Table of Contents
SECURITIES AND EXCHANGE COMMISSION
Washington, D.C. 20549
FORM 20-F
(Mark One)
| ¨ | REGISTRATION STATEMENT PURSUANT TO SECTION 12(b) OR (g) OF THE SECURITIES EXCHANGE ACT OF 1934 |
OR
| x | ANNUAL REPORT PURSUANT TO SECTION 13 OR 15(d) OF THE SECURITIES EXCHANGE ACT OF 1934 |
For the fiscal year ended December 31, 2014
OR
| ¨ | TRANSITION REPORT PURSUANT TO SECTION 13 OR 15(d) OF THE SECURITIES EXCHANGE ACT OF 1934 |
for the transition period from to
| ¨ | SHELL COMPANY REPORT PURSUANT TO SECTION 13 OR 15(d) OF THE SECURITIES EXCHANGE ACT OF 1934 |
Date of event requiring this shell company report
Commission file number 001-12518
BANCO SANTANDER, S.A.
(Exact name of Registrant as specified in its charter)
Kingdom of Spain
(Jurisdiction of incorporation)
Ciudad Grupo Santander
28660 Boadilla del Monte (Madrid), Spain
(address of principal executive offices)
José G. Cantera
Banco Santander, S.A.
Ciudad Grupo Santander
28660 Boadilla del Monte
Madrid, Spain
Tel: +34 91 289 32 80
Fax: +34 91 257 12 82
(Name, Telephone, E-mail and/or Facsimile number and Address of Company Contact Person)
Securities registered or to be registered, pursuant to Section 12(b) of the Act
| Title of each class |
Name of each exchange on which registered | |
| American Depositary Shares, each representing the right to receive one Share of Capital Stock of Banco Santander, S.A., par value euro 0.50 each | New York Stock Exchange | |
| Shares of Capital Stock of Banco Santander, S.A., par value euro 0.50 each | New York Stock Exchange * | |
| Guarantee of Non-cumulative Guaranteed Preferred Stock of Santander Finance Preferred, S.A. Unipersonal, Series 1, 4, 5 and 6 | New York Stock Exchange ** |
| * | Banco Santander Shares are not listed for trading, but are only listed in connection with the registration of the American Depositary Shares, pursuant to requirements of the New York Stock Exchange. |
| ** | The guarantee is not listed for trading, but is listed only in connection with the registration of the corresponding Non-cumulative Guaranteed Preferred Stock of Santander Finance Preferred, S.A. Unipersonal (100% owned subsidiary of Banco Santander, S.A.) |
Securities registered or to be registered pursuant to Section 12(g) of the Act.
None.
(Title of Class)
Securities for which there is a reporting obligation pursuant to Section 15(d) of the Act
None.
(Title of Class)
Indicate by check mark if the registrant is a well-known seasoned issuer, as defined in Rule 405 of the Securities Act. Yes x No ¨
If this report is an annual or transition report, indicate by check mark if the registrant is not required to file reports pursuant to Section 13 or 15(d) of the Securities Exchange Act of 1934. Yes ¨ No x
Indicate by check mark whether the registrant (1) has filed all reports required to be filed by Section 13 or 15(d) of the Securities Exchange Act of 1934 during the preceding 12 months (or for such shorter period that the registrant was required to file such reports), and (2) has been subject to such filing requirements for the past 90 days. Yes x No ¨
Indicate by check mark whether the registrant has submitted electronically and posted on its corporate Web site, if any, every Interactive Data File required to be submitted and posted pursuant to Rule 405 of Regulation S-T during the preceding 12 months (or for such shorter period that the registrant was required to submit and post such files). Yes ¨ No ¨
Indicate by check mark whether the registrant is a large accelerated filer, an accelerated filer, or a non-accelerated filer. See definition of “accelerated filer and large accelerated filer” in Rule 12b-2 of the Exchange Act. (Check one):
Large accelerated filer x Accelerated filer ¨ Non-accelerated filer ¨
Indicate by check mark which basis of accounting the registrant has used to prepare the financial statements included in this filing:
| U.S. GAAP ¨ |
International Financial Reporting Standards as issued by the International Accounting Standards Board x |
Other ¨ |
If “Other” has been checked in response to the previous question indicate by check mark which financial statement item the registrant has elected to follow. Item 17 ¨ Item 18 ¨
If this is an annual report, indicate by check mark whether the registrant is a shell company (as defined in Rule 12b-2 of the Exchange Act). Yes ¨ No x
Indicate the number of outstanding shares of each of the issuer’s classes of capital stock or common stock as of the close of business covered by the annual report. 14,060,585,886 shares
Table of Contents
BANCO SANTANDER, S.A.
| Page | ||||||
| 5 | ||||||
| 6 | ||||||
| PART I | ||||||
| ITEM 1. | 8 | |||||
| ITEM 2. | 8 | |||||
| ITEM 3. | 8 | |||||
| 8 | ||||||
| 13 | ||||||
| 13 | ||||||
| 13 | ||||||
| ITEM 4. | 35 | |||||
| 35 | ||||||
| 46 | ||||||
| 121 | ||||||
| 121 | ||||||
| ITEM 4A. | 121 | |||||
| ITEM 5. | 122 | |||||
| 130 | ||||||
| 162 | ||||||
| 163 | ||||||
| 163 | ||||||
| 166 | ||||||
| 167 | ||||||
| 167 | ||||||
| ITEM 6. | 169 | |||||
| 169 | ||||||
| 178 | ||||||
| 192 | ||||||
| 201 | ||||||
| 203 | ||||||
| ITEM 7. | 204 | |||||
| 204 | ||||||
| 205 | ||||||
| 206 | ||||||
| ITEM 8. | 206 | |||||
| 206 | ||||||
| 215 | ||||||
Table of Contents
| ITEM 9. | 215 | |||||
| 215 | ||||||
| 217 | ||||||
| 217 | ||||||
| 222 | ||||||
| 222 | ||||||
| 222 | ||||||
| ITEM 10. | 222 | |||||
| 222 | ||||||
| 222 | ||||||
| 233 | ||||||
| 233 | ||||||
| 233 | ||||||
| 239 | ||||||
| 239 | ||||||
| 239 | ||||||
| 239 | ||||||
| ITEM 11. | 240 | |||||
| 240 | ||||||
| 240 | ||||||
| 241 | ||||||
| 243 | ||||||
| 248 | ||||||
| 272 | ||||||
| 302 | ||||||
| 309 | ||||||
| 313 | ||||||
| 320 | ||||||
| 320 | ||||||
| ITEM 12. | 325 | |||||
| 325 | ||||||
| 325 | ||||||
| 325 | ||||||
| 325 | ||||||
| PART II | ||||||
| ITEM 13. | 327 | |||||
| ITEM 14. | MATERIAL MODIFICATIONS TO THE RIGHTS OF SECURITY HOLDERS AND USE OF PROCEEDS |
327 | ||||
| ITEM 15. | 327 | |||||
| ITEM 16 | ||||||
| 330 | ||||||
| 330 | ||||||
| 331 | ||||||
| D. Exemptions from the Listing Standards for Audit Committees |
331 | |||||
| E. Purchases of Equity Securities by the Issuer and Affiliated Purchasers |
332 | |||||
| 332 | ||||||
| 332 | ||||||
| 335 | ||||||
Table of Contents
| PART III | ||||||
| ITEM 17. | 335 | |||||
| ITEM 18. | 335 | |||||
| ITEM 19. | 336 | |||||
Table of Contents
PRESENTATION OF FINANCIAL AND OTHER INFORMATION
Accounting Principles
Under Regulation (EC) No. 1606/2002 of the European Parliament and of the Council of July 19, 2002, all companies governed by the law of an EU Member State and whose securities are admitted to trading on a regulated market of any Member State must prepare their consolidated financial statements in conformity with the International Financial Reporting Standards previously adopted by the European Union (“EU-IFRS”). The Bank of Spain Circular 4/2004 of December 22, 2004 on Public and Confidential Financial Reporting Rules and Formats (“Circular 4/2004”) requires Spanish credit institutions to adapt their accounting systems to the principles derived from the adoption by the European Union of International Financial Reporting Standards. Therefore, Grupo Santander (“the Group” or “Santander”) is required to prepare its consolidated financial statements for the year ended December 31, 2014 in conformity with the EU-IFRS and Bank of Spain’s Circular 4/2004. Differences between EU-IFRS, Bank of Spain’s Circular 4/2004 and International Financial Reporting Standards as issued by the International Accounting Standard Board (IFRS-IASB) are not material. Therefore, we assert that the financial information contained in this annual report on Form 20-F complies with IFRS-IASB.
We have presented our financial information according to the classification format for banks used in Spain. We have not reclassified the line items to comply with Article 9 of Regulation S-X (see note 55 of our consolidated financial statements). Article 9 is a regulation of the US Securities and Exchange Commission that contains presentation requirements for bank holding company financial statements.
Our auditors, Deloitte, S.L., an independent registered public accounting firm, have audited our consolidated financial statements in respect of the three years ended December 31, 2014, 2013 and 2012 in accordance with IFRS-IASB. See page F-1 to our consolidated financial statements for the 2014, 2013 and 2012 report prepared by Deloitte, S.L.
General Information
Our consolidated financial statements are in Euros, which are denoted “euro”, “euros”, “EUR” or “€” throughout this annual report. Also, throughout this annual report, when we refer to:
| • | “we”, “us”, “our”, the “Group”, “Grupo Santander” or “Santander”, we mean Banco Santander, S.A. and its subsidiaries, unless the context otherwise requires; |
| • | “dollars”, “US$” or “$”, we mean United States dollars; and |
| • | “pounds” or “£”, we mean United Kingdom pounds. |
When we refer to “average balances” for a particular period, we mean the average of the month-end balances for that period, unless otherwise noted. We do not believe that monthly averages present trends that are materially different from trends that daily averages would show. In calculating our interest income, we include any interest payments we received on non-accruing loans if they were received in the period when due. We have not reflected consolidation adjustments in any financial information about our subsidiaries or other business units.
When we refer to “loans”, we mean loans, leases, discounted bills and accounts receivable, unless otherwise noted. The loan to value “LTV” ratios disclosed in this report refer to LTV ratios calculated as the ratio of the outstanding amount of the loan to the most recent available appraisal value of the mortgaged asset. Additionally, if a loan is approaching a doubtful status, we update the appraisals which are then used to estimate allowances for loan losses.
When we refer to “non-performing balances”, we mean non-performing loans and contingent liabilities (“NPL”), securities and other assets to collect.
When we refer to “allowances for credit losses”, we mean the specific allowances for credit losses, and unless otherwise noted, the collectively assessed allowance for credit losses and any allowances for country-risk. See “Item 4. Information on the Company—B. Business Overview—Classified Assets—Allowances for Credit Losses and Country-Risk Requirements”.
When we refer to “perimeter effect”, we mean growth or reduction derived from changes in the companies that we consolidate resulting from acquisitions, dispositions or other reasons.
5
Table of Contents
Where a translation of foreign exchange is given for any financial data, we use the exchange rates of the relevant period (as of the end of such period for balance sheet data and the average exchange rate of such period for income statement data) as published by the European Central Bank, unless otherwise noted.
Management makes use of certain financial measures in local currency to help in the assessment of on-going operating performance. These non-GAAP financial measures include the results of operations of our subsidiary banks located outside the eurozone, excluding the impact of foreign exchange. We analyze these banks’ performance on a local currency basis to better measure the comparability of results between periods. Because changes in foreign currency exchange rates have a non-operating impact on the results of operations, we believe that evaluating their performance on a local currency basis provides an additional and meaningful assessment of performance to both management and the company’s investors. For a discussion of the accounting principles used in translation of foreign currency-denominated assets and liabilities to euros, see note 2(a) of our consolidated financial statements.
CAUTIONARY STATEMENT REGARDING FORWARD-LOOKING STATEMENTS
This annual report contains statements that constitute “forward-looking statements” within the meaning of the U.S. Private Securities Litigation Reform Act of 1995. Forward-looking statements include, but are not limited to, information regarding:
| • | exposure to various types of market risks; |
| • | management strategy; |
| • | capital expenditures; |
| • | earnings and other targets; and |
| • | asset portfolios. |
Forward-looking statements may be identified by words such as “expect,” “project,” “anticipate,” “should,” “intend,” “probability,” “risk,” “VaR,” “RORAC,” “target,” “goal,” “objective,” “estimate,” “future” and similar expressions. We include forward-looking statements in the “Operating and Financial Review and Prospects,” “Information on the Company,” and “Quantitative and Qualitative Disclosures About Risks” sections. Forward-looking statements are not guarantees of future performance and involve risks and uncertainties, and actual results may differ materially from those in the forward-looking statements.
6
Table of Contents
You should understand that the following important factors, in addition to those discussed in “Key Information—Risk Factors”, “Operating and Financial Review and Prospects,” “Information on the Company” and elsewhere in this annual report, could affect our future results and could cause those results or other outcomes to differ materially from those anticipated in any forward-looking statement:
The forward-looking statements contained in this report speak only as of the date of this report. We do not undertake to update any forward-looking statement to reflect events or circumstances after that date or to reflect the occurrence of unanticipated events.
7
Table of Contents
Item 1. Identity of Directors, Senior Management and Advisers
A. Directors and Senior Management
Not applicable.
B. Advisers
Not applicable.
C. Auditors
Not applicable.
Item 2. Offer Statistics and Expected Timetable
A. Offer Statistics
Not applicable.
B. Method and Expected Timetable
Not applicable.
Selected Consolidated Financial Information
We have selected the following financial information from our consolidated financial statements. You should read this information in connection with, and it is qualified in its entirety by reference to, our consolidated financial statements.
In the F-pages of this annual report on Form 20-F, our audited financial statements for the years 2014, 2013 and 2012 are presented. The audited financial statements for 2011 and 2010 are not included in this document, but they can be found in our previous annual reports on Form 20-F. These previous annual reports do not include the effect of the application of IFRIC 21, Levies, described below.
The income statement for the year ended December 31, 2014 reflects the impact of the reconsolidation of Santander Consumer USA Inc. (“SCUSA”) after we gained control of this company in January 2014. Prior to the aforementioned change of control, we accounted for our ownership interest in SCUSA using the equity method (see “Item 4. Information on the Company—A. History and development of the company—Principal Capital Expenditures and Divestitures—Acquisitions, Dispositions, Reorganizations—Santander Consumer USA”). In addition, the income statement for the year ended December 31, 2013 includes the results from Kredyt Bank S.A. after the merger in early 2013 of the subsidiaries in Poland of Banco Santander, S.A. and KBC Bank NV (Bank Zachodni WBK, S.A. and Kredyt Bank S.A.). Finally, the income statement for the year ended December, 31, 2011 reflects the impact of the consolidation of Bank Zachodni WBK, S.A.
In addition, we decided to apply ahead of the mandatory first-time application date pursuant to the endorsement issued by the European Union, IFRIC 21, Levies, which addresses the accounting for a liability to pay a levy if that liability is within the scope of IAS 37. The retroactive effect of this interpretation means anticipating the recording of contributions to the deposit guarantee fund and changing the accounting for the Financial Services Compensation Scheme levy in the UK. As a result, our profit for 2013, 2012 and 2011 was reduced by €195 million, €12 million and €41 million, respectively, and our profit for 2010 was increased by €32 million (see note 1.b and 1.d.a to our consolidated financial statements).
8
Table of Contents
| Year ended December 31, | ||||||||||||||||||||
| 2014 | 2013 | 2012 | 2011 | 2010 | ||||||||||||||||
| (in millions of euros, except percentages and per share data) | ||||||||||||||||||||
| Interest and similar income |
54,656 | 51,447 | 58,791 | 60,618 | 52,637 | |||||||||||||||
| Interest expense and similar charges |
(25,109 | ) | (25,512 | ) | (28,868 | ) | (30,024 | ) | (23,672 | ) | ||||||||||
| Interest income / (charges) |
29,547 | 25,935 | 29,923 | 30,594 | 28,965 | |||||||||||||||
| Income from equity instruments |
435 | 378 | 423 | 394 | 362 | |||||||||||||||
| Income from companies accounted for using the equity method |
243 | 500 | 427 | 57 | 17 | |||||||||||||||
| Fee and commission income |
12,515 | 12,473 | 12,732 | 12,640 | 11,559 | |||||||||||||||
| Fee and commission expense |
(2,819 | ) | (2,712 | ) | (2,471 | ) | (2,232 | ) | (1,899 | ) | ||||||||||
| Gains/losses on financial assets and liabilities (net) |
3,974 | 3,234 | 3,329 | 2,838 | 2,166 | |||||||||||||||
| Exchange differences (net) |
(1,124 | ) | 160 | (189 | ) | (522 | ) | 441 | ||||||||||||
| Other operating income |
5,214 | 5,903 | 6,693 | 8,050 | 8,190 | |||||||||||||||
| Other operating expenses |
(5,373 | ) | (6,205 | ) | (6,607 | ) | (8,180 | ) | (8,105 | ) | ||||||||||
| Total income |
42,612 | 39,666 | 44,260 | 43,639 | 41,696 | |||||||||||||||
| Administrative expenses |
(17,899 | ) | (17,452 | ) | (17,801 | ) | (17,644 | ) | (16,073 | ) | ||||||||||
| Personnel expenses |
(10,242 | ) | (10,069 | ) | (10,306 | ) | (10,305 | ) | (9,296 | ) | ||||||||||
| Other general administrative expenses |
(7,657 | ) | (7,383 | ) | (7,495 | ) | (7,339 | ) | (6,777 | ) | ||||||||||
| Depreciation and amortization |
(2,287 | ) | (2,391 | ) | (2,183 | ) | (2,098 | ) | (1,937 | ) | ||||||||||
| Provisions (net) |
(3,009 | ) | (2,445 | ) | (1,472 | ) | (2,534 | ) | (1,012 | ) | ||||||||||
| Impairment losses on financial assets (net) |
(10,710 | ) | (11,227 | ) | (18,880 | ) | (11,794 | ) | (10,400 | ) | ||||||||||
| Impairment losses on other assets (net) |
(938 | ) | (503 | ) | (508 | ) | (1,517 | ) | (286 | ) | ||||||||||
| Gains/(losses) on disposal of assets not classified as non-current assets held for sale |
3,136 | 2,152 | 906 | 1,846 | 351 | |||||||||||||||
| Negative difference of consolidation |
17 | — | — | — | — | |||||||||||||||
| Gains/(losses) on non-current assets held for sale not classified as discontinued operations |
(243 | ) | (422 | ) | (757 | ) | (2,109 | ) | (290 | ) | ||||||||||
| Operating profit/(loss) before tax |
10,679 | 7,378 | 3,565 | 7,789 | 12,049 | |||||||||||||||
| Income tax |
(3,718 | ) | (2,034 | ) | (584 | ) | (1,727 | ) | (2,917 | ) | ||||||||||
| Profit from continuing operations |
6,961 | 5,344 | 2,981 | 6,062 | 9,132 | |||||||||||||||
| Profit/(loss) from discontinued operations (net) |
(26 | ) | (15 | ) | 70 | 15 | 35 | |||||||||||||
| Consolidated profit for the year |
6,935 | 5,329 | 3,051 | 6,077 | 9,167 | |||||||||||||||
| Profit attributable to the Parent |
5,816 | 4,175 | 2,283 | 5,289 | 8,244 | |||||||||||||||
| Profit attributable to non-controlling interest |
1,119 | 1,154 | 768 | 788 | 923 | |||||||||||||||
| Per share information: |
||||||||||||||||||||
| Average number of shares (thousands) (1) |
11,858,690 | 10,836,111 | 9,766,689 | 8,892,033 | 8,686,522 | |||||||||||||||
| Basic earnings per share (euros) |
0.48 | 0.39 | 0.23 | 0.59 | 0.95 | |||||||||||||||
| Basic earnings per share continuing operation (euros) |
0.48 | 0.39 | 0.22 | 0.59 | 0.95 | |||||||||||||||
| Diluted earnings per share (euros) |
0.48 | 0.38 | 0.23 | 0.59 | 0.95 | |||||||||||||||
| Diluted earnings per share continuing operation (euros) |
0.48 | 0.38 | 0.22 | 0.59 | 0.95 | |||||||||||||||
| Remuneration paid (euros) (2) |
0.60 | 0.60 | 0.60 | 0.60 | 0.60 | |||||||||||||||
| Remuneration paid (US$) (2) |
0.73 | 0.83 | 0.79 | 0.78 | 0.80 | |||||||||||||||
9
Table of Contents
| Year ended December 31, | ||||||||||||||||||||
| 2014 | 2013 | 2012 | 2011 | 2010 | ||||||||||||||||
| (in millions of euros, except percentages and per share data) | ||||||||||||||||||||
| Total assets |
1,266,296 | 1,115,763 | 1,269,645 | 1,251,048 | 1,216,968 | |||||||||||||||
| Loans and advances to credit institutions (net) (3) |
81,713 | 74,964 | 73,900 | 51,726 | 79,855 | |||||||||||||||
| Loans and advances to customers (net) (3) |
734,711 | 668,856 | 719,112 | 748,541 | 722,504 | |||||||||||||||
| Investment securities (net) (4) |
195,164 | 142,234 | 152,066 | 154,015 | 174,258 | |||||||||||||||
| Investments: Associates and joint venture |
3,471 | 5,536 | 4,454 | 4,155 | 273 | |||||||||||||||
| Contingent liabilities |
44,078 | 41,049 | 45,033 | 48,042 | 59,795 | |||||||||||||||
| Liabilities |
||||||||||||||||||||
| Deposits from central banks and credit institutions (5) |
155,369 | 109,397 | 152,966 | 143,138 | 140,112 | |||||||||||||||
| Customer deposits (5) |
647,627 | 607,837 | 626,639 | 632,533 | 616,376 | |||||||||||||||
| Debt securities (5) |
196,889 | 175,477 | 205,969 | 197,372 | 192,873 | |||||||||||||||
| Capitalization |
||||||||||||||||||||
| Guaranteed subordinated debt excluding preferred securities and preferred shares (6) |
3,276 | 4,603 | 5,207 | 6,619 | 10,934 | |||||||||||||||
| Other subordinated debt |
6,878 | 7,483 | 8,291 | 10,477 | 12,189 | |||||||||||||||
| Preferred securities (6) |
6,239 | 3,652 | 4,319 | 5,447 | 6,917 | |||||||||||||||
| Preferred shares (6) |
739 | 401 | 421 | 449 | 435 | |||||||||||||||
| Non-controlling interest (including net income of the period) |
8,909 | 9,314 | 9,415 | 6,354 | 5,860 | |||||||||||||||
| Stockholders’ equity (7) |
80,805 | 70,328 | 71,797 | 74,408 | 73,625 | |||||||||||||||
| Total capitalization |
106,846 | 95,781 | 99,450 | 103,754 | 109,960 | |||||||||||||||
| Stockholders’ equity per average share (7) |
6.81 | 6.49 | 7.35 | 8.37 | 8.48 | |||||||||||||||
| Stockholders’ equity per share at the year-end (7) |
6.42 | 6.21 | 6.96 | 8.69 | 8.84 | |||||||||||||||
| Other managed funds |
||||||||||||||||||||
| Mutual funds |
109,519 | 93,304 | 89,176 | 102,611 | 113,510 | |||||||||||||||
| Pension funds |
11,481 | 10,879 | 10,076 | 9,645 | 10,965 | |||||||||||||||
| Managed portfolio |
20,369 | 20,987 | 18,889 | 19,200 | 20,314 | |||||||||||||||
| Total other managed funds (8) |
141,369 | 125,170 | 118,141 | 131,456 | 144,789 | |||||||||||||||
| Consolidated ratios |
||||||||||||||||||||
| Profitability ratios: |
||||||||||||||||||||
| Net yield (9) |
2.69 | % | 2.31 | % | 2.51 | % | 2.72 | % | 2.66 | % | ||||||||||
| Return on average total assets (ROA) |
0.58 | % | 0.44 | % | 0.24 | % | 0.49 | % | 0.77 | % | ||||||||||
| Return on average stockholders’ equity (ROE) (10) |
7.75 | % | 5.84 | % | 3.14 | % | 7.33 | % | 11.78 | % | ||||||||||
| Capital ratio: |
||||||||||||||||||||
| Average stockholders’ equity to average total assets |
6.24 | % | 5.89 | % | 5.65 | % | 5.88 | % | 5.85 | % | ||||||||||
| Ratio of earnings to fixed charges (11) |
||||||||||||||||||||
| Excluding interest on deposits |
1.90 | % | 1.69 | % | 1.27 | % | 1.62 | % | 2.28 | % | ||||||||||
| Including interest on deposits |
1.43 | % | 1.29 | % | 1.11 | % | 1.26 | % | 1.52 | % | ||||||||||
| Credit quality data |
||||||||||||||||||||
| Loans and advances to customers |
||||||||||||||||||||
| Allowances for non-performing balances including country risk and excluding contingent liabilities as a percentage of total gross loans |
3.57 | % | 3.59 | % | 3.41 | % | 2.45 | % | 2.63 | % | ||||||||||
| Non-performing balances as a percentage of total gross loans (12) |
5.30 | % | 5.81 | % | 4.74 | % | 4.07 | % | 3.76 | % | ||||||||||
| Allowances for non-performing balances as a percentage of non-performing balances (12) |
67.42 | % | 61.76 | % | 72.01 | % | 60.17 | % | 69.99 | % | ||||||||||
| Net loan charge-offs as a percentage of total gross loans |
1.38 | % | 1.38 | % | 1.36 | % | 1.39 | % | 1.31 | % | ||||||||||
| Ratios adding contingent liabilities to loans and advances to customers and excluding country risk (*) |
||||||||||||||||||||
| Allowances for non-performing balances (**) as a percentage of total loans and contingent liabilities |
3.49 | % | 3.48 | % | 3.29 | % | 2.38 | % | 2.56 | % | ||||||||||
| Non-performing balances as a percentage of total loans and contingent liabilities (**) (12) |
5.19 | % | 5.64 | % | 4.54 | % | 3.90 | % | 3.54 | % | ||||||||||
| Allowances for non-performing balances as a percentage of non-performing balances (**)(12) |
67.24 | % | 61.65 | % | 72.41 | % | 61.02 | % | 72.17 | % | ||||||||||
| Net loan and contingent liabilities charge-offs as a percentage of total loans and contingent liabilities |
1.30 | % | 1.29 | % | 1.28 | % | 1.29 | % | 1.21 | % | ||||||||||
| (*) | We disclose these ratios because our credit risk exposure comprises loans and advances to customers as well as contingent liabilities, all of which are subject to impairment and, therefore, allowances are taken in respect thereof. |
10
Table of Contents
| (**) | Non-performing loans and contingent liabilities, securities and other assets to collect. |
| (1) | Average number of shares has been calculated on the basis of the weighted average number of shares outstanding in the relevant year, net of treasury stock. |
| (2) | The shareholders at the annual shareholders’ meeting held on June 19, 2009 approved a new remuneration scheme (scrip dividend), whereby the Bank offered the shareholders the possibility to opt to receive an amount equivalent to the dividends in cash or new shares. The remuneration per share for 2010, 2011, 2012 and 2013 disclosed above, €0.60, is calculated assuming that the four dividends for these years were paid in cash. In 2014, assuming the same criteria, the remuneration per share will be €0.60. |
| (3) | Equals the sum of the amounts included under the headings “Financial assets held for trading”, “Other financial assets at fair value through profit or loss” and “Loans and receivables” as stated in our consolidated financial statements. |
| (4) | Equals the amounts included as “Debt instruments” and “Equity instruments” under the headings “Financial assets held for trading”, “Other financial assets at fair value through profit or loss”, “Available-for-sale financial assets” and “Loans and receivables” as stated in our consolidated financial statements. |
| (5) | Equals the sum of the amounts included under the headings “Financial liabilities held for trading”, “Other financial liabilities at fair value through profit or loss” and “Financial liabilities at amortized cost” included in notes 20, 21 and 22 to our consolidated financial statements. |
| (6) | In our consolidated financial statements, preferred securities and preferred shares are included under “Subordinated liabilities”. |
| (7) | Equals the sum of the amounts included at the end of each year as “Own funds” and “Valuation adjustments” as stated in our consolidated financial statements. We have deducted the book value of treasury stock from stockholders’ equity. |
| (8) | At December 31, 2014 and 2013 we held a 50% ownership interest in Santander Asset Management (“SAM”) and controlled this company jointly with Warburg Pincus and General Atlantic. Funds under “Other managed funds” are mostly managed by SAM. |
| (9) | Net yield is the total of net interest income (including dividends on equity securities) divided by average earning assets. See “Item 4. Information on the Company—B. Business Overview—Selected Statistical Information—Assets—Earning Assets—Yield Spread”. |
| (10) | The Return on average stockholders’ equity ratio is calculated as profit attributable to the Parent divided by average stockholders’ equity. |
| (11) | For the purpose of calculating the ratio of earnings to fixed charges, earnings consist of pre-tax income from continuing operations before adjustment for income or loss from equity investees plus fixed charges. Fixed charges consist of total interest expense (including or excluding interest on deposits as appropriate) and the interest expense portion of rental expense. |
| (12) | Non-performing loans reflect Bank of Spain classifications. These classifications differ from the classifications applied by U.S. banks in reporting loans as non-accrual, past due, restructured and potential problem loans. See “Item 4. Information on the Company—B. Business Overview—Classified Assets—Bank of Spain’s Classification Requirements”. |
11
Table of Contents
Set forth below is a table showing our allowances for non-performing balances broken down by various categories as disclosed and discussed throughout this annual report on Form 20-F:
| IFRS-IASB | ||||||||||||||||||||
| Year Ended December 31, | ||||||||||||||||||||
| 2014 | 2013 | 2012 | 2011 | 2010 | ||||||||||||||||
| (in millions of euros) | ||||||||||||||||||||
| Allowances refers to: |
||||||||||||||||||||
| Allowances for non-performing balances (*) (excluding country risk) |
28,046 | 25,681 | 26,112 | 19,531 | 20,553 | |||||||||||||||
| Less: Allowances for contingent liabilities and commitments (excluding country risk) |
652 | 688 | 614 | 648 | 1,011 | |||||||||||||||
|
|
|
|
|
|
|
|
|
|
|
|||||||||||
| Allowances for balances of loans (excluding country risk): |
27,394 | 24,993 | 25,497 | 18,883 | 19,541 | |||||||||||||||
| Allowances relating to country risk and other |
46 | 154 | 98 | 210 | 121 | |||||||||||||||
|
|
|
|
|
|
|
|
|
|
|
|||||||||||
| Allowances for non-performing balances (excluding contingent liabilities) |
27,440 | 25,147 | 25,595 | 19,093 | 19,662 | |||||||||||||||
| Of which: |
||||||||||||||||||||
| Allowances for loans and receivables: |
27,321 | 24,959 | 25,467 | 18,858 | 19,544 | |||||||||||||||
| Allowances for customers |
27,217 | 24,903 | 25,422 | 18,806 | 19,502 | |||||||||||||||
| Allowances for credit institutions and other financial assets |
79 | 37 | 30 | 36 | 17 | |||||||||||||||
| Allowances for debt instruments |
25 | 19 | 15 | 16 | 25 | |||||||||||||||
| Allowances for debt Instruments available for sale |
119 | 188 | 129 | 235 | 119 | |||||||||||||||
| (*) | Non-performing loans and contingent liabilities, securities and other assets to collect. |
Exchange Rates
The exchange rates shown below are those published by the European Central Bank (“ECB”), and are based on the daily consultation procedures between central banks within and outside the European System of Central Banks, which normally takes place at 14:15 p.m. CET.
| Rate During Period | ||||||||
| Calendar Period | Period End ($) |
Average Rate ($) |
||||||
| 2010 |
1.34 | 1.33 | ||||||
| 2011 |
1.29 | 1.39 | ||||||
| 2012 |
1.32 | 1.28 | ||||||
| 2013 |
1.38 | 1.33 | ||||||
| 2014 |
1.21 | 1.33 | ||||||
12
Table of Contents
| Rate During Period | ||||||||
| Last six months | High $ | Low $ | ||||||
| 2014 |
||||||||
| October |
1.28 | 1.25 | ||||||
| November |
1.25 | 1.24 | ||||||
| December |
1.25 | 1.21 | ||||||
| 2015 |
||||||||
| January |
1.20 | 1.12 | ||||||
| February |
1.14 | 1.12 | ||||||
| March |
1.12 | 1.06 | ||||||
| April (through April 28) |
1.09 | 1.06 | ||||||
On April 28, 2015, the exchange rate for euros and dollars (expressed in dollars per euro), as published by the ECB, was $1.09.
For a discussion of the accounting principles used in translation of foreign currency-denominated assets and liabilities to euros, see note 2 (a) to our consolidated financial statements.
B. Capitalization and indebtedness.
Not Applicable.
C. Reasons for the offer and use of proceeds.
Not Applicable.
1. Macro-Economic and Political Risks
1.1 Because our loan portfolio is concentrated in Continental Europe, the United Kingdom, Latin America and the United States, adverse changes affecting the economies of Continental Europe, the United Kingdom, certain Latin American countries or the United States could adversely affect our financial condition.
Our loan portfolio is concentrated in Continental Europe (in particular, Spain), the United Kingdom, Latin America and the United States. At December 31, 2014, Continental Europe accounted for 37% of our total loan portfolio (Spain accounted for 22% of our total loan portfolio), the United Kingdom (where the loan portfolio consists primarily of residential mortgages) accounted for 34%, Latin America accounted for 20% (of which Brazil represents 10% of our total loan portfolio) and the United States accounted for 9%. Accordingly, the recoverability of these loan portfolios in particular, and our ability to increase the amount of loans outstanding and our results of operations and financial condition in general, are dependent to a significant extent on the level of economic activity in Continental Europe (in particular, Spain), the United Kingdom, Latin America and the United States. A return to recessionary conditions in the economies of Continental Europe (in particular, Spain), the United Kingdom, the Latin American countries in which we operate or the United States, would likely have a significant adverse impact on our loan portfolio and, as a result, on our financial condition, cash flows and results of operations. See “Item 4. Information on the Company—B. Business Overview”.
1.2 We are vulnerable to disruptions and volatility in the global financial markets.
In the past seven years, financial systems worldwide have experienced difficult credit and liquidity conditions and disruptions leading to less liquidity, greater volatility, general widening of spreads and, in some cases, lack of price transparency in interbank lending rates. Global economic conditions deteriorated significantly between 2007 and 2009, and many of the countries in which we operate fell into recession. Although some countries have begun to recover, this recovery may not be sustainable. Many major financial institutions, including some of the world’s largest global commercial banks, investment banks, mortgage lenders, mortgage guarantors and insurance companies experienced, and some continue to experience, significant difficulties. Around the world, there have also been runs on deposits at several financial institutions, numerous institutions have sought additional capital or have been assisted by governments, and many lenders and institutional investors have reduced or ceased providing funding to borrowers (including to other financial institutions).
13
Table of Contents
In particular, we face, among others, the following risks related to the economic downturn:
| • | Reduced demand for our products and services. |
| • | Increased regulation of our industry. Compliance with such regulation will increase our costs and may affect the pricing for our products and services and limit our ability to pursue business opportunities. |
| • | Inability of our borrowers to timely or fully comply with their existing obligations. Macroeconomic shocks may negatively impact the household income of our retail customers and may adversely affect the recoverability of our retail loans, resulting in increased loan losses. |
| • | The process we use to estimate losses inherent in our credit exposure requires complex judgments, including forecasts of economic conditions and how these economic conditions might impair the ability of our borrowers to repay their loans. The degree of uncertainty concerning economic conditions may adversely affect the accuracy of our estimates, which may, in turn, impact the reliability of the process and the sufficiency of our loan loss allowances. |
| • | The value and liquidity of the portfolio of investment securities that we hold may be adversely affected. |
| • | Any worsening of global economic conditions may delay the recovery of the international financial industry and impact our financial condition and results of operations. |
Despite recent improvements in certain segments of the global economy, uncertainty remains concerning the future economic environment. There can be no assurance that economic conditions in these segments will continue to improve or that the global economic condition as a whole will improve significantly. Such economic uncertainty could have a negative impact on our business and results of operations. Investors remain cautious. A slowing or failing of the economic recovery would likely aggravate the adverse effects of these difficult economic and market conditions on us and on others in the financial services industry.
Increased disruption and volatility in the global financial markets could have a material adverse effect on us, including our ability to access capital and liquidity on financial terms acceptable to us, if at all. If capital markets financing ceases to become available, or becomes excessively expensive, we may be forced to raise the rates we pay on deposits to attract more customers and become unable to maintain certain liability maturities. Any such increase in capital markets funding availability or costs or in deposit rates could have a material adverse effect on our interest margins and liquidity.
If all or some of the foregoing risks were to materialize, this could have a material adverse effect on us.
1.3 We may suffer adverse effects as a result of economic and sovereign debt tensions in the eurozone.
Our results of operations are materially affected by conditions in the capital markets and the economy generally in the eurozone, which, although improving recently, continue to show signs of fragility and volatility. Interest rate differentials among eurozone countries are affecting government finance and borrowing rates in those economies.
The European Central Bank (the “ECB”) and European Council took actions in 2012 and 2013 to aim to reduce the risk of contagion throughout and beyond the eurozone. These included the creation of the Open Market Transaction facility of the ECB and the decision by eurozone governments to create a banking union. A significant number of financial institutions throughout Europe have substantial exposures to sovereign debt issued by nations that are under financial pressure. Should any of those nations default on their debt, or experience a significant widening of credit spreads, major financial institutions and banking systems throughout Europe could be destabilized, resulting in the further spread of the ongoing economic crisis.
The high cost of capital for some European governments impacted the wholesale markets and there was a consequent increase in the cost of retail funding, with greater competition in the savings market. In the absence of a permanent resolution of the eurozone crisis, conditions could deteriorate.
We have direct and indirect exposure to financial and economic conditions throughout the eurozone economies. While concerns relating to sovereign defaults or a partial or complete break-up of the European Monetary Union, including potential accompanying redenomination risks and uncertainties, seemed to have abated during 2014, such concerns have resurfaced to some extent with the election of a new government in Greece in January 2015. A deterioration of the economic and financial
14
Table of Contents
environment could have a material adverse impact on the whole financial sector, creating new challenges in sovereign and corporate lending and resulting in significant disruptions in financial activities at both the market and retail levels. This could materially and adversely affect our operating results, financial position and prospects.
1.4 Exposure to sovereign debt could have a material adverse effect on us.
Like many other banks, we invest in debt securities of governments in the geographies in which we operate, including debt securities of the countries that have been most affected by the deterioration in economic conditions, such as Spain, Portugal, Italy and Ireland. A failure by any such government to make timely payments under the terms of these securities, or a significant decrease in their market value, could have a material adverse effect on us.
1.5 Our growth, asset quality and profitability may be adversely affected by volatile macroeconomic and political conditions.
The economies of some of the countries where we operate, particularly in Latin America, have experienced significant volatility in recent decades, characterized, in some cases, by slow or regressive growth, declining investment and hyperinflation. This volatility resulted in fluctuations in the levels of deposits and in the relative economic strength of various segments of the economies to which we lend. Negative and fluctuating economic conditions, such as slowing or negative growth and a changing interest rate environment, impact our profitability by causing lending margins to decrease and credit quality to decline and leading to decreased demand for higher margin products and services. For instance, Brazil’s present high rate of inflation, compounded by high and increasing interest rates, declining consumer spending and increasing unemployment, may have a material adverse impact on the Brazilian economy as a whole as well as on our financial condition and earnings in Brazil, which represented 20% of profit attributed to the Parent bank’s total operating areas in 2014 and 10% of our total loans as of December 31, 2014. In addition, our business in Brazil may be adversely affected by evolving issues of corruption and related political instability.
Negative and fluctuating economic conditions in the countries in which we operate, such as those that certain Latin American and European countries have experienced recently, could also result in government defaults on public debt. This could affect us in two ways: directly, through portfolio losses, and indirectly, through instabilities that a default in public debt could cause to the banking system as a whole, particularly since commercial banks’ exposure to government debt is high in these regions or countries.
In addition, our revenues are subject to risk of loss from unfavorable political and diplomatic developments, social instability, and changes in governmental policies, including expropriation, nationalization, international ownership legislation, interest-rate caps and tax policies.
Our growth, asset quality and profitability may be adversely affected by volatile macroeconomic and political conditions.
2. Risks Relating to Our Business
2.1 Legal, Regulatory and Compliance Risks
2.1.1 We are exposed to risk of loss from legal and regulatory proceedings.
We face risk of loss from legal and regulatory proceedings, including tax proceedings, that could subject us to monetary judgments, regulatory enforcement actions, fines and penalties. The current regulatory environment in the jurisdictions in which we operate reflects an increased supervisory focus on enforcement, combined with uncertainty about the evolution of the regulatory regime, and may lead to material operational and compliance costs.
We are from time to time subject to certain claims and parties to certain legal proceedings incidental to the normal course of our business, including in connection with conflicts of interest, lending activities, relationships with our employees and other commercial or tax matters. In view of the inherent difficulty of predicting the outcome of legal matters, particularly where the claimants seek very large or indeterminate damages, or where the cases present novel legal theories, involve a large number of parties or are in the early stages of discovery, we cannot state with confidence what the eventual outcome of these pending matters will be or what the eventual loss, fines or penalties related to each pending matter may be. We believe that we have made adequate reserves related to the costs anticipated to be incurred in connection with these various claims and legal proceedings—see note 25 of our consolidated financial statements-. However, the amount of these provisions is substantially less than the total amount of the claims asserted against us and in light of the uncertainties involved in such claims and proceedings, there is no assurance that the ultimate resolution of these matters will not significantly exceed the reserves currently accrued by us. As a result, the outcome of a particular matter may be material to our operating results for a particular period, depending upon, among other factors, the size of the loss or liability imposed and our level of income for that period.
15
Table of Contents
2.1.2 We are subject to substantial regulation which could adversely affect our business and operations.
As a financial institution, we are subject to extensive regulation, which materially affects our businesses. The statutes, regulations and policies to which we are subject may be changed at any time. In addition, the interpretation and the application by regulators of the laws and regulations to which we are subject may also change from time to time. Extensive legislation affecting the financial services industry has recently been adopted in regions that directly or indirectly affect our business, including Spain, the United States, the European Union, Latin America and other jurisdictions, and regulations are in the process of being implemented. The manner in which those laws and related regulations are applied to the operations of financial institutions is still evolving. Moreover, to the extent these recently adopted regulations are implemented inconsistently in the various jurisdictions in which we operate, we may face higher compliance costs. Any legislative or regulatory actions and any required changes to our business operations resulting from such legislation and regulations could result in significant loss of revenue, limit our ability to pursue business opportunities in which we might otherwise consider engaging and provide certain products and services, affect the value of assets that we hold, require us to increase our prices and therefore reduce demand for our products, impose additional compliance and other costs on us or otherwise adversely affect our businesses. Accordingly, there can be no assurance that future changes in regulations or in their interpretation or application will not adversely affect us.
The regulations which most significantly affect the Bank, or which could most significantly affect the Bank in the future, relate to capital requirements, liquidity and funding, development of a fiscal and banking union in the European Union and regulatory reforms in the United States, and are discussed in further detail below.
Capital requirements, liquidity, funding and structural reform
Increasingly onerous capital requirements constitute one of the Bank’s main regulatory challenges. Increasing capital requirements may adversely affect the Bank’s profitability and create regulatory risk associated with the possibility of failure to maintain required capital levels. As a Spanish financial institution, the Bank is subject to Capital Requirements Directive (“CRD IV”), through which the European Union began implementing the Basel III capital reforms from January 1, 2014, with certain requirements in the process of being phased in until January 1, 2019. The core regulation in the solvency of credit entities is, therefore, the Capital Requirements Regulation (“CRR”), which is complemented by several binding technical standards, all of which are directly applicable in all EU member states, without the need for national implementation measures. The implementation of the CRD IV Directive into Spanish law has largely taken place through Royal Decree Law 14/2013 and Law 10/2014, and a new Bank of Spain Circular 2/2014. Notwithstanding this, further regulatory developments in this area remain pending as at the date of this report.
The new regulatory regime has, among other things, increased the level of capital required by means of a “combined buffer requirement” that entities must comply with from 2016 onwards. Article 104 of the CRD IV Directive, as implemented by Article 68 of Law 10/2014, and similarly Article 16 of Council Regulation (EU) No 1024/2013 of October 15, 2013 conferring specific tasks on the European Central Bank (the “ECB”) concerning policies relating to the prudential supervision of credit institutions (the “SSM Regulation”), also contemplate that in addition to the minimum “Pillar 1” capital requirements (including, if applicable, any buffer capital as discussed below), supervisory authorities may impose further “Pillar 2” capital requirements to cover other risks, including those not considered to be fully captured by the minimum “own funds” requirements under CRD IV or to address macro-prudential considerations. This may result in the imposition of additional own funds requirements on the Bank and/or the Group pursuant to this “Pillar 2” framework. Any failure by the Bank and/or the Group to maintain its “Pillar 1” minimum regulatory capital ratios, any “Pillar 2” additional own funds requirements could result in administrative actions or sanctions, which, in turn, may have a material adverse impact on the Group’s results of operations.
The ECB is currently undertaking an assessment of the additional “Pillar 2” capital requirements that may be imposed for each of the European banking institutions now subject to the Single Supervisory Mechanism (the “SSM”). The ECB is required to carry out these assessments under CRD IV at least on an annual basis. There can be no assurance that an additional own funds requirement for the Bank and/or the Group may not be required by the ECB either when it provides its final decision in relation to this initial assessment or at any time in the future. Any additional own funds requirement that may be imposed on the Bank and/or the Group by the ECB pursuant to this initial assessment may require the Bank and/or the Group to hold capital levels similar to, or higher than, those required under the full application of CRD IV. There can also be no assurance that the Group will be able to continue to maintain such capital ratios.
In addition to the above, the EBA published on December 19, 2014 its final guidelines for common procedures and methodologies in respect of its supervisory review and evaluation process (SREP). Included in this were the EBA’s proposed guidelines for a common approach to determining the amount and composition of additional own funds requirements to be implemented by January 1, 2016. Under these guidelines, national supervisors must set a composition requirement for the
16
Table of Contents
additional own funds requirements to cover certain specified risks of at least 56% CET1 capital and at least 75% Tier 1 capital. The guidelines also contemplate that national supervisors should not set additional own funds requirements in respect of risks which are already covered by capital buffer requirements and/or additional macro-prudential requirements; and, accordingly, the above “combined buffer requirement” is in addition to the minimum own funds requirement and to the additional own funds requirement. In this regard, according to Law 10/2014, for those entities not meeting the “combined buffer requirement” or the “Pillar 2” capital requirements described above or where a restriction upon “discretionary payments” has been imposed pursuant to Article 68 of Law 10/2014 distributions relating to CET1 capital, variable remuneration or discretionary pension revenues and distributions relating to additional tier 1 capital may be subject to restrictions until the Maximum Distributable Amount has been calculated and communicated to the Bank of Spain (and thereafter subject to such Maximum Distributable Amount). The criteria for the calculation of the Maximum Distributable Amount in respect of any such “discretionary payments” are specified in the Royal Decree 84/2015, of February 13, 2015, which develops Law 10/2014.
At its meeting on January 12, 2014, the oversight body of the Basel Committee endorsed the definition of the leverage ratio set forth in CRD IV, to promote consistent disclosure, starting on January 1, 2015. There will be a mandatory minimum capital requirement as of January 1, 2018, with an initial minimum leverage ratio of 3% that can be raised after calibration, if European authorities so decide.
On November 10, 2014 the Financial Stability Board (the “FSB”) published a consultative document (the “Consultative Document”) containing certain policy proposals to enhance the loss absorbing capacity of global systemically important banks—except for those from emerging countries—(“G-SIBs”), such as the Bank. The policy proposals included in the Consultative Document consist of an elaboration of the principles on loss absorbing and recapitalization capacity of G-SIBs in resolution and a term sheet setting out a proposal for the implementation of these proposals in the form of an internationally agreed standard on total loss absorbing capacity (“TLAC”) for G-SIBs. The consultation period ended on February 2, 2015.
Once finalized, these proposals will form a new minimum TLAC standard for G-SIBs. If implemented as contemplated, the TLAC requirement may create additional minimum capital requirements for the Bank and could require the Bank to maintain an additional minimum TLAC ratio of (i) the Bank’s regulatory capital plus certain types of debt capital instruments and other eligible liabilities that can be written down or converted into equity during resolution to (ii) the Bank’s risk-weighted assets.
The FSB has proposed that a single specific minimum “Pillar 1” TLAC requirement will be set at the greater of (a) 16% to 20% of risk weighted assets and (b) twice the amount of capital required to meet the relevant Basel III Tier 1 leverage ratio requirement (equivalent to the leverage ratio set forth in CRD IV). However, the final proposed TLAC amount has not been agreed within the FSB and is the subject of a quantitative impact study, expected to be completed in 2015. The final requirements are expected to be announced in 2015, most probably at the FSB’s plenary session in November 2015.
Furthermore, the Bank Recovery and Resolution Directive (“BRRD”) requires all banks to maintain a minimum requirement for own funds and eligible liabilities (“MREL”). The purpose of MREL, which is calculated as a percentage of the total liabilities and own funds of an institution, is to ensure that institutions maintain enough capital capable of being written down and/or bailed-in, so as to facilitate resolution.
The TLAC requirements may apply both on a common minimum “Pillar 1” basis and with provision for home and host resolution authorities to be able to specify additional “Pillar 2” TLAC requirements on an individual institution basis. TLAC requirements may further be imposed in addition to the minimum “own funds” requirements under CRD IV and the MREL once the BRRD has been implemented in Spain. Any failure by an institution to meet the applicable minimum “Pillar 1” and “Pillar 2” TLAC requirements may be treated in the same manner as a failure to meet minimum regulatory capital requirements, where resolution authorities must ensure that they intervene and place an institution into resolution sufficiently early if it is deemed to be failing or likely to fail and there is no reasonable prospect of recovery.
The conditions required of TLAC eligible instruments (other than own funds) and those required of eligible liabilities for MREL purposes under the BRRD are different and there can be no assurance that it will be possible for the Bank to issue instruments which simultaneously satisfy both requirements. Markets have not yet been established for such instruments (other than own funds instruments) and there can be no assurance that such markets will develop or that, if they do, the Bank will be able to issue sufficient TLAC and MREL eligible liabilities to meet its requirements. That may limit the quantity of the Bank’s CET1 capital which is available to meet its “combined buffer requirement”.
17
Table of Contents
EU fiscal and banking union
The project of achieving a European banking union was launched in the summer of 2012. Its main goal is to resume progress towards the European single market for financial services by restoring confidence in the European banking sector and ensuring the proper functioning of monetary policy in the eurozone.
The Banking union is expected to be achieved through new harmonized banking rules (the single rulebook) and a new institutional framework with stronger systems for both banking supervision and resolution that will be managed at the European level. Its two main pillars are the Single Supervisory Mechanism (“SSM”) and the Single Resolution Mechanism (“SRM”).
The SSM is expected to assist in making the banking sector more transparent, unified and safer. In accordance with the SSM Regulation, the ECB fully assumed its new supervisory responsibilities within the SSM, in particular direct supervision of the 120 largest European banks (including the Bank), on November 4, 2014. In preparation for this step, between November 2013 and October 2014, the ECB conducted, together with national supervisors, a comprehensive assessment of 130 banks, which together hold more than 80% of eurozone banking assets. The exercise consisted of three elements: (i) a supervisory risk assessment, which assessed the main balance sheet risks including liquidity, funding and leverage; (ii) an asset quality review, which focused on credit and market risks; and (iii) a stress test to examine the need to strengthen capital or take other corrective measures.
The SSM represents a significant change in the approach to bank supervision at a European and global level. The SSM will result in the direct supervision of 120 financial institutions, including the Bank, and indirect supervision of around 3,500 financial institutions. The new supervisor will be one of the largest in the world in terms of assets under supervision. In the coming years, the SSM is expected to work to establish a new supervisory culture importing best practices from the 19 supervisory authorities that will be part of the SSM. Several steps have already been taken in this regard such as the recent publication of the Supervisory Guidelines and the creation of the SSM Framework Regulation. In addition, this new body will represent an extra cost for the financial institutions that will fund it through payment of supervisory fees.
The other main pillar of the EU banking union is the SRM, the main purpose of which is to ensure a prompt and coherent resolution of failing banks in Europe at minimum cost. Regulation (EU) No. 806/2014 of the European Parliament and the Council of the European Union (the “SRM Regulation”), which was passed on July 15, 2014, and takes legal effect from January 1, 2015, establishes uniform rules and a uniform procedure for the resolution of credit institutions and certain investment firms in the framework of the SRM and a Single Resolution Fund (“SRF”). Under the intergovernmental agreement (“IGA”) signed by 26 EU member states on May 21, 2014, contributions by banks raised at national level will be transferred to the SRF. The new Single Resolution Board started operating from January 1, 2015 but it will not fully assume its resolution powers until January 1, 2016. From that date onwards the Single Resolution Fund will also be in place, funded by contributions from European banks in accordance with the methodology approved by the Council of the European Union. The Single Resolution Fund is intended to reach a total amount of €55 billion by 2024 and to be used as a separate backstop only after an 8% bail-in of a bank’s liabilities has been applied to cover capital shortfalls (in line with the BRRD).
By allowing for the consistent application of EU banking rules through the SSM, the banking union is expected to help resume momentum towards economic and monetary union. In order to complete such union, a single deposit guarantee scheme is still needed which may require a change to the existing European treaties. This is the subject of continued negotiation by European leaders to ensure further progress is made in European fiscal, economic and political integration.
Regulations adopted towards achieving a banking and/or fiscal union in the EU and decisions adopted by the ECB in its capacity as the Bank’s main supervisory authority may have a material impact on the Bank’s business, financial condition and results of operations. In particular, the BRRD and Directive 2014/49/EU on deposit guarantee schemes were published in the Official Journal of the EU on June 12, 2014. The BRRD was required to be implemented on or before January 1, 2015, although the bail-in tool will not apply until January 1, 2016, except where a bail-out is required during 2015. In this case, a minimum 8% bail-in of a bank’s liabilities (including senior debt and uncovered deposits) will be required as a precondition for access to any direct recapitalization by the European Stability Mechanism (ESM), as agreed by the eurozone members in December 2014.
The process for the implementation of the BRRD in Spain started on December 1, 2014, with the publication of the BRRD Draft Implementation Law for public consultation by the Spanish Ministry of Economy and Competitiveness. On February 27, 2015, the Council of Ministers submitted to Parliament the Draft Law on the Recovery and Resolution of Credit Institutions and Investment Service Companies (“Proyecto de Ley de Recuperación y Resolución de Entidades de Crédito y Empresas de Servicios de Inversión”).
18
Table of Contents
In addition, on January 29, 2014, the European Commission released its proposal on the structural reforms of the European banking sector that will impose new constraints on the structure of European banks. The proposal aims at ensuring the harmonization between the divergent national initiatives in Europe. It includes a prohibition on proprietary trading similar to that contained in Section 619 of the Dodd-Frank Act (also known as the Volcker Rule) and a mechanism to potentially require the separation of trading activities (including market making), such as in the Financial Services (Banking Reform) Act 2013, complex securitizations and risky derivatives.
Moreover, regulations adopted on structural measures to improve the resilience of EU credit institutions may have a material impact on the Bank’s business, financial condition and results of operations. These regulations, if adopted, may also cause the Group to invest significant management attention and resources to make any necessary changes.
United States significant regulation
In the United States, the Dodd-Frank Wall Street Reform and Consumer Protection Act (the “Dodd-Frank Act”) which was adopted in 2010 will continue to result in significant structural reforms affecting the financial services industry. This legislation provided for, among other things, the establishment of a Consumer Financial Protection Bureau with broad authority to regulate the credit, savings, payment and other consumer financial products and services that we offer, the creation of a structure to regulate systemically important financial companies, more comprehensive regulation of the over-the-counter derivatives market, prohibitions on engagement in certain proprietary trading activities and restrictions on ownership or sponsorship of, or entering into certain credit-related transactions with related, covered funds, restrictions on the interchange fees earned through debit card transactions, and a requirement that bank regulators phase out the treatment of trust preferred capital instruments as Tier 1 capital for regulatory capital purposes.
With respect to OTC derivatives, the Dodd-Frank Act provides for an extensive framework for the regulation of OTC derivatives, including mandatory clearing, exchange trading and transaction reporting of certain OTC derivatives. Entities that are swap dealers, security-based swap dealers, major swap participants or major security-based swap participants are required to register with the CFTC or the SEC, or both, and are or will be subject to new capital, margin, business conduct, recordkeeping, clearing, execution, reporting and other requirements. Banco Santander, S.A. and Abbey National Treasury Services plc became provisionally registered as a swap dealer with the CFTC on July 8, 2013 and November 4, 2013, respectively. In addition, we may register one more subsidiary as swap dealer with the CFTC. Although many significant regulations applicable to swap dealers are already in effect, some of the most important rules, such as margin requirements for uncleared swaps and capital rules for swap dealers, have not yet been implemented and we continue to assess how compliance with these new rules will affect our business.
In July 2013, the U.S. bank regulators issued the U.S. Basel III final rules implementing the Basel III capital framework for U.S. banks and bank holding companies. Certain aspects of the U.S. Basel III final rules, such as new minimum capital ratios and a revised methodology for calculating risk-weighted assets, became effective for part of the Bank’s U.S. operations on January 1, 2015. Other aspects of the U.S. Basel III final rules, such as the capital conservation buffer and the new regulatory deductions from and adjustments to capital, will be phased in over several years beginning on January 1, 2015.
In addition, in September 2014 the Board of Governors of the Federal Reserve System (the “Federal Reserve”) and other U.S. regulators issued a final rule introducing a quantitative liquidity coverage ratio requirement on certain large banks and bank holding companies. The liquidity coverage ratio is part of the Basel Committee’s international standards on quantitative liquidity metrics, which are in turn part of the international Basel III framework. The U.S. implementation of the liquidity coverage ratio is broadly consistent with the Basel Committee’s liquidity standards, but is more stringent in several important respects. Although this final rule does not apply to foreign banking organizations (“FBOs”), the Federal Reserve has stated that it intends, through future rulemakings, to apply the liquidity coverage ratio and another Basel III liquidity metric to the U.S. operations of some or all large FBOs.
On February 19, 2014, the Federal Reserve issued a final rule to enhance its supervision and regulation of certain FBOs. Among other things, this rule requires FBOs with over $50 billion of U.S. non-branch assets to establish or designate a U.S. intermediate holding company (an “IHC”) and to transfer its entire ownership interest in substantially all of its U.S. subsidiaries to such IHC by July 1, 2016. U.S. branches and agencies are not required to be transferred to the IHC. The IHC will be subject to an enhanced supervision framework, including enhanced risk-based and leverage capital requirements, liquidity requirements, risk management and governance requirements, and stress-testing requirements. A phased-in approach is being used for the standards and requirements. Certain enhanced standards are effective in 2015, with other standards and requirements becoming effective between July 1, 2016 and January 1, 2018. Pursuant to the final rule, as an FBO with over $50 billion of U.S. non-branch assets as of June 30, 2014, we submitted an IHC implementation plan to the Federal Reserve by January 1, 2015. As of the date of this annual report, we are awaiting a determination on the adequacy of the plan from the Federal Reserve. Implementation and compliance with this plan may cause the Group to invest significant management attention and resources.
19
Table of Contents
Within the Dodd-Frank Act, the Volcker Rule prohibits “banking entities” from engaging in certain forms of proprietary trading or from sponsoring, investing in, or entering into certain credit-related transactions with related, covered funds, in each case subject to certain exceptions. The term “covered fund” is defined very broadly to include traditional hedge funds, private equity funds, certain securitization vehicles and other entities that rely on Sections 3(c)(1) or 3(c)(7) of the U.S. Investment Company Act of 1940 for an exemption under that Act, as well as certain similar foreign funds. The Volcker Rule became effective on July 21, 2012 and on December 10, 2013, U.S. regulators issued final rules implementing the Volcker Rule. The statute and final rules also contain exclusions and certain exemptions for market-making, hedging, underwriting, trading in U.S. government and agency obligations as well as certain foreign government obligations, trading solely outside the United States, and also permit certain ownership interests in certain types of funds to be retained. On December 10, 2013, the Federal Reserve issued an order extending the period for all banking entities to conform with the Volcker Rule and implement a compliance program until July 21, 2015. In December 2014, the Federal Reserve issued an order extending the Volcker Rule’s general conformance period until July 21, 2016 for investments in and relationships with covered funds and certain foreign funds that were in place on or prior to December 31, 2013 (“legacy covered funds”), and stated its intention to grant a final one-year extension of the general conformance period, to July 21, 2017, for banking entities to conform ownership interests in and relationships with legacy covered funds. This extension of the conformance period does not apply to the Volcker Rule’s prohibitions on proprietary trading and does not appear to apply to any investments in and relationships with covered funds put in place after December 31, 2013. Banking entities such as the Bank must bring their activities and investments into compliance with the requirements of the Volcker Rule by the end of the conformance period. We are assessing how the final rules implementing the Volcker Rule will affect our businesses and are developing and implementing plans to bring affected businesses into compliance.
Furthermore, Title I of the Dodd-Frank Act and the implementing regulations issued by the Federal Reserve and the Federal Deposit Insurance Corporation (“FDIC”) require each bank holding company with assets of $50 billion or more, including us, to prepare and submit annually to the Federal Reserve and the FDIC a plan for the orderly resolution of our subsidiaries and operations that are domiciled in the United States in the event of future material financial distress or failure. In addition, each insured depository institution (“IDI”) with assets of $50 billion or more, such as the Bank, must submit a separate IDI resolution plan annually to the FDIC. The Title I and IDI plans each must include information on resolution strategy, major counterparties and interdependencies, among other things, and require substantial effort, time and cost to prepare. We submitted our most recent annual U.S. resolution plans in December 2014. The Title I plan resolution plan is subject to review by the Federal Reserve and the FDIC. The IDI plan is subject to review solely by the FDIC.
Each of these aspects of the Dodd-Frank Act, as well as other changes in U.S. banking regulations, may directly and indirectly impact various aspects of our business. The full spectrum of risks that the Dodd-Frank Act poses to us is not yet known; however, such risks could be material and we could be materially and adversely affected by them.
United States stress testing, capital planning, and related supervisory actions
Certain of our U.S. banking subsidiaries, including Santander Holdings USA, our U.S. bank holding company subsidiary, are subject to stress testing and capital planning requirements under regulations implementing the Dodd-Frank Act or other banking laws or policies. In March 2014 and 2015, the Federal Reserve Board, as part of its Comprehensive Capital Analysis and Review (“CCAR”) process, objected on qualitative grounds to the capital plans submitted by Santander Holdings USA. In its 2015 public report on CCAR, the Federal Reserve Board cited widespread and critical deficiencies in Santander Holdings USA’s capital planning processes, including specific deficiencies in governance, internal controls, risk identification and risk management, management information systems, and supporting assumptions and analysis. As a result of the 2014 and 2015 CCAR objections, Santander Holdings USA is not permitted to make any capital distributions without the Federal Reserve Board’s approval, other than the continued payment of dividends on Santander Holdings USA’s outstanding class of preferred stock, until a new capital plan is approved by the Federal Reserve Board. The deadline for Santander Holdings USA’s next capital plan submission is in April 2016, and there is the risk that the Federal Reserve Board will object to Santander Holdings USA’s next capital plan.
In addition, we are subject to supervisory actions in the United States related to the CCAR stress testing and capital planning processes. Specifically, on September 15, 2014, Santander Holdings USA and the Federal Reserve Bank of Boston (“FRB Boston”) executed a written agreement relating to a subsidiary’s declaration and payment of dividends in the second quarter of 2014 without the Federal Reserve Board’s approval. Under the written agreement, Santander Holdings USA agreed to submit to the FRB Boston written procedures to strengthen board oversight of management regarding planned capital distributions by Santander Holdings USA and its subsidiaries. In addition, Santander Holdings USA agreed to subject future distributions to the prior written approval of Federal Reserve System and to take necessary actions to ensure that no such distributions are made.
20
Table of Contents
Other supervisory actions and restrictions on U.S. activities
In addition to the foregoing, U.S. bank regulatory agencies from time to time take supervisory actions under certain circumstances that restrict or limit a financial institution’s activities. In some instances, we are subject to significant legal restrictions on our ability to publicly disclose these actions or the full details of these actions. In addition, as part of the regular examination process, our U.S. banking subsidiaries’ regulators may advise our U.S. banking subsidiaries to operate under various restrictions as a prudential matter. The U.S. supervisory environment has become significantly more demanding and restrictive since the financial crisis of 2008. Under the U.S. Bank Holding Company Act, the Federal Reserve has the authority to disallow us and our U.S. banking subsidiaries from engaging in certain categories of new activities in the United States or acquiring shares or control of other companies in the United States. Such actions and restrictions currently applicable to us or our U.S. banking subsidiaries could adversely affect our costs and revenues. Moreover, efforts to comply with nonpublic supervisory actions or restrictions could require material investments in additional resources and systems, as well as a significant commitment of managerial time and attention. As a result, such supervisory actions or restrictions could have a material adverse effect on our business and results of operations; and we may be subject to significant legal restrictions on our ability to publicly disclose these matters or the full details of these actions. In addition to such confidential actions and restrictions we expect that SHUSA will become subject to a public enforcement action with the Federal Reserve Bank of Boston in the near future. Although the SHUSA has not yet received a draft of such action, it believes that the action will require SHUSA to make enhancements with respect to, among other matters, board and senior management oversight of the consolidated organization, risk management, and new business initiatives.
As noted above, our business and operations are subject to increasingly stringent regulatory oversight and scrutiny, which may lead to regulatory investigations or enforcement actions. A single event may give rise to numerous and overlapping investigations and regulatory proceedings, by various agencies, regulators and other governmental officials in any of the jurisdictions in which we operate, which in turn could harm our reputation or lead to higher operational costs, thereby reducing our profitability.
2.1.3 We are subject to review by taxing authorities, and an incorrect interpretation by us of tax laws and regulations may have a material adverse effect on us.
The preparation of our tax returns requires the use of estimates and interpretations of complex tax laws and regulations and is subject to review by taxing authorities. We are subject to the income tax laws of Spain and certain foreign countries. These tax laws are complex and subject to different interpretations by the taxpayer and relevant governmental taxing authorities, which are sometimes subject to prolonged evaluation periods until a final resolution is reached. In establishing a provision for income tax expense and filing returns, we must make judgments and interpretations about the application of these inherently complex tax laws. If the judgment, estimates and assumptions we use in preparing our tax returns are subsequently found to be incorrect, there could be a material adverse effect on our results of operations.
2.1.4 Changes in taxes and other assessments may adversely affect us.
The legislatures and tax authorities in the tax jurisdictions in which we operate regularly enact reforms to the tax and other assessment regimes to which we and our customers are subject. Such reforms include changes in the rate of assessments and, occasionally, enactment of temporary taxes, the proceeds of which are earmarked for designated governmental purposes. The effects of these changes and any other changes that result from enactment of additional tax reforms cannot be quantified and there can be no assurance that any such reforms would not have an adverse effect upon our business.
2.1.5 We may not be able to detect or prevent money laundering and other financial crime activities fully or on a timely basis, which could expose us to additional liability and could have a material adverse effect on us.
We are required to comply with applicable anti-money laundering (“AML”), anti-terrorism, sanctions and other laws and regulations in the jurisdictions in which we operate. These laws and regulations require us, among other things, to conduct full customer due diligence regarding sanctions and politically-exposed person screening, keep our customer, account and transaction information up to date and have implemented effective financial crime policies and procedures detailing what is required from those responsible. Our requirements also include AML training for our employees, reporting suspicious transactions and activity to appropriate law enforcement following full investigation by our local AML team.
Financial crime has become the subject of enhanced regulatory scrutiny and supervision by regulators globally. AML sanctions, laws and regulations are increasingly complex and detailed and have become the subject of enhanced regulatory supervision, requiring improved systems, sophisticated monitoring and skilled compliance personnel.
21
Table of Contents
We have developed policies and procedures aimed at detecting and preventing the use of our banking network for money laundering and other financial crime related activities. These require implementation and embedding within our business effective controls and monitoring, which in turn require on-going changes to systems and operational activities. Financial crime is continually evolving and subject to increasingly stringent regulatory oversight and focus. This requires proactive and adaptable responses from us so that we are able to effectively deter threats and criminality. Even known threats can never be fully eliminated, and there will be instances where we may be used by other parties to engage in money laundering and other illegal or improper activities. In addition, we rely heavily on our employees to assist us by spotting such activities and reporting them, and our employees have varying degrees of experience in recognizing criminal tactics and understanding the level of sophistication of criminal organizations. Where we outsource any of our customer due diligence, customer screening or anti financial crime operations, we remain responsible and accountable for full compliance and any breaches. If we are unable to apply the necessary scrutiny and oversight, there remains a risk of regulatory breach.
If we are unable to fully comply with applicable laws, regulations and expectations, our regulators and relevant law enforcement agencies have the ability and authority to impose significant fines and other penalties on us, including requiring a complete review of our business systems, day-to-day supervision by external consultants and ultimately the revocation of our banking license.
The reputational damage to our business and global brand would be severe if we were found to have breached AML or sanctions requirements. Our reputation could also suffer if we are unable to protect our customers or our business from being used by criminals for illegal or improper purposes.
In addition, while we review our relevant counterparties’ internal policies and procedures with respect to such matters, we, to a large degree, rely upon our relevant counterparties to maintain and properly apply their own appropriate anti-money laundering procedures. Such measures, procedures and compliance may not be completely effective in preventing third parties from using our (and our relevant counterparties’) services as a conduit for money laundering (including illegal cash operations) without our (and our relevant counterparties’) knowledge. If we are associated with, or even accused of being associated with, or become a party to, money laundering, then our reputation could suffer and/or we could become subject to fines, sanctions and/or legal enforcement (including being added to any “black lists” that would prohibit certain parties from engaging in transactions with us), any one of which could have a material adverse effect on our operating results, financial condition and prospects.
Any such risks could have a material adverse effect on our operating results, financial condition and prospects.
2.2 Liquidity and Financing Risks
2.2.1 Liquidity and funding risks are inherent in our business and could have a material adverse effect on us.
Liquidity risk is the risk that we either do not have available sufficient financial resources to meet our obligations as they fall due or can secure them only at excessive cost. This risk is inherent in any retail and commercial banking business and can be heightened by a number of enterprise-specific factors, including over-reliance on a particular source of funding, changes in credit ratings or market-wide phenomena such as market dislocation. While we implement liquidity management processes to seek to mitigate and control these risks, unforeseen systemic market factors in particular make it difficult to eliminate completely these risks. Adverse and continued constraints in the supply of liquidity, including inter-bank lending, has affected and may materially and adversely affect the cost of funding our business, and extreme liquidity constraints may affect our current operations as well as limit growth possibilities.
Disruption and volatility in the global financial markets could have a material adverse effect on our ability to access capital and liquidity on financial terms acceptable to us.
Our cost of obtaining funding is directly related to prevailing market interest rates and to our credit spreads. Increases in interest rates and our credit spreads can significantly increase the cost of our funding. Changes in our credit spreads are market-driven, and may be influenced by market perceptions of our creditworthiness. Changes to interest rates and our credit spreads occur continuously and may be unpredictable and highly volatile.
If wholesale markets financing ceases to become available, or becomes excessively expensive, we may be forced to raise the rates we pay on deposits, with a view to attracting more customers, and/or to sell assets, potentially at depressed prices. The persistence or worsening of these adverse market conditions or an increase in base interest rates could have a material adverse effect on our ability to access liquidity and cost of funding.
22
Table of Contents
We rely, and will continue to rely, primarily on commercial deposits to fund lending activities. The ongoing availability of this type of funding is sensitive to a variety of factors outside our control, such as general economic conditions and the confidence of commercial depositors in the economy, in general, and the financial services industry in particular, and the availability and extent of deposit guarantees, as well as competition between banks for deposits. Any of these factors could significantly increase the amount of commercial deposit withdrawals in a short period of time, thereby reducing our ability to access commercial deposit funding on appropriate terms, or at all, in the future. If these circumstances were to arise, this could have a material adverse effect on our operating results, financial condition and prospects.
We anticipate that our customers will continue, in the near future, to make short-term deposits (particularly demand deposits and short-term time deposits), and we intend to maintain our emphasis on the use of banking deposits as a source of funds. The short-term nature of this funding source could cause liquidity problems for us in the future if deposits are not made in the volumes we expect or are not renewed. If a substantial number of our depositors withdraw their demand deposits or do not roll over their time deposits upon maturity, we may be materially and adversely affected.
We cannot assure you that in the event of a sudden or unexpected shortage of funds in the banking system, we will be able to maintain levels of funding without incurring high funding costs, a reduction in the term of funding instruments or the liquidation of certain assets. If this were to happen, we could be materially adversely affected.
2.2.2 Credit, market and liquidity risk may have an adverse effect on our credit ratings and our cost of funds. Any downgrading in our credit rating would likely increase our cost of funding, require us to post additional collateral or take other actions under some of our derivative contracts and adversely affect our interest margins and results of operations.
Credit ratings affect the cost and other terms upon which we are able to obtain funding. Rating agencies regularly evaluate us, and their ratings of our debt are based on a number of factors, including our financial strength and conditions affecting the financial services industry generally. In addition, due to the methodology of the main rating agencies, our credit rating is affected by the rating of Spanish sovereign debt. If Spain’s sovereign debt is downgraded, our credit rating would also likely be downgraded by an equivalent amount.
Any downgrade in our debt credit ratings would likely increase our borrowing costs and require us to post additional collateral or take other actions under some of our derivative contracts, and could limit our access to capital markets and adversely affect our commercial business. For example, a ratings downgrade could adversely affect our ability to sell or market certain of our products, engage in certain longer-term and derivatives transactions and retain our customers, particularly customers who need a minimum rating threshold in order to invest. In addition, under the terms of certain of our derivative contracts, we may be required to maintain a minimum credit rating or terminate such contracts. Any of these results of a ratings downgrade, in turn, could reduce our liquidity and have an adverse effect on us, including our operating results and financial condition.
Banco Santander, S.A.’s long-term debt is currently rated investment grade by the major rating agencies—Baa1 outlook under review for upgrade by Moody’s Investors Service España, S.A., BBB+ stable outlook by Standard & Poor’s Ratings Services and A- stable outlook by Fitch Ratings Ltd. During 2012, following downgrades of Spanish sovereign debt, all three agencies downgraded Banco Santander, S.A.’s rating together with that of the other main Spanish banks, due to the weaker-than-previously-anticipated macroeconomic and financial environment in Spain with dimming growth prospects in the near term, depressed real estate market activity and heightened turbulence in the capital markets. In the fourth quarter of 2013 and first quarter of 2014 the three agencies revised our outlook from negative to stable reflecting the gradual improvement of the Spanish economy and the view that any further weakening of our credit profile was unlikely to be significant. During the first half of 2014, all three agencies upgraded our rating following the upgrade revision of Spain’s sovereign debt (Moody’s Investors Service from Baa2 to Baa1, Standard & Poor’s from BBB to BBB+ and Fitch from BBB+ to A-).
Santander UK’s long-term debt is currently rated investment grade by the major rating agencies: A2 with outlook under review for upgrade by Moody’s Investors Service, A with negative outlook by Standard & Poor’s Ratings Services and A with stable outlook by Fitch Ratings. All three agencies revised Santander UK’s ratings during 2012 following the downgrades of the Spanish sovereign debt and remained unchanged in 2013. Negative outlook by Standard & Poor’s reflects the negative trend that they see for the U.K. banking industry.
We conduct substantially all of our material derivative activities through Banco Santander, S.A. and Santander UK. If all the rating agencies were to downgrade Banco Santander, S.A.’s long-term senior debt ratings by one or two notches, we will not be required to post additional collateral pursuant to derivative and other financial contracts. However, we may be required to post additional collateral in the event of a downgrade by more than two notches. We estimate that as of December 31, 2014, if all the rating agencies were to downgrade Santander UK’s long-term credit ratings by one notch, and thereby trigger a short-
23
Table of Contents
term credit rating downgrade, this could result in contractual outflows from Santander UK’s total liquid assets of £5.9 billion of cash and additional collateral that Santander UK would be required to post under the terms of secured funding and derivatives contracts. A hypothetical two notch downgrade would result in an additional contractual outflow of £1.2 billion of cash and collateral under secured funding and derivatives contracts.
While certain potential impacts of these downgrades are contractual and quantifiable, the full consequences of a credit rating downgrade are inherently uncertain, as they depend upon numerous dynamic, complex and inter-related factors and assumptions, including market conditions at the time of any downgrade, whether any downgrade of a firm’s long-term credit rating precipitates downgrades to its short-term credit rating, and assumptions about the potential behaviors of various customers, investors and counterparties. Actual outflows could be higher or lower than this hypothetical example, depending upon certain factors including which credit rating agency downgrades our credit rating, any management or restructuring actions that could be taken to reduce cash outflows and the potential liquidity impact from loss of unsecured funding (such as from money market funds) or loss of secured funding capacity. Although, unsecured and secured funding stresses are included in our stress testing scenarios and a portion of our total liquid assets is held against these risks, it is still the case that a credit rating downgrade could have a material adverse effect on Banco Santander, S.A., and/or its subsidiaries.
In addition, if we were required to cancel our derivatives contracts with certain counterparties and were unable to replace such contracts, our market risk profile could be altered.
In light of the difficulties in the financial services industry and the financial markets, there can be no assurance that the rating agencies will maintain the current ratings or outlooks. Failure to maintain favorable ratings and outlooks could increase our cost of funding and adversely affect interest margins, which could have a material adverse effect on us.
2.3 Credit Risks
2.3.1 If we are unable to effectively control the level of non-performing or poor credit quality loans in the future, or if our loan loss reserves are insufficient to cover future loan losses, this could have a material adverse effect on us.
Risks arising from changes in credit quality and the recoverability of loans and amounts due from counterparties are inherent in a wide range of our businesses. Non-performing or low credit quality loans have in the past and can continue to negatively impact our results of operations. We cannot assure you that we will be able to effectively control the level of the non-performing loans in our total loan portfolio. In particular, the amount of our reported non-performing loans may increase in the future as a result of growth in our total loan portfolio, including as a result of loan portfolios that we may acquire in the future, or factors beyond our control, such as adverse changes in the credit quality of our borrowers and counterparties or a general deterioration in economic conditions in Continental Europe, the United Kingdom, Latin America, particularly Brazil, the United States or global economic conditions, impact of political events, events affecting certain industries or events affecting financial markets and global economies.
Our current loan loss reserves may not be adequate to cover any increase in the amount of non-performing loans or any future deterioration in the overall credit quality of our total loan portfolio. Our loan loss reserves are based on our current assessment of and expectations concerning various factors affecting the quality of our loan portfolio. These factors include, among other things, our borrowers’ financial condition, repayment abilities and repayment intentions, the realizable value of any collateral, the prospects for support from any guarantor, government macroeconomic policies, interest rates and the legal and regulatory environment. As the recent global financial crisis demonstrated, many of these factors are beyond our control. As a result, there is no precise method for predicting loan and credit losses, and we cannot assure you that our loan loss reserves will be sufficient to cover actual losses. If our assessment of and expectations concerning the above mentioned factors differ from actual developments, if the quality of our total loan portfolio deteriorates, for any reason, including the increase in lending to individuals and small and medium enterprises, the volume increase in the credit card portfolio and the introduction of new products, or if the future actual losses exceed our estimates of incurred losses, we may be required to increase our loan loss reserves, which may adversely affect us. If we were unable to control or reduce the level of our non-performing or poor credit quality loans, this could have a material adverse effect on us.
Mortgage loans are one of our principal assets, comprising 50% of our loan portfolio as of December 31, 2014. We are exposed to developments in housing markets, especially in Spain and the United Kingdom, and to a number of large real estate developers in Spain. From 2002 to 2007, demand for housing and mortgage financing in Spain increased significantly driven by, among other things, economic growth, declining unemployment rates, demographic and social trends, the desirability of Spain as a vacation destination and historically low interest rates in the eurozone. The United Kingdom also experienced an increase in housing and mortgage demand driven by, among other things, economic growth, declining unemployment rates, demographic trends and the increasing prominence of London as an international financial center. During late 2007, the housing
24
Table of Contents
market began to adjust in Spain and the United Kingdom as a result of excess supply (particularly in Spain) and higher interest rates. Since 2008, as economic growth stalled in Spain and the United Kingdom, persistent housing oversupply, decreased housing demand, rising unemployment, subdued earnings growth, greater pressure on disposable income, a decline in the availability of mortgage finance and the continued effect of global market volatility have caused home prices to decline, while mortgage delinquencies and forbearances have increased.
As a result of these and other factors, our NPL ratio increased from 0.94% at December 31, 2007, to 2.02% at December 31, 2008, to 3.24% at December 31, 2009, to 3.54% at December 31, 2010, to 3.90% at December 31, 2011, to 4.54% at December 31, 2012 and to 5.64% at December 31, 2013. At December 31, 2014, our NPL ratio was 5.19%. High unemployment rates coupled with declining real estate prices, could have a material adverse impact on our mortgage payment delinquency rates, which in turn could have a material adverse effect on our business, financial condition and results of operations.
2.3.2 Our loan and investment portfolios are subject to risk of prepayment, which could have a material adverse effect on us.
Our fixed rate loan and investment portfolios are subject to prepayment risk, which results from the ability of a borrower or issuer to pay a debt obligation prior to maturity. Generally, in a declining interest rate environment, prepayment activity increases, which reduces the weighted average lives of our earning assets and could have a material adverse effect on us. We would also be required to amortize net premiums into income over a shorter period of time, thereby reducing the corresponding asset yield and net interest income. Prepayment risk also has a significant adverse impact on credit card and collateralized mortgage loans, since prepayments could shorten the weighted average life of these assets, which may result in a mismatch in our funding obligations and reinvestment at lower yields. Prepayment risk is inherent to our commercial activity and an increase in prepayments could have a material adverse effect on us.
2.3.3 The value of the collateral securing our loans may not be sufficient, and we may be unable to realize the full value of the collateral securing our loan portfolio.
The value of the collateral securing our loan portfolio may fluctuate or decline due to factors beyond our control, including macroeconomic factors affecting Europe, the United States and Latin American countries. The value of the collateral securing our loan portfolio may be adversely affected by force majeure events, such as natural disasters, particularly in locations where a significant portion of our loan portfolio is composed of real estate loans. Natural disasters such as earthquakes and floods may cause widespread damage which could impair the asset quality of our loan portfolio and could have an adverse impact on the economy of the affected region. We may also not have sufficiently recent information on the value of collateral, which may result in an inaccurate assessment for impairment losses of our loans secured by such collateral. If any of the above were to occur, we may need to make additional provisions to cover actual impairment losses of our loans, which may materially and adversely affect our results of operations and financial condition.
2.3.4 We are subject to counterparty risk in our banking business.
We are exposed to counterparty risk in addition to credit risks associated with lending activities. Counterparty risk may arise from, for example, investing in securities of third parties, entering into derivative contracts under which counterparties have obligations to make payments to us or executing securities, futures, currency or commodity trades from proprietary trading activities that fail to settle at the required time due to non-delivery by the counterparty or systems failure by clearing agents, clearing houses or other financial intermediaries.
We routinely transact with counterparties in the financial services industry, including brokers and dealers, commercial banks, investment banks, mutual funds, hedge funds and other institutional clients. Defaults by, and even rumors or questions about the solvency of, certain financial institutions and the financial services industry generally have led to market-wide liquidity problems and could lead to losses or defaults by other institutions. Many of the routine transactions we enter into expose us to significant credit risk in the event of default by one of our significant counterparties.
25
Table of Contents
2.4 Market Risks
2.4.1 Our financial results are constantly exposed to market risk. We are subject to fluctuations in interest rates and other market risks, which may materially and adversely affect us.
Market risk refers to the probability of variations in our net interest income or in the market value of our assets and liabilities due to volatility of interest rate, inflation, exchange rate or equity price. Changes in interest rates affect the following areas, among others, of our business:
| • | net interest income; |
| • | the volume of loans originated; |
| • | the market value of our securities holdings; |
| • | gains from sales of loans and securities; and |
| • | gains and losses from derivatives. |
Variations in short-term interest rates could affect our net interest income, which comprises the majority of our revenue, reducing our growth rate and potentially resulting in losses. When interest rates rise, we may be required to pay higher interest on our floating-rate borrowings while interest earned on our fixed-rate assets does not rise as quickly, which could cause profits to grow at a reduced rate or decline in some parts of our portfolio. Interest rates are highly sensitive to many factors beyond our control, including increased regulation of the financial sector, monetary policies, domestic and international economic and political conditions and other factors.
Increases in interest rates may reduce the volume of loans we originate. Sustained high interest rates have historically discouraged customers from borrowing and have resulted in increased delinquencies in outstanding loans and deterioration in the quality of assets. Increases in interest rates may also reduce the propensity of our customers to prepay or refinance fixed-rate loans. Increases in interest rates may reduce the value of our financial assets and may reduce gains or require us to record losses on sales of our loans or securities.
If interest rates decrease, although this is likely to reduce our funding costs, it is likely to compress our net interest margins, as well as adversely impact our income from investments in securities and loans with similar maturities, which could have a negative effect on us. In addition, we may also experience increased delinquencies in a low interest rate environment when such an environment is accompanied by high unemployment and recessionary conditions.
The market value of a security with a fixed interest rate generally decreases when prevailing interest rates rise, which may have an adverse effect on our earnings and financial condition. In addition, we may incur costs (which, in turn, will impact our results) as we implement strategies to reduce future interest rate exposure. The market value of an obligation with a floating interest rate can be adversely affected when interest rates increase, due to a lag in the implementation of repricing terms or an inability to refinance at lower rates.
We are also exposed to foreign exchange rate risk as a result of mismatches between assets and liabilities denominated in different currencies. Fluctuations in the exchange rate between currencies may negatively affect our earnings and value of our assets and securities. The recent depreciation of the Latin American currencies against the U.S. dollar could make our Latin American subsidiaries’ foreign currency-linked obligations and funding more expensive and have similar consequences for our borrowers in Latin America.
We are also exposed to equity price risk in connection with our trading investments in equity securities. The performance of financial markets may cause changes in the value of our investment and trading portfolios. The volatility of world equity markets due to the continued economic uncertainty and sovereign debt crisis has had a particularly strong impact on the financial sector. Continued volatility may affect the value of our investments in entities in this sector and, depending on their fair value and future recovery expectations, could become a permanent impairment which would be subject to write-offs against our results. To the extent any of these risks materialize, our net interest income or the market value of our assets and liabilities could be materially adversely affected.
26
Table of Contents
2.4.2 Market conditions have resulted and could result in material changes to the estimated fair values of our financial assets. Negative fair value adjustments could have a material adverse effect on our operating results, financial condition and prospects.
In the past seven years, financial markets have been subject to significant stress resulting in steep falls in perceived or actual financial asset values, particularly due to volatility in global financial markets and the resulting widening of credit spreads. We have material exposures to securities, loans and other investments that are recorded at fair value and are therefore exposed to potential negative fair value adjustments. Asset valuations in future periods, reflecting then-prevailing market conditions, may result in negative changes in the fair values of our financial assets and these may also translate into increased impairments. In addition, the value ultimately realized by us on disposal may be lower than the current fair value. Any of these factors could require us to record negative fair value adjustments, which may have a material adverse effect on our operating results, financial condition or prospects.
In addition, to the extent that fair values are determined using financial valuation models, such values may be inaccurate or subject to change, as the data used by such models may not be available or may become unavailable due to changes in market conditions, particularly for illiquid assets, and particularly in times of economic instability. In such circumstances, our valuation methodologies require us to make assumptions, judgments and estimates in order to establish fair value, and reliable assumptions are difficult to make and are inherently uncertain and valuation models are complex, making them inherently imperfect predictors of actual results. Any consequential impairments or write-downs could have a material adverse effect on our operating results, financial condition and prospects.
2.4.3 We are subject to market, operational and other related risks associated with our derivative transactions that could have a material adverse effect on us.
We enter into derivative transactions for trading purposes as well as for hedging purposes. We are subject to market, credit and operational risks associated with these transactions, including basis risk (the risk of loss associated with variations in the spread between the asset yield and the funding and/or hedge cost) and credit or default risk (the risk of insolvency or other inability of the counterparty to a particular transaction to perform its obligations thereunder, including providing sufficient collateral).
Market practices and documentation for derivative transactions in the countries where we operate differ from each other. In addition, the execution and performance of these transactions depends on our ability to maintain adequate control and administration systems and to hire and retain qualified personnel. Moreover, our ability to adequately monitor, analyze and report derivative transactions continues to depend, to a great extent, on our information technology systems. This factor further increases the risks associated with these transactions and could have a material adverse effect on us.
2.5 Risk Management
2.5.1 Failure to successfully implement and continue to improve our risk management policies, procedures and methods, including our credit risk management system, could materially and adversely affect us, and we may be exposed to unidentified or unanticipated risks.
The management of risk is an integral part of our activities. We seek to monitor and manage our risk exposure through a variety of separate but complementary financial, credit, market, operational, compliance and legal reporting systems. While we employ a broad and diversified set of risk monitoring and risk mitigation techniques, such techniques and strategies may not be fully effective in mitigating our risk exposure in all economic market environments or against all types of risk, including risks that we fail to identify or anticipate.
Some of our qualitative tools and metrics for managing risk are based upon our use of observed historical market behavior. We apply statistical and other tools to these observations to arrive at quantifications of our risk exposures. These qualitative tools and metrics may fail to predict future risk exposures. These risk exposures could, for example, arise from factors we did not anticipate or correctly evaluate in our statistical models. This would limit our ability to manage our risks. Our losses thus could be significantly greater than the historical measures indicate. In addition, our quantified modeling does not take all risks into account. Our more qualitative approach to managing those risks could prove insufficient, exposing us to material unanticipated losses. If existing or potential customers believe our risk management is inadequate, they could take their business elsewhere. This could have a material adverse effect on our operating results, financial condition and prospects.
As a commercial bank, one of the main types of risks inherent in our business is credit risk. For example, an important feature of our credit risk management system is to employ an internal credit rating system to assess the particular risk profile of a customer. As this process involves detailed analyses of the customer, taking into account both quantitative and qualitative
27
Table of Contents
factors, it is subject to human error. In exercising their judgment, our employees may not always be able to assign an accurate credit rating to a customer or credit risk, which may result in our exposure to higher credit risks than indicated by our risk rating system.
In addition, we have refined our credit policies and guidelines to address potential risks associated with particular industries or types of customers. However, we may not be able to timely detect these risks before they occur, or due to limited tools available to us, our employees may not be able to effectively implement them, which may increase our credit risk. Failure to effectively implement, consistently follow or continuously refine our credit risk management system may result in an increase in the level of non-performing loans and a higher risk exposure for us, which could have a material adverse effect on us.
2.6 General Business and Industry Risks
2.6.1 The financial problems faced by our customers could adversely affect us.
Market turmoil and economic recession could materially and adversely affect the liquidity, credit ratings, businesses and/or financial conditions of our borrowers, which could in turn increase our non-performing loan ratios, impair our loan and other financial assets and result in decreased demand for borrowings in general. In addition, our customers may further significantly decrease their risk tolerance to non-deposit investments such as stocks, bonds and mutual funds, which would adversely affect our fee and commission income. We may also be adversely affected by the negative effects of the heightened regulatory environment on our customers due to the high costs associated with regulatory compliance and proceedings. Any of the conditions described above could have a material adverse effect on our business, financial condition and results of operations.
2.6.2 Changes in our pension liabilities and obligations could have a material adverse effect on us.
We provide retirement benefits for many of our former and current employees through a number of defined benefit pension plans. We calculate the amount of our defined benefit obligations using actuarial techniques and assumptions, including mortality rates, the rate of increase of salaries, discount rates, inflation, the expected rate of return on plan assets, or others. The accounting and disclosures are based on IFRS and on those other requirements defined by the local supervisors. Given the nature of these obligations, changes in the assumptions that support valuations, including market conditions, can result in actuarial losses which would in turn impact the financial condition of our pension funds. Because pension obligations are generally long term obligations, fluctuations in interest rates have a material impact on the projected costs of our defined benefit obligations and therefore on the amount of pension expense that we accrue.
Any increase in the current size of the deficit in our defined benefit pension plans, due to reduction in the value of the pension fund assets (depending on the performance of financial markets) or an increase in the pension fund liabilities due to changes in mortality assumptions, the rate of increase of salaries, discount rate assumptions, inflation, the expected rate of return on plan assets, or other factors, could result in our having to make increased contributions to reduce or satisfy the deficits which would divert resources from use in other areas of our business and reduce our capital resources. While we can control a number of the above factors, there are some over which we have no or limited control. Increases in our pension liabilities and obligations could have a material adverse effect on our business, financial condition and results of operations.
2.6.3 We depend in part upon dividends and other funds from subsidiaries.
Some of our operations are conducted through our financial services subsidiaries. As a result, our ability to pay dividends, to the extent we decide to do so, depends in part on the ability of our subsidiaries to generate earnings and to pay dividends to us. Payment of dividends, distributions and advances by our subsidiaries will be contingent upon our subsidiaries’ earnings and business considerations and is or may be limited by legal, regulatory and contractual restrictions. Additionally, our right to receive any assets of any of our subsidiaries as an equity holder of such subsidiaries, upon their liquidation or reorganization, will be effectively subordinated to the claims of our subsidiaries’ creditors, including trade creditors.
2.6.4 Increased competition and industry consolidation may adversely affect our results of operations.
We face substantial competition in all parts of our business, including in originating loans and in attracting deposits. The competition in originating loans comes principally from other domestic and foreign banks, mortgage banking companies, consumer finance companies, insurance companies and other lenders and purchasers of loans.
In addition, there has been a trend towards consolidation in the banking industry, which has created larger and stronger banks with which we must now compete. There can be no assurance that this increased competition will not adversely affect
28
Table of Contents
our growth prospects, and therefore our operations. We also face competition from non-bank competitors, such as brokerage companies, department stores (for some credit products), leasing and factoring companies, mutual fund and pension fund management companies and insurance companies.
Non-traditional providers of banking services, such as Internet based e-commerce providers, mobile telephone companies and internet search engines may offer and/or increase their offerings of financial products and services directly to customers. Several of these competitors may have long operating histories, large customer bases, strong brand recognition and significant financial, marketing and other resources. They may adopt more aggressive pricing and rates and devote more resources to technology, infrastructure and marketing. New competitors may enter the market or existing competitors may adjust their services with unique product or service offerings or approaches to providing banking services. If we are unable to successfully compete with current and new competitors, or if we are unable to anticipate and adapt our offerings to changing banking industry trends, including technological changes, our business may be adversely affected. In addition, our failure to effectively anticipate or adapt to emerging technologies or changes in customer behavior, including among younger customers, could delay or prevent our access to new digital-based markets which would in turn have an adverse effect on our competitive position and business.
Increasing competition could also require that we increase our rates offered on deposits or lower the rates we charge on loans, which could also have a material adverse effect on us, including our profitability. It may also negatively affect our business results and prospects by, among other things, limiting our ability to increase our customer base and expand our operations and increasing competition for investment opportunities.
If our customer service levels were perceived by the market to be materially below those of our competitor financial institutions, we could lose existing and potential business. If we are not successful in retaining and strengthening customer relationships, we may lose market share, incur losses on some or all of our activities or fail to attract new deposits or retain existing deposits, which could have a material adverse effect on our operating results, financial condition and prospects.
2.6.5 Our ability to maintain our competitive position depends, in part, on the success of new products and services we offer our clients and our ability to continue offering products and services from third parties, and we may not be able to manage various risks we face as we expand our range of products and services that could have a material adverse effect on us.
The success of our operations and our profitability depends, in part, on the success of new products and services we offer our clients and our ability to continue offering products and services from third parties. However, we cannot guarantee that our new products and services will be responsive to client demands or successful once they are offered to our clients, or that they will be successful in the future. In addition, our clients’ needs or desires may change over time, and such changes may render our products and services obsolete, outdated or unattractive and we may not be able to develop new products that meet our clients’ changing needs. Our success is also dependent on our ability to anticipate and leverage new and existing technologies that may have an impact on products and services in the banking industry. Technological changes may further intensify and complicate the competitive landscape and influence client behavior. If our products and services employ technology that is not as attractive to our clients as that employed by our competitors, if we fail to employ technologies desired by our clients before our competitors do so, or if we fail to execute effectively on targeted strategic technology initiatives, our business and results could be adversely affected. In addition, we cannot respond in a timely fashion to the changing needs of our clients, we may lose clients, which could in turn materially and adversely affect us.
As we expand the range of our products and services, some of which may be at an early stage of development in the markets of certain regions where we operate, we will be exposed to new and potentially increasingly complex risks and development expenses. Our employees and risk management systems, as well as our experience and that of our partners may not be sufficient or adequate to enable us to properly handle or manage such risks. In addition, the cost of developing products that are not launched is likely to affect our results of operations. Any or all of these factors, individually or collectively, could have a material adverse effect on us.
Further, our customers may issue complaints and seek redress if they consider that they have suffered loss from our products and services, for example, as a result of any alleged mis-selling or incorrect application of the terms and conditions of a particular product. This could in turn subject us to risks of potential legal action by our customers and intervention by our regulators. We have in the past experienced losses due to claims of mis-selling in the U.K., Spain and other jurisdictions and may do so again in the future. For further detail on our legal and regulatory risk exposures, please see the risk factor entitled “We are exposed to risk of loss from legal and regulatory proceedings.”
29
Table of Contents
2.6.6 If we are unable to manage the growth of our operations this could have an adverse impact on our profitability.
We allocate management and planning resources to develop strategic plans for organic growth, and to identify possible acquisitions and disposals and areas for restructuring our businesses. From time to time, we evaluate acquisition and partnership opportunities that we believe offer additional value to our shareholders and are consistent with our business strategy. However, we may not be able to identify suitable acquisition or partnership candidates, and our ability to benefit from any such acquisitions and partnerships will depend in part on our successful integration of those businesses. Any such integration entails significant risks such as unforeseen difficulties in integrating operations and systems and unexpected liabilities or contingencies relating to the acquired businesses, including legal claims. We can give no assurances that our expectations with regards to integration and synergies will materialize. We also cannot provide assurance that we will, in all cases, be able to manage our growth effectively or deliver our strategic growth objectives. Challenges that may result from our strategic growth decisions include our ability to:
| • | manage efficiently the operations and employees of expanding businesses; |
| • | maintain or grow our existing customer base; |
| • | assess the value, strengths and weaknesses of investment or acquisition candidates; |
| • | finance strategic investments or acquisitions; |
| • | fully integrate strategic investments, or newly-established entities or acquisitions in line with its strategy; |
| • | align our current information technology systems adequately with those of an enlarged group; |
| • | apply our risk management policy effectively to an enlarged group; and |
| • | manage a growing number of entities without over-committing management or losing key personnel. |
Any failure to manage growth effectively, including relating to any or all of the above challenges associated with our growth plans, could have a material adverse effect on our operating results, financial condition and prospects.
2.6.7 Goodwill impairments may be required in relation to acquired businesses.
We have made business acquisitions in recent years and may make further acquisitions in the future. It is possible that the goodwill which has been attributed, or may be attributed, to these businesses may have to be written-down if our valuation assumptions are required to be reassessed as a result of any deterioration in their underlying profitability, asset quality and other relevant matters. Impairment testing in respect of goodwill is performed annually, more frequently if there are impairment indicators present, and comprises a comparison of the carrying amount of the cash-generating unit with its recoverable amount. Goodwill impairment does not, however, affect our regulatory capital. While no material impairment of goodwill was recognized in 2013 or 2014, there can be no assurances that we will not have to write down the value attributed to goodwill in the future, which would adversely affect our results and net assets.
2.6.8 We rely on recruiting, retaining and developing appropriate senior management and skilled personnel.
Our continued success depends in part on the continued service of key members of our management team. The ability to continue to attract, train, motivate and retain highly qualified professionals is a key element of our strategy. The successful implementation of our growth strategy depends on the availability of skilled management, both at our head office and at each of our business units. If we or one of our business units or other functions fails to staff its operations appropriately or loses one or more of its key senior executives and fails to replace them in a satisfactory and timely manner, our business, financial condition and results of operations, including control and operational risks, may be adversely affected.
In addition, the financial industry has and may continue to experience more stringent regulation of employee compensation, which could have an adverse effect on our ability to hire or retain the most qualified employees. If we fail or are unable to attract and appropriately train, motivate and retain qualified professionals, our business may also be adversely affected.
30
Table of Contents
2.6.9 We rely on third parties for important products and services.
Third party vendors provide key components of our business infrastructure such as loan and deposit servicing systems, internet connections and network access. Third parties can be sources of operational risk to us, including with respect to security breaches affecting such parties. We may be required to take steps to protect the integrity of our operational systems, thereby increasing our operational costs and potentially decreasing customer satisfaction. In addition, any problems caused by these third parties, including as a result of their not providing us their services for any reason, their performing their services poorly, or employee misconduct, could adversely affect our ability to deliver products and services to customers and otherwise to conduct business. Replacing these third party vendors could also entail significant delays and expense.
2.6.10 Damage to our reputation could cause harm to our business prospects.
Maintaining a positive reputation is critical to our attracting and maintaining customers, investors and employees. Damage to our reputation can therefore cause significant harm to its business and prospects. Harm to our reputation can arise from numerous sources, including, among others, employee misconduct, litigation or regulatory outcomes, failure to deliver minimum standards of service and quality, compliance failures, unethical behavior, and the activities of customers and counterparties. Further, negative publicity regarding us, whether or not true, may result in harm to our prospects.
Actions by the financial services industry generally or by certain members of, or individuals in, the industry can also affect our reputation. For example, the role played by financial services firms in the financial crisis and the seeming shift toward increasing regulatory supervision and enforcement has caused public perception of us and others in the financial services industry to decline.
We could suffer significant reputational harm if we fail to properly identify and manage potential conflicts of interest. Management of potential conflicts of interest has become increasingly complex as we expand our business activities through more numerous transactions, obligations and interests with and among our clients. The failure to adequately address, or the perceived failure to adequately address, conflicts of interest could affect the willingness of clients to deal with us, or give rise to litigation or enforcement actions against us. Therefore, there can be no assurance that conflicts of interest will not arise in the future that could cause material harm to us.
2.6.11 We engage in transactions with our subsidiaries or affiliates that others may not consider to be on an arm’s-length basis.
We and our affiliates have entered into a number of services agreements pursuant to which we render services, such as administrative, accounting, finance, treasury, legal services and others.
Spanish law provides for several procedures designed to ensure that the transactions entered into with or among our financial subsidiaries and/or affiliates do not deviate from prevailing market conditions for those types of transactions.
We are likely to continue to engage in transactions with our affiliates. Future conflicts of interests between us and any of affiliates, or among our affiliates, may arise, which conflicts are not required to be and may not be resolved in our favor.
2.7 Technology Risks
2.7.1 Any failure to effectively improve or upgrade our information technology infrastructure and management information systems in a timely manner could have a material adverse effect on us.
Our ability to remain competitive depends in part on our ability to upgrade our information technology on a timely and cost-effective basis. We must continually make significant investments and improvements in our information technology infrastructure in order to remain competitive. We cannot assure you that in the future we will be able to maintain the level of capital expenditures necessary to support the improvement or upgrading of our information technology infrastructure. Any failure to effectively improve or upgrade our information technology infrastructure and management information systems in a timely manner could have a material adverse effect on us.
2.7.2 Risks relating to data collection, processing and storage systems are inherent in our business.
Our businesses depend on the ability to process a large number of transactions efficiently and accurately, and on our ability to rely on our digital technologies, computer and email services, software and networks, as well as on the secure processing, storage and transmission of confidential and other information in our computer systems and networks. The proper functioning of financial control, accounting or other data collection and processing systems is critical to our businesses and to
31
Table of Contents
our ability to compete effectively. Losses can result from inadequate personnel, inadequate or failed internal control processes and systems, or from external events that interrupt normal business operations. We also face the risk that the design of our controls and procedures prove to be inadequate or are circumvented. Although we work with our clients, vendors, service providers, counterparties and other third parties to develop secure transmission capabilities and prevent against cyber-attacks, we routinely exchange personal, confidential and proprietary information by electronic means, and we may be the target of attempted cyber-attacks. If we cannot maintain an effective data collection, management and processing system, we may be materially and adversely affected.
We take protective measures and continuously monitor and develop our systems to protect our technology infrastructure and data from misappropriation or corruption, but our systems, software and networks nevertheless may be vulnerable to unauthorized access, misuse, computer viruses or other malicious code and other events that could have a security impact. An interception, misuse or mishandling of personal, confidential or proprietary information sent to or received from a client, vendor, service provider, counterparty or third party could result in legal liability, regulatory action and reputational harm. There can be no assurance that we will not suffer material losses from operational risk in the future, including those relating to cyber-attacks or other such security breaches. Further, as cyber-attacks continue to evolve, we may incur significant costs in our attempt to modify or enhance our protective measures or investigate or remediate any vulnerabilities. Any material disruption or slowdown of our systems could cause information, including data related to customer requests, to be lost or to be delivered to our clients with delays or errors, which could reduce demand for our services and products and could materially and adversely affect us. For further information see Item 11. Quantitative and Qualitative Disclosures about Market Risk—Part 7. Operational risk—7.3 Mitigation measures—Anti-cyber-risk measures.
2.7.3 Failure to protect personal information could adversely affect us.
We manage and hold confidential personal information of customers in the conduct of our banking operations. Although we have procedures and controls to safeguard personal information in our possession, unauthorized disclosures could subject us to legal actions and administrative sanctions as well as damages that could materially and adversely affect our operating results, financial condition and prospects. In addition, we may be required to report events related to information security issues (including any cybersecurity issues), events where customer information may be compromised, unauthorized access and other security breaches, to the relevant regulatory authorities.
2.8 Financial Reporting and Control Risks
2.8.1 Changes in accounting standards could impact reported earnings.
The accounting standard setters and other regulatory bodies periodically change the financial accounting and reporting standards that govern the preparation of our consolidated financial statements. These changes can materially impact how we record and report our financial condition and results of operations. In some cases, we could be required to apply a new or revised standard retroactively, resulting in the restatement of prior period financial statements.
2.8.2 Our financial statements are based in part on assumptions and estimates which, if inaccurate, could cause material misstatement of the results of our operations and financial position.
The preparation of financial statements requires management to make judgments, estimates and assumptions that affect the reported amounts of assets, liabilities, income and expenses. Due to the inherent uncertainty in making estimates, actual results reported in future periods may be based upon amounts which differ from those estimates. Estimates, judgments and assumptions are continually evaluated and are based on historical experience and other factors, including expectations of future events that are believed to be reasonable under the circumstances. Revisions to accounting estimates are recognized in the period in which the estimate is revised and in any future periods affected. The accounting policies deemed critical to our results and financial position, based upon materiality and significant judgments and estimates, include impairment of loans and advances, goodwill impairment, valuation of financial instruments, impairment of available-for-sale financial assets, deferred tax assets provision and pension obligation for liabilities.
If the judgment, estimates and assumptions we use in preparing our consolidated financial statements are subsequently found to be incorrect, there could be a material effect on our results of operations and a corresponding effect on our funding requirements and capital ratios.
32
Table of Contents
2.8.3 Disclosure controls and procedures over financial reporting may not prevent or detect all errors or acts of fraud.
Disclosure controls and procedures over financial reporting are designed to reasonably assure that information required to be disclosed by the company in reports filed or submitted under the Securities Exchange Act is accumulated and communicated to management, and recorded, processed, summarized and reported within the time periods specified in the SEC’s rules and forms.
These disclosure controls and procedures have inherent limitations which include the possibility that judgments in decision-making can be faulty and that breakdowns occur because of simple errors or mistakes. Additionally, controls can be circumvented by the individual acts of some persons, by collusion of two or more people or by any unauthorized override of the controls. Consequently, our businesses are exposed to risk from potential non-compliance with policies, employee misconduct or negligence and fraud, which could result in regulatory sanctions and serious reputational or financial harm. In recent years, a number of multinational financial institutions have suffered material losses due to the actions of ‘rogue traders’ or other employees. It is not always possible to deter employee misconduct and the precautions we take to prevent and detect this activity may not always be effective. Accordingly, because of the inherent limitations in the control system, misstatements due to error or fraud may occur and not be detected.
33
Table of Contents
2.9 Foreign Private Issuer and Other Risks
2.9.1 Our corporate disclosure may differ from disclosure regularly published by issuers of securities in other countries, including the United States.
Issuers of securities in Spain are required to make public disclosures that are different from, and that may be reported under presentations that are not consistent with, disclosures required in other countries, including the United States. In particular, for regulatory purposes, we currently prepare and will continue to prepare and make available to our shareholders statutory financial statements in accordance with IFRS, which differs from U.S. GAAP in a number of respects. In addition, as a foreign private issuer, we are not subject to the same disclosure requirements in the United States as a domestic U.S. registrant under the Exchange Act, including the requirements to prepare and issue quarterly reports, or the proxy rules applicable to domestic U.S. registrants under Section 14 of the Exchange Act or the insider reporting and short-swing profit rules under Section 16 of the Exchange Act. Accordingly, the information about us available to you will not be the same as the information available to shareholders of a U.S. company and may be reported in a manner that you are not familiar with.
2.9.2 Investors may find it difficult to enforce civil liabilities against us or our directors and officers.
The majority of our directors and officers reside outside of the United States. In addition, all or a substantial portion of our assets and their assets are located outside of the United States. Although we have appointed an agent for service of process in any action against us in the United States with respect to our ADSs, none of our directors or officers has consented to service of process in the United States or to the jurisdiction of any United States court. As a result, it may be difficult for investors to effect service of process within the United States on such persons.
Additionally, investors may experience difficulty in Spain enforcing foreign judgments obtained against us and our executive officers and directors, including in any action based on civil liabilities under the U.S. federal securities laws. Based on the opinion of Spanish counsel, there is doubt as to the enforceability against such persons in Spain, whether in original actions or in actions to enforce judgments of U.S. courts, of liabilities based solely on the U.S. federal securities laws.
2.9.3 As a holder of ADSs you will have different shareholders’ rights than in the United States and certain other jurisdictions.
Our corporate affairs are governed by our Bylaws and Spanish corporate law, which may differ from the legal principles that would apply if we were incorporated in a jurisdiction in the United States or in certain other jurisdictions outside Spain. Under Spanish corporate law, you may have fewer and less well-defined rights to protect your interests than under the laws of other jurisdictions outside Spain.
Although Spanish corporate law imposes restrictions on insider trading and price manipulation, the form of these regulations and the manner of their enforcement may differ from that in the U.S. securities markets or markets in certain other jurisdictions. In addition, in Spain, self-dealing and the preservation of shareholder interests may be regulated differently, which could potentially disadvantage you as a holder of the shares underlying ADSs.
2.9.4 ADS holders may be subject to additional risks related to holding ADSs rather than shares.
Because ADS holders do not hold their shares directly, they are subject to the following additional risks, among others:
| • | as an ADS holder, we may not treat you as one of our direct shareholders and you may not be able to exercise shareholder rights; |
| • | we and the depositary may amend or terminate the deposit agreement without the ADS holders’ consent in a manner that could prejudice ADS holders or that could affect the ability of ADS holders to transfer ADSs; and |
| • | the depositary may take or be required to take actions under the Deposit Agreement that may have adverse consequences for some ADS holders in their particular circumstances. |
34
Table of Contents
Item 4. Information on the Company
A. History and development of the company
Introduction
Banco Santander, S.A. (“Santander”, the “Bank”, the “Parent” or the “Parent bank”) is the Parent bank of Grupo Santander. It was established on March 21, 1857 and incorporated in its present form by a public deed executed in Santander, Spain, on January 14, 1875.
On January 15, 1999, the boards of directors of Banco Santander, S.A. and Banco Central Hispanoamericano, S.A. agreed to merge Banco Central Hispanoamericano, S.A. into Banco Santander, S.A., and to change Banco Santander’s name to Banco Santander Central Hispano, S.A. The shareholders of Banco Santander, S.A. and Banco Central Hispanoamericano, S.A. approved the merger on March 6, 1999, at their respective general meetings. The merger and the name change were registered with the Mercantile Registry of Santander, Spain, by the filing of a merger deed. Effective April 17, 1999, Banco Central Hispanoamericano, S.A. shares were extinguished by operation of law and Banco Central Hispanoamericano, S.A. shareholders received new Banco Santander shares at a ratio of three shares of Banco Santander, S.A. for every five shares of Banco Central Hispanoamericano, S.A. formerly held. On the same day, Banco Santander, S.A. changed its legal name to Banco Santander Central Hispano, S.A.
The general shareholders’ meeting held on June 23, 2007 approved the proposal to change the name of the Bank to Banco Santander, S.A.
The general shareholders’ meeting held on March 22, 2013 approved the merger by absorption of Banco Español de Crédito, S.A. (Banesto) and Banco Banif, S.A.
We are incorporated under, and governed by the laws of the Kingdom of Spain. We conduct business under the commercial name “Santander”. Our corporate offices are located in Ciudad Grupo Santander, Avda. de Cantabria s/n, 28660 Boadilla del Monte (Madrid), Spain. Telephone: (011) 34-91-259-6520.
Principal Capital Expenditures and Divestitures
Acquisitions, Dispositions, Reorganizations
Our principal acquisitions and dispositions in 2014, 2013 and 2012 were as follows:
Sale of Altamira Asset Management
On November 21, 2013, we announced that we had reached a preliminary agreement with Apollo European Principal Finance Fund II, a fund managed by subsidiaries of Apollo Global Management, LLC, for the sale of the platform for managing the recovery of Banco Santander, S.A.’s loans in Spain and for managing and marketing the properties obtained through this activity (“Altamira Asset Management, S.L.”).
On January 3, 2014, we announced that we had sold 85% of the share capital of Altamira Asset Management, S.L. to Altamira Asset Management Holdings, S.L., an investee of Apollo European Principal Finance Fund II, for €664 million, giving rise to a net gain of €385 million, which was recognized in our consolidated income statement for 2014.
Following this transaction, we retained the aforementioned property assets and loan portfolio on our balance sheet, while management of these assets is carried out from the platform owned by Apollo.
Santander Consumer USA
In January 2014, the public offering of shares of Santander Consumer USA Inc. (“SCUSA”) was completed and the company was admitted to trading on the New York Stock Exchange. The offering represented 21.6% of SCUSA’s share capital, of which 4.23% related to the ownership interest sold by the Group. Following this sale, we held 60.74% of the share capital of SCUSA (December 31, 2014: 60.46%). Both Sponsor Auto Finance Holdings Series LP (“Sponsor Holdings”)—an investee of funds controlled by Warburg Pincus LLC, Kohlberg Kravis Roberts & Co. L.P. and Centerbridge Partners L.P.—and DDFS LLC (“DDFS”)—a company controlled by Thomas G. Dundon, who holds the position of Chief Executive Officer of SCUSA—also reduced their ownership interest in SCUSA.
35
Table of Contents
Since the ownership interests of the aforementioned shareholders were reduced below specified percentages following the offering, the shareholders’ agreement previously entered into by the shareholders was terminated in accordance with its terms; this entailed the termination of the agreement which, inter alia, had granted Sponsor Holdings and DDFS representation on the board of directors of SCUSA and had established a voting system under which the strategic, financial and operating decisions, and other significant decisions associated with the ordinary management of SCUSA, were subject to joint approval by the Group and the aforementioned shareholders. Therefore, SCUSA ceased to be controlled jointly by all the above and is now controlled by the Group on the basis of the percentage held in its share capital (“change of control”).
Prior to this change of control the Group accounted for its ownership interest in SCUSA using the equity method. Following the change of control, the Group fully consolidated its ownership interest in SCUSA and, on the date it obtained control, included all of SCUSA’s assets and liabilities in its consolidated balance sheet at their fair value.
As a result of the aforementioned transaction, we recognized a net gain of €730 million in the consolidated income statement for 2014.
Agreement with El Corte Inglés
On October 7, 2013, we announced that we had entered into a strategic agreement through our subsidiary Santander Consumer Finance, S.A. with El Corte Inglés, S.A. in the area of consumer finance, which included the acquisition of 51% of the share capital of Financiera El Corte Inglés E.F.C., S.A., with El Corte Inglés, S.A. retaining the remaining 49%. On February 27, 2014, following the receipt of the relevant regulatory and competition authorizations, the acquisition was completed. Santander Consumer Finance, S.A. paid €140 million for 51% of the share capital of Financiera El Corte Inglés E.F.C., S.A.
GetNet Tecnologia Em Captura e Processamento de Transações H.U.A.H. S.A.
On April 7, 2014, Banco Santander (Brasil) S.A. announced that it had reached an agreement to purchase through an investee all the shares of GetNet Tecnologia Em Captura e Processamento de Transações H.U.A.H. S.A. (“GetNet”). The transaction was completed on July 31, 2014 for a purchase price of BRL1,156 million (approximately €383 million), giving rise to goodwill of €229 million.
Acquisition of non-controlling interests in Banco Santander (Brasil) S.A.
On April 28, 2014, the Bank’s board of directors approved a bid for the acquisition of all the shares of Banco Santander (Brasil) S.A. not then owned by the Group, which represented approximately 25% of the share capital of Banco Santander (Brasil) S.A., offering in consideration Bank shares in the form of Brazilian Depositary Receipts (BDRs) or American Depositary Receipts (ADRs). As part of the bid, the Bank requested that its shares be listed on the São Paulo Stock Exchange in the form of BDRs.
The offer was voluntary, in that the non-controlling shareholders of Banco Santander (Brasil) S.A. were not obliged to participate, and it was not conditional upon a minimum acceptance level. The consideration offered, following the adjustment made as a result of the application of the Santander Dividendo Elección scrip dividend scheme in October 2014, consisted of 0.7152 new Banco Santander shares for each unit or ADR of Banco Santander (Brasil) S.A. and 0.3576 new Banco Santander shares for each ordinary or preference share of Banco Santander (Brasil) S.A.
The bid was accepted by holders of 13.65% of the share capital of Banco Santander (Brasil) S.A. Accordingly, the Group’s ownership interest in Banco Santander (Brasil) S.A. rose to 88.30% of its share capital. To cater for the exchange, the Bank, executing the agreement adopted by the extraordinary general shareholders’ meeting held on September 15, 2014, issued 370,937,066 shares, representing approximately 3.09% of the Bank’s share capital at the issue date. The aforementioned transaction gave rise to an increase of €185 million in Share capital, €2,372 million in Share premium and €15 million in Reserves, and a reduction of €2,572 million in Non-controlling interests.
The shares of Banco Santander (Brasil) S.A. continue to be listed on the São Paulo and New York stock exchanges.
36
Table of Contents
Custody business
On June 19, 2014, we announced that we had reached a definitive agreement with FINESP Holdings II B.V., a subsidiary of Warburg Pincus, to sell a 50% stake in Santander’s current custody business in Spain, Mexico and Brazil, retaining the remaining 50%. The transaction values the business at €975 million at the date of the announcement. The sale is subject to receipt of the relevant regulatory authorizations which, in accordance with the agreement, should be obtained in the first half of 2015.
Agreement with GE Capital
On June 23, 2014, we announced that Santander Consumer Finance, S.A., Banco Santander’s consumer finance unit had reached an agreement with GE Money Nordic Holding AB to acquire GE Capital’s business in Sweden, Denmark and Norway for approximately €693 million at the date of the announcement. The acquisition was completed on November 6, 2014, following the receipt of the relevant authorizations.
Agreement with Banque PSA Finance
We, through our subsidiary Santander Consumer Finance, S.A., and Banque PSA Finance, the vehicle financing unit of the PSA Peugeot Citroën Group, entered into an agreement in July 2014 for the joint operation of the vehicle financing business in eleven European countries. Pursuant to the terms of the agreement, we will finance this business under certain circumstances and conditions from the date on which the transaction is completed, which is expected to occur in 2015 or at the beginning of 2016. In addition, in certain countries, we will purchase the current lending portfolio of Banque PSA Finance. We also entered into a cooperation agreement relating to the insurance business in all these countries through the set up of two insurance companies in Malta. We have obtained authorization from the competition authorities but the transaction remains subject to approval by the other relevant regulatory bodies.
In January 2015, the relevant regulatory authorizations were obtained for the commencement of activities in France and the United Kingdom.
Agreement with CNP
On July 10, 2014, we announced that we had reached an agreement with the French insurance company CNP to acquire a 51% stake in three insurance companies based in Ireland (Santander Insurance Life Limited, Santander Insurance Europe Limited and Santander Insurance Services Ireland Limited) that distribute life and non-life products through the Santander Consumer Finance network.
In December 2014, after the regulatory authorizations were obtained, CNP paid €297 million to acquire 51% , or a controlling interest in, the three aforementioned insurance companies. The agreement includes deferred payments to CNP in 2017 and 2020 and deferred amounts receivable by the Group in 2017, 2020 and 2023, based on the business plan.
The agreement included the execution of a 20-year retail agreement, renewable for five-year periods, for the sale of life and non-life insurance products through the Santander Consumer Finance network, for which we will receive commissions at market rates.
This transaction gave rise to the recognition of a gain of €413 million under Gains/(losses) on disposal of assets not classified as non-current assets held for sale, of which €207 million related to the fair value recognition of the 49% ownership interest retained by us.
Agreement to acquire Carfinco
On September 16, 2014, we announced that we had reached an agreement to acquire the listed Canadian company Carfinco Financial Group Inc. (“Carfinco”) for an amount of 298 million Canadian dollars (approximately €210 million). Santander will pay 11.25 Canadian dollars per share, which represents a premium of 32% on the share price during the 90 trading sessions prior to September 16, 2014. The board of directors of Carfinco approved the transaction and recommended to its shareholders that they vote in favor of it at the general meeting called for such purpose, and the transaction was completed on March 6, 2015.
The impact of the transaction on the Group’s shareholders’ equity is not material.
37
Table of Contents
Metrovacesa, S.A.
On December 19, 2012, the creditor entities that participated in a debt restructuring agreement for the Sanahuja Group under which they received shares of Metrovacesa, S.A. as payment for that group’s debt, announced that they reached an agreement to promote the delisting of the shares of Metrovacesa, S.A. and they voted in favor of this at the general meeting held for this purpose on January 29, 2013. Following the approval of the delisting and the public takeover offer at the Metrovacesa, S.A. general meeting, the entities made a delisting public takeover offer of €2.28 per share to the Metrovacesa, S.A. shareholders that had not entered into the agreement. The Group participated in the delisting public takeover offer by acquiring an additional 1.953% of Metrovacesa, S.A. for €44 million.
Following this transaction, at December 31, 2013, the Group held an ownership interest of 36.82% in the share capital of Metrovacesa, S.A.
On December 23, 2014, the Group acquired 19.07% of Metrovacesa, S.A. from Bankia, S.A. for €98.9 million, as a result of which its stake increased to 55.89%, thus obtaining control over this company. After this transaction, Metrovacesa, S.A. is fully consolidated with the Group (until then it was accounted for by the equity method).
For further information see note 3.b. xvi. Metrovacesa, S.A. to our consolidated financial statements.
Invitation to tender American Securities for purchase
On March 6, 2013, we announced an invitation to all holders of callable subordinated notes series 22 issued by Santander Issuances, S.A. Unipersonal (the American Securities) to tender such Securities for purchase (the American Invitation). The American Securities are listed in the London Stock Exchange. The total principal amount of the American Securities comprising the American Invitation amounts to approximately US$ 257.5 million.
Banco Santander announced the final aggregate principal amount accepted for purchase on March 14, 2013 (US$ 26.6 million) and the final purchase prices as a consequence of the tender offers.
The invitation was undertaken as a part of the Group’s active management of liabilities and capital, and focused on core capital generation as well as the optimization of the future interest expense.
Invitation to tender European Securities for purchase
On March 6, 2013, we announced an invitation to all holders of certain securities issued by Santander Issuances, S.A. Unipersonal and Santander Perpetual, S.A. Unipersonal (the European Securities) to tender such securities for purchase (the European Invitation). The European Securities are subordinated and perpetual bonds listed in the Luxembourg Stock Exchange, corresponding to 15 different series. The total principal amount of the series comprising the Invitation amounts to approximately €6,575 million and GBP 2,243 million.
Banco Santander announced the final aggregate principal amount accepted for purchase on March 14, 2013 (€140.2 million and GBP 178.9 million) and the final purchase prices as a consequence of the European Invitation.
The European Invitation was undertaken as a part of the Group’s active management of liabilities and capital, and focused on core capital generation as well as the optimization of future interest expense. The invitation was also designed to provide liquidity in the market and to offer the holders of the European Securities the possibility to exit their investment in the European Securities.
Santander sells 5.2% of its Polish unit as KBC places its 16.2% in the market
On March 18, 2013, KBC Bank NV (“KBC”) and Banco Santander announced a secondary offering of up to 19,978,913 shares in Bank Zachodni WBK S.A. (“BZ WBK”) by way of a fully-marketed follow-on offering (the “WBK Offering”). Through the WBK Offering, KBC would sell 15,125,964 shares (constituting 16.17% of BZ WBK shares outstanding at that date) and Santander was expected to sell not less than 195,216 but up to 4,852,949 shares (constituting between 0.21% and 5.19% of BZ WBK shares outstanding at that date).
38
Table of Contents
KBC and Banco Santander, as selling shareholders, granted the underwriters a reverse greenshoe option in relation to up to 10% of the final Offering size which was not used. KBC and Santander each committed to be locked up for a period of 90 days, and BZ WBK for a period of 180 days, following the closing of the WBK Offering.
The WBK Offering was made to eligible institutional investors and within an indicative price range of PLN240 to PLN270. The final sale price was determined through a book-building process that began on March 18, 2013, and ended on March 21, 2013.
On March 22, 2013, Banco Santander, S.A. and KBC completed the placement of all the shares owned by KBC and 5.2% of the share capital of Bank Zachodni WBK S.A. held by the Group in the market for €285 million, which gave rise to an increase of €292 million in Non-controlling interests.
Following these transactions, we hold 70% of the share capital of Bank Zachodni WBK S.A. and the remaining 30% is held by non-controlling interests.
Agreement with Warburg Pincus and General Atlantic
On May 30, 2013, we announced that we had entered into an agreement with subsidiaries of Warburg Pincus and General Atlantic to foster the global development of our asset management unit, Santander Asset Management (SAM). Pursuant to the terms and conditions of the agreement, Warburg Pincus and General Atlantic together own 50% of the holding company which comprises the eleven management companies we have, mainly in Europe and Latin America, while the other 50% are held by us.
The purpose of the alliance is to enable SAM to improve its ability to compete with the large independent international asset management companies, since the businesses to be strengthened include asset management in the global institutional market, with the additional advantage of having knowledge and experience in the markets in which we are present. The agreement also contemplates the distribution of products managed by SAM in the countries in which we have a commercial network for a period of ten years, renewable for five additional two-year periods, for which we will receive commissions at market rates, thus benefiting from broadening the range of products and services we offer our customers. SAM also distributes its products and services internationally, outside our commercial network.
Since the aforementioned asset management companies belonged to different Group companies, a corporate restructuring took place prior to the completion of the transaction whereby each of the asset management companies was sold by its shareholders for its fair value to SAM Investment Holdings Limited (SAM), a holding company created by us. The aggregate value of the asset management companies was approximately €1.7 billion.
Subsequently, in December 2013, once the required authorizations were obtained from various regulators, the agreement was executed through the acquisition of a 50% ownership interest in SAM’s share capital by Sherbrooke Acquisition Corp SPC (an investee of Warburg Pincus and General Atlantic) for €449 million. At that date, SAM had financing from third parties for €845 million. The agreement includes deferred contingent amounts payable and receivable for the Group based on the achievement of the business plan targets over the coming five years.
Also, we entered into a shareholders’ agreement with Sherbrooke Acquisition Corp SPC shareholders regulating, inter alia, the taking of strategic, financial, operational and other significant decisions regarding the ordinary management of SAM on a joint basis. Certain restrictions on the transferability of the shares were also agreed, and a commitment was made by the two parties to retain the restrictions for at least 18 months. Lastly, Sherbrooke Acquisition Corp SPC will be entitled to sell to the Group its ownership interest in the share capital of SAM at market value on the fifth and seventh anniversaries of the transaction, unless a public offering of SAM shares has taken place prior to those dates.
Following these transactions, at year-end we held a 50% ownership interest in SAM and controlled this company jointly with the aforementioned shareholders.
As a result of the aforementioned transaction, we recognized a gain of €1,372 million in the consolidated income statement for 2013, of which €671 million related to the fair value of the 50% ownership interest retained by us.
Banco Santander (Brasil) optimized its equity structure
On September 29, 2013, we announced that our subsidiary Banco Santander (Brasil) S.A. will optimize its equity structure by replacing BRL 6 billion of common equity (Core Tier I) (amount which will be distributed pro rata among its shareholders) with newly-issued instruments of an equivalent amount qualifying as Additional Tier I and Tier II capital, and which will be offered to Banco Santander (Brasil) S.A.’s shareholders.
39
Table of Contents
In January 2014 we subscribed a percentage of the newly issued instruments in proportion to our shareholding in Banco Santander (Brasil) S.A. (approximately 75%), as well as those not subscribed by the other shareholders of Banco Santander (Brasil) S.A.
The new structure improves Banco Santander (Brasil) S.A.’s regulatory capital composition, by increasing the return on equity (ROE) while maintaining the total amount of regulatory capital and capital ratios (BIS II ratio of approximately 21.5% and fully loaded BIS III ratio of approximately 18.9%) above the other retail banks in Brazil.
Cooperation agreement and purchase of 7.2% stake in Bank of Shanghai
On May 12, 2014, after obtaining approval from the China Banking Regulatory Commission to the cooperation agreement reached with Bank of Shanghai (“BoS”) to buy an equity stake in BoS announced on December 10, 2013, we acquired a 7.2% equity stake in BoS from HSBC Ltd -such equity stake represented 8% of the share capital of BoS on the date when the agreement was announced, but after a private placement of shares carried out by BoS completed in February 2014, it represents 7.2%-.
This transaction has made Santander the second-largest shareholder in BoS and its strategic international partner. The cost of the investment, including the purchase of HSBC Ltd.’s stake and the cooperation agreement with Bank of Shanghai, was estimated at approximately €470 million. The transaction has had an impact of approximately 1 basis point on the Santander Group’s capital.
Under the terms of the agreement, Santander is providing BoS with a permanent team of professionals, who are contributing Santander’s knowledge and experience in risk management, commercial, wholesale and retail banking, and are working together with BOS together to find joint business opportunities.
Transfer of interest in Banco Santander (Brasil), S.A.
In January and March 2012 the Group transferred shares representing 4.41% and 0.77%, respectively, of the capital stock of Banco Santander (Brasil), S.A. to two leading international financial institutions. These institutions undertook to deliver these shares to the holders of bonds issued by Banco Santander in October 2010 which were exchangeable for Banco Santander (Brasil), S.A. shares upon maturity, in accordance with their terms.
Merger of Bank Zachodni WBK S.A. and Kredyt Bank S.A.
On February 28, 2012, the Group announced that Banco Santander, S.A. and KBC Bank NV (KBC) had entered into an investment agreement to merge their two subsidiaries in Poland, Bank Zachodni WBK S.A. and Kredyt Bank S.A., respectively, following which the Group would control approximately 76.5% of the entity resulting from the merger and KBC 16.4%, with the remaining 7.1% being owned by non-controlling interests. Also, the Group undertook to place a portion of its ownership interest among investors and to acquire up to 5% of the entity resulting from the merger in order to help KBC to reduce its holding in the merged entity to below 10%. KBC’s objective is to dispose of its entire investment in order to maximize its value.
The transaction was carried out through a capital increase at Bank Zachodni WBK S.A., whose new shares would be offered to KBC and the other shareholders of Kredyt Bank S.A. in exchange for their shares in Kredyt Bank S.A. The related exchange ratio was established at 6.96 shares of Bank Zachodni S.A. for every 100 shares of Kredyt Bank S.A.
In early 2013, following the approval from the Polish financial regulator (KNF), the aforementioned transaction was consummated. As a result, the Group controlled approximately 75.2% of the post-merger entity and KBC controlled approximately 16.2%, with the remaining 8.6% being owned by non-controlling holders. This transaction gave rise to an increase of €1,037 million in non-controlling interests—€169 million as a result of the acquisition of control of Kredyt Bank S.A. and €868 million as a result of the reduction in the percentage of ownership of Bank Zachodni WBK S.A.
On March 22 2013, Banco Santander, S.A. and KBC completed the placement of all the shares owned by KBC and 5.2% of the share capital of Bank Zachodni WBK S.A. held by the Group in the market for €285 million, which gave rise to an increase of €292 million in non-controlling interests.
40
Table of Contents
Following these transactions, the Group held 70% of the share capital of Bank Zachodni WBK S.A. and the remaining 30% was held by non-controlling holders.
Valores Santander
On March 30, 2012, we informed that the Ordinary General Shareholders’ Meeting held that day had resolved to grant the holders of Valores Santander an option to convert their securities on four occasions before October 4, 2012, the mandatory conversion date for the outstanding Valores Santander. As a result on June 7, 2012, July 5, 2012, August 7, 2012 and September 6, 2012 we issued 73,927,779, 193,095,393, 37,833,193 and 14,333,873 new shares related to the conversion requests of 195,923, 511,769, 98,092 and 37,160 Valores Santander, respectively.
In October 2007, a total of 1,400,000 Valores Santander were issued. On October 2008, 2009, 2010 and 2011, and on June, July, August and September 2012 a total to 880,700 Valores Santander were voluntarily converted. On October 4, 2012, the mandatory conversion of the remaining 519,300 Valores Santander took place, representing 37.1% of the original issuance.
Invitation to tender certain securitization bonds for cash
On April 16, 2012, we announced an invitation to all holders of certain securities (the Securities) to tender such Securities for purchase by Banco Santander for cash (the Invitation). The Securities are fixed rate securities (securitization bonds) listed on the AIAF Fixed Rate Market which correspond to 33 different series issued by specific securitization funds managed by Santander de Titulización, S.G.F.T., S.A. series with an aggregate outstanding principal amount of €6 billion.
The rationale for the Invitation was to effectively manage the Group’s outstanding liabilities and to strengthen our balance sheet. The Invitation was also designed to provide liquidity to Security holders.
On April 25, 2012 we announced the aggregate outstanding principal amount of each of the Securities accepted for purchase, which for senior securities amounted to €388,537,762.18 and for mezzanine securities €61,703,163.58.
Sale of our Colombian unit to the Chilean group Corpbanca
In December 2011, we entered into an agreement with the Chilean group Corpbanca to sell our shareholding in Banco Santander Colombia S.A. and our other business subsidiaries in this country (Santander Investment Valores Colombia S.A., Comisionista de Bolsa Comercial, Santander Investment Colombia S.A., Santander Investment Trust Colombia S.A., Sociedad Fiduciaria y Agencia de Seguros Santander, Ltda.).
Following receipt of the regulatory authorizations from the competent authorities and the delisting of the shares of Banco Santander Colombia S.A., in the second quarter of 2012 we sold our shareholding in Banco Santander Colombia S.A. and our other business subsidiaries in Colombia to the Corpbanca Group for a total of $1,229 million (€983 million), giving rise to a gain of €619 million, which was recognized under Gains/(losses) on disposal of assets not classified as non-current assets held for sale in our 2012 consolidated income statement.
Agreement with Abbey Life Assurance
On July 19, 2012, we reached an agreement with Abbey Life Assurance Ltd, a subsidiary of Deutsche Bank AG, under which Abbey Life Assurance Ltd reinsured 100% of the individual life risk portfolio of the insurance companies of Banco Santander in Spain and Portugal.
This reinsurance transaction enabled us to monetize our life risk insurance portfolio. This transaction gave rise to income of €435 million recognized under Other operating income—Income from insurance and reinsurance contracts issued in the consolidated income statement (€308 million net of tax).
The policies ceded to Abbey Life Assurance Ltd consist of the portfolio as of June 30, 2012. This reinsurance agreement does not involve any changes for our customers as services will continue to be provided by Santander’s insurance companies. Our branches in Spain and Portugal will continue to offer products designed by our insurance companies as the agreement reached with Abbey Life Assurance Ltd does not involve any commitment on future distribution and is limited to the portfolio existing at June 30, 2012.
41
Table of Contents
Placement of shares of Grupo Financiero Santander, S.A.B. de C.V. on the secondary market
On August 16, 2012, we announced our intention to register with both the Mexican Comisión Nacional de Banca y Valores (National Commission of Banking and Securities) and the U.S. Securities & Exchange Commission the registration statements for the placement of shares of Grupo Financiero Santander, S.A.B. de C.V. on the secondary market. The selling institutions would be Banco Santander, S.A. and its subsidiary Santusa Holding, S.L.
On September 26, 2012, we announced that the price of the offering of shares of Grupo Financiero Santander Mexico was set at 31.25 Mexican pesos ($2.437) per share, valuing Santander Mexico at €12,730 million ($16,538 million), making it the 82nd largest bank in the world by market capitalization at that time.
The total volume of the offering represented 24.9% of the share capital of Santander Mexico after the exercise of the green shoe option. The value of the transaction was €3,178 million, making it the largest equity offering in Latin America in 2012 and one of the largest in the world.
The gains obtained by Banco Santander in this transaction were fully allocated to reserves, in line with accounting requirements, as Banco Santander will continue to maintain control over its Mexican subsidiary.
Of the total shares sold, 81% were placed in the United States and elsewhere outside Mexico and 19% in Mexico. The American Depositary Shares of Santander Mexico commenced trading on the New York Stock Exchange on September 26, 2012. The shares of Santander Mexico continue to trade on the Mexican Stock Exchange.
The IPO of our unit in Mexico was an important step in our strategy of having market listings for all of our significant subsidiaries.
Invitation to tender offer
On August 22, 2012, the Bank and Santander Financial Exchanges Limited invited the holders of 21 series of subordinated debt and preferred securities to sell those securities. The aggregate principal amount of the securities traded in euros and sterling amounted to €7,201 million and £3,373 million, respectively.
The rationale for the invitation was to effectively manage the Group’s outstanding liabilities and to strengthen our balance sheet. The invitation was also designed to provide liquidity to security holders.
On August 31, 2012, we and Santander Financial Exchanges Limited announced that the holders had agreed to sell an aggregate principal amount of €755 million for the securities traded in euros and £311 million for the securities traded in sterling.
Termination of the agreement to purchase Royal Bank of Scotland branch offices
On October 15, 2012, we announced that the agreement for the sale by The Royal Bank of Scotland (“RBS”) to Santander UK of approximately 300 branches of RBS in England and Wales and NatWest in Scotland (the “Business”) would not be completed due to the foreseeable failure to meet the conditions precedent by the agreed final deadline of February 2013.
42
Table of Contents
Santander and Elavon agreement
On October 19, 2012, we announced that we had reached an agreement with Elavon Financial Services Limited (“Elavon”) to jointly operate a payment services business for credit and debit cards through merchants’ point of sale terminals in Spain.
The transaction involves the incorporation of a joint venture company whose share capital will be held 51% by Elavon and 49% by the Bank, and to which Santander Group will transfer its aforementioned payment services business in Spain (excluding that of Banesto).
The transaction was completed in the first half of 2013 and generated a gain of €122 million (€85 million net of tax).
Mergers by absorption of Banesto and Banco Banif
On December 17, 2012, we announced that we had resolved to approve the plan for the merger by absorption of Banesto and Banco Banif, S.A. as part of the restructuring of the Spanish financial sector. These transactions are part of a commercial integration which brought Banesto and Banif under the Santander brand.
At their respective board of directors meetings held on January 9, 2013, the directors of the Bank and Banesto approved the common draft terms of the merger by absorption of Banesto into the Bank with the dissolution without liquidation of the former and the transfer en bloc of all its assets and liabilities to the Bank, which were acquired, by universal succession, the rights and obligations of the absorbed entity. As a result of the merger, the shareholders of Banesto, other than the Bank, received in exchange shares of the Bank.
January 1, 2013 was established as the date from which the transactions of Banesto shall be considered to have been performed for accounting purposes for the account of the Bank.
On March 22, 2013 and March 21, 2013, the general shareholders meetings of the Bank and Banesto, respectively, approved the terms of the merger.
On April 29, 2013, pursuant to the provisions of the terms of the merger and to the resolutions of the general shareholders’ meetings of both companies, the regime and procedure for the exchange of Banesto shares for shares of Banco Santander was made public. Banco Santander covered the exchange of Banesto shares with shares held as treasury stock based on the exchange ratio of 0.633 shares of Banco Santander, each with a nominal value of €0.50, for each share of Banesto, each with a nominal value of €0.79, without provision for any supplemental cash remuneration.
On May 3, 2013, the merger was registered with the Commercial Registry of Cantabria and the dissolution of Banesto was completed.
The directors of Banco Banif, S.A., at its board of directors meeting held on January 28, 2013, and the directors of Banco Santander, S.A., at its board of directors meeting held on that same day, approved the common drafts terms of the merger by absorption of Banco Banif, S.A. into Banco Santander, S.A. with the dissolution without liquidation of the former and the transfer en bloc of all its assets and liabilities to Banco Santander, S.A., which acquired, by universal succession, the rights and obligations of the absorbed entity.
January 1, 2013 was established as the date from which the transactions of Banif were considered to have been performed for accounting purposes for the account of the Bank.
On May 7, 2013, the merger was registered with the Commercial Registry of Cantabria and the dissolution of Banco Banif, S.A. was completed.
Insurance business in Spain
On December 20, 2012, we announced that we had reached an agreement with Aegon. In this regard, we created two insurance companies, one for life insurance and the other for general insurance, in which Aegon would acquire ownership interests of 51%, and management responsibility would be shared by Aegon and the Group. We would hold 49% of the share capital of the companies and we would enter into a distribution agreement for the sale of insurance products in Spain through the commercial networks for a period of 25 years. The agreement would not affect savings, health and vehicle insurance, which would continue to be owned and managed by Santander.
43
Table of Contents
In June 2013, after obtaining the relevant authorizations from the Directorate-General of Insurance and Pension Funds and from the European competition authorities, Aegon acquired a 51% ownership interest in the two insurance companies created by the Group for these purposes, one for life insurance and the other for general insurance (currently Aegon Santander Vida Seguros y Reaseguros, S.A. and Aegon Santander Generales Seguros y Reaseguros, S.A.), for which it paid €220 million, thereby gaining joint control together with the Group over the aforementioned companies. The agreement also includes payments to Aegon that are deferred over two years and amounts receivable for the Group that are deferred over five years, depending on the business plan.
The aforementioned agreement includes the execution of a distribution agreement for the sale of insurance products in Spain for 25 years through commercial networks, for which the Group will receive commissions at market rates.
This transaction gave rise to a gain of €385 million recognized under Gains (losses) on disposal of assets not classified as non-current assets held for sale (€270 million net of tax), of which €186 million related to the fair value recognition of the 49% ownership interest retained by the Group.
Capital Increases
As of December 31, 2012, our capital had increased by 1,412,136,547 shares, or 15.85% of our total capital as of December 31, 2011, to 10,321,179,750 shares as a result of the following transactions:
| • | Valores Santander: On March 30, 2012, we informed that the Ordinary General Shareholders’ Meeting held that day had resolved to grant the holders of Valores Santander an option to convert their securities on four occasions before October 4, 2012, the mandatory conversion date for the outstanding Valores Santander. As a result on June 7, 2012, July 5, 2012, August 7, 2012, September 6, 2012 and October 9, 2012 we issued 73,927,779, 193,095,393, 37,833,193, 14,333,873 and 200,311,513 new shares related to the conversion requests of 195,923, 511,769, 98,092, 37,160 and 519,300 Valores Santander, respectively. |
| • | Scrip Dividend: On January 31, 2012, May 2, 2012, July 31, 2012 and November 2, 2012, we issued 167,810,197 shares, 284,326,000 shares, 218,391,102 shares and 222,107,497 shares, giving rise to capital increases of €83,905,098.50, €142,163,000, €109,195,551 and €111,053,748.50, respectively. |
As of December 31, 2013, our capital had increased by 1,012,240,738 shares, or 9.81% of our total capital as of December 31, 2012, to 11,333,420,488 shares as a result of the following transactions:
| • | Scrip Dividend: On January 30, 2013, April 30, 2013, July 31, 2013 and October 31, 2013, we issued 217,503,395 shares, 270,917,436 shares, 282,509,392 shares and 241,310,515 shares, giving rise to capital increases of €108,751,697.50, €135,458,718, €141,254,696 and €120,655,257.50, respectively. |
As of December 31, 2014, our capital had increased by 1,250,994,171 shares, or 11.04% of our total capital as of December 31, 2013, to 12,584,414,659 shares as a result of the following transactions:
| • | Scrip Dividend: On January 30, 2014, April 29, 2014, July 30, 2014 and November 5, 2014, we issued 227,646,659 shares, 217,013,477 shares, 210,010,506 shares and 225,386,463 shares (2.01%, 1.92%, 1.85%, and 1.99% of the share capital, respectively), giving rise to capital increases of €113,823,329.50, €108,506,738.50, €105,005,253 and €112,693,231.50, respectively. |
| • | Acquisition of non-controlling interests in Banco Santander (Brasil) S.A.: On November 4, 2014 we issued 370,937,066 shares (3.27% of the share capital) giving rise to a capital increase of €185,468,533. |
Other Material Events
Asset quality review
On October 26, 2014, regarding the asset quality review (AQR) carried out by the European Central Bank and the European Banking Authority, we announced:
44
Table of Contents
| • | That such review, carried out with reference to December 2013, affected 16 portfolios in 7 countries, accounting for more than 50% of our risk assets. |
| • | That the impact of the analysis on CET1 was not material (decrease of 4 basis points). The non-performing loan ratio of the reviewed portfolios increased 0.14 percentage points post-AQR, which showed that coverage was appropriate and that risks were correctly classified. |
Furthermore, with respect to the stress test applied to all countries where we operate and which covered a three-year period (2014—2016) with two scenarios (base and adverse), the results were as follows:
| • | In the base scenario, we increase our capital ratio (CET1) as of December 31, 2016 by 1.6 percentage points to 12%. |
| • | In the adverse scenario, the CET1 ratio dropped 1.4 percentage points, to 9%. That ratio was 3.5 percentage points above the required minimum, meaning that in this scenario, we would exceed the required capital amount by close to €20 billion. |
Recent Events
Scrip dividends
At its meeting of January 12, 2015, the Bank’s executive committee resolved to apply the Santander Dividendo Elección scrip dividend scheme on the dates on which the third interim dividend is traditionally paid, whereby the shareholders were offered the option of receiving an amount equivalent to said dividend, the gross amount of which was €0.146 per share, in shares or cash.
On January 29, 2015 we announced that the holders of 83.73% of the free allotment rights chose to receive new shares. Thus, the definitive number of ordinary shares of €0.5 of face value issued in the free-of-charge capital increase is 262,578,993, corresponding to 1.90% of the share capital, and the amount of the capital increase is €131,289,496.50. The value of the remuneration corresponding to the holders of free allotment rights who requested new shares amounts to €1,686,807,451.03. The shareholders holding the remaining 16.27% of the free allotment rights have accepted the irrevocable undertaking to acquire free allotment rights assumed by Banco Santander. Consequently, Banco Santander has acquired 2,244,531,167 rights for a total gross consideration of €327,701,550.38. Banco Santander has waived the free allotment rights so acquired.
On April 10, 2015 we announced the information in connection with the flexible remuneration program Santander Dividendo Elección (scrip dividend scheme) to be applied to the final 2014 dividend. The shareholders were offered the option of receiving an amount equivalent to said dividend, the gross amount of which was €0.151 per share, in shares or cash.
Capital increase
On January 8, 2015, an extraordinary meeting of the board of directors took place to:
(i) Approve a capital increase with the exclusion of pre-emption rights for an amount of up to €7,500 million, which represents approximately 9.6% of the share capital of Banco Santander before the capital increase. The transaction was implemented through an accelerated book-building. The objective of this transaction was to accelerate our plans to grow organically allowing us to increase both customer credit and market share in our core geographies, and to take advantage of our business model. Our capital was increased for a nominal amount of €606,796,117 through the issuance of 1,213,592,234 ordinary shares of Banco Santander with a nominal value of 0.50 each. The price for the new shares was fixed at €6.18 per share. Consequently, the total amount of the capital increase was of €7,500,000,006.12 euros (€606,796,117 nominal amount and €6,893,203,889.12 share premium). The new shares were admitted to trade in the Spanish markets on January 12, 2015.
(ii) Reformulate the dividend policy of Banco Santander to take effect with the first dividend to be paid with respect to our 2015 results, in order to distribute 3 cash dividends and a scrip dividend relating to such 2015 results. Each of these dividends will have an estimated amount of 5 euro cents.
45
Table of Contents
Merger of Santander Asset Management and Pioneer Investments
On April 23, 2015, we announced that we had reached a preliminary and exclusive agreement with our partners Warburg Pincus and General Atlantic, subject to the signing of final terms, to merge Santander Asset Management and Pioneer Investments to create a leading global asset manager in Europe and Latin America. The combined company, with approximately €353 billion in assets under management at the close of 2014, will be called Pioneer Investments.
The agreement contemplates the creation of a new company into which the local asset managers of Santander Asset Management and Pioneer Investments will be incorporated. Santander will have a direct 33.3% stake in the new company, UniCredit will have a 33.3% stake, and private equity fund managers Warburg Pincus and General Atlantic will share a 33.3% stake. Pioneer Investments’ operations in the United States will not be included in the new company but will be owned by UniCredit (50%) and Warburg Pincus and General Atlantic (50%).
The transaction values Santander Asset Management at €2.6 billion and Pioneer Investments at €2.75 billion. Warburg Pincus and General Atlantic will make an additional equity investment into the company as part of the transaction. This transaction will not have any material impact on our capital. Following the signing of the preliminary agreement, the parties will work towards signing a definitive binding agreement which will be subject to the customary regulatory and corporate approvals.
At December 31, 2014, we had a market capitalization of €88.0 billion, stockholders’ equity of €80.8 billion and total assets of €1,266.3 billion. We had an additional €161.8 billion in managed and marketed customer funds at that date. As of December 31, 2014, we had 56,245 employees and 5,482 branch offices in Continental Europe, 25,599 employees and 929 branches in the United Kingdom, 85,009 employees and 5,729 branches in Latin America, 15,919 employees and 811 branches in the United States and 2,633 employees in Corporate Activities (for a full breakdown of employees by country, see “Item 6. Directors, Senior Management and Employees—D. Employees” herein).
We are a financial group operating principally in Spain, the United Kingdom, other European countries, Brazil and other Latin American countries and the United States, offering a wide range of financial products.
In Latin America, we have majority shareholdings in banks in Argentina, Brazil, Chile, Colombia, Mexico, Peru and Uruguay.
Grupo Santander maintains the general criteria used in our 2013 Form 20-F, with the following exceptions:
1) In the Group’s financial statements
| • | The Group has applied IFRIC 21, Levies, which addresses the accounting for a liability to pay a levy if that liability is within the scope of IAS 37. The adoption of IFRIC 21 gave rise to a change in the recognition of the contributions made by Santander UK to the Financial Services Compensation Scheme and of the contributions made by the Group’s Spanish financial institutions to the Deposit Guarantee Fund. Pursuant to the applicable standard, this change was applied retrospectively, giving rise to changes in the balances for 2013 (negative impacts of €195 million on attributable profit and of €65 million on the Group’s reserves) and 2012 (negative impacts of €12 million on attributable profit and of €53 million on the Group’s reserves). |
| • | Some corporate transactions recently carried out by the Group involved changes in the consolidation method. Taking control of SCUSA in 2014 led to the full consolidation of SCUSA, which was previously accounted for by the equity method. Conversely, the sale of a controlling stake in asset management companies at the end of 2013 requires us to consolidate them by the equity method instead of by full consolidation. |
2) In businesses
| • | The United States area includes Santander Bank, Santander Consumer USA, which is now consolidated through full consolidation, and Puerto Rico, which was previously included in Latin America. |
| • | The Santander Asset Management units that were sold are consolidated by the equity method in the various countries in which we operate. |
46
Table of Contents
3) Other adjustments
| • | The annual adjustment was made of the perimeter of the Global Customer Relationship Model between Retail Banking and Global Banking and Markets. This change has no impact on the geographic segments. |
| • | The Asset Management and Insurance area is now called Private Banking, Asset Management and Insurance. As compared to the figures published in 2013, the domestic private banking units of Spain, Portugal, Italy, Brazil, Mexico and Chile are included in this new business segment (with management shared with local banks), as well as Santander Private Banking in Latin America (previously included under the Retail Banking segment). |
The financial statements of each business area have been drawn up by aggregating the Group’s basic operating units. The information relates to both the accounting data of the companies in each area as well as that provided by the management information systems. In all cases, the same general principles as those used in the Group are applied.
In accordance with the criteria established by IFRS-IASB, the structure of our operating business areas has been segmented into two levels:
First (or geographic) level. The activity of our operating units is segmented by geographical areas. This coincides with our first level of management and reflects our positioning in the world’s main currency areas.
The reported segments are:
| • | Continental Europe. This covers all retail banking business, wholesale banking and private banking and asset management and insurance in this region. This segment includes the following units: Spain, Portugal, Poland, Santander Consumer Finance (which includes the consumer business in Europe, including that of Spain, Portugal and Poland) and Spain’s run-off real estate. |
| • | United Kingdom. This includes retail and wholesale banking, private banking and asset management and insurance conducted by the various units and branches of the Group in the country. |
| • | Latin America. This embraces all the Group’s financial activities conducted via its subsidiary banks and subsidiaries. It also includes the specialized units of Santander Private Banking, as an independent and globally managed unit, and the Bank’s New York branch’s business. |
| • | United States. Includes the businesses of Santander Bank, Santander Consumer USA and Puerto Rico. |
Second (or business) level. This segments the activity of our operating units by type of business. The reported segments are:
| • | Retail Banking. This area covers all customer banking businesses (except those of private banking and Corporate Banking, managed through the Global Customer Relationship Model). Also included in this business area are the results of the hedging positions taken in each country within the scope of the relevant ALCO portfolio. |
| • | Global Wholesale Banking. This business reflects the revenues from global corporate banking, investment banking and markets worldwide including all treasuries managed globally, both trading and distribution to customers (after the appropriate distribution with Retail Banking customers), as well as equities business. |
| • | Private Banking, Asset Management and Insurance. This includes the contribution to the Group for the design and management of mutual and pension funds and insurance, conducted in some cases via wholly-owned subsidiaries and in others via subsidiaries in which the Group participates through joint ventures with specialists. In both cases, the subsidiaries pay fees to the distribution networks used to place these products (basically the Group’s, though not exclusively) via agreements. This means that the result recorded in this segment is net for each of the subsidiaries included, in accordance with their participation and consolidation method, (i.e. deducting the distribution cost of sharing agreements from gross income). It also includes private banking business as defined above. |
| • | Spain’s run-off real estate. This unit includes loans to customers in Spain whose activity is mainly real estate development, equity stakes in real estate companies and foreclosed assets. |
In addition to these operating units, which cover everything by geographic area and business, we continue to maintain a separate Corporate Activities area. This area incorporates the centralized activities relating to equity stakes in financial companies, financial management of the structural exchange rate position and of the Parent bank’s structural interest rate risk, as well as management of liquidity and of stockholders’ equity through issues and securitizations. As the Group’s holding
47
Table of Contents
entity, the Corporate Activities area manages all capital and reserves and allocations of capital and liquidity. It also incorporates the goodwill’s impairment but not the costs related to the Group’s central services except for corporate and institutional expenses related to the Group’s functioning.
For purposes of our financial statements and this annual report on Form 20-F, we have calculated the results of operations of the various units of the Group listed below using these criteria. As a result, the data set forth herein may not coincide with the data published independently by each unit individually.
First level (or geographic):
Continental Europe
Continental Europe includes all activities carried out in this region: retail banking, global wholesale banking, private banking, asset management and insurance, as well as Spain’s run-off real estate. During 2014, there were four main units within this area: Spain, Portugal, Poland and Santander Consumer Finance.
Continental Europe is the largest business area of Grupo Santander by assets. At the end of 2014, it accounted for 36% of managed and marketed customer funds, 37% of total loans to customers and 27% of profit attributed to the Parent bank’s total operating areas.
The area had 5,482 branches and 56,245 employees (direct and assigned) of which 3,476 were temporary employees, at the end of 2014.
In 2014, this segment obtained attributable profit of €2,079 million, an increase of €952 million or 84% mainly due to improved net interest margin (which increased by €605 million) and to the decrease in impairment losses on financial assets (which decreased by €806 million). Return on equity (“ROE”) stood at 8.1%.
Spain
We have a solid retail presence in Spain (3,511 branches, 4,986 ATMs and 12.6 million customers), which is reinforced with global businesses in key products and segments (wholesale banking, private banking, asset management, insurance and cards).
In order to consolidate the Group’s leadership in Spain and increase profitability and efficiency, Santander merged its two large retail networks (Santander and Banesto) and its private bank (Banif) in 2013. See “—A. History and development of the company—Principal Capital Expenditures and Divestitures—Acquisitions, Dispositions, Reorganizations”.
The integration was completed in July 2014, ahead of schedule. All private banking clients were incorporated to Banif’s specialized customer attention model. We took advantage of the integration to optimize segmentation and specialization of branches, with a particular emphasis on private banking, Select and company banking, and increasing coverage in specialized portfolios to almost 100%.
At the end of 2014, we had 3,511 branches and a total of 24,979 employees (direct and assigned), all of which were hired on a full time basis.
In 2014 Spain showed sound recovery of economic growth which, combined with the improvement in financial condition (10 year risk premium of 107 basis points at year end), boosted retail banking flows of credit to both households and SMEs. However, the balance of loans to businesses and households declined once again, due to the deleveraging in some sectors and the increasing number of debt issuances by large companies. Deposits were down slightly in response to the decrease in term in an environment of low interest rates that benefited investment funds.
In 2014, profit attributable to the Parent bank in Spain was €1,121 million, a €655 million or 141% increase as compared to 2013, while the ROE was 9.9% (as compared to 3.9% in 2013). The main factors contributing to the growth were: (i) a €411 million increase in net interest income, reflecting the lower cost of deposits, (ii) a €326 million decrease in net gains on financial assets and liabilities, due to lower income from wholesale banking, (iii) a €252 million drop in operating expenses, due to synergies from the merger and optimization plans, and (iv) a €666 million decrease in impairment losses on financial assets, due to lower net entries in non-performing loan balances as credit quality improves.
In 2014, Spain’s lending decreased by 2%, managed and marketed customer funds increased by 2% with deposits decreasing by 2%, marketable debt securities diminishing by 82% and mutual and pension funds growing by 22%. The increase in mutual and pension funds of €9,629 million due to the greater demand for these products and the improved performance of the markets, with the accompanying increase in share prices, was offset in part by the decrease in marketable debt securities of €3,248 million.
48
Table of Contents
The non-performing loans (“NPL”) ratio was 7.38%, an 11 basis point decrease as compared to 2013. The coverage ratio remained at 45%.
Portugal
Our main Portuguese retail and investment banking operations are conducted by Banco Santander Totta, S.A. (“Santander Totta”).
At the end of 2014, Portugal had 594 branches and 5,410 employees (direct and assigned), of which 42 employees were temporary.
In 2014, profit attributable to the Parent bank was €189 million, a €75 million or 65% increase from 2013. The main drivers for the increase were the growth in net interest income (€32 million as a result of the lower funding costs), a €37 million increase in net gains on financial assets and liabilities (greater gains in portfolio management) which offset the €38 million drop in net fees and commissions (affected by both the lower business volume and regulatory changes), and a €69 million decrease in impairment losses on financial assets (benefiting from the decrease in net non-performing loans entries over the past 12 months).
In 2014, the strategy of the Group in Portugal remained closely focused on raising levels of profitability and market share in the various segments. At the same time, management of net interest income and non-performing loans continued to be critical strategic priorities. On the liability side, a cost reduction strategy was combined with a notable increase in liabilities, as a result of harnessing market opportunities and a flight-to-quality effect in order to grow. On the asset side, greater emphasis was placed on the business segment.
Lending continued to decline with a decrease of 5% for 2014 due to the deleveraging environment. At the end of 2014, managed and marketed customer funds increased by 3% with a 1% decrease in deposits, a 23% increase in marketable debt securities, and a 15% increase in mutual and pension funds.
The year 2014 ended with an NPL ratio of 8.89%, as compared to 8.12% at the end of 2013. The coverage ratio stood at 52% compared to 50% in December 2013. The ROE increased 232 basis points to 8.1%.
Poland
In February 2012, Banco Santander, S.A. and KBC Bank NV (KBC) reached an investment agreement for the merger of their subsidiaries in Poland, BZ WBK S.A. and Kredyt Bank S.A., which was put into effect in early 2013, after the necessary approval was received from the Polish financial supervisor (KNF). For further details see “Item 4. Information on the Company—A. History and development of the company—Principal Capital Expenditures and Divestitures—Acquisitions, Dispositions, Reorganizations— Merger of Bank Zachodni WBK S.A. and Kredyt Bank S.A.”
In the second half of 2014 the merger of BZ WBK and Kredyt Bank was completed.
Santander is the third largest bank in Poland in terms of loans and deposits (market share of 8.9% and 9.5%, respectively, including the business of Santander Consumer Finance in the country). Excluding that business, the market shares are 7.5% in loans and 8.3% in deposits. The unit in Poland had 788 branches, 115 agencies and 11,971 employees (direct and assigned), of which 1,306 employees were temporary, at the end of 2014.
In 2014, attributable profit was €358 million, €24 million or 7% higher than 2013. Income benefited from the increase in total income of €58 million and a decrease in operating expenses of €11 million. Attributable profit was affected by higher taxes (€28 million) and minority interests (€16 million).
Customer loans increased 5%, managed and marketed customer funds increased 7% with a 9% increase in deposits. The NPL ratio decreased 42 basis points to 7.42% and the coverage ratio decreased 2 percentage points to 60%. The ROE stood at 16.2% compared to 15.9% in 2013.
49
Table of Contents
Santander Consumer Finance
Our consumer financing activities are conducted through our subsidiary Santander Consumer Finance (SCF) and its group of companies. Most of the activity of SCF relates to auto financing, personal loans, credit cards, insurance and customer deposits. These consumer financing activities are mainly focused on Germany, Spain, Italy, Norway, Poland, Finland and Sweden. SCF also conducts business in Portugal, Austria and the Netherlands, among others.
The following agreements were entered into in 2014 and strengthen SCF’s position in its markets: (i) the agreement with Banque PSA Finance (PSA Peugeot Citroën Group), (ii) the acquisition in Spain of 51% of Financiera El Corte Inglés, and (iii) the acquisition of GE Nordics (GE Money’s business in Norway, Sweden and Denmark). See “—A. History and development of the company—Principal Capital Expenditures and Divestitures—Acquisitions, Dispositions, Reorganizations”.
At the end of 2014, this unit had 579 branches and 13,046 employees (direct and assigned), of which 1,240 employees were temporary.
In 2014, this unit generated €891 million in profit attributable to the Parent bank, a €97 million or 12% increase compared with 2013. The effective management of asset spreads and the reduction in the cost of deposits absorbed the decrease in interest rates, leading to a €126 million increase in net interest income. Fees and commissions were up by €49 million compared to 2013. Operating expenses rose by €61 million, almost entirely due to the addition of new units in Spain and the Nordic countries (without the impact of changes in the scope of consolidation, operating expenses were down 0.5%). Impairment losses on financial assets were down by €21 million, taking the cost of lending to all-time lows (under 1%), and reflecting a high credit quality for the business.
Customer loans increased by 8%, and managed and marketed customer funds increased by 13%, mainly due to a 51% increase in marketable debt securities. The NPL ratio increased 81 basis points to 4.82% while the coverage decreased to 100% from 105% in 2013, impacted by the entry of GE Nordics. Without taking into account the impact of GE Nordics, the NPL ratio and coverage ratio would have been 3.86% and 106%, respectively.
Spain run-off real-estate
This segment focuses on: (i) managing real estate clients with whom the Group holds potentially problematic exposures in order to reduce their exposure, and (ii) property and land management, which includes the sale of existing properties and, in certain cases, real estate development and subsequent marketing and sale. This segment also includes our investments in the Spanish Bank Restructuring Asset Management Company, or SAREB, see note 8.b.ii to our consolidated financial statements. As of the end of 2014, the stake in Metrocavesa was consolidated by global integration. See “—A. History and development of the company—Principal Capital Expenditures and Divestitures—Acquisitions, Dispositions, Reorganizations—Metrovacesa, S.A.” in our 2014 Form 20-F.
At the end of 2014, this segment had 490 employees.
The Group’s strategy in recent years has been directed at reducing exposure to these assets, which at year end totaled €8,114 million net and were down by €2,667 million or 25% year on year.
In 2014, this segment had €583 million of losses attributable to the Parent bank, representing €52 million decrease in losses compared to 2013, resulting from the decrease in interest income, a fall in impairment losses and lower write-downs recorded in 2014.
United Kingdom
As of December 31, 2014, the United Kingdom accounted for 31% of the total managed and marketed customer funds of the Group’s operating areas. Furthermore, it accounted for 34% of total loans to customers and 21% of profit attributed to the Parent bank’s total operating areas.
Santander UK is focused on the United Kingdom. Around 79% of customer loans are prime mortgages for homes in the U.K. The portfolio of mortgages is of high quality, with no exposure to self-certified or subprime mortgages while buy to let loans represent around 2% of customer loans. As of December 31, 2014, the loan to deposit ratio was 124%, one percentage point higher than at December 31, 2013.
Santander UK’s strategy continued to be centered on three priorities: increasing customer loyalty and satisfaction, being the “bank of choice” for U.K. businesses, and maintaining balance sheet profitability and strength.
50
Table of Contents
At the end of 2014, we had 929 branches and a total of 25,599 employees (direct and assigned), of which 441 employees were temporary, in the United Kingdom.
In 2014, Santander UK contributed €1,576 million profit attributable to the Parent bank, a €427 million or 37% increase from 2013. The ROE was 11.2% (as compared to 8.9% in 2013). The main developments were: (i) a €783 million increase in net interest income due to the reduced cost of retail deposits, (ii) a €421 million increase in operating expenses due to investments in the retail banking and business segments, which were partially offset by the efficiency plans being implemented, and (iii) a €248 million decrease in impairment losses on financial assets mainly due to improved credit quality throughout the range of products we offer and the improved economic environment.
As of December 31, 2014, loans and advances to customers increased by 9%, or 2% excluding the exchange rate impact, and managed and marketed customer funds increased 8%, or 0.4% excluding the exchange rate impact, with a 8% growth in deposits, or 1% excluding the exchange rate impact, and a 9% growth, or 1% excluding the exchange rate impact in marketable debt securities. The NPL ratio decreased 19 basis points to 1.79% and the coverage ratio stood at 42%.
51
Table of Contents
Latin America
At December 31, 2014, we had 5,729 branches and 85,009 employees (direct and assigned) in Latin America, of which 3,242 were temporary employees. At that date, Latin America accounted for 26% of the total managed and marketed customer funds, 20% of total loans to customers and 41% of profit attributed to the Parent bank’s total operating areas.
Our Latin American banking business is principally conducted by the following banking subsidiaries:
| Percentage held at December 31, 2014 |
Percentage held at December 31, 2014 |
|||||||||
| Banco Santander (Brasil), S.A. |
89.02 | Banco Santander, S.A. (Uruguay) |
100.00 | |||||||
| Banco Santander Chile |
67.01 | Banco Santander Perú, S.A. |
100.00 | |||||||
| Banco Santander (Mexico), S.A., Institución de Banca Múltiple, Grupo Financiero Santander |
75.05 | Banco Santander Río, S.A. (Argentina) |
99.30 | |||||||
| Banco Santander de Negocios Colombia S.A. |
99.99 | |||||||||
We engage in a full range of retail banking activities in Latin America, although the range of our activities varies from country to country. We seek to take advantage of whatever particular business opportunities local conditions present.
Our significant position in Latin America is attributable to our financial strength, high degree of diversification (by countries, businesses, products, etc.), and the breadth and depth of our franchise. Grupo Santander has the region’s largest international franchise. It has over 49 million customers and market share of 9.9% in loans and 10.1% in deposits.
Profit attributable to the Parent bank from Latin America in 2014 was €3,150 million, a €29 million or 1% decrease as compared to 2013. However, in local currencies and eliminating the perimeter effect (the units of Santander Asset Management “SAM” that were sold and which we now consolidate by the equity method in the various applicable countries), attributable profit increased by 10%. The ROE reached 14.0% (as compared to 13.8% in 2013). Net interest income fell by €1,041 million or 7%, however in local currencies and eliminating the perimeter effect, net interest income increased 3%, mainly affected by the change in business mix toward lower cost of credit products and also reduced spreads. Operating expenses decreased by €505 million or 6%, however, excluding the exchange rate impact and the perimeter effect, expenses grew by 5% mainly due to investment in networks and commercial projects (some traditional and others focused on priority customer segments) and inflationary pressures on employee compensation and contracted services. Impairment losses on financial assets declined €1,342 million or 21% mainly due to the improvement in Brazil continuing the trend started at the beginning of 2013.
As of December 31, 2014, loans and advances to customers increased by 12% (the perimeter effect does not affect loans as SAM does not engage in the credit business). Managed and marketed customer funds increased 15%, with a 13% growth in deposits and a 44% growth in loans due to credit institutions. The NPL ratio decreased 35 basis points to 4.65% and the coverage ratio stood at 85% at December 31, 2014.
Detailed below are the performance highlights of the main Latin American countries in which we operate:
Brazil. Santander Brazil is the country’s third largest private sector bank by assets and the largest foreign bank in the country. The institution operates in the main regions, with 3,411 branches and points of banking attention, 14,856 ATMs, 46,464 employees (direct and assigned), all of which were hired on a full time basis and more than 31 million customers at the end of 2014.
During 2014, Santander Brazil’s strategy, as a bank with a wide range of products and focus on commercial banking consisted of the following: to improve customer satisfaction and loyalty, to increase the recurring and sustainable nature of transactions, to increase productivity, to strengthen the business lines with lower market share, to maintain capital and liquidity discipline with the objective of preserving the strength of the balance sheet, to manage regulatory changes and to harness opportunities for growth.
52
Table of Contents
During 2014 Santander Brazil entered into or effected the following agreements/acquisitions:
| • | Agreement to create a joint venture with Banco Bonsucesso to leverage activities in the payroll business, as well as increase the number of products offered and improve the distribution and marketing capacity. This transaction closed in the first quarter of 2015. |
| • | Acquisition of 50% of SuperBank, a digital platform that sells financial products and services for the individuals segment, with a more efficient structure. |
| • | Purchase of GetNet to strengthen the credit cards business. Banco Santander (Brasil) S.A. has an indirect participation in GetNet with a stake of 88.5%. |
Profit attributable to the Parent bank from Brazil in 2014 was €1,558 million, a €19 million or 1% decrease (+8% in local currency) as compared to 2013. Total income fell €1,557 million or 11% (or 3% in local currency and at constant perimeter) compared with 2013. This decrease was due to (i) an 11%, or 3% decrease in local currency and excluding the perimeter effect, in net interest income due to the portfolio’s change in mix to lower risk products/segments and reduced spreads on loans, and (ii) an 82%, or 81% decrease in local currency and excluding the perimeter effect, in trading gains because of the reduced gains from market activity in 2014. Operating expenses decreased by 8% compared with 2013, however in local currency and at constant perimeter they rose 1%, remaining well below the inflation rate. Credit quality continues to improve as loan loss provisions declined by 25%, or 18% in local currency (the perimeter effect did not have an impact). The ROE stood at 13.3%.
During 2014, total loans increased by 12%, or 10% in local currency, mainly due to an increase in mortgages (34%), where market penetration is still low, and large companies (24%). Loan volumes in segments with low risk/spreads such as agri-business (23%) and loans through the Brazilian Development Bank (21%), where we want to increase our presence, also rose strongly. Managed and marketed customer funds increased by 14% with deposits growing by 12%, loans due to credit institution increasing by 77% and mutual and pension funds growing by 17%. The NPL ratio was 5.05% at December 31, 2014 compared with 5.64% at December 31, 2013. The coverage ratio stood at 95% at December 31, 2014.
Mexico. Banco Santander (Mexico), S.A., Institución de Banca Múltiple, Grupo Financiero Santander, is one of the leading financial services companies in Mexico. In the fourth quarter of 2013, Mexico acquired ING Hipotecaria, which consolidated the Bank as the country’s second largest mortgage provider. Santander is the third largest banking group in Mexico by business volume, with a market share in loans of 13.8% and 13.7% in deposits. As of December 31, 2014, it had 1,347 branches throughout the country, 16,933 employees (direct and assigned), of which 3,117 were temporary and more than 11 million customers.
Profit attributable to the Parent bank from Mexico in 2014 declined 7% (or 4% eliminating the exchange rate impact and the perimeter effect) to €660 million. Total income increased 1%, or 6% in local currency and eliminating the perimeter effect, supported by increased business activity and effective management of spreads. Operating expenses rose 2%, or 7% excluding the exchange rate impact and the perimeter effect, due to the greater installed capacity, with the opening of 95 branches in 2014. Loan loss provisions declined 6%, or 2% in local currency (the perimeter effect did not have an impact). As a result, operating profit before taxes increased 4%, or 9% in local currency and eliminating the perimeter effect. However, the normalization of the effective tax rate (7.8% in 2013 and 19.5% in 2014) offset the increase in profit before taxes. The ROE was 14.3% at December 31, 2014, compared to 15.2% at December 31, 2013.
Loans increased by 16% while managed and marketed customer funds increased by 15% mainly due to an increase of 16% in deposits.
At December 31, 2014, the NPL ratio increased 18 basis points to 3.84% while the coverage ratio was 86%.
Chile. Banco Santander Chile is the leading bank in Chile in terms of assets and customers, with a particular focus on retail activity (individuals and SMEs). As of December 31, 2014, its market share in loans was 19.2% and in deposits 17.6%. Of note is its share of loans to individuals – it is the leader in consumer finance with a market share of 24.6% and in mortgages with a market share of 20.9%. As of December 31, 2014, Banco Santander Chile had 475 branches, 12,081 employees (direct and assigned), all of which were hired on a full time basis, 1,645 ATMs and 3.6 million customers.
Profit attributable to the Parent bank from Chile increased 17% to €509 million (or 35% in local currency and excluding the perimeter effect). Total income decreased 2% with a 2% increase in net interest income and 11% fall in income from commissions. Operating expenses and loan loss provisions decreased 9% and 13%, respectively.
53
Table of Contents
In local currency and at constant perimeter total income increased by 13%, backed by: (i) an 18% increase in net interest income spurred by growth of volumes in target segments, due to the better mix of deposits and the rise in earnings from the inflation-indexed UF portfolio, and (ii) a 2.2% increase in income from commissions from means of payment (11%), mutual funds (17%) and transaction banking, which offset the impact of the regulatory changes that limited insurance fees we can charge to our customers. Operating expenses rose 6% which is slightly above the inflation rate, due to investments in technology. Loan loss provisions were essentially unchanged with a slight increase of 0.5%. For 2014, the ROE was 19.9%, the NPL ratio increased by 6 basis points to 5.97% and the coverage ratio was 52%.
In 2014, customer loans increased 6% and managed and marketed customer funds rose by 14% resulting from an 11% increase in customer deposits and a 37% growth in mutual and pension funds.
Argentina. Santander Río is the country’s leading private sector bank in terms of assets, loans and customer funds, with market shares of 9.2% in lending and 9.5% in deposits at December 31, 2014. At that date in Argentina we had 396 branches, 7,275 employees and 2.5 million customers.
During the year, lending and deposits increased 7% and 15%, respectively. Nevertheless, in local currency lending rose 23%, focused on lending to SMEs and companies, deposits increased 31%, with similar growth in time deposits (40%) and demand deposits (26%). Loan and deposit growth and trends were aligned with the market.
Profit attributable to the Parent bank was €298 million, an 10% decrease compared with 2013. However, in local currency profit attributable to the Parent bank increased 33% due to improved net interest income and fee and commissions income. At the end of 2014, the ROE was 33.5% and the NPL ratio was 1.61% compared with 33.5% and 1.42% at the end of 2013, respectively.
Uruguay. The Group maintained its leadership in Uruguay. We are the largest private sector bank in the country, with a market share in lending of 17.7% and 15.1% in deposits. Overall, the Group had 89 branches, 1,221 employees and over 500,000 customers in the country at December 31, 2014.
Lending increased by 17%, with particular growth in individual customers and SMEs, and deposits rose by 18%, in each case compared with 2013. Attributable profit in Uruguay was €54 million, an increase of 2%, or 16% in local currency, mainly due to the increase in net interest income and income from fees and commissions.
Peru. As of December 31, 2014, Banco Santander Perú, S.A. had 1 branch and 117 employees. The unit’s activity is focused on companies and on the Group’s global customers. A new auto finance company began to operate in 2013, together with a well-known international partner with considerable experience in Latin America. The company has a specialized business model, focused on service and with products that enable customers to acquire any brand of new car from any dealer in Peru.
Profit attributable to the Parent bank from Peru was €24 million, a 25% increase, or a 31% increase in local currency, compared with 2013.
Colombia. Banco Santander de Negocios Colombia S.A. began operating in January 2014. The bank targets the corporate and business markets, with a special focus on global customers and local customers aiming to expand to gain international presence.
Colombia had a €5.1 million loss attributable to the Parent bank.
United States
The U.S. segment includes Santander Holdings USA (SHUSA), a bank holding company with two distinct lines of business: retail banking, via its subsidiary Santander Bank and Banco Santander Puerto Rico since 2014, and consumer finance business through its stake in Santander Consumer USA Inc. (SCUSA).
The business model of Santander Bank, with 705 branches, 10,060 employees (direct and assigned), all of which were hired on a full time basis, and two million customers at December 31, 2014, focuses on retail customers and companies. It conducts business in the north east of the United States, an area that generates 22% of the country’s GDP.
Santander Puerto Rico had 54 branches, 410,000 customers, 1,430 employees and market shares of 10.0% in lending and 11.7% in deposits, as well as a network of 52 shops that tend to our consumer clients, in each case at December 31, 2014. It focuses on individuals and companies.
54
Table of Contents
SCUSA, based in Dallas, has 4,429 employees and specializes in consumer finance, mainly auto finance and leasing of new and used vehicles (mainly focused on retail customers, although also on vehicle dealers), and on unsecured consumer loans, as well as servicing of portfolios for third parties.
At December 31, 2013, our stake in the company was recorded by the equity method. In the first quarter 2014, SCUSA completed an initial public offering of shares at a price of $24 per share, and is now listed on the New York Stock Exchange. As of December 31, 2014, we retain a 60.5% stake; as a result, since 2014 we are fully consolidating SCUSA’s financial statements.
The U.S. segment accounted for 7% of the total managed and marketed customer funds, 9% of total loans to customers and 11% of profit attributed to the Parent bank’s total operating areas.
The U.S. segment obtained attributable profit of €800 million in 2014, in line with the €803 million obtained in 2013. Total income increased €3,157 million or 127%, however, excluding the perimeter effect (as SCUSA was fully consolidated in 2013 and as Puerto Rico was included in this segment in 2013) and exchange rates, total income increased by 16%. This growth was mostly due to the increase in lending by SCUSA while Santander Bank was affected by the reduction in the investments portfolio that impacted net interest income, as well as the decline in fee income largely due to new regulations limiting fees charged on overdrafts. Operating expenses rose €589 million or 41%, or 8% eliminating the perimeter effect, largely due to increased expenses associated with regulatory compliance. Loan loss provisions increased €2,186 million or €713 million eliminating the perimeter effect, mainly due to SCUSA’s lending growth.
For 2014, ROE was 7.96% and the NPL ratio was 2.54%, which represents a 109 and 55 basis point reduction from 2013, respectively. The coverage ratio stood at 193% at year end.
Second or business level:
Retail Banking
Retail Banking’s profit attributable to the Parent bank in 2014 increased 16% (or 26% on a comparable basis as if Private Banking were excluded in 2013 and excluding the impact of exchange rates), to €5,871 million. The results were impacted by: (i) a 12% increase in net interest income (or 7% without the perimeter effect (as if Private Banking were excluded in 2013 and SCUSA was fully consolidated in 2013) and excluding the impact of exchange rates), (ii) a 1% decrease in operating expenses as the depreciation of Latin American currencies offset the perimeter effect and the investments made to develop the network and businesses, and (iii) a 3% increase in loan loss provisions.
In 2014, Retail Banking generated 85% of the operating areas’ total income and 77% of profit attributable to the Parent bank. This segment had 173,670 employees as of December 31, 2014, of which 6,202 were temporary.
By geographic area, the main features in 2014 were as follows:
| • | Continental Europe posted a profit attributable to the Parent bank 71.4% higher than in 2013, due to increased net interest income and lower provisions. |
| • | Attributable profit in the U.K. increased 43%, backed by increased net interest income and reduced provisions partly offset by increased operating costs. |
| • | Latin America’s attributable profit decreased by 5%. However, in local currencies attributable profit increased 6% resulting from lower provisions. |
| • | Attributable profit in the U.S. grew 5% because of a 17% increase in total income due to the increase in net interest income. On the other hand, operating expenses increased (mainly due to increased regulatory compliance costs), and loan loss provisions grew (mainly due to the increase in lending by SCUSA and the increase in the unsecured consumer loan portfolio). |
Global Wholesale Banking
This area covers our corporate banking, treasury and investment banking activities throughout the world.
Global Wholesale Banking generated 12% of total income and 21% of the profit attributable to the Parent bank in 2014. This segment had approximately 7,481 employees at December 31, 2014.
55
Table of Contents
The attributable profit in 2014 was €1,614 million, an increase of 7% compared to 2013. This performance was impacted by an increase in net interest income (3%) and income from fees and commissions (13%), and from a decrease in net gains on financial assets and liabilities (-36%), increased investments in franchises under development (4%) and a decrease in loan loss provisions (-42%).
Global Wholesale Banking has 3 major areas: (i) global transaction banking (which includes cash management, trade finance and basic financing and custody), (ii) financing solutions and advisory (which includes the units that originate and distribute corporate loans or structured financing, the teams that originate bonds and securitization, the corporate finance units (mergers and acquisitions, primary equity markets, investment solutions for corporate clients via derivatives), as well as asset and capital structuring), and (iii) global markets (which include the sale and distribution of fixed income and equity derivatives, interest rates and inflation, the trading and hedging of exchange rates, short-term money markets for the Group’s wholesale and retail clients, management of books associated with distribution, brokerage of equities, and derivatives for investment and hedging solutions).
Private Banking, Asset Management and Insurance
This segment comprises all of our companies whose activity is private banking, management of mutual and pension funds and insurance.
Since December 2013, we hold a 50% ownership interest in SAM and control this company jointly with Warburg Pincus and General Atlantic. As a result, since December 2013, this company is accounted for by the equity method. See “—A. History and development of the company—Principal Capital Expenditures and Divestitures—Acquisitions, Dispositions, Reorganizations—Agreement with Warburg Pincus and General Atlantic.
In 2014, this segment accounted for 3% of total income and 9% of attributable profit to the Parent bank. Profit attributable to the Parent bank by Private Baking, Asset Management and Insurance in 2014 was €391 million or 125% higher than in 2013. Without the effect of the changes in the scope of consolidation (on a comparable basis for 2013 and 2014 assuming that the sale of 50% of the management companies took place before 2013 and that Private Banking was included in 2013), and excluding the impact of exchange rates, the increase would have been 31.3%. This increase was due to higher total income, flat operating expenses and lower loan loss provisions.
Private Banking
Attributable profit was €319 million (15.7% and 16.9% in constant euros) with a good evolution of gross income, operating expenses and loan loss provisions.
The process of developing and implementing a homogeneous model, which offers comprehensive solutions for the financial needs of the Group’s high net worth clients, through specialized commercial units in the various countries in which we operate and supported by the Group’s other global areas, continued during 2014. An important milestone in 2014 was integrating the three specialized networks in Spain, positioning Santander as the reference financial institution for high net worth clients in the country.
Asset Management
Attributable profit in 2014 was €114 million, 43% higher than in 2013, after absorbing the sale of 50% of the SAM units and the depreciation of Latin American currencies. On a comparable basis (assuming the sale of 50% of the management companies took place before 2013), attributable profit doubled due to the greater contribution of the shared fund management entities as well as the increase in business volume. Total funds under management and marketed in 2014 were 17% higher than in 2013 at €162,000 million at constant exchange rates, of which €136,000 million were mutual and pension funds, and the remainder were clients’ managed portfolios.
Under the strategic alliance with Warburg Pincus and General Atlantic to promote the global asset management business, the area continued to advance in its marketing model, backed by the strength and knowledge of local markets.
Insurance
Santander Insurance posted attributable profit in 2014 of €270 million, 15% more than in 2013. Eliminating the impact of exchange rates, attributable profit increased by 24%, mainly due to the increase in income from companies accounted for by the equity method. This line item represents the contribution of our joint venture insurers in our various strategic alliances.
56
Table of Contents
We strengthened our bancassurance business via strategic alliances with insurers that are global leaders, thereby enabling our clients to access a larger and more innovative range of products. We entered into an agreement in 2014 with CNP to develop the insurance business of Santander Consumer Finance in Europe, and extend the cooperation agreement with Aegon to the Portuguese market. Our strategic agreements with Zurich in five Latin American countries, with Aegon in Spain and Aviva in Poland continued to meet our objectives. See “—A. History and development of the company—Principal Capital Expenditures and Divestitures—Acquisitions, Dispositions, Reorganizations” for further details on the CNP and Aegon agreements.
Spain’s run-off real estate
See above under “First level (or geographic)—Continental Europe—Spain’s run-off real estate.”
Corporate Activities
At the end of 2014, this area had 2,633 employees (direct and assigned) of which 957 were temporary.
This area is responsible for, on the one hand, a series of centralized activities to manage the structural risks of the Group and of the Parent bank. It executes the necessary activities for managing interest rates, exposure to exchange-rate movements and the required levels of liquidity in the Group. On the other hand, it acts as the Group’s holding entity, managing the Group’s global capital as well as that of each of the business units.
The Corporate Activities area had a loss of €1,789 million in 2014, a 14% decrease as compared to 2013. This decrease was primarily due to an improvement in net interest income from the lower cost borrowing, increased trading gains (better results from management of assets and liabilities), and a growth in gains in other assets.
Within corporate activities, the financial management area conducts the global functions of balance sheet management, both structural interest rate and liquidity risk management (the latter via issuances and securitizations), as well as the structural position of exchange rates:
| • | Interest rate risk is actively managed by taking market positions to soften the impact of interest rate changes on net interest income, and is done via bonds and derivatives of high credit quality and liquidity and low consumption of capital. |
| • | The objective of structural liquidity management is to finance the Group’s recurring activity in optimum conditions of maturity and cost, maintaining an appropriate profile (in volumes and maturities) by diversifying the funding sources. |
| • | Management of the exposure to exchange rate movements is also carried out on a centralized basis. This management (which is dynamic) is conducted through exchange-rate derivatives, seeking to optimize at all times the financial cost of hedging. |
Hedging of net investments in the capital of businesses abroad aims to neutralize the impact on capital of converting into euros the balances of our material subsidiaries that are consolidated and whose currency is not the euro.
The Group’s policy seeks to mitigate the impact, which, in situations of high volatility in the markets, sudden changes in interest rates would have on these exposures of a permanent nature. At the end 2014, we had €15,546 million hedged relating to our investments in Brazil, the U.K., Mexico, Chile, the U.S., Poland and Norway and the instruments used were spot, foreign exchange forwards or tunnel options.
Exposures of a temporary nature—those regarding results that the Group’s units will contribute in the next 12 months in non-euro currencies—are also managed on a centralized basis in order to limit their volatility in euros.
Meanwhile, and separately from the financial management described here, Corporate Activities manages all capital and reserves and allocations of capital to each of the units, as well as providing the liquidity that some of the business units might need. The price at which these transactions are carried out is the market rate (euribor or swap) plus a risk premium associated with the hold of the funds during the life of the transaction, which in terms of liquidity, the Group supports.
Lastly, and marginally, the equity stakes of a financial nature that the Group takes within its policy of optimizing investments are reflected in Corporate Activities.
57
Table of Contents
Total Revenues by Activity and Geographic Location
For a breakdown of our total revenues by category of activity and geographic market, see note 52 to our consolidated financial statements.
58
Table of Contents
Selected Statistical Information
The following tables show our selected statistical information.
Average Balance Sheets and Interest Rates
The following tables show, by domicile of customer, our average balances and interest rates for each of the past three years.
You should read the following tables and the tables included under “—Changes in Net Interest Income—Volume and Rate Analysis” and “—Assets—Earning Assets—Yield Spread” in conjunction with the following:
| • | We have included interest received on non-accruing assets in interest income only if we received such interest during the period in which it was due; |
| • | We have included loan arrangement fees in interest income; |
| • | We have not recalculated tax-exempt income on a tax-equivalent basis because the effect of doing so would not be significant; |
| • | We have included income and expenses from interest-rate hedging transactions as a separate line item under interest income and expenses if these transactions qualify for hedge accounting under IFRS-IASB. If these transactions did not qualify for such treatment, we have included income and expenses on these transactions elsewhere in our income statement. See note 2 to our consolidated financial statements for a discussion of our accounting policies for hedging activities; |
| • | We have stated average balances on a gross basis, before netting our allowances for credit losses, except for the total average asset figures, which includes such netting; and |
| • | All average data have been calculated using month-end balances, which is not significantly different from having used daily averages. |
As stated above under “Presentation of Financial and Other Information”, we have prepared our financial statements for 2014, 2013, 2012, 2011 and 2010 under IFRS-IASB.
59
Table of Contents
Average Balance Sheet - Assets and Interest Income
| Year Ended December 31, | ||||||||||||||||||||||||||||||||||||
| ASSETS | 2014 | 2013 | 2012 | |||||||||||||||||||||||||||||||||
| Average Balance |
Interest | Average Rate |
Average Balance |
Interest | Average Rate |
Average Balance |
Interest | Average Rate |
||||||||||||||||||||||||||||
| (in millions of euros, except percentages) | ||||||||||||||||||||||||||||||||||||
| Cash and due from central banks |
||||||||||||||||||||||||||||||||||||
| Domestic |
1,737 | 13 | 0.75 | % | 6,590 | 54 | 0.82 | % | 21,172 | 91 | 0.44 | % | ||||||||||||||||||||||||
| International |
75,567 | 2,025 | 2.68 | % | 77,467 | 2,647 | 3.42 | % | 75,572 | 2,602 | 3.44 | % | ||||||||||||||||||||||||
|
|
|
|
|
|
|
|
|
|
|
|
|
|
|
|
|
|
|
|||||||||||||||||||
| 77,304 | 2,038 | 2.64 | % | 84,057 | 2,701 | 3.21 | % | 96,744 | 2,693 | 2.78 | % | |||||||||||||||||||||||||
| Due from credit entities |
||||||||||||||||||||||||||||||||||||
| Domestic |
22,614 | 98 | 0.43 | % | 28,206 | 152 | 0.54 | % | 25,257 | 136 | 0.54 | % | ||||||||||||||||||||||||
| International |
59,090 | 1,684 | 2.85 | % | 56,983 | 614 | 1.08 | % | 45,600 | 898 | 1.97 | % | ||||||||||||||||||||||||
|
|
|
|
|
|
|
|
|
|
|
|
|
|
|
|
|
|
|
|||||||||||||||||||
| 81,704 | 1,782 | 2.18 | % | 85,189 | 766 | 0.90 | % | 70,857 | 1,034 | 1.46 | % | |||||||||||||||||||||||||
| Loans and credits |
||||||||||||||||||||||||||||||||||||
| Domestic |
164,517 | 5,125 | 3.12 | % | 178,227 | 5,755 | 3.23 | % | 198,643 | 7,332 | 3.69 | % | ||||||||||||||||||||||||
| International |
541,635 | 37,050 | 6.84 | % | 519,037 | 34,450 | 6.64 | % | 550,730 | 38,795 | 7.04 | % | ||||||||||||||||||||||||
|
|
|
|
|
|
|
|
|
|
|
|
|
|
|
|
|
|
|
|||||||||||||||||||
| 706,152 | 42,175 | 5.97 | % | 697,264 | 40,205 | 5.77 | % | 749,373 | 46,127 | 6.16 | % | |||||||||||||||||||||||||
| Debt securities |
||||||||||||||||||||||||||||||||||||
| Domestic |
44,797 | 1,582 | 3.53 | % | 55,497 | 2,113 | 3.81 | % | 52,382 | 1,946 | 3.72 | % | ||||||||||||||||||||||||
| International |
110,741 | 5,665 | 5.12 | % | 94,144 | 4,322 | 4.59 | % | 96,910 | 5,147 | 5.31 | % | ||||||||||||||||||||||||
|
|
|
|
|
|
|
|
|
|
|
|
|
|
|
|
|
|
|
|||||||||||||||||||
| 155,538 | 7,247 | 4.66 | % | 149,641 | 6,435 | 4.30 | % | 149,292 | 7,093 | 4.75 | % | |||||||||||||||||||||||||
| Income from hedging operations |
||||||||||||||||||||||||||||||||||||
| Domestic |
95 | 85 | 211 | |||||||||||||||||||||||||||||||||
| International |
198 | 125 | 472 | |||||||||||||||||||||||||||||||||
|
|
|
|
|
|
|
|||||||||||||||||||||||||||||||
| 293 | 210 | 683 | ||||||||||||||||||||||||||||||||||
| Other interest-earning assets |
||||||||||||||||||||||||||||||||||||
| Domestic |
41,774 | 689 | 1.65 | % | 60,673 | 677 | 1.12 | % | 75,008 | 803 | 1.07 | % | ||||||||||||||||||||||||
| International |
33,826 | 432 | 1.28 | % | 41,333 | 453 | 1.10 | % | 47,902 | 357 | 0.75 | % | ||||||||||||||||||||||||
|
|
|
|
|
|
|
|
|
|
|
|
|
|
|
|
|
|
|
|||||||||||||||||||
| 75,600 | 1,121 | 1.48 | % | 102,006 | 1,130 | 1.11 | % | 122,910 | 1,160 | 0.94 | % | |||||||||||||||||||||||||
| Total interest-earning assets |
||||||||||||||||||||||||||||||||||||
| Domestic |
275,439 | 7,602 | 2.76 | % | 329,193 | 8,836 | 2.68 | % | 372,462 | 10,520 | 2.82 | % | ||||||||||||||||||||||||
| International |
820,859 | 47,054 | 5.73 | % | 788,964 | 42,611 | 5.40 | % | 816,714 | 48,271 | 5.91 | % | ||||||||||||||||||||||||
|
|
|
|
|
|
|
|
|
|
|
|
|
|
|
|
|
|
|
|||||||||||||||||||
| 1,096,298 | 54,656 | 4.99 | % | 1,118,157 | 51,447 | 4.60 | % | 1,189,176 | 58,791 | 4.94 | % | |||||||||||||||||||||||||
| Investments in affiliated companies |
||||||||||||||||||||||||||||||||||||
| Domestic |
1,630 | — | 0.00 | % | 1,223 | — | 0.00 | % | 1,147 | — | 0.00 | % | ||||||||||||||||||||||||
| International |
2,135 | — | 0.00 | % | 3,632 | — | 0.00 | % | 3,459 | — | 0.00 | % | ||||||||||||||||||||||||
|
|
|
|
|
|
|
|
|
|
|
|
|
|
|
|
|
|
|
|||||||||||||||||||
| 3,765 | — | 0.00 | % | 4,855 | — | 0.00 | % | 4,606 | — | 0.00 | % | |||||||||||||||||||||||||
| Total earning assets |
||||||||||||||||||||||||||||||||||||
| Domestic |
277,069 | 7,602 | 2.74 | % | 330,416 | 8,836 | 2.67 | % | 373,609 | 10,520 | 2.82 | % | ||||||||||||||||||||||||
| International |
822,994 | 47,054 | 5.72 | % | 792,596 | 42,611 | 5.38 | % | 820,173 | 48,271 | 5.89 | % | ||||||||||||||||||||||||
|
|
|
|
|
|
|
|
|
|
|
|
|
|
|
|
|
|
|
|||||||||||||||||||
| 1,100,063 | 54,656 | 4.97 | % | 1,123,012 | 51,447 | 4.58 | % | 1,193,782 | 58,791 | 4.92 | % | |||||||||||||||||||||||||
| Other assets |
101,784 | 91,236 | 92,856 | |||||||||||||||||||||||||||||||||
| Assets from discontinued operations |
— | — | — | |||||||||||||||||||||||||||||||||
|
|
|
|
|
|
|
|
|
|
|
|
|
|||||||||||||||||||||||||
| Total average assets |
1,201,847 | 54,656 | 1,214,248 | 51,447 | 1,286,638 | 58,791 | ||||||||||||||||||||||||||||||
60
Table of Contents
Average Balance Sheet - Liabilities and Interest Expense
| Year Ended December 31, | ||||||||||||||||||||||||||||||||||||
| 2014 | 2013 | 2012 | ||||||||||||||||||||||||||||||||||
| LIABILITIES AND STOCKHOLDERS EQUITY |
Average Balance |
Interest | Average Rate |
Average Balance |
Interest | Average Rate |
Average Balance |
Interest | Average Rate |
|||||||||||||||||||||||||||
| Due to credit entities |
||||||||||||||||||||||||||||||||||||
| Domestic |
16,006 | 225 | 1.41 | % | 21,654 | 335 | 1.55 | % | 55,339 | 761 | 1.38 | % | ||||||||||||||||||||||||
| International |
116,499 | 1,980 | 1.70 | % | 107,956 | 1,635 | 1.51 | % | 99,347 | 1,720 | 1.73 | % | ||||||||||||||||||||||||
|
|
|
|
|
|
|
|
|
|
|
|
|
|
|
|
|
|
|
|||||||||||||||||||
| 132,505 | 2,205 | 1.66 | % | 129,610 | 1,970 | 1.52 | % | 154,686 | 2,481 | 1.60 | % | |||||||||||||||||||||||||
| Customers deposits |
||||||||||||||||||||||||||||||||||||
| Domestic |
170,327 | 1,629 | 0.96 | % | 173,833 | 3,053 | 1.76 | % | 153,399 | 2,850 | 1.86 | % | ||||||||||||||||||||||||
| International |
459,133 | 11,787 | 2.57 | % | 458,506 | 11,752 | 2.56 | % | 482,952 | 13,554 | 2.81 | % | ||||||||||||||||||||||||
|
|
|
|
|
|
|
|
|
|
|
|
|
|
|
|
|
|
|
|||||||||||||||||||
| 629,460 | 13,416 | 2.13 | % | 632,339 | 14,805 | 2.34 | % | 636,351 | 16,404 | 2.58 | % | |||||||||||||||||||||||||
| Marketable debt securities |
||||||||||||||||||||||||||||||||||||
| Domestic |
68,571 | 2,242 | 3.27 | % | 83,445 | 2,993 | 3.59 | % | 95,054 | 3,175 | 3.34 | % | ||||||||||||||||||||||||
| International |
121,194 | 4,602 | 3.80 | % | 105,509 | 3,886 | 3.68 | % | 109,647 | 4,102 | 3.74 | % | ||||||||||||||||||||||||
|
|
|
|
|
|
|
|
|
|
|
|
|
|
|
|
|
|
|
|||||||||||||||||||
| 189,765 | 6,844 | 3.61 | % | 188,954 | 6,879 | 3.64 | % | 204,701 | 7,277 | 3.55 | % | |||||||||||||||||||||||||
| Subordinated debt |
||||||||||||||||||||||||||||||||||||
| Domestic |
9,540 | 407 | 4.27 | % | 8,547 | 496 | 5.80 | % | 10,409 | 637 | 6.12 | % | ||||||||||||||||||||||||
| International |
7,762 | 677 | 8.72 | % | 8,098 | 764 | 9.43 | % | 10,830 | 1,013 | 9.35 | % | ||||||||||||||||||||||||
|
|
|
|
|
|
|
|
|
|
|
|
|
|
|
|
|
|
|
|||||||||||||||||||
| 17,302 | 1,084 | 6.27 | % | 16,645 | 1,260 | 7.57 | % | 21,239 | 1,650 | 7.77 | % | |||||||||||||||||||||||||
| Other interest-bearing liabilities |
||||||||||||||||||||||||||||||||||||
| Domestic |
57,956 | 917 | 1.58 | % | 75,386 | 962 | 1.28 | % | 91,492 | 1,113 | 1.22 | % | ||||||||||||||||||||||||
| International |
55,512 | 1,189 | 2.14 | % | 57,778 | 1,064 | 1.84 | % | 63,062 | 684 | 1.08 | % | ||||||||||||||||||||||||
|
|
|
|
|
|
|
|
|
|
|
|
|
|
|
|
|
|
|
|||||||||||||||||||
| 113,468 | 2,106 | 1.86 | % | 133,164 | 2,026 | 1.52 | % | 154,554 | 1,797 | 1.16 | % | |||||||||||||||||||||||||
| Expenses from hedging operations |
||||||||||||||||||||||||||||||||||||
| Domestic |
(388 | ) | (1,138 | ) | (974 | ) | ||||||||||||||||||||||||||||||
| International |
(158 | ) | (290 | ) | 234 | |||||||||||||||||||||||||||||||
|
|
|
|
|
|
|
|||||||||||||||||||||||||||||||
| (546 | ) | (1,428 | ) | (740 | ) | |||||||||||||||||||||||||||||||
| Total interest-bearing liabilities |
||||||||||||||||||||||||||||||||||||
| Domestic |
322,400 | 5,032 | 1.56 | % | 362,865 | 6,701 | 1.85 | % | 405,693 | 7,561 | 1.86 | % | ||||||||||||||||||||||||
| International |
760,100 | 20,077 | 2.64 | % | 737,847 | 18,811 | 2.55 | % | 765,838 | 21,307 | 2.78 | % | ||||||||||||||||||||||||
|
|
|
|
|
|
|
|
|
|
|
|
|
|
|
|
|
|
|
|||||||||||||||||||
| 1,082,500 | 25,109 | 2.32 | % | 1,100,712 | 25,512 | 2.32 | % | 1,171,531 | 28,868 | 2.46 | % | |||||||||||||||||||||||||
| Other liabilities |
34,543 | 31,959 | 34,048 | |||||||||||||||||||||||||||||||||
| Non-controlling interest |
9,757 | 10,066 | 8,424 | |||||||||||||||||||||||||||||||||
| Stockholders’ Equity |
75,047 | 71,511 | 72,635 | |||||||||||||||||||||||||||||||||
| Liabilities from discontinued operations |
— | — | — | |||||||||||||||||||||||||||||||||
|
|
|
|
|
|
|
|
|
|
|
|
|
|||||||||||||||||||||||||
| Total average Liabilities and Stockholders´ Equity |
1,201,847 | 25,109 | 1,214,248 | 25,512 | 1,286,638 | 28,868 | ||||||||||||||||||||||||||||||
61
Table of Contents
Changes in Net Interest Income—Volume and Rate Analysis
The following tables allocate, by domicile of customer, changes in our net interest income between changes in average volume and changes in average rate for 2014 compared to 2013 and 2013 compared to 2012. We have calculated volume variances based on movements in average balances over the period and rate variance based on changes in interest rates on average interest-earning assets and average interest-bearing liabilities. We have allocated variances caused by changes in both volume and rate to volume. You should read the following tables and the footnotes thereto in light of our observations noted in the preceding sub-section entitled “—Average Balance Sheets and Interest Rates”, and the footnotes thereto.
| Volume and rate analysis | IFRS-IASB 2014/2013 |
|||||||||||
| Increase (Decrease) due to changes in | ||||||||||||
| Volume | Rate | Net change | ||||||||||
| (in millions of euros) | ||||||||||||
| Interest income | ||||||||||||
| Cash and due from central banks |
||||||||||||
| Domestic |
(36 | ) | (5 | ) | (41 | ) | ||||||
| International |
(63 | ) | (559 | ) | (622 | ) | ||||||
|
|
|
|
|
|
|
|||||||
| (99 | ) | (564 | ) | (663 | ) | |||||||
| Due from credit entities |
||||||||||||
| Domestic |
(27 | ) | (27 | ) | (54 | ) | ||||||
| International |
24 | 1,046 | 1,070 | |||||||||
|
|
|
|
|
|
|
|||||||
| (3 | ) | 1,019 | 1,016 | |||||||||
| Loans and credits |
||||||||||||
| Domestic |
(432 | ) | (198 | ) | (630 | ) | ||||||
| International |
1,527 | 1,073 | 2,600 | |||||||||
|
|
|
|
|
|
|
|||||||
| 1,095 | 875 | 1,970 | ||||||||||
| Debt securities |
||||||||||||
| Domestic |
(386 | ) | (145 | ) | (531 | ) | ||||||
| International |
814 | 529 | 1,343 | |||||||||
|
|
|
|
|
|
|
|||||||
| 428 | 384 | 812 | ||||||||||
| Other interest-earning assets |
||||||||||||
| Domestic |
(252 | ) | 264 | 12 | ||||||||
| International |
(88 | ) | 68 | (20 | ) | |||||||
|
|
|
|
|
|
|
|||||||
| (340 | ) | 332 | (8 | ) | ||||||||
| Total interest-earning assets without hedging operations |
||||||||||||
| Domestic |
(1,133 | ) | (111 | ) | (1,244 | ) | ||||||
| International |
2,214 | 2,157 | 4,371 | |||||||||
|
|
|
|
|
|
|
|||||||
| 1,081 | 2,046 | 3,127 | ||||||||||
| Income from hedging operations |
||||||||||||
| Domestic |
10 | — | 10 | |||||||||
| International |
73 | — | 73 | |||||||||
|
|
|
|
|
|
|
|||||||
| 83 | — | 83 | ||||||||||
| Total interest-earning assets |
||||||||||||
| Domestic |
(1,123 | ) | (111 | ) | (1,234 | ) | ||||||
| International |
2,287 | 2,157 | 4,444 | |||||||||
|
|
|
|
|
|
|
|||||||
| 1,164 | 2,046 | 3,210 | ||||||||||
|
|
|
|
|
|
|
|||||||
62
Table of Contents
| Volume and rate analysis | IFRS-IASB 2013/2012 |
|||||||||||
| Increase (Decrease) due to changes in | ||||||||||||
| Volume | Rate | Net change | ||||||||||
| (in millions of euros) | ||||||||||||
| Interest income | ||||||||||||
| Cash and due from central banks |
||||||||||||
| Domestic |
(87 | ) | 50 | (37 | ) | |||||||
| International |
65 | (20 | ) | 45 | ||||||||
|
|
|
|
|
|
|
|||||||
| (22 | ) | 30 | 8 | |||||||||
| Due from credit entities |
||||||||||||
| Domestic |
16 | — | 16 | |||||||||
| International |
188 | (472 | ) | (284 | ) | |||||||
|
|
|
|
|
|
|
|||||||
| 204 | (472 | ) | (268 | ) | ||||||||
| Loans and credits |
||||||||||||
| Domestic |
(711 | ) | (866 | ) | (1,577 | ) | ||||||
| International |
(2,168 | ) | (2,177 | ) | (4,345 | ) | ||||||
|
|
|
|
|
|
|
|||||||
| (2,879 | ) | (3,043 | ) | (5,922 | ) | |||||||
| Debt securities |
||||||||||||
| Domestic |
118 | 49 | 167 | |||||||||
| International |
(144 | ) | (681 | ) | (825 | ) | ||||||
|
|
|
|
|
|
|
|||||||
| (26 | ) | (632 | ) | (658 | ) | |||||||
| Other interest-earning assets |
||||||||||||
| Domestic |
(159 | ) | 33 | (126 | ) | |||||||
| International |
(54 | ) | 150 | 96 | ||||||||
|
|
|
|
|
|
|
|||||||
| (213 | ) | 183 | (30 | ) | ||||||||
| Total interest-earning assets without hedging operations |
||||||||||||
| Domestic |
(823 | ) | (734 | ) | (1,557 | ) | ||||||
| International |
(2,113 | ) | (3,200 | ) | (5,313 | ) | ||||||
|
|
|
|
|
|
|
|||||||
| (2,936 | ) | (3,934 | ) | (6,870 | ) | |||||||
| Income from hedging operations |
||||||||||||
| Domestic |
(127 | ) | — | (127 | ) | |||||||
| International |
(347 | ) | — | (347 | ) | |||||||
|
|
|
|
|
|
|
|||||||
| (474 | ) | — | (474 | ) | ||||||||
| Total interest-earning assets |
||||||||||||
| Domestic |
(950 | ) | (734 | ) | (1,684 | ) | ||||||
| International |
(2,460 | ) | (3,200 | ) | (5,660 | ) | ||||||
|
|
|
|
|
|
|
|||||||
| (3,410 | ) | (3,934 | ) | (7,344 | ) | |||||||
|
|
|
|
|
|
|
|||||||
63
Table of Contents
| Volume and rate analysis | IFRS-IASB 2014/2013 |
|||||||||||
| Increase (Decrease) due to changes in | ||||||||||||
| Volume | Rate | Net change | ||||||||||
| (in millions of euros) | ||||||||||||
| Interest charges | ||||||||||||
| Due to credit entities |
(81 | ) | (29 | ) | (110 | ) | ||||||
| Domestic |
136 | 209 | 345 | |||||||||
|
|
|
|
|
|
|
|||||||
| International |
55 | 180 | 235 | |||||||||
| Customers’ deposits |
(60 | ) | (1,364 | ) | (1,424 | ) | ||||||
| Domestic |
16 | 19 | 35 | |||||||||
|
|
|
|
|
|
|
|||||||
| International |
(44 | ) | (1,345 | ) | (1,389 | ) | ||||||
| Marketable debt securities |
(502 | ) | (249 | ) | (751 | ) | ||||||
| Domestic |
593 | 123 | 716 | |||||||||
|
|
|
|
|
|
|
|||||||
| International |
91 | (126 | ) | (35 | ) | |||||||
| Subordinated debt |
53 | (142 | ) | (89 | ) | |||||||
| Domestic |
(31 | ) | (56 | ) | (87 | ) | ||||||
|
|
|
|
|
|
|
|||||||
| International |
22 | (198 | ) | (176 | ) | |||||||
| Other interest-bearing liabilities |
(250 | ) | 205 | (45 | ) | |||||||
| Domestic |
(42 | ) | 167 | 125 | ||||||||
|
|
|
|
|
|
|
|||||||
| International |
(292 | ) | 372 | 80 | ||||||||
| Total interest-bearing liabilities without hedging operations |
(840 | ) | (1,579 | ) | (2,419 | ) | ||||||
| Domestic |
672 | 462 | 1,134 | |||||||||
|
|
|
|
|
|
|
|||||||
| International |
(168 | ) | (1,117 | ) | 1,285 | |||||||
| Expenses from hedging operations |
750 | — | 750 | |||||||||
| Domestic |
132 | — | 132 | |||||||||
|
|
|
|
|
|
|
|||||||
| International |
882 | — | 882 | |||||||||
| Total interest-bearing liabilities |
(90 | ) | (1,579 | ) | (1,669 | ) | ||||||
| Domestic |
804 | 462 | 1,266 | |||||||||
|
|
|
|
|
|
|
|||||||
| International |
714 | (1,117 | ) | (403 | ) | |||||||
|
|
|
|
|
|
|
|||||||
64
Table of Contents
| IFRS-IASB 2013/2012 |
||||||||||||
| Increase (Decrease) due to changes in | ||||||||||||
| Volume | Rate | Net change | ||||||||||
| (in millions of euros) | ||||||||||||
| Interest charges | ||||||||||||
| Due to credit entities |
||||||||||||
| Domestic |
(511 | ) | 85 | (426 | ) | |||||||
| International |
141 | (226 | ) | (85 | ) | |||||||
|
|
|
|
|
|
|
|||||||
| (370 | ) | (141 | ) | (511 | ) | |||||||
| Customers deposits |
||||||||||||
| Domestic |
365 | (162 | ) | 203 | ||||||||
| International |
(664 | ) | (1,138 | ) | (1,802 | ) | ||||||
|
|
|
|
|
|
|
|||||||
| (299 | ) | (1,300 | ) | (1,599 | ) | |||||||
| Marketable debt securities |
||||||||||||
| Domestic |
(406 | ) | 224 | (182 | ) | |||||||
| International |
(153 | ) | (63 | ) | (216 | ) | ||||||
|
|
|
|
|
|
|
|||||||
| (559 | ) | 161 | (398 | ) | ||||||||
| Subordinated debt |
||||||||||||
| Domestic |
(109 | ) | (32 | ) | (141 | ) | ||||||
| International |
(258 | ) | 9 | (249 | ) | |||||||
|
|
|
|
|
|
|
|||||||
| (367 | ) | (23 | ) | (390 | ) | |||||||
| Other interest-bearing liabilities |
||||||||||||
| Domestic |
(204 | ) | 54 | (150 | ) | |||||||
| International |
(62 | ) | 442 | 380 | ||||||||
|
|
|
|
|
|
|
|||||||
| (266 | ) | 496 | 230 | |||||||||
| Total interest-bearing liabilities without hedging operations |
||||||||||||
| Domestic |
(865 | ) | 169 | (696 | ) | |||||||
| International |
(996 | ) | (976 | ) | (1,972 | ) | ||||||
|
|
|
|
|
|
|
|||||||
| (1,861 | ) | (807 | ) | (2,668 | ) | |||||||
| Expenses from hedging operations |
||||||||||||
| Domestic |
(164 | ) | — | (164 | ) | |||||||
| International |
(524 | ) | — | (524 | ) | |||||||
|
|
|
|
|
|
|
|||||||
| (688 | ) | — | (688 | ) | ||||||||
| Total interest-bearing liabilities |
||||||||||||
| Domestic |
(1,029 | ) | 169 | (860 | ) | |||||||
| International |
(1,520 | ) | (976 | ) | (2,496 | ) | ||||||
|
|
|
|
|
|
|
|||||||
| (2,549 | ) | (807 | ) | (3,356 | ) | |||||||
|
|
|
|
|
|
|
|||||||
65
Table of Contents
Assets
Earning Assets—Yield Spread
The following table analyzes, by domicile of customer, our average earning assets, interest income and dividends on equity securities and net interest income and shows gross yields, net yields and yield spread for each of the years indicated. You should read this table and the footnotes thereto in light of our observations noted in the preceding sub-section entitled “—Average Balance Sheets and Interest Rates”, and the footnotes thereto.
| Earning Assets—Yield Spread | IFRS-IASB | |||||||||||
| Year Ended December 31, | ||||||||||||
| 2014 | 2013 | 2012 | ||||||||||
| (in millions of euros, except percentages) | ||||||||||||
| Average earning assets |
||||||||||||
| Domestic |
277,069 | 330,416 | 373,609 | |||||||||
| International |
822,994 | 792,596 | 820,173 | |||||||||
|
|
|
|
|
|
|
|||||||
| 1,100,063 | 1,123,012 | 1,193,782 | ||||||||||
| Interest |
||||||||||||
| Domestic |
7,602 | 8,836 | 10,520 | |||||||||
| International |
47,054 | 42,611 | 48,271 | |||||||||
|
|
|
|
|
|
|
|||||||
| 54,656 | 51,447 | 58,791 | ||||||||||
| Net interest income (1) |
||||||||||||
| Domestic |
2,570 | 2,135 | 2,959 | |||||||||
| International |
26,977 | 23,800 | 26,964 | |||||||||
|
|
|
|
|
|
|
|||||||
| 29,547 | 25,935 | 29,923 | ||||||||||
| Gross yield (2) |
||||||||||||
| Domestic |
2.74 | % | 2.67 | % | 2.82 | % | ||||||
| International |
5.72 | % | 5.38 | % | 5.89 | % | ||||||
|
|
|
|
|
|
|
|||||||
| 4.97 | % | 4.58 | % | 4.92 | % | |||||||
| Net yield (3) |
||||||||||||
| Domestic |
0.93 | % | 0.65 | % | 0.79 | % | ||||||
| International |
3.28 | % | 3.00 | % | 3.29 | % | ||||||
|
|
|
|
|
|
|
|||||||
| 2.69 | % | 2.31 | % | 2.51 | % | |||||||
| Yield spread (4) |
||||||||||||
| Domestic |
1.18 | % | 0.83 | % | 0.95 | % | ||||||
| International |
3.08 | % | 2.83 | % | 3.10 | % | ||||||
|
|
|
|
|
|
|
|||||||
| 2.65 | % | 2.26 | % | 2.46 | % | |||||||
| (1) | Net interest income is the net amount of interest and similar income and interest expense and similar charges. See “Income Statement” on page [9] of this annual report. |
| (2) | Gross yield is the quotient of interest income divided by average earning assets. |
| (3) | Net yield is the quotient of net interest income divided by average earning assets. |
| (4) | Yield spread is the difference between gross yield on earning assets and the average cost of interest-bearing liabilities. For a discussion of the changes in yield spread over the periods presented, see “Item 5. Operating and Financial Review and Prospects—A. Operating results—Results of Operations for Santander—Interest Income / (Charges)” herein. |
66
Table of Contents
Return on Equity and Assets
The following table presents our selected financial ratios for the years indicated.
| Year Ended December 31, | ||||||||||||
| 2014 | 2013 | 2012 | ||||||||||
| ROA: Return on average total assets |
0.58 | % | 0.44 | % | 0.24 | % | ||||||
| ROE: Return on average stockholders’ equity |
7.75 | % | 5.85 | % | 3.14 | % | ||||||
| PAY-OUT: Dividends per average share as a percentage of net attributable income per average share (*) |
19.53 | % | 20.22 | % | 46.55 | % | ||||||
| Average stockholders’ equity as a percentage of average total assets |
6.24 | % | 5.88 | % | 5.65 | % | ||||||
| (*) | The pay-out ratio does not include in the numerator the amounts paid under the Santander Dividendo Elección program (scrip dividends) which are not dividends paid on account of the net attributable income of the period. Such amounts equivalent to dividends are €6,589 million, €5,920 million and €5,066 million, for 2014, 2013 and 2012, respectively. The pay-out ratio for 2014 is an estimate that includes the part of the final dividend expected to be paid in cash in May 2015. |
Interest-Earning Assets
The following table shows, by domicile of customer, the percentage mix of our average interest-earning assets for the years indicated. You should read this table in light of our observations noted in the preceding sub-section entitled “—Average Balance Sheets and Interest Rates”, and the footnotes thereto.
Interest-earning assets
| IFRS-IASB Year Ended December 31, |
||||||||||||
| 2014 | 2013 | 2012 | ||||||||||
| Cash and due from Central Banks |
||||||||||||
| Domestic |
0.16 | % | 0.58 | % | 1.78 | % | ||||||
| International |
6.88 | % | 6.93 | % | 6.35 | % | ||||||
|
|
|
|
|
|
|
|||||||
| 7.04 | % | 7.51 | % | 8.13 | % | |||||||
| Due from credit entities |
||||||||||||
| Domestic |
2.06 | % | 2.52 | % | 2.12 | % | ||||||
| International |
5.39 | % | 5.10 | % | 3.83 | % | ||||||
|
|
|
|
|
|
|
|||||||
| 7.45 | % | 7.62 | % | 5.95 | % | |||||||
| Loans and credits |
||||||||||||
| Domestic |
15.01 | % | 15.94 | % | 16.70 | % | ||||||
| International |
49.41 | % | 46.42 | % | 46.32 | % | ||||||
|
|
|
|
|
|
|
|||||||
| 64.42 | % | 62.36 | % | 63.02 | % | |||||||
| Debt securities |
||||||||||||
| Domestic |
4.09 | % | 4.96 | % | 4.40 | % | ||||||
| International |
10.10 | % | 8.42 | % | 8.15 | % | ||||||
|
|
|
|
|
|
|
|||||||
| 14.19 | % | 13.38 | % | 12.55 | % | |||||||
| Other interest-earning assets |
||||||||||||
| Domestic |
3.81 | % | 5.43 | % | 6.31 | % | ||||||
| International |
3.09 | % | 3.70 | % | 4.04 | % | ||||||
|
|
|
|
|
|
|
|||||||
| 6.90 | % | 9.13 | % | 10.35 | % | |||||||
| Total interest-earning assets |
||||||||||||
| Domestic |
25.13 | % | 29.43 | % | 31.31 | % | ||||||
| International |
74.87 | % | 70.57 | % | 68.69 | % | ||||||
|
|
|
|
|
|
|
|||||||
| 100.00 | % | 100.00 | % | 100.00 | % | |||||||
67
Table of Contents
The following tables show our short-term funds deposited with other banks at each of the dates indicated.
| IFRS-IASB Year Ended December 31, |
||||||||||||||||||||
| 2014 | 2013 | 2012 | 2011 | 2010 | ||||||||||||||||
| (in millions of euros) | ||||||||||||||||||||
| Reciprocal accounts |
1,571 | 1,858 | 1,863 | 2,658 | 1,264 | |||||||||||||||
| Time deposits |
8,177 | 16,284 | 15,669 | 11,419 | 13,548 | |||||||||||||||
| Reverse repurchase agreements |
39,807 | 29,702 | 25,486 | 10,647 | 36,721 | |||||||||||||||
| Other accounts |
32,158 | 27,120 | 30,882 | 27,002 | 28,322 | |||||||||||||||
|
|
|
|
|
|
|
|
|
|
|
|||||||||||
| 81,713 | 74,964 | 73,900 | 51,726 | 79,855 | ||||||||||||||||
| Of which impairment allowances |
(79 | ) | (37 | ) | (30 | ) | (36 | ) | (17 | ) | ||||||||||
Investment Securities
At December 31, 2014, the book value of our investment securities was €195.2 billion (representing 15% of our total assets). These investment securities had a yield of 4.51% in 2014 compared with a yield of 4.23% in 2013, and a yield of 4.69% in 2012. Approximately €39.2 billion, or 20.1%, of our investment securities at December 31, 2014 consisted of Spanish Government and government agency securities. For a discussion of how we value our investment securities, see note 2 to our consolidated financial statements.
The following tables show the book values of our investment securities by type and domicile of counterparty at each of the dates indicated.
| IFRS-IASB Year Ended December 31, |
||||||||||||
| 2014 | 2013 | 2012 | ||||||||||
| (in millions of euros) | ||||||||||||
| Debt securities |
||||||||||||
| Domestic- |
||||||||||||
| Spanish Government |
37,324 | 31,160 | 35,380 | |||||||||
| Other domestic issuer: |
||||||||||||
| Public authorities |
1,858 | 1,720 | 1,761 | |||||||||
| Other domestic issuer |
8,542 | 11,752 | 10,046 | |||||||||
|
|
|
|
|
|
|
|||||||
| Total domestic |
47,724 | 44,632 | 47,187 | |||||||||
| International- |
||||||||||||
| United States: |
||||||||||||
| U.S. Treasury and other U.S. Government agencies |
4,289 | 2,620 | 132 | |||||||||
| States and political subdivisions |
1,558 | 1,653 | 6,941 | |||||||||
| Other securities |
8,793 | 5,945 | 7,648 | |||||||||
|
|
|
|
|
|
|
|||||||
| Total United States |
14,640 | 10,218 | 14,721 | |||||||||
| Other: |
||||||||||||
| Governments |
87,190 | 55,387 | 60,149 | |||||||||
| Other securities |
26,954 | 22,416 | 19,431 | |||||||||
|
|
|
|
|
|
|
|||||||
| Total Other |
114,144 | 77,803 | 79,580 | |||||||||
|
|
|
|
|
|
|
|||||||
| Total International |
128,784 | 88,021 | 94,301 | |||||||||
| Less- Allowance for credit losses |
(144 | ) | (207 | ) | (144 | ) | ||||||
| Total Debt Securities |
176,364 | 132,446 | 141,344 | |||||||||
| Equity securities |
||||||||||||
| Domestic |
4,197 | 3,449 | 3,802 | |||||||||
| International- |
||||||||||||
| United States |
1,106 | 951 | 1,417 | |||||||||
| Other |
13,497 | 5,388 | 5,503 | |||||||||
|
|
|
|
|
|
|
|||||||
| Total international |
14,603 | 6,339 | 6,920 | |||||||||
| Total Equity Securities |
18,800 | 9,788 | 10,722 | |||||||||
| Total Investment Securities |
195,164 | 142,234 | 152,066 | |||||||||
68
Table of Contents
The following table sets out the aggregate book value and aggregate market value of the securities of single issuers, other than the Government of the United States, which exceeded 10% of our stockholders’ equity as of December 31, 2014 (and other debt securities with aggregate values near to 10% of our stockholders’ equity).
| Aggregate as of December 31, 2014 | ||||||||
| Book value | Market value | |||||||
| (in millions of euros) | ||||||||
| Debt securities: |
||||||||
| Exceed 10% of stockholders’ equity: |
||||||||
| Spanish Government and public authorities |
39,182 | 39,182 | ||||||
| Brazilian Government |
37,792 | 37,792 | ||||||
| Mexican Government |
9,071 | 9,071 | ||||||
| Portuguese Government |
8,698 | 8,698 | ||||||
| Near 10% of stockholders’ equity: |
||||||||
| U.K. Government |
7,577 | 7,577 | ||||||
| Polish Government |
6,373 | 6,373 | ||||||
The following table shows the maturities of our debt securities (before impairment allowances) as of December 31, 2014.
| Year Ended December 31, 2014 | ||||||||||||||||||||
| Maturing Within 1 Year |
Maturing Between 1 and 5 Years |
Maturing Between 5 and 10 Years |
Maturing After 10 Years |
Total | ||||||||||||||||
| Debt Securities | (in millions of euros) | |||||||||||||||||||
| Domestic: |
||||||||||||||||||||
| Spanish Government |
3,811 | 11,219 | 13,706 | 8,588 | 37,324 | |||||||||||||||
| Other domestic issuer: |
||||||||||||||||||||
| Public authorities |
855 | 439 | 493 | 71 | 1,858 | |||||||||||||||
| Other domestic issuer |
886 | 5,210 | 565 | 1,881 | 8,542 | |||||||||||||||
|
|
|
|
|
|
|
|
|
|
|
|||||||||||
| Total domestic |
5,552 | 16,868 | 14,764 | 10,540 | 47,724 | |||||||||||||||
| International: |
||||||||||||||||||||
| United States: |
||||||||||||||||||||
| U.S. Treasury and other U.S. Government agencies |
237 | 1,521 | 284 | 2,247 | 4,289 | |||||||||||||||
| States and political subdivisions |
— | 74 | 192 | 1,292 | 1,558 | |||||||||||||||
| Other securities |
578 | 2,556 | 548 | 5,111 | 8,793 | |||||||||||||||
|
|
|
|
|
|
|
|
|
|
|
|||||||||||
| Total United States |
815 | 4,151 | 1,024 | 8,650 | 14,640 | |||||||||||||||
| Other: |
||||||||||||||||||||
| Governments |
24,944 | 36,106 | 19,864 | 6,276 | 87,190 | |||||||||||||||
| Other securities |
6,943 | 10,685 | 6,978 | 2,348 | 26,954 | |||||||||||||||
|
|
|
|
|
|
|
|
|
|
|
|||||||||||
| Total Other |
31,887 | 46,791 | 26,842 | 8,624 | 114,144 | |||||||||||||||
|
|
|
|
|
|
|
|
|
|
|
|||||||||||
| Total International |
32,702 | 50,942 | 27,866 | 17,274 | 128,784 | |||||||||||||||
| Total debt investment securities |
38,254 | 67,810 | 42,630 | 27,814 | 176,508 | |||||||||||||||
69
Table of Contents
Loan Portfolio
At December 31, 2014, our total loans and advances to customers equaled €761.9 billion (60.2% of our total assets). Net of allowances for credit losses, loans and advances to customers equaled €734.7 billion at December 31, 2014 (58.0% of our total assets). In addition to loans, we had outstanding as of December 31, 2014, 2013, 2012, 2011 and 2010 €183.0 billion, €154.3 billion, €187.7 billion, €181.6 billion and €180.0 billion, respectively, of undrawn balances available to third parties.
Loans by Geographic Area and Type of Customer
The following tables illustrate our loans and advances to customers (including securities purchased under agreement to resell), by domicile and type of customer at each of the dates indicated.
| IFRS-IASB Year Ended December 31, |
||||||||||||||||||||
| 2014 | 2013 | 2012 | 2011 | 2010 | ||||||||||||||||
| (in millions of euros) | ||||||||||||||||||||
| Loans to borrowers in Spain: (**): |
||||||||||||||||||||
| Spanish Government |
17,465 | 13,374 | 16,884 | 12,147 | 12,137 | |||||||||||||||
| Commercial, financial, agricultural and industrial |
46,355 | 47,583 | 61,527 | 65,935 | 67,940 | |||||||||||||||
| Real estate and construction (*) |
24,673 | 27,158 | 29,008 | 36,260 | 38,419 | |||||||||||||||
| Other mortgages |
60,583 | 62,180 | 63,886 | 69,297 | 74,462 | |||||||||||||||
| Installment loans to individuals |
11,644 | 8,668 | 12,775 | 12,964 | 15,985 | |||||||||||||||
| Lease financing |
3,267 | 3,372 | 3,857 | 5,043 | 6,195 | |||||||||||||||
| Other |
8,384 | 11,517 | 12,077 | 12,912 | 12,475 | |||||||||||||||
|
|
|
|
|
|
|
|
|
|
|
|||||||||||
| Total |
172,371 | 173,852 | 200,014 | 214,558 | 227,613 | |||||||||||||||
| Loans to borrowers outside Spain: (**): |
||||||||||||||||||||
| Non-Spanish Governments |
7,053 | 4,402 | 4,983 | 4,394 | 3,527 | |||||||||||||||
| Commercial and industrial |
253,843 | 209,820 | 217,358 | 225,961 | 217,747 | |||||||||||||||
| Mortgage loans |
296,236 | 275,739 | 290,825 | 296,330 | 269,893 | |||||||||||||||
| Other |
32,425 | 29,946 | 31,354 | 26,104 | 23,226 | |||||||||||||||
|
|
|
|
|
|
|
|
|
|
|
|||||||||||
| Total |
589,557 | 519,907 | 544,520 | 552,789 | 514,393 | |||||||||||||||
| Total loans and advances to customers, gross |
761,928 | 693,759 | 744,534 | 767,347 | 742,007 | |||||||||||||||
| Allowance for loan losses (***) |
(27,217 | ) | (24,903 | ) | (25,422 | ) | (18,806 | ) | (19,502 | ) | ||||||||||
| Total loans and advances to customers, net of allowances |
734,711 | 668,856 | 719,112 | 748,541 | 722,504 | |||||||||||||||
| (*) | As of December 31, 2014, the portfolio of loans to real estate and construction companies included €9,349 million of loans, the proceeds of which were to be used for real estate purposes, defined in accordance with the Bank of Spain’s purpose-based classification guidelines, compared to €12,105 million, €15,867 million, €23,442 million and €27,334 million of such loans in 2013, 2012, 2011 and 2010, respectively. |
| (**) | Credit of any nature granted to credit institutions is included in the “Loans and advances to credit institutions” caption of our balance sheet. |
| (***) | Refers to loan losses of “Loans and Advances to customers”. See “Item 3. Key information—A. Selected financial data”. |
At December 31, 2014, our loans and advances to associated companies and jointly controlled entities amounted to €6,202 million (see “Item 7. Major Shareholders and Related Party Transactions—B. Related party transactions”). Excluding government-related loans and advances, the largest outstanding exposure to a single counterparty at December 31, 2014 was €2.9 billion (0.4% of total loans and advances, including government-related loans), and the five next largest exposures totaled €8.7 billion (1.2% of total loans, including government-related loans).
70
Table of Contents
Maturity
The following table sets forth an analysis by maturity of our loans and advances to customers by domicile and type of customer as of December 31, 2014.
| Maturity | ||||||||||||||||||||||||||||||||
| Less than | One to five | Over five | ||||||||||||||||||||||||||||||
| one year | years | years | Total | |||||||||||||||||||||||||||||
| Balance | % of Total | Balance | % of Total | Balance | % of Total | Balance | % of Total | |||||||||||||||||||||||||
| (in millions of euros, except percentages) | ||||||||||||||||||||||||||||||||
| Loans to borrowers in Spain: (*) |
||||||||||||||||||||||||||||||||
| Spanish Government |
4,472 | 2.40 | % | 3,993 | 2.15 | % | 9,000 | 2.31 | % | 17,465 | 2.29 | % | ||||||||||||||||||||
| Commercial, financial, agriculture and industrial |
16,745 | 8.99 | % | 15,511 | 8.35 | % | 14,099 | 3.62 | % | 46,355 | 6.08 | % | ||||||||||||||||||||
| Real estate and construction |
8,829 | 4.74 | % | 5,574 | 3.00 | % | 10,270 | 2.63 | % | 24,673 | 3.24 | % | ||||||||||||||||||||
| Other mortgages |
4,122 | 2.21 | % | 1,317 | 0.71 | % | 55,144 | 14.14 | % | 60,583 | 7.95 | % | ||||||||||||||||||||
| Installment loans to individuals |
5,346 | 2.87 | % | 4,859 | 2.62 | % | 1,439 | 0.37 | % | 11,644 | 1.53 | % | ||||||||||||||||||||
| Lease financing |
366 | 0.20 | % | 1,904 | 1.02 | % | 997 | 0.26 | % | 3,267 | 0.43 | % | ||||||||||||||||||||
| Other |
6,375 | 3.42 | % | 958 | 0.52 | % | 1,051 | 0.27 | % | 8,384 | 1.10 | % | ||||||||||||||||||||
|
|
|
|
|
|
|
|
|
|
|
|
|
|
|
|
|
|||||||||||||||||
| Total borrowers in Spain |
46,255 | 24.84 | % | 34,116 | 18.36 | % | 92,000 | 23.60 | % | 172,371 | 22.62 | % | ||||||||||||||||||||
| Loans to borrowers outside Spain: (*) |
||||||||||||||||||||||||||||||||
| Non-Spanish Governments |
3,653 | 1.96 | % | 1,469 | 0.79 | % | 1,931 | 0.50 | % | 7,053 | 0.93 | % | ||||||||||||||||||||
| Commercial and Industrial |
100,501 | 53.97 | % | 112,098 | 60.31 | % | 41,244 | 10.58 | % | 253,843 | 33.32 | % | ||||||||||||||||||||
| Mortgage loans |
12,760 | 6.85 | % | 31,650 | 17.03 | % | 251,826 | 64.59 | % | 296,236 | 38.88 | % | ||||||||||||||||||||
| Other |
23,036 | 12.37 | % | 6,522 | 3.51 | % | 2,867 | 0.74 | % | 32,425 | 4.26 | % | ||||||||||||||||||||
|
|
|
|
|
|
|
|
|
|
|
|
|
|
|
|
|
|||||||||||||||||
| Total loans to borrowers outside Spain |
139,950 | 75.16 | % | 151,739 | 81.64 | % | 297,868 | 76.40 | % | 589,557 | 77.38 | % | ||||||||||||||||||||
| Total loans and leases, gross |
186,205 | 100.00 | % | 185,855 | 100.00 | % | 389,868 | 100.00 | % | 761,928 | 100.00 | % | ||||||||||||||||||||
| (*) | Credit of any nature granted to credit institutions is included in the “Loans and advances to credit institutions” caption of our balance sheet. |
For roll-over not due to clients’ financial difficulties, the analysis is performed under standard acceptance terms and a comprehensive review of the client.
Fixed and Variable Rate Loans
The following table sets forth a breakdown of our fixed and variable rate loans having a maturity of more than one year at December 31, 2014.
| Fixed and variable rate loans having a maturity of more than one year |
||||||||||||
| Domestic | International | Total | ||||||||||
| (in millions of euros) | ||||||||||||
| Fixed rate |
23,107 | 242,153 | 265,260 | |||||||||
| Variable rate |
103,009 | 207,454 | 310,463 | |||||||||
|
|
|
|
|
|
|
|||||||
| Total |
126,116 | 449,607 | 575,723 | |||||||||
71
Table of Contents
Cross-Border Outstandings
The following table sets forth, as of the end of the years indicated, the aggregate amount of our cross-border outstandings (which consist of loans, interest-bearing deposits with other banks, acceptances and other monetary assets denominated in a currency other than the home-country currency of the office where the item is booked) where outstandings in the borrower’s country exceeded 0.75% of our total assets. Cross-border outstandings do not include local currency loans made by subsidiary banks in other countries to the extent that such loans are funded in the local currency or hedged. As a result, they do not include the vast majority of the loans by Santander UK or our Latin American subsidiaries.
| IFRS-IASB | ||||||||||||||||||||||||
| 2014 | 2013 | 2012 | ||||||||||||||||||||||
| % of total assets |
% of total assets |
% of total assets |
||||||||||||||||||||||
| (in millions of euros, except percentages) | ||||||||||||||||||||||||
| OECD (1) (2) Countries: |
||||||||||||||||||||||||
| Total OECD Countries |
11,909 | 0.94 | % | 12,518 | 1.12 | % | 19,325 | 1.52 | % | |||||||||||||||
| Non-OECD Countries: |
||||||||||||||||||||||||
| Total Latin American Countries (2) (3) |
13,751 | 1.09 | % | 10,962 | 0.98 | % | 10,861 | 0.86 | % | |||||||||||||||
| Other Non-OECD |
10,142 | 0.80 | % | 10,698 | 0.96 | % | 7,418 | 0.58 | % | |||||||||||||||
|
|
|
|
|
|
|
|
|
|
|
|
|
|||||||||||||
| Total Non-OECD |
23,893 | 1.89 | % | 21,660 | 1.94 | % | 18,279 | 1.44 | % | |||||||||||||||
|
|
|
|
|
|
|
|
|
|
|
|
|
|||||||||||||
| Total |
35,802 | 2.83 | % | 34,178 | 3.06 | % | 37,604 | 2.96 | % | |||||||||||||||
| (1) | The Organization for Economic Cooperation and Development. |
| (2) | Aggregate outstandings in any single country in this category do not exceed 0.75% of our total assets. |
| (3) | With regards to these cross-border outstandings, at December 31, 2014, 2013 and 2012, we had allowances for country-risk equal to €12.4, €14.7 million and €8.5 million, respectively. Such allowances for country-risk exceeded the Bank of Spain’s minimum requirements at such dates. |
As of December 31, 2014, 2013 and 2012, we did not have any cross-border outstanding to any single borrower that exceeded 0.75% of total assets.
Exposure to sovereign counterparties by credit rating
Our exposure to sovereign counterparties (the exposure is included in the financial statement line items “Financial assets held for trading—Debt instruments”, “Other financial assets at fair value through profit or loss—Debt instruments”, “Available for sale financial assets—Debt instruments” and “Loans and receivables—Debt instruments”) organized by credit rating and our exposure to private and sovereign debt organized by origin of the issuer is included in note 7 to the Financial Statements.
Additionally, in note 10 to our consolidated financial statements we present the disclosure by credit rating of our exposure to sovereign counterparties recorded under the caption “loans and advances to customers”.
The detail at December 31, 2014, 2013 and 2012, by type of financial instrument, of the Group’s sovereign risk exposure to Europe’s peripheral countries and of the short positions held with them, taking into consideration the criteria established by the European Banking Authority (EBA) is explained in note 51.d to our consolidated financial statements.
72
Table of Contents
Classified Assets
In the following pages, we describe the Bank of Spain’s requirements for classification of non-performing assets. The Group has established a credit loss recognition process that is independent of the process for balance sheet classification and derecognition of non-performing loans from the balance sheet.
The description below sets forth the minimum requirements that are followed and applied by all of our subsidiaries. Nevertheless, if the regulatory authority of the country where a particular subsidiary is located imposes stricter or more conservative requirements for classification of the non-performing balances, the more strict or conservative requirements are followed for classification purposes.
The classification described below applies to all debt instruments not measured at fair value through profit or loss, and to contingent liabilities.
Bank of Spain’s Classification Requirements
a) Standard Assets
Standard assets include loans, fixed-income securities, guarantees and certain other extensions of credit that are not classified in any other category. Under this category, assets that require special attention must be identified, including restructured loans and standard assets with clients that have other outstanding risks classified as Non-Performing Past Due.
b) Sub-standard Assets
This category includes all types of credits and off-balance sheet risks that cannot be classified as non-performing or charged-off assets but that have certain weaknesses that may result in losses for the bank higher than those described in the previous category. Credits and off-balance sheet risks with insufficient documentation must also be classified under this category.
c) Assets classified as non-performing due to counterparty arrears
The Bank of Spain requires Spanish banks to classify as non-performing the entire outstanding principal amount and accrued interest on any loan, fixed-income security, guarantee and certain other extensions of credit on which any payment of principal or interest or agreed cost is 90 days or more past due (“non-performing past-due assets”).
In relation to the aggregate risk exposure (including off-balance sheet risks) to a single obligor, if the amount of non-performing balances exceeds 20% of the total outstanding risks (excluding non-accrued interest on loans to such borrower), then banks must classify all outstanding risks to such borrower as non-performing.
Once any portion of a loan is classified as non-performing, the entire loan is placed on a non-accrual status. Accordingly, even the portion of any such a loan which may still be identified as performing will be recorded on non-accrual status.
73
Table of Contents
d) Assets classified as non-performing for reasons other than counterparty arrears
The Bank of Spain requires Spanish banks to classify any loan, fixed-income security, guarantee and certain other extensions of credit as non-performing if they have a reasonable doubt that these extensions of credit will be collected (“other non-performing assets”), even if any past due payments have been outstanding for less than 90 days or the asset is otherwise performing. When a bank classifies an asset as non-performing on this basis, it must classify the entire principal amount of the asset as non-performing.
Once any such asset is classified as non-performing, it is placed on a non-accrual status.
e) Charged-off Assets
Credit losses are generally recognized through provisions for allowances for credit losses, well before they are removed from the balance sheet. Under certain unusual circumstances (such as bankruptcy, insolvency, etc.), the loss is directly recognized through write-offs.
The Bank of Spain requires Spanish banks to charge-off immediately those non-performing assets that management believes will never be repaid. Otherwise, the Bank of Spain requires Spanish banks to charge-off non-performing assets four years after they were classified as non-performing. Accordingly, even if allowances have been established equal to 100% of a non-performing asset, Spanish banks may maintain that non-performing asset, fully provisioned, on their balance sheet for the full four-year period if management believes based on objective factors that there is some possibility of recoverability of that asset.
Because the Bank of Spain does not permit partial write-offs of non-performing loans, when a loan is deemed partially uncollectible, the credit loss is charged against earnings through provisions to credit allowances instead of through partial write-offs of the loan. If a loan becomes entirely uncollectible, its allowance is increased until it reaches 100% of the loan balance. The credit loss recognition process is independent of the process for the derecognition of non-performing loans from the balance sheet. The entire loan balance is kept on the balance sheet until any portion of it has been classified as non-performing for 4 years. Loans can be charged-off earlier depending on our management’s view as to the recoverability of the loan. After that period, the loan balance and its 100% specific allowance are removed from the balance sheet and recorded in off-balance sheet accounts, with no resulting impact on net income at that time.
f) Country-Risk Outstandings
The Bank of Spain requires Spanish banks to classify as country-risk outstandings all loans, fixed-income securities and other outstandings to any countries, or residents of countries, that the Bank of Spain has identified as being subject to transfer risk or sovereign risk and the remaining risks derived from the international financial activity.
All outstandings must be assigned to the country of residence of the client except in the following cases:
| • | Outstandings guaranteed by residents in other countries in a better category or by the Spanish Government Export Credit Insurer (CESCE) or by residents in Spain, should be classified in the category of the guarantor. |
| • | Fully secured loans, when the security covers sufficiently the outstanding risk and can be enforced in Spain or in any other “category 1” country, should be classified as category 1. |
| • | Outstanding risks with foreign branches of a bank should be classified according to the residence of the headquarters of those branches. |
The Bank of Spain has established six categories to classify such countries, as shown in the following table:
| Country-Risk Categories |
Description | |
| 1 | European Union, Norway, Switzerland, Iceland, USA, Canada, Japan, Australia and New Zealand | |
| 2 | Low risk countries not included in 1 | |
| 3 | Countries with transitory difficulties | |
| 4 | Countries with serious difficulties | |
| 5 | Doubtful countries | |
| 6 | Bankrupt countries | |
74
Table of Contents
The Bank of Spain allows each bank to decide how to classify the listed countries within this classification scheme, subject to the Bank of Spain’s oversight. The classification is made based on criteria such as the payment record (in particular, compliance with renegotiation agreements), the level of the outstanding debt and of the charges for debt services, the debt quotations in the international secondary markets and other indicators and factors of each country as well as all the criteria indicated by the Bank of Spain. All credit extensions and off-balance sheet risks included in country-risk categories 3 to 6, except the excluded cases described below, will be classified as follows:
| • | Sub-standard assets: All outstandings in categories 3 and 4 except when they should be classified as non-performing or charged-off assets due to credit risk attributable to the client. |
| • | Non-performing assets: All outstandings in category 5 and off-balance sheet risks classified in category 6, except when they should be classified as non-performing or charged-off assets due to credit risk attributable to the client. |
| • | Charged-off assets: All other outstandings in category 6 except when they should be classified as charged-off assets due to credit risk attributable to the client. |
Among others, the Bank of Spain excludes from country-risk outstandings:
| • | Regardless of the currency of denomination of the asset, risks with residents in a country registered in subsidiary companies in the country of residence of the holder. |
| • | Any trade credits established by letter of credit or documentary credit with a due date of one year or less after the drawdown date. |
| • | Any trade credits granted under specific export contracts with a due date of six months or less if the credits mature on the date of the export. |
| • | Any interbank obligations of branches of foreign banks in the European Union and of the Spanish branches of foreign banks. |
| • | Private sector risks in countries included in the monetary zone of a currency issued by a country classified in category 1; and |
| • | Any negotiable financial assets purchased at market prices for placement with third parties within the framework of a portfolio separately managed for that purpose, held for less than six months by the company. |
Non-Accrual of Interest Requirements
We stop accruing interest on the basis of contractual terms on the principal amount of any asset that is classified as an non-performing asset and on category 5 (doubtful) and category 6 (bankrupt) country-risk outstandings. Thereafter, we recognize the passage of time (financial effect) releasing provisions for loan losses by calculating the present value of the estimated future cash flows using the rate of interest used to discount the future cash flows for the purpose of measuring the impairment loss. On the other hand, any collected interest for any assets classified as non-performing are accounted for on a cash basis.
75
Table of Contents
The following table shows the amount of non-accrued interest owed on non-performing assets and the amount of such interest that was received:
| IFRS-IASB | ||||||||||||
| At December 31, | ||||||||||||
| 2014 | 2013 | 2012 | ||||||||||
| (in millions of euros) | ||||||||||||
| Non accrued interest on the basis of contractual terms owed on non-performing assets |
||||||||||||
| Domestic |
658 | 606 | 566 | |||||||||
| International |
1,342 | 1,294 | 1,313 | |||||||||
|
|
|
|
|
|
|
|||||||
| Total |
2,000 | 1,900 | 1,879 | |||||||||
| Non accrued interest on the basis of contractual terms received on non-performing assets |
||||||||||||
| Domestic |
202 | 190 | 190 | |||||||||
| International |
256 | 265 | 229 | |||||||||
|
|
|
|
|
|
|
|||||||
| Total |
458 | 455 | 419 | |||||||||
The balances of non-performing loans and contingent liabilities as of December 31, 2014, 2013 and 2012 are as follows:
| Millions of Euros | ||||||||||||
| 2014 | 2013 | 2012 | ||||||||||
| Non-performing loans more than ninety days past due |
29,810 | 30,832 | 31,326 | |||||||||
| Other non-performing loans and contingent liabilities (*) |
11,899 | 10,820 | 4,735 | |||||||||
|
|
|
|
|
|
|
|||||||
| Total non-performing loans and contingent liabilities |
41,709 | 41,652 | 36,061 | |||||||||
| (*) | See above “—Bank of Spain’s Classification Requirements—d) Assets classified as non-performing for reasons other than counterparty arrears” for a detailed explanation of assets included under this category. |
The roll-forward of allowances (under IFRS-IASB) is shown in note 10 to our consolidated financial statements.
Guarantees
The Bank of Spain requires certain guarantees to be classified as non-performing in the following situations:
| • | in cases involving past-due guaranteed loans and advances: (i) for non-financial guarantees, the amount demanded by the beneficiary and outstanding under the guarantee; and (ii) for financial guarantees, at least the amount classified as non-performing of the guaranteed risk; and |
| • | in all other cases, the entire amount of the guaranteed debt when the debtor has declared bankruptcy or has demonstrated serious solvency problems, even if the guaranteed beneficiary has not reclaimed payment. |
Allowances for Credit Losses and Country-Risk Requirements
The Bank of Spain requires that we develop internal models to manage credit risk and to calculate the allowances for both credit risk and country-risk based on historical experience. We detail below the main characteristics of our internal models.
Since 1993 we have used our internal models for assigning solvency and internal ratings, which measure the degree of risk of a client or transaction. Each rating corresponds to a certain probability of default or non-payment, the result of the Group’s past experience, except for some designated low default portfolios. We have different internal rating models for risk admission and monitoring (differentiating between segments; models for corporate, sovereign, financial institutions; medium and small companies, retail, etc.).
76
Table of Contents
The ratings accorded to customers are regularly reviewed, incorporating new financial information and the experience in the development of the banking relationship with the customer. The regularity of the reviews increases in the case of clients who reach certain levels in the automatic warning systems and for those classified as special watch. The rating tools are also reviewed so that Group’s accuracy can be fine-tuned.
In order to make the internal ratings of the various models comparable and to be able to make comparisons with the ratings of external rating agencies, the Group has a master ratings scale. The comparisons are established via the probability of default associated with each rating.
The process of credit rating and parameter estimation
Credit risk measurement quantification requires following two steps; the first one is the estimation, and the second one is the assignment of the parameters that define the credit risk: Probability of Default, Loss Given Default and Exposure at Default.
We cover our losses inherent in loans and advances not measured at fair value through profit or loss and in contingent liabilities taking into account the historical experience of impairment and other circumstances known at the time of assessment. For these purposes, impairment losses are losses incurred at the reporting date, calculated using statistical methods.
The parameters necessary for its calculation, with the corresponding adjustment are also used to calculate economic capital and to calculate BIS III regulatory capital under internal models.
Incurred loss is the cost of the credit risk of a transaction that will manifest within a one year lead time from the balance sheet date due to an event that had already occurred at the assessment date and considering the characteristics of the counterparty and the guarantees and collateral associated with the transaction.
The incurred loss is calculated using statistical models that consider the following three factors: “exposure at default”, “probability of default” and “loss given default”.
| • | Exposure at default (EaD) is the amount of risk exposure at the date of default by the counterparty. |
| • | Probability of default (PD) is the probability of the counterparty failing to meet its principal and/or interest payment obligations. The probability of default is associated with the rating/scoring of each counterparty/transaction. PD estimation is based on the Group’s own internal experience, i.e. the historical records of default for each rating as well as the recoveries experience regarding non-performing loans: |
| • | In portfolios where the internal experience of defaults is scant, such as banks, sovereigns or global wholesale banking, estimates of the parameters come from alternative sources: market prices or studies of outside agencies which draw on the shared experience of a sufficient number of institutions. These portfolios are called low default portfolios. |
| • | For the rest of portfolios, estimates are based on our own internal experience. |
PD is measured using a time horizon of one year; i.e. it quantifies the probability of the counterparty defaulting in the coming year due to an event that had already occurred at the assessment date. The calculation of PD considers both to loans that are past-due by 90 days or more and cases in which there is no default but there are doubts as to the solvency of the counterparty (subjective non-performing assets).
| • | Loss given default (“LGD”) is the loss arising in the event of default. It depends mainly on the present value of credit enhancements, such as collateral and guarantees associated with the transaction and other future flow that are expected to be recovered. The LGD calculation is based on the analysis of recoveries of past due transactions, considering not only revenues and loans associated with the collection process, but also the moment when these revenues and costs take place and all direct costs linked to the collecting activity. |
Once estimated, the credit risk parameters are assigned to assets that are not past due and play an essential role in the risk management and decision taking processes. These parameters, with the corresponding adjustments, are used by several management tools such as (1) pre-classifications, (2) economic capital, (3) return on risk adjusted capital (“RORAC”), or (4) stress scenarios.
77
Table of Contents
Control of the process
Internal validation is a prerequisite for supervisory validation and consists of a specialized and sufficiently independent unit forming a technical opinion on whether the internal model is appropriate for the purposes used (internal and regulatory) and drawing conclusions on its usefulness and effectiveness. Moreover, it must evaluate whether the risk management and control procedures are appropriate for the entity’s strategy and risk profile.
Grupo Santander’s corporate framework of internal validation is fully aligned with the criteria for internal validation of advanced models issued by the Bank of Spain. The criterion of separation of functions is maintained between Internal Validation and Internal Audit which, as the last element of control in the Group, is responsible for reviewing the methodology, tools and work done by Internal Validation and to give its opinion on its degree of effective independence.
The calculation obtained based on the output from the internal models described above reflects the best estimate of the Group as to probable credit losses and constitute an appropriate basis for determining loan loss allowances.
As of July 2008, the Bank of Spain approved the Group’s internal models for regulatory capital calculation purposes with respect to the vast majority of the Group’s credit risk net exposure. The Bank of Spain continues to review the models for the purpose of calculating allowances for loan losses.
While these models are not yet approved by the Bank of Spain for loan loss allowance calculation, we are required to calculate the allowances according to the instructions described below:
a. Specific allowance (individual):
The allowance for debt instruments not measured at fair value through profit or loss that are classified as non-performing is generally recognized in accordance with the criteria set forth below:
i. Assets classified as non-performing due to counterparty arrears:
Debt instruments, whoever the obligor and whatever the guarantee or collateral, with amounts more than three months past due are assessed individually. The allowances percentages are determined taking into account the age of the past-due amounts, the guarantees or collateral provided and the financial situation of the counterparty and the guarantors. Loans are identified as non-performing and income no longer accrued when it is determined that collection of interest or principal is non-performing or when the interest or principal has been past due for 90 days or more, unless the loan is well secured and in the process of collection. According to Bank of Spain’s requirements, all non-performing loans not guaranteed by effective collateral must be fully provisioned (hence all the credit loss recognized) when they are more than 12 months overdue.
ii. Assets classified as non-performing for reasons other than counterparty arrears:
Debt instruments which are not classifiable as non-performing due to arrears but for which there are reasonable doubts as to their repayment under the contractual terms are assessed individually, and their allowance is the difference between the amount recognized in assets and the present value of the cash flows expected to be received.
b. General allowance for inherent losses (collective):
Based on its experience and on the information available to it on the Spanish banking industry, the Bank of Spain has established various categories of debt instruments and contingent liabilities, classified as standard risk, which are recognized at Spanish entities or relate to transactions performed on behalf of residents in Spain which are recognized in the accounting records of foreign subsidiaries, and has applied a range of required allowances to each category.
c. Country risk allowance:
78
Table of Contents
Country risk is considered to be the risk associated with counterparties resident in a given country due to circumstances other than normal commercial risk (sovereign risk, transfer risk and risks arising from international financial activity). Based on the countries’ economic performance, political situation, regulatory and institutional framework, and payment capacity and record, the Group classifies all the transactions performed with third parties into six different groups, from group 1 (transactions with ultimate obligors resident in European Union countries, Norway, Switzerland, Iceland, the United States, Canada, Japan, Australia and New Zealand) to group 6 (transactions the recovery of which is considered remote due to circumstances attributable to the country), assigning to each group the credit loss allowance percentages resulting from the aforementioned analyses. However, due to the size of the Group and to the proactive management of its country risk exposure, the allowances recognized in respect of country risk are not material with respect to the credit loss allowances recognized.
The difference between loan loss provisions calculated using internal models and those calculated under Bank of Spain Guidance, was not material for any of the three years ended December 31, 2014, 2013 and 2012.
Guarantees
Provisions for non-performing guarantees will be equal to the amount that, using prudent criteria, is considered irrecoverable.
Bank of Spain’s Foreclosed Assets Requirements
If a Spanish bank eventually acquires the properties (residential or not) which secure loans or credits, the Bank of Spain requires that the value of the foreclosed assets should be the lesser of the amount of the debt net of allowances (which shall be at least 10% of the value) and the fair value of the foreclosed assets less the estimated selling costs (which shall be at least 10% of such value).
After the initial recognition of a foreclosed assets, the Bank of Spain establishes that if the fair value of the foreclosed asset less the estimated selling cost is lower than the carrying amount, the entity should recognize the corresponding impairment.
The Bank of Spain considers the amount of time acquired assets have been held is a clear indication of impairment. Accordingly, it determines that Spanish entities will recognize impairment (unless the bids received indicate a higher amount) at least as large as the amount resulting from applying the following discounts to the initial valuation:
| Terms from acquisition |
% Coverage | |||
| Over 12 months |
20 | |||
| Over 24 month |
30 | |||
| Over 36 month |
40 | |||
For the purpose of ensuring that the provisions determined in accordance with the above-mentioned policy are reasonable under IFRS-IASB we develop an estimation of the fair value of our foreclosed assets using external valuations. The difference between both estimations was not material for any of the three years ended December 31, 2014, 2013 and 2012.
Bank of Spain’s Charge-off Requirements
The Bank of Spain does not permit non-performing assets to be partially charged-off.
The Bank of Spain requires Spanish banks to charge-off immediately those non-performing assets that management believes will never be repaid or that were made to category 6 (“bankrupt”) countries or residents of such category 6 countries. See the above sub-section entitled “—Bank of Spain’s Classification Requirements—Country-Risk Outstandings”. Otherwise, the Bank of Spain requires Spanish banks to charge-off non-performing assets four years after they were classified as non-performing. Accordingly, even if allowances have been established equal to 100% of a non-
79
Table of Contents
performing asset (in accordance with the Bank of Spain criteria discussed above), the Spanish bank may maintain that non-performing asset, fully provisioned, on its balance sheet for the full four year period if management believes based on objective factors that there is some possibility of recoverability of that asset.
80
Table of Contents
Movements in Allowances for Credit Losses
The following table analyzes movements in our allowances for credit losses and movements, by domicile of customer, for the years indicated. See “Presentation of Financial and Other Information”. For further discussion of movements in the allowances for credit losses, see “Item 5. Operating and Financial Review and Prospects—A. Operating results—Results of Operations for Santander—Impairment Losses (net)”.
| IFRS-IASB Year Ended December 31, |
||||||||||||||||||||
| 2014 | 2013 | 2012 | 2011 | 2010 | ||||||||||||||||
| (in millions of euros) | ||||||||||||||||||||
| Allowance for credit losses at beginning of year |
||||||||||||||||||||
| Borrowers in Spain |
12,279 | 11,711 | 6,907 | 6,810 | 6,993 | |||||||||||||||
| Borrowers outside Spain |
12,680 | 13,756 | 11,951 | 12,734 | 10,906 | |||||||||||||||
|
|
|
|
|
|
|
|
|
|
|
|||||||||||
| Total |
24,959 | 25,467 | 18,858 | 19,544 | 17,899 | |||||||||||||||
| Consolidation/deconsolidation of companies’ credit loss allowances (1) |
||||||||||||||||||||
| Borrowers in Spain |
— | — | — | — | — | |||||||||||||||
| Borrowers outside Spain |
— | — | (266 | ) | (1,267 | ) | — | |||||||||||||
|
|
|
|
|
|
|
|
|
|
|
|||||||||||
| Total |
— | — | (266 | ) | (1,267 | ) | — | |||||||||||||
| Net provisions for credit losses charged to income statement (2) |
||||||||||||||||||||
| Borrowers in Spain |
2,531 | 3,447 | 8,847 | 3,169 | 2,326 | |||||||||||||||
| Borrowers outside Spain |
9,326 | 8,607 | 10,992 | 9,581 | 9,078 | |||||||||||||||
|
|
|
|
|
|
|
|
|
|
|
|||||||||||
| Total |
11,857 | 12,054 | 19,839 | 12,750 | 11,404 | |||||||||||||||
| Charge-offs against credit loss allowance |
||||||||||||||||||||
| Borrowers in Spain |
(3,009 | ) | (2,580 | ) | (2,747 | ) | (2,798 | ) | (2,174 | ) | ||||||||||
| Borrowers outside Spain |
(8,818 | ) | (8,046 | ) | (8,599 | ) | (9,495 | ) | (8,582 | ) | ||||||||||
|
|
|
|
|
|
|
|
|
|
|
|||||||||||
| Total |
(11,827 | ) | (10,626 | ) | (11,346 | ) | (12,293 | ) | (10,756 | ) | ||||||||||
| Other movements |
2,332 | (1,936 | ) | (1,618 | ) | 124 | 997 | |||||||||||||
| Allowance for credit losses at end of year (3) (4) |
||||||||||||||||||||
| Borrowers in Spain |
11,264 | 12,279 | 11,711 | 6,907 | 6,810 | |||||||||||||||
| Borrowers outside Spain |
16,057 | 12,680 | 13,756 | 11,951 | 12,734 | |||||||||||||||
|
|
|
|
|
|
|
|
|
|
|
|||||||||||
| Total |
27,321 | 24,959 | 25,467 | 18,858 | 19,544 | |||||||||||||||
| Recoveries of loans previously charged off against income statement |
||||||||||||||||||||
| Borrowers in Spain |
296 | 395 | 272 | 297 | 201 | |||||||||||||||
| Borrowers outside Spain |
1,040 | 673 | 1,044 | 1,487 | 979 | |||||||||||||||
|
|
|
|
|
|
|
|
|
|
|
|||||||||||
| Total |
1,336 | 1,068 | 1,316 | 1,784 | 1,180 | |||||||||||||||
| Average loans outstanding |
||||||||||||||||||||
| Borrowers in Spain |
164,517 | 178,227 | 198,643 | 217,235 | 224,642 | |||||||||||||||
| Borrowers outside Spain |
541,635 | 519,037 | 550,730 | 511,964 | 480,885 | |||||||||||||||
|
|
|
|
|
|
|
|
|
|
|
|||||||||||
| Total |
706,152 | 697,264 | 749,373 | 729,199 | 705,527 | |||||||||||||||
| Net charge-offs against loan loss allowance to average loans ratio (5) |
||||||||||||||||||||
| Borrowers in Spain |
1.65 | % | 1.23 | % | 1.25 | % | 1.15 | % | 0.88 | % | ||||||||||
| Borrowers outside Spain |
1.44 | % | 1.42 | % | 1.37 | % | 1.56 | % | 1.58 | % | ||||||||||
|
|
|
|
|
|
|
|
|
|
|
|||||||||||
| Total |
1.49 | % | 1.37 | % | 1.34 | % | 1.44 | % | 1.36 | % | ||||||||||
81
Table of Contents
| (1) | The negative net balance in 2011 is related to the deconsolidation of Santander Consumer USA Inc. (SCUSA) which was accounted for by the equity method in December 2011. See “Item 4. Information on the Company—A. History and development of the company—Principal Capital Expenditures and Divestitures—Acquisitions, Dispositions and Reorganizations—Santander Consumer USA”. |
| (2) | We have not included a separate line item for charge-offs of loans not previously provided for (loans charged-off against income) as these are not permitted. |
| (3) | Allowances for the impairment losses on the assets making up the balances of “Loans and receivables—Loans and advances to customers”, “Loans and receivables—Loans and advances to credit institutions” and “Loans and receivables—Debt securities”. See “Item 3. Key information—A. Selected financial data”. |
| (4) | The segregation of the allowance for credit losses between Spain and outside Spain was made by geographical location of the Group’s company that accounts for the risk. |
| (5) | For the purpose of calculating the ratio, net charge-offs consist of charge-offs against credit loss allowance less Recoveries of loans previously charged-off. |
The net charge-offs against loan loss allowance to average loans ratio was lower in Spain than in foreign jurisdictions as of December 31, 2013, 2012, 2011 and 2010 primarily due to the different mix of products of our credit portfolio in the various countries in which we operate (our mortgage portfolio is focused in Spain and United Kingdom while in Latin America (including Brazil) the main products are non-collateral loans (credit cards or consumer loans)). This means that the amount of loan write-offs contributed each year by these countries is far higher than in Spain, since these entities of the Group have fewer possibilities of recovering the loans once they have fallen into arrears.
However, as of December 31, 2014, there has been a reversal in this trend due both to an increase in charge-offs in Spain together with a reduction in the average loan volumes in Spain. The balance of loans to businesses and households in Spain declined, due to the deleveraging in some sectors and the increased number of debt issuances by large companies.
82
Table of Contents
The table below shows a breakdown of recoveries, net provisions and charge-offs against credit loss allowance by type and domicile of borrower for the years indicated.
| Year Ended December 31, | ||||||||||||||||||||
| 2014 | 2013 | 2012 | 2011 | 2010 | ||||||||||||||||
| (in millions of euros) | ||||||||||||||||||||
| Recoveries of loans previously charged off against income statement |
||||||||||||||||||||
| Domestic: |
||||||||||||||||||||
| Commercial, financial, agricultural, industrial |
104 | 236 | 85 | 135 | 41 | |||||||||||||||
| Real estate and construction |
77 | 80 | 38 | 31 | 32 | |||||||||||||||
| Other mortgages |
5 | 7 | 10 | 37 | 32 | |||||||||||||||
| Installment loans to individuals |
91 | 48 | 137 | 92 | 89 | |||||||||||||||
| Lease finance |
18 | 19 | — | 1 | 1 | |||||||||||||||
| Other |
1 | 5 | 2 | 1 | 6 | |||||||||||||||
|
|
|
|
|
|
|
|
|
|
|
|||||||||||
| Total Borrowers in Spain |
296 | 395 | 272 | 297 | 201 | |||||||||||||||
| Borrowers outside Spain |
||||||||||||||||||||
| Government and official institutions |
— | — | — | — | 4 | |||||||||||||||
| Commercial and industrial |
932 | 575 | 877 | 1,208 | 877 | |||||||||||||||
| Mortgage loans |
79 | 78 | 79 | 197 | 72 | |||||||||||||||
| Other |
29 | 20 | 88 | 82 | 26 | |||||||||||||||
| Borrowers outside Spain |
1,040 | 673 | 1,044 | 1,487 | 979 | |||||||||||||||
|
|
|
|
|
|
|
|
|
|
|
|||||||||||
| Total |
1,336 | 1,068 | 1,316 | 1,784 | 1,180 | |||||||||||||||
| Net provisions for credit losses charged to income statement |
||||||||||||||||||||
| Domestic: |
||||||||||||||||||||
| Commercial, financial, agricultural, industrial |
989 | 1,842 | 1,290 | 1,070 | 688 | |||||||||||||||
| Real estate and construction |
282 | 176 | 5,378 | 672 | 706 | |||||||||||||||
| Other mortgages |
818 | 587 | 1,291 | 818 | 164 | |||||||||||||||
| Installment loans to individuals |
352 | 745 | 709 | 489 | 663 | |||||||||||||||
| Lease finance |
52 | 52 | 57 | 122 | 83 | |||||||||||||||
| Other |
38 | 45 | 122 | (2 | ) | 22 | ||||||||||||||
|
|
|
|
|
|
|
|
|
|
|
|||||||||||
| Total Borrowers in Spain |
2,531 | 3,447 | 8,847 | 3,169 | 2,326 | |||||||||||||||
| Borrowers outside Spain |
||||||||||||||||||||
| Government and official institutions |
9 | 1 | — | (4 | ) | 48 | ||||||||||||||
| Commercial and industrial |
8,824 | 7,772 | 9,673 | 7,962 | 8,134 | |||||||||||||||
| Mortgage loans |
28 | 553 | 624 | 1,163 | 525 | |||||||||||||||
| Other |
465 | 281 | 695 | 460 | 371 | |||||||||||||||
|
|
|
|
|
|
|
|
|
|
|
|||||||||||
| Borrowers outside Spain |
9,326 | 8,607 | 10,992 | 9,581 | 9,078 | |||||||||||||||
|
|
|
|
|
|
|
|
|
|
|
|||||||||||
| Total |
11,857 | 12,054 | 19,839 | 12,750 | 11,404 | |||||||||||||||
| Charge-offs against credit loss allowance |
||||||||||||||||||||
| Domestic: |
||||||||||||||||||||
| Commercial, financial, agricultural, industrial |
(1,439 | ) | (893 | ) | (755 | ) | (980 | ) | (704 | ) | ||||||||||
| Real estate and construction |
(787 | ) | (717 | ) | (676 | ) | (133 | ) | (191 | ) | ||||||||||
| Other mortgages |
(198 | ) | (278 | ) | (400 | ) | (592 | ) | (369 | ) | ||||||||||
| Installment loans to individuals |
(506 | ) | (593 | ) | (839 | ) | (870 | ) | (841 | ) | ||||||||||
| Lease finance |
(22 | ) | (60 | ) | (27 | ) | (220 | ) | (61 | ) | ||||||||||
| Other |
(57 | ) | (39 | ) | (50 | ) | (3 | ) | (8 | ) | ||||||||||
|
|
|
|
|
|
|
|
|
|
|
|||||||||||
| Total Borrowers in Spain |
(3,009 | ) | (2,580 | ) | (2,747 | ) | (2,798 | ) | (2,174 | ) | ||||||||||
| Borrowers outside Spain |
||||||||||||||||||||
| Government and official institutions |
— | — | — | — | (43 | ) | ||||||||||||||
| Commercial and industrial |
(8,162 | ) | (7,130 | ) | (7,402 | ) | (8,445 | ) | (7,994 | ) | ||||||||||
| Mortgage loans |
(277 | ) | (459 | ) | (477 | ) | (791 | ) | (445 | ) | ||||||||||
| Other |
(379 | ) | (457 | ) | (720 | ) | (259 | ) | (100 | ) | ||||||||||
|
|
|
|
|
|
|
|
|
|
|
|||||||||||
| Borrowers outside Spain |
(8,818 | ) | (8,046 | ) | (8,599 | ) | (9,495 | ) | (8,582 | ) | ||||||||||
|
|
|
|
|
|
|
|
|
|
|
|||||||||||
| Total |
(11,827 | ) | (10,626 | ) | (11,346 | ) | (12,293 | ) | (10,756 | ) | ||||||||||
The table below shows a breakdown of allowances for credit losses by type and domicile of borrower for the years indicated.
83
Table of Contents
Allowances for Credit Losses
| IFRS-IASB Year Ended December 31, |
||||||||||||||||||||||||||||||||||||||||
| 2014 | % | 2013 | % | 2012 | % | 2011 | % | 2010 | % | |||||||||||||||||||||||||||||||
| (in millions of euros, except percentages) | ||||||||||||||||||||||||||||||||||||||||
| Borrowers in Spain: |
||||||||||||||||||||||||||||||||||||||||
| Commercial, financial, agricultural, industrial |
2,354 | 8.62 | 2,681 | 10.74 | 1,775 | 6.97 | 1,579 | 8.37 | 1,499 | 7.67 | ||||||||||||||||||||||||||||||
| Real estate and construction (*) |
4,749 | 17.38 | 6,678 | 26.76 | 7,511 | 29.49 | 3,210 | 17.02 | 2,723 | 13.93 | ||||||||||||||||||||||||||||||
| Other mortgages |
3,254 | 11.91 | 1,810 | 7.25 | 1,420 | 5.58 | 1,325 | 7.03 | 1,329 | 6.80 | ||||||||||||||||||||||||||||||
| Installment loans to individuals |
703 | 2.57 | 967 | 3.87 | 823 | 3.23 | 690 | 3.66 | 1,065 | 5.45 | ||||||||||||||||||||||||||||||
| Lease finance |
121 | 0.44 | 113 | 0.46 | 103 | 0.40 | 101 | 0.54 | 169 | 0.87 | ||||||||||||||||||||||||||||||
| Other |
83 | 0.31 | 30 | 0.12 | 79 | 0.31 | 2 | 0.01 | 25 | 0.13 | ||||||||||||||||||||||||||||||
|
|
|
|
|
|
|
|
|
|
|
|
|
|
|
|
|
|
|
|
|
|||||||||||||||||||||
| Total Borrowers in Spain |
11,264 | 41.23 | 12,279 | 49.20 | 11,711 | 45.98 | 6,907 | 36.62 | 6,810 | 34.85 | ||||||||||||||||||||||||||||||
| Borrowers outside Spain: |
||||||||||||||||||||||||||||||||||||||||
| Government and official institutions |
36 | 0.13 | 21 | 0.08 | 30 | 0.12 | 31 | 0.17 | 31 | 0.16 | ||||||||||||||||||||||||||||||
| Commercial and industrial |
13,218 | 48.38 | 9,765 | 39.12 | 10,628 | 41.74 | 9,334 | 49.50 | 9,811 | 50.20 | ||||||||||||||||||||||||||||||
| Mortgage loans |
2,043 | 7.48 | 2,223 | 8.91 | 2,054 | 8.06 | 1,791 | 9.50 | 1,876 | 9.60 | ||||||||||||||||||||||||||||||
| Other |
760 | 2.78 | 671 | 2.69 | 1,043 | 4.10 | 795 | 4.21 | 1,016 | 5.20 | ||||||||||||||||||||||||||||||
|
|
|
|
|
|
|
|
|
|
|
|
|
|
|
|
|
|
|
|
|
|||||||||||||||||||||
| Total Borrowers outside Spain |
16,057 | 58.77 | 12,680 | 50.80 | 13,756 | 54.02 | 11,951 | 63.38 | 12,734 | 65.15 | ||||||||||||||||||||||||||||||
|
|
|
|
|
|
|
|
|
|
|
|
|
|
|
|
|
|
|
|
|
|||||||||||||||||||||
| Total |
27,321 | 100.00 | 24,959 | 100.00 | 25,467 | 100.00 | 18,858 | 100.00 | 19,544 | 100.00 | ||||||||||||||||||||||||||||||
| (*) | As of December 31, 2014, the allowances of the portfolio of loans to construction and property development companies with real estate purposes, defined in accordance with the Bank of Spain’s purpose-based classification guidelines, amounted to €3,974 million. In this table and in the previous one, loans to construction and property development companies are defined as loans granted to companies that belong to that sector, irrespective of the purpose of the loan. |
Non-performing Balances
The following tables show our non-performing assets (loans and other assets to collect) and contingent liabilities, excluding country-risk.
| IFRS-IASB At December 31, |
||||||||||||||||||||
| Non-performing balances | 2014 | 2013 | 2012 | 2011 | 2010 | |||||||||||||||
| (in millions of euros) | ||||||||||||||||||||
| Past-due and other non-performing balances (1) (2) (3): |
||||||||||||||||||||
| Domestic |
20,891 | 22,658 | 16,623 | 15,340 | 12,474 | |||||||||||||||
| International |
20,818 | 18,994 | 19,438 | 16,666 | 16,004 | |||||||||||||||
|
|
|
|
|
|
|
|
|
|
|
|||||||||||
| Total |
41,709 | 41,652 | 36,061 | 32,006 | 28,478 | |||||||||||||||
| (1) | The total amount of our non-performing balances fully provisioned under IFRS was €5,255 million, €5,312 million, €5,176 million, €5,106 million, and €4,843 million, at December 31, 2014, 2013, 2012, 2011, and 2010, respectively. |
| (2) | Non-performing balances due to country risk were €7 million, €3 million, €6 million, €7 million, and €8 million, at December 31, 2014, 2013, 2012, 2011, and 2010, respectively. |
| (3) | At December 31, 2014, 2013, 2012, 2011, and 2010 (i) the total amount of our non-performing past-due balances was €29,810 million, €30,832 million, €31,326 million, €27,415 million, and €23,606 million, respectively, and (ii) the total amount of our other non-performing was €11,899 million, €10,820 million, €4,735 million, €4,591 million, and €4,872 million, respectively. |
We do not believe that there is a material amount of assets not included in the foregoing table where known information about credit risk at December 31, 2014 (not related to transfer risk inherent in cross-border lending activities) gave rise to serious doubts as to the ability of the borrowers to comply with the loan repayment terms at such date.
84
Table of Contents
The following table shows our financial assets classified as loans and receivables which are considered to be non-performing due to credit risk at December 31, 2014, classified by geographical location of risk and by age of the oldest past-due amount (see note 10.d, to our consolidated financial statements):
| Millions of euros | ||||||||||||||||||||||||
| With no past-due balances or less than 3 months past due |
With balances past due by | |||||||||||||||||||||||
| 3 to 6 months |
6 to 9 months |
9 to 12 months |
More than 12 months |
Total | ||||||||||||||||||||
| Spain |
6,664 | 2,764 | 909 | 866 | 9,404 | 20,607 | ||||||||||||||||||
| European Union (excluding Spain) |
2,027 | 2,520 | 908 | 767 | 3,532 | 9,754 | ||||||||||||||||||
| United States and Puerto Rico |
661 | 626 | 58 | 29 | 329 | 1,703 | ||||||||||||||||||
| Other OECD countries |
272 | 1,364 | 259 | 239 | 1,726 | 3,860 | ||||||||||||||||||
| Latin America (no OECD) |
1,324 | 338 | 933 | 841 | 1,012 | 4,448 | ||||||||||||||||||
| Rest of the world |
— | — | — | — | — | — | ||||||||||||||||||
|
|
|
|
|
|
|
|
|
|
|
|
|
|||||||||||||
| 10,948 | 7,612 | 3,067 | 2,742 | 16,003 | 40,372 | |||||||||||||||||||
Evolution of Non-performing Balances
The following tables show the movement in our non-performing assets and contingent liabilities (excluding country risk, see “—Country-Risk Outstandings” herein).
| IFRS-IASB | ||||||||||||||||||||||||||||||||||||
| (in millions of euros) | Quarter ended | Year ended Dec. 31, |
Year ended Dec. 31, |
Year ended Dec. 31, |
Year ended Dec. 31, |
Year ended Dec. 31, |
||||||||||||||||||||||||||||||
| Mar. 31, 2014 |
Jun. 30, 2014 |
Sep. 30, 2014 |
Dec. 31, 2014 |
2014 | 2013 | 2012 | 2011 | 2010 | ||||||||||||||||||||||||||||
| Opening balance |
41,652 | 42,300 | 42,334 | 41,727 | 41,652 | 36,061 | 32,006 | 28,478 | 24,554 | |||||||||||||||||||||||||||
| Increases |
6,612 | 7,645 | 6,682 | 7,866 | 28,805 | 37,316 | 34,983 | 34,379 | 31,764 | |||||||||||||||||||||||||||
| Cash recoveries |
(3,762 | ) | (4,746 | ) | (4,377 | ) | (4,898 | ) | (17,783 | ) | (17,863 | ) | (16,298 | ) | (15,466 | ) | (15,802 | ) | ||||||||||||||||||
| Foreclosed assets |
(314 | ) | (364 | ) | (347 | ) | (345 | ) | (1,370 | ) | (1,857 | ) | (2,146 | ) | (2,791 | ) | (2,484 | ) | ||||||||||||||||||
| Changes in scope of consolidation |
327 | 0 | 0 | 170 | 497 | 743 | (628 | ) | 69 | 55 | ||||||||||||||||||||||||||
| Exchange differences and others |
685 | 292 | 464 | 294 | 1,735 | (2,122 | ) | (509 | ) | (370 | ) | 1,147 | ||||||||||||||||||||||||
| Write-offs |
(2,900 | ) | (2,793 | ) | (3,029 | ) | (3,105 | ) | (11,827 | ) | (10,626 | ) | (11,347 | ) | (12,293 | ) | (10,756 | ) | ||||||||||||||||||
| Closing balance |
42,300 | 42,334 | 41,727 | 41,709 | 41,709 | 41,652 | 36,061 | 32,006 | 28,478 | |||||||||||||||||||||||||||
85
Table of Contents
Non-performing Balances Ratios
The following table shows the total amount of our computable credit risk, our non-performing assets and contingent liabilities by category, our allowances for credit losses, the ratio of our non-performing balances to total computable credit risk and our coverage ratio at the dates indicated.
| IFRS-IASB At December 31, |
||||||||||||||||||||
| 2014 | 2013 | 2012 | 2011 | 2010 | ||||||||||||||||
| (in millions of euros, except percentages) | ||||||||||||||||||||
| Computable credit risk (1) |
804,084 | 738,558 | 793,449 | 820,968 | 802,192 | |||||||||||||||
| Non-performing balances by category: |
||||||||||||||||||||
| Individuals |
17,251 | 17,607 | 16,828 | 15,951 | 15,562 | |||||||||||||||
| Mortgages |
9,022 | 9,609 | 7,281 | 6,872 | 6,304 | |||||||||||||||
| Consumer loans |
5,874 | 5,129 | 5,961 | 6,254 | 6,487 | |||||||||||||||
| Credit cards and others |
2,355 | 2,869 | 3,586 | 2,825 | 2,771 | |||||||||||||||
| Enterprises |
21,648 | 21,538 | 18,155 | 14,995 | 11,321 | |||||||||||||||
| Corporate Banking |
2,643 | 2,408 | 991 | 954 | 1,550 | |||||||||||||||
| Public sector |
167 | 99 | 87 | 106 | 45 | |||||||||||||||
| Total non-performing balances |
41,709 | 41,652 | 36,061 | 32,006 | 28,478 | |||||||||||||||
| Allowances for non-performing balances |
28,046 | 25,681 | 26,112 | 19,531 | 20,552 | |||||||||||||||
| Ratios |
||||||||||||||||||||
| Non-performing balances (2) to computable credit risk |
5.19 | % | 5.64 | % | 4.54 | % | 3.90 | % | 3.55 | % | ||||||||||
| Coverage ratio (3) |
67.24 | % | 61.65 | % | 72.41 | % | 61.02 | % | 72.17 | % | ||||||||||
| Balances charged-off to total loans and contingent liabilities |
1.30 | % | 1.29 | % | 1.27 | % | 1.29 | % | 1.21 | % | ||||||||||
| (1) | Computable credit risk is the sum of the face amounts of loans and advances (including non-performing assets but excluding country risk loans), guarantees and documentary credits. |
| (2) | Non-performing loans and contingent liabilities, securities and other assets to collect. |
| (3) | Allowances for non-performing balances as a percentage of non-performing balances. |
Non-performing loan (NPL) balances increased slightly by €57 million to €41,709 million compared to 2013. Net NPL entries in 2014 amounted to €9,652 million, which is a €7,944 million decrease as compared to 2013. This decrease in new NPLs arose in all countries, particularly in Spain, Portugal, Poland, the U.K. and Chile. This decrease offset the perimeter impact of €497 million relating to the full consolidation of SCUSA (which was previously accounted for by the equity method), the purchase of Financiera el Corte Ingles and the acquisition of GE Money’s business in Norway, Sweden and Denmark. See “—A. History and development of the company—Principal Capital Expenditures and Divestitures—Acquisitions, Dispositions, Reorganizations”.
The balance of NPL, together with the level of lending, brought the Group’s NPL ratio to 5.19%, 45 basis points lower than in 2013 and the first decline since the start of the financial crisis. The NPL coverage ratio of 67.24% at December 31, 2014 represented an increase of 559 basis points compared to the coverage ratio at the end of 2013. This ratio is calculated as allowances for non-performing balances as a percentage of non-performing balances.
The increase in non-performing balances is also aggravated through the classification as non-performing of the entire outstanding principal amount and accrued interest on any loan on which any payment of principal, interest or agreed cost is 90 days or more past due. We refer to this effect as the “individual loan drag effect”. An additional impact occurs by the so-called “client drag effect”, through which Spanish banking groups classify as non-performing the aggregate risk exposure (including off-balance sheet risks) to a single obligor, whenever the amount of non-performing balances of such obligor exceeds 25% of its total outstanding risks (excluding non-accrued interest on loans to such borrower). Both drag effects have a larger impact in the case of mortgages and corporate loans due to the greater average amount of these loans.
The NPL ratios by country as of December 31, 2014 are set out below1.
| 1 | For further details on credit risk refer to “Item 11. Quantitative and qualitative disclosures about market risk—Part 4. Credit risk”. |
86
Table of Contents
| • | Continental Europe |
| • | Spain’s NPL ratio was 7.38% at the end of 2014, 11 basis points lower than at the end of 2013, despite the reduction in the denominator and due to the favorable evolution of NPLs, mainly in the companies segment. The coverage ratio increased to 46% at the end of 2014. |
| • | Portugal ended the year with an NPL ratio of 8.89%, 77 basis points higher than at the end of 2013. The ratio was partly affected by the decline in lending, in line with the financial system’s deleveraging process. The coverage ratio of 52% at the end of 2014 was 2 percentage points higher than at the end of 2013. |
| • | Poland’s NPL ratio fell to 7.42%, a 42 basis point decrease compared to the end of 2013, and is on a path of normalization after the rise in 2013 following the integration of Kredyt Bank. The coverage ratio at December 31, 2014 was 60%. |
| • | Santander Consumer’s NPL ratio, after the acquisition of GE Money, was 4.82%, with a good general performance of portfolios in all countries. The coverage ratio at December 31, 2014 was 100%. |
| • | The U.K. reduced its NPL ratio to 1.79% (-19 basis points), due to good performance in all segments, particularly retail and especially the mortgage portfolio. The coverage ratio increased to 42% (0.3 percentage points more than 2013). |
| • | Latin America |
| • | Brazil’s NPL ratio fell to 5.05% (-59 basis points), with positive performance in most portfolios. The coverage ratio was 95%. |
| • | Chile increased its NPL ratio 6 basis points to 5.97%, although the portfolio’s risk premium came down. The coverage ratio increased by 1.3 percentage points over the prior year to 52% at the end of 2014 and lending increased by 6% over the prior year. |
| • | Mexico’s NPL ratio increased 18 basis points to 3.84%, mainly affected by the greater regulatory requirements in the country’s financial system and a macroeconomic environment less favorable than anticipated. The coverage ratio dropped 11 percentage points to 86% at the end of 2014. |
| • | The United States’ NPL ratio declined 6 basis points to 2.54% and the coverage ratio rose to 193%, an increase of 106 percentage points. |
| • | The NPL ratio at Santander Bank NA was 1.41% (-82 basis points) at the end of 2014, as a result of the good performance of the retail and company portfolios, while the coverage ratio was higher at 109% at the end of 2014 compared to 93.6% at the end of 2013. |
| • | SCUSA’s cost of credit was 10.76%. The high rotation of the portfolio and the unit’s active credit management brought the NPL ratio to 3.97% and the coverage ratio increased to 296% at the end of 2014. |
| • | Puerto Rico’s NPL ratio increased 116 basis points to 7.45% and the coverage ratio dropped 6 percentage points to 56% at the end of 2014. |
Other non-accruing balances
As described previously herein under “—Bank of Spain’s Classification Requirements”, we do not classify our loans and contingent liabilities to borrowers in countries with transitory difficulties (category 3) and countries in serious difficulties (category 4) as impaired balances. Loans and contingent liabilities in these categories do not stop accruing interest. However, we treat category 5 (doubtful countries) country-risk outstandings as both a non-accruing and impaired balance.
87
Table of Contents
| Summary of non-accrual balances |
IFRS-IASB Year Ended December 31, |
|||||||||||||||||||
| 2014 | 2013 | 2012 | 2011 | 2010 | ||||||||||||||||
| (in millions of euros) | ||||||||||||||||||||
| Balances classified as non-performing balances |
41,709 | 41,652 | 36,061 | 32,006 | 28,478 | |||||||||||||||
| Non-performing balances due to country risk |
7 | 3 | 6 | 7 | 8 | |||||||||||||||
|
|
|
|
|
|
|
|
|
|
|
|||||||||||
| Total non-accruing balances |
41,716 | 41,655 | 36,067 | 32,013 | 28,486 | |||||||||||||||
Foreclosed Assets
The tables below set forth the movements in our foreclosed assets for the periods shown.
| IFRS-IASB | ||||||||||||||||||||||||||||
| Quarterly movements | Year Ended December 31, |
|||||||||||||||||||||||||||
| Mar. 31, 2014 |
Jun. 30, 2014 |
Sep. 30, 2014 |
Dec. 31, 2014 |
2014 | 2013 | 2012 | ||||||||||||||||||||||
| (in millions of euros, except percentages) | ||||||||||||||||||||||||||||
| Opening balance |
9,698 | 9,972 | 10,247 | 10,435 | 9,698 | 8,611 | 9,624 | |||||||||||||||||||||
| Foreclosures |
723 | 524 | 413 | 484 | 2,144 | 2,308 | 2,603 | |||||||||||||||||||||
| Sales |
(334 | ) | (284 | ) | (261 | ) | (428 | ) | (1,307 | ) | (1,315 | ) | (3,248 | ) | ||||||||||||||
| Other movements |
(115 | ) | 35 | 36 | 52 | 8 | 94 | (368 | ) | |||||||||||||||||||
|
|
|
|
|
|
|
|
|
|
|
|
|
|
|
|||||||||||||||
| Gross foreclosed assets |
9,972 | 10,247 | 10,435 | 10,543 | 10,543 | 9,698 | 8,611 | |||||||||||||||||||||
| Of which: in Spain |
9,196 | 9,454 | 9,648 | 9,760 | 9,760 | 8,831 | 7,846 | |||||||||||||||||||||
| Allowances established |
5,160 | 5,282 | 5,368 | 5,404 | 5,404 | 4,956 | 4,416 | |||||||||||||||||||||
| Of which: in Spain |
4,914 | 5,019 | 5,126 | 5,163 | 5,163 | 4,685 | 4,170 | |||||||||||||||||||||
|
|
|
|
|
|
|
|
|
|
|
|
|
|
|
|||||||||||||||
| Closing balance (net) |
4,812 | 4,965 | 5,067 | 5,139 | 5,139 | 4,742 | 4,195 | |||||||||||||||||||||
| Of which: in Spain |
4,282 | 4,435 | 4,522 | 4,597 | 4,597 | 4,146 | 3,676 | |||||||||||||||||||||
| Allowance as a percentage of foreclosed assets |
51.8 | % | 51.5 | % | 51.4 | % | 51.3 | % | 51.3 | % | 51.1 | % | 51.3 | % | ||||||||||||||
| Of which: in Spain |
53.4 | % | 53.1 | % | 53.1 | % | 52.9 | % | 52.9 | % | 53.1 | % | 53.1 | % | ||||||||||||||
Liabilities
Deposits
The principal components of our deposits are customer demand, time and notice deposits, and international and domestic interbank deposits. Our retail customers are the principal source of our demand, time and notice deposits. For an analysis, by domicile of customer, of average domestic and international deposits by type for 2014, 2013 and 2012 see “—Average Balance Sheets and Interest Rates—Liabilities and Interest Expense”.
We compete actively with other commercial banks and with savings banks for domestic deposits. Our share of customer deposits in the Spanish banking system (including Cajas de Ahorros) was 19.8% at November 30, 2014 (most recent available data), according to figures published by the Spanish Banking Association (“AEB”) and the Confederación Española de Cajas de Ahorros (“CECA”). See “—Competition” herein.
88
Table of Contents
The following tables analyze our year-end deposits.
Deposits (from central banks and credit institutions and customers) by type of deposit.
| IFRS-IASB At December 31, |
||||||||||||
| 2014 | 2013 | 2012 | ||||||||||
| (in millions of euros) | ||||||||||||
| Deposits from central banks and credit institutions- |
||||||||||||
| Reciprocal accounts |
704 | 755 | 508 | |||||||||
| Time deposits |
85,178 | 55,839 | 92,491 | |||||||||
| Other demand accounts |
4,893 | 3,425 | 3,225 | |||||||||
| Repurchase agreements |
64,594 | 49,378 | 50,742 | |||||||||
| Central bank credit account drawdowns |
— | — | 6,000 | |||||||||
|
|
|
|
|
|
|
|||||||
| Total |
155,369 | 109,397 | 152,966 | |||||||||
| Customer deposits- |
||||||||||||
| Demand deposits- |
||||||||||||
| Current accounts |
200,752 | 167,787 | 144,305 | |||||||||
| Savings accounts |
173,105 | 164,214 | 167,389 | |||||||||
| Other demand deposits |
5,046 | 3,512 | 3,443 | |||||||||
| Time deposits- |
||||||||||||
| Fixed-term deposits |
222,756 | 225,471 | 257,583 | |||||||||
| Home-purchase savings accounts |
71 | 102 | 132 | |||||||||
| Discount deposits |
448 | 1,156 | 1,345 | |||||||||
| Hybrid financial liabilities |
3,525 | 3,324 | 3,128 | |||||||||
| Other time deposits |
484 | 463 | 590 | |||||||||
| Notice deposits |
22 | 21 | 969 | |||||||||
| Repurchase agreements |
41,418 | 41,787 | 47,755 | |||||||||
|
|
|
|
|
|
|
|||||||
| Total |
647,627 | 607,837 | 626,639 | |||||||||
| Total deposits |
802,996 | 717,234 | 779,605 | |||||||||
89
Table of Contents
Deposits (from central banks and credit institutions and customers) by geographic location of the Group entity that accounts for the deposits.
| IFRS-IASB At December 31, |
||||||||||||
| 2014 | 2013 | 2012 | ||||||||||
| (in millions of euros) | ||||||||||||
| Deposits from central banks and credit institutions- |
||||||||||||
| Due to credit institutions |
||||||||||||
| Offices in Spain |
80,805 | 49,770 | 87,053 | |||||||||
| Offices outside Spain: |
||||||||||||
| Other EU countries |
34,164 | 35,472 | 34,894 | |||||||||
| United States |
13,514 | 7,215 | 12,648 | |||||||||
| Other OECD countries (1) |
6,656 | 15 | 55 | |||||||||
| Latin America (no OECD) (1) |
20,229 | 16,924 | 18,313 | |||||||||
| Other |
1 | 1 | 3 | |||||||||
| Total offices outside Spain |
74,564 | 59,627 | 65,913 | |||||||||
|
|
|
|
|
|
|
|||||||
| Total |
155,369 | 109,397 | 152,966 | |||||||||
| Customer deposits |
||||||||||||
| Offices in Spain |
186,051 | 185,460 | 192,588 | |||||||||
| Offices outside Spain: |
||||||||||||
| Other EU countries |
275,291 | 259,903 | 261,135 | |||||||||
| United States and Puerto Rico |
51,291 | 43,773 | 45,129 | |||||||||
| Other OECD countries (1) |
55,003 | 1,879 | 788 | |||||||||
| Latin America (no OECD) (1) |
79,848 | 116,666 | 126,842 | |||||||||
| Other |
143 | 156 | 157 | |||||||||
| Total offices outside Spain |
461,576 | 422,377 | 434,051 | |||||||||
|
|
|
|
|
|
|
|||||||
| Total |
647,627 | 607,837 | 626,639 | |||||||||
|
|
|
|
|
|
|
|||||||
| Total deposits |
802,996 | 717,234 | 779,605 | |||||||||
| (1) | In this schedule Mexico and Chile are classified under “Other OECD countries” since 2014. |
The following table shows the maturity of time deposits (excluding inter-bank deposits) in denominations of $100,000 or more for the year ended December 31, 2014. Large denomination customer deposits may be a less stable source of funds than demand and savings deposits.
| Year Ended December 31, 2014 | ||||||||||||
| Domestic | International | Total | ||||||||||
| (in millions of euros) | ||||||||||||
| Under 3 months |
9,206 | 37,205 | 46,411 | |||||||||
| 3 to 6 months |
4,799 | 14,673 | 19,472 | |||||||||
| 6 to 12 months |
9,271 | 12,444 | 21,715 | |||||||||
| Over 12 months |
8,380 | 28,016 | 36,396 | |||||||||
|
|
|
|
|
|
|
|||||||
| Total |
31,656 | 92,338 | 123,994 | |||||||||
90
Table of Contents
The aggregate amount of deposits held by non-resident depositors (banks and customers) in our domestic branch network was €64 billion, €49 billion and €55 billion, at December 31, 2014, 2013 and 2012, respectively.
| Short-Term Borrowings | IFRS-IASB At December 31, |
|||||||||||||||||||||||
| 2014 | 2013 | 2012 | ||||||||||||||||||||||
| Amount | Average Rate |
Amount | Average Rate |
Amount | Average Rate |
|||||||||||||||||||
| (in millions of euros, except percentages) | ||||||||||||||||||||||||
| Securities sold under agreements to repurchase (principally Spanish Treasury notes and bills): |
||||||||||||||||||||||||
| At December 31 |
106,012 | 3.85 | % | 91,166 | 3.69 | % | 98,497 | 3.27 | % | |||||||||||||||
| Average during year |
100,771 | 4.05 | % | 109,191 | 3.08 | % | 115,755 | 3.34 | % | |||||||||||||||
| Maximum month-end balance |
110,877 | 122,226 | 133,725 | |||||||||||||||||||||
| Other short-term borrowings: |
||||||||||||||||||||||||
| At December 31 |
18,126 | 1.02 | % | 13,945 | 3.48 | % | 21,984 | 3.01 | % | |||||||||||||||
| Average during year |
18,787 | 2.58 | % | 19,329 | 2.51 | % | 19,403 | 2.74 | % | |||||||||||||||
| Maximum month-end balance |
22,686 | 23,049 | 22,304 | |||||||||||||||||||||
|
|
|
|
|
|
|
|
|
|
|
|
|
|||||||||||||
| Total short-term borrowings at year-end |
124,138 | 3.43 | % | 105,111 | 3.66 | % | 120,481 | 3.22 | % | |||||||||||||||
Competition in Spain
We face strong competition in all of our principal areas of operation from other banks, savings banks, credit co-operatives, brokerage services, on-line banks, insurance companies and other financial services firms.
Banks
At the end of November 2014 (most recent available information), Banco Bilbao Vizcaya Argentaria, S.A. and Banco Santander, S.A. accounted for approximately 52.2% of loans and 57.2% of deposits in all Spanish banks, which in turn represented 38.4% of loans and 35.8% of deposits in the Spanish financial system, according to figures published by the AEB and the CECA.
Foreign banks also have a presence in the Spanish banking system as a result of liberalization measures adopted by the Bank of Spain in 1978. At December 31, 2014, there were 86 foreign banks (of which 79 were from European Union countries) with branches in Spain. In addition, there were 24 Spanish subsidiary banks of foreign banks (of which 17 were from European Union countries).
Spanish law provides that any financial institution organized and licensed in another Member State of the European Union may conduct business in Spain from an office outside Spain. They do not need prior authorization from the Spanish authorities to do so. Once the Bank of Spain receives notice from the institution’s home country supervisory authority about the institution’s proposed activities in Spain, the institution is automatically registered and the proposed activities are automatically authorized.
The opening of a branch of any financial institution authorized in another Member State of the European Union does not need prior authorization or specific allocation of resources. The opening is subject to the reception by the Bank of Spain of a notice from the institution’s home country supervisory authority containing, at least, the following information:
| • | Program of activities detailing the transactions to be made and the corporate structure of the branch; |
| • | Address in Spain of the branch; |
| • | Name and curriculum vitae of the branch’s managers; |
| • | Shareholders’ equity and solvency ratio of the financial institution and its consolidated group; and |
| • | Detailed information about any deposit guarantee scheme that assures the protection of the branch’s depositors. |
Once the Bank of Spain receives the notice, it notifies the financial institution, thereby permitting the branch to be registered in the Mercantile Register and, then, in the Special Register of the Bank of Spain.
91
Table of Contents
Spanish Law provides that financial institutions which are not authorized in another Member State of the European Union do not benefit from the ‘Community Passport’, and are therefore required to obtain prior authorization from the Bank of Spain to operate in Spain with branches. The procedure to obtain such authorization from the Bank of Spain is similar to the one set up in the Law 10/2014 of June 26, 2014 on Organization, Supervision and Solvency of Credit Entities and the Royal Decree 84/2015, of February 13, 2015, which develops Law 10/2014, for the establishment of new Spanish banks. These branches of third country institutions must necessarily be ascribed to the Spanish Deposit Guarantee Fund, in case there is no system of coverage in their home country, or if the system guarantees less than €100,000 per depositor (in this case, for the difference up to such €100,000). These institutions may also be authorized to operate in Spain and to provide services (no branches), although, in this case, the institutions cannot raise funds from the public.
Spanish law requires prior approval by the Bank of Spain for a Spanish bank to acquire a significant interest in a bank organized outside the European Union, create a new bank outside the European Union or open a branch outside the European Union. Spanish banks must provide prior notice to the Bank of Spain to conduct any other business outside of Spain.
When a new bank is created by a Spanish bank outside of Spain, the following information has to be provided to the Bank of Spain:
| • | amount of the investment; |
| • | percentage of the share capital and of the total voting rights; |
| • | name of the companies through which the investment will be made; |
| • | draft of the Bylaws; |
| • | program of activities, setting out the types of business envisaged, the administrative and accounting organization and the internal control procedures, including those established to prevent money laundering transactions; |
| • | list of the persons who will be members of the first board of directors and of the senior management; |
| • | list of partners with significant holdings; and |
| • | detailed description of the banking, tax and anti-money laundering regulations of the country where it will be located. |
The opening of branches outside Spain requires prior application to the Bank of Spain, including information about the country where the branch will be located, the address, program of activities and names and resumes of the branch’s managers. The opening of representative offices requires prior notice to the Bank of Spain detailing the activities to be performed.
Savings Banks
Spanish savings banks (“Cajas de Ahorros”) are mutual organizations which engage in the same activities as banks, but primarily take deposits and make loans, principally to individual customers and small to medium-sized companies. The Spanish savings banks provided strong competition for the demand and savings deposits through a vast network of offices in Spain. Royal Decree-Law 2/2011, which came into force on February 18, 2011 was designed to reinforce the Spanish financial system and opened up a new stage in the process of restructuring and strengthening the Spanish savings banks. The focus was set on recapitalizing institutions that needed more capital and encouraging the savings banks to transfer their financial activity to a bank to ease their access to capital markets and wholesale funding. As of December 31, 2012, the downsizing of the savings sector within this framework was finalized and the savings banks completed their conversion into commercial banks. Notwithstanding this, to address concerns in connection with the persistence of savings banks as controllers or significant shareholders of commercial banks the Spanish parliament adopted in December 2013 a comprehensive reform of the savings bank system as part of the ESM-supported program. The reform entailed a two-fold approach: a) strengthening the regulatory regime for the two small savings banks that still carry out banking activities directly; and b) providing that former savings banks that indirectly exercise banking activity (through ownership of a commercial bank) be transformed into “foundations”.
92
Table of Contents
Credit Co-operatives
Credit co-operatives are active principally in rural areas. They provide savings and loan services including financing of agricultural machinery and supplies. They are also a source of competition.
Brokerage Services
We face competition in our brokerage activities in Spain from brokerage houses of other financial institutions.
Spanish law provides that any investment services company authorized to operate in another Member State of the European Union may conduct business in Spain from an office outside Spain, once the Spanish Securities Markets Commission (“CNMV”) receives notice from the institution’s home country supervisory authority about the institution’s proposed activities in Spain.
Spanish law provides that credit entities have access, as members, to the Spanish stock exchanges, in accordance with the provisions established by the European Union Investment Services Directive.
We also face strong competition in our mutual funds, pension funds and insurance activities from other banks, savings banks, insurance companies and other financial services firms.
On-line Banks and Insurance Companies
The entry of on-line banks into the Spanish banking system has increased competition, mainly in customer funds businesses such as deposits. Insurance companies and other financial service firms also compete for customer funds.
Competition outside Spain
In addition, we face strong competition outside Spain, particularly in Argentina, Brazil, Chile, Mexico, Portugal, the United Kingdom, Germany, Poland, and the United States. In these corporate and institutional banking markets, we compete with the large domestic banks active in these markets and with the major international banks.
The global banking crisis resulted in the withdrawal or disappearance of a number of market participants and significant consolidation of competitors, particularly in the U.S. and U.K. Competition for retail deposits has intensified significantly reflecting the difficulties in the wholesale money markets.
In a number of these markets there are regulatory barriers to entry or expansion, and the state ownership of banks. Competition is generally intensifying as more players enter markets that are perceived to be de-regulating and offer significant growth potential.
Competition for corporate and institutional customers in the U.K. is from U.K. banks and from large foreign financial institutions that are also active and offer combined investment and commercial banking capabilities. Santander UK’s main competitors are established U.K. banks, building societies and insurance companies and other financial services providers (such as supermarket chains and large retailers).
In the U.K. credit card market, large retailers and specialist card issuers, including major U.S. operators, are active in addition to the U.K. banks. In addition to physical distribution channels, providers compete through direct marketing activity and the Internet.
In the United States, Santander Bank competes in the Northeastern, New England and New York retail and mid-corporate banking markets with local and regional banks and other financial institutions. Santander Bank also competes in the U.S. in large corporate lending and specialized finance markets, and in fixed-income trading and sales. Competition is principally with the large U.S. commercial and investment banks and international banks active in the U.S.
SUPERVISION AND REGULATION
Single Supervisory Mechanism, Bank of Spain and the European Central Bank
The Single Supervisory Mechanism (SSM) establishes a new financial supervision system consisting of the European Central Bank (ECB) and the national competent authorities (NCAs) of the participating European Union (EU) countries and combines the strengths, experience and expertise of these bodies. Its main objectives are to guarantee the security and solidity of the European banking system and to increase financial integration and stability in Europe. It is the first step towards the so-called “Banking Union,” which is expected to be completed with a single resolution mechanism and a harmonized deposit guarantee system.
93
Table of Contents
The ECB is responsible for the effective and consistent functioning of the SSM and exercises oversight over the functioning of the system. To ensure efficient supervision, credit institutions were categorized as “significant” and “less significant.” In accordance with the Single Supervisory Mechanism (SSM) Regulation, the ECB fully assumed its new supervisory responsibilities within the SSM, in particular direct supervision of the 120 largest European banks (including us), on November 4, 2014.
The ECB supervises directly the significant banks (including us) through the Joint Supervisory Teams (JSTs), which are responsible for the day-to-day supervision of these institutions. These teams comprise staff from the ECB and the NCAs, whose work is coordinated by a ECB staff member, assisted by one or more NCA sub-coordinators. Among other duties, these teams are responsible for the ongoing assessment of institutions’ risk profiles, solvency and liquidity, and prepare the draft decisions to be presented to the Supervisory Board. All other less-significant institutions are directly supervised by national competent authorities (NCAs), and indirectly supervised by the ECB.
In relation to significant institutions, the NCAs, including the Bank of Spain, must assist the ECB, contributing their experience and most of the supervisors making up the JSTs. Also, among other tasks, they provide support for on-site inspections (to be carried out by non-JST teams), gather and transmit any information required, participate in the preparation of supervisory decisions, and collaborate on sanction procedures.
In the case of less-significant institutions, the NCAs supervise them directly, while the ECB supervises them indirectly. In these cases, the ECB, which has ultimate responsibility for the functioning of the SSM, may issue guidelines to ensure consistent supervision in participating countries, request additional information, or even take over the direct supervision of an institution if it considers it necessary.
The participants in the Single Supervisory Mechanism (SSM) are all the countries that form part of the Eurosystem and all European Union countries which are not in the eurozone, but which want to establish a close cooperation with the European Central Bank (ECB) and therefore accept this new supervision system.
The criteria determining whether an institution is significant are:
| • | Its consolidated total assets are worth over 30 billion euros. |
| • | Its assets are worth more than 20% of the GDP of the country in which it is established, unless the consolidated total assets are less than 5 billion euros. |
| • | It is one of the three largest credit institutions in a member state. |
| • | It has subsidiaries in more than one participant country, with cross-border assets or liabilities representing more than 20% of its total assets and liabilities. |
| • | It has requested or received public financial assistance from the European Stability Mechanism or the European Financial Stability Facility. |
Based on these criteria, a list has been drawn up of 120 significant institutions which represent almost 85% of total banking assets in the eurozone, 14 of which are Spanish as of the date of this annual report. In the case of Spain, the significant institutions which are directly supervised by the ECB represent more than 90% of deposit institution assets. We have been categorized as a significant institution.
To directly supervise the significant banks, the ECB has created two directorate generals, which perform the continuous monitoring of the 120 groups. DG I supervises the 30 largest banks in terms of balance sheet and activities, while DG II covers the remaining 90 significant banks. However, the supervision of specific aspects or matters, what is known as on-site inspection, is carried out by different teams. The ECB has thus adopted a different model to that place at the Bank of Spain to date: functionally separating the continuous monitoring of banks and inspection visits.
Prior to the European Central Bank (ECB) assuming its supervisory competencies, it has carried out a comprehensive assessment of significant institutions in order to foster transparency regarding the situation of the main European banks, and identify and apply any corrective measures needed to strengthen their solvency.
This assessment, in which the Bank of Spain has worked intensively with the ECB, consists of two main phases:
| • | Asset quality review: a detailed review of the balance sheets of the banks analyzed. This process was decentralized with the support of leading auditing firms under the central control of the ECB. After a stringent quality control process in which the national competent authorities (NCAs) played a vital role, the process resulted in a series of adjustments to the CET1 capital ratio (the highest quality one), which were taken into account to set the baseline levels for the stress tests. |
94
Table of Contents
| • | Stress tests: this is a simulation exercise to assess the resilience of the institutions in severe but plausible hypothetical stress scenarios. The exercise can indicate the capital which might be needed if certain risks were to materialize, and identify areas where other supervision could be required. |
The stress test is basically designed by the institutions themselves (bottom-up approach), applying the methods of the European Banking Authority (EBA) with strict quality controls by the ECB and the NCAs. It assessed the predicted situation of the institutions in two scenarios: a baseline one and an adverse one. The time frame for the exercise is three years (2014-2016) and it was designed based on the consolidated year-end 2013 figures.
To determine which institutions pass the comprehensive assessment, minimum thresholds were defined for the different parts of the exercise. Banks must achieve a CET1 ratio of at least 8% to satisfy the asset quality review and the baseline scenario of the stress tests. The minimum threshold for adverse scenario stress tests is 5.5%.
If an institution falls below one of these thresholds, it has two weeks to present a capital plan to make up the shortfall. It will then have a period of 6 to 9 months to implement it.
On October 26, 2014, the results of the comprehensive assessment of the banking sector were published and summarized by the Bank of Spain as follows:
| • | The comprehensive assessment of the European banking sector has satisfactorily fulfilled its main objectives: to improve transparency, to identify potential weaknesses on bank balance sheets and to contribute to strengthening banks’ solvency. |
| • | No Spanish bank has a capital shortfall and, generally, the margin by which they have exceeded the thresholds set in the exercise is a comfortable one. |
| • | The exercise conducted (asset quality review and stress tests) shows that Spanish banks’ balance sheets offer a rigorous view of their assets and that the impact of an adverse scenario on their solvency would be relatively limited. |
| • | This outcome confirms that the clean-up, reform and restructuring of the Spanish banking system undertaken in recent years has borne fruit and that Spanish banks face the future with healthy balance sheets and a sound solvency position. |
With regard to significant Spanish banks, the Bank of Spain, in addition to providing its experience and most of the staff of the joint supervisory teams, will shoulder the weight of on-site inspections, it will participate in the preparation of all the decisions to be adopted by the ECB Supervisory Board and it will be active in the exercise of its sanctioning powers. As regards the sanctioning regime, the European Central Bank will be responsible for imposing sanctions, provided that three requirements are met: that the sanction is imposed on the credit institution, i.e. on the legal person; that it stems from non-compliance with directly applicable European Union legal rules; and that the sanctions are of a pecuniary nature. In the remaining cases, power will continue to be exercised by the national supervisory authorities, without prejudice to the ECB being able to demand that the appropriate proceedings be initiated.
There are certain areas of banking activity whose supervision is not assumed by the SSM, but continue to be within the purview of the national authorities. The Bank of Spain thus continues to exercise supervisory powers in the areas of money laundering prevention, consumer protection and, partly, in the oversight of financial markets. It also retains the supervision of banking foundations associated with regional governments. In addition to this, the Bank of Spain, like the other national supervisory authorities participating in the SSM, fully retains its supervisory powers over non-bank financial institutions, other financial institutions and entities related to the financial sector such as payment institutions, electronic money institutions, credit financial intermediaries, mutual guarantee companies, currency-exchange bureau and appraisal companies.
Until January 1, 1999, the Bank of Spain was the entity responsible for implementing Spanish monetary policy. As of that date, the start of Stage III of the European Monetary Union, the European System of Central Banks and the European Central Bank became jointly responsible for Spain’s monetary policy. The European System of Central Banks consists of the national central banks of the twenty seven Member States belonging to the European Union, whether they have adopted the euro or not, and the European Central Bank. The “Eurosystem” is the term used to refer to the European Central Bank and the national central banks of the Member States which have adopted the euro. The European Central Bank is responsible for the monetary policy of the European Union. The Bank of Spain, as a member of the European System of Central Banks, takes part in the development of the European System of Central Banks’ powers including the design of the European Union’s monetary policy.
95
Table of Contents
The European System of Central Banks is made up of three decision-making bodies:
| • | the Governing Council, comprised of the 6 members of the Executive Board of the European Central Bank and the governors of the national central banks of the 19 Member States which have adopted the euro; |
| • | the Executive Board, comprised of the president, vice-president and four other members; and |
| • | the General Council of the European Central Bank, comprised of the president and vice-president of the European Central Bank and the governors of the national central banks of the 28 European Union Member States. |
The Governing Council is the body in charge of formulating monetary policy for the eurozone and adopting the guidelines and decisions necessary to ensure the performance of the tasks entrusted to the Eurosystem. The Executive Board is the body in charge of implementing the monetary policy for the eurozone laid out by the Governing Council and providing the instructions necessary to carry out monetary policy to the eurozone’s national central banks. The General Council is the transitional body which carries out the tasks taken over from the European Monetary Institute which the ECB is required to perform in Stage III of the European Monetary Union on account of the fact that not all EU Member States have adopted the euro yet.
The European Central Bank has delegated the authority to issue the euro to the central banks of each country participating in Stage III. These central banks are also in charge of executing the European Union’s monetary policy in their respective countries. The countries that have not adopted the euro will have a seat in the European System of Central Banks, but will not have a say in the monetary policy or instructions laid out by the governing council to the national central banks.
Since January 1, 1999, the Bank of Spain has performed the following basic functions attributed to the European System of Central Banks:
| • | defining and executing the European Union monetary policy; |
| • | conducting currency exchange operations consistent with the provisions of Article 109 of the Treaty on European Union, and holding and managing the States’ official currency reserves; |
| • | promoting the sound working of payment systems in the eurozone; and |
| • | issuing legal tender bank notes. |
Notwithstanding the European Monetary Union, the Bank of Spain, as the Spanish national central bank, continues to be responsible for:
| • | maintaining, administering and managing the foreign exchange and precious metal reserves; |
| • | promoting the sound working and stability of the financial system and, without prejudice to the functions of the European System of Central Banks, of national payment systems; |
| • | supervising and compliance with the specific rules of credit institutions, other entities and financial markets, for which it has been assigned supervisory responsibility; |
| • | placing currency in circulation and the performance, on behalf of the State, of all such other related functions; |
| • | preparing and publishing statistics relating to its functions, and assisting the European Central Bank in the compilation of the necessary statistical information; |
| • | rendering treasury services to the Spanish Treasury and to the regional governments, although the granting of loans or overdrafts in favor of the State, the regional governments or other bodies referred to in Article 104 of the European Union Treaty, is generally prohibited; |
| • | rendering services related to public debt to the State and regional governments; and |
| • | advising the Spanish Government and preparing the appropriate reports and studies. |
96
Table of Contents
Cash Ratio
European Central Bank regulations require credit institutions in each Member State that participates in the European Monetary Union, including us, to place a specific percentage of their “Qualifying Liabilities” with their respective central banks in the form of interest bearing deposits as specified below (the “Cash Ratio”).
The European Central Bank requires the maintenance of a minimum cash ratio by all credit institutions established in the Member States of the European Monetary Union. Branches located in the eurozone of institutions not registered in this area are also subject to this ratio, while the branches located outside the eurozone of institutions registered in the eurozone are not subject to this ratio.
“Qualifying Liabilities” are broadly defined as deposits and debt securities issued. The Cash Ratio is 1% over Qualifying Liabilities except in relation to deposits with stated maturity greater than two years, deposits redeemable at notice after two years, repos and debt securities with a stated maturity greater than two years, for which the ratio is 0%.
Liabilities of institutions subject to the Cash Ratio and liabilities of the European Central Bank and national central banks of a participating Member State of the European Monetary Union are not included in the base of “Qualifying Liabilities”.
Investment Ratio
The Spanish Government has the power to require credit institutions to invest a portion of certain “Qualifying Liabilities” in certain kinds of public sector debt or public-interest financing (the “Investment Ratio”), and has exercised this power in the past. Although the Investment Ratio has been 0% since December 31, 1992, the law which authorizes it has not been abolished, and the Spanish Government could re-impose the Ratio, subject to EU requirements.
Capital Adequacy Requirements
The regulations known as Basel III, which established new global capital and liquidity standards for financial institutions, came into force in 2014.
From the capital standpoint, Basel III redefines what is considered to be available capital at financial institutions (including new deductions and raising the requirements for eligible equity instruments), increases the minimum capital requirements, requires financial institutions to operate permanently with capital buffers, and adds new requirements in relation to the risks considered.
The Group shares the ultimate objective pursued by the regulator with this new framework, namely to endow the international financial system with greater stability and resilience. In this regard, for many years the Group has collaborated on the impact studies for calibrating the new rules conducted by the Basel Committee and the European Banking Authority (EBA) and coordinated at local level by the Bank of Spain.
In Europe, the new standards have been implemented through Directive 2013/36/EU, known as the Capital Requirements Directive (“CRD IV”), and the related CRR, which is directly applicable in all EU member states (as part of the Single Rulebook). In addition, the standards are subject to Implementing Technical Standards commissioned from the European Banking Authority (EBA), some of which will be issued in the coming months/years.
The Capital Requirements Regulation came into force on January 1, 2014, with many of its rules subject to various implementation timetables. This transitional implementation phase, which affects mainly the definition of eligible capital, concludes at the end of 2019, except with regard to the deduction for deferred tax assets, the transition period for which lasts until 2023.
Subsequent to the transposition of Basel III into European legislation, the Basel Committee has continued to issue additional standards, some in the form of public consultation processes, which will entail a future amendment of CRD IV and the CRR. The Group will continue to support the regulators by offering its opinions and participating in impact studies.
The Group currently has robust capital ratios, in keeping with its business model and risk profile, which, coupled with its substantial capacity to generate capital organically and the gradual implementation timetable envisaged for the new requirements in the legislation, place it in a position to comply with Basel III.
97
Table of Contents
With regard to credit risk, the Group is continuing to adopt its plan to implement the advanced internal ratings-based (AIRB) approach under Basel for substantially all its banks, and it intends to do so until the percentage of net exposure of the loan portfolio covered by this approach exceeds 90%. The attainment of this objective in the short term will also depend on the acquisitions of new entities and the need for the various supervisors to coordinate the validation processes for the internal approaches. The Group is present in geographical areas where there is a common legal framework among supervisors, as is the case in Europe through the Capital Requirements Directive. However, in other jurisdictions, the same process is subject to the framework of cooperation between the home and host country supervisors under different legislations, which in practice entails adapting to different criteria and timetables in order to obtain authorization to use the advanced approaches on a consolidated basis.
Accordingly, in 2014 the Group continued the project of progressive implementation of the technology platforms and methodological improvements required for the roll-out of the AIRB approaches for regulatory capital calculation purposes at the remaining Group units. To date the Group has obtained authorization from the supervisory authorities to use advanced approaches for the calculation of regulatory capital requirements for credit risk for the Parent, the main subsidiaries in Spain, the United Kingdom and Portugal, certain portfolios in Mexico, Brazil and Chile, as well as for United States and Santander Consumer Finance in Spain and Germany. The Group’s Basel implementation strategy is focused on obtaining authorization for the use of AIRB approaches at the main entities in the Americas and Europe.
With regard to operational risk, the Group currently uses the standardized approach for regulatory capital calculation and has embarked on a project to roll out Advanced Measurement Approaches (AMA) approaches once it has collated sufficient data using its own management model. The Group considers that the internal model should be developed primarily on the basis of the experience accumulated in managing an entity through the corporate guidelines and criteria established after assuming control, which are a distinctive feature.
As regards the other risks explicitly addressed in Pillar I of the Basel Capital Accord, Grupo Santander has been authorized to use its internal model for market risk on the treasury areas’ trading activities in Spain, Chile, Portugal and Mexico, thus continuing implementation of the roll-out plan it submitted to the Bank of Spain for the other units.
With respect to Pillar II, the Group uses an economic capital approach to quantify its global risk profile and its capital adequacy position as part of the internal capital adequacy assessment process (ICAAP) at consolidated level. This process includes regulatory and economic capital planning under several alternative economic scenarios, in order to ensure that the internal capital adequacy targets are met even in plausible but highly unlikely adverse scenarios. The ICAAP exercise is supplemented with a qualitative description of the risk management and internal control systems, is reviewed by internal audit and internal validation teams and is subject to a corporate governance structure that culminates in its approval by the Parent bank’s board of directors, which also establishes the strategic factors relating to risk appetite and capital adequacy targets on an annual basis.
In accordance with the capital requirements set by the European Directive and Bank of Spain rules, the Group publishes its Pillar III disclosures report on an annual basis. This report comfortably meets the market transparency requirements in relation to Pillar III. The Group considers the market reporting requirements to be fundamental in order to complement the minimum capital requirements of Pillar I and the supervisory review process performed through Pillar II. In this respect, its Pillar III disclosures report incorporates the recommendations made by the European Banking Authority (EBA), thus making Grupo Santander an international benchmark in terms of market transparency, as is already the case with its annual report.
Parallel to the roll-out of advanced approaches at the various Group units, Grupo Santander is carrying out an ongoing training process on Basel at all levels of the organization, covering a significant number of professionals from all areas and divisions, with a particular focus on those most affected by the changes arising from the adoption of the new international capital standards.
At December 31, 2014, our eligible capital exceeded the minimum required by over €23.6 billion. Our Spanish subsidiary banks were, at December 31, 2014, each in compliance with these capital adequacy requirements, and all our foreign subsidiary banks were in compliance with their local regulations.
Concentration of Risk
An institution’s exposure to a client or group of connected clients is considered a large exposure where its value is equal to or exceeds 10% of its eligible capital.
An institution shall not incur an exposure, after taking into account the effect of the credit risk mitigation, to a client or group of connected clients the value of which exceeds 25% of its eligible capital. Where that client is an institution or where a group of connected clients includes one or more institutions, that value shall not exceed the
98
Table of Contents
greater of 25% of the institution’s eligible capital and €150 million, provided that the sum of exposure values, after taking into account the effect of the credit risk mitigation in accordance with Articles 399 to 403 of the Capital Requirements Regulation 575/2013 (CRR), to all connected clients that are not institutions does not exceed 25% of the institution’s eligible capital.
Legal Reserve and Other Reserves
Spanish banks are subject to legal and other restricted reserves requirements. In addition, we must allocate profits to certain other reserves as described in note 33 to our consolidated financial statements.
Allowances for Credit Losses and Country-Risk
For a discussion relating to allowances for credit losses and country-risk, see “—Classified Assets—Bank of Spain’s Classification Requirements” herein.
Employee Pension Plans
At December 31, 2014, our pension plans were all funded according to the criteria disclosed in note 25 to our consolidated financial statements.
Restrictions on Dividends
We may only pay dividends (including interim dividends) if such payment is in compliance with the applicable capital requirement regulations (described under “—Capital Adequacy Requirements” herein) and other requirements. Credit institutions must comply at all times with the “combined capital buffers” requirement established in articles 43 and following of Law 10/2014 of June 26, 2014, on the organization, supervision and solvency of credit institutions, defined as the total common equity tier 1 capital necessary to comply with the obligation to have a capital conservation buffer, and, where appropriate: a) institution-specific countercyclical capital buffer; b) a global systemically important institution (G-SII) buffer; c) a buffer for other systemically important institutions; and d) a systemic risk buffer.
Pursuant to article 48.2 of the Law 10/2014, credit institutions which do not fulfill the requirement of combined capital buffers, or those institutions for which a common equity tier 1 capital distribution results in their decline to a level where the combined buffer requirement is not fulfilled, shall calculate the maximum distributable amount (MDA), in accordance with article 73 of the Royal Decree 84/2015, of February 13, 2015, which develops the Law 10/2014. Until the MDA has been calculated and such MDA has been immediately reported to the Bank of Spain none of the following actions can be performed by the credit institutions: a) make a distribution in connection with common equity tier 1 capital; b) create an obligation to pay variable remuneration or discretionary pension benefits or pay variable remuneration if the obligation to pay was created at a time when the institution failed to meet the combined buffer requirements; and c) make payments on additional tier 1 instruments. The restrictions shall only apply to payments that result in a reduction of common equity tier 1 or in a reduction of the profits reduced, provided that the suspension or cancellation of the payment does not constitute an event of default of the payment obligations or other circumstances that lead to the opening of an insolvency proceeding.
In addition to the above, Recommendation of the European Central Bank of January 28, 2015 on dividend distribution policies (ECB/2015/2) provides that credit institutions need to establish dividend policies using conservative and prudent assumptions in order, after any distribution, to satisfy the applicable capital requirements and, in relation to the payment of dividends in 2015 for the financial year 2014, recommended that: a) Category 1: Credit institutions which satisfy the applicable capital requirements and which have already reached their fully loaded ratios as at December 31, 2014, should only distribute their net profits in dividends in a conservative manner to enable them to continue to fulfil all requirements even in the case of deteriorated economic and financial conditions; b) Category 2: Credit institutions which satisfy the applicable capital requirements as at December 31, 2014 but which have not reached their fully loaded ratios as at December 31, 2014 should only distribute their net profits in dividends in a conservative manner to enable them to continue to fulfil all requirements, even in the case of deteriorated economic and financial conditions. In addition, they should in principle only pay out dividends to the extent that, at a minimum, a linear path towards the required fully loaded ratios is secured; and c) Category 3: Credit institutions which under the 2014 comprehensive assessment have a capital shortfall that would not be covered by capital measures by December 31, 2014, or credit institutions in breach of the applicable capital requirements, should in principle not distribute any dividend.
As of December 31, 2014, our total capital ratio is 12.0% and our minimum capital requirement under Pillar I is 8%. As of that date, our eligible capital exceeded the minimum required under Pillar I by over €23.6 billion.
99
Table of Contents
Limitations On Types Of Business
Spanish banks generally are not subject to any prohibitions on the types of business they may conduct, although they are subject to certain limitations on the types of businesses they may conduct directly.
The activities that credit institutions authorized in another Member State of the European Union may conduct and which benefit from the mutual recognition within the European Union are detailed in article 12 and in the annex of Law 10/2014 of June 26, on Organization, Supervision and Solvency of Credit Entities.
Deposit Guarantee Fund
The Deposit Guarantee Fund on Credit Institutions (Fondo de Garantía de Depósitos, or the “FGD”), which operates under the guidance of the Bank of Spain, guarantees in the case of the Bank and our Spanish banking subsidiaries: (i) bank deposits up to €100,000 per depositor; and (ii) securities and financial instruments which have been assigned to a credit institution for its deposit, register or for other such services, up to €100,000 per investor. Taking into account the principle of minimal capital impact, the FGD may participate in resolution proceedings by granting financial support in exceptional cases.
The FGD is funded by annual contributions from member banks. The amount of such bank’s contributions will not exceed 3 per thousand of the year-end amount of deposits to which the guarantee extends depending of the kind of credit institution. Nevertheless, further contributions will be suspended when the FGD’s funds exceed the requirement by 1% or more of the calculation basis.
As of December 31, 2014, the Bank and its domestic bank subsidiaries were members of the FGD and thus were obligated to make annual contributions to it. The contributions made by the Bank to the FGD amounted to €261 million in 2014 (€271 million at the end of 2013). The 2013 contribution included the extraordinary contribution established in Additional Provision Five of Royal Decree-Law 21/2012, of July 13, on liquidity measures of Public Authorities and in the financial sector, as determined by Article 2 of Royal Decree-Law 6/2013, on protection of holders of certain savings and investment products and other financial measures.
On April 16, 2014, the recast Deposit Guarantee Schemes Directive was published (Directive 2014/49/EU of the European Parliament and of the Council of April 16, 2014 on deposit guarantee schemes (recast)), which is aimed at eliminating certain differences between the laws of the European Union Member States as regards the rules on deposit guarantee schemes to which those credit institutions are subject. The Deposit Guarantee Schemes Directive is still pending to be transposed to the Spanish national law.
Data Protection
Organic Law 15/1999, dated December 13, 1999, establishes the requirements relating to the treatment of customers’ personal data by credit entities. This law requires credit entities to notify the Spanish Data Protection Agency prior to creating files with a customer’s personal information. Furthermore, this law requires the credit entity to identify the persons who will be responsible for the files and the measures that will be taken to preserve the security of those files. The files must then be recorded in the Spanish Data Protection General Registry, once compliance with the relevant requirements has been confirmed. Credit entities that breach this law may be subject to claims by the interested parties before the Spanish Data Protection Agency. The Data Protection Agency, which has investigatory and sanctioning capabilities, is the Spanish Authority responsible for the control and supervision of the enforcement of this law.
Recent Legislation
Royal Decree-Law 2/2011 of February 18, 2011 on the strengthening of the banking system, which came into force on February 20, 2011, is aimed to dissipate the fears that have arisen regarding the capacity of the Spanish banking system to absorb the potential losses associated with the deterioration of assets and proposes to strengthen the solvency of Spanish banking entities and to accelerate the restructuring process of the Spanish savings banks. The Royal Decree-Law provides incentives for institutions to raise private capital to boost their solvency, which can be done through direct funds from third parties, public issuances or a combination of both.
Royal Decree-Law 13/2011, of September 16, 2011 temporarily restores the wealth tax for 2011 and 2012, abolishing the existing 100% tax rebate, and increases the value of the exemption for dwelling houses to €300,000 and the general tax-free amount to €700,000, extending this general tax-free amount to non-residents in Spain.
Royal Decree-Law 2/2012 of February 3, 2012 which came into force on February 4, is primarily aimed at strengthening and rationalizing the balance sheets of Spanish financial institutions and consolidated group of credit institutions in relation to the large exposures to real estate assets through loans to real estate developers and
100
Table of Contents
repossessed assets, by increased provisioning combined with a requirement for an additional capital buffer on non-performing assets. (See Item 4. Information on the Company—A. History and development of the company—Other Material Events’ herein).
Royal Decree-Law 18/2012, of May 11, 2012 on write-downs and sales of the financial sector’s real estate assets, which builds on Royal Decree-Law 2/2012 of February 3, and which became effective on May 12, 2012, required credit institutions to create new provisions for their portfolio of loans and assets foreclosed or received in payment of debts relating to development land and to real estate construction or development.
In order for real estate assets to be identified and sold, the Royal Decree-Law 18/2012 envisages the creation of share capital companies to which credit institutions must transfer all the real estate assets foreclosed or received in payment of debts relating to land or real estate construction or development, and other real estate assets foreclosed or received in payment of debts since December 31, 2011.
The transfers must be made at fair value and by the end of the period for setting aside the new provisions established in Royal Decree-Laws 2/2012 and 18/2012 (i.e. before December 31, 2012, unless integration processes are carried out). In the event of absence of and difficulty estimating a fair value, the value in the accounts of the institution contributing the asset may be used instead, taking into account the provisions that must be created for the assets pursuant to Royal Decree-Laws 2/2012 and 18/2012.
Law 8/2012 of October 30, 2012 on write-downs and sales of the financial sector’s real estate assets, which became effective on October 31, 2012, gives the provisions of Royal Decree-Law 18/2012, May 11, the status of a law. Among other things, it required additional provisions to those already established in Royal Decree-Law 2/2012 of February 3, consolidating the financial sector in the wake of the impairment of its loans to the property business. These new requirements must have been complied with by the credit institutions by December 31, 2012. It also clarified a number of points regarding Royal Decree-Law 2/2012 to ensure consistency with Royal Decree-Law 18/2012, and the opportunity was taken to modify a number of financial regulations.
The Law 8/2012 also introduced special treatment for preference shares under the terms of Royal Decree-Law 18/2012. Thus, credit institutions facing equity capital difficulties as a result of applying the new provisions may include in their consolidation plan an application to defer for up to 12 months the envisaged remuneration on
101
Table of Contents
preference shares or mandatory convertible debt instruments in circulation before May 12, 2012 (date of entry into force of Royal Decree-Law 18/2012) or on instruments exchanged for the foregoing. Once this period has expired, deferred remuneration may only be paid if sufficient distributable profits or reserves are available and there is no capital shortfall at the parent credit institution. The Law also empowers the Government to stipulate under what circumstances institutions issuing preferred shares or subordinate bonds are to offer to exchange them for shares or subordinate bonds in the issuing institution or a member of its group, and the criteria for determining the percentage of the nominal value of the instruments to be exchanged.
Royal Decree-Law 24/2012 of August 31, 2012 on restructuring and resolution of credit institutions, which repeals Royal Decree-Law 9/2009 of June 26, 2009 on bank restructuring and strengthening of the capital of credit institutions, as well as certain sections of Royal Decree-Law 2/2011 of February 18, 2011 on the strengthening of the Spanish financial system, and of Royal Decree-Law 2/2012 of February 3, on restructuring of the financial sector, also, introduced various amendments to a large number of provisions with the status of Law. The Royal Decree-Law included the following measures: (i) a new enhanced framework for the management of credit institution crises, which will allow such institutions to be effectively restructured and, where necessary, resolved (wound up) in an orderly manner; (ii) new regulation of the FROB, which delimits its powers and significantly enhances the tools for intervention in all phases of the management of credit institution crises; (iii) a system of burden sharing to distribute the costs of credit institution restructuring and resolution between the public and private sectors; (iv) the legal framework for the incorporation of an Asset Management Company; (v) greater protection for retail investors; (vi) a new regime of “capital principal” requirements that must be complied with by institutions, which covers both the definition and level of such capital; (vii) the transfer of certain powers to the Bank of Spain; (viii) new functions of the Deposit Guarantee Fund for Credit Institutions, and (ix) new limits on the remuneration of executives of credit institutions that receive financial support.
The Royal Decree-Law became effective on August 31, 2012. Law 9/2012, of November 14, on restructuring and resolution of credit institution was published on November 15, 2012, and raised the content of Royal Decree-Law 24/2012 of August 31, on restructuring and resolution of credit institutions (which it repeals) to the status of a Law, and introduces some significant new provisions on the regulation of asset management companies (AMCs), and the segregated assets of AMCs’, which the Law terms “bank asset funds” (FABs). The Law also makes a number of changes of relevance to the financial sphere.
Law 17/2012 of December 27, 2012 on the State Budget for 2013 established that the collective action clauses (CAC) that apply as of January 1, 2013 to all issues of public debt with a maturity of more than a year are a set of clauses aggregating representative majorities among bondholders. In the event of a proposed modification of debt instruments’ conditions, this avoids the need to obtain unanimity among all bondholders and thus makes it possible to adopt binding modifications, avoiding a minority’s being able to block solutions approved by the majority. This allows, for example, the bonds’ terms governing their issue or management to be modified with the prior consent of the issuer and a vote in favor by at least 75% of the total principal of the bonds in circulation represented by a duly called meeting of bondholders, or a written resolution signed by or on behalf of the holders of at least 66% of the total principal of the bonds in circulation. The instruments and issue mechanisms used for State debt have, however, been left broadly unchanged. Thus, ordinary and special auctions (competitive and non-competitive bids) and other procedures will continue to be used for issues. In particular, issues may be granted, in whole or in part, to one or more financial institutions to ensure their placement. Outright sales or the sale under repos of newly issued securities or expanded existing issues that the Treasury might have in its securities account may also be performed.
Law 8/2013, June 26, 2013 on urban renewal, regeneration and rehabilitation, was published, the fifteenth final provision of which extends the period of application of hybrid capital and subordinated debt instrument management actions, as set out in Law 9/2012 from June 30, 2013 to December 31, 2013. Finally, this provision of Law 9/2012 of November 14, setting a deadline of December 31, 2013 for the application of Chapter VII of this law relative to the management of hybrid capital and subordinated debt instruments, has been eliminated by Royal Decree-Law 14/2013 of November 29. This elimination means the loss-absorption mechanisms derived from the restructuring or resolution of a credit institution, by its shareholders and subordinate creditors, prevail under Spanish regulations. Hence, the instruments needed to distribute the losses of an institution in keeping with the principle laid down in the Law regarding the correct assumption of risks and the minimum use of public funds are maintained.
On January 14, 2013 the U.S. and the Kingdom of Spain signed a protocol amending the Tax Treaty, which needs to be ratified by both countries and will enter into force three months following the later of the dates on which any of the countries give notice that their internal procedures for entry into force have been fulfilled. Among the most significant changes included in the Tax Treaty was the elimination of the taxation at source for interest, royalties and for dividends if the beneficial owner is a company that has owned shares in the last year representing 80% of the voting capital (withholding will be 5% if the recipient does not reach that percentage, but at least 10%). Capital gains will not be subject to taxation at source, unless they derive from the sale of real estate or companies whose assets consist mainly of real estate.
102
Table of Contents
On February 1, 2013, Royal Decree-Law 2/2013, on urgent measures in the electricity system and financial sector was published. In the financial area, this addressed the regulation of investments by insurance undertakings in securities or movable property rights issued by SAREB. Specifically, assets issued by SAREB may be included among those eligible to cover insurance undertakings’ technical reserves, provided they do not exceed the limit of 3% of total provisions. They will be valued at their cost of acquisition, as defined in the accounting plan for insurance companies.
In addition, for the purposes of their solvency margin, unrealized capital gains or losses deriving from these assets, whether recognized on the accounts or not, will not be included in the calculation. The Royal Decree-Law came into force on February 2, 2013.
On February 23, 2013, the Royal Decree-Law 4/2013 on measures to support entrepreneurs and stimulate growth and job creation came into force. The main changes from the financial and fiscal standpoint are:
a) The measures to promote business finance include an amendment to the Regulations on the organization and supervision of private insurance, enacted by Royal Decree 2486/1998 of November 20, 1998, to allow insurance undertakings to invest in shares admitted to trading on the alternative stock market (MAB) or any other multilateral trading facility, and in venture capital funds, and that these investments be eligible as part of their technical provisions. Similarly, the regulations on pension schemes and pension funds, enacted by Royal Decree 304/2004 of February 20, 2004, have been amended to allow pension funds to invest in these securities. In both cases, a specific maximum limit of 3% of insurance undertakings’ total technical provisions, or of the pension funds’ total assets, in the securities of a single entity is established. This ceiling rises to 6% when they are issued or backed by entities belonging to the same group;
b) Another measure to encourage non-bank finance of share capital companies is the elimination of the limit set in the Law on Share Capital Companies. This relaxation of the rules will only be applicable in the case of issues aimed at institutional investors, to ensure adequate protection of retail investors. Specifically, it applies in the following cases: 1) when aimed solely at qualified investors; or 2) investors purchasing securities of a minimum value of €100,000 in each issue; or 3) when offering securities with a nominal unit value of at least €100,000;
c) In order to stimulate business creation and reduce the tax burden on new firms in their first few years of operation, a more favorable tax framework has been created for self-employed persons starting a business. Thus, new businesses starting after January 1, 2013 will pay corporate income tax in the first tax year in which the company’s taxable earnings are positive and in the subsequent tax year at a rate of 15% on the first €300,000 of taxable income, and 20% on the remainder. In line with the above, a new reduction of 20% on net business and professional earnings has been established in personal income tax for persons starting a business or professional activity, applicable to the first tax year in which their earnings are positive and in the subsequent tax year. The current limit on the exemption for unemployment benefits received as a single payment has also been eliminated (this exemption was previously set at €15,500);
d) The period in which debtors are to settle payment (unless stipulated otherwise in the contract) has been shortened from 60 to 30 calendar days after the receipt of the goods or provision of services, even if the invoice or demand for payment is received previously. This limit can be extended to 60 calendar days by agreement between the parties in exceptional cases. It is stipulated that, if the parties have agreed a deferred payment timetable, and either of them fails to meet payment on the agreed date, the interest on arrears will be calculated only on the overdue amounts. The legal interest rate the debtor is liable to pay in the event of late payment has been increased, such that it is now the interest rate applied by the ECB in its most recent main refinancing operation, plus eight percentage points. Late payment incurs a fixed charge of €40 that the creditor is entitled to collect from the debtor, which will be added to the principal without the need for an express demand. All duly substantiated costs of collection caused by the default will be added to this amount. As regards these costs, the legislation states that any agreement between the parties excluding compensation will be presumed to be an unfair contract term and thus null and void.
On July 28, 2013, Law 11/2013 of July 26, 2013 on business support measures and measures conducive to growth and job creation came into force. It revises the provisions in Royal Decree-Law 4/2013 of February 2013 on business support some of which affect the financial sector. More recently, Law 14/2013 of September 27, on support to and internationalization of business not only complements that mentioned above, but also introduces new fiscal and social security support for business and promotes channels of financing and growth in the international markets. The most notable changes introduced by Law 11/2013 and Law 14/2013 , particularly those of a financial and fiscal nature, are as follows:
103
Table of Contents
a) The regulatory framework governing cédulas de internacionalización (internationalization covered bonds) was updated to address in greater detail the assets pledged as collateral for them, and a new instrument, bonos de internacionalización (internationalization bonds), was created to lend greater flexibility to the issuance of securities collateralized by loans linked to internationalization (without prejudice, in any case, to the unlimited liability of the issuer). Compared with the previous legislation, the list of eligible collateral is broadened and its scope is extended to include internationalization bonds. Thus the principal of and interest on covered bonds will be particularly collateralized by loans relating to the financing of goods and services export contracts or to the internationalization of firms meeting certain requirements. These requirements include, inter alia, that the firm has a high credit quality, and that the loan has been granted to general government or to EU or non-EU public sector entities or to multilateral development banks or international organizations or, regardless of the borrower, has been guaranteed by these bodies;
b) Certain amendments were made to the regulations on the organization and supervision of private insurance enacted by Royal Decree 2486/1998 of November 20, 1998. In particular, it is provided that insurance companies may invest in securities admitted to trading on the Mercado Alternativo Bursátil (alternative stock market) or on the Mercado Alternativo de Renta Fija (alternative fixed-income market) and in venture-capital companies and that those investments qualify for the coverage of technical provisions under certain conditions, although they are not eligible for an amount above 10% of total technical provisions. In the same vein, amendments were made to the pension scheme and pension fund regulations enacted by Royal Decree 304/2004 of February 20, 2004 so as to allow pension funds to invest in these securities;
c) The provisions of Royal Decree-Law 4/2013 regarding the removal, in certain cases, of the limit imposed on share capital companies are retained, and, accordingly, the total amount of debt securities issued may not exceed paid-in share capital plus reserves to ensure that retail investors are adequately protected, this flexibility will only apply in those cases in which the issues are targeted at institutional investors, specifically: 1) when they are targeted exclusively at qualified investors; 2) when the securities offering is directed at investors that purchase securities amounting to at least €100,000 per investor in each separate offering, or 3) when the offering is of securities with a unit nominal value of at least €100,000. Also, certain refinements are made in respect of the issuance by share capital companies of debt or other securities of which recognize or create debt and are to be admitted to trading in a multilateral trading system. Thus, it will not be required to execute a public deed, register the issue or perform other related acts in the Mercantile Register, including the Official Gazette of the Mercantile Register; and
d) The tax framework of Royal Decree-Law 4/2013, which favors the self-employed who start up a business, with a view to encouraging the creation of businesses and to reducing the tax burden during the initial years of business activity, was retained.
On March 24, 2013, Royal Decree-Law 6/2013 of March 22, 2013 on the protection of the holders of certain savings and investment products and other financial measures was published and came into force. This Royal Decree-Law introduces certain mechanisms to speed up the resolution of disputes between credit institutions and their customers, primarily through arbitration, in relation to the marketing of certain savings and investment products, particularly hybrid capital instruments (generally preference shares) and subordinated debt. It also aims to offer liquidity to holders of shares received in exchange for these instruments, granting the Credit Institution Deposit Guarantee Fund (FGD) sufficient legal powers to create market mechanisms allowing liquidity alternatives for these shares. A monitoring committee has been set up as a decision-making body under the Ministry of Economy and Competitiveness to oversee hybrid capital and subordinated debt instruments, with specific responsibility for: 1) analyzing the factors behind judicial and extrajudicial claims by holders of this type of financial product against credit institutions in which the Fund for the Orderly Restructuring of the Banking Sector (FROB) has a shareholding; 2) quarterly submission of a report to the Spanish Parliament on the elements underlying these claims, and, where applicable, 3) making proposals to the competent authorities to improve the protection of purchasers of these products. The committee will also determine the basic criteria to be applied by credit institutions in which the FROB has a shareholding in order to offer their customers the option of submitting disputes arising in relation to the instruments mentioned to arbitration, so that they are appropriately compensated for the economic loss incurred. It will also specify the criteria to designate the group of customers whose claims, in view of their personal or family circumstances, should receive priority treatment by credit institutions in which the FROB has a shareholding. The committee will agree these criteria at its inaugural meeting and may review them on a quarterly basis. The commission will be chaired by the President of the CNMV, with the Deputy Governor of the Banco de España as deputy chairman, with a secretary appointed by the CNMV. The remaining members are the General Secretary for Health and Consumer Affairs, at the Ministry of Health, Social Services and Equality; the General Secretary for the Treasury and Financial Policy, at the Ministry of Economy and Competitiveness; and the President of Consumers’ and Users’ Council. Representatives appointed by the consumer affairs authorities at the regional government and the National Consumer Affairs Institute who have taken part in the claim and resolution mechanisms mentioned will also be invited to attend in an advisory capacity. The Royal Decree-Law also sets out a mechanism for providing liquidity
104
Table of Contents
through the Deposit Guarantee Fund (FGD) for shares due to be received by holders of the aforementioned instruments as a result of their being exchanged. Thus, first of all, the functions of the FGD have been expanded to allow it to subscribe for shares or subordinated debt instruments issued by SAREB. Moreover, it is empowered to purchase ordinary shares not admitted to trading on a regulated market issued by credit institutions transferring their assets to SAREB and which are the product of the conversion of hybrid capital instruments and subordinated debt. The FGD will primarily acquire the shares of the institution’s customers who are in situations of particular hardship as a result of their personal and family circumstances, in accordance with the criteria laid down by the committee. The foregoing instruments will be acquired at a price that does not exceed their market value and is in accordance with European Union rules on State aid. For the purposes of determining the market value, the FGD will commission an independent expert report. In order to maintain the FGD’s asset position healthy to ensure it is able to perform its role in supporting the stability of the Spanish financial system properly, a special one-off contribution to it by member institutions has been established, of 3 per thousand of deposits held on December 31, 2012. This contribution will be made in two phases. A first tranche equivalent to 40% was to be paid within 20 business days of December 31, 2013. The management committee of the FGD may establish certain exemptions in relation to this tranche, such as: 1) non-application of this tranche to institutions in which the FROB has a majority shareholding; 2) a deduction of up to a maximum of 50% of the contributions of FGD member institutions whose basis for the calculation does not exceed €5 billion; and 3) a deduction of up to a maximum of 30% of the amounts invested by institutions in the subscription or purchase, before December 31, 2013, of shares or subordinated debt instruments issued by SAREB. The second tranche, which will account for the remaining 60%, must be paid from January 1, 2014, in accordance with the timetable of payments laid down by the management committee of the FGD, such calendar not exceeding 7 years. Without prejudice to the payment timetable, the amount due for this second tranche will be recognized on the assets of the FGD on the date of settlement of the first tranche.
On May 15, 2013, Law 1/2013, on measures to strengthen the protection of mortgagors, debt restructuring, and rented social housing, came into force. The Law 1/2013 was partially amended by Law 8/2013, of June 26, on urban renewal, regeneration and rehabilitation and by Royal Decree-Law 1/2015, of February 27. An immediate two-year moratorium (extended to four years by Royal Decree-Law 1/2015) on evictions of families considered to be especially vulnerable has been enacted. This exceptional temporary measure will affect any mortgage foreclosure proceedings or extrajudicial sale granting the property to the creditor affecting the principal residence of persons included in certain groups. Special vulnerability is defined here in similar terms as in Royal Decree-Law 27/2012 of November 15, 2012 (BOE of on urgent measures to strengthen the protection of mortgage debtors., namely applying to: 1) large families; 2) one-parent families with two dependent children; 3) families with a child aged under three years; 4) families with a member with a recognized level of disability of more than 33%, requiring long-term care, or suffering from illness accredited as permanently preventing them from working; 5) families in which the mortgagor is unemployed and has exhausted their unemployment benefits; 6) families living together in which one or more persons related to the mortgagor or their spouse by a family tie of up to the third degree of kinship is disabled, requires long term care, or suffers from a serious illness accredited as permanently preventing them from working; 7) families in which there is a victim of domestic violence, provided the dwelling subject to repossession is their principal residence; and 8) (since February 2015) debtors over 60 years old. Improvements have been made to the mortgage market with the amendment of the consolidated text of the Mortgage Law, promulgated by Decree on February 8, 1946; Law 2/1981 of March 25, 1981 on mortgage market regulation; and Law 41/2007 of December 7, 2007, amending Law 2/1981 of March 25, 1981 on mortgage market regulation and other rules of the mortgage and financial system, regulating reverse mortgages and long-term care insurance and establishing certain tax rules. The deed of mortgage on the property must state whether the mortgaged property is intended as the principal residence or not. Unless proven otherwise, at the time of foreclosure it will be deemed that the property is the principal residence if so stated in the deed. The deed will also be required to include, together with the customer’s signature, a handwritten statement, with the wording to be determined by the Bank of Spain, to the effect that the borrower has been adequately warned of the possible risks arising out of the contract. This will apply, in particular, in the following cases: 1) when limitations are placed on the variability of the interest rate, in the form of floor and ceiling clauses, in which the limit on downward variations is less than that on upward variations; 2) when the contract incorporates an interest rate hedging instrument, or 3) when the loan is in one or more foreign currencies. The Mortgage Law has also been strengthened as regards the arrangements for extrajudicial sales of mortgaged property, provided that this has been agreed in the mortgage deed in the event of a default on payment of principal or interest on the guaranteed amount. Various amendments have also been made to Law 1/2000 of January 7, 2000 on Civil procedure in order to ensure that mortgage foreclosure proceedings take place in a way that protects the rights and interests of mortgagors appropriately, and overall, to streamline foreclosure proceedings and make them more flexible. In particular, the legal costs that may be claimed from the foreclosed debtor may in no case exceed 5% of the amount demanded in the foreclosure order. The possibility of a reduction in the outstanding debt has been provided for, such that when part of the debt remains unpaid after mortgage foreclosure of the debtor’s principal residence, the debtor may be released from it if certain conditions are satisfied. These are, settlement of 65% of the remainder within five years, together with interest at the legal rate, or if that is not possible, 80% over a period of ten years. The debtor is also entitled to a share of any possible future revaluation of the foreclosed property. Specifically, if the foreclosed property is sold in the following ten years, the outstanding debt for which the debtor is liable will be reduced by 50% of the capital gain obtained from the sale. If, during the periods indicated above, the property is
105
Table of Contents
realized for a sum greater than that for which the debtor is liable, the latter will be released under the above rules and be entitled to the remainder of the proceeds. These periods were extended until January 1, 2014. The possibility of a reduction in the outstanding debt described in this law and in others recently adopted in Spain, would only affect specific clients and only in the event that the value of the corresponding collateral recovered by the Group pursuant to foreclosure is not sufficient to cover the debt. Our experience is that once the foreclosure has taken place no additional cash flow is recovered; accordingly the amount of the loan outstanding following the foreclosure is fully covered with impairment losses. Hence, these changes have not had any impact on our provisions or allowance for loan losses.
Royal Decree-Law 11/2013, of August 2, 2013 on the protection of part-time workers and other urgent economic and social measures. Among other measures, in order to comply with the decision adopted by the European Commission last July 17, 2013, which concluded that the Spanish tax lease arrangements for the acquisition of vessels as worded till December 31, 2012 was partially incompatible with EU rules on state aid, introduces the transitional regime to be applied to all existing administrative authorizations affected by the content of that Decision.
Law 14/2013, of September 27, 2013 on support to entrepreneurs and their internationalization. Among other measures, it modifies the VAT regulation, introducing with effect from January 1, 2014, an optional cash basis regime for VAT tax payers whose turnover during the previous calendar year was less than €2 million.
Law 16/2013, of October 29, establishing certain measures on environmental taxation and taking other tax and financial measures on. It includes different changes to corporate income tax; among the most significant ones:
| a) | For tax periods beginning on or after January 1, 2013: (i) it has eliminated the tax deductibility of impairment losses on holdings in the capital or equity of entities, whether or not resident in Spain, and the possibility of deducting losses incurred abroad by permanent establishments (“PEs”); (ii) it has introduced a deferral regime for tax losses incurred on intragroup transfers of securities representing a holding in the capital or equity of entities, or on intragroup transfers of the PE, until the securities are transferred to third parties outside the group or the transferor or transferee cease to form part of the group; and new restrictions for the calculation of tax losses on the transfer of holdings. |
| b) | It has renewed for tax periods beginning in 2014 and 2015, some temporary measures which were introduced exceptionally for years 2012 and 2013, among others: (i) the offsetting of tax losses carryforwards will be restricted to 50% of the tax base before such offset for those entities whose turnover during the previous year was between €20 million and €60 million, and to 25% if the turnover exceeds €60 million; though these limitations will not apply to income/gains subject to debt compositions as a result of an arrangement with creditors not related to the taxpayer that is approved in a tax period beginning on or after January 1, 2013 (ii) the limitations on the tax deductibility of goodwill to 1% per year, and of intangible assets with an indefinite useful life to 2% per year, (iii) the increase in the rates applicable for determining the amount of the tax prepayment for large companies. |
Royal Decree-Law 14/2013 of November 29, 2013 on urgent measures for the adaptation of Spanish law to EU supervisory and solvency regulations for financial institutions was published on November 30, 2013. The Royal Decree came into force on December 1, 2013, although certain provisions were enforceable during 2014. The aim of this legislation is to incorporate directly into Spanish law Regulation (EU) 575/2013 of the European Parliament and of the Council of June 26, 2013. The main new developments are:
106
Table of Contents
a) A transitory regime has been established for specialized credit institutions which will continue to be considered as credit institutions until the specific legislation corresponding to them is approved;
b) Regulations have been laid down for a legal entity identifier, envisaged by Regulation (EU) No 648/2012 of the European Parliament and of the Council of July 4, 2012, on OTC derivatives, central counterparties and trade repositories. Early next year, the central counterparties and trade repositories shall identify participants in a derivatives contract (for the purposes of their registration in the trade repositories) through the use of a code known as an entity identifier. In Spain, their issuance and management will be incumbent upon the Mercantile Register;
c) As from the entry into force of the regulation, the core capital requirement regulated under Royal Decree-Law 2/2011 of February 18, 2011 on the reinforcement of the financial system is repealed. However, a transition period running to December 31, 2014 has been set in order to mitigate the effects its repeal could have;
d) Law 9/2012 of November 14, 2012 on the restructuring and resolution of credit institutions has been amended in order to enable the Fund for the Orderly Restructuring of the Banking Sector (FROB) to increase its own funds through the capitalization of credits, loans or any other debt operation in which the State features as creditor. The management of its cash operations, previously in the hands exclusively of the Bank of Spain, has also been made more flexible. It also introduces important tax measures aimed at allowing for certain deferred tax assets (“DTAs”) to continue to be classified as capital, in line with legislation in force in other European Union member states, in such a way that Spanish credit institutions may operate in a uniform competitive environment. It states that certain temporary differences deriving from bad debts and pensions will receive a special treatment as regards their inclusion in the tax base, with retroactive effects for tax periods commencing on or after January 1, 2011. Moreover, for tax periods commencing on or after January 1, 2014, the timing differences which, after taking into account the aforementioned rules, cannot be used in certain circumstances (either because the taxpayer incurs accounting losses or because it is liquidated or has an insolvency order against it) can be “converted” into current credits against the tax authorities (which can be cash-settled or offset against other current tax debts, at the taxpayer’s option). Lastly, the provision establishes that after certain periods have elapsed without being able to use those tax assets, they can be exchanged for public debt securities.
107
Table of Contents
Organic Law 9/2013 of December 20, 2013 on the Control of Trade Debt in the Public Sector amending, inter alia, Organic Law 2/2012 of April 27, 2012 on Budgetary Stability and Financial Sustainability and Organic Law 8/1980 of September 22, 1980 on the Financing of the Regional Governments, was published on December 21, 2013. Barring certain exceptions, the Organic Law came into force on December 22, 2013. The most significant changes were to introduce in Organic Law 2/2012 two fundamental provisions: on one hand, that the control of public-sector debt should not be limited only to the volume of its financial debt but also to its trade debt; and, on the other, the obligation to pay these debts to suppliers within 30 days, which is the deadline established in legislation on bad debts.
On December 29, 2013, entered into force Law 26/2013 of December 27 on savings banks and bank foundations, which contains the new legal regime for savings banks, and the regulation of bank foundations for the first time in Spanish law. This law repeals Law 31/1985 of August 2, on the regulation of the basic rules relating to the governing bodies of savings banks; Royal Decree-Law 11/2010 of July 9, on governing bodies and other aspects of the legal regime for savings banks, except the paragraphs that refer to the tax regime for institutional protection schemes; and certain paragraphs of Article 7 of Law 13/1985 of May 25, on investment ratios, own funds and reporting obligations of financial intermediaries, insofar as they concern non-voting equity units. The main changes which have been introduced by Law 26/2013 are:
a) It specifies and determines the object of their activity, which is the traditional object of savings banks, these being credit institutions with a charitable nature and social purpose, whose financial activity must be primarily oriented towards the acceptance of repayable funds and the provision of banking and investment services to retail customers and SMEs;
b) It takes the important step of professionalizing the governing bodies of savings banks, basically by reducing the representation of government and public law entities and corporations, and by extending the requirements for integrity, experience and good governance to all the members of the board of directors (previously they only applied to the majority of directors), including general managers and similar officers, those responsible for the functions of internal control and those who perform other key duties for the daily activity of savings banks. In short, the legislation applicable to banks is extended to the members of the board of directors and equivalent officers;
c) As envisaged by the previous legislation, it requires savings banks to publish a corporate governance report on an annual basis, which will be sent to the CNMV, to the Bank of Spain and to the competent regional government bodies;
d) Mergers of savings banks will be subject to the authorization procedure provided for in the implementing regional legislation. The change in address of the registered office of a savings bank will be subject to the authorization procedure of the transfer project, in accordance with the provisions of the implementing regional legislation. The denial of authorization of the merger or of the transfer may only occur through a reasoned resolution when the resulting institution may not comply with any of the objective requirements laid down in the said legislation; and;
e) It introduces the regulation of bank foundations into the Spanish legal system. These entities have a direct or indirect holding of at least 10% of the capital or voting rights of a credit institution, or that enables them to appoint or replace one or more members of the board of directors of such institution.
Law 22/2013 of December 23, 2013 on the State Budget for 2014 authorized the Minister for Economic Affairs and Competitiveness to increase State debt such year with the limitation that the outstanding balance at the end of the year may not exceed that on January 1, 2014 by more than €73 billion. Law 22/2013, of December 23, on 2014 National General Budget, among other tax measures, includes the extension for the year 2014 of certain temporary measures that had been introduced for tax years 2012 and 2013, among the most significant ones: (i) the supplementary levy scale on Individual Income Tax, (ii) the increase of the withholding tax rates for nonresident income to 24.75% (standard rate) and 21% (applicable on dividends, interest and capital gains), instead of 24% and 19% rates respectively, (iii) the extension of the Wealth Tax enforcement. Royal Decree-Law 1/2014, of January 24, has also extended until December 31, 2014 the increase of the 19% withholding rate in the Corporate Income Tax to 21%.
Instrument of Ratification of the Convention between the Kingdom of Spain and Argentina for the avoidance of double taxation and prevention of fiscal evasion with respect to taxes on income and on capital, made in Buenos Aires on March 11, 2013, (published in BOE January 14, 2014). The new Convention entered into force on December 23, 2013, but new will apply retroactively to January 1, 2013, replacing the previous treaty that had been terminated unilaterally by Argentina with effects from the same date. In general the new treaty retains the terms of the previous treaty; however, it excludes relief from Argentina’s 0.5% wealth tax. The Argentine government terminated the previous treaty in 2012. Among the most significant changes included in the new Tax Treaty is the elimination of the exclusive taxation in the country of residence of assets consisting of shares in a company and the Most Favorable Nation clause (affecting interest, royalties and capital gains) of the previous protocol.
108
Table of Contents
On March 14, 2013, a new Tax Treaty was signed between the Kingdom of Spain and the United Kingdom of Great Britain and Northern Ireland (U.K.). The ratification process was concluded in April 2014 and the new Treaty will apply in Spain from June 12, 2014, for withholding taxes and from January 1, 2015, for income taxes and other taxes, and in the U.K. from June 12, 2014, for withholding taxes, from April 6, 2015, for income and capital gains taxes, and from April 1, 2015, for corporation tax. Among the most relevant changes introduced by the new Treaty, the interests’ and royalties’ withholding tax rates have been reduced to 0%, and the dividend withholding tax rate has been reduced to 0% if the beneficial owner is a company that controls, directly or indirectly, at least 10% of the capital in the company paying the dividends or a pension scheme.
Royal-Decree-Law 8/2014, of July 4, 2014 of urgent measures for growth, competitiveness and efficiency, among other tax measures, introduces, with effect from January 1, 2014, a tax rate of 0.03% (instead of 0% previously established) in the Tax on deposits in credit institutions created by Law 16/2012, of December 27, 2014, also introducing technical improvements in the determination of taxable income.
Laws 26/2014 and 27/2014, of November 27, 2014, which modify the most important Spanish tax laws. This new legislation will generally come into force on January 1, 2015, though it includes some transitory regimes. Some of the main tax amendments introduced are summarized below:
| (a) | Corporate income tax: |
| • | The general corporate income tax rate is reduced from 30% to 28% in 2015 and to 25% in 2016 and onwards. The tax rate applicable to credit institutions will remain at 30%. |
| • | Tax Losses can be carried forward indefinitely (previously only 18 years) but with an annual quantitative limit of 70% of the positive taxable base (prior to the application of the capitalization reserve taxable reduction), for tax years starting in 2017 (60% limit applies to tax years starting in 2016), with a minimum threshold of €1 million. For 2015 the limitation continues at 50% or 25% of the company´s taxable base if its turnover in the previous tax year exceeded €20 million or €60 million respectively. The right of the tax authorities to audit tax losses carry-forwards is established for 10 years (the ordinary statute of limitations period remains 4 years). |
| • | The participation exemption regime is introduced for dividends and capital gains derived from both Spanish resident and non-Spanish resident subsidiaries, with the following requirements: (i) a minimum ownership percentage of 5% or a cost acquisition of €20 million and one-year minimum holding period in the subsidiary; (ii) for foreign subsidiaries only, if they are not resident in a tax treaty country, a minimum level of nominal taxation of 10% under a foreign corporate tax system similar to the Spanish corporate income tax. This regime will not apply where the distributed dividends generated a tax deductible expense in the entity paying the dividend, or if the participation is held in a company resident in a tax haven. |
| • | Withholding taxes are generally reduced from 21% to 19% as from 2016 (20% for tax year 2015). |
| • | The Tax credit for reinvestment of extraordinary profits is abolished. Instead, companies subject to the general tax rate may annually reduce their taxable base to an amount equal to 10% of the increase of their net equity during a given year, provided a special reserve is booked for the same amount, non-disposable for at least 5 years. |
| • | The Group taxation regime scope of application is extended to Spanish subsidiaries held indirectly through a foreign intermediary company and Spanish subsidiaries of a common foreign parent company. In addition to the requirement of a 75% participation in the subsidiary (70% for listed subsidiaries), the new Law also requires a minimum of 50% of the voting rights. |
| • | The impairment of tangible fixed assets, real estate investments, intangible fixed assets (including goodwill), securities representing a capital or equity shareholding in an entity and debt securities will be nondeductible for tax purposes. Losses derived from these items will be deductible only where transferred to unrelated third parties or when actually charged-off from the balance sheet. |
| • | Transfer pricing rules are amended, including changes in the definition of a related party (new 25% participation threshold). The Law also introduces certain amendments in anti-abuse rules in line with OECD Base Erosion and Profit Shifting (BEPS) project, as amendments in relation to the tax treatment of hybrid instruments, and additional substance requirements in the Control Foreign Companies (CFC) rules in order to avoid imputation of foreign low-taxed income. |
109
Table of Contents
| (b) | Non-resident income tax: |
| • | The withholding tax applicable to dividends, interest and capital gains is reduced to 19% as from January 1, 2016 (20% for tax year 2015). The general withholding tax rate is reduced to 24% (from 24.75%), but it will be reduced to 19% as from January 1, 2016 (20% for tax year 2015) for income obtained by residents in EU or European Economic Area (EEA) countries with which an effective exchange of information exists. |
| • | The annual exemption of €1,500 on dividends obtained by certain non-resident individuals is abolished. |
| (c) | Personal income tax: |
| • | Tax rates have being decreased from January 1, 2015, with further reductions from 2016, but several exemptions, deductions and rebates have been reduced. Tax rates band for savings income (dividends, interest and capital gains -including short term capital gains previously included as part of the general income-) is 20 to 24% for 2015 and 19 to 23% from 2016 onwards, and for general income 20 to 47% for 2015 and 19 to 45% from 2016 onwards, though the final tax rate will depend on the tax scale approved by the region (“Comunidad Autónoma”) where the taxpayer is resident. |
Law 36/2014, of December 26, 2014, relating to the 2014 National General Budget, among other tax measures, includes the extension for the year 2015 of the wealth tax enforcement.
Royal Decree-Law 4/2014 of March 7, 2014 (BOE of March 8, 2014), adopting urgent measures relating to the refinancing and rescheduling of corporate debt in order to speed up these processes and make them more flexible, was published. It entered into force on March 9, 2014 and was validated by the Spanish Congress on March 20, 2014. The main purpose of the Royal Decree-Law is to increase the effectiveness of pre-insolvency refinancing so that firms can reschedule their debt more flexibly without having to apply for insolvency proceedings. For this purpose various aspects of Spanish Insolvency Law 22/2003 of July 9, 2003 are amended. For instance, as a result of the amendment of Article 5 bis of Law 22/2003, notification to the court by the debtor that it has commenced negotiations to reach a refinancing agreement is sufficient to stay, for the foreseeable duration of the negotiations, the execution of judgments in relation to assets required for the continuation of the debtor’s professional or business activity, including execution actions before the courts (previously, refinancing agreements only halted executions if such agreements had been judicially approved). The proceedings arising from public-law claims are excluded, in any event, from this stay. In addition to this, article 56 of Law 22/2003 is amended to limit the cases where the execution of judgments in relation to secured assets is stayed to those in which the assets are required for the continuation of a professional or business activity; and those assets not considered necessary for the continuation of such activity are specified, such as shares or investments of companies engaging exclusively in holding an asset and the liability required to finance it.
Law 3/2014 of March 27, 2014 which amends the consolidated text of the General Consumer and User Protection Law and other supplementary laws, enacted by Legislative Royal Decree 1/2007 of November 16, 2007, was published with the aim of transposing into Spanish law Directive 2011/83/EU of the European Parliament and of the Council, of October 25, 2011 on consumer rights. This law increases the information which must be provided to consumers and users by enlarging pre-contractual information requirements. For instance, the new obligations include informing consumers and users, where applicable, of the existence and the conditions of deposits or other financial guarantees to be paid or provided by them at the request of the trader, including an arrangement whereby an amount is blocked on the consumer’s credit or debit card. The law came into force on March 29, 2014.
Law 10/2014 of June 26, 2014, on the regulation, supervision and solvency of credit institutions was published and came into force on June 28, 2014, except for certain specific provisions referring to Securities Market Law 24/1988 of July 29, 1988 which are enforceable from October 31, 2014. Its main purpose is to complete the transposition (commenced by Royal Decree-Law 14/2013 of November 29, 2013 on urgent measures for the adaptation of Spanish law to EU supervisory and solvency regulations for financial institutions), of Directive 2013/36/EU of the European Parliament and of the Council of June 26, 2013. Inter alia, the Law 10/2014 regulates general aspects of the legal framework governing access to the status of credit institution; the functioning of its governing bodies, and the supervisory and disciplinary instruments that the authorities are to use. The Law 10/2014 is subdivided into the following main sections:
110
Table of Contents
a) Legal framework for Credit Institutions, including a set of general provisions concerning the legal framework applicable to credit institutions. It therefore defines what constitutes a credit institution, establishes the nature of the business reserved exclusively to them, and the sources of the legal rules governing them. It also regulates other points, which are inherently associated with the characteristics of credit institutions, such as the system for granting and revoking authorization; the rules on significant shareholdings; the suitability of members of the board of directors or equivalent body and incompatibilities to which they are subject, the rules of corporate governance and remuneration policy;
b) Solvency of Credit institutions: Although the regulations on solvency are determined by Regulation (EU) No 575/2013 of June 26, 2013, which has already been in force since January 1, 2014, the Law 10/2014 includes the provisions on the matters which are to be included in Spanish legislation. These include credit institutions’ self-assessment of their capital relative to the risks they assume, to ensure that they have in place sound, effective and comprehensive strategies and processes to continuously assess and maintain the amounts, types and distribution of internal capital that they consider adequate to cover the nature and level of the risks to which they are or might be exposed. Additionally, it sets out a series of requirements additional to those for Common Equity Tier 1—the so-called capital buffers -which allow supervisors to demand higher levels of capital than those established in Regulation (EU) No 575/2013 of June 26, 2013. Specifically, five types of buffers are defined:
1) Capital conservation buffer for unexpected losses, comprising Common Equity Tier 1 equivalent to 2.5% of the total amount of the risk exposure. Transitional arrangements are established according to the following timetable: 0.625% in 2016; 1.25% in 2017; 1.875% in 2018; and 2.5% as of 2019;
2) Specific counter-cyclical capital buffer, in terms of Common Equity Tier 1, calculated specifically for each institution or group, equivalent to the total amount of the risk exposure multiplied by a specific percentage. This percentage will be the weighted average of the percentages for counter-cyclical buffers applicable in the territories in which the institution’s relevant credit exposures are located such that up to 2.5% of the total weighted exposures may be required. The same transitional arrangements are established as for the capital conservation buffer;
3) Capital conservation buffer for global systemically important financial institutions (G-SIFIs) of between 1% and 3.5% of the total risk exposure, depending on the systemic importance of the institution concerned. As in previous cases, transitional arrangements are applicable to these percentages according to the following timetable: 25% in 2016; 50% in 2017; 75% in 2018; and 100% as of 2019;
4) Buffer for other systemically important financial institutions (SIFIs), giving the Bank of Spain a degree of discretion as to whether to require certain institutions to set aside this buffer, which may be as much as 2% of the total risk exposure, bearing in mind the criteria used to identify SIFIs; and
5) Common Equity Tier 1 systemic risk buffer in order to prevent or avoid non-cyclical long-term specific or macroprudential risks that could prompt a shock in the financial system with serious negative consequences for the system and the real economy;
c) Prudential Supervision: Under the legislation currently in force the Bank of Spain has been designated as the supervisory authority for credit institutions. It has therefore been granted the powers and authority necessary to perform this role, the scope and aims of its supervisory activities have been defined, and it has been granted authority to take the necessary measures to ensure compliance with solvency regulations. Moreover, given that credit institutions conduct their business in an increasingly integrated environment, particularly within Europe, the regulations also cover the Bank of Spain’s dealings with other supervisory authorities, and in particular the European Banking Authority (EBA). In this context, once the Single Supervisory Mechanism (SSM) has come fully into effect in the European Union, the Bank of Spain will have to perform its credit institution supervisory duties in cooperation with, and without prejudice to the competences directly assigned to, the ECB, by virtue of Regulation (EU) No 1024/2013 of the Council of October 15, 2013, which entrusts the ECB with specific tasks concerning policies relating to the prudential supervision of credit institutions;
d) Institutions’ Reporting and Disclosure obligations;
e) New System of Penalties, since the penalty system applicable to credit institutions follows the model defined by Law 26/1988 of July 29, 1988 which is repealed;
f) Changes to the legal rules of preference shares, since the classification in Regulation (EU) No 575/2013, June 26, 2013, of preference shares as additional Tier 1 capital for the credit institutions issuing them needed to be introduced into Spanish legislation, subject to the conditions established in the Regulation;
111
Table of Contents
g) Integration of the Bank of Spain in the Single Supervisory Mechanism, pursuant to Regulation (EU) No 1024/2013 of the Council of October 15, 2013;
h) Amendments to Law 26/2013, December 27, 2013 in relation to saving banks and banking foundations;
i) As envisaged in Regulation (EU) No 575/2013, June 26, 2013, the Bank of Spain may exempt credit institutions forming part of an institutional protection system from compliance with individual solvency requirements under the Regulation 575/2013;
j) The composition of the management board of the Deposit Guarantee Fund, regulated under Royal Decree Law 16/2011 of October 14, 2011, is amended to include representatives of the Ministries of Economic Affairs and Competitiveness, and of Finance and Public Administration, as the institution is included within the scope of fiscal consolidation;
k) Supervision on individuals or legal entities which, not being registered in any of the legally required administrative registers of financial institutions, offer loans, deposits or financial services of any kind; and
l) Wide-ranging amendments to Law 24/1988 of July 28, 1988 on the securities market in order to bring investment firms within the scope of the prudential supervision system envisaged for credit institutions under Directive 2013/36/EU of June 26, 2013. Royal Decree 84/2015 of February 13, on banking solvency gave the details of Law 10/2014 on credit institutions’ organization, supervision and solvency, completing transposition of EU solvency law into the Spanish legal framework. The Royal Decree came into force on February 15, 2015.
Royal Decree 579/2014 of July 4, 2014 implementing certain aspects of Law 14/2013 of September 27, 2013 on support for entrepreneurs relating to internationalization bonds and internationalization covered bonds and came into force on July 17, 2014. Besides implementing certain aspects of internationalization bond and covered bond issuances, the Royal Decree regulates secondary market transactions in these bonds and the supervisory powers of the CNMV and the Bank of Spain. The information that internationalization bonds and covered bonds must include is stipulated, along with general issuance rules which, without prejudice to the provisions of the Royal Decree 579/2014, shall conform to Securities Market Law 24/1988 of July 28, 1988. It also regulates the way in which the maximum issue limits should be calculated, and the way in which they should be restored if they are exceeded. If the limits are exceeded owing to higher repayments of the loans affected or for any other reason, various measures are envisaged whereby issuers should restore the balance in the shortest time possible.
Royal Decree 11/2014 of September 5, 2014 on urgent insolvency measures was published, with the aim, inter alia, of extending the reforms brought in by Royal Decree-Law 4/2014 for the pre-insolvency stage (refinancing agreements) to the insolvency agreement itself, with the main objective being to promote agreements that will enable economically viable companies to survive insolvency proceedings. The key changes ushered in by the Royal Decree-Law 11/2014, which came into force on September 7, 2014, are as follows: a) General changes to insolvency agreements: aiming at helping companies to survive the Royal Decree 11/2014 provides that assets and rights can only be transferred to creditors in payment if they are not essential for the continuation of the professional or business activity and if their fair value is equal to or less than that of the claim being discharged. If their fair value is higher, the difference should be included in the assets available to creditors. In no event will there be an obligation to transfer assets or rights in payment to public sector creditors; b) Changes relating to preferred creditors: provisions are introduced in respect of the valuation of preferred collateral. Accordingly, the special preference will only affect the portion of the claim that does not exceed the value of the collateral included in the list of creditors. Any portion of the claim exceeding that value will not receive special treatment and will be classified according to the nature of the claim; c) Changes relating to winding-up proceedings. In respect of winding-up, the aim is to ensure, insofar as possible, the continuation of the business activity, basically facilitating the sale of the establishments and operations, and of any other production units, of the debtor.
Royal Decree 636/2014 of July 25, 2014 sets up the General Government Economic and Financial Information Office (Central de Información Económico-Financiera de las Administraciones Públicas, CIEF) and regulates the sending of information by the Bank of Spain and financial institutions to the Ministry of Finance and Public Administration.
Law 22/2014 of November 12, 2014, regulates venture capital entities and other closed-end collective investment institutions (CECIIs) and their management companies (CECIIMCs) and amends Law 35/2003 of November 4, 2003 on CIIs. The main new features include a speedier and less onerous administrative process for the creation of venture capital entities, as the administrative authorization by the CNMV is virtually eliminated, being replaced by registration with the CNMV once it has been confirmed that all the documentation required by law is complete.
112
Table of Contents
Law 17/2014 of September 30, 2014 adopts urgent measures on the refinancing and restructuring of corporate debt. The Law 17/2014 writes into Insolvency Law 22/2003 of July 9, 2003 the text of Royal Decree-Law 4/2014 of March 7, 2014, which substantially amended Law 22/2003, particularly regarding the regulation of refinancing agreements able to be entered into by companies and the extension of their terms to dissenting creditors. The submission of notification of commencement of negotiations may be accepted as cause for staying judicial enforcement proceedings against assets required for the continuation of the debtor’s professional or business activity. Also permitted is the stay of any other individual enforcement proceedings at the initiative of financial creditors, provided that not less than 51% of the creditors holding financial claims have expressly supported the initiation of negotiations aimed at entering into the related refinancing agreement. Any proceedings arising from public law claims are excluded, in any event, from this stay.
Law 31/2014 of December 3, 2014, amending the Spanish Limited Companies Law in order to improve corporate governance, entered into force, with certain exceptions, on December 24, 2014. The changes can be divided into two categories: those referring to the annual general meeting and those concerning the board of directors.
a) Annual General Meeting: The Annual General Meeting’s powers to deliberate and resolve on matters are broadened, among others, in respect of the director remuneration policy and transactions having an effect equivalent to that of winding up the company, such as acquisition, sale or transfer to another company of essential assets. So-called “minority rights” in listed companies are strengthened by lowering from 5% to 3% the minimum share capital needed for shareholders to be able to exercise their rights. Also, the Bylaws cannot require ownership of more than 1,000 shares to be eligible to attend the Annual General Meeting. The legal treatment of shareholders’ conflicts of interest is reformed and its application extended to public limited companies (by broadening the applicability of the existing regime for private limited companies). Shareholders’ right to information is enhanced, particularly for listed companies, where the period during which shareholders can exercise their right to information prior to the Annual General Meeting is extended to five days before it is held (compared with seven previously). As a new development, valid written requests for information, clarifications and written questions, as well as written replies from directors, must be placed on the company’s website. All cases of the challenging of corporate resolutions (void and voidable resolutions) are unified under a general regime of voidance, for which an expiration period of one year is set, the only exception being challenges to resolutions contrary to public order for which there is no expiration period. For listed companies, the expiration period is reduced from one year to three months, so as to safeguard the efficacy and flexibility particularly required in the management of these companies. As regards the capacity to challenge corporate resolutions, to avoid situations of abuse of rights, a lower limit is set such that the only shareholders eligible to challenge corporate resolutions will be those representing, individually or jointly, at least 1% of capital for unlisted companies and 0.1% for listed companies, although the Law permits these thresholds to be lowered in the articles of association. Finally, for these purposes the concept of corporate interest is broadened, such that it is now deemed to be prejudiced if a resolution is imposed unfairly by the majority.
b) Board of Directors: The Law 31/2014 assigns to the board of directors, as a non-delegable duty, the taking of decisions relating to core management and supervision activities. It is thus stipulated that the board has to meet at least once a quarter so as to maintain a constant presence in the dealings of the company. Law 31/2014 introduces a number of significant changes intended to contribute to the proper functioning of the board, particularly in listed companies. Thus directors are required to attend board meetings in person, the non-delegable powers of the board are listed exhaustively and director categories are stipulated, defining those who are executive, non-executive, nominee and independent directors (definitions formerly included in Order ECC/461/2013). The appointment and re-election of directors is regulated, and the maximum period of office is set at four years, compared with the former maximum of six years generally in force. New obligations regarding remuneration policy are also established for all limited companies. Thus, the maximum amount of total annual remuneration of all directors taken together must be approved by the Annual General Meeting and will remain in force so long as it is not changed. Also, remuneration must be reasonably consistent with the importance of the company, its economic situation at each point in time and the market standards of comparable companies. Additionally, in listed companies, the director remuneration policy must conform, wherever applicable, to the remuneration system set out in the articles of association and must be approved by the Annual General Meeting at least every three years as a separate item on the agenda. Any change to or replacement of the director remuneration policy during that three-year period must have prior approval from the Annual General Meeting.
In addition to this, the Law 31/2014, places the control of tax risks within the responsibilities of the boards of directors of listed companies. The board of directors of a listed company may not delegate the determination of the company’s policy on tax risk control and management and the supervision of internal information and control systems. The law also tasks the audit committee with supervising the effectiveness of internal control of the company, its internal audit and its risk (including tax) management systems. The audit committee must also give prior notice to the board of the creation or acquisition of investments in special purpose vehicles or entities domiciled in countries or territories classified as tax havens, as well as of transactions with related parties. Lastly, information must be included in the annual corporate governance report on the company’s risk (including tax) control systems.
113
Table of Contents
Law 36/2014 of December 26, 2014 on the State Budget for 2015 was published on December 30, 2014. The Spanish Minister for Economic Affairs and Competitiveness was authorized to increase the outstanding balance of State debt in 2015 by up to €49,503 million with respect to its level at the start of the year (the limit set in the last budget was €72,958 million). This limit may be exceeded during the course of the year upon the authorization of the Minister for Economic Affairs and Competitiveness. A number of circumstances were established in which it will be automatically reviewed. In accordance with Law 9/2012 of November 14, 2012 on restructuring and resolution of credit institutions, during the 2015 budget year the FROB’s borrowed funds must not exceed €22 billion (€63.5 billion was the limit set in the last budget). With regard to government guarantees, the limit on the total guarantees granted by the State and other government agencies is €3.5 billion (the limit set in the last budget was €3.725 billion). Of this amount, €3 billion (the same amount as envisaged in previous budgets) will be earmarked to guarantee fixed-income securities issued by securitization SPVs, designed to improve the financing of businesses’ productive activity. To set up these securitization SPVs, the credit institutions concerned must transfer loans and credits granted to all types of non-financial firms located in Spain, of which at least 50% must have been granted to SMEs and 25% must be short-term (for less than one year). The liquidity obtained through the securitization must be reinvested by the credit institutions concerned in loans or credits granted to the types of firms indicated above, of which at least 80% must be SMEs. At least half of the reinvestment must take place within one year from when this liquidity is obtained. Under personal income tax, compensation is maintained for the loss of tax benefits affecting the recipients of certain income from capital produced over a period of more than two years in 2014, as was the case under the Personal Income Tax Law approved by Royal Legislative Decree 3/2004 of March 5, 2004, that remained in force until December 31, 2006. In the case of venture capital funds, an exemption is established for all transactions subject to tax under the corporate transactions heading, in order to align their treatment with that of mortgage securitization SPVs and financial instrument securitization SPVs. In accordance with ECB regulations, the budget law authorizes the Bank of Spain to entrust the production of its share of euro banknotes to a public corporation in which it has a controlling interest, and whose sole corporate purpose is the production of such State budget for 2015.
Royal Decree-Law 17/2014, of December 26, 2014, on financial sustainability measures of regional and local governments, and other economic measures, was published and, barring certain exceptions, came into force on December 31, 2014. On the one hand, it aims to set up new mechanisms which will enable all tiers of government to share financial savings, give priority attention to social spending, continue to assist regional and local governments with greater funding difficulties and give a boost to those which have managed to overcome them. On the other, it is intended to reduce the number of funds set up to finance liquidity support mechanisms and improve the efficiency of their management. Thus, two funds are set up, the Fund for Financing Regional Governments (FFCA) and the Fund for Financing Local Governments (FFEL). These funds are compartmentalized to adapt them to the financial needs of the aforementioned regional and local governments, and are treated as additional funding mechanisms.
United States Supervision and Regulation
Our operations are subject to extensive federal and state banking and securities regulation and supervision in the United States. We engage in U.S. banking activities directly through our New York branch and indirectly through Santander UK’s branch in Connecticut, our subsidiary Edge Act corporation, Banco Santander International, in Miami, Banco Santander Puerto Rico (“Santander Puerto Rico”) in Puerto Rico, Santander Bank, a national bank that has branches throughout the Northeast U.S., and Santander Consumer USA, an auto financing company. We also engage in securities activities in the United States directly through our broker-dealer subsidiaries, Santander Securities Corporation and Santander Investment Securities Inc.
Disclosure pursuant to Section 219 of the Iran threat reduction and Syria human rights act
Pursuant to Section 219 of the Iran Threat Reduction and Syria Human Rights Act of 2012, which added Section 13(r) to the Securities Exchange Act of 1934, as amended (the “Exchange Act”), an issuer is required to disclose in its annual or quarterly reports, as applicable, whether it or any of its affiliates knowingly engaged in certain activities, transactions or dealings relating to Iran or with individuals or entities designated pursuant to certain Executive Orders. Disclosure is generally required even where the activities, transactions or dealings were conducted in compliance with applicable law.
The following activities are disclosed in response to Section 13(r) with respect to affiliates of Santander UK within the Group. During the period covered by this annual report:
(a) Santander UK holds frozen savings and current accounts for three customers resident in the U.K. who are currently designated by the U.S. for terrorism. The accounts held by each customer were blocked after the customer’s designation and have remained blocked and dormant throughout 2014. No revenue has been generated by Santander UK on these accounts. The bank account held for one of these customers was closed in the fourth quarter of 2014.
114
Table of Contents
(b) An Iranian national, resident in the U.K., who is currently designated by the U.S. under the Iranian Financial Sanctions Regulations and the Non-Proliferation of Weapons of Mass Destruction (“NPWMD”) designation, holds a mortgage with Santander UK that was issued prior to any such designation. No further drawdown has been made (or would be allowed) under this mortgage although we continue to receive repayment instalments. In 2014, total revenue in connection with the mortgage was approximately £2,580 while net profits were negligible relative to the overall profits of Santander UK. Santander UK does not intend to enter into any new relationships with this customer, and any disbursements will only be made in accordance with applicable sanctions. The same Iranian national also holds two investment accounts with Santander Asset Management UK Limited. The accounts have remained frozen during 2014. The investment returns are being automatically reinvested, and no disbursements have been made to the customer. Total revenue for the Group in connection with the investment accounts was approximately £250 while net profits in 2014 were negligible relative to the overall profits of Banco Santander, S.A.
(c) In addition, during the third quarter 2014, Santander UK has identified two additional customers. A U.K. national designated by the U.S. under the NPWMD sanctions program held a business account. No transactions were made and the account was closed in the fourth quarter of 2014. No revenue or profit has been generated. A second U.K. national designated by the U.S. for terrorism held a personal current account and a personal credit card account, both of which were closed in the third quarter. Although transactions took place on the current account during the third quarter of 2014, revenue and profits generated were negligible. No transactions took place on the credit card.
In addition, the Group has certain legacy export credits and performance guarantees with Bank Mellat, which are included in the U.S. Department of the Treasury’s Office of Foreign Assets Control’s Specially Designated Nationals and Blocked Persons List. The Bank entered into two bilateral credit facilities in February 2000 in an aggregate principal amount of €25.9 million. Both credit facilities matured in 2012. In addition, in 2005 Banco Santander participated in a syndicated credit facility for Bank Mellat of €15.5 million, which matures on July 6, 2015. As of December 31, 2014, the Group was owed €2.3 million under this credit facility.
Banco Santander has not been receiving payments from Bank Mellat under any of these credit facilities in recent years. Banco Santander has been and expects to continue to be repaid any amounts due by official export credit agencies, which insure between 95% and 99% of the outstanding amounts under these credit facilities. No funds have been extended by Santander under these facilities since they were granted.
The Group also has certain legacy performance guarantees for the benefit of Bank Sepah and Bank Mellat (stand-by letters of credit to guarantee the obligations—either under tender documents or under contracting agreements—of contractors who participated in public bids in Iran) that were in place prior to April 27, 2007. However, should any of the contractors default in their obligations under the public bids, the Group would not be able to pay any amounts due to Bank Sepah or Bank Mellat because any such payments would be frozen pursuant to Council Regulation (EU) No. 961/2010.
In the aggregate, all of the transactions described above resulted in approximately €41,000 gross revenues and approximately €80,500 net loss to the Group in the year ended December 31, 2014, all of which resulted from the performance of export credit agencies rather than any Iranian entity. The Group has undertaken significant steps to withdraw from the Iranian market such as closing its representative office in Iran and ceasing all banking activities therein, including correspondent relationships, deposit taking from Iranian entities and issuing export letters of credit, except for the legacy transactions described above. The Group is not contractually permitted to cancel these arrangements without either (i) paying the guaranteed amount—which payment would be frozen as explained above (in the case of the performance guarantees), or (ii) forfeiting the outstanding amounts due to it (in the case of the export credits). As such, the Group intends to continue to provide the guarantees and hold these assets in accordance with company policy and applicable laws.
Dodd-Frank Act
On July 21, 2010, the United States enacted the Dodd-Frank Act, which provides a broad framework for significant regulatory changes that has already extended, and will continue to extend, to almost every area of U.S. financial regulation. Implementation of the Dodd-Frank Act requires further detailed rulemaking over several years by different U.S. regulators, including the Office of the Comptroller of the Currency (the “OCC”), the Board of Governors of the Federal Reserve System (the “Federal Reserve Board”), the Securities and Exchange Commission (the “SEC”), the Federal Deposit Insurance Corporation (the “FDIC”), the Commodity Futures Trading Commission (the “CFTC”) and the newly created Financial Stability Oversight Council (the “Council”) and Consumer Financial Protection Bureau (the “CFPB”), although uncertainty remains to some degree about the final details, timing and impact of the rules.
115
Table of Contents
Within the Dodd-Frank Act, the Volcker Rule prohibits “banking entities” from engaging in certain forms of proprietary trading or from sponsoring, investing in, or entering into certain credit-related transactions with related covered funds, in each case subject to certain exceptions. The Volcker Rule became effective on July 21, 2012 and on December 10, 2013, U.S. regulators issued final rules implementing the Volcker Rule. The statute and final rules also contain exclusions and certain exemptions for market-making, hedging, underwriting, trading in U.S. government and agency obligations as well as certain foreign government obligations, trading solely outside the United States, and also permit certain ownership interests in certain types of funds to be retained. On December 10, 2013, the Federal Reserve Board issued an order extending the period for all banking entities to conform with the Volcker Rule and implement a compliance program until July 21, 2015. In December 2014, the Federal Reserve Board issued an order extending the Volcker Rule’s general conformance period until July 21, 2016 for investments in and relationships with covered funds and certain foreign funds that were in place on or prior to December 31, 2013 (“legacy covered funds”), and stated its intention to grant a final one-year extension of the general conformance period, to July 21, 2017, for banking entities to conform ownership interests in and relationships with legacy covered funds. This extension of the conformance period does not apply to the Volcker Rule’s prohibitions on proprietary trading and does not appear to apply to any investments in and relationships with covered funds put in place after December 31, 2013. Banking entities, such as the Bank, must bring their activities and investments into compliance with the requirements of the Volcker Rule by the end of the conformance period. We continue to assess how the final rules implementing the Volcker Rule will affect our businesses and are developing and implementing plans to bring affected businesses into compliance. It is expected that our non-U.S. banking organizations, such as the Bank, will largely be able to continue their activities outside the United States in reliance on the “solely outside the U.S.” exemptions under the Volcker Rule and its implementing regulations.
The Dodd-Frank Act also provides regulators with authority to impose greater capital, leverage and liquidity requirements and other prudential standards, particularly for financial institutions that pose significant systemic risk. However, in imposing heightened capital, leverage, liquidity and other prudential standards on non-U.S. banks such as us, the Federal Reserve Board is directed to take into account the principle of national treatment and equality of competitive opportunity, and the extent to which the foreign bank is subject to comparable home country standards (although certain of our activities will be subject to the U.S. standards).
Pursuant to this authority, in February 2014, the Federal Reserve Board approved a final rule to enhance its supervision and regulation of the U.S. operations of foreign banking organizations (“FBOs”) such as us. Under the Federal Reserve Board’s rule, FBOs with $50 billion or more in U.S. assets held outside of their U.S. branches and agencies (“Large FBOs”), will be required to create a separately capitalized top-tier U.S. intermediate holding company (“IHC”) that will hold substantially all of the FBO’s U.S. bank and nonbank subsidiaries, such as Santander Bank. An IHC will be subject to U.S. risk-based and leverage capital, liquidity, risk management, stress testing and other enhanced prudential standards on a consolidated basis. Under the final rule, a Large FBO that is subject to the IHC requirement may request permission from the Federal Reserve to establish multiple IHCs or use an alternative organizational structure. The final rule also permits the Federal Reserve to apply the IHC requirement in a manner that takes into account the separate operations of multiple foreign banks that are owned by a single Large FBO. Although U.S. branches and agencies of a Large FBO will not be required to be held beneath an IHC, such branches and agencies will be subject to liquidity, and, if stress-test requirements are not met, certain asset maintenance requirements. Large FBOs generally will be required to establish IHCs and comply with the enhanced prudential standards beginning July 1, 2016. An IHC’s compliance with applicable U.S. leverage ratio requirements is generally delayed until January 1, 2018. FBOs that had $50 billion or more in non-branch/agency U.S. assets as of June 30, 2014, such as us, were required to submit an implementation plan by January 1, 2015 on how the FBO will comply with the IHC and other requirements. Enhanced prudential standards will apply to our top-tier U.S.-based bank holding companies beginning on January 1, 2015 until we form or designate an IHC and the IHC becomes subject to corresponding enhanced prudential standards. The Federal Reserve Board has stated that it will issue, at a later date, final rules to implement certain other enhanced prudential standards under the Dodd-Frank Act for large bank holding companies and large FBOs, including single counterparty credit limits and an early remediation framework.
U.S. regulators will also be able to restrict the size and growth of systemically significant non-bank financial companies and large interconnected bank holding companies and will be required to impose bright-line debt-to-equity ratio limits on financial companies that the Council determines pose a grave threat to financial stability.
Furthermore, the Dodd-Frank Act provides for an extensive framework for the regulation of OTC derivatives, including mandatory clearing, exchange trading and transaction reporting of certain OTC derivatives. Entities that are swap dealers, security-based swap dealers, major swap participants or major security-based swap participants are required to register with the CFTC or the SEC, or both, and are or will be subject to new capital, margin, business
116
Table of Contents
conduct, recordkeeping, clearing, execution, reporting and other requirements. Banco Santander, S.A. and Abbey National Treasury Services plc became provisionally registered as swap dealers with the CFTC on July 8, 2013 and November 4, 2013, respectively. In addition, we may register one more subsidiary as a swap dealer with the CFTC. Although many significant regulations applicable to swap dealers are already in effect, some of the most important rules, such as margin requirements for uncleared swaps and capital rules for swap dealers, have not yet been implemented and we continue to assess how compliance with these new rules will affect our business.
The Dodd-Frank Act removed, effective in July 2011, a longstanding prohibition on the payment of interest on demand deposits by our FDIC-insured bank subsidiaries and our New York branch. The Dodd-Frank Act also requires that the lending limits applicable to Santander Bank, Santander Puerto Rico, and our New York branch take into account credit exposure arising from derivative transactions, and that those applicable to Santander Bank and our New York branch also take into account securities borrowing and lending transactions and repurchase and reverse repurchase agreements with counterparties. The OCC has issued a final rule implementing the Dodd-Frank Act’s provisions relating to lending limits. Also, under the so-called swap “push-out” provisions of the Dodd-Frank Act, certain derivatives activities of FDIC-insured banks and U.S. branch offices of foreign banks (including our New York branch) are restricted or prohibited effective July 2015. In December 2014, the United States enacted an amendment to the swap “push-out” provision of the Dodd-Frank Act that significantly narrows the scope of derivatives subject to the restrictions or prohibitions, effectively limiting the provision to certain derivatives based on asset-backed securities.
In addition, Title I of the Dodd-Frank Act and the implementing regulations issued by the Federal Reserve Board and the FDIC require each bank holding company with assets of $50 billion or more, including us, to prepare and submit annually to the Federal Reserve Board and the FDIC a plan for the orderly resolution of our subsidiaries and operations that are domiciled in the United States in the event of future material financial distress or failure. In addition, each insured depository institution (“IDI”) with assets of $50 billion or more, such as the Bank, must submit a separate IDI resolution plan annually to the FDIC. The Title I and IDI plans each must include information on resolution strategy, major counterparties and interdependencies, among other things, and require substantial effort, time and cost to prepare. We submitted our most recent annual U.S. resolution plans in December 2014. The Title I plan resolution plan is subject to review by the Federal Reserve Board and the FDIC and the IDI plan is subject to review by the FDIC only. If the Federal Reserve Board and the FDIC jointly find a bank holding company’s Title I plan to be not credible, and the company fails to correct any deficiencies in a timely manner, the Federal Reserve Board and the FDIC may impose increased capital or liquidity requirements, restrictions on growth, activities or operations, or requirements to divest certain assets or operations.
Regulations that the FDIC or CFPB may adopt could affect the nature of the activities that a bank, such as Santander Bank and Santander Puerto Rico, may conduct, and may impose restrictions and limitations on the conduct of such activities.
The Dodd-Frank Act also grants the SEC discretionary rule-making authority to impose a new fiduciary standard on brokers, dealers and investment advisers, and expands the extraterritorial jurisdiction of U.S. courts over actions brought by the SEC or the United States with respect to violations of the antifraud provisions of the Securities Act of 1933, the Securities Exchange Act of 1934 and the Investment Advisers Act of 1940.
Regulatory Authorities
We are a financial holding company and a bank holding company under the U.S. Bank Holding Company Act of 1956, as amended (the “Bank Holding Company Act”), by virtue of our ownership of Santander Bank, Santander Holdings USA and Santander BanCorp. As a result, we and our U.S. operations are subject to regulation, supervision and examination by the Federal Reserve System, including both the Federal Reserve Board and Federal Reserve Banks, such as the Federal Reserve Bank of New York and the Federal Reserve Bank of Boston.
Certain of our subsidiaries, branches and branches of our subsidiaries are subject to regulation and supervision in the United States. Santander Puerto Rico is a Puerto Rico-chartered bank and its deposits are insured by the FDIC. Santander Puerto Rico is subject to regulation, supervision and examination by the Puerto Rico Office of Financial Institutions and the FDIC. Santander Bank is a federally-chartered national bank, the deposits of which are also insured by the FDIC. Santander Bank is subject to regulation, supervision and examination by the OCC and the FDIC. Our New York branch is supervised by the Federal Reserve Bank of New York and the New York State Department of Financial Services, but its deposits are not insured (or eligible to be insured) by the FDIC. Santander UK’s branch in Connecticut is supervised by the Federal Reserve Bank of New York and the Connecticut Department of Banking. Banco Santander International is supervised by the Federal Reserve Bank of Atlanta. Santander Consumer USA is regulated and supervised by the Federal Reserve Bank of Boston and various state regulators.
117
Table of Contents
Restrictions on Activities
As described below, federal and state banking laws and regulations impose certain requirements and restrict our ability to engage, directly or indirectly through subsidiaries, in activities or make investments, directly or indirectly, in companies in the United States.
As a financial holding company and a bank holding company under the Bank Holding Company Act, we are subject to regulation and supervision by the Federal Reserve Board. As a financial holding company, the scope of our permitted activities and investments in the United States is broader than that permitted for bank holding companies that are not also financial holding companies, although it is nevertheless subject to certain limitations and restrictions. Our U.S. activities and investments are limited to those that are financial in nature or incidental or complementary to a financial activity, as determined by the Federal Reserve Board. To maintain our financial holding company status, we and all of our subsidiaries must be “well capitalized” and “well managed” as determined by the Federal Reserve Board. If at any time we fail to meet these capital and management requirements, the Federal Reserve Board may impose limitations or conditions on the conduct of our activities and we may not commence in the United States any new activities otherwise permissible for financial holding companies or acquire any shares in any U.S. company under Section 4(k) of the Bank Holding Company Act, subject to certain narrow exceptions, without prior Federal Reserve Board approval.
In addition, we are required to obtain the prior approval of the Federal Reserve Board before directly or indirectly acquiring the ownership or control of more than 5% of any class of voting shares of a U.S. bank or other depository institution, or a depository institution holding company. Under the Bank Holding Company Act and Federal Reserve Board regulations, our U.S. banking operations (including our New York branch and Santander Puerto Rico) are also restricted from engaging in certain “tying” arrangements involving products and services. We are also required to act as a source of financial strength for our U.S. bank subsidiaries.
Santander Puerto Rico and Santander Bank are subject to requirements and restrictions under federal and state law, including requirements to maintain reserves against deposits, restrictions on the types and amounts of loans that may be made and the interest that may be charged thereon, and limitations on the types of investments that may be made and the types of services that may be offered. Various consumer laws and regulations also affect the operations of these subsidiaries.
Under U.S. federal banking laws, state-chartered banks (such as Santander Puerto Rico) and state-licensed branches and agencies of foreign banks (such as our New York branch) may not, as a general matter, engage as a principal in any type of activity not permissible for their federally chartered or licensed counterparts, unless (i) in the case of state-chartered banks (such as Santander Puerto Rico), the FDIC determines that the additional activity would pose no significant risk to the FDIC’s Deposit Insurance Fund and is consistent with sound banking practices, and (ii) in the case of state licensed branches and agencies (such as our New York branch), the Federal Reserve Board determines that the additional activity is consistent with sound banking practices. United States federal banking laws also subject state branches and agencies to the single-borrower lending limits, which are substantially similar to the lending limits applicable to national banks. For our U.S. branches, these single-borrower lending limits are based on the worldwide capital of the entire foreign bank (e.g., Banco Santander, S.A. in the case of our New York branch).
Under the International Banking Act of 1978, as amended, the Federal Reserve Board may terminate the activities of any U.S. office of a foreign bank if it determines (i) that the foreign bank is not subject to comprehensive supervision on a consolidated basis in its home country (unless the home country is making demonstrable progress toward establishing such supervision), (ii) that there is reasonable cause to believe that such foreign bank or its affiliate has violated the law or engaged in an unsafe or unsound banking practice in the United States and, as a result of such violation or practice, the continued operation of the U.S. office would be inconsistent with the public interest or with the purposes of federal banking laws or, (iii) for a foreign bank that presents a risk to the stability of the U.S. financial system, the home country of the foreign bank has not adopted, or made demonstrable progress toward adopting, an appropriate system of financial regulation to mitigate such risk.
There are various qualitative and quantitative restrictions on the extent to which we and our nonbank subsidiaries can borrow or otherwise obtain credit from our U.S. banking subsidiaries or engage in certain other transactions involving those subsidiaries. In general, these transactions must be on terms that would ordinarily be offered to unaffiliated entities must be secured by designated amounts of specified collateral and are subject to volume limitations. These restrictions also apply to certain transactions of our New York branch with certain of our U.S. affiliates. Effective in July 2012, the Dodd-Frank Act subjects credit exposures arising from derivative transactions, securities borrowing and lending transactions, and repurchase/reverse repurchase agreements to these collateral and volume limitations. The Federal Reserve Board has not yet issued regulations to implement these changes made by the Dodd-Frank Act.
118
Table of Contents
A major focus of U.S. governmental policy relating to financial institutions is aimed at preventing money laundering and terrorist financing and compliance with economic sanctions in respect of designated countries or activities. Failure of an institution to have policies and procedures and controls in place to prevent, detect and report money laundering and terrorist financing could in some cases have serious legal, financial and reputational consequences for the institution.
Our U.S. Bank Holding Company Subsidiary
Certain of our U.S. banking subsidiaries, including Santander Holdings USA, our U.S. bank holding company subsidiary, are subject to stress testing and capital planning requirements under regulations implementing the Dodd-Frank Act. In March 2014 and 2015, the Federal Reserve Board, as part of its Comprehensive Capital Analysis and Review (“CCAR”) process, objected on qualitative grounds to the capital plans submitted by Santander Holdings USA. In its 2015 public report on CCAR, the Federal Reserve Board cited widespread and critical deficiencies in Santander Holdings USA’s capital planning processes, including specific deficiencies in governance, internal controls, risk identification and risk management, management information systems, and supporting assumptions and analysis. As a result of the 2014 and 2015 CCAR objections, Santander Holdings USA is not permitted to make any capital distributions without the Federal Reserve Board’s approval, other than the continued payment of dividends on Santander Holdings USA’s outstanding class of preferred stock, until a new capital plan is approved by the Federal Reserve Board. The deadline for Santander Holdings USA’s next capital plan submission is in January 2016, and there is a risk that the Federal Reserve Board will object to Santander Holdings USA’s next capital plan.
In addition, we are subject to supervisory actions in the United States. Specifically, on September 15, 2014, Santander Holdings USA and the Federal Reserve Bank of Boston (“FRB Boston”) executed a written agreement relating to a subsidiary’s declaration and payment of dividends in the second quarter of 2014 without the Federal Reserve Board’s approval. Under the written agreement, Santander Holdings USA agreed to submit to the FRB Boston written procedures to strengthen board oversight of management regarding planned capital distributions by Santander Holdings USA and its subsidiaries. In addition, Santander Holdings USA agreed to subject future distributions to the prior written approval of Federal Reserve System and to take necessary actions to ensure that no such distributions are made without the Federal Reserve Board’s approval.
As a separate supervisory matter, U.S. bank regulatory agencies from time to time take supervisory actions under certain circumstances that restrict or limit a financial institution’s activities. In some instances, we are subject to significant legal restrictions on our ability to publicly disclose these actions or the full details of these actions. In addition, as part of the regular examination process, our U.S. banking subsidiaries’ regulators may advise our U.S. banking subsidiaries to operate under various restrictions as a prudential matter. The U.S. supervisory environment has become significantly more demanding and restrictive since the financial crisis of 2008. Currently, under the U.S. Bank Holding Company Act, we and our U.S. banking subsidiaries may not be able to engage in certain categories of new activities in the United States or acquire shares or control of other companies in the United States. Any such actions or restrictions, if and in whatever manner imposed, could adversely affect our costs and revenues. Moreover, efforts to comply with any nonpublic supervisory actions or restrictions may require material investments in additional resources and systems, as well as a significant commitment of managerial time and attention. As a result, such supervisory actions or restrictions, if and in whatever manner imposed, could have a material adverse effect on our business and results of operations; and, in certain instances, we may be subject to significant legal restrictions on our ability to publicly disclose these matters or the full details of these actions.
Our New York branch
Our New York branch is licensed by the New York Superintendent of Financial Services to conduct a commercial banking business. Its activity is mainly focused on wholesale and investment banking, providing a full range of lending, investment banking, transactional banking and brokerage services to corporate and institutional investors. Under the New York State Banking Law and regulations, our New York branch is required to maintain eligible high-quality assets with banks in the State of New York, as security for the protection of depositors and certain other creditors.
The New York State Banking Law also empowers the Superintendent of Banks to establish asset maintenance requirements for branches of foreign banks, expressed as a percentage of each branch’s liabilities. The presently designated percentage is 0%, although the Superintendent may impose additional asset maintenance requirements upon individual branches on a case-by-case basis.
The New York State Banking Law authorizes the Superintendent of Financial Services to take possession of the business and property of a New York branch of a foreign bank under certain circumstances, generally involving violation of law, conduct of business in an unsafe manner, impairment of capital, suspension of payment of obligations, or initiation of liquidation proceedings against the foreign bank at its domicile or elsewhere. In liquidating
119
Table of Contents
or dealing with a branch’s business after taking possession of a branch, only the claims of depositors and other creditors that arose out of transactions with a branch are to be accepted by the Superintendent of Financial Services for payment out of the business and property of the foreign bank in the State of New York, without prejudice to the rights of the holders of such claims to be satisfied out of other assets of the foreign bank. After such claims are paid, the Superintendent of Financial Services will turn over the remaining assets, if any, to the foreign bank or its duly appointed liquidator or receiver.
Our U.S. Depository Institution Subsidiaries
The Federal Deposit Insurance Corporation Improvement Act of 1991 (the “FDICIA”) provides for extensive regulation of depository institutions (such as Santander Bank and Santander Puerto Rico), including requiring federal banking regulators to take “prompt corrective action” with respect to FDIC-insured depository institutions that do not meet minimum capital requirements. For this purpose, FDICIA establishes five capitalization categories: “well capitalized,” “adequately capitalized,” “undercapitalized,” “significantly undercapitalized” and “critically undercapitalized.” As an insured depository institution’s capital level declines and the depository institution falls into lower categories (or if it is placed in a lower category by the discretionary action of its supervisor), greater limits are placed on its activities and federal banking regulators are authorized (and, in many cases, required) to take increasingly more stringent supervisory actions, which could ultimately include the appointment of a conservator or receiver for the depository institution (even if it is solvent). In addition, FDICIA generally prohibits an FDIC-insured bank from making any capital distribution (including payment of a dividend) or payment of a management fee to its holding company if the bank would thereafter be undercapitalized. If an insured depository institution becomes “undercapitalized,” it is required to submit to federal regulators a capital restoration plan guaranteed by the depository institution’s holding company. If an undercapitalized depository institution fails to submit an acceptable plan, it is treated as if it were “significantly undercapitalized.” Significantly undercapitalized depository institutions may be subject to a number of restrictions, including requirements to sell sufficient voting stock to become adequately capitalized, requirements to reduce total assets and restrictions on accepting deposits from correspondent banks. “Critically undercapitalized” depository institutions are subject to appointment of a receiver or conservator.
In July 2013, the U.S. bank regulators issued the U.S. Basel III final rules implementing the Basel III capital framework for U.S. banks and bank holding companies and other U.S. capital reform. Certain aspects of the U.S. Basel III final rules, such as new minimum capital ratios and a revised methodology for calculating risk-weighted assets, became effective on January 1, 2015 for our U.S. depository institution subsidiaries. These minimum capital ratios include a total capital to risk-weighted assets of 8%, Tier 1 capital to risk-weighted assets of 6% and CET1 capital to risk-weighted assets of 4.5%. Other aspects of the U.S. Basel III final rules, such as the 2.5% capital conservation buffer and the new regulatory deductions from and adjustments to capital, will be phased in over several years beginning on January 1, 2015.
In addition, the Federal Reserve Board and other U.S. regulators issued in September 2014 a final rule implementing a quantitative liquidity coverage ratio requirement on certain large banks and bank holding companies. The final liquidity coverage ratio is broadly consistent with the Basel Committee’s revised Basel III liquidity rules, but is more stringent in several important respects. The final rule became effective on January 1, 2015. The Federal Reserve Board has also stated that it intends, through future rulemakings, to apply the Basel III liquidity coverage ratio and net stable funding ratio to the U.S. operations of some or all large FBOs.
Monetary Policy and Exchange Controls
The decisions of the European System of Central Banks influence conditions in the money and credit markets, thereby affecting interest rates, the growth in lending, the distribution of lending among various industry sectors and the growth of deposits. Monetary policy has had a significant effect on the operations and profitability of Spanish banks in the past and this effect is expected to continue in the future. Similarly, the monetary policies of governments in other countries in which we have operations, particularly in Latin America, the United States and the United Kingdom, affect our operations and profitability in those countries. We cannot predict the effect which any changes in such policies may have upon our operations in the future, but we do not expect it to be material.
The European Monetary Union has had a significant effect upon foreign exchange and bond markets and has involved modification of the internal operations and systems of banks and of inter-bank payments systems. Since January 1, 1999, the start of Stage III, see “—Supervision and Regulation—Single Supervisory Mechanism, Bank of Spain and the European Central Bank,” Spanish monetary policy has been affected in several ways. The euro has become the national currency of the fifteen participating countries and the exchange rates between the currencies of these countries were fixed to the euro. Additionally, the European System of Central Banks became the entity in charge of the European Union’s monetary policy.
120
Table of Contents
Banco Santander, S.A. is the parent company of the Group which was comprised at December 31, 2014 of 833 companies that consolidate by the global integration method. In addition, there were 209 companies that were accounted for by the equity method.
See Exhibits I, II and III to our consolidated financial statements included in this Form 20-F for details of our consolidated and non-consolidated companies.
D. Property, plant and equipment.
During 2014, the Bank and its banking subsidiaries either leased or owned premises in Spain and abroad, which at December 31, 2014 included 3,511 branch offices in Spain and 9,440 abroad. These figures include traditional branches and banking services points but do not include electronic service points. See note 16 to our consolidated financial statements.
Item 4A. Unresolved Staff Comments
None.
121
Table of Contents
Item 5. Operating and Financial Review and Prospects
Critical Accounting Policies
The preparation of the Group’s consolidated financial statements requires a significant amount of judgment involving estimates and assumptions which can be inherently uncertain at the time they are made (see note 1.c to our consolidated financial statements). Changes in assumptions may have a significant impact on the financial statements in the periods in which they are changed. Judgments or changes in assumptions are submitted to the audit committee of the board of directors and/or to our regulatory authorities and are disclosed in the notes to our consolidated financial statements.
Management bases its estimates and judgments on historical experience and on various other factors that are believed to be reasonable under current circumstances. Actual results may differ from these estimates if assumptions and conditions change.
We believe that of our significant accounting policies, the following may involve a high degree of judgment:
Fair value of financial instruments
Trading assets or liabilities, financial instruments that are classified at fair value through profit or loss, available for sale securities, and all derivatives are recorded at fair value on the balance sheet. The fair value of a financial instrument on a given date is taken to be the price that would be received in a sale of an asset or paid to transfer a liability in an orderly transaction between market participants. The most objective and common reference for the fair value of a financial instrument is the price that would be paid for it on an active, transparent and deep market (quoted price or market price).
If there is no market price for a given financial instrument, its fair value is estimated on the basis of the price established in recent transactions involving similar instruments and, in the absence thereof, of valuation techniques commonly used by the international financial community, taking into account the specific features of the instrument to be measured and, particularly, the various types of risk associated with it.
We use derivative financial instruments for both trading and non-trading activities. The principal types of derivatives used are interest rate swaps, future rate agreements, interest rate options and futures, foreign exchange forwards, foreign exchange futures, foreign exchange options, foreign exchange swaps, cross currency swaps, equity index futures and equity options. The fair value of standard derivatives is calculated based on published price quotations. The fair value of over-the-counter (“OTC”) derivatives is taken to be the sum of the future cash flows arising from the instrument, discounted to present value at the date of measurement (present value or theoretical close) using valuation techniques commonly used by the financial markets: net present value (NPV), option pricing models and other methods.
The following subsections set forth the most important products and families of derivatives, and the related valuation techniques and inputs, by asset class.
| • | Fixed income and inflation |
The fixed income asset class includes basic instruments such as interest rate forwards, interest rate swaps and cross currency swaps, which are valued using the net present value of the discounted estimated future cash flows taking into account basis swap and cross currency spreads, depending on the payment frequency and currency of each leg of the derivative. Vanilla options, including caps, floors and swaptions, are priced using the Black-Scholes model, which is one of the benchmark industry models. More exotic derivatives are priced using more complex models which are generally accepted as standard across institutions.
These pricing models are fed with observable market data such as deposit interest rates, futures rates, cross currency swap and constant maturity swap rates, and basis spreads, on the basis of which different yield curves are calculated, depending on the payment frequency and discounting curves for each currency. In the case of options, implied volatilities are also used as model inputs. These volatilities are observable in the market for cap and floor options and swaptions, and interpolation and extrapolation of volatilities from the quoted ranges are carried out using generally accepted industry models. The pricing of more exotic derivatives may require the use of non-observable data or parameters, such as correlation (among interest rates and cross-asset), mean reversion rates and prepayment rates, which are usually defined from historical data or through calibration.
Inflation-related assets include inflation-linked bonds and zero-coupon or year-on-year inflation-linked swaps, valued with the present value method using forward estimation and discounting. Derivatives on inflation indices are priced using standard and more complex bespoke models, as appropriate. Valuation inputs of these
122
Table of Contents
models consider inflation-linked swap spreads observable in the market and estimations of inflation seasonality, on the basis of which a forward inflation curve is calculated. Also, implied volatilities taken from zero-coupon and year-on-year inflation options are also inputs for the pricing of more complex derivatives.
| • | Equity and foreign exchange |
The most important products in these asset classes are forward and futures contracts; they also include vanilla, listed and OTC (over-the-counter) derivatives on single underlying assets and baskets of assets. Vanilla options are priced using the standard Black-Scholes model and more exotic derivatives involving forward returns, average performance, or digital, barrier or callable features are priced using generally accepted industry models and bespoke models, as appropriate. For derivatives on illiquid stocks, hedging takes into account the liquidity constraints in models.
The inputs of equity models consider yield curves, spot prices, dividends, asset borrowing costs (repo margin spreads), implied volatilities, correlation among equity stocks and indices, and cross-asset correlation. Implied volatilities are obtained from market quotes of European and American vanilla call and put options. Various interpolation and extrapolation techniques are used to obtain continuous volatility surfaces for illiquid stocks. Dividends are usually estimated for the mid and long term. Correlations are implied, when possible, from market quotes of correlation-dependent products. In all other cases, proxies are used for correlations between benchmark underlyings or correlations are obtained from historical data.
The inputs of foreign exchange models include the yield curve for each currency, the spot foreign exchange price and the implied volatilities and correlation among assets of this type. Volatilities are obtained from European call and put options which are quoted in markets as at-the-money, risk reversal or butterfly options. Illiquid currency pairs are usually handled by using the data of the liquid pairs from which the illiquid currency can be derived. For more exotic products, unobservable model parameters may be estimated by fitting to reference prices provided by other non-quoted market sources.
| • | Credit |
The most common instrument in this asset class is the credit default swap (CDS), which is used to hedge credit exposure to third parties. In addition, models for first-to-default (FTD), n-to-default (NTD) and single-tranche collateralized debt obligation (CDO) products are also available. These products are valued with standard industry models, which estimate probability of default of a single issuer (for CDSs) or the joint probability of default of more than one issuer for FTDs, NTDs and CDOs.
Valuation inputs are the yield curve, the CDS spread curve and the recovery rate. The CDS spread curve is obtained in the market for indices and important individual issuers. For less liquid issuers, this spread curve is estimated using proxies or other credit-dependent instruments. Recovery rates are usually set to standard values. For listed single-tranche CDOs, the correlation of joint default of several issuers is implied from the market. For FTDs, NTDs and bespoke CDOs, the correlation is estimated from proxies or historical data when no other option is available.
Valuation adjustment for counterparty risk or default risk
The credit valuation adjustment (CVA) is a valuation adjustment to OTC derivatives as a result of the risk associated with the credit exposure assumed to each counterparty.
The CVA is calculated taking into account potential exposure to each counterparty in each future period. The CVA for a specific counterparty is equal to the sum of the CVA for all the periods. The following inputs are used to calculate the CVA:
| • | Expected exposure: including for each transaction the mark-to-market (MtM) value plus an add-on for the potential future exposure for each period. Mitigating factors such as netting and collateral agreements are taken into account, as well as temporary impairment for derivatives with interim payments. |
| • | LGD: percentage of final loss assumed in a counterparty credit event/default. |
| • | Probability of default: for cases where there is no market information (the CDS quoted spread curve, etc.), proxies based on companies holding exchange-listed CDSs, in the same industry and with the same external rating as the counterparty, are used. |
| • | Discount factor curve. |
123
Table of Contents
The debt valuation adjustment (DVA) is a similar valuation adjustment to the CVA but, in this case, as a result of the own risk of the Group assumed by its counterparties in OTC derivatives.
The CVA and DVA recognized by the Group at December 31, 2014 amounted to €786 million and €228 million, respectively.
Valuation adjustments due to model risk
The valuation models described above are not significantly subjective, since they can be adjusted and recalibrated, where appropriate, through the internal calculation of the fair value and the subsequent comparison with the related actively traded price. However, fair value adjustments may be necessary when market quoted prices are not available for comparison purposes.
The sources of risk are associated with uncertain model parameters, illiquid underlying issuers, low quality market data or missing risk factors (sometimes the best available option is to use limited models with controllable risk). In these situations, we calculate and apply valuation adjustments in accordance with general industry practice.
The measurements obtained using the internal models might have been different had other methods or assumptions been used with respect to interest rate risk, to credit risk, market risk and foreign currency risk spreads, or to their related correlations and volatilities.
In note 2. d) iii. to our consolidated financial statements additional information can be found regarding valuation techniques used by the Group, along with details of the principal assumptions and estimates used in these models and the effect on the fair value of a reasonable change in the assumptions used in the valuation.
Allowance for credit losses for financial instruments accounted for at amortized cost
Financial assets accounted for at amortized cost and contingent liabilities are assessed for objective evidence of impairment and any resulting allowances for credit losses are recognized and measured in accordance with IAS 39. Credit losses exist if the carrying amount of an asset or claim or a portfolio of assets or claims exceeds the present value of the estimated future cash flows.
When a loan is deemed partially uncollectible, a provision is recorded (charged against earnings) as opposed to a partial write-off (derecognition from the balance sheet), since a partial write-off of the loan is not permitted by the Bank of Spain. If a loan becomes entirely uncollectible, the provision is increased to 100% of the loan balance. Accordingly, we recognize a credit loss on any loan at the time it is deemed to be impaired.
The credit loss recognition process is independent of the process for the derecognition of non-performing loans from the balance sheet. The balances relating to impaired transactions continue to be recognized on the balance sheet, for their full amounts, until we consider that the recovery of those amounts is remote.
We consider recovery to be remote when there has been a substantial and irreversible deterioration of the borrower’s solvency, when commencement of the liquidation phase of insolvency proceedings has been ordered or when more than four years have elapsed since the borrower’s transaction was classified as non-performing due to arrears (the maximum period established by the Bank of Spain).
When the recovery of a financial asset is considered remote, it is charged-off, together with the related allowance, without prejudice to any actions that the consolidated entities may initiate to seek collection until their contractual rights are extinguished due to expiry of the statute of limitations period, forgiveness or any other cause.
For the purpose of determining impairment losses, we monitor our debtors as described below:
| • | Individually for significant debt instruments and for instruments which, although not material, are not susceptible to being classified in a group of financial assets with similar credit risk characteristics, which are classified by the Group as “individualized”. This category includes wholesale banking enterprises, financial institutions and certain retail banking enterprises. |
| • | Collectively, in all other cases, which are classified by the Group as “standardized” by grouping together instruments having similar credit risk characteristics indicative of the debtors’ ability to pay all principal and interest amounts in accordance with the contractual terms. The credit risk characteristics considered for the purpose of grouping the assets are, inter alia, instrument type, debtor’s industry and geographical location, type of guarantee or collateral, age of past-due amounts and any other relevant factor for the estimation of future cash flows. This category includes exposures to individuals, individual entrepreneurs and retail banking enterprises not classified as individualized customers. |
124
Table of Contents
As regards impairment losses resulting from materialization of the insolvency risk of the obligors (credit risk), a debt instrument is non-performing due to insolvency:
| • | When there is evidence of a deterioration of the obligor’s ability to pay, either because it is in arrears or for other reasons, and/or |
| • | When country risk materializes: country risk is considered to be the risk associated with debtors resident in a given country due to circumstances other than normal commercial risk. |
We have certain policies, methods and procedures for covering its credit risk arising both from insolvency allocable to counterparties and from country risk. These policies, methods and procedures are applied in the granting, examination and documentation of debt instruments and contingent liabilities and commitments, and in the identification of their impairment and the calculation of the amounts required to cover the related credit risk.
With respect to the coverage of loss arising from credit risk, we must meet the Bank of Spain requirements, which establish that, until the Spanish regulatory authority has verified and approved the internal models for the calculation of the allowance for losses arising from credit risk (to date it has only approved the internal models to be used to calculate regulatory capital), entities must calculate their credit risk coverage as set forth below:
a. Specific allowance (individuals):
The allowance for debt instruments not measured at fair value through profit or loss that are classified as non-performing is generally recognized in accordance with the criteria set forth below:
i. Assets classified as non-performing due to counterparty arrears:
Debt instruments, whoever the obligor and whatever the guarantee or collateral, with amounts more than three months past due are assessed individually, taking into account the age of the past-due amounts, the guarantees or collateral provided and the financial situation of the counterparty and the guarantors.
ii. Assets classified as non-performing for reasons other than counterparty arrears:
Debt instruments which are not classifiable as non-performing due to arrears but for which there are reasonable doubts as to their repayment under the contractual terms are assessed individually, and their allowance is the difference between the amount recognized in assets and the present value of the cash flows expected to be received.
b. General allowance for inherent losses (collective):
Based on its experience and on the information available to it on the Spanish banking industry, the Bank of Spain has established various categories of debt instruments and contingent liabilities, classified as standard risk, which are recognized at Spanish entities or relate to transactions performed on behalf of residents in Spain which are recognized in the accounting records of foreign subsidiaries, and has applied a range of required allowances to each category.
c. Country risk allowance:
Country risk is considered to be the risk associated with counterparties resident in a given country due to circumstances other than normal commercial risk (sovereign risk, transfer risk and risks arising from international financial activity). Based on the countries’ economic performance, political situation, regulatory and institutional framework, and payment capacity and record, we classify all the transactions performed with third parties into six different groups, from group 1 (transactions with ultimate obligors resident in European Union countries, Norway, Switzerland, Iceland, the United States, Canada, Japan, Australia and New Zealand) to group 6 (transactions the recovery of which is considered remote due to circumstances attributable to the country), assigning to each group the credit loss allowance percentages resulting from the aforementioned analyses. However, due to the size of the Group and to the proactive management of our country risk exposure, the allowances recognized relating to this matter are not material with respect to the credit loss allowances recognized.
125
Table of Contents
The allowance for credit losses for financial instruments accounted for at amortized cost and contingent liabilities recorded by Grupo Santander as at December 31, 2014, using the methodology outlined above, was €27,975 million.
However, the coverage of the Group’s losses arising from credit risk must also meet the regulatory requirements of IFRS-IASB and, therefore, we check the allowances calculated as described above with those obtained from our own internal models for the calculation of the coverage of losses arising from credit risk in order to confirm that there are no material differences.
Our internal models (a full description of our credit risk management system is included in Item 4. Information on the Company—B. Business Overview—Allowance for Credit Losses and Country Risk Requirements and in Item 11. Quantitative and Qualitative Disclosures about Market Risk—Part 4. Credit Risk) determine the impairment losses on debt instruments not measured at fair value through profit or loss and on contingent liabilities taking into account the historical experience of impairment and other circumstances known at the time of assessment. For these purposes, impairment losses on loans are losses incurred at the reporting date, calculated using statistical methods.
The amount of an impairment loss incurred on a debt instrument carried at amortized cost is equal to the difference between its carrying amount and the present value of its estimated future cash flows. In estimating the future cash flows of debt instruments the following factors are taken into account:
| • | All the amounts that are expected to be obtained over the remaining life of the instrument, including, where appropriate, those which may result from the collateral provided for the instrument (less the costs for obtaining and subsequently selling the collateral). The impairment loss takes into account the likelihood of collecting accrued past-due interest receivable; |
| • | The various types of risk to which each instrument is subject; and |
| • | The circumstances in which collections will foreseeably be made. |
These cash flows are subsequently discounted using the instrument’s effective interest rate (if its contractual rate is fixed) or the effective contractual rate at the discount date (if it is variable).
The loss incurred is calculated by multiplying three factors: exposure at default, probability of default and loss given default. These parameters are also used to calculate economic capital and to calculate BIS II regulatory capital under internal models.
| • | Exposure at default (EaD) is the amount of risk exposure at the date of default by the counterparty. |
| • | Probability of default (PD) is the probability of the counterparty failing to meet its principal and/or interest payment obligations. The probability of default is associated with the rating/scoring of each counterparty/transaction. |
| • | For the purposes of calculating the incurred losses PD is measured using a time horizon of one year; i.e. it quantifies the probability of the counterparty defaulting in the coming year due to an event that had already occurred at the assessment date. The definition of default used includes amounts past due by 90 days or more and cases in which there is no default but there are doubts as to the solvency of the counterparty (subjective non-performing assets). |
| • | Loss given default (LGD) is the loss arising in the event of default. It depends mainly on the present value of the guarantees associated with the transaction and other the future flows that are expected to be recovered. |
In addition to all of the above, the calculation of the incurred loss takes into account the adjustment to the current situation of the aforementioned factors (PD and LGD) considering our historical experience and other specific information to reflect the current conditions.
At December 31, 2014 there is no material difference in the calculation of loan allowances between the EU-IFRS required to be applied under the Bank of Spain’s Circular 4/2004 (as explained above) and IFRS-IASB.
Impairment
Certain assets, including goodwill, other intangible assets, non-current assets held for sale, equity method investments, financial assets not carried at fair value through profit or loss and other assets are subject to impairment review. We record impairment charges when we believe there is objective evidence of impairment, or that the cost of the assets may not be recoverable. Assessment of what constitutes impairment is a matter of significant judgment.
126
Table of Contents
Goodwill and other intangible assets are tested for impairment on an annual basis, or more frequently if events or changes in circumstances, such as an adverse change in business climate or observable market data, indicate that these assets may be impaired. An impairment loss recognized for goodwill may not be reversed in a subsequent period. The fair value determination used in the impairment assessment requires estimates based on quoted market prices, prices of comparable businesses, present value or other valuation techniques, or a combination thereof, requiring management to make subjective judgments and assumptions. Events and factors that may significantly affect the estimates include, among others, competitive forces, customer behaviors and attrition, changes in revenue growth trends, cost structures and technology, and changes in discount rates and specific industry or market sector conditions.
In relation to goodwill, the first step of the impairment review process requires the identification of the cash-generating units (“CGU”). These are the smallest identifiable group of assets that, as a result of continuing operations, generate cash inflows that are largely independent of the cash inflows from other assets or groups of assets. Goodwill is then allocated to these CGUs; this allocation is reviewed following business reorganization.
The amount to be recovered of each cash-generating unit is determined taking into consideration the carrying amount (including any fair value adjustments arising on the business combination) of all the assets and liabilities of all the independent legal entities comprising the cash-generating unit, together with the related goodwill.
The amount to be recovered of the cash-generating unit is compared with its recoverable amount in order to determine whether there is any impairment.
The Group assesses the existence of any indication that might be considered to be evidence of impairment of the cash-generating unit by reviewing information including the following: (i) certain macroeconomic variables that might affect its investments (population data, political situation, economic situation -including bankarization-, among others) and (ii) various microeconomic variables comparing our investments with the financial services industry of the country in which the Group carries on most of its business activities (balance sheet composition, total funds under management, results, efficiency ratio, capital adequacy ratio, return on equity, among others).
Regardless of whether there is any indication of impairment, every year the Group calculates the recoverable amount of each cash-generating unit to which goodwill has been allocated and, to this end, it uses price quotations, if available, market references (multiples), internal estimates and based in part on third-party appraisals.
Firstly, we determine the recoverable amount by calculating the fair value of each cash-generating unit on the basis of the quoted price of the cash-generating units, if available, and of the price earnings ratios of comparable local entities.
In addition, we perform estimates of the recoverable amounts of certain cash-generating units by calculating their value in use using discounted cash flow projections. The main assumptions used in this calculation are: (i) earnings projections based on the financial budgets approved by the directors which normally cover a five-year period (unless a longer time horizon can be justified), (ii) discount rates determined as the cost of capital taking into account the risk-free rate of return plus a risk premium in line with the market and the business in which the units operate and (iii) constant growth rates used in order to extrapolate earnings to perpetuity which do not exceed the long-term average growth rate for the market in which the cash-generating unit in question operates.
The cash flow projections used to obtain the values in use are based on the financial budgets approved by both local management of the related local units and the Group’s directors. Our budgetary estimation process is common for all the cash-generating units. The local management teams prepare their budgets using the following key assumptions:
| a) | Microeconomic variables of the cash-generating unit: management takes into consideration the current balance sheet structure, the product mix on offer and the business decisions taken by local management in this regard. |
| b) | Macroeconomic variables: growth is estimated on the basis of the changing environment; taking into consideration expected GDP growth in the unit’s geographical location and forecast trends in interest and exchange rates. These data, which are based on external information sources, are provided by the Group’s economic research service. |
| c) | Past performance variables: in addition, management takes into consideration in the projection the difference (both positive and negative) between the cash-generating unit’s past performance and that of the market. |
Given the degree of uncertainty of these assumptions, we perform a sensitivity analysis thereof using reasonable changes in the key assumptions on which the recoverable amount of the cash-generating units is based in order to confirm whether their recoverable amount still exceeds their carrying amount. Following the sensitivity analysis performed, the value in use of all the cash-generating units still exceeds their recoverable amount.
127
Table of Contents
Based on the foregoing, and in accordance with the estimates, projections and sensitivity analyses available to the Bank’s directors, in 2014 we recognized impairment losses on goodwill totaling €2 million (2013: €40; 2012: €156 million) under Impairment losses on other assets (net)—Goodwill and other intangible assets. In 2012 the impairment losses recognized, which were due mainly to the deterioration of business expectations, related mainly to Group subsidiaries in Italy.
At December 31, 2014, none of the cash-generating units with significant goodwill had a recoverable amount approximating their carrying amount, except for Santander Consumer USA, the recoverable amount of which is very close to its carrying amount since the business combination took place in 2014. The recoverable amount is considered to be close to the carrying amount when reasonable changes in the main assumptions used in the valuation cause the recoverable amount to be below the carrying amount.
Non-current assets held for sale are measured at the lower of fair value less costs to sell and the carrying amount. The Group measures foreclosed property assets located in Spain by taking into consideration the appraisal value on the date of foreclosure and the length of time each asset has been recognized in the balance sheet. Property assets under construction are measured taking into account the current situation of the property, not the final value. In addition, in order to check at the end of each reporting period that the measurement made using the aforementioned criteria does not differ from fair value, the Group requests an independent expert to perform an appraisal. After performing these assessments at December 31, 2014, 2013 and 2012 the allowance that covers the value of our non-current assets held for sale amounted to €5,404 million, €4,955 million and €4,416 million, respectively.
Equity method investments are evaluated for impairment on an annual basis or more frequently if events or changes in circumstances indicate that these assets are impaired. An equity method investment is impaired if its fair value is deemed to be less than its cost. Accordingly, we evaluate whether an event or change in circumstances has occurred that may have a significant adverse effect on the fair value of the investment. In 2014, 2013 and 2012 there was no evidence of material impairment on the Group’s equity method investments.
In relation to the available for sale securities (debt and equity instruments) at the end of each year, we make an assessment of whether there is any objective evidence that any our available for sale securities of is impaired. This assessment includes but is not limited to an analysis of the following information: (i) the issuer’s economic and financial position, the existence of default or late payment, analysis of the issuer’s solvency, the evolution of its business, short-term projections, trends observed with respect to its earnings and, if applicable, its dividend distribution policy; (ii) market-related information such as changes in the general economic situation, changes in the issuer’s sector which might affect its ability to pay; (iii) changes in the fair value of the security analyzed, analysis of the origins of such changes—whether they are intrinsic or the result of the general uncertainty concerning the economy or the country; and (iv) independent analysts’ reports and forecasts and other independent market information.
In the case of quoted equity instruments, when the changes in the fair value of the instrument under analysis are assessed, the duration and significance of the fall in its market price below cost for us is taken into account. As a general rule, for these purposes we consider a significant fall to be a 40% drop in the value of the asset or a continued fall over a period of 18 months. Nevertheless, it should be noted that we assess, on a case-by-case basis each of the securities that have suffered losses, and monitors the performance of their prices, recognizing an impairment loss as soon as it is considered that the recoverable amount could be affected, even though the price may not have fallen by the percentage or for the duration mentioned above.
If, after the above assessment has been carried out, we consider that the presence of one or more of these factors could affect recovery of the cost of the asset, an impairment loss is recognized in the income statement for the amount of the loss in equity under valuation adjustments. Also, where we do not intend and/or are not able to hold the investment for a sufficient amount of time to recover the cost, the instrument is written down to its fair value.
Upon impairment, the full difference between amortized cost and fair value is removed from equity and recognized in net profit or loss. Impairments on debt securities may be reversed if there is a decrease in the amount of the impairment which can be objectively related to an observable event. Impairments on equity securities may not be reversed.
At the end of 2014 we performed the assessment described above and recognized in the consolidated income statement impairment losses of €42 million in respect of debt instruments (€89 million in 2013 and €18 million in 2012). At 2014, 2013 and 2012 year-end, we analyzed the additional unrealized revaluation losses related to debt instruments and we concluded that they were temporary and, therefore, there was no evidence of impairment since the
128
Table of Contents
interest payment schedules for all the securities had been complied with and there was no evidence that the issuers would not continue to meet their payment obligations or that the future payments (both principal and interest) would not be sufficient to recover the cost.
At the end of 2014, 45.62% of the losses recognized under valuation adjustments—available-for-sale financial assets arising from debt securities had been incurred in more than twelve months. Most of the losses on government debt securities recognized in the Group’s equity (approximately 53.63% of the total) related to the decline in value of Spanish and Portuguese government debt securities. This decline in value was not prompted by interest rate changes but rather by an increase, which occurred after the instruments were acquired, in the credit risk spreads (credit spreads that improved in 2014); there had not been any default on payments of interest nor was there any evidence that the issuers would fail to continue to meet their payment obligations in the future, with respect both to principal and interest, and thus prevent recovery of the carrying amount of such securities.
During 2014, 2013 and 2012 we completed the analysis described above for equity securities and we recognized in 2014 impairments amounting to €147 million (€169 million in 2013 and €344 million in 2012). No additional significant impairments were recorded in 2014 for the remainder of the equity securities that showed unrealized losses as of December 31, 2014 because, after carrying out the abovementioned analysis, we concluded that their carrying value was still recoverable.
Retirement Benefit Obligations
We provide pension plans in most parts of the world. For defined contribution plans, the pension cost recognized in the consolidated income statement represents the contribution payable to the scheme. For defined benefit plans, the pension cost is assessed in accordance with the advice of a qualified external actuary using the projected unit credit method. This cost is annually charged to the consolidated income statement.
The actuarial valuation is dependent upon a series of assumptions; the principal ones are set forth below:
| • | annual discount rate-determined, when available, by reference to high-quality corporate bonds; |
| • | mortality tables; |
| • | annual social security pension revision rate; |
| • | price inflation; |
| • | annual salary growth rate; and |
| • | the method used to calculate vested commitments to current employees. |
The difference between the fair value of the plan assets and the present value of the defined benefit obligation at the balance sheet date is recognized as a liability in the balance sheet.
Further information on retirement benefit obligations is set out in notes 2 and 25 to our consolidated financial statements.
Business combinations and goodwill
Goodwill and intangible assets include the cost of acquired subsidiaries in excess of the fair value of the tangible net assets recorded in connection with acquisitions as well as acquired intangible assets which include core deposits, customer lists, brands and assets under management. Accounting for goodwill and acquired intangible assets requires management’s estimates regarding: (1) the fair value of the acquired intangible assets and the initial amount of goodwill to be recorded, (2) the amortization period (for identified intangible assets other than goodwill) and (3) the recoverability of the carrying value of acquired intangible assets.
To determine the initial amount of goodwill to be recognized on an acquisition, we have to determine the fair value of the consideration and the fair value of the net assets acquired. We use independent appraisers and our internal analysis, generally based on discounted cash flow techniques, to determine the fair value of the net assets acquired and non-cash components of the consideration paid.
We test goodwill for impairment at the cash-generating unit level. We identify our reporting units as one level below our business segments, based on our management structure. We keep those cash-generating units unchanged unless business segment reorganization occurs. We disclose our goodwill impairment assessment methodology in “Critical Accounting Policies—Impairment”.
129
Table of Contents
The useful lives of acquired intangible assets are estimated based on the period over which the assets are expected to contribute directly or indirectly to the future cash flows of the acquired entity.
For acquired intangible assets, the amortization period is reviewed annually. In making these assumptions, we consider historical results, adjusted to reflect current and anticipated operating conditions. Because a change in these assumptions can result in a significant change in the recorded amount of acquired intangible assets, we believe the accounting for business combinations is one of our critical accounting estimates.
As a result of the first consolidation of the acquired subsidiaries, Santander Consumer USA and GE Capital (2014) and merger of Bank Zachodni WBK S.A. and Kredyt Bank S.A. (2013), a significant amount of goodwill was recorded (see note 3 and note 17 to our consolidated financial statements). Management made this determination, based in part upon independent appraisals of intangible assets, which is initially estimated and subsequently revised within the one year time period allowed by IFRS-IASB.
Recent Accounting Pronouncements
See note 1.b to our consolidated financial statements for the detail of standards and interpretations that came into force in 2014 and those with effective dates subsequent to December 31, 2014.
We have based the following discussion on our consolidated financial statements. You should read it along with these financial statements, and it is qualified in its entirety by reference to them.
In a number of places in this report, in order to analyze changes in our business from period to period, we have isolated the effects of foreign exchange rates on our results of operations and financial position. In particular, we have isolated the effects of depreciation/appreciation of local currencies against the euro because we believe that doing so is useful in understanding the development of our business. For these purposes, we calculate the effect of movements in the exchange rates by multiplying the previous period balances in local currencies by the difference between the exchange rate to the euro of the current and the previous period.
General
We are a financial group whose main business focus is retail banking, complemented by global wholesale banking, asset management and insurance businesses.
Our main source of income is the interest that we earn from our lending activities, by borrowing funds from customers and money markets at certain rates and lending them to other customers at different rates. We also derive income from the interest and dividends that we receive from our investments in fixed/variable income and equity securities and from our trading activities in such securities and derivatives, by buying and selling them to take advantage of current and/or expected differences between purchase and sale prices.
Another source of income are the commissions that we earn from the different banking and other financial services that we provide (credit and debit cards, insurance, account management, bill discounting, guarantees and other contingent liabilities, advisory and custody services, etc.) and from our mutual and pension funds management services.
In addition, from time to time, we derive income from the capital gains we make from the sale of our holdings in Group companies.
2014 Overview
In 2014, the world economy recorded growth of around 3.3%, a rate similar to that achieved the previous year. This similarity conceals two big differences: on the one hand, the advanced economies overall experienced a marked revitalization, which was offset by the slowdown in growth in emerging economies. On the other, among both the advanced and the emerging economies the differences in their cyclical positions were accentuated.
With regard to the financial markets, in general financial conditions improved substantially. The advances occurred mainly in the first half of the year, when the global perception of risk fell significantly, there were widespread rises in stock market indices, risk premiums on both government and private debt securities fell considerably, access to capital markets became more fluid and the conditions on the supply of bank credit—in the advanced economies—eased.
130
Table of Contents
This performance was linked to the monetary policies of the various central banks, which resulted in abundant liquidity and the consequent pursuit of returns. The progress made towards the European banking union and the idea that the most extreme risks had passed also had a significant impact.
There was a correction in the second half of 2014 with a greater differentiation in performance depending on the nature of the assets and the outlook for each economy in the face of the downward revision of the forecasts for global growth, the end of the asset-buying program in the United States, and the fall in commodity prices (especially sharp in the case of oil).
As regards the banking sector environment, the most significant highlight for the banking systems in which the Bank operates was the advance towards a banking union in the eurozone. The ECB took on the function of supervising all banks in the eurozone, and of doing so directly in the case of the 120 largest banks, which account for 82% of the system’s total assets.
Before embarking on this task an exhaustive assessment of the banks’ assets and liabilities was performed, which signified a turning point in the evolution of European banking and led to increased confidence in the European financial system in the course of the year.
The regulatory agenda was once again intense in 2014. Progress continues to be made in responding to the weaknesses identified in the recent financial crisis.
The regulators worked on the design and implementation of effective crisis management frameworks to enable any institution to be resolved at no cost to taxpayers and without causing systemic risk. At an international level, the Financial Stability Board made progress with the crisis management framework to be applied at global systemically important banks (G-SIBs). The newest element of these frameworks is the requirement for banks to have a minimum loss-absorbing capacity (TLAC) in the event of resolution. A consultation paper was presented in November 2014, and an impact and market assessment study will be undertaken in 2015 in order to finalize the definition and calibration of the requirement by the end of the year.
Another area where there continues to be intensive regulatory activity is the review of the capital consumption frameworks for credit risk, market risk and operational risk, for both the standard and advanced models, being undertaken by the Basel Committee. This work is expected to be completed in 2015 and its success will depend on whether the role of risk sensitive requirements is maintained in the prudential framework, or whether greater weight is given to measures that are not risk sensitive such as the leverage ratio.
| • | The United States is in a solid expansion phase. The economy grew at above its expected rate, as a result of which unemployment and the excess of installed capacity were reduced substantially. Inflation remained low. In these conditions, the Federal Reserve concluded its bond-buying program, without, as of the date of this annual report, abandoning the expansive tone of its monetary policy. |
| • | The United Kingdom performed well in 2014. Inflation was below 2%, enabling the Bank of England to hold its discount rate at 0.5%. |
| • | The eurozone registered a slow recovery. Inflation was close to 0%, which led the ECB to cut its benchmark rates and launch new quantitative easing measures in the form of injecting long-term liquidity (TLTROs) and purchases of securities issued by the private sector. |
| • | Spain grew well above the eurozone average in 2014. Job creation, which began in the fourth quarter of 2013, continued and produced a gradual decline in the unemployment rate. The recovery is the result of the adjustments and reforms made in the public and private sectors in the last few years, notable among which has been the improvement in competitiveness, via internal devaluation, labor market reforms and restructuring of the financial system. |
| • | Germany’s growth eased as the year progressed, while maintaining the strength of its labor market and the high level of competitiveness of its exports. |
| • | Poland grew strongly in 2014, although the economy lost steam in the last part of the year due to the conflict in the Ukraine (which adversely impacted Poland’s trade with Eastern Europe) and the eurozone’s modest growth. |
In Latin America, growth slowed in 2014 (1.3% compared to 2.7% in 2013) in an international environment characterized by the normalization of monetary policy in the U.S., slower growth in China and less favorable terms of foreign trade than in the past. Despite lower growth, inflation rose, as a result of several supply shocks and the impact of the depreciation of Latin American currencies.
131
Table of Contents
| • | Brazil recorded moderate growth, despite which the unemployment rate remained very low. The first measures announced by the new government were positively perceived by the markets. |
| • | The Chilean economy’s growth slowed, which led to more expansive monetary (benchmark interest rate at 3%) and fiscal policies. |
| • | Mexico was on an upward growth trend during 2014, thanks to the strong trade links with the U.S. and the expectations raised by the major structural reforms in various areas. |
Results of Operations for Santander
Summary
Profit attributable to the Parent bank in 2014 was €5,816 million, a 39.3% or €1,641 million increase from €4,175 million in 2013, which represented a 82.9% or €1,892 million increase from €2,283 million in 2012.
There are a number of factors that have an impact on the year-on-year comparison:
| • | A more favorable global macroeconomic environment of recovery, despite signs of weakness in some European economies and in emerging economies during the second half of 2014. |
| • | Improved financial conditions in markets, while interest rates generally remained low. |
| • | A more demanding regulatory environment, limiting revenues and increasing compliance costs. |
| • | A positive perimeter effect from the full consolidation of SCUSA, the incorporation of Financiera El Corte Inglés, GetNet and the consumer finance business of GE Capital in the Nordic countries, as well as the acquisition of minority interests in our bank subsidiary in Brazil in September 2014, partially offset by the loss of control of the fund management companies in the fourth quarter of 2013. |
| • | The impact of the exchange rates of the various currencies against the euro was 4 to 5 percentage points negative for the Group as a whole in year-on-year comparisons for revenues and costs. The negative effects were in Brazil (8 to 9 percentage points), Mexico (4 percentage points) and Chile (14 to 15 percentage points) offset in part by a positive impact in the U.K. (6 percentage points). There was an immaterial positive impact in the U.S. (0.1 percentage points). |
Interest Income / (Charges)
Net interest income was €29,547, a 13.9% or €3,612 million increase from €25,935 million in 2013, which represented a 13.3% or €3,988 million decrease from €29,923 million in 2012.
2014 compared to 2013
The €3,612 million increase in net interest income was mainly due to the full consolidation of SCUSA. Excluding this effect and the exchange rate impact, net interest income increased by €2,384 million. The main developments were:
| • | The general macroeconomic improvement in all countries except for Brazil, with very positive growth in Spain, the U.K., the U.S. and Chile. |
| • | The positive evolution of lending, with growth in all units except Portugal, which is still deleveraging. |
| • | The growth in deposits, together with decreases in the average cost of funds mainly in developed countries. |
The performance of net interest income by geographic areas was the following:
| • | Favorable evolution in the U.K. (22.7%) and the U.S. (177.2%), due to the decrease in the cost of retail deposits in the U.K. and the impact of the reconsolidation of SCUSA in the U.S. (eliminating the effect of the reconsolidation of SCUSA, growth would have been of 11.2% due to increased consumer activity). |
132
Table of Contents
| • | Continental Europe’s net interest income increased 7.4%, with growth in all units. Spain’s rose 9.4%, due to the decreased cost of funds which compensated the decline in interest earned. |
| • | Latin America as a whole grew because of increased loan volumes. Brazil is the only unit that declined (-11.0%) due to lower spreads from the change of business mix toward lower risk segments. |
The average balance of interest earning assets in 2014 was €1,096,298 million, which was 2% or €21,859 million less than in 2013. This decrease occurred mainly in Spain (-€53,754 million), despite its lower relative weight. Within this, the biggest drops were in: (i) Other interest earning assets (-€18,899 million) mainly relating to derivatives and hedges, (ii) Loans and advances to customers (-€13,710 million), as a result of the reduction in loan volume that occurred in the end of 2013 which lowered the starting point for 2014, and the balances of the real estate operations that were discontinued in Spain, which continued to impact the 2014 fiscal year, and (iii) Debt securities (-€10,700 million). Average balances outside of Spain increased €31,895 million mainly due to the increase in Loans and advances to customers (€22,598 million) and Debt securities (€16,597 million) partially offset by the decrease in Other interest earning assets (-€7,507 million). The average return on total earning assets rose by 38 basis points to 4.97% while the average cost of total interest-bearing liabilities stood unchanged at 2.32%.
The development by geographic distribution (principal segments) of customer loans as of December 31, 2014 as compared to December 31, 2013 was the following:.
| • | In Continental Europe, the evolution varied among its units. Lending fell in Portugal, still affected by low demand, and the balance of Spain’s run-off real estate activity decreased, as the strategy of reducing this type of risk continued. Loans grew at Santander Consumer Finance, benefiting from the acquisition in 2013 of Zagiel, the consumer finance arm of KBC in Poland (see “Item 4. Information on the Company—A. History and development of the company—Principal Capital Expenditures and Divestitures—Acquisitions, Dispositions and Reorganizations—Merger of Bank Zachodni WBK S.A. and Kredyt Bank S.A.”), with a good evolution by products and segments, and in Spain, where the deleveraging trend of the last few years was reversed as a result of growth in lending to companies and public administrations. |
| • | In the United Kingdom, the balance of customer loans was 2% higher in sterling with the balance of mortgages and lending to companies increasing by 1% and 8%, respectively. |
| • | Lending in Latin America in local currencies terms increased 12%, with significant growth in all countries: Brazil (11%), Mexico (15%), Chile (8%), Argentina (23%), Uruguay (17%) and Peru (28%). |
| • | Lending in the U.S. rose 3% in dollars in constant perimeter (eliminating the effect of the reconsolidation of SCUSA), impacted by to the sale and securitizations of assets in the second half of 2014 (7% without this impact). Santander Bank’s lending increased 1% (6% excluding the sale of assets) and SCUSA’s increased 13%, benefiting from the strategic alliance with Chrysler, while lending in Puerto Rico dropped 16% against a backdrop of deleveraging. |
At the end of 2014, Continental Europe accounted for 37% of the Group’s total net lending (22% Spain), the U.K. 34%, Latin America 20% (10% Brazil) and the U.S. 9%.
The average balance of interest-bearing liabilities in 2014 was €1,082,500 million, which was 2% or €18,212 million less than in 2013, with their average cost of funds flat at 2.32%.
The reason for the drop in average liabilities, as in the case of assets, was Spain (-€34,726 million), as a result of: (i) the decreases in other interest-bearing liabilities (-€17,502 million), marketable debt securities (-€14,874 million) due to the fall in the outstanding average balances of wholesale funds, after the parent company raised an amount that was lower than the maturities and amortizations booked in the year, and (ii) transactions with credit institutions (-€5,648 million). Balances outside of Spain increased (€22,325 million), mainly due to marketable debt securities (€15,685 million) as debt issuances increased and amortizations decreased (see note 23 to our consolidated financial statements) and transactions with credit institutions (€8,543 million).
The development by geographic distribution (principal segments) of customer deposits as of December 31, 2014 as compared to December 31, 2013 was the following:
| • | Deposits in Continental Europe remained flat with decreases in Spain, Portugal and Santander Consumer offset by growth in Poland. |
133
Table of Contents
| • | In the U.K., customer deposits increased by 8% (1% in sterling) due to the strategy of replacing expensive and less stable deposits with those that offer a better opportunity of customer linkage. Demand deposits grew because of the rise in current accounts as a result of the success of marketing the 1|2|3 range of products (designed to build closer customer relationships, greater transactionality and increased loyalty), which offset the reduction in time deposits. |
| • | In Latin America, customer deposits grew by 13% (12% in local currencies) with Brazil, Mexico and Chile growing by 12%, 16% and 11%, respectively. |
| • | Lastly, in the U.S. deposits rose 19% mainly due to exchange rates. In dollars, deposits increased 5% and continued to improve in their composition and cost. |
Continental Europe accounted for 40% of customer deposits (28% Spain), the U.K. 32%, Latin America 21% (Brazil 11%) and the U.S. 7%.
2013 compared to 2012
The €3,988 million decrease in net interest income was mainly due to:
| • | The depreciation of some currencies (6 percentage point of the fall), particularly Brazil, the U.K., Argentina and Chile; |
| • | The impact of the cost associated with the policy of strengthening liquidity that the Group has been implementing since the middle of 2012; |
| • | The decrease in lending due to deleveraging in some countries; and |
| • | Reduced spreads in an environment of record low interest rates in mature markets and the change of mix toward lower risk products in some markets. These impacts were not offset by the reduction of the cost of funds, which is still not fully reflected across our sources of funding. |
The performance of net interest income by countries was the following:
| • | Favorable evolution of Santander UK 3.4% (8.3% rise in pound sterling). |
| • | Drop of 15.4% in Spain, largely due to the country’s deleveraging process, mortgage repricing and the higher cost of funds. Our efforts to reduce the cost of funds in Spain is already beginning to be reflected in the last few quarters and we expect it to continue to improve. |
| • | Latin America’s net interest income declined 15.2% (5.7% in local currencies), due to Brazil. Mexico (5.7%) and Chile (-1.7%), on the other hand, increased 5.9% and 3.4%, respectively, in local currency. |
The average balance of interest earning assets in 2013 was €1,118,157 million, which was 6.0% or €71,019 million less than in 2012. This decrease occurred mainly in Spain (-€43,269 million), despite its lower relative weight. Within this, the biggest drops were in Loans and advances to customers (-€20,416 million), as a result of the deleveraging process, and Cash and due from central banks (-€14,582 million). The balances outside of Spain declined €27,750 million mainly due to the impact of changes in exchange rates.
The geographic distribution (principal segments) of customer loans was very different by market.
| • | In Continental Europe, the low demand for loans as a result of the economic situation of some countries affected balances in Spain and Portugal. Santander Consumer Finance’s total lending remained stable, while Poland registered positive growth both organically as well as from the increased perimeter. The balance of Spain’s run-off real estate activity was much lower, as we maintained the strategy of reducing this type of risk. |
| • | In the United Kingdom, the balance of customer loans was 7% lower. In local criteria and currency, the balance of home mortgages dropped 5% because of the strategy of improving the risk profile, which meant discontinuing some products. Loans to companies, on the other hand, increased 13% in local currency. |
| • | Lending in Latin America decreased 5% in nominal terms, but increased 11% excluding the exchange rate impact, with growth in all countries. |
134
Table of Contents
| • | Lending in the U.S. declined 5%, as a result of: (i) the fall in the run-off portfolios, which includes indirect lending to car dealers, home equity loans, student loans and others, (ii) and the strategy in the last year of mortgage origination for its subsequent sale. |
At the end of 2013, Continental Europe accounted for 40% of the Group’s total net lending (24% Spain), the U.K. 36%, Latin America 20% (10% Brazil) and the U.S. 6%.
The average balance of interest-bearing liabilities in 2013 was €1,100,712 million, which was 6% or €70,819 million less than in 2012, with a 14 basis points improvement in their average cost, taking it to 2.32%. This improvement was primarily in the cost of customer deposits, which fell 24 basis points.
The main reason for the drop in average liabilities, as in the case of assets, was Spain (-€42,828 million), as a result of the decreases in transactions with credit institutions (-€33,685 million, mainly because of the repayment of the Long-term Refinancing Operation “LTRO” funds, obtained from the ECB at the end of 2011), marketable securities (-€11,609 million) and other interest-bearing liabilities (-€16,106 million). In contrast, domestic customer deposits increased by €20,434 million. Balances were also down outside of Spain (-€27,991 million), mainly due to lower customer deposits (-€24,446 million) affected by exchange rates.
The development by geographic distribution (principal segments) of customer deposits as of December 31, 2013 as compared to December 31, 2012 was the following:
| • | Customer deposits in Continental Europe were flat as the decrease in Spain and Santander Consumer Finance was offset by the increase in Poland due to the entry of Kredyt Bank. |
| • | In the U.K., customer deposits dropped 4% in 2013 due to the strategy of replacing expensive and less stable deposits with those that offer a better opportunity of linkage. Demand deposits grew because of the rise in current accounts as a result of the success of the 1|2|3 range of products, which partly offset the reduction in time deposits balances. The 1|2|3 World (current account, credit card, savings, etc.) is designed to build closer customer relationships, greater transactionality and increased loyalty. |
| • | In Latin America customer deposits decreased 6%. However, as in lending, in local currency, all countries increased their deposits. |
| • | Lastly, U.S. customer deposits continued to improve their mix and cost. Increasing demand deposits were offset by a greater decrease in time deposits. Total deposits were 7% lower (-2% in local currency). |
Continental Europe accounted for 42% of customer deposits (30% Spain), the U.K. 31%, Latin America 21% (Brazil 10%) and the U.S. 6%.
Income from Equity Instruments
Income from equity instruments was €435 million in 2014, a 15% or €57 million increase from €378 million in 2013, which was an 11% or €45 million decrease from €423 million in 2012.
The €57 million increase in 2014 and the €45 million decrease in 2013, was mainly explained by the variation in dividends from our equity portfolio (mainly Spanish blue chips).
Income from Companies Accounted for by the Equity Method
Income from companies accounted for by the equity method was €243 million in 2014, a €257 million decrease from €500 million in 2013, which was a €73 million increase from €427 million in 2012. In this line item we recorded in 2013 the contribution to the Group of Santander Consumer USA and the corporate insurance transactions in Europe and Latin America. Starting in 2014, we are fully consolidating Santander Consumer USA financial statements, hence the reduction in 2014. See “Item 4. Information on the Company—A. History and development of the company—Principal Capital Expenditures and Divestitures—Acquisitions, Dispositions and Reorganizations”.
Fee and Commission Income (net)
Fee and commission income was €9,696 million in 2014, a 1% or €65 million decrease from €9,761 million in 2013. During 2013, fee and commission income decreased by 5% as compared to €10,261 million obtained in 2012.
135
Table of Contents
2014 compared to 2013
Fee and commission income for 2014 and 2013 was as follows:
| 2014 | 2013 | Amount Change |
% Change |
|||||||||||||
| (in millions of euros, except percentages) | ||||||||||||||||
| Mutual and pension funds |
913 | 1,121 | (208 | ) | (18.6 | %) | ||||||||||
| Insurance |
2,193 | 2,284 | (91 | ) | (4.0 | %) | ||||||||||
| Securities services |
763 | 678 | 85 | 12.5 | % | |||||||||||
| Commissions for services |
5,827 | 5,678 | 149 | 2.6 | % | |||||||||||
| Total fee and commission income (net) |
9,696 | 9,761 | (65 | ) | (0.7 | %) | ||||||||||
Fee and commission income was virtually flat affected by reduced activity in some markets because of the economic environment. Increases in income from services and securities were offset by decreases in mutual and pension funds and insurance.
The average balances of mutual funds managed and marketed increased 14% from €101.2 billion in 2013 to €117.5 billion in 2014, with significant growth in Spain and Brazil partially offset by a 18% decrease in the United Kingdom.
The average balances of pension funds increased 7% from €10.4 billion in 2013 to €11.2 billion in 2014. Spain accounted for most of this growth. Our only remaining pension business abroad is in Portugal. The average balances of pension funds in Portugal also increased 8% to €852 million in 2014 from €788 million in 2013.
2013 compared to 2012
Fee and commission income for 2013 and 2012 was as follows:
| 2013 | 2012 | Amount Change |
% Change |
|||||||||||||
| (in millions of euros, except percentages) | ||||||||||||||||
| Mutual and pension funds |
1,121 | 1,178 | (57 | ) | (4.8 | %) | ||||||||||
| Insurance |
2,284 | 2,317 | (33 | ) | (1.4 | %) | ||||||||||
| Securities services |
678 | 702 | (24 | ) | (3.4 | %) | ||||||||||
| Commissions for services |
5,678 | 6,064 | (385 | ) | (6.3 | %) | ||||||||||
| Total fee and commission income (net) |
9,761 | 10,261 | (499 | ) | (4.9 | %) | ||||||||||
The 5% decrease in fee and commission income was mainly due to lesser commissions for services mainly due to overdrafts.
The average balances of mutual funds under management decreased 7.5% from €99.3 billion in 2012 to €91.8 billion in 2013, mainly concentrated in the United Kingdom and Brazil. However, as of year-end 2013, mutual funds increased 4.6% mainly due to the increase in Spain of 28.7%, as a result of greater marketing, partially offset by a 30.7% decrease in the United Kingdom.
The average balances of pension funds increased 7.0% from €9.7 billion in 2012 to €10.4 billion in 2013. Spain experienced a 7.4% increase from €8.9 billion in 2012 to €9.6 billion in 2013. Our only remaining pension business abroad is in Portugal. The average balances of pension funds in Portugal increased 2.9% from €766 million in 2012 to €788 million in 2013.
Gains/(Losses) on Financial Assets and Liabilities (net)
Net gains on financial assets and liabilities in 2014 were €3,974 million, a 22.9% or €740 million increase as compared to €3,234 million in 2013, which represented a 2.9% or €95 million decrease from €3,329 million in 2012. Gains (losses) on financial assets and liabilities include gains and losses arising from the following: marking to market our trading portfolio and derivative instruments, including spot market foreign exchange transactions, sales of investment securities and liquidation of our corresponding hedge or other derivative positions. For further details, see note 44 to our consolidated financial statements.
136
Table of Contents
2014 compared to 2013
The €740 million increase was mainly due to the net effect of: (i) a €644 million increase in trading gains, (ii) a €245 million increase in other financial instruments at fair value through profit or loss relating to valuation fluctuations, and (iii) a €195 million decrease in financial instruments not measured at fair value through profit or loss.
2013 compared to 2012
The €95 million decrease was mainly due to the net effect of: (i) a €273 million increase in trading gains, (ii) a €165 million decrease in other financial instruments at fair value through profit or loss relating to valuation fluctuations, and (iii) a €167 million decrease in financial instruments not measured at fair value through profit or loss, after the gains accounted in 2012 relating to repurchase transactions.
Exchange differences (net)
Exchange differences (net) in 2014 were a €1,124 million loss, a €1,284 million decrease as compared to €160 million gains in 2013, which represented a €349 million increase from €189 million loss in 2012.
The negative impact of exchange rates of Brazilian, Mexican and Chilean currencies against the euro was partially offset by a positive impact of the sterling against the euro. There was no significant impact due to the dollar.
Other operating income / expenses (net)
Net other operating income in 2014 was a €159 million loss, a €143 million increase from losses of €302 million in 2013, which was a €388 million decrease from income of €86 million in 2012. Under this line item we include income and expenses from insurance activity, non-financial services, other commissions and charges to the Deposit Guarantee Fund.
The main developments in insurance activity were:
| • | In July 2014, we announced that we had reached an agreement for the French insurance company CNP to acquire a 51% stake in our three insurance companies based in Ireland (Santander Insurance Life Limited, Santander Insurance Europe Limited and Santander Insurance Services Ireland Limited) that distribute life and non-life products through the Santander Consumer Finance network. This transaction was closed in December 2014 and will therefore impact our 2015 results of operations. |
| • | In December 2012, we entered into a strategic alliance with the insurer Aegon to boost its bancassurance business in Spain through our commercial networks. In June 2013, Aegon acquired a 51% ownership interest in the two insurance companies created by the Group for these purposes. |
| • | In July 2012, we reached an agreement with Abbey Life Insurance ltd., a subsidiary of Deustche Bank AG, to reinsure the entire individual life risk portfolio of the insurance companies in Spain and Portugal. |
137
Table of Contents
| 2014 | 2013 | Amount Change |
% Change |
|||||||||||||
| (in millions of euros, except percentages) | ||||||||||||||||
| Insurance activity |
137 | 117 | 20 | 17.1 | % | |||||||||||
| Income from insurance and reinsurance contracts issued |
3,532 | 4,724 | (1,192 | ) | (25.2 | %) | ||||||||||
| Of which: |
||||||||||||||||
| Insurance and reinsurance premium income |
3,284 | 4,513 | (1,229 | ) | (27.2 | %) | ||||||||||
| Reinsurance income |
248 | 211 | 37 | 17.5 | % | |||||||||||
| Expenses of insurance and reinsurance contracts |
(3,395 | ) | (4,607 | ) | 1,212 | (26.3 | %) | |||||||||
| Of which: |
||||||||||||||||
| Claims paid and other insurance-related expenses |
(3,800 | ) | (4,497 | ) | 697 | (15.5 | %) | |||||||||
| Net provisions for insurance contract liabilities |
910 | 382 | 528 | 138.2 | % | |||||||||||
| Reinsurance premiums paid |
(505 | ) | (492 | ) | (13 | ) | 2.6 | % | ||||||||
| Non-financial services |
88 | 93 | (5 | ) | (5.4 | %) | ||||||||||
| Sales and income from the provision of non-financial services |
343 | 322 | 21 | 6.5 | % | |||||||||||
| Cost of sales |
(255 | ) | (229 | ) | (26 | ) | 11.4 | % | ||||||||
| Other operating income and expenses |
(384 | ) | (512 | ) | 128 | (25.0 | %) | |||||||||
| Other operating income |
1,339 | 857 | 482 | 56.2 | % | |||||||||||
| Of which, fees and commissions offsetting direct costs |
106 | 115 | (9 | ) | (7.8 | %) | ||||||||||
| Other operating expenses |
(1,723 | ) | (1,369 | ) | (354 | ) | 25.9 | % | ||||||||
| Of which, Deposit Guarantee Fund |
(577 | ) | (570 | ) | (7 | ) | 1.2 | % | ||||||||
|
|
|
|
|
|
|
|
|
|||||||||
| Other operating income / expenses, net |
(159 | ) | (302 | ) | 143 | (47.4 | %) | |||||||||
The €143 million increase in net other operating income in 2014 was mainly due to an increase of €128 million in other operating income and expenses. The 2014 reduction in income and expenses from insurance and reinsurance contracts results from the previously mentioned agreements, as a result of these joint ventures being accounted for by the equity method.
138
Table of Contents
| 2013 | 2012 | Amount Change |
% Change |
|||||||||||||
| (in millions of euros, except percentages) | ||||||||||||||||
| Insurance activity |
117 | 593 | (476 | ) | (80.3 | %) | ||||||||||
| Income from insurance and reinsurance contracts issued |
4,724 | 5,541 | (817 | ) | (14.7 | %) | ||||||||||
| Of which: |
||||||||||||||||
| Insurance and reinsurance premium income |
4,513 | 4,667 | (154 | ) | (3.3 | %) | ||||||||||
| Reinsurance income |
211 | 874 | (663 | ) | (75.9 | %) | ||||||||||
| Expenses of insurance and reinsurance contracts |
(4,607 | ) | (4,948 | ) | 341 | (6.9 | %) | |||||||||
| Of which: |
||||||||||||||||
| Claims paid and other insurance-related expenses |
(4,497 | ) | (4,440 | ) | (57 | ) | 1.3 | % | ||||||||
| Net provisions for insurance contract liabilities |
382 | (323 | ) | 705 | n.a. | |||||||||||
| Reinsurance premiums paid |
(492 | ) | (185 | ) | (307 | ) | 165.9 | % | ||||||||
| Non-financial services |
93 | 137 | (44 | ) | (32.1 | %) | ||||||||||
| Sales and income from the provision of non-financial services |
322 | 369 | (47 | ) | (12.7 | %) | ||||||||||
| Cost of sales |
(229 | ) | (232 | ) | 3 | (1.3 | %) | |||||||||
| Other operating income and expenses |
(512 | ) | (644 | ) | 132 | (20.5 | %) | |||||||||
| Other operating income |
857 | 783 | 74 | 9.5 | % | |||||||||||
| Of which, fees and commissions offsetting direct costs |
115 | 130 | (15 | ) | (11.5 | %) | ||||||||||
| Other operating expenses |
(1,369 | ) | (1,427 | ) | 58 | (4.1 | %) | |||||||||
| Of which, Deposit Guarantee Fund |
(570 | ) | (554 | ) | (16 | ) | 2.9 | % | ||||||||
|
|
|
|
|
|
|
|
|
|||||||||
| Other operating income / expenses, net |
(302 | ) | 86 | (388 | ) | n.a. | ||||||||||
The €388 million decrease in net other operating income in 2013 was mainly due to a decrease in insurance activity of €476 million mainly due to the previously mentioned agreements, partially offset by an increase of €132 million in other operating income and expenses.
Administrative Expenses
Administrative expenses increased 2.6% or €447 million to €17,899 million in 2014 from €17,452 million in 2013, which declined from €17,801 million in 2012.
139
Table of Contents
2014 compared to 2013
Administrative expenses for 2014 and 2013 were as follows:
| 2014 | 2013 | Amount Change |
% Change |
|||||||||||||
| (in millions of euros, except percentages) | ||||||||||||||||
| Personnel expenses |
10,242 | 10,069 | 173 | 1.7 | % | |||||||||||
| Other general administrative expenses |
7,657 | 7,383 | 274 | 3.7 | % | |||||||||||
| Building and premises and supplies |
1,930 | 1,980 | (50 | ) | (2.5 | %) | ||||||||||
| Other expenses |
1,788 | 1,556 | 232 | 14.9 | % | |||||||||||
| Information technology |
979 | 992 | (13 | ) | (1.3 | %) | ||||||||||
| Advertising |
655 | 630 | 25 | 4.0 | % | |||||||||||
| Technical reports |
606 | 493 | 113 | 22.9 | % | |||||||||||
| Communications |
489 | 519 | (30 | ) | (5.8 | %) | ||||||||||
| Taxes (other than income tax) |
462 | 445 | 17 | 3.8 | % | |||||||||||
| Guard and cash courier services |
397 | 425 | (28 | ) | (6.6 | %) | ||||||||||
| Per diems and travel expenses |
287 | 284 | 3 | 1.1 | % | |||||||||||
| Insurance premiums |
64 | 59 | 5 | 8.5 | % | |||||||||||
| Total administrative expenses |
17,899 | 17,452 | 447 | 2.6 | % | |||||||||||
In 2014, administrative expenses increased 2.6% or €447 million, negatively affected by exchange rates.
The performance by units varied:
| • | certain units in processes of integration (Spain and Poland) or structural adjustment (Portugal) saw their operating costs decline in nominal terms. Brazil also did well, reflecting the effort in efficiency improvement plans and a nominal rise of 1% in local currency (an 8% decline in euros), compared to inflation of more than 6%. |
| • | the U.K. is combining investments in its digital transformation plan, commercial plan and in branches with efficiency improvements, same as in Chile. |
| • | higher expenses in Mexico and Argentina because of their expansion plans or programs to improve commercial capacity, and in the U.S., which is enhancing the franchise of Santander Bank and adapting to regulatory requirements (8%). |
2013 compared to 2012
Administrative expenses for 2013 and 2012 were as follows:
| 2013 | 2012 | Amount Change |
% Change |
|||||||||||||
| (in millions of euros, except percentages) | ||||||||||||||||
| Personnel expenses |
10,069 | 10,306 | (237 | ) | (2.3 | %) | ||||||||||
| Other general administrative expenses |
7,383 | 7,495 | (112 | ) | (1.5 | %) | ||||||||||
| Building and premises and supplies |
1,980 | 1,916 | 64 | 3.3 | % | |||||||||||
| Other expenses |
1,556 | 1,694 | (138 | ) | (8.1 | %) | ||||||||||
| Information technology |
992 | 889 | 103 | 11.6 | % | |||||||||||
| Advertising |
630 | 662 | (32 | ) | (4.8 | %) | ||||||||||
| Communications |
519 | 638 | (119 | ) | (18.7 | %) | ||||||||||
| Technical reports |
493 | 491 | 2 | 0.4 | % | |||||||||||
| Taxes (other than income tax) |
445 | 415 | 30 | 7.2 | % | |||||||||||
| Guard and cash courier services |
425 | 432 | (7 | ) | (1.6 | %) | ||||||||||
| Per diems and travel expenses |
284 | 297 | (13 | ) | (4.4 | %) | ||||||||||
| Insurance premiums |
59 | 61 | (2 | ) | (3.3 | %) | ||||||||||
| Total administrative expenses |
17,452 | 17,801 | (349 | ) | (2.0 | %) | ||||||||||
140
Table of Contents
In 2013, administrative expenses decreased 2.0% or €349 million, positively affected by exchange rates. Excluding the impact of exchange rate differences administrative expenses increased by 3.6%.
Expenses in Europe, in both, the big commercial units as well as the United Kingdom, continued to fall or rose below the inflation rate. Latin America was up as a result of the commercial network expansion and upgrade and the review of pay agreements in an environment of higher inflation. In the United States, the year-on-year comparison reflects the investments in technology and commercial structure, as well as costs associated with the change in brand.
Depreciation and Amortization
Depreciation and amortization was €2,287 million in 2014, a 4.3% or €104 million decrease from €2,391 million in 2013, which was a 9.5% or €208 million increase from €2,183 million in 2012. The decrease in 2014 was mainly focused in Latin America.
Provisions (net)
Net provisions were €3,009 million in 2014, a 23.1% or €564 million increase from €2,445 million in 2013, which was a 66.1% or €973 million increase from €1,472 million in 2012. This item includes additions charged to the income statement in relation to provisions for pensions and similar obligations, provisions for contingent liabilities and commitments and other provisions (mainly provisions for restructuring costs and tax and legal litigation).
The variation in 2014 is mainly due to a €672 million increase in provisions for taxes and other legal contingencies and other provisions, which include, inter alia, provisions for restructuring costs and tax-related and non-tax-related proceedings. Of note were provisions of €455 million recognized for customer remediation in Germany, of which €197 million were used. In addition, there was a €36 million decrease in provisions for pensions and similar obligations, and a €72 million decrease in contingent liabilities and commitments provisions.
The variation in 2013 is mainly due to a €581 million increase in provisions for pensions and similar obligations. In Spain we recognized provisions of €334 million in 2013 to cover obligations arising from employees’ acceptances of an early retirement and voluntary redundancy offer. In addition, there was a €334 million increase in other provisions and a €58 million increase in contingent liabilities and commitments provisions.
For further details, see note 25 to our consolidated financial statements.
Impairment Losses (net)
Impairment losses (net) were €11,648 million in 2014, a 0.7% or €82 million decrease from €11,730 million in 2013, which was a 39.5% or €7,658 million decrease from €19,388 million in 2012.
Impairment losses are divided in the income statement as follows:
| 2014 | 2013 | 2012 | ||||||||||
| Impairment losses on financial assets (net): |
10,710 | 11,227 | 18,880 | |||||||||
| Loans and receivables |
10,521 | 10,986 | 18,523 | |||||||||
| Other financial assets not measured at fair value through profit and loss |
189 | 241 | 357 | |||||||||
| Impairment losses on other assets (net): |
938 | 503 | 508 | |||||||||
| Goodwill and other intangible assets |
701 | 41 | 151 | |||||||||
| Other assets |
237 | 462 | 357 | |||||||||
|
|
|
|
|
|
|
|||||||
| Total impairment losses (net) |
11,648 | 11,730 | 19,388 | |||||||||
2014 compared to 2013
The €465 million or 4.2% decrease in net impairment losses for loans and receivables in 2014 compared to 2013 reflected a €204 million decrease in provisions, a €268 million increase in recoveries of loans previously charged-off and a €7 million increase in impairment losses of other assets. For a further discussion on credit risk see “Item 11. Quantitative and Qualitative Disclosures about Market Risk—Part 4. Credit Risk”.
141
Table of Contents
The most significant decreases were in the U.K., Spain, Brazil and Portugal, due to the improved macroeconomic environment and balance sheet management. Among the rest of the large units, the only significant rise was in the U.S. because of the reconsolidation of SCUSA, which, in addition, made larger provisions partly due to the larger volume of business following the agreement with Chrysler.
Our total allowances for credit losses (excluding country-risk) increased by €2,365 million to €28,046 million at December 31, 2014, from €25,681 million at December 31, 2013 mainly driven by the reconsolidation of SCUSA.
Net impairment losses on other assets in 2014 increased to €938 million compared to €503 million in 2013. In 2014 we recognized €699 million in other intangible assets. These impairment losses relate mainly to the decline in or loss of the recoverable value of certain computer systems and applications as a result of the processes initiated by the Group to adapt to the various regulatory changes and to transform or integrate businesses.
The impairment losses of other financial assets not measured at fair value through profit and loss in 2014 of €189 million were mainly due to equity instruments that had suffered a significant and prolonged fall in price.
Non-performing balances (excluding country-risk) were essentially flat at €41,709 million at December 31, 2014, a €57 million increase compared to €41,652 million at December 31, 2013. Our Non-performing balance ratio was 5.19% at December 31, 2014 as compared to 5.64% at December 31, 2013. The ratio decreased or remained stable in all the main units except for Santander Consumer Finance where the ratio increased adversely impacted by the consolidation of GE’s business in the Nordic countries and Portugal partially impacted by the decrease in loans. Our coverage ratio was 67% at December 31, 2014 and 62% at December 31, 2013. See “Item 4. Information on the Company—B. Business Overview—Selected Statistical Information—Non-performing Balances Ratios” and “Item 4. Information on the Company—B. Business Overview—Selected Statistical Information—Evolution of Non-performing Balances”.
2013 compared to 2012
The €7,537 million or 40.7% decrease in net impairment losses for loans and receivables in 2013 compared to 2012 reflected a €7,788 million decrease in provisions, a €248 million decrease in recoveries of loans previously charged-off and a €3 million increase in impairment losses of other assets.
Credit loss provisions accounted in 2013 decreased after the recorded rise in non-performing loans in the Spain’s real estate run-off segment in 2012. In other units, provisions were down in Brazil, the United Kingdom, Portugal, Santander Consumer Finance, the United States and, to a lesser extent, Spain. In contrast, they were up in the other Latin American countries, particularly Mexico, with a big impact from the one-off charge booked for housing developers.
Our total allowances for credit losses (excluding country-risk) decreased by €431 million to €25,681 million at December 31, 2013, from €26,112 million at December 31, 2012.
Net impairment losses on other assets in 2013 remained at the prior year level with €503 million compared to €508 million in 2012.
The impairment losses of other financial assets not measured at fair value through profit and loss in 2013 of €241 million were mainly due to equity instruments that had suffered a significant and prolonged fall in price.
Non-performing balances (excluding country-risk) increased by €5,591 million to €41,652 million at December 31, 2013, compared to €36,061 million at December 31, 2012. Our Non-performing balance ratio was 5.64% at December 31, 2013 as compared to 4.54% at December 31, 2012. This increase was mainly due to the 2.84 percentage points increase in Continental Europe. See “Item 5. Operating and Financial Review and Prospects—A. Operating results—Results of Operations for Santander—Continental Europe”. Our coverage ratio was 62% at December 31, 2013 and 72% at December 31, 2012. See “Item 4. Information on the Company—B. Business Overview—Selected Statistical Information—Non-performing Balances Ratios”.
142
Table of Contents
Net gains / (losses) on other assets
Net gains on other assets were €2,893 million in 2014, a €1,163 million increase from gains of €1,730 million in 2013, which was a €1,581 million increase from gains of €149 million in 2012.
The €3,136 million gains on disposal of assets not classified as non-current assets held for sale accounted in 2014 were mainly due to disposal of investments (Altamira Asset Management and insurance companies in Ireland) and to the recognition at fair value of the ownership interest held by the Group in SCUSA after its IPO and the public placement of 4% of our stake in SCUSA. See “Item 4. Information on the Company—A. History and development of the company—Principal Capital Expenditures and Divestitures—Acquisitions, Dispositions and Reorganizations” and note 49 to our consolidated financial statements.
The €2,152 million gains on disposal of assets not classified as non-current assets held for sale accounted in 2013 were mainly due to the sale of our management companies (pursuant to the agreement with Warburg Pincus and General Atlantic), the insurance companies in Spain, and the payment services company (agreement with Elavon Financial Services Limited). See “Item 4. Information on the Company—A. History and development of the company—Principal Capital Expenditures and Divestitures—Acquisitions, Dispositions, Reorganizations”.
Losses on non-current assets held for sale not classified as discontinued operations in 2014 totaled €243 million as compared to €422 million in 2013. This line item includes mainly impairment of foreclosed assets recorded during the year and the sale of properties.
2014 compared to 2013
| 2014 | 2013 | Amount Change |
% Change |
|||||||||||||
| (in millions of euros, except percentages) | ||||||||||||||||
| Gains / (losses) on disposal of assets not classified as non-current assets held for sale |
3,136 | 2,152 | 984 | 45.7 | % | |||||||||||
| Of which: |
||||||||||||||||
| Disposal of investments |
3,026 | 2,167 | 859 | 39.6 | % | |||||||||||
| Gains / (losses) on non-current assets held for sale not classified as discontinued operations |
(243 | ) | (422 | ) | 179 | (42.4 | %) | |||||||||
| Of which: |
||||||||||||||||
| Impairment of non-current assets held for sale |
(339 | ) | (335 | ) | (4 | ) | 1.2 | % | ||||||||
| Gains/Losses on sale of non-current assets held for sale |
48 | (87 | ) | 135 | n/a | |||||||||||
|
|
|
|
|
|
|
|
|
|||||||||
| Net gains / (losses) on other assets |
2,893 | 1,730 | 1,163 | 67.2 | % | |||||||||||
2013 compared to 2012
| 2013 | 2012 | Amount Change |
% Change |
|||||||||||||
| (in millions of euros, except percentages) | ||||||||||||||||
| Gains / (losses) on disposal of assets not classified as non-current assets held for sale |
2,152 | 906 | 1,246 | 137.5 | % | |||||||||||
| Of which: |
||||||||||||||||
| Disposal of investments |
2,167 | 775 | 1,392 | 179.6 | % | |||||||||||
| Gains / (losses) on non-current assets held for sale not classified as discontinued operations |
(422 | ) | (757 | ) | 335 | (44.3 | %) | |||||||||
| Of which: |
||||||||||||||||
| Impairment of non-current assets held for sale |
(335 | ) | (449 | ) | 114 | (25.4 | %) | |||||||||
| Losses on sale of non-current assets held for sale |
(87 | ) | (308 | ) | 221 | (71.8 | %) | |||||||||
|
|
|
|
|
|
|
|
|
|||||||||
| Net gains / (losses) on other assets |
1,730 | 149 | 1,581 | n/a | ||||||||||||
143
Table of Contents
Income Tax
The provision for corporate income tax was €3,718 million in 2014, a 82.8% or €1,684 million increase from €2,034 million in 2013, which represented a 248.3% or €1,450 million increase from €584 million in 2012. The effective tax rate was 34.9% in 2014, 27.6% in 2013 and 16.7% in 2012.
The increase in the effective tax rate in 2014 compared to the prior year is mainly due to the €3,301 million increase in consolidated operating profit before tax together with the movement in the net adjustments to profit before tax that applied in 2014 as compared to 2013 (see the reconciliation in note 27.c to our consolidated financial statements).
The increase in the effective tax rate in 2013 compared to the prior year is primarily due to the €3,813 million increase in consolidated operating profit before tax together with a reduction in the net adjustments to profit before tax that applied in 2013 as compared to 2012 (see the reconciliation in note 27.c to our consolidated financial statements).
For more information about factors affecting effective tax rates, see note 27 to our consolidated financial statements.
Profit / (losses) from discontinued operations
Losses from discontinued operations were €26 million in 2014, compared to €15 million in 2013, which represented a €85 million decrease from €70 million profit in 2012. During 2014 and 2013 we did not discontinue any significant operations.
Profit attributable to non-controlling interest
Profit attributable to non-controlling interest was €1,119 million in 2014, a 3.0% or €35 million decrease from €1,154 million in 2013, which represented a 50.3% or €386 million increase from €768 million in 2012. For further details, see note 28 to our consolidated financial statements.
2014 compared to 2013
In 2014, we increased our ownership interest in Banco Santander (Brasil) S.A., thereby generating a decrease in the balance of non-controlling interests of €2,572 million which was partially offset by the €1,013 million increase resulting from the reconsolidation of SCUSA.
2013 compared to 2012
The increase in 2013, was mainly due to a full year accounting of minority interest in Mexico as in the fourth quarter of 2012 Santander México finalized its placement of shares in the secondary market. Moreover, in 2013 we reduced our ownership interest in Bank Zachodni WBK S.A. to 70%, thereby generating an increase in the balance of non-controlling interests of €1,329 million (see note 3 to our consolidated financial statements).
Results of Operations by Business Areas
For a description of our segments see “Item 4. “Information on the Company—B. Business Overview”.
Our results of operations by business areas can be summarized as follows.
144
Table of Contents
First level (geographic):
Continental Europe
| Variations | ||||||||||||||||||||
| 2014 | 2013 | 2012 | 2014/2013 | 2013/2012 | ||||||||||||||||
| (in millions of euros, except percentages) | ||||||||||||||||||||
| INTEREST INCOME / (CHARGES) |
8,728 | 8,123 | 8,854 | 7 | % | (8 | %) | |||||||||||||
| Income from equity instruments |
287 | 265 | 289 | 8 | % | (8 | %) | |||||||||||||
| Income from companies accounted for by the equity method |
(25 | ) | (19 | ) | (88 | ) | 32 | % | (78 | %) | ||||||||||
| Net fees and commissions |
3,457 | 3,552 | 3,625 | (3 | %) | (2 | %) | |||||||||||||
| Gains/losses on financial assets and liabilities (net) * |
453 | 775 | 306 | (42 | %) | 153 | % | |||||||||||||
| Other operating income/(expenses) (net) |
(78 | ) | (111 | ) | (19 | ) | (30 | %) | 484 | % | ||||||||||
| TOTAL INCOME |
12,822 | 12,585 | 12,967 | 2 | % | (3 | %) | |||||||||||||
| Administrative expenses |
(5,632 | ) | (5,807 | ) | (5,790 | ) | (3 | %) | 0 | % | ||||||||||
| Personnel expenses |
(3,316 | ) | (3,527 | ) | (3,498 | ) | (6 | %) | 1 | % | ||||||||||
| Other general expenses |
(2,316 | ) | (2,280 | ) | (2,292 | ) | 2 | % | (1 | %) | ||||||||||
| Depreciation and amortization |
(706 | ) | (769 | ) | (667 | ) | (8 | %) | 15 | % | ||||||||||
| Provisions (net) |
(530 | ) | (158 | ) | (130 | ) | 235 | % | 22 | % | ||||||||||
| Impairment losses on financial assets (net) |
(2,960 | ) | (3,766 | ) | (9,903 | ) | (21 | %) | (62 | %) | ||||||||||
| Impairment losses on other assets (net) |
(74 | ) | (65 | ) | (27 | ) | 14 | % | 141 | % | ||||||||||
| Gains/(losses) on other assets (net) |
109 | (374 | ) | (757 | ) | n/a | (51 | %) | ||||||||||||
| OPERATING PROFIT/(LOSS) BEFORE TAX |
3,029 | 1,646 | (4,307 | ) | 84 | % | n/a | |||||||||||||
| Income tax |
(756 | ) | (376 | ) | 1,490 | 101 | % | n/a | ||||||||||||
| PROFIT FROM CONTINUING OPERATIONS |
2,273 | 1,270 | (2,817 | ) | 79 | % | n/a | |||||||||||||
| Profit/(loss) from discontinued operations (net) |
(26 | ) | (6 | ) | (7 | ) | 333 | % | (14 | %) | ||||||||||
| CONSOLIDATED PROFIT FOR THE YEAR |
2,247 | 1,264 | (2,824 | ) | 78 | % | n/a | |||||||||||||
| Profit attributable to non-controlling interest |
168 | 137 | (79 | ) | 23 | % | n/a | |||||||||||||
| Profit attributable to the Parent |
2,079 | 1,127 | (2,745 | ) | 84 | % | n/a | |||||||||||||
| * | Includes exchange differences (net) |
2014 compared to 20132
In 2014, Continental Europe accounted for 27% of profit attributed to the Parent bank’s total operating areas.
The different units from the Continental Europe segment developed their business in 2014 in an environment of moderate growth, with significant variances among countries and low interest rates. The system’s high liquidity facilitated corporate debt issuances and better access to credit by both companies and households. Nevertheless, lending in the eurozone declined further (-0.4%), reflecting continued deleveraging in some economies and disintermediation. The deposits of companies and households continued to grow at rates of around 3%.
In this context, the integration of the retail networks in Spain and the banks in Poland was completed.
Total income increased by €237 million mainly due to the €605 million increase in net interest income partially offset by a €322 million decrease in gains on financial assets and liabilities. The growth in net interest income reflects the greater reduction in the cost of deposits, in all units, which compensated the decline in interest earned. The fall in gains/(losses) on financial assets and liabilities was due to reduced revenues from wholesale activity.
Operating expenses, which include administrative expenses and depreciation and amortization, decreased by €238 million or 4%, primarily due to synergies from the merger and optimization plans in Spain.
Provisions and impairment losses, which include provisions (net), impairment losses on financial assets (net), and impairment losses on other assets (net) (loan-loss provisions), decreased by €425 million or 11% reflecting decreases in all commercial units, except Poland, in loan-loss provisions.
The NPL ratio in Continental Europe decreased 20 basis points to 8.93%, while the coverage ratio was flat at 57%.
| 2 | For a summary by countries see “Item 4. Information on the Company—B. Business Overview—Continental Europe”. |
145
Table of Contents
Profit attributable to the Parent increased by €952 million or 84% mainly due to improved net interest margin, the decrease in operating expenses relating to synergies from the merger and optimization plans in Spain and the decrease in impairment losses on financial assets.
2013 compared to 2012
In 2013, Continental Europe accounted for 18% of profit attributed to the Parent bank’s total operating areas.
The main actions in 2013 focused on integrating the mergers of retail networks in Spain and the banks in Poland. In a still weak environment and with low interest rates, the Group’s strategy over the last three years was maintained. These strategies were: (i) defending spreads on loans and on deposits, (ii) greater focus on reducing the cost of funds, after reaching a comfortable liquidity position, (iii) control of costs and (iv) active risk management.
Total income decreased by €382 million mainly due to the €731 million decrease in net interest income partially offset by a €469 million increase in gains on financial assets and liabilities. The fall in net interest income reflects the economic weakness, low interest rates, a still high average cost of deposits and repricing of mortgages. The increase in gains/(losses) on financial assets and liabilities was due to trading gains (wholesale business).
Operating expenses, which include administrative expenses and depreciation and amortization, rose by €119 million or 1.8%, primarily due to the perimeter in Poland, since on a like-for-like basis their performance was flat (-0.8%) with costs at all units either decreasing or stable.
Provisions and impairment losses, which include provisions (net), impairment losses on financial assets (net), and impairment losses on other assets (net), decreased by €6,071 million or 60.3% after the strong increase in the deterioration of the real estate segment in Spain experienced in 2012 was not repeated in 2013.
The effort in provisions in the past years was combined with a strategy of reducing the real estate exposure in Spain. The balance sheet of Spain’s run-off real estate activity declined by €1,496 million (-12%). The reduction since December 2008 is approximately €30 billion (-73%).
The NPL ratio in Continental Europe increased from 6.29% in 2012 to 9.13% in 2013, while NPL coverage decreased from 73% in 2012 to 57% in 2013. The NPL ratio increase was mainly due to: (i) a rise in Spain’s non-performing loans, mainly related to specific clients and to real estate mortgages to individuals, (ii) a drop in Spain’s lending levels, partially due to the cancellation of the public sector financing pursuant to a government program to pay suppliers’ pending invoices, deleveraging in the real estate sector and the decrease in the demand for credit, and (iii) to the integration of Kredyt Bank S.A. in Poland, which has a higher NPL ratio than the rest of Continental Europe.
Profit attributable to the Parent increased by €3,872 million after the heavy impairment losses accounted in 2012 in the Spain’s real estate portfolio in run-off. Furthermore, comparisons with 2012 are affected by: the positive impact of the consolidation of Kredyt Bank in Poland, which was partially offset by the reinsurance transaction in Spain and Portugal. The overall impact of the change in perimeter was 2 percentage points increase in revenues and 6 percentage points negative in ordinary attributable profit.
146
Table of Contents
United Kingdom
| Variations | ||||||||||||||||||||
| 2014 | 2013 | 2012 | 2014/2013 | 2013/2012 | ||||||||||||||||
| (in millions of euros, except percentages) | ||||||||||||||||||||
| INTEREST INCOME / (CHARGES) |
4,234 | 3,451 | 3,336 | 23 | % | 3 | % | |||||||||||||
| Income from equity instruments |
1 | 1 | 1 | 0 | % | 0 | % | |||||||||||||
| Income from companies accounted for by the equity method |
9 | 4 | (5 | ) | 125 | % | n/a | |||||||||||||
| Net fees and commissions |
1,028 | 991 | 1,190 | 4 | % | (17 | %) | |||||||||||||
| Gains/losses on financial assets and liabilities (net) * |
241 | 403 | 1,231 | (40 | %) | (67 | %) | |||||||||||||
| Other operating income/(expenses) (net) |
28 | 30 | 24 | (7 | %) | 25 | % | |||||||||||||
| TOTAL INCOME |
5,541 | 4,880 | 5,777 | 14 | % | (16 | %) | |||||||||||||
| Administrative expenses |
(2,565 | ) | (2,181 | ) | (2,311 | ) | 18 | % | (6 | %) | ||||||||||
| Personnel expenses |
(1,642 | ) | (1,401 | ) | (1,492 | ) | 17 | % | (6 | %) | ||||||||||
| Other general expenses |
(923 | ) | (780 | ) | (819 | ) | 18 | % | (5 | %) | ||||||||||
| Depreciation and amortization |
(461 | ) | (424 | ) | (379 | ) | 9 | % | 12 | % | ||||||||||
| Provisions (net) |
(184 | ) | (232 | ) | (522 | ) | (21 | %) | (56 | %) | ||||||||||
| Impairment losses on financial assets (net) |
(333 | ) | (580 | ) | (1,220 | ) | (43 | %) | (52 | %) | ||||||||||
| Impairment losses on other assets (net) |
— | (4 | ) | — | n/a | n/a | ||||||||||||||
| Gains/(losses) on other assets (net) |
3 | — | 5 | n/a | (100 | %) | ||||||||||||||
| OPERATING PROFIT/(LOSS) BEFORE TAX |
2,001 | 1,459 | 1,350 | 37 | % | 8 | % | |||||||||||||
| Income tax |
(425 | ) | (301 | ) | (312 | ) | (41 | %) | (4 | %) | ||||||||||
| PROFIT FROM CONTINUING OPERATIONS |
1,576 | 1,158 | 1,038 | 36 | % | 12 | % | |||||||||||||
| Profit/(loss) from discontinued operations (net) |
— | (9 | ) | 77 | (100 | %) | n/a | |||||||||||||
| CONSOLIDATED PROFIT FOR THE YEAR |
1,576 | 1,149 | 1,115 | 37 | % | 3 | % | |||||||||||||
| Profit attributable to non-controlling interest |
— | — | — | n/a | n/a | |||||||||||||||
| Profit attributable to the Parent |
1,576 | 1,149 | 1,115 | 37 | % | 3 | % | |||||||||||||
| * | Includes exchange differences (net) |
2014 compared to 2013
In 2014, the United Kingdom accounted for 21% of profit attributed to the Parent bank’s total operating areas.
Santander UK’s strategy is built around three priorities: loyal and satisfied retail customers; Bank of Choice for U.K. companies, and consistent profitability and a strong balance sheet.
Total income increased by €661 million in 2014 mainly due to greater net interest income, partially offset by lesser gains / (losses) on financial assets and liabilities. Net interest income increased by €783 million due to the reduced cost of retail deposits. Santander UK’s Retail Banking reduced its more rate sensitive and short term deposits (mainly through maturities of higher rate eSaver savings products), and replaced them with deposits that offer better relationship opportunities and lower cost term products. Gains / (losses) on financial assets and liabilities decreased €162 million mainly due unrepeated results obtained in 2013 from the ALCO portfolio and debt repurchases.
Operating expenses increased €421 million or 16% in 2014 due to continued investments in the retail banking and business segments, which were partially offset by the efficiency plans being implemented. These investment programs continued to support improvements in the business and to provide the underpinning for future efficiency improvements.
We continued to invest in branch renovations and digital technology. This year we have delivered a number of improvements in all of our digital platforms including our online and mobile banking services as well as introducing more digital technology into our branches.
Provisions and impairment losses decreased €295 million or 36% of which €247 million were due to lower impairment losses on financial assets relating to improved credit quality across our product range and supported by an improving economic environment. Provisions (net) decreased by €48 million as a result of a €286 million reduction in pension obligations due to the agreement reached to limit pensionable salary (see note 25.C.ii to our consolidated financial statements), partly offset by restructuring costs. The NPL ratio of 1.79% at the end of 2014 was lower than at the end of 2013 when it was 1.98%. We maintained our conservative lending criteria, with an average LTV of 65% for new loans, including Help to Buy, and 47% on the stock of mortgages.
147
Table of Contents
Profit attributable to the Parent increased €427 million mainly due to improved net interest income and lower provisions and impairment losses which were partially offset by increased operating expenses. The results demonstrate a further improvement in performance and continued progress evident during the year, particularly in net interest income.
2013 compared to 2012
In 2013, the United Kingdom accounted for 18% of profit attributed to the Parent bank’s total operating areas.
Total income decreased by €897 million in 2013 mainly due to lesser gains / (losses) on financial assets and liabilities as in 2012 Santander UK accounted for the repurchase of debt capital instruments. Net interest income increased €115 million or 3.4% (8.3% in pounds sterling), and rose in every quarter, thanks to the spread on the stock of mortgages and the maturity of costly deposits in the second half of the year. The ratio of net interest income to average customer assets improved to 1.71% in the last quarter of 2013 from 1.27% in the last quarter of 2012. Net fees and commissions were €199 million lower due to reduced Global Banking & Markets activity.
Operating expenses decreased €85 million in 2013. In local currency, operating expenses increased £32 million or 1.5% (below inflation and revenues), despite investments in retail and corporate banking.
Santander UK continued to invest in the growth of the SME business and Large Corporates. Moreover, the unit further developed its capacity to support their SME customers, with more customer-facing staff in its growing regional Corporate Business Centre network, and expansion into new financial centers across the U.K. Santander UK also completed the rollout of and customer migration to the new transactional platform in 2013.
The increase was also driven by ongoing investment in business growth in Retail Banking, as well as increased regulatory compliance and control costs. These increases were partly offset by tight cost control, the consolidation of multi-branch locations.
Provisions and impairment losses decreased €926 million. The €290 million decrease in provisions was mainly due to a €264 million customer remediation provision charge principally relating to PPI remediation accounted in 2012 and not repeated in 2013. Impairment losses on financial assets decreased by €640 million mainly due to the significant provisions accounted in 2012 related to the review and full re-assessment of the assets held in the non-core corporate and legacy portfolios in run-off. The provisions related to assets acquired from Alliance & Leicester plc. (particularly the shipping portfolio) as well as certain assets within the old Abbey Commercial Mortgages book. The amount of the provision in 2012 reflected the increasing losses experienced in these portfolios. No further significant provisions were required in 2013 as disposals of assets across the portfolios were consistent with provisioned levels.
In 2013, Santander UK improved its credit quality across the product range in retail and corporate banking. The NPL ratio experienced a small decrease of 7 basis points, from 2.05% to 1.98%, while the coverage decreased from 44% to 42%. The stock of residential properties in possession remained very low at 0.05% of the total portfolio, unchanged from 2012 and below the industry average, according to the Council of Mortgage Lenders.
Profit attributable to the Parent increased €34 million mainly due to lower provisions and impairment losses which were partially compensated by reduced gains on financial transactions. The results demonstrate a further improvement in performance and continued the progress evident through the year, particularly in net interest income.
148
Table of Contents
Latin America
| Variations | ||||||||||||||||||||
| 2014 | 2013¹ | 2012¹ | 2014/2013 | 2013/2012 | ||||||||||||||||
| (in millions of euros, except percentages) | ||||||||||||||||||||
| INTEREST INCOME / (CHARGES) |
13,879 | 14,920 | 17,596 | (7 | %) | (15 | %) | |||||||||||||
| Income from equity instruments |
88 | 54 | 59 | 63 | % | (8 | %) | |||||||||||||
| Income from companies accounted for by the equity method |
283 | 202 | 183 | 40 | % | 10 | % | |||||||||||||
| Net fees and commissions |
4,565 | 4,808 | 5,020 | (5 | %) | (4 | %) | |||||||||||||
| Gains/losses on financial assets and liabilities (net) * |
538 | 1,041 | 1,068 | (48 | %) | (3 | %) | |||||||||||||
| Other operating income/(expenses) (net) |
(288 | ) | (268 | ) | (360 | ) | 7 | % | (26 | %) | ||||||||||
| TOTAL INCOME |
19,065 | 20,757 | 23,566 | (8 | %) | (12 | %) | |||||||||||||
| Administrative expenses |
(7,226 | ) | (7,624 | ) | (8,069 | ) | (5 | %) | (6 | %) | ||||||||||
| Personnel expenses |
(4,012 | ) | (4,235 | ) | (4,551 | ) | (5 | %) | (7 | %) | ||||||||||
| Other general expenses |
(3,214 | ) | (3,389 | ) | (3,518 | ) | (5 | %) | (4 | %) | ||||||||||
| Depreciation and amortization |
(790 | ) | (897 | ) | (863 | ) | (12 | %) | 4 | % | ||||||||||
| Provisions (net) |
(942 | ) | (782 | ) | (1,017 | ) | 20 | % | (23 | %) | ||||||||||
| Impairment losses on financial assets (net) |
(5,143 | ) | (6,485 | ) | (7,300 | ) | (21 | %) | (11 | %) | ||||||||||
| Impairment losses on other assets (net) |
14 | (24 | ) | (17 | ) | n/a | 41 | % | ||||||||||||
| Gains/(losses) on other assets (net) |
113 | 311 | 228 | (64 | %) | 36 | % | |||||||||||||
| OPERATING PROFIT/(LOSS) BEFORE TAX |
5,091 | 5,256 | 6,528 | (3 | %) | (19 | %) | |||||||||||||
| Income tax |
(1,151 | ) | (1,197 | ) | (1,457 | ) | (4 | %) | (18 | %) | ||||||||||
| PROFIT FROM CONTINUING OPERATIONS |
3,940 | 4,059 | 5,071 | (3 | %) | (20 | %) | |||||||||||||
| Profit/(loss) from discontinued operations (net) |
— | — | — | n/a | n/a | |||||||||||||||
| CONSOLIDATED PROFIT FOR THE YEAR |
3,940 | 4,059 | 5,071 | (3 | %) | (20 | %) | |||||||||||||
| Profit attributable to non-controlling interest |
790 | 880 | 866 | (10 | %) | 2 | % | |||||||||||||
| Profit attributable to the Parent |
3,150 | 3,179 | 4,205 | (1 | %) | (24 | %) | |||||||||||||
| ¹ | Figures have been reclassified to exclude Puerto Rico, which is now included under the United States segment. |
| * | Includes exchange differences (net) |
2014 compared to 20133
As of December 31, 2014, Latin America accounted for 41% of profit attributable to the Parent’s total operating areas.
The strategy in 2014 focused on expansion, consolidation and improvement in the business of the commercial franchise in the region.
Total income decreased by €1,692 million or 8%, however in local currencies and eliminating the perimeter effect (the units of Santander Asset Management that were sold and that we now consolidate by the equity method in the various countries), they increased 2%. Net interest income fell by €1,041 million or 7%, however in local currencies and eliminating the perimeter effect they increased 3%, mainly affected by the change in business mix to lower cost of credit products and also reduced spreads, particularly in Brazil and Mexico. Higher volumes and a lower cost of funds offset these effects. Net fees and commissions declined by €243 million or 5%. However, in local currencies and eliminating the perimeter effect, net fee and commission income increased 9%, with growth in all countries, in particular growth from credit cards (10%) and insurance (4%). Gains / (losses) on financial assets and liabilities decreased €503 million mainly due to lower trading gains as the income obtained in 2013 from the sale of portfolios, mainly in Brazil, was not repeated.
Operating expenses decreased by €505 million or 6%. Nevertheless, excluding the exchange rate impact and the perimeter effect, expenses grew by 5% mainly due to investment in networks and commercial projects (some traditional and others focused on priority customer segments) and inflationary pressures on employee compensation and contracted services, and to a lesser extent, the consolidation of GetNet in Brazil.
Provisions and impairment losses decreased by €1,220 million as impairment losses on financial assets declined €1,342 million, mainly due to the improvement in Brazil (-€1,212 million) accentuating the change in trend started at the beginning of 2013. The NPL ratio decreased 35 basis points to 4.65%, positively impacted by Brazil, and the coverage ratio stood at 84.7% at the end of 2014.
| 3 | For a summary by countries see “Item 4. Information on the Company—B. Business Overview—Latin America”. |
149
Table of Contents
Profit attributable to the Parent decreased by €29 million or 1%. However, excluding the exchange rate impact and the perimeter effect, attributable profits increased by 11% mainly due to growth in net interest income and lower loan-loss provisions partly offset by the increase in operating expenses. The higher effective tax charge, mainly in Mexico, and lower minority interests in Brazil, had an adverse impact on our profits.
2013 compared to 2012
As of December 31, 2013, Latin America accounted for 51% of profit attributable to the Parent’s total operating areas.
The strategy in 2013 was focused on the expansion and consolidation of the commercial franchise in the region. The specialized offering of products and services is being strengthened in line with customer requirements, with a view to enabling the Bank to boost long-term growth; all while maintaining constant vigilance of risk quality.
Total income decreased by €2,809 million due to a fall of €2,676 million in net interest income mainly focused in Brazil affected by lower spreads and the change of mix towards products with lower cost and margins. These effects were partially offset by higher volumes (in local currencies ). Net fees and commissions declined by €212 million or 4%. However, deducting the exchange rate impact, net fee and commission income increased 6%. Of note was the growth in local currencies from cards (18%) and foreign trade (19%).
Operating expenses decreased by €411 million or 5%. Nevertheless, excluding the exchange rate impact, operating expenses grew 6% due to investment in networks and commercial projects (some traditional and others focused on priority customer segments), inflationary pressures on salary agreements and contracted services, and higher amortizations for technology.
Provisions and impairment losses decreased by €1,043 million. This fall was mainly concentrated in Brazil which, after the change in trend at the beginning of 2013, reduced its provisions between March and the end of the year. This was partially offset by rises in Mexico and Chile. The NPL ratio and the coverage stood at 5.00% and 85%, respectively.
Profit attributable to the Parent decreased by €1,026 million mainly due to a fall in net interest income affected by lower spreads (primarily in Brazil due to the change of business mix) partially offset by lower provisions due to the improvement in Brazil.
150
Table of Contents
United States
| Variations | ||||||||||||||||||||
| 2014 | 2013¹ | 2012¹ | 2014/2013 | 2013/2012 | ||||||||||||||||
| (in millions of euros, except percentages) | ||||||||||||||||||||
| INTEREST INCOME / (CHARGES) |
4,643 | 1,675 | 1,980 | 177 | % | (15 | %) | |||||||||||||
| Income from equity instruments |
29 | 23 | 21 | 26 | % | 10 | % | |||||||||||||
| Income from companies accounted for by the equity method |
4 | 321 | 341 | (99 | %) | (6 | %) | |||||||||||||
| Net fees and commissions |
683 | 460 | 455 | 48 | % | 1 | % | |||||||||||||
| Gains/losses on financial assets and liabilities (net) * |
162 | 66 | 247 | 145 | % | (73 | %) | |||||||||||||
| Other operating income/(expenses) (net) |
121 | (60 | ) | (71 | ) | n/a | (15 | %) | ||||||||||||
| TOTAL INCOME |
5,642 | 2,485 | 2,973 | 127 | % | (16 | %) | |||||||||||||
| Administrative expenses |
(1,813 | ) | (1,274 | ) | (1,221 | ) | 42 | % | 4 | % | ||||||||||
| Personnel expenses |
(1,029 | ) | (690 | ) | (663 | ) | 49 | % | 4 | % | ||||||||||
| Other general expenses |
(784 | ) | (584 | ) | (558 | ) | 34 | % | 5 | % | ||||||||||
| Depreciation and amortization |
(219 | ) | (169 | ) | (154 | ) | 30 | % | 10 | % | ||||||||||
| Provisions (net) |
(25 | ) | (51 | ) | (180 | ) | (51 | %) | (72 | %) | ||||||||||
| Impairment losses on financial assets (net) |
(2,230 | ) | (44 | ) | (345 | ) | 4,968 | % | (87 | %) | ||||||||||
| Impairment losses on other assets (net) |
(13 | ) | (17 | ) | (24 | ) | (24 | %) | (29 | %) | ||||||||||
| Gains/(losses) on other assets (net) |
46 | (2 | ) | 5 | n/a | n/a | ||||||||||||||
| OPERATING PROFIT/(LOSS) BEFORE TAX |
1,388 | 928 | 1,054 | 50 | % | (12 | %) | |||||||||||||
| Income tax |
(369 | ) | (125 | ) | (192 | ) | 195 | % | (35 | %) | ||||||||||
| PROFIT FROM CONTINUING OPERATIONS |
1,019 | 803 | 862 | 27 | % | (7 | %) | |||||||||||||
| Profit/(loss) from discontinued operations (net) |
— | — | — | n/a | n/a | |||||||||||||||
| CONSOLIDATED PROFIT FOR THE YEAR |
1,019 | 803 | 862 | 27 | % | (7 | %) | |||||||||||||
| Profit attributable to non-controlling interest |
219 | — | — | n/a | n/a | |||||||||||||||
| Profit attributable to the Parent |
800 | 803 | 862 | (0 | %) | (7 | %) | |||||||||||||
| ¹ | Figures have been reclassified to include Puerto Rico, which was previously included under the Latin America segment. |
| * | Includes exchange differences (net). |
2014 compared to 20134
In 2014, United States contributed 11% of the profit attributable to the Parent bank’s total operating areas. In 2014, business was conducted in an environment of faster growth. With interest rates at historic lows, this enabled quantitative stimulus measures to be reduced and the dollar to strengthen against the euro.
Santander Bank strategy in 2014 centered on growth in loans to companies and consolidating the business derived from auto finance, and on increasing and improving the quality of deposits. In addition, measures to optimize the balance sheet were implemented which will have a positive impact on results in the future.
In Santander Puerto Rico the strategy of deleveraging led to a 16% fall in lending.
SCUSA completed in the first quarter of 2014 its public offering of shares and listing on the New York Stock Exchange. SCUSA continued in 2014 its auto finance plan stemming from the agreement with Chrysler, whereby we originate private-label loans and leases under the Chrysler Capital brand (“Chrysler Capital”) to facilitate Chrysler vehicle retail sales. Furthermore, SCUSA took actions and entered into agreements that enabled it to continue to grow in unsecured consumer loans. The strategy of the last few quarters was centered on increasing originations, but maintaining more stable on-balance sheet balances, as a result of securitizations and sales of portfolios.
Total income increased €3,157 million or 127%, however, excluding the exchange rate impact and the perimeter effect (as SCUSA was fully consolidated in 2014), total income increased by €781 million or 16% with improvements in all areas. This growth was mostly due to the increase in lending in SCUSA, offset by the reduction in the investments portfolio that impacted net interest income, as well as the decline in fee income largely due to new regulations on fees we can charge on overdrafts.
Operating expenses rose €589 million or 41% (8% eliminating the perimeter effect) largely due to the need to adapt to regulatory requirements, as well as investment in technology (ATMs, mobile banking and cards).
| 4 | For further information on the segment, see “Item 4. Information on the Company—B. Business Overview—United States”. |
151
Table of Contents
Provisions and impairment losses increased by €2,156 million as Impairment losses on financial assets (net), increased by €2,186 million (€713 million eliminating the perimeter effect), due in particular to SCUSA’s faster pace of lending and growth of the unsecured consumer credit portfolio. At December 31, 2014, the NPL ratio was 2.54%, which represents a 55 basis points reduction from 2013. The coverage ratio improved 45 percentage points to 193% at December 31, 2014.
Profit attributable to the Parent was €800 million in line with the €803 million obtained in 2013. The increase in total income due to SCUSA’s growth in lending did not feed through fully to profits because of the higher provisions required for the faster pace of lending and to a lesser extent, the increase in operating expenses.
2013 compared to 2012
In 2013, United States contributed 13% of the profit attributable to the Parent’s bank total operating areas. Business was conducted in a setting of moderate growth in which the monetary authorities kept interest rates very low and implemented other unconventional stimulus measures such as quantitative easing.
During 2013, Sovereign Bank changed its name to Santander Bank and continued to capture new customers and expand its range of higher value-added products and services. The main strategy in the retail segment is to enhance customer attention via new ATMs, refurbish branches and give an impetus to alternative channels (mobile banking, etc.).
Santander Consumer USA’s strategy was to continue to strengthen its auto finance franchise. The growth drivers are organic growth supported by commercial agreements with brands and dealers, strategic alliances (such as the partnership with Chrysler), growth in the platform of direct credits to clients via Internet (Roadloans.com) and the opportunities of expansion offered by servicing.
Total income decreased by €488 million reflecting a €305 million reduction in net interest income and €181 million reduction in gains on financial assets and liabilities. The decrease in net interest income reflected the low interest rate environment, the reduction in the non-strategic loan portfolio and the sharp fall in the investment portfolio. Gains on financial assets and liabilities decreased due to lower trading gains.
SCUSA’s contribution, which was accounted for as income from companies accounted for by the equity method, was €321 million, 5.9% less than in 2012. Although SCUSA’s net interest income increased by 27% in U.S. dollars, partly due to the agreement with Chrysler, this growth has not yet fed through to profits because of the higher provisions required for the faster pace of lending, which increased 35% in U.S. dollars in 2013.
Operating expenses increased by €68 million as a result of the investment in rebranding, technology (ATMs, mobile banking, cards) and higher spending on regulatory compliance.
Provisions and impairment losses decreased by €437 million due to the normalization of the cost of credit and the improvement in the economy. At December 31, 2013, the NPL ratio and the coverage stood at 2.60% and 87% respectively.
Profit attributable to the Parent decreased €59 million. This fall was mainly driven by Santander Bank as the sharp reduction in provisions due to the high credit quality was offset by a fall in net interest income and gains on financial assets and liabilities and higher operating expenses.
152
Table of Contents
Corporate Activities
| Variations | ||||||||||||||||||||
| 2014 | 2013 | 2012 | 2014/2013 | 2013/2012 | ||||||||||||||||
| (in millions of euros, except percentages) | ||||||||||||||||||||
| INTEREST INCOME / (CHARGES) |
(1,937 | ) | (2,234 | ) | (1,843 | ) | (13 | %) | 21 | % | ||||||||||
| Income from equity instruments |
30 | 35 | 53 | (14 | %) | (34 | %) | |||||||||||||
| Income from companies accounted for by the equity method |
(28 | ) | (8 | ) | (4 | ) | 250 | % | 100 | % | ||||||||||
| Net fees and commissions |
(37 | ) | (50 | ) | (29 | ) | (26 | %) | 72 | % | ||||||||||
| Gains/losses on financial assets and liabilities (net) * |
1,456 | 1,109 | 288 | 31 | % | 285 | % | |||||||||||||
| Other operating income/(expenses) (net) |
58 | 107 | 512 | (46 | %) | (79 | %) | |||||||||||||
| TOTAL INCOME |
(458 | ) | (1,041 | ) | (1,023 | ) | (56 | %) | 2 | % | ||||||||||
| Administrative expenses |
(663 | ) | (566 | ) | (410 | ) | 17 | % | 38 | % | ||||||||||
| Personnel expenses |
(243 | ) | (216 | ) | (102 | ) | 13 | % | 112 | % | ||||||||||
| Other general expenses |
(420 | ) | (350 | ) | (308 | ) | 20 | % | 14 | % | ||||||||||
| Depreciation and amortization |
(111 | ) | (132 | ) | (120 | ) | (16 | %) | 10 | % | ||||||||||
| Provisions (net) |
(1,328 | ) | (1,222 | ) | 377 | 9 | % | (424 | %) | |||||||||||
| Impairment losses on financial assets (net) |
(44 | ) | (352 | ) | (112 | ) | (88 | %) | 214 | % | ||||||||||
| Impairment losses on other assets (net) |
(865 | ) | (393 | ) | (440 | ) | 120 | % | (11 | %) | ||||||||||
| Gains/(losses) on other assets (net) |
2,639 | 1,795 | 668 | 47 | % | 169 | % | |||||||||||||
| OPERATING PROFIT/(LOSS) BEFORE TAX |
(830 | ) | (1,911 | ) | (1,060 | ) | (57 | %) | 80 | % | ||||||||||
| Income tax |
(1,017 | ) | (35 | ) | (113 | ) | 2,806 | % | (69 | %) | ||||||||||
| PROFIT FROM CONTINUING OPERATIONS |
(1,847 | ) | (1,946 | ) | (1,173 | ) | (5 | %) | 66 | % | ||||||||||
| Profit/(loss) from discontinued operations (net) |
— | — | — | n/a | n/a | |||||||||||||||
| CONSOLIDATED PROFIT FOR THE YEAR |
(1,847 | ) | (1,946 | ) | (1,173 | ) | (5 | %) | 66 | % | ||||||||||
| Profit attributable to non-controlling interest |
(58 | ) | 137 | (19 | ) | (142 | %) | (821 | %) | |||||||||||
| Profit attributable to the Parent |
(1,789 | ) | (2,083 | ) | (1,154 | ) | (14 | %) | 81 | % | ||||||||||
| * | Includes exchange differences (net). |
2014 compared to 2013
Total income improved by €583 million or 56%. Net interest income / (charges) improved by €297 million due to the lower cost of issues. Gains/losses on financial assets and liabilities (net) increased by €347 million due to improved trading gains due to increased results from the management of assets and liabilities. These gains include those derived from the centralized management of the interest rate and exchange rate risk of the Parent bank as well as that from equities.
Operating expenses increased €76 million or 11% mainly due to the combined effect of stable recurring personnel costs (where the efficiency plans are producing their results), and the higher costs related to ongoing corporate transactions, which are recorded in Corporate Activities until their effective entry into force. Costs related to the implementation of the various regulations are also recorded in Corporate Activities.
Provisions and impairment losses increased €270 million mainly due to provision for pre-retirements in Spain and restructuring costs and impairment losses on intangible assets partly offset by the decrease in loan-loss provisions. These impairment losses on intangible assets mainly relate to the decline in, or loss, of the recoverable value of certain computer systems and applications as a result of the processes initiated by the Group to adapt to the various regulatory changes and to transform or integrate businesses.
Gains/(losses) on other assets (net) were €2,639 mainly due to: (i) the public offering of shares by SCUSA €1.7 billion, (ii) the sale of Altamira for €550 million, and (iii) €413 million due to the sale of insurance companies in Ireland of which €207 million related to the fair value recognition of the 49% ownership interest retained by the Group. See notes 3 and 49 to our consolidated financial statements.
Income taxes increased by €982 million mainly due to the previously mentioned transactions.
Loss attributable to the Parent decreased by €294 million as total income and gains on other assets improved, partially offset by the increase in income tax as well as by higher provisions and impairment losses.
153
Table of Contents
2013 compared to 2012
Total income decreased €18 million or 1.6%. Net interest income / (charges) worsened by €391 million due to our policy of strengthening liquidity since the middle of 2012, and which, combined with the current low level of market interest rates, caused net interest income to deteriorate temporarily. It also includes the cost of credit of issues in wholesale markets, which was partly absorbed by lower recourse to these markets (directly related to the lower funding needs from the gap between lending and deposits).
Other operating income decreased by €405 million mainly due to the €435 million accounted in 2012 as a result of the agreement reached with Abbey Life Insurance Ltd., a subsidiary of Deutsche Bank AG. The agreement provided for the reinsurance of our entire individual life risk portfolio of our insurance companies in Spain and Portugal.
Gains/losses on financial assets and liabilities increased by €821 million due to gains derived from the ALCO portfolio. These gains reflect those derived from the centralized management of the interest rate and exchange rate risk of the parent bank as well as from equities.
Operating expenses increased €168 million mainly due to the execution in 2013 of projects originally planned for 2012. Administrative expenses increased, partly linked to higher indirect taxes.
Provisions and impairment losses increased €1,792 million mainly due to provisions for pensions and similar obligations relating to the pre-retirement and voluntary redundancy offer accepted by employees in 2013, charges made in the fourth quarter for goodwill in Italy, real estate provisions and for the integration costs of SEB in Germany.
Gains/(losses) on other assets (net) registered an increase of €1,127 million. Gains were mainly due to the sale of our management companies (€1,372 million) to Warburg Pincus and General Atlantic, the insurance companies in Spain (€385 million) to Aegon, and the payment services company (€122 million) to Elavon Financial Services Limited.
Loss attributable to the Parent increased by €929 million primarily due to greater provisions and impairment losses, higher interest charges partially offset by trading gains and gains on corporate transactions.
154
Table of Contents
Second level (business):
Retail Banking
| Variations | ||||||||||||||||||||
| 2014¹ | 2013 | 2012 | 2014/2013 | 2013/2012 | ||||||||||||||||
| (in millions of euros, except percentages) | ||||||||||||||||||||
| INTEREST INCOME / (CHARGES) |
28,493 | 25,552 | 28,865 | 12 | % | (11 | %) | |||||||||||||
| Income from equity instruments |
132 | 78 | 86 | 69 | % | (9 | %) | |||||||||||||
| Income from companies accounted for by the equity method |
47 | 401 | 400 | (88 | %) | n/a | ||||||||||||||
| Net fees and commissions |
7,700 | 8,193 | 8,471 | (6 | %) | (3 | %) | |||||||||||||
| Gains/losses on financial assets and liabilities (net) * |
615 | 1,119 | 2,004 | (45 | %) | (44 | %) | |||||||||||||
| Other operating income/(expenses) (net) |
(356 | ) | (553 | ) | (630 | ) | (36 | %) | (12 | %) | ||||||||||
| TOTAL INCOME |
36,631 | 34,790 | 39,196 | 5 | % | (11 | %) | |||||||||||||
| Administrative expenses |
(14,893 | ) | (14,890 | ) | (15,343 | ) | 0 | % | (3 | %) | ||||||||||
| Personnel expenses |
(8,608 | ) | (8,669 | ) | (8,986 | ) | (1 | %) | (4 | %) | ||||||||||
| Other general expenses |
(6,285 | ) | (6,221 | ) | (6,357 | ) | 1 | % | (2 | %) | ||||||||||
| Depreciation and amortization |
(1,903 | ) | (2,027 | ) | (1,848 | ) | (6 | %) | 10 | % | ||||||||||
| Provisions (net) |
(1,628 | ) | (1,173 | ) | (1,815 | ) | 39 | % | (35 | %) | ||||||||||
| Impairment losses on financial assets (net) |
(9,763 | ) | (9,506 | ) | (12,182 | ) | 3 | % | (22 | %) | ||||||||||
| Impairment losses on other assets (net) |
(30 | ) | (73 | ) | (44 | ) | (59 | %) | 66 | % | ||||||||||
| Gains/(losses) on other assets (net) |
487 | 249 | 219 | 96 | % | 14 | % | |||||||||||||
| OPERATING PROFIT/(LOSS) BEFORE TAX |
8,901 | 7,370 | 8,183 | 21 | % | (10 | %) | |||||||||||||
| Income tax |
(2,070 | ) | (1,509 | ) | (1,675 | ) | 37 | % | (10 | %) | ||||||||||
| PROFIT FROM CONTINUING OPERATIONS |
6,831 | 5,861 | 6,508 | 17 | % | (10 | %) | |||||||||||||
| Profit/(loss) from discontinued operations (net) |
(26 | ) | (15 | ) | 70 | 73 | % | n/a | ||||||||||||
| CONSOLIDATED PROFIT FOR THE YEAR |
6,805 | 5,846 | 6,578 | 16 | % | (11 | %) | |||||||||||||
| Profit attributable to non-controlling interest |
934 | 769 | 686 | 21 | % | 12 | % | |||||||||||||
| Profit attributable to the Parent |
5,871 | 5,077 | 5,892 | 16 | % | (14 | %) | |||||||||||||
| ¹ | Do not include Private Banking, which is included under the Private Banking, Asset Management and Insurance segment. |
| * | Includes exchange differences (net). |
2014 compared to 2013
Retail Banking generated 77% of the operating areas’ profit attributable to the Parent bank in 2014. The evolution of results in euros is affected by average exchange rates. In addition, SCUSA, which was previously accounted for by the equity method, is fully consolidated in our results as of the date we took control after its public offering and listing in January 2014.
The €1,841 million increase in total income was mainly due to a €2,941 million or 12% growth in net interest income. However, eliminating the perimeter effect (as if SCUSA was fully consolidated in 2013 and Private Banking was not included in the Retail Banking segment) and excluding the exchange rate impact, total income and net interest income increased €1,817 million or 5% and €1,865 million or 7%, respectively. The increase in net interest income was primarily focused in: (i) Continental Europe and the U.K. as the reduction in cost of funds compensated the decrease in interest income and (ii) in U.S. due to the increase in lending. Each of our four business areas (Continental Europe, the U.K., Latin America and the U.S.) improved their total income.
Net fees and commissions decreased €493 million. However, eliminating the perimeter effect and excluding the exchange rate impact net fees and commissions increased €253 million mainly due to Latin America’s performance.
Operating expenses decreased by €121 million or 1% as the depreciation of the Latin American currencies compensated the perimeter effect and the investments made to develop the network and businesses.
155
Table of Contents
Provisions and impairment losses increased by €669 million or 6%. The main developments were the inclusion of SCUSA and its lending growth, as well as the decrease in impairments in Latin America mainly concentrated in Brazil.
Profit attributable to the Parent increased by €794 million or 16% (26% at constant perimeter and exchange rate) spurred by our increase net interest income and control of costs.
2013 compared to 2012
Retail Banking generated 81.1% of the operating areas’ profit attributable to the Parent bank in 2013.
The €4,406 million decrease in total income was mainly due to a €3,313 million fall in net interest income (-5.3% excluding the exchange rate impact). This reflected the environment of low growth and interest rates, the Group’s strategy of giving priority to liquidity and balance sheet strength and the change of business mix toward lower risk products. Further contributing to the fall in total income was a €885 million reduction in gains/losses on financial assets and liabilities as in 2012 Santander UK accounted for the repurchase of debt capital instruments.
Net fees and commissions decreased by €278 million. Excluding the exchange rate impact, they increased by 2.7% benefiting from the growth in commissions in cards in Latin America.
Operating expenses decreased by €274 million. Excluding the exchange rate impact they increased 4.4% mainly due to the increasing costs in Latin America related to business development and inflationary pressures on wage agreements. Santander Bank’s operating expenses also increased due to the rebranding process and technology investment.
Provisions and impairment losses decreased by €3,289 million mainly attributable to the improvement of the portfolio’s composition and its credit quality, and improvement in the economy.
Profit attributable to the Parent decreased by €815 million or 13.8% (8.9% lower excluding exchange rates) due to lower total income in an environment of reduced business and low interest rates in mature markets and change of business mix in emerging ones. Lower provisions partly offset the decrease in total income.
156
Table of Contents
Global Wholesale Banking
| Variations | ||||||||||||||||||||
| 2014 | 2013 | 2012 | 2014/2013 | 2013/2012 | ||||||||||||||||
| (in millions of euros, except percentages) | ||||||||||||||||||||
| INTEREST INCOME / (CHARGES) |
2,533 | 2,464 | 2,708 | 3 | % | (9 | %) | |||||||||||||
| Income from equity instruments |
273 | 265 | 284 | 3 | % | (7 | %) | |||||||||||||
| Income from companies accounted for by the equity method |
(2 | ) | (1 | ) | — | n/a | n/a | |||||||||||||
| Net fees and commissions |
1,414 | 1,254 | 1,360 | 13 | % | (8 | %) | |||||||||||||
| Gains/losses on financial assets and liabilities (net) * |
747 | 1,159 | 840 | (36 | %) | 38 | % | |||||||||||||
| Other operating income/(expenses) (net) |
32 | 7 | (16 | ) | 357 | % | n/a | |||||||||||||
| TOTAL INCOME |
4,997 | 5,148 | 5,176 | (3 | %) | (1 | %) | |||||||||||||
| Administrative expenses |
(1,615 | ) | (1,549 | ) | (1,592 | ) | 4 | % | (3 | %) | ||||||||||
| Personnel expenses |
(1,015 | ) | (988 | ) | (1,013 | ) | 3 | % | (2 | %) | ||||||||||
| Other general expenses |
(600 | ) | (561 | ) | (579 | ) | 7 | % | (3 | %) | ||||||||||
| Depreciation and amortization |
(205 | ) | (186 | ) | (171 | ) | 10 | % | 9 | % | ||||||||||
| Provisions (net) |
(43 | ) | (47 | ) | (17 | ) | (9 | %) | 176 | % | ||||||||||
| Impairment losses on financial assets (net) |
(556 | ) | (952 | ) | (420 | ) | (42 | %) | 127 | % | ||||||||||
| Impairment losses on other assets (net) |
(43 | ) | (37 | ) | (24 | ) | 16 | % | 54 | % | ||||||||||
| Gains/(losses) on other assets (net) |
(12 | ) | 12 | (5 | ) | n/a | n/a | |||||||||||||
| OPERATING PROFIT/(LOSS) BEFORE TAX |
2,523 | 2,389 | 2,947 | 6 | % | (19 | %) | |||||||||||||
| Income tax |
(689 | ) | (661 | ) | (827 | ) | 4 | % | (20 | %) | ||||||||||
| PROFIT FROM CONTINUING OPERATIONS |
1,834 | 1,728 | 2,120 | 6 | % | (18 | %) | |||||||||||||
| Profit/(loss) from discontinued operations (net) |
— | — | — | n/a | n/a | |||||||||||||||
| CONSOLIDATED PROFIT FOR THE YEAR |
1,834 | 1,728 | 2,120 | 6 | % | (18 | %) | |||||||||||||
| Profit attributable to non-controlling interest |
220 | 224 | 209 | (2 | %) | 7 | % | |||||||||||||
| Profit attributable to the Parent |
1,614 | 1,504 | 1,911 | 7 | % | (21 | %) | |||||||||||||
| * | Includes exchange differences (net). |
2014 compared to 2013
Santander Global Banking and Markets maintained in 2014 the key pillars of its business model, focused on the customer, the global reach of the division and its synergies with local units, with an active management of risk, capital and liquidity. This segment contributed 21% of profit attributable to the Parent bank in 2014.
Total income decreased €151 million mainly due to lower gains on financial assets and liabilities (€412 million) partially offset by the €160 million increase in net fees and commissions and the €69 million increase in net interest income. The sharp fall in gains on financial assets and liabilities was due to lower trading gains relating to the impact of markets on transactions with customers and valuation adjustments.
Operating expenses increased 5% reflecting investments in high potential markets, particularly in the U.K. and the U.S.
Provisions and impairment losses decreased by €394 million or 38% compared with 2013 due to lower loan-loss provisions, after the increase experienced in 2013 in Spain and Mexico.
Profit attributable to the Parent increased by €110 million. This performance was due to the increase in income from fees and commissions, the growth in net interest income and lower provisions, which were offset by the decrease in gains on financial assets and liabilities, higher costs incurred from the investment in franchises under development.
157
Table of Contents
2013 compared to 2012
Santander Global Banking and Markets conducted its business in markets that were more stable and with increased regulatory requirements. This segment contributed 24.0% of profit attributable to the Parent bank in 2013.
Total income decreased 0.5% or €28 million. However, it rose 4.9% year-on-year, excluding the exchange rate impact. Net interest income decreased €244 million mainly due to exchange rates and to a lesser extent a reduction in Spain’s business volume.
Operating expenses decreased 1.6% (2.9% eliminating exchange rates), reflecting the investments in building up franchises in key markets.
Provisions and impairment losses increased by €575 million due to higher loan-loss provisions, mainly in Spain and Mexico. In the first case, they were related to specific companies, and in the second mainly to homebuilders.
Profit attributable to the Parent decreased by €407 million. The key drivers were higher minority interests in the Latin American units, the depreciation of their currencies and, above all, higher loan-loss provisions.
Private Banking, Asset Management and Insurance
| Variations | ||||||||||||||||||||
| 2014 | 2013¹ | 2012¹ | 2014/2013 | 2013/2012 | ||||||||||||||||
| (in millions of euros, except percentages) | ||||||||||||||||||||
| INTEREST INCOME / (CHARGES) |
462 | 115 | 119 | 302 | % | (3 | %) | |||||||||||||
| Income from equity instruments |
— | — | — | n/a | n/a | |||||||||||||||
| Income from companies accounted for by the equity method * |
294 | 148 | 131 | 99 | % | 13 | % | |||||||||||||
| Net fees and commissions |
610 | 349 | 418 | 75 | % | (17 | %) | |||||||||||||
| Gains/losses on financial assets and liabilities (net) |
32 | 6 | 3 | 433 | % | n/a | ||||||||||||||
| Other operating income/(expenses) (net) |
108 | 145 | 223 | (26 | %) | (35 | %) | |||||||||||||
| TOTAL INCOME |
1,506 | 763 | 894 | 97 | % | (15 | %) | |||||||||||||
| Administrative expenses |
(523 | ) | (285 | ) | (272 | ) | 84 | % | 5 | % | ||||||||||
| Personnel expenses |
(338 | ) | (149 | ) | (160 | ) | 127 | % | (7 | %) | ||||||||||
| Other general expenses |
(185 | ) | (136 | ) | (112 | ) | 36 | % | 21 | % | ||||||||||
| Depreciation and amortization |
(57 | ) | (33 | ) | (35 | ) | 73 | % | (6 | %) | ||||||||||
| Provisions (net) |
(10 | ) | (3 | ) | (17 | ) | 233 | % | (82 | %) | ||||||||||
| Impairment losses on financial assets (net) |
(0 | ) | (7 | ) | (2 | ) | (100 | %) | 250 | % | ||||||||||
| Impairment losses on other assets (net) |
— | — | — | n/a | n/a | |||||||||||||||
| Gains/(losses) on other assets (net) |
2 | 2 | 8 | 0 | % | n/a | ||||||||||||||
| OPERATING PROFIT/(LOSS) BEFORE TAX |
918 | 437 | 576 | 110 | % | (24 | %) | |||||||||||||
| Income tax |
(192 | ) | (101 | ) | (154 | ) | 90 | % | (34 | %) | ||||||||||
| PROFIT FROM CONTINUING OPERATIONS |
726 | 336 | 422 | 116 | % | (20 | %) | |||||||||||||
| Profit/(loss) from discontinued operations (net) |
— | — | — | n/a | n/a | |||||||||||||||
| CONSOLIDATED PROFIT FOR THE YEAR |
726 | 336 | 422 | 116 | % | (20 | %) | |||||||||||||
| Profit attributable to non-controlling interest |
23 | 24 | 20 | (4 | %) | 20 | % | |||||||||||||
| Profit attributable to the Parent |
703 | 312 | 402 | 125 | % | (22 | %) | |||||||||||||
| ¹ | Do not include Private Banking, which is included under the Retail Banking segment. |
| * | Includes exchange differences (net). |
158
Table of Contents
2014 compared to 2013
In 2014 this unit generated 9% of the operating areas’ total profit attributable to the Parent bank. The whole area registered a trend of sustained improvement in gross income and spreads that resulted in the highest attributable profit in two years being recorded in the fourth quarter.
Total income increased by €743 million or 97%, however excluding the perimeter effect (as if Private Banking were included in 2013, and assuming units of Santander Asset Management that were sold were consolidated by the equity method in 2013) and the exchange rate impact, total income increased 8% mainly due to the increased contribution of our joint ventures in the insurance segment.
Operating expenses increased by €262 million or 82%, however excluding the perimeter effect and exchange rate impact, operating expenses grew by 2%.
Profit attributable to the Parent increased by €391 million or 125%. Disregarding the effect of the changes in the scope of consolidation (as if Private Banking was included in 2013, and assuming units of Santander Asset Management that were sold were consolidated by the equity method in 2013), and excluding the impact of exchange rates, the increase would have been 31%. This increase was due to higher total income, flat operating expenses and lower provisions.
2013 compared to 2012
In 2013 this unit generated 5.0% of the operating areas’ total profit attributable to the Parent bank. In December 2012, Santander agreed to a strategic alliance with the insurer Aegon to boost its bancassurance business in Spain through commercial networks. This transaction closed in June 2013. The alliance does not affect savings, auto and health insurance, which Santander continues to manage.
Total income decreased by €131 million or 14.7% mainly due to a €69 million decrease in net fees and commission and a €78 million decrease in other operating income. These changes are mostly related to the agreement reached in July 2012, with Abbey Life Insurance Ltd. and the previously mentioned alliance with Aegon. Eliminating the perimeter and exchange rate effects, total income declined 3.6%.
Operating expenses increased by €11million reflecting the costs of developing the franchise.
Profit attributable to the Parent decreased by €90 million or 22.4%. Excluding the agreement with Abbey Life Insurance Ltd., the alliance with Aegon and exchange rate effects, attributable profit would have been 7.1% lower in 2013.
159
Table of Contents
Spain’s Run-Off Real Estate
| Variations | ||||||||||||||||||||
| 2014 | 2013 | 2012 | 2014/2013 | 2013/2012 | ||||||||||||||||
| (in millions of euros, except percentages) | ||||||||||||||||||||
| INTEREST INCOME / (CHARGES) |
(4 | ) | 38 | 74 | n/a | (49 | %) | |||||||||||||
| Income from equity instruments |
— | — | — | n/a | n/a | |||||||||||||||
| Income from companies accounted for by the equity method |
(68 | ) | (40 | ) | (100 | ) | 70 | % | n/a | |||||||||||
| Net fees and commissions |
9 | 15 | 41 | (40 | %) | (63 | %) | |||||||||||||
| Gains/losses on financial assets and liabilities (net) * |
— | 1 | 5 | (100 | %) | (80 | %) | |||||||||||||
| Other operating income/(expenses) (net) |
(1 | ) | (8 | ) | (3 | ) | (88 | %) | 167 | % | ||||||||||
| TOTAL INCOME |
(64 | ) | 6 | 17 | n/a | (65 | %) | |||||||||||||
| Administrative expenses |
(205 | ) | (162 | ) | (184 | ) | 27 | % | (12 | %) | ||||||||||
| Personnel expenses |
(38 | ) | (47 | ) | (45 | ) | (19 | %) | 4 | % | ||||||||||
| Other general expenses |
(167 | ) | (115 | ) | (139 | ) | 45 | % | (17 | %) | ||||||||||
| Depreciation and amortization |
(11 | ) | (13 | ) | (9 | ) | (15 | %) | 44 | % | ||||||||||
| Provisions (net) |
— | — | — | n/a | n/a | |||||||||||||||
| Impairment losses on financial assets (net) |
(347 | ) | (410 | ) | (6,164 | ) | (15 | %) | (93 | %) | ||||||||||
| Impairment losses on other assets (net) |
— | — | — | n/a | n/a | |||||||||||||||
| Gains/(losses) on other assets (net) |
(206 | ) | (328 | ) | (741 | ) | (37 | %) | (56 | %) | ||||||||||
| OPERATING PROFIT/(LOSS) BEFORE TAX |
(833 | ) | (907 | ) | (7,081 | ) | (8 | %) | (87 | %) | ||||||||||
| Income tax |
250 | 272 | 2,185 | (8 | %) | (88 | %) | |||||||||||||
| PROFIT FROM CONTINUING OPERATIONS |
(583 | ) | (635 | ) | (4,896 | ) | (8 | %) | (87 | %) | ||||||||||
| Profit/(loss) from discontinued operations (net) |
— | — | — | n/a | n/a | |||||||||||||||
| CONSOLIDATED PROFIT FOR THE YEAR |
(583 | ) | (635 | ) | (4,896 | ) | (8 | %) | (87 | %) | ||||||||||
| Profit attributable to non-controlling interest |
— | — | (128 | ) | n/a | (100 | %) | |||||||||||||
| Profit attributable to the Parent |
(583 | ) | (635 | ) | (4,768 | ) | (8 | %) | (87 | %) | ||||||||||
| * | Includes exchange differences (net). |
2014 compared to 2013
The Group manages in a separate unit its run-off real estate activity in Spain, which includes loans to clients mainly for real estate promotion, and has a specialized management model, stakes in the real estate company SAREB and foreclosed assets. The Group’s strategy in the last few years has been to reduce the volume of these assets which at the end of 2014 stood at €8,114 million in net terms (around 3% of loans in Spain and less than 1% of the Group’s loans).
Impairment losses on financial assets continued its downward trend and experienced a reduction of €63 million directly related to the decrease in net customer lending which amounted to €3,787 million, or €1,948 million less than in 2013.
Losses on other assets (net) decreased by €122 million mainly due to a drop in impairments and losses from sale of foreclosed assets.
Losses attributable to the Parent decreased €52 million, mainly due to a fall in impairment losses and decreased losses on other assets.
2013 compared to 2012
In 2013, we began to manage a separate unit for run-off real estate activity in Spain, which has a specialized management model and, which includes loans to clients mainly for real estate promotion, stakes in real estate companies (Metrovacesa and SAREB) and foreclosed assets.
160
Table of Contents
Losses attributable to the Parent decreased by €4,133 million after the heavy impairment losses accounted for during 2012 due to the deterioration of the real estate portfolio. Provisions and impairment losses decreased €5,754.
Losses on other assets decreased by €413 million mainly due to lesser provisions for foreclosed assets in 2013.
Income tax benefit decreased by €1,913 million as operating losses decreased by €6,173 million.
Financial Condition
Assets and Liabilities
Our consolidated total assets were €1,266,296 million at December 31, 2014, a €150,533 million increase from total assets of €1,115,763 million at December 31, 2013. Our gross loans and advances to corporate clients, individual clients and government and public entities, including the trading portfolio, other financial assets at fair value and loans, increased by 9.8% to €761,928 million at December 31, 2014, from €693,759 million at December 31, 2013.
Changes in exchange rates of the currencies in which we operate significantly impacted our financial position as compared to 2013. On the basis of year-end exchange rates, the dollar appreciated 14% against the euro, 7% against the sterling and the Brazilian real and 1% against the Mexican peso, while the Chilean and Argentine pesos depreciated 2% and 13%, respectively and the Polish zloty 3%. The year-on-year impact in lending and customer funds was 3-4 percentage points positive.
There was also a positive perimeter effect from the full consolidation of Santander Consumer USA, the incorporation of Financiera El Corte Inglés, GetNet and the consumer finance business of GE Capital in the Nordic countries.
Customer deposits, which comprise deposits from clients and securities sold to clients under agreements to repurchase, increased by 6.5% from €607,837 million at December 31, 2013, to €647,627 million at December 31, 2014, affected by exchange rates. Other managed funds, including mutual funds, pension funds, managed portfolios and savings-insurance policies, increased by 12.9% from €125,170 million at December 31, 2013 to €141,369 million at December 31, 2014. The strategic objective has been to grow demand deposits, reduce expensive deposits and market mutual funds. The result was 9% growth in demand deposits (rise in the 10 main units), a 5% fall in time deposits and an increase of 18% in mutual funds.
During 2014, the Group issued €66,360 million of senior debt (including Santander UK’s medium term program and €7,711 million in covered bonds), and €4,351 million of subordinated debt. As regards securitization activities, in 2014 the Group’s subsidiaries placed several securitizations for a total amount of €13,391 million, mainly through the Santander Consumer Finance units.
During 2014, €60,883 million of senior debt (including Santander UK’s medium term program), including €10,175 million of covered bonds and €3,743 million of subordinated debt, matured.
Regarding other balance sheet items, goodwill totaled €27,548 million, which was €4,267 million more than in 2013 due to the full consolidation of SCUSA, the incorporation of GetNet and GE’s business in Nordic countries and the change in exchange rates, particularly the U.S. dollar and sterling.
Financial assets available for sale at December 31, 2014, totaled €115,250 million, which was €31,451 million (38%) more than a year earlier, due to the increased debt positions of Spain, Portugal, the U.K., Brazil and the U.S..
Capital
Stockholders’ equity, net of treasury stock, at December 31, 2014, was €80,805 million, an increase of €10,477 million or 14.9% from €70,328 million at December 31, 2013, mainly due to the increase in the capital stock, additional paid-in capital, consolidated income for the year and the decrease of negative valuation adjustments, mainly due to exchange differences.
Our computable capital as of December 31, 2014 amounted to €70,483 million and the surplus over the minimum required was €23.6 billion. Our total capital ratio as of that date is 12.0%.
Under the new European regulation on capital, we effected three issuances of contingent perpetual preferred securities convertible into ordinary shares of the Bank, eligible as additional Tier 1 (AT1) capital, to strengthen our solvency (Tier 1) capital in 2014.
161
Table of Contents
These transactions were for €1,500 million in March, $1,500 million in May and €1,500 million in September, and at annual rates of 6.25%, 6.375% and 6.25%, respectively, for the first five years in the first two cases and the first seven in the other. From a qualitative standpoint, the Group has solid ratios appropriate for its business model, balance sheet structure and risk profile.
As of December 31, 2014 the phased-in CET1 (common equity tier 1) is 11.0%, the same as that for the Tier 1 capital ratio, while the total ratio is 12.0%. The fully-loaded CET1 is 8.3% and the fully-loaded total ratio is 10.4%.
Our eligible stockholders’ equity under BIS II was €71,453 million at December 31, 2013. The surplus over the minimum required by the Bank of Spain was €23.3 billion at December 31, 2013. In accordance with the Basel II Accord criteria (which provide the framework under which Spanish entities must report capital ratios as of June 30, 2008), at December 31, 2013 the BIS II ratio was 14.59% (13.09% at December 31, 2012), Tier I Capital was 12.60% (11.17% at December 31, 2012) and core capital was 11.71% (10.33% at December 31, 2012). See “Item 4. Information on the Company—B. Business Overview—Supervision and Regulation—Capital Adequacy Requirements”.
B. Liquidity and capital resources
Management of liquidity
For information about our liquidity risk management process, see “Item 11. Quantitative and Qualitative Disclosures about Market Risk—Part 1. Corporate risk management and control principles” and “Item 11. Quantitative and Qualitative Disclosures about Market Risk—Part 6. Liquidity and funding risk”.
Sources of funding
As a financial group, a principal source of our liquidity is our customer deposits which consist primarily of demand, time and notice deposits. In addition, we complement the liquidity generated by our customer deposits through access to the domestic and international capital markets and to the interbank market (overnight and time deposits). For this purpose, we have in place a series of domestic and international programs for the issuance of commercial paper and medium- and long-term debt. We also maintain a diversified portfolio of liquid and securitized assets throughout the year. In addition, another source of liquidity is the generation of cash flow.
At December 31, 2014, we had outstanding €196.9 billion of senior debt, of which €78.6 billion were mortgage bonds and €18.1 billion were promissory notes. Additionally, we had €17.1 billion in outstanding subordinated debt (which includes €6.2 billion preferred securities and €0.7 billion in preferred shares).
The following table shows the average balances during the years 2014, 2013 and 2012 of our principal sources of funds:
| 2014 | 2013 | 2012 | ||||||||||
| (in millions of euros) | ||||||||||||
| Due to credit entities |
132,505 | 129,610 | 154,686 | |||||||||
| Customer deposits |
629,460 | 632,339 | 636,351 | |||||||||
| Marketable debt securities |
189,765 | 188,954 | 204,701 | |||||||||
| Subordinated debt |
17,302 | 16,645 | 21,239 | |||||||||
|
|
|
|
|
|
|
|||||||
| Total |
969,032 | 967,548 | 1,016,977 | |||||||||
The average maturity of our outstanding debt as of December 31, 2014 is as follows:
| (1) Senior debt |
5.4 years | |||
| (2) Mortgage debt |
12.9 years | |||
| (3) Dated subordinated debt |
7.1 years |
For more information see notes 22.b, 23.a and 51.a to our consolidated financial statements.
162
Table of Contents
The cost and availability of debt financing are influenced by our credit ratings. A reduction in these ratings could increase the cost of and reduce our market access to debt financing. Our credit ratings are as follows:
| . | Long-Term | Short-Term | Outlook | |||
| Moody’s |
Baa1 | P-2 | Stable | |||
| Standard & Poor’s |
BBB+ | A-2 | Stable | |||
| Fitch |
A- | F2 | Stable | |||
| DBRS |
A | R-1 (low) | Stable | |||
Our total customer deposits, excluding assets sold under repurchase agreements, totaled €606.2 billion at December 31, 2014. Loans and advances to customers (gross) totaled €761.9 billion at the same date.
We remain well placed to access various wholesale funding sources from a wide range of counterparties and markets, and the changing mix between customer deposits and repos, deposits by banks and debt securities in issue primarily reflects comparative pricing, maturity considerations and investor counterparty demand rather than any material perceived trend.
We use our liquidity to fund our lending and investment securities activities, for the payment of interest expense, for dividends paid to shareholders and the repayment of debt.
We, Grupo Santander, are a European, Latin American and North American financial group. Although at this moment we are not aware of any material legal or economic restrictions on the ability of our subsidiaries to transfer funds to the Bank (the Parent company) in the form of cash dividends, loans or advances, capital repatriation and other forms, or to have access to foreign currency at the official exchange rate, there is no assurance that in the future such restrictions will not be adopted or how they would affect our business. Nevertheless, the geographic diversification of our businesses limits the effect of any restrictions that could be adopted in any given country.
In some jurisdictions, limitations have been imposed on dividend payments under the new, much stricter capital adequacy regulations.
We believe that our working capital is sufficient for our present requirements and to pursue our planned business strategies.
As of December 31, 2014, and to the present date, we did not, and presently do not, have any material commitments for capital expenditures.
C. Research and development, patents and licenses, etc.
During 2014, 2013 and 2012, we spent €1,345 million, €1,229 million, and €1,098 million, respectively, in research and development activities in connection with information technology projects.
Overview
We believe we have a unique model and franchise to compete in the global retail banking landscape. Our purpose is to help people and businesses prosper. At our core lies:
| • | A diversified presence. Our well-balanced emerging-mature markets mix is delivering growth above our peers. |
| • | Strong retail and commercial operations. We are or aim to be one of the top 3 banks in our core 10 markets, which give us access to one billion customers. |
| • | Autonomous subsidiaries in liquidity and capital. The Group is composed of subsidiaries that are autonomous in capital and liquidity. This autonomy creates incentives for good local management and enhances our stability and flexibility. |
| • | International talent management, a common culture and a top global brand. We are able to attract and retain world class talent. We have a shared approach as to how we want to operate and we have created a powerful, global brand. |
163
Table of Contents
| • | Prudent risk management and balance sheet strength, underpinned by our Group’s solid control framework. We have delivered a dividend every year for more than 50 years, including during the financial crisis. |
| • | Investment in innovation, driving digital transformation, and sharing best practice. Our global scale enables us to add value to our subsidiaries around the world. |
Our aim is to be the best retail and commercial bank that earns the lasting loyalty of our employees, customers, shareholders and communities.
We have communicated to the market six strategic priorities that will allow us to achieve our aim. These priorities are:
| 1. | Be the best bank to work in and transform our culture |
| 2. | Increase the number of loyal individual customers and companies |
| 3. | Operational excellence |
| 4. | Capital strength and risk management |
| 5. | Enhanced profitability |
| 6. | Santander Universities as the main support of communities |
Our corporate culture is based on everything we do should be Simple, Personal and Fair.
| • | A simple bank offers its customers a service that is convenient and products that are easy to understand, however and whenever they choose to bank. It makes its processes better every day, so they are easy and clear for customers and its team. |
| • | A personal bank treats its customers as valued individuals, providing a professional, personal service they can trust. It supports colleagues to develop their skills and achieve their ambitions. |
| • | A fair bank treats people as they like to be treated – and it earns investors an adequate and sustainable return, while contributing its share to help communities. |
We have reinforced our capital and risk management. Our €7.5 billion capital increase in January 2015 was done for two reasons. First, we wanted to be able to accelerate organic growth, with the new capital allowing us prudently to seek to gain market share now that most of our core markets are forecast to grow once again. Second, we wanted to be able to have in place a sustainable dividend policy and aim to increase the cash component of the pay-out to between 30 to 40% of recurrent earnings.
Looking ahead, we aim to have one of the best overall capital ratios while focusing on organic growth in Europe and the Americas, strategic capital allocation and the application of stricter criteria to any acquisitions we consider. We are working on a Group Wide Risk Management Program to enhance our holistic and timely control of all types of risks. Our goal is to achieve a predictable risk profile, with NPLs below 5%. The most important aspect of risk management, however, is strong corporate governance, and our board of directors is and will continue to be fully involved in the Group’s risk oversight and management.
Outlook
The forward-looking statements included below and in the following section are based on the current beliefs and expectations of our management and are subject to significant risks and uncertainties. These risks and uncertainties could cause the Group’s actual results to differ materially from those set forth in such forward-looking statements. See the sections entitled “Forward-Looking Statements” and “Risk Factors” of this annual report.
The economic outlook for 2015 is better than in recent years. In particular, we expect the European recovery to continue and emerging countries to experience increased growth. Banks, however, will continue to operate in a very complex environment of low interest rates and economic growth below pre-2008 levels. Many of the regulations introduced as a result of the international financial crisis will continue to have a structural impact on banks’ profitability. This is particularly the case with the higher capital requirements, short- and long-term liquidity and leverage ratios, higher cost of deposits as a result of bank resolution mechanisms and the cost of compliance with these and other new regulations.
United Kingdom
The business dynamics, combined with our balance sheet strength, represent a strong foundation for growth in 2015, during which we will seek to maintain key strategic lines in the United Kingdom: increase the number of loyal customers, demand deposit accounts and increased lending to companies. We will also continue to invest in digital technology and seek to further improve the efficiency ratio.
164
Table of Contents
Spain
In 2015, with a macroeconomic environment that is expected to further improve, we expect that profit and profitability will continue to normalize. We will focus more on the commercial business, quality of service and customer loyalty. We also aim to increase our lending market share and continue efforts to improve the cost of credit and operational excellence that in turn will positively affect results.
Santander Consumer Finance
In 2015, we expect that the entry into force of the agreement with Banque PSA Finance and of the business acquired from GE Nordics will consolidate our leadership in auto finance in various European countries, enabling us to enter markets such as France and Switzerland where we have not operated previously. In addition, we will focus on integrating new operations while fostering the growth of the rest of our units and maintaining spreads tailored to each market.
United States
Our two main objectives in 2015 are to continue to improve the commercial franchise in order to be in a position to gain market share in a growing economy and to strengthen governance and control structures by investing more in technology, risk and regulatory compliance, enabling us to efficiently meet regulatory requirements.
Portugal
We expect we will continue to normalize profit in 2015 and we believe we have the opportunity to gain market share in the next few years, growing in customers and revenues as we seek to improve our cost structure and lower our provisions.
Brazil
We are seeking to implement measures to increase the number of loyal customers, increase market share, while continuing to improve efficiency. In addition, the acquisition of minority interests and investments in GetNet and Bonsuceso reaffirms our confidence in the country’s medium and long term potential, and we believe will have a positive direct impact on results.
Mexico
In 2015, we expect to continue making investments in the multi-channel business and to open branches while pursuing our efficiency plan. The objective is to grow at a rate greater than the market, particularly with high income clients, SMEs and other companies. We are well-positioned to take advantage of the economic recovery and want to be one of the leading banks in financing the government’s infrastructure plan.
Chile
We believe the more expansive tone of monetary and fiscal policy in 2015 anticipates an increase in activity. The Bank’s strategy will continue to focus on improving the customer experience, transforming commercial and retail banking and deepening the relationship model with SMEs and large corporations.
Poland
We are well-positioned in 2015 with the integration of BZ WBK and Kredyt Bank complete. We draw strength from our leadership in credit cards, mobile banking and electronic banking, from our capacity to offer innovative solutions to individual customers and companies, and the development of the Next Generation Bank strategic program, whose main objective is to make BZ WBK the Bank of first choice.
Argentina
In 2015, we will continue to develop a strategy focused on improving our commercial position in order to fully exploit the most profitable businesses or segments, with greater emphasis on high income individuals, SMEs and transaction-specific products.
165
Table of Contents
E. Off-balance sheet arrangements
As of December 31, 2014, 2013 and 2012, we had outstanding the following contingent liabilities and commitments:
| 2014 | 2013 | 2012 | ||||||||||
| (in millions of euros) | ||||||||||||
| Contingent liabilities: |
||||||||||||
| Financial guarantees and other sureties |
13,383 | 13,479 | 14,437 | |||||||||
| Irrevocable documentary credits |
2,381 | 2,430 | 2,866 | |||||||||
| Other guarantees |
28,006 | 24,690 | 27,285 | |||||||||
| Other contingent liabilities |
308 | 450 | 445 | |||||||||
|
|
|
|
|
|
|
|||||||
| 44,078 | 41,049 | 45,033 | ||||||||||
|
|
|
|
|
|
|
|||||||
| Commitments: |
||||||||||||
| Balances drawable by third parties |
182,955 | 154,314 | 187,664 | |||||||||
| Other commitments |
25,085 | 18,483 | 28,378 | |||||||||
|
|
|
|
|
|
|
|||||||
| 208,040 | 172,797 | 216,042 | ||||||||||
|
|
|
|
|
|
|
|||||||
| Total: |
252,118 | 213,846 | 261,075 | |||||||||
|
|
|
|
|
|
|
|||||||
For more information see note 35 to our consolidated financial statements.
In addition to the contingent liabilities and commitments described above, the following table provides information regarding off-balance sheet funds managed by us and jointly controlled companies as of December 31, 2014, 2013 and 2012:
| 2014 | 2013 | 2012 | ||||||||||
| (in millions of euros) | ||||||||||||
| Off-balance sheet funds: |
||||||||||||
| Mutual funds |
109,519 | 93,304 | 89,176 | |||||||||
| Pension funds |
11,481 | 10,879 | 10,076 | |||||||||
| Other managed funds |
20,369 | 20,987 | 18,889 | |||||||||
|
|
|
|
|
|
|
|||||||
| 141,369 | 125,170 | 118,141 | ||||||||||
Relationship with unconsolidated companies
We have holdings in companies over which we are in a position to exercise significant influence, but that we do not control or jointly control. According to IFRS-IASB, these investments in associated companies are accounted for using the equity method (see further details of these companies in Exhibit II to our consolidated financial statements).
Transactions with these companies are made under market conditions and are closely monitored by our regulatory authorities. See note 53 to our consolidated financial statements for further information.
Also, in our securitization activity we use structured entities (fondos de titulización) that are consolidated in the Group’s financial statements. According to IFRS, only those entities that meet certain requirements can be consolidated. We are not required to repurchase assets from or contribute additional assets to any of these structured entities. We do, however, provide in the ordinary course of business certain loans (amounting to €627.5 million as of December 31, 2014) to some of these structured entities, which are provided for in accordance with the risks involved. These loans are made on terms equivalent to those which prevail in arms’ length transactions. In 2014, the Group sold securitized bonds and structured medium and long-term operations with customers whose collateral is securitized bonds or mortgage bonds amounting to close to €13 billion.
We do not have any further transactions with unconsolidated entities other than those mentioned above.
We have no other off-balance sheet arrangements that have, or are reasonably likely to have, a current or future material effect on our financial condition, revenues or expenses, results of operations, liquidity, capital expenditures or capital resources.
166
Table of Contents
F. Tabular disclosure of contractual obligations
The following table summarizes our contractual obligations by remaining maturity at December 31, 2014:
Contractual obligations
| Less than 1 year |
More than 1 year but less than 3 years |
More than 3 years but less than 5 years |
More than 5 years |
Total | ||||||||||||||||
| (in millions of euros) | ||||||||||||||||||||
| Deposits from central banks and from credit institutions |
83,374 | 18,546 | 14,289 | 6,228 | 122,437 | |||||||||||||||
| Customer deposits |
521,438 | 56,359 | 8,629 | 22,530 | 608,956 | |||||||||||||||
| Marketable debt securities |
69,616 | 49,978 | 22,457 | 51,008 | 193,059 | |||||||||||||||
| Subordinated debt |
262 | 3,699 | 5,458 | 7,713 | 17,132 | |||||||||||||||
| Liabilities under insurance contracts (1) |
576 | 43 | 29 | 65 | 713 | |||||||||||||||
| Operating lease obligations |
325 | 598 | 513 | 1,852 | 3,288 | |||||||||||||||
| Capital lease obligations |
124 | 61 | 39 | 105 | 329 | |||||||||||||||
| Purchase obligations |
3 | 3 | 2 | 1 | 9 | |||||||||||||||
| Other long-term liabilities (2) |
1,952 | 3,687 | 3,464 | 8,535 | 17,638 | |||||||||||||||
| Contractual interest payments (3) |
8,937 | 7,973 | 6,258 | 30,457 | 53,625 | |||||||||||||||
|
|
|
|
|
|
|
|
|
|
|
|||||||||||
| Total |
686,607 | 140,947 | 61,138 | 128,494 | 1,017,186 | |||||||||||||||
| (1) | Includes life insurance contracts in which the investment risk is borne by the policy holder and insurance savings contracts. |
| (2) | Other long-term liabilities relate to pensions and similar obligations and include the estimated benefit payable for the next ten years. |
| (3) | Calculated for all Deposits from credit institutions, Customer deposits, Marketable debt securities and Subordinated debt assuming a constant interest rate based on data as of December 31, 2014 over time for all maturities, and those obligations with maturities of more than five years have an average life of ten years. |
The table above excludes the “fixed payments” of our derivatives since derivative contracts executed by the Group apply close-out netting across all outstanding transactions, that is, these agreements provide for settlements to be made on a maturity or settlement date for the differences that arise, and as such, the obligation to be settled in the future is not fixed at the present date and is not determined by the fixed payments.
For a description of our trading and hedging derivatives, which are not reflected in the above table, see note 36 to our consolidated financial statements.
For more information on our marketable debt securities and subordinated debt, see notes 22 and 23 to our consolidated financial statements.
Higher-Risk Loans
Grupo Santander does not have any significant exposure to higher-risk loans. Our credit profile is focused on retail banking with a medium-low risk profile and with broad diversification both by geography and segment, and 61% of the Group’s total loan portfolio is secured (in most cases, by real estate).
Mortgages to individuals represent approximately 38% of the Group’s total lending. These mortgages are focused on our core markets, Spain and the U.K., and are mainly residential mortgages with a low risk profile, low non-performing ratios and an appropriate coverage ratio. This low risk profile produces low related losses.
In Spain, at December 31, 2014, the loan portfolio and thus its risk profile mainly comprises primary residence loans with an affordability rate close to 29% (under management criteria described below). Residential mortgages represent around 29% of the total credit risk portfolio in Spain, of which 73% has a LTV at inception of under 80% (further details regarding the ranges of LTV are reported in note 54 to our consolidated financial statements).
All customers applying for a prime residential mortgage are subject to a rigorous assessment of credit risk and affordability. In evaluating the payment capacity (affordability) of a potential customer, the credit analyst must determine if the income of the customer is sufficient to meet the payment of the loan installments taking into consideration other income that the customer may receive. In addition, the analyst must decide if the customer’s income will be stable over the term of the loan.
167
Table of Contents
The U.K.’s mortgage portfolio is focused on primary residence mortgages with high risk quality in terms of LTV (47,3% as of December 31, 2014). Certain portfolios that may present higher risks than others (interest only, flexible loans, loans with LTV greater than 100%, buy to let), are subject to strict lending policies to mitigate risks. Furthermore, their performance is continuously monitored to ensure an adequate control.
The Group’s strategy in the last few years has been to reduce the volume of real estate exposure in Spain which at the end of 2014 stood at €8,114 million in net terms (around 3% of loans in Spain and less than 1% of the Group’s loans).
Changes in Practices
There have not been any significant changes in policies and practices in response to the effects of the current economic environment that might affect the quality of the credit information presented. This is due to the fact that the following policies and practices already formed part of our normal course of business:
a) Medium-low risk profile of the portfolio
Our risk profile is characterized by the prevalence of primary residence loans and a low effort rate of loan approval, which leads to a medium-low risk profile for the mortgage portfolio. This is due to the establishment of risk management frameworks and policies that reflect our risk management principles.
In addition to the tasks performed by the internal audit division, the risk unit has a specific risk monitoring function for adequate credit quality control with local and global teams.
b) Suspended accrual interest of non-performing past-due assets
Balances are deemed to be impaired, and the interest accrual suspended, when there are reasonable doubts as to their full recovery and/or the collection of the related interest for the amounts and on the dates initially agreed upon, after taking into account the guarantees received to secure (fully or partially) collection of the related balances. For all non-performing past due assets, any collections relating to non-performing loans and advances are used to recognize the accrued interest and the remainder, if any, is applied to reduce the principal amount outstanding.
When the recovery of any recognized amount is considered unlikely, the amount is charged-off, without prejudice to any actions that we may initiate to seek collection.
c) Allowances for credit losses and internal model
As of July 2008, the Bank of Spain had approved for regulatory capital calculation purposes the Group’s internal models affecting the vast majority of the Group’s credit risk net exposure. The Bank of Spain will continue to review the models for the purpose of calculating allowances for loan losses. The calculation obtained based on the output parameters of internal models is consistent with the best estimate of the Group as to the probable losses using possible scenarios which rely on the approved internally developed models, and which constitute an appropriate basis for determining loan loss allowances. While these models are not yet approved by the Bank of Spain for loan loss allowance calculation, we are required to calculate the allowances according to the instructions described in Item 4 in our annual report on Form 20-F for the year ended December 31, 2014, and are subject to continuing review by Bank of Spain, and subsequent continuous improvement of the processes within our internal model. The difference between loan loss provisions calculated using internal models and those calculated under Bank of Spain guidance, was not material for each one of the three years ended December 31, 2014, 2013 and 2012.
Other
We use credit derivatives to cover loans and trading transactions. The volume of this activity is small compared to that of our peers and is subject to strict internal controls that minimize operational risk. Risk in these activities is controlled via a series of limits such as VaR, nominal by rating, sensitivity to the spread by rating and name, and sensitivity to the rate of recovery and to correlation. Jump-to-default limits are also set by geographic area, sector and liquidity.
Exposures related to complex structured assets
We have a very limited exposure to complex structured assets. See “Item 11. Quantitative and Qualitative Analysis About Market Risk—Part 5. Market Risk”.
168
Table of Contents
Item 6. Directors, senior management and employees
A. Directors and senior management
We are managed by our board of directors, which currently consists of 15 members. In accordance with our Bylaws (Estatutos), the board shall consist of at least 14 and not more than 22 members. Each member of the board is elected to a three-year term by our shareholders at a general meeting. One-third of the members are re-elected each year.
Our board of directors holds its meetings in accordance with an annual calendar. The Rules and Regulations of the Board5 provide that the board shall hold not less than nine annual ordinary meetings; in 2014, it met 16 times. Our board of directors elects our chairman, vice chairmen and chief executive officer from among its members. Between board meetings, lending and other board powers reside with the executive committee (comisión ejecutiva) and with the executive risk committee (comisión delegada de riesgos) of our board of directors.
The chairman of the board is the executive chairman and the highest-ranking officer of the Bank (article 48.1 of the Bylaws and article 8.1 of the Rules and Regulations of the Board) and accordingly, all the powers that may be delegated under the Law, our Bylaws and the Rules and Regulations of the Board have been delegated to him.
However, it is the chief executive officer, in accordance with article 10.1 of the Rules and Regulations of the Board, in his capacity as such, who is entrusted with the day-to-day management of the different business areas and the highest executive functions.
There is a clear separation of duties between the executive chairman, the chief executive officer, the board and the committees thereof, as well as various checks and balances that assure proper equilibrium in the corporate governance structure of the Bank.
Members of our senior management are appointed and removed by the board.
| 5 | The Rules and Regulations of the Board of Directors are available on the Group’s website, which does not form part of this annual report on Form 20-F, at www.santander.com under the heading “Information for shareholders and investors—Corporate governance—Rules and Regulations of the Board of Directors”. |
169
Table of Contents
The current members of our board of directors are:
| Name |
Position with Banco Santander |
Director since | ||
| Ana Botín (1) |
Chairman | 1989 | ||
| José Antonio Álvarez |
Chief executive officer | 2015 | ||
| Bruce Carnegie-Brown |
Vice chairman | 2015 | ||
| Rodrigo Echenique |
Vice chairman | 1988 | ||
| Matías R. Inciarte (2) |
Vice chairman | 1988 | ||
| Guillermo de la Dehesa |
Vice chairman | 2002 | ||
| Sheila C. Bair |
Director | 2014 | ||
| Javier Botín (1) |
Director | 2004 | ||
| Sol Daurella |
Director | 2015 | ||
| Carlos Fernández |
Director | 2015 | ||
| Esther Giménez-Salinas |
Director | 2012 | ||
| Ángel Jado |
Director | 2010 | ||
| Juan R. Inciarte (2) |
Director | 2008 | ||
| Isabel Tocino |
Director | 2007 | ||
| Juan Miguel Villar-Mir |
Director | 2013 | ||
| (1) | Ana Botín and Javier Botín are siblings. |
| (2) | Matías R. Inciarte and Juan R. Inciarte are brothers. |
170
Table of Contents
Our current executive officers are:
| Name |
Position with Banco Santander | |
| Ana Botín |
Chairman of the board of directors and of the executive committee | |
| José Antonio Álvarez |
Director and chief executive officer | |
| Rodrigo Echenique |
Executive vice chairman | |
| Matías R. Inciarte |
Executive vice chairman and chairman of the executive risk committee | |
| Juan R. Inciarte |
Executive director and executive vice president, Asia | |
| Rami Aboukhair |
Executive vice president, commercial banking Spain | |
| Ignacio Benjumea |
Executive vice president, general secretary and secretary of the board | |
| Juan Manuel Cendoya |
Executive vice president, communications, corporate marketing and research | |
| Jesús Cepeda |
Executive vice president, human resources, organization and costs | |
| José Luis de Mora |
Executive vice president, Group financial planning and corporate development | |
| José Doncel |
Executive vice president, financial accounting and control | |
| José María Fuster |
Executive vice president, innovation | |
| Enrique G. Candelas |
Executive vice president, Spain | |
| José G. Cantera |
Executive vice president, financial management and investor relations and chief financial officer | |
| Juan Guitard |
Executive vice president, internal audit | |
| Remigio Iglesias |
Executive vice president, risk | |
| Mónica López-Monís |
Executive vice president, chief compliance officer | |
| Javier Maldonado |
Executive vice president, risk | |
| Víctor Matarranz |
Executive vice president, chairman’s office and strategy | |
| Luis Moreno |
Executive vice president, commercial banking | |
| José Mª Nus |
Executive vice president, risk and chief risk officer | |
| César Ortega |
Executive vice president, general secretariat | |
| Andreu Plaza |
Executive vice president, technology and operations | |
| Jacques Ripoll |
Executive vice president, global wholesale banking | |
| Ángel Rivera |
Executive vice president, commercial banking | |
| Magda Salarich |
Executive vice president, consumer finance | |
| Javier San Félix |
Executive vice president, commercial banking | |
| José Antonio Villasante |
Executive vice president, universities | |
| Juan A. Yanes |
Executive vice president, strategic alliances in asset management and insurance | |
| Jesús Mª Zabalza |
Executive vice president, Brazil | |
In addition, Scott Powell is the Group’s country head for Santander in the United States.
171
Table of Contents
The following is a summary of the relevant business experience and principal business activities of our current directors and executive officers:
Ana Botín (chairman of the board of directors and of the executive committee, the innovation and technology committee and the international committee)
Born in 1960. Ms. Botín was appointed director in 1989 and chairman of the board in 2014. She joined the Bank after a period at JP Morgan (1981-1988). She has been executive vice president of Banco Santander, S.A. since 1992 and was executive chairman of Banesto from 2002 to 2010 and chief executive officer of Santander UK plc. from 2010 to 2014. Other significant positions: she is a non-executive director of The Coca-Cola Company. She is also Business Ambassador of the United Kingdom.
José Antonio Álvarez (chief executive officer)
Born in 1960. Appointed director and chief executive officer in 2014. Mr. Álvarez earned an M.A. in Economics and Business Administration and an MBA at The University of Chicago. He joined the Bank in 2002 and was appointed executive vice president of the financial management and investor relations division in 2004 (chief financial officer). Other significant positions: he is a member of the board of Banco Santander (Brasil), S.A. and SAM Investments Holdings Limited. Has also served as a director of Santander Consumer Finance, S.A. and as a member of the supervisory boards of Santander Consumer AG, Santander Consumer Holding GMBH, Santander Holdings USA, Inc. and Bank Zachodni WBK, as well as a director of Bolsas y Mercados Españoles (BME).
Rodrigo Echenique (vice chairman of the board of directors)
Born in 1946. Mr. Echenique joined the board in 1988. He earned a degree as a Law and Government Attorney. Mr. Echenique is a former chief executive officer of Banco Santander, S.A. (1988- 1994). He is also currently non-executive director of Inditex, S.A and NH Hotels Group, S.A. Has served on the board of directors of several industrial and financial companies. He was also a member and subsequently chairman of the advisory board of Accenture, S.A. He has been non-executive chairman of Vocento, S.A. and Vallehermoso, S.A.
Matías R. Inciarte (vice chairman of the board of directors and chairman of the executive risk committee)
Born in 1948. Joined the board in 1988. Graduate in Economics and Government Economist. He also carried out Business Administration studies at the MIT. Other significant positions: minister of the Presidency between 1981 and 1982, as well as technical general secretary of the Ministry of Finance, general secretary of the Ministry for European Community Relations and deputy secretary of state to the President. He is currently chairman of the Fundación Princesa de Asturias and of the social council of the Universidad Carlos III de Madrid, as well as an external director of Sanitas, S.A. de Seguros and of Financiera Ponferrada, S.A., SICAV.
Bruce Carnegie-Brown (vice chairman of the board of directors, lead director, chairman of the appointments committee, the remuneration committee and the risk supervision, regulation and compliance committee)
Born in 1959. Appointed director in 2014. Mr. Brown holds an M. A. degree in English Language and Literature. Other significant positions: He is currently non-executive chairman of Moneysupermarket.com Group Plc and Aon UK Ltd and a non-executive director of Santander UK Plc. He was previously founder and managing partner of the quoted private equity division of 3i Group plc, president and CEO of Marsh Europe and has held various positions at JP Morgan Chase and Bank of America. He was also lead independent director at Close Brothers Group plc (2008-2014) and Catlin Group Ltd (2010-2014).
Guillermo de la Dehesa (vice chairman of the board of directors)
Born in 1941. Mr. de la Dehesa joined the board in 2002. Government Economist and head of office of Banco de España (on leave of absence). Main activity: international advisor to Goldman Sachs International. Other significant positions: former state secretary of Economy, secretary general for Trade, chief executive officer of Banco Pastor, S.A. He is presently the non-executive vice-chairman of Amadeus IT Holding, S.A., chairman of the Centre for Economic Policy Research (CEPR) based in London, a member of the Group of Thirty based in Washington, chairman of the board of trustees of IE Business School and non-executive chairman of Aviva Grupo Corporativo, S.L. and of Aviva Vida y Pensiones, S.A. de Seguros y Reaseguros.
Sheila C. Bair
Born in 1954. Ms. Bair joined the board in 2014 and holds a JD from the University of Kansas School of Law and a BA from the University of Kansas. Main activity: Senior advisor to and chair of the Systemic Risk Council at The Pew Charitable Trusts and columnist for Fortune magazine. Other significant positions: Ms. Bair was chairman of
172
Table of Contents
the Federal Deposit Insurance Corporation (2006-2011), professor of Financial Regulatory Policy for the Isenberg School of Management at the University of Massachusetts-Amherst (2002-2006) and Assistant Secretary for Financial Institutions at the U.S. Department of the Treasury (2001-2002). She is also a non-executive director of Thomson Reuters Corporation and Host Hotels & Resorts Inc. In addition, she is a founding board member of The Volcker Alliance.
Javier Botín
Born in 1973. Mr. Botín joined the board in 2004. Graduate in Law. Main activity: chairman and chief executive officer of JB Capital Markets, Sociedad de Valores, S.A. In addition to his professional activity in the financial sector, he works with several non-profit organizations and has served as the Chairman of the Botín Foundation since 2014 and trustee of the Princess of Gerona Foundation and of the Prehistoric Research Institute of Cantabria.
Sol Daurella
Born in 1966. Appointed director in 2014. Graduate in Business and MBA in Business Administration. Main activity: Executive chairwoman of Coca- Cola Iberian Partners, S.A. Other significant positions: She is currently a non-executive director of Acciona, S.A. Has served as a member of the governing board of the Círculo de Economía and an independent external director of Banco Sabadell, S.A. She is also Honorary Consul-General for Iceland in Catalonia.
Carlos Fernández
Born in 1966. Appointed director in 2014. An Industrial Engineer, he has undertaken graduate studies in business administration at the Instituto Panamericano de Alta Dirección de Empresas. Main activity: He is the chairman of the board of directors and vice president of Finaccess, S.A.P.I. Other significant positions: He is currently a member of the board of Grupo Financiero Santander, S.A.B. de C.V. and of Grupo Modelo.
Esther Giménez-Salinas
Born in 1949. Ms. Giménez joined the board in 2012. Doctor of Laws. Main activity: full professor of Criminal Law at ESADE-URL Law School. Other significant positions: she has been a rector of the Ramon Llull University, a member of the Spanish Supreme Judicial Council, a member of the Standing Committee of the Conference of Rectors of Spanish Universities and an executive vice president of the Centre for Legal Studies of the Department of Justice of the Generalitat de Catalunya.
Ángel Jado
Born in 1945. Mr. Jado joined the board in 2010. Graduate in Law and in Business Administration. Other significant positions: he was director of Banco Santander from 1972 to 1999 and director of Banco Banif, S.A. from 2001 to 2013. Currently, he holds various positions in investment trusts.
Juan R. Inciarte
Born in 1952. Mr. Inciarte joined the board in 2008. Graduate in Economics. Other significant positions: he is director of Santander UK plc, Santander Consumer Finance, S.A. and SAM Investment Holdings Limited. Was formerly a member of the board of directors of The Royal Bank of Scotland and NatWest Bank, director and member of the executive committee of Instituto Bancario San Paolo di Torino and director of First Union (now Wells Fargo & Company). Has likewise served on the board of NIBC Bank NV, Sovereign Bancorp (now Santander Bank N.A.), CEPSA and ABN AMRO, among others.
Isabel Tocino
Born in 1949. Ms. Tocino joined the board in 2007. Doctor in Law. She has undertaken graduate studies in business administration at IESE and the Harvard Business School. Main activity: full professor at Universidad Complutense de Madrid. Other significant positions: she has formerly been Spanish Minister for the Environment, chairwoman of the European Affairs Committee and of the Foreign Affairs Committee of the Spanish Congress and chairwoman for Spain and Portugal and vice-chairwoman for Europe of Siebel Systems. She is currently an elected member of the Spanish State Council, a member of the Royal Academy of Doctors and a non-executive director of ENCE Energía y Celulosa, S.A., Enagas, S.A. and Naturhouse Health, S.A.
173
Table of Contents
Juan Miguel Villar-Mir (chairman of the audit committee).
Born in 1931. Mr. Villar-Mir joined the board in 2013. Bearing in mind his knowledge and experience in financial, accounting and audit matters, the board has appointed Mr. Villar-Mir as a member of the audit committee. Since the 2015 general shareholders’ meeting, he serves as chairman and audit committee financial expert replacing Mr. Guillermo de la Dehesa Romero. Doctorate in Civil Engineering, graduate in Law and degree in Industrial Organization. Main activity: he is the chairman of Obrascón Huarte Lain, S.A., the chairman and chief executive officer of Grupo Villar-Mir, S.A.U., and vice-chairman of Inmobiliaria Colonial, S.A. Other significant positions: he was minister of Finance and government vice-chairman for Economic Affairs between 1975 and 1976, and has been chairman of Electra de Viesgo, Altos Hornos de Vizcaya, Hidro Nitro Española, Empresa Nacional de Celulosa, Empresa Nacional Carbonĺfera del Sur, Cementos del Cinca y Cementos Portland Aragón and Puerto Sotogrande. He is also Professor of accounting and legislation at the University of Technical Engineering and Public Works in the Madrid Polytechnical University and a member of the Royal Academy of Engineering.
Jose Rami Aboukhair
Born in 1967. Mr. Aboukhair joined the Group in 2008 as Director of Santander Insurance. Since then, he has been Managing Director and Head of Marketing and Products, as well as Managing Director of Retail Products. In 2015 he has been appointed executive vice president of Banco Santander, S.A., responsible for Retail Banking Spain (Santander Bank Network).
Ignacio Benjumea
Born in 1952. Mr. Benjumea joined Banco Santander in 1987. In 1994 he was appointed executive vice president and general secretary and secretary of the board of Banco Santander. Graduate in Law at the Deusto University, ICADE-E3, and Government Attorney. Other important positions: vice chairman of the Fundación de Estudios Financieros. He was Technical General Secretary of the Ministry of Labor and Social Security, general secretary of Banco de Crédito Industrial, general secretary and director and executive vice president of Banco Santander de Negocios and director of Dragados, S.A., Bolsas y Mercados Españoles (BME) and of the Governing Body of the Madrid Stock Exchange.
Juan Manuel Cendoya
Born in 1967. Former manager of the Legal and Tax Department of Bankinter, S.A. from 1999 to 2001. He joined the Bank in July 2001 as executive vice president, communications, corporate marketing and research.
Jesús Cepeda
Born in 1961. Mr. Cepeda joined the Bank in 1990, having held positions as head of the management control area and deputy head of the financial accounting and control division prior to being appointed executive vice president and head of the human resources, organization and costs division in 2013.
José Luis de Mora
Born in 1966. Mr. de Mora joined the Group in 2003. Since 2003, he has been in charge of developing the organic strategic planning and the group acquisitions/expansion. In 2015 he was appointed executive vice president of Banco Santander, S.A. and head of group financial planning and corporate development.
José Doncel
Born in 1961. Mr. Doncel worked for Arthur Andersen and Banco Santander before joining Banesto in 1994, where he served as head of accounting and financial management. In 2013, he joined Banco Santander, where he was appointed executive vice president and head of the internal audit division. In 2014, he was appointed head of the financial accounting and control division.
174
Table of Contents
José María Fuster
Born in 1958. Mr. Fuster joined the Group in 1988. In 2004, he was appointed chief information officer of Grupo Santander. In the same year, he was also named member of the board of Abbey National plc (now, Santander UK plc) and the board of Advisors of IBM Corporation. In 2007, he was appointed executive vice president of technology and operations at Banco Santander. Presently, José María Fuster is the corporate head of innovation.
Enrique G. Candelas
Born in 1953. Mr. Candelas joined Banco Santander in 1975 and was appointed senior vice president in 1993. He was appointed executive vice president, Retail Banking Spain (Santander Branch Network) in 1999 and head of Santander Spain in 2013.
José G. Cantera
Born in 1966. Mr. Cantera joined the Group in 2003. In 2006, he was appointed Banesto’s chief executive officer. Formerly, he was member of the executive committee of Citigroup EMEA and member of the board of directors of Citigroup Capital Markets Int. Ltd. and Citigroup Capital Markets UK. A former non-executive director of Banesto, in 2012 he was appointed executive vice president of global wholesale banking. Currently, he is head of the financial management and investor relations division.
Juan Guitard
Born in 1960. Former general secretary of the board of Banco Santander de Negocios (from 1994 to 1999) and manager of the investment banking department of the Bank (from 1999 to 2000). He rejoined the Bank in 2002, being appointed executive vice president, vice-secretary general of the board. In November 2014, he was appointed head of the internal audit division, a position he held between 2009 and 2013. In 2013, he was responsible for the risk division. Currently he serves as head of the internal audit division.
Remigio Iglesias
Born in 1954. Mr. Iglesias joined the Group in 1990, having held several positions in commercial banking. He was appointed executive vice president in 2013 and head of the asset recoveries and restructuring area.
Mónica López-Monís
Born in 1969. Ms. López joined the Group in 2009, having held several positions as general secretary of Banesto and vice secretary of Banco Santander, S.A. She was appointed general secretary of Bankinter in 2014. In 2015 she was appointed executive vice-president of Banco Santander, S.A. and chief compliance officer.
Javier Maldonado
Born in 1962. Mr. Maldonado joined the Group in 2004, having held several positions in Santander UK. He was appointed executive vice president of Banco Santander S.A. and head of control and coordination of regulatory projects in 2014.
Víctor Matarranz
Born in 1976. Mr. Matarranz joined Santander UK in 2010 as director of strategy. In 2014, he was appointed executive vice president of Banco Santander S.A and head of office of the Chairman. Presently, he is executive vice president of chairman’s office and strategy.
Luis Moreno
Born in 1964. Mr. Moreno joined the Bank in 1989, having held positions as head of products, marketing and electronic banking and head of the marketing and business development area of private banking, asset management and insurance division prior to being appointed executive vice president in 2013.
José Mª Nus
Born in 1950. Mr. Nus joined Santander UK in 2010 as executive director and chief risk officer. In 2010, he was appointed executive vice president of Banco Santander S.A. and in October 2014 senior executive vice president of risks. He has also been executive vice president, risk in Argentaria and Bankinter and member of the board of directors in Banesto, Banco de Vitoria, Banco de Negocios Argentaria, Banco de Crédito Local and Banco de Alicante. He is currently a member of the board of Societat Catalana d’Economia.
175
Table of Contents
César Ortega
Born in 1954. Mr. Ortega joined the Bank in 2000 and was appointed executive vice president, general secretariat in 2006.
Andreu Plaza
Born in 1960. Mr. Plaza joined Santander UK in 2012 as IT&OP director (retail banking). In 2015, he was appointed executive vice president of Banco Santander S.A. and head of technology and operations, corporate division. He has also been head of Organization and IT & Operations in Catalunya Banc and Caixa Catalunya, and member of the board of directors in Servired and Información y Tecnología de Catalunya.
Jacques Ripoll
Born in 1966. Mr. Ripoll joined Santander UK in 2013 as head Global Banking and Markets. He was appointed executive vice president of Banco Santander S.A. and head of Global Banking and Markets in 2015.
Ángel Rivera
Born in 1966. Mr. Rivera joined the Bank in 2013 as executive vice president responsible for companies and institutions within the commercial banking division. Previously, he developed his professional career over 23 years with the Banco Popular Group.
Magda Salarich
Born in 1956. Ms. Salarich joined the Bank in 2008 as executive vice president responsible for the consumer finance division. Previously, she held several positions in the automobile industry, including the position of director and executive vice president of Citroën España and head of commerce and marketing for Europe of Citroën Automobiles.
Javier San Félix
Born in 1967. Mr. San Félix joined the Group in 2004 as head of strategic planning in the consumer finance division. In 2005 he was appointed director and executive vice president of Santander Consumer Finance in Spain and in 2006 he was appointed chief operating officer of the consumer finance division. A former chief executive officer of Banesto, he was appointed executive vice president of Banco Santander, S.A. and head of the commercial banking division in 2013.
José Antonio Villasante
Born in 1946. Mr. Villasante’s entire professional career has been with Banco Santander, S.A., which he joined in 1964. He was appointed senior vice president in 1994 and deputy executive vice president in 2006. He is currently executive vice president, head of Santander Universities.
Juan A. Yanes
Born in 1962. Mr. Yanes joined Grupo Santander in 1991 and worked in investment banking, corporate finance, and financial markets until 1999. In 1999, he was appointed as global head of market risk in U.S. and in 2010 executive vice president of the Bank.
From 2009 to 2013, Juan A. Yanes was the chief corporate officer responsible for the consolidated supervision of all Banco Santander, S.A. activities in the U.S. and was also responsible for compliance and internal control. In 2013 he was appointed chief risk officer in charge of all Santander operations in the U.S. and in 2014 head of global markets. Presently, he is the officer responsible for managing strategic alliances in asset management and insurance reporting to the CEO.
Before joining the Group he worked for Citibank in the capital markets area in Venezuela.
Jesús Mª Zabalza
Born in 1958. Mr. Zabalza is the former executive vice president of La Caixa (from 1996 to 2002). He joined the Bank in 2002, being appointed executive vice president, America. He is currently chief executive officer of Banco Santander Brasil.
176
Table of Contents
* * * * * *
In addition, following is a summary of the relevant business experience of Scott Powell (US country head from 2015 and chief executive officer of Santander Holdings USA).
Mr. Powell has extensive experience in retail banking, risk management and consumer and auto lending. He has held a variety of roles at J.P. Morgan Chase & Co., including Head of Banking and Consumer Lending Operations, CEO of Consumer Banking and Retail Investments, Head of Consumer Lending, as well as Chief Risk Officer, Consumer. He also spent 14 years at Citi in a variety of risk management roles. Most recently, Mr. Powell was Executive Chairman of National Flood Services Inc.
* * * * * *
For a description of arrangements or understandings with major shareholders, customers, suppliers or others pursuant to which any person referred to above was appointed, see “Item 7. Major Shareholders and Related Party Transactions—A. Major Shareholders—Shareholders’ agreements” herein.
177
Table of Contents
Directors’ compensation
i. Fees Stipulated in the Bylaws
The annual general meeting held on March 22, 2013 approved an amendment to the Bylaws, whereby the remuneration of directors in their capacity as board members became an annual fixed amount determined by the shareholders at the annual general meeting. This amount shall remain in effect unless the shareholders resolve to change it at a general meeting. However, the board of directors may elect to reduce the amount in any years in which it deems such action justified. The remuneration established for 2014 by the annual general meeting was €6 million, with two components: (a) an annual retainer and (b) attendance fees. The annual general meeting has set again the remuneration for 2015 in €6 million.
The specific amount payable for the above-mentioned items to each of the directors is determined by the board of directors. For such purpose, it takes into consideration the positions held by each director on the board, their attendance of board meetings, their membership of the various committees, their attendance of committee meetings and any other objective circumstances considered by the board.
The total Bylaw-stipulated fees earned by the directors in 2014 amounted to €4.4 million compared to €4.3 million in 2013.
Annual retainer
The amounts received individually by the directors in 2014 and 2013 based on the positions held by them on the board and their membership of the board committees were as follows:
| Euros | ||||||||
| 2014 | 2013 | |||||||
| Members of the board of directors |
84,954 | 84,954 | ||||||
| Members of the executive committee |
170,383 | 170,383 | ||||||
| Members of the audit committee |
39,551 | 39,551 | ||||||
| Members of the appointments committee (1) |
23,730 | 23,730 | ||||||
| Members of the remuneration committee (1) |
23,730 | 23,730 | ||||||
| Members of the risk supervision, regulation and compliance committee (2) |
20,697 | — | ||||||
| Chairman of the risk supervision, regulation and compliance committee (2) |
26,164 | — | ||||||
| Non-executive deputy chairmen (3) |
28,477 | 28,477 | ||||||
| (1) | In 2014, the former appointments and remuneration committee was divided into two, namely the appointments committee and the remuneration committee. The amount indicated relates to the entire year, the corresponding proportional part for each case having been paid. |
| (2) | Held its first meeting on July 23, 2014. |
| (3) | In 2013 the total amount of €28,477 was paid to Guillermo de la Dehesa and Manuel Soto pro rata in proportion to the time during which each held office in the year. |
Attendance fees
The directors receive fees for attending board and committee meetings, excluding executive committee meetings, since no attendance fees are received for attending this committee.
By resolution of the board of directors, at the proposal of the remuneration committee, the fees for attending board and committee meetings (excluding executive committee meetings) have remained unchanged since 2008.
178
Table of Contents
| Board meeting attendance fees |
Euros | |||
| 2008-2014 | ||||
| Board of directors |
||||
| Resident directors |
2,540 | |||
| Non-resident directors |
2,057 | |||
| Executive risk committee, audit committee and risk supervision, regulation and compliance committee |
||||
| Resident directors |
1,650 | |||
| Non-resident directors |
1,335 | |||
| Other committees (except the executive committee) |
||||
| Resident directors |
1,270 | |||
| Non-resident directors |
1,028 | |||
ii. Salaries
Fixed remuneration
The executive directors’ gross annual salary for 2014 and 2013 was as follows:
| Thousands of euros | ||||||||
| 2014 | 2013 | |||||||
| Ana Botín (1) |
||||||||
| Chief executive officer of Santander UK |
1,392 | 2,005 | ||||||
| Chair |
833 | — | ||||||
| Matías R. Inciarte |
1,710 | 1,710 | ||||||
| Juan R. Inciarte |
1,200 | 987 | ||||||
| Emilio Botín (2) |
930 | 1,344 | ||||||
| Javier Marín (3) |
||||||||
| Executive vice president |
— | 267 | ||||||
| Chief executive officer |
2,000 | 1,333 | ||||||
| Alfredo Sáenz (4) |
— | — | ||||||
|
|
|
|
|
|||||
| Total |
8,065 | 7,646 | ||||||
|
|
|
|
|
|||||
| (1) | As indicated in the annual remuneration report for 2013, which was approved, on a consultation basis, by the Bank’s annual general meeting on March 28, 2014, the gross annual salary that corresponded to her in 2014 for her duties as chief executive officer of Santander UK amounted to GBP 1,702 thousand (€2,005 thousand, considering the average exchange rate for 2013). Following her designation as chair of Banco Santander on September 10, 2014, this amount was revised to reflect her new responsibilities and was established at €2.5 million. |
The amounts in euros in the above table for 2014 include the portion relating to her duties as chief executive officer of Santander UK and the portion relating to her duties as chair of the Group.
| (2) | Ceased to be a member of the board due to his death on September 9, 2014. |
| (3) | The amount actually received in 2013 was €1.6 million, which is the sum of his remuneration as executive vice president of the Bank for the first four months of the year (€267 thousand) and his remuneration as chief executive officer for the remaining eight (€1.3 million). Ceased to be a member of the board on January 12, 2015. |
| (4) | Retired from the board on April 29, 2013. The gross salary received until that date is shown, together with his other remuneration, in section iii) below. |
179
Table of Contents
Variable remuneration
In 2013, the variable remuneration was implemented through a deferred conditional variable remuneration plan, or bonus, payable partly in cash and partly in shares and deferred over a three-year period. In 2014, our board of directors, at the proposal of the appointments and remuneration committee, included in this variable remuneration a multiannual component consisting of a new long-term incentive (performance share plan, “ILP”—see note 47 to our consolidated financial statements for terms and conditions) based on the performance of certain variables of the Bank over a certain period.
Bonus
The maximum variable remuneration (bonus) of the executive directors for 2014 and 2013 approved by the board at the proposal of the appointments and remuneration committee (in 2014, the remuneration committee) was as follows:
| Thousands of euros | ||||||||
| 2014 | 2013 | |||||||
| Ana Botín (1) |
||||||||
| Chief executive officer of Santander UK |
2,212 | 2,212 | ||||||
| Chair |
1,550 | — | ||||||
| Matías R. Inciarte |
2,868 | 2,308 | ||||||
| Juan R. Inciarte |
2,223 | 1,480 | ||||||
| Emilio Botín |
— | 1,412 | ||||||
| Javier Marín (2) |
||||||||
| Executive vice president |
— | 500 | ||||||
| Chief executive officer |
3,966 | 2,000 | ||||||
| Alfredo Sáenz |
— | — | ||||||
|
|
|
|
|
|||||
| Total |
12,819 | 9,912 | ||||||
|
|
|
|
|
|||||
| (1) | The amounts in euros in the above table for 2014 include the portion relating to her duties as chief executive officer of Santander UK and the portion relating to her duties as chair of the Group. |
| (2) | The amounts in euros in the above table for 2013 include the portion relating to his duties as executive vice president for the first four months of the year and the portion relating to his duties as chief executive officer of the Bank for the remaining eight months. |
The third and fourth cycles of the deferred conditional variable remuneration plan (bonus) were approved in 2013 and 2014 under the same payment terms as the first cycle of the plan (see note 5.e to our consolidated financial statements), whereby payment of a portion of the variable remuneration for these years is deferred over three years for it to be paid, where appropriate, in three equal portions, 50% in cash and 50% in Santander shares, provided that the conditions for entitlement to the remuneration are met. Similarly, the portion of the variable remuneration that is not deferred (immediate payment) is paid 50% in cash and 50% in shares.
The amounts shown in the foregoing table reflect the maximum total variable remuneration allocated to the executive directors for each year. These amounts include both the cash-based and share-based variable remuneration (according to the plans agreed in each year) and both the remuneration payable immediately and that which, as the case may be, is payable following a deferral period.
180
Table of Contents
The following table shows the form of payment of the aforementioned variable remuneration for 2014 and 2013:
| Thousands of euros | ||||||||||||||||||||||||||||||||
| 2014 | 2013 | |||||||||||||||||||||||||||||||
| Immediate payment in cash (20%) |
Immediate payment in shares (20%) |
Deferred payment in cash (30%) (1) |
Deferred payment in shares (30%) (1) |
Immediate payment in cash (20%) |
Immediate payment in shares (20%) |
Deferred payment in cash (30%) (2) |
Deferred payment in shares (30%) (2) |
|||||||||||||||||||||||||
| Ana Botín (3) |
752 | 752 | 1,129 | 1,129 | 442 | 442 | 664 | 664 | ||||||||||||||||||||||||
| Matías R. Inciarte |
574 | 574 | 860 | 860 | 462 | 462 | 692 | 692 | ||||||||||||||||||||||||
| Juan R. Inciarte |
445 | 445 | 667 | 667 | 296 | 296 | 444 | 444 | ||||||||||||||||||||||||
| Emilio Botín |
— | — | — | — | 282 | 282 | 424 | 424 | ||||||||||||||||||||||||
| Javier Marín |
793 | 793 | 1,190 | 1,190 | 500 | 500 | 750 | 750 | ||||||||||||||||||||||||
| Alfredo Sáenz |
— | — | — | — | — | — | — | — | ||||||||||||||||||||||||
|
|
|
|
|
|
|
|
|
|
|
|
|
|
|
|
|
|||||||||||||||||
| Total |
2,564 | 2,564 | 3,846 | 3,846 | 1,982 | 1,982 | 2,974 | 2,974 | ||||||||||||||||||||||||
|
|
|
|
|
|
|
|
|
|
|
|
|
|
|
|
|
|||||||||||||||||
| (1) | In 3 years: 2016, 2017 and 2018 subject to continued service, with the exceptions provided for, and the non-applicability of “malus” clauses. |
| (2) | In 3 years: 2015, 2016 and 2017 subject to continued service, with the exceptions provided for, and the non-applicability of “malus” clauses. |
| (3) | In 2013, euro equivalent value of the original amount in pounds sterling. |
The amounts of immediate and deferred payments in shares shown in the table above correspond to the following numbers of shares:
| Number of shares | ||||||||||||||||||||||||
| 2014 | 2013 | |||||||||||||||||||||||
| Immediate payment |
Deferred payment (1) |
Total | Immediate payment |
Deferred payment (2) |
Total | |||||||||||||||||||
| Ana Botín |
121,629 | 182,444 | 304,073 | 66,241 | 99,362 | 165,603 | ||||||||||||||||||
| Matías R. Inciarte |
92,726 | 139,088 | 231,814 | 69,092 | 103,639 | 172,731 | ||||||||||||||||||
| Juan R. Inciarte |
71,872 | 107,808 | 179,680 | 44,299 | 66,448 | 110,747 | ||||||||||||||||||
| Emilio Botín |
— | — | — | 42,287 | 63,431 | 105,718 | ||||||||||||||||||
| Javier Marín |
128,225 | 192,338 | 320,563 | 74,850 | 112,275 | 187,125 | ||||||||||||||||||
| Alfredo Sáenz |
— | — | — | — | — | — | ||||||||||||||||||
|
|
|
|
|
|
|
|
|
|
|
|
|
|||||||||||||
| Total |
414,452 | 621,678 | 1,036,130 | 296,769 | 445,155 | 741,924 | ||||||||||||||||||
|
|
|
|
|
|
|
|
|
|
|
|
|
|||||||||||||
| (1) | In 3 years: 2016, 2017 and 2018 subject to continued service, with the exceptions provided for, and the non-applicability of “malus” clauses. |
| (2) | In 3 years: 2015, 2016 and 2017 subject to continued service, with the exceptions provided for, and the non-applicability of “malus” clauses. |
ILP 2014
The ILP for the executive directors was set by the board, at the proposal of the remuneration committee, at an amount equal to 15% of the bonus.
The ILP thus established for each beneficiary is called the “Agreed ILP Amount”, and its accrual and its amount are linked to the degree of achievement of the multiannual targets established in the plan (see note 47 to our consolidated financial statements). The Agreed ILP Amount determines, for each executive director, the maximum number of shares that the director may, if appropriate, receive; this number was calculated taking into account the market price of the Santander share in the 15 trading sessions prior to January 16, 2015, which was €6.186 per share.
181
Table of Contents
The following is a breakdown of the maximum number of shares corresponding to each executive director and the estimated fair value of this variable remuneration:
| 2014 | ||||||||
| Fair value (thousands of euros) (1) |
Maximum number of shares |
|||||||
| Ana Botín (1) |
140 | 62,395 | ||||||
| Matías R. Inciarte |
170 | 75,655 | ||||||
| Juan R. Inciarte |
120 | 53,346 | ||||||
| Emilio Botín |
— | — | ||||||
| Javier Marín |
147 | 65,470 | ||||||
|
|
|
|
|
|||||
| Total |
577 | 256,866 | ||||||
|
|
|
|
|
|||||
| (1) | Estimated fair value at the plan award date, taking into account various possible scenarios regarding Banco Santander’s TSR performance in relation to that of the benchmark group entities in the measurement periods. |
The accrual of the ILP and its amount are conditional on the performance of Banco Santander’s TSR in relation to that of the entities in the benchmark group over a multiannual period. Thus, in 2016, 2017 and 2018, the amount, if any, to be received by each executive director under the ILP (the annual amount of the ILP) will be determined by applying to one third of the ILP agreed amount the percentage resulting from the performance of the TSR according to the table approved in the plan.
iii. Breakdown by director
A breakdown of the remuneration by Bank director for 2014 and 2013 is provided below. The salaries of the executive directors shown in the table below correspond to the gross annual salary received and to the maximum amount of the bonus approved by the board as period remuneration, irrespective of the year of payment and of the amount which may ultimately be paid to the directors under the agreed deferred remuneration scheme. Also, the figures for 2014 include, for each director, the estimated fair value of the new long-term incentive (ILP), irrespective of the year of payment and of the amount which may ultimately be paid under the agreed deferred remuneration scheme. Note 5.e) to our consolidated financial statements includes disclosures on the shares delivered as part of the deferred remuneration schemes in place in previous years the conditions for delivery of which were met in the corresponding years.
182
Table of Contents
| Thousands of euros | ||||||||||||||||||||||||||||||||||||||||||||||||||||||||||||||||||||||||||||||
| 2014 | 2013 | |||||||||||||||||||||||||||||||||||||||||||||||||||||||||||||||||||||||||||||
| Bylaw-stipulated emoluments | Salaries of executive directors | |||||||||||||||||||||||||||||||||||||||||||||||||||||||||||||||||||||||||||||
| Annual emolument | Attendance fees | |||||||||||||||||||||||||||||||||||||||||||||||||||||||||||||||||||||||||||||
| Audit and compliance committee |
Appointments and remuneration committee |
Risk supervision, regulation and compliance committee |
Variable- immediate payment |
Variable- deferred payment (a) |
Other remuneration (c) |
|||||||||||||||||||||||||||||||||||||||||||||||||||||||||||||||||||||||||
| Directors |
Board | Executive committee |
Appointments committee |
Remuneration committee |
Board | Other fees |
Fixed | In cash |
In shares |
In cash |
In shares |
ILP (b) | Total | Total | Total (d) | |||||||||||||||||||||||||||||||||||||||||||||||||||||||||||||||
| Ana Botín |
||||||||||||||||||||||||||||||||||||||||||||||||||||||||||||||||||||||||||||||
| Chief executive officer of Santander UK |
85 | 170 | — | — | — | — | — | 29 | 2 | 1,392 | 442 | 442 | 664 | 664 | 140 | 3,744 | 448 | 4,478 | 4,840 | |||||||||||||||||||||||||||||||||||||||||||||||||||||||||||
| Chair |
— | — | — | — | — | — | — | — | — | 833 | 310 | 310 | 465 | 465 | — | 2,383 | — | 2,383 | — | |||||||||||||||||||||||||||||||||||||||||||||||||||||||||||
| Matías R. Inciarte |
85 | 170 | — | — | — | — | — | 38 | 158 | 1,710 | 574 | 574 | 860 | 860 | 170 | 4,748 | 175 | 5,375 | 4,729 | |||||||||||||||||||||||||||||||||||||||||||||||||||||||||||
| Guillermo de la Dehesa (1) |
113 | 170 | 40 | 19 | 4 | 4 | — | 38 | 48 | — | — | — | — | — | — | — | — | 438 | 394 | |||||||||||||||||||||||||||||||||||||||||||||||||||||||||||
| Rodrigo Echenique (2) |
85 | 170 | 12 | 19 | 4 | 4 | 21 | 36 | 152 | — | — | — | — | — | — | — | 23 | 527 | 493 | |||||||||||||||||||||||||||||||||||||||||||||||||||||||||||
| Sheila C. Bair (3) |
79 | — | — | — | — | — | 21 | 23 | 7 | — | — | — | — | — | — | — | — | 129 | — | |||||||||||||||||||||||||||||||||||||||||||||||||||||||||||
| Javier Botín (4) |
85 | — | — | — | — | — | — | 25 | — | — | — | — | — | — | — | — | — | 110 | 113 | |||||||||||||||||||||||||||||||||||||||||||||||||||||||||||
| Esther Giménez-Salinas |
85 | — | — | — | — | — | — | 36 | — | — | — | — | — | — | — | — | — | 121 | 114 | |||||||||||||||||||||||||||||||||||||||||||||||||||||||||||
| Ángel Jado |
85 | — | — | — | — | — | 21 | 38 | 8 | — | — | — | — | — | — | — | — | 152 | 115 | |||||||||||||||||||||||||||||||||||||||||||||||||||||||||||
| Juan R. Inciarte |
85 | — | — | — | — | — | — | 38 | 87 | 1,200 | 445 | 445 | 667 | 667 | 120 | 3.543 | 184 | 3,937 | 2,830 | |||||||||||||||||||||||||||||||||||||||||||||||||||||||||||
| Isabel Tocino (5) |
85 | 170 | — | 19 | — | 4 | — | 36 | 171 | — | — | — | — | — | — | — | — | 485 | 432 | |||||||||||||||||||||||||||||||||||||||||||||||||||||||||||
| Juan Miguel Villar-Mir (6) |
85 | — | — | — | — | — | — | 20 | — | — | — | — | — | — | — | — | — | 105 | 71 | |||||||||||||||||||||||||||||||||||||||||||||||||||||||||||
| Emilio Botín (7) |
59 | 118 | — | — | — | — | — | 20 | 1 | 930 | — | — | — | — | — | 930 | 1 | 1,129 | 3,051 | |||||||||||||||||||||||||||||||||||||||||||||||||||||||||||
| Javier Marín (8) |
||||||||||||||||||||||||||||||||||||||||||||||||||||||||||||||||||||||||||||||
| Executive vice president |
— | — | — | — | — | — | — | — | — | — | — | — | — | — | — | — | — | — | 767 | |||||||||||||||||||||||||||||||||||||||||||||||||||||||||||
| Chief executive officer |
85 | 170 | — | — | — | — | — | 36 | 3 | 2,000 | 793 | 793 | 1,190 | 1,190 | 147 | 6,113 | 54 | 6,460 | 3,574 | |||||||||||||||||||||||||||||||||||||||||||||||||||||||||||
| Fernando de Asúa (9) |
113 | 170 | 40 | 19 | 4 | 4 | 47 | 36 | 211 | — | — | — | — | — | — | — | — | 645 | 579 | |||||||||||||||||||||||||||||||||||||||||||||||||||||||||||
| Vittorio Corbo (10) |
48 | — | — | — | — | — | — | 8 | — | — | — | — | — | — | — | — | — | 56 | 106 | |||||||||||||||||||||||||||||||||||||||||||||||||||||||||||
| Abel Matutes (11) |
85 | — | 40 | — | 4 | — | — | 28 | 26 | — | — | — | — | — | — | — | — | 183 | 169 | |||||||||||||||||||||||||||||||||||||||||||||||||||||||||||
| Lord Burns (Terence) (12) |
— | — | — | — | — | — | — | — | — | — | — | — | — | — | — | — | — | — | 103 | |||||||||||||||||||||||||||||||||||||||||||||||||||||||||||
| Alfredo Sáenz (13) |
— | — | — | — | — | — | — | — | — | — | — | — | — | — | — | — | — | — | 1,899 | |||||||||||||||||||||||||||||||||||||||||||||||||||||||||||
| Manuel Soto (13) |
— | — | — | — | — | — | — | — | — | — | — | — | — | — | — | — | — | — | 137 | |||||||||||||||||||||||||||||||||||||||||||||||||||||||||||
|
|
|
|
|
|
|
|
|
|
|
|
|
|
|
|
|
|
|
|
|
|
|
|
|
|
|
|
|
|
|
|
|
|
|
|
|
|
|
|||||||||||||||||||||||||||||||||||||||||
| Total 2014 |
1,347 | 1,310 | 131 | 77 | 18 | 18 | 109 | 484 | 873 | 8,065 | 2,564 | 2,564 | 3,846 | 3,846 | 577 | 21,461 | 884 | 26,713 | — | 8.9% | ||||||||||||||||||||||||||||||||||||||||||||||||||||||||||
|
|
|
|
|
|
|
|
|
|
|
|
|
|
|
|
|
|
|
|
|
|
|
|
|
|
|
|
|
|
|
|
|
|
|
|
|
|
|
|||||||||||||||||||||||||||||||||||||||||
| Total 2013 |
1,415 | 1,308 | 158 | 103 | — | — | — | 468 | 874 | 8,880 | 1,982 | 1,982 | 2,974 | 2,974 | — | 18,792 | 1.398 | — | 24,517 | |||||||||||||||||||||||||||||||||||||||||||||||||||||||||||
|
|
|
|
|
|
|
|
|
|
|
|
|
|
|
|
|
|
|
|
|
|
|
|
|
|
|
|
|
|
|
|
|
|
|
|
|
|
|
|||||||||||||||||||||||||||||||||||||||||
| (1) | Member of the audit committee and third deputy chairman since April 29, 2013. |
| (2) | Executive director since January 16, 2015. |
| (3) | Appointed director on January 27, 2014. |
| (4) | All the amounts received were repaid to the Fundación Marcelino Botín. |
| (5) | Member of the executive committee since April 29, 2013. |
| (6) | Board member since May 7, 2013. |
| (7) | Ceased to be a member of the board due to his death on September 9, 2014. |
| (8) | Member of the board and the executive committee since April 29, 2013. Retired from the board on January 12, 2015. |
| (9) | Retired from the board on February 12, 2015. |
| (10) | Retired from the board on July 24, 2014. |
| (11) | Retired from the board on February 18, 2015. |
| (12) | Retired from the board on December 31, 2013. |
| (13) | Retired from the board on April 29, 2013. |
| (a) | Maximum deferred bonus for the period approved by the board of directors at the related meetings. |
| (b) | Fair value of the ILP granted in 2014. |
| (c) | Includes, inter alia, the life and medical insurance costs borne by the Group relating to Bank directors. |
| (d) | Includes the corresponding deferred variable remuneration. |
183
Table of Contents
Compensation of the board members as representatives of the Bank on other boards
By resolution of the executive committee, all the remuneration received by the Bank’s directors who represent the Bank on the boards of directors of listed companies in which the Bank has a stake, paid by those companies and relating to appointments made after March 18, 2002, accrues to the Group. In 2014 and 2013, the Bank’s directors did not receive any remuneration in respect of these representative duties.
Two directors of the Bank received a total of €295 thousand in 2014 as members of the boards of directors of Group companies (2013: €1,184 thousand), the detail being as follows: Matías R. Inciarte received €42 thousand as non-executive director of U.C.I., S.A. and Vittorio Corbo—who resigned as a director of the Bank with effect from July 24, 2014—received €253 thousand prior to his resignation, of which he received €89 thousand as chairman and non-executive director of Banco Santander Chile, €156 thousand for advisory services provided to that entity and €8 thousand as non-executive director of Grupo Financiero Santander México, S.A.B. de C.V.
Pension commitments and other items for directors
In 2012, within the framework of the measures implemented by the Group in order to mitigate the risks arising from the defined-benefit pension obligations payable to certain employees, which led to an agreement with the workers’ representatives to convert the defined-benefit obligations existing under the collective agreement into defined-contribution plans (see note 25 to our consolidated financial statements), the contracts of the executive directors and the other members of the Bank’s senior management which provided for defined-benefit pension obligations were amended to convert these obligations into a defined-contribution employee welfare system, which was externalized to Santander Seguros y Reaseguros, Compañía Aseguradora, S.A. The new system grants the executive directors the right to receive a pension benefit upon retirement, regardless of whether or not they are in the Bank’s employ on that date, based on the contributions made to the aforementioned system, and replaced the right to receive a pension supplement which had previously been payable to them upon retirement. The new system expressly excludes any obligation of the Bank to the executive directors other than the conversion of the previous system into the new employee welfare system, which took place in 2012, and, as the case may be, the annual contributions to be made as described below6. In the event of pre-retirement, the executive directors who have not exercised the option to receive their pensions in the form of a lump sum are entitled to receive an annual retainer until the date of retirement.
The initial balance for each executive director in the new defined-contribution welfare system was that corresponding to the market value of the assets in which the provisions for the respective accrued obligations had been invested, at the date on which the former pension obligations were converted into the new welfare system7.
Since 2013 the Bank makes annual contributions to the employee welfare system for the benefit of the executive directors and senior executives, in proportion to their respective pensionable bases, until they leave the Group, or until their retirement from the Group, death or disability (including, as the case may be, during the pre-retirement period). No contributions are made for the executive directors and senior executives who, prior to the conversion of the defined-benefit pension obligations into the current defined-contribution employee welfare system, had exercised the option to receive their pension rights in a lump sum8.
The terms of the employee welfare system regulate the impact of the deferral of the computable variable remuneration on the benefit payments covered by the system upon retirement and, as the case may be, the retention in the form of shares of the benefits arising from such remuneration.
In 2013, as a result of his appointment as chief executive officer, changes were introduced to the contract of Javier Marín with respect to the pension obligations stipulated in his senior management contract. The annual contribution to the employee welfare system was thereafter calculated as 80% of the sum of: (i) fixed annual remuneration; and (ii) 30% of the arithmetic mean of the last three gross amounts of variable remuneration. Also, the pensionable base in relation to the
| 6 | As provided for in the contracts of the executive directors and members of senior management prior to their modification Emilio Botín and Matías R. Inciarte had exercised the option to receive the accrued pensions -or amounts similar thereto- in the form of a lump sum (i.e. in a single payment), which meant that no further pension benefit would accrue to them from that time, and the lump sum to be received, which would be updated at the agreed-upon interest rate, was fixed. |
| 7 | In the case of Emilio Botín and Matías R. Inciarte, the initial balance corresponded to the amounts that were set when, as described above, they exercised the option to receive a lump sum, and includes the interest accrued on these amounts from that date. |
| 8 | Rodrigo Echenique, appointed executive director on January 16, 2015, does not participate in the welfare system and is not entitled to have any contributions made in his favor by the Bank in this connection, notwithstanding the pension rights to which he was entitled prior to his appointment as executive director. |
184
Table of Contents
death and permanent disability scheme provided for in his senior management contract became 100% of fixed annual remuneration. Under his senior management contract the annual contribution was 55% of his fixed remuneration, and the pensionable base in the event of death or disability was 80% of his fixed remuneration.
The following is a breakdown of the balances relating to each of the current executive directors under the welfare system at December 31, 2014 and 2013:
| Thousands of euros | ||||||||
| 2014 | 2013 | |||||||
| Ana Botín (1) |
40,134 | 37,202 | ||||||
| Matías R. Inciarte |
47,255 | 46,058 | ||||||
| Juan R. Inciarte |
13,730 | 13,410 | ||||||
| Emilio Botín |
— | (2) | 25,864 | |||||
| Javier Marín (3) |
4,523 | 4,346 | ||||||
| Alfredo Sáenz (4) |
— | — | ||||||
|
|
|
|
|
|||||
| 105,642 | 126,880 | |||||||
|
|
|
|
|
|||||
| (1) | Includes the amounts relating to the period of provision of services at Banesto, externalized with another insurance company. |
| (2) | Following his death on September 9, 2014, a death benefit of the amount of the accumulated rights (€26,498 thousand) is payable to the beneficiaries designated in the policy implementing the welfare system. |
| (3) | Ceased to be a director on January 12, 2015 and took voluntary pre-retirement, as provided for in his contract, opting to receive the annual pre-retirement retainers to which he is entitled (€800 thousand gross) in a single payment (€10,861 thousand gross). As stipulated in his contract, the Bank will make annual contributions to the welfare system, amounting to 55% of this director’s annual retainer during the pre-retirement period, and Javier Marín will be entitled to receive, at the time of his retirement, the retirement benefit recognized in the welfare system, equal to the amount of the balance accumulated in the system corresponding to him at that time. As regards the deferred variable remuneration corresponding to Javier Marín in relation to years prior to his pre-retirement, the scheme described in the relevant sections of this report shall apply, and Javier Marín will receive this remuneration, if appropriate, on the dates contemplated in the corresponding plans, subject to the stipulated conditions for its accrual being met. |
| (4) | In April 2013, upon his retirement, Alfredo Sáenz requested payment of the pensions to which he was entitled in a lump sum (€88.5 million gross). For such purpose, his pension rights were settled, in accordance with the applicable contractual and legal terms, through: i) the payment in cash of €38.2 million relating to the net amount of the pension calculated taking into account the fixed remuneration, and €12.2 million relating to the net amount of the pension calculated taking into account the accrued variable remuneration at the retirement date, and ii) the investment by Sáenz of those €12.2 million in Santander shares (2,216,082 shares), which were deposited at the Bank on a restricted basis until April 29, 2018. |
The Group also has pension obligations to other directors amounting to €18 million (December 31, 2013: €18 million). The payments made in 2014 to the members of the board entitled to post-employment benefits amounted to €1.2 million (2013: €1.2 million), of which €0.9 million relate to Rodrigo Echenique (appointed executive director on January 16, 2015).
Lastly, the contracts of the executive directors who had not exercised the option referred to above prior to the conversion of the defined-benefit pension obligations into the current welfare system include a supplementary welfare regime for the contingency of death (surviving spouse and child benefits) and permanent disability of serving directors.
The provisions recognized in 2014 and 2013 for retirement pensions and supplementary benefits (surviving spouse and child benefits, and permanent disability) were as follows:
| Thousands of euros | ||||||||
| 2014 | 2013 | |||||||
| Ana Botín |
2,140 | 1,443 | ||||||
| Matías R. Inciarte |
— | — | ||||||
| Juan R. Inciarte |
718 | 609 | ||||||
| Emilio Botín |
— | — | ||||||
| Javier Marín |
2,126 | 2,006 | ||||||
| Alfredo Sáenz |
— | — | ||||||
|
|
|
|
|
|||||
| 4,984 | 4,058 | |||||||
|
|
|
|
|
|||||
185
Table of Contents
Insurance
The Group has taken out life insurance policies for the Bank’s directors, who will be entitled to receive benefits if they are declared disabled; in the event of death, the benefits will be payable to their heirs. The premiums paid by the Group are included in the Other remuneration column of the table shown in note 5.a.iii to our consolidated financial statements. Also, the following table provides information on the sums insured for the Bank’s executive directors:
| Insured sum (Thousands of euros) |
||||||||
| 2014 | 2013 | |||||||
| Ana Botín |
7,500 | 6,000 | ||||||
| Matías R. Inciarte |
5,131 | 5,131 | ||||||
| Juan R. Inciarte |
2,961 | 2,961 | ||||||
| Emilio Botín |
— | — | ||||||
| Javier Marín |
2,400 | 2,400 | ||||||
| Alfredo Sáenz |
— | — | ||||||
|
|
|
|
|
|||||
| 17,992 | 16,492 | |||||||
|
|
|
|
|
|||||
Additionally, other directors have life insurance policies the cost of which is borne by the Group, the related insured sum being €1.4 million at December 31, 2014 (2013: €1.4 million).
Deferred variable remuneration systems
The following is information on the maximum number of shares to which the executive directors are entitled at the beginning and end of 2013 and 2014 due to their participation in the deferred variable remuneration systems, which implemented a portion of their variable remuneration relating to prior years, as well as on the payments, in shares or in cash, made to them in 2013 and 2014 where the terms and conditions for the receipt thereof had been met:
i) Obligatory investment share plan
Pursuant to the obligatory investment share plan (see note 47 to our consolidated financial statements), as deferred share-based variable remuneration in 2009, the executive directors acquired, prior to February 28, 2010, the number of Bank shares shown in the table below, corresponding to the third cycle of this plan. Executive directors who retain the shares acquired in the obligatory investment and remain in the Group’s employ for three years from the date on which the obligatory investment is made are entitled to receive the same number of Bank shares as that composing their initial obligatory investment provided that none of the following circumstances exist in the three-year period from the investment in the shares: (i) poor financial performance of the Group; (ii) breach by the beneficiary of the codes of conduct or other internal regulations, including, in particular, those relating to risks, where applicable to the executive in question; or (iii) material restatement of the Group’s financial statements, except when it is required pursuant to a change in accounting standards.
The conditions having been met for their receipt, in February 2013, as approved by the board, at the proposal of the appointments and remuneration committee, the gross number of shares are detailed below relating to the third cycle accrued to the executive directors, and this number is equal to the number of shares initially acquired by them.
| Maximum number of shares to be delivered (2) |
||||
| 3rd cycle 2010-2012 |
||||
| Ana Botín (1) |
18,446 | |||
| Matías R. Inciarte |
25,849 | |||
| Juan R. Inciarte |
15,142 | |||
| Emilio Botín |
20,515 | |||
| Javier Marín |
11,092 | |||
|
|
|
|||
| 91,044 | ||||
|
|
|
|||
186
Table of Contents
| (1) | The maximum number of shares corresponding to Ana Botín as beneficiary of this plan is in line with the resolution adopted by the shareholders at the annual general meeting of Banesto held on February 24, 2010. |
| (2) | In addition, Alfredo Sáenz received 49,000 shares as a result of his participation in the third cycle of the aforementioned plan. |
ii) Performance share plan (Plan I13)
The table below shows the maximum number of options held at January 1, 2013 by each executive director based on their participation in the I13 incentive plan (Plan I13) which implemented a portion of the variable remuneration for 2010. As established in the plan, the number of shares received was determined by the degree of achievement of the targets to which the plan was tied, and the necessary minimum not having been reached, their options under the plan were cancelled.
| Options at January 1, 2013 |
Shares delivered in 2013 (number) |
Options cancelled in 2013 (number) |
Options at December 31, 2013 |
Grant date | Share delivery deadline |
|||||||||||||||||||
| Plan I13 |
||||||||||||||||||||||||
| Ana Botín (1) |
56,447 | — | (56,447 | ) | — | 06-11-10 | 07-31-13 | |||||||||||||||||
| Matías R. Inciarte |
105,520 | — | (105,520 | ) | — | 06-11-10 | 07-31-13 | |||||||||||||||||
| Juan R. Inciarte |
60,904 | — | (60,904 | ) | — | 06-11-10 | 07-31-13 | |||||||||||||||||
| Emilio Botín |
82,941 | — | (82,941 | ) | — | 06-11-10 | 07-31-13 | |||||||||||||||||
| Alfredo Sáenz (2) |
228,445 | — | (228,445 | ) | — | 06-11-10 | 07-31-13 | |||||||||||||||||
|
|
|
|
|
|
|
|
|
|||||||||||||||||
| 534,257 | — | (534,257 | ) | — | ||||||||||||||||||||
|
|
|
|
|
|
|
|
|
|||||||||||||||||
| (1) | Without prejudice to the Banesto shares corresponding to Ana Botín by virtue of the various Banesto share-based incentive plans approved by the shareholders at the general meeting of Banesto (a maximum of 32,358 Banesto shares relating to her participation in the Banesto Share-Based Incentive Plan expiring in 2013). |
| (2) | Following his resignation on April 29, 2013, Alfredo Sáenz lost his entitlement arising from his participation in these plans since he did not meet all the conditions stipulated for the shares to be received. |
iii) Deferred conditional delivery share plan
The 2010 variable remuneration of the executive directors and Group executives or employees whose variable remuneration or annual bonus for 2010 exceeded, in general, €300,000 (gross) was approved by the board of directors through the instrumentation of the first cycle of the deferred conditional delivery share plan, whereby a portion of the aforementioned variable remuneration or bonus was deferred over a period of three years for it to be paid, where appropriate, in Santander shares. Application of this cycle, insofar as it entails the delivery of shares to the plan beneficiaries, was authorized by the annual general meeting held on June 11, 2010.
In addition to the requirement that the beneficiary remains an employee of the Group, with the exceptions included in the plan regulations, the accrual of the share-based deferred remuneration is conditional upon none of the following circumstances existing, in the opinion of the board of directors, during the period prior to each of the deliveries: (i) poor financial performance of the Group; (ii) breach by the beneficiary of internal regulations, including, in particular, those relating to risks; (iii) material restatement of the Group’s financial statements, except when it is required pursuant to a change in accounting standards; or (iv) significant changes in economic capital and the qualitative assessment of risk.
The share-based bonus is being deferred over three years and will be paid, where appropriate, in three instalments starting after the first year.
187
Table of Contents
The number of shares allocated to the executive directors for deferral purposes in 2010 and the shares delivered in 2013 (second third) and in February 2014 (third third), once the conditions for receiving them had been met, are as follows (the plan having been settled):
| Number of shares deferred on bonus for 2010 (2) |
Number of shares delivered in 2013 (2nd third) (2) |
Number of shares delivered in 2014 (3rd third) (2) |
||||||||||
| Ana Botín (1) |
91,187 | 30,395 | 19,240 | |||||||||
| Matías R. Inciarte |
135,188 | 45,063 | 45,063 | |||||||||
| Juan R. Inciarte |
61,386 | 20,462 | 20,462 | |||||||||
| Emilio Botín |
94,345 | 31,448 | 31,448 | |||||||||
| Javier Marín |
37,749 | 12,583 | 12,583 | |||||||||
| (1) | Shares of Banesto, as authorized by the shareholders of that entity at the annual general meeting of February 23, 2011. Following the merger of Banesto with the Bank, 19,240 shares of the Bank were delivered in 2014, equal to the 30,395 shares of Banesto authorized by the annual general meeting. |
| (2) | On January 23, 2012, Francisco Luzón took pre-retirement and resigned from his positions as director and head of the Americas division. In accordance with the plan regulations Francisco Luzón retained the right to receive the shares corresponding to his participation in the plan, subject to compliance with the conditions established for them to be received. In both 2013 and 2014 he received 51,660 shares relating to the number of shares to which he was entitled as a result of the vesting of the second and third thirds of the deferred portion of his 2010 bonus. |
Furthermore, Alfredo Sáenz ceased to be a member of the board on April 29, 2013. In accordance with the terms of the plan, Alfredo Sáenz retained the right to receive the shares corresponding to his participation in the plan, subject to compliance with the conditions established for them to be received. In both 2013 and 2014 he received 104,150 shares relating to the number of shares to which he was entitled as a result of the vesting of the second and third thirds of the deferred portion of his 2010 bonus.
iv) Deferred conditional variable remuneration plan
Since 2011, the bonuses of executive directors and certain executives (including senior management) and employees who assume risk, who perform control functions or receive an overall remuneration placing them on the same remuneration level as senior executives and employees who assume risk (all of whom are referred to as identified staff) have been approved by the board of directors and implemented, respectively, through various cycles of the deferred conditional variable remuneration plan. Application of these cycles, insofar as they entail the delivery of shares to the plan beneficiaries, was authorized by the related annual general meetings.
The purpose of these plans is to defer a portion of the bonus of the beneficiaries thereof (60% in the case of executive directors) over a period of three years for it to be paid, where appropriate, in cash and in Santander shares; the other portion of the bonus is also to be paid in cash and Santander shares, upon commencement of the cycles, in accordance with the rules set forth below.
In addition to the requirement that the beneficiary remains employed by Grupo Santander, the accrual of the deferred remuneration is conditional upon none of the following circumstances existing on the opinion of the board of directors following a proposal of the remuneration committee in relation to the corresponding year in the period prior to each of the deliveries: (i) poor financial performance of the Group; (ii) breach by the beneficiary of internal regulations, including, in particular, those relating to risks; (iii) material restatement of the Group’s financial statements, except when it is required pursuant to a change in accounting standards; or (iv) significant changes in the Group’s economic capital or its risk profile. All the foregoing shall in each case be governed by the rules of the relevant plan cycle.
On each delivery, the beneficiaries will be paid an amount in cash equal to the dividends paid for the amount deferred in shares and the interest on the amount deferred in cash. If the Santander Dividendo Elección scrip dividend scheme is applied, they will be paid the price offered by the Bank for the bonus share rights corresponding to those shares.
The maximum number of shares to be delivered is calculated taking into account the volume-weighted average prices for the 15 trading sessions prior to the date on which the board of directors approves the bonus for the Bank’s executive directors for each year.
The table below shows the number of Santander shares assigned to each executive director and not yet delivered at January 1, 2013, December 31, 2013 and December 31, 2014, and the gross shares delivered to them in 2013 and 2014, by way of either immediate payment or deferred payment, in the latter case once the board had determined, at the proposal of the appointments and remuneration committee, that the third relating to each plan had accrued. The shares resulted from each of the plans which awarded the variable remuneration of 2011, 2012, 2013 and 2014, as shown in the following table:
188
Table of Contents
| Share-based |
Maximum number of shares to be delivered at January 1, 2013 |
Shares delivered in 2013 (immediate payment 2012 variable remuneration) |
Shares delivered in 2013 (deferred payment 2011 variable remuneration) |
2013 variable remuneration (maximum number of shares to be delivered) |
Maximum number of shares to be delivered at December 31, 2013 |
Shares delivered in 2014 (immediate payment 2013 variable remuneration) |
Shares delivered in 2014 (deferred payment 2012 variable remuneration) |
Shares delivered in 2014 (deferred payment 2011 variable remuneration) |
2014 variable remuneration (maximum number of shares to be delivered) |
Maximum number of shares to be delivered at December 31, 2014 |
||||||||||||||||||||||||||||||
| 2011 variable remuneration |
||||||||||||||||||||||||||||||||||||||||
| Ana Botín |
141,002 | — | (47,001 | ) | — | 94,001 | — | — | (47,001 | ) | — | 47,000 | ||||||||||||||||||||||||||||
| Matías R. Inciarte |
188,634 | — | (62,878 | ) | — | 125,756 | — | — | (62,878 | ) | — | 62,878 | ||||||||||||||||||||||||||||
| Juan R. Inciarte |
110,070 | — | (36,690 | ) | — | 73,380 | — | — | (36,690 | ) | — | 36,690 | ||||||||||||||||||||||||||||
| Emilio Botín |
149,327 | — | (49,776 | ) | — | 99,551 | — | — | (49,776 | ) | — | 49,775 | ||||||||||||||||||||||||||||
| Javier Marín |
77,882 | — | (25,961 | ) | — | 51,921 | — | — | (25,961 | ) | — | 25,960 | ||||||||||||||||||||||||||||
| Francisco Luzón (1) |
196,494 | — | (65,498 | ) | — | 130,996 | — | — | (65,498 | ) | — | 65,498 | ||||||||||||||||||||||||||||
| Alfredo Sáenz (2) |
371,049 | — | (123,683 | ) | — | 247,366 | — | — | (123,683 | ) | — | 123,683 | ||||||||||||||||||||||||||||
| 1,234,458 | — | (411,487 | ) | — | 822,971 | — | — | (411,487 | ) | — | 411,484 | |||||||||||||||||||||||||||||
| 2012 variable remuneration |
||||||||||||||||||||||||||||||||||||||||
| Ana Botín |
174,790 | (69,916 | ) | — | — | 104,874 | — | (34,958 | ) | — | — | 69,916 | ||||||||||||||||||||||||||||
| Matías R. Inciarte |
207,648 | (83,059 | ) | — | — | 124,589 | — | (41,530 | ) | — | — | 83,059 | ||||||||||||||||||||||||||||
| Juan R. Inciarte |
121,165 | (48,466 | ) | — | — | 72,699 | — | (24,233 | ) | — | — | 48,466 | ||||||||||||||||||||||||||||
| Emilio Botín |
109,879 | (43,952 | ) | — | — | 65,927 | — | (21,976 | ) | — | — | 43,951 | ||||||||||||||||||||||||||||
| Javier Marín |
116,908 | (58,454 | ) | 58,454 | — | (19,485 | ) | — | — | 38,969 | ||||||||||||||||||||||||||||||
| Alfredo Sáenz (2) |
273,028 | (109,211 | ) | — | — | 163,817 | — | (54,605 | ) | — | — | 109,212 | ||||||||||||||||||||||||||||
| 1,003,418 | (413,058 | ) | — | — | 590,360 | — | (196,787 | ) | — | — | 393,573 | |||||||||||||||||||||||||||||
| 2013 variable remuneration |
||||||||||||||||||||||||||||||||||||||||
| Ana Botín |
— | — | — | 165,603 | 165,603 | (66,241 | ) | — | — | — | 99,362 | |||||||||||||||||||||||||||||
| Matías R. Inciarte |
— | — | — | 172,731 | 172,731 | (69,092 | ) | — | — | — | 103,639 | |||||||||||||||||||||||||||||
| Juan R. Inciarte |
— | — | — | 110,747 | 110,747 | (44,299 | ) | — | — | — | 66,448 | |||||||||||||||||||||||||||||
| Emilio Botín |
— | — | — | 105,718 | 105,718 | (42,287 | ) | — | — | — | 63,431 | |||||||||||||||||||||||||||||
| Javier Marín |
— | — | — | 187,125 | 187,125 | (74,850 | ) | — | — | — | 112,275 | |||||||||||||||||||||||||||||
| — | — | — | 741,924 | 741,924 | (296,769 | ) | — | — | — | 445,155 | ||||||||||||||||||||||||||||||
| 2014 variable remuneration |
||||||||||||||||||||||||||||||||||||||||
| Ana Botín |
— | — | — | — | — | — | — | — | 304,073 | 304,073 | ||||||||||||||||||||||||||||||
| Matías R. Inciarte |
— | — | — | — | — | — | — | — | 231,814 | 231,814 | ||||||||||||||||||||||||||||||
| Juan R. Inciarte |
— | — | — | — | — | — | — | — | 179,680 | 179,680 | ||||||||||||||||||||||||||||||
| Emilio Botín |
— | — | — | — | — | — | — | — | — | — | ||||||||||||||||||||||||||||||
| Javier Marín |
— | — | — | — | — | — | — | — | 320,563 | 320,563 | ||||||||||||||||||||||||||||||
| — | — | — | — | — | — | — | — | 1,036,130 | 1,036,130 | |||||||||||||||||||||||||||||||
| (1) | On January 23, 2012, Francisco Luzón took pre-retirement and resigned from his positions as director and head of the Americas division. In relation to his 2011 variable remuneration to be received in cash and in Santander shares, the board resolved, at the committee’s proposal, to deliver him €743 thousand and 130,996 shares as an immediate payment. The deferred amount in cash and in shares relating to the first, second and third thirds was paid in February 2013, 2014 and 2015, the requirements of the plan for the receipt thereof having been met. Upon each delivery of shares, he was paid an amount in cash equal to the dividends paid on those shares and, if the Santander Dividendo Elección scrip dividend scheme is applied, the price offered by the Bank for the bonus share rights relating to the aforementioned shares, as well as the interest accrued on the amount deferred in cash. |
| (2) | Alfredo Sáenz ceased to discharge his duties as director on April 29, 2013. The deferred amounts, in cash (two gross payments of €702 thousand each, relating to the deferred variable remuneration for 2011, and three of €351 thousand each, relating to the deferred variable remuneration for 2012) and in shares (see table above), relating to the deferred variable remuneration for 2011 and 2012, have or will be paid to him on the corresponding maturity dates, together with the remuneration relating to the shares (dividends and amounts offered for the bonus share rights if the Santander Dividendo Elección scrip dividend scheme is applied) and the interest accrued on the cash amounts, subject to compliance with the requirements set forth in the related resolutions of the general meetings and the plans’ regulations, as well as all other terms set forth therein. |
189
Table of Contents
Furthermore, the table below shows the cash delivered in 2013 and 2014, by way of either immediate payment or deferred payment, in the latter case once the board had determined, at the proposal of the appointments and remuneration committee that the third relating to each plan had accrued:
| Thousands of euros | ||||||||||||||||
| 2014 | 2013 | |||||||||||||||
| Cash paid (immediate payment 2013 variable remuneration) |
Cash paid (third of deferred payment 2012 and 2011 variable remuneration) |
Cash paid (immediate payment 2012 variable remuneration) |
Cash paid (1st third deferred payment 2011 variable remuneration) |
|||||||||||||
| Ana Botín (1) |
466 | 513 | 449 | 286 | ||||||||||||
| Matías R. Inciarte |
462 | 624 | 534 | 357 | ||||||||||||
| Juan R. Inciarte |
296 | 364 | 311 | 208 | ||||||||||||
| Emilio Botín |
282 | 423 | 282 | 282 | ||||||||||||
| Javier Marín |
500 | 272 | 376 | 147 | ||||||||||||
| Francisco Luzón |
— | — | (2) | — | 371 | |||||||||||
| Alfredo Sáenz |
— | — | (3) | 702 | 702 | |||||||||||
|
|
|
|
|
|
|
|
|
|||||||||
| 2,005 | 2,197 | 2,654 | 2,353 | |||||||||||||
|
|
|
|
|
|
|
|
|
|||||||||
| (1) | Euro equivalent value of the original amount in pounds sterling. |
| (2) | In 2014 he received €371 thousand relating to the second third of the conditional deferred variable remuneration plan of 2011, the requirements for the accrual thereof having been met. |
| (3) | In 2014 he received €1,053 thousand relating to the second and first thirds of the conditional deferred variable remuneration plans of 2011 and 2012, the requirements for the accrual thereof having been met. |
v) Performance share plan (ILP)
The table below shows the maximum number of shares to which the executive directors are entitled, as part of their variable remuneration for 2014, as a result of their participation in the ILP (see note 47 to our consolidated financial statements).
| Maximum number of shares |
||||
| Ana Botín |
62,395 | |||
| Matías R. Inciarte |
75,655 | |||
| Juan R. Inciarte |
53,346 | |||
| Emilio Botín |
— | |||
| Javier Marín |
65,470 | |||
|
|
|
|||
| Total |
256,866 | |||
|
|
|
|||
The accrual and amount of the ILP are conditional upon the performance of Santander’s TSR compared to that of the companies in the benchmark group over a multiannual period. Therefore, in 2016, 2017 and 2018 the amount to be received by each executive director in relation to the ILP (the “ILP Agreed Amount”) will be determined by applying to the third of the ILP Agreed Amount the percentage relating to the performance of the TSR in accordance with the table approved in the plan.
190
Table of Contents
The shares to be delivered on each ILP payment date, based on compliance with the related multiannual TSR target will be conditional, in addition to the requirement that the beneficiary remains in the Group’s employ, with the exceptions included in the plan regulations, upon none of the following circumstances existing in the opinion of the board of directors following a proposal of the remuneration committee, during the period prior to each of the deliveries as a result of actions performed in 2014: (i) poor financial performance of the Group; (ii) breach by the beneficiary of internal regulations, including, in particular, those relating to risks; (iii) material restatement of the Group’s financial statements, except when it is required pursuant to a change in accounting standards; or (iv) significant changes in the Group’s economic capital or risk profile.
Senior managers
Following is a breakdown of the remuneration, in terms of gross salary, maximum bonus amount and in 2014 fair value of the remuneration for participation in the ILP plan, approved for the Bank’s executive vice presidents (*) in 2014 and 2013:
| Number of managers (1) |
Thousands of euros | |||||||||||||||||||||||||||||||||||||||
| Salaries | Other remuneration (3) |
Total | ||||||||||||||||||||||||||||||||||||||
| Fixed | Variable-Immediate payment |
Variable-Deferred payment (2) |
ILP | Total | ||||||||||||||||||||||||||||||||||||
| In cash | In shares | In cash | In shares | |||||||||||||||||||||||||||||||||||||
| 2014 |
27 | 26,211 | 9,990 | 9,990 | 12,422 | 12,422 | 2,264 | 73,299 | 7,493 | (4) | 80,792 | |||||||||||||||||||||||||||||
| 2013 |
28 | 26,040 | 9,521 | 9,521 | 9,588 | 9,588 | — | 64,257 | 8,416 | 72,673 | ||||||||||||||||||||||||||||||
| (*) | Excluding executive directors’ remuneration, which is detailed above. |
| (1) | Persons who at some point in the year occupied the position of executive vice president. The amounts reflect the remuneration for the full year regardless of the number of months in which the position of executive vice president was occupied. |
| (2) | The shareholders at the annual general meetings of March 22, 2013 and March 28, 2014 approved the third and fourth cycles of the deferred conditional variable remuneration plan, whereby payment of a portion of the variable remuneration for 2013 and 2014 will be deferred over three years for it to be paid, where appropriate, in three equal portions, 50% in cash and 50% in Santander shares, provided that the conditions for entitlement to the remuneration are met. The amount of the immediate payment in shares for 2014 relates to 1,514,738 Santander shares and 148,631 Banco Santander (Brasil) S.A. shares (2013: 1,331,781 Santander shares and 165,100 Banco Santander (Brasil) S.A. shares). The shares relating to the amount of the deferred payment in shares are shown in the table below. |
| (3) | Includes other remuneration items such as life insurance premiums totaling €1,290 thousand (2013: €1,499 thousand). |
| (4) | In addition, USD 6.9 million were paid in relation to the extraordinary taxation in the United States due to the change in the pension plans of Banco Santander, S.A. |
The maximum amount of the ILP to which the executive vice presidents are entitled was set by the board of directors at a total of €6,238 thousand (with a fair value of €2,264 thousand). The accrual and amount of the ILP are subject, inter alia, to achievement of the multiannual TSR targets contemplated by the plan. Any ILP payments will be received in full in shares and deferred in thirds (to be received in 2016, 2017 and 2018).
Following is a breakdown of the maximum number of Santander shares that the Bank’s executive vice presidents (excluding executive directors) were entitled to receive at December 31, 2014 and 2013 relating to the deferred portion under the various plans then in force (see note 47 to our consolidated financial statements):
| Maximum number of shares to be delivered |
12/31/14 | 12/31/13 | ||||||
| Deferred conditional delivery plan (2010) |
— | 482,495 | ||||||
| Deferred conditional variable remuneration plan (2011) |
637,995 | 1,480,251 | ||||||
| Deferred conditional variable remuneration plan (2012) |
1,014,196 | 1,660,832 | (1) | |||||
| Deferred conditional variable remuneration plan (2013) |
1,412,164 | 1,341,718 | ||||||
| Deferred conditional variable remuneration plan (2014) |
1,857,841 | (2) | — | |||||
| ILP (2014) |
1,008,398 | — | ||||||
| (1) | For the executives who joined from Banesto, the Banesto shares were converted into Santander shares at €0.633 per share. |
| (2) | In addition, at December 31, 2014 they were entitled to a maximum of 222,946 Banco Santander (Brasil) S.A. shares (the maximum number of shares corresponding to the deferred portion of the 2014 bonus). |
191
Table of Contents
In addition, at December 31, 2013 they were entitled to a maximum of 167,943 Banco Santander (Brasil) S.A. shares and to a maximum of 843,718 options on Banco Santander (Brasil) S.A. shares (343,718 under the share option plan approved in 2011, the exercise of which, subject to the plan’s terms and conditions, commenced in July 2014, plus 500,000 under the share option plan approved in 2013, the exercise of which, subject to the plan’s terms and conditions, may commence in July 2016). In 2014, 51,558 share options under the plan approved in 2011 were exercised and the remainder of these options were cancelled. All other options remained in force at December 31, 2014, in accordance with the terms and conditions of the corresponding plans.
In 2014 and 2013, since the conditions established in the corresponding deferred share-based remuneration schemes for prior years had been met, in addition to the payment of the related cash amounts, the following number of Santander shares was delivered to the executive vice presidents:
| Number of shares delivered |
2014 | 2013 | ||||||
| Third cycle—obligatory investment plan |
— | 275,325 | ||||||
| Deferred conditional delivery plan (2010) |
365,487 | 482,494 | (1) | |||||
| Deferred conditional variable remuneration plan (2011) |
637,996 | 708,375 | (2) | |||||
| Deferred conditional variable remuneration plan (2012) |
507,098 | — | ||||||
| (1) | In addition, 14,705 Banesto shares were delivered. |
| (2) | In addition, 50,159 Banesto shares were delivered. |
As indicated in note 5.c. to our consolidated financial statements, in 2012 the contracts of the members of the Bank’s senior management which provided for defined-benefit pension obligations were amended to convert these obligations into a defined-contribution employee welfare system, which was externalized to Santander Seguros y Reaseguros, Compañía Aseguradora, S.A. The new system grants the senior executives the right to receive a pension benefit upon retirement, regardless of whether or not they are in the Bank’s employ on that date, based on the contributions made to the aforementioned system, and replaces the right to receive a pension supplement which had previously been payable to them upon retirement. The new system expressly excludes any obligation of the Bank to the executives other than the conversion of the previous system into the new employee welfare system, which took place in 2012, and, as the case may be, the annual contributions to be made. In the event of pre-retirement, the senior executives who have not exercised the option described in note 5.c to our consolidated financial statements are entitled to an annual retainer until the date of retirement.
The senior executives’ beginning balance under the new employee welfare system amounted to €287 million. This balance reflects the market value, at the date of conversion of the former pension obligations into the new employee welfare system, of the assets in which the provisions for the respective accrued obligations had been invested. The balance at December 31, 2014 amounted to €296 million (December 31, 2013: €312 million).
The contracts of the senior executives who had not exercised the option referred to in note 5.c. to our consolidated financial statements prior to the conversion of the defined-benefit pension obligations into the current welfare system include a supplementary welfare regime for the contingencies of death (surviving spouse and child benefits) and permanent disability of serving executives.
Additionally, the total sum insured under life and accident insurance policies relating to this group of employees amounted to €154 million at December 31, 2014 (December 31, 2013: €92 million).
Lastly, the net charge to the consolidated income statement amounted to €20 million in 2014 (2013: €19.7 million).
Date of expiration of the current term of office of the directors and the period during which the directors have served in that office:
The period during which the directors have served in their office is shown in the table under Section A of this Item 6.
192
Table of Contents
The date of expiration of the current term of office is shown in the table below:
| Name |
Date of expiration (1) |
|||
| Ana Botín |
1st half 2017 | |||
| José Antonio Álvarez |
1st half 2018 | |||
| Bruce Carnegie-Brown |
1st half 2018 | |||
| Rodrigo Echenique |
1st half 2017 | |||
| Matías R. Inciarte |
1st half 2018 | |||
| Guillermo de la Dehesa |
1st half 2018 | |||
| Javier Botín |
1st half 2016 | |||
| Sheila C. Bair |
1st half 2017 | |||
| Sol Daurella |
1st half 2018 | |||
| Carlos Fernández |
1st half 2018 | |||
| Esther Giménez-Salinas |
1st half 2017 | |||
| Ángel Jado |
1st half 2016 | |||
| Juan R. Inciarte |
1st half 2018 | |||
| Isabel Tocino |
1st half 2016 | |||
| Juan Miguel Villar-Mir |
1st half 2018 | |||
| (1) | Pursuant to the provisions of our Bylaws, one-third of the board will be renewed every year, based on length of service and according to the date and order of their respective appointments. |
At the annual general meeting held on March 27, 2015, our shareholders passed the following resolutions:
| • | To ratify the appointment of Carlos Fernández as a director, which appointment was approved by the board of directors at its meeting of November 25, 2014, and to re-elect him for a term of three years. |
| • | To ratify the appointment of Sol Daurella as a director, which appointment was approved by the board of directors at its meeting of November 25, 2014. |
| • | To ratify the appointment of Bruce Carnegie-Brown as a director, which appointment was approved by the board of directors at its meeting of November 25, 2014. |
| • | To ratify the appointment of José Antonio Álvarez as a director, which appointment was approved by the board of directors at its meeting of November 25, 2014. |
| • | To re-elect for a term of three years the following directors: Juan Rodríguez Inciarte, Matías Rodríguez Inciarte, Juan Miguel Villar-Mir and Guillermo de la Dehesa. |
The basic terms and conditions of the contracts of the executive directors, besides those relating to the remuneration thereof, are the following:
a) Exclusivity and non-competition
Executive directors may not enter into contracts to provide services to other companies or entities except where expressly authorized by the board of directors. In all cases, a duty of non-competition is established with respect to companies and activities similar in nature to those of the Bank and its consolidated Group.
Likewise, the contracts of the executive directors provide for certain prohibitions against competition and the taking of clients, employees and suppliers that may be enforced for two years after the termination thereof for reasons other than retirement, pre-retirement or a breach by the Bank. The compensation to be paid by the Bank for this prohibition against competition is 80% of the fixed remuneration of the corresponding director, payable 40% on termination of the contract and 60% at the end of the two-year period.
b) Code of conduct
There is an obligation to strictly observe the provisions of the Group’s General Code and of the Code of Conduct in the Securities Markets, specifically with respect to rules of confidentiality, professional ethics and conflicts of interest.
193
Table of Contents
c) Pre-retirement and retirement
The contracts of the following executive directors acknowledge their right to pre-retire under the terms stated below when they have not reached retirement age:
| • | Ana Botín shall have the right to pre-retirement in the event of separation for reasons other than her breach or her voluntary retirement prior to reaching the age of 55 . In such case, she shall have the right to an annual allotment equal to the sum of her fixed remuneration and 30% of the average amount of the last variable remunerations of the executive chairman, with a maximum of three variable remunerations. This allotment shall be reduced gradually, by up to 20% in the event of voluntary retirement prior to the age of 60. |
| • | Juan R. Inciarte shall have the right to pre-retirement in the event of separation for reasons other than his breach or voluntary retirement. In such case, he shall have the right to an annual allotment equal to his fixed remuneration. |
| • | José Antonio Álvarez will be entitled to pre-retire in the event of separation for reasons other than his own free will or breach of duty. In such case, he will be entitled to an annual allocation equivalent to the fixed remuneration corresponding to him as a senior executive vice president. |
If Ana Botín, Juan R. Inciarte or José Antonio Álvarez take pre-retirement, they have the right to opt to receive the annual allotments in the form of an annuity or as capital (i.e. in a lump sum), in whole but not in part.
At retirement at legal age (legal age for retirement depends on the number of years worked and the date of birth, and is progressively being increased by Spanish law up to 67 years), the above referred directors will be entitled to the pension rights corresponding to them in the employee welfare system.
The executive directors other than Rodrigo Echenique participate in the defined-contribution employee welfare system created in 2012, which covers the contingencies of retirement, disability and death. The Bank makes annual contributions to the benefit plans for the benefit of the other executive directors, except in the case of Matías R. Inciarte, for whom new contributions are not made. The annual contributions are calculated in proportion to the pensionable bases of the executive directors, and shall continue to be made until they leave the Group or until their retirement within the Group, death or disability (including, if applicable, during pre-retirement). The pensionable base for purposes of the annual contributions is the one indicated above for the calculation of the allotment for pre-retirement (except in the case of José Antonio Álvarez, who during his term of office as CEO, will have a pensionable base equal to the sum of his fixed remuneration as such and 30% of the average of the last three variable remuneration payments), with the amount of the contributions being 55% in the cases of Ana Botín and José Antonio Álvarez and 50% in the case of Juan R. Inciarte.
The employee welfare system is outsourced to Santander Seguros y Reaseguros, Compañía Aseguradora, S.A., and the economic rights of the foregoing directors thereunder belong to them regardless of whether or not they are active in the Bank at the time of their retirement, death or disability. The contracts of these directors do not provide for any severance payment obligation in the case of termination other than as may be required by law.
The contract with Rodrigo Echenique does not provide for any charge to Banco Santander regarding benefits, without prejudice to the pension rights to which Mr. Echenique was entitled prior to his appointment as executive director.
Finally, the contracts of Ana Botín, José Antonio Álvarez and Juan R. Inciarte include a supplemental benefit scheme for the contingencies of death (surviving spouse and child benefits) and permanent disability of serving directors, which gives the widow/widower and any children under the age of 25 in the case of death, or the director in case of disability, the right to a pension supplemental to that which they would be entitled to receive from social security up to an annual maximum amount equal to his or her respective pensionable bases, as indicated above in relation with the pre-retirement. Income to be received from the employee welfare system described above shall be deducted from the amount of the supplemental benefit, and the supplemental pension could reach zero (but not less than zero).
d) Termination
The contracts are for an indefinite term and do not provide for any severance payment obligation in the case of termination other than as may be required by law.
Notwithstanding the foregoing, if the termination of his contract occurs before January 1, 2018 other than due to his own decision, death or permanent disability or to a serious breach of his obligations, Rodrigo Echenique shall have the right to receive a severance payment in the amount of two times his fixed salary.
In the event of termination of her contract by the Bank, Ana Botín must remain permanently available to the Bank for a period of 4 months to ensure a proper transition, during which period she would receive her fixed salary.
194
Table of Contents
e) Insurance
The Group has taken out life insurance policies for the Bank’s directors, who will be entitled to receive benefits if they are declared disabled; in the event of death, the benefits will be payable to their heirs. The premiums paid by the Group are included in the Other remuneration column of the table shown in note 5.a.iii to our consolidated financial statements. Also, the following table provides information on the sums insured for the Bank’s executive directors:
| Insured sum (Thousands of euros) |
||||||||||||
| 2014 | 2013 | Var (%) | ||||||||||
| Ana Botín |
7,500 | 6,000 | 25.00 | % | ||||||||
| Matías R Inciarte |
5,131 | 5,131 | 0.00 | % | ||||||||
| Juan R Inciarte |
2,961 | 2,961 | 0.00 | % | ||||||||
| Emilio Botín |
— | — | — | |||||||||
| Javier Marín |
2,400 | 2,400 | 0.00 | % | ||||||||
| Alfredo Sáenz |
— | — | ||||||||||
|
|
|
|
|
|
|
|||||||
| 17,992 | 16,492 | 9.10 | % | |||||||||
|
|
|
|
|
|
|
|||||||
Additionally, other directors have life insurance policies the cost of which is borne by the Group, the related insured sum being €1.4 million at December 31, 2014 (2013: €1.4 million).
f) Confidentiality and return of documents
A strict duty of confidentiality is established during the relationship and following termination thereof, pursuant to which executive directors must return to the Bank the documents and items related to their activities that are in their possession.
g) Other terms and conditions
The advance notice periods contained in the contracts with the executive directors are as follows:
| Advance notice period | Date of current contract (month/day/year) |
By decision of the Bank (months) |
By decision of the director (months) |
|||||||
| Ana Botín |
01/26/2015 | (*) | (*) | |||||||
| José Antonio Alvarez |
02/23/2015 | (*) | (*) | |||||||
| Matías R. Inciarte |
12/26/2012 | 4 | 4 | |||||||
| Rodrigo Echenique |
01/26/2015 | (*) | (*) | |||||||
| Juan R. Inciarte |
12/26/2012 | 4 | 4 | |||||||
(*) There is no contractual provision in this regard.
In the other cases, payment clauses in place of pre-notice periods are not contemplated.
Audit Committee, Risk Supervision, Regulation and Compliance Committee, Appointments Committee and Remuneration Committee
An audit committee, a risk supervision, regulation and compliance committee, an appointments committee as well as a remuneration committee operate as part of the board of directors.
Audit Committee
The Bank’s audit committee was created in 1986, with significant progress since that time with respect to both its duties and its operation.
The committee is regulated by articles 53 of the Bylaws and 16 of the Rules and Regulations of the Board. In addition, articles 27 and 35 of its Rules and Regulations contain specific provision regarding certain aspects of its activities. The risk supervision, regulation and compliance committee, created in June 2014, has assumed a portion of the duties until then attributed to the audit committee.
The Rules and Regulations of the Board provide that only non-executive directors can be members of this committee with independent directors (as defined in the Rules and Regulations of the Board) having a majority representation. Nevertheless, we have determined that all of the members of our audit committee meet the independence criteria for foreign private issuers set forth in Rule 10A-3 under the Exchange Act. The committee’s chairman must always be an independent director (as defined in the Rules and Regulations of the Board) and someone who has the necessary knowledge and experience in matters of accounting, auditing or risk management. Currently, the chairman of the audit committee is Juan Miguel Villar-Mir, who our board of directors has determined is an “Audit Committee Financial Expert”, as such term is defined in the SEC’s Form 20-F.
The members of the audit committee are appointed by the board of directors, taking into account the directors’ knowledge, aptitude and experience in the areas of accounting and auditing.
195
Table of Contents
Functions of the audit committee:
a) Have its chairman and/or secretary report to the shareholders at the general shareholders’ meeting with respect to matters raised therein by shareholders regarding its powers.
b) Propose the appointment of the auditor, as well as the conditions under which such auditor will be hired, the scope of its professional duties and, if applicable, the revocation or non-renewal of its appointment. The committee shall favor the Group’s auditor also assuming responsibility for auditing the companies making up the Group.
c) Review the accounts of the Company and the Group, monitor compliance with legal requirements and the proper application of generally accepted accounting principles, and report on the proposals for alterations to the accounting principles and standards suggested by management.
d) Supervise the internal audit function, and particularly:
(i) Proposing the selection, appointment and withdrawal of the party responsible for internal audit;
(ii) Reviewing the annual working plan for internal audit, for its subsequent review and approval by the board, and the annual activities report;
(iii) Ensuring the independence and effectiveness of the internal audit function;
(iv) Proposing the budget for this service;
(v) Receiving periodic information regarding the activities thereof; and
(vi) Verifying that senior management takes into account the conclusions and recommendations of its reports.
e) Supervise the process for gathering financial information and for the internal control systems. In particular, the audit committee shall:
(i) Supervise the process of preparing and presenting the regulated financial information relating to the Company and the Group, as well as its integrity, reviewing compliance with regulatory requirements, the proper demarcation of group consolidation and the correct application of accounting standards;
(ii) Supervise the effectiveness of the systems for the internal monitoring, reviewing them periodically, so that the principal risks are identified, managed and properly disclosed; and
(iii) Discuss with the external auditor any significant weaknesses detected in the internal control system during the course of the audit.
f) Serve as a channel of communication between the board and the auditor, assess the results of each audit and the response of the management team to its recommendations, and act as a mediator in the event of disagreement between the board and the auditor regarding the principles and standards to be applied in the preparation of the financial statements. Specifically, it shall endeavor to ensure that the statements ultimately drawn up by the board are submitted to the shareholders at the general shareholders’ meeting without any qualifications or reservations in the auditor’s report.
g) Supervise the fulfilment of the audit contract, endeavoring to ensure that the opinion on the annual financial statements and the main contents of the auditor’s report are set forth in a clear and accurate fashion.
h) Ensure the independence of the auditor, by taking notice of those circumstances or issues that might risk such independence and any others related to the development of the auditing procedure, as well as receive information and maintain such communication with the auditor as is provided for in legislation regarding the auditing of financial statements and in technical auditing regulations. And, specifically, verify the percentage represented by the fees paid for any and all reasons of the total income of the audit firm, and the length of service of the partner who leads the audit team in the provision of such services to the Company. The annual report shall set forth the fees paid to the audit firm, including information relating to fees paid for professional services other than audit work.
In any event, the audit committee should receive annually from the external auditor written confirmation of the latter’s independence versus the Company or institutions directly or indirectly linked to the Company, as well as information on any type of additional services provided to such institutions by the aforementioned auditor or by persons or institutions related to the latter, as stipulated in Royal Legislative Decree 1/2011, of July 1, Spain’s Consolidated Audit Act.
196
Table of Contents
Likewise, prior to the issuing of the external auditor’s report, the committee shall issue annually a report expressing an opinion on the independence of the external auditor. In any event, such report should make a statement as to the providing of the additional services referred to in the preceding paragraph.
i) The committee shall ensure that the Company publicly communicates a change of auditor and accompanies such communication with a declaration regarding the possible existence of disagreements with the outgoing auditor and, if any, regarding the content thereof and, in the event of the resignation of the auditor, the committee shall examine the circumstances causing it.
j) Report to the board, in advance of the adoption by it of the corresponding decisions, regarding:
(i) The financial information that the Company must periodically make public, ensuring that such information is prepared in accordance with the same principles and practices applicable to the annual financial statements.
(ii) The creation or acquisition of equity interests in special purpose entities or entities domiciled in countries or territories that are considered to be tax havens.
k) Know and, if applicable, respond to the initiatives, suggestions or complaints put forward or raised by the shareholders regarding the area of authority of this committee and which are submitted to it by the office of the general secretary of the Company. The committee shall also:
(i) Receive, deal with and keep a record of the claims received by the Bank on matters related to the process for gathering financial information, auditing and internal controls.
(ii) Receive on a confidential and anonymous basis possible communications from Group employees who express their concern on possible questionable practices in the areas of accounting or auditing.
l) Receive information from the person responsible for the Company’s taxation matters on the tax policies applied, at least prior to the drawing-up of the annual accounts and the filing of the Corporate Tax return, and where relevant, on the tax consequences of transactions or matters submitted to the board of directors or the executive committee for approval, unless such bodies have been informed directly, in which case this will be reported to the committee at the first subsequent meeting held by it. The audit committee shall transfer the information received to the board of directors.
m) Evaluate, at least one a year, its operation and the quality of its work.
n) Other duties specifically provided for in the Rules and Regulations of the Board.
The 2015 annual general meeting (held on March 27, 2015) passed a resolution amending, among others, article 53 of the Bylaws in order to confer the audit committee additional functions in accordance with Law 31/2014. Such amendments are subject to the authorization of the Bank of Spain, and once they are in force, the Rules and Regulations of the Board will be amended accordingly.
The Group’s 2014 audit committee report is available on the Group’s website, which does not form part of this annual report on Form 20-F, at www.santander.com under the heading “Information for shareholders and investors—corporate governance—committees’ report”.
The following are the current members of the audit committee:
| Name |
Position | |
| Juan Miguel Villar-Mir | Chairman | |
| Carlos Fernández | Member | |
| Angel Jado | Member | |
| Isabel Tocino | Member | |
Ignacio Benjumea acts as secretary to the audit committee, but is classified as a non-member.
Risk Supervision, Regulation and Compliance Committee
The risk supervision, regulation and compliance committee of the Bank was created in June 2014, with general powers to support and advise the board of directors on risk supervision and control, on the definition of the Group’s risk policies, on relations with supervisory authorities and on regulation and compliance. The committee is regulated by articles 54 bis of the Bylaws and 17 bis of the Rules and Regulations of the Board. The committee has assumed a portion of the duties previously attributed to the audit committee. Article 54 bis will be renumbered as article 54 ter following the entry into force of the Bylaws amendments passed at the 2015 annual general meeting, which are subject to the authorization of the Bank of Spain.
The Rules and Regulations of the Board state that the members of this committee must all be non-executive directors with independent directors having a majority representation including an independent director as chairman.
197
Table of Contents
The members of the risk supervision, regulation and compliance committee are appointed by the board of directors taking into account the directors knowledge, aptitude and experience and the duties of the committee.
Functions of the risk supervision, regulation and compliance committee:
a) Support and advice to the board in defining and assessing risk policies affecting the Group, and in determining the risk appetite and risk strategy.
The Group’s risk policies shall include:
i. The identification of the various types of risk (operational, technological, financial, legal and reputational, among others) that the Group faces, including, among financial and economic risks, contingent liabilities and others which are off-balance sheet;
ii. The setting of the risk appetite that the Group deems acceptable;
iii. The planned measures to mitigate the impact of identified risks, in the event that they materialize; and
iv. The information and internal monitoring systems that will be used to monitor and manage such risks.
b) Assisting the board in monitoring the implementation of the risk strategy.
c) Systematically review exposure to principal customers, economic sectors of activity, geographic areas and risk types.
d) Know and assess the management tools, improvement initiatives, evolution of projects and any other relevant activity relating to the control of risks, including the policy on internal risk models and the internal validation thereof.
e) Support and advice to the board regarding supervisors and regulators in the different countries where the Group operates.
f) Supervise the observance of the general code of conduct, the manuals and procedures for the prevention of money laundering and financing of terrorism and, in general, the rules of governance and compliance program in effect in the Group, and make such proposals as are deemed necessary for the improvement thereof. In particular, the committee shall have the duty to receive information and, if applicable, issue a report on disciplinary measures to be imposed upon members of senior management.
g) Supervision of the Group’s policy and governance and compliance rules and, in particular, of the adoption of actions and measures that result from the reports issued or the inspection proceedings carried out by the administrative authorities of supervision and control.
h) Tracking and evaluation of policy proposals and regulatory changes that may be applicable, and possible consequences for the Group.
i) Report on any proposed amendments to the Rules and Regulations of the Board prior to the approval thereof by the board of directors.
The Group’s 2014 risk supervision, regulation and compliance committee report is available on the Group’s website, which does not form part of this annual report on Form 20-F, at www.santander.com under the heading “Information for shareholders and investors—corporate governance—committees’ report”.
The following are the current members of the risk supervision, regulation and compliance committee:
| Name |
Position | |
| Bruce Carnegie-Brown |
Chairman | |
| Guillermo de la Dehesa |
Member | |
198
Table of Contents
| Angel Jado |
Member | |
| Sheila C. Bair |
Member | |
| Carlos Fernández |
Member | |
| Isabel Tocino |
Member | |
| Juan Miguel Villar-Mir |
Member |
Ignacio Benjumea acts as secretary to the risk supervision, regulation and compliance committee, but is classified as a non-member.
Appointments Committee
Under the provisions of article 54.1 of the Bylaws and article 17.10 of the Rules and Regulations of the Board, at its meeting of October 23, 2014, the board of directors resolved to separate the appointments and remuneration committee into two committees. The appointments committee assumed the duties relating to appointments contained in article 17.4 of the Rules and Regulations of the Board, and the remuneration committee assumed those included in article 17.5 of the Rules and Regulations of the Board, as well as, in both cases, any other duties corresponding thereto under applicable law. The 2015 annual general meeting passed a resolution amending the articles of association (which is subject to the authorization of the Bank of Spain) whereby the appointments and remuneration committees are regulated separately in articles 54 and 54 bis of the Bylaws. Once such amendments become effective, the Rules and Regulations of the Board will be amended accordingly.
The members of the appointments committee are appointed by the board of directors, taking into account the directors’ knowledge, aptitudes and experience and the goals of the committee.
Functions of the appointments committee:
The appointments committee shall have the following duties, and any other provided for in applicable law:
(a) Propose and review the internal criteria and procedures to be followed in order to determine the composition of the board and select those persons who will be proposed to serve as directors, as well as for the continuous evaluation of directors, reporting on such continuous evaluation. In particular, the appointments and remuneration committee:
(i) Shall establish the knowledge and experience necessary for directors, likewise assessing the time and dedication required for appropriately carrying out the position.
(ii) Shall consider potential candidates to fill any vacancies that the directors, where applicable, may propose.
(b) Prepare, by following standards of objectiveness and conformance to the corporate interests, the proposals for appointment, re-election and ratification of directors provided for in section 2 of article 21 of the Rules and Regulations of the Board, as well as the proposals for appointment of the members of each of the committees of the board of directors. Likewise, it shall prepare the proposals for the appointment of positions on the board of directors and its committees.
(c) Annually verify the classification of each director (as executive, proprietary, independent or other) for the purpose of their confirmation or review at the ordinary general shareholders’ meeting and in the annual corporate governance report.
(d) Report on proposals for appointment or withdrawal of the secretary of the board, prior to submission thereof to the board.
(e) Propose and review the internal criteria and procedures for the selection and continuous evaluation of senior executive vice presidents or similar officers and other employees responsible for internal control functions or who hold key positions for the daily carrying-out of banking activity, and to report on their appointment and removal from office and their continuous evaluation.
(f) Ensure compliance by the directors with the duties prescribed in article 30 of the Rules and Regulations of the Board, prepare the reports provided for herein and receive information, and, if applicable, prepare a report on the measures to be adopted with respect to the directors in the event of non-compliance with the abovementioned duties or with the code of conduct of the Group in the securities markets.
199
Table of Contents
(g) Examine the information sent by the directors regarding their other professional obligations and assess whether such obligations might interfere with the dedication required of directors for the effective performance of their work.
(h) Evaluate, at least once a year, its operation and the quality of its work.
(i) Report on the process of evaluation of the board and of the members thereof.
(j) Examine or organize the succession of both the chairman of the board and the chief executive officer and, if appropriate, make proposals to the board of directors in order for that such succession to occur in an orderly and planned way according to the provisions of article 24 of the Rules and Regulations of the Board.
(k) And the others specifically provided for in the Rules and Regulations of the Board.
The Group’s 2014 appointments committee report is available on the Group’s website, which does not form part of this annual report on Form 20-F, at www.santander.com under the heading “Information for shareholders and investors—Corporate governance—Committees report”.
The following are the members of the appointments committee:
| Name |
Position | |
| Bruce Carnegie-Brown |
Chairman | |
| Guillermo de la Dehesa |
Member | |
| Sol Daurella |
Member | |
| Carlos Fernández |
Member | |
| Angel Jado |
Member | |
Ignacio Benjumea acts as secretary to the appointments and remuneration committee but is classified as a non-member.
Remuneration Committee
Under the provisions of article 54.1 of the Bylaws and article 17.10 of the Rules and Regulations of the Board, at its meeting of October 23, 2014, the board of directors resolved to separate the appointments and remuneration committee into two committees. The appointments committee assumed the duties relating to appointments contained in article 17.4 of the Rules and Regulations of the Board, and the remuneration committee assumed those included in article 17.5 of the Rules and Regulations of the Board, as well as, in both cases, any other duties corresponding thereto under applicable law.
The members of the remuneration committee are appointed by the board of directors, taking into account the directors’ knowledge, aptitude and experience and the goals of the committee.
Functions of the remuneration committee:
The remuneration committee shall have the following functions and any other provided for in applicable law:
(a) Propose to the board:
(i) The policy for compensation of directors and the corresponding report, upon the terms of article 29 of the Rules and Regulations of the Board.
(ii) The policy for compensation of the members of senior management.
(iii) The individual compensation of the directors.
(iv) The individual compensation of the executive directors and, if applicable, external directors, for the performance of duties other than those of a mere director, and other terms of their contracts.
(v) The basic terms of the contracts and compensation of the members of senior management.
(vi) The remuneration of those other officers who, while not members of senior management, receive significant compensation, particularly variable compensation, and whose activities may have a significant impact on the assumption of risk by the Group.
200
Table of Contents
(b) Ensure compliance with the policy established by the Group for compensation of the directors and the members of senior management.
(c) Periodically review the compensation programs, assessing the appropriateness and yield thereof and endeavoring to ensure that the compensation of directors shall conform to standards of moderation and correspondence to the earnings of the Group.
(d) Ensure the transparency of such compensation and the inclusion in the annual report and in the annual corporate governance report of information regarding the compensation of directors and, for such purposes, submit to the board any and all information that may be appropriate.
(e) And others specifically provided for in the Rules and Regulations of the Board.
The Group’ s 2014 remuneration committee report is available on the Group’ s website, which does not form part of this annual report on Form 20-F, at www.santander.com under the heading “Information for shareholders and investors—Corporate governance—Committees report.”
The following are the members of the remuneration committee:
| Name |
Position | |
| Bruce Carnegie-Brown |
Chairman | |
| Guillermo de la Dehesa |
Member | |
| Sol Daurella |
Member | |
| Isabel Tocino |
Member | |
| Angel Jado |
Member | |
Ignacio Benjumea acts as secretary to the remuneration committee but is classified as a non-member.
As of December 31, 2014, we had 185,405 employees (as compared to 182,958 in 2013 and 186,763 in 2012) of which 30,153 were employed in Spain (as compared to 32,208 in 2013 and 34,862 in 2012) and 155,252 were employed outside Spain (as compared to 150,750 in 2013 and 151,901 in 2012). The terms and conditions of employment in the non-government-owned banks in Spain are negotiated on an industry-wide basis with the trade unions. This process has historically produced collective agreements binding on all the non-government-owned banks and their employees. The 2011-2014 agreement expired in December 2014 and the new agreement has not been signed as of the date of this annual report. The terms and conditions of employment in many of our subsidiaries outside Spain (including in Argentina, Portugal, Italy, Uruguay, Puerto Rico, Chile, Mexico, Germany, the U.K., Brazil and Poland) are negotiated either directly or indirectly (on an industry-wide basis) with the trade unions.
201
Table of Contents
The table below shows our employees by geographic area:
| Number of employees | ||||||||||||
| 2014 | 2013 | 2012 | ||||||||||
| SPAIN |
30,153 | 32,208 | 34,862 | |||||||||
| LATIN AMERICA |
84,086 | 84,555 | 88,044 | |||||||||
| Argentina |
7,319 | 6,945 | 6,818 | |||||||||
| Brazil |
46,281 | 49,187 | 53,543 | |||||||||
| Chile |
12,087 | 12,217 | 12,336 | |||||||||
| Colombia |
55 | 40 | — | |||||||||
| Mexico |
16,991 | 14,819 | 14,068 | |||||||||
| Peru |
128 | 127 | 66 | |||||||||
| Uruguay |
1,220 | 1,220 | 1,209 | |||||||||
| Venezuela |
— | — | 4 | |||||||||
| EUROPE |
54,515 | 54,456 | 52,209 | |||||||||
| Austria |
389 | 423 | 360 | |||||||||
| Germany |
5,339 | 5,491 | 5,628 | |||||||||
| Belgium |
16 | 22 | 22 | |||||||||
| Finland |
148 | 140 | 146 | |||||||||
| France |
48 | 52 | 48 | |||||||||
| Hungary |
44 | 48 | 37 | |||||||||
| Ireland |
36 | 34 | 21 | |||||||||
| Italy |
747 | 737 | 840 | |||||||||
| Norway |
593 | 557 | 493 | |||||||||
| Poland |
15,363 | 15,689 | 12,625 | |||||||||
| Portugal |
5,829 | 6,029 | 6,105 | |||||||||
| Switzerland |
148 | 148 | 159 | |||||||||
| The Netherlands |
339 | 363 | 360 | |||||||||
| Sweden |
767 | — | — | |||||||||
| United Kingdom |
24,709 | 24,723 | 25,365 | |||||||||
| USA |
16,398 | 11,542 | 11,460 | |||||||||
| ASIA |
189 | 154 | 144 | |||||||||
| Hong Kong |
110 | 93 | 89 | |||||||||
| China |
71 | 45 | 38 | |||||||||
| Japan |
5 | 5 | 6 | |||||||||
| Others |
3 | 11 | 11 | |||||||||
| OTHERS |
64 | 43 | 44 | |||||||||
| Bahamas |
43 | 24 | 24 | |||||||||
| Others |
21 | 19 | 20 | |||||||||
|
|
|
|
|
|
|
|||||||
| Total |
185,405 | 182,958 | 186,763 | |||||||||
In those cases where an employee is working from one country but is technically employed by a Group company located in a different country, we designate that employee as working from his/her country of residence.
202
Table of Contents
The table below shows our employees by type of business:
| Number of employees | ||||||||||||
| 2014 | 2013 | 2012 | ||||||||||
| Retail Banking |
173,670 | 170,971 | 174,764 | |||||||||
| Private Banking, Asset Management and Insurance |
1,131 | 1,795 | 1,881 | |||||||||
| Global Wholesale Banking |
7,481 | 7,165 | 7,027 | |||||||||
| Corporate Activities |
2,633 | 2,398 | 2,374 | |||||||||
| Spain’s Real Estate Run-Off |
490 | 629 | 717 | |||||||||
|
|
|
|
|
|
|
|||||||
| Total |
185,405 | 182,958 | 186,763 | |||||||||
|
|
|
|
|
|
|
|||||||
As of December 31, 2014, we had 7,160 temporary employees (as compared to 6,274 as of December 31, 2013 and 6,875 as of December 31, 2012). In 2014, the average number of temporary employees working for the Group was 6,767 employees.
As of April 15, 2015, the direct, indirect and represented holdings of our current directors were as follows:
| Directors |
Direct Stake | Indirect stake | Represented stake | Total shares | % of Capital stock | |||||||||||||||
| Ana P. Botín (1)(3) |
213,082 | 17,334,286 | — | 17,547,368 | 0.125 | % | ||||||||||||||
| Bruce Carnegie-Brown |
2 | — | — | 2 | 0.000 | % | ||||||||||||||
| Matías R. Inciarte (2) |
1,327,138 | 120,966 | 204,742 | 1,652,846 | 0.012 | % | ||||||||||||||
| Guillermo de la Dehesa |
139 | — | — | 139 | 0.000 | % | ||||||||||||||
| Rodrigo Echenique |
658,758 | 13,594 | — | 672,352 | 0.005 | % | ||||||||||||||
| José Antonio Álvarez |
425,458 | — | 1,240 | 426,698 | 0.003 | % | ||||||||||||||
| Sheila C. Bair |
1,476 | — | — | 1,476 | 0.000 | % | ||||||||||||||
| Javier Botín (1)(3) |
4,793,481 | 51,571,602 | — | 56,365,083 | 0.401 | % | ||||||||||||||
| Sol Daurella |
920 | 270,370 | — | 271,290 | 0.002 | % | ||||||||||||||
| Carlos Fernández |
15,434,451 | — | — | 15,434,451 | 0.110 | % | ||||||||||||||
| Esther Giménez-Salinas |
5,181 | — | — | 5,181 | 0.000 | % | ||||||||||||||
| Ángel Jado |
2,050,000 | 5,100,000 | — | 7,150,000 | 0.051 | % | ||||||||||||||
| Juan R. Inciarte |
1,673,175 | — | — | 1,673,175 | 0.012 | % | ||||||||||||||
| Isabel Tocino |
166,888 | — | — | 166,888 | 0.001 | % | ||||||||||||||
| Juan Miguel Villar-Mir |
1,150 | — | — | 1,150 | 0.000 | % | ||||||||||||||
|
|
|
|
|
|
|
|
|
|
|
|||||||||||
| Total shares |
26,751,299 | 74,410,818 | 205,982 | 101,368,099 | 0.721 | % | ||||||||||||||
|
|
|
|
|
|
|
|
|
|
|
|||||||||||
| (1) | Javier Botín has the right to vote, at the general shareholders’ meeting, 76,776,412 shares owned by the Botín Foundation (0.546% of the share capital), 6,128,787 shares owned by Nueva Azil, S.L. and Latimer Inversiones, S.L. (0.044% of the share capital); 8,636,449 shares owned by Carmen Botín (0.061% of the share capital); 7,835,293 shares owned by Paloma Botín (0.056% of the share capital); 16,873,709 shares owned by Emilio Botín O. (0.120% of the share capital); and 602,532 of the estate of Mr. Emilio Botín (0.004% of the share capital). Additionally, Javier Botín has the right to vote 17,547,368 shares owned by Ana Botín (0.125% of the share capital). |
| (2) | Matías R. Inciarte has the right to vote 204,742 shares owned by two of his children. |
| (3) | Javier Botín is a proprietary non-executive director because on the board of directors he represents the aggregate interests owned by the Botín Foundation, Bafimar, S.L., Cronje, S.L., Puente de San Miguel, S.L.U., Inversiones Zulú, S.L., Latimer Inversiones, S.L., Nueva Azil, S.L., Agropecuaria El Castaño, S.L.U., Bright Sky 2012, S.L., Ana Botín, Carmen Botín, Paloma Botín, Emilio Botin O., Jorge Botín, Javier Botín R., Marta Botín, the estate of Mr. Emilio Botín and his own interest. |
Santander’s capital is comprised of only one class of shares, all of which are ordinary and have the same rights.
As of April 15, 2015, our current executive officers (not directors) referred to above under Section A of this Item 6 as a group beneficially owned, directly or indirectly, 6,444,500 ordinary shares, or 0.046% of our issued and outstanding share capital as of that date. No individual executive officer beneficially owns, directly or indirectly, one percent or more of the outstanding share capital as of that date.
203
Table of Contents
Item 7. Major Shareholders and Related Party Transactions
As of December 31, 2014, to our knowledge no person beneficially owned, directly or indirectly, 5% or more of our shares.
As of December 31, 2014 a total of 1,798,626,636 shares, or 14.29% of our share capital, were held by 1,279 registered holders with registered addresses in the United States and Puerto Rico, including JPMorgan Chase, as depositary of our American Depositary Share Program. These ADSs were held by 18,228 record holders. Since certain of such shares and ADSs are held by nominees, the foregoing figures are not representative of the number of beneficial holders. Our directors and executive officers did not own any ADSs as of December 31, 2014.
To our knowledge, we are not controlled directly or indirectly, by any other corporation, government or any other natural or legal person. We do not know of any arrangements which would result in a change in our control. The Bylaws of Banco Santander provide for only one class of shares (ordinary shares), granting all holders thereof the same rights.
Shareholders’ agreements
In February 2006, three of our directors at that time, together with other shareholders of the Bank, entered into a shareholders’ agreement that was notified to the Bank and to the CNMV. Two of our directors are parties to this agreement as of the date of this annual report. The document witnessing the aforementioned agreement was filed at both the CNMV Registry and the Cantabria Mercantile Registry.
The agreement, which was signed by Emilio Botín, Ana Botín, Emilio Botín O’Shea, Javier Botín, Simancas, S.A., Puente San Miguel, S.A. Puentepumar, S.L., Latimer Inversiones, S.L. and Cronje, S.L. Unipersonal, provides for the syndication of the Bank shares held by the signatories to the agreement or whose voting rights have been granted to them.
The aim of the syndication agreement through the restrictions established on the free transferability of the shares and the regulated exercise of the voting rights inherent thereto is to ensure, at all times, the concerted representation and actions of the syndicate members as shareholders of the Bank, for the purpose of developing a lasting, stable common policy and an effective, unitary presence and representation in the Bank’s corporate bodies.
At any given time, the chair of the syndicate is the person then presiding over the Fundación Botín, currently Javier Botín.
The members of the syndicate undertake to syndicate and pool the voting and other political rights attaching to the syndicated shares, so that these rights may be exercised, and, in general, the syndicate members may act towards the Bank, in a concerted manner, in accordance with the instructions and indications and with the voting criteria and orientation, necessarily unitary, issued by the syndicate. For this purpose, the representation of these shares is attributed to the chair of the syndicate as the common representative of its members.
Except for transactions carried out in favor of other members of the syndicate or in favor of the Fundación Botín, prior authorization must be granted from the syndicate meeting, which may freely approve or refuse permission for the planned transfer.
Banco Santander informed the CNMV on August 3 and November 19, 2012, by means of material fact filings, that it had been officially notified of amendments to this shareholder agreement in respect of the persons subscribing to it.
On October 17, 2013, the Bank filed a significant event with the CNMV updating the holders and distribution of the shares in the syndication to reflect the business reorganization of one of the pact members.
Finally, Banco Santander filed a significant event with the CNMV on October 3, 2014 updating the holders and the distribution of the shares in the syndication, and changing the chair of the syndicate to Javier Botín, present chair of the Fundación Botín, completing this information through a significant event filed on February 6, 2015.
At the date of execution of the agreement, the syndicate comprised a total of 44,396,513 shares of the Bank (0.353% of its share capital at year-end 2014). In addition, as established in clause one of the shareholders’ agreement, the syndication extends, solely with respect to the exercise of the voting rights, to other Bank shares held either directly or indirectly by the signatories, or whose voting rights are assigned to them, in the future. Accordingly, at December 31, 2014, a further 35,100,696 shares (0.279% of share capital) were also included in the syndicate.
204
Table of Contents
Details of the shares currently covered by the syndication are as follows:
Shares covered by the shareholders’ agreement
As of April 15, 2015, the agreement encompassed a total of 73,912,451 Bank shares (0.526% of its share capital), broken down as follows:
| Parties to the shareholder agreement | No. of shares syndicated |
% of total share capital |
||||||
| Estate of Mr. Emilio Botín-Sanz de Sautuola y García de los Ríos |
602,532 | 0.004 | % | |||||
| Ms. Ana Botín-Sanz de Sautuola O’Shea1 |
8,209,707 | 0.058 | % | |||||
| Mr. Emilio Botín-Sanz de Sautuola O’Shea2 |
16,873,709 | 0.120 | % | |||||
| Mr. Francisco Javier Botín-Sanz de Sautuola O’Shea 3 |
16,288,313 | 0.116 | % | |||||
| Ms. Paloma Botín-Sanz de Sautuola O’Shea 4 |
7,835,293 | 0.056 | % | |||||
| Ms. Carmen Botín-Sanz de Sautuola O’Shea |
8,636,449 | 0.061 | % | |||||
| PUENTEPUMAR, S.L. |
— | — | ||||||
| LATIMER INVERSIONES, S.L. 5 |
553,508 | 0.004 | % | |||||
| CRONJE, S.L., Unipersonal |
9,337,661 | 0.066 | % | |||||
| NUEVA AZIL, S.L. |
5,575,279 | 0.040 | % | |||||
| Total |
73,912,451 | 0.526 | % | |||||
| (4) | 7,996,625 shares of Banco Santander S.A. held indirectly through Bafimar, S.L. |
| (5) | 7,800,332 shares of Banco Santander S.A. held indirectly through Puente San Miguel, S.L.U. |
| (6) | 4,652,747 shares of Banco Santander S.A. held indirectly through Inversiones Zulú, S.L. and 6,794,391 shares indirectly through Agropecuaria El Castaño, S.L.U. |
| (7) | 6,628,291 shares of Banco Santander S.A. held indirectly through Bright Sky 2012, S.L. |
| (8) | Bare ownership (ownership without usufruct) of 553,508 shares corresponds to Fundación Botín, but the voting rights are assigned to Latimer Inversiones, S.L. as their beneficial owner. |
In all other respects, the agreement remains unchanged.
The aforementioned significant filings can be found on the Group’s website (www.santander.com).
Loans made to members of our board of directors and to our executive officers
The Group’s direct risk exposure to the Bank’s directors and the guarantees provided for them are detailed below.
| Thousands of euros | ||||||||||||||||||||||||
| 2014 | 2013 | |||||||||||||||||||||||
| Loans and advances |
Guarantees | Total | Loans and credits |
Guarantees | Total | |||||||||||||||||||
| Matías R.Inciarte |
8 | — | 8 | 17 | — | 17 | ||||||||||||||||||
| Juan R.Inciarte |
4,182 | — | 4,182 | 4,734 | — | 4,734 | ||||||||||||||||||
| Rodrigo Echenique |
317 | — | 317 | 650 | — | 650 | ||||||||||||||||||
| Javier Botín |
18 | — | 18 | 22 | — | 22 | ||||||||||||||||||
| Ángel Jado |
1 | — | 1 | 7 | — | 7 | ||||||||||||||||||
| Isabel Tocino |
7 | — | 7 | 20 | — | 20 | ||||||||||||||||||
| Vittorio Corbo |
— | — | — | 4 | — | 4 | ||||||||||||||||||
| Javier Marín |
723 | — | 723 | 707 | — | 707 | ||||||||||||||||||
|
|
|
|
|
|
|
|
|
|
|
|
|
|||||||||||||
| 5,255 | — | 5,255 | 6,161 | — | 6,161 | |||||||||||||||||||
|
|
|
|
|
|
|
|
|
|
|
|
|
|||||||||||||
Additionally, the total amount of loans and credits made by us to our executive officers who are not directors, as of December 31, 2014 amounted to €25 million (see note 53 to our consolidated financial statements).
Loans extended to related parties were made in the ordinary course of business, on substantially the same terms, including interest rates and collateral, as those prevailing at the time for comparable transactions with other persons, and did not involve more than normal risk of collectability or present other unfavorable features.
205
Table of Contents
Loans made to other Related Parties
The companies of the Group engage, on a regular and routine basis, in a number of customary transactions among Group members, including:
| • | overnight call deposits; |
| • | foreign exchange purchases and sales; |
| • | derivative transactions, such as forward purchases and sales; |
| • | money market fund transfers; and |
| • | letters of credit for imports and exports |
and others within the scope of the ordinary course of the banking business, such as loans and other banking services to our shareholders, to employees of all levels, and the associates and the members of the families of all these persons, as well as those other businesses conducted by the companies of the Group. All these transactions are made:
| • | in the ordinary course of business; |
| • | on substantially the same terms, including interest rates and collateral, as those prevailing for comparable transactions with other persons; and |
| • | did not involve more than the normal risk of collectability or other unfavorable features. |
As of December 31, 2014 our loans and credits to associated and jointly controlled entities, amounted to €6,202 million. Those loans and credits represented 0.84% of our total net loans and credits and 7.68% of our total stockholders’ equity as of December 31, 2014.
For more information, see notes 5 and 53 to our consolidated financial statements.
C. Interests of experts and counsel
Not Applicable.
A. Consolidated statements and other financial information
Financial Statements
See Item 18 for our consolidated financial statements.
| (a) | Index to consolidated financial statements of Santander |
206
Table of Contents
Legal Proceedings
Our general policy is to record provisions for tax and legal proceedings in which we assess the chances of loss to be probable and we do not record provisions when the chances of loss are possible or remote. We determine amounts to be provided as our best estimate of the expenditure required to settle the corresponding claim based, among others, on a case-by-case basis based on the analysis and legal opinion of internal and external counsel or by considering the historical average amount of loss of such category of lawsuits.
i. Tax-related litigation
As of the date of this report, the main tax-related proceedings concerning the Group were as follows:
| • | Legal actions filed by Banco Santander (Brasil) S.A. and certain Group companies in Brazil challenging the increase in the rate of Brazilian social contribution tax on net income from 9% to 15% stipulated by Interim Measure 413/2008, ratified by Law 11,727/2008, a provision having been recognized for the amount of the estimated loss. |
| • | Legal actions filed by certain Group companies in Brazil claiming their right to pay the Brazilian social contribution tax on net income at a rate of 8% and 10% from 1994 to 1998. No provision was recognized in connection with the amount considered to be a contingent liability. |
| • | Legal actions filed by Banco Santander Brasil, S.A. (currently Banco Santander (Brasil), S.A.) and other Group entities claiming their right to pay the Brazilian PIS and COFINS social contributions only on the income from the provision of services. In the case of Banco Santander Brasil, S.A., the legal action was declared unwarranted and an appeal was filed at the Federal Regional Court. In September 2007 the Federal Regional Court found in favor of Banco Santander Brasil, S.A., but the Brazilian authorities appealed against the judgment at the Federal Supreme Court. On April 23, 2015, the Federal Supreme Court published its decision holding that it will review the appeal related to PIS and declining to hear the appeal related to COFINS. The Federal Supreme Court’s decision on the PIS appeal is still pending judgment and its decline of the appeal related to COFINS is subject to further appeal. In the case of Banco ABN AMRO Real S.A. (currently Banco Santander (Brasil), S.A.), in March 2007 the court found in its favor, but the Brazilian authorities appealed against the judgment at the Federal Regional Court, which handed down a decision partly upholding the appeal in September 2009. Banco Santander (Brasil), S.A. filed an appeal at the Federal Supreme Court. Law 12,865/2013 established a program of payments or deferrals of certain tax and social security debts, under which any entities that availed themselves of the program and withdrew the legal actions brought by them were exempted from paying late-payment interest. In November 2013 Banco Santander (Brasil) S.A. partially availed itself of this program but only with respect to the legal actions brought by the former Banco ABN AMRO Real S.A. in relation to the period from September 2006 to April 2009, and with respect to other minor actions brought by other entities in its Group. However, the legal actions brought by Banco Santander (Brasil), S.A. and those of Banco ABN AMRO Real S.A. relating to the periods prior to September 2006, for which the estimated loss was provided for, subsist and are pending judgment. |
| • | Banco Santander (Brasil), S.A. and other Group companies in Brazil have appealed against the assessments issued by the Brazilian tax authorities questioning the deduction of loan losses in their income tax returns (IRPJ and CSLL) on the ground that the relevant requirements under the applicable legislation were not met. No provision was recognized in connection with the amount considered to be a contingent liability. |
| • | Banco Santander (Brasil), S.A. and other Group companies in Brazil are involved in several administrative and legal proceedings against various municipalities that demand payment of the Service Tax on certain items of income from transactions not classified as provisions of services. No provision was recognized in connection with the amount considered to be a contingent liability. |
| • | In addition, Banco Santander (Brasil), S.A. and other Group companies in Brazil are involved in several administrative and legal proceedings against the tax authorities in connection with the taxation for social security purposes of certain items which are not considered to be employee remuneration. No provision was recognized in connection with the amount considered to be a contingent liability. |
| • | In December 2008 the Brazilian tax authorities issued an infringement notice against Banco Santander (Brasil), S.A. in relation to income tax (IRPJ and CSLL) for 2002 to 2004. The tax authorities took the view that Banco Santander (Brasil), S.A. did not meet the necessary legal requirements to be able to deduct the goodwill arising on the acquisition of Banespa (currently Banco Santander (Brasil), S.A.). Banco Santander (Brasil) S.A. filed an appeal against the infringement notice at Conselho Administrativo de Recursos Fiscais (CARF), which on October 21, 2011 unanimously decided to render the infringement notice null and void. The tax authorities have filed an appeal against this decision at a higher administrative level (High Chamber |
207
Table of Contents
| of Tax Appeal). In June 2010 the Brazilian tax authorities issued infringement notices in relation to this same matter for 2005 to 2007. Banco Santander (Brasil), S.A. filed an appeal against these procedures at CARF, which was partially upheld on October 8, 2013. This decision has been appealed at the higher instance of CARF. In December 2013 the Brazilian tax authorities issued the infringement notice relating to 2008, the last year for amortization of the goodwill. This infringement notice was appealed by Banco Santander (Brasil), S.A. in the Federal Tax Office, and the Bank had a favorable decision, which has been appealed at CARF by the tax authorities Based on the advice of its external legal counsel and in view of the first decision by CARF, the Group considers that the stance taken by the Brazilian tax authorities is incorrect, that there are sound defense arguments to appeal against the infringement notices and that, accordingly, the risk of incurring a loss is remote. Consequently, no provisions have been recognized in connection with these proceedings because this matter should not affect the consolidated financial statements. |
| • | In May 2003 the Brazilian tax authorities issued separate infringement notices against Santander Distribuidora de Títulos e Valores Mobiliarios Ltda. (DTVM) and Banco Santander Brasil, S.A. (currently Banco Santander (Brasil), S.A.) in relation to the Provisional Tax on Financial Movements (CPMF) with respect to certain transactions carried out by DTVM in the management of its customers’ funds and for the clearing services provided by Banco Santander Brasil, S.A. to DTVM in 2000, 2001 and the first two months of 2002. Both entities filed an appeal against the infringement notices at CARF, with DTVM obtaining a favorable decision and Banco Santander (Brasil) S.A. an unfavorable decision. Both decisions were appealed by the losing parties at the Higher Chamber of CARF, and the appeal relating to Banco Santander (Brasil) S.A. is pending a decision. With respect to DTVM, on August 24, 2012, it was notified of a decision overturning the previous favorable judgment and lodged an appeal at the Higher Chamber of CARF on August 29, 2012. In the opinion of its legal advisors, the Group considers that the tax treatment applied in these transactions was correct. No provision was recognized in the consolidated financial statements in relation to this litigation as it was considered a contingent liability. |
| • | In December 2010 the Brazilian tax authorities issued an infringement notice against Santander Seguros, S.A. (currently Zurich Santander Brasil Seguros e Previdencia S.A.), as the successor by merger to ABN AMRO Brazil Dois Participações, S.A., in relation to income tax (IRPJ and CSL) for 2005. The tax authorities questioned the tax treatment applied to a sale of shares of Real Seguros, S.A. made in that year. The bank filed an appeal against this infringement notice which was upheld in part by CARF, the Federal Union having filed a special appeal. As the former parent of Santander Seguros, S.A. (Brasil), Banco Santander (Brasil) S.A. is liable in the event of any adverse outcome of this proceeding. No provision was recognized in connection with this proceeding as it was considered to be a contingent liability. |
| • | Also, in December 2010, the Brazilian tax authorities issued infringement notices against Banco Santander (Brasil), S.A. in connection with income tax (IRPJ and CSLL), questioning the tax treatment applied to the economic compensation received under the contractual guarantees provided by the sellers of the former Banco Meridional. The bank filed an appeal for reconsideration against this infringement notice. On November 23, 2011, CARF unanimously decided to render null and void an infringement notice relating to 2002 with regard to the same matter, and the decision was declared final in February 2012. The proceedings relating to the 2003 to 2006 fiscal years are still in progress although, based on the advice of its external legal counsel, the Group considers that the risk of incurring a loss is remote. |
| • | In June 2013, the Brazilian tax authorities issued an infringement notice against Banco Santander (Brasil), S.A. as the party liable for tax on the capital gain allegedly obtained in Brazil by Sterrebeeck B.V., an entity not resident in Brazil, as a result of the “incorporação de ações” (merger of shares) transaction carried out in August 2008. As a result of the aforementioned transaction, Banco Santander (Brasil), S.A. acquired all of the shares of Banco ABN AMRO Real, S.A. and ABN AMRO Brasil Dois Participações, S.A. through the delivery to these entities’ shareholders of newly issued shares of Banco Santander (Brasil), S.A., issued in a capital increase carried out for that purpose. The Brazilian tax authorities take the view that in the aforementioned transaction Sterrebeeck B.V. obtained income subject to tax in Brazil consisting of the difference between the issue value of the shares of Banco Santander (Brasil), S.A. that were received and the acquisition cost of the shares delivered in the exchange. In December 2014 the Group filed an appeal against the infringement notice at CARF after the appeal for reconsideration lodged at the Federal Tax Office was dismissed. Based on the advice of its external legal counsel, the Group considers that the stance taken by the Brazilian tax authorities is incorrect and that there are sound defense arguments to appeal against the infringement notice. Accordingly, the risk of incurring a loss is remote. Consequently, the Group has not recognized any provisions in connection with these proceedings because this matter should not affect the consolidated financial statements. |
| • | In November 2014 the Brazilian tax authorities issued an infringement notice against Banco Santander (Brasil), S.A. in relation to income tax (IRPJ and CSLL) for 2009 questioning legitimacy of deducting the amortization of the goodwill of Banco ABN AMRO Real S.A., which took place prior to the absorption of this bank by Banco Santander (Brasil), S.A., but accepting the amortization performed prior to the merger. |
208
Table of Contents
| On the advice of its external legal counsel, Banco Santander (Brasil), S.A. has filed an appeal against this decision at the Federal Tax Office. No provision was recognized in connection with this proceeding as it was considered to be a contingent liability. Banco Santander (Brasil), S.A. has also appealed against infringement notices issued by the tax authorities questioning the tax deductibility of the amortization of the goodwill arising on the acquisition of Banco Sudameris. No provision has been recognized related to this matter as it is considered to be a contingent liability. |
| • | Legal action brought by Sovereign Bancorp, Inc. (currently Santander Holdings USA, Inc.) claiming its right to take a foreign tax credit in connection with taxes paid outside the United States in fiscal years 2003 to 2005 in relation to financing transactions carried out with an international bank. Santander Holdings USA Inc. considers that, in accordance with applicable tax legislation, it is entitled to recognize the aforementioned tax credits as well as the related issuance and financing costs. In addition, if the outcome of this legal action is favorable to the interests of Santander Holdings USA, Inc., the amounts paid over by the entity in relation to this matter with respect to 2006 and 2007 would have to be refunded. In 2013 the U.S. courts found against two taxpayers in cases with a similar structure. In the case of Santander Holdings USA, Inc. the proceeding was scheduled for October 7, 2013, although it was adjourned indefinitely when the judge found in favor of Santander Holdings USA, Inc. with respect to one of the main grounds of the case. Santander Holdings USA, Inc. expects the judge to rule on whether his previous decision will result in the proceedings being stayed in the case or whether other matters need to be analyzed before a final decision may be handed down. If the decision is favorable to Santander Holdings USA, Inc.’s interests, the U.S. government has stated its intention to appeal. The estimated loss relating to this proceeding was provided for. |
| • | The Santander UK group has proactively engaged with HM Revenue & Customs to resolve a number of outstanding legacy tax matters. It has not however been possible to satisfactorily resolve all of these matters and as a result litigation proceedings have commenced in relation to a small number of remaining issues. All of these items relate to periods prior to Santander UK’s adoption of the Code of Practice on Taxation for Banks in 2010. A provision for the full amount of tax in dispute has been made through the tax charge in previous years. |
At the date of approval of this annual report on Form 20-F certain other less significant tax-related proceedings were also in progress.
ii. Non-tax-related proceedings
As of the date of this report, the main non-tax-related proceedings concerning the Group were as follows:
| • | Customer remediation: claims associated with the sale by Santander UK of certain financial products (principally payment protection insurance or PPI) to its customers. |
Payment protection insurance is a U.K. insurance product offering payment protection on unsecured personal loans (and credit cards). The product was sold by all U.K. banks. The mis-selling issues are predominantly related to business written before 2009. The nature and profitability of the product has changed materially since 2008.
On July 1, 2008, the U.K. Financial Ombudsman Service (“FOS”) referred concerns regarding the handling of PPI complaints to the U.K. Financial Services Authority (“FSA”). On September 29, 2009 and March 9, 2010, the FSA issued consultation papers on PPI complaints handling as an issue of wider implication. The FSA published its Policy Statement on August 10, 2010, setting out the evidence and guidance on the fair assessment of a complaint and the calculation of redress, as well as a requirement for firms to reassess historically rejected complaints which had to be implemented by December 1, 2010.
On October 8, 2010, the British Bankers’ Association (“BBA”), the principal trade association for the U.K. banking and financial services sector, filed on behalf of certain financial institutions (which did not include Santander UK plc) an application for permission to seek judicial review against the FSA and the FOS. The BBA sought an order quashing the FSA Policy Statement and an order quashing the decision of the FOS to determine PPI sales in accordance with the guidance published on its website in November 2008. The judicial review was heard in the courts in January 2011 and on April 20, 2011 judgment was handed down by the High Court dismissing the proceeding brought by the BBA.
Santander UK did not participate in the legal action undertaken by other U.K. banks and had been consistently making provisions and settling claims with regards to PPI complaints liabilities.
209
Table of Contents
The following table shows information on the total claims received up to December 31, 2014 and the resolution thereof:
| (number of claims, in thousands) |
||||||||||||
| 2014 | 2013 | 2012 | ||||||||||
| Claims outstanding at the beginning of the period |
14 | 31 | 1 | |||||||||
| Claims received (1) |
246 | 363 | 437 | |||||||||
| Claims rejected as being invalid(2) |
(194 | ) | (298 | ) | (258 | ) | ||||||
| Resolved claims |
(46 | ) | (82 | ) | (149 | ) | ||||||
|
|
|
|
|
|
|
|||||||
| Claims outstanding at the end of the period |
19 | 14 | 31 | |||||||||
|
|
|
|
|
|
|
|||||||
| (1) | Includes rejected claims relating to customers that had never purchased payment protection insurance from Santander UK. |
| (2) | Customers are entitled to appeal to the Financial Ombudsman Service (FOS) if their claims are rejected. The FOS may uphold or reject an appeal and if an appeal is upheld, Santander UK is required to compensate the customer. The table shows the result of appeals relating to paid or rejected claims. |
At December 31, 2014, the provision recognized in connection with the claims above totaled GBP 129 million.
In 2014, the number of claims received declined compared to previous years but it is expected that claims will continue to be received for a longer period than initially envisaged and, accordingly the provisions have been increased by GBP 95 million. The monthly cost associated with these claims fell to GBP 11 million compared to a monthly average of GBP 18 million in 2013 and of GBP 26 million in 2012. The percentage of claims rejected as being invalid continues to be high.
The provision recognized at the end of 2014 represents the best estimate by Group management, taking into account the opinion of its advisers and of the costs to be incurred in relation to any compensation that may result from the redress measures associated with the sales of payment protection insurance (PPI) in the UK. The provision was calculated on the basis of the following key assumptions resulting from judgments made by management:
| • | Volume of claims- estimated number of claims; |
| • | Percentage of claims lost- estimated percentage of claims that are or will be in the customers’ favor; and |
| • | Average cost-estimated payment to be made to customers, including compensation for direct loss plus interest. |
These assumptions were based on the following information:
| • | A complete analysis of the causes of the claim, the probability of success, as well as the possibility that this probability could change in the future; |
| • | Activity recorded with respect to the number of claims received; |
| • | Level of compensation paid to customers, together with a projection of the probability that this level could change in the future; |
| • | Impact on the level of claims in the event of proactive initiatives carried out by the Group through direct contact with customers; and |
| • | Impact of the media coverage. |
These assumptions are reviewed, updated and validated on a regular basis using the latest available information, such as, the number of claims received, the percentage of claims lost, the potential impact of any change in that percentage, etc. and any new evaluation of the estimated population.
210
Table of Contents
The most relevant factor for calculating the balance of the provision is the number of claims received as well as the expected level of future claims. The percentage of claims lost is calculated on the basis of the analysis of the sale process. The average cost of compensation is calculated in a reasonable manner as the Group manages a high volume of claims and the related population is homogenous. Group management reviews the provision required at each relevant date, taking into account the latest available information on the aforementioned assumptions as well as past experience.
| • | After the Madrid Provincial Appellate Court had rendered null and void the award handed down in the previous arbitration proceeding, on September 8, 2011, Banco Santander, S.A. filed a new request for arbitration with the Spanish Arbitration Court against Delforca 2008, Sociedad de Valores, S.A. (formerly Gaesco Bolsa Sociedad de Valores, S.A.), claiming €66 million that the latter owes it as a result of the declaration on January 4, 2008 of the early termination by the Bank of all the financial transactions agreed upon between the parties. |
On August 3, 2012, Delforca 2008, S.A. was declared to be in a position of voluntary insolvency by Barcelona Commercial Court no. 10, which had agreed as part of the insolvency proceeding to stay the arbitration proceeding and the effects of the arbitration agreement entered into by Banco Santander, S.A. and Delforca 2008, S.A. The Bank filed an appeal against this decision, which was dismissed and it then proceeded to prepare a challenge with a view to filing a future appeal. The Arbitration Court, in compliance with the decision of the Commercial Court, agreed on January 20, 2013 to stay the arbitration proceedings at the stage reached at that date until a decision could be reached in this respect in the insolvency proceeding.
In addition, as part of the insolvency proceeding of Delforca 2008, S.A., Banco Santander, S.A. notified its claim against the insolvent party with a view to having the claim recognized as a contingent ordinary claim without specified amount. However, the insolvency manager opted to exclude Banco Santander, S.A.’s claim from the provisional list of creditors and, accordingly, Banco Santander, S.A. filed an ancillary claim, which was dismissed by a Court decision on February 17, 2015. Banco Santander, S.A. has duly contested the decision with a view to lodging a future appeal.
As part of the same insolvency proceeding, Delforca 2008, S.A. has filed another ancillary claim requesting the termination of the arbitration agreement included in the framework financial transactions agreement entered into by that party and Banco Santander, S.A. in 1998, as well as the termination of the obligation that allegedly binds the insolvent party to the High Council of Chambers of Commerce (Spanish Arbitration Court). This claim has been upheld in full by the Court. Banco Santander, S.A. has contested the judgment with a view to lodging a future appeal.
On December 30, 2013, Banco Santander filed a complaint requesting the termination of the insolvency proceeding of Delforca 2008, S.A. due to supervening disappearance of the alleged insolvency of the company. The complaint was dismissed by the decision of June 30, 2014 against which the Bank proceeded to prepare a challenge with a view to filing a future appeal.
In addition, in April 2009 Mobiliaria Monesa, S.A. (parent of Delforca 2008, S.A.) filed a claim against Banco Santander, S.A. at Santander Court of First Instance no. 5, claiming damages which it says it incurred as a result of the (in its opinion) unwarranted claim filed by the Bank against its subsidiary, reproducing the same objections as Delforca 2008, S.A. This proceeding has currently been stayed on preliminary civil ruling grounds, against which Mobilaria Monesa, S.A. filed an appeal which was dismissed by the Cantabria Provincial Appellate Court in a judgment dated January 16, 2014.
Lastly, on April 11, 2012, Banco Santander, S.A. was notified of the claim filed by Delforca 2008, S.A., heard by Madrid Court of First Instance no. 21, in which it sought indemnification for the damage and losses it alleges it incurred due to the (in its opinion) unwarranted claim by the Bank. Delforca 2008, S.A. made the request in a counterclaim filed in the arbitration proceeding that concluded with the annulled award, putting the figure at up to €218 million. The aforementioned Court has dismissed the motion for declinatory exception proposed by Banco Santander, S.A. as the matter has been referred for arbitration. This decision was upheld in an appeal at the Madrid Provincial Appellate Court in a judgment dated May 27, 2014. The Group considers that the risk of loss arising as a result of these matters is remote and, accordingly, it has not recognized any provisions in connection with these proceedings.
| • | Former employees of Banco do Estado de São Paulo S.A., Santander Banespa, Cia. de Arrendamiento Mercantil: a claim was filed in 1998 by the association of retired Banespa employees (AFABESP) on behalf of its members, requesting the payment of a half-yearly bonus initially envisaged in the entity’s Bylaws in the |
211
Table of Contents
| event that the entity obtained a profit and that the distribution of this profit were approved by the board of directors. The bonus was not paid in 1994 and 1995 since the bank did not make a profit and partial payments were made from 1996 to 2000, as agreed by the board of directors, and the relevant clause was eliminated in 2001. The Regional Employment Court ordered the bank to pay this half-yearly bonus in September 2005 and the bank filed an appeal against the decision at the High Employment Court (“TST”) and, subsequently, at the Federal Supreme Court (“STF”). The TST confirmed the judgment against the bank, whereas the STF rejected the extraordinary appeal filed by the bank in a decision adopted by only one of the Court members, thereby also upholding the order issued to the bank. This decision was appealed by the bank and the association. Only the appeal lodged by the bank has been given leave to proceed and will be decided upon by the STF in plenary session. |
| • | “Planos economicos”: Like the rest of the banking system, Santander Brazil has been the subject of claims from customers, mostly depositors, and of class actions brought for a common reason, arising from a series of legislative changes relating to the calculation of inflation (“planos economicos”). The claimants considered that their vested rights had been impaired due to the immediate application of these adjustments. In April 2010, the High Court of Justice (“STJ”) set the limitation period for these class actions at five years, as claimed by the banks, rather than twenty years, as sought by the claimants, which will probably significantly reduce the number of actions brought and the amounts claimed in this connection. As regards the substance of the matter, the decisions issued to date have been adverse for the banks, although two proceedings have been brought at the STJ and the Supreme Federal Court (“STF”) with which the matter is expected to be definitively settled. In August 2010, STJ handed down a decision finding for the plaintiffs in terms of substance, but excluding one of the “planos” from the claim, thereby reducing the amount thereof, and once again confirming the five-year statute of limitations period. Shortly thereafter, the STF issued an injunctive relief order whereby the proceedings in progress were stayed until this court issues a final decision on the matter. |
| • | Proceeding under Criminal Procedure Law (case no. 1043/2009) conducted at Madrid Court of First Instance no. 26, following a claim brought by Banco Occidental de Descuento, Banco Universal, C.A. against the Bank for USD 150 million in principal plus USD 4.7 million in interest, upon alleged termination of an escrow contract. |
The court upheld the claim but did not make a specific pronouncement on costs. A judgment handed down by the Madrid Provincial Appellate Court on October 9, 2012 upheld the appeal lodged by the Bank and dismissed the appeal lodged by Banco Occidental de Descuento, Banco Universal, C.A., dismissing the claim. The dismissal of the claim was confirmed in an ancillary order to the judgment dated December 28, 2012. An appeal was filed at the Supreme Court by Banco Occidental de Descuento against the Madrid Provincial Appellate Court decision. The appeal was dismissed in a Supreme Court judgment dated October 24, 2014. Banco Occidental de Descuento has filed a motion for annulment against the aforementioned judgment which has not yet been granted leave to proceed. The Bank has challenged the appeal. The Bank has not recognized any provisions in this connection.
| • | On January 26, 2011, notice was served on the Bank of an ancillary insolvency claim to annul acts detrimental to the assets available to creditors as part of the voluntary insolvency proceedings of Mediterráneo Hispa Group, S.A. at Murcia Commercial Court no. 2. The aim of the principal action is to request annulment of the application of the proceeds obtained by the company undergoing insolvency from an asset sale and purchase transaction involving €32 million in principal and €2.7 million in interest. On November 24, 2011, the hearing was held with the examination of the proposed evidence. Upon completion of the hearing, it was resolved to conduct a final proceeding. The Court dismissed the claim in full in a judgment dated November 13, 2013. The judgment was confirmed at appeal by the Murcia Provincial Appellate Court in a judgment dated July 10, 2014. The insolvency managers have filed a cassation and extraordinary appeal against procedural infringements against the aforementioned judgment. |
| • | The bankruptcy of various Lehman Group companies was made public on September 15, 2008. Various customers of Santander Group were affected by this situation since they had invested in securities issued by Lehman or in other products which had such assets as their underlying. |
At the date of this annual report, certain claims had been filed in relation to this matter. The Bank’s directors and its legal advisers consider that the various Lehman products were sold in accordance with the applicable legal regulations in force at the time of each sale or subscription and that the fact that the Group acted as intermediary would not give rise to any liability for it in relation to the insolvency of Lehman. Accordingly, the risk of loss is considered to be remote and, as a result, the Group has not recognized any provisions relating to this matter.
212
Table of Contents
| • | The intervention, on the grounds of alleged fraud, of Bernard L. Madoff Investment Securities LLC (“Madoff Securities”) by the U.S. Securities and Exchange Commission (“SEC”) took place in December 2008. The exposure of customers of the Group through the Optimal Strategic US Equity (“Optimal Strategic”) subfund was €2,330 million, of which €2,010 million related to institutional investors and international private banking customers, and the remaining €320 million made up the investment portfolios of the Group’s private banking customers in Spain, who were qualifying investors. |
At the date of this annual report, certain claims had been filed in relation to this matter. The Group considers that it has at all times exercised due diligence and that these products have always been sold in a transparent way pursuant to applicable legislation and established procedures. Therefore, the risk of loss is considered to be remote or non-material.
| • | At the end of the first quarter of 2013, news stories were published stating that the public sector was debating the validity of the interest rate swaps arranged between various financial institutions and public sector companies in Portugal, particularly in the public transport industry. |
The swaps under debate included swaps arranged by Banco Santander Totta with the public companies Metropolitano de Lisboa, E.P.E. (MdL), Metro de Porto, S.A. (MdP), Sociedade de Transportes Colectivos do Porto, S.A. (STCP) and Companhia Carris de Ferro de Lisboa, S.A. (Carris). These swaps were arranged prior to 2008, i.e. before the start of the financial crisis, and had been executed without incident.
In view of this situation Banco Santander Totta took the initiative to request a court judgment on the validity of the swaps in the jurisdiction of the United Kingdom to which the swaps are subject. The corresponding claims were filed in May 2013.
After the Bank had filed the claims, the four companies (MdL, MdP, STCP and Carris) notified Banco Santander Totta that they were suspending payment of the amounts owed under the swaps until a final decision had been handed down in the U.K. jurisdiction in the proceedings. MdL, MdP and Carris suspended payment in September 2013 and STCP did the same in December 2013.
Consequently, Banco Santander Totta extended each of the claims to include the unpaid amounts.
On November 29, 2013, the companies presented their defense in which they claimed that the swaps were null and void under Portuguese law and, accordingly, that they should be refunded the amounts paid. On February 14, 2014, Banco Santander Totta, S.A. answered the counterclaim, maintaining its arguments and rejecting the opposing arguments in its documents dated November 29, 2013.
On April 4, 2014, the companies issued their replies to the Bank’s documents. The preliminary hearing took place on May 16, 2014. The documentation analysis stage has been in progress since December 2014. These proceedings are still in progress.
Banco Santander Totta, S.A. and its legal advisers consider that the entity acted at all times in accordance with applicable legislation and under the terms of the swaps, and take the view that the U.K. courts will confirm the full validity and effectiveness of the swaps. As a result, the Group has not recognized any provisions in this connection.
| • | Most of the German banking industry has been affected by two German Supreme Court decisions in 2014 in relation to processing fees in consumer loan agreements. |
In May 2014 the German Supreme Court held processing fees in loan agreements to be null and void. The Court subsequently handed down a ruling at the end of October 2014 extending from three to ten years the statute of limitation period on claims relating to old transactions. Therefore, any claims relating to processing fees paid between 2004 and 2011 become statute-barred in 2014. This situation gave rise to numerous claims at the end of 2014 which have affected the income statements of banks in Germany.
Santander Consumer Bank AG stopped including these processing fees in agreements from January 1, 2013 and ceased charging these fees definitively at that date, i.e. before the Supreme Court handed down its judgment on the issue.
In 2014 Santander Consumer Bank AG recognized provisions totaling approximately €455 million to cover the estimated cost of the claims relating to processing fees, considering both the claims already received and the estimated claims that may be received in 2015 relating to fees paid in 2012; no new claims are expected to be received for fees paid earlier than 2012 since they are statute-barred.
213
Table of Contents
The Bank and the other Group companies are subject to claims and, therefore, are party to certain legal proceedings incidental to the normal course of their business (including those in connection with lending activities, relationships with employees and other commercial or tax matters).
In this context, it must be considered that the outcome of court proceedings is uncertain, particularly in the case of claims for large or indeterminate amounts, those based on legal issues for which there are no precedents, those that affect a large number of parties or those at a very preliminary stage.
With the information available to it, the Group considers that at December 31, 2014, 2013 and 2012, it had reliably estimated the obligations associated with each proceeding and had recognized, where necessary, sufficient provisions to cover reasonably any liabilities that may arise as a result of these tax and legal situations. It also believes that any liability arising from such claims and proceedings will not have, overall, a material adverse effect on the Group’s business, financial position or results of operations.
In view of the inherent difficulty of predicting the outcome of legal matters, particularly where the claimants seek very large or indeterminate damages, or where the cases present novel legal theories, involve a large number of parties or are in early stages of discovery, the Group cannot state with confidence what the eventual outcome of any of these pending matters will be, what the timing of the ultimate resolution of such matters will be or what the eventual loss, fines or penalties related to each such pending matter may be. Consequently, there is no assurance that the ultimate resolution of these matters will not significantly exceed the reserves currently accrued by the Group; and the outcome of a particular matter may be material to the Group’s operating results for a particular period, depending upon, among other factors, the size of the loss or liability imposed and the level of the Group’s income for that period.
Shareholders remuneration
The table below sets forth the historical per share and per ADS (each of which represents the right to receive one of our shares) amounts of interim and total remuneration in respect of each fiscal year indicated, distributed quarterly.
| Euro per Share | Dollars per ADS | |||||||||||||||||||||||||||||||||||||||
| First | Second | Third | Fourth | Total | First | Second | Third | Fourth | Total | |||||||||||||||||||||||||||||||
| 2008 |
0.14 | 0.14 | 0.12 | 0.26 | 0.65 | 0.17 | 0.14 | 0.13 | 0.27 | 0.70 | ||||||||||||||||||||||||||||||
| 2009 |
0.14 | 0.12 | 0.12 | 0.22 | 0.60 | 0.16 | 0.14 | 0.14 | 0.24 | 0.67 | ||||||||||||||||||||||||||||||
| 2010 |
0.14 | 0.12 | 0.12 | 0.23 | 0.60 | 0.14 | 0.13 | 0.13 | 0.25 | 0.65 | ||||||||||||||||||||||||||||||
| 2011 |
0.14 | 0.13 | 0.12 | 0.22 | 0.60 | 0.15 | 0.14 | 0.12 | 0.23 | 0.64 | ||||||||||||||||||||||||||||||
| 2012 |
0.15 | 0.15 | 0.15 | 0.15 | 0.60 | 0.14 | 0.19 | 0.21 | 0.21 | 0.75 | ||||||||||||||||||||||||||||||
| 2013 |
0.15 | 0.15 | 0.15 | 0.15 | 0.60 | 0.15 | 0.15 | 0.16 | 0.21 | 0.67 | ||||||||||||||||||||||||||||||
| 2014(*) |
0.15 | 0.15 | 0.15 | 0.15 | 0.60 | 0.16 | 0.16 | 0.15 | 0.13 | 0.67 | ||||||||||||||||||||||||||||||
| (*) | As of the date of this annual report on Form 20-F, the fourth dividend has not yet been paid. |
The shareholders at the annual shareholders’ meeting held on June 19, 2009 approved a remuneration scheme (scrip dividend), whereby the Bank offered the shareholders the possibility to opt to receive an amount equivalent to the dividends in cash or new shares. The remuneration per share approved in subsequent annual shareholders’ meetings for 2009, 2010, 2011, 2012, 2013 and 2014 disclosed above, €0.60, is calculated assuming that the four payments for these years (either cash dividends or scrip dividends) were made in cash.
Banco Santander paid on account of 2014:
| • | A scrip dividend of €0.15 per share equivalent to the first interim dividend (August 2014); |
| • | A scrip dividend of €0.15 per share equivalent to the second interim dividend (November 2014); |
| • | A scrip dividend of €0.15 per share equivalent to the third interim dividend (February 2015); and |
| • | A scrip dividend of €0.15 per share equivalent to the fourth dividend approved at the annual general shareholders’ meeting held on March 27, 2015 (to be paid in May 2015). |
Following the increase of capital of the third interim dividend, the Bank’s share capital at the date of this annual report on Form 20-F was €7,030,292,943 represented by 14,060,585,886 shares, par value €0.50 each.
214
Table of Contents
Banco Santander assigned €7,725 million to dividends in 2014, 14.0% more than in 2013.
On January 8, 2015, an extraordinary meeting of the board of directors took place to reformulate the dividend policy of Banco Santander to take effect with the first dividend to be paid with respect to our 2015 results, in order to distribute 3 cash dividends and a scrip dividend relating to such 2015 results. Each of these dividends will have an estimated amount of 5 euro cents.
For a discussion of regulatory and legal restrictions on our payments of dividends, see “Item 4. Information on the Company—B. Business Overview—Supervision and Regulation—Restrictions on Dividends” herein.
For a discussion of Spanish taxation of dividends, see “Item 10. Additional Information—E. Taxation—Spanish tax considerations—Taxation of dividends” herein.
The dividends paid on the guaranteed non-cumulative preference stock of certain of our subsidiaries are limited by our Distributable Profits in the fiscal year preceding a dividend payment. “Distributable Profits” with respect to any year means our reported net profits after tax and extraordinary items for such year as derived from the Parent bank’s non-consolidated audited profit and loss account prepared in accordance with Bank of Spain requirements and guidelines in effect at the time of such preparation. Such requirements and guidelines may be expected to reflect the Bank of Spain regulatory policies applicable to us, including without limitation those relating to the maintenance of minimum levels of capital. See “Item 4. Information on the Company—B. Business Overview—Supervision and Regulation—Capital Adequacy Requirements” and “—Restrictions on Dividends” herein. According to our interpretation of the relevant Bank of Spain requirements and guidelines, Distributable Profits during the preceding five years were:
| Year Ended December 31, | ||||||||||||||||||
| IFRS-IASB | ||||||||||||||||||
| 2010 | 2011 | 2012 | 2013 | 2014 | ||||||||||||||
| (in millions of euros) | ||||||||||||||||||
| 3,332 | 2,151 | 1,355 | 1,030 | 1,435 | ||||||||||||||
The portion of our net income attributable to our subsidiaries has increased steadily in recent years as our subsidiaries have grown and we have acquired new subsidiaries. Such profits are available to us only in the form of dividends from our subsidiaries and we are dependent to a certain extent upon such dividends in order to have Distributable Profits sufficient to allow payment of dividends on our guaranteed preferred stock of our subsidiaries as well as dividends on our shares (although the payment of dividends on the shares is limited in the event of the non-payment of preference share dividends). We generally control a sufficient proportion of our consolidated subsidiaries’ voting capital to enable us to require such subsidiaries to pay dividends to the extent permitted under the applicable law. As a result of our growth, the Bank, as the holding entity of the shares of our various companies, has added investments in our subsidiaries, the financial costs of which are borne by us.
On April 28, 2015 we published our first quarter 2015 results, which are available on our website at www.santander.com under the heading “Investor Relations”, and will be furnished promptly to the SEC on Form 6-K. The information contained on, or that can be accessed through, our website does not form part of this annual report on Form 20-F.
Market Price and Volume Information
Santander’s Shares
In 2014, Santander was the most actively traded stock on the Spanish stock exchange. As at December 31, 2014, the stock had an 18.37% weighting in the IBEX 35 Index and was ranked first among all Spanish issuers represented in this index. Santander’s stock weighting in the Euro Stoxx 50 was, at year end, 4.43%, placing it in fourth position. Our market capitalization of €88,041 million at 2014 year-end was the largest bank in the eurozone by market capitalization and the 11th in the world in 2014.
215
Table of Contents
At December 31, 2014 a total of 1,798,626,636 shares, or 14.29% of our share capital, were held by 1,279 registered holders with registered addresses in the United States and Puerto Rico, including JPMorgan Chase, as depositary of our American Depositary Share Program.
Our shares are traded on Spain’s automated “continuous market”, the national, centralized market which integrates the four Spanish stock exchanges (Madrid, Barcelona, Valencia and Bilbao). Our shares are also listed on the New York (in the form of American Depositary Shares), London (in the form of CREST Depository Interests), São Paulo (in the form of Brazil Depositary Shares), Milan, Lisbon, Buenos Aires, Warsaw and Mexico stock exchanges. At December 31, 2014, 55.74% of our shares were held of record by non-residents of Spain.
The table below sets forth the high and low of the daily closing prices and last daily sales prices in euros for our shares on the Spanish continuous market for the periods indicated.
| Euros per Share | ||||||||||||
| High | Low | Last | ||||||||||
| 2010 Annual |
11.98 | 7.30 | 7.93 | |||||||||
| 2011 Annual |
9.32 | 5.13 | 5.87 | |||||||||
| 2012 Annual |
6.68 | 4.04 | 6.10 | |||||||||
| 2013 Annual |
6.77 | 4.84 | 6.51 | |||||||||
| First Quarter |
6.62 | 5.23 | 5.24 | |||||||||
| Second Quarter |
5.63 | 4.84 | 4.90 | |||||||||
| Third Quarter |
6.08 | 4.87 | 6.03 | |||||||||
| Fourth Quarter |
6.77 | 6.04 | 6.51 | |||||||||
| 2014 Annual |
7.90 | 6.22 | 7.00 | |||||||||
| First Quarter |
6.92 | 6.22 | 6.92 | |||||||||
| Second Quarter |
7.89 | 6.93 | 7.63 | |||||||||
| Third Quarter |
7.90 | 7.14 | 7.61 | |||||||||
| Fourth Quarter |
7.56 | 6.63 | 7.00 | |||||||||
| 2015 First Quarter |
7.03 | 5.89 | 7.02 | |||||||||
| Last six months |
||||||||||||
| 2014 |
||||||||||||
| October |
7.56 | 6.73 | 7.03 | |||||||||
| November |
7.25 | 6.63 | 7.25 | |||||||||
| December |
7.38 | 6.64 | 7.02 | |||||||||
| 2015 |
||||||||||||
| January |
7.03 | 5.89 | 5.96 | |||||||||
| February |
6.53 | 5.94 | 6.53 | |||||||||
| March |
7.02 | 6.31 | 7.02 | |||||||||
| April (through April 28, 2014) |
7.15 | 6.56 | 6.85 | |||||||||
On April 28, 2014, the reported last sale price of our shares on the continuous Spanish market was €6.85.
American Depositary Shares
Our ADSs have been listed and traded on the New York Stock Exchange since July 30, 1987. Each ADS represents one of our shares and is evidenced by an American Depositary Receipt or “ADR.” The deposit agreement, pursuant to which ADRs have been issued, is among us, JP Morgan Chase, as depositary, and the holders from time to time of ADRs. At December 31, 2014, a total of 531,343,503 of our ADSs were held by 18,228 registered holders. Since certain of such of our shares and our ADSs are held by nominees, the number of record holders may not be representative of the number of beneficial owners.
The table below sets forth the reported high and low of the daily closing prices and last daily sales prices for our ADSs on the New York Stock Exchange for the periods indicated.
216
Table of Contents
| Dollars Per ADS | ||||||||||||
| High | Low | Last | ||||||||||
| 2010 Annual |
17.50 | 8.77 | 10.65 | |||||||||
| 2011 Annual |
12.69 | 6.80 | 7.52 | |||||||||
| 2012 Annual |
8.76 | 4.89 | 8.17 | |||||||||
| 2013 |
||||||||||||
| Annual |
9.29 | 6.43 | 9.07 | |||||||||
| First Quarter |
8.81 | 6.77 | 6.81 | |||||||||
| Second Quarter |
7.47 | 6.46 | 6.47 | |||||||||
| Third Quarter |
8.21 | 6.43 | 8.17 | |||||||||
| Fourth Quarter |
9.29 | 8.31 | 9.07 | |||||||||
| 2014 |
||||||||||||
| Annual |
10.75 | 8.21 | 8.33 | |||||||||
| First Quarter |
9.58 | 8.36 | 9.58 | |||||||||
| Second Quarter |
10.75 | 9.58 | 10.42 | |||||||||
| Third Quarter |
10.64 | 9.46 | 9.50 | |||||||||
| Fourth Quarter |
9.43 | 8.21 | 8.33 | |||||||||
| 2015 First Quarter |
8.42 | 6.62 | 7.45 | |||||||||
| Last six months |
||||||||||||
| 2014 |
||||||||||||
| October |
9.43 | 8.35 | 8.77 | |||||||||
| November |
8.90 | 8.21 | 8.90 | |||||||||
| December |
9.03 | 8.23 | 8.33 | |||||||||
| 2015 |
||||||||||||
| January |
8.42 | 6.62 | 6.69 | |||||||||
| February |
7.41 | 6.76 | 7.28 | |||||||||
| March |
7.51 | 6.76 | 7.45 | |||||||||
| April (through April 9, 2015) |
7.72 | 7.39 | 7.39 | |||||||||
On [April 9, 2015], the reported last sale price of our ADSs on the New York Stock Exchange was $7.39.
Not Applicable
General
Spanish Securities Market
The Spanish securities market for equity securities (the “Spanish Stock Exchanges”) consists of four stock exchanges located in Madrid, Barcelona, Bilbao and Valencia (the “local exchanges”). The majority of the transactions conducted on them are done through the Automated Quotation System. During the year ended December 31, 2014, the Automated Quotation System accounted for the majority of the total trading volume of equity securities on the Spanish Stock Exchanges.
Automated Quotation System
The Automated Quotation System was founded in November 2, 1995, substituting the computer assisted trading system known as Sistema de Interconexión Bursatil, which had been in place since 1989. It links the four local exchanges, providing those securities listed on it with a uniform continuous market that eliminates most of the differences among the local exchanges. The principal feature of the system is the computerized matching of buy and sell orders at the time of entry of the order. Each order is executed as soon as a matching order is entered, but can be modified or canceled until executed. The activity of the market can be continuously monitored by investors and brokers. The Automated Quotation System is operated and regulated by the Sociedad de Bolsas, a corporation owned by the company that manages the Spanish Stock Exchanges. All trades on the Automated Quotation System must be placed through a bank, brokerage firm, a dealer firm or a credit entity that are a member of a Spanish stock exchange directly.
217
Table of Contents
There is a pre-opening session held from 8:30 a.m. to 9:00 a.m. (Madrid time) each trading day on which orders are placed at that time. The computerized trading hours are from 9:00 a.m. to 5:30 p.m. (Madrid time) Each session will end with a 5 minute auction, between 5:30 and 5:35 p.m., with a random closedown of 30 seconds. The price resulting from each auction will be the closing price of the session.
From May 14, 2001, rules came into effect regarding the maximum price fluctuations in the price of stocks. Under the rules, each stock in the continuous market is assigned a static and a dynamic range within which the price of stocks can fluctuate. The price of a stock may rise or fall by its static range (which is published once a month and is calculated according to the stock’s average historic price volatility) above or below its opening price (which shall be the closing price of the previous session). When the stock trades outside of this range, the trading of the stock is suspended for 5 minutes, during which an auction takes place. After this auction, the price of the stock can once again rise or fall by its static range above or below its last auction price (which will be considered as the new static price before triggering another auction). Furthermore, the price of a stock cannot rise or fall by more than its dynamic price range (which is fixed and published once a month and is calculated according to the stock’s average intra-day volatility), from the last price at which it has traded. If the price variation exceeds the stock’s dynamic range a five minute auction is triggered.
Moreover, there is a block market (el mercado de bloques) allowing for block trades between buyers and sellers from 9:00 a.m. to 5:30 p.m. during the trading session. Under certain conditions, this market allows cross-transactions of trades at prices different from prevailing market prices. Trading in the block market is subject to certain limits with regard to price deviations and volumes.
Between 5:30 p.m. and 8:00 p.m., trades may occur outside the computerized matching system without prior authorization of the Sociedad de Bolsas, at a price within the range of 5% above the higher of the average price and closing price for the day and 5% below the lower of the average price and closing price for the day, if there are no outstanding bids or offers, as the case may be, on the system matching or bettering the terms of the proposed off-system transaction, and if the trade involves more than €300,000 and more than 20% of the average daily trading volume of the stock during the preceding quarter. At any time before 8:00 p.m., trades may take place (with the prior authorization of the Sociedad de Bolsas) at any price if:
| • | the trade involves more than €1.5 million and more than 40% of average daily trading volume of the stock during the preceding quarter; |
| • | relates to a merger or spin-off of a listed company; |
| • | relates to the reorganization of a business group; |
| • | the transaction is executed for the purposes of settling litigation; |
| • | involves certain types of contracts or complex transactions; or |
| • | the Sociedad de Bolsas finds other justifiable cause. |
Information with respect to computerized trades between 9:00 a.m. and 5:30 p.m. is made public immediately, and information with respect to trades outside the computerized matching system is reported to the Sociedad de Bolsas and published in the Boletín de Cotización and in the computer system by the next trading day.
Clearance and Settlement System. Book-Entry System
Until April 1, 2003, transactions carried out on the regional Spanish stock exchanges and the continuous market were cleared and settled through the Servicio de Compensación y Liquidación de Valores, S.A. (the “SCL”). Since April 1, 2003, the settlement and clearance of all trades on the Spanish stock exchanges, the Public Debt Market (Mercado de Deuda Pública), the AIAF Fixed Income Market (Mercado AIAF de Renta Fija) and Latibex—the Latin American stock exchange- denominated in euros, are made through the Sociedad de Gestión de los Sistemas de Registro, Compensación y Liquidación de Valores, S.A. (“Iberclear”), which was formed as a result of a merger between SCL and Central de Anotaciones del Mercado de Deuda Pública (the latter of which was managed by the Bank of Spain).
Ownership of shares listed on any Spanish stock exchange is required to be represented by entries in a register maintained by Iberclear, which is the Spanish Central Securities Depositary, and transfers or changes in ownership are effected by entries in such register. The securities register system is structured in two levels: the central registry managed by Iberclear which keeps the securities balances of the participants, and a detailed registry managed by the participants where securities are listed by holder’s name.
218
Table of Contents
A reform of the existing clearing, settlement and registry system is currently being implemented in Spain. The reform introduces three fundamental changes that, in turn, will involve a number of operating modifications. These changes are as follows: a) Transition to a registry system based on balances; b) the introduction of a new Central Counterparty (“BME Clearing”); and c) the integration of the Central de Anotaciones del Mercado de Deuda Pública (CADE), or the registry, and SCL into a single platform. With the introduction of the Central Counterparty, Spain’s stock exchange markets will be organized around three infrastructures: a trading platform (SIBE), the Central Counterparty (a new segment of BME) and the central securities depository (IBERCLEAR). This new system will be implemented in two consecutive phases: a) first phase: the implementation of the Central Counterparty and the transition to a registry system based on balances to be scheduled to be completed in the fourth quarter of 2015; and b) second phase: the transfer of CADE into the new system and the connection to Target 2 Securities system scheduled to be completed during the first quarter of 2017.
Securities Market Legislation
The Spanish Securities Markets Act, which came into effect in 1989, among other things:
| • | established an independent regulatory authority, the CNMV, to supervise the securities markets; |
| • | established a framework for the regulation of trading practices, tender offers and insider trading; |
| • | required stock exchange members to be corporate entities; |
| • | required companies listed on a Spanish stock exchange to file annual audited financial statements and to make public quarterly financial information; |
| • | established a framework for integrating quotations on the four Spanish stock exchanges by computer; |
| • | exempted the sale of securities from transfer and value added taxes; |
| • | deregulated brokerage commissions as of 1992; and |
| • | provided for transfer of shares by book-entry or by delivery of evidence of title. |
The Securities Markets Act was amended by Law 37/1998, which implemented two European Union directives into Spanish law. The first is Directive 93/22/CE, relating to investment services within securities, later amended by Directive 95/26/CE of the European Parliament and Council. The second is Directive 97/9/CE of the European Parliament and Council, relating to indemnity systems.
Law 37/1998 introduced some innovations to the Securities Markets Act. The first was the recognition that both Spanish and other European Union Member State companies authorized to provide investment services have full access to the official secondary markets, with full capacity to operate, thereby enabling the direct admission of banking entities into the stock exchange area. The second innovation was that the scope of the Securities Markets Act was enlarged to include a list of financial instruments, such as financial exchange contracts, or installment financial contracts, which expanded the categories of securities included.
The Securities Markets Act has been further amended by Law 44/2002 (November 22, 2002) on reform measures of the financial system, which introduced certain modifications to the laws governing financial markets and corporations, generally, including:
| • | provisions regarding market transparency such as: requiring listed companies to establish an audit committee, redefining the reporting requirements for material facts, rules relating to the treatment of confidential and insider information and related party transactions, and prevention of manipulative and fraudulent practices with respect to market prices; |
| • | the establishment of Iberclear; and |
| • | the authorization of the Minister of Economy and Competitiveness to regulate financial services electronic contracts. |
On July 17, 2003, the Securities Market law was amended by Law 26/2003 in order to reinforce the transparency of listed companies. It introduced:
219
Table of Contents
| • | information and transparency obligations including detailed requirements of the contents of the corporate website of listed companies and the obligation to file with the CNMV an annual corporate governance report; and |
| • | the obligation to implement a series of corporate governance rules including, among others, regulations regarding the boards of directors and the general shareholders’ meetings. |
On March 11, 2005, Royal Decree Law 5/2005 was approved, modifying the Securities Market Law in order to implement the Directive 2003/71/EC of the European Parliament and of the Council on the prospectus to be published when securities are offered to the public or admitted to trading. The Directive: (i) harmonizes the requirements for the process of approval of prospectuses, which enables a prospectus to be valid throughout the European Union; and (ii) incorporates the application of the country of origin principle.
On April 22, 2005, the Securities Market Law was amended by Law 5/2005 on supervision of financial conglomerates in order to make the sectorial rules applicable to investment firms more consistent with other sectorial rules applicable to other groups with similar financial activities, such as credit institutions and insurance undertakings.
On November 14, 2005, the Securities Market Law was further amended by Law 19/2005, which refers to the European public limited-liability companies with registered offices in Spain and, on November 24, 2005, by Law 25/2005, of November 24, 2005, which regulates the capital risk entities.
Royal Decree 1310/2005 (November 4) partially developed the Securities Market Law 24/1988, in relation to the admission to trading of securities in the official secondary markets, the sale or subscription public offers and the prospectus required to those effects.
Royal Decree 1333/2005 (November 11), which developed the Securities Market Law 24/1988, in relation to market abuse.
Law 12/2006 of May 16, 2006 amended the Securities Market Law by: (i) introducing a new article relating to notifications to the CNMV of transactions that might constitute insider dealing or market manipulation, (ii) completing the regulation of Bolsas y Mercados Españoles, and (iii) clarifying the regulation of significant participations on the entities which manage the clearing and settlement of securities and the Spanish secondary markets.
Law 36/2006 of November 30, 2006, relating to measures to prevent the tax fraud, among others, amends article 108 of the Securities Market Law.
Law 6/2007 of April 12, 2007 amends the Securities Market Law, in order to modify the rules for takeover bids and for issuers transparency. This Law came into effect on August 13, 2007, and partially integrates into the Spanish legal system Directive 2004/25/EC of the European Parliament and of the Council of April 21, 2004 on takeover bids and Directive 2004/109/EC of the European Parliament and of the Council of December 15, 2004 on the harmonization of transparency requirements in relation to information about issuers whose securities are admitted to trading on a regulated market and amending Directive 2001/34/EC. This Law has been further developed by Royal Decree 1066/2007 (July 27) on rules applicable to takeover bids for securities and by Royal Decree 1362/2007 (October 19) on transparency requirements for issuers of listed securities. For a brief description of the provisions of Law 6/2007 as regards the rules applicable to takeover bids see “Item 10. Additional Information—B. Memorandum and articles of association—Tender Offers”.
Law 6/2007 (i) introduces several changes to the periodical financial information, annual, biannual and quarterly, to be published by issuers of listed securities; and (ii) introduces new developments to the system which establishes the duty to notify significant stakes in an enterprise, such as:
| • | Anyone with a right to acquire, transfer or exercise voting rights granted by the shares, regardless of the actual ownership of the shares; and anyone owning, acquiring or transferring other securities or financial instruments which grant a right to acquire shares with voting rights, will also have to notify the holding of a significant stake in accordance with the developing regulations; |
| • | Directors of listed companies, in addition to notifying any transaction concerning the shares or other securities or financial instruments of the issuer which are linked to these shares, will have to inform the CNMV of their stake upon appointment or resignation; and |
| • | Listed companies will be required to notify transactions concerning their treasury shares in certain cases, which will be established in the developing regulations. |
220
Table of Contents
Law 47/2007 of December 19, 2007 amends the Securities Market Law in order to adapt it to Directive 2004/39/EC on markets in financial instruments (MiFID), Directive 2006/73/EC implementing Directive 2004/39/EC with respect to the organizational requirements and operating conditions for investment firms and defining terms for the purpose of that Directive, and Directive 2006/49/EC on the capital adequacy of investment firms and credit institutions. The amendments introduced by Law 47/2007 represent important reforms of the Securities Market Law and serve to (i) increase the number of investment services that can be performed by the entities; (ii) reinforce the measures for the protection of investors; (iii) establish new organizational procedures for investment firms; and (iv) reinforce the supervisory powers of the CNMV, establishing cooperation mechanisms among supervisory authorities. Directive 2006/49/EC and MiFID implementation have been introduced by Royal Decrees 216/2008 and 217/2008 (both of February 15), respectively.
Law 32/2011 of October 4, 2011, amending Law 24/1988 of July 28, 1988, on the securities market, introduced a central counterparty for equity transactions imposing the obligation to carry out all equity transactions traded through a central counterparty. Other relevant amendments of Law 32/2011 of October 4, 2011, include the introduction of a right of withdrawal in the event of insolvency of the entities in charge of keeping the registry and of participating entities and the pro rata rule. Modifications were also made to the regulatory regime of Iberclear, which is in charge of both the register of securities held in book-entry form and their clearing and settlement. Specifically, the new rules facilitate the relationship between Iberclear and the other agents of the trading and post-trading system and regulate the agreements that Iberclear may carry out to provide a better integration with to the TARGET2-Securities project, which aims to establish a eurozone-wide settlement system.
Royal Decree-Law 20/2012 of July 13, 2012 on measures to ensure budgetary stability and the promotion of competitiveness which, among other reforms, amended Law 24/1988 of July 28, 1988 on the Securities Market (and Law 44/2002 of November 22, 2002 on financial system reform measures) to include a new financial instrument in the Spanish legal system, the so-called “internationalization covered bonds” (cédulas de internacionalización). These bonds are similar to “territorial covered bonds” (cédulas territoriales), introduced by Law 44/2002 and are fixed-income securities that may be issued by credit institutions, whose capital and interest are especially secured by loans and credits granted for the internationalization of companies. The total amount of internationalization covered bonds issued by a credit institution may not exceed 70% of the amount of the unrepaid “eligible” loans and credits.
The Law 11/2012 of December 19, 2012 on urgent measures relating to the environment, which included transposition into Spanish legislation of the provisions of the Commission Regulation 1031/2010 of November 12, 2010 on the timing, administration and other aspects of auctioning of greenhouse gas emission allowances, amended by the Commission Regulation 1210/2011 of November 23, 2011, also amended Law 24/1988 of July 28, 1988 on the Securities Market to define the financial institutions that can participate in these auctions and grant the CNMV supervisory, inspection and sanctioning powers in relation to the aforementioned misconduct. It established that investment firms and credit institutions authorized to provide investment services may submit bids to greenhouse gas emission allowance auctions on their customers’ behalf, as well as conduct the activities envisaged in Law 24/1988.
Law 10/2014 of June 26, 2014, on the regulation, supervision and solvency of credit institutions makes wide-ranging amendments to Law 24/1988 of July 28, 1988 on the securities market in order to bring investment firms within the scope of the supervision system envisaged for credit institutions under Directive 2013/36/EU of June 26, 2013.
Law 31/2014 of December 3, 2014, amending the Spanish Limited Companies Law in order to improve corporate governance, also amends Law 24/1988 of July 28, 1988 to confer on the CNMV the necessary powers to enable it to supervise some of the aspects introduced or modified in this Law, which are applicable to listed companies.
Trading by Santander’s Subsidiaries in the Shares
Some of our subsidiaries, in accordance with customary practice in Spain, and as permitted under Spanish law, have regularly purchased and sold our shares both for their own account and for the accounts of customers. Our subsidiaries have intervened in the market for our shares primarily in connection with customer transactions and in transactions that are undertaken to supply liquidity to the market, and occasionally for other purposes. Among such other purposes are those transactions that have provided a mechanism for accumulating shares that were used to meet conversions into our shares, of bonds issued by us and other affiliated companies and to make offerings of shares. We expect that our subsidiaries may continue to purchase and sell our shares from time to time.
Our trading activities in our shares are limited to those set forth above. The continuous market is driven by orders, which are matched by the market’s computer system according to price and time entered. Santander’s broker subsidiary, Santander Investment Bolsa, S.V., S.A., and the other brokers authorized to trade on the continuous market (“Member Firms”) are not required to and do not serve as market makers maintaining independently established bid and ask prices. Rather, Member Firms place orders for their customers, or for their own account, into the market’s computer system. If an adequate counterparty order is not available on the continuous market at that time, the Member Firm may solicit counterparty orders from among its own clients and/or may accommodate the client by filling the client’s order as principal.
221
Table of Contents
Under the Capital Companies Law, a company and its subsidiaries are prohibited from purchasing shares of the company in the primary market. However, purchase of the shares is permitted in the secondary market provided that: (1) the aggregate nominal value of such purchases (referred to as “treasury stock” or “autocartera”) and of the shares previously held by the company and its subsidiaries does not exceed 10% of the total outstanding capital stock of the company, (2) the purchases are authorized at a meeting of the shareholders of the acquiring company and, if the acquisition relates to shares in the parent company, the acquiring company’s parent, and (3) such purchases, together with the shares previously held by the company and its subsidiaries, do not result in a net equity less than the company’s stock and the minimum reserves stipulated by law and our Bylaws.
The law requires that the CNMV be notified each time the acquisition of treasury stock made since the last notification reaches 1% of the voting rights of the company, regardless of any other preceding sales. The Capital Companies Law establishes, in relation to the treasury stock shares (held by us and our affiliates), that the exercise of the right to vote and other non-financial rights attached to them shall be suspended. Financial rights arising from treasury stock held directly by us, with the exception of the right to allotment of new bonus shares, shall be attributed proportionately to the rest of the shares.
The portion of overall trading volume in Santander ordinary shares transacted by Group subsidiaries continues to vary from day to day and from month to month, and is expected to continue to do so in the future. In 2014, 7.73% of the total volume traded in Santander ordinary shares executed on the Primary Spanish Stock Exchange (Bolsas y Mercados Españoles) was transacted by Santander Investment Bolsa S.V., S.A. The portion of trading volume in shares allocable to purchases and sales as principal by our companies (treasury shares) was approximately 2.5% in the same period. The monthly average percentage of outstanding shares held by our subsidiaries ranged from 0.136% to 0.414% in 2014. At December 31, 2014, the Parent bank and our subsidiaries held 1,465,371 of our shares (0.012% of our total capital stock as of that date).
Not Applicable.
Not Applicable.
Not Applicable.
Item 10. Additional Information
Not Applicable.
B. Memorandum and articles of association
The following summary of the material terms of our Bylaws is not meant to be complete and is qualified in its entirety by reference to our Bylaws. Because this is a summary, it does not contain all the information that may be important to you. You should read our Bylaws carefully before you decide to invest. Copies of our Bylaws are incorporated by reference.
The current Bylaws of Banco Santander, S.A. were approved by our shareholders acting at the annual general shareholders’ meeting held on June 21, 2008 and incorporated with the office of the Mercantile Registry on August 11, 2008.
Subsequently, several articles have been amended and sub-subsections 1 and 2 of Article 5 of the Bank’s Bylaws have been updated several times to show the current share capital and the number of shares outstanding. The most recent of such amendments corresponds to the one required by the share capital increase carried out on January 29, 2015 and filed with the office of the Mercantile Registry on the following day.
At the 2013 annual general meeting, held on March 22, 2013, our shareholders resolved to amend our Bylaws to achieve two separate goals: (i) to modify the rules on directors’ remuneration to conform them to the Bank’s practices; and (ii) to adjust the Bylaws to recent statutory amendments to the Capital Companies Law included in Law 1/2012, of June 22, 2012, on the simplification of the obligations to provide information and documentation regarding mergers and split-offs of capital companies (“Law 1/2012”).
222
Table of Contents
The first goal was achieved by amending section 2 of article 58 of our Bylaws regarding the rules for the remuneration of directors for their duties of supervision and collective decision-making, which has changed from a system of profits participation to one of fixed amount remuneration. For more information on the amendment of section 2 of article 58 of our Bylaws, see below, “Certain Powers of the Board of Directors”.
The second goal was achieved by amending the title and sections 1 and 2 in article 61 of our Bylaws to conform the provision to the latest amendment of article 11 bis of the Capital Companies Law pursuant to Law 1/2012. First, the amendment of the title of the article was intended to specify the corporate nature of the website, in line with the nomenclature used by the law. Second, section 1 includes now a new rule that gives the shareholders at the General Shareholders’ Meeting the power to create the corporate website, for which purpose the corresponding item should expressly appear in the agenda of the meeting. Legal provisions have also been included regarding the manner in which such resolution will be announced. The power to amend, relocate or remove the website still belongs to the board of directors, in line with the legal rule applicable by default. Third, in section 2, apart from including certain improvements to the text, the reference to “registration with the Commercial Registry” of the approval of the amendment, removal or relocation of the website is replaced with a reference to its “record on the Bank’s page maintained with the Commercial Registry”, thus conforming the text of the Bylaws to the tenor of the new text of article 11 bis of the Capital Companies Law.
At the 2014 annual general meeting, held on March 28, 2014, our shareholders resolved to amend our Bylaws to achieve two separate goals:
| i) | to adjust the Bylaws to statutory amendments regarding corporate governance introduced by: (a) Order EEC/461/2013 of March 20, which determines the content and structure of the annual corporate governance report, of the annual remuneration report and of other reporting instruments of listed corporations (sociedades anónimas), of savings associations and of other entities that issue securities admitted to trading on official securities markets, and (b) Royal Decree-law 14/2013 of November 29, on urgent measures to adjust Spanish Law to European Union regulations governing supervision and solvency of financial institutions; and |
| ii) | to make certain changes in the Bylaws regarding the organization of the Bank, relating primarily to the provisions of Directive 2013/36/UE of the European Parliament and of the Council, of June 26, 2013, on access to the activity of credit institutions and the prudential supervision of credit institutions and investment firms (“Directive CRD IV”). Such Directive, together with (UE) Regulation No. 575/2013 of the European Parliament and of the Council of June 26, 2013 on prudential requirements for credit institutions and investment firms, constitute the new supervision and solvency regulations for credit institutions applicable in the European Union since January 1, 2014. |
At the 2015 annual general meeting, held on March 27, 2015, our shareholders resolved to amend our Bylaws to conform the Bylaws to the amendments of the Capital Companies Law introduced by Law 31/2014, of December 3, 2014, amending the Capital Companies Law to improve corporate governance (“Law 31/2014”). That reforms has been supplemented with the inclusion of certain technical improvements to the Bylaws, whether to improve their drafting, facilitate understanding, provide the text of the Bylaws with greater flexibility or, simply, adjust them to the Group’s practices.
In particular, the following articles of the Bylaws have been amended: articles 20 (distribution of powers), 23 (power and duty to call a meeting), 24 (call of a general shareholders’ meeting), 25 (establishment of the general shareholders’ meeting), 31 (right to receive information), 35 (approval of resolutions), 42 (qualitative composition of the board), 43 (chairman of the board), 44 (vice chairman of the board), 45 (secretary of the board), 46 (meetings of the board of directors), 47 (conduct of the meetings), 50 (committees of the board of directors), 52 (executive risk committee), 53 (audit committee), 54 (appointments and remuneration committee), 54 bis (risk supervision, regulation and compliance committee, whose only amendment has been its renumbering as 54 ter), 55 (term of office), 56 (withdrawal of directors), 57 (liability of directors), 58 (compensation of directors), 59 (transparency of the director compensation system, which has also been renumbered as 59 bis), 60 (annual corporate governance report), 61 (corporate website), 62 (submission of the annual accounts), 64 (dividends in kind) and 65 (deposit of the annual accounts). Likewise, the following new articles have been included in the Bylaws: articles 54 bis (the remuneration committee) and 59 (approval of director remuneration policy).
Our amended Bylaws have not yet been filed with the Mercantil Register (since they are subject to the prior authorization of the Bank of Spain), which is required prior to their effectiveness. We expect that the amendments will become effective with in the first semester 2015.
223
Table of Contents
Our current Bylaws are included as Exhibit 1.1 to this annual report. The Bylaws are also available on the Group’s website, which does not form part of this annual report on Form 20-F, at www.santander.com, under the heading “Information for shareholders and investors — General information — Bylaws”.
In 2014, several amendments to the Rules and Regulations of the Board of Directors were recorded with the Companies Register of Cantabria. The purpose of such modifications was to adapt the Rules and Regulations to new legislative developments on corporate governance. Such amendments consist of adapting to Order ECC/461/2013, Royal Decree-Law 14/2013 and the CRD IV Directive (Directive 2013/36/ EU) for the following purposes, among others: (i) to adjust director typology definitions; (ii) to regulate the sphere of competence of a new committee in charge of assisting the board with regards risk, regulation and compliance, adjusting where applicable the other responsibilities of the board committees; and (iii) to specify the requirement that the chairman may not simultaneously serve as chief executive officer.
In March 2015, a new amendment to the Rules and Regulations of the Board of Directors was recorded with the Companies Register of Cantabria. The purpose of such modification was to change the name of the technology, productivity and quality committee, which would henceforth be known as the innovation and technology committee.
It is envisaged that the board of directors will modify the Rules and Regulations of the Board to conform them to the new wording of the Bylaws once the proposals to modify them have become effective. Such amendments consist of conforming the Bylaws to the amendments of the Capital Companies Law introduced by Law 31/2014, Royal Decree 84/2015 and the Unified Good Governance Code updated in February 2015.
The following is a summary of the main changes approved in 2014:
| • | Adaptation of the definitions of executive director, proprietary director and independent director to those set forth in Order ECC/461/2013 (which, following the coming into force of Act 31/2014, are contained in section 529 duodecies of the Capital Companies Law). |
| • | Reform of the regulations governing the positions of chair and vice-chair of the board and chief executive officer, and insertion of a new article that further regulates the position of lead director. |
| • | Amendment of the provisions that regulate board committees with the creation of a new risk supervision, regulation and compliance committee. |
| • | Modification of the provisions for board meetings, which may now be called by the lead director. |
| • | Inclusion, pursuant to the Bylaws, of a limit on variable remuneration of executive directors in proportion to fixed remuneration. |
| • | Replacement of the existing provisions for transition of power with new provisions under which independent directors that have held their position for more than 12 years may be considered independent directors until the end of their term. |
| • | Adaptation of the regime of limitations and incompatibilities applicable to directors of the Bank to conform to current legislation, currently codified in article 26 of Act 10/2014, of June 26, 2014, on the ordering, supervision and solvency of credit institutions. |
All references to the Rules and Regulations of the Board and to the Rules and Regulations for the general shareholders’ meeting in this annual report on Form 20-F are references to the current text.
The Rules and Regulations of the Board are available on the Group’s website, which does not form part of this annual report on Form 20-F, at www.santander.com, under the heading “Information for shareholders and investors—Corporate governance—Board of directors—Rules and Regulations of the Board of Directors”.
General
As of December 31, 2014, the Bank’s share capital was €6,292,207,329.50, represented by a single class of 12,584,414,659 book-entry Santander shares with a nominal value of €0.50 each.
All of our shares are fully paid and non-assessable. Spanish law requires that bank-listed equity securities be issued in book-entry form only.
224
Table of Contents
Register
Santander is registered with the Commercial Registry of Santander (Finance Section). The Bank is also recorded in the Special Registry of Banks and Bankers with registration number 0049, and its fiscal identification number is A-39000013.
Corporate Object and Purpose
Article 2 of our Bylaws states that the corporate objective and purpose of Santander consists of carrying-out all types of activities, operations and services specific to the banking business in general and which are permitted under current legislation and the acquisition, holding and disposal of all types of securities.
Certain Provisions Regarding Shareholder Rights
As of the date of the filing of this report, Santander’s capital is comprised of only one class of shares, all of which are ordinary shares and have the same rights. Santander may issue non-voting shares for a nominal amount of not more than one-half of the paid-up share capital, and redeemable shares for a nominal amount of not more than one-fourth of its share capital.
Our Bylaws do not contain any provisions relating to sinking funds.
Our Bylaws do not specify what actions or quorums are required to change the rights of holders of our stock. Under Spanish law, the rights of holders of stock may only be changed by an amendment to the Bylaws of the company that complies with the requirements explained below under “—Meetings and Voting Rights”.
Meetings and Voting Rights
We hold our annual general shareholders’ meeting during the first six months of each fiscal year on a date fixed by the board of directors. Extraordinary meetings may be called from time to time by the board of directors whenever the board considers it advisable for corporate interests, and whenever so requested by shareholders representing at least 3% of the outstanding share capital of Santander. At our annual general shareholders’ meeting held on March 30, 2012, our shareholders approved an amendment to our Bylaws to require that notices of all meetings be published at least one month prior to the date set for the meeting, except in those instances in which a different period is established by law, in the Official Gazette of the Mercantile Register or in one of the local newspapers having the largest circulation in the province where the registered office of Santander is located, on the website of the CNMV and on the Bank’s website (www.santander.com). In addition, under Spanish law, the agenda of the meeting must be sent to the CNMV and the Spanish Stock Exchanges and published on the company’s website. Our last ordinary general meeting of shareholders was held on March 27, 2015 and our last extraordinary general meeting of shareholders was held on September 15, 2014.
Each Santander share entitles the holder to one vote. Registered holders of any number of shares who are current in the payment of capital calls will be entitled to attend shareholders’ meetings. Our Bylaws do not contain provisions regarding cumulative voting.
Any Santander share may be voted by proxy. Subject to the limitations imposed by Spanish law, proxies may be given to any individual or legal person, must be in writing or by remote means of communication and are valid only for a single meeting. According to Spanish law, if a director or another person solicits a proxy for a director thus obtaining more than three proxies and the director is subject to a conflict of interest, the director holding the proxies may not exercise the voting rights attaching to the represented shares (unless specific instructions were given by the shareholder) in connection with decisions relating to:
| • | his appointment or ratification, removal, dismissal or withdrawal as director; |
| • | the institution of a derivative action against him; or |
| • | the approval or ratification of transactions between Santander and the director in question, companies controlled or represented by him, or persons acting for his account. |
In accordance with the Rules and Regulations for the General Shareholders’ Meeting and in the manner established by such Rules and Regulations, the Group’s website includes from the date when the call of the general shareholders’ meeting is published, the text of all resolutions proposed by the board of directors with respect to the agenda items and the details regarding the manner and procedures for shareholders to follow to confer representation on any individual or legal entity. The manner and procedures for electronic delegation and voting via the Internet are also indicated.
225
Table of Contents
At both general shareholders’ meetings held in 2004 (the annual shareholders’ meeting of June 19, 2004 and the extraordinary general meeting of October 21, 2004) our shareholders could exercise their voting and representation rights prior to the meetings by electronic means (via the Internet). In addition, at the extraordinary general shareholders’ meeting of October 21, 2004, our shareholders could vote by mail and in the annual general shareholders’ meetings held on June 18, 2005, June 17, 2006, June 23, 2007, June 21, 2008, June 19, 2009, June 11, 2010, June 17, 2011, March 30, 2012, March 22, 2013, March 28, 2014 and March 27, 2015 and in the extraordinary general shareholders’ meeting of October 23, 2006, July 27, 2007, September 22, 2008, January 26, 2009 and September 15, 2014 our shareholders, besides exercising their voting and representation rights prior to the meeting by mail or via the Internet, were able to attend (besides attending and voting in person) via the Internet and were also able to vote in real time on the Internet on the resolutions considered at the meeting.
Only registered holders of Santander shares of record at least five days prior to the day on which a meeting is scheduled to be held may attend and vote at shareholders’ meetings. As a registered shareholder, the depositary will be entitled to vote the Santander shares underlying the Santander ADSs. The deposit agreement requires the depositary to accept voting instructions from holders of Santander ADSs and to execute such instructions to the extent permitted by law.
In general, resolutions passed by a general meeting are binding upon all shareholders. In certain circumstances, Spanish law gives dissenting or absent shareholders the right to have their Santander shares redeemed by us at prices determined in accordance with established formula or criteria. Santander shares held by the Bank or its affiliates are counted for purposes of determining quorums but may not be voted by the Bank or by its affiliates.
Resolutions at general meetings are passed provided that, regarding the voting capital present or represented at the meeting, the number of votes in favor is higher than the number of votes against. Except for the foregoing cases in which the law or the Bylaws require a greater majority.
In accordance with Spanish law, a quorum on first call for a duly constituted ordinary or extraordinary general meeting of shareholders requires the presence in person or by proxy of shareholders representing at least 25% of the subscribed voting capital. On the second call there is no quorum requirement.
Notwithstanding the above, a quorum of at least 50% of the subscribed voting capital is required on the first call of ordinary or extraordinary general meeting of shareholders to validly approve any of the following actions:
| • | the issuance of debentures; |
| • | the increase or reduction of share capital, the exclusion or limitation of pre-emptive rights, or the relocation of the registered office abroad; |
| • | the transformation, merger, split-off, or assignment of assets and liabilities; and |
| • | any other amendment of our Bylaws. |
A quorum of 25% of the subscribed voting capital is required to vote on such actions on the second call.
For the valid approval of all the above listed actions the favorable vote of more than half of the votes corresponding to the shares represented in person or by proxy at the general shareholders’ meeting shall be required, except when on second call shareholders representing less than fifty percent of the subscribed share capital with the right to vote are in attendance, in which case the favorable vote of two-thirds of the share capital represented in person or by proxy at the general shareholders’ meeting shall be required.
For purposes of determining the quorum, those shareholders who vote by mail or via the Internet are counted as present at the meeting, as provided by the Rules and Regulations of the Bank’s general shareholders’ meetings. The quorum at the 2015 annual general meeting was 59.724% of the Bank’s share capital.
Changes in Capital
Any increase or reduction in share capital must be approved at the general meeting in accordance with the procedures explained above in the section entitled “Meetings and Voting Rights”. However, the shareholders acting at the general shareholders’ meeting may delegate to the board of directors the power to increase share capital.
226
Table of Contents
The capital increase may be effected by issuing new shares or by increasing the par value of existing shares. Capital reduction may be effected by reducing the par value of existing shares, by repurchasing them, or dividing them into groups for exchange.
Unpaid subscription amounts on partially paid-up shares must be paid by the shareholders at the time determined by the board of directors, within five years of the date of the resolution providing for the capital increase.
At the Bank’s annual general shareholders’ meeting held on March 27, 2015, our shareholders passed a resolution which, among other things, withdrew, to the extent of the unused amount, the authorization granted by our shareholders at the annual meeting held on March 28, 2014, and gave the board the authority to increase, within a period of three years from the date of the meeting, the Bank’s capital by up to €3,515,146,471.50. Under this resolution, the board is authorized to totally or partially exclude pre-emptive rights, upon the terms of the Spanish law, provided, however, that this power is limited to capital increases carried out under this resolution up to the amount of €1,406,058,588.50. Moreover, at such annual general meeting, our shareholders also passed a resolution which gave the board the authority to execute, within one year, a capital increase of €500 million, to be disbursed in cash.
At the Bank’s annual general shareholders’ meeting held on March 27, 2015, our shareholders passed a resolution which, among other things, withdrew, to the extent of the unused part, the authorization granted by our shareholders at the annual general shareholders meeting held on March 28, 2014, and permitted the Bank to issue, within five years from the date of the meeting, on one or more occasions, debentures, bonds, participating preference shares and other fixed-income securities or debt instruments of a similar nature (including warrants) that are convertible into and/or exchangeable for shares of the Bank in an amount up to €10 billion aggregate principal amount or the equivalent thereof in another currency.
At the Bank’s annual general shareholders’ meeting held on March 27, 2015, our shareholders also passed a resolution by which they authorized the board of directors to issue, on one or more occasions, up to €50 billion euros, or the equivalent thereof in another currency, in fixed-income securities in any of the forms admitted by Law, including bonds, certificates, promissory notes, debentures and preferred interests or debt instruments of a similar nature (including warrants payable by physical delivery or set-off). This power may be exercised by the board of directors within a maximum period of five years from the date of adoption of this resolution by our shareholders, at the end of which period it shall be cancelled to the extent of the unused amount.
Dividends
On January 8, 2015, we announced that the Bank has reformulated its shareholder remuneration policy with the objective of once again paying the majority of shareholders’ quarterly remuneration in cash. In particular, the Bank intends to offer remuneration of 0.20 euros per share with a charge to the 2015 results, which would be paid in four installments, of which three will be received in cash and the other in shares or cash at the shareholder’s discretion, under the Santander Dividendo Elección scrip dividend program. In subsequent financial years, the Bank aims for its cash pay-out to represent between 30% and 40% of its recurring profit, instead of the current 20%, and for shareholder remuneration to match the growth of its results.
Notwithstanding this change in remuneration policy, Banco Santander maintains its stated intention to apply the Santander Dividendo Elección scrip dividend scheme to the remuneration corresponding to the final dividend for 2014.
As such, the aim of the proposals submitted for approval of the shareholders at the ordinary general shareholders’ meeting under item 9 of the agenda is to offer all shareholders of the Bank the option to receive their remuneration corresponding to the final dividend for 2014 and to one of the interim dividends for 2015 (on November 2015) through the application of the Santander Dividendo Elección scrip dividend program.
Once the annual accounts are approved, our shareholders at the general shareholders’ meeting resolve on the allocation of the results for the fiscal year. Dividends may only be distributed out of the earnings for the fiscal year or with a charge to unappropriated reserves, after the payments required by the law and the Bylaws have been made, provided that the stockholders’ equity disclosed in the accounts is not reduced to less than the share capital as a result of the distribution. If there are any losses from prior fiscal years that reduce the Bank’s stockholders’ equity below the amount of the share capital, the earnings must be used to offset such losses.
The amount, time and form of payment of the dividends, to be distributed among our shareholders in proportion to their paid-in capital will be established by resolutions adopted at the general meeting. Our shareholders at the general shareholders’ meeting and the board of directors may make resolutions as to the distribution of interim dividends, subject to limitations and in compliance with the requirements established by the law.
227
Table of Contents
A shareholder’s dividend entitlement lapses five years after the dividend payment date.
Dividends may be paid in kind in whole or in part, provided that:
| • | the property or securities to be distributed are of the same nature; |
| • | they have been admitted to listing on an official market as of the effective date of the resolution, or liquidity is duly guaranteed by the Bank within a maximum period of one year; and |
| • | they are not distributed for a value that is lower than the value at which they are recorded on the Bank’s balance sheet. |
Preemptive Rights
In the event of a capital increase each shareholder has a preferential right by operation of law to subscribe for shares in proportion to its shareholding in each new issue of Santander shares. The same right is vested on shareholders upon the issuance of convertible debt. However, preemptive rights of shareholders may be excluded under certain circumstances by specific approval at the shareholders’ meeting (or upon its delegation by the board of directors) and preemptive rights are deemed excluded by operation of law in the relevant capital increase when our shareholders approve:
| • | capital increases following conversion of convertible bonds into Santander shares; |
| • | capital increases due to the absorption of another company or of part of the spun-off assets of another company, when the new shares are issued in exchange for the new assets received; or |
| • | capital increases due to Santander’s tender offer for securities using Santander’s shares as all or part of the consideration. |
If capital is increased by the issuance of new shares in return for capital from certain reserves, the resulting new Santander shares will be distributed pro rata to existing shareholders.
Redemption
Our Bylaws do not contain any provisions relating to redemption of shares except as set forth in connection with capital reductions. Nevertheless, pursuant to Spanish law, redemption rights may be created at a duly held general shareholders’ meeting. Such meeting will establish the specific terms of any redemption rights created.
Registration and Transfers
The Santander shares are in book-entry form in the Iberclear system. We maintain a registry of shareholders. We do not recognize, at any given time, more than one person as the person entitled to vote each share in the shareholders meeting.
Under Spanish law and regulations, transfers of shares quoted on a stock exchange are normally made through a Sociedad o Agencia de Valores, credit entities and investment services companies, that are members of the Spanish stock exchange.
Transfers executed through stock exchange systems are implemented pursuant to the stock exchange clearing and settlement procedures of Iberclear. Transfers executed “over the counter” are implemented pursuant to the general legal regime for book-entry transfer, including registration by Iberclear.
New shares may not be transferred until the capital increase is registered with the Commercial Registry.
228
Table of Contents
Liquidation Rights
Upon a liquidation of Santander, our shareholders would be entitled to receive pro-rata any assets remaining after the payment of our debts, taxes and expenses of the liquidation. Holders of non-voting shares, if any, are entitled to receive reimbursement of the amount paid before any amount is distributed to the holders of voting shares.
Change of Control
Our Bylaws do not contain any provisions that would have an effect of delaying, deferring or preventing a change in control of the company and that would operate only with respect to a merger, acquisition or corporate restructuring involving Santander or any of our subsidiaries. Nonetheless, certain aspects of Spanish law described in the following section may delay, defer or prevent a change of control of the Bank or any of our subsidiaries in the event of a merger, acquisition or corporate restructuring.
Legal Restrictions on Acquisitions of Shares in Spanish Banks
Certain provisions of Spanish law require notice to the Bank of Spain and non objection by the European Central Bank prior to the acquisition by any individual or corporation of a substantial number of shares of a Spanish financial institution.
Any individual or corporation that wishes to acquire, directly or indirectly, a significant holding (participación significativa) in a Spanish financial institution must give advance notice to the Bank of Spain describing the size of such participation, its terms and conditions, and the anticipated closing date of the acquisition. “Significant holding” is defined as 10% of the outstanding share capital or voting rights of the bank or any lesser participation that gives the acquirer effective influence or control over the target bank.
In addition, prior notice must be given to the Bank of Spain of any increase, direct or indirect, in any significant holding resulting in percentage equity interest or voting rights reaching or surpassing one of the following percentages: 20%, 30% or 50%. Notice to the Bank of Spain is also required from anyone who, as a result of the contemplated acquisition, may attain sufficient power to control the credit entity.
Any acquisition mentioned in the preceding sentence to which the required notice was not given or even if given, a three month period after receipt of notice has not yet elapsed, or that is opposed by the Bank of Spain will have the following effects: (1) the acquired shares will have voting rights suspended and any votes casted will be void, (2) the Bank of Spain may seize control of the bank or replace its board of directors, and (3) a fine may be levied on the acquirer.
The European Central Bank has sixty business days after the receipt of notice to object to a proposed transaction. Such objection may be based on finding the acquirer unsuitable on the basis, among others, of its commercial or professional reputation, its solvency or ability of the credit institution to comply with the applicable prudential regulation on a permanent basis. If sixty business days elapse without any word from the Bank of Spain, its authorization is deemed granted. However, absent objection by the European Central Bank, it may set forth a different maximum period for closing the proposed transaction.
Any individual or institution that plans to sell its significant holding, or reduce it to one of the above-mentioned levels of ownership, or because of any sale will lose control of the entity, must provide advance notice to the Bank of Spain indicating the amount of the transaction and its anticipated closing date. Failure to comply with these requirements may subject the offending party to penalties.
Any acquisition or sale, directly or indirectly, of a participation in a Spanish financial institution which results in the percentage of its share capital or voting rights reaching or exceeding 5%, must be notified to the Bank of Spain by the relevant financial institution, indicating the amount of the participation reached.
In addition to this, the credit institutions must notify the Bank of Spain, during the following month to each natural quarter (i.e. April, July, October and January), of a list of all its shareholders that are financial institutions and all other shareholders that own at least 0.25% of the bank’s total equity.
If the Bank of Spain determines at any time that the influence of a person who owns a significant participation of a bank may adversely affect that bank’s financial situation, it may: (1) suspend the voting rights of such person’s shares up to 3 years; (2) seize control of the bank or replace its board of directors; or (3) exceptionally revoke the bank’s license. Where appropriate, a fine may also be levied on the relevant person.
229
Table of Contents
Tender Offers
Law 6/2007, of April 12, which amends the Securities Market Law, modified the rules for takeover bids. This Law, came into effect on August 13, 2007, and partially transposes into the Spanish legal system Directive 2004/25/EC of the European Parliament and of the Council of April 21, 2004 on takeover bids.
These rules replaced the traditional system where launching a takeover bid was compulsory prior to acquiring a significant shareholding in the target company and partial bids were permitted for a regime where takeover bids must be made for all the share capital after obtaining the control of a listed company (i.e. 30% of the voting rights or appointment of more than one-half of the members of the company’s board of directors) whether such control is obtained by means of an acquisition of securities or an agreement with other holders of securities.
The above does not prevent parties from making voluntary bids for a number that is less than the totality of securities in a listed company.
Law 6/2007 also regulates, among other things: (i) obligations for the board of directors of the offeree company in terms of preventing the takeover bid (passivity rule); and (ii) the squeeze-out and sell-out rights when the offeror is a holder of securities representing at least 90% of the voting capital of the offeree company and the prior takeover bid has been accepted by holders of securities representing at least 90% of the voting rights covered by the bid.
Royal Decree 1066/2007 on rules applicable to takeover bids for securities further developed the regulations on takeover bids established by Law 6/2007, completing the amendments introduced by Law 6/2007, in order to ensure that takeover bids are carried out within a comprehensive legal framework and with absolute legal certainty. The Royal Decree contains provisions regarding: (i) the scope and application to all takeover bids, whether voluntary or mandatory, for a listed company; (ii) the rules applicable to mandatory takeover bids when control of a company is obtained; (iii) other cases of takeover bids, such as bids for de-listing of securities and bids that must be made when a company wishes to reduce capital through the acquisition of its own shares for subsequent redemption thereof; (iv) the consideration and guarantees offered in a bid; (v) stages of the procedure that must be followed in a takeover bid; (vi) the mandatory duty of passivity of the offeree company’s board of directors and the optional regime of neutralization of other preventive measures against bids; (vii) changes to, withdrawal of, and cessation of effects of the bid; (viii) the acceptance period, the calculation of the acceptances received and the settlement of the bid; (ix) the procedures applicable to competing offers; (x) the rules for squeeze-outs and sell-outs; and (xi) certain rules on supervision, inspection and sanctions applicable with respect to the regulations on takeover bids.
Reporting Requirements
Royal Decree 1362/2007 requires that any entity which acquires or transfers shares and as a consequence the number of voting rights held exceeds, reaches or falls below the threshold of 3%, 5%, 10%, 15%, 20%, 25%, 30%, 35%, 40%, 45%, 50%, 60%, 70%, 75%, 80% or 90%, of the voting rights of a company, for which Spain is the member state of origin, listed on a Spanish stock exchange or on any other regulated market in the European Union, must, within 4 trading days after that acquisition or transfer, report it to such company, and to the CNMV. This duty to report the holding of a significant stake is applicable not only to the acquisitions and transfers in the terms described above, but also to those cases in which in the absence of an acquisition or transfer of shares, the percentage of an individual’s voting rights exceeds, reaches or falls below the thresholds that trigger the duty to report, as a consequence of an alteration in the total number of voting rights of an issuer. Similar disclosure obligations apply, among others, in the event of: (i) the acquisition or disposal of any financial instruments entitling the holder to acquire the company’s shares (such as options, futures, swaps, etc.); (ii) certain voting, deposit, temporary transfer or other agreements regarding the relevant shares; or (iii) custodians or proxy-holders who can exercise with discretion the voting rights attached to the relevant shares. The above mentioned threshold percentage will be 1% or any multiple of 1% whenever the person who has the duty to notify is a resident of a tax haven or of a country or territory where there is no taxation or where there is no obligation to exchange tax information (in accordance with Spanish law).
In addition, any Spanish company listed on the Spanish stock exchanges must report any acquisition by such company (or a subsidiary) of the company’s own shares if the acquisition, together with any acquisitions since the date of the last report and without deducting sales of its own shares by the company or by its subsidiaries, causes the company’s ownership of its own shares to exceed 1% of its voting rights. See “Item 9. The Offer and Listing—C. Markets—Trading by Santander’s Subsidiaries in the Shares” herein.
Members of the board of directors of listed companies, in addition to notifying the CNMV of any transaction concerning the shares or other securities or financial instruments of the issuer which are linked to these shares, are required to inform the CNMV of their ratio of voting rights upon appointment or resignation.
In addition, top managers of any listed company must report to the CNMV the acquisition or disposal of shares or other securities or financial instruments of the issuer which are linked to these shares.
230
Table of Contents
Board of Directors
Our board of directors may be made up of a minimum of 14 and a maximum of 22 members, appointed by our shareholders acting at the general meeting of shareholders.
Members of the board of directors are elected for an initial term of three years but can be re-elected. One third of the members of the board are re-elected each year.
A director could serve for a term shorter than the one for which he or she has been initially elected if the shareholders acting at a duly called general meeting decide that that director be replaced before completing his or her term.
The Rules and Regulations of the Board provide that in exercising its powers to make proposals at the general shareholders’ meeting and to designate directors by interim appointment to fill vacancies (co-option), the board shall endeavor to ensure that the external or non-executive directors represent a wide majority over the executive directors and that the former include a reasonable number of independent directors. In addition, in all events, the board of directors shall endeavor such that the number of independent directors represent at least one-third of all directors.
Article 42.1 of our Bylaws also provides that the shareholders at the general shareholders’ meeting shall endeavor to ensure that external or non-executive directors represent a large majority of the board of directors, and that a reasonable number of the board of directors are independent directors. In addition, the shareholders at the general shareholders’ meeting shall likewise endeavor to ensure that independent directors represent at least one-third of the total number of directors.
The Rules and Regulations of the Board (Article 6.2.c.) include the definition of independent directors, which coincides with the one currently established in section 529 duodecies of the Capital Companies Law.
Eight out of our 15 board members are external independent directors.
The independence standards set forth in the Rules and Regulations of the Board may not necessarily be consistent with, or as stringent as, the director independence standards established by the NYSE. See “Item 16G. Corporate Governance—Independence of the directors on the board of directors” herein.
Certain Powers of the Board of Directors
The actions of the members of the board are limited by Spanish law and certain general provisions contained in our Bylaws. For instance, Article 57 of our Bylaws states that the directors will be liable to Santander, to our shareholders and to our corporate creditors for any damages that they may cause by acts or omissions which are contrary to law or to the Bylaws or by acts or omissions contrary to the duties inherent in the exercise of their office, provided that there has been willful misconduct or negligence.
A director’s power to vote on a proposal, arrangement or contract in which such director is materially interested is not regulated by our Bylaws. Conflicts of interest are regulated by Article 30 of the Rules and Regulations of the Board. Under Article 30, a director is obliged to inform the board of any direct or indirect conflict of interest which may exist with the Bank. If such a conflict relates to a particular transaction with the Bank, then the director (i) may not undertake the transaction without the board’s authorization (such authorization can only be granted following a report of the remuneration committee or the audit committee once the amendments to the Bylaws approved at the annual general meeting held on March 27, 2015, become effective); and (ii) the director may not take part in the discussion or voting regarding the transaction to which the conflict relates.
According to our Bylaws, unpaid subscription amounts on partially paid-up shares shall be paid up by the shareholders at the time determined by the board of directors, within five years of the date of the resolution providing for the capital increase. The manner and other details of such payment shall be determined by the resolution providing for the capital increase. Without prejudice to the effects of default as set forth by law, any late payment of unpaid subscription amounts shall bear, for the benefit of the Bank, such interest as is provided by law in respect of late payments, starting from the day when payment is due and without any judicial or extra-judicial demand being required. In addition, the Bank shall be entitled to bring such legal actions as may be permitted by law in these cases.
Our Bylaws provide that the members of the board of directors are entitled to receive compensation for performing the duties entrusted to them by reason of their appointment. The compensation has two components: an annual retainer and attendance fees. Directors may also receive compensation in the form of shares of the Bank or options over the shares, or other remuneration linked to share value following a resolution adopted by the shareholders at the general shareholders’ meeting (conducted in accordance with our Bylaws and applicable Spanish legislation).
231
Table of Contents
At the Bank’s annual general shareholders’ meeting held on March 27, 2015, our shareholders passed a resolution to amend articles 58 and 59 (renumbered as 59 bis) of our Bylaws, and to introduce a new article 59 setting out the rules for the remuneration of directors. Such amendments aim at conforming the terminology of the Bylaws to the text that Law 31/2014 has introduced to the sections of the Spanish Capital Companies Law regarding the remuneration of directors. The main amendments to those rules are summarized below.
Amendments to the second paragraph of sub-section 2 of Article 58 purports to incorporate into the Bylaws the standard, established in the Spanish Capital Companies Law, that the board must distribute among its members the total remuneration corresponding to them as board members.
Additionally, amendments to sub-section 4 of article 58 of the Bylaws sets forth the precautionary procedures to which board approval of agreements with executive directors must be subject in accordance with Spanish law: the requirement of a two-thirds majority, the abstention of any affected director and the inclusion of the agreement in the minutes of the meeting as an exhibit. They also reproduce the legal provisions regarding the contents of such agreements and the principle that a director may not receive any remuneration for the performance of executive duties which amounts or items are not recorded therein.
The new article 59 has been introduced in order for the Bylaws to reflect the new provision of the Spanish Capital Companies Law, which establishes the requirement that any document entitled “Director remuneration policy” with the following content has to be approved by the shareholders at the general shareholders’ meeting as a separate item on the agenda at least each three years: (i) the remuneration of directors in their capacity as such (in Bylaws mandate) including the total amount accrued by the board in its capacity as such and (ii) the basis for the remuneration of directors for the performance of executive duties that, at least, shall include the amount of the fixed remuneration and the variation during the period at which the policy is referred, the principles in order to fix the variable components and the terms and conditions of the remuneration, its duration and, if applicable, indemnity for early termination or end of the contractual relationship, or exclusivity and non-competition.
The amendment of the content of the current article 59 (which, after the reform, would be renumbered as article 59 bis) is intended to conform the regulation of the annual director remuneration report in the Bylaws to the amendments introduced by Law 31/2014 to the legal rules for this report subject to the consultative voting of the shareholders meeting. The most noteworthy legal change is that the report no longer has to include information on the planned policy for future years (given that this will be the object of a new remuneration policy), and is only required to offer complete, clear and understandable information regarding the policy for the current year and an overall summary of the policy applied in the previous financial year.
The new sub-section 4 of article 59 bis regulates the special circumstance in which the vote at the general shareholders’ meeting rejects the annual director remuneration report during the effective term of a specific remuneration policy. In this case, the remuneration policy applicable to the following financial year would have to be submitted to the shareholders at the general shareholders’ meeting prior to its application, though the maximum term for the policy may not have expired (except for those situations in which the policy has already been approved at the same general shareholders’ meeting that rejected the annual remuneration report).
Our amended Bylaws have not yet been filed with the Mercantile Register (since they are subject to the prior authorization of the Bank of Spain), which is required prior to their effectiveness. We expect that the amendments will become effective within the first semester of 2015.
Board of Directors Qualification
There are no mandatory retirement provisions due to age for board members in our Bylaws or in the regulations of our board of directors. These regulations contain provisions relating to the cessation of directorship for other reasons.
In addition, there are no share ownership requirements in our Bylaws or in the Rules and Regulations of the Board of Directors.
Pursuant to Spanish law, directors appointed by the board but whose appointment remains subject to ratification by the shareholders may not necessarily be a shareholder of the Bank and, pursuant to the Rules and Regulations of the Board, proprietary directors must submit their resignation proportionately when the shareholder that they represent parts with its shareholdings or reduces them in a significant manner. Our Bylaws and Rules and Regulations of the Board do not otherwise require ownership of Santander shares for a director’s qualification.
232
Table of Contents
During the past two years, the Bank was not a party to any contract outside its ordinary course of business that was material to the Group as a whole.
Restrictions on Foreign Investments
Under present regulations, foreign investors may transfer invested capital, capital gains and dividends out of Spain without limitation on the amount other than applicable taxes. See “—Taxation”. On July 4, 2003, Law 19/2003 was approved which updates Spanish exchange control and money laundering prevention provisions, by recognizing the principle of freedom of the movement of capital between Spanish residents and non-residents. The law establishes procedures for the declaration of capital movements for purposes of administrative or statistical information and authorizes the Spanish Government to take measures which are justified on grounds of public policy or public security. It also provides the mechanism to take exceptional measures with regard to third countries if such measures have been approved by the European Union or by an international organization to which Spain is a party. The Spanish stock exchanges and securities markets are open to foreign investors. Royal Decree 664/1999, on Foreign Investments (April 23, 1999), established a new framework for the regulation of foreign investments in Spain which, on a general basis, will no longer require any prior consents or authorizations from authorities in Spain (without prejudice to specific regulations for several specific sectors, such as television, radio, mining, telecommunications, etc.). Royal Decree 664/1999 requires notification of all foreign investments in Spain and liquidations of such investments upon completion of such investments to the Investments Registry of the Ministry of Economy and Finance, strictly for administrative statistical and economical purposes. Only investments from “tax haven” countries (as they are defined in Royal Decree 1080/1991), shall require notice before and after performance of the investment, except that no prior notice shall be required for: (1) investments in securities or participations in collective investment schemes that are registered with the CNMV, and (2) investments that do not increase the foreign ownership of the capital stock of a Spanish company to over 50%. In specific instances, the Council of Ministers may agree to suspend, all or part of, Royal Decree 664/1999 following a proposal of the Minister of Economy and Competitiveness, or, in some cases, a proposal by the head of the government department with authority for such matters and a report of the Foreign Investment Body. These specific instances include a determination that the investments, due to their nature, form or condition, affect activities, or may potentially affect activities relating to the exercise of public powers, national security or public health. Royal Decree 664/1999 is currently suspended for investments relating to national defense. Whenever Royal Decree 664/1999 is suspended, the affected investor must obtain prior administrative authorization in order to carry out the investment.
The following is a discussion of the material Spanish and U.S. federal income tax consequences to you of the ownership and disposition of ADSs or shares.
The description of Spanish tax consequences below is intended as a general guide and applies to you only if you are a non-resident of Spain and your ownership of ADSs or shares is not effectively connected with a permanent establishment or fiscal base in Spain and you are a U.S. resident entitled to the benefits of the Convention Between the United States of America and the Kingdom of Spain for the Avoidance of Double Taxation and the Prevention of Fiscal Evasion with Respect to Taxes on Income (the “Treaty”).
On January 14, 2013, the United States of America and the Kingdom of Spain signed a protocol amending the Treaty, which needs to be ratified by both countries, and will become effective three months following the date on which both countries have provided notice that its internal procedures for effectiveness have been fulfilled. When this protocol becomes effective, taxation described under the Treaty in this section may be altered.
This summary is for general information only and does not constitute tax advice. You should consult your own tax adviser as to the particular tax consequences to you of owning the shares or ADSs including your eligibility for the benefits of any treaty between Spain and the country of your residence for the avoidance of double taxation, the applicability or effect of any special rules to which you may be subject, and the applicability and effect of state, local, foreign and other tax laws and possible changes in tax law.
233
Table of Contents
Spanish tax considerations
The following is a summary of material Spanish tax matters and is not exhaustive of all the possible tax consequences to you of the acquisition, ownership and disposition of ADSs or shares. This discussion is based upon the tax laws of Spain and regulations thereunder, which are subject to change, possibly with retroactive effect. This summary takes into account the amendments introduced on January 1, 2015 pursuant to Law 26/2014 of November 27 amending the Personal Income Tax Law and Non-Resident Income Tax Law.
Taxation of dividends
Under Spanish law, dividends paid by a Spanish resident company to a holder of ordinary shares or ADSs not residing in Spain for tax purposes and not operating through a permanent establishment in Spain are subject to Spanish Non-Resident Income Tax at a 20% rate from January 1, 2015 (19% from January 1, 2016 onwards).
We will withhold tax on the gross amount of dividends at the tax rates referred to above, following the procedures set forth by the Order of April 13, 2000. However, under the Treaty and subject to the fulfillment of certain requirements, you may be entitled to a reduced rate of 15%.
To benefit from the Treaty’s reduced rate of 15%, you must provide our depositary, JPMorgan Chase Bank, N.A., with a certificate from the U.S. Internal Revenue Service (the “IRS”) stating that to the knowledge of the IRS, you are a resident of the United States within the meaning of the Treaty. The IRS certificate is valid for a period of one year.
According to the Order of April 13, 2000, to get a direct application of the Treaty-reduced rate of 15%, the certificate referred to above must be provided to our depositary before the tenth day following the end of the month in which the dividends were distributable by us. If you fail timely to provide our depositary with the required documentation, you may obtain a refund of the amount withheld exceeding 15% that would result from the Spanish tax authorities in accordance with the procedures below.
A scrip dividend (see “Item 4. Information on the Company—A. History and development of the company—Principal Capital Expenditures and Divestitures—Recent events”) will be treated as follows:
| • | If the holder of ordinary shares or ADSs elects to receive newly issued ordinary shares or ADSs it will be considered a delivery of fully paid-up shares free of charge and, hence, will not be considered income for purposes of the Spanish Non-Resident Income Tax. The acquisition value, both of the new ordinary shares or ADSs received in the scrip dividend and of the ordinary shares or ADSs from which they arise, will be the result of dividing the total original cost of the shareholder’s portfolio by the number of shares, both old and new. The acquisition date of the new shares will be that of the shares from which they arise. |
| • | If the holder of ordinary shares or ADSs elects to sell the rights on the market, the amount obtained from the sale of rights will be deducted from the acquisition value of the shares from which the rights arose. If the amount obtained from such sale is higher than the acquisition value of the shares from which the rights arose, the excess amount will be treated as a capital gain for the holder in the fiscal year in which the transfer takes place (please refer to “—Taxation of capital gains” below). Note that, pursuant to Law 26/2014, the tax treatment of this option will be modified from January 1, 2017 onwards. According to this amendment, the full amount obtained from the sale of rights will be treated as a taxable capital gain for the holder at the time the transfer takes place, provided the transfer occurs on or after January 1, 2017 (please refer to “—Taxation of Capital Gains” below). |
| • | If the holder of ordinary shares or ADSs elects to receive the proceeds from the sale of rights back to us at a fixed price, the tax regime applicable to the amounts received will be that applicable to cash dividends described above. |
Spanish refund procedure
According to Spanish Regulations on Non-Resident Income Tax, approved by Royal Decree 1776/2004, dated July 30, 2004, as amended, and the Order EHA/3316 dated December 17, 2010, a refund of the amount withheld in excess of the rate provided by the Treaty can be obtained from the relevant Spanish tax authorities. To pursue the refund claim, if you are a U.S. resident entitled to the benefits of the Treaty, you are required to file all of the following:
| • | the applicable Spanish Tax Form (currently, Form 210), |
| • | the certificate of tax residence referred to in the preceding section, and |
| • | evidence that Spanish Non-Resident Income Tax was withheld with respect to you. |
234
Table of Contents
For the purposes of the Spanish refund procedure, the holder must file Form 210 (together with the corresponding documentation) within the period from February 1 of the year following the year in which the Non-Resident Income Tax was withheld and ending four years after the end of the filing period in which we reported and paid such withholding taxes. The Spanish Revenue Office must make the refund within six months after the refund claim is filed. If such period lapses without receipt of the refund, the holder is entitled to receive interest for late payment on the amount of the refund claimed. For further details, prospective holders should consult their tax advisors.
You are urged to consult your own tax adviser regarding refund procedures and any U.S. tax implications of receipt of a refund.
Taxation of capital gains
Under Spanish law, any capital gains derived from the transfer of securities issued by Spanish tax residents are deemed to be Spanish-source income and, therefore, are taxable in Spain. If you are a U.S. resident, income from the sale of ADSs or shares will be treated as capital gains for Spanish tax purposes. Since January 1, 2015, Spanish Non-Resident Income Tax is levied at a 20% rate (19% from January 1, 2016 onwards) on capital gains realized by persons not residing in Spain for tax purposes who are not entitled to the benefit of any applicable treaty for the avoidance of double taxation. Capital gains and losses will be calculated separately for each transaction and losses may not be offset against capital gains.
Notwithstanding the above, capital gains derived from the transfer of shares on an official Spanish secondary stock market by any holder who is a resident of a country that has entered into a treaty for the avoidance of double taxation with Spain containing an “exchange of information” clause will be exempt from taxation in Spain. In addition, under the Treaty, if you are a U.S. resident, capital gains realized by you upon the disposition of ADSs or shares will not be taxed in Spain provided you have not held, directly or indirectly, 25% or more of our stock during the twelve months preceding the disposition of the stock. You are required to establish that you are entitled to this exemption by providing to the relevant Spanish tax authorities an IRS certificate of residence in the United States, together with the appropriate Spanish 210 Form, between January 1 and January 20 of the calendar year following the year in which the transfer of ADSs or shares took place.
Spanish wealth tax
Individuals not resident in Spain for tax purposes who hold shares or ADSs located in Spain are subject to the Spanish wealth tax (Spanish Law 19/1991), which imposes a tax on property and rights located in Spain or that can be exercised within the Spanish territory on the last day of any year. The Spanish tax authorities might take the view that all shares of Spanish corporations and all ADSs representing such shares are located in Spain for Spanish tax purposes. If such a view were to prevail, non-residents of Spain who held shares or ADSs on the last day of any year would be subject to the Spanish wealth tax for such year on the average market value of such shares or ADSs during the last quarter of such year (this average price of listed shares is published in the Official State Gazette every year). Law 4/2008 amended the Spanish wealth tax law, introducing a 100% tax rebate and eliminating the obligation to file any form for tax periods starting as of January 1, 2008. However, this 100% tax rebate was temporarily abolished by different legislation with effect as of the 2011 fiscal year, and was expected to be restored from January 1, 2015, but Law 36/2014 of December 26 has delayed it again until January 1, 2016. Notwithstanding the above, the first €700,000 of net wealth owned by an individual will be exempt from taxation.
As a result of the above legislation, non-residents of Spain who hold or held shares, ADSs, or other assets or rights located in Spain according to Spanish wealth tax law, on the last day of 2014 or 2015, the combined value of which exceeds €700,000 might be subject to the Spanish wealth tax on that excess amount at marginal rates varying between 0.2% and 2.5%, and would be obliged to file the corresponding wealth tax return.
Spanish inheritance and gift taxes
Transfers of shares or ADSs upon death or by gift are subject to Spanish inheritance and gift taxes (Spanish Law 29/1987) if the transferee is a resident of Spain for tax purposes, or if the shares or ADSs are located in Spain at the time of gift or death, or the rights attached thereto could be exercised or have to be fulfilled in the Spanish territory, regardless of the residence of the beneficiary. In this regard, the Spanish tax authorities might determine that all shares of Spanish corporations and all ADSs representing such shares are located in Spain for Spanish tax purposes. The applicable tax rate, after applying all relevant factors, ranges between 0% and 81.6% for individuals.
Gifts granted to corporations non-resident in Spain are subject to Spanish Non-Resident Income Tax at a 20% tax rate from January 1, 2015 (19% from January 1, 2016 onward) on the fair market value of the shares as a capital gain. If the donee is a United States corporation, the exclusions available under the Treaty described in the section “—Taxation of capital gains” above will be applicable.
235
Table of Contents
Transfer tax and VAT
The subscription, acquisition and transfer of ADSs or shares will be exempt from Spanish transfer tax and value-added tax. Additionally, no Spanish Stamp Duty or registration tax will be levied as a result of such subscription, acquisition and transfer.
Compliance
In certain circumstances, the Spanish tax authorities can impose penalties for any failure to comply with any of the Spanish tax requirements referred to above. Such penalties may in certain cases be based on the amount of tax payable.
U.S. Federal Income Tax Considerations
The following summary describes the material U.S. federal income tax consequences of the ownership and disposition of ADSs or shares, but it does not purport to be a comprehensive description of all of the tax considerations that may be relevant to a particular person’s decision to acquire such securities. The summary applies only to U.S. Holders (as defined below) that hold ADSs or shares as capital assets for U.S. federal income tax purposes. In addition, it does not describe all of the tax consequences that may be relevant in light of the U.S. Holder’s particular circumstances, including the potential application of the provisions of the Internal Revenue Code of 1986, as amended (the “Code”) known as the Medicare contribution tax, state, local or non-United States tax laws, and tax consequences applicable to U.S. Holders subject to special rules, such as:
| • | financial institutions; |
| • | insurance companies; |
| • | dealers and traders in securities that use a mark-to-market method of tax accounting; |
| • | persons holding ADSs or shares as part of a “straddle”, conversion transaction or integrated transaction; |
| • | persons whose “functional currency” is not the U.S. dollar; |
| • | persons liable for the alternative minimum tax; |
| • | tax exempt entities, including “individual retirement accounts” and “Roth IRAs”; |
| • | partnerships or other entities classified as partnerships for U.S. federal income tax purposes; |
| • | persons that own or are deemed to own 10% or more of our voting shares; |
| • | persons that acquired our ADSs or shares pursuant to the exercise of an employee stock option or otherwise as compensation; or |
| • | persons holding ADSs or shares in connection with a trade or business outside the United States. |
If an entity that is classified as a partnership for U.S. federal income tax purposes holds shares or ADSs, the U.S. federal income tax treatment of a partner will generally depend on the status of the partner and the activities of the partnership. Partnerships holding shares or ADSs and partners in such partnerships should consult their tax advisers as to the particular U.S. federal income tax consequences of owning and disposing of the shares or ADSs.
This summary is based on the Code, administrative pronouncements, judicial decisions, final, temporary and proposed Treasury Regulations, and the Treaty, all as of the date hereof, changes to any of which may affect the tax consequences described herein, possibly with retroactive effect. In addition, this summary assumes that each obligation provided for in or otherwise contemplated by the deposit agreement or any other related document will be performed in accordance with its terms. U.S. Holders are urged to consult their own tax advisers as to the U.S., Spanish and other tax consequences of the ownership and disposition of ADSs or shares in their particular circumstances.
As used herein, a “U.S. Holder” is, for U.S. federal income tax purposes, a beneficial owner of ADSs or shares who is eligible for the benefits of the Treaty and is:
| • | a citizen or individual resident of the United States; |
| • | a corporation, or other entity taxable as a corporation, created or organized in or under the laws of the United States, any state thereof or the District of Columbia; or |
236
Table of Contents
| • | an estate or trust the income of which is subject to U.S. federal income taxation regardless of its source. |
In general, for U.S. federal income tax purposes, U.S. Holders of ADSs will be treated as the owners of the underlying shares represented by those ADSs. Accordingly, no gain or loss will be recognized if a U.S. Holder exchanges ADSs for the underlying shares represented by those ADSs.
The U.S. Treasury has expressed concerns that parties to whom American depositary shares are released before delivery of shares to the depositary, or intermediaries in the chain of ownership between U.S. Holders and the issuer of the security underlying the American depositary shares, may be taking actions that are inconsistent with the claiming of foreign tax credits by U.S. Holders of American depositary shares. These actions would also be inconsistent with the claiming of the reduced rate of tax, described below, applicable to dividends received by certain non-corporate holders. Accordingly, the creditability of Spanish taxes and the availability of the reduced tax rate for dividends received by certain non-corporate U.S. Holders, each described below, could be affected by actions taken by these parties or intermediaries.
237
Table of Contents
Taxation of Distributions
To the extent paid out of our current or accumulated earnings and profits (as determined in accordance with U.S. federal income tax principles), distributions, including the amount of any Spanish withholding tax, made with respect to ADSs or shares (other than certain pro rata distributions of our capital stock or rights to subscribe for shares of our capital stock) will be includible in the income of a U.S. Holder as foreign-source ordinary dividend income. Because we do not maintain calculations of our earnings and profits under U.S. federal income tax principles, it is expected that distributions generally will be reported to U.S. Holders as dividends. These dividends will be included in a U.S. Holder’s income on the date of the U.S. Holder’s (or in the case of ADSs, the depositary’s) receipt of the dividends, and will not be eligible for the “dividends-received deduction” generally allowed to corporations receiving dividends from U.S. corporations under the Code. The amount of the distribution will equal the U.S. dollar value of the euros received, calculated by reference to the exchange rate in effect on the date that distribution is received (which, for U.S. Holders of ADSs, will be the date that distribution is received by the depositary), whether or not the depositary or U.S. Holder in fact converts any euros received into U.S. dollars at that time. If the dividend is converted into U.S. dollars on the date of receipt, a U.S. Holder generally will not be required to recognize foreign currency gain or loss in respect thereof. A U.S. Holder may have foreign currency gain or loss if the euros are converted into U.S. dollars after the date of receipt. Any gain or loss resulting from the conversion of euros into U.S. dollars will be treated as ordinary income or loss, as the case may be, and will be U.S.-source.
A scrip dividend (see “Item 4. Information on the Company—A. History and development of the company—Principal Capital Expenditures and Divestures—Recent Events”) will be treated as a distribution of cash, even if a U.S. Holder elects to receive the equivalent amount in shares. In that event, the U.S. Holder will be treated as having received the U.S. dollar fair market value of the shares on the date of receipt, and that amount will be the U.S. Holder’s tax basis in those shares. The holding period for the shares will begin on the following day.
Subject to generally applicable limitations that may vary depending upon a U.S. Holder’s individual circumstances, the discussion above regarding concerns expressed by the U.S. Treasury, and the discussion of the passive foreign investment company rules below, under current law, dividends paid to certain non-corporate U.S. Holders may be taxable at rates applicable to long-term capital gains. A U.S. Holder must satisfy minimum holding period requirements in order to be eligible to be taxed at these favorable rates. Non-corporate U.S. Holders are urged to consult their own tax advisers regarding the availability of the reduced rate on dividends in their particular circumstances.
Subject to certain generally applicable limitations that may vary depending upon a U.S. Holder’s circumstances and subject to the discussion above regarding concerns expressed by the U.S. Treasury, a U.S. Holder will be entitled to a credit against its U.S. federal income tax liability for Spanish income taxes withheld at a rate not exceeding the rate provided by the Treaty. Spanish income taxes withheld in excess of the rate applicable under the Treaty will not be eligible for credit against a U.S. Holder’s federal income tax liability. See “—Spanish tax considerations—Spanish refund procedure” for a discussion of how to obtain amounts withheld in excess of the applicable Treaty rate. The limitation on foreign taxes eligible for credit is calculated separately with regard to specific classes of income. Instead of claiming a credit, a U.S. Holder may, at its election, deduct such otherwise creditable Spanish taxes in computing taxable income, subject to generally applicable limitations. An election to deduct foreign taxes instead of claiming foreign tax credits applies to all taxes paid or accrued in the taxable year to foreign countries and possessions of the United States.
A U.S. Holder must satisfy minimum holding period requirements in order to be eligible to claim a foreign tax credit for foreign taxes withheld on dividends. The rules governing foreign tax credits are complex, and U.S. Holders are urged to consult their own tax advisers to determine whether they are subject to any special rules that limit their ability to make effective use of foreign tax credits.
Sale or Exchange of ADSs or Shares
A U.S. Holder will realize gain or loss on the sale or exchange of ADSs or shares in an amount equal to the difference between the U.S. Holder’s tax basis in the ADSs or shares and the amount realized on the sale or exchange, in each case as determined in U.S. dollars. Subject to the discussion of the passive foreign investment company rules below, the gain or loss will be capital gain or loss and will be long-term capital gain or loss if the U.S. Holder held the ADSs or shares for more than one year. This gain or loss will generally be U.S.-source gain or loss for foreign tax credit purposes.
Passive Foreign Investment Company Rules
We believe that we were not a “passive foreign investment company” (“PFIC”) for U.S. federal income tax purposes for the 2014 taxable year. However, because our PFIC status depends upon the composition of our income and assets and the fair market value of our assets (including, among others, less than 25% owned equity investments)
238
Table of Contents
from time to time, and upon certain proposed Treasury Regulations that are not yet in effect but are proposed to become effective for taxable years after December 31, 1994, there can be no assurance that we were not or will not be a PFIC for any taxable year.
If we were a PFIC for any taxable year, any gain recognized by a U.S. Holder on a sale or other disposition of ADSs or shares would be allocated ratably over the U.S. Holder’s holding period for the ADSs or shares. The amounts allocated to the taxable year of the sale or other exchange and to any year before we became a PFIC would be taxed as ordinary income. The amounts allocated to each other taxable year would be subject to tax at the highest rate in effect for individuals or corporations, as appropriate, for that taxable year, and an interest charge would be imposed on the amount allocated to each of those taxable years. Further, any distribution in respect of ADSs or shares in excess of 125% of the average of the annual distributions on ADSs or shares received by the U.S. Holder during the preceding three years or the U.S. Holder’s holding period, whichever is shorter, would be subject to taxation as described above. Certain elections may be available that would result in alternative treatments (such as mark-to-market treatment) of the ADSs or shares.
In addition, if we were a PFIC in a taxable year in which we paid a dividend or the prior taxable year, the reduced rate on dividends discussed above with respect to non-corporate U.S. Holders would not apply.
If we were a PFIC for any taxable year during which a U.S. Holder owned the ADSs or shares, the U.S. Holder would generally be required to file IRS Form 8621 with their annual U.S. federal income tax returns, subject to certain exceptions.
Information Reporting and Backup Withholding
Payment of dividends and sales proceeds that are made within the United States or through certain U.S.-related financial intermediaries generally are subject to information reporting, and may be subject to backup withholding, unless (i) the U.S. Holder is an exempt recipient or (ii) in the case of backup withholding, the U.S. Holder provides a correct taxpayer identification number and certifies that it is not subject to backup withholding. The amount of any backup withholding from a payment to a U.S. Holder will be allowed as a credit against the U.S. Holder’s U.S. federal income tax liability and may entitle the U.S. Holder to a refund, provided that the required information is timely furnished to the IRS.
Certain U.S. Holders who are individuals may be required to report information relating to their ownership of an interest in certain foreign financial assets, including stock of a non-U.S. entity, subject to certain exceptions (including an exception for publicly traded stock and interests held in custodial accounts maintained by a U.S. financial institution). Certain U.S. Holders that are entities may be subject to similar rules in the future. U.S. Holders are urged to consult their tax advisers regarding the effect, if any, of this requirement on the ownership and disposition of ADSs or shares.
F. Dividends and paying agents
Not Applicable.
Not Applicable.
We are subject to the information requirements of the Exchange Act, except that as a foreign issuer, we are not subject to the proxy rules or the short-swing profit disclosure rules of the Exchange Act. In accordance with these statutory requirements, we file or furnish reports and other information with the SEC. Reports and other information filed or furnished by us with the SEC may be inspected and copied at the public reference facilities maintained by the SEC at Room 1580, 100 F Street, N.E., Washington, D.C. 20549, and at the SEC’s regional offices at 200 Vesey Street, Suite 400, New York, New York 10281-1022 and 175 W. Jackson Boulevard, Suite 900, Chicago, Illinois 60604. Copies of such material may also be inspected at the offices of the New York Stock Exchange, 11 Wall Street, New York, New York 10005, on which our ADSs are listed. In addition, the SEC maintains a website that contains information filed electronically with the SEC, which can be accessed on the internet at http://www.sec.gov. The information contained on this website does not form part of this annual report on Form 20-F.
Not Applicable.
239
Table of Contents
Item 11. Quantitative and Qualitative Disclosures About Market Risk
Our risk management activities involve the integrated qualification and quantification of the different types of risk (credit risk, operational risk, reputational risk and market risk) which are assumed by our business units in their activities.
We have divided this section into the following ten parts:
| • | Corporate risk management and control principles; |
| • | Corporate governance of the risk function; |
| • | Risk management and control model; |
| • | Credit risk; |
| • | Market risk; |
| • | Liquidity and funding risk; |
| • | Operational risk; |
| • | Compliance, conduct and reputational risk; |
| • | Model risk; and |
| • | Capital management and control of capital risk. |
Part 1. Corporate risk management and control principles
The Group’s risk policy focuses on maintaining a predictable medium-low risk profile for all its risks, and its risk management model is a key factor in achieving the Group’s strategic objectives.
Risk management is governed by the following basic principles, which are in line with the Group’s strategy and business model and take into account the recommendations of the supervisory and regulatory bodies.
| • | A risk culture common to the organization as a whole. It consists of a series of attitudes, values, skills and guidelines for action vis-à-vis risks that are integrated in all processes, including change management and strategic and business planning decision-making. It is implemented through the direct involvement of our senior management in risk management and decision-making, remuneration schemes that are aligned with risk appetite, training processes at all levels of the organization, robust control mechanisms and a complete, detailed regulatory framework of risk management and control policies and processes. |
| • | Independence of the risk function, encompassing all risks and appropriately separating the risk generating units from those responsible for risk control and having sufficient authority and direct access to management and governing bodies responsible for setting and supervising risk strategy and policies. |
| • | The consideration of all risks on an integrated basis as an objective for the appropriate management and control thereof, including both directly originated risks and those originated indirectly (e.g. by third parties including suppliers). |
| • | An organizational and governance model that assigns management and control officers to all risks, while maintaining the principle of independence, and which has clear, coherent reporting mechanisms at each Group subsidiary and from these to parent level management. |
| • | Decision-making functions are apportioned in accordance with the powers and responsibilities attributed to each risk managing unit, mainly through consensus, which is considered to be an effective instrument for conducting the appropriate analysis and providing different perspectives to be taken into consideration in risk management. |
| • | The Group encourages the use of common management procedures among Group subsidiaries, without prejudice to their adaptation to regulations, supervisory requirements and each unit’s level of progress. |
240
Table of Contents
| • | These procedures include the formulation and monitoring of risk appetite and, accordingly, the Group evaluates the level and type of risks it considers reasonable to assume in the performance of its business strategy and the development thereof within limits that are objective, verifiable and consistent with the risk appetite for each relevant activity, as well as the use of scenario analysis and a forward-looking monitoring of risks in management processes, using advanced models and metrics and establishing a control, reporting and escalation framework to ensure that risks are identified and managed from different perspectives. |
Part 2. Corporate governance of the risk function
2.1. Corporate risk governance structure
The board of directors is responsible for the approval of the Group’s general policies and strategies and, in particular, its general risk policy.
In addition to the executive committee, which also oversees risk, the board has a risk supervision, regulation and compliance committee.
2.1.1. The risk supervision, regulation and compliance committee
This committee’s purpose is to assist the board in the oversight and control of risk, the formulation of the Group’s risk policies, relationships with supervisory bodies, and regulation and compliance.
By resolution of the 2014 annual general meeting and at the proposal of the board, this committee was created in line with the European CRD IV Directive and best market practices. It comprises external or non-executive directors, with a majority of independent directors, and is chaired by an independent director.
The functions of the risk supervision, regulation and compliance committee are as follows:
| • | To support and advise the board on formulating and assessing risk policies for the Group and establishing the risk propensity and risk strategy. |
| • | To provide the board with assistance in the oversight of the application of the risk strategy. |
| • | To conduct systematic reviews of the Group’s exposure to its main customers, economic activity sectors, geographical areas and types of risk. |
| • | To be acquainted with and measure the management tools, improvement initiatives, project development and any other relevant risk control actions, including the policy on internal risk models and their internal validation. |
| • | To support and advise the board in its relationship with supervisors and regulators in the various countries in which the Group has a presence. |
| • | To supervise compliance with the general code of conduct, with the anti-money laundering and financing of terrorism manuals and procedures and, in general, with the Bank’s rules of governance and compliance program, and to make appropriate proposals for improvement. |
| • | To supervise the Group’s governance and compliance policies and rules and, in particular, the adoption of the steps and measures arising from the reports or inspections conducted by the administrative supervision and control authorities. |
| • | To monitor and assess legislative proposals and regulatory developments that may have an impact on the Group. |
2.1.2. The executive risk committee (CDR)
The executive risk committee is a body with risk-management powers delegated by the board and it makes decisions within the scope of those powers to ensure that the Group’s risk profile derived from its business strategy is in line with the risk appetite limits and global policies approved by the board.
The CDR is chaired by an executive deputy chairman of the board, and comprises four additional board members.
The committee’s main responsibilities are as follows:
| • | To determine the transactions that are outside the powers delegated to lower-ranking bodies and the overall limits for pre-classified risk categories for economic groups or in relation to exposure by type of risk. |
241
Table of Contents
| • | To provide the risk supervision, regulation and compliance committee with the information it requires to perform the duties attributed to it by law, the Bylaws and the Rules and Regulations of the Board, without prejudice to the obligation to inform the board of directors, on a timely basis, of its risk management activities. |
| • | To monitor the Group’s general risk profile composed of all the risks detailed in the risk map. |
| • | To manage the Group’s exposure to its various customers, economic activity sectors, geographical areas and types of risk. |
| • | To authorize the management tools, improvement initiatives, project development and any other relevant risk control actions, including the policy on internal risk models and their internal validation. |
| • | To follow, within the scope of its activities, the indications issued by the supervisory authorities in the performance of their functions. |
| • | To ensure that the Group’s actions are consistent with the risk appetite previously established by the board of directors with the advice of the risk supervision, regulation and compliance committee, and to empower other lower-ranking committees or executives to assume risks. |
2.1.3. Basic risk management committees
Some of the CDR’s powers have been delegated to corporate risk committees, which are structured by type of risk and activity, which facilitates the appropriate escalation process to enable final decisions to be made and the risk profile to be monitored on an ongoing basis.
2.2. Risk function responsibility model
2.2.1. Lines of defense
The Group follows a risk management and control model based on three lines of defense:
| • | The first line of defense comprises the business units and support areas (including those specializing in risk) that originate the Bank’s risk exposure as part of their activity. These units are responsible for appropriately managing, monitoring and reporting the risk generated, which must be kept at a level consistent with the risk appetite and within authorized risk limits. |
| • | The second line of defense comprises risk control and oversight teams, including the compliance function. This second line seeks to ensure effective control of risks and seeks to ensure that risks are managed in accordance with the defined risk appetite level. |
| • | The Group’s internal audit function, as the third line of defense and in its role as the last control layer, performs regular assessments to ensure that the policies, methods and procedures are appropriate and checks their effective implementation. |
The three lines of defense have sufficient levels of separation and independence for the effectiveness of the general framework not to be compromised and they act in a coordinated manner in order to maximize their efficiency and strengthen their effectiveness.
Over and above these lines of defense, the board committees and the executive risk committees, both at the Bank and unit level, are entrusted with the proper management and control of risk from the highest echelon of the organization.
242
Table of Contents
2.2.2. Organizational risk function structure
The chief risk officer (CRO) is the head of the risk function and reports to an executive deputy chairman of the Bank who is a member of the board of directors and chairman of the executive risk committee.
The CRO, whose duties include advising on and overseeing executive decisions, reports separately to the risk supervision, regulation and compliance committee and to the board.
The risk management and control model has the following key features:
| • | Specialist risk management, enabling the units to manage the risk they generate in accordance with the established policies and limits. |
| • | Control of financial, non-financial and transversal risks, checking, for each type of risk, that management and exposure are in keeping with the guidelines established by senior management. |
| • | Group-wide risk management, which involves taking a comprehensive holistic view of risk, assessing the Group’s global risk profile and verifying that it is consistent with the risk appetite and limit structure established by the board; and ensuring that the risk management and control systems are adequate and in line with the most stringent criteria and best practices observed in the industry and/or required by the regulators. |
| • | Development, in the sphere of risk, of reporting regulations, methodologies and infrastructure. |
| • | Planning and internal governance. |
| • | Internal validation of risk models in order to assess their suitability for management and regulatory purposes. The validation exercise consists of the review of the theoretical fundamentals of the model, the quality of the data used to build and calibrate the model, and its use and the associated governance process. |
| • | Control and coordination of regulatory projects to supervise the design and implementation of the best regulatory risk management standards at the Group and compliance with regulatory requirements in all countries in a consistent and efficient manner. |
2.3. The Group’s relationship with subsidiaries regarding risk management
2.3.1. Alignment of units with the Bank
The risk management and control model at all Group units has a common set of basic principles. Beyond these principles and fundamentals, each unit tailors its risk management to local circumstances, within the framework of the corporate policies and structures characteristic of the Group’s risk management models.
One of the strengths of this model is the adoption of the best practices developed in each of the units and markets in which the Group is present. The corporate risk divisions pool and transfer these practices.
2.3.2. Committee structure
The Group units’ governing bodies are structured taking into account local regulatory and legal requirements and each unit’s size and complexity and are consistent with those of the Bank, as established in the internal governance framework, thus facilitating communication, reporting and effective control.
The subsidiaries’ managing bodies, in accordance with the internal governance framework in place at the Group, have their own model of (quantitative and qualitative) risk management powers and must adhere to the principles of conduct contained in the benchmark models and frameworks developed at the parent level.
Given its ability to take aggregate holistic, comprehensive view of all risks, the Bank reserves for itself the powers to validate and monitor the operations and management policies at the various units, to the extent that they affect the Group’s risk profile.
Part 3. Risk management and control model
The risk management and control model ensures that the risk profile remains within the levels set for the risk appetite and other limits. Similarly, it includes the adoption of the corrective and mitigating measures required to keep risk levels in line with the defined objectives.
243
Table of Contents
The tools that help ensure that all the risks arising from the Group’s business activity are properly managed and controlled are described below.
3.1. Risk map
The risk map covers the main risk categories in which the Group has its most significant current and/or potential exposures, thus facilitating the identification of those risks. The risk map includes the following:
| • | Financial risks: |
| • | Credit risk: risk that might arise from the failure to meet agreed-upon contractual obligations in financial transactions. |
| • | Trading market risk: risk which is incurred as a result of the possibility of changes in market conditions affecting the value of positions in the trading portfolios. |
| • | Liquidity risk: risk of non-compliance with payment obligations on time or of complying with them at an excessive cost. |
| • | Structural market risk: risk caused by the management of the various balance sheet items, including those relating to the adequacy of capital and those arising from the insurance and pensions businesses. |
| • | Non-financial risks: |
| • | Operational risk: the risk of incurring losses due to the inadequacy or failure of processes, staff and internal systems or due to external events. |
| • | Conduct risk: the risk caused by inappropriate practices in the Bank’s dealings with its customers, and the treatment and products offered to each particular customer and the adequacy thereof. |
| • | Compliance and legal risk: risk arising from non-compliance with the legal framework, internal rules or the requirements of regulators and supervisors. |
| • | Transversal risks: |
| • | Model risk: risk that includes losses arising from decisions based mainly on the results of models, due to errors in the design, application or use of the aforementioned models. |
| • | Reputational risk: risk of negative perception of the Bank by public opinion, its customers, investors or any other interested party. |
| • | Strategic risk: the risk that results diverge significantly from the Group’s strategy or business plan due to changes in general business conditions and risks associated with strategic decisions. This includes the risk of poor implementation of decisions or lack of capacity to respond to changes in the business environment. |
| • | Capital risk: risk that the capital of the Group or any of its entities is not sufficient in terms of quantity and/or quality to meet the regulatory minimum capital requirements set to operate as a bank; respond to market expectations regarding its creditworthiness and support business growth and strategic possibilities that might arise. |
3.2. Group-wide risk management (GWRM)
GWRM involves the identification, evaluation, management and control of all risks, using a comprehensive perspective integrated in all levels of the organization. The implementation and coordinated management of all the components of GWRM make it possible to evaluate the Group’s risk profile and its global management on an ongoing basis, thus enhancing risk management capabilities at all levels of the organization.
The Group has launched the Santander Advanced Management program to expedite implementation of its strategic projects for improved risk management and control capacity, with a view to positioning the Group as the financial group having the best market practices in the current financial environment.
The program aims to achieve excellence in risk management, at both the parent and unit level, while at all times maintaining a focus on doing “more and better” business.
The scope of application of the program encompasses all Group units and ensures the use of a set of uniform management principles in the various regulatory and competitive environments.
244
Table of Contents
3.3. Risk assessment
As part of its routine risk management, the Group identifies and assesses the financial and non-financial risks inherent to the business activity to which it is exposed in the various geographical areas in which it operates.
3.4. Risk appetite and limits structure
Risk appetite is defined at the Group as the amount and type of risk that it considers reasonable to assume in implementing its business strategy, in order to ensure that it can continue to operate normally if unexpected events occur. To this end, severe scenarios are taken into account, which might have an adverse impact on its levels of capital or liquidity, its profits and/or its share price.
The board of directors is the body responsible for establishing and annually updating the Group’s risk appetite, for monitoring its actual risk profile and for ensuring consistency between the two. Risk appetite is measured both for the Group as a whole and for each of the main business units using a corporate methodology adapted to the circumstances of each unit/market. At the unit level, the boards of directors of the related subsidiaries are responsible for approving the respective risk appetite proposals once they have been validated by the Group.
3.4.1. Banking business model and fundamentals of the risk appetite
The definition and establishment of the Group’s risk appetite is consistent with its risk culture and its banking business model from the risk perspective. The main features defining the business model, which form the basis of the risk appetite at the Group, are as follows:
| • | A predictable general medium-low risk profile based on a diversified business model focusing on retail banking with a diversified international presence and significant market shares, and a wholesale banking model which prioritizes the relationship with the customer base in the Group’s principal markets. |
| • | A stable, recurring earnings generation and shareholder return policy based on a strong capital and liquidity base and a strategy to effectively diversify sources and maturities. |
| • | A corporate structure based on autonomous subsidiaries that are self-sufficient in capital and liquidity terms, minimizing the use of non-operating or purely instrumental companies, and ensuring that no subsidiary has a risk profile that might jeopardize the Group’s solvency. |
| • | An independent risk function with direct and active involvement of senior management to foster a strong risk culture focused on protecting and ensuring an adequate return on capital. |
| • | Maintaining a management model that ensures that all risks are viewed in a global interrelated manner through a robust corporate risk control and monitoring environment with global responsibilities spanning all risks, all businesses, and all geographical areas. |
| • | A business model that focuses on the products with respect to which the Group considers that it has sufficient knowledge and management capacity (systems, processes and resources). |
| • | The conduct of the Group’s business activity on the basis of a behavior model that safeguards the interests of its customers and shareholders. |
| • | The availability of sufficient and adequate human resources, systems and tools in order to enable the Group to maintain a risk profile consistent with the established risk appetite, at both global and local levels. |
| • | The application of a compensation policy with the incentives required to ensure that the individual interests of employees and executives are in line with the corporate risk appetite framework and that the incentives are consistent with the Group’s long-term earnings performance. |
3.4.2. Corporate risk appetite principles
The Group’s risk appetite is governed by the following principles at all the entities:
| • | Responsibility of the board and of senior executives. The board of directors of the Bank is the body ultimately responsible for establishing the risk appetite and its supporting regulations, as well as for overseeing compliance therewith. |
245
Table of Contents
| • | Integral view of risk, involving the verification and monitoring of the risk profile. The risk appetite should take into consideration all the significant risks to which the Group may be exposed, providing an aggregate view of the Group’s risk profile through the use of quantitative metrics and qualitative indicators. |
| • | Future risk estimate. The risk appetite should take into consideration the desirable risk profile at the present time and in the medium term considering both the most likely circumstances and stress scenarios. |
| • | Links with strategic and business plans and integration in management. The risk appetite is a benchmark in strategic and business planning. |
| • | Risk appetites that are consistent across the various units and risk language that is common to the entire organization. |
| • | Periodic review, ongoing checking and adaptation to best practices and regulatory requirements. |
3.4.3. Limits, monitoring and control structure
The risk appetite exercise is performed annually and includes a series of metrics and related limits that set out in quantitative and qualitative terms the maximum risk exposure that each Group entity and the Group as a whole are willing to assume. Compliance with risk appetite limits is subject to ongoing monitoring.
3.4.4. Pillars of the risk appetite metrics
Risk appetite is expressed through limits on quantitative metrics and qualitative indicators that measure the Group’s exposure or risk profile by type of risk, portfolio, segment and business line, in both current and stressed conditions. The aforementioned risk appetite metrics and limits are structured around five main pillars that define the position that the Group’s senior management wishes to adopt or maintain in developing its business model.
| • | The volatility in the income statement that the Group is willing to tolerate. |
| • | The solvency position the Group wishes to maintain. |
| • | The minimum liquidity position the Group wishes to have. |
| • | The maximum concentration levels that the Group considers it reasonable to assume. |
| • | Qualitative aspects and complementary metrics. |
3.5. Scenario analysis
We conduct advanced risk management through the analysis of the impact that various scenarios in the environment in which we operate might cause. These scenarios are expressed in terms of both macroeconomic variables and other variables that affect management.
Scenario analysis is a very useful tool for senior management since it allows them to test the our resistance to stressed environments or scenarios and to implement a series of measures to reduce our risk profile vis-à-vis such scenarios.
The main uses of scenario analysis are described below:
| • | Regulatory uses: in which stress tests of scenarios are performed under guidelines set by the regulator. This group of uses includes, for example, the stress tests (comprehensive assessment and stress tests) requested in 2014 by the European Central Bank using the methodology set by the European Banking Authority (EBA). |
| • | Internal capital (ICAAP) or liquidity adequacy assessment processes where, although the regulator can impose certain requirements, the Bank develops its own methodology to assess its capital and liquidity levels vis-à-vis various stress scenarios. These tools enable capital and liquidity management to be planned. |
| • | Risk appetite. This contains stressed metrics on which maximum loss levels (or minimum liquidity levels) are established that the Bank does not wish to exceed. |
| • | Daily risk management. Scenario analysis is used in budgetary processes for provisions and other balance-sheet aggregates by type of risk, in the generation of commercial risk approval policies, in senior management’s overall analysis of risk or in specific analyses of the profiles of activities or portfolios. |
246
Table of Contents
Corporate scenario analysis project
In response to increasing regulatory pressure and the need for advanced risk management, in 2014 a project was launched to develop a robust scenario analysis structure at the parent level; it is expected that the project will be extended to include the Group’s main units in 2015. This project consists of three main pillars:
| • | Scenario analysis tool: implementation of an advanced loss-estimation tool with more robust, automated data handling and a multi-user operating environment. |
| • | Governance: review of the governance framework for scenario analysis exercises in order to adapt to the increasing importance of these analyses, increased regulatory pressures and best market practices. |
| • | Stress methodologies: preparation of plans to develop advanced mathematical stress models to improve risk predictability, taking into account the organization’s calculation capabilities. |
3.6. Living wills (recovery and resolution plans)
The Group was the first international financial institution considered to be globally systemic by the Financial Stability Board to present (in 2010) its living will (the most important portion of which describes the measures that the entity would have available to overcome a highly severe crisis situation by itself) to its consolidated supervisor (at that time the Bank of Spain).
In 2014, the fifth version of the corporate living will was prepared. The living will comprises the Parent company living will (corresponding to Banco Santander, S.A.) and the individual living wills for the most important local units (the U.K., Brazil, Mexico, the US, Germany, Argentina, Chile, Poland and Portugal), thus complying with the commitment made by the Bank to the competent authorities in 2010.
The Group’s senior management is fully involved in the preparation and periodic monitoring of the content of the living wills by holding specific committee meetings of a technical nature, as well as for monitoring at the institutional level, and this ensures that the content and structure of documents are adapted to local and international crisis management legislation, which has been in continuous development in recent years.
The Parent company living will is approved by the board of directors or by the executive committee and the executive risk committee, exercising the functions delegated to them. In turn, the individual living wills are approved by local bodies, always in coordination with the Group since they are part of the Parent company living will.
3.7. Independent reporting
One of the key features of the management model is the risk reporting framework, which sets standards that ensure a consolidated view of all risks and facilitates decision-making by the board of directors and senior management.
Accordingly, in 2014 the Group launched a project to ensure that risk reporting to senior management includes the basic principles defined in Risk Data Aggregation, which are summarized in terms of the following cornerstones:
| • | Governance: a governance system and taxonomy are established for the data and reporting life cycles. |
| • | Database architecture: this supports the Bank’s ability to aggregate all the risk data in a reliable manner, thereby ensuring that they are accurate, comprehensive, complete, traceable, updated in a timely fashion, adaptable to requirements and flexible. |
| • | Preparation of risk reports for senior management. |
3.8. Internal risk control framework
The risk management model has an internal control environment that ensures appropriate control of all risks and provides an integrated view thereof. This control is performed at all the Group’s units and for each type of risk in order to ensure that the Group’s exposures and overall risk profile are within the framework of the mandates established by both the board of directors and the regulators.
247
Table of Contents
The main functions ensuring effective risk control are:
| • | the supervision and aggregate consolidation of all risks. The risk unit, both at the Parent company level and at each unit, performs the function of supervising all risks with the aim of questioning or independently challenging risk management and risk control mechanisms, providing value judgments and elements to support decision-making by senior management. |
| • | the assessment of internal control mechanisms. This consists of a periodic systematic review of all the necessary control processes and procedures in order to guarantee that they are effective and in force. |
| • | integrated risk control and internal risk validation. The main activities performed by the integrated risk control function include: |
| • | Verifying that the management and control systems for the various risks inherent in the Group’s activities comply with the most stringent criteria and the best practices observed in the industry and/or required by regulators. |
| • | Overseeing the adequate compliance, in due time and form, with any recommendations on risk management and control made as a result of inspections conducted by internal audit and by the supervisors to which the Group is subject. |
This function has global and corporate scope, encompassing all risks, all businesses and all geographical areas. Performance of this function is based on an internally-developed methodology and a set of tools that support the function, in order to systematize its operation and tailor it to the Group’s specific requirements. As a result, it is possible to formalize application of this methodology and to render it traceable and targetable.
The internal validation of risk models function provides essential support to the executive risk committee and the local and corporate risk committees in the performance of their duties to authorize the use of the models (for management and regulatory purposes) and to review them regularly.
To this end, a fully independent specialized unit of the Group issues an expert opinion on the adequacy of the internal models for the intended internal management and/or regulatory purposes (calculation of regulatory capital, level of provisions, etc.), expressing a conclusion on their robustness, usefulness and effectiveness.
At the Group, internal validation covers all models used in the risk function, i.e. credit, market, structural and operational risk models and economic and regulatory capital models. The scope of the validation includes not only the more theoretical or methodological aspects, but also the technology systems and the data quality that underpin the effective operation of the models and, in general, all the relevant aspects of risk management (controls, reporting, uses, involvement of senior management, etc.).
This function is performed at a global and at the Parent company level in order to ensure uniformity of application, and is implemented through five regional centers located in Madrid, London, São Paulo, Boston and Wroclaw (Poland). From a functional standpoint, these regional centers are fully accountable to the corporate center, which makes it possible to ensure consistency in the performance of their activities.
| • | Control by the compliance function that the risks assumed are compliant with the legal framework, internal regulations and regulatory and supervisory requirements. |
| • | Assessment by the internal audit function, as the third line of defense, provides an independent review of the first two lines of defense, thus ensuring that the policies, methods and procedures are appropriate and are integrated in management of risk. |
Internal audit is a permanent parent-level function that is independent of any other Group function or unit, and its purpose is to support the board of directors and senior management by providing additional safeguards related to the matters mentioned above, thus contributing to the protection of the organization and its reputation.
4.1 Introduction to the treatment of credit risk
Credit risk is the possibility of loss stemming from the total or partial failure of our customers or counterparties to meet their financial obligations to the Group.
248
Table of Contents
We manage credit risk through segmentation based on three categories of customers:
| • | The individuals segment includes all individuals, except for those engaging in a business activity. This segment is in turn divided into various sub-segments based on income levels, which makes it possible to tailor risk management to each type of customer. |
| • | The SMEs, companies and institutions segment includes legal entities and individuals engaging in a business activity. It also includes public-sector entities in general and not-for-profit private-sector entities. |
| • | The global wholesale banking segment comprises corporate customers, financial institutions and sovereigns, which make up a closed list of entities that is reviewed on an annual basis. Inclusion of an entity on this list is determined on the basis of a comprehensive analysis of the enterprise (business, countries in which it operates, types of products used, level of income it represents for the Bank, length of relationship with the customer, etc.). |
The Group has a mainly retail profile, with 85% of its total risk exposure being generated by its commercial banking business.
4.2 Main data and variations
Following are the main data relating to credit risk arising in our business:
MAIN AGGREGATES—RISK MANAGEMENT*
| Credit risk exposure to customers (1) (millions of euros) |
Non-performing loans ratio (%) |
Coverage ratio (%) |
||||||||||||||||||||||
| 2014 | 2013 | 2014 | 2013 | 2014 | 2013 | |||||||||||||||||||
| Continental Europe |
308,205 | 312,167 | 8.93 | 9.13 | 57.2 | 57.3 | ||||||||||||||||||
| Spain |
182,974 | 189,783 | 7.38 | 7.49 | 45.5 | 44.0 | ||||||||||||||||||
| Santander Consumer Finance (1) |
63,654 | 58,628 | 4.82 | 4.01 | 100.1 | 105.3 | ||||||||||||||||||
| Portugal |
25,588 | 26,810 | 8.89 | 8.12 | 51.8 | 50.0 | ||||||||||||||||||
| Poland |
18,920 | 18,101 | 7.42 | 7.84 | 60.3 | 61.8 | ||||||||||||||||||
| UK |
256,337 | 235,627 | 1.79 | 1.98 | 41.9 | 41.6 | ||||||||||||||||||
| Latin America |
167,065 | 146,392 | 4.65 | 5.00 | 84.7 | 85.4 | ||||||||||||||||||
| Brazil |
90,572 | 79,216 | 5.05 | 5.64 | 95.4 | 95.1 | ||||||||||||||||||
| Mexico |
27,893 | 24,024 | 3.84 | 3.66 | 86.1 | 97.5 | ||||||||||||||||||
| Chile |
33,514 | 31,645 | 5.97 | 5.91 | 52.4 | 51.1 | ||||||||||||||||||
| Argentina |
5,703 | 5,283 | 1.61 | 1.42 | 143.3 | 140.4 | ||||||||||||||||||
| US |
72,477 | 44,372 | 2.54 | 2.60 | 192.8 | 86.6 | ||||||||||||||||||
| Puerto Rico |
3,871 | 4,023 | 7.45 | 6.29 | 55.6 | 61.6 | ||||||||||||||||||
| Santander Bank NA |
45,825 | 40,349 | 1.41 | 2.23 | 109.4 | 93.6 | ||||||||||||||||||
| SC USA |
22,782 | — | 3.97 | — | 296.2 | — | ||||||||||||||||||
|
|
|
|
|
|
|
|
|
|
|
|
|
|||||||||||||
| Total Group |
804,084 | 738,558 | 5.19 | 5.64 | 67.2 | 61.7 | ||||||||||||||||||
|
|
|
|
|
|
|
|
|
|
|
|
|
|||||||||||||
| (1) | Including gross loans and advances to customers, guarantees and documentary credits. |
In 2014, our credit risk exposure to customers increased by 9%. This growth was experienced across-the-board, with the exception of Spain, Portugal and Puerto Rico. The Group’s non-performing loans ratio fell to 5.19%. The coverage ratio was approximately 67%, positively impacted by the relatively high proportion of mortgage portfolios (especially in the U.K. and Spain), which require lower provisions since they are secured by collateral.
4.3. Detail of the main geographical areas
Following is a description of the portfolios in the geographical areas where the Group’s risk concentration is highest.
4.3.1. United Kingdom
Credit risk exposure to U.K. customers amounted to €256,337 million at the end of December 2014, and represented 32% of the Group total.
Due to its importance, not only to Santander UK, but also to the Group’s lending activity as a whole, the mortgage loan portfolio (which totaled €193,048 million at the end of December 2014) must be highlighted.
249
Table of Contents
This portfolio is composed of first-mortgage home purchase or refurbishment loans to new and existing customers, since we do not grant transactions involving second or successive mortgages.
The property on which the mortgage guarantee is constituted must always be located in the U.K., regardless of where the funding is to be employed, except for certain one-off transactions. Loans may be granted for the purchase of residences abroad, but the mortgage guarantee must in all cases be constituted on a property located in the U.K..
Geographically speaking, the credit risk exposure is concentrated mainly in the South East of the country, particularly in the metropolitan area of London, where house price indices reflect a more stable behavior, even in times of economic slowdown.
All properties are appraised independently prior to the approval of each new transaction, in accordance with the Group’s risk management policies.
For mortgage loans that have already been granted, the appraised value of the mortgaged property is updated quarterly by an independent agency using an automatic appraisal system in accordance with standard procedure in the market and in compliance with current legislation.
The non-performing loans ratio of the mortgage segment fell from 1.88% in 2013 to 1.64% at 2014 year-end. This decrease in the non-performing loans ratio was based on the performance of non-performing loans, which improved significantly as a result of the more favorable macroeconomic environment and the increase in re-performing loans due to the improved efficiency of the recovery teams.
The credit policies limit the maximum loan-to-value ratio to 90% for loans on which principal and interest are repaid and to 50% for loans on which interest is paid periodically and the principal is repaid on maturity.
Current credit risk policies expressly prohibit loans considered to be high risk (subprime mortgages), and establish demanding requirements regarding the credit quality of both loans and customers. For example, the granting of mortgage loans with LTVs exceeding 100% has been forbidden since 2009.
Another indicator of the sound performance of the portfolio is the small volume of foreclosed properties, which amounted to €75 million at the end of December 2014. The efficient management of foreclosures, coupled with the existence of a dynamic market for foreclosed homes, makes it possible to sell these properties in a short span of time (on average approximately 18 weeks during 2014).
4.3.2. Spain
Portfolio overview
Total credit risk exposure in Spain (including guarantees and documentary credits but excluding the discontinued real estate operations unit discussed below) amounted to €182,974 million (23% of the Group total), with an adequate degree of diversification in terms of both products and customer segments.
Although in 2014 , lending was still down by 4% compared with 2013, the second half of the year witnessed moderate growth figures, reflecting the improved economic situation and the various strategies implemented and marking a turning point in the downward trend in total credit risk exposure. The non-performing loans ratio for the total portfolio stood at 7.38% and the coverage ratio rose to 45%.
Portfolio of home purchase loans to families
Home purchase loans granted to families in Spain stood at €52,942 million at 2014 year-end. Of this amount, 99% was secured by mortgages.
250
Table of Contents
| In millions of euros |
12/31/14 | |||||||
| Gross amount |
Of which: Non- performing |
|||||||
| Home purchase loans to families |
52,942 | 3,059 | ||||||
| Without mortgage guarantee |
493 | 61 | ||||||
| With mortgage guarantee |
52,449 | 2,998 | ||||||
The risk profile of the home purchase mortgage loan portfolio in Spain remained at a medium-low level.
| • | All mortgage transactions include principal repayments from the very first day. |
| • | Prepayment is common practice and, accordingly, the average life of the transactions is far shorter than their contractual term. |
| • | Debtors provide all their assets as security, not just the home. |
| • | High quality of collateral, since the portfolio consists almost exclusively of principal-residence loans. |
| • | Stable average debt-to-income ratio at around 29%. |
| • | 73% of the portfolio has an LTV of less than 80%. In 2014, a re-appraisal encompassing substantially all the mortgage portfolio was conducted, in keeping with supervisory requirements. |
The following table sets forth the loan to value ratio of our home purchase loan portfolio with mortgage guarantee in Spain as of December 31, 2014, taking into account guarantee updated values:
| 12/31/14 | ||||||||||||||||||||||||
| Loan to value ratio | ||||||||||||||||||||||||
| In millions of euros |
Less than or equal to 40% |
More than 40% and less than 60% |
More than 60% and less than 80% |
More than 80% and less than or equal to 100% |
More than 100% |
Total | ||||||||||||||||||
| Initial gross amount |
5,113 | 10,071 | 22,855 | 11,155 | 3,255 | 52,449 | ||||||||||||||||||
| Of which: Non-performing |
90 | 228 | 685 | 694 | 1,301 | 2,998 | ||||||||||||||||||
For internal management purposes, the Group updates the LTV ratios at least once a year, taking into consideration published house price indices. Also, if a debtor becomes non-performing the Group updates the appraisals undertaken by valuers, which are taken into account in the estimate of impairment losses.
Companies portfolio
The €96,884 million of direct credit risk exposure to SMEs and companies constitute the most important lending segment in Spain, representing 53% of the total.
94% of the portfolio relates to customers to which an analyst has been assigned who monitors the customer on an ongoing basis in all the phases of the risk cycle.
The non-performing loans ratio of this portfolio stood at 8.91% in 2014, impacted mainly by the decrease in lending.
Real estate business
The Group manages, as a separate unit, its real estate business, which includes loans to customers engaging mainly in property development, for which a specialized management model is in place, the investment in SAREB and foreclosed assets.
251
Table of Contents
In recent years, the Group’s strategy has been geared towards reducing these assets. The changes in gross property development loans to customers were as follows:
| Millions of euros | ||||||||||||
| 12/31/14 | 12/31/13 | 12/31/12 | ||||||||||
| Balance at beginning of year (net) |
12,105 | 15,867 | 23,442 | |||||||||
| Foreclosed assets |
(357 | ) | (848 | ) | (930 | ) | ||||||
| Reductions (1) |
(2,015 | ) | (2,114 | ) | (5,670 | ) | ||||||
| Charged-off assets |
(384 | ) | (800 | ) | (975 | ) | ||||||
|
|
|
|
|
|
|
|||||||
| Balance at end of year (net) |
9,349 | 12,105 | 15,867 | |||||||||
|
|
|
|
|
|
|
|||||||
| (1) | Includes sales of portfolios, cash recoveries and third-party subrogations. |
The NPL ratio of this portfolio ended the year at 67.3% (compared with 61.7% at December 2013) due to the increase in the proportion of non-performing assets in the problem loan portfolio and, in particular, to the sharp reduction in lending in this segment. The table below shows the distribution of the portfolio. The coverage ratio of the real estate exposure in Spain stands at 42.5%.
| Millions of euros |
12/31/14 | |||||||||||
| Gross amount |
Excess over collateral value |
Specific allowance |
||||||||||
| Financing for construction and property development recorded by the Group’s credit institutions (business in Spain) |
9,349 | 4,218 | 3,974 | |||||||||
| Of which: Non-performing |
6,292 | 3,175 | 3,400 | |||||||||
| Of which: Substandard |
1,529 | 623 | 574 | |||||||||
| Memorandum item: charged-off assets |
1,888 | |||||||||||
| Memorandum item: Data from the public consolidated balance sheet |
12/31/14 | |||
| Millions of euros | Carrying amount |
|||
| Total loans and advances to customers excluding the public sector (business in Spain) |
154,906 | |||
| Total consolidated assets |
1,266,296 | |||
| Impairment losses and credit risk allowances. Collective coverage (business in Spain) |
253 | |||
The Group calculates the loan loss allowance individually as the difference between the carrying amount of the debt and the present value of its estimated cash flows over the life of the agreement, including those from the guarantees, less costs to sell.
At year-end, the concentration of this portfolio was as follows:
| Loans: Gross amount |
||||
| 12/31/14 | ||||
| 1. Without mortgage guarantee |
1,011 | |||
| 2. With mortgage guarantee |
8,338 | |||
| 2.1 Completed buildings |
4,440 | |||
| 2.1.1 Residential |
2,096 | |||
| 2.1.2 Other |
2,344 | |||
| 2.2 Buildings under construction |
546 | |||
| 2.2.1 Residential |
457 | |||
| 2.2.2 Other |
89 | |||
| 2.3 Land |
3,352 | |||
| 2.3.1 Developed land |
2,882 | |||
| 2.3.2 Other land |
470 | |||
|
|
|
|||
| Total |
9,349 | |||
|
|
|
|||
252
Table of Contents
Policies and strategies in place for the management of these risks
The policies in effect for the management of this portfolio, which are reviewed and approved on a regular basis by the Group’s senior management, are currently geared towards reducing and securing the outstanding exposure, albeit without neglecting any viable new business that may be identified.
In order to manage this credit exposure, the Group has specialized teams that not only form part of the risk areas but also supplement the management of this exposure and cover the entire life cycle of these transactions: commercial management, legal procedures and potential recovery management.
As has already been discussed in this section, the Group’s proactive management of these risks enabled it to significantly reduce its exposure, and it has a granular, geographically diversified portfolio in which the financing of second residences accounts for a very small proportion of the total.
Mortgage lending on non-urban land represents a low percentage of mortgage exposure to land, while the remainder relates to land already classified as urban or approved for development.
The significant reduction of exposure in the case of residential financing projects in which the construction work has already been completed was based on various actions. As well as the specialized marketing channels already in existence, campaigns were carried out with the support of specific teams of managers for this function who, in the case of the Santander Network, were directly supervised by the recoveries business area. These campaigns, which involved the direct management of the projects with property developers and purchasers, reducing sale prices and adapting the lending conditions to the buyers’ needs, enabled loans already in force to be subrogated. These subrogations enable the Group to diversify its risk in a business segment that displays a clearly lower non-performing loans ratio.
The loan approval processes are managed by specialist teams which, working in direct coordination with the sales teams, have a set of clearly defined policies and criteria:
| • | Property developers with a robust solvency profile and a proven track record in the market. |
| • | Strict criteria regarding the specific parameters of the transactions: exclusive financing for the construction cost, high percentages of accredited sales, principal residence financing, etc. |
| • | Support of financing of government-subsidized housing, with accredited sales percentages. |
| • | Restricted financing of land purchases, subject to restoring a sufficient level of coverage in existing financing arrangements or to obtaining increased collateral. |
In addition to the permanent control performed by its risk monitoring teams, the Group has a specialist technical unit that monitors and controls this portfolio with regard to the stage of completion of construction work, planning compliance and sales control, and validates and controls progress billing payments. The Group has created a set of specific tools for this function. All mortgage distributions, amounts drawn down of any kind, changes made to the grace periods, etc. are authorized on a centralized basis.
In the case of construction-phase projects that are experiencing difficulties of any kind, the policy adopted is to ensure completion of the construction work so as to obtain completed buildings that can be sold in the market. To achieve this aim, the projects are analyzed on a case-by-case basis in order to adopt the most effective series of measures for each case (structured payments to suppliers to ensure completion of the work, specific schedules for drawing down amounts, etc.).
The management of on-balance-sheet property assets is performed by companies that specialize in the sale of property, which is supplemented by the commercial network structure. The sale prices are reduced in line with market conditions.
Foreclosed properties
As a last resort, the acquisition and foreclosure of property assets is one of the mechanisms adopted in Spain in order to manage the portfolio efficiently. At December 31, 2014, the net balance of these assets amounted to €4,597 million (gross amount: €9,760 million; recognized allowance: €5,163 million).
253
Table of Contents
The following table shows the detail of the assets foreclosed by the businesses in Spain at the end of 2014:
| Millions of euros |
12/31/14 | |||||||
| Carrying amount |
Of which: Allowance |
|||||||
| Property assets from financing provided to construction and property development companies |
3,648 | 4,443 | ||||||
| Of which: |
||||||||
| Completed buildings |
1,182 | 930 | ||||||
| Residential |
514 | 415 | ||||||
| Other |
668 | 515 | ||||||
| Buildings under construction |
465 | 449 | ||||||
| Residential |
465 | 449 | ||||||
| Other |
— | — | ||||||
| Land |
2,001 | 3,064 | ||||||
| Developed land |
723 | 1,065 | ||||||
| Other land |
1,278 | 1,999 | ||||||
| Property assets from home purchase mortgage loans to households |
949 | 720 | ||||||
| Other foreclosed property assets |
— | — | ||||||
|
|
|
|
|
|||||
| Total property assets |
4,597 | 5,163 | ||||||
|
|
|
|
|
|||||
| Equity instruments, ownership interests and financing provided to non-consolidated companies holding these assets |
473 | 924 | ||||||
|
|
|
|
|
|||||
| Total |
5,070 | 6,087 | ||||||
|
|
|
|
|
|||||
In recent years, the Group has considered foreclosure to be a more efficient method for resolving cases of default than legal proceedings. The Group initially recognizes foreclosed assets at the lower of the carrying amount of the debt (net of provisions) and the fair value of the foreclosed asset (less estimated costs to sell). If fair value (less costs to sell) is lower than the net value of the debt, the difference is recognized under Impairment losses on financial assets (net)—Loans and receivables in the consolidated income statement for the year. Subsequent to initial recognition, the assets are measured at the lower of fair value (less costs to sell) and the amount initially recognized. The fair value of this type of assets is determined by the Group’s directors based on evidence obtained from qualified valuers or evidence of recent transactions.
The changes in foreclosed properties were as follows:
| Thousands of millions of euros |
||||||||
| 2014 | 2013 | |||||||
| Gross additions |
1.8 | 1.9 | ||||||
| Disposals |
(0.9 | ) | (0.9 | ) | ||||
| Difference |
0.9 | 1.0 | ||||||
4.3.3. Brazil
The loan portfolio in Brazil amounts to €90,572 million (11.2% of the Group total), is adequately diversified and has a predominantly retail profile, with 51% of loans granted to individuals, consumer finance and SME customers.
In 2014, the portfolio grew by 5.13% (excluding changes in exchange rates) as compared with 7.1% in 2013. This growth is in line with the average performance of private banks in Brazil. The non-performing loans ratio ended the year at 5.05%, down from 5.64% at 2013 year-end, and the NPL coverage ratio stood at 95% at the end of December 2014.
4.4. Credit risk from other standpoints
4.4.1. Credit risk from financial market operations
This concept includes the credit risk arising in treasury operations with customers, mainly credit institutions. These operations are performed using both money market financing products arranged with various financial institutions and products with counterparty risk intended to provide service to the Group’s customers.
254
Table of Contents
As defined in Chapter 6 of the CRR (Regulation (EU) No 575/2013), counterparty credit risk is the risk that the counterparty to a transaction could default before the final settlement of the transaction’s cash flows. These products include the following types of transactions: derivative instruments, repurchase agreements, securities or commodities lending transactions, deferred settlement transactions and guarantee financing transactions.
The Group uses two methods to measure its exposure to this risk: a mark-to-market method (replacement cost for derivatives or amount drawn down for committed facilities) including an add-on for potential future exposure; and another method, introduced in mid-2014 for certain regions and products, which calculates exposure using Monte Carlo simulations. Calculations are also performed of capital at risk or unexpected loss (i.e. the loss which, once the expected loss is subtracted, constitutes the economic capital, net of guarantees and recoveries).
When the markets close, the exposures are recalculated by adjusting all the transactions to their new time horizon, the potential future exposure is adjusted and mitigation measures are applied (netting arrangements, collateral arrangements, etc.) so that the exposures can be controlled daily against the limits approved by senior management. Risk control is performed using an integrated, real-time system that enables the Group to know at any time the unused exposure limit with respect to any counterparty, for any product and maturity and at any Group unit.
4.4.2. Concentration risk
Concentration risk control is key to the risk management process. The Group continuously monitors the degree of credit risk concentration, by country, sector and customer group.
The board of directors, by reference to the Group’s risk appetite, determines the maximum levels of concentration over risk appetite and limit structure. In keeping with the risk appetite, the executive risk committee establishes the risk policies and reviews the appropriate exposure limits to ensure the adequate management of credit risk concentration.
The Group is subject to the regulation of “large exposures” contained in Part Four of CRR (Regulation (EU) No 575/2013), according to which an institution’s exposure to a customer or group of connected customers is considered a “large exposure” where its value is equal to or exceeds 10% of its eligible capital. Additionally, in order to limit large exposures, an institution may not incur an exposure to a customer or group of connected customers the value of which exceeds 25% of its eligible capital, after taking into account the effect of the credit risk mitigation contained in the Regulation.
At the end of December 2014, after applying risk mitigation techniques and the regulations applicable to large exposures, the exposure to each of the reported groups was below 4.7% of eligible capital, with the exception of one central counterparty in the EU, the exposure to which stood at 7.3%.
For its part, the Group’s regulatory credit exposure to the 20 largest groups classified as large exposures accounted for 5.5% of the credit risk exposure to customers (lending plus off-balance-sheet exposures). The regulatory credit exposure to the top 10 international financial institutions (IFIs) amounted to €18,378 million.
The Group’s risk division works closely with the finance division in the active management of credit portfolios, which includes reducing the concentration of exposures through several techniques, such as the arrangement of credit derivatives for hedging purposes or the performance of securitization transactions, in order to optimize the risk/return ratio of the total portfolio.
255
Table of Contents
The detail, by activity and geographical area of the counterparty, of the concentration of the Group’s risk at December 31, 2014 is as follows:
| Millions of euros |
12/31/14 | |||||||||||||||||||
| Total | Spain | Other EU countries |
Americas | Rest of the world |
||||||||||||||||
| Credit institutions |
167,414 | 28,770 | 85,429 | 45,949 | 7,266 | |||||||||||||||
| Public sector |
159,589 | 58,794 | 33,398 | 61,874 | 5,523 | |||||||||||||||
| Of which: |
||||||||||||||||||||
| Central government |
130,594 | 38,214 | 32,620 | 54,318 | 5,442 | |||||||||||||||
| Other |
28,995 | 20,580 | 778 | 7,556 | 81 | |||||||||||||||
| Other financial institutions |
55,115 | 13,501 | 15,976 | 23,535 | 2,103 | |||||||||||||||
| Non-financial companies and sole proprietors |
319,661 | 89,824 | 89,349 | 127,000 | 13,488 | |||||||||||||||
| Of which: |
||||||||||||||||||||
| Construction and property development |
25,880 | 7,123 | 7,028 | 10,844 | 885 | |||||||||||||||
| Civil engineering construction |
5,916 | 2,937 | 2,402 | 517 | 60 | |||||||||||||||
| Large companies |
175,865 | 42,190 | 45,392 | 78,127 | 10,156 | |||||||||||||||
| SMEs and sole proprietors |
112,000 | 37,574 | 34,527 | 37,512 | 2,387 | |||||||||||||||
| Other households and non-profit institutions serving households |
447,545 | 66,539 | 272,767 | 104,032 | 4,207 | |||||||||||||||
| Of which: |
||||||||||||||||||||
| Residential |
305,546 | 51,579 | 220,072 | 33,523 | 372 | |||||||||||||||
| Consumer loans |
121,458 | 9,412 | 50,389 | 58,168 | 3,489 | |||||||||||||||
| Other purposes |
20,541 | 5,548 | 2,306 | 12,341 | 346 | |||||||||||||||
|
|
|
|
|
|
|
|
|
|
|
|||||||||||
| Subtotal |
1,149,324 | 257,428 | 496,919 | 362,390 | 32,587 | |||||||||||||||
|
|
|
|
|
|
|
|
|
|
|
|||||||||||
| Less: collectively assessed impairment losses |
5,983 | |||||||||||||||||||
|
|
|
|||||||||||||||||||
| Total (*) |
1,143,341 | |||||||||||||||||||
|
|
|
|||||||||||||||||||
| (*) | For the purposes of this table, the definition of risk includes the following items in the public balance sheet: Loans and advances to credit institutions, Loans and advances to customers, Debt instruments, Equity instruments, Trading derivatives, Hedging derivatives, Investments and Contingent liabilities. |
4.4.3. Country risk
Country risk is a credit risk component inherent in all cross-border credit transactions due to circumstances other than ordinary commercial risk. Its main elements are sovereign risk, transfer risk and other risks that can affect international financial operations (war, natural disasters, balance of payments crises, etc.).
At December 31, 2014, the country risk exposure for which allowances must be recorded amounted to €176 million (2013: €382 million). The allowance recognized relating to this matter at 2014 year-end amounted to €22 million, as compared with €47 million at 2013 year-end. It should be noted that in 2014, Colombia was considered to be a country belonging to Group 2 instead of Group 3 per the Bank of Spain country risk classification.
The country risk exposure is moderate and has continued the downward trend witnessed in recent years, the decrease in 2014 being more pronounced as a result of transactions that matured in the year. Total country risk exposure, irrespective of whether or not allowances must be recorded, is also moderate. Except for the Group 1 countries (considered by the Bank of Spain to have the lowest level of risk (this group includes transactions with ultimate obligors resident in European Union countries, Norway, Switzerland, Iceland, the US, Canada, Japan, Australia and New Zealand)), exposure to an individual country in no case exceeds 1% of the Group’s total assets.
The Group’s country risk management policies continued to adhere to a principle of maximum prudence, and country risk is assumed, applying highly selective criteria, in transactions that are clearly profitable for the Group and bolster its global relationship with its customers.
4.4.4. Sovereign risk and exposure to other public sector entities
As a general rule, the Group considers sovereign risk to be the risk assumed in transactions with the central bank (including the regulatory cash reserve requirement), the issuer risk of the Treasury or similar body (government debt securities) and the risk arising from transactions with public entities that have the following features: their funds are obtained only from fiscal income; they are legally recognized as entities directly included in the central government public sector; and their activities are of a non-commercial nature.
256
Table of Contents
This criterion, which has been employed historically by the Group, differs in certain respects from that requested by the European Banking Authority (EBA) for its periodic stress tests. The most significant differences are that the EBA’s criteria do not include risk exposure to central banks, exposure to insurance companies or indirect exposure by means of guarantees or other instruments. However, they do include exposure to public sector entities (including regional and local entities) in general, not just the central government public sector.
Sovereign risk exposure (per the criteria applied at the Group) arises mainly from the subsidiary banks’ obligations to make certain deposits at the corresponding central banks, from the arrangement of deposits using liquidity surpluses, and from the fixed-income portfolios held as part of the on-balance-sheet structural interest rate risk management strategy and in the trading books of the treasury departments. The vast majority of these exposures are taken in local currency and are financed out of local customer deposits, also denominated in local currency.
257
Table of Contents
The detail at December 31, 2014, 2013 and 2012, based on the Group’s management of each portfolio, of the Group’s sovereign risk exposure, net of the short positions held with the respective countries, taking into consideration the aforementioned criterion established by the European Banking Authority (EBA), is as follows:
| Country |
12/31/14 | |||||||||||||||
| Millions of euros | ||||||||||||||||
| Portfolio | ||||||||||||||||
| Financial assets held for trading and Other financial assets at fair value through profit or loss (*) |
Available-for-sale financial assets |
Loans and receivables |
Total net direct exposure |
|||||||||||||
| Spain |
5,778 | 23,893 | 15,098 | 44,769 | ||||||||||||
| Portugal |
104 | 7,811 | 589 | 8,504 | ||||||||||||
| Italy |
1,725 | — | — | 1,725 | ||||||||||||
| Greece |
— | — | — | — | ||||||||||||
| Ireland |
— | — | — | — | ||||||||||||
| Rest of eurozone |
(1,070 | ) | 3 | 1 | (1,066 | ) | ||||||||||
| U.K. |
(613 | ) | 6,669 | 144 | 6,200 | |||||||||||
| Poland |
5 | 5,831 | 30 | 5,866 | ||||||||||||
| Rest of Europe |
1,165 | 444 | 46 | 1,655 | ||||||||||||
| U.S. |
88 | 2,897 | 664 | 3,649 | ||||||||||||
| Brazil |
11,144 | 17,685 | 783 | 29,612 | ||||||||||||
| Mexico |
2,344 | 2,467 | 3,464 | 8,275 | ||||||||||||
| Chile |
593 | 1,340 | 248 | 2,181 | ||||||||||||
| Rest of Americas |
181 | 1,248 | 520 | 1,949 | ||||||||||||
| Rest of the world |
4,840 | 906 | 618 | 6,364 | ||||||||||||
|
|
|
|
|
|
|
|
|
|||||||||
| Total |
26,284 | 71,194 | 22,205 | 119,683 | ||||||||||||
|
|
|
|
|
|
|
|
|
|||||||||
| (*) | Net of short positions amounting to €3,187 million. |
In addition, at December 31, 2014, the Group had net direct derivative exposures the fair value of which amounted to €1,028 million and net indirect derivative exposures the fair value of which amounted to €5 million. Also, the Group did not have any exposure to held-to-maturity investments.
258
Table of Contents
| Country |
12/31/13 | |||||||||||||||
| Millions of euros | ||||||||||||||||
| Portfolio | ||||||||||||||||
| Financial assets held for trading and other financial assets at fair value through profit or loss (*) |
Available-for-sale financial assets |
Loans and receivables |
Total net direct exposure |
|||||||||||||
| Spain |
4,359 | 21,144 | 12,864 | 38,367 | ||||||||||||
| Portugal |
148 | 2,076 | 583 | 2,807 | ||||||||||||
| Italy |
1,309 | 77 | — | 1,386 | ||||||||||||
| Greece |
— | — | — | — | ||||||||||||
| Ireland |
— | — | — | — | ||||||||||||
| Rest of eurozone |
(1,229 | ) | 67 | — | (1,161 | ) | ||||||||||
| U.K. |
(1,375 | ) | 3,777 | — | 2,402 | |||||||||||
| Poland |
216 | 4,770 | 43 | 5,030 | ||||||||||||
| Rest of Europe |
5 | 117 | — | 122 | ||||||||||||
| U.S. |
519 | 2,089 | 63 | 2,671 | ||||||||||||
| Brazil |
8,618 | 8,901 | 223 | 17,743 | ||||||||||||
| Mexico |
3,188 | 2,362 | 2,145 | 7,695 | ||||||||||||
| Chile |
(485 | ) | 1,037 | 534 | 1,086 | |||||||||||
| Rest of Americas |
268 | 619 | 663 | 1,550 | ||||||||||||
| Rest of the world |
5,219 | 596 | 146 | 5,964 | ||||||||||||
|
|
|
|
|
|
|
|
|
|||||||||
| Total |
20,762 | 47,632 | 17,268 | 85,661 | ||||||||||||
|
|
|
|
|
|
|
|
|
|||||||||
| (*) | Net of short positions amounting to €17,658 million. |
In addition, at December 31, 2013, the Group had net direct derivative exposures the fair value of which amounted to €(206) million and net indirect derivative exposures the fair value of which amounted to €6 million. Also, the Group did not have any exposure to held-to-maturity investments.
259
Table of Contents
| 12/31/12 | ||||||||||||||||
| Millions of euros | ||||||||||||||||
| Portfolio | ||||||||||||||||
| Country |
Financial assets held for trading and other financial assets at fair value through profit or loss (*) |
Available-for-sale financial assets |
Loans and receivables |
Total net direct exposure |
||||||||||||
| Spain |
4,403 | 24,654 | 16,528 | 45,586 | ||||||||||||
| Portugal |
— | 1,684 | 616 | 2,300 | ||||||||||||
| Italy |
(71 | ) | 76 | — | 4 | |||||||||||
| Greece |
— | — | — | — | ||||||||||||
| Ireland |
— | — | — | — | ||||||||||||
| Rest of eurozone |
943 | 789 | — | 1,731 | ||||||||||||
| U.K. |
(2,628 | ) | 4,419 | — | 1,792 | |||||||||||
| Poland |
669 | 2,898 | 26 | 3,592 | ||||||||||||
| Rest of Europe |
10 | — | — | 10 | ||||||||||||
| U.S. |
(101 | ) | 1,783 | 30 | 1,712 | |||||||||||
| Brazil |
14,067 | 11,745 | 351 | 26,163 | ||||||||||||
| Mexico |
4,510 | 2,444 | 2,381 | 9,335 | ||||||||||||
| Chile |
(293 | ) | 1,667 | 521 | 1,895 | |||||||||||
| Rest of Americas |
214 | 916 | 771 | 1,900 | ||||||||||||
| Rest of the world |
1,757 | 645 | 234 | 2,636 | ||||||||||||
|
|
|
|
|
|
|
|
|
|||||||||
| Total |
23,480 | 53,718 | 21,457 | 98,655 | ||||||||||||
|
|
|
|
|
|
|
|
|
|||||||||
| (*) | Net of short positions amounting to €15,282 million. |
In addition, at December 31, 2012, the Group had net direct derivative exposures the fair value of which amounted to €(330) million and net indirect derivative exposures the fair value of which amounted to €(33) million. Also, the Group did not have any exposure to held-to-maturity investments.
4.4.5. Environmental risk
In line with the Group’s commitment to sustainability, the environmental risk analysis of credit transactions is one of the main features of the strategic corporate social responsibility plan. The analysis is founded on two cornerstones:
| • | The Equator Principles: an initiative of the International Finance Corporation of the World Bank. These principles constitute an international standard for the analysis of the social and environmental implications of project finance transactions and corporate loans for known purposes. The assumption of these principles involves a commitment to assess and take into consideration social and environmental risk and, accordingly, to grant loans only to those projects that can evidence that their social and environmental impacts are properly managed. |
| • | The VIDA tool: implemented since 2004, the main aim of this tool is to assess the environmental risk of both current and potential individualized companies in commercial banking (Spain), using a system that classifies each of the companies into one of seven categories, depending on the degree of environmental risk incurred. |
4.5. Credit risk cycle
The credit risk management process consists of identifying, analyzing, controlling and deciding on, as appropriate, the risks incurred in the Group’s operations. The parties involved in this process are the business areas, senior management and the risk units.
The process involves the board of directors, the executive committee and the executive risk committee, which establishes the risk policies and procedures, and the limits and delegations of powers, and approves and supervises the scope of action of the risk function.
The risk cycle comprises three different phases: pre-sale, sale and post-sale. The process is being permanently updated, with the findings and conclusions of the post-sale phase being fed back into the risk analysis and planning of the pre-sale phase.
260
Table of Contents
4.5.1. Risk analysis and credit rating process
In general, risk analysis consists of examining the customer’s ability to meet its contractual obligations to the Bank. This involves analyzing the customer’s credit quality, its risk transactions, its solvency and the return to be obtained in view of the risk assumed.
Since 1993 the Group has used rating models for this purpose. These mechanisms are used in both the wholesale segment (sovereigns, financial institutions and corporate banking) and the other companies and institutions segment.
The rating is obtained from a quantitative module based on balance sheet ratios or macroeconomic variables and supplemented by the analyst’s expert judgment.
Ratings assigned to customers are reviewed periodically to include any new financial information available and the experience in the banking relationship. The frequency of the reviews is increased in the case of customers that reach certain levels in the automatic warning systems and of customers classified as requiring special monitoring. The rating tools themselves are also reviewed in order to progressively fine-tune the ratings they provide.
In contrast to the use of ratings in the wholesale and other companies and institutions segments, in the individuals segment, scoring techniques predominate; in general, these tools automatically assign a score to proposed transactions.
4.5.2. Risk limit planning and setting
The purpose of this phase is to efficiently and comprehensively limit the risk levels the Group assumes.
The credit risk planning process is used to establish the budgets and limits at portfolio or customer level depending on the segment in question.
Thus, the risk limits are planned and set using documents agreed upon by the business areas and risk units and approved by the executive risk committee or its delegated committees, which contain the expected results of transactions in terms of risk and return, as well as the limits applicable to the activity and the related risk management.
Risk limit planning is implemented through the commercial strategic plan (PEC), thus ensuring the coordination of the business plan, the risk-appetite-based lending policy and the resources required to implement it. This Plan serves as a reference for all the commercial banking businesses, and the highest-ranking executive risk committee of each entity is responsible for the approval and monitoring of the commercial strategic plans.
Also, an analysis is conducted at the customer level in the wholesale and other companies and institutions segments. When certain features concur, an individual limit is established for the customer (pre-classification).
Thus, for large corporate groups a pre-classification model based on an economic capital measurement and monitoring system is used. The result of the pre-classification is the maximum level of risk that can be assumed vis-à-vis a customer or group in terms of amount or maturity. In the companies segment, a simplified pre-classification model is applied for customers meeting certain requirements (thorough knowledge, rating, etc.).
Scenario analysis
Credit risk scenario analysis enables senior management to gain a clearer understanding of the performance of the portfolio in response to changing market and circumstantial conditions and it is a basic tool for assessing the adequacy of the provisions recognized and the capital held to cater for stress scenarios.
These analyses, which are performed for all the Group’s significant portfolios, comprise the following milestones:
| • | Definition of benchmark scenarios (at global level and for each of the Group units). |
261
Table of Contents
| • | Determination of the value of the risk metrics and parameters (probability of default, loss given default, non-performing loans ratio, etc.) in various scenarios. |
| • | Estimation of the expected loss associated with each of the scenarios considered and comparison of that loss against the level of provisions. |
| • | Analysis of the changes in the credit risk profile at portfolio, segment, unit and Group level in various scenarios and in comparison with previous years. |
The simulation models used by the Group rely on data from a complete economic cycle to calibrate the behavior of the credit risk parameters in response to changes in the macroeconomic variables. These models undergo regular backtesting and recalibration processes in order to ensure that they provide a correct reflection of the relationship between the macroeconomic variables and the risk parameters.
The risk and loss parameters are projected, usually with a three-year time horizon, using various economic scenarios that include the main macroeconomic variables (GDP, unemployment rate, housing prices, inflation, etc.).
The economic scenarios used are based on different stress levels, ranging from the base or most probable scenario to more stressed economic scenarios which, although less probable, could possibly arise.
These scenarios are generally defined by the Group’s economic research service, in coordination with each unit, using as a reference the data published by the main international organizations.
A global stress scenario is defined that describes a situation of worldwide crisis and the manner in which it affects each of the main geographical regions in which the Group is present. In addition, a local stress scenario is defined which, affecting certain of the Group’s main units in an isolated fashion, includes a higher level of stress than the global stress scenario.
At the meetings of the executive risk committee, senior management of the Group is apprised of the definitive set of scenarios to be used in conducting the Group’s stress test, after which it proposes any changes it deems appropriate and gives its formal approval.
4.5.3. Transaction decision-making
The sale phase comprises the decision-making process, the aim of which is to analyze and resolve upon transactions, since approval by the risk unit is a pre-requisite for the arrangement of any risk transaction. This process must consider the transaction approval policies defined and take into account both the risk appetite and any transaction elements that are important in achieving a balance between risk and return.
In the sphere of lower-revenue individuals, businesses and SMEs, the management of large volumes of loan transactions is facilitated by the use of automatic decision-making models that rate the customer/loan relationship. Thus, loans are classified in homogeneous risk groups using the rating assigned to the transaction by the model on the basis of information on the features of the transaction and the borrower.
As stated above, the preliminary limit-setting stage can follow two different paths, giving rise to different types of decisions in the companies sphere:
| • | Automatic decisions, consisting of verification by the business that the proposed transaction (in terms of amount, product, maturity and other conditions) falls within the limits authorized pursuant to the aforementioned pre-classification. This process is generally applied to corporate pre-classifications. |
| • | Decisions always requiring the analyst’s authorization, even if the transaction meets the amount, maturity and other conditions established in the pre-classified limit. This process applies to pre-classifications of retail banking companies. |
262
Table of Contents
Credit risk mitigation techniques
The Group applies various methods of reducing credit risk, depending, inter alia, on the type of customer and product. Some of these methods are specific to a particular type of transaction (e.g. real estate guarantees) while others apply to groups of transactions (e.g. netting and collateral arrangements).
The various mitigation techniques can be grouped into the following categories:
Netting by counterparty
Netting refers to the possibility of determining a net balance of transactions of the same type, under the umbrella of a master agreement such as an ISDA or similar agreement.
It consists of aggregating the positive and negative market values of the derivatives transactions entered into by the Group with a particular counterparty, so that, in the event of default, the counterparty owes the Group (or the Group owes the counterparty, if the net figure is negative) a single net figure and not a series of positive or negative amounts relating to each of the transactions entered into with the counterparty.
An important aspect of master agreements is that they represent a single legal obligation encompassing all the transactions they cover. This is the key to being able to set off the risks of all the transactions covered by the contract with the same counterparty.
Collateral
Collateral refers to the assets pledged by the customer or a third party to secure the performance of an obligation. Collateral may be:
| • | Financial: cash, security deposits, gold, etc. |
| • | Non-financial: property (both residential and commercial), other movable property, etc. |
From the risk acceptance standpoint, collateral of the highest possible quality is required. For regulatory capital calculation purposes, only collateral that meets the minimum quality requirements described in the Basel capital accords can be taken into consideration.
One very important example of financial collateral is the collateral agreement. Collateral agreements comprise a set of highly liquid instruments with a determined economic value that are deposited or transferred by a counterparty in favor of another party in order to guarantee or reduce any counterparty credit risk that might arise from the portfolios of derivative transactions between the parties in which there is exposure to risk.
Collateral agreements vary in nature but, whichever the specific form of collateralization may be, the ultimate aim, as with the netting technique, is to reduce counterparty risk.
Transactions subject to a collateral agreement are assessed periodically (normally on a daily basis). The agreed-upon parameters defined in the agreement are applied to the net balance arising from these assessments, from which the collateral amount (normally cash or securities) payable to or receivable from the counterparty is obtained.
With regard to real estate collateral, periodic re-appraisal processes are in place, based on the actual market values for the different types of real estate, which meet all the requirements established by the regulator.
When mitigation techniques are used, the minimum requirements established in the credit risk management policy manual are adhered to. In short, these consist of monitoring the following:
| • | Legal certainty. Collateral and guarantees must be examined to ensure that at all times it is possible to legally enforce the settlement thereof. |
| • | A substantial positive correlation must not exist between the counterparty and the value of the collateral. |
| • | Collateral and guarantees must be correctly documented. |
263
Table of Contents
| • | The availability of documentation of the methodologies used for each mitigation technique. |
| • | The appropriate periodic monitoring and control of the methodologies. |
Personal guarantees and credit derivatives
Personal guarantees are guarantees provided by a third party liable for another party’s obligations to the Group. They include, for example, bank guarantees and standby letters of credit. Only guarantees provided by third parties that meet the minimum requirements established by the supervisor can be recognized for capital calculation purposes.
Credit derivatives are financial instruments whose main purpose is to hedge credit risk by buying protection from a third party, whereby the Bank transfers the risk of the issuer of the underlying instrument. Credit derivatives are OTC instruments, i.e. they are not traded in organized markets. Credit derivative hedges, mainly credit default swaps, are entered into with leading financial institutions.
4.5.4. Monitoring
The monitoring function is based on a process of ongoing observation, which makes it possible to detect early any changes that might arise in customers’ credit quality, so that action can be taken to correct any deviations with an adverse impact.
Monitoring is based on the segmentation of customers, is performed by dedicated local and global risk teams and is complemented by the work performed by internal audit.
The function involves, inter alia, identifying and monitoring companies under special watch, reviewing ratings and the ongoing monitoring of specified indicators.
The system called “companies under special watch” (FEVE, using the Spanish acronym) distinguishes four categories based on the degree of concern raised by the circumstances observed (extinguish, secure, reduce and monitor). The inclusion of a position in the FEVE system does not mean that there has been a default, but rather that it is deemed advisable to adopt a specific policy for the position in question, to place a person in charge and to set the policy implementation period. Customers classified as FEVE are reviewed at least every six months, or every three months for those classified in the most severe categories. A company can be classified as FEVE as a result of the monitoring process itself, a review performed by internal audit, a decision made by the sales manager responsible for that company or the triggering of the automatic warning system.
Assigned ratings are reviewed at least annually, but should any weakness be detected, or depending on the rating itself, more frequent reviews are performed.
For exposures to lower-revenue individuals, businesses and SMEs, the key indicators are monitored in order to detect any variance in the performance of the loan portfolio with respect to the forecasts made in the credit management programs.
4.5.5. Measurement and control
In addition to monitoring customers’ credit quality, the Group establishes the control procedures required to analyze the current credit risk portfolio and the changes therein over the various credit risk phases.
The risk control function is performed by assessing risks from various complementary perspectives, the main pillars being control by geographical location, business area, management model, product, etc., thus facilitating the early detection of specific areas requiring attention and the preparation of action plans to correct possible impairment. Each control pillar can be analyzed in two ways:
Quantitative and qualitative analysis of the portfolio
In the analysis of the portfolio, any variances in the Group’s risk exposure with respect to budgets, limits and benchmarks are controlled on an ongoing and systematic basis, and the impacts of these variances in certain future situations, both those of an exogenous nature and those arising from strategic decisions, are assessed in order to establish measures aimed at placing the profile and amount of the risk portfolio within the parameters set by the Group.
264
Table of Contents
In addition to the traditional metrics, the following, inter alia, are used in the credit risk control phase:
| • | Change in non-performing loans (VMG, using the Spanish acronym): VMG measures the change in non-performing loans during a period, discounting loans charged-off and taking recoveries into account. It is an aggregate measure at portfolio level that enables action to be taken in the event of deteriorations in the trend of non-performing loans. |
It is calculated as the difference between the ending balance and the beginning balance of non-performing loans for the period in question, plus the loans charged-off in the period, less any previously charged-off loans recovered in that same period.
VMG and its component parts play a decisive role as monitoring variables.
| • | EL (expected loss) and capital: EL is the estimated financial loss that will occur over the next twelve months on the portfolio existing at any given time. |
It is an additional cost of the activity and must be charged in the transaction price. It is calculated using three basic parameters:
| • | EAD (exposure at default): the maximum amount that could be lost as a result of a default. |
| • | PD (probability of default): is the probability that a customer will default in the next twelve months. |
| • | LGD (loss given default): represents the percentage of exposure that will not be recovered in the event of default. To calculate the LGD, the amounts recovered throughout the recovery process are discounted to the time of default, and this figure is compared, on a percentage basis, with the amount owed by the customer at that date. |
Thus, other relevant factors are taken into account in estimating the risk involved in transactions, such as the quantification of off-balance-sheet exposures or the expected percentage of recoveries, in relation to the guarantees associated with the transaction and other characteristics of the transaction: type of product, term, etc.
The risk parameters are also used in the calculation of both economic and regulatory capital. The inclusion of capital metrics in management is fundamental to the rationalization of the use of capital.
Assessment of the control processes
This includes a systematic periodic review of the procedures and methodology, and is performed over the entire credit risk cycle to ensure that they are in force and effective.
In 2006, within the corporate framework established in the Group for compliance with the Sarbanes-Oxley Act, a corporate tool was made available on the Group’s intranet for the documentation and certification of all the sub-processes, operational risks and related mitigating controls. In this connection, the risk division assesses the efficiency of the internal control of its activities on an annual basis.
Furthermore, the internal risk validation function, as part of its mandate to supervise the quality of the Group’s risk management, guarantees that the systems for the management and control of the risks inherent to its activity comply with the strictest criteria and the best practices observed in the industry and/or required by the regulators. Also, internal audit is responsible for ensuring that the policies, methods and procedures are appropriate, effectively implemented and regularly reviewed.
4.5.6. Recovery management
Recovery is a significant function within the sphere of the Group’s risk management. This function is performed by the asset recovery and clean-up area (DRSA), a unit created in July 2013 with the aim of achieving greater efficiency in the asset recovery process, while at the same time developing a global strategy and a comprehensive approach for recovery management.
265
Table of Contents
The Group has in place a corporate management model that defines the general recovery action guidelines. These guidelines are applied in the various countries in which the Group has a presence, always taking into account the local peculiarities required for the recovery activity, due either to the local economic environment, to the business model or to a combination of both. The recovery units are business areas involving direct customer management and, accordingly, this corporate model has a business approach that creates value sustainably over time on the basis of effective and efficient collection management, achieved through either the return of unpaid balances to performing status or the full recovery thereof.
The recovery management model requires the proper coordination of all management areas (recovery business, commercial, technology and operations, human resources and risk) and the management processes and methodology supporting it are reviewed and enhanced on an ongoing basis, through the application of best practices developed in the various countries.
In order to manage recovery properly, action is taken in four main phases: early arrears management, recovery of non-performing loans, recovery of charged-off loans and management of foreclosed assets. In fact, the actions taken by the recovery function commence even before the first missed payment, i.e. when there are signs of a deterioration of the customer’s ability to pay, and they end when the customer’s debt has been paid or has returned to performing status. The recovery function aims to anticipate default events and focuses on preventive management.
The macroeconomic environment has a direct effect on the customer default rate. Therefore, the quality of the portfolios is fundamental to the development and growth of our businesses in the various countries, and particular attention is paid, on a permanent basis, to the debt collection and recovery functions in order to guarantee that this quality remains at the expected levels at all times.
The differing characteristics of customers make segmentation necessary in order to ensure proper recovery management. The mass management of large groups of customers with similar profiles and products is performed using highly technological processes, while personalized management is reserved for customers who, due to their profile, require the assignment of a specific manager and a more tailored analysis.
The recovery activity has been aligned with the social and economic reality of the different countries, and various management mechanisms have been used, all involving appropriate criteria, based on the age, collateral and conditions of the transaction, while always ensuring that, at least, the required ratings and provisions are maintained.
Within the recovery function particular emphasis has been placed on using the mechanisms referred to above for early arrears management, in accordance with corporate policies, considering the various local realities and closely monitoring the production, inventory and performance of those local areas. The aforementioned policies are reviewed and adapted periodically in order to reflect both best management practices and any applicable regulatory amendments.
In addition to the measures aimed at adapting transactions to the customer’s ability to pay, special mention should be made of recovery management, in which alternative solutions to legal action are sought to ensure the early collection of debts.
One of the channels for the recovery of debts of customers whose ability to pay has deteriorated severely is foreclosure (either court-ordered or through dación en pago, or a transfer of an asset in lieu of cash payment, as non-recourse settlement of a debt) of the property assets securing the transactions. In geographical regions that are highly exposed to real estate risk, such as Spain, the Group has very efficient instruments in place to manage the sale of such assets, making it possible to maximize recovery and reduce the on-balance-sheet stock of property assets at a much faster pace than at other financial institutions.
Forborne loan portfolio
The term “forborne loan portfolio” refers, for the purposes of the Group’s risk management, to those transactions in which the customer has, or might foreseeably have, financial difficulty in meeting its payment obligations under the terms and conditions of the current agreement and, accordingly, the agreement has been modified or cancelled or even a new transaction has been entered into.
266
Table of Contents
The Group has a detailed customer debt forbearance policy that serves as a reference for the various local adaptations made for all the financial institutions forming part of the Group. This policy shares the general principles laid down in both Bank of Spain Circular 6/2012 and the technical standards published by the European Banking Authority in 2014, which it develops in greater detail based on the level of customer impairment.
This policy establishes strict criteria for the assessment of these exposures:
| • | The use of this practice is restricted, and any actions that might defer the recognition of impairment must be avoided. |
| • | The main aim must be to recover the amounts owed, and any amounts deemed unrecoverable must be recognized as soon as possible. |
| • | Forbearance must always assume the existing guarantees will remain in place and, if possible, be enhanced. Not only can effective guarantees serve to mitigate losses given default, but they might also reduce the probability of default. |
| • | This practice must not give rise to the granting of additional funding, or be used to refinance debt of other entities or as a cross-selling instrument. |
| • | All the alternatives to forbearance and their impacts must be assessed, making sure that the results of this practice will exceed those which would foreseeably be obtained if it were not performed. |
| • | Forborne transactions are classified using more stringent criteria, which prudentially ensure that the customer’s ability to pay is restored from the date of forbearance and for an adequate period of time thereafter. |
| • | In addition, in the case of customers that have been assigned a risk analyst, it is particularly important to conduct an individual analysis of each specific case, for both the proper identification of the transaction and its subsequent classification, monitoring and adequate provisioning. |
The forbearance policy also sets out various criteria for determining the scope of transactions qualifying as forborne exposures by defining a detailed series of objective indicators that are indicative of situations of financial difficulty.
Accordingly, transactions not classified as non-performing at the date of forbearance are generally considered to be experiencing financial difficulty if at that date they were more than one month past due. Where no payments have been missed or there are no payments more than one month past due, other indicators of financial difficulty are taken into account, including most notably the following:
| • | Transactions with customers who are already experiencing difficulties in other transactions. |
| • | Situations where a transaction has to be modified prematurely, and the Group has not yet had a previous satisfactory experience with the customer. |
| • | Cases in which the necessary modifications entail the grant of special conditions, such as the establishment of a grace period, or where these new conditions are deemed to be more favorable for the customer than those which would have been granted for an ordinary loan approval. |
| • | Where a customer submits successive loan modification requests at unreasonable time intervals. |
| • | In any case, if once the modification has been made any payment irregularity arises during a given probation period (as evidenced by backtesting), even in the absence of any other symptoms, the transaction will be deemed to be within the scope of forborne exposures. |
Once it has been determined that the reasons for the modification relate to financial difficulties, for management purposes a distinction is made between two types of forbearance based on the original classification of the transactions: ex-ante forbearance, when the original transaction was classified as other than non-performing; and ex-post forbearance, when it had previously been classified as non-performing.
In addition, within the category of ex-post forbearance, distinct treatments are established for cases of advanced impairment, the classification requirements and criteria for which are even more stringent than those for other forborne transactions.
267
Table of Contents
As regards the strategies to be applied, corporate policy requires the customer’s ability and willingness to pay to be analyzed and a distinction to be drawn between the severity and the estimated duration of the impairment. The results of this analysis will be used as a basis for deciding whether the debt should be forborne and the most appropriate way of doing so for each case:
| • | When borrowers display a severe but transitory deterioration in their ability to pay (which is expected to be recovered in a short space of time), short-term adjustment strategies are applied, such as a payment moratorium on the principal or the reduction of instalments for a short, limited period until the ability to pay is recovered. |
| • | When borrowers display a slight deterioration in their ability to pay (an early recovery of which is not expected), more long-term strategies are applied, such as reducing instalments by deferring either the maturity date or a portion of the principal, which would be paid at the same time as the last instalment, at all times securing its payment through the provision of effective guarantees. |
In any case, through a case-by-case analysis, priority is given to modifications for customers displaying a slight but prolonged deterioration, since those experiencing severe but transitory deterioration carry a higher risk, as they depend on the accuracy of the estimated time of their future recovery. Cases of severe deterioration deemed to be prolonged over time are not considered for forbearance.
Corporate policy also establishes mechanisms for the management and control of forborne transactions, allowing them to be treated in a different way from other transactions, with particular attention being paid to the processes of:
| • | Planning and budgeting, including preparing the pertinent business plans, projections and limits for the most relevant aggregates. |
| • | Monitoring the performance of the portfolio and assessing the extent to which performance is in line with the projections prepared in the planning phase. |
Once forbearance measures have been adopted, transactions that have to remain classified as non-performing because at the date of forbearance they do not meet the requirements to be classified in a different category9 must comply with a prudential payment schedule in order to assure reasonable certainty as to the recovery of the customer’s ability to pay.
If there is any (non-technical) default in payments during that period, the aforementioned payment schedule starts again.
On successful completion of the period, the duration of which depends on the customer’s situation and the transaction features (term and guarantees provided), the transaction is no longer considered to be impaired, although it continues to be subject to a probationary period during which it undergoes special monitoring.
This monitoring continues until a series of requirements have been met, including most notably: a minimum observation period; repayment of a substantial percentage of the outstanding amounts; and settlement of the amounts that were past due at the time of forbearance.
When forbearance is applied to a transaction classified as non-performing, the original default dates continue to be considered for all purposes, irrespective of whether as a result of forbearance the transaction becomes current in its payments. Also, the forbearance of a transaction classified as non-performing does not give rise to any release of the related provisions.
By contrast, if following arrangement of forbearance there is no improvement in the customer’s payment performance, the possibility of extending new forbearance measures will be considered, with the application of more stringent classification/return-to-performing criteria. In this regard, the Group’s policy establishes a longer period (between 6 and 36 months) of uninterrupted payments before the transaction can return to performing status (between 3 and 12 months in the case of first forbearances). The duration of this period is determined by any collateral provided and the residual maturity of the loan. The Group’s policy permits a maximum of one modification per year and three modifications every five years.
| 9 | Bank of Spain Circular 6/2012: the refinancing or restructuring of transactions that are not current in their payments does not interrupt their arrears, nor does it give rise to their reclassification to one of the previous categories, unless there is reasonable certainty that the customer will be able to meet its payment obligations within the established time frame or new effective collateral is provided, and, in both cases, at least the ordinary outstanding interest is received, without taking into account late-payment interest. |
268
Table of Contents
The internal models used by the Group for provisioning purposes include forborne transactions as follows:
| • | Customers not subject to individual monitoring: the internal models consider forborne transactions as a distinct segment with its own probability of default calculated on the basis of past experience, considering, among other factors, the performance of the successive forbearance measures. |
| • | Customers subject to individual monitoring: the internal rating is an essential input in determining the probability of default and it takes into consideration the existence of successive forbearance measures. This rating must be updated at least once every six months for customers with forborne transactions. |
At December 31, 2014, €18,849 million of the Group’s forborne loan portfolio (33% of the total forborne portfolio) had undergone several modifications.
Quantitative information required by Bank of Spain Circular 6/2012
Set forth below is the quantitative information required by Bank of Spain Circular 6/2012 on the restructured/refinanced transactions in force at December 31, 2014. The following terms are used in Bank of Spain Circular 6/2012 with the meanings specified:
| • | Refinancing transaction: transaction granted or used for reasons relating to current or foreseeable financial difficulties the borrower may have in repaying one or more of the transactions granted to it, or through which the payments on such transactions are brought fully or partially up to date, in order to enable the borrowers of cancelled or refinanced transactions to repay the debt (principal and interest) because the borrower is unable, or might foreseeably become unable, to comply with the conditions thereof in due time and form. |
| • | Restructured transaction: transaction with respect to which, for economic or legal reasons relating to current or foreseeable financial difficulties of the borrower, the financial terms and conditions are modified in order to facilitate the payment of the debt (principal and interest) because the borrower is unable, or might foreseeably become unable, to comply with the aforementioned terms and conditions in due time and form, even if such modification is contemplated in the agreement. |
269
Table of Contents
CURRENT REFINANCING AND RESTRUCTURING BALANCES (a)
| Millions of euros | ||||||||||||||||||||||||||||||||||||||||||||||||||||||||||||||||||||||||||||||||||||||||||||
| Standard (b) | Substandard | Non-performing | ||||||||||||||||||||||||||||||||||||||||||||||||||||||||||||||||||||||||||||||||||||||||||
| Full property mortgage guarantee |
Other collateral (c) |
Without collateral |
Full property mortgage guarantee |
Other collateral (c) |
Without collateral |
Full property mortgage guarantee |
Other collateral (c) |
Without collateral |
Total | |||||||||||||||||||||||||||||||||||||||||||||||||||||||||||||||||||||||||||||||||||
| Number of transactions |
Gross amount |
Number of transactions |
Gross amount |
Number of transactions |
Gross amount |
Number of transactions |
Gross amount |
Number of transactions |
Gross amount |
Number of transactions |
Gross amount |
Allowance | Number of transactions |
Gross amount |
Number of transactions |
Gross amount |
Number of transactions |
Gross amount |
Allowance | Number of transactions |
Gross amount |
Allowance | ||||||||||||||||||||||||||||||||||||||||||||||||||||||||||||||||||||||
| Public sector |
6 | 18 | 12 | 294 | 89 | 562 | 6 | 14 | — | — | 3 | 4 | 4 | 2 | 3 | — | — | 22 | 43 | 11 | 140 | 938 | 15 | |||||||||||||||||||||||||||||||||||||||||||||||||||||||||||||||||||||
| Other legal entities and individual traders |
6,019 | 2,644 | 14,907 | 1,249 | 57,125 | 2,968 | 5,526 | 1,978 | 6,200 | 1,466 | 38,674 | 1,427 | 910 | 10,608 | 5,651 | 8,704 | 6,321 | 69,546 | 4,522 | 8,003 | 217,309 | 28,226 | 8,913 | |||||||||||||||||||||||||||||||||||||||||||||||||||||||||||||||||||||
| Of which: Financing for construction and property development |
355 | 471 | 44 | 39 | 119 | 3 | 819 | 579 | 149 | 475 | 354 | 61 | 406 | 2,685 | 2,830 | 1,394 | 2,857 | 375 | 591 | 3,297 | 6,294 | 7,906 | 3,703 | |||||||||||||||||||||||||||||||||||||||||||||||||||||||||||||||||||||
| Other individuals |
66,147 | 5,099 | 543,763 | 7,090 | 853,873 | 1,587 | 37,154 | 3,642 | 17,096 | 2,142 | 344,797 | 951 | 556 | 32,889 | 2,189 | 81,953 | 2,912 | 862,280 | 1,927 | 2,585 | 2,839,952 | 27,539 | 3,141 | |||||||||||||||||||||||||||||||||||||||||||||||||||||||||||||||||||||
|
|
|
|
|
|
|
|
|
|
|
|
|
|
|
|
|
|
|
|
|
|
|
|
|
|
|
|
|
|
|
|
|
|
|
|
|
|
|
|
|
|
|
|
|
|
|
|||||||||||||||||||||||||||||||||||||||||||||||
| Total |
72,172 | 7,761 | 558,682 | 8,633 | 911,087 | 5,117 | 42,686 | 5,634 | 23,296 | 3,608 | 383,474 | 2,382 | 1,470 | 43,499 | 7,843 | 90,657 | 9,233 | 931,848 | 6,492 | 10,599 | 3,057,401 | 56,703 | 12,069 | |||||||||||||||||||||||||||||||||||||||||||||||||||||||||||||||||||||
|
|
|
|
|
|
|
|
|
|
|
|
|
|
|
|
|
|
|
|
|
|
|
|
|
|
|
|
|
|
|
|
|
|
|
|
|
|
|
|
|
|
|
|
|
|
|
|||||||||||||||||||||||||||||||||||||||||||||||
| (a) | Including all refinanced or restructured transactions as defined in section 1.g) of Annex IX of Bank of Spain Circular 4/2004 |
| (b) | Standard risks classified as under special monitoring pursuant to section 7.a) of Annex IX of Bank of Spain Circular 4/2004 |
| (c) | Including transactions without a full property mortgage guarantee, i.e. with a loan-to-value ratio of more than 1, and transactions with collateral other than a real estate mortgage, irrespective of their loan-to-value ratio |
270
Table of Contents
The transactions presented in the foregoing tables were classified at December 31, 2014, by nature, as follows:
| • | Non-performing: transactions that are in the process of being returned to performing status, those for which advantageous conditions had to be granted that would not have been granted for an ordinary loan approval or those which, having been classified as standard or substandard, have again encountered payment difficulties during the term of the transaction. |
| • | Substandard: transactions previously classified as non-performing with respect to which, following forbearance, sustained payments have been made for a certain period, depending on the transaction features and the type of guarantee, and transactions previously classified as standard: i) which have been granted an initial grace period and will remain in this category until three monthly instalments (or the equivalent) have been paid after the grace period, or ii) that following forbearance have become non-performing (default). |
| • | Standard: transactions previously classified as non-performing or substandard which have successfully completed the precautionary observation periods established in the corporate policy evidencing that payment capacity pursuant to the terms established has been restored, and transactions classified as standard at the date of forbearance, until they meet the requirements to cease to be subject to the special monitoring described above. |
The table below shows the changes in 2014 in the forborne loan portfolio:
| Millions of euros | 2014 | |||
| Beginning balance |
53,602 | |||
| Of which: Other than non-performing |
29,961 | |||
| Non-performing assets |
23,641 | |||
| Additions |
15,391 | |||
| Inclusions in the scope of consolidation |
6,330 | |||
| Reductions (*) |
(18,620 | ) | ||
| Balance at end of year |
56,703 | |||
| Of which: Other than non-performing |
33,135 | |||
| Non-performing assets |
23,568 | |||
| (*) | Including, mainly, debt repayments, foreclosures and write-offs and transactions that have ceased to be subject to special monitoring because the aforementioned requirements have been met. |
On a comparable basis with respect to the 2013 scope of consolidation, the level of forborne transactions at the Group fell by 6% (€3,229 million), thus continuing the downward trend of the previous year.
58% of the forborne loan transactions are classified as other than non-performing. Particularly noteworthy are the level of existing secured loans (75% of transactions are secured by collateral) and the coverage provided by specific allowances (representing 21% of the total forborne loan portfolio and 45% of the non-performing portfolio).
271
Table of Contents
| A. | Activities subject to market risk and types of market risk |
The perimeter of activities subject to market risk covers those transactions where capital risk is assumed as a result of changes in market conditions, including both trading risks as well as structural risks that are also affected by movements in markets.
This risk comes from the change in risk factors -interest rates, inflation rates, exchange rates, share prices, the spread on loans, commodity prices and the volatility of each of these elements—as well as from the liquidity risk of the various products and markets in which the Group operates.
| • | Interest rate risk is the possibility that changes in interest rates could adversely affect the value of a financial instrument, a portfolio or the Group as a whole. It affects, among others, loans, deposits, debt securities, most assets and liabilities of trading portfolios as well as derivatives. |
| • | Inflation rate risk is the possibility that changes in inflation rates could adversely affect the value of a financial instrument, a portfolio or the Group as a whole. It affects, among others, loans, debt securities and derivatives, whose yield is linked to inflation or to a real rate of variation. |
| • | Exchange rate risk is the sensitivity of the value of a position in a currency different to the base currency to a potential movement in exchange rates. A long position or one bought in a foreign currency would produce a loss in the event that the currency depreciates against the base currency. Among the positions affected by this risk are non-euro investments in subsidiaries, as well as loans, securities and derivatives denominated in foreign currencies. |
| • | Equity risk is the sensitivity of the value of open positions in equities to adverse movements in the market prices or in expectations of future dividends. Among other instruments, this affects positions in shares, stock market indices, convertible bonds and derivatives using shares as the underlying asset (put, call, and equity swaps). |
| • | Credit spread risk is the risk or sensitivity of the value of open positions in fixed income securities or in credit derivatives to movements in credit spread curves or in recovery rates associated with issuers and specific types of debt. The spread is a differential between financial instruments that trade with a spread over other reference instruments, mainly the yield on government securities and interbank rates. |
| • | Commodities price risk is the risk derived from the effect of potential changes in prices. The Group’s exposure to this risk is not significant and is concentrated in derivative transactions on commodities with clients. |
| • | Volatility risk is the risk or sensitivity of the value of a portfolio to changes in the volatility of risk factors: interest rates, exchange rates, shares, credit spreads and commodities. This risk is incurred by financial instruments which have volatility as a variable in their valuation model. The most significant case is portfolios of financial options. |
All these market risks can be partly or fully mitigated by using options, futures, forwards and swaps.
There are other types of market risk, whose coverage is more complex. They are the following:
| • | Correlation risk is the sensitivity of the value of a portfolio to changes in the relation between risk factors, either of the same type (for example, between two exchange rates) or of a different nature (for example, between an interest rate and the price of a commodity). |
| • | Market liquidity risk is that of a Group entity or the Group as whole finding itself unable to get out of or close a position in time without impacting on the market price or on the cost of the transaction. This risk can be caused by a fall in the number of market makers or institutional investors, the execution of large volumes of transactions and market instability, increasing with the concentration existing in certain products and currencies. |
272
Table of Contents
| • | Risk of prepayment or cancellation. When in certain transactions the contract allows, explicitly or implicitly, cancellation before the maturity without negotiation there is a risk that the cash flows have to be reinvested at a potentially lower interest rate. This mainly affects loans or mortgage securities. |
| • | Underwriting risk. This occurs as a result of an entity’s participation in underwriting a placement of securities or another type of debt, assuming the risk of partially owning the issue or the loan due to non-placement of all of it among potential buyers. |
Pension, actuarial and fiduciary risks, which are described later on, also depend on movements in market factors.
On the basis of the finality of the risk, activities are segmented in the following way:
| a) | Trading: financial services to customers and purchase-sale and positioning mainly in fixed-income, equity and currency products. The Global Banking and Markets (GBM) division is mainly responsible for managing it. |
| b) | Structural risks: we distinguish between balance sheet risks and pension and actuarial risks: |
| b.1) | Structural balance sheet risks: market risks inherent in the balance sheet excluding the trading portfolio. Management decisions on these risks are taken by the ALCO committees of each country in coordination with the Group’s ALCO committee and are executed by the financial management division. This management seeks to inject stability and recurrence into the financial margin of commercial activity and to the Group’s economic value, maintaining adequate levels of liquidity and solvency. The risks are: |
| • | Structural interest rate risk. This arises from mismatches in the maturities and repricing of all assets and liabilities. |
| • | Structural exchange rate risk/hedging of results. Exchange rate risk occurs when the currency in which the investment is made is different from the euro in companies that consolidate and those that do not (structural exchange rate). In addition, the positions of exchange rate hedging of future results generated in currencies other than the euro (hedging of results) are also included. |
| • | Structural equity risk. This involves investments via stakes in financial or non-financial companies that are not consolidated, as well as portfolios available for sale formed by equity positions. |
| b.2) | Pension and actuarial risk |
| • | Pension risk: the risk assumed by the Bank in relation to the pension commitments with its employees. The risk lies in the possibility that the fund does not cover these commitments in the period of accrual of the provision and the profitability obtained by the portfolio is not sufficient and obliges the Group to increase the level of contributions. |
| • | Actuarial risk: unexpected losses produced as a result of an increase in the commitments with the insurance takers, as well as losses from an unforeseen rise in costs. |
| B. | Trading market risks |
| 1. | Quantitative analysis |
The Group’s trading risk exposure remained low in 2014, in line with previous years, due to the fact that most of the activity involves providing services to its clients, as well as geographic and risk diversification.
273
Table of Contents
| 1.1. | Value at Risk (VaR) analysis |
The Group maintained its strategy of concentrating its trading activity in its customer business. This was reflected in the VaR evolution of the trading portfolio of global wholesale banking, which was around the average of the last three years and ended 2014 at €10.5 million12.
EVOLUTION OF VaR 2012-2014
Millions of euros. VaR at 99%, with a time frame of one day
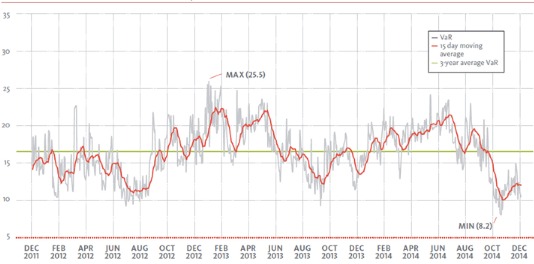
During 2014 VaR fluctuated between €8.2 million and €23.8 million. The main increases were linked to the Brazilian treasury’s changes in exposure to exchange rates and Spain’s treasury’s changes in exposure to interest rates and credit spreads.
The average VaR in 2014 was €16.9 million, in line with two previous years (€17.4 million in 2013 and €14.9 million in 2012) due to the concentration of activity in customers as discussed above.
The histogram below shows the distribution of average risk in terms of VaR between 2012 and 2014 where the accumulation of days with levels between €9.5 million and €21.5 million can be seen (93%). The higher values of €21.5 million (5%) were concentrated in periods mainly affected by one-off rises in volatility of the Brazilian currency and by the eurozone’s sovereign debt crisis.
VaR RISK HISTOGRAM
VaR at 99%, with a time frame of one day
| 12 | Relative to the trading activity of global wholesale banking (GWB) in financial markets. In addition to the trading activity of GWB, there are other positions catalogued for accounting purposes. The total VaR of trading of this accounting perimeter was €11.3 million. |
274
Table of Contents
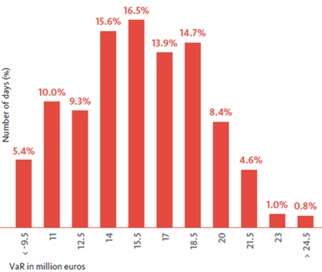
Risk by factor
The average and year-end values in VaR terms at 99% for the last three years as well as their minimum and maximum values and the expected shortfall (ES) at 97.5%13 in 2014 were as follows:
VaR STATISTICS BY RISK FACTOR14,15
Millions of euros. VaR at 99%, with a time frame of one day
| 13 | Item “Stressed VaR (SVaR) and expected shortfall (ES)” sets out the definition of this metric. Following the recommendation of the Basel Committee in its Fundamental review of the trading book: A revised market risk framework (October 2013), the confidence level of 97.5% means approximately a risk level similar to that which the VaR captures with a 99% confidence level. |
| 14 | The VaR of global activities includes operations that are not assigned to any particular country. |
| 15 | In Latin America, the U.S. and Asia, the VaR levels of the credit spread and commodity factors are not shown separately because of their limited or zero materiality. |
275
Table of Contents
| 2014 | 2013 | 2012 | ||||||||||||||||||||||||||||||||||||
| VaR (99%) | ES (97.5%) | VaR | VaR | |||||||||||||||||||||||||||||||||||
| Minimum | Average | Maximum | Year-end | Year-end | Average | Year-end | Average | Year-end | ||||||||||||||||||||||||||||||
| Total Trading |
Total |
8.2 | 16.9 | 23.8 | 10.5 | 11.4 | 17.4 | 13.1 | 14.9 | 18.5 | ||||||||||||||||||||||||||||
| Diversification effect |
(5.2 | ) | (13.0 | ) | (27.9 | ) | (9.3 | ) | (9.9 | ) | (16.2 | ) | (12.3 | ) | (15.2 | ) | (13.5 | ) | ||||||||||||||||||||
| Interest rate VaR |
8.1 | 14.2 | 22.2 | 10.5 | 11.7 | 12.7 | 8.5 | 11.8 | 12.0 | |||||||||||||||||||||||||||||
| Equity VaR |
1.1 | 2.7 | 8.9 | 1.8 | 1.3 | 5.6 | 4.7 | 7.0 | 7.1 | |||||||||||||||||||||||||||||
| FX VaR |
1.3 | 3.5 | 10.2 | 2.9 | 2.8 | 5.4 | 4.7 | 5.0 | 3.5 | |||||||||||||||||||||||||||||
| Credit spread VaR |
4.2 | 9.3 | 15.9 | 4.6 | 5.3 | 9.6 | 7.2 | 6.1 | 9.1 | |||||||||||||||||||||||||||||
| Commodities VaR |
0.1 | 0.3 | 0.5 | 0.1 | 0.2 | 0.3 | 0.3 | 0.4 | 0.3 | |||||||||||||||||||||||||||||
| Europe |
Total |
5.9 | 12.2 | 18.0 | 7.3 | 7.3 | 13.9 | 9.9 | 11.0 | 16.4 | ||||||||||||||||||||||||||||
| Diversification effect |
(1.9 | ) | (9.2 | ) | (22.8 | ) | (5.5 | ) | (5.8 | ) | (14.1 | ) | (9.0 | ) | (12.9 | ) | (9.9 | ) | ||||||||||||||||||||
| Interest rate VaR |
4.6 | 8.9 | 13.0 | 6.2 | 6.3 | 9.3 | 6.6 | 7.9 | 6.8 | |||||||||||||||||||||||||||||
| Equity VaR |
0.8 | 1.7 | 8.1 | 1.0 | 0.8 | 4.3 | 2.6 | 6.2 | 6.3 | |||||||||||||||||||||||||||||
| FX VaR |
0.7 | 2.9 | 9.8 | 1.5 | 1.8 | 5.2 | 3.7 | 4.1 | 4.0 | |||||||||||||||||||||||||||||
| Credit spread VaR |
2.7 | 7.6 | 14.1 | 3.9 | 4.1 | 9.0 | 5.8 | 5.4 | 8.9 | |||||||||||||||||||||||||||||
| Commodities VaR |
0.1 | 0.3 | 0.5 | 0.1 | 0.2 | 0.3 | 0.3 | 0.4 | 0.3 | |||||||||||||||||||||||||||||
| Latin America |
Total |
6.3 | 12.3 | 26.7 | 9.8 | 10.1 | 11.1 | 6.9 | 10.1 | 8.9 | ||||||||||||||||||||||||||||
| Diversification effect |
0.4 | (3.5 | ) | (12.2 | ) | (12.2 | ) | (3.7 | ) | (5.3 | ) | (6.7 | ) | (6.4 | ) | (3.8 | ) | |||||||||||||||||||||
| Interest rate VaR |
5.2 | 11.3 | 24.2 | 9.8 | 10.6 | 9.6 | 5.9 | 8.8 | 8.8 | |||||||||||||||||||||||||||||
| Equity VaR |
0.7 | 2.1 | 5.0 | 3.0 | 1.4 | 3.2 | 2.9 | 3.1 | 1.6 | |||||||||||||||||||||||||||||
| FX VaR |
0.7 | 2.0 | 9.2 | 9.2 | 1.9 | 3.5 | 4.7 | 3.1 | 1.3 | |||||||||||||||||||||||||||||
| US and Asia |
Total |
0.4 | 0.7 | 1.6 | 0.7 | 0.9 | 0.8 | 0.5 | 0.9 | 0.8 | ||||||||||||||||||||||||||||
| Diversification effect |
(0.1 | ) | (0.3 | ) | (1.0 | ) | (0.2 | ) | (0.7 | ) | (0.4 | ) | (0.2 | ) | (0.5 | ) | (0.3 | ) | ||||||||||||||||||||
| Interest rate VaR |
0.3 | 0.7 | 1.6 | 0.7 | 0.7 | 0.7 | 0.5 | 0.7 | 0.6 | |||||||||||||||||||||||||||||
| Equity VaR |
0.0 | 0.1 | 0.5 | 0.0 | 0.0 | 0.1 | 0.0 | 0.2 | 0.1 | |||||||||||||||||||||||||||||
| FX VaR |
0.1 | 0.3 | 0.6 | 0.2 | 0.9 | 0.4 | 0.2 | 0.6 | 0.4 | |||||||||||||||||||||||||||||
| Global activities | Total |
1.6 | 2.3 | 9.0 | 1.9 | 2.2 | 1.5 | 2.0 | 2.7 | 1.2 | ||||||||||||||||||||||||||||
| Diversification effect |
0.0 | (0.6 | ) | (3.4 | ) | (0.6 | ) | (0.5 | ) | (0.3 | ) | (0.5 | ) | (0.6 | ) | (0.3 | ) | |||||||||||||||||||||
| Interest rate VaR |
0.2 | 0.6 | 3.0 | 0.4 | 0.4 | 0.3 | 0.4 | 0.3 | 0.2 | |||||||||||||||||||||||||||||
| Credit spread VaR |
1.4 | 2.2 | 9.3 | 1.9 | 2.1 | 1.5 | 2.1 | 2.6 | 1.3 | |||||||||||||||||||||||||||||
| FX VaR |
0.0 | 0.0 | 0.2 | 0.2 | 0.2 | 0.1 | 0.0 | 0.4 | 0.1 | |||||||||||||||||||||||||||||
The proximity of the expected shortfall to VaR shows that the risk of high losses of low probability (tail risk) is not high, at least bearing in mind the historic window of the last two years.
The average VaR decreased slightly in 2014 by €0.5 million, and by €2.6 million if compared with the year-end figures. By risk factor, the average VaR increased in interest rates and declined in exchange rates, equities and credit spreads. By geographic zones, it rose in Latin America and global activities and declined in Europe, the United States and Asia.
The VaR evolution by risk factor in general was stable in the last few years. The transitory rises in VaR of various factors is explained more by transitory increases in the volatility of market prices than by significant changes in positions.
276
Table of Contents
VaR BY RISK FACTOR
Millions of euros, VaR at 99% with a time frame of one day (15-day moving average)
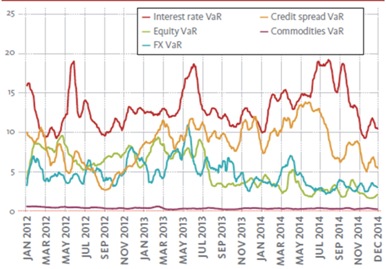
Lastly, the table below compares the VaR figures with stressed VaR figures for trading activity in Spain and Brazil, whose treasuries were those that experienced the Group’s largest average VaR in 2014.
STRESSED VaR STATISTICS VERSUS VaR IN 2014: TREASURIES IN SPAIN AND BRAZIL
Millions of euros. Stressed VaR and VaR at 99% with time frame of one day
| 2014 | 2013 | |||||||||||||||||||||||||
| Min | Avg. | Max | Year-end | Avg. | Year-end | |||||||||||||||||||||
| Spain |
VaR (99%) |
3.2 | 7.1 | 12.9 | 4.1 | 10.7 | 2.3 | |||||||||||||||||||
| Stressed VaR (99%) | 7.9 | 15.3 | 24.8 | 21.4 | 12.2 | 5.7 | ||||||||||||||||||||
| Brazil |
VaR (99%) |
4.9 | 10.4 | 23.7 | 8.5 | 9.1 | 4.8 | |||||||||||||||||||
| Stressed VaR (99%) | 6.0 | 14.2 | 35.3 | 25.6 | 17.2 | 11.4 | ||||||||||||||||||||
1.2. Gauging and contrasting measures
The real losses can differ from the forecasts by the VaR for various reasons related to the limitations of this metric, which is set out in detail later in the section on the methodologies. The Group regularly analyses and evaluates the accuracy of the VaR calculation model in order to confirm its reliability.
The most important test consists of backtesting exercises, analyzed at the local and global levels and in all cases with the same methodology. Backtesting consists of comparing the forecast VaR measurements, with a certain level of confidence and time frame, with the real results of losses obtained in the same time frame. This enables anomalies in the VaR model of the portfolio in question to be detected (for example, shortcomings in the parameterization of the valuation models of certain instruments, not very adequate proxies, etc.).
277
Table of Contents
We calculate and evaluate three types of backtesting:
| • | “Clean” backtesting: the daily VaR is compared with the results obtained without taking into account the intraday results or the changes in the portfolio’s positions. This method contrasts the effectiveness of the individual models used to assess and measure the risks of the different positions. |
| • | Backtesting on complete results: the daily VaR is compared with the day’s net results, including the results of the intraday operations and those generated by commissions. |
| • | Backtesting on complete results without mark-ups or commissions: the daily VaR is compared with the day’s net results from intraday operations but excluding those generated by mark-ups and commissions. This method aims to give an idea of the intraday risk assumed by the Group’s treasuries. |
For the first case and the total portfolio, there was one exception in 2014 of Value at Earnings (VaE) at 99% (days when the daily loss was higher than the VaR) on June 6, 2014 mainly due to Mexico because of the drop in sovereign yield curves and swaps (nominal and indexed to inflation UDI), following the Bank of Mexico’s cut of 50 basis points to 3% in the benchmark interest rate, which was not discounted by the market.
There was also an exception of VaR at 99% (days when the daily loss was higher than the VaR) on October 16, 2014 mainly due to Spain, because of the rise in credit spreads in Europe and the decline in stock market indexes.
The number of exceptions reflected the expected performance of the VaR calculation model, which works with a confidence level of 99% and an analysis period of one year (over a longer period of time, an average of two or three exceptions a year is expected).
BACKTESTING OF BUSINESS PORTFOLIOS: DAILY RESULTS VERSUS PREVIOUS DAY’S VALUE AT RISK (Millions of euros)
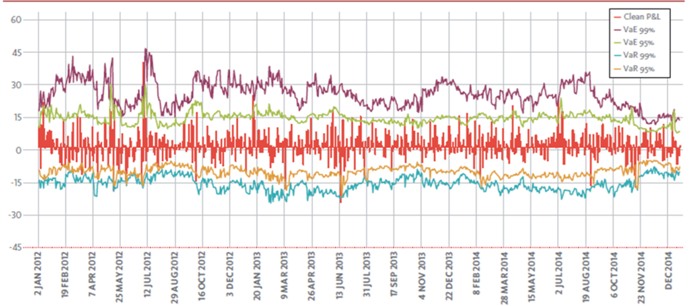
278
Table of Contents
1.3. Distribution of risks and management results16
Geographic distribution
In trading activity, the average contribution of Latin America to the Group’s total VaR in 2014 was 49.4% compared with a contribution of 44.7% in economic results. Europe, with 48.6% of global risk, contributed 49.1% of results. In relation to prior years, there was a gradual homogenization in the profile of activity in the Group’s different units, focused generally on providing service to professional and institutional clients.
Below is the geographic contribution (by percentage) to the Group total, both in risks, measured in VaR terms, as well as in results, measured in economic terms.
VaR BINOMIAL-MANAGEMENT RESULTS: GEOGRAPHIC DISTRIBUTION
Average VaR (at 99%, with a time frame of one day) and annual accumulated management result (millions of euros); percentage of annual totals.
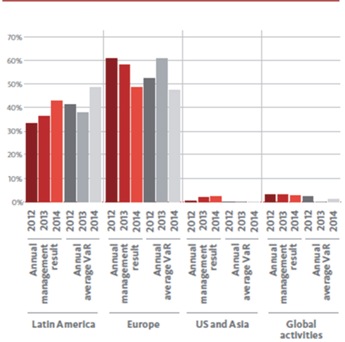
Monthly distribution of risks and results
The next chart shows the risk assumption profile, in terms of VaR, compared to results in 2014. The average VaR remained relatively stable, although on a downward path to some extent in the second half of the year, while results evolved in a more irregular way during the year. January and June were positive months and months from August onward were less positive.
DISTRIBUTION OF RISK BY TIME AND RESULTS IN 2014: PERCENTAGES OF ANNUAL TOTALS
Average VaR (at 99%, with a time frame of one day) and annual accumulated management result (millions of euros); percentage of annual totals.
| 16 | Results in terms that can be assimilated to the gross margin (excluding operating costs, financial ones are the only cost). |
279
Table of Contents
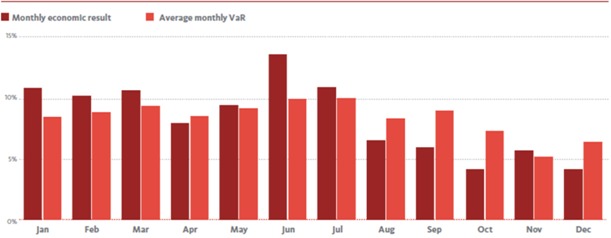
The following histogram of frequencies shows the distribution of daily economic results on the basis of their size between 2012 and 2014. The daily yield17 was between -€15 and €15 million on more than 97% of days when the market was open.
HISTOGRAM OF THE FREQUENCY OF DAILY RESULTS (MTM)
Daily results of management “clean” of commissions and intraday operations (millions of euros). Number of days (%) in each range
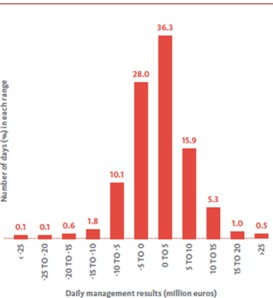
1.4. Risk management of financial derivatives market
Derivatives activity is mainly focused on marketing investment products and hedging risks for clients. Management is focused on ensuring that the net risk opened is the lowest possible.
| 17 | Yields “clean” of commissions and results of intraday derivative operations. |
280
Table of Contents
These transactions include options on equities, fixed-income and exchange rates. The units where this activity mainly takes place are: Spain, Santander UK, and, to a lesser extent, Brazil and Mexico.
The chart below shows the VaR Vega18 performance of structured derivatives business over the last three years. It fluctuated at around an average of €6 million. In general, the periods with higher VaR levels related to periods of significant rises in volatility in the markets. The evolution of VaR Vega in the second quarter of 2013 was the result of the increased volatility of euro and U.S. dollar interest rate curves, coinciding with a strategy of hedging client operations of significant amounts. The VaR Vega during 2014 gradually declined due to greater market stability.
EVOLUTION OF RISK (VaR) OF THE BUSINESS OF FINANCIAL DERIVATIVES
Million euros. VaR Vega at 99%, with a time frame of one day
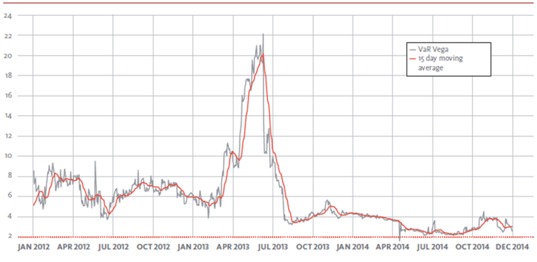
As regards the VaR by risk factor, on average, the exposure was concentrated, in this order: interest rates, equities, exchange rates and commodities. This is shown in the table below:
FINANCIAL DERIVATIVES. RISK (VaR) BY RISK FACTOR
Millions of euros. VaR at 99%, with a time frame of one day
| 2014 | 2013 | 2012 | ||||||||||||||||||||||||||||||
| Minimum | Average | Maximum | Year-end | Average | Year-end | Average | Year-end | |||||||||||||||||||||||||
| Total VaR Vega |
1.7 | 3.3 | 4.7 | 2.7 | 8.0 | 4.5 | 6.8 | 6.5 | ||||||||||||||||||||||||
| Diversification impact |
0.1 | (2.1 | ) | (8.4 | ) | (2.6 | ) | (3.8 | ) | (2.7 | ) | (3.0 | ) | (3.4 | ) | |||||||||||||||||
| Interest rate VaR |
1.2 | 2.4 | 4.3 | 1.7 | 6.6 | 4.1 | 2.3 | 2.8 | ||||||||||||||||||||||||
| Equity VaR |
0.5 | 1.8 | 3.6 | 2.0 | 3.4 | 1.8 | 6.5 | 5.5 | ||||||||||||||||||||||||
| FX VaR |
0.0 | 1.2 | 7.2 | 1.6 | 1.7 | 1.3 | 0.7 | 1.3 | ||||||||||||||||||||||||
| Commodities VaR |
0.0 | 0.0 | 0.1 | 0.1 | 0.1 | 0.1 | 0.3 | 0.2 | ||||||||||||||||||||||||
As regards the distribution by business unit, the exposure is concentrated, in order of significance, in Spain, the United Kingdom, Mexico and Brazil.
| 18 | Vega, a Greek term, means the sensitivity of the value of a portfolio to changes in the price of market volatility. |
281
Table of Contents
FINANCIAL DERIVATIVES. RISK (VaR) BY UNIT
Millions of euros. VaR at 99%, with a time frame of one day
| 2014 | 2013 | 2012 | ||||||||||||||||||||||||||||||
| Minimum | Average | Maximum | Year-end | Average | Year-end | Average | Year-end | |||||||||||||||||||||||||
| Total VaR Vega |
1.7 | 3.3 | 4.7 | 2.7 | 8.0 | 4.5 | 6.8 | 6.5 | ||||||||||||||||||||||||
| Spain |
1.3 | 2.4 | 3.9 | 1.5 | 7.0 | 3.8 | 5.9 | 5.4 | ||||||||||||||||||||||||
| Santander UK |
0.9 | 1.4 | 1.9 | 0.9 | 2.2 | 1.6 | 2.8 | 2.0 | ||||||||||||||||||||||||
| Brazil |
0.3 | 0.8 | 7.2 | 0.7 | 1.2 | 0.9 | 1.0 | 2.8 | ||||||||||||||||||||||||
| Mexico |
0.6 | 0.9 | 1.7 | 1.3 | 1.2 | 1.2 | 0.7 | 0.6 | ||||||||||||||||||||||||
The average risk in 2014 (€3.3 million) was low relative to the last three years, for the reasons described above.
We continue to have very limited exposure to instruments or complex structured vehicles, reflecting a management culture one of whose hallmarks is prudence in risk management. At the end of 2014, the Group had:
| • | CDOs and CLOs: the position continues to be not very significant (€99 million). |
| • | Hedge funds: the total exposure is not significant (€192 million at the end of 2014) and most of it is via the financing of these funds (€20 million), with the rest direct participation in portfolio or derivatives to hedge funds. This exposure has low loan-to-value levels of around 31% (collateral of €620 million at the end of 2014). The risk with this type of counterparty is analyzed case by case, establishing percentages of collateralization on the basis of the features and assets of each fund. |
| • | Conduits: no exposure. |
| • | Monolines: Santander’s exposure to bond insurance companies (monolines) was €137 million19 at the end of 2014, mainly indirect exposure, and €136 million by virtue of the guarantee provided by this type of entity to various financing or traditional securitization operations. The exposure in this case is to double default, as the primary underlying assets are of high credit quality. The small remaining amount is direct exposure (for example, via purchase of protection from the risk of nonpayment by any of these insurance companies through a credit default swap). The exposure was 2% lower than in 2013. |
In short, the exposure to this type of instrument, as the result of the Group’s usual operations, continued to decline in 2014. This was mainly due to the integration of positions of institutions acquired by the Group, such as Sovereign in 2009. All these positions were known at the time of purchase, having been duly provisioned. These positions, since their integration in the Group, have been notably reduced, with the ultimate goal of eliminating them from the balance sheet.
Santander’s policy for approving new transactions related to these products remains very prudent and conservative. It is subject to strict supervision by the Group’s senior management. Before approving a new transaction, product or underlying asset, the risks division verifies:
| • | The existence of an appropriate valuation model to monitor the value of each exposure: Mark-to-Market, Mark-to-Model or Mark-to-Liquidity. |
| • | The availability in the market of observable data (inputs) needed to be able to apply this valuation model. |
| 19 | Guarantees provided by monolines for bonds issued by U.S. states (municipal bonds) are not considered as exposure. They amounted to €744 million at the end of 2014. |
282
Table of Contents
And provided these two points are always met:
| • | The availability of appropriate systems, duly adapted to calculate and monitor every day the results, positions and risks of new operations. |
| • | The degree of liquidity of the product or underlying asset, in order to make their coverage possible when necessary. |
1.5. Issuer risk in trading portfolios
Trading activity in credit risk is mainly conducted in Treasury in Spain. It is done by taking positions in bonds and credit default swaps (CDS) at different maturities on corporate and financial references, as well as indexes (Itraxx, CDX).
The table below shows the largest positions at the end of the year, distinguishing between long positions (bond purchase or protection sale via CDS) and short positions (bond sale or purchase protection via CDS):
Million euros. Data at December 31, 2014
| Largest “long” positions (protection sale) | Largest “short” positions (protection purchase) | |||||||||||||||
| Exposure at default (EaD) |
% of total EaD |
Exposure at default (EaD) |
% of total EaD |
|||||||||||||
| 1st reference |
213 | 5.5 | % | (48 | ) | 6.2 | % | |||||||||
| 2nd reference |
129 | 3.3 | % | (27 | ) | 3.4 | % | |||||||||
| 3rd reference |
128 | 3.3 | % | (26 | ) | 3.4 | % | |||||||||
| 4th reference |
97 | 2.5 | % | (24 | ) | 3.1 | % | |||||||||
| 5th reference |
85 | 2.2 | % | (19 | ) | 2.5 | % | |||||||||
| Top 5 sub-total |
651 | 16.9 | % | (144 | ) | 18.5 | % | |||||||||
| Total |
3,848 | 100.0 | % | (775 | ) | 100.0 | % | |||||||||
Note: zero recoveries are supposed (LCR=0) in the EaD calculation.
1.6. Analysis of scenarios
Various stress scenarios were calculated and analyzed regularly in 2014 (at least every month) at the local and global levels for all the trading portfolios and using the same assumptions by risk factor.
Maximum volatility scenario (Worst Case)
This scenario is given particular attention as it combines historic movements of risk factors with an ad hoc analysis in order to reject very unlikely combinations of variations (for example, sharp falls in stock markets together with a decline in volatility).
As regards the variations, an historic volatility equivalent to six standard deviations is applied. The scenario is defined by taking for each risk factor the movement which represents the greatest potential loss in the portfolio, rejecting the most unlikely combinations in economic-financial terms. For year-end, that scenario implied, for the global portfolio, interest rate rises, falls in stock markets, depreciation of all currencies against the euro, rise in credit spreads and mixed volatility movements. The following table shows the results of this scenario at the end of 2014.
MAXIMUM VOLATILITY STRESS SCENARIO (WORST CASE)
Million euros. Data at December 31, 2014
| Interest rates |
Equities | Exchange rates |
Credit Spread |
Commodities | Total | |||||||||||||||||||
| Total trading |
(33.6 | ) | (10.0 | ) | (10.5 | ) | (26.7 | ) | (0.2 | ) | (81.0 | ) | ||||||||||||
| Europe |
(3.4 | ) | (0.7 | ) | (3.3 | ) | (23.7 | ) | (0.2 | ) | (31.4 | ) | ||||||||||||
| Latin America |
(27.9 | ) | (9.3 | ) | (4.6 | ) | 0.0 | 0.0 | (41.8 | ) | ||||||||||||||
| US |
(1.3 | ) | 0.0 | (2.1 | ) | 0.0 | 0.0 | (3.5 | ) | |||||||||||||||
| Global activities |
(0.8 | ) | 0.0 | (0.5 | ) | (3.0 | ) | 0.0 | (4.3 | ) | ||||||||||||||
| Asia |
(0.1 | ) | 0.0 | (0.5 | ) | 0.0 | 0.0 | (0.1 | ) | |||||||||||||||
283
Table of Contents
The stress test shows that the economic loss suffered by the Group in its trading portfolios, in terms of the mark to market (MtM) result would be, if the stress movements defined in the scenario materialized in the market, €81.0 million, a loss that would be concentrated in Latin America (in this order, interest rates, equities and exchange rates) and Europe (basically concentrated in credit spreads).
Other global stress test scenarios
Various global scenarios (similar for all the Group’s units) are established:
| • | Abrupt crisis: ad hoc scenario with very sudden movements in markets. Rise in interest rate curves, sharp falls in stock markets, large appreciation of the dollar against the rest of currencies, rise in volatility and in credit spreads. |
| • | Crisis 11S: historic scenario of the September 11, 2001 attacks with a significant impact on the U.S. and global markets. It is sub-divided into two scenarios: 1) maximum accumulated loss until the worst moment of the crisis, and 2) maximum loss in a day. In both cases, there are drops in stock markets and in interest rates in core markets and rises in emerging markets, and the dollar appreciates against the rest of currencies. |
| • | Subprime crisis: historic scenario of the U.S. mortgage crisis. The objective of the analysis is to capture the impact on results of the reduction in liquidity in the markets. The scenarios have two time frames (one day and 10 days): in both cases there are drops in stock markets and in interest rates in core markets and rises in emerging markets, and the dollar appreciates against the rest of currencies. |
| • | Sovereign crisis: the severest historic scenario carried out by the Committee of European Banking Supervisors (CEBS) to measure the market’s shock capacity between April 15 and September 1, 2010. Given the Group’s international sphere, four geographic zones are distinguished (U.S., Europe, Latin America and Asia), interest rate rises, falls in stock markets and volatilities are established, rises in credit spreads and depreciation of the euro and Latin American currencies and appreciation of Asian currencies against the dollar. |
As of November 2014, this latter scenario has been replaced by the adverse scenario proposed by the EBA in April in its stress test exercise (“The EBA 2014 EU-Wide Stress Test”), obtaining a result of €223.9 million at December 31, 2014.
Every month a consolidated stress test report is drawn up, supervised by the global committee of market risks, with explanations of the main changes in results for the various scenarios and units. An early warning mechanism has also been established so that when the loss of a scenario is high in historic terms and/or the capital consumed by the portfolio in question, the relevant business executive is informed.
Here we show the results of the global scenarios for the last three years.
284
Table of Contents
STRESS TEST RESULTS : COMPARISON OF THE 2012 TO 2014 SCENARIOS (ANNUAL AVERAGES)
(Millions of euros)
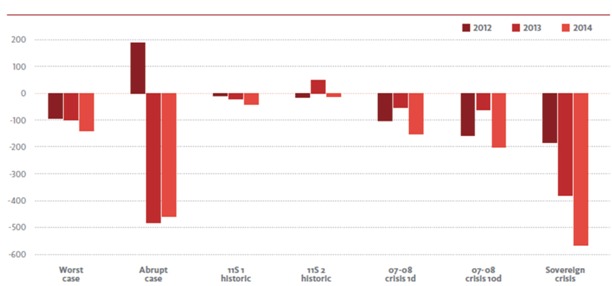
2. Methodologies
2.1 Value At Risk (VaR)
The standard methodology that we applied to trading activities during 2014 was Value at Risk (VaR), which measures the maximum expected loss with a certain confidence level and within a certain time frame. The standard for historic simulation is a confidence level of 99% and a time frame of one day. Statistical adjustments are applied enabling the most recent developments that condition the levels of risk assumed to be efficiently and quickly incorporated. A time frame of two years or at least 520 days from the reference date of the VaR calculation is used, obtained from the reference date of calculating the VaR. Two figures are calculated every day, one applying an exponential decline factor which accords less weight to the observations furthest away in time and another with the same weight for all observations. The reported VaR is the higher of the two.
The Value at Earnings (VaE) is also calculated, and it measures the maximum potential gain with a certain level of confidence and within a certain time frame, applying the same methodology as for the VaR.
The VaR by historic simulation has many advantages as a risk metric (it sums up in a single number the market risk of a portfolio, is based on market movements that really occurred without the need to make assumptions of formal functions nor of correlations between market factors, etc.), but also has limitations.
Some limitations are intrinsic to the VaR metrics, regardless of the methodology used for its calculation, including:
| • | The VaR calculation is calibrated at a certain level of confidence which does not indicate the levels of possible losses beyond it. |
| • | There are some products in the portfolio with a liquidity horizon greater than that specified in the VaR model. |
| • | The VaR is a static analysis of the risk of the portfolio, and the situation could change significantly during the following day, although the likelihood of this occurring is very low. |
285
Table of Contents
Other limitations come from using the historic simulation methodology:
| • | High sensitivity to the historic window used. |
| • | Incapacity to capture plausible events of big impact if they do not occur in the historic window used. |
| • | The existence of parameters of valuation with no market input (such as correlations, dividend and recovery rate). |
| • | Slow adjustment to the new volatilities and correlations, if the most recent data receives the same weight as the oldest data. |
Part of these limitations are corrected by using the stressed VaR and expected shortfall, the calculation of a VaR with exponential decline and applying conservative valuation adjustments. Furthermore, as previously stated, the Group regularly conducts analysis and backtesting of the accuracy of the VaR calculation model.
2.2 Stressed VaR (sVaR) and Expected Shortfall (ES)
In addition to the usual VaR, we calculate a stressed VaR for the main portfolios on a daily basis. The methodology for calculation is the same as that used for the VaR, with the following two exceptions:
| • | Historic period of observation of factors: the stressed VaR uses a window of 250 days, instead of one of 520 for the VaR. Furthermore, it is not just the latest data that is used but a continuous period of stress relevant for the portfolio in question. As regards determining the period of observation, for each relevant portfolio, the methodology area has analyzed the history of a subseries of market risk factors that were chosen on the basis of expert criteria and the most relevant positions of the books. |
| • | In order to obtain the stressed VaR, unlike when calculating the VaR, the maximum between the percentile uniformly weighted and the one exponentially weighted is not applied. Instead, the percentile uniformly weighted is used directly. |
Meanwhile, the expected shortfall (ES) is also calculated in order to estimate the expected value of the potential loss when this is higher than the level set by the VaR. The ES, unlike the VaR, has the advantage of capturing better the tail risk and of being a sub-additive metric20. With regard to the near future, the Basel Committee recommends replacing VaR with the expected shortfall as the reference metric for calculating the regulatory capital of the trading portfolios21. The committee believes that the confidence level of 97.5% is a risk level similar to that which VaR captures with a confidence level of 99%.
2.3 Analysis of scenarios
In addition to VaR, the Group uses other measures that enable it to have greater control of the risks in all the markets in which it operates. These measures include analysis of scenarios, which consists of defining alternatives to the performance of different financial variables and obtaining the impact on results of applying them on activities. These scenarios can replicate events that occurred in the past (such as a crisis) or determine plausible alternatives that do not correspond to past events.
The potential impact on results of applying different stress scenarios on all the trading portfolios and considering the same assumptions by risk factor is calculated and analyzed regularly. As a minimum three types of scenarios are defined: plausible, severe and extreme, obtaining with the VaR a fuller spectrum of the risk profile.
In addition, levels of warning (triggers) are set for global scenarios, on the basis of the historic results of these scenarios and of the capital associated with the portfolio in question. In the event of surpassing these levels, those responsible for
| 20 | The sub-additive metric is one of the desirable properties which, according to financial literature, should present a coherent risk metric. This property establishes that f (a+b) be lower or equal to f(a)+f(b). Intuitively, it supposes that the more instruments or risk factors there are, the less risky a portfolio due to the benefits of diversification. VaR does not meet this property for certain distributions, while the ES always does. |
| 21 | “Fundamental review of the trading book: a revised market risk framework” (consultative documents of the Basel Committee on banking supervision, October 2013). |
286
Table of Contents
management of the portfolio are informed so they can take the necessary measures. At the same time, the results of the stress exercises at the global level, as well as the possible breaching of the levels set, are regularly reviewed and communicated to senior management if deemed pertinent.
2.4 Analysis of positions, sensitivities and results
The positions are used to quantify the net volume of market securities of the transactions in portfolio, grouped by main risk factor, considering the delta value of the futures and options that could exist. All the risk positions can be expressed in the base currency of the unit and in the currency for homogenizing information. The changes in positions are monitored every day, in order to detect possible incidents that might occur and correct them in a timely manner.
The market risk sensitivity measures are those that estimate the variation (sensitivity) of the market value of an instrument or portfolio to changes in each of the risk factors. The sensitivity of value of an instrument to changes in market factors can be obtained through analytical approximations by partial derivatives or by the complete revaluation of the portfolio.
The daily drawing up of the income statement is an excellent indicator of risks, as it enables the impact of changes in financial variables on portfolios to be identified.
2.5 Derivative activities and credit management
Also noteworthy is monitoring of derivative activities and credit management which, because of its atypical nature, is conducted daily with specific measures. First, the sensitivities to price movements of the underlying asset (delta and gamma), volatility (vega) and time (theta) are controlled. Second, measures such as the sensitivity to the spread, jump-to-default, concentrations of positions by level of rating, etc., are reviewed systematically.
As regards the credit risk inherent in the trading portfolios, and in line with the recommendations of the Basel Committee on Banking Supervision and prevailing regulations, an additional metric, the incremental risk charge (IRC), is calculated in order to cover the risk of non-compliance and of migration of rating that is not adequately captured in the VaR, via the variation of the corresponding credit spreads. The products controlled are basically fixed-income bonds, both public and private, derivatives on bonds (forwards, options, etc.) and credit derivatives (credit default swaps, asset backed securities, etc.). The method for calculating the IRC is based on direct measurements on the tails of the distribution of losses to the appropriate percentile (99.9%), with a time frame of one year. Monte Carlo methodology is used, applying one million simulations.
2.6 Credit Valuation Adjustment (CVA) and Debt Valuation Adjustment (DVA)
The Group incorporates credit valuation adjustment (CVA) and debt valuation adjustment (DVA) when calculating the results of trading portfolios. The CVA is a valuation adjustment of over-the-counter (OTC) derivatives, as a result of the risk associated with the credit exposure assumed by each counterparty.
The CVA is calculated by taking into account the potential exposure with each counterparty in each future maturity. The CVA for a certain counterparty would be equal to the sum of the CVA for all maturities. It is calculated on the basis of the following inputs:
| • | Expected exposure: including, for each transaction the current market value (MtM) as well as the potential future risk (add-on) to each maturity. Mitigating factors such as collateral and netting contracts are taken into account, as well as a factor of temporary decay for those derivatives with intermediate payments. |
| • | Severity: the percentage of final loss assumed in case of credit/ non-payment of the counterparty. |
| • | Probability of default: for cases where there is no market information (spread curve traded via CDS, etc.) general proxies generated on the basis of companies with listed CDS of the same sector and external rating as the counterparty are used. |
287
Table of Contents
| • | Discount factors curve. |
The DVA is a valuation adjustment similar to the CVA, but in this case as a result of Grupo Santander’s risk that counterparties assume in the OTC derivatives.
3. System for controlling limits
Setting market risk and liquidity limits is designed as a dynamic process which responds to the Group’s risk appetite level. This process is part of the annual limits plan, which is drawn up by the Group’s senior management and administered by the general directorate of risks in a way that involves all the Group’s institutions.
The market risk limits used in Grupo Santander are established on different metrics and try to cover all activity subject to market risk from many perspectives, applying a conservative criterion. The main ones are:
| • | VaR limits. |
| • | Limits of equivalent positions and/or nominal. |
| • | Sensitivity limits to interest rates. |
| • | Vega limits. |
| • | Risk limits of delivery by short positions in securities (fixed income and equities). |
| • | Limits aimed at reducing the volume of effective losses or protecting results already generated during the period: |
| • | Loss trigger. |
| • | Stop loss. |
| • | Credit limits: |
| • | Limit on the total exposure. |
| • | Limit to the jump to default by issuer. |
| • | Others. |
| • | Limits for origination operations. |
These general limits are complemented by sub-limits. In this way, the market risk area has a structure of limits sufficiently granular to conduct an effective control of the various types of market risk factors on which an exposure is maintained. Positions are tracked daily, both of each unit as well as globally. An exhaustive control is made of the changes in the portfolios, in order to detect possible incidents for their immediate correction. Meanwhile, the daily drawing up of the income statement by the market risks area is an excellent indicator of risks, as it allows the impact that changes in financial variables have had on portfolios to be identified.
Three categories of limits are established on the basis of its sphere of approval and control: limits of approval and global controls, limits of global approval and local controls and limits of approval and local controls. The limits are requested by the business executive of each country/institution, tending to the particular nature of the business and achieving the budget established, seeking consistency between the limits and the risk/return ratio, and approved by the corresponding risk bodies.
288
Table of Contents
The business units must at all times comply with the limits approved. In the event of a limit being exceeded, the local business executives have to explain, in writing and on the day, the reasons for the excess and the action plan to correct the situation, which in general can consist of reducing the position until it reaches the prevailing limits or set out the strategy that justifies an increase in the limits.
If the business unit fails to respond to the situation of excess within three days, the global business executives will be asked to set out the measures to be taken in order to make the adjustment to the existing limits. If this situation lasts for 10 days as of the first excess, senior risk management will be informed so that a decision can be made on what steps to take, and the risk takers could be made to reduce the levels of risk assumed.
C. Structural balance sheet risks
1. Quantitative analysis22
The market risk profile inherent in the Group’s balance sheet, in relation to the volume of assets and shareholders’ funds, as well as the financial margin budgeted, remained at low levels in 2014 and in line with previous years.
1.1. Structural interest rate risk
Europe and the United States
The main balances in Europe (Parent bank and U.K.) show positive economic value sensitivities to interest rate rises, given the expectations of long-term rates on the basis of economic indicators, while short-term rates maintains a very low net interest margin (NIM) exposure. The U.S. balance sheet has a positive sensitivity to short as well as long-term interest rate rises.
In any case, the level of exposure in all countries is moderate in relation to the annual budget and the amount of equity.
At the end of 2014, the risk of the NIM at one year, measured as its sensitivity to parallel changes of ±100 basis points, was concentrated in the U.S. dollar yield curve with €67 million in risk to interest rate cuts (very low probability scenario in the current environment). Of note also was the risk to interest rate cuts in the Polish zloty curve (€21 million).
NIM SENSITIVITY BY COUNTRIES TO 100 BASIS POINTS23
% of the total
Rest: SCF and Portugal.
| 22 | Includes the entire balance sheet except for the trading portfolios. |
| 23 | Sensitivity for the worst scenario between +100 and -100 basis points. |
289
Table of Contents
At the same date, the main risk of economic value, measured as its sensitivity to parallel changes in the yield curve of ±100 basis points was in the euro interest rate curve (€2,149 million in risk to interest rate cuts). As regards the dollar and sterling curves, the amounts were €865 million and €343 million, respectively, also in risk to interest rate cuts.
As previously stated, we believe these scenarios are very unlikely.
MVE SENSITIVITY BY COUNTRIES TO 100 BASIS POINTS24
% of the total
Rest: Portugal, SCF and Poland.
The tables below give the structure by maturity of the balance sheet’s interest rate risk at the Parent bank and Santander UK at the end of 2014.
SANTANDER PARENT BANK: INTEREST RATE REPRICING GAP25
Million euros. December 31, 2014
| Total | 3 months | 1 year | 3 years | 5 years | > 5 years | Not sensitive | ||||||||||||||||||||||
| Assets |
394,976 | 148,766 | 70,591 | 25,194 | 15,919 | 19,812 | 114,693 | |||||||||||||||||||||
| Liabilities |
431,401 | 166,111 | 63,114 | 59,981 | 30,499 | 40,457 | 71,238 | |||||||||||||||||||||
| Off-balance sheet |
36,425 | 21,971 | (1,040 | ) | 13,849 | 2,087 | (441 | ) | 0 | |||||||||||||||||||
| Net gap |
0 | 4,626 | 6,437 | (20,939 | ) | (12,494 | ) | (21,086 | ) | 43,455 | ||||||||||||||||||
| 24 | Sensitivity for the worst scenario between +100 and -100 basis points. |
| 25 | Aggregate gap of all foreign currencies in the balance sheet of Parent bank, expressed in euros. |
290
Table of Contents
SANTANDER UK: INTEREST RATE REPRICING GAP26
Million euros. December 31, 2014
| Total | 3 months | 1 year | 1-3 years | 3-5 years | > 5 years | Not sensitive | ||||||||||||||||||||||
| Assets |
324,674 | 193,356 | 30,189 | 49,580 | 23,806 | 7,192 | 20,551 | |||||||||||||||||||||
| Liabilities |
324,342 | 210,648 | 25,153 | 26,559 | 11,494 | 14,779 | 35,710 | |||||||||||||||||||||
| Off-balance sheet |
(332 | ) | 10,815 | 3,246 | (512 | ) | (7,603 | ) | (6,280 | ) | 1 | |||||||||||||||||
| Net gap |
0 | (6,477 | ) | 8,282 | 22,509 | 4,710 | (13,867 | ) | (15,158 | ) | ||||||||||||||||||
In general, the gaps by maturities remained at very low levels in relation to the size of the balance sheet, in order to minimize the interest rate risk.
Latin America
The long-term balances are positioned to interest rate cuts due to slower economic growth. The situation in the short term is very similar, except in the case of Mexico, as it invests in the short term its liquidity excess in local currency.
A moderate level of exposure was maintained during 2014 in all countries in relation to the annual budget and the amount of equity.
At the end of 2014, the financial margin risk measured in sensitivity to ±100 basis points, was concentrated in three countries, Brazil (€152 million), Mexico (€55 million) and Chile (€33 million), as shown in the chart below:
NIM SENSITIVITY BY COUNTRIES TO 100 BASIS POINTS27
% of the total
Rest: Argentina, Panama, Peru and Uruguay.
Equity value risk, measured by its sensitivity to parallel changes of +/- 100 basis points, is also concentrated in Brazil (€572 million), Chile (€152 million) and Mexico (€132 million).
| 26 | Aggregate gap of all foreign currencies in the balance sheet of Santander UK, expressed in euros. |
| 27 | Sensitivity for the worst scenario between +100 and -100 basis points. |
291
Table of Contents
MVE SENSITIVITY BY COUNTRIES TO 100 BASIS POINTS 28
% of the total
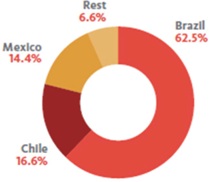
Rest: Argentina, Panama, Peru and Uruguay.
The gap tables show the structure by maturity of risk of the balance sheet in Brazil in December 2014.
BRAZIL: INTEREST RATE REPRICING GAP29
Million euros. December 31, 2014
| Total | 3 months | 1 year | 3 years | 5 years | > 5 years | Not sensitive | ||||||||||||||||||||||
| Assets |
191,635 | 79,913 | 30,171 | 27,540 | 9,676 | 14,086 | 30,250 | |||||||||||||||||||||
| Liabilities |
191,635 | 119,076 | 10,640 | 12,014 | 7,288 | 6,603 | 36,015 | |||||||||||||||||||||
| Off-balance sheet |
0 | (14,156 | ) | 12,975 | (973 | ) | 1,517 | 637 | 1 | |||||||||||||||||||
| Net gap |
0 | (53,319 | ) | 32,505 | 14,553 | 3,905 | 8,120 | (5,764 | ) | |||||||||||||||||||
1.2. Structural exchange-rate risk/hedging of results
Structural exchange rate risk arises from Group operations in currencies, mainly related to permanent financial investments, and the results and the hedging of these investments.
This management is dynamic and seeks to limit the impact on the core capital ratio of movements in exchange rates.
At the end of 2014, the largest exposures of permanent investments (with their potential impact on equity) were in Brazilian reals, followed by sterling, U.S. dollars, Mexican pesos, Chilean pesos and Polish zlotys. The Group covers part of these positions of a permanent nature with exchange-rate derivatives.
In addition, financial management at the consolidated level is responsible for exchange-rate management of the Group’s expected results and dividends in those units whose currency is not the euro.
| 28 | Sensitivity for the worst scenario between +100 and -100 basis points. |
| 29 | Aggregate gap of all currencies in the balance sheet of the Brazil unit, expressed in euros. |
292
Table of Contents
1.3. Structural equity risk
We maintain equity positions in our banking book in addition to those of the trading portfolio. These positions are maintained as portfolios available for sale (capital instruments) or as equity stakes, depending on their envisaged time in the portfolio.
The equity portfolio of the banking book at the end of 2014 was diversified in securities in various countries, mainly Spain, Brazil, the U.S., Netherlands and China. Most of the portfolio is invested in the financial and insurance sectors; other sectors, to a lesser extent, are professional, scientific and technical activities, public administrations (stake in SAREB), energy supply and the hotel and restaurant trade.
The structural equity positions are exposed to market risk. VaR calculations are made for these positions, using market price series for listed shares and proxies for those that do not. At the end of 2014, the VaR at 99% with a one day time frame was €208.5 million (€235.3 million and €281.4 million at the end of 2013 and 2012, respectively).
1.4. Structural VaR
With a homogeneous metric such as the VaR, the total market risk of the balance sheet can be monitored, distinguishing between fixed income (both interest rate as well the credit spread for the ALCO portfolios), exchange rates and equities.
In general, the structural VaR is not high in terms of the Group’s volume of assets or equity.
Structural VaR
Figures in millions of EUR
| December 31, 2014 | ||||||||||||||||||||
| December 31, 2013 | Low | Average | High | Period End | ||||||||||||||||
| TOTAL |
736.6 | 612.3 | 727.5 | 840.7 | 806.5 | |||||||||||||||
|
|
|
|
|
|
|
|
|
|
|
|||||||||||
| Trading |
13.1 | 8.2 | 16.9 | 23.8 | 10.5 | |||||||||||||||
| Non-Trading |
733.9 | 597.3 | 718.6 | 814.2 | 809.8 | |||||||||||||||
| Diversification Effect |
(10.3 | ) | 6.8 | (8.0 | ) | 2.6 | (13.9 | ) | ||||||||||||
The diversification effect is calculated as the sum of the individual or “stand alone” VaR of each portfolio minus the total VaR of the consolidated portfolio.
We calculate the VaR for full revaluation (individual pricers for each position) or second-order Taylor approximation for the most complex portfolios. We include several individual factors such as each interest rate curve involved, individual share prices, currencies and volatility matrices. For reporting purposes, we group them based on the primary factor (interest rate, equity, foreign exchange, credit spread and commodities).
Our daily VaR (considering each factor of interest rate risk, foreign exchange rate risk and equity price risk individually) were as set forth below.
293
Table of Contents
Interest Rate Risk, Foreign Exchange Rate Risk and Equity Price Risk
Figures in millions of EUR
| December 31, 2014 | ||||||||||||||||||||
| December 31, 2013 | Low | Average | High | Period End | ||||||||||||||||
| Interest Rate Risk |
||||||||||||||||||||
| Trading |
8.5 | 8.1 | 14.2 | 22.2 | 10.5 | |||||||||||||||
| Non-Trading |
681.0 | 411.3 | 539.0 | 698.0 | 493.6 | |||||||||||||||
| Diversification Effect |
(8.5 | ) | (8.0 | ) | (14.0 | ) | (21.8 | ) | (10.4 | ) | ||||||||||
|
|
|
|
|
|
|
|
|
|
|
|||||||||||
| TOTAL |
681.0 | 411.4 | 539.2 | 698.4 | 493.7 | |||||||||||||||
| Exchange Rate Risk |
||||||||||||||||||||
| Trading |
4.7 | 1.3 | 3.5 | 10.2 | 2.9 | |||||||||||||||
| Non-Trading |
197.8 | 256.9 | 315.3 | 533.8 | 533.8 | |||||||||||||||
| Diversification Effect |
(4.6 | ) | (1.3 | ) | (3.5 | ) | (10.1 | ) | (2.9 | ) | ||||||||||
|
|
|
|
|
|
|
|
|
|
|
|||||||||||
| TOTAL |
197.9 | 256.9 | 315.3 | 533.9 | 533.8 | |||||||||||||||
| Equity Price Risk |
||||||||||||||||||||
| Trading |
4.7 | 1.1 | 2.7 | 8.9 | 1.8 | |||||||||||||||
| Non-Trading |
235.3 | 170.6 | 228.4 | 275.8 | 208.5 | |||||||||||||||
| Diversification Effect |
(4.6 | ) | (1.1 | ) | (2.7 | ) | (8.8 | ) | (1.7 | ) | ||||||||||
|
|
|
|
|
|
|
|
|
|
|
|||||||||||
| TOTAL |
235.3 | 170.6 | 228.4 | 276.0 | 208.5 | |||||||||||||||
The Group’s daily VaR estimates by activity were as set forth below.
VaR by Activity
Figures in millions of EUR
| December 31, 2014 | ||||||||||||||||||||
| December 31, 2013 | Low | Average | High | Period End | ||||||||||||||||
| Trading |
||||||||||||||||||||
| Interest Rate |
8.5 | 8.1 | 14.2 | 22.2 | 10.5 | |||||||||||||||
| Exchange Rate |
4.7 | 1.3 | 3.5 | 10.2 | 2.9 | |||||||||||||||
| Equity |
4.7 | 1.1 | 2.7 | 8.9 | 1.8 | |||||||||||||||
| Credit Spread |
7.2 | 4.2 | 9.3 | 15.9 | 4.6 | |||||||||||||||
| Commodities |
0.3 | 0.1 | 0.3 | 0.5 | 0.1 | |||||||||||||||
|
|
|
|
|
|
|
|
|
|
|
|||||||||||
| TOTAL |
13.1 | 8.2 | 16.9 | 23.8 | 10.5 | |||||||||||||||
| Non-Trading Interest Rate |
||||||||||||||||||||
| Interest Rate |
681.0 | 411.3 | 539.0 | 698.0 | 493.6 | |||||||||||||||
|
|
|
|
|
|
|
|
|
|
|
|||||||||||
| Exchange Rate |
||||||||||||||||||||
| Non-Trading Foreign Exchange |
||||||||||||||||||||
| Exchange Rate |
197.8 | 256.9 | 315.3 | 533.8 | 533.8 | |||||||||||||||
|
|
|
|
|
|
|
|
|
|
|
|||||||||||
| Non-Trading Equity |
||||||||||||||||||||
| Equity |
235.3 | 170.6 | 228.4 | 275.8 | 208.5 | |||||||||||||||
|
|
|
|
|
|
|
|
|
|
|
|||||||||||
| TOTAL |
736.6 | 612.3 | 727.5 | 840.7 | 806.5 | |||||||||||||||
|
|
|
|
|
|
|
|
|
|
|
|||||||||||
| Interest Rate |
681.0 | 411.4 | 539.2 | 698.4 | 493.7 | |||||||||||||||
| Exchange Rate |
197.9 | 256.9 | 315.3 | 533.9 | 533.8 | |||||||||||||||
| Equity |
235.3 | 170.6 | 228.4 | 276.0 | 208.5 | |||||||||||||||
294
Table of Contents
2. Methodologies
2.1 Structural interest rate risk
The Group analyzes the sensitivity of net interest margin and of equity value to changes in interest rates. This sensitivity arises from gaps in maturity dates and the review of interest rates in the different asset and liability items.
On the basis of the positioning of balance sheet interest rates, as well as the situation and outlook for the market, the financial measures are agreed to adjust the positioning to that desired by the Bank. These measures range from taking positions in markets to defining the interest rate features of commercial products.
The metrics used by the Group to control interest rate risk in these activities are: the interest rate gap, the sensitivity of net interest margin and of equity value to changes in interest rate levels, Value at Risk (VaR), for the purposes of calculating economic capital.
Interest rate gap of assets and liabilities
Interest rate gap analysis focuses on lags or mismatches between changes in the value of asset, liability and off-balance sheet items. It provides a basic representation of the balance sheet structure and allows for the detection of interest rate risk by concentration of maturities. It is also a useful tool for estimating the impact of eventual interest rate movements on net interest margin or equity value.
All on- and off-balance sheet items must be disaggregated by their flows and looked at in terms of repricing/maturity. In the case of those items that do not have a contractual maturity, an internal model of analysis is used and estimates made of the duration and sensitivity of them.
Net interest margin sensitivity (NIM)
The sensitivity of net interest margin measures the change in the short/medium term in the accruals expected over a particular period (12 months), in response to a shift in the yield curve.
It is calculated by simulating the net interest margin, both for a scenario of a shift in the yield curve as well as for the current situation. The sensitivity is the difference between the two margins calculated.
Market value of equity sensitivity (MVE)
The sensitivity of equity value is an additional measure to the sensitivity of the net interest margin.
It measures the interest risk implicit in the equity value on the basis of the impact of a change in interest rates on the current values of financial assets and liabilities.
Treatment of liabilities without defined maturity
In the corporate model, the total volume of the balances of accounts without maturity is divided between stable and unstable balances.
The separation between the stable and unstable balances is obtained from a model that is based on the relation between balances and their own moving averages.
From this simplified model the monthly cash flows are obtained and used to calculate the NIM and MVE sensitivities.
The model requires a variety of inputs:
| • | Parameters inherent in the product. |
| • | Performance parameters of the customer (in this case analysis of historic data is combined with the expert business view). |
295
Table of Contents
| • | Market data. |
| • | Historic data of the portfolio. |
Pre-payment treatment for certain assets
The pre-payment issue mainly affects fixed-rate mortgages in units where the relevant interest rate curves for the balance sheet (specifically for the portfolio of investment in fixed rate mortgages) are at low levels. In these units the risk is modeled and some changes can also be made to assets without defined maturity (credit card businesses and similar).
The usual techniques used to value options cannot be applied directly because of the complexity of the factors that determine the pre-payment of borrowers. As a result, the models for assessing options must be combined with empirical statistical models which seek to capture the prepayment performance. Some of the factors are:
| • | Interest rate: the differential between the fixed rate of the mortgage and the market rate at which it could be refinanced, net of cancellation and opening costs; |
| • | Seasoning: pre-payment trend downward at the start of the instrument’s life cycle (signing of the contract) and upward and stabilizing as time passes; |
| • | Seasonality: the amortizations or early cancellations tend to take place at specific dates. |
| • | Burnout: decreasing trend in the speed of pre-payment as the instrument’s maturity approaches, which includes: |
a) Age: defines low rates of pre-payment.
b) Cash pooling: defines as more stable those loans that have already overcome various waves of interest rate falls. In other words, when a portfolio of loans has passed one or more cycles of downward rates and thus high levels of pre-payment, the “surviving” loans have a significantly lower pre-payment probability.
c) Others: geographic mobility, demographic, social, available income factors, etc.
The series of econometric relations that seek to capture the impact of all these factors is the probability of pre-payment of a loan or pool of loans and is denominated the pre-payment model.
Value at Risk (VaR)
The Value at Risk for balance sheet activity and investment portfolios is calculated with the same standard as for trading: maximum expected loss under historic simulation with a confidence level of 99% and a time frame of one day. As for the trading portfolios, 520 daily figures, representing the two years prior to the reference date, are used in the VaR calculation.
| 2.2 | Structural exchange rate risk/hedging of results |
These activities are monitored via position measurements, VaR and results, on a daily basis.
| 2.3 | Structural equity risk |
These activities are monitored via position measurements, VaR and results, on a monthly basis.
| 3. | System for controlling limits |
As already stated for the market risk of trading, under the framework of the annual limits, plan limits are set for balance sheet structural risks, reflecting the Group’s risk appetite level.
296
Table of Contents
The main ones are:
Structural interest rate risk of the balance sheet:
| • | Sensitivity limit of net interest margin at 1 year. |
| • | Sensitivity limit of equity value. |
Structural exchange rate risk:
| • | Net position in each currency (for positions of hedging results). |
In the event any one of these limits or their sub limits is breached, the relevant risk management executives must explain the reasons why and facilitate the measures to correct it.
D. Pension, actuarial and fiduciary risks
1. Pension risks
When managing the pension fund risks of employees (defined benefit), the Group assumes the financial, market, credit and liquidity risks which it incurs for the asset and investment of the fund, as well as the actuarial risks derived from the liability, and the responsibilities for pensions to its employees.
The Group’s objective in the sphere of controlling and managing pension risk focuses on identifying, measuring/assessing, monitoring, controlling, mitigating and communicating this risk. The Group’s priority is thus to identify and eliminate or mitigate all focus areas of risk, regardless of whether they have produced losses or not.
This is why the methodology used by the Group estimates the combined losses in assets and liabilities in a defined stress scenario on a yearly basis from changes in interest rates and discount rates, inflation, stocks markets and properties, as well as the credit and operational risk.
Main data
The main data regarding the pension funds of employees of defined benefit are set out in note 25 to our consolidated financial statements, which report the details and movements of provisions for pensions, as well as the main hypotheses used to calculate the actuarial risk and the risk of the fund, including changes in the value of assets and liabilities and details on the investment portfolios assigned to them.
297
Table of Contents
The investor profile of the aggregated portfolio of employees’ pension funds is low risk, as around 70% of the total portfolio is invested in fixed-income assets, as set out in the chart below.
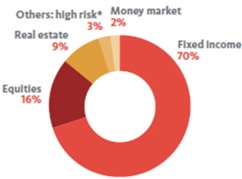
| * | Includes positions in hedge funds, private equity and derivatives. |
2. Actuarial risk
Actuarial risk is produced by biometric changes in the life expectancy of those with life insurance, from the unexpected increase in the indemnity envisaged in non-life insurance and, in any case, from unexpected changes in the performance of insurance takers in the exercise of the options envisaged in contracts.
The following are actuarial risks:
Risk of life liability: the risk of loss in the value of the liabilities of life insurance caused by fluctuations in risk factors that affect these liabilities.
i. Mortality/longevity risk: risk of loss from movements in the value of the liability resulting from changes in estimates of the probability of death/survival of those insured.
ii. Morbidity risk: risk of loss from movements in the value of the liability resulting from changes in estimates of the probability of disability/incapacity of those insured.
iii. Rescue/fall risk: the risk of loss from movements in the value of the liability resulting from the early cancellation of the contract, of changes in the exercise of the right of rescue by the insurance holders, as well as options of extraordinary contribution and/or suspending contributions.
iv. Risk of costs: risk of loss from changes in the value of the liability resulting from negative variances in planned costs.
v. Catastrophe risk: losses caused by catastrophic events that increase the risk of life liability of the institution.
Risk of non-life liability: risk of loss from the change in the value of the liability of non-life insurance caused by fluctuations in risk factors that affect these liabilities:
i. Premium risk: loss resulting from the insufficiency of premiums to meet the disasters that might occur.
ii. Reserve risk: loss resulting from the insufficiency of reserves for disasters, already incurred but not settled, including costs from management of these disasters.
iii. Catastrophe risk: losses caused by catastrophic events that increase the risk of non-life liability of the institution.
298
Table of Contents
Main data
In the case of the Group, actuarial risk encompasses the activity of the Group’s fully-owned subsidiaries which are subject not only to a risk of actuarial nature, but also their activity is impacted by the rest of financial, non-financial and transversal risks, defined by the Group.
The volume of assets managed by the companies in Spain and Portugal that are wholly owned subsidiaries of the Bank amounted to €25,576 million, of which €23,276 million are directly related to commitments with insurance holders, as follows:
| • | €14,479 million are commitments guaranteed (wholly or partly) by the companies themselves. |
| • | €8,797 million are commitments where the risks are assumed by the insurance holders. |
3. Fiduciary risk
Fiduciary risk comes from the management and/or administration by clients of products and assets, as well as when acting as trustee for third parties. It is mostly associated with activities related to investment and protection products linked to asset management and insurance activities.
It is the risk incurred when acting as trustee for third parties or managing assets for the benefit of third parties, where mismanagement of assets could result in losses for the client and the fiduciary could be responsible for these losses, with the consequent economic and/or reputational impact.
The fiduciary risk can also be defined as the potential loss that could occur due to significant fluctuations in the value of the portfolios managed by the fiduciary for third parties (settler/beneficiaries) and the image and reputation of the trust.
In this sense, there is a relation between fiduciary risks and the risk of conduct, which is the risk caused by inadequate practices in the Bank’s relationship with its clients, the treatment and products offered to the client and their adequacy for each specific client, as well as the compliance and reputational risks.
The main factor of all activities and/or businesses that involve a fiduciary risk is the duty to act in the client’s best interest (“Look after the money of clients as if it was your own”). This principle obliges one to always act in the client’s interest, in accordance with the mandate, instructions or orders.
This principle is backed by basic pillars for managing fiduciary risk and defending clients’ interests.
| • | Knowledge of the client: risk management should be orientated by adequate knowledge, within the organization, of the reality and needs of clients. This knowledge includes the appropriateness of the product offered to clients in asset management and insurance, ensuring that it fits into the marketing policy in accordance with the client profile. |
| • | Mandate compliance: the process of risk management requires analysis and control of the mandates through regular assessment of compliance with them. The risk associated with clients’ positions will be managed for by applying the same general principles as those applied in the analysis and control of the Group’s own risks. |
| • | Transparency: all the relevant information on management of positions, the risks entailed in them and the evolution and results generated by these positions must be transmitted to the client. |
| • | Management of conflicts of interest: potential or actual conflicts of interest can result from the interrelation between the activity of management and that of other business units or Group areas. In order to avoid these circumstances the criteria established by the Group will be followed in all cases, safeguarding in all of them the interests of clients, participants, partners or those insured. |
299
Table of Contents
| • | Monitoring and adapting to regulations: both of products as well as fund management companies so as to always provide the highest quality service and foresee regulatory risk. |
The largest component of fiduciary risk is associated with asset management by third parties: discretional management of vehicles and portfolios by fund management and insurance companies in which the Group has a stake and/or with whom distribution agreements are maintained, as well as activity carried out by the Group’s private banking units which provide advisory services and discretional management of client portfolios.
The regulations impose on fund management companies as well as companies that provide investment services the obligation to always safeguard the interests of clients.
This obligation is specified in the management contract or fiduciary mandate, which defines the conditions under which the fiduciary operates and its relation with clients. In order to guarantee compliance with the mandate granted by clients, risk is managed from the different vectors that could affect the portfolios as further discussed below.
In order for the fiduciary to be able to carry out these services, there must be at the local level a legal structure subject to the requirements of its local supervisor. It is also necessary to have adequate technical and human resources, and conduct the control and monitoring of risks in a risk and compliance unit that is independent of business.
The three fundamental vectors of fiduciary risk control are:
| • | The financial, market, credit and liquidity risks which are incurred by investing the wealth of clients in financial products and instruments. |
| • | The regulatory risk of complying with the limits established by regulations and the strictly fiduciary risk, complying with the investment mandates and with the security of the investment process. |
| • | The importance of monitoring the final result of the investments both with regard to the fiduciary relations with the client who expects the best result as well as with regard to competitors, with the objective of offering a product of the highest possible quality and without compromising Group’s risk principles. |
Management and control model
The Group’s business and asset management activities were changed during the course of 2014, following the corporate restructuring at Santander Asset Management (SAM), a vehicle that integrates asset management activity and which, under the marketing agreement entered into, offers a wide range of savings and investment products that cover the various needs of clients and which are distributed by the Group’s commercial networks and by external distribution channels.
Asset management activity can vary as regards the assets managed:
| • | Management of mutual funds and companies, discretional management portfolios and pension funds, currently developed by SAM and by countries’ private banking teams and vehicles. |
| • | Private equity management, specialized in managing venture capital vehicles. |
| • | Real estate management, specialized in managing property products. |
We market and manage these assets in accordance with the rules and recommendations of local supervisors, following minimum standards that ensure the best interests of our clients.
300
Table of Contents
The mission and objectives of the Group’s department of fiduciary risks are synthesized in the admission and monitoring of the risks assumed with clients and businesses, participating in the decision-making processes on the introduction of new products and the mandates of defined management; and, subsequently, monitoring all the fiduciary risks.
In order to comply with this mission, the fiduciary risk team has the following functions:
| • | Define the risk profile of the new products/portfolios/mandates and underlying assets, participating in the approval process, as well as approving the companies that manage and administer them. |
| • | Identify, know, control, analyze and monitor the fiduciary risks globally in the business of private banking, asset management and insurance. |
| • | Cooperate in designing and defining the fiduciary risk policies: products, underlying assets and management policies. |
| • | Disseminate, implement, cooperate in applying and overseeing compliance in the local units and in each of the business units of the risk policies, procedures and any other rule applicable in the fiduciary risk sphere. |
| • | Design the control and monitoring policies of fiduciary risk on products, portfolios, mandates and underlying assets, guaranteeing both the vision of control as well as that of management. |
| • | Supervise the result of the control processes conducted, make improvement proposals and recommendations for fiduciary risk. |
| • | Design and implement mitigating measures for the risks detected. |
Implementing these functions is structured at the parent and local levels in the following way:
At the parent level, the area of fiduciary risks is in charge of designing and defining the financial risk policies and procedures, compliance and performance at the global level; disseminating and cooperating in their implementation in the local units; supervising the result of the control processes carried out locally and implementing, when necessary, the mitigating measures for the risks detected.
At the local level, the areas of local risks must have the structure and means necessary to conduct its activity as described above, as they are in charge of executing the various controls established, assuming the responsibility of reporting the results to the interlocutors at the local level (business, risk supervision, regulators and supervisors, etc.), as well as to their interlocutors at the parent level.
Main metrics
At the end of 2014, the mutual funds managed and marketed were €124,708 million and the pension funds were €11,481 million.
301
Table of Contents
The risk profile of the total mutual and pension funds is influenced by the type of assets incorporated in the different products, as shown below:
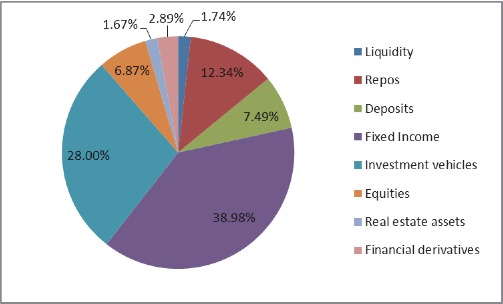
Part 6. Liquidity and funding risk
6.1. Introduction to the treatment of liquidity and funding risk
Liquidity and funding management has always been a basic element of the Group’s business strategy and a fundamental cornerstone, together with capital, on which the strength of its balance sheet rests.
Liquidity became highly significant for bank management in recent years due to the stresses that arose in the financial markets in the context of a global economic crisis. This scenario emphasized the importance of banks having appropriate funding structures and strategies to ensure the continuity of their intermediation activity.
During that period of stress, the Group enjoyed an adequate liquidity position, surpassing that of its peers, which represented a competitive advantage in terms of carrying on and expanding its activity in a demanding environment.
Currently, in a more favorable scenario for liquidity, the Group continues to benefit from its proven robustness as it meets the new challenge of cost optimization amid the demanding liquidity standards required by regulations, and as it drives growth in geographical areas previously undergoing deleveraging.
This improved position achieved by the Group as a whole is based on a decentralized funding model composed of subsidiaries that are autonomous and self-sufficient in terms of liquidity. Each subsidiary is responsible for covering the liquidity needs arising from its current and future activity, either by taking deposits from its customers in its area of influence, or by resorting to the wholesale markets where it operates, subject to management and supervision procedures coordinated at Group level.
This is a funding structure that has proven to be most effective in situations of high market stress as it prevents difficulties in one area from affecting funding capacity in other areas and, therefore, the Group as a whole, which could occur if a centralized funding model was used.
302
Table of Contents
In addition, at the Group this funding structure also benefits from the advantages of having a commercial banking model with a significant presence in ten markets with great potential, with the focus on retail customers and a high level of efficiency. As a result, the subsidiaries have a considerable capacity to attract stable deposits, as well as a significant issue capacity in the wholesale markets of those countries, generally in local currencies, bolstered by the strength of their franchise and their membership in a leading group.
6.2. Liquidity management framework—Monitoring and control of liquidity risk
Structural liquidity management seeks to finance the Group’s recurring business with optimal maturity and cost conditions, avoiding the need to assume undesired liquidity risks.
Liquidity management at the Group is based on the following principles:
| • | Decentralized liquidity model. |
| • | Medium- and long-term liquidity needs arising from the business must be funded using medium- and long-term instruments. |
| • | High proportion of customer deposits, as a result of a commercial balance sheet. |
| • | Diversification of wholesale funding sources by: instrument/investor; market/currency; and maturity. |
| • | Restrictions on recourse to short-term wholesale financing. |
| • | Availability of a sufficient liquidity reserve, including a capacity for discounting at central banks, to be drawn upon in adverse situations. |
| • | Compliance with the regulatory liquidity requirements at the Group and subsidiary level, as a new conditioning factor in management. |
In order to ensure the effective application of these principles by all the Group entities, it was necessary to develop a single management framework resting on the following three tenets:
| • | A sound organizational and governance model to ensure that senior management of the subsidiaries is involved in the decision-making process and is included in the Group’s global strategy. |
| • | An in-depth balance-sheet analysis and liquidity risk measurement to support the decision-making process and the control thereof. |
| • | A management approach adapted in practice to the liquidity needs of each business. |
6.2.1. Organizational and governance model
Decisions relating to all structural risks, including liquidity risk, are made though local asset-liability committees (ALCOs) in coordination with the Global ALCO.
The Global ALCO is the body empowered by the Bank’s board of directors to coordinate the asset and liability management (ALM) function throughout the Group, including the management of liquidity and funding, which is carried out by the local ALCOs in accordance with the corporate ALM framework.
303
Table of Contents
It is chaired by the Bank’s chair and its members are an executive deputy chairman (who, in turn, is the chairman of the executive risk committee), the CEO, the finance and risk executive vice presidents, and other executive vice presidents and heads of certain business and analysis units who perform advisory functions.
In line with governance best practice, the Group has traditionally maintained a clear division between the implementation of the financial management strategy (for which the financial management area is responsible) and its monitoring and control (which is the responsibility of the market risk area).
In recent years, this governance model has been reinforced by being integrated into a more global vision of the Group’s risks, namely the Group risk appetite framework. This framework responds to the demands from market regulators and participants, as a result of the financial crisis, for banks to strengthen their risk management and control systems.
With respect to the liquidity risk profile and appetite, the framework aims to reflect the Group’s business strategy in structuring the balance sheet to make it as resilient as possible to potential liquidity stress scenarios. Appetite metrics have therefore been structured to reflect the application, on an individual basis, of the principles of the Group’s management model, with specific levels for the structural funding ratio and minimum liquidity horizons under various stress scenarios.
6.2.2. Balance sheet analysis and liquidity risk measurement
Funding and liquidity decision-making is based on a thorough understanding of the Group’s current situation (environment, strategy, balance sheet and liquidity position), of the future liquidity needs of the various units and businesses (liquidity projection) and of the accessibility and situation of the funding sources in wholesale markets.
Its aim is to ensure that the Group maintains adequate liquidity levels to cover its short- and long-term requirements with stable funding sources, optimizing the impact of funding costs on the income statement.
This requires the monitoring of the balance sheet structure, the preparation of short- and medium-term liquidity projections and the establishment of basic metrics.
Simultaneously, various scenario analyses are conducted considering the additional liquidity needs that could arise if certain very severe but highly unlikely events occur. These events might have a varying effect on the various balance sheet items and/or funding sources (extent of roll-over of wholesale financing, level of run-off of deposits, impairment of liquid assets, etc.), due either to the global market conditions or to the Group’s specific situation.
The results of these balance-sheet, projection and scenario analyses provide the inputs required to prepare the Group’s various contingency plans, which, if necessary, would enable it to anticipate a broad spectrum of potential adverse situations.
All these measures are in line with the practices being promoted to strengthen the liquidity of financial institutions by the Basel Committee and the various regulators (in the European Union, the European Banking Authority). The objective is to define a framework of principles and metrics that are, in some cases, nearing implementation and, in others, at earlier stages of development.
Methodology for liquidity risk monitoring and control
The liquidity risk metrics adopted by the Group pursue the following goals:
| • | To attain the highest degree of effectiveness in liquidity risk measurement and control. |
304
Table of Contents
| • | To provide support for financial management, to which end the metrics are adapted to the manner in which the Group’s liquidity is managed. |
| • | To be aligned with the regulatory requirements arising from the transposition of Basel III in the European Union, in order to avoid any conflicts between limits and to facilitate management. |
| • | To act as an early warning system that anticipates potential risk situations by monitoring certain indicators. |
| • | To achieve involvement at country level. Although the metrics are developed on the basis of common, uniform concepts affecting liquidity, these have to be analyzed and adapted by each unit. |
Two kinds of basic metrics are used to control liquidity risk: short term and structural. Short-term metrics include basically the liquidity gap, while structural metrics feature the net structural balance-sheet position.
Liquidity gap
The liquidity gap provides information on potential cash inflows and outflows -both contractual and those estimated using assumptions- for a given period. Liquidity gap analyses are prepared for each of the main entities and for each of the currencies in which the Group operates.
The gap supplies data on the projected sources and applications of funds of all on- and off-balance sheet items in specific time periods. This analysis tool is obtained by considering the net result of the maturity and cash flow structure for each of the time buckets established. The tool is constructed by including the available liquidity and contrasting it with the liquidity requirements resulting from maturities.
In practice, since the same item will behave differently at the various Group subsidiaries, a set of common standards and methodologies are in place to make it possible to construct the liquidity risk profiles of each unit in a uniform manner and to submit these profiles in a comparable form to the Bank’s senior management.
Consequently, as this analysis has to be performed on an individual basis for each subsidiary, for the purpose of their autonomous management, a consolidated view of the Group’s liquidity gaps is of very limited use for the management and understanding of liquidity risk.
Net structural position
The purpose of this metric is to determine the reasonableness of the balance-sheet funding structure. The Group’s aim is to ensure that its structural needs (lending, non-current assets, etc.) are satisfied by means of an appropriate combination of wholesale funding sources and a stable retail customer base, as well as capital and other non-current liabilities.
Each unit prepares its liquidity balance sheet based on the nature of its business and compares its liquidity needs with the various funding sources available to it. The essential factors taken into account in determining this metric are the degree of recurrence of the business to be financed, the stability of the funding sources and the readiness with which assets can be converted into cash.
In practice, each subsidiary prepares its own liquidity balance sheet (different from the balance sheet for accounting purposes) by classifying the various asset, liability and off-balance-sheet items on the basis of their nature in terms of liquidity. Thus, the funding structure of each subsidiary is determined, which must at all times conform to a fundamental premise: namely that the core businesses must be financed with stable funds and medium- and long-term financing. The combination of these measures guarantees the robustness of the Group’s financial structure and the sustainability of its business plans.
305
Table of Contents
At the end of 2014, the Group had a structural liquidity surplus of €153,000 million, comprising debt securities (€151,000 million), equity instruments (€14,000 million) and net loans and advances to credit institutions and central banks (€9,000 million), offset by short-term wholesale funding (€21,000 million).
Accordingly, the average structural liquidity surplus amounted to €158,000 million.
Scenario analysis
The Group supplements the aforementioned metrics by developing a series of stress scenarios.
Its main objective is to identify the critical factors in potential crises and, at the same time, to define the most appropriate management measures to address each of the situations assessed.
In their liquidity analyses the units generally consider three different scenarios: idiosyncratic, local systemic and global systemic. These scenarios constitute the minimum standard analysis established for all Group units to be reported to senior management. Also, each unit develops ad-hoc scenarios which replicate major historical crises or the liquidity risks specific to its particular environment.
The definition of scenarios and calculation of metrics under each scenario is directly related to the definition and execution of the liquidity contingency plan, which is the responsibility of financial management.
At the end of 2014, in the event of a potential systemic crisis the Group would have an adequate liquidity position.
6.2.3. Management tailored to business needs
The Group performs its liquidity management at subsidiary and/or business unit level in order to finance its recurring activities with the appropriate terms and prices.
In practice, the liquidity management at these units consists of:
| • | Preparation of a liquidity plan each year on the basis of the funding needs arising from the budgets of each business and the methodology described above. Based on these liquidity requirements and taking into account certain conservative limits on the raising of funds in the short-term markets, the financial management area establishes an issue and securitization plan for the year at subsidiary/global business level. |
| • | Year-round monitoring of the actual changes in the balance sheet and in the funding requirements of the subsidiaries/businesses, which results in the relevant updates of the plan. |
| • | Monitoring and management of the units’ compliance with the regulatory ratios, and oversight of the level of committed assets in each unit’s funding, from a structural standpoint and with regard to the component with the shortest term. |
| • | Continuous active presence in a wide range of wholesale funding markets, enabling the Group to maintain an adequate issue structure that is diversified in terms of product type and has a conservative average maturity. |
The effectiveness of this management effort at Group level is based on the fact that it is implemented at all subsidiaries. Specifically, each subsidiary budgets the liquidity requirements resulting from its intermediation activity and assesses its own ability to raise funds in the wholesale markets so that, in ongoing coordination with the Group, it can establish an issue and securitization plan.
306
Table of Contents
Traditionally, the Group’s main subsidiaries have been self-sufficient in terms of their structural funding. The exception is Santander Consumer Finance (SCF) which, because it specializes in consumer financing mainly through dealer/retailer recommendations, requires the financial support of other Group units, especially the Parent.
6.3. Funding strategy and evolution of liquidity in 2014
6.3.1. Funding strategy
In the last few years the Group’s funding activity has achieved its goal of obtaining sufficient funds for the Group’s recurring business in a more demanding environment. At its peak, during the global economic and financial crisis, the Group had to manage sharp increases in risk. As a result, liquidity levels were very low over certain time horizons and the related costs of funding were very high. Following the interventions by the central banks of the major economies, these market conditions eased significantly throughout 2013 and even more so in 2014.
This sound performance by the Group was underpinned by the extension of the management model to all Group subsidiaries, including recent acquisitions, and, above all, by the adaptation of the subsidiaries’ strategies to the growing demands of both markets and regulators. These demands were not uniform across the markets and reached far higher levels of difficulty and pressure in certain areas, such as the peripheral regions of Europe.
In any case, it is possible to identify a series of general trends in the policies implemented by Group’s subsidiaries in their funding and liquidity management strategies since the beginning of the crisis, namely:
| • | Strong generation of liquidity from the commercial business due to the lower growth of credit and greater emphasis on attracting customer funds. |
| • | Maintenance of adequate, stable medium- and long-term wholesale funding levels at Group level. At 2014 year-end, this funding represented 21% of the liquidity balance sheet, a similar level to that of recent years but well below that of 2008 year-end when wholesale funding, which was more abundant and less expensive, had not yet suffered the pressures of the crisis. Following the tightening of conditions on the wholesale markets, the Group’s decentralized subsidiaries model, with proprietary issue and rating programs, contributed to maintaining the Group’s high-level participation in the developed wholesale markets, even in the most demanding periods, such as the two-year period encompassing 2011 and 2012. |
| • | Holding a sufficient volume of assets eligible for discount at central banks as part of the liquidity reserve to anticipate periods of stress on wholesale markets. In particular, in recent years the Group has significantly raised its total discount capacity, which currently stands at around €170 billion. |
Thanks to all these market and business developments, based on a sound liquidity management model, the Group currently enjoys a very robust funding structure, the main features of which are as follows:
| • | High proportion of customer deposits in a predominantly commercial balance sheet. Customer deposits are the Group’s major source of funding. These deposits represent around two thirds of the Group’s net liabilities (i.e. of the liquidity balance sheet) and at the end of 2014 they accounted for 88% of net loans. |
| • | Diversified wholesale funding, primarily at medium and long term, with a very small proportion maturing in the short term. Medium- and long-term wholesale funding represents 21% of the Group’s net liabilities and enables it to comfortably cater for the net loans not financed with customer deposits (commercial gap). This funding is well-balanced by instrument (approximately 1/3 senior debt, 1/3 securitizations and secured, structured loans, 1/4 covered bonds, with the remainder consisting of preference shares and subordinated debt) and by market: the markets with a greater proportion of issues are the ones where investment activity is higher. |
307
Table of Contents
6.3.2. Evolution of liquidity in 2014
At the end of 2014, in comparison with 2013, the Group reported:
| • | A stable ratio of loans to net assets (total assets less trading derivatives and interbank balances) at 74% due to the improvement in lending following the end of deleveraging in mature markets. |
| • | A slight increase in the loan-to-deposit (LTD) ratio, to 113% (112% in 2013), within very comfortable levels (lower than 120%). The trend in this ratio reflects the recovery of credit in mature markets, both organic and inorganic, and the increased focus on optimizing the cost of retail deposits in countries with low interest rates. |
| • | A slight decline in the ratio of loan-to-customer deposits plus medium- and long-term funding, for similar reasons to the trend in the LTD ratio, since the increase in the wholesale funds is also lower than that of loans. This ratio stood at 116%. |
| • | There was a continuing limited recourse to short-term wholesale funds at the Group. The ratio of this funding, at around 2%, was in line with previous years. |
Lastly, the Group’s structural surplus (i.e. the excess of structural funding resources -deposits, medium- and long-term funding, and capital- over structural liquidity requirements -non-current assets and loans-) continued to rise in 2014. At December 31, 2014, the structural surplus stood at €153 billion on a consolidated basis.
Asset encumbrance
It is important to note the Group’s moderate use of assets as security for structural balance-sheet funding sources. Following the guidelines laid down by the European Banking Authority (EBA) in 2014, the concept of asset encumbrance includes both on-balance-sheet assets provided as security in transactions to obtain liquidity and off-balance-sheet assets that have been received and re-used for the same purpose, as well as other assets associated with liabilities for reasons other than funding.
The reporting of the Group information at 2014 year-end required by the EBA is as follows:
On-balance-sheet encumbered assets
| Billions of euros |
Carrying amount of encumbered assets |
Carrying amount of non- encumbered assets |
||||||
| Assets |
296.0 | 970.3 | ||||||
| Credits and loans |
186.3 | 692.1 | ||||||
| Equity instruments |
7.4 | 11.4 | ||||||
| Debt securities |
84.2 | 92.2 | ||||||
| Other assets |
18.1 | 174.6 | ||||||
308
Table of Contents
Encumbrance of collateral received
| Billions of euros |
Fair value of encumbered collateral received or own debt securities issued |
Fair value of collateral received or own debt securities issued available for encumbrance |
||||||
| Collateral received |
57.5 | 37.4 | ||||||
| Credits and loans |
1.6 | 0.3 | ||||||
| Equity instruments |
1.8 | 0.6 | ||||||
| Debt securities |
54.2 | 31.4 | ||||||
| Other collateral received |
— | 5.3 | ||||||
| Own debt securities issued other than own covered bonds or ABSs |
— | — | ||||||
Encumbered assets and collateral received and matching liabilities
| Billions of euros |
Matching liabilities, contingent liabilities or securities lent |
Assets, collateral received and own debt securities issued other than covered bonds and ABSs encumbered |
||||||
| Total sources of encumbrance (carrying amount) |
291.7 | 353.5 | ||||||
On-balance-sheet encumbered assets amounted to €296 billion, almost two-thirds of which are loans (mortgage loans, corporate loans, etc.). For their part, off-balance-sheet encumbered assets amounted to €57.5 billion, relating mostly to debt securities received as security in asset purchase transactions and re-used. Taken together, these two categories represent a total of €353.5 billion of encumbered assets, which give rise to €291.7 billion of associated liabilities.
At 2014 year-end, total assets encumbered in funding transactions represented 26% of the Group’s expanded balance sheet under EBA standards (total assets plus collateral received: €1,361 billion at December 2014).
Within these encumbered assets, a distinction should be made between the different sources of encumbrance and the role they play in the Group’s funding:
| • | 50% of total encumbered assets relate to security provided in medium- and long-term financing transactions (with average maturity of more than two years) to fund the commercial balance-sheet activity. This places the level of “structural” asset encumbrance at 13% of the expanded balance sheet under EBA standards. |
| • | The other 50% relate to transactions in the short-term market (with average maturity of less than three months) or to security provided in derivative transactions whose purpose is not to fund the ordinary business activity but rather to ensure efficient short-term liquidity management. |
7.1. Definition and objectives
The Group defines operational risk as the risk of loss resulting from inadequate or failed internal processes, human resources and systems or from external events.
Operational risk is inherent in all products, activities, processes and systems, and is generated in all the business and support areas. Accordingly, all the employees are responsible for managing and controlling the operational risks generated in their area of activity.
309
Table of Contents
The aim pursued by the Group in operational risk control and management is primarily to identify, measure/assess, monitor, control, mitigate and report on this risk.
The Group’s priority, therefore, is to identify and mitigate any clusters of operational risk, irrespective of whether losses have been incurred. Measurement of this risk also contributes to the establishment of priorities in operational risk management.
For the purpose of calculating regulatory capital for operational risk, the Group has been applying the standardized approach provided for under Basel II standards. However, in 2014 the Group initiated a project to shift to Advanced Measurement Approaches (AMA), for which it has already satisfied the majority of the regulatory requirements. In any event, it should be noted that the priority in operational risk management continues to be focused on mitigation.
7.2. Operational risk management and control model
7.2.1. Operational risk management cycle
The operational risk management and control model includes the following phases:
| • | Identification of the operational risk inherent in all the Group’s activities, products, processes and systems. |
| • | Definition of the target operational risk profile, specifying the strategies by unit and time horizon, through the establishment of the operational risk appetite and tolerance, the budget and the related monitoring. |
| • | Engagement of all employees in the operational risk culture, through appropriate training for all areas and levels of the organization. |
| • | Objective and continued measurement and assessment of operational risk, consistent with the industry and regulatory standards (Basel, Bank of Spain, etc.). |
| • | Continuous monitoring of operational risk exposures, implementation of control procedures, improvement of internal awareness and mitigation of losses. |
| • | Establishment of mitigation measures to eliminate or minimize operational risk. |
| • | Generation of periodic reports on the exposure to operational risk and its level of control for senior management and the Group’s areas/units, and reporting to the market and the regulatory authorities. |
| • | Definition and implementation of the methodology required for calculating capital in terms of expected and unexpected loss. |
The following is required for each of the key processes indicated above:
| • | Definition and implementation of systems enabling the Group to monitor and control operational risk exposures. These systems must be integrated into the Group’s daily management, using the current technology and maximizing the automation of applications. |
| • | Definition and documentation of operational risk management and control policies and implementation of the related methodologies and tools consistent with current regulations and best practices. |
The operational risk management and control model implemented by the Group provides the following benefits:
| • | It encourages the development of an operational risk culture. |
| • | Integrated and effective management of operational risk (identification, measurement/assessment, control/mitigation and reporting). |
310
Table of Contents
| • | Improved knowledge of actual and potential operational risks and better assignment to business and support lines. |
| • | The information on operational risk helps improve processes and controls and reduce losses and income volatility. |
| • | Setting of limits for operational risk appetite. |
7.2.2. Risk identification, measurement and assessment model
In order to identify, measure and assess operational risk, the Group defined a set of quantitative and qualitative corporate techniques/tools that are combined to perform a diagnosis based on the identified risks and obtain a valuation through the measurement/assessment of the area/unit.
The quantitative analysis of this risk is carried out mainly using tools that record and quantify the level of losses associated with operational risk events.
The tools defined for the qualitative analysis aim to assess aspects (coverage/exposure) linked to the risk profile, thereby making it possible to capture the control environment in place.
7.3. Mitigation measures
The Group has an inventory of mitigation measures established in response to the main sources of risk. They were identified through the analysis of the tools applied for managing operational risk, and from the organizational and development model, as well as from the preventive implementation of operational and technology risk management and control policies and procedures.
The most significant mitigation measures center on improving security for customers in their ordinary transactions, and continuous improvement of processes, technology and management to ensure that products are sold and services are provided appropriately.
In addition, with regard to measures relating to customer-, product- and business-related practices, the Group establishes corporate policies for marketing products and services.
Anti-cyber-risk measures
There was in 2014 an increase in the number and impact of incidents relating to cybersecurity, which affect all types of companies and institutions, including those in the financial sector. This trend, which is generating concern among entities and regulators, is encouraging the adoption of preventive measures in order to be prepared for attacks of this nature. The implementation of the cybersecurity strategy at the various Group entities gave rise to various initiatives and lines of action, such as:
| • | Assessment of each entity’s situation with respect to the internal reference model in order to identify possibilities for improvement and to prioritize points of action with regard to cyber risks. |
| • | Strengthening of the technological solutions and services aimed at detecting and preventing cyber-attacks and information leaks, and the recording, correlation and management of security events. |
| • | Improvement of the security monitoring services and extension of their scope. |
| • | Participation in the cyber exercises promoted by the Spanish Cybersecurity Institute (INCIBE) aimed at evaluating the response by companies to this type of incident. |
| • | Cooperation with international forums with the objective of identifying best practices and sharing information about threats. |
311
Table of Contents
Measures also began to be taken to update the training programs in this sphere for the Group’s employees, which will lead to a new course in the e-learning platform in 2015. This course will give precise steps, as well as examples of the main patterns of cyber attacks and electronic fraud currently occurring.
In addition, observation and study of the events in the sector and in other industries, from an analytical standpoint, enables us to update and adapt our models to the emerging threats.
Lastly, we have prepared a global program of insurance for cyber risk that covers the Group’s units against such events.
7.4. Business continuity plan
The Group has a business continuity management system to ensure the continuity of the business processes of its entities in the event of a disaster or serious incident.
This basic objective consists of the following:
| • | Minimizing possible injury to persons, as well as adverse financial and business impacts for the Group, due to an interruption of normal business operations. |
| • | Reducing the operational effects of a disaster by supplying a series of pre-defined, flexible guidelines and procedures to be employed in order to resume and recover processes. |
| • | Resuming time-sensitive business operations and associated support functions, in order to achieve business continuity, stable earnings and planned growth. |
| • | Re-establishing the time-sensitive technology and transaction-support operations of the business if existing technologies are not operational. |
| • | Protecting the public image of, and confidence in, the Group. |
| • | Meeting the Group’s obligations to its employees, customers, shareholders and other third-party stakeholders. |
In 2014, the Group continued to make progress in the implementation and continuous improvement of its business continuity management system. It placed particular emphasis on tightening controls for monitoring the continuity plans of the suppliers that provide services deemed essential for the Bank.
7.5. Other matters relating to operational risk control and monitoring
Analysis and monitoring of controls in market operations
In view of the specific features and complexity of financial markets, the Group seeks to continually strengthen the operational control procedures in order to remain in line with new regulations and best market practices. Therefore, in 2014, the control model for this business continued to be improved, with particular emphasis on the following points:
| • | Analysis of the individual operations of each treasury operator to detect any possible anomalous conduct. |
| • | Implementation of a new tool enabling compliance with the new requirements regarding transaction recording and control. |
| • | Tightening of controls on cancellations of amendments to transactions. |
| • | Reinforcement of controls on contributions of prices to market indices. |
| • | Development of additional controls for operational detection and prevention. |
312
Table of Contents
| • | Development of additional controls of accesses to front-office record keeping systems. |
The business is also undergoing a global transformation, combined with the modernization of the technology platforms and operating processes involving a robust control model that enables the operational risk associated with this activity to be reduced.
Corporate information
The operational risk function has an operational risk management information system that provides data on the Group’s main risk elements. The information available from each country/unit in the operational risk sphere is consolidated to provide a global view with the following features:
| • | Two levels of information: one corporate, with consolidated information, and the other individualized for each country/unit. |
| • | Dissemination of the best practices among the countries/units of the Group, obtained from the combined study of the results of qualitative and quantitative analyses of operational risk. |
More specifically, information is prepared on the following aspects:
| • | The operational risk management model in place at the Group and its main units and geographical areas. |
| • | The scope of operational risk management. |
| • | Monitoring of appetite metrics. |
| • | Analysis of the internal event database and of significant external events. |
| • | Analysis of the most significant risks, detected using various sources of information, such as the internal operational and technology risk assessment exercises. |
| • | Evaluation and analysis of risk indicators. |
| • | Mitigating measures/active management. |
| • | Business continuity plans and contingency plans. |
This information acts as the basis for meeting reporting requirements including to the executive risk committee, the risk supervision, regulation and compliance committee, the operational risk committee, senior management, regulators and rating agencies.
The role of insurance in operational risk management
The Group considers insurance as a key factor in operational risk management. In 2014, common guidelines were established for coordinating the various functions involved in the management cycle for operational risk-mitigating insurance, mainly the areas of proprietary insurance and operational risk control, but also the various front-line risk management areas.
Part 8. Compliance, conduct and reputational risk
8.1. Definitions and objective
Compliance risk is the risk of receiving penalties (financial or otherwise), or of being subject to other types of disciplinary measures by the supervisors as a result of failing to comply with laws, regulations, standards, the organization’s self-regulatory standards or codes of conduct applicable to the activity carried on.
313
Table of Contents
Conduct risk is the risk caused by inappropriate practices in the Bank’s dealings with its customers and products offered to them and the adequacy thereof for each particular customer.
Reputational risk is defined as the risk of damage to the perception of the Bank held by public opinion, the Bank’s customers, investors or any other interested party.
The Group’s objective regarding compliance and conduct risk is: (i) to minimize the probability of irregularities arising; and (ii) to identify, report and swiftly resolve any irregularities that might possibly arise. As for reputational risk, bearing in mind the diversity of sources from which it can arise, management efforts are aimed at identifying and controlling this risk so that the probability of its occurring is reduced and its possible impact is mitigated.
8.2. Corporate governance and organizational model
It is the responsibility of the Bank’s board of directors, as part of its supervisory function, to approve the Group’s general risk policy. In the corporate compliance, conduct and reputational risk area, the board is in charge of the Group’s general code of conduct, the governance frameworks on the prevention of money laundering and terrorist financing, and the marketing of products and services.
The compliance function reports to the board of directors: (i) on an ongoing basis, directly through an executive deputy chairman of the board who supervises the Group’s compliance function; and (ii) through the monthly report submitted to the risk supervision, regulation and compliance committee. This committee supports and advises the board in the Group’s relationship with the supervisors and regulators of the various countries in which it is present, as well as in the supervision of internal codes and regulations.
At its meeting on January 16, 2015, the board of directors resolved to appoint an executive deputy chairman of the board, to whom the compliance function will report, in accordance with regulatory recommendations on corporate governance. In addition, in order to bolster the prominence of the compliance function, at its meeting on February 2, 2015 the executive committee resolved to appoint an executive vice president as chief compliance officer.
The corporate committees for regulatory compliance, analysis and resolution and marketing (the last two specialize in their respective subjects: the prevention of money laundering and the marketing of products and services) are collective bodies with basic competencies in this matter which have a global scope (all geographical areas, all businesses) and are replicated at local level.
The risk unit monitors the compliance risk control framework both from the integrated risk control and internal risk validation area (CIVIR), in the exercise of its functions to support the executive risk committee, and from the non-financial risk control area created in 2013.
The organizational model revolves around the corporate compliance and reputational risk area, which is entrusted with managing the Group’s compliance, conduct and reputational risks. Within this area are the corporate regulatory compliance risk management office, the corporate conduct risk management office and the corporate financial intelligence unit (UCIF), which is responsible for the prevention of money laundering and terrorist financing. This structure is replicated at local level and also in the global businesses, and the appropriate functional reporting channels to the corporate area have been established.
8.3. Risk appetite model and regulatory risk assessment exercise
The Group’s risk appetite model applicable to compliance and conduct risk is characterized by the following three elements:
| • | It is based on an express declaration of zero appetite for compliance and conduct risk. |
| • | The objective of the management performed by the Group is to minimize the incidence of compliance and conduct risk. Accordingly, systematic monitoring is performed using the compliance and conduct risk indicator resulting from the assessment matrices prepared for each country. |
314
Table of Contents
| • | Quarterly monitoring of the level of risk is performed on a country-by-country basis. |
Data of the communications received from the various supervisors each month is fed into the assessment matrix. Each of these communications is allocated a score depending on the risk they represent in terms of: (i) costs due to fines; (ii) process reorganization costs; and (iii) the impact on the brand and reputational risk. These assessments complement the ratings assigned by internal audit with respect to compliance. Each local unit is allocated a weighting based on its attributable profit and volume of assets, which can be used to obtain an overall score for the Group.
The corporate compliance area carried out a regulatory risk assessment exercise in 2014 focusing on the Group’s main countries. This exercise, which centered on the identification of the regulatory obligations affecting the Group’s units, was based on a risk assessment of each obligation, which is conducted in two stages: the first, in relation to “inherent risk”, which stems from the activity relating to the business, and the second, in relation to residual risk, after taking the effect of the controls into consideration.
This regulatory risk assessment exercise is expected to complement the risk appetite model by contributing new metrics to it.
8.4. Risk management model
The main responsibility for compliance, conduct and reputational risk management is shared by the compliance and reputational risk function and the various business and support units that conduct the activities giving rise to risk. The responsibility for fostering the development of standard policies across the entire Group, for establishing controls and monitoring and checking that they are applied, and for reporting incidents lies with the compliance and reputational risk function, which is also responsible for advising senior management on these matters and for fostering a culture of compliance, all as part of an annual program whose effectiveness is periodically evaluated.
The compliance function directly manages the basic components of these risks (money laundering, codes of conduct, product marketing, etc.) and ensures that the other components are duly addressed by the corresponding Group unit (responsible financing, data protection, customer claims, etc.), for which purpose it has established the appropriate control and verification systems.
The integrated risk control and internal risk validation area (CIVIR) ensures that the risk management model is properly executed. Also, as part of its functions, internal audit performs the tests and reviews required to check that the standards and procedures established at the Group are being complied with.
The central plank of the Group’s compliance program is the general code of conduct. This code contains the ethical principles and standards of conduct that must guide the actions of all the Group employees and is complemented in certain matters by the standards contained in the industry-specific codes and manuals30.
Also, the code establishes: i) the functions and responsibilities regarding compliance by the Group’s relevant governing bodies and divisions; ii) the standards regulating the consequences of the failure to comply; and iii) a channel for reporting and processing notifications of allegedly unlawful actions.
It is the role of the corporate compliance office, under the supervision of the risk supervision, regulation and compliance committee and the regulatory compliance committee, to ensure the effective implementation and monitoring of the general code of conduct.
The regulatory compliance committee has authority on all matters relating to the compliance function, without prejudice to the matters assigned to the two specialist bodies in this area (the corporate marketing committee with regard to the marketing of products and services, and the analysis and resolution committee with regard to the prevention of money laundering and terrorist financing). The regulatory compliance committee is composed of representatives from the general secretary’s division, risk, human resources, organization and costs, technology and operations, internal audit, financial management and public policy.
| 30 | The industry-specific codes and manuals include the prevention of money laundering and terrorist financing manual, the code of conduct in securities markets, the procedures manual for the sale of financial products, the analysis code of conduct, the research policy manual, the use of information and communications technology conduct manual, the property management conduct manual, the purchasing management conduct manual, etc., in addition to the notes and circulars implementing specific points of these codes and manuals, including, in particular, the corporate circular on the corporate program for the prevention of corruption. |
315
Table of Contents
The Group’s compliance department has been entrusted with the following compliance, conduct and reputational risk management functions:
| • | Implementing the Group’s general code of conduct and other industry-specific codes and manuals. |
| • | Supervising the training activities on the compliance program conducted by the human resources area. |
| • | Directing any investigations into possible breaches, with help from internal audit, and proposing the appropriate penalties to the related committee. |
| • | Cooperating with internal audit in the periodic reviews that it carries out on compliance with the general code of conduct and with the industry-specific codes and manuals, without prejudice to the periodic reviews of matters of regulatory compliance which are conducted by the compliance department directly. |
| • | Receiving and handling the complaints made by employees through the whistleblower hotline. |
| • | Advising on the resolution of doubts arising from the application of the codes and manuals. |
| • | Preparing an annual report on the application of the compliance program for submission to the risk supervision, regulation and compliance committee. |
| • | Regularly reporting to the risk supervision, regulation and compliance committee and the board of directors on the implementation of the compliance policy and the compliance program. |
| • | Assessing, every year, the changes that it might be appropriate to make to the compliance program, particularly in the event of detecting unregulated risk areas and improvable procedures, and proposing such changes to the risk supervision, regulation and compliance committee. |
As regards the industry-specific codes and manuals, the focus of the compliance program is on the following operational spheres, inter alia:
Prevention of money laundering and terrorist financing
Policies
As a socially responsible organization, it is a strategic objective for the Group to have an advanced effective system for the prevention of money laundering and the financing of terrorism that is constantly adapted to the latest international regulations and has the capacity to respond to the appearance of new techniques employed by criminal organizations.
The prevention of money laundering and terrorist financing function is articulated in certain policies that establish minimum standards that the Group’s units must observe, and which are prepared in conformity with the principles contained in the 40 recommendations of the Financial Action Task Force (FATF) and the obligations and stipulations of Directive 2005/60/EC of the European Parliament and of the Council of October 26, 2005 on the prevention of the use of the financial system for the purpose of money laundering and terrorist financing.
The corporate policy and the standards implementing it must obligatorily be complied with at all Group units worldwide. In this regard, units should be taken to be all the banks, subsidiaries, departments or branches of the Bank, both in Spain and abroad, which, in accordance with their legal status, must be subject to the regulations on the prevention of money laundering and terrorist financing.
316
Table of Contents
Governance and organization
The organization of the prevention of money laundering and terrorist financing function at the Group lies with the following bodies: (i) the board of directors, (ii) the Group’s analysis and resolution committee (CAR), (iii) the corporate financial intelligence unit (UCIF), (iv) local CARs, (v) local prevention of money laundering and terrorist financing units and (vi) heads of prevention at various levels.
The board of directors approves the internal governance framework for the prevention of money laundering and terrorist financing.
The Group’s CAR is a collective body with a corporate scope. It is composed of representatives of the following divisions: risk, internal audit, commercial banking, global wholesale banking, human resources, organization and costs, technology and operations, the controller’s unit and management control, consumer finance and the general secretary’s division. It defines the general policies and objectives, and formulates the policy rules for the Group’s various bodies and entities with regard to prevention and the related coordination.
The corporate financial intelligence unit (UCIF) directs, supervises and coordinates the systems for the prevention of money laundering and terrorist financing of the Group’s subsidiaries, branches and business areas. This requires the adoption of programs, measures and improvements where necessary.
The local CARs are the internal control bodies designated for the prevention of money laundering and terrorist financing with a local remit. They are composed of representatives of the departments most directly involved in these matters.
The local prevention of money laundering units (UPBCs) are the technical units responsible for directing and coordinating the systems and procedures for the prevention of money laundering and terrorist financing in the countries where the Group has a presence, for investigating and reporting suspect transactions and for fulfilling the reporting requirements to the related authorities.
Also, there are persons responsible for the prevention of money laundering and terrorist financing at four different levels: area, unit, branch and account. Their purpose in each case is to support the UCIF and the local UPBCs from a position of proximity to customers and operations.
At consolidated level, a total of 885 professionals perform the prevention of money laundering and terrorist financing function at the Group (85% on a full-time basis) at 149 units established in 35 countries.
The Group has established corporate systems at all its units and business areas based on decentralized computer software which makes it possible to present directly to the account branches or the relationship managers the transactions and customers which need to be analyzed because of their risk. These tools are supplemented by others that are used centrally by the teams of analysts in the prevention units and, based on certain risk profiles and changes in certain customer operational behavior patterns, they enable transactions that might be linked to money laundering or terrorist financing to be analyzed, identified on a preventative basis and monitored.
The Bank is a founding member, along with ten other large international banks, of the Wolfsberg Group. The Wolfsberg Group’s objective is to establish international standards to increase the effectiveness of programs to combat money laundering and terrorist financing in the financial community. Various initiatives have been developed which have addressed, inter alia, issues such as the prevention of money laundering in private banking and correspondent banking, and the financing of terrorism. The regulatory authorities and experts in this area consider that the Wolfsberg Group and the principles and guidelines set by it represent an important step in the fight against money laundering, corruption, terrorism and other serious crimes.
Marketing of products and services
Policies
The Group manages the risk that may arise from an inadequate sale of products or an improper provision of services by the Group in accordance with the corporate framework for the marketing of products and services.
317
Table of Contents
The purpose of this corporate framework is to establish a standard system for the marketing of products and services at the Group, in order to minimize the Group’s exposure to risks in all the phases of marketing (approval, pre-sale, sale and follow-up).
In order to adapt the framework to the Bank and to the Group’s subsidiaries, it is adopted by the respective boards of directors, and made binding and adapted where necessary to ensure compliance with the applicable local regulatory requirements.
Governance and organization
The organizational structure for managing the risk that might arise from the incorrect selling of products or services is based, at both parent and local levels, on the marketing committees, the monitoring committees and at the conduct risk management offices.
The corporate marketing committee (CCC) is the Group’s highest decision-making body regarding the approval of products and services. It is composed of representatives of the following divisions: risk, financial management, technology and operations, the general secretary’s division, the controller’s unit and management control, internal audit, commercial banking and global wholesale banking.
The CCC assesses the suitability of the product or service for the environment in which it is to be marketed, placing particular emphasis on ensuring that:
| • | Each product or service is sold by competent sales personnel. |
| • | Customers are furnished with the required appropriate information. |
| • | The product or service fits the customer’s risk profile. |
| • | Each product or service is assigned to the appropriate market, not only from a legal or tax standpoint, but also with regard to the financial culture of that market. |
| • | The product or service meets the requirements of the corporate marketing policies and, in general, the applicable internal or external regulations. |
Also, the local marketing committees approve new products and channel the related validation proposals to the CCC.
In their respective approval processes the marketing committees’ actions are guided by a risk-based approach, from the view point of both the Bank and the customer.
The corporate monitoring committee is the Group’s decision-making body regarding the monitoring of products and services. It is composed of representatives from the following divisions: internal audit, the general secretary’s division, risk, and the business areas concerned (with the ongoing representation of commercial banking). It meets weekly, and considers and resolves specific issues relating to the selling of products and services at all the Group’s units.
The purpose of the corporate conduct risk management office is to provide the relevant governing bodies with the information required to enable them: (i) to conduct an appropriate analysis of risk in the validation phase, with a twofold focus: impact on the Bank and impact on the customer; and (ii) to monitor products over their life cycle.
At local level conduct risk management offices have been established, which are responsible, inter alia, for promoting a corporate culture of correct marketing practices and ensuring that products are approved and monitored in the respective local spheres in keeping with the corporate framework.
318
Table of Contents
Conduct in securities markets
Policy
This is set by the code of conduct in the securities markets (CCMV), complemented, inter alia, by the code of conduct for analysis activities, the research policy manual and the procedure for detecting, analyzing and communicating transactions suspected of market abuse.
Governance and organization
The organization is centered on the corporate compliance office and local and subsidiaries’ compliance divisions.
The Group’s compliance department performs the following main functions in relation to the rules of conduct in securities markets:
| • | Registering and controlling sensitive information that is known by and/or generated at the Group. |
| • | Keeping lists of the securities affected and the initiated persons, and monitoring transactions with these securities. |
| • | Monitoring transactions with restricted securities depending on the type of activity, portfolios or groups to which the restriction applies. |
| • | Receiving and attending to notifications of, and requests for, authorization of transactions for our own account. |
| • | Controlling transactions for the accounts of the persons subject to compliance with the code of conduct. |
| • | Managing breaches of the CCMV. |
| • | Resolving any issues raised concerning the CCMV. |
| • | Recording and resolving conflicts of interest and the situations that might give rise to them. |
| • | Assessing and managing any conflicts that might arise in the analysis activity. |
| • | Maintaining the files required to control compliance with the obligations established in the CCMV. |
| • | Developing regular contact with the regulators. |
| • | Organizing training and, in general, performing the actions required to apply the CCMV. |
| • | Analyzing actions that might constitute market abuse and, where appropriate, reporting them to the supervisors. |
Criminal risk prevention
The Group’s compliance department has also been entrusted with the management of the criminal risk prevention model, which resulted from the entry into force of Organic Law 5/2010, which made legal entities criminally responsible for crimes committed on their account or for their benefit by directors or representatives or employees as a result of a lack of control.
In 2014, the Group obtained AENOR certification for the risk management system for crime prevention, of which the whistleblowing channel is a key component.
There are 26 whistleblowing channels in place at the Group. In 2014, complaints were made through six of them, in Germany, Brazil, the US, the U.K., Poland and Spain.
In 2014, the total number of complaints received through all channels was over 400. They were processed in accordance with the Group’s internal procedures. The most common grounds for the complaints were employees’ failure to comply with the internal regulations, through either inappropriate behavior or non-observance of the Group’s policies or procedures.
319
Table of Contents
Relationships with supervisors and dissemination of information to the markets
The compliance department is responsible for responding to the information requirements of the regulatory and supervisory bodies, both in Spain and in other countries where the Group operates, monitoring implementation of the measures arising from the reports or inspections conducted by these bodies and supervising the way in which the Group disseminates institutional information in the markets, transparently and in accordance with the regulators’ requirements. The risk supervision, regulation and compliance committee (prior to its creation in June 2014, the audit committee) is informed of the main issues at each of its meetings.
In 2014, the Bank published 90 significant events, which may be consulted on the Group’s website and on that of the CNMV.
The use of models in risk management gives rise to model risk, i.e. the risk of losses arising from decisions based mainly on the results of models, due to errors in the definition, application or use of such models.
This risk occurs both in operational risk (the risk associated with errors in the data, construction, implementation and use of the model) and implicitly in the risk associated with the activity that it supports (in credit, market or other risk, due to the inadequate data, construction or use of the model).
As a result of the extension of the use of models to a wide range of activities, it is necessary to establish a series of actions and controls over the life cycle of these models in order to identify and minimize the associated risks.
Model risk can be mitigated through an appropriate control and management environment, i.e. through a series of controls over the life cycle of the model. The cycle encompasses all stages of the model, from the definition of the standards to be used in its development to the periodic monitoring of the model and its expiry.
The planning stage is particularly significant since this is when the development and management priorities are defined. When plans are prepared, the needs to be covered are identified and the materiality of the risk involved is assessed.
The extraction and validation of the information, and the development of the model are two other fundamental stages. In the case of development, control points must be established in order to check, inter alia, that the data used are suitable, that the objectives match the requested results, that the model was constructed in accordance with the set guidelines, or that the implementation is viable prior to formal roll-out of the model, which will occur after it has been formally approved.
There must be a validation process in place that is carried out by a function that is independent from that of the model developer, in order to control the risk associated with the development of models. The scope of the validation will depend on the type of model, the materiality and the type of development involved.
Lastly, all developments, whether a new model, a modification of an existing one or a new use for an existing model, must be reviewed and approved based on its materiality by the relevant governing body. This process represents the recognition by the intervening parties that they are familiar with, and aware of, all the risks associated with the use of the model, of the various assumptions used in its construction, and of the existing limitations in its various intended uses.
Once implemented, the models are monitored regularly to check that they are being used for the purpose for which they were approved and that they continue to work as expected.
Part 10. Capital management and control of capital risk
Capital management at the Group, which is carried out on an integrated basis in order to ensure the Group’s capital adequacy, meet regulatory requirements and maximize return on capital, is determined by the strategic objectives and the risk appetite set by the board of directors. With this objective in mind, a series of policies have been defined that shape the Group’s capital management approach:
320
Table of Contents
| • | To establish adequate capital planning to enable the Group to comply with current requirements and to provide the capital required to cover the needs of the business plans, regulatory requirements, and the associated short- and medium-term risks, while maintaining the risk profile approved by the board. |
| • | To ensure that, in stress scenarios, the Group and its companies maintain sufficient capital to cover their needs arising from the increase in risks caused by the deterioration in macroeconomic conditions. |
| • | To optimize the use of capital through an appropriate allocation of capital among the businesses based on the relative return on regulatory and economic capital, taking into consideration the risk appetite, their growth and the strategic objectives. |
The Group defines capital risk as the risk that the Group or one or more of its subsidiaries may have an insufficient amount and/or quality of capital to meet regulatory and other requirements and its strategic planning guidelines. The objectives relating to capital risk include most notably:
| • | To meet the internal capital and capital adequacy targets |
| • | To meet the regulatory requirements |
| • | To align the Bank’s strategic plan with the capital expectations of relevant third parties (rating agencies, shareholders and investors, customers, supervisors, etc.). |
| • | To support the growth of the businesses and any strategic opportunities that may arise. |
Capital adequacy position
The Group has a sound capital adequacy position that surpasses the levels required by regulations. In 2014, the Group continued to bolster its main capital ratios in response to the difficult economic and financial environment and new regulatory demands.
On January 9, 2015, the Bank completed a capital increase of €7,500 million. With this increase, the Bank has met its main objective of being able to sustain the organic growth of the business, by increasing credit and the market share in the main markets in which the Group operates.
Leverage ratio requirements
The new CRD IV regulations introduce a new leverage ratio that is not sensitive to the entities’ risk profile. It is calculated as the ratio of Tier 1 capital to exposure.
This exposure is calculated as the sum of total assets on balance sheet plus off-balance-sheet items (mainly guarantees, unused credit limits granted and documentary credits). Certain technical adjustments are made to this sum, such as by replacing the asset value of derivatives and securities financing transactions with the EAD considered for the calculation of risk-weighted assets and by eliminating the value of assets considered as deductions from Tier 1 capital. Additionally, the regulators have included certain value reductions for off-balance-sheet trade-related transactions.
Although compliance with this ratio is not yet mandatory, it must be published from 2015 onwards. Regulators have announced their intention to make compliance with a minimum ratio obligatory starting in 2018 (indicating a 3% minimum benchmark ratio).
10.1. New regulatory framework
From the capital standpoint, Basel III redefines what is considered to be available capital at financial institutions (including new deductions and raising the requirements for eligible equity instruments), increases the minimum capital requirements, requires financial institutions to operate permanently with capital buffers, and adds new requirements in relation to the risks considered.
321
Table of Contents
The Group shares the ultimate objective pursued by the regulator with this new framework, namely to endow the international financial system with greater stability and resilience. In this regard, for many years the Group has collaborated on the impact studies for calibrating the new standards conducted by the Basel Committee and the European Banking Authority (EBA) and coordinated at local level by the Bank of Spain.
In Europe, the new standards were implemented through Directive 2013/36/EU, known as the Capital Requirements Directive (“CRD IV”), and the related Capital Requirements Regulation 575/2013 (“CRR”), which is directly applicable in all EU member states (as part of the Single Rulebook). In addition, the standards are subject to Implementing Technical Standards commissioned from the European Banking Authority (EBA), some of which will be issued in the coming months/years.
The Capital Requirements Regulation came into force on January 1, 2014, with many of its rules subject to various implementation timetables. This transitional implementation phase, which affects mainly the definition of eligible capital, concludes at the end of 2017, except with regard to the deduction for deferred tax assets, the transition period for which lasts until 2023.
Subsequent to the transposition of Basel III into European legislation, the Basel Committee has continued to issue additional standards, some in the form of public consultation processes, which will entail a future amendment of CRD IV and the CRR. The Group will continue to support the regulators by offering its opinions and participating in impact studies.
For more detailed discussion of the regulatory framework, see note 1.e to our consolidated financial statements.
10.2. Economic capital
Economic capital is the capital required, based on an internally-developed model, to support all the risks of the business activity with a given solvency level. In the Group’s case, the solvency level is determined by the AA-/A+ long-term target rating, which results in the application of a 99.95% confidence level (higher than the regulatory 99.90%) for the purpose of calculating the required capital.
The Group’s economic capital model complements the regulatory approach by including in its measurement all the significant risks incurred in the Group’s operations. Accordingly, it considers risks such as concentration risk, structural interest rate risk, business risk, pension risk and other risks outside the scope of regulatory Pillar I capital requirements. Economic capital also includes the diversification effect, which in the Group’s case, owing to the multinational, multi-business nature of its operations, is of key importance in determining its overall risk and solvency profile.
Economic capital is a fundamental tool for the internal management and implementation of the Group’s strategy, from the viewpoint of both the assessment of capital adequacy and the management of portfolio and business risk.
With regard to capital adequacy, in the context of Pillar II of the Basel Capital Accord, the Group conducts the internal capital adequacy assessment process using its economic capital model. To this end, the Group plans the evolution of the business and the capital requirements under a central scenario and under alternative stress scenarios. With this planning the Group ensures that it will continue to meet its capital adequacy targets, even in adverse economic scenarios.
Also, the economic capital metrics make it possible to assess risk-return targets, price transactions on a risk basis and gauge the economic viability of projects, units or lines of business, with the ultimate objective of maximizing the generation of shareholder value.
Since it is a uniform risk measure, economic capital makes it possible to explain the distribution of risk across the Group, placing different activities and types of risk in a comparable metric.
RORAC and value creation
The Group has used RORAC methodology in its risk management since 1993, with the following objectives:
322
Table of Contents
| • | Calculation of economic capital requirements and of the return thereon for the Group’s business units, segments, portfolios and customers, in order to facilitate an optimal allocation of capital. |
| • | Budgeting of capital requirements and RORACs of the Group’s business units. |
| • | Analysis and setting of prices in the decision-making process for transactions (loan approval) and customers (monitoring). |
The RORAC methodology facilitates the comparison, on a like-for-like basis, of the performance of transactions, customers, portfolios and businesses, and identifies those which achieve a risk-adjusted return higher than the Group’s cost of capital, thus aligning risk management and business management with the aim of maximizing value creation, which is the ultimate objective of Group senior management.
The Group periodically assesses the level of and the changes in the value creation (VC) and return on risk-adjusted capital (RORAC) of the Group and of its main business units. The VC is the profit generated over and above the cost of the economic capital (EC) used, and is calculated using the following formula:
VC = Profit – (average EC x cost of capital)
The profit used is obtained by making the required adjustments to accounting profit in order to reflect only the recurring profit obtained by each unit from its business activity.
If a transaction or portfolio yields a positive return, it will be contributing to the Group’s profit, although it will only create shareholder value when this return exceeds the cost of capital.
2014 witnessed an uneven performance of the business units in terms of value creation. The Group’s results and, therefore, the RORAC and value creation figures were shaped by the varying trends in the economic cycle at the Group units.
10.3 Capital planning and stress tests
Capital stress tests have gained particular significance as a tool for the dynamic evaluation of banks’ risk exposure and capital adequacy. A new forward-looking assessment model has become a key component of capital adequacy analysis.
This forward-looking assessment is based on both macroeconomic and idiosyncratic scenarios that are highly improbable but nevertheless plausible. To conduct the assessment, it is necessary to have robust planning models capable of transferring the effects defined in the projected scenarios to the various elements that have a bearing on capital adequacy.
The ultimate goal of capital stress tests is to perform a complete evaluation of banks’ risk exposure and capital adequacy in order to determine any possible capital requirements that would arise if banks failed to meet the regulatory or internal capital targets set.
Internally, the Group has defined a capital planning and stress process, to serve not only as a response to the various regulatory exercises, but also as a key tool integrated in the Group’s management and strategy.
The aim of the internal capital planning and stress process is to guarantee current and future capital adequacy, even in adverse yet plausible economic scenarios. To this end, starting with the Group’s initial situation, the expected outcomes for the Group are estimated for various business environments and the Group’s capital ratios are calculated, normally projected over a three-year period.
The process implemented provides a comprehensive view of the Group’s capital for the time horizon analyzed and in each of the specified scenarios.
European Central Bank comprehensive assessment exercise
The European Central Bank comprehensive assessment exercise began in October 2013, with a view to launching the Single Supervisory Mechanism on November 4, 2014. Banks participating in this exercise were subjected to a risk
323
Table of Contents
assessment, an asset quality review and a stress test. Its objective was to increase transparency, control and credibility, in order for the results to bolster the private sector’s trust in the capital adequacy of European banks and the quality of their balance sheets.
The most significant banks in the EU took part, including all banks meeting at least one of the following criteria: (1) assets exceeding €30 billion, (2) assets exceeding 20% of the country’s GDP, (3) the bank is one of the three largest credit institutions in a Member State.
The comprehensive assessment was based on three pillars:
| • | Risk assessment: prior evaluation of the business model and the most significant risks, including those relating to liquidity, leverage and funding. Each entity’s risk profile was taken into account, together with its relationship with other entities and its vulnerability to exogenous factors. |
| • | Asset quality review (AQR): a qualitative and quantitative analysis of the credit and market exposures at December 2013 (including off-balance-sheet exposures, non-performing loans, refinancing transactions and sovereign risk). Its specific objective was to assess whether the provisions and the valuation of the collateral for the credit exposure were adequate, and to assess the valuation of complex instruments and high risk assets. It was structured in three phases: |
| • | Portfolio selection: at the proposal of the national competent authorities, the portfolios to be included in the analysis were selected, in accordance with the coverage criteria established at entity level. |
| • | Execution: data integrity validation, collateral valuation and recalculation of provisions and risk-weighted assets. |
| • | Verification: analysis of consistency to ensure the comparability of the results of all the portfolios and of all the banks across the European Union. This included an analysis of quality control, guidelines and definitions. |
| • | Stress test: an analysis of the banks’ ability to withstand an adverse situation. This was carried out in cooperation with the EBA (European Banking Authority). The exercise established a baseline scenario and an adverse scenario affecting a bank’s performance, including its risks (credit, market, sovereign, securitization and cost of funding), with a three-year time horizon (2014-2016), using AQR-adjusted 2013 year-end data as the starting point. |
The adverse macroeconomic scenario took into consideration certain systemic risks for the banking sector such as an increase in bond yields at a global level, particularly those relating to emerging economies, or a higher deterioration of asset quality in economies with weaker fundamentals and vulnerable financial sectors.
Minimum capital (CET1) was set at 8% in the baseline scenario and at 5.5% in the adverse scenario, in accordance with the Basel III definition (CRD IV/CRR) and its progressive introduction (phase-in) timetable.
The stress test results were based on the scenarios defined in the methodology and are not forecasts of financial performance or of capital ratios. The stress test was based on the common methodology designed by the EBA, which included key assumptions to simplify the exercise (for example, a static balance sheet, a dividend payout similar to the average for the last three years and valuation adjustments on public debt).
Result of the assessment for the Group
With regard to the AQR exercise, i.e. the review of the quality of the portfolios, an analysis was conducted of 16 major credit portfolios from seven countries and various segments (residential, SMEs and corporates) representing more than 50% of the credit risk exposure at December 31, 2013. In addition, a review was made of procedures and policies, taking samples of files and reviewing them, of appraisals of properties and collateral and of the valuation models for the trading book. The impact of the analysis on CET1 was not material (-4 basis points).
With respect to the stress test, the Group passed the proposed scenarios comfortably, particularly the adverse scenario which is very unlikely to occur.
324
Table of Contents
Item 12. Description of Securities Other than Equity Securities.
Not Applicable
Not Applicable
Not Applicable
Our Depositary is J.P. Morgan Chase & Co., with its principal executive office located at 270 Park Avenue, New York, NY 10017-2070.
Each ADS represents the right to receive one share of Capital Stock of Santander, par value €0.50 each.
| • | Fees charged to investors as outlined in the deposit agreement are the following: |
325
Table of Contents
| Category of Service |
Depositary Actions |
Associated Fee | ||
| (a) Deposit or substituting the underlying shares | Each person to whom ADSs are issued against deposits of shares, including deposits in respect of share distributions, rights and other distributions.31
Each person surrendering ADRs for the withdrawal of deposited securities. |
$5.00 for each 100 ADSs (or portion thereof) delivered or surrendered. | ||
| (b) Receiving or distributing dividends | Distribution of dividends. | $0.01 per ADS. | ||
| (c) Selling or Exercising Rights | Distribution or sale of securities, the fee being in an amount equal to the fee for the execution and delivery of ADSs which would have been charged as a result of the deposit of such securities. | $5.00 for each 100 ADSs (or portion thereof). | ||
| (d) Withdrawing an underlying security | Acceptance of ADRs surrendered for withdrawal of deposited securities. |
$5.00 for each 100 ADSs (or portion thereof) evidenced by the ADRs surrendered. | ||
| (e) Expenses of the Depositary | Expenses incurred on behalf of and charged to Holders in connection with:
i) Stock transfer or other taxes and other governmental charges.
ii) Cable, telex and facsimile transmission and delivery.
iii) Transfer or registration fees for the registration of transfers of deposited shares and other deposited securities on any applicable register in the name of the Custodian or its nominee in connection with the deposit of shares or in the name of such person as a Holder may direct in connection with any withdrawal of deposited securities.
iv) Expenses of the Depositary in connection with the conversion of foreign currency into U.S. dollars (which are paid out of such foreign currency). |
Expenses payable at the sole discretion of the depositary. | ||
| • | Fees received from our depositary in connection with the ADR program are the following: |
Contract amount:
Fixed: $4,524,058.22
Variable: $691,837.71
Total: $5,215,895.93
Actually paid:
Fixed: $5,215,895.93
Variable: $0
Total: $5,215,895.93
Waived fees:
Ongoing program maintenance per contract year: $150,000
Annual meeting services: $15,000
Investor Relations advisory services: $185,000
Total: $350,000
| 31 | The Depositary may sell (by public or private sale) sufficient securities and property received in respect of such share distributions, rights and other distributions prior to such deposit to cover such charge. |
326
Table of Contents
Item 13. Defaults, Dividend Arrearages and Delinquencies
A. Not Applicable
B. Not Applicable
Item 14. Material Modifications to the Rights of Security Holders and Use of Proceeds
A. Not Applicable
B. Not Applicable
C. Not Applicable
D. Not Applicable
E. Not Applicable
Item 15. Controls and Procedures
(a) Evaluation of Disclosure Controls and Procedures
As of December 31, 2014, Banco Santander, S.A., under the supervision and with the participation of its management, including its disclosure committee, its chief executive officer, chief financial officer, and chief accounting officer, performed an evaluation of the effectiveness of the design and operation of its disclosure controls and procedures (as defined in Rule 13a-15 (e) under the Exchange Act). There are, as described below, inherent limitations to the effectiveness of any control system, including disclosure controls and procedures. Accordingly, even effective disclosure controls and procedures can provide only reasonable assurance of achieving their control objectives.
Based on such evaluation, Banco Santander, S.A.’s chief executive officer, chief financial officer and chief accounting officer concluded that Banco Santander, S.A.’s disclosure controls and procedures are effective in ensuring that information Banco Santander, S.A. is required to disclose in the reports it files or submits under the Exchange Act is (1) recorded, processed, summarized and reported within the time periods specified in the SEC’s rules and forms, and (2) accumulated and communicated to Banco Santander, S.A.’s management, including its disclosure committee, chief executive officer, chief financial officer and the chief accounting officer, as appropriate to allow timely decisions regarding required disclosures.
(b) Management’s Report on Internal Control over Financial Reporting
The management of Banco Santander, S.A. is responsible for establishing and maintaining adequate internal control over financial reporting as defined in Rule 13a-15 (f) under the Exchange Act.
Our internal control over financial reporting is a process designed by, or under the supervision of, the Bank’s principal executive and principal financial officers and effected by the Bank’s board of directors, management and other personnel, to provide reasonable assurance regarding the reliability of financial reporting and the preparation of consolidated financial statements for external purposes, in accordance with generally accepted accounting principles. For Banco Santander, S.A., generally accepted accounting principles refer to the International Financial Reporting Standards as issued by the International Accounting Standards Board (“IFRS-IASB”).
Our internal control over financial reporting includes those policies and procedures that:
| • | Pertain to the maintenance of records that in reasonable detail accurately and fairly reflect the transactions and dispositions of our assets; |
327
Table of Contents
| • | Provide reasonable assurance that transactions are recorded as necessary to permit preparation of financial statements in accordance with generally accepted accounting principles, and that our receipts and expenditures are being made only in accordance with authorizations of our management and directors; and |
| • | Provide reasonable assurance regarding prevention or timely detection of unauthorized acquisition, use or disposition of our assets that could have a material effect on the financial statements. |
Because of its inherent limitations, internal control over financial reporting may not prevent or detect misstatements. Also, projections of any evaluation of effectiveness to future periods are subject to the risk that controls may become inadequate because of changes in conditions, or that the degree of compliance with the policies or procedures may deteriorate.
We have adapted our internal control over financial reporting to the most rigorous international standards and comply with the guidelines set by the Committee of Sponsoring Organizations of the Treadway Commission in its Enterprise Risk Management Integrated Framework. These guidelines have been extended and installed in our Group companies, applying a common methodology and standardizing the procedures for identifying processes, risks and controls, based on the Enterprise Risk Management Integrated Framework.
The documentation, update and maintenance processes in the Group’s companies have been constantly directed and monitored by a global coordination team, which set the guidelines for its development and supervised its execution at the unit level.
The general framework is consistent, as it assigns to management specific responsibilities regarding the structure and effectiveness of the processes related directly and indirectly with the production of consolidated financial statements, as well as the controls needed to mitigate the risks inherent in these processes.
Under the supervision and with the participation of the management of the Group, including our chief executive officer, our chief financial officer and our chief accounting officer, we conducted an evaluation of the effectiveness of our internal control over financial reporting as of December 31, 2014, based on the framework set forth by the Committee of Sponsoring Organizations of the Treadway Commission (“COSO”) in Internal Control—Integrated Framework (2013). Based on this assessment, management believes that, as of December 31, 2014, its internal control over financial reporting was effective based on those criteria.
Our independent registered public accounting firm has issued an audit report on the effectiveness of our internal control over financial reporting as of December 31, 2014. This report follows below.
328
Table of Contents
(c) Attestation report of the registered public accounting firm
REPORT OF INDEPENDENT REGISTERED PUBLIC ACCOUNTING FIRM
To the Board of Directors and Shareholders of Banco Santander, S.A.:
We have audited the internal control over financial reporting of Banco Santander, S.A. (the “Bank”) and Companies composing, together with the Bank, the Santander Group (the “Group”) as of December 31, 2014, based on criteria established in Internal Control—Integrated Framework (2013) issued by the Committee of Sponsoring Organizations of the Treadway Commission. The Group’s management is responsible for maintaining effective internal control over financial reporting and for its assessment of the effectiveness of internal control over financial reporting, included in the accompanying Management’s Report on Internal Control Over Financial Reporting. Our responsibility is to express an opinion on the Group’s internal control over financial reporting based on our audit.
We conducted our audit in accordance with the standards of the Public Company Accounting Oversight Board (United States of America). Those standards require that we plan and perform the audit to obtain reasonable assurance about whether effective internal control over financial reporting was maintained in all material respects. Our audit included obtaining an understanding of internal control over financial reporting, assessing the risk that a material weakness exists, testing and evaluating the design and operating effectiveness of internal control based on the assessed risk, and performing such other procedures as we considered necessary in the circumstances. We believe that our audit provides a reasonable basis for our opinion.
A company’s internal control over financial reporting is a process designed by, or under the supervision of, the company’s principal executive and principal financial officers, or persons performing similar functions, and effected by the company’s board of directors, management, and other personnel to provide reasonable assurance regarding the reliability of financial reporting and the preparation of financial statements for external purposes in accordance with generally accepted accounting principles. A company’s internal control over financial reporting includes those policies and procedures that (1) pertain to the maintenance of records that, in reasonable detail, accurately and fairly reflect the transactions and dispositions of the assets of the company; (2) provide reasonable assurance that transactions are recorded as necessary to permit preparation of financial statements in accordance with generally accepted accounting principles, and that receipts and expenditures of the company are being made only in accordance with authorizations of management and directors of the company and (3) provide reasonable assurance regarding prevention or timely detection of unauthorized acquisition, use, or disposition of the company’s assets that could have a material effect on the financial statements.
Because of the inherent limitations of internal control over financial reporting, including the possibility of collusion or improper management override of controls, material misstatements due to error or fraud may not be prevented or detected on a timely basis. Also, projections of any evaluation of the effectiveness of the internal control over financial reporting to future periods are subject to the risk that the controls may become inadequate because of changes in conditions, or that the degree of compliance with the policies or procedures may deteriorate.
In our opinion, the Group maintained, in all material respects, effective internal control over financial reporting as of December 31, 2014, based on the criteria established in Internal Control—Integrated Framework (2013) issued by the Committee of Sponsoring Organizations of the Treadway Commission.
We have also audited, in accordance with the standards of the Public Company Accounting Oversight Board (United States of America), the consolidated financial statements as of and for the year ended December 31, 2014 of the Group and our report dated April 29, 2015 expressed an unqualified opinion on those financial statements.
/s/ Deloitte, S.L.
DELOITTE, S.L.
Madrid, Spain
April 29, 2015
329
Table of Contents
(d) Changes in internal controls over financial reporting. There was no change in our internal control over financial reporting that occurred during the period covered by this annual report that has materially affected, or is reasonably likely to materially affect, our internal control over financial reporting.
Item 16A. Audit committee financial expert
The audit committee has four members, all of whom are non-executive independent directors (as defined by Article 6.2c) of the Rules and Regulations of the Board). All members of the audit committee also meet the independence criteria set by the NYSE for foreign private issuers. Our Rules and Regulations of the Board provide that all members of the audit committee must have knowledge, aptitude and experience in the areas of accounting, auditing or risk management. Currently, the chairman of the audit committee is Juan Miguel Villar-Mir. The standards for director independence by Spanish law may not necessarily be consistent with, or as stringent as, the standards for director independence established by the NYSE for U.S. issuers. Our board of directors has determined that Juan Miguel Villar-Mir is an “Audit Committee Financial Expert”, as such term is defined in the SEC’s Form 20-F.
We have adopted a code of ethics (the “General Code of Conduct”) that applies to members of the board and to all employees of Banco Santander, S.A. and of the Grupo Santander companies, notwithstanding the fact that certain persons are also subject to the Code of Conduct in Securities Markets or to other Codes of Conduct related specifically to the activity or lines of business in which they undertake their responsibilities. This Code establishes the principles that guide these officers’ and directors’ respective actions: ethical conduct, professional standards and confidentiality. It also establishes the limitations and defines the conflicts of interest arising from their status as senior executives or directors.
In 2012, a new General Code of Conduct was published. The current Code primarily broadened the scope of the previous one by: (i) including guidelines for certain specific situations not included in the previous version and (ii) listing additional responsibilities in relation to the Code for compliance management and for other bodies and divisions of the Group.
The current General Code of Conduct set an open door policy by which any Grupo Santander employee who becomes aware of an allegedly unlawful act or an act in breach of the General Code of Conduct or of our business specific codes and manuals may report such act directly to compliance management.
This Code is available on our website, which does not form part of this annual report on Form 20-F, at www.santander.com under the heading “Information for shareholders and investors—corporate governance—codes of conduct”.
330
Table of Contents
Item 16C. Principal Accountant Fees and Services
Amounts paid to the firms belonging to the Deloitte worldwide organization, the Group’s principal auditor, for statutory audit and other services were as follows
| 2014 | 2013 | 2012 | ||||||||||
| (in millions of euros) | ||||||||||||
| Audit Fees |
44.2 | 35.9 | 38.1 | |||||||||
| Audit Related Fees |
31.1 | 20.8 | 20.6 | |||||||||
| Tax Fees |
6.6 | 4.6 | 4.3 | |||||||||
| All Other Fees |
8.0 | 6.5 | 8.1 | |||||||||
| 89.9 | 67.8 | 71.1 | ||||||||||
The services provided by the Group’s auditors meet the independence requirements stipulated by the Legislative Royal Decree 1/2011, of July 31, 2011 approving the Consolidated Audit Act, as well as those included in the Sarbanes-Oxley Act of 2002, in the SEC and in the Rules and Regulations of the Board.
The audit committee is required to pre-approve the audit and non-audit services performed by the Group’s auditors in order to assure that the provision of such services do not impair the audit firm’s independence.
In the first months of each year the audit committee proposes to the board the appointment of the independent auditor. At that time, the audit committee pre-approves the audit and audit related services that the appointed auditors will be required to carry out during the year to comply with the applicable regulation. These services will be included in the corresponding audit contracts of the Bank and of any other company of the Group with its principal auditing firm.
In addition, non-recurring audit or audit-related services and all non-audit services provided by the Group’s principal auditing firm or other auditing firms are subject to case-by-case pre-approval by the audit committee.
During 2013 the audit committee reviewed the policies and procedures to manage the approval of services to be rendered by the auditor. A list of pre-approved services, including the most common non-prohibited services that may be required from the auditor, was adopted. Specific approval is required for other services not included in the list. The Chief Accounting Officer is in charge of managing the process and must report monthly to the audit committee detailing all services to be provided by auditors, including those pre-approved and others requiring individual approval.
All services provided by the Group’s principal auditing firm in 2014 detailed in the table above were approved by the audit committee.
Item 16D. Exemption from the Listing Standards for Audit Committees
Not applicable.
331
Table of Contents
Item 16E. Purchases of Equity Securities by the Issuer and Affiliated Purchasers
The following table shows the repurchases of shares made by the Bank or any of its Affiliated Purchasers during 2014:
| 2014 |
(a) Total number of shares (or units) purchased* |
(b) Average price paid per share (or unit) |
(c) Total number of shares (or units) purchased as part of publicly announced plans or programs |
(d) Maximum number (or approximate dollar value) of shares (or units) that may yet be purchased under the plans or programs |
||||||||||||
| January |
76,265,114 | 6.60 | — | — | ||||||||||||
| February |
13,776,660 | 6.44 | — | — | ||||||||||||
| March |
23,112,786 | 6.50 | — | — | ||||||||||||
| April |
62,318,614 | 7.01 | — | — | ||||||||||||
| May |
32,230,398 | 7.24 | — | — | ||||||||||||
| June |
26,360,476 | 7.69 | — | — | ||||||||||||
| July |
96,477,413 | 7.38 | — | — | ||||||||||||
| August |
12,627,390 | 7.28 | — | — | ||||||||||||
| September |
28,703,974 | 7.73 | — | — | ||||||||||||
| October |
50,932,663 | 6.95 | — | — | ||||||||||||
| November |
28,158,130 | 6.72 | — | — | ||||||||||||
| December |
36,627,283 | 7.03 | — | — | ||||||||||||
| Total |
487,590,901 | |||||||||||||||
| * | The number of shares purchased included securities lending and short positions. |
During 2014, all purchases and sales of equity securities were made in open-market transactions.
Item 16F. Changes in Registrant’s Certifying Accountant
Not applicable
Item 16G. Corporate Governance
The following is a summary of the significant differences between our corporate governance practices and those applicable to domestic issuers under the NYSE listing standards.
Independence of the directors on the board of directors
Under the NYSE corporate governance rules, a majority of the board of directors of any U.S. company listed on the NYSE must be composed of independent directors, whose independence is determined in accordance with highly detailed rules promulgated by the NYSE.
Under Spanish law, section 529.duodecies of the Capital Companies Law, passed by RDL 1/2010 (July 2, 2010) sets out the requirements to be considered as independent director in a listed company but does not set the number of independent directors. There is a non-binding recommendation that the number of independent directors represent at least half of the total size of the Board. Article 42.1 of our Bylaws establishes that the shareholders at the general shareholders’ meeting shall endeavor to ensure that independent directors represent at least one-third of the total number of directors. Article 6.1 of the Rules and Regulations of the Board of Directors establishes likewise that the board shall endeavor that the number of independent directors represent at least one-third of all directors. The board of directors of Santander has eight independent directors (out of fifteen directors total), as defined in Article 6.2.c) of the Rules and Regulations of the Board, in accordance with section 529 duodecies of the Capital Companies Law. We have not determined whether the directors on the Santander board would be considered independent under the NYSE rules except in the case of the members of our audit committee where we have determined that all of them meet the independence criteria for foreign private issuers set forth in Rule 10A-3 under the Exchange Act. In accordance with section 529.duodecies of the Capital Companies Law, Article 6.2.c) of the Rules and Regulations of the Board defines the concept of an independent director as follows:
“External or non-executive Directors who have been appointed based on their personal or professional status and who perform duties not conditioned by relationships with the Company, or with the significant shareholders or management thereof shall be considered independent directors.
332
Table of Contents
In no event may there be a classification as independent directors of those who:
a) Have been employees or executive directors of the Group’s companies, except after the passage of 3 or 5 years, respectively, since the cessation of such relationship.
b) Receive from the Company, or from another Group company, any amount or benefit for something other than director compensation, unless it is immaterial.
For purposes of the provisions of this sub-section, neither dividends nor pension supplements that a director receives by reason of the director’s prior professional or employment relationship shall be taken into account, provided that such supplements are unconditional and therefore, the Company paying them may not suspend, modify or revoke the accrual thereof without breaching its obligations.
c) Are, or have been during the preceding 3 years, a partner of the external auditor or the party responsible for auditing the Company or any other Group company during such period.
d) Are executive directors or senior managers of another company in which an executive director or senior manager of the Company is an external director.
e) Maintain, or have maintained during the last year, a significant business relationship with the Company or with any Group company, whether in their own name or as a significant shareholder, director or senior manager of an entity that maintains or has maintained such relationship.
Business relationships shall be considered the relationships of a provider of goods or services, including financial, advisory or consulting services.
f) Are significant shareholders, executive directors or senior managers of an entity that receives, or has received during the preceding 3 years, significant donations from the Company or the Group.
Those who are merely members of the board of a foundation that receives donations shall not be considered included in this letter.
g) Are spouses, persons connected by a similar relationship of affection, or relatives to the second degree of an executive director or senior manager of the Company.
h) Have not been proposed, whether for appointment or for renewal, by the appointments committee or remuneration committee.
i) Are, as regards a significant shareholder or shareholder represented on the board, in one of the circumstances set forth in letters (i), (v), (vi) or (vii) of this sub-section 2(c). In the event of a kinship relationship set forth in item (vii), the limitation shall apply not only with respect to the shareholder, but also with respect to the related proprietary directors thereof in the affiliate company”.
The independence standards set forth in the Rules and Regulations of the Board may not necessarily be consistent with, or as stringent as, the director independence standards established by the NYSE.
Independence of the directors on the appointments committee and remuneration committee
In accordance with the NYSE corporate governance rules, all U.S. companies listed on the NYSE must have a compensation committee and a nominating and corporate governance committee and all members of such committees must be independent in accordance with highly detailed rules promulgated by the NYSE. The appointments committee and the remuneration committee of the Bank’s board of directors are composed of five external directors (four are independent and one in the opinion of the board is neither proprietary nor independent), and the risk supervision, regulation and compliance committee is composed of seven external directors (six are independent and one in the opinion of the board is neither proprietary nor independent) and the chairman of those three committees is independent in accordance with the standards set forth in the previously mentioned Article 6.2. c) of the Rules and Regulations of the Board. These independence standards may not necessarily be consistent with, or as stringent as, the director independence
333
Table of Contents
standards established by the NYSE. The composition of the appointments committee and the remuneration committee is described under the caption “Audit Committee, Risk Supervision, Regulation and Compliance Committee, Appointments Committee and Remuneration Committee” below.
During the fiscal year 2014, none of the members of the appointments committee, the remuneration committee and the risk supervision, regulation and compliance committee was an executive director, member of senior management or a Bank employee, and no executive director or member of senior management has held a position on the board (or its remuneration committee) of companies that employ members of the appointments committee, the remuneration committee and the risk supervision, regulation and compliance committee.
Separate meetings for non-management directors
In accordance with the NYSE corporate governance rules, non-management directors must meet periodically outside of the presence of management. Under Spanish law, this practice is not required and as such, the non-management directors on the board of directors of Santander do not meet outside of the presence of the directors who also serve in a management capacity.
The audit committee, the appointments committee, the remuneration committee and the risk supervision, regulation and compliance committee of the Bank’s board of directors consist entirely of non-management directors.
The audit committee met 13 times during 2014. The risk supervision, regulation and compliance committee met 5 times during 2014. The appointments and remuneration committee met 12 times during 2014 and after its division into two different committees, the appointments committee met 4 times and the remuneration committee met 4 times during 2014.
Code of ethics
Under the NYSE corporate governance rules, all U.S. companies listed on the NYSE must adopt a Code of Business Conduct and Ethics which contains certain required topics. In March 2000, Santander adopted a General Code of Conduct that applies to members of the board and to all employees of Banco Santander, S.A. and of the Grupo Santander companies, notwithstanding the fact that certain persons are also subject to the Code of Conduct in Securities Markets or to other Codes of Conduct related specifically to the activity or lines of business in which they undertake their responsibilities. On July 28, 2003, the board approved amendments to the General Code of Conduct to conform it to the requirements of Law 44/2002 (November 2, 2002) on reform measures of the financial system. The code came into force on August 1, 2003 and replaced the previous one. The General Code of Conduct establishes the principles that guide the actions of officers and directors including ethical conduct, professional standards and confidentiality.
In 2012, a new General Code of Conduct was published. The current Code primarily broadened the scope of the previous one by: (i) including guidelines for certain specific situations not included in the previous version and (ii) listing additional responsibilities in relation to the Code for compliance management and for other bodies and divisions of the Group.
The current General Code of Conduct set an open door policy by which any Grupo Santander employee who becomes aware of an allegedly unlawful act or an act in breach of the General Code of Conduct or of our business specific codes and manuals may report such act directly to compliance management.
As of December 31, 2014, no waivers with respect to the General Code of Conduct had been applied for or granted.
In addition, we abide by a Code of Conduct in the Securities Markets, which was adopted on July 28, 2003. This code establishes standards and obligations in relation to securities trading, conflicts of interest and the treatment of price sensitive information. Both codes are available to the public on our website, which does not form part of this annual report on Form 20-F, at www.santander.com under the heading “Information for shareholders and investors—corporate governance—codes of conduct”.
334
Table of Contents
Item 16H. Mine Safety Disclosure
Not applicable.
We have responded to Item 18 in lieu of this item.
Reference is made to Item 19 for a list of all financial statements filed as part of this Form 20-F.
335
Table of Contents
| (a) Index to Financial Statements |
Page | |||
| F-1 | ||||
| Consolidated Balance Sheets at December 31, 2014, 2013 and 2012 |
F-2 | |||
| Consolidated Income Statements for the Years Ended December 31, 2014, 2013 and 2012 |
F-3 | |||
| F-4 | ||||
| F-5 | ||||
| Consolidated Cash Flow Statement for the Years Ended December 31, 2014, 2013 and 2012 |
F-8 | |||
| F-9 | ||||
(b) List of Exhibits.
| Exhibit |
Description | |
| 1.1 | Bylaws (Estatutos) of Banco Santander, S.A. | |
| 1.2 | Bylaws (Estatutos) of Banco Santander, S.A., (English translation of Bylaws set forth in Exhibit 1.1 hereto). | |
| 8.1 | List of Subsidiaries (incorporated by reference as Exhibits I, II and III of our Financial Statements filed with this Form 20-F). | |
| 12.1 | Section 302 Certification by the chief executive officer. | |
| 12.2 | Section 302 Certification by the chief financial officer. | |
| 12.3 | Section 302 Certification by the chief accounting officer. | |
| 13.1 | Section 906 Certification by the chief executive officer, the chief financial officer and the chief accounting officer. | |
| 15.1 | Consent of Deloitte, S.L. | |
We will furnish to the SEC, upon request, copies of any unfiled instruments that define the rights of holders of long-term debt of Santander.
336
Table of Contents
SIGNATURES
The registrant hereby certifies that it meets all of the requirements for filing on Form 20-F and that it has duly caused and authorized the undersigned to sign this annual report on its behalf.
| BANCO SANTANDER, S.A. | ||||
| By: | /s/ José G. Cantera | |||
| Name: | José G. Cantera | |||
| Title: | Chief financial officer | |||
Date: April 29, 2015
337
Table of Contents
Index to Financial Statements
Table of Contents
REPORT OF INDEPENDENT REGISTERED PUBLIC ACCOUNTING FIRM
To the Board of Directors and Shareholders of Banco Santander, S.A.:
We have audited the accompanying consolidated balance sheets of Banco Santander, S.A. (the “Bank”) and Companies composing, together with the Bank, the Santander Group (the “Group”), as of December 31, 2014, 2013 and 2012, and the related consolidated income statements, statements of recognized income and expense, changes in total equity, and cash flows for the years then ended. These consolidated financial statements are the responsibility of the Bank’s directors. Our responsibility is to express an opinion on these consolidated financial statements based on our audits.
We conducted our audits in accordance with the standards of the Public Company Accounting Oversight Board (United States of America). Those standards require that we plan and perform the audit to obtain reasonable assurance about whether the consolidated financial statements are free of material misstatement. An audit includes examining, on a test basis, evidence supporting the amounts and disclosures in the consolidated financial statements. An audit also includes assessing the accounting principles used and significant estimates made by management, as well as evaluating the overall financial statement presentation. We believe that our audits provide a reasonable basis for our opinion.
In our opinion, the consolidated financial statements referred to above present fairly, in all material respects, the financial position of the Group as of December 31, 2014, 2013, and 2012, and the results of its operations, its changes in equity, and its cash flows for each of the three years in the period ended December 31, 2014, in conformity with International Financial Reporting Standards, as issued by the International Accounting Standards Board (“IFRS-IASB”).
We have also audited, in accordance with the standards of the Public Company Accounting Oversight Board (United States of America), the Group’s internal control over financial reporting as of December 31, 2014, based on the criteria established in Internal Control—Integrated Framework (2013) issued by the Committee of Sponsoring Organizations of the Treadway Commission and our report dated April 29, 2015 expressed an unqualified opinion on the Group’s internal control over financial reporting.
/s/ Deloitte, S.L.
DELOITTE, S.L.
Madrid, Spain
April 29, 2015
F-1
Table of Contents
CONSOLIDATED BALANCE SHEETS AS AT DECEMBER 31, 2014, 2013 AND 2012
(Millions of Euros)
The accompanying Notes 1 to 55 and Appendices are an integral part of the consolidated balance sheet as at December 31, 2014.
F-2
Table of Contents
CONSOLIDATED INCOME STATEMENTS
FOR THE YEARS ENDED
DECEMBER 31, 2014, 2013 AND 2012
(Millions of Euros)
| (Debit) Credit | ||||||||||||||||
| Notes | 2014 | 2013 | 2012 | |||||||||||||
| Interest and similar income |
38 | 54,656 | 51,447 | 58,791 | ||||||||||||
| Interest expense and similar charges |
39 | (25,109 | ) | (25,512 | ) | (28,868 | ) | |||||||||
| INTEREST INCOME/(CHARGES) |
29,547 | 25,935 | 29,923 | |||||||||||||
| Income from equity instruments |
40 | 435 | 378 | 423 | ||||||||||||
| Income from companies accounted for using the equity method |
13 & 41 | 243 | 500 | 427 | ||||||||||||
| Fee and commission income |
42 | 12,515 | 12,473 | 12,732 | ||||||||||||
| Fee and commission expense |
43 | (2,819 | ) | (2,712 | ) | (2,471 | ) | |||||||||
| Gains/losses on financial assets and liabilities (net) |
44 | 3,974 | 3,234 | 3,329 | ||||||||||||
| Held for trading |
2,377 | 1,733 | 1,460 | |||||||||||||
| Other financial instruments at fair value through profit or loss |
239 | (6 | ) | 159 | ||||||||||||
| Financial instruments not measured at fair value through profit or loss |
1,427 | 1,622 | 1,789 | |||||||||||||
| Other |
(69 | ) | (115 | ) | (79 | ) | ||||||||||
| Exchange differences (net) |
45 | (1,124 | ) | 160 | (189 | ) | ||||||||||
| Other operating income |
5,214 | 5,903 | 6,693 | |||||||||||||
| Income from insurance and reinsurance contracts issued |
46 | 3,532 | 4,724 | 5,541 | ||||||||||||
| Sales and income from the provision of non-financial services |
46 | 343 | 322 | 369 | ||||||||||||
| Other |
46 | 1,339 | 857 | 783 | ||||||||||||
| Other operating expenses |
(5,373 | ) | (6,205 | ) | (6,607 | ) | ||||||||||
| Expenses of insurance and reinsurance contracts |
46 | (3,395 | ) | (4,607 | ) | (4,948 | ) | |||||||||
| Changes in inventories |
46 | (255 | ) | (229 | ) | (232 | ) | |||||||||
| Other |
46 | (1,723 | ) | (1,369 | ) | (1,427 | ) | |||||||||
| TOTAL INCOME |
42,612 | 39,666 | 44,260 | |||||||||||||
| Administrative expenses |
(17,899 | ) | (17,452 | ) | (17,801 | ) | ||||||||||
| Personnel expenses |
47 | (10,242 | ) | (10,069 | ) | (10,306 | ) | |||||||||
| Other general administrative expenses |
48 | (7,657 | ) | (7,383 | ) | (7,495 | ) | |||||||||
| Depreciation and amortization |
16 & 18 | (2,287 | ) | (2,391 | ) | (2,183 | ) | |||||||||
| Provisions (net) |
25 | (3,009 | ) | (2,445 | ) | (1,472 | ) | |||||||||
| Impairment losses on financial assets (net) |
(10,710 | ) | (11,227 | ) | (18,880 | ) | ||||||||||
| Loans and receivables |
10 | (10,521 | ) | (10,986 | ) | (18,523 | ) | |||||||||
| Other financial instruments not measured at fair value through profit or loss |
7 & 29 | (189 | ) | (241 | ) | (357 | ) | |||||||||
| Impairment losses on other assets (net) |
(938 | ) | (503 | ) | (508 | ) | ||||||||||
| Goodwill and other intangible assets |
17 & 18 | (701 | ) | (41 | ) | (151 | ) | |||||||||
| Other assets |
(237 | ) | (462 | ) | (357 | ) | ||||||||||
| Gains/(losses) on disposal of assets not classified as non-current assets held for sale |
49 | 3,136 | 2,152 | 906 | ||||||||||||
| Gains from bargain purchases arising in business combinations |
17 | — | — | |||||||||||||
| Gains/(losses) on non-current assets held for sale not classified as discontinued operations |
50 | (243 | ) | (422 | ) | (757 | ) | |||||||||
| OPERATING PROFIT/(LOSS) BEFORE TAX |
10,679 | 7,378 | 3,565 | |||||||||||||
| Income tax |
27 | (3,718 | ) | (2,034 | ) | (584 | ) | |||||||||
| PROFIT FROM CONTINUING OPERATIONS |
6,961 | 5,344 | 2,981 | |||||||||||||
| PROFIT (LOSS) FROM DISCONTINUED OPERATIONS (net) |
37 | (26 | ) | (15 | ) | 70 | ||||||||||
| CONSOLIDATED PROFIT FOR THE YEAR |
6,935 | 5,329 | 3,051 | |||||||||||||
| Profit attributable to the Parent |
5,816 | 4,175 | 2,283 | |||||||||||||
| Profit attributable to non-controlling interests |
28 | 1,119 | 1,154 | 768 | ||||||||||||
| EARNINGS PER SHARE |
||||||||||||||||
| From continuing and discontinued operations |
||||||||||||||||
| Basic earnings per share (euros) |
4 | 0.48 | 0.39 | 0.23 | ||||||||||||
| Diluted earnings per share (euros) |
4 | 0.48 | 0.38 | 0.23 | ||||||||||||
| From continuing operations |
||||||||||||||||
| Basic earnings per share (euros) |
4 | 0.48 | 0.39 | 0.22 | ||||||||||||
| Diluted earnings per share (euros) |
4 | 0.48 | 0.38 | 0.22 | ||||||||||||
The accompanying Notes 1 to 55 and Appendices are an integral part of the consolidated income statement for the year ended December 31, 2014.
F-3
Table of Contents
CONSOLIDATED STATEMENTS OF RECOGNIZED INCOME AND EXPENSE
FOR THE YEARS ENDED DECEMBER 31, 2014, 2013 AND 2012
(Millions of Euros)
| 2014 | 2013 | 2012 | ||||||||||
| CONSOLIDATED PROFIT FOR THE YEAR |
6,935 | 5,329 | 3,051 | |||||||||
| OTHER RECOGNIZED INCOME AND EXPENSE |
4,180 | (5,913 | ) | (3,709 | ) | |||||||
| Items that will not be reclassified to profit or loss |
(703 | ) | 188 | (1,123 | ) | |||||||
| Actuarial gains/(losses) on defined benefit pension plans |
(1,009 | ) | 502 | (1,708 | ) | |||||||
| Non-current assets held for sale |
— | — | — | |||||||||
| Income tax relating to items that will not be reclassified to profit or loss |
306 | (314 | ) | 585 | ||||||||
| Items that may be reclassified to profit or loss |
4,883 | (6,101 | ) | (2,586 | ) | |||||||
| Available-for-sale financial assets: |
2,324 | (99 | ) | 1,171 | ||||||||
| Revaluation gains/(losses) |
3,604 | 1,150 | 1,729 | |||||||||
| Amounts transferred to income statement |
(1,280 | ) | (1,250 | ) | (558 | ) | ||||||
| Other reclassifications |
— | 1 | — | |||||||||
| Cash flow hedges: |
589 | 47 | (84 | ) | ||||||||
| Revaluation gains/(losses) |
934 | 463 | 129 | |||||||||
| Amounts transferred to income statement |
(345 | ) | (416 | ) | (249 | ) | ||||||
| Amounts transferred to initial carrying amount of hedged items |
— | — | — | |||||||||
| Other reclassifications |
— | — | 36 | |||||||||
| Hedges of net investments in foreign operations: |
(1,730 | ) | 1,117 | (1,107 | ) | |||||||
| Revaluation gains/(losses) |
(1,730 | ) | 1,074 | (1,336 | ) | |||||||
| Amounts transferred to income statement |
— | 38 | 229 | |||||||||
| Other reclassifications |
— | 5 | — | |||||||||
| Exchange differences: |
4,189 | (7,028 | ) | (2,168 | ) | |||||||
| Revaluation gains/(losses) |
4,184 | (7,020 | ) | (1,831 | ) | |||||||
| Amounts transferred to income statement |
5 | (37 | ) | (330 | ) | |||||||
| Other reclassifications |
— | 29 | (7 | ) | ||||||||
| Non-current assets held for sale: |
— | — | — | |||||||||
| Revaluation gains/(losses) |
— | — | — | |||||||||
| Amounts transferred to income statement |
— | — | — | |||||||||
| Other reclassifications |
— | — | — | |||||||||
| Entities accounted for using the equity method: |
361 | (294 | ) | (57 | ) | |||||||
| Revaluation gains/(losses) |
266 | (283 | ) | (61 | ) | |||||||
| Amounts transferred to income statement |
95 | 23 | 21 | |||||||||
| Other reclassifications |
— | (34 | ) | (17 | ) | |||||||
| Other recognized income and expense |
— | — | — | |||||||||
| Income tax relating to items that may be reclassified to profit or loss |
(850 | ) | 156 | (341 | ) | |||||||
| TOTAL RECOGNIZED INCOME AND EXPENSE |
11,115 | (584 | ) | (658 | ) | |||||||
| Attributable to the Parent |
9,110 | (504 | ) | (774 | ) | |||||||
| Attributable to non-controlling interests |
2,005 | (80 | ) | 116 | ||||||||
The accompanying Notes 1 to 55 and Appendices are an integral part of the consolidated statement of recognized income and expense for the year ended December 31, 2014.
F-4
Table of Contents
CONSOLIDATED STATEMENTS OF CHANGES IN TOTAL EQUITY
FOR THE YEARS ENDED
DECEMBER 31, 2014, 2013 AND 2012
(Millions of Euros)
| Equity attributable to the Parent | ||||||||||||||||||||||||||||||||||||||||||||||||||||
| Shareholders’ equity | ||||||||||||||||||||||||||||||||||||||||||||||||||||
| Share capital |
Share premium |
Reserves | Other equity instruments |
Less: Treasury shares |
Profit for the year attributable to the Parent |
Less: Dividends and remuneration |
Total shareholders’ equity |
|||||||||||||||||||||||||||||||||||||||||||||
| Accumulated reserves (losses) |
Reserves (losses) of entities accounted for using the equity method |
Valuation adjustments |
Total | Non- controlling interests |
Total equity |
|||||||||||||||||||||||||||||||||||||||||||||||
| Ending balance as at 12/31/13 |
5,667 | 36,804 | 37,858 | 263 | 193 | (9 | ) | 4,370 | (406 | ) | 84,740 | (14,152 | ) | 70,588 | 9,314 | 79,902 | ||||||||||||||||||||||||||||||||||||
| Adjustments due to changes in accounting policies |
— | — | (65 | ) | — | — | — | (195 | ) | — | (260 | ) | — | (260 | ) | — | (260 | ) | ||||||||||||||||||||||||||||||||||
| Adjustments due to errors |
— | — | — | — | — | — | — | — | — | — | — | — | — | |||||||||||||||||||||||||||||||||||||||
| Adjusted beginning balance |
5,667 | 36,804 | 37,793 | 263 | 193 | (9 | ) | 4,175 | (406 | ) | 84,480 | (14,152 | ) | 70,328 | 9,314 | 79,642 | ||||||||||||||||||||||||||||||||||||
|
|
|
|
|
|
|
|
|
|
|
|
|
|
|
|
|
|
|
|
|
|
|
|
|
|
|
|||||||||||||||||||||||||||
| Total recognized income and expense |
— | — | — | — | — | — | 5,816 | — | 5,816 | 3,294 | 9,110 | 2,005 | 11,115 | |||||||||||||||||||||||||||||||||||||||
|
|
|
|
|
|
|
|
|
|
|
|
|
|
|
|
|
|
|
|
|
|
|
|
|
|
|
|||||||||||||||||||||||||||
| Other changes in equity |
625 | 1,807 | 3,180 | (76 | ) | 72 | (1 | ) | (4,175 | ) | (65 | ) | 1,367 | — | 1,367 | (2,410 | ) | (1,043 | ) | |||||||||||||||||||||||||||||||||
| Capital increases |
625 | 1,932 | (30 | ) | — | — | — | — | — | 2,527 | — | 2,527 | (524 | ) | 2,003 | |||||||||||||||||||||||||||||||||||||
| Capital reductions |
— | — | — | — | — | — | — | — | — | — | — | — | — | |||||||||||||||||||||||||||||||||||||||
| Conversion of financial liabilities into equity |
— | — | — | — | — | — | — | — | — | — | — | — | — | |||||||||||||||||||||||||||||||||||||||
| Increases in other equity instruments |
— | — | — | — | 78 | — | — | — | 78 | — | 78 | — | 78 | |||||||||||||||||||||||||||||||||||||||
| Reclassification of financial liabilities to other equity instruments |
— | — | — | — | — | — | — | — | — | — | — | — | — | |||||||||||||||||||||||||||||||||||||||
| Reclassification of other equity instruments to financial liabilities |
— | — | — | — | — | — | — | — | — | — | — | — | — | |||||||||||||||||||||||||||||||||||||||
| Distribution of dividends |
— | — | (438 | ) | — | — | — | — | (471 | ) | (909 | ) | — | (909 | ) | (380 | ) | (1,289 | ) | |||||||||||||||||||||||||||||||||
| Transactions involving own equity instruments (net) |
— | — | 40 | — | — | (1 | ) | — | — | 39 | — | 39 | — | 39 | ||||||||||||||||||||||||||||||||||||||
| Transfers between equity items |
— | (125 | ) | 4,033 | (76 | ) | (63 | ) | — | (4,175 | ) | 406 | — | — | — | — | — | |||||||||||||||||||||||||||||||||||
| Increases (decreases) due to business combinations |
— | — | — | — | — | — | — | — | — | — | — | 1,465 | 1,465 | |||||||||||||||||||||||||||||||||||||||
| Equity-instrument-based payments |
— | — | — | — | (51 | ) | — | — | — | (51 | ) | — | (51 | ) | — | (51 | ) | |||||||||||||||||||||||||||||||||||
| Other increases/(decreases) in equity |
— | — | (425 | ) | — | 108 | — | — | — | (317 | ) | — | (317 | ) | (2,971 | ) | (3,288 | ) | ||||||||||||||||||||||||||||||||||
| Ending balance as at 12/31/14 |
6,292 | 38,611 | 40,973 | 187 | 265 | (10 | ) | 5,816 | (471 | ) | 91,663 | (10,858 | ) | 80,805 | 8,909 | 89,714 | ||||||||||||||||||||||||||||||||||||
The accompanying Notes 1 to 55 and Appendices are an integral part of the consolidated statement of changes in total equity for the year ended December 31, 2014.
F-5
Table of Contents
SANTANDER GROUP
CONSOLIDATED STATEMENTS OF CHANGES IN TOTAL EQUITY
FOR THE YEARS ENDED
DECEMBER 31, 2014, 2013 AND 2012
(Millions of Euros)
| Equity attributable to the Parent | ||||||||||||||||||||||||||||||||||||||||||||||||||||
| Shareholders’ equity | ||||||||||||||||||||||||||||||||||||||||||||||||||||
| Share capital |
Share premium |
Reserves | Other equity instruments |
Less: Treasury shares |
Profit for the year attributable to the Parent |
Less: Dividends and remuneration |
Total shareholders’ equity |
|||||||||||||||||||||||||||||||||||||||||||||
| Accumulated reserves (losses) |
Reserves (losses) of entities accounted for using the equity method |
Valuation adjustments |
Total | Non- controlling interests |
Total equity |
|||||||||||||||||||||||||||||||||||||||||||||||
| Ending balance as at 12/31/12 |
5,161 | 37,412 | 36,898 | 255 | 250 | (287 | ) | 2,205 | (650 | ) | 81,244 | (6,590 | ) | 74,654 | 9,672 | 84,326 | ||||||||||||||||||||||||||||||||||||
| Adjustments due to changes in accounting policies |
— | — | (53 | ) | — | — | — | 78 | — | 25 | (2,882 | ) | (2,857 | ) | (257 | ) | (3,114 | ) | ||||||||||||||||||||||||||||||||||
| Adjustments due to errors |
— | — | — | — | — | — | — | — | — | — | — | — | — | |||||||||||||||||||||||||||||||||||||||
| Adjusted beginning balance |
5,161 | 37,412 | 36,845 | 255 | 250 | (287 | ) | 2,283 | (650 | ) | 81,269 | (9,472 | ) | 71,797 | 9,415 | 81,212 | ||||||||||||||||||||||||||||||||||||
|
|
|
|
|
|
|
|
|
|
|
|
|
|
|
|
|
|
|
|
|
|
|
|
|
|
|
|||||||||||||||||||||||||||
| Total recognized income and expense |
— | — | — | — | — | — | 4,175 | — | 4,175 | (4,680 | ) | (504 | ) | (80 | ) | (584 | ) | |||||||||||||||||||||||||||||||||||
|
|
|
|
|
|
|
|
|
|
|
|
|
|
|
|
|
|
|
|
|
|
|
|
|
|
|
|||||||||||||||||||||||||||
| Other changes in equity |
506 | (608 | ) | 948 | 8 | (57 | ) | 278 | (2,283 | ) | 244 | (964 | ) | — | (964 | ) | (21 | ) | (985 | ) | ||||||||||||||||||||||||||||||||
| Capital increases |
506 | (506 | ) | (7 | ) | — | — | — | — | — | (7 | ) | — | (7 | ) | (2 | ) | (9 | ) | |||||||||||||||||||||||||||||||||
| Capital reductions |
— | — | — | — | — | — | — | — | — | — | — | — | — | |||||||||||||||||||||||||||||||||||||||
| Conversion of financial liabilities into equity |
— | — | — | — | — | — | — | — | — | — | — | — | — | |||||||||||||||||||||||||||||||||||||||
| Increases in other equity instruments |
— | — | — | — | 103 | — | — | — | 103 | — | 103 | — | 103 | |||||||||||||||||||||||||||||||||||||||
| Reclassification of financial liabilities to other equity instruments |
— | — | — | — | — | — | — | — | — | — | — | — | — | |||||||||||||||||||||||||||||||||||||||
| Reclassification of other equity instruments to financial liabilities |
— | — | — | — | — | — | — | — | — | — | — | — | — | |||||||||||||||||||||||||||||||||||||||
| Distribution of dividends |
— | — | (412 | ) | — | — | — | — | (406 | ) | (818 | ) | — | (818 | ) | (747 | ) | (1,565 | ) | |||||||||||||||||||||||||||||||||
| Transactions involving own equity instruments (net) |
— | — | (28 | ) | — | — | 278 | — | — | 250 | — | 250 | — | 250 | ||||||||||||||||||||||||||||||||||||||
| Transfers between equity items |
— | (102 | ) | 1,836 | 8 | (109 | ) | — | (2,283 | ) | 650 | — | — | — | — | — | ||||||||||||||||||||||||||||||||||||
| Increases (decreases) due to business combinations |
— | — | — | — | — | — | — | — | — | — | — | 169 | 169 | |||||||||||||||||||||||||||||||||||||||
| Equity-instrument-based payments |
— | — | — | — | (41 | ) | — | — | — | (41 | ) | — | (41 | ) | — | (41 | ) | |||||||||||||||||||||||||||||||||||
| Other increases/(decreases) in equity |
— | — | (441 | ) | — | (10 | ) | — | — | — | (451 | ) | — | (451 | ) | 559 | 108 | |||||||||||||||||||||||||||||||||||
| Ending balance as at 12/31/13 |
5,667 | 36,804 | 37,793 | 263 | 193 | (9 | ) | 4,175 | (406 | ) | 84,480 | (14,152 | ) | 70,328 | 9,314 | 79,642 | ||||||||||||||||||||||||||||||||||||
The accompanying Notes 1 to 55 and Appendices are an integral part of the consolidated statement of changes in total equity for the year ended December 31, 2014.
F-6
Table of Contents
SANTANDER GROUP
CONSOLIDATED STATEMENTS OF CHANGES IN TOTAL EQUITY
FOR THE YEARS ENDED
DECEMBER 31, 2014, 2013 AND 2012
(Millions of Euros)
| Equity attributable to the Parent | ||||||||||||||||||||||||||||||||||||||||||||||||||||
| Shareholders’ equity | ||||||||||||||||||||||||||||||||||||||||||||||||||||
| Share capital |
Share premium |
Reserves | Other equity instruments |
Less: Treasury shares |
Profit for the year attributable to the Parent |
Less: Dividends and remuneration |
Total shareholders’ equity |
|||||||||||||||||||||||||||||||||||||||||||||
| Accumulated reserves (losses) |
Reserves (losses) of entities accounted for using the equity method |
Valuation adjustments |
Total | Non- controlling interests |
Total equity |
|||||||||||||||||||||||||||||||||||||||||||||||
| Ending balance as at 12/31/11 |
4,455 | 31,223 | 32,921 | 59 | 8,708 | (251 | ) | 5,351 | (1,570 | ) | 80,896 | (4,482 | ) | 76,414 | 6,445 | 82,859 | ||||||||||||||||||||||||||||||||||||
| Adjustments due to changes in accounting policies |
— | — | (12 | ) | — | — | — | (62 | ) | — | (74 | ) | (1,933 | ) | (2,007 | ) | (91 | ) | (2,098 | ) | ||||||||||||||||||||||||||||||||
| Adjustments due to errors |
— | — | — | — | — | — | — | — | — | — | — | — | — | |||||||||||||||||||||||||||||||||||||||
| Adjusted beginning balance |
4,455 | 31,223 | 32,909 | 59 | 8,708 | (251 | ) | 5,289 | (1,570 | ) | 80,822 | (6,415 | ) | 74,407 | 6,354 | 80,761 | ||||||||||||||||||||||||||||||||||||
|
|
|
|
|
|
|
|
|
|
|
|
|
|
|
|
|
|
|
|
|
|
|
|
|
|
|
|||||||||||||||||||||||||||
| Total recognized income and expense |
— | — | — | — | — | — | 2,283 | — | 2,283 | (3,057 | ) | (774 | ) | 116 | (658 | ) | ||||||||||||||||||||||||||||||||||||
|
|
|
|
|
|
|
|
|
|
|
|
|
|
|
|
|
|
|
|
|
|
|
|
|
|
|
|||||||||||||||||||||||||||
| Other changes in equity |
706 | 6,189 | 3,936 | 196 | (8,458 | ) | (36 | ) | (5,289 | ) | 920 | (1,836 | ) | — | (1,836 | ) | 2,945 | 1,109 | ||||||||||||||||||||||||||||||||||
| Capital increases |
706 | 6,330 | (235 | ) | — | (6,811 | ) | — | — | — | (10 | ) | — | (10 | ) | 22 | 12 | |||||||||||||||||||||||||||||||||||
| Capital reductions |
— | — | — | — | — | — | — | — | — | — | — | (112 | ) | (112 | ) | |||||||||||||||||||||||||||||||||||||
| Conversion of financial liabilities into equity |
— | — | — | — | — | — | — | — | — | — | — | — | — | |||||||||||||||||||||||||||||||||||||||
| Increases in other equity instruments |
— | — | — | — | 133 | — | — | — | 133 | — | 133 | — | 133 | |||||||||||||||||||||||||||||||||||||||
| Reclassification of financial liabilities to other equity instruments |
— | — | — | — | — | — | — | — | — | — | — | — | — | |||||||||||||||||||||||||||||||||||||||
| Reclassification of other equity instruments to financial liabilities |
— | — | — | — | — | — | — | — | — | — | — | — | — | |||||||||||||||||||||||||||||||||||||||
| Distribution of dividends |
— | — | (496 | ) | — | — | — | — | (650 | ) | (1,146 | ) | — | (1,146 | ) | (409 | ) | (1,555 | ) | |||||||||||||||||||||||||||||||||
| Transactions involving own equity instruments (net) |
— | — | 85 | — | — | (36 | ) | — | — | 49 | — | 49 | — | 49 | ||||||||||||||||||||||||||||||||||||||
| Transfers between equity items |
— | (141 | ) | 3,727 | 196 | (63 | ) | — | (5,289 | ) | 1,570 | — | — | — | — | — | ||||||||||||||||||||||||||||||||||||
| Increases (decreases) due to business combinations |
— | — | — | — | — | — | — | — | — | — | — | 5 | 5 | |||||||||||||||||||||||||||||||||||||||
| Equity-instrument-based payments |
— | — | (2 | ) | — | (40 | ) | — | — | — | (42 | ) | — | (42 | ) | — | (42 | ) | ||||||||||||||||||||||||||||||||||
| Other increases/(decreases) in equity |
— | — | 857 | — | (1,677 | ) | — | — | — | (820 | ) | — | (820 | ) | 3,439 | 2,619 | ||||||||||||||||||||||||||||||||||||
| Ending balance as at 12/31/12 |
5,161 | 37,412 | 36,845 | 255 | 250 | (287 | ) | 2,283 | (650 | ) | 81,269 | (9,472 | ) | 71,797 | 9,415 | 81,212 | ||||||||||||||||||||||||||||||||||||
The accompanying Notes 1 to 55 and Appendices are an integral part of the consolidated statement of changes in total equity for the year ended December 31, 2014.
F-7
Table of Contents
CONSOLIDATED STATEMENTS OF CASH FLOWS FOR THE YEARS ENDED DECEMBER 31, 2014, 2013 AND 2012
(Millions of Euros)
| 2014 | 2013 | 2012 | ||||||||||
| A. CASH FLOWS FROM OPERATING ACTIVITIES: |
(3,939 | ) | (34,852 | ) | 24,133 | |||||||
|
|
|
|
|
|
|
|||||||
| Consolidated profit for the year |
6,935 | 5,329 | 3,051 | |||||||||
| Adjustments made to obtain the cash flows from operating activities- |
18,772 | 17,894 | 24,385 | |||||||||
| Depreciation and amortization |
2,287 | 2,391 | 2,183 | |||||||||
| Other adjustments |
16,485 | 15,503 | 22,202 | |||||||||
| Net increase/decrease in operating assets- |
88,438 | (13,533 | ) | 27,343 | ||||||||
| Financial assets held for trading |
12,931 | (8,440 | ) | 381 | ||||||||
| Other financial assets at fair value through profit or loss |
11,012 | 3,426 | 5,207 | |||||||||
| Available-for-sale financial assets |
27,968 | (4,149 | ) | 7,334 | ||||||||
| Loans and receivables |
35,644 | (2,767 | ) | 11,854 | ||||||||
| Other operating assets |
883 | (1,603 | ) | 2,567 | ||||||||
| Net increase/decrease in operating liabilities- |
60,144 | (68,031 | ) | 27,202 | ||||||||
| Financial liabilities held for trading |
(4,667 | ) | 4,320 | (9,970 | ) | |||||||
| Other financial liabilities at fair value through profit or loss |
19,786 | (2,781 | ) | (3,010 | ) | |||||||
| Financial liabilities at amortized cost |
46,747 | (63,939 | ) | 39,216 | ||||||||
| Other operating liabilities |
(1,722 | ) | (5,631 | ) | 966 | |||||||
| Income tax recovered/paid |
(1,352 | ) | (3,577 | ) | (3,162 | ) | ||||||
|
|
|
|
|
|
|
|||||||
| B. CASH FLOWS FROM INVESTING ACTIVITIES: |
(6,005 | ) | 677 | 126 | ||||||||
|
|
|
|
|
|
|
|||||||
| Payments- |
9,246 | 3,322 | 3,920 | |||||||||
| Tangible assets |
6,695 | 1,877 | 2,161 | |||||||||
| Intangible assets |
1,218 | 1,264 | 1,726 | |||||||||
| Investments |
18 | 181 | 33 | |||||||||
| Subsidiaries and other business units |
1,315 | — | — | |||||||||
| Non-current assets held for sale and associated liabilities |
— | — | — | |||||||||
| Held-to-maturity investments |
— | — | — | |||||||||
| Other payments related to investing activities |
— | — | — | |||||||||
| Proceeds- |
3,241 | 3,999 | 4,046 | |||||||||
| Tangible assets |
986 | 500 | 815 | |||||||||
| Intangible assets |
— | 39 | 6 | |||||||||
| Investments |
324 | 295 | 2 | |||||||||
| Subsidiaries and other business units |
1,004 | 1,578 | 991 | |||||||||
| Non-current assets held for sale and associated liabilities |
927 | 1,587 | 2,232 | |||||||||
| Held-to-maturity investments |
— | — | — | |||||||||
| Other proceeds related to investing activities |
— | — | — | |||||||||
|
|
|
|
|
|
|
|||||||
| C. CASH FLOWS FROM FINANCING ACTIVITIES: |
(62 | ) | (1,676 | ) | (703 | ) | ||||||
|
|
|
|
|
|
|
|||||||
| Payments- |
8,094 | 8,528 | 12,549 | |||||||||
| Dividends |
909 | 818 | 1,287 | |||||||||
| Subordinated liabilities |
3,743 | 1,915 | 4,080 | |||||||||
| Redemption of own equity instruments |
— | — | — | |||||||||
| Acquisition of own equity instruments |
3,442 | 5,592 | 6,957 | |||||||||
| Other payments related to financing activities |
— | 203 | 225 | |||||||||
| Proceeds- |
8,032 | 6,852 | 11,846 | |||||||||
| Subordinated liabilities |
4,351 | 1,027 | 2 | |||||||||
| Issuance of own equity instruments |
— | — | — | |||||||||
| Disposal of own equity instruments |
3,498 | 5,560 | 7,005 | |||||||||
| Other proceeds related to financing activities |
183 | 265 | 4,839 | |||||||||
| D. EFFECT OF FOREIGN EXCHANGE RATE CHANGES |
2,331 | (5,534 | ) | (1,592 | ) | |||||||
| E. NET INCREASE/(DECREASE) IN CASH AND CASH EQUIVALENTS |
(7,675 | ) | (41,385 | ) | 21,964 | |||||||
| F. CASH AND CASH EQUIVALENTS AS AT BEGINNING OF YEAR |
77,103 | 118,488 | 96,524 | |||||||||
| G. CASH AND CASH EQUIVALENTS AS AT END OF YEAR |
69,428 | 77,103 | 118,488 | |||||||||
| COMPONENTS OF CASH AND CASH EQUIVALENTS AS AT END OF YEAR: |
||||||||||||
| Cash |
7,491 | 6,697 | 7,214 | |||||||||
| Cash equivalents at central banks |
61,937 | 70,406 | 111,274 | |||||||||
| Other financial assets |
— | — | — | |||||||||
| Less: Bank overdrafts refundable on demand |
— | — | — | |||||||||
|
|
|
|
|
|
|
|||||||
| TOTAL CASH AND CASH EQUIVALENTS AS AT END OF YEAR |
69,428 | 77,103 | 118,488 | |||||||||
|
|
|
|
|
|
|
|||||||
The accompanying Notes 1 to 55 and Appendices are an integral part of the consolidated statement of cash flows for the year ended December 31, 2014.
F-8
Table of Contents
Banco Santander, S.A. and Companies composing Santander Group
Notes to the consolidated financial statements for the year ended December 31, 2014
| 1. | Introduction, basis of presentation of the consolidated financial statements and other information |
| a) | Introduction |
Banco Santander, S.A. (“the Bank” or “Banco Santander”) is a private-law entity subject to the rules and regulations applicable to banks operating in Spain. The Bylaws and other public information on the Bank can be found on the website of the Bank (www.santander.com) and at its registered office at Paseo de Pereda 9-12, Santander.
In addition to the operations carried on directly by it, the Bank is the head of a group of subsidiaries that engage in various business activities and which compose, together with it, Santander Group (“the Group” or “Santander Group”). Therefore, the Bank is obliged to prepare, in addition to its own separate financial statements, the Group’s consolidated financial statements, which also include the interests in joint ventures and investments in associates.
| b) | Basis of presentation of the consolidated financial statements |
Under Regulation (EC) no. 1606/2002 of the European Parliament and of the Council of July 19, 2002, all companies governed by the law of an EU Member State and whose securities are admitted to trading on a regulated market of any Member State must prepare their consolidated financial statements for the years beginning on or after January 1, 2005 in conformity with the International Financial Reporting Standards (“IFRSs”) previously adopted by the European Union (“EU-IFRSs”).
In order to adapt the accounting system of Spanish credit institutions to the new standards, the Bank of Spain issued Circular 4/2004, of 22 December, on Public and Confidential Financial Reporting Rules and Formats.
The Group’s consolidated financial statements for 2014 were formally prepared by the Bank’s directors (at the board meeting on February 23, 2015) in accordance with International Financial Reporting Standards as adopted by the European Union and with Bank of Spain Circular 4/2004 and Spanish corporate and commercial law applicable to the Group and in compliance with IFRS as issued by the International Accounting Standards Board (“IFRS – IASB” and together with IFRS adopted by the European Union, “IFRS”), using the basis of consolidation, accounting policies and measurement bases set forth in Note 2 to these consolidated financial statements and, accordingly, they present fairly the Group’s equity and financial position at December 31, 2014, 2013 and 2012 and the consolidated results of its operations, the consolidated recognized income and expense, the changes in its consolidated equity and the consolidated cash flows in 2014, 2013 and 2012. These consolidated financial statements were prepared from the accounting records kept by the Bank and by the other Group entities, and include the adjustments and reclassifications required to unify the accounting policies and measurement bases applied by the Group.
F-9
Table of Contents
The notes to the consolidated financial statements contain information in addition to that presented in the consolidated balance sheet, consolidated income statement, consolidated statement of recognized income and expense, consolidated statement of changes in total equity and consolidated statement of cash flows. The notes provide, in a clear, relevant, reliable and comparable manner, narrative descriptions and breakdowns of these financial statements.
Adoption of new standards and interpretations issued
The following standards came into force and were adopted by the European Union in 2014:
| • | Amendments to IAS 32, Financial Instruments: Presentation - Offsetting Financial Assets and Financial Liabilities - these amendments introduce a series of additional clarifications on the requirements of the standard for being able to offset a financial asset and a financial liability, indicating that they may only be offset when the entity currently has a legally enforceable right to set off the recognized amounts and this right is not contingent on a future event. |
| • | Amendments to IAS 36, Impairment of Assets - Recoverable Amount Disclosures for Non-Financial Assets - these amendments eliminate the requirement to present certain disclosures on the recoverable amount of each cash-generating unit and introduce the obligation to disclose information on the recoverable amount of assets for which an impairment loss has been recognized or reversed during the period. |
| • | Amendments to IAS 39, Financial Instruments: Recognition and Measurement - Novation of Derivatives and Continuation of Hedge Accounting - these amendments introduce an exception to the application of the discontinuation of hedge accounting for novations in which, as a consequence of laws or regulations, the original counterparty of the hedging instrument is replaced by one or more central counterparties, such as clearing agencies, provided that any other changes to the hedging instrument are limited to those that are necessary to effect such a replacement of the counterparty. |
The application of the aforementioned accounting standards did not have any material effects on the Group’s consolidated financial statements.
Also, at the date of preparation of these consolidated financial statements, the effective date of the following standard is subsequent to December 31, 2014:
| • | Amendments to IAS 19, Employee Benefits: Defined Benefit Plans—Employee Contributions (obligatory for reporting periods beginning on or after July 1, 2014, early application permitted)—these amendments allow employee contributions to be deducted from the service cost in the same period in which they are paid, provided certain requirements are met, without the need to make calculations to attribute the reduction to each year of service. The application of this accounting standard is not expected to have any material effects on the Group’s consolidated financial statements. |
Also, the Group decided to apply early, with respect to the date of obligatory first-time application pursuant to the endorsement issued by the European Union, IFRIC 21, Levies, which addresses the accounting for a liability to pay a levy if that liability is within the scope of IAS 37. Under the interpretation: the obligating event that gives rise to a liability to pay a levy is the activity that triggers the payment of the levy, as identified by the legislation; an entity does not have a constructive obligation to pay a levy that will be triggered by operating in a future period; the liability to pay a levy is recognized progressively if the obligating event occurs over a period of time; and if an obligation to pay a levy is triggered when a minimum threshold is reached, the corresponding liability is recognized when that minimum threshold is reached.
The adoption of IFRIC 21 by the Group gave rise to a change in the recognition of the contributions made by Santander UK to the Financial Services Compensation Scheme, which will not be recognized until April 1 each year, and of the contributions made by the Group’s Spanish financial institutions to the Deposit Guarantee Fund, which will be recognized at December 31, each year. Pursuant to the applicable standard, this change was applied retrospectively, giving rise to changes in the comparative balances as indicated in Note 1.d.
F-10
Table of Contents
Lastly, at the date of preparation of these consolidated financial statements, the following standards and interpretations which effectively come into force after December 31, 2014 had not yet been adopted by the European Union:
| • | IFRS 9, Financial Instruments: Classification and Measurement and Hedge Accounting (without a defined mandatory effective date), which will in the future replace the part of the current IAS 39 relating to the classification and measurement of financial assets and hedge accounting. IFRS 9 presents significant differences regarding financial assets with respect to the current standard, including the approval of a new classification model based on only two categories, namely instruments measured at amortized cost and those measured at fair value, the disappearance of the current Held-to-maturity investments and Available-for-sale financial assets categories, impairment analyses only for assets measured at amortized cost and the non-separation of derivatives embedded in financial contracts. The main change introduced with regard to financial liabilities affects liabilities that an entity elects to measure at fair value. The portion of the change in the fair value of these liabilities attributable to changes in the entity’s own credit risk must be presented in Valuation adjustments instead of in the income statement. In relation to hedge accounting, the new model attempts to more closely align accounting rules with risk management. The three types of hedge accounting present in the current standard are retained (cash flow hedges, fair value hedges and hedges of net investments in foreign operations). However, there are very significant changes to various matters with respect to IAS 39, such as hedged items, hedging instruments, the accounting for the time value of options and effectiveness assessment. |
| • | IFRS 15, Revenue from Contracts with Customers (obligatory for annual reporting periods beginning on or after January 1, 2017) - the new standard on the recognition of revenue from contracts with customers. It supersedes the following standards and interpretations currently in force: IAS 18, Revenue; IAS 11, Construction Contracts; IFRIC 13, Customer Loyalty Programs; IFRIC 15, Agreements for the Construction of Real Estate; IFRIC 18, Transfers of Assets from Customers; and SIC-31, Revenue-Barter Transactions Involving Advertising Services. Under IFRS 15, an entity recognizes revenue in accordance with the core principle of the standard by applying the following five steps: identify the contract(s) with a customer; identify the performance obligations in the contract; determine the transaction price; allocate the transaction price to the performance obligations identified in the contract; and recognize revenue when (or as) the entity satisfies a performance obligation. |
| • | Amendments to IAS 16 and IAS 38 - Clarification of Acceptable Methods of Depreciation and Amortization (obligatory for annual reporting periods beginning on or after January 1, 2016, early application permitted) - these amendments clarify that when an item of property, plant and equipment or an intangible asset is accounted for using the revaluation model, the total gross carrying amount of the asset is adjusted in a manner that is consistent with the revaluation of the carrying amount of the asset, so that the accumulated depreciation or amortization is equal to the difference between the gross carrying amount and the carrying amount of the asset after revaluation (after taking into account any impairment losses). |
| • | Amendments to IASs 16 and 41 - Bearer Plants (obligatory for annual reporting periods beginning on or after January 1, 2016, early application permitted) - under these amendments, plants of this nature are now within the scope of IAS 16 and must be accounted for in the same way as property, plant and equipment rather than at their fair value. |
| • | Amendments to IAS 27, Equity Method in Separate Financial Statements (obligatory for annual reporting periods beginning on or after January 1, 2016, early application permitted) - these amendments permit the use of the equity method as an option in the separate financial statements of an entity for accounting for investments in subsidiaries, joint ventures and associates. |
F-11
Table of Contents
| • | Amendments to IFRS 10 and IAS 28, Sale or Contribution of Assets between an Investor and its Associate or Joint Venture (obligatory for annual reporting periods beginning on or after January 1, 2016, early application permitted) - these amendments establish that a gain or loss must be recognized for the full amount when the transaction involves assets that constitute a business (whether the business is housed in a subsidiary or not). When the transaction involves assets that do not constitute a business, a partial gain or loss is recognized, even if these assets are housed in a subsidiary. |
| • | Amendments to IFRS 11 - Accounting for Acquisitions of Interests in Joint Operations (obligatory for annual reporting periods beginning on or after January 1, 2016, early application permitted)—these amendments specify how to account for the acquisition of an interest in a joint operation in which the activity of the joint operation constitutes a business. |
| • | Improvements to IFRSs, 2010-2012 cycle (obligatory for reporting periods beginning on or after July 1, 2014) - these improvements introduce minor amendments to IFRS 2, IFRS 3, IFRS 8, IFRS 13, IAS 16, IAS 24 and IAS 38. |
| • | Improvements to IFRSs, 2011-2013 cycle (obligatory for reporting periods beginning on or after July 1, 2014) - these improvements introduce minor amendments to IFRS 1, IFRS 3, IFRS 13 and IAS 40. |
| • | Improvements to IFRSs, 2012-2014 cycle (obligatory for reporting periods beginning on or after July 1, 2016) - these improvements introduce minor amendments to IFRS 5, IFRS 7, IAS 19 and IAS 34. |
The Group is currently analyzing the possible effects of these new standards and interpretations.
All accounting policies and measurement bases with a material effect on the consolidated financial statements for 2014 were applied in their preparation.
| c) | Use of estimates |
The consolidated results and the determination of consolidated equity are sensitive to the accounting policies, measurement bases and estimates used by the directors of the Bank in preparing the consolidated financial statements. The main accounting policies and measurement bases are set forth in Note 2.
In the consolidated financial statements estimates were occasionally made by the senior management of the Bank and of the consolidated entities in order to quantify certain of the assets, liabilities, income, expenses and obligations reported herein. These estimates, which were made on the basis of the best information available, relate basically to the following:
| • | The impairment losses on certain assets (see Notes 6, 7, 8, 10, 12, 13, 16, 17 and 18); |
| • | The assumptions used in the actuarial calculation of the post-employment benefit liabilities and commitments and other obligations (see Note 25); |
| • | The useful life of the tangible and intangible assets (see Notes 16 and 18); |
| • | The measurement of goodwill arising on consolidation (see Note 17); |
| • | The calculation of provisions and the consideration of contingent liabilities (see Note 25); |
| • | The fair value of certain unquoted assets and liabilities (see Notes 6, 7, 8, 9, 10, 11, 20, 21 and 22); and |
| • | The recoverability of deferred tax assets (see Note 27). |
F-12
Table of Contents
Although these estimates were made on the basis of the best information available at 2014 year-end, future events might make it necessary to change these estimates (upwards or downwards) in coming years. Changes in accounting estimates would be applied prospectively, recognizing the effects of the change in estimates in the related consolidated income statement.
| d) | Information relating to 2013 and 2012 |
Pursuant to the applicable accounting standards, the balances relating to the years ended December 31, 2013 and 2012 presented in these consolidated financial statements were adjusted with respect to the amounts shown in the consolidated financial statements for 2013, by the amounts and for the items indicated below, in order to allow for a better comparison of information:
| a) | Application of IFRIC 21, Levies (see Note 1.b): set forth below are the effects arising from the retrospective application of the aforementioned interpretation (the positive or negative sign shows whether the figures are increases or decreases with respect to the figures shown in the consolidated financial statements for said years): |
| Millions of euros | ||||||||
| 2013 | 2012 | |||||||
| BALANCE SHEET | ||||||||
| Deferred tax assets |
125 | 45 | ||||||
|
|
|
|
|
|||||
| Total assets |
125 | 45 | ||||||
|
|
|
|
|
|||||
| Other provisions |
114 | (146 | ) | |||||
| Other liabilities |
271 | 254 | ||||||
|
|
|
|
|
|||||
| Total liabilities |
385 | 108 | ||||||
|
|
|
|
|
|||||
| Reserves |
(65 | ) | (53 | ) | ||||
| Consolidated profit for the year |
(195 | ) | (12 | ) | ||||
| Valuation adjustments |
— | 2 | ||||||
|
|
|
|
|
|||||
| Total equity |
(260 | ) | (63 | ) | ||||
|
|
|
|
|
|||||
| INCOME STATEMENT | ||||||||
| Other operating expenses |
(11 | ) | (24 | ) | ||||
| Provisions (net) |
(263 | ) | 6 | |||||
| Income tax |
79 | 6 | ||||||
|
|
|
|
|
|||||
| Consolidated profit for the year |
(195 | ) | (12 | ) | ||||
|
|
|
|
|
|||||
| Of which: |
||||||||
|
|
|
|
|
|||||
| Profit attributable to the Parent |
(195 | ) | (12 | ) | ||||
|
|
|
|
|
|||||
| Profit attributable to non-controlling interests |
— | — | ||||||
|
|
|
|
|
|||||
The additional information required by IAS 1 in the case of retrospective application of a new accounting policy -the consolidated balance sheet at the beginning of the year prior to that in which the new policy is applied, i.e. as at January 1, 2013, in this case- is reflected in the consolidated balance sheet as at December 31, 2012, since the balances in that balance sheet are the same as those that would relate to the consolidated balance sheet at the aforementioned date.
F-13
Table of Contents
| b) | Note 52 includes a description of certain changes made in the business segment reporting. |
In 2013 the Group applied the accounting changes introduced by the amendment to IAS 19, Employee Benefits, which, inter alia, eliminated the possibility of deferring recognition of a portion of actuarial gains and losses. The consolidated statements of changes in total equity for 2013 and 2012 include the impact on equity at the beginning of each of those years arising from the retrospective application of the aforementioned amendment, which gave rise to a reduction in equity of EUR 3,051 million at January 1, 2013 (January 1, 2012: EUR 2,045 million).
| e) | Capital management |
i. Regulatory and economic capital
The Group’s capital management is performed at regulatory and economic levels.
Regulatory capital management is based on the analysis of the capital base, the capital ratios using various regulatory criteria and the scenarios used for capital planning. The aim is to achieve a capital structure that is as efficient as possible in terms of both cost and any requirement that might be issued by regulators, rating agencies and investors.
Following is a brief description of the regulatory capital framework to which Santander Group is subject.
In December 2010 the Basel Committee on Banking Supervision published a new global regulatory framework for international capital standards (Basel III) which strengthened the requirements of the previous frameworks, known as Basel I and Basel II, and other requirements additional to Basel II (Basel 2.5), by enhancing the quality, consistency and transparency of the capital base and improving risk coverage. On June 26, 2013, the Basel III legal framework was included in European law through Directive 2013/36 (CRD IV), repealing Directives 2006/48 and 2006/49, and through Regulation 575/2013 on prudential requirements for credit institutions and investment firms (CRR). Regulation 575/2013 is directly applicable in EU Member States effective January 1, 2014 and repeals all lower-ranking rules providing for additional capital requirements.
Directive 2013/36 (CRD IV) was transposed into Spanish legislation through Law 10/2014 on the regulation, supervision and capital adequacy of credit institutions, and its subsequent regulatory implementation in the form of Royal Decree-Law 84/2015. Regulation 575/2013 is directly applicable in EU Member States as from January 1, 2014 and repeals all lower-ranking rules providing for additional capital requirements.
Regulation 575/2013 (CRR) establishes a timetable for gradual phase-in that will permit a progressive adaptation to the new requirements in the European Union. These transitional arrangements, which were incorporated into Spanish regulations through the approval of Royal Decree-Law 14/2013 and Bank of Spain Circular 2/2014, began to apply in 2014 and, in certain cases, will end in 2024. They affect both the new deductions and the issues and items of own funds which cease to be eligible as such under this new regulation. There is also a series of Common Equity Tier 1 (CET 1) capital requirements additional to those established in Regulation 575/2013, namely the so-called “capital buffers”, which are applicable for the first time in 2016 and must be fully implemented by 2019.
The Basel regulatory framework is based on three pillars. Pillar I sets out the minimum capital requirements to be met, and provides for the possibility of using internal ratings and models (AIRB approach) in the calculation of risk-weighted exposures and including operational risk therein. The aim is to render regulatory requirements more sensitive to the risks actually borne by entities in carrying on their business activities. Pillar II establishes a supervisory review system to improve internal risk management and internal capital adequacy assessment based on the risk profile. Lastly, Pillar III defines the elements relating to disclosures and market discipline.
F-14
Table of Contents
At December 31, 2014, the Group met all the minimum capital requirements established by current legislation.
From an economic standpoint, capital management seeks to optimize value creation at the Group and at its constituent business units. To this end, the economic capital, RORAC and value creation data for each business unit are generated, analyzed and reported to the capital committee on a quarterly basis. Within the framework of the internal capital adequacy assessment process (Pillar II of the Basel Capital Accord), the Group uses an economic capital measurement model with the objective of ensuring that there is sufficient capital available to support all the risks of its activity in various economic scenarios, with the solvency levels agreed upon by the Group.
In order to adequately manage the Group’s capital, it is essential to estimate and analyze future needs, in anticipation of the various phases of the business cycle. Projections of regulatory and economic capital are made based on the budgetary information (balance sheet, income statement, etc.), macroeconomic scenarios defined by the Group’s economic research service, and the impact, if any, of foreseeable regulatory changes. These estimates are used by the Group as a reference to plan the management actions (issues, securitizations, etc.) required to achieve its capital targets.
In addition, certain stress scenarios are simulated in order to assess the availability of capital in adverse situations. These scenarios are based on sharp fluctuations in macroeconomic variables, GDP, interest rates, values of equity instruments, etc. that mirror historical crises that could happen again or plausible but unlikely stress situations.
ii. Plan for the roll-out of advanced approaches and authorization from the supervisory authorities
The Group intends to adopt, over the next few years, the advanced internal ratings-based (AIRB) approach under Basel II for substantially all its banks, until the percentage of exposure of the loan portfolio covered by this approach exceeds 90%.
Accordingly, the Group continued in 2014 with the project for the progressive implementation of the technology platforms and methodological improvements required for the roll-out of the AIRB approaches for regulatory capital calculation purposes at the various Group units.
To date, the Group has obtained authorization from the supervisory authorities to use advanced internal rating-based approaches for the calculation of regulatory capital requirements for credit risk for the Parent and the main subsidiaries in Spain, the UK and Portugal, non-retail portfolios in Mexico and large corporate portfolios in Brazil, Chile and the US. In 2014 the Group obtained approval for the individualized corporate portfolios (upgrade from the foundation internal rating-based approach to the AIRB approach), developers and institutions in Mexico; the extension of use of the slotting criteria approach for specialized lending exposures in the UK was authorized; and authorization was obtained for the individualized corporate portfolios and credit cards at Santander Consumer España, as well as for the extension of use of the global wholesale banking model. Lastly, approval was obtained for the consumer portfolios in Germany, including most notably the car and personal loan portfolios.
F-15
Table of Contents
As regards the other risks explicitly addressed under Basel Pillar I, the Group is authorized to use its internal model for market risk for its treasury trading activities in Madrid, Chile, Portugal and Mexico.
Also, the Group has regulatory approval for its corporate methodology, enabling it to calculate, for the market risk of the trading book, the incremental default and migration risk charge (IRC) and stressed value at risk (VaR).
As far as operational risk is concerned, the Group uses the standardized approach for regulatory capital calculation purposes but is working towards requesting authorization for the use of AMA approaches, with the objective of gaining regulatory approval in the short term.
| f) | Environmental impact |
In view of the business activities carried on by the Group entities, the Group does not have any environmental liability, expenses, assets, provisions or contingencies that might be material with respect to its consolidated equity, financial position or results. Therefore, no specific disclosures relating to environmental issues are included in these consolidated financial statements.
| g) | Events after the reporting period |
It should be noted that from January 1, 2015 to April 29, 2015 on which these consolidated financial statements were authorized for issue, the following significant events occurred:
| • | On January 8, 2015, the Group announced that its board of directors had resolved to increase capital through an accelerated bookbuilt offering with disapplication of pre-emption rights. The capital increase amounted to EUR 7,500 million, of which EUR 607 million related to the par value of the 1,213,592,234 new shares issued and EUR 6,893 million to the share premium. |
| • | At its meeting of January 12, 2015, the Bank’s executive committee resolved to apply the Santander Dividendo Elección scrip dividend scheme on the dates on which the third interim dividend is traditionally paid, whereby the shareholders were offered the option of receiving an amount equivalent to said dividend, the gross amount of which was EUR 0.146 per share, in shares or cash. On April 10, 2015 the Group announced the information in connection with the flexible remuneration program Santander Dividendo Elección scrip dividend scheme to be applied to the final 2014 dividend. The shareholders were offered the option of receiving an amount equivalent to said dividend, the gross amount of which was EUR 0.151 per share, in shares or cash. |
| • | On April 23, 2015, we announced that we had reached a preliminary and exclusive agreement with our partners Warburg Pincus and General Atlantic, subject to the signing of final terms, to merge Santander Asset Management and Pioneer Investments to create a leading global asset manager in Europe and Latin America. The combined company, with approximately €353 billion in assets under management at the close of 2014, will be called Pioneer Investments. |
The agreement contemplates the creation of a new company into which the local asset managers of Santander Asset Management and Pioneer Investments will be incorporated. Santander will have a direct 33.3% stake in the new company, UniCredit will have a 33.3% stake, and private equity fund managers Warburg Pincus and General Atlantic will share a 33.3% stake. Pioneer Investments’ operations in the United States will not be included in the new company but will be owned by UniCredit (50%) and Warburg Pincus and General Atlantic (50%).
The transaction values Santander Asset Management at €2.6 billion and Pioneer Investments at €2.75 billion. Warburg Pincus and General Atlantic will make an additional equity investment into the company as part of the transaction. Following the signing of the preliminary agreement, the parties will work towards signing a definitive binding agreement which will be subject to the customary regulatory and corporate approvals.
| 2. | Accounting policies |
The accounting policies applied in preparing the consolidated financial statements were as follows:
| a) | Foreign currency transactions |
| i. | Functional currency |
The Group’s functional currency is the euro. Therefore, all balances and transactions denominated in currencies other than the euro are deemed to be denominated in foreign currency.
F-16
Table of Contents
| ii. | Translation of foreign currency balances |
Foreign currency balances are translated to euros in two consecutive stages:
| • | Translation of foreign currency to the functional currency (currency of the main economic environment in which the entity operates), and |
| • | Translation to euros of the balances held in the functional currencies of entities whose functional currency is not the euro. |
Translation of foreign currency to the functional currency
Foreign currency transactions performed by consolidated entities (or entities accounted for using the equity method) not located in EMU countries are initially recognized in their respective currencies. Monetary items in foreign currency are subsequently translated to their functional currencies using the closing rate.
Furthermore:
| • | Non-monetary items measured at historical cost are translated to the functional currency at the exchange rate at the date of acquisition. |
| • | Non-monetary items measured at fair value are translated at the exchange rate at the date when the fair value was determined. |
| • | Income and expenses are translated at the average exchange rates for the year for all the transactions performed during the year. When applying this criterion, the Group considers whether there have been significant changes in the exchange rates in the year which, in view of their materiality with respect to the consolidated financial statements taken as a whole, would make it necessary to use the exchange rates at the transaction date rather than the aforementioned average exchange rates. |
| • | The balances arising from non-hedging forward foreign currency/foreign currency and foreign currency/euro purchase and sale transactions are translated at the closing rates prevailing in the forward foreign currency market for the related maturity. |
Translation of functional currencies to euros
If the functional currency is not the euro, the balances in the financial statements of the consolidated entities (or entities accounted for using the equity method) are translated to euros as follows:
| • | Assets and liabilities, at the closing rates. |
| • | Income and expenses, at the average exchange rates for the year. |
| • | Equity items, at the historical exchange rates. |
| iii. | Recognition of exchange differences |
The exchange differences arising on the translation of foreign currency balances to the functional currency are generally recognized at their net amount under Exchange differences in the consolidated income statement, except for exchange differences arising on financial instruments at fair value through profit or loss, which are recognized in the consolidated income statement without distinguishing them from other changes in fair value, and for exchange differences arising on non-monetary items measured at fair value through equity, which are recognized under Valuation adjustments—Exchange differences.
F-17
Table of Contents
The exchange differences arising on the translation to euros of the financial statements denominated in functional currencies other than the euro are recognized in equity under Valuation adjustments—Exchange differences in the consolidated balance sheet, whereas those arising on the translation to euros of the financial statements of entities accounted for using the equity method are recognized in equity under Valuation adjustments—Entities accounted for using the equity method, until the related item is derecognized, at which time they are recognized in the consolidated income statement.
| iv. | Entities located in hyperinflationary economies |
In 2009 the Group sold substantially all its businesses in Venezuela and at December 31, 2013 its net assets in that country amounted to only EUR 1 million (December 31, 2012: EUR 3 million). At December 31, 2014, the Group did not have any net assets in Venezuela.
In view of the foregoing, at December 31, 2014, 2013 and 2012 none (except the business in Venezuela in 2013 and 2012) of the functional currencies of the consolidated entities and associates located abroad related to hyperinflationary economies, as defined by International Financial Reporting Standards as adopted by the European Union. Accordingly, at the end of the last three reporting periods it was not necessary to adjust the financial statements of any of the consolidated entities or associates to correct for the effect of inflation.
| v. | Exposure to foreign currency risk |
The Group hedges a portion of these permanent positions using foreign exchange derivative financial instruments (see Note 36). Also, the Group manages foreign currency risk by dynamically hedging its position over time (with a potential impact on profit or loss) and attempting to limit the impact of currency depreciations and, in turn, optimizing the finance cost of the hedges.
The following tables show the sensitivity of consolidated profit and consolidated equity to changes in the foreign currency positions arising from all the Group’s items denominated in foreign currencies to 1% variations in the various foreign currencies in which the Group has material balances.
The estimated effect on the consolidated equity attributable to the Group and on the consolidated profit of a 1% appreciation of the euro against the related currency is as follows:
| Millions of euros | ||||||||||||||||||||||||
| Effect on consolidated equity | Effect on consolidated profit | |||||||||||||||||||||||
| Currency |
2014 | 2013 | 2012 | 2014 | 2013 | 2012 | ||||||||||||||||||
| US dollar |
(114.6 | ) | (74.2 | ) | (71.6 | ) | (14.9 | ) | (9.0 | ) | (8.3 | ) | ||||||||||||
| Chilean peso |
(23.3 | ) | (16.2 | ) | (19.3 | ) | (6.2 | ) | (6.7 | ) | (4.8 | ) | ||||||||||||
| Pound sterling |
(195.0 | ) | (173.1 | ) | (165.4 | ) | (12.6 | ) | (7.9 | ) | (11.0 | ) | ||||||||||||
| Mexican peso |
(18.1 | ) | (9.7 | ) | (11.6 | ) | (6.7 | ) | (7.8 | ) | (9.8 | ) | ||||||||||||
| Brazilian real |
(138.9 | ) | (73.8 | ) | (149.6 | ) | (3.5 | ) | (3.9 | ) | (20.0 | ) | ||||||||||||
| Polish zloty |
(34.1 | ) | (32.5 | ) | (44.3 | ) | (3.8 | ) | (3.8 | ) | (3.3 | ) | ||||||||||||
F-18
Table of Contents
Similarly, the estimated effect on the Group’s consolidated equity and consolidated profit of a 1% depreciation of the euro against the related currency is as follows:
| Millions of euros | ||||||||||||||||||||||||
| Effect on consolidated equity | Effect on consolidated profit | |||||||||||||||||||||||
| Currency |
2014 | 2013 | 2012 | 2014 | 2013 | 2012 | ||||||||||||||||||
| US dollar |
117.0 | 75.7 | 73.1 | 15.2 | 9.2 | 8.5 | ||||||||||||||||||
| Chilean peso |
23.8 | 16.5 | 19.6 | 6.4 | 6.9 | 4.9 | ||||||||||||||||||
| Pound sterling |
198.9 | 176.6 | 168.8 | 12.8 | 8.0 | 11.2 | ||||||||||||||||||
| Mexican peso |
18.5 | 9.9 | 11.8 | 6.8 | 8.0 | 10.0 | ||||||||||||||||||
| Brazilian real |
141.8 | 75.4 | 147.8 | 3.6 | 4.0 | 20.5 | ||||||||||||||||||
| Polish zloty |
34.8 | 33.1 | 40.5 | 3.9 | 3.8 | 3.4 | ||||||||||||||||||
The foregoing data were obtained as follows:
| a. | Effect on consolidated equity: in accordance with the accounting policy detailed in Note 2.a.iii, the exchange differences arising on the translation to euros of the financial statements in the functional currencies of the Group entities whose functional currency is not the euro are recognized in consolidated equity. The possible effect that a change in the exchange rates of the related currency would have on the Group’s consolidated equity was therefore determined by applying the aforementioned change to the net value of each unit’s assets and liabilities -including, where appropriate, the related goodwill- and by taking into consideration the offsetting effect of the hedges of net investments in foreign operations. |
| b. | Effect on consolidated profit: the effect was determined by applying the fluctuations in the average exchange rates used for the year, as indicated in Note 2.a.ii, to translate to euros the income and expenses of the consolidated entities whose functional currency is not the euro, taking into consideration, where appropriate, the offsetting effect of the various hedging transactions in place. |
The estimates used to obtain the foregoing data were performed considering the effects of the exchange rate fluctuations in isolation from the effect of the performance of other variables, the changes in which would affect equity and profit, such as variations in the interest rates of the reference currencies or other market factors. Accordingly, all variables other than the exchange rate fluctuations were kept constant with respect to their positions as at December 31, 2014, 2013 and 2012.
| b) | Basis of consolidation |
| i. | Subsidiaries |
Subsidiaries are defined as entities over which the Bank has the capacity to exercise control; the Bank controls an entity when it is exposed, or has rights, to variable returns from its involvement with the investee and has the ability to affect those returns through its power over the investee.
The financial statements of the subsidiaries are fully consolidated with those of the Bank. Accordingly, all balances and effects of the transactions between consolidated entities are eliminated on consolidation.
On acquisition of control of a subsidiary, its assets, liabilities and contingent liabilities are recognized at their acquisition-date fair values. Any positive differences between the acquisition cost and the fair values of the identifiable net assets acquired are recognized as goodwill (see Note 17). Negative differences are recognized in profit or loss on the date of acquisition.
F-19
Table of Contents
Additionally, the share of third parties of the Group’s equity is presented under Non-controlling interests in the consolidated balance sheet (see Note 28). Their share of the profit for the year is presented under Profit attributable to non-controlling interests in the consolidated income statement.
The results of subsidiaries acquired during the year are included in the consolidated income statement from the date of acquisition to year-end. Similarly, the results of subsidiaries disposed of during the year are included in the consolidated income statement from the beginning of the year to the date of disposal.
As at December 31, 2014, the Group controlled the following companies in which it held an ownership interest of less than 50% of the share capital: (i) Luri 1, S.A., (ii) Luri 2, S.A. and (iii) Luri Land, S.A. The percentage ownership interests in the aforementioned companies were 5.8%, 10% and 8.11%, respectively (see Exhibit I). Although the Group holds less than half the voting power, it manages and, as a result, exercises control over these entities. The business activities of these entities are the acquisition of real estate and other general operations relating thereto, including the rental, purchase and sale of properties.
The impact of the consolidation of these companies on the Group’s consolidated financial statements is immaterial.
The Appendices contain significant information on the subsidiaries.
| ii. | Interests in joint ventures (jointly controlled entities) |
Joint ventures are deemed to be ventures that are not subsidiaries but which are jointly controlled by two or more unrelated entities. This is evidenced by contractual arrangements whereby two or more entities have interests in entities so that decisions on significant activities require the unanimous consent of all the parties sharing control.
In the consolidated financial statements, investments in jointly controlled entities are accounted for using the equity method, i.e. at the Group’s share of net assets of the investee, after taking into account the dividends received therefrom and other equity eliminations. The profits and losses resulting from transactions with a jointly controlled entity are eliminated to the extent of the Group’s interest therein.
As at December 31, 2014, the Group exercised joint control of Luri 3, S.A., despite holding 10% of its share capital. This decision is based on the Group’s presence on the company’s board of directors, in which the agreement of all members is required for decision-making.
The Appendices contain significant information on the jointly controlled entities.
| iii. | Associates |
“Associates” are entities over which the Bank is in a position to exercise significant influence, but not control or joint control. It is presumed that the Bank exercises significant influence if it holds 20% or more of the voting power of the investee.
In the consolidated financial statements, investments in associates are accounted for using the equity method, i.e. at the Group’s share of net assets of the investee, after taking into account the dividends received therefrom and other equity eliminations. The profits and losses resulting from transactions with an associate are eliminated to the extent of the Group’s interest in the associate.
There are certain investments in entities (in which the Group owns 20% or more of the voting power) that are not considered to be associates, since the Group is not in a position to exercise significant influence over them. These investments are not significant for the Group and are recognized under Available-for-sale financial assets.
F-20
Table of Contents
The Appendices contain significant information on the associates.
| iv. | Structured entities |
When the Group incorporates entities, or holds ownership interests therein, to enable its customers to access certain investments, or for the transfer of risks or other purposes, also called structured entities since the voting or similar power is not a key factor in deciding who controls the entity, the Group determines, using internal criteria and procedures and taking into consideration the applicable legislation, whether control (as defined above) exists and, therefore, whether these entities should be consolidated. Specifically, for those entities to which it applies (investment funds and pension funds, mainly), the Group analyses the following factors:
| • | Percentage of ownership held by the Group, 20% being established as the threshold from which a more in-depth analysis is performed. |
| • | Identification of the fund manager, and verification as to whether it is a company controlled by the Group since this could affect the Group’s ability to direct the relevant activities. |
| • | Existence of agreements between investors that might require decisions to be taken jointly by the investors, rather than by the fund manager. |
| • | Existence of currently exercisable removal rights (possibility of removing the manager from his position) since the existence of such rights might limit the manager’s power over the fund, and it may be concluded that the manager is acting as an agent of the investors. |
| • | Analysis of the fund manager’s remuneration regime, taking into consideration that a remuneration regime that is proportionate to the service rendered does not, generally, create exposure of such importance to indicate that the manager is acting as the principal Conversely, if the remuneration regime is not proportionate to the service rendered, this might give rise to such an exposure that might lead the Group to a different conclusion. |
These structured entities also include the securitization special purpose vehicles, which are consolidated in the case of the SPVs over which, based on the aforementioned analysis, it is considered that the Group continues to exercise control.
The balances associated with unconsolidated structured entities are not material with respect to the Group’s consolidated financial statements.
| v. | Business combinations |
A business combination is the bringing together of two or more separate entities or economic units into one single entity or group of entities.
Business combinations whereby the Group obtains control over an entity are recognized for accounting purposes as follows:
F-21
Table of Contents
| • | The Group measures the cost of the business combination, which is normally the consideration transferred, defined as the acquisition-date fair values of the assets transferred, the liabilities incurred to the former owners of the acquiree and the equity instruments issued, if any, by the acquirer. In cases where the amount of the consideration to be transferred has not been definitively established at the acquisition date, but rather depends on future events, any contingent consideration is recognized as part of the consideration transferred and measured at its acquisition-date fair value; also, acquisition-related costs do not for these purposes form part of the cost of the business combination. |
| • | The fair values of the assets, liabilities and contingent liabilities of the acquired entity or business, including any intangible assets which might not have been recognized by the acquiree, are estimated and recognized in the consolidated balance sheet; the Group also estimates the amount of any non-controlling interests and the fair value of the previously held equity interest in the acquiree. |
| • | Any positive difference between the aforementioned items is recognized as discussed in Note 2.m. Any negative difference is recognized under Gains from bargain purchases arising in business combinations in the consolidated income statement. |
Goodwill is only measured and recognized once, when control of a business is obtained.
| vi. | Changes in the levels of ownership interests in subsidiaries |
Acquisitions and disposals not giving rise to a change in control are recognized as equity transactions, and no gain or loss is recognized in the income statement and the initially recognized goodwill is not remeasured. The difference between the consideration transferred or received and the decrease or increase in non-controlling interests, respectively, is recognized in reserves.
Similarly, when control over a subsidiary is lost, the assets, liabilities and non-controlling interests and any other items recognized in valuation adjustments of that company are derecognized from the consolidated balance sheet, and the fair value of the consideration received and of any remaining equity interest is recognized . The difference between these amounts is recognized in profit or loss.
| vii. | Acquisitions and disposals |
Note 3 provides information on the most significant acquisitions and disposals in 2014, 2013 and 2012.
| c) | Definitions and classification of financial instruments |
| i. | Definitions |
A financial instrument is any contract that gives rise to a financial asset of one entity and a financial liability or equity instrument of another entity.
An equity instrument is any agreement that evidences a residual interest in the assets of the issuing entity after deducting all of its liabilities.
A financial derivative is a financial instrument whose value changes in response to the change in an observable market variable (such as an interest rate, foreign exchange rate, financial instrument price, market index or credit rating), whose initial investment is very small compared with other financial instruments with a similar response to changes in market factors, and which is generally settled at a future date.
Hybrid financial instruments are contracts that simultaneously include a non-derivative host contract together with a derivative, known as an embedded derivative, that is not separately transferable and has the effect that some of the cash flows of the hybrid contract vary in a way similar to a stand-alone derivative.
F-22
Table of Contents
Compound financial instruments are contracts that simultaneously create for their issuer a financial liability and an own equity instrument (such as convertible bonds, which entitle their holders to convert them into equity instruments of the issuer).
The preference shares contingently convertible into ordinary shares eligible as Additional Tier 1 capital (“CCPSs”) -perpetual preference shares, which may be repurchased by the issuer in certain circumstances, the interest on which is discretionary, and would convert into a variable number of newly issued ordinary shares if the capital ratio of the Bank or its consolidable group falls below a given percentage (trigger event), as those two terms are defined in the related issue prospectuses- are recognized for accounting purposes by the Group as compound instruments. The liability component reflects the issuer’s obligation to deliver a variable number of shares and the equity component reflects the issuer’s discretion in relation to the payment of the related coupons. In order to effect the initial allocation, the Group estimates the fair value of the liability as the amount that would have to be delivered if the trigger event were to occur immediately and, accordingly, the equity component, as a residual amount, is zero. In view of the aforementioned discretionary nature of the payment of the coupons, they are deducted directly from equity.
The following transactions are not treated for accounting purposes as financial instruments:
| • | Investments in associates and jointly controlled entities (see Note 13). |
| • | Rights and obligations under employee benefit plans (see Note 25). |
| • | Rights and obligations under insurance contracts (see Note 15). |
| • | Contracts and obligations relating to employee remuneration based on own equity instruments (see Note 34). |
| ii. | Classification of financial assets for measurement purposes |
Financial assets are initially classified into the various categories used for management and measurement purposes, unless they have to be presented as Non-current assets held for sale or they relate to Cash and balances with central banks, Changes in the fair value of hedged items in portfolio hedges of interest rate risk (asset side), Hedging derivatives and Investments, which are reported separately.
Financial assets are included for measurement purposes in one of the following categories:
| • | Financial assets held for trading (at fair value through profit or loss): this category includes the financial assets acquired for the purpose of generating a profit in the near term from fluctuations in their prices and financial derivatives that are not designated as hedging instruments. |
| • | Other financial assets at fair value through profit or loss: this category includes hybrid financial assets not held for trading that are measured entirely at fair value and financial assets not held for trading that are included in this category in order to obtain more relevant information, either because this eliminates or significantly reduces recognition or measurement inconsistencies (accounting mismatches) that would otherwise arise from measuring assets or liabilities or recognizing the gains or losses on them on different bases, or because a group of financial assets or financial assets and liabilities is managed and its performance is evaluated on a fair value basis, in accordance with a documented risk management or investment strategy, and information about the group is provided on that basis to the Group’s key management personnel. Financial assets may only be included in this category on the date they are acquired or originated. |
F-23
Table of Contents
| • | Available-for-sale financial assets: this category includes debt instruments not classified as Held-to-maturity investments, Loans and receivables or Financial assets at fair value through profit or loss, and equity instruments issued by entities other than subsidiaries, associates and jointly controlled entities, provided that such instruments have not been classified as Financial assets held for trading or as Other financial assets at fair value through profit or loss. |
| • | Loans and receivables: this category includes the investment arising from ordinary lending activities, such as the cash amounts of loans drawn down and not yet repaid by customers or the deposits placed with other institutions, whatever the legal instrument, unquoted debt securities and receivables from the purchasers of goods, or the users of services, constituting part of the Group’s business. |
The consolidated entities generally intend to hold the loans and credits granted by them until their final maturity and, therefore, they are presented in the consolidated balance sheet at their amortized cost (which includes any reductions required to reflect the estimated losses on their recovery).
| • | Held-to-maturity investments: this category includes debt instruments traded in an active market, with fixed maturity and with fixed or determinable payments, for which the Group has both the intention and proven ability to hold to maturity. |
| iii. | Classification of financial assets for presentation purposes |
Financial assets are classified by nature into the following items in the consolidated balance sheet:
| • | Cash and balances with central banks: cash balances and balances receivable on demand relating to deposits with the Bank of Spain and other central banks. |
| • | Loans and advances: includes the debit balances of all credit and loans granted by the Group, other than those represented by securities, as well as finance lease receivables and other debit balances of a financial nature in favor of the Group, such as cheques drawn on credit institutions, balances receivable from clearing houses and settlement agencies for transactions on the stock exchange and organized markets, bonds given in cash, capital calls, fees and commissions receivable for financial guarantees and debit balances arising from transactions not originating in banking transactions and services, such as the collection of rentals and similar items. They are classified, depending on the institutional sector to which the debtor belongs, under: |
| • | Loans and advances to credit institutions: credit of any nature, including deposits and money market operations, in the name of credit institutions. |
| • | Loans and advances to customers: includes the remaining credit, including money market operations through central counterparties. |
| • | Debt instruments: bonds and other securities that represent a debt for their issuer, that generate an interest return, and that are in the form of certificates or book entries. |
| • | Equity instruments: financial instruments issued by other entities, such as shares, which have the nature of equity instruments for the issuer, unless they are investments in subsidiaries, jointly controlled entities or associates. Investment fund units are included in this item. |
| • | Trading derivatives: includes the fair value in favor of the Group of derivatives which do not form part of hedge accounting, including embedded derivatives separated from hybrid financial instruments. |
F-24
Table of Contents
| • | Changes in the fair value of hedged items in portfolio hedges of interest rate risk: this item is the balancing entry for the amounts credited to the consolidated income statement in respect of the measurement of the portfolios of financial instruments which are effectively hedged against interest rate risk through fair value hedging derivatives. |
| • | Hedging derivatives: includes the fair value in favor of the Group of derivatives, including embedded derivatives separated from hybrid financial instruments, designated as hedging instruments in hedge accounting. |
| iv. | Classification of financial liabilities for measurement purposes |
Financial liabilities are initially classified into the various categories used for management and measurement purposes, unless they have to be presented as Liabilities associated with non-current assets held for sale or they relate to Hedging derivatives or Changes in the fair value of hedged items in portfolio hedges of interest rate risk (liability side), which are reported separately.
Financial liabilities are classified for measurement purposes into one of the following categories:
| • | Financial liabilities held for trading (at fair value through profit or loss): this category includes the financial liabilities issued for the purpose of generating a profit in the near term from fluctuations in their prices, financial derivatives not considered to qualify for hedge accounting and financial liabilities arising from the outright sale of financial assets acquired under reverse repurchase agreements (“reverse repos”) or borrowed (short positions). |
| • | Other financial liabilities at fair value through profit or loss: financial liabilities are included in this category when more relevant information is obtained, either because this eliminates or significantly reduces recognition or measurement inconsistencies (accounting mismatches) that would otherwise arise from measuring assets or liabilities or recognizing the gains or losses on them on different bases, or because a group of financial liabilities or financial assets and liabilities is managed and its performance is evaluated on a fair value basis, in accordance with a documented risk management or investment strategy, and information about the group is provided on that basis to the Group’s key management personnel. Liabilities may only be included in this category on the date when they are issued or originated. |
| • | Financial liabilities at amortized cost: financial liabilities, irrespective of their instrumentation and maturity, not included in any of the above-mentioned categories which arise from the ordinary borrowing activities carried on by financial institutions. |
| v. | Classification of financial liabilities for presentation purposes |
Financial liabilities are classified by nature into the following items in the consolidated balance sheet:
| • | Deposits: includes all repayable balances received in cash by the Group, other than those instrumented as marketable securities and those having the substance of subordinated liabilities. This item also includes cash bonds and cash consignments received the amount of which may be invested without restriction. Deposits are classified on the basis of the creditor’s institutional sector into: |
| • | Deposits from central banks: deposits of any nature, including credit received and money market operations received from the Bank of Spain or other central banks. |
| • | Deposits from credit institutions: deposits of any nature, including credit received and money market operations in the name of credit institutions. |
F-25
Table of Contents
| • | Customer deposits: includes the remaining deposits, including money market operations through central counterparties. |
| • | Marketable debt securities: includes the amount of bonds and other debt represented by marketable securities, other than those having the substance of subordinated liabilities. This item includes the component considered to be a financial liability of issued securities that are compound financial instruments. |
| • | Trading derivatives: includes the fair value, with a negative balance for the Group, of derivatives, including embedded derivatives separated from the host contract, which do not form part of hedge accounting. |
| • | Short positions: includes the amount of financial liabilities arising from the outright sale of financial assets acquired under reverse repurchase agreements or borrowed. |
| • | Subordinated liabilities: amount of financing received which, for the purposes of payment priority, ranks behind ordinary debt. This category also includes the financial instruments issued by the Group which, although capital for legal purposes, do not meet the requirements for classification as equity, such as certain preference shares issued. |
| • | Other financial liabilities: includes the amount of payment obligations having the nature of financial liabilities not included in other items, and liabilities under financial guarantee contracts, unless they have been classified as non-performing. |
| • | Changes in the fair value of hedged items in portfolio hedges of interest rate risk: this item is the balancing entry for the amounts charged to the consolidated income statement in respect of the measurement of the portfolios of financial instruments which are effectively hedged against interest rate risk through fair value hedging derivatives. |
| • | Hedging derivatives: includes the fair value of the Group’s liability in respect of derivatives, including embedded derivatives separated from hybrid financial instruments, designated as hedging instruments in hedge accounting. |
| d) | Measurement of financial assets and liabilities and recognition of fair value changes |
In general, financial assets and liabilities are initially recognized at fair value which, in the absence of evidence to the contrary, is deemed to be the transaction price. Financial instruments not measured at fair value through profit or loss are adjusted by the transaction costs. Financial assets and liabilities are subsequently measured at each year-end as follows:
| i. | Measurement of financial assets |
Financial assets are measured at fair value, without deducting any transaction costs that may be incurred on their disposal, except for loans and receivables, held-to-maturity investments, equity instruments whose fair value cannot be determined in a sufficiently objective manner and financial derivatives that have those equity instruments as their underlying and are settled by delivery of those instruments.
The fair value of a financial asset on a given date is taken to be the price that would be received to sell an asset or paid to transfer a liability in an orderly transaction between market participants. The most objective and common reference for the fair value of a financial instrument is the price that would be paid for it on an active, transparent and deep market (quoted price or market price). At December 31, 2014, there were no significant investments in quoted financial instruments which have ceased to be recognized at their quoted price because their market cannot be deemed to be active.
F-26
Table of Contents
If there is no market price for a given financial instrument, its fair value is estimated on the basis of the price established in recent transactions involving similar instruments and, in the absence thereof, of valuation techniques commonly used by the international financial community, taking into account the specific features of the instrument to be measured and, particularly, the various types of risk associated with it.
All derivatives are recognized in the balance sheet at fair value from the trade date. If the fair value is positive, they are recognized as an asset and if the fair value is negative, they are recognized as a liability. The fair value on the trade date is deemed, in the absence of evidence to the contrary, to be the transaction price. The changes in the fair value of derivatives from the trade date are recognized in Gains/losses on financial assets and liabilities (net) in the consolidated income statement. Specifically, the fair value of financial derivatives traded in organized markets included in the portfolios of financial assets or liabilities held for trading is deemed to be their daily quoted price and if, for exceptional reasons, the quoted price cannot be determined on a given date, these financial derivatives are measured using methods similar to those used to measure OTC derivatives.
The fair value of OTC derivatives is taken to be the sum of the future cash flows arising from the instrument, discounted to present value at the date of measurement (present value or theoretical close) using valuation techniques commonly used by the financial markets: net present value (NPV), option pricing models and other methods.
Loans and receivables and Held-to-maturity investments are measured at amortized cost using the effective interest method. Amortized cost is understood to be the acquisition cost of a financial asset or liability plus or minus, as appropriate, the principal repayments and the cumulative amortization (taken to the income statement) of the difference between the initial cost and the maturity amount. In the case of financial assets, amortized cost furthermore includes any reductions for impairment or uncollectibility. In the case of loans and receivables hedged in fair value hedges, the changes in the fair value of these assets related to the risk or risks being hedged are recognized.
The effective interest rate is the discount rate that exactly matches the carrying amount of a financial instrument to all its estimated cash flows of all kinds over its remaining life. For fixed rate financial instruments, the effective interest rate coincides with the contractual interest rate established on the acquisition date plus, where applicable, the fees and transaction costs that, because of their nature, form part of their financial return. In the case of floating rate financial instruments, the effective interest rate coincides with the rate of return prevailing in all connections until the next benchmark interest reset date.
Equity instruments whose fair value cannot be determined in a sufficiently objective manner and financial derivatives that have those instruments as their underlying and are settled by delivery of those instruments are measured at acquisition cost adjusted, where appropriate, by any related impairment loss.
The amounts at which the financial assets are recognized represent, in all material respects, the Group’s maximum exposure to credit risk at each reporting date. Also, the Group has received collateral and other credit enhancements to mitigate its exposure to credit risk, which consist mainly of mortgage guarantees, cash collateral, equity instruments and personal security, assets leased out under finance lease and full-service lease agreements, assets acquired under repurchase agreements, securities loans and credit derivatives.
F-27
Table of Contents
| ii. | Measurement of financial liabilities |
In general, financial liabilities are measured at amortized cost, as defined above, except for those included under Financial liabilities held for trading and Other financial liabilities at fair value through profit or loss and financial liabilities designated as hedged items (or hedging instruments) in fair value hedges, which are measured at fair value.
| iii. | Valuation techniques |
The following table shows a summary of the fair values, at 2014, 2013 and 2012 year-end, of the financial assets and liabilities indicated below, classified on the basis of the various measurement methods used by the Group to determine their fair value:
| Millions of euros | ||||||||||||||||||||||||||||||||||||
| 2014 | 2013 | 2012 | ||||||||||||||||||||||||||||||||||
| Published price quotations in active markets |
Internal models |
Total | Published price quotations in active markets |
Internal models |
Total | Published price quotations in active markets |
Internal models |
Total | ||||||||||||||||||||||||||||
| Financial assets held for trading |
67,319 | 81,569 | 148,888 | 46,472 | 68,817 | 115,289 | 48,014 | 129,903 | 177,917 | |||||||||||||||||||||||||||
| Other financial assets at fair value through profit or loss |
3,670 | 39,003 | 42,673 | 3,687 | 27,694 | 31,381 | 3,387 | 24,969 | 28,356 | |||||||||||||||||||||||||||
| Available-for-sale financial assets (1) |
90,149 | 23,455 | 113,604 | 62,343 | 20,415 | 82,758 | 65,720 | 25,256 | 90,976 | |||||||||||||||||||||||||||
| Hedging derivatives (assets) |
26 | 7,320 | 7,346 | 221 | 8,080 | 8,301 | 128 | 7,808 | 7,936 | |||||||||||||||||||||||||||
| Financial liabilities held for trading |
17,409 | 92,383 | 109,792 | 14,643 | 80,030 | 94,673 | 15,985 | 127,257 | 143,242 | |||||||||||||||||||||||||||
| Other financial liabilities at fair value through profit or loss |
— | 62,317 | 62,317 | — | 42,311 | 42,311 | — | 45,418 | 45,418 | |||||||||||||||||||||||||||
| Hedging derivatives (liabilities) |
226 | 7,029 | 7,255 | 187 | 5,096 | 5,283 | 96 | 6,348 | 6,444 | |||||||||||||||||||||||||||
| Liabilities under insurance contracts |
— | 713 | 713 | — | 1,430 | 1,430 | — | 1,425 | 1,425 | |||||||||||||||||||||||||||
| (1) | In addition to the financial instruments measured at fair value shown in the foregoing table, at December 31, 2014, 2013 and 2012, the Group held equity instruments classified as available-for-sale financial assets and carried at cost amounting to EUR 1,646 million, EUR 1,041 million and EUR 1,290 million, respectively (see Note 51.c). |
Financial instruments at fair value, determined on the basis of published price quotations in active markets (Level 1), include government debt securities, private-sector debt securities, derivatives traded in organized markets, securitized assets, shares, short positions and fixed-income securities issued.
In cases where price quotations cannot be observed, management makes its best estimate of the price that the market would set, using its own internal models. In most cases, these internal models use data based on observable market parameters as significant inputs (Level 2) and, in very specific cases, they use significant inputs not observable in market data (Level 3). In order to make these estimates, various techniques are employed, including the extrapolation of observable market data. The best evidence of the fair value of a financial instrument on initial recognition is the transaction price, unless the fair value of the instrument can be obtained from other market transactions performed with the same or similar instruments or can be measured by using a valuation technique in which the variables used include only observable market data, mainly interest rates.
F-28
Table of Contents
General measurement bases
The Group has developed a formal process for the systematic valuation and management of financial instruments, which has been implemented worldwide across all the Group’s units. The governance scheme for this process distributes responsibilities between two independent divisions: Treasury (development, marketing and daily management of financial products and market data) and Risk (on a periodic basis, validation of pricing models and market data, computation of risk metrics, new transaction approval policies, management of market risk and implementation of fair value adjustment policies).
The approval of new products follows a sequence of steps (request, development, validation, integration in corporate systems and quality assurance) before the product is brought into production. This process ensures that pricing systems have been properly reviewed and are stable before they are used.
The following subsections set forth the most important products and families of derivatives, and the related valuation techniques and inputs, by asset class:
Fixed income and inflation
The fixed income asset class includes basic instruments such as interest rate forwards, interest rate swaps and cross currency swaps, which are valued using the net present value of the discounted estimated future cash flows taking into account basis swap and cross currency spreads, depending on the payment frequency and currency of each leg of the derivative. Vanilla options, including caps, floors and swaptions, are priced using the Black-Scholes model, which is one of the benchmark industry models. More exotic derivatives are priced using more complex models which are generally accepted as standard across institutions.
These pricing models are fed with observable market data such as deposit interest rates, futures rates, cross currency swap and constant maturity swap rates, and basis spreads, on the basis of which different yield curves are calculated, depending on the payment frequency and discounting curves for each currency. In the case of options, implied volatilities are also used as model inputs. These volatilities are observable in the market for cap and floor options and swaptions, and interpolation and extrapolation of volatilities from the quoted ranges are carried out using generally accepted industry models. The pricing of more exotic derivatives may require the use of non-observable data or parameters, such as correlation (among interest rates and cross-asset), mean reversion rates and prepayment rates, which are usually defined from historical data or through calibration.
Inflation-related assets include inflation-linked bonds and zero-coupon or year-on-year inflation-linked swaps, valued with the present value method using forward estimation and discounting. Derivatives on inflation indices are priced using standard and more complex bespoke models, as appropriate. Valuation inputs of these models consider inflation-linked swap spreads observable in the market and estimations of inflation seasonality, on the basis of which a forward inflation curve is calculated. Also, implied volatilities taken from zero-coupon and year-on-year inflation options are also inputs for the pricing of more complex derivatives.
Equity and foreign exchange
The most important products in these asset classes are forward and futures contracts; they also include vanilla, listed and OTC (over-the-counter) derivatives on single underlying assets and baskets of assets. Vanilla options are priced using the standard Black-Scholes model and more exotic derivatives involving forward returns, average performance, or digital, barrier or callable features are priced using generally accepted industry models and bespoke models, as appropriate. For derivatives on illiquid stocks, hedging takes into account the liquidity constraints in models.
F-29
Table of Contents
The inputs of equity models consider yield curves, spot prices, dividends, asset borrowing costs (repo margin spreads), implied volatilities, correlation among equity stocks and indices, and cross-asset correlation. Implied volatilities are obtained from market quotes of European and American vanilla call and put options. Various interpolation and extrapolation techniques are used to obtain continuous volatility surfaces for illiquid stocks. Dividends are usually estimated for the mid and long term. Correlations are implied, when possible, from market quotes of correlation-dependent products. In all other cases, proxies are used for correlations between benchmark underlyings or correlations are obtained from historical data.
The inputs of foreign exchange models include the yield curve for each currency, the spot foreign exchange price and the implied volatilities and correlation among assets of this type. Volatilities are obtained from European call and put options which are quoted in markets as at-the-money, risk reversal or butterfly options. Illiquid currency pairs are usually handled by using the data of the liquid pairs from which the illiquid currency can be derived. For more exotic products, unobservable model parameters may be estimated by fitting to reference prices provided by other non-quoted market sources.
Credit
The most common instrument in this asset class is the credit default swap (CDS), which is used to hedge credit exposure to third parties. In addition, models for first-to-default (FTD), n-to-default (NTD) and single-tranche collateralized debt obligation (CDO) products are also available. These products are valued with standard industry models, which estimate probability of default of a single issuer (for CDSs) or the joint probability of default of more than one issuer for FTDs, NTDs and CDOs.
Valuation inputs are the yield curve, the CDS spread curve and the recovery rate. The CDS spread curve is obtained in the market for indices and important individual issuers. For less liquid issuers, this spread curve is estimated using proxies or other credit-dependent instruments. Recovery rates are usually set to standard values. For listed single-tranche CDOs, the correlation of joint default of several issuers is implied from the market. For FTDs, NTDs and bespoke CDOs, the correlation is estimated from proxies or historical data when no other option is available.
Valuation adjustment for counterparty risk or default risk
The credit valuation adjustment (CVA) is a valuation adjustment to OTC derivatives as a result of the risk associated with the credit exposure assumed to each counterparty.
The CVA is calculated taking into account potential exposure to each counterparty in each future period. The CVA for a specific counterparty is equal to the sum of the CVA for all the periods. The following inputs are used to calculate the CVA:
| • | Expected exposure: including for each transaction the mark-to-market (MtM) value plus an add-on for the potential future exposure for each period. Mitigating factors such as netting and collateral agreements are taken into account, as well as temporary impairment for derivatives with interim payments. |
| • | LGD: percentage of final loss assumed in a counterparty credit event/default. |
| • | Probability of default: for cases where there is no market information (the CDS quoted spread curve, etc.), proxies based on companies holding exchange-listed CDSs, in the same industry and with the same external rating as the counterparty, are used. |
| • | Discount factor curve. |
F-30
Table of Contents
The debt valuation adjustment (DVA) is a similar valuation adjustment to the CVA but, in this case, as a result of the own risk of the Group assumed by its counterparties in OTC derivatives.
The CVA and DVA recognized at December 31, 2014 amounted to EUR 786 million and EUR 228 million, respectively.
Valuation adjustments due to model risk
The valuation models described above are not significantly subjective, since they can be adjusted and recalibrated, where appropriate, through the internal calculation of the fair value and the subsequent comparison with the related actively traded price. However, fair value adjustments may be necessary when market quoted prices are not available for comparison purposes.
The sources of risk are associated with uncertain model parameters, illiquid underlying issuers, low quality market data or missing risk factors (sometimes the best available option is to use limited models with controllable risk). In these situations, the Group calculates and applies valuation adjustments in accordance with general industry practice. The main sources of model risk are described below:
In fixed income markets, model risks include the correlation among fixed income indices, basis spread modelling, calibration risk of model parameters and the treatment of near-zero or negative interest rates. Other sources of risk arise from the estimation of market data, such as volatilities or interest rate curves, whether used for estimation or cash flow discounting purposes.
In equity markets, model risks include forward skew modelling, the impact of stochastic interest rates, correlation and multi-curve modelling. Also, other sources of risk arise from the hedging management of digital, callable and barrier option payments. In addition, the estimation of market data such as dividends and correlation for quanto and composite basket options must also be considered as sources of risk.
For specific financial instruments relating to home mortgage loans secured by financial institutions in the UK (which are regulated and partially financed by the Government) and property asset derivatives, the main input is the Halifax Home Price Index (HPI). In these cases, risk assumptions include estimates of the future growth and the volatility of the HPI, mortality and the implied credit spreads.
Inflation markets are exposed to model risk resulting from the uncertainty of modelling the correlation structure among various CPI rates. Another source of risk may arise from the bid-offer spread of inflation-linked swaps.
Foreign exchange markets are exposed to model risk resulting from forward skew modelling, the impact of stochastic interest rate and correlation modelling for multi-asset instruments. Risk may also arise from market data, due to the existence of specific illiquid foreign exchange pairs.
The most important source of model risk for credit derivatives relates to the estimation of the correlation between the probabilities of default of different underlying issuers. For illiquid underlying issuers, the CDS spread may not be well defined.
Set forth below are the financial instruments at fair value whose measurement was based on internal models (Levels 2 and 3) as at December 31, 2014, 2013 and 2012:
F-31
Table of Contents
| Millions of euros | ||||||||||||
| Fair values calculated using internal models as at 12/31/14 |
||||||||||||
| Level 2 | Level 3 | Valuation techniques |
Main assumptions | |||||||||
| ASSETS: |
148,760 | 2,587 | ||||||||||
| Financial assets held for trading |
80,378 | 1,191 | ||||||||||
| Loans and advances to credit institutions |
1,815 | — | Present Value Method |
Observable market data | ||||||||
| Loans and advances to customers (a) |
2,921 | — | Present Value Method |
Observable market data | ||||||||
| Debt and equity instruments |
1,768 | 85 | Present Value Method |
Observable market data, HPI | ||||||||
| Trading derivatives |
73,874 | 1,106 | ||||||||||
| Swaps |
55,794 | 116 | Present Value Method, Gaussian Copula (b) |
Observable market data, basis, liquidity | ||||||||
| Exchange rate options |
1,000 | — | Black-Scholes Model |
Observable market data, liquidity | ||||||||
| Interest rate options |
8,385 | 768 | Black’s Model, Heath-Jarrow-Morton Model |
Observable market data, liquidity, correlation | ||||||||
| Interest rate futures |
132 | — | Present Value Method |
Observable market data | ||||||||
| Index and securities options |
2,420 | 111 | Black-Scholes Model |
Observable market data, dividends, correlation, liquidity, HPI | ||||||||
| Other |
6,143 | 111 | Present Value Method, Monte Carlo simulation and other |
Observable market data and other | ||||||||
| Hedging derivatives |
7,320 | — | ||||||||||
| Swaps |
7,058 | — | Present Value Method |
Observable market data, basis | ||||||||
| Exchange rate options |
40 | — | Black-Scholes Model |
Observable market data | ||||||||
| Interest rate options |
28 | — | Black’s Model |
Observable market data | ||||||||
| Other |
194 | — | N/A |
N/A | ||||||||
| Other financial assets at fair value through profit or loss |
38,323 | 680 | ||||||||||
| Loans and advances to credit institutions |
28,592 | — | Present Value Method |
Observable market data | ||||||||
| Loans and advances to customers (c) |
8,892 | 78 | Present Value Method |
Observable market data, HPI | ||||||||
| Debt and equity instruments |
839 | 602 | Present Value Method |
Observable market data | ||||||||
| Available-for-sale financial assets |
22,739 | 716 | ||||||||||
| Debt and equity instruments |
22,739 | 716 | Present Value Method |
Observable market data | ||||||||
| LIABILITIES: |
161,890 | 552 | ||||||||||
| Financial liabilities held for trading |
91,847 | 536 | ||||||||||
| Deposits from central banks |
2,041 | — | Present Value Method |
Observable market data | ||||||||
| Deposits from credit institutions |
5,531 | — | Present Value Method |
Observable market data | ||||||||
| Customer deposits |
5,544 | — | Present Value Method |
Observable market data | ||||||||
| Debt and equity instruments |
— | — | Present Value Method |
Observable market data, liquidity | ||||||||
| Trading derivatives |
76,644 | 536 | ||||||||||
| Swaps |
56,586 | 49 | Present Value Method, Gaussian Copula (b) |
Observable market data, basis, liquidity, HPI | ||||||||
| Exchange rate options |
1,033 | — | Black-Scholes Model |
Observable market data, liquidity | ||||||||
| Interest rate options |
9,816 | 294 | Black’s Model, Heath-Jarrow-Morton Model |
Observable market data, liquidity, correlation | ||||||||
| Index and securities options |
3,499 | 193 | Black-Scholes Model |
Observable market data, dividends, correlation, liquidity, HPI | ||||||||
| Interest rate and equity futures |
165 | — | Present Value Method |
Observable market data | ||||||||
| Other |
5,545 | — | Present Value Method, Monte Carlo simulation and other |
Observable market data and other | ||||||||
| Short positions |
2,087 | — | Present Value Method |
Observable market data | ||||||||
| Hedging derivatives |
7,029 | — | ||||||||||
| Swaps |
6,901 | — | Present Value Method |
Observable market data, basis | ||||||||
| Exchange rate options |
2 | — | Black-Scholes Model |
Observable market data | ||||||||
| Interest rate options |
14 | — | Black’s Model |
Observable market data | ||||||||
| Other |
112 | — | N/A |
N/A | ||||||||
| Other financial liabilities at fair value through profit or loss |
62,301 | 16 | Present Value Method |
Observable market data | ||||||||
| Liabilities under insurance contracts |
713 | — | See Note 15 |
|||||||||
F-32
Table of Contents
| Millions of euros | ||||||||||||||||||
| Fair values calculated using internal models | ||||||||||||||||||
| 12/31/13 | 12/31/12 | |||||||||||||||||
| Level 2 | Level 3 | Level 2 | Level 3 | Valuation techniques | ||||||||||||||
| ASSETS: |
123,499 | 1,507 | 186,648 | 1,288 | ||||||||||||||
| Financial assets held for trading |
68,535 | 282 | 129,508 | 395 | ||||||||||||||
| Loans and advances to credit institutions |
5,502 | — | 9,843 | — | Present Value Method | |||||||||||||
| Loans and advances to customers (a) |
5,079 | — | 9,162 | — | Present Value Method | |||||||||||||
| Debt and equity instruments |
1,585 | 50 | 1,320 | — | Present Value Method | |||||||||||||
| Trading derivatives |
56,369 | 232 | 109,183 | 395 | ||||||||||||||
| Swaps |
40,380 | 56 | 90,759 | 109 | Present Value Method, Gaussian Copula (b) | |||||||||||||
| Exchange rate options |
849 | 16 | 708 | 46 | Black-Scholes Model | |||||||||||||
| Interest rate options |
7,375 | — | 9,141 | — | Black’s Model, Heath-Jarrow-Morton Model | |||||||||||||
| Interest rate futures |
16 | — | 78 | — | Present Value Method | |||||||||||||
| Index and securities options |
2,953 | 56 | 3,188 | — | Black-Scholes Model | |||||||||||||
| Other |
4,796 | 104 | 5,309 | 240 | Present Value Method, Monte Carlo simulation and other | |||||||||||||
| Hedging derivatives |
8,080 | — | 7,808 | — | ||||||||||||||
| Swaps |
6,920 | — | 7,609 | — | Present Value Method | |||||||||||||
| Exchange rate options |
400 | — | 43 | — | Black-Scholes Model | |||||||||||||
| Interest rate options |
24 | — | 36 | — | Black’s Model | |||||||||||||
| Other |
736 | — | 120 | — | N/A | |||||||||||||
| Other financial assets at fair value through profit or loss |
27,184 | 510 | 24,500 | 469 | ||||||||||||||
| Loans and advances to credit institutions |
13,444 | — | 10,272 | — | Present Value Method | |||||||||||||
| Loans and advances to customers (c) |
13,135 | 61 | 13,863 | 74 | Present Value Method | |||||||||||||
| Debt and equity instruments |
605 | 449 | 365 | 395 | Present Value Method | |||||||||||||
| Available-for-sale financial assets |
19,700 | 715 | 24,832 | 424 | ||||||||||||||
| Debt and equity instruments |
19,700 | 715 | 24,832 | 424 | Present Value Method | |||||||||||||
| LIABILITIES: |
128,762 | 105 | 180,243 | 205 | ||||||||||||||
| Financial liabilities held for trading |
79,970 | 60 | 127,158 | 99 | ||||||||||||||
| Deposits from central banks |
3,866 | — | 1,128 | — | Present Value Method | |||||||||||||
| Deposits from credit institutions |
7,468 | — | 8,292 | — | Present Value Method | |||||||||||||
| Customer deposits |
8,500 | — | 8,890 | 7 | Present Value Method | |||||||||||||
| Debt and equity instruments |
1 | — | 1 | — | Present Value Method | |||||||||||||
| Trading derivatives |
57,260 | 60 | 108,847 | 92 | ||||||||||||||
| Swaps |
41,156 | 2 | 88,450 | 8 | Present Value Method, Gaussian Copula (b) | |||||||||||||
| Exchange rate options |
660 | — | 766 | 6 | Black-Scholes Model | |||||||||||||
| Interest rate options |
8,457 | — | 10,772 | — | Black’s Model, Heath-Jarrow-Morton Model | |||||||||||||
| Index and securities options |
4,252 | — | 121 | — | Black-Scholes Model | |||||||||||||
| Interest rate and equity futures |
88 | — | 4,816 | — | Present Value Method | |||||||||||||
| Other |
2,647 | 58 | 3,922 | 78 | Present Value Method, Monte Carlo simulation and other | |||||||||||||
| Short positions |
2,875 | — | — | — | ||||||||||||||
| Hedging derivatives |
5,096 | — | 6,348 | — | Present Value Method | |||||||||||||
| Swaps |
4,961 | — | 5,860 | — | Present Value Method | |||||||||||||
| Exchange rate options |
1 | — | 76 | — | Black-Scholes Model | |||||||||||||
| Interest rate options |
13 | — | 17 | — | Black’s Model | |||||||||||||
| Other |
121 | — | 395 | — | N/A | |||||||||||||
| Other financial liabilities at fair value through profit or loss |
42,266 | 45 | 45,312 | 106 | ||||||||||||||
| Liabilities under insurance contracts |
1,430 | — | 1,425 | — | Present Value Method See Note 15 | |||||||||||||
| (a) | Includes mainly short-term loans and reverse repurchase agreements with corporate customers (mainly brokerage and investment companies). |
| (b) | Includes credit risk derivatives with a net fair value of EUR 83 million at December 31, 2014 (December 31, 2013 and 2012: positive net fair value of EUR 56 million and EUR 18 million, respectively). These assets and liabilities are measured using the Standard Gaussian Copula Model. |
| (c) | Includes home mortgage loans to financial institutions in the UK (which are regulated and partly financed by the Government). The fair value of these loans was obtained using observable market variables, including current market transactions with similar amounts and collateral facilitated by the UK Housing Association. Since the Government is involved in these financial institutions, the credit risk spreads have remained stable and are homogeneous in this sector. The results arising from the valuation model are checked against current market transactions. |
F-33
Table of Contents
The measurements obtained using the internal models might have been different had other methods or assumptions been used with respect to interest rate risk, to credit risk, market risk and foreign currency risk spreads, or to their related correlations and volatilities. Nevertheless, the Bank’s directors consider that the fair value of the financial assets and liabilities recognized in the consolidated balance sheet and the gains and losses arising from these financial instruments are reasonable.
The net gain recognized in the income statement for 2014 arising from the aforementioned valuation models amounted to EUR 206 million (2013 and 2012: net losses of EUR 298 million and EUR 229 million, respectively), of which EUR 302 million related to models whose significant inputs are unobservable market data (2013 and 2012: gains of EUR 46 million and EUR 20 million, respectively).
Level 3 financial instruments
Set forth below are the Group’s main financial instruments measured using unobservable market data that constitute significant inputs of the internal models (Level 3):
| • | Instruments in Santander UK’s portfolio (loans, debt instruments and derivatives) linked to the House Price Index (HPI). Even if the valuation techniques used for these instruments may be the same as those used to value similar products (present value in the case of loans and debt instruments, and the Black-Scholes model for derivatives), the main factors used in the valuation of these instruments are the HPI spot rate, the growth rate of that rate, its volatility and mortality rates, which are not always observable in the market and, accordingly, these instruments are considered illiquid. |
| • | The HPI spot rate: for some instruments the NSA HPI spot rate, which is directly observable and published on a monthly basis, is used. For other instruments where regional HPI rates must be used (published quarterly), adjustments are made to reflect the different composition of the rates and adapt them to the regional composition of Santander UK’s portfolio. |
| • | HPI growth rate: this is not always directly observable in the market, especially for long maturities, and is estimated in accordance with existing quoted prices. To reflect the uncertainty implicit in these estimates, adjustments are made based on an analysis of the historical volatility of the HPI, incorporating reversion to the mean. |
| • | HPI volatility: the long-term volatility is not directly observable in the market but is estimated on the basis of more short-term quoted prices and by making an adjustment to reflect the existing uncertainty, based on the standard deviation of historical volatility over various time periods. |
| • | Mortality rates: these are based on published official tables and adjusted to reflect the composition of the customer portfolio for this type of product at Santander UK. |
| • | Illiquid CDOs and CLOs in the portfolio of the treasury unit in Madrid. These are measured by grouping together the securities by type of underlying (sector/country), payment hierarchy (prime, mezzanine, junior, etc.), and assuming forecast conditional prepayment rates (CPR) and default rates, adopting conservative criteria. |
| • | Trading derivatives on baskets of shares. These are measured using advanced local and stochastic volatility models, using Monte Carlo simulations; the main unobservable input is the correlation between the prices of the shares in each basket in question. |
| • | Callable interest rate trading derivatives (Bermudan-style options) where the main unobservable input is mean reversion of interest rates. |
F-34
Table of Contents
With respect to 2013 year-end the Group reclassified to Level 3 the interest-rate derivatives with periodic call options and options on baskets of listed shares. The reason for the reclassification was the greater significance in the fair value of the aforementioned financial instruments of the illiquidity in the inputs used (the mean reversion of interest rates and the correlations between the underlyings, respectively). These products relate almost exclusively to derivatives transactions performed to serve the Group’s clients.
The table below shows the effect, at December 31, 2014, on the fair value of the main financial instruments classified as Level 3 of a reasonable change in the assumptions used in the valuation. This effect was determined by applying the probable valuation ranges of the main unobservable inputs detailed in the following table:
F-35
Table of Contents
| Portfolio/Instrument (Level 3) |
Valuation technique |
Main unobservable inputs |
Range | Weighted average |
Impacts (in millions of euros) | |||||||||||||
| Unfavorable scenario |
Favorable scenario |
|||||||||||||||||
| Financial assets held for trading |
||||||||||||||||||
| Debt instruments |
Partial differential equations |
Long-term volatility |
27% - 41% | 33.21 | % | (1.2 | ) | 0.9 | ||||||||||
| Trading derivatives |
Present Value Method |
Curves on TAB indices (*) |
(a) | (a | ) | (3 | ) | 3 | ||||||||||
| Present Value Method, Modified Black-Scholes Model |
HPI forward growth rate |
0%-5% | 2.6 | % | (37 | ) | 33 | |||||||||||
| Present Value Method, Modified Black-Scholes Model |
HPI spot rate |
n/a | 630 | (**) | (11 | ) | 12 | |||||||||||
| Standard Gaussian Copula Model |
Probability of default |
0%-5% | 2.14 | % | (10 | ) | 7 | |||||||||||
| Advanced local and stochastic volatility models |
Correlation between share prices |
55%-75% | 61 | % | (9.9 | ) | 9.9 | |||||||||||
| Advanced multi-factor interest rate models |
Mean reversion of interest rates |
0.0001-0.03 | 0.01 | (***) | — | 39.4 | ||||||||||||
| Other financial assets at fair value through profit or loss |
||||||||||||||||||
| Loans and advances to customers |
Weighted average by probability (according to forecast mortality rates) of European HPI options, using the Black-Scholes model |
HPI forward growth rate |
0%-5% | 2.8 | % | (7 | ) | 6 | ||||||||||
| Debt and equity instruments |
Weighted average by probability (according to forecast mortality rates) of HPI forwards, using the present value model |
HPI forward growth rate |
0%-5% | 2.6 | % | (53 | ) | 48 | ||||||||||
| Weighted average by probability (according to forecast mortality rates) of HPI forwards, using the present value model |
HPI spot rate |
n/a | 630 | (**) | (26 | ) | 26 | |||||||||||
| Available-for-sale financial assets |
||||||||||||||||||
| Debt and equity instruments |
Present Value Method, others |
Non-performing loans and prepayment ratios, cost of capital, long-term earnings growth rate |
(a) | (a | ) | (2.4 | ) | 2.4 | ||||||||||
| Financial liabilities held for trading |
||||||||||||||||||
| Trading derivatives |
Present Value Method, Modified Black-Scholes Model |
HPI forward growth rate |
0%-5% | 2.1 | % | (15 | ) | 12 | ||||||||||
| Present Value Method, Modified Black-Scholes Model |
HPI spot rate |
n/a | 607 | (**) | (21 | ) | 17 | |||||||||||
| Present Value Method, Modified Black-Scholes Model |
Curves on TAB indices (*) |
(a) | (a | ) | — | — | ||||||||||||
| Advanced local and stochastic volatility models |
Correlation between share prices |
55%-75% | 61 | % | (b | ) | (b | ) | ||||||||||
| Advanced multi-factor interest rate models |
Mean reversion of interest rates |
0.0001-0.03 | 0.01 | (***) | (b | ) | (b | ) | ||||||||||
| Other financial liabilities at fair value through profit or loss |
— | — | — | — | (b | ) | (b | ) | ||||||||||
| (*) | TAB: “Tasa Activa Bancaria” (Active Bank Rate). Average deposit interest rates (over 30, 90, 180 and 360 days) published by the Chilean Association of Banks and Financial Institutions (ABIF) in nominal currency (Chilean peso) and in real terms, adjusted for inflation (Unidad de Fomento - UF). |
| (**) | There are national and regional HPI indices. The HPI spot value is the weighted average of the indices that correspond to the positions of each portfolio. The impact reported is a change of 10%. |
| (***) | Theoretical average value of the parameter. The change arising on a favorable scenario is from 0.0001 to 0.03. An unfavorable scenario is not considered as there is insufficient margin for an adverse change from the current parameter level. The Group is also exposed, to a lesser extent, to this type of derivative in currencies other than the euro and, therefore, both the average and the range of the unobservable inputs are different. The impact in an unfavorable scenario would be losses of EUR 9.2 million. |
| (a) | The exercise was conducted for the unobservable inputs described in the Main unobservable inputs column under probable scenarios. The range and weighted average value used are not shown because the aforementioned exercise was conducted jointly for various inputs or variants thereof (e.g. the TAB input comprises vector-time curves, for which there are also nominal yield curves and inflation-indexed yield curves), and it was not possible to break down the results separately by type of input. In the case of the TAB curve the gain or loss is reported for changes of +/-100 basis points for the total sensitivity to this index in Chilean pesos and UFs. |
| (b) | The Group calculates the potential effect on the valuation of each of these instruments on a joint basis, irrespective of whether their individual valuation is positive (Asset) or negative (Liability), and the global effect associated with the corresponding instruments recognized on the asset side of the consolidated balance sheet is broken down. |
F-36
Table of Contents
Lastly, the changes in the financial instruments classified as Level 3 in 2014 and 2013 were as follows:
| 2013 | Changes | 2014 | ||||||||||||||||||||||||||||||||||||||||||
| Millions of euros |
Fair value calculated using internal models (Level 3) |
Purchases | Sales | Issues | Settlements | Changes in fair value recognized in profit or loss (unrealized) |
Changes in fair value recognized in profit or loss (realized) |
Changes in fair value recognized in equity |
Level reclassifications |
Other | Fair value calculated using internal models (Level 3) |
|||||||||||||||||||||||||||||||||
| Financial assets held for trading |
282 | 182 | (14 | ) | — | — | 174 | (7 | ) | — | 575 | (1 | ) | 1,191 | ||||||||||||||||||||||||||||||
| Debt and equity instruments |
50 | 4 | (1 | ) | — | — | — | — | — | 32 | — | 85 | ||||||||||||||||||||||||||||||||
| Trading derivatives |
232 | 178 | (13 | ) | — | — | 174 | (7 | ) | — | 543 | (1 | ) | 1,106 | ||||||||||||||||||||||||||||||
| Swaps |
56 | — | (2 | ) | — | — | (7 | ) | (7 | ) | — | 52 | 24 | 116 | ||||||||||||||||||||||||||||||
| Exchange rate options |
16 | — | — | — | — | — | — | — | — | (16 | ) | — | ||||||||||||||||||||||||||||||||
| Interest rate options |
— | 162 | (5 | ) | — | — | 257 | — | — | 359 | (5 | ) | 768 | |||||||||||||||||||||||||||||||
| Index and securities options |
56 | 16 | — | — | — | (100 | ) | — | — | 132 | 7 | 111 | ||||||||||||||||||||||||||||||||
| Other |
104 | — | (6 | ) | — | — | 24 | — | — | — | (11 | ) | 111 | |||||||||||||||||||||||||||||||
| Other financial assets at fair value through profit or loss |
510 | 37 | (5 | ) | — | — | 61 | — | — | 90 | (13 | ) | 680 | |||||||||||||||||||||||||||||||
| Loans and advances to customers |
61 | — | (5 | ) | — | — | 18 | — | — | — | 4 | 78 | ||||||||||||||||||||||||||||||||
| Debt and equity instruments |
449 | 37 | — | — | — | 43 | — | — | 90 | (17 | ) | 602 | ||||||||||||||||||||||||||||||||
| Available-for-sale financial assets |
715 | 35 | (55 | ) | — | (36 | ) | — | — | (35 | ) | 78 | 14 | 716 | ||||||||||||||||||||||||||||||
| TOTAL ASSETS |
1,507 | 254 | (74 | ) | — | (36 | ) | 235 | (7 | ) | (35 | ) | 743 | — | 2,587 | |||||||||||||||||||||||||||||
| Financial assets held for trading |
60 | 48 | (6 | ) | — | — | (71 | ) | (2 | ) | — | 503 | 4 | 536 | ||||||||||||||||||||||||||||||
| Trading derivatives |
60 | 48 | (6 | ) | — | — | (71 | ) | (2 | ) | — | 503 | 4 | 536 | ||||||||||||||||||||||||||||||
| Swaps |
2 | — | — | — | — | 2 | (2 | ) | — | 47 | — | 49 | ||||||||||||||||||||||||||||||||
| Interest rate options |
— | 41 | — | — | — | 56 | — | — | 197 | — | 294 | |||||||||||||||||||||||||||||||||
| Index and securities options |
— | 7 | (6 | ) | — | — | (128 | ) | — | — | 259 | 61 | 193 | |||||||||||||||||||||||||||||||
| Other |
58 | — | — | — | — | (1 | ) | — | — | — | (57 | ) | — | |||||||||||||||||||||||||||||||
| Other financial liabilities at fair value through profit or loss |
45 | — | (26 | ) | — | — | (1 | ) | — | — | — | (2 | ) | 16 | ||||||||||||||||||||||||||||||
| TOTAL LIABILITIES |
105 | 48 | (32 | ) | — | — | (72 | ) | (2 | ) | — | 503 | 2 | 552 | ||||||||||||||||||||||||||||||
F-37
Table of Contents
| 2012 | Changes | 2013 | ||||||||||||||||||||||||||||||||||||||
| Millions of euros |
Fair value calculated using internal models (Level 3) |
Purchases | Sales | Issues | Settlements | Changes in fair value recognized in profit or loss (unrealized) |
Changes in fair value recognized in profit or loss (realized) |
Changes in fair value recognized in equity |
Other | Fair value calculated using internal models (Level 3) |
||||||||||||||||||||||||||||||
| Financial assets held for trading |
395 | 131 | (164 | ) | — | (44 | ) | (4 | ) | 2 | — | (34 | ) | 282 | ||||||||||||||||||||||||||
| Debt and equity instruments |
— | 46 | — | — | — | 8 | — | — | (4 | ) | 50 | |||||||||||||||||||||||||||||
| Trading derivatives |
395 | 85 | (164 | ) | — | (44 | ) | (12 | ) | 2 | — | (30 | ) | 232 | ||||||||||||||||||||||||||
| Swaps |
109 | — | (62 | ) | — | — | 19 | — | — | (10 | ) | 56 | ||||||||||||||||||||||||||||
| Exchange rate options |
46 | — | (1 | ) | — | — | (8 | ) | (3 | ) | — | (18 | ) | 16 | ||||||||||||||||||||||||||
| Index and securities options |
— | 85 | — | — | (39 | ) | — | — | — | 10 | 56 | |||||||||||||||||||||||||||||
| Other |
240 | — | (101 | ) | — | (5 | ) | (23 | ) | 5 | — | (12 | ) | 104 | ||||||||||||||||||||||||||
| Hedging derivatives |
— | — | — | — | — | — | — | — | — | — | ||||||||||||||||||||||||||||||
| Swaps |
— | — | — | — | — | — | — | — | — | — | ||||||||||||||||||||||||||||||
| Other financial assets at fair value through profit or loss |
469 | 111 | (32 | ) | — | (17 | ) | 18 | 9 | — | (48 | ) | 510 | |||||||||||||||||||||||||||
| Loans and advances to customers |
74 | — | — | — | (11 | ) | (8 | ) | 6 | — | — | 61 | ||||||||||||||||||||||||||||
| Debt and equity instruments |
395 | 111 | (32 | ) | — | (6 | ) | 26 | 3 | — | (48 | ) | 449 | |||||||||||||||||||||||||||
| Available-for-sale financial assets |
424 | 277 | (48 | ) | — | — | (1 | ) | (2 | ) | 73 | (8 | ) | 715 | ||||||||||||||||||||||||||
| TOTAL ASSETS |
1,288 | 519 | (244 | ) | — | (61 | ) | 13 | 9 | 73 | (89 | ) | 1,507 | |||||||||||||||||||||||||||
| Financial liabilities held for trading |
99 | — | (18 | ) | — | (14 | ) | (11 | ) | 13 | — | (9 | ) | 60 | ||||||||||||||||||||||||||
| Customer deposits |
7 | — | — | — | — | — | — | — | (7 | ) | — | |||||||||||||||||||||||||||||
| Trading derivatives |
92 | — | (18 | ) | — | (14 | ) | (11 | ) | 13 | — | (2 | ) | 60 | ||||||||||||||||||||||||||
| Swaps |
8 | — | (6 | ) | — | — | (1 | ) | — | — | 1 | 2 | ||||||||||||||||||||||||||||
| Exchange rate options |
6 | — | (6 | ) | — | — | — | — | — | — | — | |||||||||||||||||||||||||||||
| Other |
78 | — | (6 | ) | — | (14 | ) | (10 | ) | 13 | — | (3 | ) | 58 | ||||||||||||||||||||||||||
| Other financial liabilities at fair value through profit or loss |
106 | — | (42 | ) | — | — | (14 | ) | (12 | ) | — | 7 | 45 | |||||||||||||||||||||||||||
| TOTAL LIABILITIES |
205 | — | (60 | ) | — | (14 | ) | (25 | ) | 1 | — | (2 | ) | 105 | ||||||||||||||||||||||||||
F-38
Table of Contents
| iv. | Recognition of fair value changes |
As a general rule, changes in the carrying amount of financial assets and liabilities are recognized in the consolidated income statement. A distinction is made between the changes resulting from the accrual of interest and similar items, which are recognized under Interest and similar income or Interest expense and similar charges, as appropriate, and those arising for other reasons, which are recognized at their net amount under Gains/losses on financial assets and liabilities (net).
Adjustments due to changes in fair value arising from:
| • | Available-for-sale financial assets are recognized temporarily under Valuation adjustments - Available-for-sale financial assets, unless they relate to exchange differences, in which case they are recognized in equity under Valuation adjustments - Exchange differences (net), or to exchange differences arising on monetary financial assets, in which case they are recognized in Exchange differences (net) in the consolidated income statement. |
| • | Items charged or credited to Valuation adjustments - Available-for-sale financial assets and Valuation adjustments - Exchange differences (net) in equity remain in the Group’s consolidated equity until the asset giving rise to them is impaired or derecognized , at which time they are recognized in the consolidated income statement. |
| • | Unrealized gains on available-for-sale financial assets classified as Non-current assets held for sale because they form part of a disposal group or a discontinued operation are recognized in equity under Valuation adjustments - Non-current assets held for sale. |
| v. | Hedging transactions |
The consolidated entities use financial derivatives for the following purposes: i) to facilitate these instruments to customers who request them in the management of their market and credit risks; ii) to use these derivatives in the management of the risks of the Group entities’ own positions and assets and liabilities (hedging derivatives); and iii) to obtain gains from changes in the prices of these derivatives (trading derivatives).
Financial derivatives that do not qualify for hedge accounting are treated for accounting purposes as trading derivatives.
A derivative qualifies for hedge accounting if all the following conditions are met:
| 1. | The derivative hedges one of the following three types of exposure: |
| a. | Changes in the fair value of assets and liabilities due to fluctuations, among others, in the interest rate and/or exchange rate to which the position or balance to be hedged is subject (fair value hedge); |
| b. | Changes in the estimated cash flows arising from financial assets and liabilities, commitments and highly probable forecast transactions (cash flow hedge); |
| c. | The net investment in a foreign operation (hedge of a net investment in a foreign operation). |
| 2. | It is effective in offsetting exposure inherent in the hedged item or position throughout the expected term of the hedge, which means that: |
| a. | At the date of arrangement the hedge is expected, under normal conditions, to be highly effective (prospective effectiveness). |
F-39
Table of Contents
| b. | There is sufficient evidence that the hedge was actually effective during the whole life of the hedged item or position (retrospective effectiveness). To this end, the Group checks that the results of the hedge were within a range of 80% to 125% of the results of the hedged item. |
| 3. | There must be adequate documentation evidencing the specific designation of the financial derivative to hedge certain balances or transactions and how this hedge was expected to be achieved and measured, provided that this is consistent with the Group’s management of own risks. |
The changes in value of financial instruments qualifying for hedge accounting are recognized as follows:
| a. | In fair value hedges, the gains or losses arising on both the hedging instruments and the hedged items attributable to the type of risk being hedged are recognized directly in the consolidated income statement. |
In fair value hedges of interest rate risk on a portfolio of financial instruments, the gains or losses that arise on measuring the hedging instruments are recognized directly in the consolidated income statement, whereas the gains or losses due to changes in the fair value of the hedged amount (attributable to the hedged risk) are recognized in the consolidated income statement with a balancing entry under Changes in the fair value of hedged items in portfolio hedges of interest rate risk on the asset or liability side of the balance sheet, as appropriate.
| b. | In cash flow hedges, the effective portion of the change in value of the hedging instrument is recognized temporarily in equity under Valuation adjustments - Cash flow hedges until the forecast transactions occur, when it is recognized in the consolidated income statement, unless, if the forecast transactions result in the recognition of non-financial assets or liabilities, it is included in the cost of the non-financial asset or liability. |
| c. | In hedges of a net investment in a foreign operation, the gains or losses attributable to the portion of the hedging instruments qualifying as an effective hedge are recognized temporarily in equity under Valuation adjustments - Hedges of net investments in foreign operations until the gains or losses on the hedged item are recognized in the income statement. |
| d. | The ineffective portion of the gains and losses on the hedging instruments of cash flow hedges and hedges of a net investment in a foreign operation are recognized directly under Gains/losses on financial assets and liabilities (net) in the consolidated income statement. |
If a derivative designated as a hedge no longer meets the requirements described above due to expiration, ineffectiveness or for any other reason, the derivative is classified for accounting purposes as a trading derivative.
When fair value hedge accounting is discontinued, the adjustments previously recognized on the hedged item are transferred to profit or loss at the effective interest rate re-calculated at the date of hedge discontinuation. The adjustments must be fully amortized at maturity.
When cash flow hedges are discontinued, any cumulative gain or loss on the hedging instrument recognized in equity under Valuation adjustments (from the period when the hedge was effective) remains in this equity item until the forecast transaction occurs, at which time it is recognized in profit or loss, unless the transaction is no longer expected to occur, in which case the cumulative gain or loss is recognized immediately in profit or loss.
F-40
Table of Contents
vi. Derivatives embedded in hybrid financial instruments
Derivatives embedded in other financial instruments or in other host contracts are accounted for separately as derivatives if their risks and characteristics are not closely related to those of the host contracts, provided that the host contracts are not classified as Other financial assets/liabilities at fair value through profit or loss or as Financial assets/liabilities held for trading.
| e) | Derecognition of financial assets and liabilities |
The accounting treatment of transfers of financial assets depends on the extent to which the risks and rewards associated with the transferred assets are transferred to third parties:
| 1. | If the Group transfers substantially all the risks and rewards to third parties -unconditional sale of financial assets, sale of financial assets under an agreement to repurchase them at their fair value at the date of repurchase, sale of financial assets with a purchased call option or written put option that is deeply out of the money, securitization of assets in which the transferor does not retain a subordinated debt or grant any credit enhancement to the new holders, and other similar cases-, the transferred financial asset is derecognized and any rights or obligations retained or created in the transfer are recognized simultaneously. |
| 2. | If the Group retains substantially all the risks and rewards associated with the transferred financial asset -sale of financial assets under an agreement to repurchase them at a fixed price or at the sale price plus interest, a securities lending agreement in which the borrower undertakes to return the same or similar assets, and other similar cases-, the transferred financial asset is not derecognized and continues to be measured by the same criteria as those used before the transfer. However, the following items are recognized: |
| a. | An associated financial liability, which is recognized for an amount equal to the consideration received and is subsequently measured at amortized cost, unless it meets the requirements for classification under Other financial liabilities at fair value through profit or loss. |
| b. | The income from the transferred financial asset not derecognized and any expense incurred on the new financial liability, without offsetting. |
| 3. | If the Group neither transfers nor retains substantially all the risks and rewards associated with the transferred financial asset -sale of financial assets with a purchased call option or written put option that is not deeply in or out of the money, securitization of assets in which the transferor retains a subordinated debt or other type of credit enhancement for a portion of the transferred asset, and other similar cases-the following distinction is made: |
| a. | If the transferor does not retain control of the transferred financial asset, the asset is derecognized and any rights or obligations retained or created in the transfer are recognized . |
| b. | If the transferor retains control of the transferred financial asset, it continues to recognize it for an amount equal to its exposure to changes in value and recognizes a financial liability associated with the transferred financial asset. The net carrying amount of the transferred asset and the associated liability is the amortized cost of the rights and obligations retained, if the transferred asset is measured at amortized cost, or the fair value of the rights and obligations retained, if the transferred asset is measured at fair value. |
Accordingly, financial assets are only derecognized when the rights on the cash flows they generate have been extinguished or when substantially all the inherent risks and rewards have been transferred to third parties. Similarly, financial liabilities are only derecognized when the obligations they generate have been extinguished or when they are acquired with the intention either to cancel them or to resell them.
F-41
Table of Contents
| f) | Offsetting of financial instruments |
Financial asset and liability balances are offset, i.e. reported in the consolidated balance sheet at their net amount, only if the Group entities currently have a legally enforceable right to set off the recognized amounts and intend either to settle on a net basis, or to realize the asset and settle the liability simultaneously.
Following is the detail of financial assets and liabilities that were offset in the consolidated balance sheets as at December 31, 2014 and 2013:
| December 31, 2014 | ||||||||||||
| Millions of euros | ||||||||||||
| Assets |
Gross amount of financial assets |
Gross amount of financial liabilities offset in the balance sheet |
Net amount of financial assets presented in the balance sheet |
|||||||||
| Derivatives |
128,076 | (43,872 | ) | 84,204 | ||||||||
| Reverse repurchase agreements |
57,882 | (7,064 | ) | 50,818 | ||||||||
|
|
|
|
|
|
|
|||||||
| Total |
185,958 | (50,936 | ) | 135,022 | ||||||||
|
|
|
|
|
|
|
|||||||
| December 31, 2013 | ||||||||||||
| Millions of euros | ||||||||||||
| Assets |
Gross amount of financial assets |
Gross amount of financial liabilities offset in the balance sheet |
Net amount of financial assets presented in the balance sheet |
|||||||||
| Derivatives |
86,813 | (19,613 | ) | 67,200 | ||||||||
| Reverse repurchase agreements |
59,990 | (12,463 | ) | 47,527 | ||||||||
|
|
|
|
|
|
|
|||||||
| Total |
146,803 | (32,076 | ) | 114,727 | ||||||||
|
|
|
|
|
|
|
|||||||
F-42
Table of Contents
| December 31, 2014 | ||||||||||||
| Millions of euros | ||||||||||||
| Liabilities |
Gross amount of financial liabilities |
Gross amount of financial assets offset in the balance sheet |
Net amount of financial liabilities presented in the balance sheet |
|||||||||
| Derivatives |
130,175 | (43,872 | ) | 86,303 | ||||||||
| Repurchase agreements |
113,075 | (7,064 | ) | 106,011 | ||||||||
|
|
|
|
|
|
|
|||||||
| Total |
243,250 | (50,936 | ) | 192,314 | ||||||||
|
|
|
|
|
|
|
|||||||
| December 31, 2013 | ||||||||||||
| Millions of euros | ||||||||||||
| Liabilities |
Gross amount of financial liabilities |
Gross amount of financial assets offset in the balance sheet |
Net amount of financial liabilities presented in the balance sheet |
|||||||||
| Derivatives |
83,783 | (19,613 | ) | 64,170 | ||||||||
| Repurchase agreements |
103,621 | (12,463 | ) | 91,158 | ||||||||
|
|
|
|
|
|
|
|||||||
| Total |
187,404 | (32,076 | ) | 155,328 | ||||||||
|
|
|
|
|
|
|
|||||||
Also, the Group has offset other items for EUR 2,084 million (December 31, 2013: EUR 2,267 million).
Most of the derivatives and repos not offset in the balance sheet are subject to netting and collateral arrangements.
| g) | Impairment of financial assets |
| i. | Definition |
A financial asset is considered to be impaired -and therefore its carrying amount is adjusted to reflect the effect of impairment- when there is objective evidence that events have occurred which:
| • | In the case of debt instruments (loans and debt securities), give rise to an adverse impact on the future cash flows that were estimated at the transaction date. |
| • | In the case of equity instruments, mean that their carrying amount may not be fully recovered. |
As a general rule, the carrying amount of impaired financial instruments is adjusted with a charge to the consolidated income statement for the period in which the impairment becomes evident, and the reversal, if any, of previously recognized impairment losses is recognized in the consolidated income statement for the period in which the impairment is reversed or reduced.
F-43
Table of Contents
Balances are deemed to be non-performing, and the interest accrual is suspended, when there are reasonable doubts as to their full recovery and/or the collection of the related interest for the amounts and on the dates initially agreed upon, after taking into account the guarantees received by the consolidated entities to secure (fully or partially) collection of the related balances. Collections relating to non-performing loans and advances are used to recognize the accrued interest and the remainder, if any, to reduce the principal amount outstanding.
Transactions classified as non-performing due to arrears are reclassified as standard if, as a result of the collection of a portion or the sum of the unpaid instalments, the reasons for classifying such transactions as non-performing cease to exist, i.e. they no longer have any amount more than three months past due, unless other subjective reasons remain for classifying them as non-performing. The refinancing of non-performing loans does not result in their reclassification to standard unless: there is certainty that the customer can make payment in accordance with the new schedule; the customer provides effective guarantees or collateral; the customer pays the current interest receivable; and the customer complies with the established cure period (see Note 54).
The following constitute effective guarantees or collateral: collateral in the form of cash deposits; quoted equity instruments and debt securities issued by creditworthy issuers; mortgages on completed housing, offices and multi-purpose premises and on rural property, net of any prior charges; and personal guarantees (bank guarantees, inclusion of new obligors, etc.) which entail the direct and joint liability of the new guarantors to the customer, these being persons or entities whose solvency is sufficiently demonstrated so as to ensure the full repayment of the transaction on the agreed terms.
The balances relating to impaired transactions continue to be recognized on the balance sheet, for their full amounts, until the Group considers that the recovery of those amounts is remote.
The Group considers recovery to be remote when there has been a substantial and irreversible deterioration of the borrower’s solvency, when commencement of the liquidation phase of insolvency proceedings has been ordered or when more than four years have elapsed since the borrower’s transaction was classified as non-performing due to arrears (the maximum period established by the Bank of Spain).
When the recovery of a financial asset is considered remote, it is charged-off, together with the related allowance, without prejudice to any actions that the consolidated entities may initiate to seek collection until their contractual rights are extinguished due to expiry of the statute-of-limitations period, forgiveness or any other cause.
| ii. | Debt instruments carried at amortized cost |
For the purpose of determining impairment losses, the Group monitors its debtors as described below:
| • | Individually for significant debt instruments and for instruments which, although not material, are not susceptible to being classified in a group of financial assets with similar credit risk characteristics -customers classified by the Group as “individualized”. This category includes wholesale banking enterprises, financial institutions and certain retail banking enterprises. |
| • | Collectively, in all other cases -customers classified by the Group as “standardized”-, by grouping together instruments having similar credit risk characteristics indicative of the debtors’ ability to pay all principal and interest amounts in accordance with the contractual terms. The credit risk characteristics considered for the purpose of grouping the assets are, inter alia, instrument type, debtor’s industry and geographical location, type of guarantee or collateral, age of past-due amounts and any other relevant factor for the estimation of future cash flows. This category includes exposures to individuals, individual traders and retail banking enterprises not classified as individualized customers. |
F-44
Table of Contents
As regards impairment losses resulting from materialization of the insolvency risk of the obligors (credit risk), a debt instrument is impaired due to insolvency:
| • | When there is evidence of a deterioration of the obligor’s ability to pay, either because it is in arrears or for other reasons, and/or |
| • | When country risk materializes: country risk is considered to be the risk associated with debtors resident in a given country due to circumstances other than normal commercial risk. |
The Group has certain policies, methods and procedures for covering its credit risk arising both from insolvency allocable to counterparties and from country risk. These policies, methods and procedures are applied in the granting, examination and documentation of debt instruments and contingent liabilities and commitments, and in the identification of their impairment and the calculation of the amounts required to cover the related credit risk.
With respect to the coverage of loss arising from credit risk, the Group must meet the Bank of Spain requirements, which establish that, until the Spanish regulatory authority has verified and approved the internal models for the calculation of the allowance for losses arising from credit risk (to date it has only approved the internal models to be used to calculate regulatory capital), entities must calculate their credit risk coverage as set forth below:
| a. | Specific allowance (individuals): |
The allowance for debt instruments not measured at fair value through profit or loss that are classified as non-performing is generally recognized in accordance with the criteria set forth below:
| i. | Assets classified as non-performing due to counterparty arrears: |
Debt instruments, whoever the obligor and whatever the guarantee or collateral, with amounts more than three months past due are assessed individually, taking into account the age of the past-due amounts, the guarantees or collateral provided and the financial situation of the counterparty and the guarantors.
| ii. | Assets classified as non-performing for reasons other than counterparty arrears: |
Debt instruments which are not classifiable as non-performing due to arrears but for which there are reasonable doubts as to their repayment under the contractual terms are assessed individually, and their allowance is the difference between the amount recognized in assets and the present value of the cash flows expected to be received.
| b. | General allowance for inherent losses (collective): |
Based on its experience and on the information available to it on the Spanish banking industry, the Bank of Spain has established various categories of debt instruments and contingent liabilities, classified as standard risk, which are recognized at Spanish entities or relate to transactions performed on behalf of residents in Spain which are recognized in the accounting records of foreign subsidiaries, and has applied a range of required allowances to each category.
F-45
Table of Contents
| c. | Country risk allowance: |
Country risk is considered to be the risk associated with counterparties resident in a given country due to circumstances other than normal commercial risk (sovereign risk, transfer risk and risks arising from international financial activity). Based on the countries’ economic performance, political situation, regulatory and institutional framework, and payment capacity and record, the Group classifies all the transactions performed with third parties into six different groups, from group 1 (transactions with ultimate obligors resident in European Union countries, Norway, Switzerland, Iceland, the United States, Canada, Japan, Australia and New Zealand) to group 6 (transactions the recovery of which is considered remote due to circumstances attributable to the country), assigning to each group the credit loss allowance percentages resulting from the aforementioned analyses. However, due to the size of the Group and to the proactive management of its country risk exposure, the allowances recognized in this connection are not material with respect to the credit loss allowances recognized .
However, the coverage of the Group’s losses arising from credit risk must also meet the requirements of IFRSs and, therefore, the Group checks the allowances for credit losses calculated as described above with those obtained from internal models for the calculation of the coverage of losses arising from credit risk in order to confirm that there are no material differences.
The Group’s internal models determine the impairment losses on debt instruments not measured at fair value through profit or loss and on contingent liabilities taking into account the historical experience of impairment and other circumstances known at the time of assessment. For these purposes, impairment losses on loans are losses incurred at the reporting date, calculated using statistical methods.
The amount of an impairment loss incurred on these debt instruments is equal to the difference between their carrying amount and the present value of their estimated future cash flows. In estimating the future cash flows of debt instruments the following factors are taken into account:
| • | All the amounts that are expected to be obtained over the remaining life of the instrument, including, where appropriate, those which may result from the collateral provided for the instrument (less the costs for obtaining and subsequently selling the collateral). The impairment loss takes into account the likelihood of collecting accrued past-due interest receivable; |
| • | The various types of risk to which each instrument is subject; and |
| • | The circumstances in which collections will foreseeably be made. |
These cash flows are subsequently discounted using the instrument’s effective interest rate (if its contractual rate is fixed) or the effective contractual rate at the discount date (if it is variable).
The loss incurred is calculated by multiplying three factors: exposure at default, probability of default and loss given default. These parameters are also used to calculate economic capital and to calculate BIS II regulatory capital under internal models (see Note 1.e).
| • | Exposure at default (EAD) is the amount of risk exposure at the date of default by the counterparty. |
| • | Probability of default (PD) is the probability of the counterparty failing to meet its principal and/or interest payment obligations. The probability of default is associated with the rating/scoring of each counterparty/transaction. |
F-46
Table of Contents
For the purpose of calculating the incurred loss, PD is measured using a time horizon of one year; i.e. it quantifies the probability of the counterparty defaulting in the coming year due to an event that had already occurred at the assessment date. The definition of default used includes amounts past due by 90 days or more and cases in which there is no default but there are doubts as to the solvency of the counterparty (subjective non-performing assets).
| • | Loss given default (LGD) is the loss arising in the event of default. It depends mainly on discounting of the guarantees associated with the transaction and the future flows that are expected to be recovered. |
In addition to all of the above, the calculation of the incurred loss takes into account the adjustment to the cycle of the aforementioned factors (PD and LGD) and historical experience and other specific information that reflects current conditions.
At December 31, 2014, the estimated losses arising from credit risk calculated by the Group’s internal models did not differ materially from the allowances calculated on the basis of the Bank of Spain’s requirements.
| iii. | Debt or equity instruments classified as available for sale |
The amount of the impairment losses on these instruments is the positive difference between their acquisition cost (net of any principal repayment or amortization in the case of debt instruments) and their fair value, less any impairment loss previously recognized in the consolidated income statement.
When there is objective evidence at the date of measurement of these instruments that the aforementioned differences are due to permanent impairment, they are no longer recognized in equity under Valuation adjustments - Available-for-sale financial assets and are reclassified, for the cumulative amount at that date, to the consolidated income statement.
If all or part of the impairment losses are subsequently reversed, the reversed amount is recognized , in the case of debt instruments, in the consolidated income statement for the year in which the reversal occurs (or in equity under Valuation adjustments - Available-for-sale financial assets in the case of equity instruments).
| iv. | Equity instruments carried at cost |
The amount of the impairment losses on equity instruments carried at cost is the difference between the carrying amount and the present value of the expected future cash flows discounted at the market rate of return for similar securities.
Impairment losses are recognized in the consolidated income statement for the period in which they arise as a direct reduction of the cost of the instrument. These losses can only be reversed subsequently if the related assets are sold.
| h) | Repurchase agreements and reverse repurchase agreements |
Purchases (sales) of financial instruments under a non-optional resale (repurchase) agreement at a fixed price (repos) are recognized in the consolidated balance sheet as financing granted (received), based on the nature of the debtor (creditor), under Balances with central banks, Loans and advances to credit institutions or Loans and advances to customers (Deposits from central banks, Deposits from credit institutions or Customer deposits).
Differences between the purchase and sale prices are recognized as interest over the contract term.
F-47
Table of Contents
| i) | Non-current assets held for sale and Liabilities associated with non-current assets held for sale |
Non-current assets held for sale includes the carrying amount of individual items, disposal groups or items forming part of a business unit earmarked for disposal (discontinued operations), whose sale in their present condition is highly likely to be completed within one year from the reporting date. Therefore, the carrying amount of these items -which can be of a financial nature or otherwise- will foreseeably be recovered through the proceeds from their disposal.
Specifically, property or other non-current assets received by the consolidated entities as total or partial settlement of their debtors’ payment obligations to them are deemed to be non-current assets held for sale, unless the consolidated entities have decided to make continuing use of these assets. In this connection, for the purpose of its consideration in the initial recognition of these assets, the Group obtains, at the foreclosure date, the fair value of the related asset through a request for appraisal by external appraisal agencies.
The Group has in place a corporate policy that ensures the professional competence and the independence and objectivity of the external appraisal agencies, in accordance with the regulations, which require appraisal agencies to meet independence, neutrality and credibility requirements, so that the use of their estimates does not reduce the reliability of its valuations. This policy establishes that all the appraisal companies and agencies with which the Group works in Spain should be registered in the Official Register of the Bank of Spain and that the appraisals performed by them should follow the methodology established in Ministry of Economy Order ECO/805/2003, of March 27. The main appraisal companies and agencies with which the Group worked in Spain in 2014 are as follows: Eurovaloraciones, S.A., Ibertasa, S.A., Tinsa Tasaciones Inmobiliarias, S.A.U., Tasaciones Hipotecarias Renta, S.A., Krata, S.A. and Compañía Hispania de Tasaciones y Valoraciones, S.A. Also, this policy establishes that the various subsidiaries abroad work with appraisal companies that have recent experience in the area and the type of asset under appraisal and meet the independence requirements established in the corporate policy. They should verify, inter alia, that the appraisal company is not a party related to the Group and that its billings to the Group in the last twelve months do not exceed 15% of the appraisal company’s total billings.
Liabilities associated with non-current assets held for sale includes the balances payable arising from the assets held for sale or disposal groups and from discontinued operations.
Non-current assets held for sale are generally measured at the lower of fair value less costs to sell and their carrying amount at the date of classification in this category. Non-current assets held for sale are not depreciated as long as they remain in this category.
Subsequent to initial recognition, the Group measures its non-current assets at the lower of their fair value less costs to sell and their carrying amount. The Group measures foreclosed property assets located in Spain by taking into consideration the appraisal value on the date of foreclosure and the length of time each asset has been recognized in the balance sheet. Property assets under construction are measured taking into account the current situation of the property, not the final value. In addition, in order to check at the end of each reporting period that the measurement made using the aforementioned criteria does not differ from fair value, the Group requests an independent expert to perform an appraisal.
Impairment losses on an asset or disposal group arising from a reduction in its carrying amount to its fair value (less costs to sell) are recognized under Gains/(losses) on non-current assets held for sale not classified as discontinued operations in the consolidated income statement. The gains on a non-current asset held for sale resulting from subsequent increases in fair value (less costs to sell) increase its carrying amount and are recognized in the consolidated income statement up to an amount equal to the impairment losses previously recognized .
F-48
Table of Contents
| j) | Reinsurance assets and Liabilities under insurance contracts |
Insurance contracts involve the transfer of a certain quantifiable risk in exchange for a periodic or one-off premium. The effects on the Group’s cash flows will arise from a deviation in the payments forecast and/or an insufficiency in the premium set.
The Group controls its insurance risk as follows:
| • | By applying a strict methodology in the launch of products and in the assignment of value thereto. |
| • | By using deterministic and stochastic actuarial models for measuring commitments. |
| • | By using reinsurance as a risk mitigation technique as part of the credit quality guidelines in line with the Group’s general risk policy. |
| • | By establishing an operating framework for credit risks. |
| • | By actively managing asset and liability matching. |
| • | By applying security measures in processes. |
Reinsurance assets includes the amounts that the consolidated entities are entitled to receive for reinsurance contracts with third parties and, specifically, the reinsurer’s share of the technical provisions recorded by the consolidated insurance entities.
At least once a year these assets are reviewed to ascertain whether they are impaired (i.e. there is objective evidence, as a result of an event that occurred after initial recognition of the reinsurance asset, that the Group may not receive all amounts due to it under the terms of the contract and the amount that will not be received can be reliably measured), and any impairment loss is recognized in the consolidated income statement and the assets are written down.
Liabilities under insurance contracts includes the technical provisions recorded by the consolidated entities to cover claims arising from insurance contracts in force at year-end.
Insurers’ results relating to their insurance business are recognized , according to their nature, under the related consolidated income statement items.
In accordance with standard accounting practice in the insurance industry, the consolidated insurance entities credit to the income statement the amounts of the premiums written and charge to income the cost of the claims incurred on final settlement thereof. Insurance entities are therefore required to accrue at period-end the unearned revenues credited to their income statements and the accrued costs not charged to income.
At least at each reporting date the Group assesses whether the insurance contract liabilities recognized in the consolidated balance sheet are adequate. For this purpose, it calculates the difference between the following amounts:
| • | Current estimates of future cash flows under the insurance contracts of the consolidated entities. These estimates include all contractual cash flows and any related cash flows, such as claims handling costs; and |
F-49
Table of Contents
| • | The carrying amount recognized in the consolidated balance sheet of its insurance contract liabilities (see Note 15), less any related deferred acquisition costs or related intangible assets, such as the amount paid to acquire, in the event of purchase by the entity, the economic rights held by a broker deriving from policies in the entity’s portfolio. |
If the calculation results in a positive amount, this deficiency is charged to the consolidated income statement. When unrealized gains or losses on assets of the Group’s insurance companies affect the measurement of liabilities under insurance contracts and/or the related deferred acquisition costs and/or the related intangible assets, these gains or losses are recognized directly in equity. The corresponding adjustment in the liabilities under insurance contracts (or in the deferred acquisition costs or in intangible assets) is also recognized in equity.
The most significant items forming part of the technical provisions (see Note 15) are detailed below:
| • | Non-life insurance provisions: |
| i) | Provision for unearned premiums: relates to the portion of the premiums received at year-end that is allocable to the period from the reporting date to the end of the policy cover period. |
| ii) | Provision for unexpired risks: this supplements the provision for unearned premiums to the extent that the amount of the latter is not sufficient to reflect all the assessed risks and expenses to be covered by the insurance companies in the policy period not elapsed at the reporting date. |
| • | Life insurance provisions: represent the value of the net obligations acquired vis-à-vis life insurance policyholders. These provisions include: |
| i) | Provision for unearned premiums and unexpired risks: this relates to the portion of the premiums received at year-end that is allocable to the period from the reporting date to the end of the policy cover period. |
| ii) | Mathematical provisions: these relate to the value of the insurance companies’ obligations, net of the policyholders’ obligations. These provisions are calculated on a policy-by-policy basis using an individual capitalization system, taking as a basis for the calculation the premium accrued in the year, and in accordance with the technical bases of each type of insurance updated, where appropriate, by the local mortality tables. |
| • | Provision for claims outstanding: this reflects the total obligations outstanding arising from claims incurred prior to the reporting date. This provision is calculated as the difference between the total estimated or certain cost of the claims not yet reported, settled or paid and all the amounts already paid in relation to such claims. |
| • | Provision for bonuses and rebates: this provision includes the amount of the bonuses accruing to policyholders, insureds or beneficiaries and that of any premiums to be returned to policyholders or insureds, to the extent that such amounts have not been assigned at the reporting date. These amounts are calculated on the basis of the conditions of the related individual policies. |
| • | Technical provisions for life insurance policies where the investment risk is borne by the policyholders: these provisions are calculated on the basis of the indices established as a reference to determine the economic value of the policyholders’ rights. |
F-50
Table of Contents
| k) | Tangible assets |
Tangible assets includes the amount of buildings, land, furniture, vehicles, computer hardware and other fixtures owned by the consolidated entities or acquired under finance leases. Tangible assets are classified by use as follows:
| i. | Property, plant and equipment for own use |
Property, plant and equipment for own use –including tangible assets received by the consolidated entities in full or partial satisfaction of financial assets representing receivables from third parties which are intended to be held for continuing use and tangible assets acquired under finance leases– are presented at acquisition cost, less the related accumulated depreciation and any estimated impairment losses (carrying amount higher than recoverable amount).
Depreciation is calculated, using the straight-line method, on the basis of the acquisition cost of the assets less their residual value. The land on which the buildings and other structures stand has an indefinite life and, therefore, is not depreciated.
The period tangible asset depreciation charge is recognized in the consolidated income statement and is calculated using the following depreciation rates (based on the average years of estimated useful life of the various assets):
| Average annual rate |
||||
| Buildings for own use |
2.0 | % | ||
| Furniture |
7.7 | % | ||
| Fixtures |
7.0 | % | ||
| Office and IT equipment |
25.0 | % | ||
| Leasehold improvements |
7.0 | % | ||
The consolidated entities assess at the reporting date whether there is any indication that an asset may be impaired (i.e. its carrying amount exceeds its recoverable amount). If this is the case, the carrying amount of the asset is reduced to its recoverable amount and future depreciation charges are adjusted in proportion to the revised carrying amount and to the new remaining useful life (if the useful life has to be re-estimated).
Similarly, if there is an indication of a recovery in the value of a tangible asset, the consolidated entities recognize the reversal of the impairment loss recognized in prior periods and adjust the future depreciation charges accordingly. In no circumstances may the reversal of an impairment loss on an asset raise its carrying amount above that which it would have if no impairment losses had been recognized in prior years.
The estimated useful lives of the items of property, plant and equipment for own use are reviewed at least at the end of the reporting period with a view to detecting significant changes therein. If changes are detected, the useful lives of the assets are adjusted by correcting the depreciation charge to be recognized in the consolidated income statement in future years on the basis of the new useful lives.
Upkeep and maintenance expenses relating to property, plant and equipment for own use are recognized as an expense in the period in which they are incurred, since they do not increase the useful lives of the assets.
F-51
Table of Contents
| ii. | Investment property |
Investment property reflects the net values of the land, buildings and other structures held either to earn rentals or for capital appreciation.
The criteria used to recognize the acquisition cost of investment property, to calculate its depreciation and its estimated useful life and to recognize any impairment losses thereon are consistent with those described in relation to property, plant and equipment for own use.
| iii. | Assets leased out under an operating lease |
Property, plant and equipment - Leased out under an operating lease reflects the amount of the tangible assets, other than land and buildings, leased out by the Group under an operating lease.
The criteria used to recognize the acquisition cost of assets leased out under operating leases, to calculate their depreciation and their respective estimated useful lives and to recognize the impairment losses thereon are consistent with those described in relation to property, plant and equipment for own use.
| l) | Accounting for leases |
| i. | Finance leases |
Finance leases are leases that transfer substantially all the risks and rewards incidental to ownership of the leased asset to the lessee.
When the consolidated entities act as the lessors of an asset, the sum of the present value of the lease payments receivable from the lessee, including the exercise price of the lessee’s purchase option at the end of the lease term when such exercise price is sufficiently below fair value at the option date such that it is reasonably certain that the option will be exercised, is recognized as lending to third parties and is therefore included under Loans and receivables in the consolidated balance sheet.
When the consolidated entities act as the lessees, they present the cost of the leased assets in the consolidated balance sheet, based on the nature of the leased asset, and, simultaneously, recognize a liability for the same amount (which is the lower of the fair value of the leased asset and the sum of the present value of the lease payments payable to the lessor plus, if appropriate, the exercise price of the purchase option). The depreciation policy for these assets is consistent with that for property, plant and equipment for own use.
In both cases, the finance income and finance charges arising under finance lease agreements are credited and debited, respectively, to Interest and similar income and Interest expense and similar charges in the consolidated income statement so as to produce a constant rate of return over the lease term.
| ii. | Operating leases |
In operating leases, ownership of the leased asset and substantially all the risks and rewards incidental thereto remain with the lessor.
When the consolidated entities act as the lessors, they present the acquisition cost of the leased assets under Tangible assets (see Note 16). The depreciation policy for these assets is consistent with that for similar items of property, plant and equipment for own use, and income from operating leases is recognized on a straight-line basis under Other operating income in the consolidated income statement.
F-52
Table of Contents
When the consolidated entities act as the lessees, the lease expenses, including any incentives granted by the lessor, are charged on a straight-line basis to Other general administrative expenses in their consolidated income statements.
| iii. | Sale and leaseback transactions |
In sale and leaseback transactions where the sale is at fair value and the leaseback is an operating lease, any profit or loss is recognized at the time of sale. In the case of finance leasebacks, any profit or loss is amortized over the lease term.
In accordance with IAS 17, in determining whether a sale and leaseback transaction results in an operating lease, the Group should analyze, inter alia, whether at the inception of the lease there are purchase options whose terms and conditions make it reasonably certain that they will be exercised, and to whom the gains or losses from the fluctuations in the fair value of the residual value of the related asset will accrue.
| m) | Intangible assets |
Intangible assets are identifiable non-monetary assets (separable from other assets) without physical substance which arise as a result of a legal transaction or which are developed internally by the consolidated entities. Only assets whose cost can be estimated reliably and from which the consolidated entities consider it probable that future economic benefits will be generated are recognized.
Intangible assets are recognized initially at acquisition or production cost and are subsequently measured at cost less any accumulated amortization and any accumulated impairment losses.
| i. | Goodwill |
Any excess of the cost of the investments in the consolidated entities and entities accounted for using the equity method over the corresponding underlying carrying amounts acquired, adjusted at the date of first-time consolidation, is allocated as follows:
| • | If it is attributable to specific assets and liabilities of the companies acquired, by increasing the value of the assets (or reducing the value of the liabilities) whose fair values were higher (lower) than the carrying amounts at which they had been recognized in the acquired entities’ balance sheets. |
| • | If it is attributable to specific intangible assets, by recognizing it explicitly in the consolidated balance sheet provided that the fair value of these assets within twelve months following the date of acquisition can be measured reliably. |
| • | The remaining amount is recognized as goodwill, which is allocated to one or more cash-generating units (a cash-generating unit is the smallest identifiable group of assets that, as a result of continuing operation, generates cash inflows that are largely independent of the cash inflows from other assets or groups of assets). The cash-generating units represent the Group’s geographical and/or business segments. |
Goodwill is only recognized when it has been acquired for consideration and represents, therefore, a payment made by the acquirer in anticipation of future economic benefits from assets of the acquired entity that are not capable of being individually identified and separately recognized .
At the end of each reporting period or whenever there is any indication of impairment goodwill is reviewed for impairment (i.e. a reduction in its recoverable amount to below its carrying amount) and, if there is any impairment, the goodwill is written down with a charge to Impairment losses on other assets (net)—Goodwill and other intangible assets in the consolidated income statement.
F-53
Table of Contents
An impairment loss recognized for goodwill is not reversed in a subsequent period.
| ii. | Other intangible assets |
Other intangible assets includes the amount of identifiable intangible assets (such as purchased customer lists and computer software).
Other intangible assets can have an indefinite useful life -when, based on an analysis of all the relevant factors, it is concluded that there is no foreseeable limit to the period over which the asset is expected to generate net cash inflows for the consolidated entities- or a finite useful life, in all other cases.
Intangible assets with indefinite useful lives are not amortized, but rather at the end of each reporting period or whenever there is any indication of impairment the consolidated entities review the remaining useful lives of the assets in order to determine whether they continue to be indefinite and, if this is not the case, to take the appropriate steps.
Intangible assets with finite useful lives are amortized over those useful lives using methods similar to those used to depreciate tangible assets.
The intangible asset amortization charge is recognized under Depreciation and amortization in the consolidated income statement.
In both cases the consolidated entities recognize any impairment loss on the carrying amount of these assets with a charge to Impairment losses on other assets (net) in the consolidated income statement. The criteria used to recognize the impairment losses on these assets and, where applicable, the reversal of impairment losses recognized in prior years are similar to those used for tangible assets (see Note 2.k).
Internally developed computer software
Internally developed computer software is recognized as an intangible asset if, among other requisites (basically the Group’s ability to use or sell it), it can be identified and its ability to generate future economic benefits can be demonstrated.
Expenditure on research activities is recognized as an expense in the year in which it is incurred and cannot be subsequently capitalized.
| n) | Other assets |
Other assets in the consolidated balance sheet includes the amount of assets not recorded in other items, the breakdown being as follows:
| • | Inventories: this item includes the amount of assets, other than financial instruments, that are held for sale in the ordinary course of business, that are in the process of production, construction or development for such purpose, or that are to be consumed in the production process or in the provision of services. Inventories includes land and other property held for sale in the property development business. |
F-54
Table of Contents
Inventories are measured at the lower of cost and net realizable value, which is the estimated selling price of the inventories in the ordinary course of business, less the estimated costs of completion and the estimated costs required to make the sale.
Any write-downs of inventories -such as those due to damage, obsolescence or reduction of selling price- to net realizable value and other impairment losses are recognized as expenses for the year in which the impairment or loss occurs. Subsequent reversals are recognized in the consolidated income statement for the year in which they occur.
The carrying amount of inventories is derecognized and recognized as an expense in the period in which the revenue from their sale is recognized.
| • | Other: this item includes the balance of all prepayments and accrued income (excluding accrued interest, fees and commissions), the net amount of the difference between pension plan obligations and the value of the plan assets with a balance in the entity’s favor, when this net amount is to be reported in the consolidated balance sheet, and the amount of any other assets not included in other items. |
| ñ) | Other liabilities |
Other liabilities includes the balance of all accrued expenses and deferred income, excluding accrued interest, and the amount of any other liabilities not included in other categories.
| o) | Provisions and contingent assets and liabilities |
When preparing the financial statements of the consolidated entities, the Bank’s directors made a distinction between:
| • | Provisions: credit balances covering present obligations at the reporting date arising from past events which could give rise to a loss for the consolidated entities, which is considered to be likely to occur and certain as to its nature but uncertain as to its amount and/or timing. |
| • | Contingent liabilities: possible obligations that arise from past events and whose existence will be confirmed only by the occurrence or non-occurrence of one or more future events not wholly within the control of the consolidated entities. They include the present obligations of the consolidated entities when it is not probable that an outflow of resources embodying economic benefits will be required to settle them. |
| • | Contingent assets: possible assets that arise from past events and whose existence is conditional on, and will be confirmed only by, the occurrence or non-occurrence of events beyond the control of the Group. Contingent assets are not recognized in the consolidated balance sheet or in the consolidated income statement, but rather are disclosed in the notes, provided that it is probable that these assets will give rise to an increase in resources embodying economic benefits. |
The Group’s consolidated financial statements include all the material provisions with respect to which it is considered that it is more likely than not that the obligation will have to be settled. In accordance with accounting standards, contingent liabilities must not be recognized in the consolidated financial statements, but must rather be disclosed in the notes.
Provisions, which are quantified on the basis of the best information available on the consequences of the event giving rise to them and are reviewed and adjusted at the end of each year, are used to cater for the specific obligations for which they were originally recognized . Provisions are fully or partially reversed when such obligations cease to exist or are reduced.
F-55
Table of Contents
Provisions are classified according to the obligations covered as follows (see Note 25):
| • | Provision for pensions and similar obligations: includes the amount of all the provisions made to cover post-employment benefits, including obligations to pre-retirees and similar obligations. |
| • | Provisions for contingent liabilities and commitments: includes the amount of the provisions made to cover contingent liabilities -defined as those transactions in which the Group guarantees the obligations of a third party, arising as a result of financial guarantees granted or contracts of another kind- and contingent commitments -defined as irrevocable commitments that may give rise to the recognition of financial assets. |
| • | Provisions for taxes and other legal contingencies and Other provisions: include the amount of the provisions recognized to cover tax and legal contingencies and litigation and the other provisions recognized by the consolidated entities. Other provisions includes, inter alia, any provisions for restructuring costs and environmental measures. |
| p) | Court proceedings and/or claims in process |
In addition to the disclosures made in Note 1, at the end of 2014 certain court proceedings and claims were in process against the consolidated entities arising from the ordinary course of their operations (see Note 25).
| q) | Own equity instruments |
Own equity instruments are those meeting both of the following conditions:
| • | The instruments do not include any contractual obligation for the issuer: (i) to deliver cash or another financial asset to a third party; or (ii) to exchange financial assets or financial liabilities with a third party under conditions that are potentially unfavorable to the issuer. |
| • | The instruments will or may be settled in the issuer’s own equity instruments and are: (i) a non-derivative that includes no contractual obligation for the issuer to deliver a variable number of its own equity instruments; or (ii) a derivative that will be settled by the issuer through the exchange of a fixed amount of cash or another financial asset for a fixed number of its own equity instruments. |
Transactions involving own equity instruments, including their issuance and cancellation, are deducted directly from equity.
Changes in the value of instruments classified as own equity instruments are not recognized in the consolidated financial statements. Consideration received or paid in exchange for such instruments, including the coupons on preference shares contingently convertible into ordinary shares, is directly added to or deducted from equity.
| r) | Equity-instrument-based employee remuneration |
Own equity instruments delivered to employees in consideration for their services, if the instruments are delivered once the specific period of service has ended, are recognized as an expense for services (with the corresponding increase in equity) as the services are rendered by employees during the service period. At the grant date the services received (and the related increase in equity) are measured at the fair value of the equity instruments granted. If the equity instruments granted are vested immediately, the Group recognizes in full, at the grant date, the expense for the services received.
F-56
Table of Contents
When the requirements stipulated in the remuneration agreement include external market conditions (such as equity instruments reaching a certain quoted price), the amount ultimately to be recognized in equity will depend on the other conditions being met by the employees (normally length of service requirements), irrespective of whether the market conditions are satisfied. If the conditions of the agreement are met but the external market conditions are not satisfied, the amounts previously recognized in equity are not reversed, even if the employees do not exercise their right to receive the equity instruments.
| s) | Recognition of income and expenses |
The most significant criteria used by the Group to recognize its income and expenses are summarized as follows:
| i. | Interest income, interest expenses and similar items |
Interest income, interest expenses and similar items are generally recognized on an accrual basis using the effective interest method. Dividends received from other companies are recognized as income when the consolidated entities’ right to receive them arises.
However, the recognition of accrued interest in the consolidated income statement is suspended for debt instruments individually classified as impaired and for the instruments for which impairment losses have been assessed collectively because they have payments more than three months past due. Any interest that may have been recognized in the consolidated income statement before the corresponding debt instruments were classified as impaired, and that had not been collected at the date of that classification, is considered when determining the allowance for loan losses; accordingly, if subsequently collected, this interest is recognized as a reversal of the related impairment losses. Interest whose recognition in the consolidated income statement has been suspended is accounted for as interest income, when collected, on a cash basis.
| ii. | Commissions, fees and similar items |
Fee and commission income and expenses are recognized in the consolidated income statement using criteria that vary according to their nature. The main criteria are as follows:
| • | Fee and commission income and expenses relating to financial assets and financial liabilities measured at fair value through profit or loss are recognized when paid. |
| • | Those arising from transactions or services that are performed over a period of time are recognized over the life of these transactions or services. |
| • | Those relating to services provided in a single act are recognized when the single act is carried out. |
| iii. | Non-finance income and expenses |
These are recognized for accounting purposes on an accrual basis.
| iv. | Deferred collections and payments |
These are recognized for accounting purposes at the amount resulting from discounting the expected cash flows at market rates.
F-57
Table of Contents
| v. | Loan arrangement fees |
Loan arrangement fees, mainly loan origination, application and information fees, are accrued and recognized in income over the term of the loan. In the case of loan origination fees, the portion relating to the associated direct costs incurred in the loan arrangement is recognized immediately in the consolidated income statement.
| t) | Financial guarantees |
Financial guarantees are defined as contracts whereby an entity undertakes to make specific payments on behalf of a third party if the latter fails to do so, irrespective of the various legal forms they may have, such as guarantees, insurance policies or credit derivatives.
The Group initially recognizes the financial guarantees provided on the liability side of the consolidated balance sheet at fair value, which is generally the present value of the fees, commissions and interest receivable from these contracts over the term thereof, and simultaneously the Group recognizes the amount of the fees, commissions and similar interest received at the inception of the transactions and a credit on the asset side of the consolidated balance sheet for the present value of the fees, commissions and interest outstanding.
Financial guarantees, regardless of the guarantor, instrumentation or other circumstances, are reviewed periodically so as to determine the credit risk to which they are exposed and, if appropriate, to consider whether a provision is required. The credit risk is determined by application of criteria similar to those established for quantifying impairment losses on debt instruments carried at amortized cost (described in Note 2.g above).
The provisions made for these transactions are recognized under Provisions—Provisions for contingent liabilities and commitments in the consolidated balance sheet (see Note 25). These provisions are recognized and reversed with a charge or credit, respectively, to Provisions (net) in the consolidated income statement.
If a specific provision is required for financial guarantees, the related unearned commissions recognized under Financial liabilities at amortized cost - Other financial liabilities in the consolidated balance sheet are reclassified to the appropriate provision.
| u) | Assets under management and investment and pension funds managed by the Group |
Assets owned by third parties and managed by the consolidated entities are not presented on the face of the consolidated balance sheet. Management fees are included in Fee and commission income in the consolidated income statement.
The investment funds and pension funds managed by the consolidated entities are not presented on the face of the Group’s consolidated balance sheet since the related assets are owned by third parties. The fees and commissions earned in the year for the services rendered by the Group entities to these funds (asset management and custody services) are recognized under Fee and commission income in the consolidated income statement.
Note 2.b.iv describes the internal criteria and procedures used to determine whether control exists over the structured entities, which include, inter alia, investment funds and pension funds.
F-58
Table of Contents
| v) | Post-employment benefits |
Under the collective agreements currently in force and other arrangements, the Spanish banks included in the Group and certain other Spanish and foreign consolidated entities have undertaken to supplement the public social security system benefits accruing to certain employees, and to their beneficiary right holders, for retirement, permanent disability or death, and the post-employment welfare benefits.
The Group’s post-employment obligations to its employees are deemed to be defined contribution plans when the Group makes pre-determined contributions (recognized under Personnel expenses in the consolidated income statement) to a separate entity and will have no legal or effective obligation to make further contributions if the separate entity cannot pay the employee benefits relating to the service rendered in the current and prior periods. Post-employment obligations that do not meet the aforementioned conditions are classified as defined benefit plans (see Note 25).
Defined contribution plans
The contributions made in this connection in each year are recognized under Personnel expenses in the consolidated income statement. The amounts not yet contributed at each year-end are recognized , at their present value, under Provisions - Provision for pensions and similar obligations on the liability side of the consolidated balance sheet.
Defined benefit plans
The Group recognizes under Provisions - Provision for pensions and similar obligations on the liability side of the consolidated balance sheet (or under Other assets on the asset side, as appropriate) the present value of its defined benefit post-employment obligations, net of the fair value of the plan assets.
Plan assets are defined as those that will be directly used to settle obligations and that meet the following conditions:
| • | They are not owned by the consolidated entities, but by a legally separate third party that is not a party related to the Group. |
| • | They are only available to pay or fund post-employment benefits and they cannot be returned to the consolidated entities unless the assets remaining in the plan are sufficient to meet all the benefit obligations of the plan and of the entity to current and former employees, or they are returned to reimburse employee benefits already paid by the Group. |
If the Group can look to an insurer to pay part or all of the expenditure required to settle a defined benefit obligation, and it is practically certain that said insurer will reimburse some or all of the expenditure required to settle that obligation, but the insurance policy does not qualify as a plan asset, the Group recognizes its right to reimbursement -which, in all other respects, is treated as a plan asset- under Insurance contracts linked to pensions on the asset side of the consolidated balance sheet.
Post-employment benefits are recognized as follows:
| • | Service cost is recognized in the consolidated income statement and includes the following items: |
| • | Current service cost, i.e. the increase in the present value of the obligations resulting from employee service in the current period, is recognized under Personnel expenses. |
F-59
Table of Contents
| • | The past service cost, which arises from changes to existing post-employment benefits or from the introduction of new benefits and includes the cost of reductions, is recognized under Provisions (net). |
| • | Any gain or loss arising from plan settlements is recognized under Provisions (net). |
| • | Net interest on the net defined benefit liability (asset), i.e. the change during the period in the net defined benefit liability (asset) that arises from the passage of time, is recognized under Interest expense and similar charges (Interest and similar income if it constitutes income) in the consolidated income statement. |
| • | The remeasurement of the net defined benefit liability (asset) is recognized in equity under Valuation adjustments and includes: |
| • | Actuarial gains and losses generated in the year, arising from the differences between the previous actuarial assumptions and what has actually occurred and from the effects of changes in actuarial assumptions. |
| • | The return on plan assets, excluding amounts included in net interest on the net defined benefit liability (asset). |
| • | Any change in the effect of the asset ceiling, excluding amounts included in net interest on the net defined benefit liability (asset). |
| w) | Other long-term employee benefits |
Other long-term employee benefits, defined as obligations to pre-retirees -taken to be those who have ceased to render services at the entity but who, without being legally retired, continue to have economic rights vis-à-vis the entity until they acquire the legal status of retiree-, long-service bonuses, obligations for death of spouse or disability before retirement that depend on the employee’s length of service at the entity and other similar items, are treated for accounting purposes, where applicable, as established above for defined benefit post-employment plans, except that actuarial gains and losses are recognized under Provisions (net) in the consolidated income statement (see Note 25).
| x) | Termination benefits |
Termination benefits are recognized when there is a detailed formal plan identifying the basic changes to be made, provided that implementation of the plan has begun, its main features have been publicly announced or objective facts concerning its implementation have been disclosed.
| y) | Income tax |
The expense for Spanish income tax and other similar taxes applicable to the foreign consolidated entities is recognized in the consolidated income statement, except when it results from a transaction recognized directly in equity, in which case the tax effect is also recognized in equity.
The current income tax expense is calculated as the sum of the current tax resulting from application of the appropriate tax rate to the taxable profit for the year (net of any deductions allowable for tax purposes), and of the changes in deferred tax assets and liabilities recognized in the consolidated income statement.
Deferred tax assets and liabilities include temporary differences, which are identified as the amounts expected to be payable or recoverable on differences between the carrying amounts of assets and liabilities and their related tax bases, and tax loss and tax credit carryforwards. These amounts are measured at the tax rates that are expected to apply in the period when the asset is realized or the liability is settled.
F-60
Table of Contents
Tax assets includes the amount of all tax assets, which are broken down into current -amounts of tax to be recovered within the next twelve months- and deferred -amounts of tax to be recovered in future years, including those arising from tax loss or tax credit carryforwards.
Tax liabilities includes the amount of all tax liabilities (except provisions for taxes), which are broken down into current -the amount payable in respect of the income tax on the taxable profit for the year and other taxes in the next twelve months- and deferred -the amount of income tax payable in future years.
Deferred tax liabilities are recognized in respect of taxable temporary differences associated with investments in subsidiaries, associates or joint ventures, except when the Group is able to control the timing of the reversal of the temporary difference and, in addition, it is probable that the temporary difference will not reverse in the foreseeable future.
Deferred tax assets are only recognized for temporary differences to the extent that it is considered probable that the consolidated entities will have sufficient future taxable profits against which the deferred tax assets can be utilized, and the deferred tax assets do not arise from the initial recognition (except in a business combination) of other assets and liabilities in a transaction that affects neither taxable profit nor accounting profit. Other deferred tax assets (tax loss and tax credit carryforwards) are only recognized if it is considered probable that the consolidated entities will have sufficient future taxable profits against which they can be utilized.
Income and expenses recognized directly in equity are accounted for as temporary differences.
The deferred tax assets and liabilities are reassessed at the reporting date in order to ascertain whether any adjustments need to be made on the basis of the findings of the analyses performed.
| z) | Residual maturity periods and average interest rates |
The analysis of the maturities of the balances of certain items in the consolidated balance sheet and the average interest rates at the end of the reporting periods is provided in Note 51.
aa) Consolidated statements of cash flows
The following terms are used in the consolidated statements of cash flows with the meanings specified:
| • | Cash flows: inflows and outflows of cash and cash equivalents, which are short-term, highly liquid investments that are subject to an insignificant risk of changes in value, irrespective of the portfolio in which they are classified. |
The Group classifies as cash and cash equivalents the balances recognized under Cash and balances with central banks in the consolidated balance sheet.
| • | Operating activities: the principal revenue-producing activities of credit institutions and other activities that are not investing or financing activities. |
| • | Investing activities: the acquisition and disposal of long-term assets and other investments not included in cash and cash equivalents. |
| • | Financing activities: activities that result in changes in the size and composition of the equity and liabilities that are not operating activities. |
F-61
Table of Contents
ab) Consolidated statements of recognized income and expense
This statement presents the income and expenses generated by the Group as a result of its business activity in the year, and a distinction is made between the income and expenses recognized in the consolidated income statement for the year and the other income and expenses recognized directly in consolidated equity.
Accordingly, this statement presents:
| a. | Consolidated profit for the year. |
| b. | The net amount of the income and expenses recognized temporarily in consolidated equity under Valuation adjustments. |
| c. | The net amount of the income and expenses recognized definitively in consolidated equity. |
| d. | The income tax incurred in respect of the items indicated in b) and c) above, except for the valuation adjustments arising from investments in associates or jointly controlled entities accounted for using the equity method, which are presented net. |
| e. | Total consolidated recognized income and expense, calculated as the sum of a) to d) above, presenting separately the amount attributable to the Parent and the amount relating to non-controlling interests. |
The amount of the income and expenses relating to entities accounted for using the equity method recognized directly in equity is presented in this statement, irrespective of the nature of the related items, under Entities accounted for using the equity method.
The statement presents the items separately by nature, grouping together items that, in accordance with the applicable accounting standards, will not be reclassified subsequently to profit and loss since the requirements established by the corresponding accounting standards are met.
ac) Statements of changes in total equity
This statement presents all the changes in equity, including those arising from changes in accounting policies and from the correction of errors. Accordingly, this statement presents a reconciliation of the carrying amount at the beginning and end of the year of all the consolidated equity items, and the changes are grouped together on the basis of their nature into the following items:
| a. | Adjustments due to changes in accounting policies and to errors: include the changes in consolidated equity arising as a result of the retrospective restatement of the balances in the consolidated financial statements, distinguishing between those resulting from changes in accounting policies and those relating to the correction of errors. |
| b. | Income and expense recognized in the year: includes, in aggregate form, the total of the aforementioned items recognized in the consolidated statement of recognized income and expense. |
| c. | Other changes in equity: includes the remaining items recognized in equity, including, inter alia, increases and decreases in capital, distribution of profit, transactions involving own equity instruments, equity-instrument-based payments, transfers between equity items and any other increases or decreases in consolidated equity. |
F-62
Table of Contents
| 3. | Santander Group |
| a) | Banco Santander, S.A. and international Group structure |
The growth of the Group in the last decade has led the Bank to also act, in practice, as a holding entity of the shares of the various companies in its Group, and its results are becoming progressively less representative of the performance and earnings of the Group. Therefore, each year the Bank determines the amount of the dividends to be distributed to its shareholders on the basis of the consolidated net profit, while maintaining the Group’s traditionally high level of capitalization and taking into account that the transactions of the Bank and of the rest of the Group are managed on a consolidated basis (notwithstanding the allocation to each company of the related net worth effect).
At international level, the various banks and other subsidiaries, jointly controlled entities and associates of the Group are integrated in a corporate structure comprising various holding companies which are the ultimate shareholders of the banks and subsidiaries abroad.
The purpose of this structure, all of which is controlled by the Bank, is to optimize the international organization from the strategic, economic, financial and tax standpoints, since it makes it possible to define the most appropriate units to be entrusted with acquiring, selling or holding stakes in other international entities, the most appropriate financing method for these transactions and the most appropriate means of remitting the profits obtained by the Group’s various operating units to Spain.
The Appendices provide relevant data on the consolidated Group companies and on the companies accounted for using the equity method.
| b) | Acquisitions and disposals |
Following is a summary of the main acquisitions and disposals of ownership interests in the share capital of other entities and other significant corporate transactions performed by the Group in the last three years:
i. Colombia
In December 2011 the Group entered into an agreement with the Chilean group Corpbanca to sell its shareholding in Banco Santander Colombia S.A. and its other business subsidiaries in this country (Santander Investment Valores Colombia S.A., Comisionista de Bolsa Comercial; Santander Investment Colombia S.A.; Santander Investment Trust Colombia S.A., Sociedad Fiduciaria and Agencia de Seguros Santander, Ltda.).
Following the obtainment of the regulatory authorizations from the competent authorities and the delisting of the shares of Banco Santander Colombia S.A., in the second quarter of 2012 the Group sold its shareholding in Banco Santander Colombia S.A. and its other business subsidiaries in this country to the Corpbanca Group for a total of USD 1,229 million (EUR 983 million), giving rise to a gain of EUR 619 million which was recognized by the Group under Gains/(losses) on disposal of assets not classified as non-current assets held for sale in the consolidated income statement for 2012 (see Note 49).
F-63
Table of Contents
ii. Grupo Financiero Santander México, S.A.B. de C.V.
In August 2012 the Group announced its intention to file prospectuses with the Mexican National Banking and Securities Commission (CNBV) and the US Securities and Exchange Commission for the placement of shares of the subsidiary Grupo Financiero Santander México, S.A.B. de C.V. in the secondary market.
The public offering for 1,469,402,029 series B shares of Grupo Financiero Santander México, S.A.B. de C.V. was completed on September 26, 2012. The transaction was made up of a Mexican tranche, consisting of shares, and an international tranche, including the United States, consisting of American Depositary Shares (ADSs) representing five shares each.
The share placement was priced at MXN 31.25 (USD 2.437) per share.
Also, the underwriters involved in the offering were granted an option, exercisable before October 25, to purchase an additional 220,410,304 shares.
Once the global offering had been completed and the underwriters had exercised their options, the percentage sold was 24.9%, which gave rise to increases of EUR 1,092 million in Reserves, EUR 1,493 million in Non-controlling interests and EUR 263 million in Valuation adjustments—Exchange differences in 2012.
iii. Bank Zachodni WBK S.A.
In August 2012 Bank Zachodni WBK S.A. performed a capital increase amounting to PLN 332 million (EUR 81 million) which was not subscribed by the Group, giving rise to reductions of EUR 12 million in Reserves and EUR 5 million in Valuation adjustments, and to an increase of EUR 93 million in Non-controlling interests, considering the Group’s effective ownership interest in the entity. Following the aforementioned transaction, the Group held 94.23% of the entity’s share capital.
iv. Merger of Bank Zachodni WBK S.A. and Kredyt Bank S.A.
On February 28, 2012, the Group announced that Banco Santander, S.A. and KBC Bank NV (KBC) had entered into an investment agreement to merge their two subsidiaries in Poland, Bank Zachodni WBK S.A. and Kredyt Bank S.A., respectively, following which the Group would control approximately 76.5% of the entity resulting from the merger and KBC 16.4%, with the remaining 7.1% being owned by non-controlling interests. Also, the Group undertook to place a portion of its ownership interest among investors and to acquire up to 5% of the entity resulting from the merger in order to help KBC to reduce its holding in the merged entity to below 10%. KBC’s objective is to dispose of its entire investment in order to maximize its value.
It was agreed to carry out the transaction through a capital increase at Bank Zachodni WBK S.A., whose new shares would be offered to KBC and the other shareholders of Kredyt Bank S.A. in exchange for their shares in Kredyt Bank S.A. The related exchange ratio was established at 6.96 shares of Bank Zachodni S.A. for every 100 shares of Kredyt Bank S.A.
In the first few days of 2013, following obtainment of the related authorization from the Polish financial regulator (KNF), the aforementioned transaction was carried out. As a result, the Group controlled approximately 75.2% of the post-merger entity and KBC controlled approximately 16.2%, with the remaining 8.6% being owned by non-controlling interests. This transaction gave rise to an increase of EUR 1,037 million in Non-controlling interests – EUR 169 million as a result of the acquisition of control of Kredyt Bank S.A. and EUR 868 million as a result of the reduction in the percentage of ownership of Bank Zachodni WBK S.A.
F-64
Table of Contents
The detail of the fair values of the identifiable assets acquired and liabilities assumed at the business combination date, the cost of the investment and the goodwill is as follows:
| Millions of euros |
||||
| Cash and balances with central banks |
351 | |||
| Loans and receivables - Loans and advances to customers (*) |
6,767 | |||
| Available-for-sale assets |
2,547 | |||
| Other assets (**) |
692 | |||
|
|
|
|||
| Total assets |
10,357 | |||
|
|
|
|||
| Deposits from credit institutions |
1,414 | |||
| Customer deposits |
7,620 | |||
| Other liabilities |
642 | |||
|
|
|
|||
| Total liabilities |
9,676 | |||
|
|
|
|||
| Net asset value |
681 | |||
|
|
|
|||
| Non-controlling interests |
(169 | ) | ||
|
|
|
|||
| Cost of investment |
838 | |||
|
|
|
|||
| Goodwill at January 2013 (***) |
326 | |||
|
|
|
|||
| (*) | EUR 122 million of additional impairment losses were considered in estimating the fair value of the loans and receivables. |
| (**) | The estimate identified intangible assets amounting to EUR 51 million. |
| (***) | Belongs to the Bank Zachodni WBK S.A. cash-generating unit (see Note 17). |
On March 22, 2013, Banco Santander, S.A. and KBC completed the placement of all the shares owned by KBC and 5.2% of the share capital of Bank Zachodni WBK S.A. held by the Group in the market for EUR 285 million, which gave rise to an increase of EUR 292 million in Non-controlling interests.
Following these transactions, the Group held 70% of the share capital of Bank Zachodni WBK S.A. and the remaining 30% was held by non-controlling interests.
v. Agreement to purchase Royal Bank of Scotland branch offices
In August 2010 Santander UK plc announced that it had entered into an agreement to acquire the portion of the banking business carried on by Royal Bank of Scotland (RBS) through its branches in England and Wales and the NatWest network in Scotland, as well as certain SME and corporate banking centers.
On October 12, 2012, the Group announced that the agreement had become null and void due to the foreseeable breach of the terms and conditions thereof by the agreed deadline (February 2013).
vi. Merger by absorption of Banesto and Banco Banif
On December 17, 2012, Banco Santander, S.A. announced that it had resolved to approve the plan for the merger by absorption of Banco Español de Crédito, S.A. (Banesto) and Banco Banif, S.A. Unipersonal as part of the restructuring of the Spanish financial sector.
On January 9, 2013, the boards of directors of Banco Santander, S.A. and Banesto approved the common draft terms of merger. Also, on January 28, 2013, the boards of directors of Banco Santander, S.A. and Banco Banif, S.A. Unipersonal approved the related common draft terms of merger. The draft terms of merger were approved by the shareholders of Banco Santander, S.A. and Banesto at the annual general meetings held on March 22 and 21, respectively.
F-65
Table of Contents
On April 29, 2013, pursuant to the common draft terms of merger and the resolutions of the annual general meetings of the two companies, Banco Santander, S.A. announced the regime and procedure for the exchange of shares of Banesto for shares of Banco Santander, S.A. Banco Santander, S.A. exchanged the Banesto shares for treasury shares at a ratio of 0.633 shares of Banco Santander, S.A., of EUR 0.5 par value each, for each share of Banesto, of EUR 0.79 par value each, without any additional cash payment. As a result of this exchange, Non-controlling interests fell by EUR 455 million.
On May 3, 2013, the public deed of the merger by absorption of Banesto, which was extinguished, was registered at the Cantabria Mercantile Registry. Also, on April 30 the public deed of the merger by absorption of Banco Banif, S.A. Unipersonal was executed, and this entity was extinguished. The public deed was registered at the Cantabria Mercantile Registry on May 7, 2013.
vii. Insurance business in Spain
On 20 December 2012, the Group announced that it had reached an agreement with Aegon to strengthen the bancassurance business in Spain. The agreement does not affect savings, health and vehicle insurance, which continue to be managed by Santander.
In June 2013, having obtained the relevant authorizations from the Directorate-General of Insurance and Pension Funds and from the European competition authorities, Aegon acquired a 51% ownership interest in the two insurance companies created by the Group for these purposes, one for life insurance and the other for general insurance (currently Aegon Santander Vida Seguros y Reaseguros, S.A. and Aegon Santander Generales Seguros y Reaseguros, S.A.), for which it paid EUR 220 million, thereby gaining joint control together with the Group over the aforementioned companies. The agreement also includes payments to Aegon that are deferred over two years and amounts receivable by the Group that are deferred over five years, based on the business plan.
The aforementioned agreement included the execution of a 25-year distribution agreement for the sale of insurance products through the commercial networks in Spain, for which the Group will receive commissions at market rates.
This transaction gave rise to the recognition of a gain of EUR 385 million under Gains/(losses) on disposal of assets not classified as non-current assets held for sale in the consolidated income statement for 2013 (EUR 270 million net of tax), of which EUR 186 million related to the fair value recognition of the 49% ownership interest retained by the Group.
viii. Agreement with Elavon Financial Services Limited
On October 19, 2012, Banco Santander, S.A. announced that it had entered into an agreement with Elavon Financial Services Limited to jointly develop the payment services business in Spain through point-of-sale credit and debit card terminals at merchants.
This transaction involved the creation of a joint venture, 51% owned by Elavon and 49% owned by Santander, to which Santander Group transferred its aforementioned payment services business in Spain (excluding the former Banesto).
The transaction was completed in the first half of 2013 and generated a gain of EUR 122 million (EUR 85 million net of tax).
F-66
Table of Contents
ix. Agreement with Warburg Pincus and General Atlantic
On May 30, 2013, the Group announced that it had entered into an agreement with subsidiaries of Warburg Pincus and General Atlantic to foster the global development of its asset management unit, Santander Asset Management (SAM). According to the terms and conditions of the agreement, Warburg Pincus and General Atlantic would together own 50% of the holding company which would comprise the Group’s eleven management companies, mainly in Europe and Latin America, while the other 50% would be held by the Group.
The purpose of the alliance was to enable SAM to improve its ability to compete with the large independent international management companies, and the businesses to be strengthened included asset management in the global institutional market, with the additional advantage of having knowledge and experience in the markets in which the Group is present. The agreement also envisaged the distribution of products managed by SAM in the countries in which the Group has a commercial network for a period of ten years, renewable for five additional two-year periods, for which the Group would receive commissions at market rates, thus benefiting from broadening the range of products and services to offer its customers. SAM would also distribute its products and services internationally, outside the Group’s commercial network.
Since the aforementioned management companies belonged to different Group companies, prior to the completion of the transaction a corporate restructuring took place whereby each of the management companies was sold by its shareholders, for its fair value, to SAM Investment Holdings Limited (SAM), a holding company created by the Group. The aggregate value of the management companies was approximately EUR 1,700 million.
Subsequently, in December 2013, once the required authorizations had been obtained from the various regulators, the agreement was executed through the acquisition of a 50% ownership interest in SAM’s share capital by Sherbrooke Acquisition Corp SPC (an investee of Warburg Pincus and General Atlantic) for EUR 449 million. At that date, SAM had financing from third parties amounting to EUR 845 million. The agreement included deferred contingent amounts payable and receivable for the Group based on the achievement of the business plan targets over the coming five years.
Also, the Group entered into a shareholders agreement with the aforementioned shareholders regulating, inter alia, the taking of strategic, financial, operational and other significant decisions regarding the ordinary management of SAM on a joint basis. Certain restrictions on the transferability of the shares were also agreed, and a commitment was made by the two parties to retain the shares for at least 18 months. Lastly, Sherbrooke Acquisition Corp SPC will be entitled to sell to the Group its ownership interest in the share capital of SAM at market value on the fifth and seventh anniversaries of the transaction, unless a public offering of SAM shares has taken place prior to those dates.
Following these transactions, at the end of 2013 and 2014 the Group held a 50% ownership interest in SAM and controlled this company jointly with the aforementioned shareholders (see Note 13).
As a result of the above-mentioned transaction, the Group recognized a gain of EUR 1,372 million under Gains/(losses) on disposal of assets not classified as non-current assets held for sale in the consolidated income statement for 2013 (see Note 49), of which EUR 671 million related to the fair value of the 50% ownership interest retained by the Group.
F-67
Table of Contents
x. Sale of Altamira Asset Management
On November 21, 2013, the Group announced that it had reached a preliminary agreement with Apollo European Principal Finance Fund II, a fund managed by subsidiaries of Apollo Global Management, LLC, for the sale of the platform for managing the loan recovery activities of Banco Santander, S.A. in Spain and for managing and marketing the properties relating to this activity (Altamira Asset Management, S.L.).
On January 3, 2014, the Group announced that it had sold 85% of the share capital of Altamira Asset Management, S.L. to Altamira Asset Management Holdings, S.L., an investee of Apollo European Principal Finance Fund II, for EUR 664 million, giving rise to a net gain of EUR 385 million, which was recognized at its gross amount under Gains/(losses) on disposal of assets not classified as non-current assets held for sale in the consolidated income statement for 2014.
Following this transaction, the Group retained the aforementioned property assets and loan portfolio on its balance sheet, while management of these assets is carried out from the platform owned by Apollo.
xi. Santander Consumer USA
In January 2014 the public offering of shares of Santander Consumer USA Inc. (SCUSA) was completed and the company was admitted to trading on the New York Stock Exchange. The placement represented 21.6% of SCUSA’s share capital, of which 4.23% related to the holding sold by the Group. Following this sale, the Group held 60.74% of the share capital of SCUSA (December 31, 2014: 60.46%). Both Sponsor Auto Finance Holdings Series LP (Sponsor Holdings) -an investee of funds controlled by Warburg Pincus LLC, Kohlberg Kravis Roberts & Co. L.P. and Centerbridge Partners L.P.- and DDFS LLC (DDFS) -a company controlled by Thomas G. Dundon, the Chief Executive Officer of SCUSA- also reduced their holdings.
Following the placement, since the ownership interests of the aforementioned shareholders were reduced to below certain percentages established in the shareholders agreement previously entered into with the Group by the shareholders, the agreement was terminated, pursuant to the terms and conditions established therein. This entailed the termination of the agreements which, inter alia, had granted Sponsor Holdings and DDFS representation on the board of directors of SCUSA and had established a voting system under which the strategic, financial and operating decisions, and other significant decisions associated with the ordinary management of SCUSA, were subject to joint approval by the Group and the aforementioned shareholders. Therefore, SCUSA ceased to be controlled jointly by all the above and is now controlled by the Group on the basis of the percentage held in its share capital (“change of control”).
Prior to the aforementioned change of control, the Group accounted for its ownership interest in SCUSA using the equity method. Following the obtainment of control, the Group now recognizes its investment in SCUSA using the full consolidation method and, at the date of obtainment of control, it included each of SCUSA’s assets and liabilities in its consolidated balance sheet at their fair value.
The Group did not make any disbursement in relation to this change of control and, therefore, goodwill was determined by reference to the fair value of SCUSA implicit in the public offering. The detail of the fair values of the identifiable assets acquired and liabilities assumed at the business combination date is as follows:
F-68
Table of Contents
| Millions of euros |
||||
| Cash and balances with central banks |
1,185 | |||
| Financial assets held for trading |
22 | |||
| Loans and receivables - Loans and advances to customers (*) |
16,113 | |||
| Tangible assets |
1,636 | |||
| Intangible assets (**) |
503 | |||
| Other assets |
1,172 | |||
|
|
|
|||
| Total assets |
20,631 | |||
|
|
|
|||
| Deposits from credit institutions |
6,191 | |||
| Marketable debt securities and other financial liabilities (***) |
11,256 | |||
| Provisions |
11 | |||
| Other liabilities |
935 | |||
|
|
|
|||
| Total liabilities |
18,393 | |||
|
|
|
|||
| Net asset value |
2,238 | |||
|
|
|
|||
| Non-controlling interests |
(879 | ) | ||
|
|
|
|||
| Fair value of employee share option plans |
(94 | ) | ||
|
|
|
|||
| Fair value of previously held investment |
3,747 | |||
|
|
|
|||
| Goodwill |
2,482 | |||
|
|
|
|||
| (*) | The estimate of fair value included gains of EUR 18 million. |
| (**) | The valuation work identified the following intangible assets additional to those already existing: |
| • | Relationships with dealer networks amounting to EUR 429 million with an average amortization period of approximately 17 years. |
| • | Trademarks amounting to EUR 37 million. |
| (***) | In the estimate of fair value, the value of marketable debt securities increased by EUR 117 million. |
In order to determine the fair value of loans and receivables, the loans and receivables were segregated into portfolios of loans with similar features and for each portfolio the present value of the cash flows expected to be received was calculated on the basis of the estimated future losses and prepayment rates.
The goodwill is attributable to the capability and experience of SCUSA’s employees and management team.
As a result of the aforementioned transaction, the Group recognized a gain net of tax of EUR 730 million at its gross amount under Gains/(losses) on disposal of assets not classified as non-current assets held for sale in the consolidated income statement for 2014 (see Notes 27 and 49), of which EUR 688 million relate to the recognition at fair value of the ownership interest held by the Group.
Had the business combination taken place on January 1, 2014, the results contributed to the Group by SCUSA would not have varied significantly from those recognized in the consolidated income statement for 2014.
xii. Agreement with El Corte Inglés
On October 7, 2013, the Group announced that it had entered into a strategic agreement through its subsidiary Santander Consumer Finance, S.A. with El Corte Inglés, S.A. in the area of consumer finance, which included the acquisition of 51% of the share capital of Financiera El Corte Inglés E.F.C., S.A., with El Corte Inglés, S.A. retaining the remaining 49%. On February 27, 2014, following the obtainment of the relevant regulatory and competition authorizations, the acquisition was completed. Santander Consumer Finance, S.A. paid EUR 140 million for 51% of the share capital of Financiera El Corte Inglés E.F.C., S.A.
F-69
Table of Contents
The detail of the provisional fair values of the identifiable assets acquired and liabilities assumed at the business combination date is as follows:
| Millions of euros |
||||
| Loans and advances to credit institutions |
29 | |||
| Loans and receivables - Loans and advances to customers |
1,291 | |||
| Intangible assets |
2 | |||
| Other assets |
22 | |||
|
|
|
|||
| Total assets |
1,344 | |||
|
|
|
|||
| Deposits from credit institutions |
173 | |||
| Customer deposits |
81 | |||
| Marketable debt securities |
585 | |||
| Provisions |
3 | |||
| Other liabilities |
290 | |||
|
|
|
|||
| Total liabilities |
1,132 | |||
|
|
|
|||
| Net asset value |
212 | |||
|
|
|
|||
| Non-controlling interests |
(104 | ) | ||
|
|
|
|||
| Consideration paid |
140 | |||
|
|
|
|||
| Goodwill |
32 | |||
|
|
|
|||
The foregoing values are based on the information available at that date and they may be adjusted in the next month, as provided for in IFRS 3.
In 2014 Financiera El Corte Inglés E.F.C., S.A. contributed EUR 26 million to the Group’s profit. Had the business combination taken place on January 1, 2014, the profit contributed would not have varied significantly.
xiii. Getnet Tecnologia em Captura e Processamento de Transações H.U.A.H., S.A.
On April 7, 2014, Banco Santander (Brasil) S.A. announced that it had reached an agreement to purchase through an investee all the shares of Getnet Tecnologia em Captura e Processamento de Transações H.U.A.H. S.A. (“Getnet”). The transaction was completed on July 31, 2014 and the price was set at BRL 1,156 million (approximately EUR 383 million), giving rise to goodwill of EUR 229 million, which was included in the Banco Santander (Brazil) cash-generating unit (see Note 17).
Among the agreements reached, the Group has granted a put option to the non-controlling shareholders of Santander Getnet Serviços para Meios de Pagamento S.A. on all the shares held by them (11.5% of the share capital of this company). The Group recognized the corresponding liability amounting to EUR 308 million with a charge to equity.
In 2014 Getnet Tecnologia em Captura e Processamento de Transações H.U.A.H. S.A. contributed EUR 11 million to the Group’s profit. Had the business combination taken place on January 1, 2014, the profit contributed to the Group in 2014 would have been approximately EUR 21 million.
F-70
Table of Contents
xiv. Banco Santander (Brasil) S.A.
In January and March 2012 the Group transferred shares representing 4.41% and 0.77% of Banco Santander (Brasil) S.A. to two leading international financial institutions that undertook to deliver these shares to the holders of the bonds convertible into shares of Banco Santander (Brasil) S.A. issued by Banco Santander, S.A. in October 2010 upon the maturity of the bonds. This transaction did not give rise to any change in the Group’s equity.
The delivery of the aforementioned shares took place on November 7, 2013.
Acquisition of non-controlling interests in Banco Santander (Brasil) S.A.
On April 28, 2014, the Bank’s board of directors approved a bid for the acquisition of all the shares of Banco Santander (Brasil) S.A. not then owned by the Group, which represented approximately 25% of the share capital of Banco Santander (Brasil) S.A., offering in consideration Bank shares in the form of Brazilian Depositary Receipts (BDRs) or American Depositary Receipts (ADRs). As part of the bid, the Bank requested that its shares be listed on the São Paulo Stock Exchange in the form of BDRs.
The offer was voluntary, in that the non-controlling shareholders of Banco Santander (Brasil) S.A. were not obliged to participate, and it was not conditional upon a minimum acceptance level. The consideration offered, following the adjustment made as a result of the application of the Santander Dividendo Elección scrip dividend scheme in October 2014, consisted of 0.7152 new Banco Santander shares for each unit or ADR of Banco Santander (Brasil) S.A. and 0.3576 new Banco Santander shares for each ordinary or preference share of Banco Santander (Brasil) S.A.
The bid was accepted by holders of 13.65% of the share capital of Banco Santander (Brasil) S.A. Accordingly, the Group’s ownership interest in Banco Santander (Brasil) S.A. rose to 88.30% of its share capital. To cater for the exchange, the Bank, executing the agreement adopted by the extraordinary general meeting held on September 15, 2014, issued 370,937,066 shares, representing approximately 3.09% of the Bank’s share capital at the issue date. The aforementioned transaction gave rise to an increase of EUR 185 million in Share capital, EUR 2,372 million in Share premium and EUR 15 million in Reserves, and a reduction of EUR 2,572 million in Non-controlling interests.
The shares of Banco Santander (Brasil) S.A. continue to be listed on the São Paulo and New York stock exchanges.
xv. Agreement with CNP
On July 10, 2014, the Bank announced that it had reached an agreement for the French insurance company CNP to acquire a 51% stake in the three insurance companies based in Ireland (Santander Insurance Life Limited, Santander Insurance Europe Limited and Santander Insurance Services Ireland Limited) that distribute life and non-life products through the Santander Consumer Finance network.
In December 2014, after the regulatory authorizations had been obtained, CNP paid EUR 297 million to acquire 51% of the share capital of the three aforementioned insurance companies and, therefore, control thereof. The agreement also includes deferred payments to CNP in 2017 and 2020, and deferred amounts receivable by the Group in 2017, 2020 and 2023, based on the business plan.
The aforementioned agreement included the execution of a 20-year retail agreement, renewable for five-year periods, for the sale of life and non-life insurance products through the Santander Consumer Finance network, for which the Group will receive commissions at market rates.
F-71
Table of Contents
This transaction gave rise to the recognition of a gain of EUR 413 million under Gains/(losses) on disposal of assets not classified as non-current assets held for sale (see Note 49), of which EUR 207 million related to the fair value recognition of the 49% ownership interest retained by the Group.
xvi. Metrovacesa, S.A.
On December 19, 2012, the creditor entities that had participated in a debt restructuring agreement for the Sanahuja Group, under which they received shares of Metrovacesa, S.A. as dation in payment for that group’s debt, announced that they had reached an agreement to promote the delisting of the shares of Metrovacesa, S.A. and they voted in favor of this at the general meeting held for this purpose on January 29, 2013. Following the approval of the delisting and the public takeover offer at the Metrovacesa, S.A. general meeting, the entities made a delisting public takeover offer of EUR 2.28 per share to the Metrovacesa, S.A. shareholders that had not entered into the agreement. The Group participated in the delisting public takeover offer by acquiring an additional 1.953% of Metrovacesa, S.A. for EUR 44 million.
Following this transaction, at December 31, 2013, the Group held an ownership interest of 36.82% in the share capital of Metrovacesa, S.A.
On December 23, 2014, the Group acquired 19.07% of Metrovacesa, S.A. from Bankia, S.A. for EUR 98.9 million, as a result of which its stake increased to 55.89%, thus obtaining control over this company.
The detail of the provisional fair values of the identifiable assets acquired and liabilities assumed at the business combination date is as follows:
| Millions of euros |
||||
| Loans and receivables |
256 | |||
| Tangible assets (*) |
3,522 | |||
| Deferred tax assets |
364 | |||
| Other assets (**) |
1,181 | |||
|
|
|
|||
| Total assets |
5,323 | |||
|
|
|
|||
| Deposits from credit institutions |
3,359 | |||
| Deferred tax liabilities |
382 | |||
| Other liabilities |
226 | |||
|
|
|
|||
| Total liabilities |
3,967 | |||
|
|
|
|||
| Net asset value |
1,356 | |||
|
|
|
|||
| Non-controlling interests |
(598 | ) | ||
|
|
|
|||
| Consideration paid plus fair value of the previously held investment |
598 | |||
|
|
|
|||
| Gain on the acquisition |
160 | |||
|
|
|
|||
| Effect of the fair value recognition of the previously held investment on profit or loss |
(143 | ) | ||
|
|
|
|||
| Net effect recognized in profit or loss |
17 | |||
|
|
|
|||
| (*) | Relating mainly to leased assets recognized at fair value by the acquiree and recognized under Tangible assets - Investment property. |
| (**) | Including mainly Inventories. The estimate of fair value includes gains of EUR 268 million. |
The foregoing values are based on the information available at that date and they may be adjusted in the next eleven months, as provided for in IFRS 3.
F-72
Table of Contents
The fair value of the investment held was calculated using the fair value of the net assets and liabilities at the acquisition-date fair value.
The measurement at fair value of the investment held prior to the acquisition of control had an adverse effect of EUR 143 million on profit or loss. Consequently, the aforementioned transaction gave rise to the recognition of a gain of EUR 17 million in the consolidated income statement.
The results contributed by Metrovacesa, S.A. until December 23, 2014, the date of the business combination, are broken down in Note 41.
xvii. Agreement with GE Capital
On June 23, 2014, the Group announced that Santander Consumer Finance, S.A., the Group’s consumer finance unit, had reached an agreement with GE Money Nordic Holding AB to acquire GE Capital’s business in Sweden, Denmark and Norway for approximately EUR 693 million (SEK 6,408 million). On November 6, 2014, following the obtainment of the relevant authorizations, the acquisition was completed.
The detail of the provisional fair values of the identifiable assets acquired and liabilities assumed at the business combination date is as follows:
| Millions of euros |
||||
| Cash and balances with central banks |
28 | |||
| Loans and advances to credit institutions |
179 | |||
| Loans and receivables - Loans and advances to customers (*) |
2,099 | |||
| Other assets |
62 | |||
|
|
|
|||
| Total assets |
2,368 | |||
|
|
|
|||
| Deposits from credit institutions |
1,159 | |||
| Customer deposits |
769 | |||
| Subordinated liabilities |
81 | |||
| Other liabilities |
74 | |||
|
|
|
|||
| Total liabilities |
2,083 | |||
|
|
|
|||
| Net asset value |
285 | |||
|
|
|
|||
| Consideration paid |
693 | |||
|
|
|
|||
| Goodwill |
408 | |||
|
|
|
|||
| (*) | In estimating their fair value, the value of the loans was reduced by EUR 75 million. |
The foregoing values are based on the information available at that date and they may be adjusted in the next ten months, as provided for in IFRS 3.
In 2014 this business contributed EUR 8 million to the Group’s profit. Had the business combination taken place on January 1, 2014, the profit contributed to the Group in 2014 would have been approximately EUR 94 million.
xviii. Agreement with Banque PSA Finance
The Group, through its subsidiary Santander Consumer Finance, S.A., and Banque PSA Finance, the vehicle financing unit of the PSA Peugeot Citroën Group, entered into an agreement for the operation of the vehicle financing business in twelve European countries. Pursuant to the terms of the agreement, the Group will finance this business, under certain circumstances and conditions, from the date on which the transaction is
F-73
Table of Contents
completed, which is expected to occur in 2015 or at the beginning of 2016. In addition, in certain countries, the Group will purchase a portion of the current lending portfolio of Banque PSA Finance. A cooperation agreement for the insurance business in all these countries is also included. The transaction is subject to approval by the relevant regulatory and competition authorities.
In January 2015 the relevant regulatory authorizations were obtained for the commencement of activities in France and the United Kingdom.
xix. Custody business
On June 19, 2014, the Group announced that it had reached an agreement with FINESP Holdings II B.V., a subsidiary of Warburg Pincus, to sell a 50% stake in Santander’s custody business in Spain, Mexico and Brazil, with this business valued at EUR 975 million. The remaining 50% will be retained by the Group. The sale is subject to the obtainment of the relevant regulatory authorizations which, in accordance with the agreement, should be obtained in the first half of 2015.
xx. Carfinco Financial Group
On September 16, 2014, the Bank announced that it had reached an agreement to purchase the listed Canadian company Carfinco Financial Group Inc. (“Carfinco”), a company specializing in vehicle financing, for CAD 298 million (approximately EUR 210 million -at the date of the announcement). The board of directors of Carfinco and its shareholders approved the transaction, that was completed on March 6, 2015.
c) Off-shore entities
At the reporting date, under current Spanish legislation, the Group had eleven subsidiaries resident in off-shore territories, although these territories are not considered to be tax havens as defined by the OECD. Two of these subsidiaries are currently in liquidation and, over the next few years, five more subsidiaries are expected to be liquidated (two issuers and three substantially inactive or inactive companies).
Following these planned disposals, the Group would have a total of four off-shore subsidiaries, with 126 employees, mainly in Jersey and the Isle of Man:
| • | Abbey National International Limited in Jersey, which engages mainly in remote banking for British customers, who are offered traditional savings products. |
| • | Serfin International Bank and Trust, Limited (Cayman Islands), an inactive bank. |
| • | Whitewick Limited (Jersey), an inactive company. |
| • | ALIL Services Limited (Isle of Man), currently providing substantially reduced services. |
It should be noted that the individual results include transactions performed with other Group companies, such as dividend collection, recognition and reversal of provisions and corporate restructuring results which, in accordance with accounting standards, are eliminated on consolidation in order to avoid the duplication of profit or the recognition of intra-Group results. Therefore, they are not representative of the Group’s operations in these countries or of the results contributed to Santander Group.
The four subsidiaries referred to above contributed a profit of approximately EUR 14 million to the Group’s consolidated profit in 2014.
Also, the Group has five branches: three in the Cayman Islands, one in the Isle of Man and one in Jersey. These branches report to, and consolidate their balance sheets and income statements with, their respective foreign parents.
F-74
Table of Contents
Spain will foreseeably enter into information exchange agreements with the Cayman Islands, the Isle of Man, Jersey and Guernsey and, accordingly, these territories would cease to be tax havens under Spanish law and, consequently, the Group would no longer have any entities in off-shore territories. In addition, these jurisdictions have successfully passed the evaluations conducted by the Global Forum on Transparency and Exchange of Information for Tax Purposes, and are not considered to be tax havens by the OECD.
Also, from Brazil the Group controls a securitization company called Brazil Foreign Diversified Payment Rights Finance Company (in liquidation) and it manages a segregated portfolio company called Santander Brazil Global Investment Fund SPC in the Cayman Islands, and from the UK it manages a protected cell company in Guernsey called Guaranteed Investment Product 1 PCC Ltd. Additionally, the Group has, directly or indirectly, various financial investments located in tax havens including, inter alia, Asia Bridge Fund I LLC in Mauritius, Olivant Limited in Guernsey and JC Flowers in the Cayman Islands.
The Group also has five subsidiaries domiciled in off-shore territories that are not considered to be off-shore entities since they are resident for tax purposes in, and operate exclusively from, the UK (one of these subsidiaries is expected to be liquidated in 2015).
The Group has established appropriate procedures and controls (risk management, supervision, verification and review plans and periodic reports) to prevent reputational and legal risk arising at these entities. Also, the Group has continued to implement its policy to reduce the number of off-shore units.
| 4. | Distribution of the Bank’s profit, Shareholder remuneration scheme and Earnings per share |
| a) | Distribution of the Bank’s profit and Shareholder remuneration scheme |
The distribution of the Bank’s net profit for 2014 that the board of directors will propose for approval by the shareholders at the annual general meeting is as follows:
| Millions of euros |
||||
| Acquisition, with a waiver of exercise, of bonus share rights from the shareholders which, under the Santander Dividendo Elección scrip dividend scheme, opted to receive in cash remuneration equivalent to the first, second and third interim dividend -EUR 799 million- and from the shareholders which are expected to opt to receive in cash remuneration equivalent to the final dividend (EUR 337 million): |
1,136 | |||
| Of which: |
||||
| Distributed at December 31, 2014 (*) |
471 | |||
| Third interim dividend Fourth interim dividend (**) |
|
328 337 |
| |
| To voluntary reserves |
299 | |||
|
|
|
|||
| Net profit for the year |
1,435 | |||
|
|
|
|||
| (*) | Recognized under Shareholders’ equity - Dividends and remuneration. |
| (**) | Assuming a percentage of cash requests of 16%. If the amount used to acquire rights from shareholders opting to receive in cash the remuneration equivalent to the final dividend were less than the figure indicated, the difference would be automatically allocated to increase voluntary reserves. Otherwise, the difference would be deducted from the amount allocated to increase voluntary reserves. |
F-75
Table of Contents
In addition to the EUR 1,136 million indicated above, EUR 4,817 million in shares were allocated to the remuneration of shareholders under the shareholder remuneration scheme (Santander Dividendo Elección) approved by the shareholders at the annual general meeting held on March 28, 2014, whereby the Bank offered shareholders the possibility to opt to receive an amount equivalent to the first, second and third interim dividends out of 2014 profit in cash or new shares.
Similarly, within the framework of the shareholder remuneration scheme (Santander Dividendo Elección) the implementation of which will be submitted for approval by the annual general meeting, the Bank will offer shareholders the possibility of opting to receive an amount equivalent to the final dividend for 2014 in cash or new shares. The Bank’s directors consider that 84% of shareholders will request remuneration in shares and, therefore, it is anticipated that the shareholders will be paid approximately EUR 1,772 million in shares.
The board of directors will propose to the shareholders at the annual general meeting that remuneration of approximately EUR 0.60 per share be paid for 2014.
| b) | Earnings per share from continuing and discontinued operations |
| i. | Basic earnings per share |
Basic earnings per share are calculated by dividing the net profit attributable to the Group adjusted by the after-tax amount of the remuneration of contingently convertible preference shares recognized in equity (see Note 23) by the weighted average number of ordinary shares outstanding during the year, excluding the average number of treasury shares held in the year.
Accordingly:
| 12/31/14 | 12/31/13 | 12/31/12 | ||||||||||
| Profit attributable to the Group (millions of euros) |
5,816 | 4,175 | 2,283 | |||||||||
| Remuneration of contingently convertible preference shares (millions of euros) |
(131 | ) | — | — | ||||||||
|
|
|
|
|
|
|
|||||||
| 5,685 | 4,175 | 2,283 | ||||||||||
| Of which: |
||||||||||||
| Profit (Loss) from discontinued operations (net of non-controlling interests) (millions of euros) |
(26 | ) | (15 | ) | 70 | |||||||
| Profit from continuing operations (net of non-controlling interests) (millions of euros) |
5,711 | 4,190 | 2,213 | |||||||||
| Weighted average number of shares outstanding |
11,858,689,721 | 10,836,110,583 | 9,451,734,994 | |||||||||
| Assumed conversion of convertible debt |
— | — | 314,953,901 | |||||||||
|
|
|
|
|
|
|
|||||||
| Adjusted number of shares |
11,858,689,721 | 10,836,110,583 | 9,766,688,895 | |||||||||
|
|
|
|
|
|
|
|||||||
| Basic earnings per share (euros) |
0.48 | 0.39 | 0.23 | |||||||||
|
|
|
|
|
|
|
|||||||
| Basic earnings per share from discontinued operations (euros) |
(0.00 | ) | (0.00 | ) | 0.01 | |||||||
|
|
|
|
|
|
|
|||||||
| Basic earnings per share from continuing operations (euros) |
0.48 | 0.39 | 0.22 | |||||||||
|
|
|
|
|
|
|
|||||||
F-76
Table of Contents
| ii. | Diluted earnings per share |
Diluted earnings per share are calculated by dividing the net profit attributable to the Group adjusted by the after-tax amount of the remuneration of contingently convertible preference shares recognized in equity (see Note 23) by the weighted average number of ordinary shares outstanding during the year, excluding the average number of treasury shares and adjusted for all the dilutive effects inherent to potential ordinary shares (share options, and convertible debt instruments).
Accordingly, diluted earnings per share were determined as follows:
| 12/31/14 | 12/31/13 | 12/31/12 | ||||||||||
| Profit attributable to the Group (millions of euros) |
5,816 | 4,175 | 2,283 | |||||||||
| Remuneration of contingently convertible preference shares (millions of euros) |
(131 | ) | — | — | ||||||||
| Dilutive effect of changes in profit for the year arising from potential conversion of ordinary shares |
— | — | — | |||||||||
|
|
|
|
|
|
|
|||||||
| 5,685 | 4,175 | 2,283 | ||||||||||
| Of which: |
||||||||||||
| Profit (Loss) from discontinued operations (net of non-controlling interests) (millions of euros) |
(26 | ) | (15 | ) | 70 | |||||||
| Profit from continuing operations (net of non-controlling interests) (millions of euros) |
5,711 | 4,190 | 2,213 | |||||||||
| Weighted average number of shares outstanding |
11,858,689,721 | 10,836,110,583 | 9,451,734,994 | |||||||||
| Assumed conversion of convertible debt |
— | — | 314,953,901 | |||||||||
| Dilutive effect of options/rights on shares |
29,829,103 | 51,722,251 | 66,057,677 | |||||||||
|
|
|
|
|
|
|
|||||||
| Adjusted number of shares |
11,888,518,824 | 10,887,832,834 | 9,832,746,572 | |||||||||
|
|
|
|
|
|
|
|||||||
| Diluted earnings per share (euros) |
0.48 | 0.38 | 0.23 | |||||||||
|
|
|
|
|
|
|
|||||||
| Diluted earnings per share from discontinued operations (euros) |
(0.00 | ) | (0.00 | ) | 0.01 | |||||||
|
|
|
|
|
|
|
|||||||
| Diluted earnings per share from continuing operations (euros) |
0.48 | 0.38 | 0.22 | |||||||||
|
|
|
|
|
|
|
|||||||
| 5. | Remuneration and other benefits paid to the Bank’s directors and senior managers |
| a) | Remuneration of directors |
| i. | Bylaw-stipulated emoluments |
The annual general meeting held on March 22, 2013 approved an amendment to the Bylaws, whereby the remuneration of directors in their capacity as board members became an annual fixed amount determined by the annual general meeting. This amount shall remain in effect unless the shareholders resolve to change it at a general meeting. However, the board of directors may elect to reduce the amount in any years in which it deems such action justified. The remuneration established for 2014 by the annual general meeting, as for 2013, was EUR 6 million, with two components: (a) an annual emolument and (b) attendance fees.
The specific amount payable for the above-mentioned items to each of the directors is determined by the board of directors. For such purpose, it takes into consideration the positions held by each director on the board, their attendance of board meetings, their membership of the various committees, their attendance of committee meetings and any other objective circumstances considered by the board.
F-77
Table of Contents
The total bylaw-stipulated emoluments earned by the directors in 2014 amounted to EUR 4.4 million (2013: EUR 4.3 million).
Annual emolument
The amounts received individually by the directors in 2014 and 2013 based on the positions held by them on the board and their membership of the board committees were as follows:
| Euros | ||||||||
| 2014 | 2013 | |||||||
| Members of the board of directors |
84,954 | 84,954 | ||||||
| Members of the executive committee |
170,383 | 170,383 | ||||||
| Members of the audit committee |
39,551 | 39,551 | ||||||
| Members of the appointments committee (1) |
23,730 | 23,730 | ||||||
| Members of the remuneration committee (1) |
23,730 | 23,730 | ||||||
| Members of the risk supervision, regulation and compliance committee (2) |
20,697 | — | ||||||
| Chairman of the risk supervision, regulation and compliance committee (2) |
26,164 | — | ||||||
| Non-executive deputy chairmen (3) |
28,477 | 28,477 | ||||||
| (1) | In 2014 the former appointments and remuneration committee was divided into two, namely the appointments committee and the remuneration committee. The amount indicated relates to the entire year, the corresponding proportional part for each case having been paid. |
| (2) | Held its first meeting on July 23, 2014. |
| (3) | In 2013 the total amount of EUR 28,477 was paid to Mr Guillermo de la Dehesa and Mr Manuel Soto Serrano in proportion to the time during which each held office in the year. |
Attendance fees
The directors receive fees for attending board and committee meetings, excluding executive committee meetings, since no attendance fees are received for this committee.
By resolution of the board of directors, at the proposal of the remuneration committee, the fees for attending board and committee meetings -excluding executive committee meetings, for which no attendance fees have been established- have remained unchanged since 2008.
F-78
Table of Contents
| Board meeting attendance fees |
Euros | |||
| 2008-2014 | ||||
| Board of directors |
||||
| Resident directors |
2,540 | |||
| Non-resident directors |
2,057 | |||
| Executive risk committee, audit committee and risk supervision, regulation and compliance committee |
||||
| Resident directors |
1,650 | |||
| Non-resident directors |
1,335 | |||
| Other committees (except the executive committee) |
||||
| Resident directors |
1,270 | |||
| Non-resident directors |
1,028 | |||
| ii. | Salaries |
Fixed remuneration
The executive directors’ gross annual salary for 2014 and 2013 was as follows:
| Thousands of euros | ||||||||
| 2014 | 2013 | |||||||
| Ms Ana Botín-Sanz de Sautuola y O’Shea (1) |
||||||||
| Chief executive officer of Santander UK |
1,392 | 2,005 | ||||||
| Chair |
833 | — | ||||||
| Mr Matías Rodríguez Inciarte |
1,710 | 1,710 | ||||||
| Mr Juan Rodríguez Inciarte |
1,200 | 987 | ||||||
| Mr Emilio Botín-Sanz de Sautuola y García de los Ríos (2) |
930 | 1,344 | ||||||
| Mr Javier Marín Romano (3) |
||||||||
| Executive vice president |
— | 267 | ||||||
| Chief executive officer |
2,000 | 1,333 | ||||||
| Mr Alfredo Sáenz Abad (4) |
— | — | ||||||
|
|
|
|
|
|||||
| Total |
8,065 | 7,646 | ||||||
|
|
|
|
|
|||||
| (1) | As indicated in the annual remuneration report for 2013, which was approved, on a consultation basis, by the Bank’s annual general meeting on March 28, 2014, the gross annual salary that corresponded to her in 2014 for her duties as chief executive officer of Santander UK amounted to GBP 1,702 thousand (EUR 2,005 thousand, considering the average exchange rate for 2013). Following her designation as chair of Banco Santander on September 10, 2014, this amount was revised to reflect her new responsibilities and was established at EUR 2.5 million. |
The amounts in euros in the above table for 2014 include the portion relating to her duties as chief executive officer of Santander UK and the portion relating to her duties as chair of the Group.
| (2) | Ceased to be a member of the board due to his death on September 9, 2014. |
| (3) | The amount actually received in 2013 was EUR 1,600 thousand, which is the sum of his remuneration as executive vice president of the Bank for the first four months of the year (EUR 267 thousand) and his remuneration as chief executive officer for the remaining eight (EUR 1,333 thousand). Ceased to be a member of the board on January 12, 2015. |
| (4) | Retired from the board on April 29, 2013. The gross salary received until that date is shown, together with his other remuneration, in section iii) below. |
F-79
Table of Contents
Variable remuneration
In 2013 the variable remuneration was instrumented through a deferred conditional variable remuneration plan (bonus) payable partly in cash and partly in shares and deferred over a three-year period. In 2014 the board, at the proposal of the appointments and remuneration committee, included in this variable remuneration a multiannual component consisting of a new long-term incentive (performance share plan, “ILP” – see Note 47 for terms and conditions) based on the performance of certain variables of the Bank over the above period.
Bonus
The maximum variable remuneration (bonus) of the executive directors for 2014 and 2013 approved by the board at the proposal of the appointments and remuneration committee (in 2014, the remuneration committee) was as follows:
| Thousands of euros | ||||||||
| 2014 | 2013 | |||||||
| Ms Ana Botín-Sanz de Sautuola y O’Shea (1) |
||||||||
| Chief executive officer of Santander UK |
2,212 | 2,212 | ||||||
| Chair |
1,550 | — | ||||||
| Mr Matías Rodríguez Inciarte |
2,868 | 2,308 | ||||||
| Mr Juan Rodríguez Inciarte |
2,223 | 1,480 | ||||||
| Mr Emilio Botín-Sanz de Sautuola y García de los Ríos |
— | 1,412 | ||||||
| Mr Javier Marín Romano (2) |
||||||||
| Executive vice president |
— | 500 | ||||||
| Chief executive officer |
3,966 | 2,000 | ||||||
| Mr Alfredo Sáenz Abad |
— | — | ||||||
|
|
|
|
|
|||||
| Total |
12,819 | 9,912 | ||||||
|
|
|
|
|
|||||
| (1) | The amounts in euros in the above table for 2014 include the portion relating to her duties as chief executive officer of Santander UK and the portion relating to her duties as chair of the Group. |
| (2) | The amounts in euros in the above table for 2013 include the portion relating to his duties as executive vice president for the first four months of the year and the portion relating to his duties as chief executive officer of the Bank for the remaining eight months. |
The third and fourth cycles of the deferred conditional variable remuneration plan (bonus) were approved in 2013 and 2014 under the same payment terms as the first cycle of the plan (see Note 5.e), whereby payment of a portion of the variable remuneration for these years is deferred over three years for it to be paid, where appropriate, in three equal portions, 50% in cash and 50% in Santander shares, provided that the conditions for entitlement to the remuneration are met. Similarly, the portion of the variable remuneration that is not deferred (immediate payment) is paid 50% in cash and 50% in shares.
The amounts shown in the foregoing table reflect the maximum total variable remuneration allocated to the executive directors for each year. These amounts include both the cash-based and share-based variable remuneration (according to the plans agreed in each year) and both the remuneration payable immediately and that which, as the case may be, is payable following a deferral period.
F-80
Table of Contents
The following table shows the form of payment of the aforementioned variable remuneration for 2014 and 2013:
| Thousands of euros | ||||||||||||||||||||||||||||||||
| 2014 | 2013 | |||||||||||||||||||||||||||||||
| Immediate payment in cash (20%) |
Immediate payment in shares (20%) |
Deferred payment in cash (30%) (1) |
Deferred payment in shares (30%) (1) |
Immediate payment in cash (20%) |
Immediate payment in shares (20%) |
Deferred payment in cash (30%) (2) |
Deferred payment in shares (30%) (2) |
|||||||||||||||||||||||||
| Ms Ana Botín-Sanz de Sautuola y O’Shea (3) |
752 | 752 | 1,129 | 1,129 | 442 | 442 | 664 | 664 | ||||||||||||||||||||||||
| Mr Matías Rodríguez Inciarte |
574 | 574 | 860 | 860 | 462 | 462 | 692 | 692 | ||||||||||||||||||||||||
| Mr Juan Rodríguez Inciarte |
445 | 445 | 667 | 667 | 296 | 296 | 444 | 444 | ||||||||||||||||||||||||
| Mr Emilio Botín-Sanz de Sautuola y García de los Ríos |
— | — | — | — | 282 | 282 | 424 | 424 | ||||||||||||||||||||||||
| Mr Javier Marín Romano |
793 | 793 | 1,190 | 1,190 | 500 | 500 | 750 | 750 | ||||||||||||||||||||||||
| Mr Alfredo Sáenz Abad |
— | — | — | — | — | — | — | — | ||||||||||||||||||||||||
|
|
|
|
|
|
|
|
|
|
|
|
|
|
|
|
|
|||||||||||||||||
| Total |
2,564 | 2,564 | 3,846 | 3,846 | 1,982 | 1,982 | 2,974 | 2,974 | ||||||||||||||||||||||||
|
|
|
|
|
|
|
|
|
|
|
|
|
|
|
|
|
|||||||||||||||||
| (1) | In 3 years: 2016, 2017 and 2018 subject to continued service, with the exceptions provided for, and the non-applicability of “malus” clauses. |
| (2) | In 3 years: 2015, 2016 and 2017 subject to continued service, with the exceptions provided for, and the non-applicability of “malus” clauses. |
| (3) | In 2013, euro equivalent value of the original amount in pounds sterling. |
The amounts of immediate and deferred payments in shares shown in the table above correspond to the following numbers of shares:
| Number of shares | ||||||||||||||||||||||||
| 2014 | 2013 | |||||||||||||||||||||||
| Immediate payment |
Deferred payment (1) |
Total | Immediate payment |
Deferred payment (2) |
Total | |||||||||||||||||||
| Ms Ana Botín-Sanz de Sautuola y O’Shea |
121,629 | 182,444 | 304,073 | 66,241 | 99,362 | 165,603 | ||||||||||||||||||
| Mr Matías Rodríguez Inciarte |
92,726 | 139,088 | 231,814 | 69,092 | 103,639 | 172,731 | ||||||||||||||||||
| Mr Juan Rodríguez Inciarte |
71,872 | 107,808 | 179,680 | 44,299 | 66,448 | 110,747 | ||||||||||||||||||
| Mr Emilio Botín-Sanz de Sautuola y García de los Ríos |
— | — | — | 42,287 | 63,431 | 105,718 | ||||||||||||||||||
| Mr Javier Marín Romano |
128,225 | 192,338 | 320,563 | 74,850 | 112,275 | 187,125 | ||||||||||||||||||
| Mr Alfredo Sáenz Abad |
— | — | — | — | — | — | ||||||||||||||||||
|
|
|
|
|
|
|
|
|
|
|
|
|
|||||||||||||
| Total |
414,452 | 621,678 | 1,036,130 | 296,769 | 445,155 | 741,924 | ||||||||||||||||||
|
|
|
|
|
|
|
|
|
|
|
|
|
|||||||||||||
| (1) | In 3 years: 2016, 2017 and 2018 subject to continued service, with the exceptions provided for, and the non-applicability of “malus” clauses. |
| (2) | In 3 years: 2015, 2016 and 2017 subject to continued service, with the exceptions provided for, and the non-applicability of “malus” clauses. |
F-81
Table of Contents
ILP 2014
The ILP for the executive directors was set by the board, at the proposal of the remuneration committee, at an amount equal to 15% of the bonus.
The ILP thus established for each beneficiary is called the “Agreed ILP Amount”, and its accrual and its amount are linked to the degree of achievement of the multiannual targets established in the plan (see Note 47). The Agreed ILP Amount determines, for each executive director, the maximum number of shares that the director may, if appropriate, receive; this number was calculated taking into account the market price of the Santander share in the 15 trading sessions prior to January 16, 2015, which was EUR 6.186 per share.
Following is a detail of the maximum number of shares corresponding to each executive director and the estimated fair value of this variable remuneration:
| 2014 | ||||||||
| Fair value (thousands of euros) (1) |
Maximum number of shares |
|||||||
| Ms Ana Botín-Sanz de Sautuola y O’Shea (1) |
140 | 62,395 | ||||||
| Mr Matías Rodríguez Inciarte |
170 | 75,655 | ||||||
| Mr Juan Rodríguez Inciarte |
120 | 53,346 | ||||||
| Mr Emilio Botín-Sanz de Sautuola y García de los Ríos |
— | — | ||||||
| Mr Javier Marín Romano |
147 | 65,470 | ||||||
|
|
|
|
|
|||||
| Total |
577 | 256,866 | ||||||
|
|
|
|
|
|||||
| (1) | Estimated fair value at the plan award date, taking into account various possible scenarios regarding Banco Santander’s TSR performance in relation to that of the benchmark group entities in the measurement periods. |
The accrual of the ILP and its amount are conditional on the performance of Banco Santander’s TSR in relation to that of the entities in the benchmark group over a multiannual period. Thus, in 2016, 2017 and 2018, the amount, if any, to be received by each executive director under the ILP (the annual amount of the ILP) will be determined by applying to one third of the agreed amount of the ILP the percentage resulting from the performance of the TSR according to the table approved in the plan (see Note 47).
| iii. | Detail by director |
The detail, by Bank director, for 2014 and 2013 is provided below. The salaries of the executive directors shown in the table below correspond to the gross annual salary received and to the maximum amount of the bonus approved by the board as period remuneration, irrespective of the year of payment and of the amount which may ultimately be paid to the directors under the agreed deferred remuneration scheme. Also, the figures for 2014 include, for each director, the estimated fair value of the new long-term incentive (ILP), irrespective of the year of payment and of the amount which may ultimately be paid under the agreed deferred remuneration scheme. Note 5.e) below includes disclosures on the shares delivered by virtue of the deferred remuneration schemes in place in previous years the conditions for delivery of which were met in the corresponding years.
F-82
Table of Contents
| Thousands of euros | ||||||||||||||||||||||||||||||||||||||||||||||||||||||||||||||||||||||||||||||||
| 2014 | 2013 | |||||||||||||||||||||||||||||||||||||||||||||||||||||||||||||||||||||||||||||||
| Bylaw-stipulated emoluments | Salaries of executive directors | Other remuneration (c) |
Total | Total (d) |
||||||||||||||||||||||||||||||||||||||||||||||||||||||||||||||||||||||||||||
| Annual emolument | Attendance fees | |||||||||||||||||||||||||||||||||||||||||||||||||||||||||||||||||||||||||||||||
| Board | Executive committee |
Audit and compliance committee |
Appointments and remuneration committee |
Appointments committee |
Remuneration committee |
Risk supervision, regulation and compliance committee |
Board | Other fees |
||||||||||||||||||||||||||||||||||||||||||||||||||||||||||||||||||||||||
| Fixed | Variable - immediate payment |
Variable - deferred payment (a) |
ILP (b) |
Total | ||||||||||||||||||||||||||||||||||||||||||||||||||||||||||||||||||||||||||||
| Directors |
In cash |
In shares |
In cash |
In shares |
||||||||||||||||||||||||||||||||||||||||||||||||||||||||||||||||||||||||||||
| Ms Ana Patricia Botín-Sanz de Sautuola y O’Shea |
||||||||||||||||||||||||||||||||||||||||||||||||||||||||||||||||||||||||||||||||
| Chief executive officer of Santander UK |
85 | 170 | — | — | — | — | — | 29 | 2 | 1,392 | 442 | 442 | 664 | 664 | 140 | 3,744 | 448 | 4,478 | 4,840 | |||||||||||||||||||||||||||||||||||||||||||||||||||||||||||||
| Chair |
— | — | — | — | — | — | — | — | — | 833 | 310 | 310 | 465 | 465 | — | 2,383 | — | 2,383 | — | |||||||||||||||||||||||||||||||||||||||||||||||||||||||||||||
| Mr Matías Rodríguez Inciarte |
85 | 170 | — | — | — | — | — | 38 | 158 | 1,710 | 574 | 574 | 860 | 860 | 170 | 4,748 | 175 | 5,375 | 4,729 | |||||||||||||||||||||||||||||||||||||||||||||||||||||||||||||
| Mr Guillermo de la Dehesa Romero (1) |
113 | 170 | 40 | 19 | 4 | 4 | — | 38 | 48 | — | — | — | — | — | — | — | — | 438 | 394 | |||||||||||||||||||||||||||||||||||||||||||||||||||||||||||||
| Mr Rodrigo Echenique Gordillo (2) |
85 | 170 | 12 | 19 | 4 | 4 | 21 | 36 | 152 | — | — | — | — | — | — | — | 23 | 527 | 493 | |||||||||||||||||||||||||||||||||||||||||||||||||||||||||||||
| Ms Sheila Bair (3) |
79 | — | — | — | — | — | 21 | 23 | 7 | — | — | — | — | — | — | — | — | 129 | — | |||||||||||||||||||||||||||||||||||||||||||||||||||||||||||||
| Mr Francisco Javier Botín-Sanz de Sautuola y O’Shea (4) |
85 | — | — | — | — | — | — | 25 | — | — | — | — | — | — | — | — | — | 110 | 113 | |||||||||||||||||||||||||||||||||||||||||||||||||||||||||||||
| Ms Esther Giménez-Salinas i Colomer |
85 | — | — | — | — | — | — | 36 | — | — | — | — | — | — | — | — | — | 121 | 114 | |||||||||||||||||||||||||||||||||||||||||||||||||||||||||||||
| Mr Ángel Jado Becerro de Bengoa |
85 | — | — | — | — | — | 21 | 38 | 8 | — | — | — | — | — | — | — | — | 152 | 115 | |||||||||||||||||||||||||||||||||||||||||||||||||||||||||||||
| Mr Juan Rodríguez Inciarte |
85 | — | — | — | — | — | — | 38 | 87 | 1,200 | 445 | 445 | 667 | 667 | 120 | 3.543 | 184 | 3,937 | 2,830 | |||||||||||||||||||||||||||||||||||||||||||||||||||||||||||||
| Ms Isabel Tocino Biscarolasaga (5) |
85 | 170 | — | 19 | — | 4 | — | 36 | 171 | — | — | — | — | — | — | — | — | 485 | 432 | |||||||||||||||||||||||||||||||||||||||||||||||||||||||||||||
| Mr Juan Miguel Villar Mir (6) |
85 | — | — | — | — | — | — | 20 | — | — | — | — | — | — | — | — | — | 105 | 71 | |||||||||||||||||||||||||||||||||||||||||||||||||||||||||||||
| Mr Emilio Botín-Sanz de Sautuola y García de los Ríos (7) |
59 | 118 | — | — | — | — | — | 20 | 1 | 930 | — | — | — | — | — | 930 | 1 | 1,129 | 3,051 | |||||||||||||||||||||||||||||||||||||||||||||||||||||||||||||
| Mr Javier Marín Romano (8) |
||||||||||||||||||||||||||||||||||||||||||||||||||||||||||||||||||||||||||||||||
| Executive vice president |
— | — | — | — | — | — | — | — | — | — | — | — | — | — | — | — | — | — | 767 | |||||||||||||||||||||||||||||||||||||||||||||||||||||||||||||
| Chief executive officer |
85 | 170 | — | — | — | — | — | 36 | 3 | 2,000 | 793 | 793 | 1,190 | 1,190 | 147 | 6,113 | 54 | 6,460 | 3,574 | |||||||||||||||||||||||||||||||||||||||||||||||||||||||||||||
| Mr Fernando de Asúa Álvarez (9) |
113 | 170 | 40 | 19 | 4 | 4 | 47 | 36 | 211 | — | — | — | — | — | — | — | — | 645 | 579 | |||||||||||||||||||||||||||||||||||||||||||||||||||||||||||||
| Mr Vittorio Corbo Lioi (10) |
48 | — | — | — | — | — | — | 8 | — | — | — | — | — | — | — | — | — | 56 | 106 | |||||||||||||||||||||||||||||||||||||||||||||||||||||||||||||
| Mr Abel Matutes Juan (11) |
85 | — | 40 | — | 4 | — | — | 28 | 26 | — | — | — | — | — | — | — | — | 183 | 169 | |||||||||||||||||||||||||||||||||||||||||||||||||||||||||||||
| Lord Burns (Terence) (12) |
— | — | — | — | — | — | — | — | — | — | — | — | — | — | — | — | — | — | 103 | |||||||||||||||||||||||||||||||||||||||||||||||||||||||||||||
| Mr Alfredo Sáenz Abad (13) |
— | — | — | — | — | — | — | — | — | — | — | — | — | — | — | — | — | — | 1,899 | |||||||||||||||||||||||||||||||||||||||||||||||||||||||||||||
| Mr Manuel Soto Serrano (13) |
— | — | — | — | — | — | — | — | — | — | — | — | — | — | — | — | — | — | 137 | |||||||||||||||||||||||||||||||||||||||||||||||||||||||||||||
|
|
|
|
|
|
|
|
|
|
|
|
|
|
|
|
|
|
|
|
|
|
|
|
|
|
|
|
|
|
|
|
|
|
|
|
|
|
|
|
|
|||||||||||||||||||||||||||||||||||||||||
| Total 2014 |
1,347 | 1,310 | 131 | 77 | 18 | 18 | 109 | 484 | 873 | 8,065 | 2,564 | 2,564 | 3,846 | 3,846 | 577 | 21,461 | 884 | 26,713 | — | 8.9 | % | |||||||||||||||||||||||||||||||||||||||||||||||||||||||||||
|
|
|
|
|
|
|
|
|
|
|
|
|
|
|
|
|
|
|
|
|
|
|
|
|
|
|
|
|
|
|
|
|
|
|
|
|
|
|
|||||||||||||||||||||||||||||||||||||||||||
| Total 2013 |
1,415 | 1,308 | 158 | 103 | — | — | — | 468 | 874 | 8,880 | 1,982 | 1,982 | 2,974 | 2,974 | — | 18,792 | 1.398 | — | 24,517 | |||||||||||||||||||||||||||||||||||||||||||||||||||||||||||||
|
|
|
|
|
|
|
|
|
|
|
|
|
|
|
|
|
|
|
|
|
|
|
|
|
|
|
|
|
|
|
|
|
|
|
|
|
|
|
|
|
|||||||||||||||||||||||||||||||||||||||||
| (1) | Member of the audit committee and third deputy chairman since April 29, 2013. |
| (2) | Executive director since January 16, 2015. |
| (3) | Appointed director on January 27, 2014. |
| (4) | All the amounts received were repaid to the Fundación Marcelino Botín. |
| (5) | Member of the executive committee since April 29, 2013. |
| (6) | Board member since May 7, 2013. |
| (7) | Ceased to be a member of the board due to his death on September 9, 2014. |
| (8) | Member of the board and the executive committee since April 29, 2013. Retired from the board on January 12, 2015. |
| (9) | Retired from the board on February 12, 2015. |
| (10) | Retired from the board on July 24, 2014. |
| (11) | Retired from the board on February 18, 2015. |
| (12) | Retired from the board on December 31, 2013. |
| (13) | Retired from the board on April 29, 2013. |
| (a) | Maximum deferred bonus for the period approved by the board of directors at the related meetings. |
| (b) | Fair value of the ILP granted in 2014. |
| (c) | Includes, inter alia, the life and medical insurance costs borne by the Group relating to Bank directors. |
| (d) | Includes the corresponding deferred variable remuneration. |
F-83
Table of Contents
| b) | Remuneration of the board members as representatives of the Bank |
By resolution of the executive committee, all the remuneration received by the Bank’s directors who represent the Bank on the boards of directors of listed companies in which the Bank has a stake, paid by those companies and relating to appointments made after March 18, 2002, accrues to the Group. In 2014 and 2013 the Bank’s directors did not receive any remuneration in respect of these representative duties.
Two directors of the Bank received a total of EUR 295 thousand in 2014 as members of the boards of directors of Group companies (2013: EUR 1,184 thousand), the detail being as follows: Mr Matías Rodríguez Inciarte received EUR 42 thousand as non-executive director of U.C.I., S.A. and Mr Vittorio Corbo Lioi – who resigned as a director of the Bank with effect from July 24, 2014 – received EUR 253 thousand prior to his resignation, of which he received EUR 89 thousand as chairman and non-executive director of Banco Santander—Chile, EUR 156 thousand for advisory services provided to that entity and EUR 8 thousand as non-executive director of Grupo Financiero Santander México, S.A.B. de C.V.
| c) | Post-employment and other long-term benefits |
In 2012, within the framework of the measures implemented by the Group in order to mitigate the risks arising from the defined-benefit pension obligations payable to certain employees, which led to an agreement with the workers’ representatives to convert the defined-benefit obligations existing under the collective agreement into defined-contribution plans (see Note 25), the contracts of the executive directors and the other members of the Bank’s senior management -the senior executives- which provided for defined-benefit pension obligations were amended to convert these obligations into a defined-contribution employee welfare system, which was externalized to Santander Seguros y Reaseguros, Compañía Aseguradora, S.A. The new system grants the executive directors the right to receive a pension benefit upon retirement, regardless of whether or not they are in the Bank’s employ on that date, based on the contributions made to the aforementioned system, and replaced the right to receive a pension supplement which had previously been payable to them upon retirement. The new system expressly excludes any obligation of the Bank to the executive directors other than the conversion of the previous system into the new employee welfare system, which took place in 2012, and, as the case may be, the annual contributions to be made as described below1. In the event of pre-retirement, the executive directors who have not exercised the option to receive their pensions in the form of a lump sum are entitled to receive an annual emolument until the date of retirement.
The initial balance for each executive director in the new defined-contribution welfare system was that corresponding to the market value of the assets in which the provisions for the respective accrued obligations had been invested, at the date on which the former pension obligations were converted into the new welfare system2.
| 1 | As provided for in the contracts of the executive directors and members of senior management prior to their modification, Mr Emilio Botín-Sanz de Sautuola y García de los Ríos and Mr Matías Rodríguez Inciarte had exercised the option to receive the accrued pensions -or amounts similar thereto- in the form of a lump sum (i.e. in a single payment), which meant that no further pension benefit would accrue to them from that time, and the lump sum to be received, which would be updated at the agreed-upon interest rate, was fixed. |
| 2 | In the case of Mr Emilio Botín-Sanz de Sautuola y García de los Ríos and Mr Matías Rodríguez Inciarte, the initial balance corresponded to the amounts that were set when, as described above, they exercised the option to receive a lump sum, and includes the interest accrued on these amounts from that date. |
F-84
Table of Contents
Since 2013 the Bank makes annual contributions to the employee welfare system for the benefit of the executive directors and senior executives, in proportion to their respective pensionable bases, until they leave the Group, or until their retirement from the Group, death or disability (including, as the case may be, during the pre-retirement period). No contributions are made for the executive directors and senior executives who, prior to the conversion of the defined-benefit pension obligations into the current defined-contribution employee welfare system, had exercised the option to receive their pension rights in a lump sum3.
The terms of the employee welfare system regulate the impact of the deferral of the computable variable remuneration on the benefit payments covered by the system upon retirement and, as the case may be, the withholding tax on shares arising from such remuneration.
In 2013, as a result of his appointment as chief executive officer, changes were introduced to the contract of Mr Javier Marín Romano with respect to the pension obligations stipulated in his senior management contract. The annual contribution to the employee welfare system was thereafter calculated as 80% of the sum of: (i) fixed annual remuneration; and (ii) 30% of the arithmetic mean of the last three gross amounts of variable remuneration. Also, the pensionable base in relation to the death and permanent disability scheme provided for in his senior management contract became 100% of fixed annual remuneration. Under his senior management contract the annual contribution was 55% of his fixed remuneration, and the pensionable base in the event of death or disability was 80% of his fixed remuneration.
Following is a detail of the balances relating to each of the current executive directors under the welfare system at December 31, 2014 and 2013:
| Thousands of euros | ||||||||
| 2014 | 2013 | |||||||
| Ms Ana Patricia Botín-Sanz de Sautuola y O’Shea (1) |
40,134 | 37,202 | ||||||
| Mr Matías Rodríguez Inciarte |
47,255 | 46,058 | ||||||
| Mr Juan Rodríguez Inciarte |
13,730 | 13,410 | ||||||
| Mr Emilio Botín-Sanz de Sautuola y García de los Ríos |
— | (2) | 25,864 | |||||
| Mr Javier Marín Romano (3) |
4,523 | 4,346 | ||||||
| Mr Alfredo Sáenz Abad (4) |
— | — | ||||||
|
|
|
|
|
|||||
| 105,642 | 126,880 | |||||||
|
|
|
|
|
|||||
| (1) | Includes the amounts relating to the period of provision of services at Banesto, externalized with another insurance company. |
| (2) | Following his death on September 9, 2014, a death benefit of the amount of the accumulated rights (EUR 26,498 thousand) is payable to the beneficiaries designated in the policy instrumenting the welfare system. |
| (3) | Ceased to be a director on January 12, 2015 and took voluntary pre-retirement, as provided for in his contract, opting to receive the annual pre-retirement emoluments to which he is entitled (EUR 800 thousand gross) in a single payment (EUR 10,861 thousand gross). As stipulated in his contract, the Bank will make annual contributions to the welfare system, amounting to 55% of this director’s annual emolument during the pre-retirement period, and Mr Marín will be entitled to receive, at the time of his retirement, the retirement benefit recognized in the welfare system, equal to the amount of the balance accumulated in the system corresponding to him at that time. As regards the deferred variable remuneration corresponding to Mr Marín in relation to years prior to his pre-retirement, the scheme described in the relevant sections of this report shall apply, and Mr Marín will receive this remuneration, if appropriate, on the dates envisaged in the corresponding plans, subject to the stipulated conditions for its accrual being met. |
| 3 | Mr Rodrigo Echenique, appointed executive director on 16 January 2015, does not participate in the welfare system and is not entitled to have any contributions made in his favor by the Bank in this connection, notwithstanding the pension rights to which he was entitled prior to his appointment as executive director. |
F-85
Table of Contents
| (4) | In April 2013, upon his retirement, Mr Alfredo Sáenz Abad requested payment of the pensions to which he was entitled in a lump sum (EUR 88.5 million gross). For such purpose, his pension rights were settled, in accordance with the applicable contractual and legal terms, through: i) the payment in cash of EUR 38.2 million relating to the net amount of the pension calculated taking into account the fixed remuneration, and EUR 12.2 million relating to the net amount of the pension calculated taking into account the accrued variable remuneration at the retirement date, and ii) the investment by Mr Sáenz of those EUR 12.2 million in Santander shares (2,216,082 shares), which were deposited at the Bank on a restricted basis until April 29, 2018. |
The Group also has pension obligations to other directors amounting to EUR 18 million (December 31, 2013: EUR 18 million). The payments made in 2014 to the members of the board entitled to post-employment benefits amounted to EUR 1.2 million (2013: EUR 1.2 million), of which EUR 0.9 million relate to Mr Rodrigo Echenique Gordillo (appointed executive director on January 16, 2015).
Lastly, the contracts of the executive directors who had not exercised the option referred to above prior to the conversion of the defined-benefit pension obligations into the current welfare system include a supplementary welfare regime for the contingency of death (surviving spouse and child benefits) and permanent disability of serving directors.
The provisions recognized in 2014 and 2013 for retirement pensions and supplementary benefits (surviving spouse and child benefits, and permanent disability) were as follows:
| Thousands of euros | ||||||||
| 2014 | 2013 | |||||||
| Ms Ana Botín-Sanz de Sautuola y O’Shea |
2,140 | 1,443 | ||||||
| Mr Matías Rodríguez Inciarte |
— | — | ||||||
| Mr Juan Rodríguez Inciarte |
718 | 609 | ||||||
| Mr Emilio Botín-Sanz de Sautuola y García de los Ríos |
— | — | ||||||
| Mr Javier Marín Romano |
2,126 | 2,006 | ||||||
| Mr Alfredo Sáenz Abad |
— | — | ||||||
|
|
|
|
|
|||||
| 4,984 | 4,058 | |||||||
|
|
|
|
|
|||||
| d) | Insurance |
The Group has taken out life insurance policies for the Bank’s directors, who will be entitled to receive benefits if they are declared disabled; in the event of death, the benefits will be payable to their heirs. The premiums paid by the Group are included in the Other remuneration column of the table shown in Note 5.a.iii above. Also, the following table provides information on the sums insured for the Bank’s executive directors:
| Insured sum (Thousands of euros) |
||||||||
| 2014 | 2013 | |||||||
| Ms Ana Botín-Sanz de Sautuola y O’Shea |
7,500 | 6,000 | ||||||
| Mr Matías Rodríguez Inciarte |
5,131 | 5,131 | ||||||
| Mr Juan Rodríguez Inciarte |
2,961 | 2,961 | ||||||
| Mr Emilio Botín-Sanz de Sautuola y García de los Ríos |
— | — | ||||||
| Mr Javier Marín Romano |
2,400 | 2,400 | ||||||
| Mr Alfredo Sáenz Abad |
— | — | ||||||
|
|
|
|
|
|||||
| 17,992 | 16,492 | |||||||
|
|
|
|
|
|||||
Additionally, other directors have life insurance policies the cost of which is borne by the Group, the related insured sum being EUR 1.4 million at December 31, 2014 (2013: EUR 1.4 million).
F-86
Table of Contents
| e) | Deferred variable remuneration systems |
Following is information on the maximum number of shares to which the executive directors are entitled at the beginning and end of 2013 and 2014 due to their participation in the deferred variable remuneration systems, which instrumented a portion of their variable remuneration relating to prior years, as well as on the payments, in shares or in cash, made to them in 2013 and 2014 where the terms and conditions for the receipt thereof had been met (see Note 47):
| i) | Mandatory investment share plan |
Pursuant to the obligatory investment share plan (see Note 47), as deferred share-based variable remuneration in 2009, the executive directors acquired, prior to February 28, 2010, the number of Bank shares shown in the table below, corresponding to the third cycle of this plan. Executive directors who retain the shares acquired in the obligatory investment and remain in the Group’s employ for three years from the date on which the obligatory investment is made are entitled to receive the same number of Bank shares as that composing their initial obligatory investment and where none of the following circumstances exist in the three-year period from the investment in the shares: (i) poor financial performance of the Group; (ii) breach by the beneficiary of the codes of conduct or other internal regulations, including, in particular, those relating to risks, where applicable to the executive in question; or (iii) material restatement of the Group’s financial statements, except when it is required pursuant to a change in accounting standards, are entitled to receive the same number of Bank shares as that composing their initial obligatory investment.
The conditions having been met for their receipt, in February 2013, as approved by the board, at the proposal of the appointments and remuneration committee, the gross number of shares detailed above relating to the third cycle accrued to the executive directors, and this number is equal to the number of shares initially acquired by them.
| Maximum number of shares to be delivered (2) |
||||
| 3rd cycle 2010-2012 |
||||
| Ms Ana Botín-Sanz de Sautuola y O’Shea (1) |
18,446 | |||
| Mr Matías Rodríguez Inciarte |
25,849 | |||
| Mr Juan Rodríguez Inciarte |
15,142 | |||
| Mr Emilio Botín-Sanz de Sautuola y García de los Ríos |
20,515 | |||
| Mr Javier Marín Romano |
11,092 | |||
|
|
|
|||
| 91,044 | ||||
|
|
|
|||
| (1) | The maximum number of shares corresponding to Ms Ana Patricia Botín-Sanz de Sautuola y O’Shea as beneficiary of this plan is in line with the resolution adopted by the shareholders at the annual general meeting of Banesto held on February 24, 2010. |
| (2) | In addition, Mr Alfredo Sáenz Abad received 49,000 shares as a result of his participation in the third cycle of the aforementioned plan. |
F-87
Table of Contents
| ii) | Performance share plan (Plan I13) |
The table below shows the maximum number of options granted at January 1, 2013 to each executive director based on their participation in the I13 incentive plan (Plan I13) which instrumented a portion of the variable remuneration for 2010. As established in the plan, the number of shares received was determined by the degree of achievement of the targets to which the plan was tied, and the necessary minimum not having been reached, their options under the plan were cancelled.
| Options at January 1, 2013 |
Shares delivered in 2013 (number) |
Options cancelled in 2013 (number) |
Options at December 31, 2013 |
Grant date | Share delivery deadline |
|||||||||||||||||||
| Plan I13 |
||||||||||||||||||||||||
| Ms Ana Botín-Sanz de Sautuola y O’Shea (1) |
56,447 | — | (56,447 | ) | — | 06-11-10 | 07-31-13 | |||||||||||||||||
| Mr Matías Rodríguez Inciarte |
105,520 | — | (105,520 | ) | — | 06-11-10 | 07-31-13 | |||||||||||||||||
| Mr Juan Rodríguez Inciarte |
60,904 | — | (60,904 | ) | — | 06-11-10 | 07-31-13 | |||||||||||||||||
| Mr Emilio Botín-Sanz de Sautuola y García de los Ríos |
82,941 | — | (82,941 | ) | — | 06-11-10 | 07-31-13 | |||||||||||||||||
| Mr Alfredo Sáenz Abad (2) |
228,445 | — | (228,445 | ) | — | 06-11-10 | 07-31-13 | |||||||||||||||||
|
|
|
|
|
|
|
|
|
|||||||||||||||||
| 534,257 | — | (534,257 | ) | — | ||||||||||||||||||||
|
|
|
|
|
|
|
|
|
|||||||||||||||||
| (1) | Without prejudice to the Banesto shares corresponding to Ms Ana Botín-Sanz de Sautuola y O’Shea by virtue of the various Banesto share-based incentive plans approved by the shareholders at the general meeting of Banesto (a maximum of 32,358 Banesto shares relating to her participation in the Banesto Share-Based Incentive Plan expiring in 2013). |
| (2) | Following his resignation on April 29, 2013, Mr Alfredo Sáenz Abad lost his entitlement arising from his participation in these plans since he did not meet all the conditions stipulated for the shares to be received. |
| iii) | Deferred conditional delivery share plan |
The 2010 variable remuneration of the executive directors and Group executives or employees whose variable remuneration or annual bonus for 2010 exceeded, in general, EUR 300,000 (gross) was approved by the board of directors through the instrumentation of the first cycle of the deferred conditional delivery share plan, whereby a portion of the aforementioned variable remuneration or bonus was deferred over a period of three years for it to be paid, where appropriate, in Santander shares. Application of this cycle, insofar as it entails the delivery of shares to the plan beneficiaries, was authorized by the annual general meeting held on June 11, 2010.
In addition to the requirement that the beneficiary remains in the Group’s employ, with the exceptions included in the plan regulations, the accrual of the share-based deferred remuneration is conditional upon none of the following circumstances existing, in the opinion of the board of directors, during the period prior to each of the deliveries: (i) poor financial performance of the Group; (ii) breach by the beneficiary of internal regulations, including, in particular, those relating to risks; (iii) material restatement of the Group’s financial statements, except when it is required pursuant to a change in accounting standards; or (iv) significant changes in economic capital and the qualitative assessment of risk.
The share-based bonus is being deferred over three years and will be paid, where appropriate, in three instalments starting after the first year.
F-88
Table of Contents
The number of shares allocated to the executive directors for deferral purposes in 2010 and the shares delivered in 2013 (second third) and in February 2014 (third third), once the conditions for receiving them had been met, are as follows (the plan having been settled):
| Number of shares deferred on bonus for 2010 (2) |
Number of shares delivered in 2013 (2nd third) (2) |
Number of shares delivered in 2014 (3rd third) (2) |
||||||||||
| Ms Ana Botín-Sanz de Sautuola y |
91,187 | 30,395 | 19,240 | |||||||||
| Mr Matías Rodríguez Inciarte |
135,188 | 45,063 | 45,063 | |||||||||
| Mr Juan Rodríguez Inciarte |
61,386 | 20,462 | 20,462 | |||||||||
| Mr Emilio Botín-Sanz de Sautuola y García de los Ríos |
94,345 | 31,448 | 31,448 | |||||||||
| Mr Javier Marín Romano |
37,749 | 12,583 | 12,583 | |||||||||
| (1) | Shares of Banesto, as authorized by the shareholders of that entity at the annual general meeting of February 23, 2011. Following the merger of Banesto with the Bank, 19,240 shares of the Bank were delivered in 2014, equal to the 30,395 shares of Banesto authorized by the annual general meeting. |
| (2) | On January 23, 2012, Mr Francisco Luzón López took pre-retirement and resigned from his positions as director and head of the Americas division. In accordance with the plan regulations, Mr Francisco Luzón López retained the right to receive the shares corresponding to his participation in the plan, subject to compliance with the conditions established for them to be received. In both 2013 and 2014 he received 51,660 shares relating to the number of shares to which he was entitled as a result of the vesting of the second and third thirds of the deferred portion of his 2010 bonus. |
Furthermore, Mr Alfredo Sáenz Abad ceased to discharge his duties as director on April 29, 2013. In accordance with the plan regulations, Mr Alfredo Sáenz Abad retained the right to receive the shares corresponding to his participation in the plan, subject to compliance with the conditions established for them to be received. In both 2013 and 2014 he received 104,150 shares relating to the number of shares to which he was entitled as a result of the vesting of the second and third thirds of the deferred portion of his 2010 bonus.
| iv) | Deferred conditional variable remuneration plan |
Since 2011, the bonuses of executive directors and certain executives (including senior management) and employees who assume risk, who perform control functions or receive an overall remuneration that puts them on the same remuneration level as senior executives and employees who assume risk (all of whom are referred to as identified staff) have been approved by the board of directors and instrumented, respectively, through various cycles of the deferred conditional variable remuneration plan. Application of these cycles, insofar as they entail the delivery of shares to the plan beneficiaries, was authorized by the related annual general meetings.
The purpose of these plans is to defer a portion of the bonus of the beneficiaries thereof (60% in the case of executive directors) over a period of three years for it to be paid, where appropriate, in cash and in Santander shares; the other portion of the bonus is also to be paid in cash and Santander shares, upon commencement of the cycles, in accordance with the rules set forth below.
In addition to the requirement that the beneficiary remains in Santander Group’s employ, the accrual of the deferred remuneration is conditional upon none of the following circumstances existing -in the opinion of the board of directors following a proposal of the remuneration committee- in relation to the corresponding year in the period prior to each of the deliveries: (i) poor financial performance of the Group; (ii) breach by the beneficiary of internal regulations, including, in particular, those relating to risks; (iii) material restatement of the Group’s financial statements, except when it is required pursuant to a change in accounting standards; or (iv) significant changes in the Group’s economic capital or its risk profile. All the foregoing shall in each case be governed by the rules of the relevant plan cycle.
F-89
Table of Contents
On each delivery, the beneficiaries will be paid an amount in cash equal to the dividends paid for the amount deferred in shares and the interest on the amount deferred in cash. If the Santander Dividendo Elección scrip dividend scheme is applied, they will be paid the price offered by the Bank for the bonus share rights corresponding to those shares.
The maximum number of shares to be delivered is calculated taking into account the volume-weighted average prices for the 15 trading sessions prior to the date on which the board of directors approves the bonus for the Bank’s executive directors for each year.
The table below shows the number of Santander shares assigned to each executive director and not yet delivered at January 1, 2013, December 31, 2013 and December 31, 2014, and the gross shares delivered to them in 2013 and 2014, by way of either immediate payment or deferred payment, in the latter case once the board had determined, at the proposal of the appointments and remuneration committee, that the third relating to each plan had accrued. The shares resulted from each of the plans which instrumented the variable remuneration of 2011, 2012, 2013 and 2014, as shown in the following table:
F-90
Table of Contents
| Share-based variable remuneration |
Maximum number of shares to be delivered at January 1, 2013 |
Shares delivered in 2013 (immediate payment 2012 variable remuneration) |
Shares delivered in 2013 (deferred payment 2011 variable remuneration) |
2013 variable remuneration (maximum number of shares to be delivered) |
Maximum number of shares to be delivered at December 31, 2013 |
Shares delivered in 2014 (immediate payment 2013 variable remuneration) |
Shares delivered in 2014 (deferred payment 2012 variable remuneration) |
Shares delivered in 2014 (deferred payment 2011 variable remuneration) |
2014 variable remuneration (maximum number of shares to be delivered) |
Maximum number of shares to be delivered at December 31, 2014 |
||||||||||||||||||||||||||||||
| 2011 variable remuneration |
||||||||||||||||||||||||||||||||||||||||
| Ms Ana Botín-Sanz Sautuola y O’Shea |
141,002 | — | (47,001 | ) | — | 94,001 | — | — | (47,001 | ) | — | 47,000 | ||||||||||||||||||||||||||||
| Mr Matías Rodríguez Inciarte |
188,634 | — | (62,878 | ) | — | 125,756 | — | — | (62,878 | ) | — | 62,878 | ||||||||||||||||||||||||||||
| Mr Juan Rodríguez Inciarte |
110,070 | — | (36,690 | ) | — | 73,380 | — | — | (36,690 | ) | — | 36,690 | ||||||||||||||||||||||||||||
| Mr Emilio Botín-Sanz de Sautuola y García de los Ríos |
149,327 | — | (49,776 | ) | — | 99,551 | — | — | (49,776 | ) | — | 49,775 | ||||||||||||||||||||||||||||
| Mr Javier Marín Romano |
77,882 | — | (25,961 | ) | — | 51,921 | — | — | (25,961 | ) | — | 25,960 | ||||||||||||||||||||||||||||
| Mr Francisco Luzón López (1) |
196,494 | — | (65,498 | ) | — | 130,996 | — | — | (65,498 | ) | — | 65,498 | ||||||||||||||||||||||||||||
| Mr Alfredo Sáenz Abad (2) |
371,049 | — | (123,683 | ) | — | 247,366 | — | — | (123,683 | ) | — | 123,683 | ||||||||||||||||||||||||||||
| 1,234,458 | — | (411,487 | ) | — | 822,971 | — | — | (411,487 | ) | — | 411,484 | |||||||||||||||||||||||||||||
| 2012 variable remuneration |
||||||||||||||||||||||||||||||||||||||||
| Ms Ana Botín-Sanz Sautuola y O’Shea |
174,790 | (69,916 | ) | — | — | 104,874 | — | (34,958 | ) | — | — | 69,916 | ||||||||||||||||||||||||||||
| Mr Matías Rodríguez Inciarte |
207,648 | (83,059 | ) | — | — | 124,589 | — | (41,530 | ) | — | — | 83,059 | ||||||||||||||||||||||||||||
| Mr Juan Rodríguez Inciarte |
121,165 | (48,466 | ) | — | — | 72,699 | — | (24,233 | ) | — | — | 48,466 | ||||||||||||||||||||||||||||
| Mr Emilio Botín-Sanz de Sautuola y García de los Ríos |
109,879 | (43,952 | ) | — | — | 65,927 | — | (21,976 | ) | — | — | 43,951 | ||||||||||||||||||||||||||||
| Mr Javier Marín Romano |
116,908 | (58,454 | ) | 58,454 | — | (19,485 | ) | — | — | 38,969 | ||||||||||||||||||||||||||||||
| Mr Alfredo Sáenz Abad (2) |
273,028 | (109,211 | ) | — | — | 163,817 | — | (54,605 | ) | — | — | 109,212 | ||||||||||||||||||||||||||||
| 1,003,418 | (413,058 | ) | — | — | 590,360 | — | (196,787 | ) | — | — | 393,573 | |||||||||||||||||||||||||||||
| 2013 variable remuneration |
||||||||||||||||||||||||||||||||||||||||
| Ms Ana Botín-Sanz Sautuola y O’Shea |
— | — | — | 165,603 | 165,603 | (66,241 | ) | — | — | — | 99,362 | |||||||||||||||||||||||||||||
| Mr Matías Rodríguez Inciarte |
— | — | — | 172,731 | 172,731 | (69,092 | ) | — | — | — | 103,639 | |||||||||||||||||||||||||||||
| Mr Juan Rodríguez Inciarte |
— | — | — | 110,747 | 110,747 | (44,299 | ) | — | — | — | 66,448 | |||||||||||||||||||||||||||||
| Mr Emilio Botín-Sanz de Sautuola y García de los Ríos |
— | — | — | 105,718 | 105,718 | (42,287 | ) | — | — | — | 63,431 | |||||||||||||||||||||||||||||
| Mr Javier Marín Romano |
— | — | — | 187,125 | 187,125 | (74,850 | ) | — | — | — | 112,275 | |||||||||||||||||||||||||||||
| — | — | — | 741,924 | 741,924 | (296,769 | ) | — | — | — | 445,155 | ||||||||||||||||||||||||||||||
| 2014 variable remuneration |
||||||||||||||||||||||||||||||||||||||||
| Ms Ana Botín-Sanz Sautuola y O’Shea |
— | — | — | — | — | — | — | — | 304,073 | 304,073 | ||||||||||||||||||||||||||||||
| Mr Matías Rodríguez Inciarte |
— | — | — | — | — | — | — | — | 231,814 | 231,814 | ||||||||||||||||||||||||||||||
| Mr Juan Rodríguez Inciarte |
— | — | — | — | — | — | — | — | 179,680 | 179,680 | ||||||||||||||||||||||||||||||
| Mr Emilio Botín-Sanz de Sautuola y García de los Ríos |
— | — | — | — | — | — | — | — | — | — | ||||||||||||||||||||||||||||||
| Mr Javier Marín Romano |
— | — | — | — | — | — | — | — | 320,563 | 320,563 | ||||||||||||||||||||||||||||||
| — | — | — | — | — | — | — | — | 1,036,130 | 1,036,130 | |||||||||||||||||||||||||||||||
| (1) | On January 23, 2012, Mr Francisco Luzón López took pre-retirement and resigned from his positions as director and head of the Americas division. In relation to his 2011 variable remuneration to be received in cash and in Santander shares, the board resolved, at the committee’s proposal, to deliver him EUR 743 thousand and 130,996 shares as an immediate payment. The deferred amount in cash and in shares relating to the first, second and third thirds was paid in February 2013, 2014 and 2015, the requirements of the plan for the receipt thereof having been met. Upon each delivery of shares, he was paid an amount in cash equal to the dividends paid on those shares and, if the Santander Dividendo Elección scrip dividend scheme is applied, the price offered by the Bank for the bonus share rights relating to the aforementioned shares, as well as the interest accrued on the amount deferred in cash. |
| (2) | Mr Alfredo Sáenz Abad ceased to discharge his duties as director on April 29, 2013. The deferred amounts, in cash (two gross payments of EUR 702 thousand each, relating to the deferred variable remuneration for 2011, and three of EUR 351 thousand each, relating to the deferred variable remuneration for 2012) and in shares (see table above), relating to the deferred variable remuneration for 2011 and 2012, have or will be paid to him on the corresponding maturity dates, together with the remuneration relating to the shares (dividends and amounts offered for the bonus share rights if the Santander Dividendo Elección scrip dividend scheme is applied) and the interest accrued on the cash amounts, subject to compliance with the requirements set forth in the related resolutions of the general meetings and the plans’ regulations, as well as all other terms set forth therein. |
F-91
Table of Contents
Furthermore, the table below shows the cash delivered in 2013 and 2014, by way of either immediate payment or deferred payment, in the latter case once the board had determined, at the proposal of the appointments and remuneration committee that the third relating to each plan had accrued:
| Thousands of euros | ||||||||||||||||
| 2014 | 2013 | |||||||||||||||
| Cash paid (immediate payment 2013 variable remuneration) |
Cash paid (third of deferred payment 2012 and 2011 variable remuneration) |
Cash paid (immediate payment 2012 variable remuneration) |
Cash paid (1st third deferred payment 2011 variable remuneration) |
|||||||||||||
| Ms Ana Botín-Sanz de Sautuola y |
466 | 513 | 449 | 286 | ||||||||||||
| Mr Matías Rodríguez Inciarte |
462 | 624 | 534 | 357 | ||||||||||||
| Mr Juan Rodríguez Inciarte |
296 | 364 | 311 | 208 | ||||||||||||
| Mr Emilio Botín-Sanz de Sautuola y García de los Ríos |
282 | 423 | 282 | 282 | ||||||||||||
| Mr Javier Marín Romano |
500 | 272 | 376 | 147 | ||||||||||||
| Mr Francisco Luzón López |
— | — | (2) | — | 371 | |||||||||||
| Mr Alfredo Sáenz Abad |
— | — | (3) | 702 | 702 | |||||||||||
|
|
|
|
|
|
|
|
|
|||||||||
| 2,005 | 2,197 | 2,654 | 2,353 | |||||||||||||
|
|
|
|
|
|
|
|
|
|||||||||
| (1) | Euro equivalent value of the original amount in pounds sterling. |
| (2) | In 2014 he received EUR 371 thousand relating to the second third of the conditional deferred variable remuneration plan of 2011, the requirements for the accrual thereof having been met. |
| (3) | In 2014 he received EUR 1,053 thousand relating to the second and first thirds of the conditional deferred variable remuneration plans of 2011 and 2012, the requirements for the accrual thereof having been met. |
| v) | Performance share plan (ILP) |
The table below shows the maximum number of shares to which the executive directors are entitled, as part of their variable remuneration for 2014, as a result of their participation in the ILP (see Note 47).
| Maximum number of shares |
||||
| Ms Ana Botín-Sanz de Sautuola y O’Shea |
62,395 | |||
| Mr Matías Rodríguez Inciarte |
75,655 | |||
| Mr Juan Rodríguez Inciarte |
53,346 | |||
| Mr Emilio Botín-Sanz de Sautuola y García de los Ríos |
— | |||
| Mr Javier Marín Romano |
65,470 | |||
|
|
|
|||
| Total |
256,866 | |||
|
|
|
|||
The accrual and amount of the ILP are conditional upon the performance of Santander’s TSR compared to that of the companies in the benchmark group over a multiannual period. Therefore, in 2016, 2017 and 2018 the amount to be received by each executive director in relation to the ILP (the ILP Annual Amount) will be determined by applying to the third of the ILP Agreed Amount the percentage relating to the performance of the TSR in accordance with the table approved in the plan (see Note 47).
The shares to be delivered on each ILP payment date, based on compliance with the related multiannual TSR target will be conditional, in addition to the requirement that the beneficiary remains in the Group’s employ, with the exceptions included in the plan regulations, upon none of the following circumstances existing -in the opinion
F-92
Table of Contents
of the board of directors following a proposal of the remuneration committee-, during the period prior to each of the deliveries as a result of actions performed in 2014: (i) poor financial performance of the Group; (ii) breach by the beneficiary of internal regulations, including, in particular, those relating to risks; (iii) material restatement of the Group’s financial statements, except when it is required pursuant to a change in accounting standards; or (iv) significant changes in the Group’s economic capital or risk profile.
| f) | Loans |
The Group’s direct risk exposure to the Bank’s directors and the guarantees provided for them are detailed below. These transactions were made on an arm’s-length basis or the related compensation in kind was recognized :
| Thousands of euros | ||||||||||||||||||||||||
| 2014 | 2013 | |||||||||||||||||||||||
| Loans and credits |
Guarantees | Total | Loans and credits |
Guarantees | Total | |||||||||||||||||||
| Mr Matías Rodríguez Inciarte |
8 | — | 8 | 17 | — | 17 | ||||||||||||||||||
| Mr Juan Rodríguez Inciarte |
4,182 | — | 4,182 | 4,734 | — | 4,734 | ||||||||||||||||||
| Mr Rodrigo Echenique Gordillo |
317 | — | 317 | 650 | — | 650 | ||||||||||||||||||
| Mr Javier Botín-Sanz de Sautuola y O’Shea |
18 | — | 18 | 22 | — | 22 | ||||||||||||||||||
| Mr Ángel Jado Becerro de Bengoa |
1 | — | 1 | 7 | — | 7 | ||||||||||||||||||
| Ms Isabel Tocino Biscarolasaga |
7 | — | 7 | 20 | — | 20 | ||||||||||||||||||
| Mr Vittorio Corbo Lioi |
— | — | — | 4 | — | 4 | ||||||||||||||||||
| Mr Javier Marín Romano |
723 | — | 723 | 707 | — | 707 | ||||||||||||||||||
|
|
|
|
|
|
|
|
|
|
|
|
|
|||||||||||||
| 5,255 | — | 5,255 | 6,161 | — | 6,161 | |||||||||||||||||||
|
|
|
|
|
|
|
|
|
|
|
|
|
|||||||||||||
| g) | Senior managers |
Following is a detail of the remuneration, in terms of gross salary, maximum bonus amount and in 2014 fair value of the remuneration for participation in the ILP plan, approved for the Bank’s executive vice presidents (*) in 2014 and 2013:
| Number of persons (1) |
Thousands of euros | |||||||||||||||||||||||||||||||||||||||||
| Salaries | Other remuneration (3) |
Total | ||||||||||||||||||||||||||||||||||||||||
| Fixed | Variable - Immediate payment |
Variable - Deferred payment (2) |
ILP | Total | ||||||||||||||||||||||||||||||||||||||
| In cash | In shares | In cash | In shares | |||||||||||||||||||||||||||||||||||||||
| 2014 | 27 | 26,211 | 9,990 | 9,990 | 12,422 | 12,422 | 2,264 | 73,299 | 7,493 | (4) | 80,792 | |||||||||||||||||||||||||||||||
| 2013 | 28 | 26,040 | 9,521 | 9,521 | 9,588 | 9,588 | — | 64,257 | 8,416 | 72,673 | ||||||||||||||||||||||||||||||||
| (*) | Excluding executive directors’ remuneration, which is detailed above. |
| (1) | Persons who at some point in the year occupied the position of executive vice president. The amounts reflect the remuneration for the full year regardless of the number of months in which the position of executive vice president was occupied. |
| (2) | The shareholders at the annual general meetings of March 22, 2013 and March 28, 2014 approved the third and fourth cycles of the deferred conditional variable remuneration plan, whereby payment of a portion of the variable remuneration for 2013 and 2014 will be deferred over three years for it to be paid, where appropriate, in three equal portions, 50% in cash and 50% in Santander shares, provided that the conditions for entitlement to the remuneration are met. The amount of the immediate payment in shares for 2014 relates to 1,514,738 Santander shares and 148,631 Banco Santander (Brasil) S.A. shares (2013: 1,331,781 Santander shares and 165,100 Banco Santander (Brasil) S.A. shares). The shares relating to the amount of the deferred payment in shares are shown in the table below. |
F-93
Table of Contents
| (3) | Includes other remuneration items such as life insurance premiums totaling EUR 1,290 thousand (2013: EUR 1,499 thousand). |
| (4) | In addition, USD 6.9 million were paid in relation to the extraordinary taxation in the United States due to the transformation of the pension plans of Banco Santander, S.A. |
The maximum amount of the ILP to which the executive vice presidents are entitled was set by the board of directors at a total of EUR 6,238 thousand (with a fair value of EUR 2,264 thousand). The accrual and amount of the ILP are subject, inter alia, to achievement of the multiannual TSR targets envisaged in the plan. Any ILP payments will be received in full in shares and deferred in thirds (to be received in 2016, 2017 and 2018).
Following is a detail of the maximum number of Santander shares that the Bank’s executive vice presidents (excluding executive directors) were entitled to receive at December 31, 2014 and 2013 relating to the deferred portion under the various plans then in force (see Note 47):
| Maximum number of shares to be delivered |
12/31/14 | 12/31/13 | ||||||
| Deferred conditional delivery plan (2010) |
— | 482,495 | ||||||
| Deferred conditional variable remuneration plan (2011) |
637,995 | 1,480,251 | ||||||
| Deferred conditional variable remuneration plan (2012) |
1,014,196 | 1,660,832 | (1) | |||||
| Deferred conditional variable remuneration plan (2013) |
1,412,164 | 1,341,718 | ||||||
| Deferred conditional variable remuneration plan (2014) |
1,857,841 | (2) | — | |||||
| ILP (2014) |
1,008,398 | — | ||||||
| (1) For the executives who joined from Banesto, the Banesto shares were converted into Santander shares at EUR 0.633 per share. (2) In addition, at December 31, 2014 they were entitled to a maximum of 222,946 Banco Santander (Brasil) S.A. shares (the maximum number of shares corresponding to the deferred portion of the 2014 bonus) |
| |||||||
In addition, at December 31, 2013 they were entitled to a maximum of 167,943 Banco Santander (Brasil) S.A. shares and to a maximum of 843,718 options on Banco Santander (Brasil) S.A. shares (343,718 under the share option plan approved in 2011, the exercise of which, subject to the plan’s terms and conditions, commenced in July 2014, plus 500,000 under the share option plan approved in 2013, the exercise of which, subject to the plan’s terms and conditions, may commence in July 2016). In 2014, 51,558 share options under the plan approved in 2011 were exercised and the remainder of these options were cancelled. All other options remained in force at December 31, 2014, in accordance with the terms and conditions of the corresponding plans.
In 2014 and 2013, since the conditions established in the corresponding deferred share-based remuneration schemes for prior years had been met, in addition to the payment of the related cash amounts, the following number of Santander shares was delivered to the executive vice presidents:
| Number of shares delivered |
2014 | 2013 | ||||||
| Third cycle - obligatory investment plan |
— | 275,325 | ||||||
| Deferred conditional delivery plan (2010) |
365,487 | 482,494 | (1) | |||||
| Deferred conditional variable remuneration plan (2011) |
637,996 | 708,375 | (2) | |||||
| Deferred conditional variable remuneration plan (2012) |
507,098 | — | ||||||
| (1) In addition, 14,705 Banesto shares were delivered. (2) In addition, 50,159 Banesto shares were delivered. |
||||||||
As indicated in section c) of this Note, in 2012 the contracts of the members of the Bank’s senior management which provided for defined-benefit pension obligations were amended to convert these obligations into a defined-contribution employee welfare system, which was externalized to Santander Seguros y Reaseguros, Compañía Aseguradora, S.A. The new system grants the senior executives the right
F-94
Table of Contents
to receive a pension benefit upon retirement, regardless of whether or not they are in the Bank’s employ on that date, based on the contributions made to the aforementioned system, and replaces the right to receive a pension supplement which had previously been payable to them upon retirement. The new system expressly excludes any obligation of the Bank to the executives other than the conversion of the previous system into the new employee welfare system, which took place in 2012, and, as the case may be, the annual contributions to be made. In the event of pre-retirement, the senior executives who have not exercised the option described in Note 5.c are entitled to an annual emolument until the date of retirement.
The senior executives’ beginning balance under the new employee welfare system amounted to EUR 287 million. This balance reflects the market value, at the date of conversion of the former pension obligations into the new employee welfare system, of the assets in which the provisions for the respective accrued obligations had been invested. The balance at December 31, 2014 amounted to EUR 296 million (December 31, 2013: EUR 312 million).
The contracts of the senior executives who had not exercised the option referred to in Note 5.c) prior to the conversion of the defined-benefit pension obligations into the current welfare system include a supplementary welfare regime for the contingencies of death (surviving spouse and child benefits) and permanent disability of serving executives.
Additionally, the total sum insured under life and accident insurance policies relating to this group of employees amounted to EUR 154 million at December 31, 2014 (December 31, 2013: EUR 92 million).
Lastly, the net charge to the consolidated income statement amounted to EUR 20 million in 2014 (2013: EUR 19.7 million).
| h) | Post-employment benefits to former directors and former executive vice presidents |
The post-employment benefits and settlements paid in 2014 to former directors of the Bank, other than those detailed in Note 5.c and below4, amounted to EUR 8.9 million (2013: EUR 7.2 million). Also, the post-employment benefits and settlements paid in 2014 to former executive vice presidents amounted to EUR 37.2 million (2013: EUR 21 million).
In 2014 a period provision of EUR 250 thousand was recognized in the consolidated income statement in connection with the Group’s pension and similar obligations to former directors of the Bank (including the insurance premiums for the supplementary surviving spouse/child and permanent disability benefits), and provisions of EUR 3,272 thousand were released in relation to former executive vice presidents (2013: period provisions of EUR 1,153 thousand and EUR 707 thousand were recognized , respectively).
| 4 | In January 2013, upon his retirement, Mr Francisco Luzón López requested payment of the pensions to which he was entitled in a lump sum (EUR 65.4 million gross). For such purpose, his pension rights were settled, in accordance with the applicable contractual and legal terms, through: i) the payment in cash of EUR 21.1 million relating to the net amount of the pension calculated taking into account the fixed remuneration and the bylaw-stipulated emoluments, and EUR 7.1 million relating to the net amount of the pension calculated taking into account the accrued variable remuneration at the retirement date, ii) the investment by Mr Luzón of those EUR 7.1 million in Santander shares (1,144,110 shares), which shall be deposited on a restricted basis until 23 January 2017 and iii) the investment by the Bank of the gross remaining amount of the pension (EUR 6.6 million), calculated taking into account the unaccrued variable remuneration, in Santander shares (1,061,602 shares) pending delivery to Mr Luzón (subject to the same restriction period mentioned above and net of tax) subject to whether or not the variable remuneration giving rise to them finally accrued to him. Of these 1,061,602 shares, in January 2014 and in January 2015, 800,296 and 261,306 shares, respectively, were delivered to Mr Luzón, on the accrual of the variable remuneration giving rise to them, and have been deposited on a restricted basis until 23 January 2017. |
F-95
Table of Contents
Furthermore, Provisions - Provision for pensions and similar obligations in the consolidated balance sheet at December 31, 2014 included EUR 91 million in respect of the post-employment benefit obligations to former directors of the Bank (December 31, 2013: EUR 93 million) and EUR 114 million corresponding to former executive vice presidents (2013: EUR 121 million).
| i) | Pre-retirement and retirement |
The following executive directors will be entitled to take pre-retirement in the event of termination, if they have not yet reached the age of retirement, on the terms indicated below:
| • | Ms Ana Botín-Sanz de Sautuola y O’Shea will be entitled to take pre-retirement in the event of termination for reasons other than breach or resignation before the age of 55. In any event, she will be entitled to an annual emolument equivalent to her fixed remuneration and 30% of the average of her latest amounts of variable remuneration, up to a maximum of three. This emolument would be reduced by up to 20% in the event of voluntary retirement before the age of 60. |
| • | Mr Juan Rodríguez Inciarte will be entitled to take pre-retirement for reasons other than breach or resignation. In that case, he will be entitled to an annual emolument equivalent to his fixed remuneration. |
If Ms Ana Botín-Sanz de Sautuola y O’Shea or Mr Juan Rodríguez Inciarte take pre-retirement, they have the right to opt to receive the annual emoluments in the form of an annuity or a lump sum -i.e. in a single payment- in full but not in part.
For his part, Mr Matías Rodríguez Inciarte may take retirement at any time and, therefore, claim from the insurer the benefits corresponding to him under the externalized employee welfare system described in Note 5.c, with no obligation whatsoever being incumbent upon the Bank in such circumstances.
| j) | Contract termination |
The executive directors and senior executives have indefinite-term employment contracts. Executive directors or senior executives whose contracts are terminated voluntarily or due to breach of duties are not entitled to receive any economic compensation. If the Bank terminates the contract for any other reason, they will be entitled to the corresponding legally-stipulated termination benefit.
However, should Mr Rodrigo Echenique Gordillo’s contract be terminated prior to January 1, 2018, unless it is terminated voluntarily or due to his death, permanent disability, or serious breach of his duties, he shall be entitled to receive compensation of twice his fixed salary.
If the Bank were to terminate her contract, Ms Ana Botín-Sanz de Sautuola y O’Shea would have to remain at the Bank’s disposal for a period of four months in order to ensure an adequate transition, and would receive her fixed salary during that period.
Other non-director members of the Group’s senior management, other than those whose contracts were amended in 2012 as indicated above, have contracts which entitle them, in certain circumstances, to an extraordinary contribution to their welfare system in the event of termination for reasons other than voluntary redundancy, retirement, disability or serious breach of duties. These benefits are recognized as a provision for pensions and similar obligations and as a staff cost only when the employment relationship between the Bank and its executives is terminated before the normal retirement date.
F-96
Table of Contents
| k) | Information on investments held by the directors in other companies and conflicts of interest |
None of the members of the board of directors or persons related to them perform, as independent professionals or as employees, activities that involve effective competition, be it present or potential, with the activities of Banco Santander, S.A., or that, in any other way, place the directors in an ongoing conflict with the interests of Banco Santander, S.A.
Without prejudice to the foregoing, following is a detail of the declarations by the directors with respect to their investments and the investments of persons related to them in the share capital of companies whose object is banking, financing or lending; and of the management or governing functions, if any, that the directors discharge thereat.
| Director |
Corporate name |
Number of shares |
Functions | |||||
| Ms Ana Botín-Sanz de Sautuola y O’Shea |
Bankinter, S.A. (*) | 6,000,000 | — | |||||
| Santander UK plc | — | Director (1) | ||||||
| Mr Matías Rodríguez Inciarte |
Financiera El Corte Inglés, E.F.C., S.A. | — | Director (1) | |||||
| Mr Guillermo de la Dehesa Romero |
Goldman, Sachs & Co. (The Goldman Sachs Group. Inc.) Banco Popular Español, S.A. |
|
19,546 2,789 |
|
— — | |||
| Mr Rodrigo Echenique Gordillo |
Wells Fargo & Co. | 4,500 | — | |||||
| Bank of America Corporation | 12,000 | — | ||||||
| Mitsubishi UFJ Financial Group | 17,500 | — | ||||||
| Santander Investment, S.A. | — | Director (1) | ||||||
| Allfunds Bank, S.A. | — | Deputy chairman (1) | ||||||
| Banco Santander International | — | Director (1) | ||||||
| Mr Javier Botín-Sanz de Sautuola y O’Shea |
Bankinter, S.A. | 7,929,853 | — | |||||
| Ms Esther Giménez-Salinas i Colomer |
Gawa Capital Partners SL | — | Director (1) | |||||
| Mr Ángel Jado Becerro de Bengoa |
Bankinter, S.A. (2) | 1,774,000 | — | |||||
| Mr Juan Rodríguez Inciarte |
Banco Bilbao Vizcaya Argentaria, S.A. (3) | 1,118 | — | |||||
| Wells Fargo & Co. | 107 | — | ||||||
| Santander UK plc | — | Director (1) | ||||||
| Santander Consumer Finance, S.A. | — | Director (1) | ||||||
| Ms Isabel Tocino Biscarolasaga |
Banco Bilbao Vizcaya Argentaria, S.A. | 9,348 | — | |||||
| Mr Emilio Botín-Sanz de Sautuola y |
Bankinter, S.A. (5) Bank of America Corporation |
|
330,314 560 |
|
— — | |||
| Mr Javier Marín Romano (6) |
Allfunds Bank, S.A. | — | Director (1) | |||||
| Santander Investment, S.A. | — | Deputy chairman (1) | ||||||
| Santander Private Banking s.p.a. | — | Chairman (1) | ||||||
| Mr Abel Matutes Juan (7) |
Banco Bilbao Vizcaya Argentaria, S.A. (*) | 716,136 | — | |||||
| Citibank | 109,062 | — | ||||||
| Mr Vittorio Corbo Lioi (8) |
Banco Santander - Chile | — | Director (1) | |||||
| Banco Santander (México), S.A., Institución de Banca Múltiple, Grupo Financiero Santander México | — | Director (1) | ||||||
| Santander Consumo, S.A. de C.V., SOFOM, E.R. | — | Director (1) | ||||||
| Santander Hipotecario, S.A. de C.V., SOFOM, E.R. | — | Director (1) | ||||||
| (*) | Ownership interests held by related persons. |
| (1) | Non-executive. |
| (2) | Of the shares indicated, 274,000 are held by related persons. |
| (3) | Held jointly with a related person. |
| (4) | Died September 9, 2014. Data at 2013 year-end. |
F-97
Table of Contents
| (5) | In addition, he was the direct holder of the right of usufruct over 3,422,836 shares of Bankinter, S.A. at 2013 year-end. |
| (6) | Ceased to be a director on January 12, 2015. |
| (7) | Ceased to be a director on February 18, 2015. |
| (8) | Ceased to be a director on July 24, 2014. Data at 2013 year-end. |
With regard to situations of conflict of interest, as stipulated in Article 30 of the Rules and Regulations of the Board, the directors must notify the board of any direct or indirect conflict with the interests of the Bank in which they may be involved. If the conflict arises from a transaction, the director shall not be allowed to conduct it unless the board, following a report from the appointments committee, approves such transaction.
The director involved shall not participate in the deliberations and decisions on the transaction to which the conflict refers, and the body responsible for resolving conflicts of interest is the board of directors itself.
In 2014, the board, without the involvement of the interested party and following a favorable report by the remuneration committee, authorized the sale by the Bank, on an arm’s-length basis, of 2,403,923 shares of MED 2001 Inversiones, SICAV, S.A. held by Mr Ángel Jado Becerro de Bengoa and companies in his family group.
In addition to the matter described above, in 2014 there were a further 136 occasions on which other directors abstained from participating in and voting on the deliberations of the meetings of the board of directors and its committees.
The breakdown of the 136 cases is as follows: 52 occasions related to proposals for the appointment, re-election or removal of directors or the grant of powers of attorney to them; 43 occasions related to the approval of remuneration conditions; on 27 occasions the subject of debate were proposals to provide funding or other risk transactions to companies related to various directors; 5 occasions referred to the procedure required of the Bank, as a credit institution, to assess the suitability of the members of the board of directors and the holders of key functions, pursuant to Royal Decree 1245/1995, as worded in Royal Decree 256/2013; on 4 occasions the abstention occurred in connection with the annual verification of the directors’ status which, pursuant to Article 6.3 of the Rules and Regulations of the Board, was performed by the appointments and remuneration committee; 3 occasions related to the assessment commended to the appointments committee under Article 17.4 g) of the Rules and Regulations of the Board, in order to ascertain whether the professional obligations of directors might interfere with the dedication required of them for the efficient discharge of their duties; one occasion related to the approval of a transaction with a related party; and one other occasion concerned the attendance of a director as a guest at board committee meetings after the director has ceased to be a member of the board.
F-98
Table of Contents
| 6. | Loans and advances to credit institutions |
The detail, by classification, type and currency, of Loans and advances to credit institutions in the consolidated balance sheets is as follows:
| Millions of euros | ||||||||||||
| 2014 | 2013 | 2012 | ||||||||||
| Classification: |
||||||||||||
| Financial assets held for trading |
1,815 | 5,503 | 9,843 | |||||||||
| Other financial assets at fair value through profit or loss |
28,592 | 13,444 | 10,272 | |||||||||
| Loans and receivables |
51,306 | 56,017 | 53,785 | |||||||||
|
|
|
|
|
|
|
|||||||
| 81,713 | 74,964 | 73,900 | ||||||||||
|
|
|
|
|
|
|
|||||||
| Type: |
||||||||||||
| Reciprocal accounts |
1,571 | 1,858 | 1,863 | |||||||||
| Time deposits |
8,177 | 16,284 | 15,669 | |||||||||
| Reverse repurchase agreements |
39,807 | 29,702 | 25,486 | |||||||||
| Other accounts |
32,158 | 27,120 | 30,882 | |||||||||
|
|
|
|
|
|
|
|||||||
| 81,713 | 74,964 | 73,900 | ||||||||||
|
|
|
|
|
|
|
|||||||
| Currency: |
||||||||||||
| Euro |
49,099 | 33,699 | 36,955 | |||||||||
| Pound sterling |
4,348 | 4,964 | 3,787 | |||||||||
| US dollar |
15,964 | 14,915 | 13,567 | |||||||||
| Other currencies |
12,381 | 21,423 | 19,621 | |||||||||
| Impairment losses (Note 10) |
(79 | ) | (37 | ) | (30 | ) | ||||||
| Of which: due to country risk |
(13 | ) | (11 | ) | — | |||||||
|
|
|
|
|
|
|
|||||||
| 81,713 | 74,964 | 73,900 | ||||||||||
|
|
|
|
|
|
|
|||||||
The loans and advances to credit institutions classified under Financial assets held for trading consist mainly of securities of foreign institutions acquired under reverse repurchase agreements, whereas those classified under Other financial assets at fair value through profit or loss consist of assets of Spanish and foreign institutions acquired under reverse repurchase agreements.
The loans and advances to credit institutions classified under Loans and receivables are mainly time deposits and guarantees given in cash to credit institutions.
The impairment losses on financial assets recognized in Loans and receivables are disclosed in Note 10.
Note 51 contains a detail of the residual maturity periods of Loans and receivables and of the related average interest rates.
F-99
Table of Contents
| 7. | Debt instruments |
| a) | Detail |
The detail, by classification, type and currency, of Debt instruments in the consolidated balance sheets is as follows:
| Millions of euros | ||||||||||||
| 2014 | 2013 | 2012 | ||||||||||
| Classification: |
||||||||||||
| Financial assets held for trading |
54,374 | 40,841 | 43,101 | |||||||||
| Other financial assets at fair value through profit or loss |
4,231 | 3,875 | 3,460 | |||||||||
| Available-for-sale financial assets |
110,249 | 79,844 | 87,724 | |||||||||
| Loans and receivables |
7,510 | 7,886 | 7,059 | |||||||||
|
|
|
|
|
|
|
|||||||
| 176,364 | 132,446 | 141,344 | ||||||||||
|
|
|
|
|
|
|
|||||||
| Type: |
||||||||||||
| Spanish government debt securities |
39,182 | 32,880 | 37,141 | |||||||||
| Foreign government debt securities |
93,037 | 59,660 | 67,222 | |||||||||
| Issued by financial institutions |
18,041 | 17,206 | 12,297 | |||||||||
| Other fixed-income securities |
26,248 | 22,907 | 24,828 | |||||||||
| Impairment losses |
(144 | ) | (207 | ) | (144 | ) | ||||||
|
|
|
|
|
|
|
|||||||
| 176,364 | 132,446 | 141,344 | ||||||||||
|
|
|
|
|
|
|
|||||||
| Currency: |
||||||||||||
| Euro |
74,833 | 63,263 | 63,169 | |||||||||
| Pound sterling |
9,983 | 7,709 | 9,240 | |||||||||
| US dollar |
20,452 | 14,195 | 18,183 | |||||||||
| Other currencies |
71,240 | 47,486 | 50,896 | |||||||||
| Impairment losses |
(144 | ) | (207 | ) | (144 | ) | ||||||
|
|
|
|
|
|
|
|||||||
| 176,364 | 132,446 | 141,344 | ||||||||||
|
|
|
|
|
|
|
|||||||
F-100
Table of Contents
| b) | Breakdown |
The breakdown, by origin of the issuer, of Debt instruments at December 31, 2014, 2013 and 2012, net of impairment losses, is as follows:
| Millions of euros | ||||||||||||||||||||||||||||||||||||||||||||||||
| 2014 | 2013 | 2012 | ||||||||||||||||||||||||||||||||||||||||||||||
| Private fixed- income |
Public fixed- income |
Total | % | Private fixed- income |
Public fixed- income |
Total | % | Private fixed- income |
Public fixed- income |
Total | % | |||||||||||||||||||||||||||||||||||||
| Spain |
8,542 | 39,182 | 47,724 | 27.06 | % | 11,752 | 32,880 | 44,632 | 33.70 | % | 10,046 | 37,141 | 47,187 | 33.38 | % | |||||||||||||||||||||||||||||||||
| United Kingdom |
3,502 | 7,577 | 11,079 | 6.28 | % | 3,268 | 5,112 | 8,380 | 6.33 | % | 3,865 | 7,528 | 11,393 | 8.06 | % | |||||||||||||||||||||||||||||||||
| Portugal |
3,543 | 8,698 | 12,241 | 6.94 | % | 2,634 | 3,465 | 6,099 | 4.60 | % | 2,843 | 2,217 | 5,060 | 3.58 | % | |||||||||||||||||||||||||||||||||
| Poland |
745 | 6,373 | 7,118 | 4.04 | % | 723 | 5,184 | 5,907 | 4.46 | % | 462 | 2,611 | 3,073 | 2.17 | % | |||||||||||||||||||||||||||||||||
| Italy |
1,670 | 4,170 | 5,840 | 3.31 | % | 733 | 2,857 | 3,590 | 2.71 | % | 375 | 619 | 994 | 0.70 | % | |||||||||||||||||||||||||||||||||
| Ireland |
405 | — | 405 | 0.23 | % | 848 | — | 848 | 0.64 | % | 739 | — | 739 | 0.52 | % | |||||||||||||||||||||||||||||||||
| Greece |
— | — | — | — | — | — | — | — | — | — | — | — | ||||||||||||||||||||||||||||||||||||
| Other European countries |
7,327 | 4,267 | 11,594 | 6.57 | % | 5,357 | 3,607 | 8,964 | 6.77 | % | 4,244 | 6,009 | 10,253 | 7.25 | % | |||||||||||||||||||||||||||||||||
| United States |
8,793 | 5,847 | 14,640 | 8.30 | % | 5,945 | 3,997 | 9,942 | 7.51 | % | 5,994 | 6,965 | 12,959 | 9.17 | % | |||||||||||||||||||||||||||||||||
| Brazil |
5,673 | 37,792 | 43,465 | 24.65 | % | 4,954 | 19,852 | 24,806 | 18.73 | % | 4,810 | 27,359 | 32,169 | 22.76 | % | |||||||||||||||||||||||||||||||||
| Mexico |
847 | 9,071 | 9,918 | 5.62 | % | 566 | 8,156 | 8,722 | 6.59 | % | 501 | 8,817 | 9,318 | 6.59 | % | |||||||||||||||||||||||||||||||||
| Chile |
909 | 2,389 | 3,298 | 1.87 | % | 1,467 | 1,272 | 2,739 | 2.07 | % | 1,377 | 2,124 | 3,501 | 2.48 | % | |||||||||||||||||||||||||||||||||
| Other American countries |
1,558 | 1,514 | 3,072 | 1.74 | % | 1,384 | 995 | 2,379 | 1.80 | % | 1,208 | 1,163 | 2,371 | 1.68 | % | |||||||||||||||||||||||||||||||||
| Rest of the world |
631 | 5,339 | 5,970 | 3.38 | % | 275 | 5,163 | 5,438 | 4.11 | % | 517 | 1,810 | 2,327 | 1.65 | % | |||||||||||||||||||||||||||||||||
|
|
|
|
|
|
|
|
|
|
|
|
|
|
|
|
|
|
|
|
|
|
|
|
|
|||||||||||||||||||||||||
| 44,145 | 132,219 | 176,364 | 100 | % | 39,906 | 92,540 | 132,446 | 100 | % | 36,981 | 104,363 | 141,344 | 100 | % | ||||||||||||||||||||||||||||||||||
|
|
|
|
|
|
|
|
|
|
|
|
|
|
|
|
|
|
|
|
|
|
|
|
|
|||||||||||||||||||||||||
The detail, by issuer rating, of Debt instruments at December 31, 2014, 2013 and 2012 is as follows:
| Millions of euros | ||||||||||||||||||||||||||||||||||||||||||||||||
| 2014 | 2013 | 2012 | ||||||||||||||||||||||||||||||||||||||||||||||
| Private fixed- income |
Public fixed- income |
Total | % | Private fixed- income |
Public fixed- income |
Total | % | Private fixed- income |
Public fixed- income |
Total | % | |||||||||||||||||||||||||||||||||||||
| AAA |
17,737 | 10,647 | 28,384 | 16.09 | % | 10,357 | 7,847 | 18,204 | 13.74 | % | 15,754 | 11,711 | 27,465 | 19.43 | % | |||||||||||||||||||||||||||||||||
| AA |
2,763 | 14,770 | 17,533 | 9.94 | % | 2,884 | 11,304 | 14,188 | 10.71 | % | 714 | 12,724 | 13,438 | 9.51 | % | |||||||||||||||||||||||||||||||||
| A |
5,711 | 6,373 | 12,084 | 6.85 | % | 5,036 | 5,184 | 10,220 | 7.72 | % | 5,524 | 2,611 | 8,135 | 5.76 | % | |||||||||||||||||||||||||||||||||
| BBB |
5,215 | 90,505 | 95,720 | 54.27 | % | 7,158 | 64,341 | 71,499 | 53.98 | % | 3,460 | 74,435 | 77,895 | 55.11 | % | |||||||||||||||||||||||||||||||||
| Below BBB |
3,092 | 8,698 | 11,790 | 6.69 | % | 6,386 | 3,864 | 10,250 | 7.74 | % | 4,052 | 2,882 | 6,934 | 4.90 | % | |||||||||||||||||||||||||||||||||
| Unrated |
9,627 | 1,226 | 10,853 | 6.15 | % | 8,085 | — | 8,085 | 6.10 | % | 7,477 | — | 7,477 | 5.29 | % | |||||||||||||||||||||||||||||||||
|
|
|
|
|
|
|
|
|
|
|
|
|
|
|
|
|
|
|
|
|
|
|
|
|
|||||||||||||||||||||||||
| 44,145 | 132,219 | 176,364 | 100.00 | % | 39,906 | 92,540 | 132,446 | 100.00 | % | 36,981 | 104,363 | 141,344 | 100.00 | % | ||||||||||||||||||||||||||||||||||
|
|
|
|
|
|
|
|
|
|
|
|
|
|
|
|
|
|
|
|
|
|
|
|
|
|||||||||||||||||||||||||
F-101
Table of Contents
The distribution of exposure by rating shown in the foregoing table has been affected by the various reviews of sovereign issuer ratings conducted in recent years, the main review in 2014 having been that of Argentina (from Below BBB in 2013 to Unrated in 2014). Also, at December 31, 2014 the exposures with BBB ratings included mainly the Spanish sovereign exposures and the sovereign exposures in Mexico and Brazil, while those with ratings Below BBB included the Portuguese sovereign exposures (BB).
The detail, by type of financial instrument, of Private fixed-income securities at December 31, 2014, 2013 and 2012, net of impairment losses, is as follows:
| Millions of euros | ||||||||||||
| 2014 | 2013 | 2012 | ||||||||||
| Securitized mortgage bonds |
3,388 | 2,936 | 6,835 | |||||||||
| Other asset-backed bonds |
2,315 | 2,781 | 1,497 | |||||||||
| Floating rate debt |
13,172 | 10,857 | 15,883 | |||||||||
| Fixed rate debt |
25,270 | 23,332 | 12,766 | |||||||||
|
|
|
|
|
|
|
|||||||
| Total |
44,145 | 39,906 | 36,981 | |||||||||
|
|
|
|
|
|
|
|||||||
| c) | Impairment losses |
The changes in the impairment losses on Available-for-sale financial assets—Debt instruments are summarized below:
| Millions of euros | ||||||||||||
| 2014 | 2013 | 2012 | ||||||||||
| Balance at beginning of year |
188 | 129 | 235 | |||||||||
| Net impairment losses for the year |
42 | 72 | 13 | |||||||||
| Of which: |
||||||||||||
| Impairment losses charged to income (Note 29) |
42 | 89 | 18 | |||||||||
| Impairment losses reversed with a credit to income |
— | (18 | ) | (5 | ) | |||||||
| Assets charged off |
(110 | ) | — | (109 | ) | |||||||
| Exchange differences and other items |
(1 | ) | (13 | ) | (10 | ) | ||||||
|
|
|
|
|
|
|
|||||||
| Balance at end of year |
119 | 188 | 129 | |||||||||
|
|
|
|
|
|
|
|||||||
| Of which: |
||||||||||||
| By geographical location of risk: |
||||||||||||
| European Union |
9 | 105 | 51 | |||||||||
| Latin America |
110 | 83 | 78 | |||||||||
Also, the impairment losses on Loans and receivables (EUR 25 million, EUR 19 million and EUR 15 million at December 31, 2014, 2013 and 2012, respectively) are disclosed in Note 10.
F-102
Table of Contents
| d) | Other information |
At December 31, 2014, the nominal amount of debt securities assigned to certain own or third-party commitments, mainly to secure financing facilities received by the Group, amounted to EUR 84,231 million. Of these securities, EUR 27,881 million related to Spanish government debt.
The detail, by term to maturity, of the debt instruments pledged as security for certain commitments, is as follows:
| Millions of euros | ||||||||||||||||||||||||||||||||
| 1 day | 1 week | 1 month | 3 months | 6 months | 1 year | More than 12 months |
Total | |||||||||||||||||||||||||
| Government debt securities |
12,590 | 29,778 | 13,476 | 6,623 | 5,154 | 4,713 | 1,012 | 73,346 | ||||||||||||||||||||||||
| Other debt instruments |
5,078 | 240 | 1,202 | 982 | 703 | 910 | 1,770 | 10,885 | ||||||||||||||||||||||||
|
|
|
|
|
|
|
|
|
|
|
|
|
|
|
|
|
|||||||||||||||||
| Total |
17,668 | 30,018 | 14,678 | 7,605 | 5,857 | 5,623 | 2,782 | 84,231 | ||||||||||||||||||||||||
|
|
|
|
|
|
|
|
|
|
|
|
|
|
|
|
|
|||||||||||||||||
There are no particular conditions relating to the pledge of these assets that need to be disclosed.
Note 29 contains a detail of the valuation adjustments recognized in equity on available-for-sale financial assets.
Note 51 contains a detail of the residual maturity periods of Available-for-sale financial assets and of Loans and receivables and of the related average interest rates.
| 8. | Equity instruments |
| a) | Breakdown |
The detail, by classification and type, of Equity instruments in the consolidated balance sheets is as follows:
| Millions of euros | ||||||||||||
| 2014 | 2013 | 2012 | ||||||||||
| Classification: |
||||||||||||
| Financial assets held for trading |
12,920 | 4,967 | 5,492 | |||||||||
| Other financial assets at fair value through profit or loss |
879 | 866 | 688 | |||||||||
| Available-for-sale financial assets |
5,001 | 3,955 | 4,542 | |||||||||
|
|
|
|
|
|
|
|||||||
| 18,800 | 9,788 | 10,722 | ||||||||||
|
|
|
|
|
|
|
|||||||
| Type: |
||||||||||||
| Shares of Spanish companies |
3,102 | 2,629 | 3,338 | |||||||||
| Shares of foreign companies |
12,773 | 4,711 | 4,726 | |||||||||
| Investment fund units and shares |
2,925 | 2,448 | 2,658 | |||||||||
|
|
|
|
|
|
|
|||||||
| 18,800 | 9,788 | 10,722 | ||||||||||
|
|
|
|
|
|
|
|||||||
Note 29 contains a detail of the valuation adjustments recognized in equity on available-for-sale financial assets, and also the related impairment losses.
F-103
Table of Contents
| b) | Changes |
The changes in Available-for-sale financial assets-Equity instruments were as follows:
| Millions of euros | ||||||||||||
| 2014 | 2013 | 2012 | ||||||||||
| Balance at beginning of year |
3,955 | 4,542 | 5,024 | |||||||||
| Changes in the scope of consolidation |
— | — | — | |||||||||
| Net additions (disposals) |
743 | (722 | ) | (666 | ) | |||||||
| Of which: |
||||||||||||
| Bank of Shanghai Co., Ltd. |
396 | — | — | |||||||||
| SAREB |
— | 44 | 164 | |||||||||
| Valuation adjustments and other items |
303 | 135 | 184 | |||||||||
|
|
|
|
|
|
|
|||||||
| Balance at end of year |
5,001 | 3,955 | 4,542 | |||||||||
|
|
|
|
|
|
|
|||||||
The main acquisitions and disposals made in 2014, 2013 and 2012 were as follows:
| i. | Bank of Shanghai Co., Ltd. |
In May 2014 the Group acquired 8% of Bank of Shanghai Co., Ltd. for EUR 396 million.
| ii. | Sociedad de Gestión de Activos Procedentes de la Reestructuración Bancaria, S.A. (SAREB) |
In December 2012 the Group, together with other Spanish financial institutions, entered into an agreement to invest in the Spanish Bank Restructuring Asset Management Company (SAREB). The Group undertook to make an investment of up to EUR 840 million (25% in capital and 75% in subordinated debt), and at December 31, 2012, it had paid EUR 164 million of capital and EUR 490 million of subordinated debt.
In February 2013, following the review of the own funds that SAREB required, the aforementioned undertaking was reduced to EUR 806 million, and the Group disbursed the remaining EUR 44 million of capital and EUR 108 million of subordinated debt.
| c) | Notifications of acquisitions of investments |
The notifications made by the Bank in 2014, in compliance with Article 155 of the Spanish Limited Liability Companies Law and Article 53 of Spanish Securities Market Law 24/1998, of the acquisitions and disposals of holdings in investees are listed in Exhibit IV.
F-104
Table of Contents
| 9. | Trading derivatives (assets and liabilities) and Short positions |
| a) | Trading derivatives |
The detail, by type of inherent risk, of the fair value of the trading derivatives entered into by the Group is as follows (see Note 36):
| Millions of euros | ||||||||||||||||||||||||
| 2014 | 2013 | 2012 | ||||||||||||||||||||||
| Assets | Liabilities | Assets | Liabilities | Assets | Liabilities | |||||||||||||||||||
| Interest rate risk |
56,878 | 56,710 | 43,185 | 43,154 | 89,404 | 86,956 | ||||||||||||||||||
| Currency risk |
16,201 | 17,418 | 11,315 | 10,181 | 16,516 | 16,692 | ||||||||||||||||||
| Price risk |
2,800 | 4,118 | 3,247 | 4,609 | 3,289 | 5,081 | ||||||||||||||||||
| Other risks |
979 | 802 | 1,152 | 943 | 1,110 | 1,014 | ||||||||||||||||||
|
|
|
|
|
|
|
|
|
|
|
|
|
|||||||||||||
| 76,858 | 79,048 | 58,899 | 58,887 | 110,319 | 109,743 | |||||||||||||||||||
|
|
|
|
|
|
|
|
|
|
|
|
|
|||||||||||||
| b) | Short positions |
Following is a breakdown of the short positions:
| Millions of euros | ||||||||||||
| 2014 | 2013 | 2012 | ||||||||||
| Borrowed securities: |
||||||||||||
| Debt instruments |
3,303 | 3,921 | 5,371 | |||||||||
| Of which: Santander UK plc |
2,537 | 3,260 | 4,989 | |||||||||
| Equity instruments |
1,557 | 189 | 551 | |||||||||
| Of which: Santander UK plc |
1,435 | 7 | 59 | |||||||||
| Short sales: |
||||||||||||
| Debt instruments |
12,768 | 11,840 | 9,259 | |||||||||
| Of which: |
||||||||||||
| Banco Santander, S.A. |
7,093 | 6,509 | 5,946 | |||||||||
| Banco Santander (México), S.A., Institución de Banca Múltiple, Grupo Financiero Santander, Mexico |
1,561 | 2,882 | 3,266 | |||||||||
| Banco Santander (Brasil) S.A. |
3,476 | 2,388 | — | |||||||||
| Equity instruments |
— | 1 | — | |||||||||
|
|
|
|
|
|
|
|||||||
| 17,628 | 15,951 | 15,181 | ||||||||||
|
|
|
|
|
|
|
|||||||
F-105
Table of Contents
| 10. | Loans and advances to customers |
| a) | Detail |
The detail, by classification, of Loans and advances to customers in the consolidated balance sheets is as follows:
| Millions of euros | ||||||||||||
| 2014 | 2013 | 2012 | ||||||||||
| Financial assets held for trading |
2,921 | 5,079 | 9,162 | |||||||||
| Other financial assets at fair value through profit or loss |
8,971 | 13,196 | 13,936 | |||||||||
| Loans and receivables |
722,819 | 650,581 | 696,014 | |||||||||
| Of which: |
||||||||||||
| Disregarding impairment losses |
750,036 | 675,484 | 721,436 | |||||||||
| Impairment losses |
(27,217 | ) | (24,903 | ) | (25,422 | ) | ||||||
| Of which, due to country risk |
(7 | ) | (31 | ) | (42 | ) | ||||||
|
|
|
|
|
|
|
|||||||
| 734,711 | 668,856 | 719,112 | ||||||||||
|
|
|
|
|
|
|
|||||||
| Loans and advances to customers disregarding impairment |
761,928 | 693,759 | 744,534 | |||||||||
|
|
|
|
|
|
|
|||||||
| (*) | Includes Valuation adjustments for accrued interest receivable and other items amounting to EUR 3,402 million at December 31, 2014 (2013: EUR 2,593 million; 2012: EUR 3,481 million). |
Note 51 contains a detail of the residual maturity periods of loans and receivables and of the related average interest rates.
Note 54 shows the Group’s total exposure, by origin of the issuer.
There are no loans and advances to customers for material amounts without fixed maturity dates.
| b) | Breakdown |
Following is a breakdown, by loan type and status, geographical area of residence and interest rate formula, of the loans and advances to customers of the Group, which reflect the Group’s exposure to credit risk in its core business, disregarding impairment losses:
F-106
Table of Contents
| Millions of euros | ||||||||||||
| 2014 | 2013 | 2012 | ||||||||||
| Loan type and status: |
||||||||||||
| Commercial credit |
18,900 | 11,898 | 12,054 | |||||||||
| Secured loans |
440,827 | 396,432 | 428,259 | |||||||||
| Reverse repurchase agreements |
3,993 | 13,223 | 19,383 | |||||||||
| Other term loans |
228,752 | 203,267 | 218,728 | |||||||||
| Finance leases |
15,353 | 15,871 | 16,241 | |||||||||
| Receivable on demand |
10,329 | 10,155 | 11,087 | |||||||||
| Non-performing assets |
40,372 | 40,320 | 35,301 | |||||||||
| Valuation adjustments for Accrued interest receivable and other items |
3,402 | 2,593 | 3,481 | |||||||||
|
|
|
|
|
|
|
|||||||
| 761,928 | 693,759 | 744,534 | ||||||||||
|
|
|
|
|
|
|
|||||||
| Geographical area: |
||||||||||||
| Spain |
172,371 | 173,852 | 200,014 | |||||||||
| European Union (excluding Spain) |
353,674 | 328,118 | 335,727 | |||||||||
| United States and Puerto Rico |
71,764 | 43,566 | 51,186 | |||||||||
| Other OECD countries |
60,450 | 54,713 | 56,474 | |||||||||
| Latin America (non-OECD) |
93,145 | 84,000 | 92,491 | |||||||||
| Rest of the world |
10,524 | 9,510 | 8,642 | |||||||||
|
|
|
|
|
|
|
|||||||
| 761,928 | 693,759 | 744,534 | ||||||||||
|
|
|
|
|
|
|
|||||||
| Interest rate formula: |
||||||||||||
| Fixed rate |
363,679 | 280,188 | 299,937 | |||||||||
| Floating rate |
398,249 | 413,571 | 444,597 | |||||||||
|
|
|
|
|
|
|
|||||||
| 761,928 | 693,759 | 744,534 | ||||||||||
|
|
|
|
|
|
|
|||||||
At December 31, 2014, the Group had granted loans amounting to EUR 17,465 million (December 31, 2013: EUR 13,374 million; December 31, 2012: EUR 16,884 million) to the Spanish public sector (which had ratings of BBB at December 31, 2014, 2013 and 2012), and EUR 7,053 million to the public sector in other countries (December 31, 2013: EUR 4,402 million; December 31, 2012: EUR 4,983 million). At December 31, 2014, the breakdown of this amount by issuer rating was as follows: 1.9% AAA, 37% AA, 0.4% A, 51.6% BBB and 9.1% below BBB.
At December 31, 2014, the Group had EUR 697,038 million of loans and advances to customers classified as other than non-performing (excluding loans granted to the public sector). The percentage breakdown of these loans and advances by counterparty credit quality is as follows: 7.3% AAA, 16.2% AA, 17.06% A, 25.81% BBB and 33.62% below BBB.
The above-mentioned ratings were obtained by converting the internal ratings assigned to customers by the Group into the external ratings classification established by Standard & Poor’s, in order to make them more readily comparable.
Following is a detail, by activity, of the loans and advances to customers at December 31, 2014, net of impairment losses:
F-107
Table of Contents
| Millions of euros | ||||||||||||||||||||||||||||||||||||
| Total | Without collateral |
Secured loans | ||||||||||||||||||||||||||||||||||
| Net exposure | Loan to value ratio (a) | |||||||||||||||||||||||||||||||||||
| Of which: Property collateral |
Of which: Other collateral |
Less than or equal to 40% |
More than 40% and less than or equal to 60% |
More than 60% and less than or equal to 80% |
More than 80% and less than or equal to 100% |
More than 100% |
||||||||||||||||||||||||||||||
| Public sector |
24,473 | 22,930 | 318 | 1,225 | 311 | 309 | 134 | 163 | 626 | |||||||||||||||||||||||||||
| Other financial institutions |
26,776 | 20,584 | 467 | 5,725 | 2,652 | 359 | 713 | 2,166 | 302 | |||||||||||||||||||||||||||
| Non-financial companies and sole proprietors |
249,171 | 128,943 | 62,510 | 57,718 | 24,916 | 19,063 | 21,750 | 39,524 | 14,975 | |||||||||||||||||||||||||||
| Of which: |
||||||||||||||||||||||||||||||||||||
| Construction and property development |
23,484 | 1,799 | 16,269 | 5,416 | 5,061 | 2,868 | 2,873 | 9,290 | 1,593 | |||||||||||||||||||||||||||
| Civil engineering construction |
2,695 | 1,610 | 180 | 905 | 155 | 61 | 359 | 84 | 426 | |||||||||||||||||||||||||||
| Large companies |
133,940 | 87,678 | 12,665 | 33,597 | 6,671 | 5,191 | 5,310 | 20,361 | 8,729 | |||||||||||||||||||||||||||
| SMEs and individual traders |
89,052 | 37,856 | 33,396 | 17,800 | 13,029 | 10,943 | 13,208 | 9,789 | 4,227 | |||||||||||||||||||||||||||
| Other households and non-profit institutions serving households |
440,156 | 94,125 | 308,046 | 37,985 | 58,867 | 92,151 | 114,028 | 48,525 | 32,460 | |||||||||||||||||||||||||||
| Of which: |
||||||||||||||||||||||||||||||||||||
| Residential |
305,484 | 3,327 | 300,824 | 1,333 | 53,933 | 86,828 | 108,676 | 43,322 | 9,398 | |||||||||||||||||||||||||||
| Consumer loans |
120,495 | 86,379 | 1,887 | 32,229 | 2,905 | 3,760 | 3,404 | 1,835 | 22,212 | |||||||||||||||||||||||||||
| Other purposes |
14,177 | 4,419 | 5,335 | 4,423 | 2,029 | 1,563 | 1,948 | 3,368 | 850 | |||||||||||||||||||||||||||
|
|
|
|
|
|
|
|
|
|
|
|
|
|
|
|
|
|
|
|||||||||||||||||||
| Subtotal |
740,576 | 266,582 | 371,341 | 102,653 | 86,746 | 111,882 | 136,625 | 90,378 | 48,363 | |||||||||||||||||||||||||||
|
|
|
|
|
|
|
|
|
|
|
|
|
|
|
|
|
|
|
|||||||||||||||||||
| Less: collectively assessed impairment losses |
5,865 | |||||||||||||||||||||||||||||||||||
|
|
|
|||||||||||||||||||||||||||||||||||
| Total |
734,711 | |||||||||||||||||||||||||||||||||||
|
|
|
|||||||||||||||||||||||||||||||||||
| Memorandum item |
||||||||||||||||||||||||||||||||||||
| Refinanced and restructured transactions |
44,634 | 10,044 | 17,157 | 17,433 | 4,472 | 5,830 | 9,384 | 5,802 | 9,102 | |||||||||||||||||||||||||||
|
|
|
|
|
|
|
|
|
|
|
|
|
|
|
|
|
|
|
|||||||||||||||||||
| (a) | The ratio of the carrying amount of the Loans and advances to customers at December 31, 2014 to the latest available appraisal value of the collateral. |
F-108
Table of Contents
Note 54 contains information relating to the restructured/refinanced Loans and advances to customers.
| c) | Impairment losses |
The changes in the impairment losses on the assets making up the balances of Loans and receivables—Loans and advances to customers, Loans and receivables - Loans and advances to credit institutions (see Note 6) and Loans and receivables—Debt instruments (see Note 7) were as follows:
| Millions of euros | ||||||||||||
| 2014 | 2013 | 2012 | ||||||||||
| Balance at beginning of year |
24,959 | 25,467 | 18,858 | |||||||||
| Net impairment losses charged to income for the year |
11,857 | 12,054 | 19,839 | |||||||||
| Of which: |
||||||||||||
| Impairment losses charged to income |
16,518 | 17,551 | 23,002 | |||||||||
| Impairment losses reversed with a credit to income |
(4,661 | ) | (5,497 | ) | (3,163 | ) | ||||||
| Changes in the scope of consolidation (Note 3) |
— | — | (266 | ) | ||||||||
| Charge-off of non-performing balances against recorded impairment allowance |
(11,827 | ) | (10,626 | ) | (11,346 | ) | ||||||
| Exchange differences and other changes |
2,332 | (1,936 | ) | (1,618 | ) | |||||||
|
|
|
|
|
|
|
|||||||
| Balance at end of year |
27,321 | 24,959 | 25,467 | |||||||||
|
|
|
|
|
|
|
|||||||
| Of which: |
||||||||||||
| By method of assessment: |
||||||||||||
| Individually assessed |
21,449 | 21,604 | 21,540 | |||||||||
| Of which: due to country risk (Note 2.g) |
20 | 42 | 42 | |||||||||
| Collectively assessed |
5,872 | 3,355 | 3,927 | |||||||||
| By classification of assets: |
||||||||||||
| Loans and advances to credit institutions (Note 6) |
79 | 37 | 30 | |||||||||
| Debt instruments (Note 7) |
25 | 19 | 15 | |||||||||
| Loans and advances to customers |
27,217 | 24,903 | 25,422 | |||||||||
The decrease in allowances for credit losses experienced in 2013 was associated with two factors: (i) lower levels of provisioning in Brazil, the United Kingdom, Portugal, Santander Consumer Finance and the United States; and (ii) the progressive stabilization of the Spanish economy, featuring a slower pace of GDP shrinkage in the year - in comparison with 2012 -, together with positive growth in the last two quarters, for the first time since 2011, a certain improvement in private consumer spending and a containment of the unemployment rate. In 2014 the credit loss provisions remained stable in overall terms. The amount of these provisions was influenced by two factors: (i) lower provisions, particularly in Spain, Portugal, the United Kingdom and Brazil; and (ii) growth in the USA as a result of the consolidation of Santander Consumer USA Holdings, Inc.
Previously charged-off assets recovered in 2014, 2013 and 2012 amounted to EUR 1,336 million, EUR 1,068 million and EUR 1,316 million, respectively. Taking into account these amounts and those recognized in Impairment losses charged to income for the year in the foregoing table, impairment losses on Loans and receivables amounted to EUR 10,521 million in 2014, EUR 10,986 million in 2013 and EUR 18,523 million in 2012.
F-109
Table of Contents
| d) | Non-performing assets |
The detail of the changes in the balance of the financial assets classified as Loans and receivables—Loans and advances to customers and considered to be non-performing due to credit risk is as follows:
| Millions of euros | ||||||||||||
| 2014 | 2013 | 2012 | ||||||||||
| Balance at beginning of year |
40,320 | 35,301 | 31,257 | |||||||||
| Net additions |
9,841 | 16,438 | 16,167 | |||||||||
| Charged-off assets |
(11,827 | ) | (10,626 | ) | (11,346 | ) | ||||||
| Changes in the scope of consolidation |
497 | 699 | (626 | ) | ||||||||
| Exchange differences and other |
1,541 | (1,492 | ) | (151 | ) | |||||||
|
|
|
|
|
|
|
|||||||
| Balance at end of year |
40,372 | 40,320 | 35,301 | |||||||||
|
|
|
|
|
|
|
|||||||
This amount, after deducting the related allowances, represents the Group’s best estimate of the discounted value of the flows that are expected to be recovered from the non-performing assets.
At December 31, 2014, the Group’s charged-off assets totaled EUR 35,654 million (December 31, 2013: EUR 30,006 million; December 31, 2012: EUR 28,745 million).
Following is a detail of the financial assets classified as Loans and receivables and considered to be non-performing due to credit risk at December 31, 2014, classified by geographical location of risk and by age of the oldest past-due amount:
| Millions of euros | ||||||||||||||||||||||||
| With no past-due balances or less than 3 months past due |
With balances past due by | |||||||||||||||||||||||
| 3 to 6 months |
6 to 9 months |
9 to 12 months |
More than 12 months |
Total | ||||||||||||||||||||
| Spain |
6,664 | 2,764 | 909 | 866 | 9,404 | 20,607 | ||||||||||||||||||
| European Union (excluding Spain) |
2,027 | 2,520 | 908 | 767 | 3,532 | 9,754 | ||||||||||||||||||
| United States and Puerto Rico |
661 | 626 | 58 | 29 | 329 | 1,703 | ||||||||||||||||||
| Other OECD countries |
272 | 1,364 | 259 | 239 | 1,726 | 3,860 | ||||||||||||||||||
| Latin America (non-OECD) |
1,324 | 338 | 933 | 841 | 1,012 | 4,448 | ||||||||||||||||||
| Rest of the world |
— | — | — | — | — | — | ||||||||||||||||||
|
|
|
|
|
|
|
|
|
|
|
|
|
|||||||||||||
| 10,948 | 7,612 | 3,067 | 2,742 | 16,003 | 40,372 | |||||||||||||||||||
|
|
|
|
|
|
|
|
|
|
|
|
|
|||||||||||||
F-110
Table of Contents
The detail at December 31, 2013 is as follows:
| Millions of euros | ||||||||||||||||||||||||
| With no past-due balances or less than 3 months past due |
With balances past due by | |||||||||||||||||||||||
| 3 to 6 months |
6 to 9 months |
9 to 12 months |
More than 12 months |
Total | ||||||||||||||||||||
| Spain |
6,876 | 3,327 | 1,707 | 1,700 | 8,255 | 21,865 | ||||||||||||||||||
| European Union (excluding Spain) |
1,791 | 3,141 | 994 | 763 | 3,461 | 10,150 | ||||||||||||||||||
| United States and Puerto Rico |
322 | 178 | 78 | 43 | 417 | 1,038 | ||||||||||||||||||
| Other OECD countries |
231 | 1,377 | 346 | 273 | 626 | 2,853 | ||||||||||||||||||
| Latin America (non-OECD) |
600 | 1,332 | 877 | 787 | 816 | 4,412 | ||||||||||||||||||
| Rest of the world |
— | — | — | — | 2 | 2 | ||||||||||||||||||
|
|
|
|
|
|
|
|
|
|
|
|
|
|||||||||||||
| 9,820 | 9,355 | 4,002 | 3,566 | 13,577 | 40,320 | |||||||||||||||||||
|
|
|
|
|
|
|
|
|
|
|
|
|
|||||||||||||
The detail at December 31, 2012 is as follows:
| Millions of euros | ||||||||||||||||||||||||
| With no past-due balances or less than 3 months past due |
With balances past due by | |||||||||||||||||||||||
| 3 to 6 months |
6 to 9 months |
9 to 12 months |
More than 12 months |
Total | ||||||||||||||||||||
| Spain |
3,268 | 3,364 | 2,058 | 1,263 | 6,372 | 16,325 | ||||||||||||||||||
| European Union (excluding Spain) |
233 | 3,782 | 1,232 | 821 | 3,280 | 9,348 | ||||||||||||||||||
| United States and Puerto Rico |
327 | 216 | 111 | 83 | 484 | 1,221 | ||||||||||||||||||
| Other OECD countries |
117 | 1,209 | 235 | 206 | 476 | 2,243 | ||||||||||||||||||
| Latin America (non-OECD) |
430 | 2,096 | 1,446 | 1,119 | 1,072 | 6,163 | ||||||||||||||||||
| Rest of the world |
— | — | — | — | 1 | 1 | ||||||||||||||||||
|
|
|
|
|
|
|
|
|
|
|
|
|
|||||||||||||
| 4,375 | 10,667 | 5,082 | 3,492 | 11,685 | 35,301 | |||||||||||||||||||
|
|
|
|
|
|
|
|
|
|
|
|
|
|||||||||||||
F-111
Table of Contents
Set forth below for each class of non-performing assets are the gross amount, associated allowances and information relating to the collateral and/or other credit enhancements obtained at December 31, 2014:
| Millions of euros | ||||||||||||
| Gross amount |
Allowance recognized |
Estimated collateral value (*) |
||||||||||
| Without associated collateral |
15,532 | 10,482 | — | |||||||||
| With property collateral |
23,718 | 8,241 | 14,271 | |||||||||
| With other collateral |
1,122 | 623 | 482 | |||||||||
|
|
|
|
|
|
|
|||||||
| Balance as at end of year |
40,372 | 19,346 | 14,753 | |||||||||
|
|
|
|
|
|
|
|||||||
| (*) | Including the estimated value of the collateral associated with each loan. Accordingly, any other cash flows that may be obtained, such as those arising from borrowers’ personal guarantees, are not included. |
When classifying assets in the foregoing table, the main factors considered by the Group to determine whether an asset has become non-performing are the existence of amounts past due -assets non-performing due to arrears- or other circumstances that lead it to believe that not all the contractual cash flows will be recovered -assets non-performing for reasons other than arrears-, such as a deterioration of the borrower’s financial situation, the worsening of its capacity to generate funds or difficulties experienced by it in accessing credit.
Loans classified as standard: past-due amounts receivable
In addition, at December 31, 2014, there were assets with amounts receivable that were past due by three months or less, the detail of which, by age of the oldest past-due amount, is as follows:
| Millions of euros | ||||||||||||
| Less than 1 month |
1 to 2 months |
2 to 3 months |
||||||||||
| Loans and advances to customers |
2,222 | 710 | 406 | |||||||||
| Public sector |
8 | — | — | |||||||||
| Private sector |
2,214 | 710 | 406 | |||||||||
|
|
|
|
|
|
|
|||||||
| Total |
2,222 | 710 | 406 | |||||||||
|
|
|
|
|
|
|
|||||||
| e) | Securitization |
Loans and advances to customers includes, inter alia, the securitized loans transferred to third parties on which the Group has retained the risks and rewards, albeit partially, and which therefore, in accordance with the applicable accounting standards, cannot be derecognized . The breakdown of the securitized loans, by type of original financial instrument, and of the securitized loans derecognized because the stipulated requirements were met (see Note 2.e) is shown below. Note 22 details the liabilities associated with these securitization transactions.
F-112
Table of Contents
| Millions of euros | ||||||||||||
| 2014 | 2013 | 2012 | ||||||||||
| Derecognized |
2,391 | 3,618 | 6,251 | |||||||||
| Of which |
||||||||||||
| Securitized mortgage assets |
2,391 | 3,618 | 6,249 | |||||||||
| Other securitized assets |
— | — | 2 | |||||||||
| Retained on the balance sheet |
100,503 | 78,229 | 95,981 | |||||||||
| Of which |
||||||||||||
| Securitized mortgage assets |
57,808 | 56,277 | 69,354 | |||||||||
| Of which: UK assets |
36,475 | 45,296 | 56,037 | |||||||||
| Other securitized assets(*) |
42,695 | 21,952 | 26,627 | |||||||||
|
|
|
|
|
|
|
|||||||
| Total |
102,894 | 81,847 | 102,232 | |||||||||
|
|
|
|
|
|
|
|||||||
| (*) | The increase in Other securitized assets with respect to December 31, 2013 relates mainly to the acquisition of control of SCUSA by the Group in January 2014 (see Note 3). |
Securitization is used as a tool for the management of regulatory capital and as a means of diversifying the Group’s liquidity sources. In 2014, 2013 and 2012 the Group did not derecognize any of the securitizations performed, and the balance shown as derecognized for those years relates to securitizations performed in prior years.
The loans derecognized include assets of Santander Holdings USA, Inc. amounting to approximately EUR 1,942 million at December 31, 2014 (December 31, 2013: EUR 3,082 million; December 31, 2012: EUR 5,603 million) that were sold, prior to this company’s inclusion in the Group, on the secondary market for multifamily loans, and over which control was transferred and substantially all the associated risks and rewards were not retained. At December 31, 2014, the Group recognized under Other liabilities an obligation amounting to EUR 34 million (December 31, 2013: EUR 49 million; December 31, 2012: EUR 91 million), which represents the fair value of the retained credit risk.
The loans retained on the face of the balance sheet include the loans associated with securitizations in which the Group retains a subordinated debt and/or grants any manner of credit enhancements to the new holders. In 2012, following the Bank of England’s decision to accept, as collateral in its liquidity programs, not only securitizations but also all mortgage loans with a given credit quality, the Group companies in the UK redeemed GBP 33,800 million of securitized mortgage assets in order to manage more efficiently the on-balance-sheet liquidity of Santander UK.
The loans transferred through securitization are mainly mortgage loans, loans to companies and consumer loans.
F-113
Table of Contents
| 11. | Hedging derivatives |
The detail, by type of risk hedged, of the fair value of the derivatives qualifying for hedge accounting is as follows (see Note 36):
| Millions of euros | ||||||||||||||||||||||||
| 2014 | 2013 | 2012 | ||||||||||||||||||||||
| Assets | Liabilities | Assets | Liabilities | Assets | Liabilities | |||||||||||||||||||
| Fair value hedges |
5,072 | 5,321 | 5,403 | 4,146 | 7,467 | 5,492 | ||||||||||||||||||
| Of which: Portfolio hedges |
413 | 2,319 | 610 | 1,703 | 544 | 2,621 | ||||||||||||||||||
| Cash flow hedges |
2,094 | 1,650 | 1,766 | 1,023 | 344 | 553 | ||||||||||||||||||
| Hedges of net investments in foreign operations |
180 | 284 | 1,132 | 114 | 125 | 399 | ||||||||||||||||||
|
|
|
|
|
|
|
|
|
|
|
|
|
|||||||||||||
| 7,346 | 7,255 | 8,301 | 5,283 | 7,936 | 6,444 | |||||||||||||||||||
|
|
|
|
|
|
|
|
|
|
|
|
|
|||||||||||||
Note 36 contains a description of the Group’s main hedges.
| 12. | Non-current assets held for sale |
The detail of Non-current assets held for sale in the consolidated balance sheets is as follows:
| Millions of euros | ||||||||||||
| 2014 | 2013 | 2012 | ||||||||||
| Tangible assets |
5,256 | 4,845 | 4,259 | |||||||||
| Of which: |
||||||||||||
| Foreclosed assets |
5,139 | 4,742 | 4,196 | |||||||||
| Of which: Property assets in Spain (Note 54) |
4,597 | 4,146 | 3,674 | |||||||||
| Other tangible assets held for sale |
117 | 103 | 63 | |||||||||
| Other assets |
120 | 47 | 1,441 | |||||||||
|
|
|
|
|
|
|
|||||||
| 5,376 | 4,892 | 5,700 | ||||||||||
|
|
|
|
|
|
|
|||||||
At December 31, 2014, the allowance covering the value of the foreclosed and acquired assets amounted to EUR 5,404 million (2013: EUR 4,955 million; 2012: EUR 4,416 million), which represents a coverage ratio of 51.3% of the assets’ gross value (2013: 51.1%; 2012: 51.3%). The net charges recorded in those years amounted to EUR 339 million, EUR 335 million and EUR 449 million, respectively (see Note 50).
In 2014 the Group sold, for EUR 863 million, foreclosed properties with a gross carrying amount of EUR 1,246 million, for which allowance totaling EUR 425 million had been recognized. These sales gave rise to gains of EUR 42 million; in addition, other tangible assets were sold for EUR 64 million, giving rise to a gain of EUR 6 million (see Note 50).
At December 31, 2012, Other assets included assets amounting to EUR 1,370 million corresponding to the Santander UK credit card business. This business was sold for EUR 770 million on May 10, 2013, giving rise to a loss of EUR 14 million, which was recognized under Profit (loss) from discontinued operations (net) in the 2013 consolidated income statement.
F-114
Table of Contents
| 13. | Investments |
| a) | Breakdown |
The detail, by company, of Investments (see Note 2.b) is as follows:
| Millions of euros | ||||||||||||
| 2014 | 2013 | 2012 | ||||||||||
| Associates |
||||||||||||
| Zurich Santander Insurance América, S.L. |
997 | 826 | 1,013 | |||||||||
| Santander Insurance (Ireland) |
288 | — | — | |||||||||
| Metrovacesa, S.A. |
— | 647 | 649 | |||||||||
| Other companies |
490 | 356 | 295 | |||||||||
|
|
|
|
|
|
|
|||||||
| 1,775 | 1,829 | 1,957 | ||||||||||
|
|
|
|
|
|
|
|||||||
| Jointly controlled entities |
||||||||||||
| SAM Investment Holdings Limited |
456 | 449 | — | |||||||||
| Aegon Santander Seguros |
227 | 213 | — | |||||||||
| Unión de Créditos Inmobiliarios, S.A., EFC |
178 | 189 | 172 | |||||||||
| Santander Consumer USA Inc. |
— | 2,159 | 2,026 | |||||||||
| Other companies |
835 | 697 | 299 | |||||||||
|
|
|
|
|
|
|
|||||||
| 1,696 | 3,707 | 2,497 | ||||||||||
|
|
|
|
|
|
|
|||||||
| b) | Changes |
The changes in Investments were as follows:
| Millions of euros | ||||||||||||
| 2014 | 2013 | 2012 | ||||||||||
| Balance at beginning of year |
5,536 | 4,454 | 4,155 | |||||||||
| Acquisitions (disposals) and capital increases (reductions) |
80 | 422 | 34 | |||||||||
| Changes in the scope of consolidation (Note 3) |
(2,383 | ) | 769 | 394 | ||||||||
| Of which: |
||||||||||||
| Santander Consumer USA Inc. |
(2,159 | ) | — | — | ||||||||
| Metrovacesa Group |
(642 | ) | — | — | ||||||||
| Santander Insurance (Ireland) |
285 | — | — | |||||||||
| SAM Investment Holdings Limited |
— | 449 | — | |||||||||
| Aegon Santander Seguros |
— | 211 | — | |||||||||
| Effect of equity accounting (Note 41) |
243 | 500 | 427 | |||||||||
| Dividends paid and reimbursements of share premium |
(178 | ) | (303 | ) | (508 | ) | ||||||
| Exchange differences and other changes |
173 | (306 | ) | (48 | ) | |||||||
|
|
|
|
|
|
|
|||||||
| Balance at end of year |
3,471 | 5,536 | 4,454 | |||||||||
|
|
|
|
|
|
|
|||||||
F-115
Table of Contents
| c) | Impairment losses |
In 2014, 2013 and 2012 there was no evidence of material impairment on the Group’s investments.
| d) | Other information |
Following is a summary of the financial information on the companies accounted for using the equity method (obtained from the information available at the date of preparation of the financial statements):
| Millions of euros | ||||||||||||
| 2014 | 2013 | 2012 | ||||||||||
| Total assets |
40,749 | 63,443 | 54,367 | |||||||||
| Total liabilities |
(36,120 | ) | (55,483 | ) | (46,933 | ) | ||||||
|
|
|
|
|
|
|
|||||||
| Net assets |
4,629 | 7,960 | 7,434 | |||||||||
|
|
|
|
|
|
|
|||||||
| Group’s share of net assets |
2,272 | 3,755 | 2,769 | |||||||||
| Goodwill |
1,199 | 1,781 | 1,685 | |||||||||
| Of which: |
||||||||||||
| Zurich Santander Insurance América, S.L. |
526 | 526 | 526 | |||||||||
| Santander Insurance (Ireland) |
205 | — | — | |||||||||
| Santander Consumer USA Inc. |
— | 937 | 979 | |||||||||
|
|
|
|
|
|
|
|||||||
| Total Group share |
3,471 | 5,536 | 4,454 | |||||||||
|
|
|
|
|
|
|
|||||||
| Total income |
9,780 | 11,756 | 10,232 | |||||||||
|
|
|
|
|
|
|
|||||||
| Total profit |
750 | 1,029 | 612 | |||||||||
|
|
|
|
|
|
|
|||||||
| Group’s share of profit |
243 | 500 | 427 | |||||||||
|
|
|
|
|
|
|
|||||||
Following is a summary of the financial information for 2014 on the main associates and jointly controlled entities (obtained from the information available at the date of preparation of the financial statements):
| Millions of euros | ||||||||||||||||
| Total assets | Total liabilities | Total income | Total profit | |||||||||||||
| Associates |
18,042 | (15,768 | ) | 6,285 | 514 | |||||||||||
|
|
|
|
|
|
|
|
|
|||||||||
| Of which: |
||||||||||||||||
| Zurich Santander Insurance América, S.L. |
11,515 | (10,551 | ) | 4,031 | 338 | |||||||||||
|
|
|
|
|
|
|
|
|
|||||||||
| Jointly controlled entities |
22,707 | (20,352 | ) | 3,495 | 236 | |||||||||||
|
|
|
|
|
|
|
|
|
|||||||||
| Of which: |
||||||||||||||||
| SAM Investment Holdings Limited |
963 | (406 | ) | 1,016 | 118 | |||||||||||
| Unión de Créditos Inmobiliarios, S.A., EFC |
12,357 | (12,002 | ) | 485 | (3 | ) | ||||||||||
| Aegon Santander Seguros |
544 | (230 | ) | 274 | 22 | |||||||||||
|
|
|
|
|
|
|
|
|
|||||||||
| Total |
40,749 | (36,120 | ) | 9,780 | 750 | |||||||||||
|
|
|
|
|
|
|
|
|
|||||||||
At December 31, 2014 and 2013, the Group did not hold any ownership interests in jointly controlled entities or associates whose shares are listed. At December 31, 2012, the only investment in listed associates was the investment held in Metrovacesa, S.A., the fair value of which, based on its quoted price at December 31, 2012, was EUR 761 million (EUR 2.21 per share).
F-116
Table of Contents
| 14. | Insurance contracts linked to pensions |
The detail of Insurance contracts linked to pensions in the consolidated balance sheets is as follows:
| Millions of euros | ||||||||||||
| 2014 | 2013 | 2012 | ||||||||||
| Assets relating to insurance contracts covering post-employment benefit plan obligations: |
||||||||||||
| Banco Santander, S.A. |
345 | 342 | 214 | |||||||||
| Banco Español de Crédito, S.A. |
— | — | 190 | |||||||||
| Other Spanish companies |
— | — | 1 | |||||||||
|
|
|
|
|
|
|
|||||||
| 345 | 342 | 405 | ||||||||||
|
|
|
|
|
|
|
|||||||
In 2012 the Group entered into an agreement with Generali España, S.A. to terminate a portion of the insurance contracts linked to pensions which it held with this insurance company (see Note 25.c).
| 15. | Liabilities under insurance contracts and Reinsurance assets |
The detail of Liabilities under insurance contracts and Reinsurance assets in the consolidated balance sheets (see Note 2.j) is as follows:
| Millions of euros | ||||||||||||||||||||||||||||||||||||
| 2014 | 2013 | 2012 | ||||||||||||||||||||||||||||||||||
| Technical provisions for: |
Direct insurance and reinsurance assumed |
Reinsurance ceded |
Total (balance payable) |
Direct insurance and reinsurance assumed |
Reinsurance ceded |
Total (balance payable) |
Direct insurance and reinsurance assumed |
Reinsurance ceded |
Total (balance payable) |
|||||||||||||||||||||||||||
| Unearned premiums and unexpired risks |
107 | (34 | ) | 73 | 245 | (36 | ) | 209 | 137 | (68 | ) | 69 | ||||||||||||||||||||||||
| Life insurance |
157 | (146 | ) | 11 | 546 | (183 | ) | 363 | 479 | (229 | ) | 250 | ||||||||||||||||||||||||
| Claims outstanding |
378 | (107 | ) | 271 | 315 | (55 | ) | 261 | 391 | (61 | ) | 330 | ||||||||||||||||||||||||
| Bonuses and rebates |
15 | (8 | ) | 7 | 25 | (6 | ) | 19 | 14 | — | 14 | |||||||||||||||||||||||||
| Other technical provisions |
56 | (45 | ) | 11 | 299 | (76 | ) | 222 | 404 | (66 | ) | 338 | ||||||||||||||||||||||||
|
|
|
|
|
|
|
|
|
|
|
|
|
|
|
|
|
|
|
|||||||||||||||||||
| 713 | (340 | ) | 373 | 1,430 | (356 | ) | 1,074 | 1,425 | (424 | ) | 1,001 | |||||||||||||||||||||||||
|
|
|
|
|
|
|
|
|
|
|
|
|
|
|
|
|
|
|
|||||||||||||||||||
The reduction in the amount of Direct insurance and reinsurance assumed at December 31, 2014 is due to the sale of the insurance companies in Ireland -Santander Insurance Life Limited, Santander Insurance Europe Limited and Santander Insurance Services Ireland Limited- (see Note 3).
On July 19, 2012 the Group entered into an agreement with Abbey Life Assurance Company Limited (“Abbey Life Assurance”), a subsidiary of Deutsche Bank, for Abbey Life Assurance to reinsure the entire individual life risk portfolios of the Santander Group insurance companies in Spain and Portugal. Under this agreement, the Group transferred to Abbey Life Assurance, in exchange for a non-refundable up-front amount calculated on the basis of market conditions, its annual renewable life insurance policy portfolio at June 30, 2012 and the potential renewals of these policies. Abbey Life Assurance assumed, from the agreement date, all the risks and rewards relating to the term of these policies and their potential renewals (i.e. both the risk of changes in the actual rates of mortality and permanent total disability compared with the estimated rates, and the lapse risk of the portfolio, credit risk on the part of the insureds, etc.). The Group is continuing to carry out the administrative management (servicing) of these policies, as agent, and receives in exchange from Abbey Life Assurance a market consideration independent of the up-front amount received.
Since the significant risks and rewards have been transferred, this transaction gave rise to income of EUR 435 million recognized under Other operating income - Income from insurance and reinsurance contracts issued in the 2012 consolidated income statement (EUR 308 million net of tax).
F-117
Table of Contents
| 16. | Tangible assets |
| a) | Changes |
The changes in Tangible assets in the consolidated balance sheets were as follows:
| Millions of euros | ||||||||||||||||
| For own use | Leased out under an operating lease |
Investment property |
Total | |||||||||||||
| Cost: |
||||||||||||||||
| Balances as at January 1, 2012 |
14,602 | 3,076 | 4,307 | 21,985 | ||||||||||||
| Additions/disposals (net) due to change in the scope of consolidation |
41 | (11 | ) | (69 | ) | (39 | ) | |||||||||
| Additions/disposals (net) |
795 | (105 | ) | 105 | 795 | |||||||||||
| Transfers, exchange differences and other items |
342 | 157 | (78 | ) | 421 | |||||||||||
|
|
|
|
|
|
|
|
|
|||||||||
| Balances as at December 31, 2012 |
15,780 | 3,117 | 4,265 | 23,162 | ||||||||||||
| Additions/disposals (net) due to change in the scope of consolidation |
(17 | ) | — | 541 | 524 | |||||||||||
| Additions/disposals (net) |
1,021 | (124 | ) | (23 | ) | 874 | ||||||||||
| Transfers, exchange differences and other items |
(989 | ) | 212 | (139 | ) | (916 | ) | |||||||||
|
|
|
|
|
|
|
|
|
|||||||||
| Balances as at December 31, 2013 |
15,795 | 3,205 | 4,644 | 23,644 | ||||||||||||
| Additions/disposals (net) due to change in the scope of consolidation |
229 | 2,472 | 3,296 | 5,997 | ||||||||||||
| Additions/disposals (net) |
952 | 4,868 | (774 | ) | 5,046 | |||||||||||
| Transfers, exchange differences and other items |
375 | (79 | ) | 258 | 554 | |||||||||||
|
|
|
|
|
|
|
|
|
|||||||||
| Balances as at December 31, 2014 |
17,351 | 10,466 | 7,424 | 35,241 | ||||||||||||
|
|
|
|
|
|
|
|
|
|||||||||
| Accumulated depreciation: |
||||||||||||||||
| Balances as at January 1, 2012 |
(6,782 | ) | (832 | ) | (129 | ) | (7,743 | ) | ||||||||
| Disposals due to change in the scope of consolidation |
44 | — | 7 | 51 | ||||||||||||
| Disposals |
423 | 229 | 8 | 660 | ||||||||||||
| Charge for the year |
(1,059 | ) | (1 | ) | (13 | ) | (1,073 | ) | ||||||||
| Transfers, exchange differences and other items |
(252 | ) | (265 | ) | (37 | ) | (554 | ) | ||||||||
|
|
|
|
|
|
|
|
|
|||||||||
| Balances as at December 31, 2012 |
(7,626 | ) | (869 | ) | (164 | ) | (8,659 | ) | ||||||||
| Disposals due to change in the scope of consolidation |
16 | — | — | 16 | ||||||||||||
| Disposals |
280 | 179 | 14 | 473 | ||||||||||||
| Charge for the year |
(1,020 | ) | (1 | ) | (17 | ) | (1,038 | ) | ||||||||
| Transfers, exchange differences and other items |
416 | (235 | ) | (36 | ) | 145 | ||||||||||
|
|
|
|
|
|
|
|
|
|||||||||
| Balances as at December 31, 2013 |
(7,934 | ) | (926 | ) | (203 | ) | (9,063 | ) | ||||||||
| Disposals due to change in the scope of consolidation |
4 | — | — | 4 | ||||||||||||
| Disposals |
403 | 157 | 43 | 603 | ||||||||||||
| Charge for the year |
(1,048 | ) | — | (12 | ) | (1,060 | ) | |||||||||
| Transfers, exchange differences and other items |
(404 | ) | (1,009 | ) | (22 | ) | (1,435 | ) | ||||||||
|
|
|
|
|
|
|
|
|
|||||||||
| Balances as at December 31, 2014 |
(8,979 | ) | (1,778 | ) | (194 | ) | (10,951 | ) | ||||||||
|
|
|
|
|
|
|
|
|
|||||||||
F-118
Table of Contents
| Millions of euros | ||||||||||||||||
| For own use | Leased out under an operating lease |
Investment property |
Total | |||||||||||||
| Impairment losses: |
||||||||||||||||
| Balances as at January 1, 2012 |
(23 | ) | (46 | ) | (327 | ) | (396 | ) | ||||||||
| Impairment charge for the year |
(10 | ) | (23 | ) | (185 | ) | (218 | ) | ||||||||
| Disposals due to change in the scope of consolidation |
— | — | (50 | ) | (50 | ) | ||||||||||
| Exchange differences |
15 | 1 | 6 | 22 | ||||||||||||
|
|
|
|
|
|
|
|
|
|||||||||
| Balances as at December 31, 2012 |
(18 | ) | (68 | ) | (556 | ) | (642 | ) | ||||||||
| Impairment charge for the year |
(53 | ) | (24 | ) | (260 | ) | (337 | ) | ||||||||
| Disposals due to change in the scope of consolidation |
— | — | 39 | 39 | ||||||||||||
| Exchange differences |
(3 | ) | — | 16 | 13 | |||||||||||
|
|
|
|
|
|
|
|
|
|||||||||
| Balances as at December 31, 2013 |
(74 | ) | (92 | ) | (761 | ) | (927 | ) | ||||||||
| Impairment charge for the year |
(5 | ) | (31 | ) | (112 | ) | (148 | ) | ||||||||
| Disposals due to change in the scope of consolidation |
— | — | 28 | 28 | ||||||||||||
| Exchange differences |
31 | — | (18 | ) | 13 | |||||||||||
|
|
|
|
|
|
|
|
|
|||||||||
| Balances as at December 31, 2014 |
(48 | ) | (123 | ) | (863 | ) | (1,034 | ) | ||||||||
|
|
|
|
|
|
|
|
|
|||||||||
| Tangible assets, net: |
||||||||||||||||
| Balances as at December 31, 2012 |
8,136 | 2,179 | 3,545 | 13,860 | ||||||||||||
| Balances as at December 31, 2013 |
7,787 | 2,187 | 3,680 | 13,654 | ||||||||||||
| Balances as at December 31, 2014 |
8,324 | 8,565 | (*) | 6,367 | (*) | 23,256 | ||||||||||
| (*) | The increases in 2014 in Tangible assets - Leased out under an operating lease and Tangible assets - Investment property are due to the business combinations of SCUSA and Metrovacesa, S.A., respectively (see Note 3.b.xi and 3.b.xvi). |
F-119
Table of Contents
| b) | Property, plant and equipment for own use |
The detail, by class of asset, of Property, plant and equipment - For own use in the consolidated balance sheets is as follows:
| Millions of euros | ||||||||||||||||
| Cost | Accumulated depreciation |
Impairment losses |
Carrying amount |
|||||||||||||
| Land and buildings |
5,735 | (1,583 | ) | (18 | ) | 4,134 | ||||||||||
| IT equipment and fixtures |
4,174 | (3,087 | ) | — | 1,087 | |||||||||||
| Furniture and vehicles |
5,403 | (2,873 | ) | — | 2,530 | |||||||||||
| Construction in progress and other items |
468 | (83 | ) | — | 385 | |||||||||||
|
|
|
|
|
|
|
|
|
|||||||||
| Balances as at December 31, 2012 |
15,780 | (7,626 | ) | (18 | ) | 8,136 | ||||||||||
|
|
|
|
|
|
|
|
|
|||||||||
| Land and buildings |
5,781 | (1,624 | ) | (74 | ) | 4,083 | ||||||||||
| IT equipment and fixtures |
4,168 | (3,271 | ) | — | 897 | |||||||||||
| Furniture and vehicles |
5,616 | (2,983 | ) | — | 2,633 | |||||||||||
| Construction in progress and other items |
230 | (56 | ) | — | 174 | |||||||||||
|
|
|
|
|
|
|
|
|
|||||||||
| Balances as at December 31, 2013 |
15,795 | (7,934 | ) | (74 | ) | 7,787 | ||||||||||
|
|
|
|
|
|
|
|
|
|||||||||
| Land and buildings |
5,829 | (1,790 | ) | (48 | ) | 3,991 | ||||||||||
| IT equipment and fixtures |
4,716 | (3,722 | ) | — | 994 | |||||||||||
| Furniture and vehicles |
6,494 | (3,409 | ) | — | 3,085 | |||||||||||
| Construction in progress and other items |
312 | (58 | ) | — | 254 | |||||||||||
|
|
|
|
|
|
|
|
|
|||||||||
| Balances as at December 31, 2014 |
17,351 | (8,979 | ) | (48 | ) | 8,324 | ||||||||||
|
|
|
|
|
|
|
|
|
|||||||||
The carrying amount at December 31, 2014 in the foregoing table includes the following approximate amounts:
| • | EUR 6,161 million (December 31, 2013 and 2012: EUR 5,615 million) relating to property, plant and equipment owned by Group entities and branches located abroad. |
| • | EUR 187 million (December 31, 2013: EUR 138 million; December 31, 2012: EUR 208 million) relating to property, plant and equipment being acquired under finance and operating leases by the consolidated entities. |
| c) | Investment property |
The fair value of investment property at December 31, 2014 amounted to EUR 6,366 million (2013: EUR 3,689 million; 2012: EUR 3,548 million). A comparison of the fair value of investment property at December 31, 2014 with the carrying amount gives rise to unrealized gross losses of EUR 1 million (gross gains of EUR 9 million and EUR 3 million at December 31, 2013 and 2012, respectively).
The rental income earned from investment property and the direct costs related both to investment properties that generated rental income in 2014, 2013 and 2012 and to investment properties that did not generate rental income in those years are not material in the context of the consolidated financial statements.
F-120
Table of Contents
| d) | Sale of properties |
In 2007 and 2008 the Group sold ten hallmark properties, 1,152 Bank branch offices in Spain and its head office complex (Ciudad Financiera or Santander Business Campus) to various buyers. Also, the Group entered into operating leases (with maintenance, insurance and taxes payable by the Group) on those properties with the buyers for various fixed terms (12 to 15 years for the hallmark properties, 24 to 26 years for the branch offices and 40 years for the Santander Business Campus), with various rent review agreements applicable during those periods and the possible extensions thereof. The agreements between the parties also provided for purchase options that in general are exercisable by the Group on final expiry of the leases at the market value of the properties on the expiry dates; the market value will be determined, where appropriate, by independent experts.
The rental expense recognized by the Group in 2014 in connection with these operating lease agreements amounted to EUR 292 million (2013: EUR 286 million; 2012: EUR 269 million). At December 31, 2014, the present value of the minimum future payments that the Group will incur in the compulsory term amounted to EUR 239 million payable within one year, EUR 820 million payable at between one and five years and EUR 1,708 million payable at more than five years.
| 17. | Intangible assets – Goodwill |
The detail of Goodwill, based on the cash-generating units giving rise thereto, is as follows:
| Millions of euros | ||||||||||||
| 2014 | 2013 | 2012 | ||||||||||
| Santander UK |
9,540 | 8,913 | 9,105 | |||||||||
| Banco Santander (Brazil) |
6,129 | 5,840 | 7,035 | |||||||||
| Santander Consumer USA (Note 3) |
2,762 | — | — | |||||||||
| Bank Zachodni WBK |
2,418 | 2,487 | 2,210 | |||||||||
| Santander Bank NA |
1,691 | 1,489 | 1,556 | |||||||||
| Santander Consumer Germany |
1,315 | 1,315 | 1,315 | |||||||||
| Banco Santander Totta |
1,040 | 1,040 | 1,040 | |||||||||
| Banco Santander - Chile |
675 | 687 | 788 | |||||||||
| Santander Consumer Bank (Nordics) (Note 3) |
564 | 171 | 186 | |||||||||
| Grupo Financiero Santander (Mexico) |
561 | 541 | 558 | |||||||||
| Other companies |
853 | 798 | 833 | |||||||||
|
|
|
|
|
|
|
|||||||
| Total goodwill |
27,548 | 23,281 | 24,626 | |||||||||
|
|
|
|
|
|
|
|||||||
F-121
Table of Contents
The changes in Goodwill were as follows:
| Millions of euros | ||||||||||||
| 2014 | 2013 | 2012 | ||||||||||
| Balance at beginning of year |
23,281 | 24,626 | 25,089 | |||||||||
| Additions (Note 3) |
3,176 | 398 | 87 | |||||||||
| Of which: |
||||||||||||
| Santander Consumer USA |
2,482 | — | — | |||||||||
| Santander Consumer Bank (Nordics) |
408 | — | — | |||||||||
| Getnet Tecnologia Em Captura e Processamento de Transações H.U.A.H. S.A. - Banco Santander (Brazil) |
229 | — | — | |||||||||
| Financiera El Corte Inglés, E.F.C., S.A. |
32 | — | — | |||||||||
| Bank Zachodni WBK |
— | 326 | — | |||||||||
| Impairment losses |
(2 | ) | (40 | ) | (156 | ) | ||||||
| Of which: |
||||||||||||
| Santander Consumer Bank S.p.A. (Italy) |
— | — | (156 | ) | ||||||||
| Disposals or changes in scope of consolidation (Note 3) |
— | (39 | ) | — | ||||||||
| Exchange differences and other items |
1,093 | (1,664 | ) | (394 | ) | |||||||
|
|
|
|
|
|
|
|||||||
| Balance at end of year |
27,548 | 23,281 | 24,626 | |||||||||
|
|
|
|
|
|
|
|||||||
The Group has goodwill generated by cash-generating units located in non-euro currency countries (mainly the UK, Brazil, the United States, Poland, Chile, Norway, Sweden and Mexico) and, therefore, this gives rise to exchange differences on the translation to euros, at closing rates, of the amounts of goodwill denominated in foreign currencies. Accordingly, in 2014 goodwill increased by EUR 1,093 million due to exchange differences (see Note 29-c) which, pursuant to current regulations, were recognized with a credit to Valuation adjustments - Exchange differences in equity in the consolidated statement of recognized income and expense.
At least once per year (or whenever there is any indication of impairment), the Group reviews goodwill for impairment (i.e. a potential reduction in its recoverable value to below its carrying amount). The first step that must be taken in order to perform this analysis is the identification of the cash-generating units, i.e. the Group’s smallest identifiable groups of assets that generate cash inflows that are largely independent of the cash inflows from other assets or groups of assets.
The amount to be recovered of each cash-generating unit is determined taking into consideration the carrying amount (including any fair value adjustment arising on the business combination) of all the assets and liabilities of all the independent legal entities composing the cash-generating unit, together with the related goodwill.
The amount to be recovered of the cash-generating unit is compared with its recoverable amount in order to determine whether there is any impairment.
The Group’s directors assess the existence of any indication that might be considered to be evidence of impairment of the cash-generating unit by reviewing information including the following: (i) certain macroeconomic variables that might affect its investments (population data, political situation, economic situation -including bankarisation-, among others) and (ii) various microeconomic variables comparing the investments of the Group with the financial services industry of the country in which the cash-generating unit carries on most of its business activities (balance sheet composition, total funds under management, results, efficiency ratio, capital adequacy ratio, return on equity, among others).
Regardless of whether there is any indication of impairment, every year the Group calculates the recoverable amount of each cash-generating unit to which goodwill has been allocated and, to this end, it uses price quotations, if available, market references (multiples), internal estimates and appraisals performed by independent experts.
F-122
Table of Contents
Firstly, the Group determines the recoverable amount by calculating the fair value of each cash-generating unit on the basis of the quoted price of the cash-generating units, if available, and of the price earnings ratios of comparable local entities.
In addition, the Group performs estimates of the recoverable amounts of certain cash-generating units by calculating their value in use using discounted cash flow projections. The main assumptions used in this calculation are: (i) earnings projections based on the financial budgets approved by the Group’s directors which normally cover a five-year period (unless a longer time horizon can be justified), (ii) discount rates determined as the cost of capital taking into account the risk-free rate of return plus a risk premium in line with the market and the business in which the units operate and (iii) constant growth rates used in order to extrapolate earnings to perpetuity which do not exceed the long-term average growth rate for the market in which the cash-generating unit in question operates.
The cash flow projections used by Group management to obtain the values in use are based on the financial budgets approved by both local management of the related local units and the Group’s directors. The Group’s budgetary estimation process is common for all the cash-generating units. The local management teams prepare their budgets using the following key assumptions:
| a) | Microeconomic variables of the cash-generating unit: management takes into consideration the current balance sheet structure, the product mix on offer and the business decisions taken by local management in this regard. |
| b) | Macroeconomic variables: growth is estimated on the basis of the changing environment, taking into consideration expected GDP growth in the unit’s geographical location and forecast trends in interest and exchange rates. These data, which are based on external information sources, are provided by the Group’s economic research service. |
| c) | Past performance variables: in addition, management takes into consideration in the projection the difference (both positive and negative) between the cash-generating unit’s past performance and that of the market. |
Following is a detail of the main assumptions used in determining the recoverable amount, at 2014 year-end, of the most significant cash-generating units which were valued using the discounted cash flow method:
| Projected period |
Discount rate (*) |
Nominal perpetual growth rate |
||||||||||
| Santander UK |
5 years | 9.9 | % | 2.5 | % | |||||||
| Banco Santander (Brazil) |
5 years | 14.4 | % | 7.0 | % | |||||||
| Santander Bank NA |
5 years | 9.6 | % | 2.5 | % | |||||||
| Santander Consumer Germany |
5 years | 9.2 | % | 2.5 | % | |||||||
| Santander Consumer USA |
3 years | 10.5 | % | 3.0 | % | |||||||
| Banco Santander Totta |
5 years | 11.2 | % | 2.5 | % | |||||||
| (*) | Post-tax discount rate for the purpose of consistency with the earnings projections used. |
F-123
Table of Contents
Given the degree of uncertainty of these assumptions, the Group performs a sensitivity analysis thereof using reasonable changes in the key assumptions on which the recoverable amount of the cash-generating units is based in order to confirm whether their recoverable amount still exceeds their carrying amount. The sensitivity analysis involved adjusting the discount rate by +/- 50 basis points and the perpetuity growth rate by +/-50 basis points. Following the sensitivity analysis performed, the value in use of all the cash-generating units still exceeds their recoverable amount.
The recoverable amount of Bank Zachodni WBK, Banco Santander - Chile and Grupo Financiero Santander (México) was calculated as the fair values of the aforementioned cash-generating units obtained from the market prices of their shares at year-end. This value exceeded the recoverable amount.
Based on the foregoing, and in accordance with the estimates, projections and sensitivity analyses available to the Bank’s directors, in 2014 the Group recognized impairment losses on goodwill totaling EUR 2 million (2013: EUR 40 million; 2012: EUR 156 million) under Impairment losses on other assets (net) - Goodwill and other intangible assets. In 2012 the impairment losses recognized, which were due mainly to the deterioration of business expectations, related mainly to Group subsidiaries in Italy.
At December 31, 2014, none of the cash-generating units with significant goodwill had a recoverable amount approximating their carrying amount, except for Santander Consumer USA, the recoverable amount of which is very close to its carrying amount since the business combination took place in 2014. The recoverable amount is considered to be close to the carrying amount when reasonable changes in the main assumptions used in the valuation cause the recoverable amount to be below the carrying amount.
| 18. | Intangible assets - Other intangible assets |
The detail of Intangible assets - Other intangible assets in the consolidated balance sheets and of the changes therein in 2014, 2013 and 2012 is as follows:
| Millions of euros | ||||||||||||||||||||||||||||||
| Estimated useful life |
December 31, 2013 |
Net additions and disposals |
Change in scope of consolidation |
Amortization and impairment |
Application of amortization and impairment |
Exchange differences and other |
December 31, 2014 |
|||||||||||||||||||||||
| With indefinite useful life: |
||||||||||||||||||||||||||||||
| Brand names |
15 | — | 43 | — | — | 3 | 61 | |||||||||||||||||||||||
| With finite useful life: |
||||||||||||||||||||||||||||||
| IT developments |
3 to 7 years |
5,546 | 1,345 | 63 | — | (1,731 | ) | 127 | 5,350 | |||||||||||||||||||||
| Other |
1,132 | (127 | ) | 525 | — | (250 | ) | 14 | 1,294 | |||||||||||||||||||||
| Accumulated amortization |
(3,603 | ) | — | — | (1,227 | ) | 1,269 | (62 | ) | (3,623 | ) | |||||||||||||||||||
| Impairment losses |
(130 | ) | — | — | (699 | ) | 712 | (112 | ) | (229 | ) | |||||||||||||||||||
|
|
|
|
|
|
|
|
|
|
|
|
|
|
|
|||||||||||||||||
| 2,960 | 1,218 | 631 | (1,926 | ) | — | 30 | 2,853 | |||||||||||||||||||||||
|
|
|
|
|
|
|
|
|
|
|
|
|
|
|
|||||||||||||||||
F-124
Table of Contents
| Millions of euros | ||||||||||||||||||||||||||||||
| Estimated useful life |
December 31, 2012 |
Net additions and disposals |
Change in scope of consolidation |
Amortization and impairment |
Application of amortization and impairment |
Exchange differences and other |
December 31, 2013 |
|||||||||||||||||||||||
| With indefinite useful life: |
||||||||||||||||||||||||||||||
| Brand names |
14 | 2 | — | — | — | (1 | ) | 15 | ||||||||||||||||||||||
| With finite useful life: |
||||||||||||||||||||||||||||||
| IT developments |
3 to 7 years |
5,285 | 1,229 | 4 | — | (679 | ) | (293 | ) | 5,546 | ||||||||||||||||||||
| Other |
1,373 | (46 | ) | 37 | — | (37 | ) | (195 | ) | 1,132 | ||||||||||||||||||||
| Accumulated amortization |
(3,106 | ) | — | (3 | ) | (1,353 | ) | 715 | 144 | (3,603 | ) | |||||||||||||||||||
| Impairment losses |
(130 | ) | — | — | (1 | ) | 1 | — | (130 | ) | ||||||||||||||||||||
|
|
|
|
|
|
|
|
|
|
|
|
|
|
|
|||||||||||||||||
| 3,436 | 1,185 | 38 | (1,354 | ) | — | (345 | ) | 2,960 | ||||||||||||||||||||||
|
|
|
|
|
|
|
|
|
|
|
|
|
|
|
|||||||||||||||||
| Millions of euros | ||||||||||||||||||||||||||||||
| Estimated useful life |
December 31, 2011 |
Net additions and disposals |
Change in scope of consolidation |
Amortization and impairment |
Application of amortization and impairment |
Exchange differences and other |
December 31, 2012 |
|||||||||||||||||||||||
| With indefinite useful life: |
||||||||||||||||||||||||||||||
| Brand names |
14 | — | — | — | — | — | 14 | |||||||||||||||||||||||
| With finite useful life: |
||||||||||||||||||||||||||||||
| IT developments |
3 to 7 years |
5,127 | 1,098 | 45 | — | (911 | ) | (74 | ) | 5,285 | ||||||||||||||||||||
| Other |
1,494 | 545 | 11 | — | (552 | ) | (125 | ) | 1,373 | |||||||||||||||||||||
| Accumulated amortization |
(3,150 | ) | — | (28 | ) | (1,110 | ) | 1,139 | 43 | (3,106 | ) | |||||||||||||||||||
| Impairment losses |
(491 | ) | — | — | 5 | 324 | 32 | (130 | ) | |||||||||||||||||||||
|
|
|
|
|
|
|
|
|
|
|
|
|
|
|
|||||||||||||||||
| 2,994 | 1,643 | 28 | (1,105 | ) | — | (124 | ) | 3,436 | ||||||||||||||||||||||
|
|
|
|
|
|
|
|
|
|
|
|
|
|
|
|||||||||||||||||
Impairment losses of EUR 699 million were recognized under Impairment losses on other assets (net) in the consolidated income statement. These impairment losses relate mainly to the decline in or loss of the recoverable value of certain computer systems and applications as a result of the processes initiated by the Group to adapt to the various regulatory changes and to transform or integrate businesses.
F-125
Table of Contents
| 19. | Other assets |
The detail of Other assets is as follows:
| Millions of euros | ||||||||||||
| 2014 | 2013 | 2012 | ||||||||||
| Transactions in transit |
727 | 127 | 224 | |||||||||
| Net pension plan assets (Note 25) |
413 | 149 | 348 | |||||||||
| Prepayments and accrued income |
2,001 | 2,114 | 1,756 | |||||||||
| Other |
3,909 | 3,344 | 3,046 | |||||||||
| Inventories |
1,099 | 80 | 173 | |||||||||
|
|
|
|
|
|
|
|||||||
| 8,149 | 5,814 | 5,547 | ||||||||||
|
|
|
|
|
|
|
|||||||
The increase in Inventories in 2014 relates mainly to the consolidation of the assets of Metrovacesa, S.A. (see Note 3).
| 20. | Deposits from central banks and Deposits from credit institutions |
The detail, by classification, counterparty, type and currency, of Deposits from central banks and Deposits from credit institutions in the consolidated balance sheets is as follows:
| Millions of euros | ||||||||||||
| 2014 | 2013 | 2012 | ||||||||||
| Classification: |
||||||||||||
| Financial liabilities held for trading |
7,572 | 11,334 | 9,420 | |||||||||
| Of which: |
||||||||||||
| Deposits from central banks |
2,041 | 3,866 | 1,128 | |||||||||
| Deposits from credit institutions |
5,531 | 7,468 | 8,292 | |||||||||
| Other financial liabilities at fair value through profit or loss |
25,360 | 11,741 | 11,876 | |||||||||
| Of which: |
||||||||||||
| Deposits from central banks |
6,321 | 2,097 | 1,014 | |||||||||
| Deposits from credit institutions |
19,039 | 9,644 | 10,862 | |||||||||
| Financial liabilities at amortized cost |
122,437 | 86,322 | 131,670 | |||||||||
| Of which: |
||||||||||||
| Deposits from central banks |
17,290 | 9,788 | 50,938 | |||||||||
| Deposits from credit institutions |
105,147 | 76,534 | 80,732 | |||||||||
|
|
|
|
|
|
|
|||||||
| 155,369 | 109,397 | 152,966 | ||||||||||
|
|
|
|
|
|
|
|||||||
| Type: |
||||||||||||
| Reciprocal accounts |
704 | 755 | 508 | |||||||||
| Time deposits |
85,178 | 55,839 | 92,491 | |||||||||
| Other demand accounts |
4,893 | 3,425 | 3,225 | |||||||||
| Repurchase agreements |
64,594 | 49,378 | 50,742 | |||||||||
| Central bank credit account drawdowns |
— | — | 6,000 | |||||||||
|
|
|
|
|
|
|
|||||||
| 155,369 | 109,397 | 152,966 | ||||||||||
|
|
|
|
|
|
|
|||||||
| Currency: |
||||||||||||
| Euro |
86,539 | 63,947 | 98,808 | |||||||||
| Pound sterling |
8,107 | 6,993 | 8,566 | |||||||||
| US dollar |
34,646 | 27,509 | 34,904 | |||||||||
| Other currencies |
26,077 | 10,948 | 10,688 | |||||||||
|
|
|
|
|
|
|
|||||||
| 155,369 | 109,397 | 152,966 | ||||||||||
|
|
|
|
|
|
|
|||||||
F-126
Table of Contents
The increase in Deposits from central banks in 2014 is due to the Group’s participation in the European Central Bank’s targeted longer-term refinancing operations (TLTROs) in the last quarter of the year for the approximate amount of EUR 8.2 thousand million.
Both asset and liability balances with central banks increased in 2012 following the liquidity injections by the central banks in countries where the Group operates, particularly in the euro zone. The Group continued to attend these auctions and deposit at the ECB most of the funds captured, significantly increasing the liquidity buffer and improving its structure by replacing short-term maturities with longer term funding. The Group repaid most of these amounts in January 2013.
Note 51 contains a detail of the residual maturity periods of financial liabilities at amortized cost and of the related average interest rates.
| 21. | Customer deposits |
The detail, by classification, geographical area and type, of Customer deposits is as follows:
| Millions of euros | ||||||||||||
| 2014 | 2013 | 2012 | ||||||||||
| Classification: |
||||||||||||
| Financial liabilities held for trading |
5,544 | 8,500 | 8,897 | |||||||||
| Other financial liabilities at fair value through profit or loss |
33,127 | 26,484 | 28,638 | |||||||||
| Financial liabilities at amortized cost |
608,956 | 572,853 | 589,104 | |||||||||
|
|
|
|
|
|
|
|||||||
| 647,627 | 607,837 | 626,639 | ||||||||||
|
|
|
|
|
|
|
|||||||
| Geographical area: |
||||||||||||
| Spain |
186,051 | 185,460 | 192,588 | |||||||||
| European Union (excluding Spain) |
275,291 | 259,903 | 261,135 | |||||||||
| United States and Puerto Rico |
51,291 | 43,773 | 45,129 | |||||||||
| Other OECD countries |
55,003 | 47,541 | 47,948 | |||||||||
| Latin America (non-OECD) |
79,848 | 71,004 | 79,682 | |||||||||
| Rest of the world |
143 | 156 | 157 | |||||||||
|
|
|
|
|
|
|
|||||||
| 647,627 | 607,837 | 626,639 | ||||||||||
|
|
|
|
|
|
|
|||||||
| Type: |
||||||||||||
| Demand deposits- |
||||||||||||
| Current accounts |
200,752 | 167,787 | 144,305 | |||||||||
| Savings accounts |
173,105 | 164,214 | 167,389 | |||||||||
| Other demand deposits |
5,046 | 3,512 | 3,443 | |||||||||
| Time deposits- |
||||||||||||
| Fixed-term deposits |
222,756 | 225,471 | 257,583 | |||||||||
| Home-purchase savings accounts |
71 | 102 | 132 | |||||||||
| Discount deposits |
448 | 1,156 | 1,345 | |||||||||
| Hybrid financial liabilities |
3,525 | 3,324 | 3,128 | |||||||||
| Other term deposits |
484 | 463 | 590 | |||||||||
| Notice deposits |
22 | 21 | 969 | |||||||||
| Repurchase agreements |
41,418 | 41,787 | 47,755 | |||||||||
|
|
|
|
|
|
|
|||||||
| 647,627 | 607,837 | 626,639 | ||||||||||
|
|
|
|
|
|
|
|||||||
Note 51 contains a detail of the residual maturity periods of financial liabilities at amortized cost and of the related average interest rates.
F-127
Table of Contents
| 22. | Marketable debt securities |
| a) | Breakdown |
The detail, by classification and type, of Marketable debt securities is as follows:
| Millions of euros | ||||||||||||
| 2014 | 2013 | 2012 | ||||||||||
| Classification: |
||||||||||||
| Financial liabilities held for trading |
— | 1 | 1 | |||||||||
| Other financial liabilities at fair value through profit or loss |
3,830 | 4,086 | 4,904 | |||||||||
| Financial liabilities at amortized cost |
193,059 | 171,390 | 201,064 | |||||||||
|
|
|
|
|
|
|
|||||||
| 196,889 | 175,477 | 205,969 | ||||||||||
|
|
|
|
|
|
|
|||||||
| Type: |
||||||||||||
| Bonds and debentures outstanding |
178,710 | 161,274 | 183,686 | |||||||||
| Notes and other securities |
18,179 | 14,203 | 22,283 | |||||||||
|
|
|
|
|
|
|
|||||||
| 196,889 | 175,477 | 205,969 | ||||||||||
|
|
|
|
|
|
|
|||||||
Note 51 contains a detail of the residual maturity periods of financial liabilities at amortized cost and of the related average interest rates in those years.
| b) | Bonds and debentures outstanding |
The detail, by currency of issue, of Bonds and debentures outstanding is as follows:
| December 31, 2014 | ||||||||||||||||||||
| Outstanding issue amount in foreign currency (millions) |
Annual interest rate (%) |
|||||||||||||||||||
|
Millions of euros |
||||||||||||||||||||
| Currency of issue |
2014 | 2013 | 2012 | |||||||||||||||||
| Euro |
89,803 | 85,120 | 111,173 | 89,803 | 2.65 | % | ||||||||||||||
| US dollar |
39,992 | 25,641 | 26,186 | 48,554 | 2.31 | % | ||||||||||||||
| Pound sterling |
19,613 | 20,237 | 24,707 | 15,276 | 2.89 | % | ||||||||||||||
| Brazilian real |
18,707 | 15,017 | 14,581 | 60,251 | 10.82 | % | ||||||||||||||
| Hong Kong dollar |
41 | 5,026 | 170 | 390 | 4.62 | % | ||||||||||||||
| Chilean peso |
3,596 | 3,360 | 3,906 | 2,651,462 | 3.61 | % | ||||||||||||||
| Other currencies |
6,958 | 6,873 | 2,963 | |||||||||||||||||
|
|
|
|
|
|
|
|||||||||||||||
| Balance at end of year |
178,710 | 161,274 | 183,686 | |||||||||||||||||
|
|
|
|
|
|
|
|||||||||||||||
F-128
Table of Contents
The changes in Bonds and debentures outstanding were as follows:
| Millions of euros | ||||||||||||
| 2014 | 2013 | 2012 | ||||||||||
| Balance at beginning of year |
161,274 | 183,686 | 185,530 | |||||||||
| Net inclusion of entities in the Group |
7,024 | — | (1,649 | ) | ||||||||
| Of which: |
||||||||||||
| Santander Consumer USA Holdings Inc.(Note 3) |
7,024 | — | — | |||||||||
| Issues |
66,360 | 61,754 | 80,817 | |||||||||
| Of which: |
||||||||||||
| Santander UK Group |
||||||||||||
| Bonds in other currencies |
18,608 | 23,491 | 32,162 | |||||||||
| Bond in pounds sterling |
2,769 | 5,877 | 13,281 | |||||||||
| Banco Santander (Brasil) S.A. |
||||||||||||
| Real estate letters of credit |
9,551 | 4,989 | 5,359 | |||||||||
| Bonds |
4,511 | 5,777 | 6,461 | |||||||||
| Agricultural letters of credit |
1,756 | 478 | 1,612 | |||||||||
| Santander Consumer USA Holdings Inc. |
||||||||||||
| Asset-backed securities |
7,600 | — | — | |||||||||
| Santander International Debt, S.A. Sole-Shareholder Company: |
||||||||||||
| Bonds - floating/fixed rate |
4,853 | 4,654 | 9,727 | |||||||||
| Banco Santander, S.A. |
||||||||||||
| Mortgage backed bonds – fixed rate |
2,944 | 1,990 | 4,089 | |||||||||
| Territorial bonds - fixed rate |
218 | 4,000 | — | |||||||||
| Bonds |
— | 323 | — | |||||||||
| Santander Consumer Finance, S.A. - Bonds |
3,602 | 2,325 | 1,012 | |||||||||
| Banco Santander - Chile - Bonds |
1,979 | 1,469 | 1,436 | |||||||||
| Banco Santander Totta S.A.- Mortgage debentures |
1,746 | — | — | |||||||||
| Santander Consumer Bank AS - Bonds |
470 | 443 | 816 | |||||||||
| Banco Santander (México), S.A., Institución de Banca Múltiple, Grupo Financiero Santander - México Bonds |
1,099 | 392 | 780 | |||||||||
| Motor 2014 PLC - Asset-backed securities |
736 | — | — | |||||||||
| Bilkreditt 6 Limited - Asset-backed securities |
638 | — | — | |||||||||
| Fondo de Titulización de Activos Pymes Santander 10 - Asset-backed securities |
590 | — | — | |||||||||
| Svensk Autofinans WH 1 Ltd - Asset-backed securities |
474 | — | — | |||||||||
| Santander International Products, Plc. - Bonds |
341 | 65 | — | |||||||||
| SC Germany Auto 2014-1 UG (Haftungsbeschränkt) - Asset-backed securities |
389 | — | — | |||||||||
| Santander Consumer Bank SA - Bonds |
188 | 256 | 112 | |||||||||
| Santander Consumer Bank S.P.A. - Bonds - floating rate |
35 | 100 | — | |||||||||
| Motor 2013 PLC - Asset-backed securities |
— | 598 | — | |||||||||
| Bilkreditt 5 Limited - Asset-backed securities |
— | 494 | — | |||||||||
| Bilkreditt 3 Limited - Asset-backed securities |
— | 468 | — | |||||||||
| SC Germany Auto 2013-12 UG - Asset-backed securities |
— | 466 | — | |||||||||
| Dansk Auto Finansiering 1 Ltd - Asset-backed securities |
— | 416 | — | |||||||||
| SC Germany Auto 2013-2 UG (Haftungsbeschränkt) - Asset-backed securities |
— | 407 | — | |||||||||
| SCF Rahoituspalvelut 2013 Limited - Asset-backed securities |
— | 384 | — | |||||||||
| Santander Holdings USA, Inc. - Bonds |
— | 362 | 453 | |||||||||
| Bilkreditt 4 Limited- Asset-backed securities |
— | 357 | — | |||||||||
| Trade Maps 3 Ireland Limited - Debentures - floating rate |
— | 313 | — | |||||||||
| Fondo de Titulización de Activos PYMES Santander 6 - Asset-backed securities |
— | 235 | — | |||||||||
| Banco Español de Crédito, S.A. |
||||||||||||
| Mortgage-backed bonds - fixed rate |
— | — | 955 | |||||||||
| Bonds |
— | — | 949 | |||||||||
| Motor 2012 PLC - Asset-backed securities |
— | — | 895 | |||||||||
| Svensk Autofinans 1 Limited - Asset-backed securities |
— | — | 407 | |||||||||
| SCF Rahoituspalvelut Limited - Asset-backed securities |
— | — | 237 | |||||||||
| Redemptions |
(60,883 | ) | (73,619 | ) | (78,706 | ) | ||||||
| Of which: |
||||||||||||
| Santander UK Group |
(19,213 | ) | (37,388 | ) | (41,862 | ) | ||||||
| Banco Santander (Brasil) S.A. |
(14,359 | ) | (8,246 | ) | (9,346 | ) | ||||||
| Banco Santander, S.A. |
(12,391 | ) | (11,434 | ) | (6,542 | ) | ||||||
| Santander International Debt, S.A. Sole-Shareholder Company |
(6,967 | ) | (10,437 | ) | (8,479 | ) | ||||||
| Banco Santander - Chile |
(2,186 | ) | (1,263 | ) | (1,112 | ) | ||||||
| Santander Consumer Finance, S.A. |
(1,422 | ) | (1,012 | ) | (481 | ) | ||||||
| Banco Santander Totta, S.A. |
(1,095 | ) | (962 | ) | (1,014 | ) | ||||||
| Banco Santander (México), S.A., Institución de Banca Múltiple, Grupo Financiero Santander México |
(726 | ) | (62 | ) | (11 | ) | ||||||
| Brazil Foreign Diversified Payment Rights Finance Company |
(655 | ) | — | — | ||||||||
| Santander International Products, Plc. |
(610 | ) | (1,605 | ) | — | |||||||
| Santander Consumer Bank SA |
(200 | ) | (48 | ) | (68 | ) | ||||||
| Santander US Debt, S.A. Sole-Shareholder Company |
— | (947 | ) | (1,146 | ) | |||||||
| Santander Consumer Bank AG |
— | (6 | ) | (863 | ) | |||||||
| Banco Español de Crédito, S.A. |
— | — | (6,401 | ) | ||||||||
| Santander Holdings USA, Inc. |
— | — | (1,236 | ) | ||||||||
| Exchange differences |
6,706 | (5,590 | ) | (636 | ) | |||||||
| Other changes |
(1,771 | ) | (4,957 | ) | (1,670 | ) | ||||||
|
|
|
|
|
|
|
|||||||
| Balance at end of year |
178,710 | 161,274 | 183,686 | |||||||||
|
|
|
|
|
|
|
|||||||
F-129
Table of Contents
| c) | Notes and other securities |
These notes were issued basically by Banco Santander, S.A., Santander Consumer Finance, S.A., Santander Commercial Paper, S.A. (Sole-Shareholder Company), Abbey National North America LLC, Santander UK plc, Abbey National Treasury Services plc, Banco Santander (México), S.A., Institución de Banca Múltiple, Grupo Financiero Santander México, Santander Securities Services, S.A. and Fondo de Titulización de Activos Santander 2.
| d) | Guarantees |
Set forth below is information on the liabilities secured by financial assets:
| Millions of euros | ||||||||||||
| 2014 | 2013 | 2012 | ||||||||||
| Asset-backed securities |
39,594 | 30,020 | 35,853 | |||||||||
| Of which, mortgage-backed securities |
18,059 | 22,843 | 29,938 | |||||||||
| Other mortgage securities |
60,569 | 59,984 | 67,214 | |||||||||
| Of which: mortgage-backed bonds |
29,227 | 32,717 | 38,500 | |||||||||
|
|
|
|
|
|
|
|||||||
| 100,163 | 90,004 | 103,067 | ||||||||||
|
|
|
|
|
|
|
|||||||
The main characteristics of the assets securing the aforementioned financial liabilities are as follows:
| 1. | Asset-backed securities: |
| a. | Mortgage-backed securities- these securities are secured by securitized mortgage assets (see Note 10.e) with average maturities of more than ten years that must: be a first mortgage for acquisition of principal or second residence, be current in payments, have a loan-to-value ratio below 80% and have a liability insurance policy in force covering at least the appraisal value. The value of the financial liabilities broken down in the foregoing table is lower than the balance of the assets securing them - securitized assets retained on the balance sheet - mainly because the Group repurchases a portion of the bonds issued, and in such cases they are not recognized on the liabilities side of the consolidated balance sheet. |
| b. | Other asset-backed securities- including asset-backed securities and notes issued by special-purpose vehicles secured mainly by mortgage loans that do not meet the foregoing requirements and other loans (mainly personal loans with average maturities of five years and loans to SMEs with average maturities of seven years). |
| 2. | Other mortgage securities include mainly: (i) mortgage-backed bonds with average maturities of more than ten years that are secured by a portfolio of mortgage loans and credits (included in secured loans—see Note 10.b) which must: not be classified as at procedural stage; have available appraisals performed by specialized entities; have a loan-to-value ratio below 80% in the case of home loans and below 60% for loans for other assets and have sufficient liability insurance, (ii) other debt securities issued as part of the Group’s liquidity strategy in the UK, mainly covered bonds in the UK secured by mortgage loans and other assets. |
The fair value of the guarantees received by the Group (financial and non-financial assets) which the Group is authorized to sell or pledge even if the owner of the guarantee has not defaulted is not material taking into account the Group’s financial statements as a whole.
F-130
Table of Contents
| e) | Spanish mortgage-market issues |
The members of the board of directors hereby state that the Group entities operating in the Spanish mortgage-market issues area have established and implemented specific policies and procedures to cover all activities carried on and comply with mortgage-market regulations applicable to these activities as provided for in Royal Decree 716/2009, of April 24, implementing certain provisions of Mortgage Market Law 2/1981, of March 25, and, by application thereof, in Bank of Spain Circulars 7/2010 and 5/2011, and other financial and mortgage system regulations. Also, financial management defines the Group entities’ funding strategy.
The risk policies applicable to mortgage market transactions envisage maximum loan-to-value (LTV) ratios, and specific policies are also in place adapted to each mortgage product, which occasionally require the application of stricter limits.
The Bank’s general policies in this respect require the repayment capacity of each potential customer (the effort ratio in loan approval) to be analyzed using specific indicators that must be met. This analysis must determine whether each customer’s income is sufficient to meet the repayments of the loan requested. In addition, the analysis of each customer must include a conclusion on the stability over time of the customer’s income considered with respect to the life of the loan. The aforementioned indicator used to measure the repayment capacity (effort ratio) of each potential customer takes into account mainly the relationship between the potential debt and the income generated, considering on the one hand the monthly repayments of the loan requested and other transactions and, on the other, the monthly salary income and duly supported income.
The Group entities have specialized document comparison procedures and tools for verifying customer information and solvency (see Note 54).
The Group entities’ procedures envisage that each mortgage originated in the mortgage market must be individually valued by an appraisal company not related to the Group.
In accordance with Article 5 of Mortgage Market Law 41/2007, any appraisal company approved by the Bank of Spain may issue valid appraisal reports. However, as permitted by this same article, the Group entities perform several checks and select, from among these companies, a small group with which they enter into cooperation agreements with special conditions and automated control mechanisms. The Group’s internal regulations specify, in detail, each of the internally approved companies, as well as the approval requirements and procedures and the controls established to uphold them. In this connection, the regulations establish the functions of an appraisal company committee on which the various areas of the Group related to these companies are represented. The aim of the committee is to regulate and adapt the internal regulations and the activities of the appraisal companies to the current market and business situation.
Basically, the companies wishing to cooperate with the Group must have a significant level of activity in the mortgage market in the area in which they operate, they must pass a preliminary screening process based on criteria of independence, technical capacity and solvency -in order to ascertain the continuity of their business- and, lastly, they must pass a series of tests prior to obtaining definitive approval.
In order to comply in full with the legislation, any appraisal provided by the customer is reviewed, irrespective of which appraisal company issues it, to check that the requirements, procedures and methods used to prepare it are formally adapted to the valued asset pursuant to current legislation and that the values reported are customary in the market.
F-131
Table of Contents
The information required by Bank of Spain Circulars 7/2010 and 5/2011, by application of Royal Decree 716/2009, of April 24, is as follows:
| Millions of euros |
||||
| Face value of the outstanding mortgage loans and credits that support the issuance of mortgage-backed and mortgage bonds pursuant to Royal Decree 716/2009 (excluding securitized bonds) |
68,306 | |||
| Of which: |
||||
| Loans eligible to cover issues of mortgage-backed securities |
42,764 | |||
| Transfers of assets retained on balance sheet: mortgage-backed certificates and other securitized mortgage assets |
19,542 | |||
Mortgage-backed bonds
The mortgage-backed bonds (“cédulas hipotecarias”) issued by the Group entities are securities the principal and interest of which are specifically secured by mortgages, there being no need for registration in the Property Register and without prejudice to the issuer’s unlimited liability.
The mortgage-backed bonds include the holder’s financial claim on the issuer, secured as indicated in the preceding paragraph, and may be enforced to claim payment from the issuer after maturity. The holders of these securities have the status of special preferential creditors vis-à-vis all other creditors (established in Article 1923.3 of the Spanish Civil Code) in relation to all the mortgage loans and credits registered in the issuer’s favor and, where appropriate, in relation to the cash flows generated by the derivative financial instruments associated with the issues.
In the event of insolvency, the holders of mortgage-backed bonds will enjoy the special privilege established in Article 90.1.1 of Insolvency Law 22/2003, of July 9. Without prejudice to the foregoing, in accordance with Article 84.2.7 of the Insolvency Law, during the insolvency proceedings, the payments relating to the repayment of the principal and interest of the bonds issued and outstanding at the date of the insolvency filing will be settled up to the amount of the income received by the insolvent party from the mortgage loans and credits and, where appropriate, from the replacement assets backing the bonds and from the cash flows generated by the financial instruments associated with the issues (Final Provision 19 of the Insolvency Law).
If, due to a timing mismatch, the income received by the insolvent party is insufficient to meet the payments described in the preceding paragraph, the insolvency managers must settle them by realizing the replacement assets set aside to cover the issue and, if this is not sufficient, they must obtain financing to meet the mandated payments to the holders of the mortgage-backed bonds, and the finance provider must be subrogated to the position of the bond-holders.
In the event that the measure indicated in Article 155.3 of the Insolvency Law were to be adopted, the payments to all holders of the mortgage-backed bonds issued would be made on a pro-rata basis, irrespective of the issue dates of the bonds.
The outstanding mortgage-backed bonds issued by the Group totaled EUR 29,227 million at December 31, 2014 (all of which were denominated in euros), of which EUR 28,092 million were issued by Banco Santander, S.A. and EUR 1,135 million were issued by Santander Consumer Finance, S.A. The issues outstanding at December 31, 2014 and 2013 are detailed in the separate financial statements of each of these companies.
F-132
Table of Contents
Mortgage-backed bond issuers have an early redemption option solely for the purpose of complying with the limits on the volume of outstanding mortgage-backed bonds stipulated by mortgage market regulations.
None of the mortgage-backed bonds issued by the Group entities had replacement assets assigned to them.
| 23. | Subordinated liabilities |
| a) | Breakdown |
The detail, by currency of issue, of Subordinated liabilities in the consolidated balance sheets is as follows:
| Millions of euros | December 31, 2014 | |||||||||||||||||||
| Currency of issue |
2014 | 2013 | 2012 | Outstanding issue amount in foreign currency (millions) |
Annual interest rate (%) |
|||||||||||||||
| Euro |
5,901 | 4,600 | 5,214 | 5,901 | 3.80 | % | ||||||||||||||
| US dollar |
5,525 | 4,413 | 3,932 | 6,708 | 5.35 | % | ||||||||||||||
| Pound sterling |
1,776 | 2,750 | 3,292 | 1,383 | 8.10 | % | ||||||||||||||
| Brazilian real |
2,267 | 2,734 | 4,409 | 7,302 | 11.07 | % | ||||||||||||||
| Other currencies |
1,663 | 1,642 | 1,391 | |||||||||||||||||
|
|
|
|
|
|
|
|||||||||||||||
| Balance at end of year |
17,132 | 16,139 | 18,238 | |||||||||||||||||
|
|
|
|
|
|
|
|||||||||||||||
| Of which, preference shares (acciones preferentes) |
739 | 401 | 421 | |||||||||||||||||
| Of which, preference shares (participaciones preferentes) |
6,239 | 3,652 | 4,319 | |||||||||||||||||
Note 51 contains a detail of the residual maturity periods of subordinated liabilities at each year-end and of the related average interest rates in each year.
F-133
Table of Contents
| b) | Changes |
The changes in Subordinated liabilities in the last three years were as follows:
| Millions of euros | ||||||||||||
| 2014 | 2013 | 2012 | ||||||||||
| Balance at beginning of year |
16,139 | 18,238 | 22,992 | |||||||||
| Net inclusion of entities in the Group (Note 3) |
— | 237 | (1 | ) | ||||||||
| Issues |
4,351 | 1,027 | 2 | |||||||||
| Of which: |
||||||||||||
| Banco Santander, S.A. |
4,235 | — | — | |||||||||
| Banco Santander (Brasil) S.A. |
115 | — | — | |||||||||
| Santander UK plc |
— | 599 | — | |||||||||
| Banco Santander (México), S.A., Institución de Banca Múltiple, Grupo Financiero Santander México |
— | 235 | — | |||||||||
| Banco Santander - Chile |
— | 191 | — | |||||||||
| Redemptions and repurchases |
(3,743 | ) | (1,915 | ) | (4,080 | ) | ||||||
| Of which: |
||||||||||||
| Santander Issuances, S.A., Sole-Shareholder Company |
(1,425 | ) | (608 | ) | (1,253 | ) | ||||||
| Santander Finance Preferred, S.A., Sole-Shareholder Company |
(1,678 | ) | (7 | ) | (99 | ) | ||||||
| Banco Santander (Brasil), S.A. |
(379 | ) | (663 | ) | — | |||||||
| Banco Santander Chile |
(174 | ) | (7 | ) | (168 | ) | ||||||
| Banco Santander, S.A. |
(61 | ) | (28 | ) | (66 | ) | ||||||
| Santander Finance Capital, S.A., Sole-Shareholder Company |
(21 | ) | (4 | ) | — | |||||||
| Santander Securities Services, S.A. |
(3 | ) | (6 | ) | — | |||||||
| Abbey National Capital Trust I |
— | (278 | ) | (203 | ) | |||||||
| Santander Holdings USA, Inc. |
— | (193 | ) | (264 | ) | |||||||
| Santander PR Capital Trust I |
— | (91 | ) | — | ||||||||
| Santander Perpetual, S.A., Sole-Shareholder Company |
— | (28 | ) | (155 | ) | |||||||
| Santander UK plc |
— | — | (1,166 | ) | ||||||||
| Banco Español de Crédito, S.A. |
— | — | (608 | ) | ||||||||
| Exchange differences |
737 | (923 | ) | (190 | ) | |||||||
| Other changes |
(352 | ) | (525 | ) | (485 | ) | ||||||
|
|
|
|
|
|
|
|||||||
| Balance at end of year |
17,132 | 16,139 | 18,238 | |||||||||
|
|
|
|
|
|
|
|||||||
| c) | Other disclosures |
This item includes the preference shares (participaciones preferentes) and other financial instruments issued by the consolidated companies which, although equity for legal purposes, do not meet the requirements for classification as equity (preference shares).
The preference shares do not carry any voting rights and are non-cumulative. They were subscribed to by non-Group third parties and, except for the shares of Santander UK plc referred to below, are redeemable at the discretion of the issuer, based on the terms and conditions of each issue.
At December 31, 2014, Santander UK plc had a GBP 200 million subordinated issue which is convertible, at Santander UK plc’s option, into preference shares of Santander UK plc, at a price of GBP 1 per share.
For the purposes of payment priority, preference shares (participaciones preferentes) are junior to all general creditors and to subordinated deposits. The remuneration of these securities, which have no voting rights, is conditional upon the obtainment of sufficient distributable profit and upon the limits imposed by Spanish banking regulations on equity.
F-134
Table of Contents
The other issues are subordinated and, therefore, for the purposes of payment priority, they are junior to all general creditors of the issuers. The issues launched by Santander Central Hispano Issuances Limited, Santander Issuances, S.A. (Sole-Shareholder Company), Santander Perpetual, S.A. (Sole-Shareholder Company), Santander Finance Capital, S.A. (Sole-Shareholder Company), Santander International Preferred, S.A. (Sole-Shareholder Company) and Santander Finance Preferred, S.A. (Sole-Shareholder Company) are guaranteed by the Bank or by restricted deposits arranged by the Bank for this purpose. At December 31, 2014, the balance of these issues amounted to EUR 5,081 million.
At December 31, 2014, the following issues were convertible into Bank shares:
On March 5, May 8 and September 2, 2014, Banco Santander, S.A. announced that its executive committee had resolved to launch issues of preference shares contingently convertible into newly issued ordinary shares of the Bank (“CCPSs”) for a nominal amount of EUR 1,500 million, USD 1,500 million and EUR 1,500 million. The interest, payment of which is subject to certain conditions and is discretionary, was set at 6.25% per annum for the first five years (to be reprised thereafter by applying a 541 basis-point spread to the 5-year Mid-Swap Rate) for the March issue, at 6.375% per annum for the first five years (to be reprised thereafter by applying a 478.8 basis-point spread to the 5-year Mid-Swap Rate) for the May issue and at 6.25% per annum for the first seven years (to be reprised every five years thereafter by applying a 564 basis-point spread to the 5-year Mid-Swap Rate) for the September issue.
On March 25, 2014, May 28 and September 30, the Bank of Spain confirmed that the CCPSs were eligible as Additional Tier 1 capital under the new European capital requirements of Regulation (EU) No 575/2013. The CCPSs are perpetual, although they may be redeemed early in certain circumstances and would convert into newly issued ordinary shares of Banco Santander if the Common Equity Tier 1 ratio of the Bank or its consolidated group fell below 5.125%, calculated in accordance with Regulation (EU) No 575/2013. The CCPSs are traded on the Global Exchange Market of the Irish Stock Exchange.
Furthermore, on January 29, 2014, Banco Santander (Brasil), S.A. launched an issue of Tier 1 perpetual subordinated notes for a nominal amount of USD 1,248 million, of which the Group has acquired 89.6%. The notes are perpetual and would convert into ordinary shares of Banco Santander (Brasil), S.A. if the Common Equity Tier 1 ratio, calculated as established by the Central Bank of Brazil, were to fall below 5.125%.
The interest accrued on subordinated liabilities amounted to EUR 1,084 million in 2014 (2013: EUR 1,260 million; 2012: EUR 1,650 million) (see Note 39).
| 24. | Other financial liabilities |
The detail of Other financial liabilities in the consolidated balance sheets is as follows:
| Millions of euros | ||||||||||||
| 2014 | 2013 | 2012 | ||||||||||
| Trade payables |
1,276 | 1,031 | 1,255 | |||||||||
| Clearing houses |
562 | 841 | 573 | |||||||||
| Tax collection accounts: |
||||||||||||
| Tax payables |
2,304 | 2,197 | 2,021 | |||||||||
| Factoring accounts payable |
193 | 194 | 201 | |||||||||
| Unsettled financial transactions |
4,445 | 3,063 | 5,080 | |||||||||
| Other financial liabilities |
10,688 | 9,084 | 10,115 | |||||||||
|
|
|
|
|
|
|
|||||||
| 19,468 | 16,410 | 19,245 | ||||||||||
|
|
|
|
|
|
|
|||||||
Note 51 contains a detail of the residual maturity periods of other financial liabilities at each year-end.
F-135
Table of Contents
| 25. | Provisions |
| a) | Breakdown |
The detail of Provisions in the consolidated balance sheets is as follows:
| Millions of euros | ||||||||||||
| 2014 | 2013 | 2012 | ||||||||||
| Provisions for pensions and similar obligations |
9,412 | 9,126 | 10,353 | |||||||||
| Provisions for taxes and other legal contingencies |
2,916 | 2,727 | 3,100 | |||||||||
| Provisions for contingent liabilities and commitments (Note 2): |
654 | 693 | 617 | |||||||||
| Of which: due to country risk |
2 | 4 | 3 | |||||||||
| Other provisions |
2,394 | 2,043 | 1,932 | |||||||||
|
|
|
|
|
|
|
|||||||
| Provisions |
15,376 | 14,589 | 16,002 | |||||||||
|
|
|
|
|
|
|
|||||||
F-136
Table of Contents
| b) | Changes |
The changes in Provisions in the last three years were as follows:
| Millions of euros | ||||||||||||||||||||||||||||||||||||||||||||||||
| 2014 | 2013 | 2012 | ||||||||||||||||||||||||||||||||||||||||||||||
| Pensions | Contingent liabilities and commitments |
Other provisions |
Total | Pensions | Contingent liabilities and commitments |
Other provisions |
Total | Pensions | Contingent liabilities and commitments |
Other provisions |
Total | |||||||||||||||||||||||||||||||||||||
| Balances at beginning of year |
9,126 | 693 | 4,770 | 14,589 | 10,353 | 617 | 5,032 | 16,002 | 10,782 | 659 | 5,731 | 17,172 | ||||||||||||||||||||||||||||||||||||
| Net inclusion of entities in the Group |
11 | 3 | 74 | 88 | (1 | ) | 15 | — | 14 | (60 | ) | (1 | ) | (16 | ) | (77 | ) | |||||||||||||||||||||||||||||||
| Additions charged to income: |
||||||||||||||||||||||||||||||||||||||||||||||||
| Interest expense and similar charges (Note 39) |
344 | — | — | 344 | 363 | — | — | 363 | 398 | — | — | 398 | ||||||||||||||||||||||||||||||||||||
| Personnel expenses (Note 47) |
75 | — | — | 75 | 88 | — | — | 88 | 145 | — | — | 145 | ||||||||||||||||||||||||||||||||||||
| Period provisions |
361 | 54 | 2,594 | 3,009 | 397 | 126 | 1,922 | 2,445 | (184 | ) | 68 | 1,588 | 1,472 | |||||||||||||||||||||||||||||||||||
| Other additions arising from insurance contracts linked to pensions |
31 | — | — | 31 | (27 | ) | — | — | (27 | ) | (161 | ) | — | — | (161 | ) | ||||||||||||||||||||||||||||||||
| Changes in value recognized in equity |
770 | — | — | 770 | (90 | ) | — | — | (90 | ) | 1,682 | — | — | 1,682 | ||||||||||||||||||||||||||||||||||
| Payments to pensioners and pre-retirees with a charge to internal provisions |
(1,038 | ) | — | — | (1,038 | ) | (1,086 | ) | — | — | (1,086 | ) | (980 | ) | — | — | (980 | ) | ||||||||||||||||||||||||||||||
| Benefits paid due to settlements |
— | — | — | — | (2 | ) | — | — | (2 | ) | (1,006 | ) | — | — | (1,006 | ) | ||||||||||||||||||||||||||||||||
| Insurance premiums paid |
(11 | ) | — | — | (11 | ) | (6 | ) | — | — | (6 | ) | 54 | — | — | 54 | ||||||||||||||||||||||||||||||||
| Payments to external funds |
(607 | ) | — | — | (607 | ) | (217 | ) | — | — | (217 | ) | (268 | ) | — | — | (268 | ) | ||||||||||||||||||||||||||||||
| Amounts used |
— | — | (2,293 | ) | (2,293 | ) | — | — | (1,661 | ) | (1,661 | ) | — | — | (2,161 | ) | (2,161 | ) | ||||||||||||||||||||||||||||||
| Transfers, exchange differences and other changes |
350 | (96 | ) | 165 | 419 | (646 | ) | (65 | ) | (523 | ) | (1,234 | ) | (49 | ) | (109 | ) | (110 | ) | (268 | ) | |||||||||||||||||||||||||||
|
|
|
|
|
|
|
|
|
|
|
|
|
|
|
|
|
|
|
|
|
|
|
|
|
|||||||||||||||||||||||||
| Balances at end of year |
9,412 | 654 | 5,310 | 15,376 | 9,126 | 693 | 4,770 | 14,589 | 10,353 | 617 | 5,032 | 16,002 | ||||||||||||||||||||||||||||||||||||
|
|
|
|
|
|
|
|
|
|
|
|
|
|
|
|
|
|
|
|
|
|
|
|
|
|||||||||||||||||||||||||
F-137
Table of Contents
| c) | Provisions for pensions and similar obligations |
The detail of Provisions for pensions and similar obligations is as follows:
| Millions of euros | ||||||||||||
| 2014 | 2013 | 2012 | ||||||||||
| Provisions for post-employment plans - Spanish entities |
4,915 | 4,643 | 4,909 | |||||||||
| Of which: defined benefit |
4,910 | 4,633 | 4,900 | |||||||||
| Provisions for other similar obligations - Spanish entities |
2,237 | 2,161 | 2,404 | |||||||||
| Of which: pre-retirements |
2,220 | 2,149 | 2,389 | |||||||||
| Provisions for post-employment plans - Santander UK plc |
256 | 806 | 409 | |||||||||
| Provisions for post-employment plans and other similar obligations - Other foreign subsidiaries |
2,004 | 1,516 | 2,631 | |||||||||
| Of which: defined benefit |
1,999 | 1,512 | 2,626 | |||||||||
|
|
|
|
|
|
|
|||||||
| Provisions for pensions and similar obligations |
9,412 | 9,126 | 10,353 | |||||||||
|
|
|
|
|
|
|
|||||||
| i. | Spanish entities - Post-employment plans and other similar obligations |
At December 31, 2014, 2013 and 2012, the Spanish entities had post-employment benefit obligations under defined contribution and defined benefit plans. In addition, in various years some of the consolidated entities offered certain of their employees the possibility of taking pre-retirement and, therefore, provisions are recognized each year for the obligations to employees taking pre-retirement -in terms of salaries and other employee benefit costs- from the date of their pre-retirement to the date of normal retirement. In 2014, 2011 employees accepted the pre-retirement and voluntary redundancy offers, and the provision recognized to cover these obligations totaled EUR 642 million (2013: EUR 334 million).
In 2012, the Bank and Banesto reached an agreement with the employees’ representatives to alter the form of the defined-benefit obligations arising from the collective agreement into defined-contribution plans. In addition, the senior executives’ contracts with defined-benefit pension obligations were amended to alter such obligations into a defined-contribution employee welfare system.
The amount of the obligations accrued with respect to all the current employees, both those subject to the collective agreement and senior executives, whose defined-benefit obligations were converted into defined-contribution plans, totaled EUR 1,389 million. The obligations thus altered were externalized through the execution of various insurance contracts with Spanish insurance companies. The effect of the settlement of such defined-benefit obligations is shown in the tables below.
The expenses incurred by the Group in respect of contributions to defined contribution plans amounted to EUR 105 million in 2014 (2013: EUR 108 million; 2012: EUR 54 million).
The amount of the defined benefit obligations was determined on the basis of the work performed by independent actuaries using the following actuarial techniques:
| 1. | Valuation method: projected unit credit method, which sees each period of service as giving rise to an additional unit of benefit entitlement and measures each unit separately. |
F-138
Table of Contents
| 2. | Actuarial assumptions used: unbiased and mutually compatible. Specifically, the most significant actuarial assumptions used in the calculations were as follows: |
| Post-employment plans | Other similar obligations | |||||||||||
| 2014 | 2013 |
2012 |
2014 |
2013 |
2012 | |||||||
| Annual discount rate |
2.00% | 3.00% | 2.75% and 3% in the case of Banesto | 2.00% | 3.00% | 2.75% and 3% in the case of Banesto | ||||||
| Mortality tables |
PERM/F-2000 | PERM/F-2000 | GRM/F-95 (PERM/F-2000 in the case of Banesto) | PERM/F-2000 | PERM/F-2000 | GRM/F-95 (PERM/F-2000 in the case of Banesto) | ||||||
| Cumulative annual CPI growth |
1.5% | 1.5% | 1.5% | 1.5% | 1.5% | 1.5% | ||||||
| Annual salary increase rate |
2.50% (*) | 2.50% (*) | 2% (*) | n/a | n/a | n/a | ||||||
| Annual social security pension increase rate |
||||||||||||
| 1.5% | 1.5% | 1.5% | n/a | n/a | n/a | |||||||
| Annual benefit increase rate |
n/a | n/a | n/a | 0% to 1.5% | 0% to 1.5% | 0% to 1.5% | ||||||
| (*) | Corresponds to the Group’s defined-benefit obligations. |
The discount rate used for the flows was determined by reference to high-quality corporate bonds (at least AA in euros) that coincide with the terms of the obligations. The portfolio of bonds taken into consideration excludes callable, puttable and sinkable bonds which could distort the discount rate.
Any changes in the main assumptions could affect the calculation of the obligations. At December 31, 2014, if the discount rate used had been decreased or increased by 50 basis points, there would have been an increase or decrease in the present value of the post-employment obligations of +/- 5.5% and an increase or decrease in the present value of the long-term obligations of +/- 1.15%. These changes would be offset in part by increases or decreases in the fair value of the assets and insurance contracts linked to pensions.
| 3. | The estimated retirement age of each employee is the first at which the employee is entitled to retire or the agreed-upon age, as appropriate. |
The fair value of insurance contracts was determined as the present value of the related payment obligations, taking into account the following assumptions:
| Post-employment plans | Other similar obligations | |||||||||||
| 2014 | 2013 |
2012 |
2014 | 2013 | 2012 | |||||||
| Expected rate of return on plan assets |
2.0% | 3.0% | 2.75% and 3% in the case of Banesto | n/a | n/a | n/a | ||||||
| Expected rate of return on reimbursement rights |
2.0% | 3.0% | 2.75% and 3% in the case of Banesto | n/a | n/a | n/a | ||||||
F-139
Table of Contents
The funding status of the defined benefit obligations in 2014 and the four preceding years is as follows:
| Millions of euros | ||||||||||||||||||||||||||||||||||||||||
| Post-employment plans | Other similar obligations | |||||||||||||||||||||||||||||||||||||||
| 2014 | 2013 | 2012 | 2011 | 2010 | 2014 | 2013 | 2012 | 2011 | 2010 | |||||||||||||||||||||||||||||||
| Present value of the obligations: |
||||||||||||||||||||||||||||||||||||||||
| To current employees |
62 | 50 | 58 | 1,533 | 1,240 | — | — | — | — | — | ||||||||||||||||||||||||||||||
| Vested obligations to retired employees |
4,708 | 4,483 | 4,765 | 4,367 | 4,471 | — | — | — | — | — | ||||||||||||||||||||||||||||||
| To pre-retirees |
— | — | — | — | — | 2,220 | 2,149 | 2,389 | 2,769 | 3,262 | ||||||||||||||||||||||||||||||
| Long-service bonuses and other benefits |
— | — | — | — | — | 13 | 11 | 7 | 7 | 8 | ||||||||||||||||||||||||||||||
| Other |
307 | 257 | 221 | 185 | 181 | 4 | 1 | 8 | 5 | 3 | ||||||||||||||||||||||||||||||
|
|
|
|
|
|
|
|
|
|
|
|
|
|
|
|
|
|
|
|
|
|||||||||||||||||||||
| 5,077 | 4,790 | 5,044 | 6,085 | 5,892 | 2,237 | 2,161 | 2,404 | 2,781 | 3,273 | |||||||||||||||||||||||||||||||
| Less- |
||||||||||||||||||||||||||||||||||||||||
| Fair value of plan assets |
167 | 157 | 144 | 177 | 183 | — | — | — | — | — | ||||||||||||||||||||||||||||||
|
|
|
|
|
|
|
|
|
|
|
|
|
|
|
|
|
|
|
|
|
|||||||||||||||||||||
| Provisions - Provisions for pensions |
4,910 | 4,633 | 4,900 | 5,908 | 5,709 | 2,237 | 2,161 | 2,404 | 2,781 | 3,273 | ||||||||||||||||||||||||||||||
|
|
|
|
|
|
|
|
|
|
|
|
|
|
|
|
|
|
|
|
|
|||||||||||||||||||||
| Of which: |
||||||||||||||||||||||||||||||||||||||||
| Internal provisions for pensions |
4,565 | 4,293 | 4,495 | 3,762 | 3,490 | 2,237 | 2,161 | 2,404 | 2,781 | 3,272 | ||||||||||||||||||||||||||||||
| Insurance contracts linked to pensions (Note 14) |
345 | 342 | 405 | 2,146 | 2,219 | — | — | — | — | 1 | ||||||||||||||||||||||||||||||
| Unrecognized net assets for pensions |
— | (2 | ) | — | — | — | — | — | — | — | — | |||||||||||||||||||||||||||||
The amounts recognized in the consolidated income statements in relation to the aforementioned defined benefit obligations are as follows:
| Millions of euros | ||||||||||||||||||||||||
| Post-employment plans | Other similar obligations | |||||||||||||||||||||||
| 2014 | 2013 | 2012 | 2014 | 2013 | 2012 | |||||||||||||||||||
| Current service cost |
10 | 10 | 53 | 1 | — | 1 | ||||||||||||||||||
| Interest cost (net) |
139 | 139 | 204 | 59 | 61 | 101 | ||||||||||||||||||
| Expected return on insurance contracts linked to pensions |
(9 | ) | (11 | ) | (45 | ) | — | — | — | |||||||||||||||
| Extraordinary charges (credits)- |
||||||||||||||||||||||||
| Actuarial (gains)/losses recognized in the year |
— | — | — | 48 | 3 | 66 | ||||||||||||||||||
| Past service cost |
— | 30 | 22 | — | 34 | 21 | ||||||||||||||||||
| Pre-retirement cost |
12 | 8 | — | 630 | 326 | 55 | ||||||||||||||||||
| Effect of curtailment/settlement |
(14 | ) | (6 | ) | (401 | ) | — | — | 1 | |||||||||||||||
|
|
|
|
|
|
|
|
|
|
|
|
|
|||||||||||||
| 138 | 170 | (167) | 738 | 424 | 245 | |||||||||||||||||||
In addition, in 2014 Valuation adjustments – Other valuation adjustments increased by EUR 427 million with respect to defined benefit obligations (2013: an increase of EUR 52 million; 2012: a decrease of EUR 533 million).
F-140
Table of Contents
The changes in the present value of the accrued defined benefit obligations were as follows:
| Millions of euros | ||||||||||||||||||||||||
| Post-employment plans | Other similar obligations | |||||||||||||||||||||||
| 2014 | 2013 | 2012 | 2014 | 2013 | 2012 | |||||||||||||||||||
| Present value of the obligations at beginning of year |
4,790 | 5,044 | 6,085 | 2,161 | 2,404 | 2,781 | ||||||||||||||||||
| Net inclusion of entities in the Group |
— | (5 | ) | — | — | — | — | |||||||||||||||||
| Current service cost |
10 | 10 | 53 | 1 | — | 1 | ||||||||||||||||||
| Interest cost |
144 | 145 | 211 | 59 | 61 | 101 | ||||||||||||||||||
| Pre-retirement cost |
12 | 8 | — | 630 | 326 | 55 | ||||||||||||||||||
| Effect of curtailment/settlement |
(14 | ) | (6 | ) | (401 | ) | — | — | — | |||||||||||||||
| Benefits paid due to settlements |
— | — | (1,006 | ) | — | — | — | |||||||||||||||||
| Other benefits paid |
(355 | ) | (394 | ) | (317 | ) | (665 | ) | (661 | ) | (624 | ) | ||||||||||||
| Past service cost |
— | 30 | 15 | — | 34 | 21 | ||||||||||||||||||
| Actuarial (gains)/losses (*) |
485 | (79 | ) | 382 | 48 | 3 | 66 | |||||||||||||||||
| Exchange differences and other items |
5 | 37 | 22 | 3 | (6 | ) | 3 | |||||||||||||||||
|
|
|
|
|
|
|
|
|
|
|
|
|
|||||||||||||
| Present value of the obligations at end of year |
5,077 | 4,790 | 5,044 | 2,237 | 2,161 | 2,404 | ||||||||||||||||||
|
|
|
|
|
|
|
|
|
|
|
|
|
|||||||||||||
| (*) | Including in 2014 demographic actuarial losses of EUR 8 million and financial actuarial losses of EUR 477 million in the post-employment plans, as well as demographic actuarial losses of EUR 1 million and financial actuarial losses of EUR 47 million in other similar obligations. |
The changes in the fair value of plan assets and of insurance contracts linked to pensions were as follows:
Plan assets
| Millions of euros | ||||||||||||
| Post-employment plans | ||||||||||||
| 2014 | 2013 | 2012 | ||||||||||
| Fair value of plan assets at beginning of year |
157 | 144 | 177 | |||||||||
| Expected return on plan assets |
5 | 6 | 7 | |||||||||
| Actuarial gains/(losses) |
27 | — | 11 | |||||||||
| Contributions/(surrenders) |
11 | 5 | (42 | ) | ||||||||
| Benefits paid |
(38 | ) | (12 | ) | (9 | ) | ||||||
| Exchange differences and other items |
5 | 14 | — | |||||||||
|
|
|
|
|
|
|
|||||||
| Fair value of plan assets at end of year |
167 | 157 | 144 | |||||||||
|
|
|
|
|
|
|
|||||||
Insurance contracts linked to pensions
| Millions of euros | ||||||||||||||||||||||||
| Post-employment plans | Other similar obligations | |||||||||||||||||||||||
| 2014 | 2013 | 2012 | 2014 | 2013 | 2012 | |||||||||||||||||||
| Fair value of insurance contracts linked to pensions at beginning of year |
342 | 405 | 2,146 | — | — | — | ||||||||||||||||||
| Expected return on insurance contracts (Note 38) |
9 | 11 | 45 | — | — | — | ||||||||||||||||||
| Benefits paid |
(37 | ) | (47 | ) | (59 | ) | — | — | — | |||||||||||||||
| Premiums paid/(surrenders) (Note 14) |
— | — | (1,565 | ) | — | — | (1 | ) | ||||||||||||||||
| Actuarial gains/(losses) |
31 | (27 | ) | (162 | ) | — | — | 1 | ||||||||||||||||
|
|
|
|
|
|
|
|
|
|
|
|
|
|||||||||||||
| Fair value of insurance contracts linked to pensions at end of year |
345 | 342 | 405 | — | — | — | ||||||||||||||||||
|
|
|
|
|
|
|
|
|
|
|
|
|
|||||||||||||
F-141
Table of Contents
In view of the conversion of the defined-benefit obligations to defined-contribution obligations, the Group will not make material current contributions in Spain in 2015 to fund its defined-benefit pension obligations.
The plan assets and the insurance contracts linked to pensions are instrumented mainly through insurance policies.
The following table shows the estimated benefits payable at December 31, 2014 for the next ten years:
| Millions of euros |
||||
| 2015 |
959 | |||
| 2016 |
838 | |||
| 2017 |
717 | |||
| 2018 |
612 | |||
| 2019 |
515 | |||
| 2020 to 2024 |
1,656 | |||
| ii. | United Kingdom |
At the end of each of the last three years, the businesses in the United Kingdom had post-employment benefit obligations under defined contribution and defined benefit plans. The expenses incurred in respect of contributions to defined contribution plans amounted to EUR 84 million in 2014 (2013: EUR 62 million; 2012: EUR 53 million).
The amount of the defined benefit obligations was determined on the basis of the work performed by independent actuaries using the following actuarial techniques:
| 1. | Valuation method: projected unit credit method, which sees each period of service as giving rise to an additional unit of benefit entitlement and measures each unit separately. |
| 2. | Actuarial assumptions used: unbiased and mutually compatible. Specifically, the most significant actuarial assumptions used in the calculations were as follows: |
| 2014 | 2013 | 2012 | ||||
| Annual discount rate |
3.65% | 4.45% | 4.50% | |||
| Mortality tables |
116/98 S1 Light TMC | 103 S1 Light TMC | 103 S1 Light TMC | |||
| Cumulative annual CPI growth |
3.05% | 3.40% | 2.85% | |||
| Annual salary increase rate |
1.00% | 3.40% | 2.85% | |||
| Annual pension increase rate |
2.85% | 3.15% | 2.75% | |||
The discount rate used for the flows was determined by reference to high-quality corporate bonds (at least AA in pounds sterling) that coincide with the terms of the obligations. The portfolio of bonds taken into consideration excludes callable, puttable and sinkable bonds which could distort the indices.
F-142
Table of Contents
Any changes in the main assumptions could affect the calculation of the obligations. At December 31, 2014, if the discount rate used had been decreased or increased by 50 basis points, there would have been an increase or decrease in the present value of the obligations of +/- 10.6%. If the cumulative annual CPI growth assumption had been increased or decreased by 50 basis points, there would have been an increase or decrease in the present value of the obligations of +/- 7.1%. These changes would be offset in part by increases or decreases in the fair value of the plan assets.
The funding status of the defined benefit obligations in 2014 and the four preceding years is as follows:
| Millions of euros | ||||||||||||||||||||
| 2014 | 2013 | 2012 | 2011 | 2010 | ||||||||||||||||
| Present value of the obligations: |
11,959 | 10,120 | 9,260 | 8,467 | 7,824 | |||||||||||||||
|
|
|
|
|
|
|
|
|
|
|
|||||||||||
| Less- |
||||||||||||||||||||
| Fair value of plan assets |
12,108 | 9,455 | 9,194 | 8,496 | 7,617 | |||||||||||||||
|
|
|
|
|
|
|
|
|
|
|
|||||||||||
| Provisions - Provisions for pensions |
(149 | ) | 665 | 66 | (29 | ) | 207 | |||||||||||||
|
|
|
|
|
|
|
|
|
|
|
|||||||||||
| Of which: |
||||||||||||||||||||
| Internal provisions for pensions |
256 | 806 | 409 | 255 | 261 | |||||||||||||||
| Net assets for pensions |
(405 | ) | (141 | ) | (343 | ) | (284 | ) | (54 | ) | ||||||||||
The amounts recognized in the consolidated income statements in relation to the aforementioned defined benefit obligations are as follows:
| Millions of euros | ||||||||||||
| 2014 | 2013 | 2012 | ||||||||||
| Current service cost |
29 | 32 | 49 | |||||||||
| Interest cost (net) |
16 | 1 | 34 | |||||||||
| Past service cost |
(286 | ) | — | — | ||||||||
|
|
|
|
|
|
|
|||||||
| (241 | ) | 33 | 83 | |||||||||
|
|
|
|
|
|
|
|||||||
In addition, in 2014 Valuation adjustments –Other valuation adjustments decreased by EUR 173 million with respect to defined benefit obligations (2013: a decrease of EUR 697 million; 2012: a decrease of EUR 182 million).
F-143
Table of Contents
The changes in the present value of the accrued defined benefit obligations were as follows:
| Millions of euros | ||||||||||||
| 2014 | 2013 | 2012 | ||||||||||
| Present value of the obligations at beginning of year |
10,120 | 9,260 | 8,467 | |||||||||
| Current service cost |
29 | 32 | 49 | |||||||||
| Interest cost |
455 | 396 | 427 | |||||||||
| Benefits paid |
(263 | ) | (239 | ) | (258 | ) | ||||||
| Past service cost |
(286 | ) | — | — | ||||||||
| Actuarial (gains)/losses (*) |
1,174 | 852 | 367 | |||||||||
| Exchange differences and other items |
730 | (181 | ) | 208 | ||||||||
|
|
|
|
|
|
|
|||||||
| Present value of the obligations at end of year |
11,959 | 10,120 | 9,260 | |||||||||
|
|
|
|
|
|
|
|||||||
| (*) Including in 2014 demographic actuarial losses of EUR 236 million and financial actuarial losses of EUR 938 million. |
| |||||||||||
In 2014 Santander UK reached an agreement with the workers’ representatives to convert a portion of the defined-benefit obligations into defined-contribution plans. The effect of the reduction of the aforementioned obligations is shown in the preceding table under Past service cost.
The changes in the fair value of the plan assets were as follows:
| Millions of euros | ||||||||||||
| 2014 | 2013 | 2012 | ||||||||||
| Fair value of plan assets at beginning of year |
9,455 | 9,194 | 8,496 | |||||||||
| Expected return on plan assets |
439 | 395 | 393 | |||||||||
| Actuarial gains/(losses) |
1,346 | 155 | 186 | |||||||||
| Contributions |
450 | 133 | 180 | |||||||||
| Benefits paid |
(263 | ) | (239 | ) | (258 | ) | ||||||
| Exchange differences and other changes |
681 | (183 | ) | 197 | ||||||||
|
|
|
|
|
|
|
|||||||
| Fair value of plan assets at end of year |
12,108 | 9,455 | 9,194 | |||||||||
|
|
|
|
|
|
|
|||||||
The Group expects to make contributions of approximately EUR 50 million to fund these obligations in 2015.
The main categories of plan assets as a percentage of total plan assets are as follows:
| 2014 | 2013 | 2012 | ||||||||||
| Equity instruments |
22 | % | 24 | % | 27 | % | ||||||
| Debt instruments |
56 | % | 59 | % | 56 | % | ||||||
| Properties |
12 | % | 11 | % | 3 | % | ||||||
| Other |
10 | % | 6 | % | 14 | % | ||||||
F-144
Table of Contents
The following table shows the estimated benefits payable at December 31, 2014 for the next ten years:
| Millions of euros |
||||
| 2015 |
289 | |||
| 2016 |
308 | |||
| 2017 |
329 | |||
| 2018 |
351 | |||
| 2019 |
375 | |||
| 2020 to 2024 |
2,297 | |||
| iii. | Other foreign subsidiaries |
Certain of the consolidated foreign entities have acquired commitments to their employees similar to post-employment benefits.
At December 31, 2014, 2013 and 2012, these entities had defined-contribution and defined-benefit post-employment benefit obligations. The expenses incurred in respect of contributions to defined contribution plans amounted to EUR 58 million in 2014 (2013: EUR 53 million; 2012: EUR 49 million).
The actuarial assumptions used by these entities (discount rates, mortality tables and cumulative annual CPI growth) are consistent with the economic and social conditions prevailing in the countries in which they are located.
Specifically, the discount rate used for the flows was determined by reference to high-quality corporate bonds, except in the case of Brazil where there is no extensive corporate bond market and, accordingly the discount rate was determined by reference to the series B bonds issued by the Brazilian National Treasury Secretariat for a term coinciding with that of the obligations.
Any changes in the main assumptions could affect the calculation of the obligations. At December 31, 2014, if the discount rate used had been decreased or increased by 50 basis points, there would have been an increase or decrease in the present value of the obligations of +/- 5%. These changes would be offset in part by increases or decreases in the fair value of the assets.
F-145
Table of Contents
The funding status of the obligations similar to post-employment benefits and other long-term benefits in 2014 and the four preceding years is as follows:
| Millions of euros | ||||||||||||||||||||
| 2014 | 2013 | 2012 | 2011 | 2010 | ||||||||||||||||
| Present value of the obligations |
10,324 | 9,289 | 12,814 | 11,245 | 11,062 | |||||||||||||||
| Less- |
||||||||||||||||||||
| Of which: with a charge to the participants |
151 | 133 | 125 | — | — | |||||||||||||||
|
|
|
|
|
|
|
|
|
|
|
|||||||||||
| Fair value of plan assets |
8,458 | 7,938 | 10,410 | 9,745 | 10,176 | |||||||||||||||
|
|
|
|
|
|
|
|
|
|
|
|||||||||||
| Provisions - Provisions for pensions |
1,715 | 1,218 | 2,279 | 1,500 | 886 | |||||||||||||||
|
|
|
|
|
|
|
|
|
|
|
|||||||||||
| Of which: |
||||||||||||||||||||
| Internal provisions for pensions |
1,999 | 1,512 | 2,626 | 1,827 | 1,340 | |||||||||||||||
| Net assets for pensions |
(8 | ) | (8 | ) | (5 | ) | (15 | ) | (8 | ) | ||||||||||
| Unrecognized net assets for pensions |
(276 | ) | (286 | ) | (342 | ) | (312 | ) | (446 | ) | ||||||||||
In December 2011 the Portuguese financial institutions, including Banco Santander Totta, S.A., transferred in part their pension obligations to the social security authorities. As a result, Banco Santander Totta, S.A. transferred the related assets and liabilities and Provisions - Provision for pensions and similar obligations at December 31, 2011 included the present value of the obligations, net of the fair value of the related plan assets.
The amounts recognized in the consolidated income statements in relation to these obligations are as follows:
| Millions of euros | ||||||||||||
| 2014 | 2013 | 2012 | ||||||||||
| Current service cost |
35 | 46 | 42 | |||||||||
| Interest cost (net) |
131 | 162 | 116 | |||||||||
| Extraordinary charges (credits): |
||||||||||||
| Actuarial (gains)/losses recognized in the year |
4 | (1 | ) | 7 | ||||||||
| Past service cost |
1 | 7 | 2 | |||||||||
| Pre-retirement cost |
— | — | (10 | ) | ||||||||
| Other |
(34 | ) | (2 | ) | (4 | ) | ||||||
|
|
|
|
|
|
|
|||||||
| 137 | 212 | 153 | ||||||||||
|
|
|
|
|
|
|
|||||||
In addition, in 2014 Valuation adjustments – Other valuation adjustments increased by EUR 515 million with respect to defined benefit obligations (2013: an increase of EUR 735 million; 2012: a decrease of EUR 968 million).
F-146
Table of Contents
The changes in the present value of the accrued obligations were as follows:
| Millions of euros | ||||||||||||
| 2014 | 2013 | 2012 | ||||||||||
| Present value of the obligations at beginning of year |
9,289 | 12,814 | 11,245 | |||||||||
| Net inclusion of entities in the Group |
25 | 4 | (70 | ) | ||||||||
| Current service cost |
35 | 46 | 42 | |||||||||
| Interest cost |
865 | 951 | 1,010 | |||||||||
| Pre-retirement cost |
20 | — | 13 | |||||||||
| Effect of curtailment/settlement |
(6 | ) | (1 | ) | (16 | ) | ||||||
| Benefits paid |
(669 | ) | (686 | ) | (735 | ) | ||||||
| Benefits paid due to settlements |
(6 | ) | (2 | ) | (41 | ) | ||||||
| Contributions made by employees |
7 | 21 | 10 | |||||||||
| Past service cost |
1 | 7 | — | |||||||||
| Actuarial (gains)/losses (*) |
646 | (2,039 | ) | 2,352 | ||||||||
| Exchange differences and other items |
117 | (1,826 | ) | (996 | ) | |||||||
|
|
|
|
|
|
|
|||||||
| Present value of the obligations at end of year |
10,324 | 9,289 | 12,814 | |||||||||
|
|
|
|
|
|
|
|||||||
| (*) | Including in 2014 demographic actuarial losses of EUR 242 million and financial actuarial losses of EUR 404 million. |
The changes in the fair value of the plan assets were as follows:
| Millions of euros | ||||||||||||
| 2014 | 2013 | 2012 | ||||||||||
| Fair value of plan assets at beginning of year |
7,938 | 10,410 | 9,745 | |||||||||
| Net inclusion of entities in the Group |
13 | — | 10 | |||||||||
| Expected return on plan assets |
759 | 789 | 894 | |||||||||
| Actuarial gains/(losses) |
124 | (1,314 | ) | 1,259 | ||||||||
| Gains/(losses) due to settlements |
(24 | ) | — | — | ||||||||
| Contributions |
205 | 239 | 165 | |||||||||
| Benefits paid |
(643 | ) | (641 | ) | (687 | ) | ||||||
| Exchange differences and other items |
86 | (1,545 | ) | (976 | ) | |||||||
|
|
|
|
|
|
|
|||||||
| Fair value of plan assets at end of year |
8,458 | 7,938 | 10,410 | |||||||||
|
|
|
|
|
|
|
|||||||
In 2015 the Group expects to make contributions to fund these obligations for amounts similar to those made in 2014.
The main categories of plan assets as a percentage of total plan assets are as follows:
| 2014 | 2013 | 2012 | ||||||||||
| Equity instruments |
8 | % | 10 | % | 6 | % | ||||||
| Debt instruments |
83 | % | 85 | % | 86 | % | ||||||
| Properties |
5 | % | 2 | % | 4 | % | ||||||
| Other |
4 | % | 3 | % | 4 | % | ||||||
F-147
Table of Contents
The following table shows the estimated benefits payable at December 31, 2014 for the next ten years:
| Millions of euros |
||||
| 2015 |
704 | |||
| 2016 |
734 | |||
| 2017 |
761 | |||
| 2018 |
789 | |||
| 2019 |
822 | |||
| 2020 to 2024 |
4,582 | |||
| d) | Provisions for taxes and other legal contingencies and Other provisions |
Provisions - Provisions for taxes and other legal contingencies and Provisions - Other provisions, which include, inter alia, provisions for restructuring costs and tax-related and non-tax-related proceedings, were estimated using prudent calculation procedures in keeping with the uncertainty inherent to the obligations covered. The definitive date of the outflow of resources embodying economic benefits for the Group depends on each obligation. In certain cases, these obligations have no fixed settlement period and, in other cases, depend on the legal proceedings in progress.
The detail, by geographical area, of Provisions for taxes and other legal contingencies and Other provisions is as follows:
| Millions of euros | ||||||||||||
| 2014 | 2013 | 2012 | ||||||||||
| Recognized by Spanish companies |
1,217 | 1,228 | 722 | |||||||||
| Recognized by other EU companies |
1,206 | 1,027 | 1,337 | |||||||||
| Recognized by other companies |
2,887 | 2,515 | 2,973 | |||||||||
| Of which: |
||||||||||||
| Brazil |
2,453 | 2,263 | 2,750 | |||||||||
|
|
|
|
|
|
|
|||||||
| 5,310 | 4,770 | 5,032 | ||||||||||
|
|
|
|
|
|
|
|||||||
F-148
Table of Contents
Set forth below is the detail, by type of provision, of the balance at December 31, 2014, 2013 and 2012 of Provisions for taxes and other legal contingencies and Other provisions. The types of provision were determined by grouping together items of a similar nature:
| Millions of euros | ||||||||||||
| 2014 | 2013 | 2012 | ||||||||||
| Provisions for taxes |
1,289 | 1,177 | 1,198 | |||||||||
| Provisions for employment-related proceedings (Brazil) |
616 | 638 | 975 | |||||||||
| Provisions for other legal proceedings |
1,011 | 912 | 927 | |||||||||
| Provision for customer remediation |
632 | 465 | 803 | |||||||||
| Regulatory framework-related provisions |
298 | 315 | 81 | |||||||||
| Provision for restructuring |
273 | 378 | 120 | |||||||||
| Other |
1,191 | 885 | 928 | |||||||||
|
|
|
|
|
|
|
|||||||
| 5,310 | 4,770 | 5,032 | ||||||||||
|
|
|
|
|
|
|
|||||||
Relevant information is set forth below in relation to each type of provision shown in the preceding table:
The provisions for taxes include provisions for tax-related proceedings.
The provisions for employment-related proceedings (Brazil) relate to claims filed by trade unions, associations, the prosecutor’s office and ex-employees claiming employment rights to which, in their view, they are entitled, particularly the payment of overtime and other employment rights, including litigation concerning retirement benefits. The number and nature of these proceedings, which are common for banks in Brazil, justify the classification of these provisions in a separate category or as a separate type from the rest. The Group calculates the provisions associated with these claims in accordance with past experience of payments made in relation to claims for similar items. When claims do not fall within these categories, a case-by-case assessment is performed and the amount of the provision is calculated in accordance with the status of each proceeding and the risk assessment carried out by the legal advisers. The average duration of the employment-related proceedings is eight years.
The provisions for other legal proceedings include provisions for court, arbitration or administrative proceedings (other than those included in other categories or types of provisions disclosed separately) brought against Santander Group companies.
The provisions for customer remediation include the estimated cost of payments to remedy errors relating to the sale of certain products in the UK and Germany. To calculate the provision for customer remediation, the best estimate of the provision made by management is used, which is based on the estimated number of claims to be received and, of these, the number that will be accepted, as well as the estimated average payment per case.
The regulatory framework-related provisions include mainly the provisions relating to the following issues concerning Santander UK:
| • | The provision for payments to the Financial Services Compensation Scheme (FSCS): the FSCS is the compensation fund for customers of financial services entities in the UK and is responsible for paying compensation if an entity cannot pay for rights claimed from it. The FSCS is financed through levies applied to the industry (and recoveries and loans, where appropriate). |
| • | The provision for the payment of the bank levy in the UK: the 2011 Finance Act introduced an annual bank levy in the UK which is collected using the quarterly system in force for corporation tax. This levy is based on the total liabilities presented in the balance sheet at year-end, although certain amounts are excluded. In 2014 a rate of 0.156% was applied, of 0.13% in 2013 and 0.088% in 2012. |
The provisions for restructuring include only the direct costs arising from restructuring processes carried out by various Group companies.
F-149
Table of Contents
Qualitative information on the main litigation is provided in Note 25.e to the consolidated financial statements.
Our general policy is to record provisions for tax and legal proceedings in which we assess the chances of loss to be probable and we do not record provisions when the chances of loss are possible or remote. We determine the amounts to be provided for as our best estimate of the expenditure required to settle the corresponding claim based, among other factors, on a case-by-case analysis of the facts and the legal opinion of internal and external counsel or by considering the historical average amount of the loss incurred in claims of the same nature. The definitive date of the outflow of resources embodying economic benefits for the Group depends on each obligation. In certain cases, the obligations do not have a fixed settlement term and, in others, they depend on legal proceedings in progress.
The changes in Provisions for taxes and other legal contingencies and Other provisions are set forth in Note 25.b. With respect to Brazil, the main charges to the consolidated income statement in 2014 related to EUR 316 million due to civil contingencies (2013: EUR 247 million) and EUR 358 million due to employment-related claims (2013: EUR 336 million; 2012: EUR 573 million); in addition, EUR 346 million were charged to the restructuring provision in 2013. This increase is offset in part by the use of the available provisions, of which EUR 343 million relate to employment-related payments (2013: EUR 500 million; 2012: EUR 730 million), EUR 278 million to civil payments (2013: EUR 215 million) and EUR 234 million to the use of the restructuring provision (2013: 62 million). In the UK, provisions of EUR 174 million were recognized in connection with customer remediation (2012: EUR 264 million), of EUR 205 million in connection with the regulatory framework (the bank levy and the Financial Services Compensation Scheme (FSCS)) (2013: provision of EUR 347 million; 2012: release of EUR 6 million), and of EUR 108 million for restructuring. These increases were offset by the use of EUR 321 million of provisions for customer remediation (2013: 319 million; 2012: EUR 392 million), EUR 197 million in payments relating to the bank levy and the FSCS (2013: EUR 317 million) and EUR 54 million for restructuring. In Spain provisions of EUR 152 million were recognized for restructuring in 2014, of which EUR 58 million were used; furthermore, EUR 32 million were paid in relation to the extraordinary contribution to the Deposit Guarantee Fund, recognized in 2013, amounting to EUR 228 million. In Germany provisions of EUR 455 million were recognized for customer remediation, of which EUR 197 million were used.
| e) | Litigation and other matters |
i. Tax-related litigation
As of the date of this report, the main tax-related proceedings concerning the Group were as follows:
| • | Legal actions filed by Banco Santander (Brasil) S.A. and certain Group companies in Brazil challenging the increase in the rate of Brazilian social contribution tax on net income from 9% to 15% stipulated by Interim Measure 413/2008, ratified by Law 11,727/2008, a provision having been recognised for the amount of the estimated loss. |
| • | Legal actions filed by certain Group companies in Brazil claiming their right to pay the Brazilian social contribution tax on net income at a rate of 8% and 10% from 1994 to 1998. No provision was recognised in connection with the amount considered to be a contingent liability. |
| • | Legal actions filed by Banco Santander Brasil, S.A. (currently Banco Santander (Brasil), S.A.) and other Group entities claiming their right to pay the Brazilian PIS and COFINS social contributions only on the income from the provision of services. In the case of Banco Santander Brasil, S.A., the legal action was declared unwarranted and an appeal was filed at the Federal Regional Court. In September 2007 the Federal Regional Court found in favour of Banco Santander Brasil, S.A., but the Brazilian authorities appealed against the judgment at the Federal Supreme Court. On April 23, 2015, the Federal Supreme Court published its decision holding that it will review the appeal related to PIS and declining to hear the appeal related to COFINS. The Federal Supreme Court’s decision on the PIS appeal is still pending judgment and its decline of the appeal related to COFINS is subject to further appeal. In the case of Banco ABN AMRO Real S.A. (currently Banco Santander (Brasil), S.A.), in March 2007 the court found in its favour, but the Brazilian authorities appealed against the judgment at the Federal Regional Court, which handed down a decision partly upholding the appeal in September 2009. Banco Santander (Brasil), S.A. filed an |
F-150
Table of Contents
| appeal at the Federal Supreme Court. Law 12,865/2013 established a programme of payments or deferrals of certain tax and social security debts, under which any entities that availed themselves of the programme and withdrew the legal actions brought by them were exempted from paying late-payment interest. In November 2013 Banco Santander (Brasil) S.A. partially availed itself of this programme but only with respect to the legal actions brought by the former Banco ABN AMRO Real S.A. in relation to the period from September 2006 to April 2009, and with respect to other minor actions brought by other entities in its Group. However, the legal actions brought by Banco Santander (Brasil), S.A. and those of Banco ABN AMRO Real S.A. relating to the periods prior to September 2006, for which the estimated loss was provided for, subsist and are pending judgment. |
| • | Banco Santander (Brasil), S.A. and other Group companies in Brazil have appealed against the assessments issued by the Brazilian tax authorities questioning the deduction of loan losses in their income tax returns (IRPJ and CSLL) on the ground that the relevant requirements under the applicable legislation were not met. No provision was recognised in connection with the amount considered to be a contingent liability. |
| • | Banco Santander (Brasil), S.A. and other Group companies in Brazil are involved in several administrative and legal proceedings against various municipalities that demand payment of the Service Tax on certain items of income from transactions not classified as provisions of services. No provision was recognised in connection with the amount considered to be a contingent liability. |
| • | In addition, Banco Santander (Brasil), S.A. and other Group companies in Brazil are involved in several administrative and legal proceedings against the tax authorities in connection with the taxation for social security purposes of certain items which are not considered to be employee remuneration. No provision was recognised in connection with the amount considered to be a contingent liability. |
| • | In December 2008 the Brazilian tax authorities issued an infringement notice against Banco Santander (Brasil), S.A. in relation to income tax (IRPJ and CSLL) for 2002 to 2004. The tax authorities took the view that Banco Santander (Brasil), S.A. did not meet the necessary legal requirements to be able to deduct the goodwill arising on the acquisition of Banespa (currently Banco Santander (Brasil), S.A.). Banco Santander (Brasil) S.A. filed an appeal against the infringement notice at Conselho Administrativo de Recursos Fiscais (CARF), which on October 21, 2011 unanimously decided to render the infringement notice null and void. The tax authorities have appealed against this decision at a higher administrative level (Tax Appeal High Chamber). In June 2010 the Brazilian tax authorities issued infringement notices in relation to this same matter for 2005 to 2007. Banco Santander (Brasil), S.A. filed an appeal against these procedures at CARF, which was partially upheld on October 8, 2013. This decision has been appealed at the higher instance of CARF. In December 2013 the Brazilian tax authorities issued the infringement notice relating to 2008, the last year for amortisation of the goodwill. This infringement notice was appealed by Banco Santander (Brasil), S.A. in the Federal Tax Office, and the Bank had a favorable decision, which has been appealed at CARF by the tax authorities Based on the advice of its external legal counsel and in view of the first decision by CARF, the Group considers that the stance taken by the Brazilian tax authorities is incorrect, that there are sound defence arguments to appeal against the infringement notices and that, accordingly, the risk of incurring a loss is remote. Consequently, no provisions have been recognised in connection with these proceedings because this matter should not affect the consolidated financial statements. |
| • | In May 2003 the Brazilian tax authorities issued separate infringement notices against Santander Distribuidora de Títulos e Valores Mobiliarios Ltda. (DTVM) and Banco Santander Brasil, S.A. (currently Banco Santander (Brasil), S.A.) in relation to the Provisional Tax on Financial Movements (CPMF) with respect to certain transactions carried out by DTVM in the management of its customers’ funds and for the clearing services provided by Banco Santander Brasil, S.A. to DTVM in 2000, 2001 and the first two months of 2002. Both entities appealed against the infringement notices at CARF, with DTVM obtaining a favourable decision and Banco Santander (Brasil) S.A. an unfavourable decision. Both decisions were appealed by the losing parties at the Higher Chamber of CARF, and the appeal relating to Banco Santander (Brasil) S.A. is pending a decision. With respect to DTVM, on August 24, 2012, it was notified of a decision overturning the previous favourable judgment and lodged an appeal at the Higher |
F-151
Table of Contents
| Chamber of CARF on August 29, 2012. In the opinion of its legal advisors, the Group considers that the tax treatment applied in these transactions was correct. No provision was recognised in the consolidated financial statements in relation to this litigation as it was considered a contingent liability. |
| • | In December 2010 the Brazilian tax authorities issued an infringement notice against Santander Seguros, S.A. (currently Zurich Santander Brasil Seguros e Previdencia S.A.), as the successor by merger to ABN AMRO Brazil Dois Participações, S.A., in relation to income tax (IRPJ and CSL) for 2005. The tax authorities questioned the tax treatment applied to a sale of shares of Real Seguros, S.A. made in that year. The bank lodged an appeal against this infringement notice which was upheld in part by CARF, the Federal Union having filed a special appeal. As the former parent of Santander Seguros, S.A. (Brasil), Banco Santander (Brasil) S.A. is liable in the event of any adverse outcome of this proceeding. No provision was recognised in connection with this proceeding as it was considered to be a contingent liability. |
| • | Also, in December 2010, the Brazilian tax authorities issued infringement notices against Banco Santander (Brasil), S.A. in connection with income tax (IRPJ and CSLL), questioning the tax treatment applied to the economic compensation received under the contractual guarantees provided by the sellers of the former Banco Meridional. The bank filed an appeal for reconsideration against this infringement notice. On November 23, 2011, CARF unanimously decided to render null and void an infringement notice relating to 2002 with regard to the same matter, and the decision was declared final in February 2012. The proceedings relating to the 2003 to 2006 fiscal years are still in progress although, based on the advice of its external legal counsel, the Group considers that the risk of incurring a loss is remote. |
| • | In June 2013, the Brazilian tax authorities issued an infringement notice against Banco Santander (Brasil), S.A. as the party liable for tax on the capital gain allegedly obtained in Brazil by the entity not resident in Brazil, Sterrebeeck B.V., as a result of the “incorporação de ações” (merger of shares) transaction carried out in August 2008. As a result of the aforementioned transaction, Banco Santander (Brasil), S.A. acquired all of the shares of Banco ABN AMRO Real, S.A. and ABN AMRO Brasil Dois Participações, S.A. through the delivery to these entities’ shareholders of newly issued shares of Banco Santander (Brasil), S.A., issued in a capital increase carried out for that purpose. The Brazilian tax authorities take the view that in the aforementioned transaction Sterrebeeck B.V. obtained income subject to tax in Brazil consisting of the difference between the issue value of the shares of Banco Santander (Brasil), S.A. that were received and the acquisition cost of the shares delivered in the exchange. In December 2014 the Group appealed against the infringement notice at CARF after the appeal for reconsideration lodged at the Federal Tax Office was dismissed. Based on the advice of its external legal counsel, the Group considers that the stance taken by the Brazilian tax authorities is incorrect and that there are sound defence arguments to appeal against the infringement notice. Accordingly, the risk of incurring a loss is remote. Consequently, the Group has not recognised any provisions in connection with these proceedings because this matter should not affect the consolidated financial statements. |
| • | In November 2014 the Brazilian tax authorities issued an infringement notice against Banco Santander (Brasil), S.A. in relation to income tax (IRPJ and CSLL) for 2009 questioning the tax-deductibility of the amortisation of the goodwill of Banco ABN AMRO Real S.A., performed prior to the absorption of this bank by Banco Santander (Brasil), S.A., but accepting the amortisation performed prior to the merger. On the advice of its external legal counsel, Banco Santander (Brasil), S.A. has lodged an appeal against this decision at the Federal Tax Office. No provision was recognised in connection with this proceeding as it was considered to be a contingent liability. Banco Santander (Brasil), S.A. has also appealed against infringement notices issued by the tax authorities questioning the tax deductibility of the amortisation of the goodwill arising on the acquisition of Banco Sudameris. No provision has been recognised in this connection as it is considered to be a contingent liability. |
| • | Legal action brought by Sovereign Bancorp, Inc. (currently Santander Holdings USA, Inc.) claiming its right to take a foreign tax credit in connection with taxes paid outside the United States in fiscal years 2003 to 2005 in relation to financing transactions carried out with an international bank. Santander |
F-152
Table of Contents
| Holdings USA Inc. considers that, in accordance with applicable tax legislation, it is entitled to recognise the aforementioned tax credits as well as the related issuance and financing costs. In addition, if the outcome of this legal action is favourable to the interests of Santander Holdings USA, Inc., the amounts paid over by the entity in relation to this matter with respect to 2006 and 2007 would have to be refunded. In 2013 the US courts found against two taxpayers in cases with a similar structure. In the case of Santander Holdings USA, Inc. the proceeding was scheduled for October 7, 2013, although it was adjourned indefinitely when the judge found in favour of Santander Holdings USA, Inc. with respect to one of the main grounds of the case. Santander Holdings USA, Inc. is expecting the judge to rule on whether his previous decision will result in the proceedings being stayed in the case or whether other matters need to be analysed before a final decision may be handed down. If the decision is favourable to Santander Holdings USA, Inc.’s interests, the US government has stated its intention to appeal against it. The estimated loss relating to this proceeding was provided for. |
| • | The Santander UK group has proactively engaged with HM Revenue & Customs to resolve a number of outstanding legacy tax matters. It has not however been possible to satisfactorily resolve all of these matters and as a result litigation proceedings have commenced in relation to a small number of remaining issues. All of these items relate to periods prior to Santander UK’s adoption of the Code of Practice on Taxation for Banks in 2010. A provision for the full amount of tax in dispute has been made through the tax charge in previous years . |
At the date of approval of these consolidated annual financial statements certain other less significant tax-related proceedings were also in progress.
ii. Other litigation
As of the date of this report, the main non-tax-related proceedings concerning the Group were as follows:
| • | Customer remediation: claims associated with the sale by Santander UK of certain financial products (principally payment protection insurance or PPI) to its customers. |
Payment protection insurance is a UK insurance product offering payment protection on unsecured personal loans (and credit cards). The product was sold by all UK banks. The mis-selling issues are predominantly related to business written before 2009. The nature and profitability of the product has changed materially since 2008.
On July 1, 2008, the UK Financial Ombudsman Service (‘FOS’) referred concerns regarding the handling of PPI complaints to the UK Financial Services Authority (‘FSA’). On September 29, 2009 and March 9, 2010, the FSA issued consultation papers on PPI complaints handling as an issue of wider implication. The FSA published its Policy Statement on August 10, 2010, setting out the evidence and guidance on the fair assessment of a complaint and the calculation of redress, as well as a requirement for firms to reassess historically rejected complaints which had to be implemented by December 1, 2010.
On October 8, 2010, the British Bankers’ Association (‘BBA’), the principal trade association for the UK banking and financial services sector, filed on behalf of certain financial institutions (which did not include Santander UK plc) an application for permission to seek judicial review against the FSA and the FOS. The BBA sought an order quashing the FSA Policy Statement and an order quashing the decision of the FOS to determine PPI sales in accordance with the guidance published on its website in November 2008. The judicial review was heard in the courts in January 2011 and on April 20, 2011 judgment was handed down by the High Court dismissing the proceeding brought by the BBA.
Santander UK did not participate in the legal action undertaken by other UK banks and had been consistently making provisions and settling claims with regards to PPI complaints liabilities.
F-153
Table of Contents
The following table shows information on the total claims received up to December 31, 2014 and the resolution thereof:
(number of claims, in thousands)
| 2014 | 2013 | 2012 | ||||||||||
| Claims outstanding at the beginning of the period |
14 | 31 | 1 | |||||||||
| Claims received (1) |
246 | 363 | 437 | |||||||||
| Claims rejected as being invalid(2) |
(194 | ) | (298 | ) | (258 | ) | ||||||
| Resolved claims |
(46 | ) | (82 | ) | (149 | ) | ||||||
|
|
|
|
|
|
|
|||||||
| Claims outstanding at the end of the period |
19 | 14 | 31 | |||||||||
|
|
|
|
|
|
|
|||||||
| (1) | Includes rejected claims relating to customers that had never purchased payment protection insurance from Santander UK. |
| (2) | Customers are entitled to appeal to the Financial Ombudsman Service (FOS) if their claims are rejected. The FOS may uphold or reject an appeal and if an appeal is upheld, Santander UK is required to compensate the customer. The table shows the result of appeals relating to paid or rejected claims. |
At December 31, 2014, the provision recognized in this connection totaled GBP 129 million.
In 2014, there was a slowdown in the fall in the number of claims compared to previous years but it is expected that claims will be continued to be received for a longer period than initially envisaged and, accordingly the provisions have been increased by GBP 95 million. The monthly cost of compensation fell to GBP 11 million compared to a monthly average of GBP 18 million in 2013 and of GBP 26 million in 2012. The percentage of unjustified claims continues to be high.
The provision recognized at the end of 2014 represents the best estimate by Group management, taking into account the opinion of its advisers and of the costs to be incurred in relation to any compensation that may result from the redress measures associated with the sales of payment protection insurance (PPI) in the UK. The provision was calculated on the basis of the following key assumptions resulting from judgments made by management:
| • | Volume of claims- estimated number of claims; |
| • | Percentage of claims lost- estimated percentage of claims that are or will be in the customers’ favor; and |
| • | Average cost - estimated payment to be made to customers, including compensation for direct loss plus interest. |
These assumptions were based on the following information:
| • | A complete analysis of the causes of the claim, the probability of success, as well as the possibility that this probability could change in the future; |
| • | Activity recorded with respect to the number of claims received; |
| • | Level of compensation paid to customers, together with a projection of the probability that this level could change in the future; |
F-154
Table of Contents
| • | Impact on the level of claims in the event of proactive initiatives carried out by the Group through direct contact with customers; and |
| • | Impact of the media coverage. |
These assumptions are reviewed, updated and validated on a regular basis using the latest available information, such as, the number of claims received, the percentage of claims lost, the potential impact of any change in that percentage, etc. and any new evaluation of the estimated population.
The most relevant factor for calculating the balance of the provision is the number of claims received as well as the expected level of future claims. The percentage of claims lost is calculated on the basis of the analysis of the sale process. The average cost of compensation is calculated in a reasonable manner as the Group manages a high volume of claims and the related population is homogenous. Group management reviews the provision required at each relevant date, taking into account the latest available information on the aforementioned assumptions as well as past experience.
| • | After the Madrid Provincial Appellate Court had rendered null and void the award handed down in the previous arbitration proceeding, on September 8, 2011, Banco Santander, S.A. filed a new request for arbitration with the Spanish Arbitration Court against Delforca 2008, Sociedad de Valores, S.A. (formerly Gaesco Bolsa Sociedad de Valores, S.A.), claiming EUR 66 million that the latter owes it as a result of the declaration on January 4, 2008 of the early termination by the Bank of all the financial transactions agreed upon between the parties. |
On August 3, 2012, Delforca 2008, S.A. was declared to be in a position of voluntary insolvency by Barcelona Commercial Court no. 10, which had agreed as part of the insolvency proceeding to stay the arbitration proceeding and the effects of the arbitration agreement entered into by Banco Santander, S.A. and Delforca 2008, S.A. The Bank appealed this decision, which appeal was dismissed and it then proceeded to prepare a challenge with a view to filing a future appeal. The Arbitration Court, in compliance with the decision of the Commercial Court, agreed on January 20, 2013 to stay the arbitration proceedings at the stage reached at that date until a decision could be reached in this respect in the insolvency proceeding.
In addition, as part of the insolvency proceeding of Delforca 2008, S.A., Banco Santander, S.A. notified its claim against the insolvent party with a view to having the claim recognized as a contingent ordinary claim without specified amount. However, the insolvency manager opted to exclude Banco Santander, S.A.’s claim from the provisional list of creditors and, accordingly, Banco Santander, S.A. filed an ancillary claim, which was dismissed by a Court decision on 17 February 2015. Banco Santander, S.A. has duly contested the decision with a view to lodging a future appeal.
As part of the same insolvency proceeding, Delforca 2008, S.A. has filed another ancillary petition requesting the termination of the arbitration agreement included in the framework financial transactions agreement entered into by that party and Banco Santander, S.A. in 1998, as well as the termination of the obligation that allegedly binds the insolvent party to the High Council of Chambers of Commerce (Spanish Arbitration Court). This petition has been upheld in full by the Court. Banco Santander, S.A. has contested the judgment with a view to lodging a future appeal.
On December 30, 2013, Banco Santander filed a petition requesting the termination of the insolvency proceeding of Delforca 2008, S.A. due to supervening disappearance of the alleged insolvency of the company. The petition was dismissed by the decision of 30 June 2014 against which the Bank proceeded to prepare a challenge with a view to filing a future appeal.
F-155
Table of Contents
In addition, in April 2009 Mobilaria Monesa, S.A. (parent of Delforca 2008, S.A.) filed a claim against Banco Santander, S.A. at Santander Court of First Instance no. 5, claiming damages which it says it incurred as a result of (in its opinion) the unwarranted claim filed by the Bank against its subsidiary, reproducing the same objections as Delforca 2008, S.A. This proceeding has currently been stayed on preliminary civil ruling grounds, against which Mobilaria Monesa, S.A. filed an appeal which was dismissed by the Cantabria Provincial Appellate Court in a judgment dated January 16, 2014.
Lastly, on April 11, 2012, Banco Santander, S.A. was notified of the claim filed by Delforca 2008, S.A., heard by Madrid Court of First Instance no. 21, in which it sought indemnification for the damage and losses it alleges it incurred due to (in its opinion) the unwarranted claim by the Bank. Delforca 2008, S.A. made the request in a counterclaim filed in the arbitration proceeding that concluded with the annulled award, putting the figure at up to EUR 218 million. The aforementioned court has dismissed the motion for declinatory exception proposed by Banco Santander, S.A. as the matter has been referred for arbitration. This decision was confirmed in an appeal at the Madrid Provincial Appellate Court in a judgment dated 27 May 2014. The Group considers that the risk of loss arising as a result of these matters is remote and, accordingly, it has not recognized any provisions in connection with these proceedings.
| • | Former employees of Banco do Estado de São Paulo S.A., Santander Banespa, Cia. de Arrendamiento Mercantil: a claim was filed in 1998 by the association of retired Banespa employees (AFABESP) on behalf of its members, requesting the payment of a half-yearly bonus initially envisaged in the entity’s Bylaws in the event that the entity obtained a profit and that the distribution of this profit were approved by the board of directors. The bonus was not paid in 1994 and 1995 since the bank did not make a profit and partial payments were made from 1996 to 2000, as agreed by the board of directors, and the relevant clause was eliminated in 2001. The Regional Employment Court ordered the bank to pay this half-yearly bonus in September 2005 and the bank filed an appeal against the decision at the High Employment Court (“TST”) and, subsequently, at the Federal Supreme Court (“STF”). The TST confirmed the judgment against the bank, whereas the STF rejected the extraordinary appeal filed by the bank in a decision adopted by only one of the Court members, thereby also upholding the order issued to the bank. This decision was appealed by the bank and the association. Only the appeal lodged by the bank has been given leave to proceed and will be decided upon by the STF in plenary session. |
| • | “Planos economicos”: Like the rest of the banking system, Santander Brazil has been the subject of claims from customers, mostly depositors, and of class actions brought for a common reason, arising from a series of legislative changes relating to the calculation of inflation (“planos economicos”). The claimants considered that their vested rights had been impaired due to the immediate application of these adjustments. In April 2010, the High Court of Justice (“STJ”) set the limitation period for these class actions at five years, as claimed by the banks, rather than twenty years, as sought by the claimants, which will probably significantly reduce the number of actions brought and the amounts claimed in this connection. As regards the substance of the matter, the decisions issued to date have been adverse for the banks, although two proceedings have been brought at the STJ and the Supreme Federal Court (“STF”) with which the matter is expected to be definitively settled. In August 2010, STJ handed down a decision finding for the plaintiffs in terms of substance, but excluding one of the “planos” from the claim, thereby reducing the amount thereof, and once again confirming the five-year statute of limitations period. Shortly thereafter, the STF issued an injunctive relief order whereby the proceedings in progress were stayed until this court issues a final decision on the matter. |
| • | Proceeding under Criminal Procedure Law (case no. 1043/2009) conducted at Madrid Court of First Instance no. 26, following a claim brought by Banco Occidental de Descuento, Banco Universal, C.A. against the Bank for USD 150 million in principal plus USD 4.7 million in interest, upon alleged termination of an escrow contract. |
F-156
Table of Contents
The court upheld the claim but did not make a specific pronouncement on costs. A judgment handed down by the Madrid Provincial Appellate Court on October 9, 2012 upheld the appeal lodged by the Bank and dismissed the appeal lodged by Banco Occidental de Descuento, Banco Universal, C.A., dismissing the claim. The dismissal of the claim was confirmed in an ancillary order to the judgment dated 28 December 2012. An appeal was filed at the Supreme Court by Banco Occidental de Descuento against the Madrid Provincial Appellate Court decision. The appeal was dismissed in a Supreme Court judgment dated 24 October 2014. Banco Occidental de Descuento has filed a motion for annulment against the aforementioned judgment which has not yet been granted leave to proceed. The Bank has challenged the appeal. The Bank has not recognized any provisions in this connection.
| • | On January 26, 2011, notice was served on the Bank of an ancillary insolvency claim to annul acts detrimental to the assets available to creditors as part of the voluntary insolvency proceedings of Mediterráneo Hispa Group, S.A. at Murcia Commercial Court no. 2. The aim of the principal action is to request annulment of the application of the proceeds obtained by the company undergoing insolvency from an asset sale and purchase transaction involving EUR 32 million in principal and EUR 2.7 million in interest. On 24 November 2011, the hearing was held with the examination of the proposed evidence. Upon completion of the hearing, it was resolved to conduct a final proceeding. The Court dismissed the claim in full in a judgment dated 13 November 2013. The judgment was confirmed at appeal by the Murcia Provincial Appellate Court in a judgment dated 10 July 2014. The insolvency managers have filed a cassation and extraordinary appeal against procedural infringements against the aforementioned judgment. |
| • | The bankruptcy of various Lehman Group companies was made public on September 15, 2008. Various customers of Santander Group were affected by this situation since they had invested in securities issued by Lehman or in other products which had such assets as their underlying. |
At the date of these consolidated financial statements, certain claims had been filed in relation to this matter. The Bank’s directors and its legal advisers consider that the various Lehman products were sold in accordance with the applicable legal regulations in force at the time of each sale or subscription and that the fact that the Group acted as intermediary would not give rise to any liability for it in relation to the insolvency of Lehman. Accordingly, the risk of loss is considered to be remote and, as a result, no provisions needed to be recognized in this connection.
| • | The intervention, on the grounds of alleged fraud, of Bernard L. Madoff Investment Securities LLC (“Madoff Securities”) by the US Securities and Exchange Commission (“SEC”) took place in December 2008. The exposure of customers of the Group through the Optimal Strategic US Equity (“Optimal Strategic”) subfund was EUR 2,330 million, of which EUR 2,010 million related to institutional investors and international private banking customers, and the remaining EUR 320 million made up the investment portfolios of the Group’s private banking customers in Spain, who were qualifying investors. |
At the date of these consolidated financial statements, certain claims had been filed in relation to this matter. The Group considers that it has at all times exercised due diligence and that these products have always been sold in a transparent way pursuant to applicable legislation and established procedures. Therefore, the risk of loss is considered to be remote or non-material.
| • | At the end of the first quarter of 2013, news stories were published stating that the public sector was debating the validity of the interest rate swaps arranged between various financial institutions and public sector companies in Portugal, particularly in the public transport industry. |
The swaps under debate included swaps arranged by Banco Santander Totta, S.A. with the public companies Metropolitano de Lisboa, E.P.E. (MdL), Metro de Porto, S.A. (MdP), Sociedade de Transportes Colectivos do Porto, S.A. (STCP) and Companhia Carris de Ferro de Lisboa, S.A. (Carris). These swaps were arranged prior to 2008, i.e. before the start of the financial crisis, and had been executed without incident.
F-157
Table of Contents
In view of this situation Banco Santander Totta, S.A. took the initiative to request a court judgment on the validity of the swaps in the jurisdiction of the United Kingdom to which the swaps are subject. The corresponding claims were filed in May 2013.
After the Bank had filed the claims, the four companies (MdL, MdP, STCP and Carris) notified Banco Santander Totta, S.A. that they were suspending payment of the amounts owed under the swaps until a final decision had been handed down in the UK jurisdiction in the proceedings. MdL, MdP and Carris suspended payment in September 2013 and STCP did the same in December 2013.
Consequently, Banco Santander Totta, S.A. extended each of the claims to include the unpaid amounts.
On 29 November 2013, the companies presented their defense in which they claimed that the swaps were null and void under Portuguese law and, accordingly, that they should be refunded the amounts paid. On 14 February 2014, Banco Santander Totta, S.A. answered the counterclaim, maintaining its arguments and rejecting the opposing arguments in its documents dated 29 November 2013.
On 4 April 2014, the companies issued their replies to the Bank’s documents. The preliminary hearing took place on 16 May 2014. The documentation analysis stage has been in progress since December 2014. These proceedings are still in progress.
Banco Santander Totta, S.A. and its legal advisers consider that the entity acted at all times in accordance with applicable legislation and under the terms of the swaps, and take the view that the UK courts will confirm the full validity and effectiveness of the swaps. As a result, the Group has not recognized any provisions in this connection.
| • | Most of the German banking industry has been affected by two German Supreme Court decisions in 2014 in relation to handling fees in consumer loan agreements. |
In May 2014 the German Supreme Court held handling fees in loan agreements to be null and void. The Court subsequently handed down a ruling at the end of October 2014 extending from three to ten years the statute-of-limitation period on claims relating to old transactions. Therefore, any claims relating to handling fees paid between 2004 and 2011 become statute-barred in 2014. This situation gave rise to numerous claims at the end of 2014 which have affected the income statements of banks in Germany.
Santander Consumer Bank AG stopped including these handling fees in agreements from 1 January 2013 and ceased charging these fees definitively at that date, i.e. before the Supreme Court handed down its judgment on the issue.
In 2014 Santander Consumer Bank AG recognized provisions totaling approximately EUR 455 million to cover the estimated cost of the claims relating to handling fees, considering both the claims already received and the estimated claims that may be received in 2015 relating to fees paid in 2012; no new claims are expected to be received for fees paid earlier than 2012 since they are statute-barred.
The Bank and the other Group companies are subject to claims and, therefore, are party to certain legal proceedings incidental to the normal course of their business (including those in connection with lending activities, relationships with employees and other commercial or tax matters).
In this context, it must be considered that the outcome of court proceedings is uncertain, particularly in the case of claims for indeterminate amounts, those based on legal issues for which there are no precedents, those that affect a large number of parties or those at a very preliminary stage.
F-158
Table of Contents
With the information available to it, the Group considers that at December 31, 2014, 2013 and 2012, it had reliably estimated the obligations associated with each proceeding and had recognized, where necessary, sufficient provisions to cover reasonably any liabilities that may arise as a result of these tax and legal situations. It also believes that any liability arising from such claims and proceedings will not have, overall, a material adverse effect on the Group’s business, financial position or results of operations.
| 26. | Other liabilities |
The detail of Other liabilities in the consolidated balance sheets is as follows:
| Millions of euros | ||||||||||||
| 2014 | 2013 | 2012 | ||||||||||
| Transactions in transit |
621 | 505 | 784 | |||||||||
| Accrued expenses and deferred income |
6,415 | 5,275 | 5,378 | |||||||||
| Other |
3,610 | 2,774 | 2,054 | |||||||||
|
|
|
|
|
|
|
|||||||
| 10,646 | 8,554 | 8,216 | ||||||||||
|
|
|
|
|
|
|
|||||||
| 27. | Tax matters |
| a) | Consolidated Tax Group |
Pursuant to current legislation, the Consolidated Tax Group includes Banco Santander, S.A. (as the Parent) and the Spanish subsidiaries that meet the requirements provided for in Spanish legislation regulating the taxation of the consolidated profits of corporate groups (as the controlled entities).
The other Group companies file income tax returns in accordance with the tax regulations applicable to them.
| b) | Years open for review by the tax authorities |
In 2014 the assessments arising from the outcome of the tax audit of the Consolidated Tax Group of the years 2005 to 2007 were signed partly on an uncontested basis and partly on a contested basis. Notification was received at the beginning of February 2015 of the final agreed payments arising from these assessments. Based on the advice of its external legal counsel, Banco Santander, S.A., as the Parent of the consolidated tax group, considers that there are sound defense arguments to appeal against the assessments and that there should be no impact on the consolidated financial statements. Accordingly, no provision has been recognized in this connection.
Also, in 2014 a review by the tax authorities was initiated at the Consolidated Tax Group in relation to 2009, 2010 and 2011, and the Consolidated Tax Group had the years to 2014 open for review in relation to the main taxes applicable to it.
The other entities have the corresponding years open for review, pursuant to their respective tax regulations.
Because of the possible different interpretations which can be made of the tax regulations, the outcome of the tax audits of the years reviewed and of the open years might give rise to contingent tax liabilities which cannot be objectively quantified. However, the Group’s tax advisers consider that it is unlikely that such tax liabilities will arise, and that in any event the tax charge arising therefrom would not materially affect the Group’s consolidated financial statements.
F-159
Table of Contents
| c) | Reconciliation |
The reconciliation of the income tax expense calculated at the tax rate applicable in Spain (30%) to the income tax expense recognized and the detail of the effective tax rate are as follows:
| Millions of euros | ||||||||||||
| 2014 | 2013 | 2012 | ||||||||||
| Consolidated profit (loss) before tax: |
||||||||||||
| From continuing operations |
10,679 | 7,378 | 3,565 | |||||||||
| From discontinued operations |
(26 | ) | (18 | ) | 99 | |||||||
|
|
|
|
|
|
|
|||||||
| 10,653 | 7,360 | 3,664 | ||||||||||
|
|
|
|
|
|
|
|||||||
| Income tax at tax rate applicable in Spain (30%) |
3,196 | 2,208 | 1,099 | |||||||||
| Effect of application of the various tax rates applicable in each country (*) |
187 | 100 | 170 | |||||||||
| Of which: |
||||||||||||
| Brazil |
185 | 304 | 318 | |||||||||
| United Kingdom |
(138 | ) | (87 | ) | (97 | ) | ||||||
| United States |
302 | 37 | 43 | |||||||||
| Chile |
(79 | ) | (105 | ) | (108 | ) | ||||||
| Effect of profit or loss of associates and jointly controlled entities |
(73 | ) | (153 | ) | (128 | ) | ||||||
| Effect of gains not subject to taxation (1) |
— | (61 | ) | (186 | ) | |||||||
| Effect of deduction of goodwill in Brazil |
(304 | ) | (274 | ) | (414 | ) | ||||||
| Effect of reassessment of deferred taxes |
279 | (21 | ) | (50 | ) | |||||||
| Tax effect on local books of transactions eliminated on consolidation |
(20 | ) | (42 | ) | (86 | ) | ||||||
| Permanent differences |
453 | 274 | 208 | |||||||||
|
|
|
|
|
|
|
|||||||
| Current income tax |
3,718 | 2,031 | 613 | |||||||||
|
|
|
|
|
|
|
|||||||
| Effective tax rate |
34.90 | % | 27.60 | % | 16.73 | % | ||||||
| Of which: |
||||||||||||
| Continuing operations |
3,718 | 2,034 | 584 | |||||||||
| Discontinued operations (Note 37) |
— | (3 | ) | 29 | ||||||||
| Of which: |
||||||||||||
| Current tax |
2,464 | 3,511 | 3,066 | |||||||||
| Deferred taxes |
1,254 | (1,480 | ) | (2,453 | ) | |||||||
| Taxes paid in the year |
1,352 | 3,577 | 3,162 | |||||||||
| (*) | Calculated by applying the difference between the tax rate applicable in Spain and the tax rate applicable in each jurisdiction to the profit or loss contributed to the Group by the entities which operate in each jurisdiction. |
| (1) | Tax effect of the sale of Banco Santander Colombia, S.A. in 2012. |
F-160
Table of Contents
| d) | Tax recognized in equity |
In addition to the income tax recognized in the consolidated income statement, the Group recognized the following amounts in consolidated equity in 2014, 2013 and 2012:
| Millions of euros | ||||||||||||
| 2014 | 2013 | 2012 | ||||||||||
| Net tax credited (charged) to equity: |
||||||||||||
| Measurement of available-for-sale fixed-income securities |
(633 | ) | 162 | (283 | ) | |||||||
| Measurement of available-for-sale equity securities |
(50 | ) | (51 | ) | (64 | ) | ||||||
| Measurement of cash flow hedges |
(150 | ) | (38 | ) | 23 | |||||||
| Actuarial (gains) losses |
319 | (331 | ) | 538 | ||||||||
| Measurement of entities accounted for using the equity method |
(33 | ) | 39 | (15 | ) | |||||||
|
|
|
|
|
|
|
|||||||
| (547 | ) | (219 | ) | 199 | ||||||||
|
|
|
|
|
|
|
|||||||
| e) | Deferred taxes |
Tax assets in the consolidated balance sheets includes debit balances with the Spanish Public Treasury relating to deferred tax assets. Tax liabilities includes the liability for the Group’s various deferred tax liabilities.
On June 26, 2013, the Basel III legal framework was included in European law through Directive 2013/36 (CRD IV) and Regulation 575/2013 on prudential requirements for credit institutions and investment firms (CRR), directly applicable in every Member State as from January 1, 2014, albeit with a gradual timetable with respect to the application of, and compliance with, various requirements.
This legislation establishes that deferred tax assets, the use of which relies on future profits being obtained, must be deducted from regulatory capital.
In this regard, pursuant to Basel III, in recent years several countries have amended their tax regimes with respect to certain deferred tax assets so that they may continue to be considered regulatory capital since their use does not rely on the future profits of the entities that generate them (referred to hereinafter as “monetisable tax assets”).
Italy had a very similar regime to that described above, which was introduced by Decree-Law no. 225, of December 29, 2010, and amended by Law no. 10, of February 26, 2011.
In addition, in 2013 in Brazil, by means of Provisional Measure no. 608, of February 28, 2013 and, in Spain, through Royal Decree-Law 14/2013, of November 29, confirmed by Law 27/2014, of November 27, tax regimes were established whereby certain deferred tax assets (arising from credit loss provisions in Brazil and credit loss provisions, provisions for foreclosed assets and pension and pre-retirement obligations in Spain), may be converted into tax receivables in specific circumstances. As a result, their use does not rely on the entities obtaining future profits and, accordingly, they are exempt from deduction from regulatory capital.
F-161
Table of Contents
The detail of deferred tax assets, by classification as monetisable or non-monetisable assets, and of deferred tax liabilities at December 31, 2014 is as follows:
| Millions of euros | ||||||||||||||||||||
| 2014 | 2013 | 2012 | ||||||||||||||||||
| Monetisable (*) | Other | Monetisable (*) | Other | |||||||||||||||||
| Tax assets: |
8,444 | 13,720 | 7,902 | 13,291 | 20,987 | |||||||||||||||
| Tax losses and tax credits |
— | 5,650 | — | 5,671 | 7,719 | |||||||||||||||
| Temporary differences |
8,444 | 8,070 | 7,902 | 7,620 | 13,268 | |||||||||||||||
| Of which: |
||||||||||||||||||||
| Non-deductible provisions |
— | 2,709 | — | 2,365 | 2,353 | |||||||||||||||
| Valuation of financial instruments |
— | 775 | — | 1,213 | 1,700 | |||||||||||||||
| Credit losses |
4,429 | 1,013 | 3,989 | 920 | 3,341 | |||||||||||||||
| Pensions |
3,408 | 759 | 3,286 | 553 | 2,897 | |||||||||||||||
| Valuation of tangible and intangible assets |
607 | 474 | 627 | 522 | 731 | |||||||||||||||
| Tax liabilities: |
— | 4,527 | — | 1,825 | 2,603 | |||||||||||||||
| Temporary differences |
— | 4,527 | — | 1,825 | 2,603 | |||||||||||||||
| Of which: |
||||||||||||||||||||
| Valuation of financial instruments |
— | 1,093 | — | 729 | 1,314 | |||||||||||||||
| Valuation of tangible and intangible assets |
— | 1,323 | — | 461 | 760 | |||||||||||||||
| Investments in Group companies (Note 3) |
— | 1,096 | — | — | — | |||||||||||||||
| (*) | Not deducted from regulatory capital. |
The Group only recognizes deferred tax assets for temporary differences or tax loss and tax credit carryforwards where it is considered probable that the consolidated entities that generated them will have sufficient future taxable profits against which they can be utilized.
The deferred tax assets and liabilities are reassessed at the reporting date in order to ascertain whether any adjustments need to be made on the basis of the findings of the analyses performed.
These analyses take into account, inter alia: (i) the profit before tax generated by the various entities in prior years, (ii) each entity or tax group’s projected profits before tax, (iii) the estimated reversal of the existing temporary differences, based on their nature, and (iv) the period and limits established by the legislation of each country for the recovery of the various deferred tax assets, thereby concluding on each entity or tax group’s ability to recover its recognized deferred tax assets.
The projected earnings used in these analyses are based on the financial budgets approved by the Group’s directors for the various entities, which generally cover a period of three years (see further details in Note 17), applying constant growth rates not exceeding the average long-term growth rate for the market in which the consolidated entities operate, in order to estimate the earnings for subsequent years considered in the analyses.
F-162
Table of Contents
Relevant information is set forth below for the main countries which have recognized deferred tax assets:
Spain
The deferred tax assets recognized in Spain total EUR 11,638 million, of which EUR 5,734 million were for monetisable temporary differences, EUR 2,029 million for other temporary differences and EUR 3,875 million for tax losses and credits.
The Group estimates that the recognized deferred tax assets for temporary differences will be recovered in 15 years. This period would also apply to the recovery of the recognized tax loss and tax credit carryforwards.
Brazil
The deferred tax assets recognized in Brazil total EUR 5,886 million, of which EUR 2,509 million were for monetisable temporary differences, EUR 2,865 million for other temporary differences and EUR 512 million for tax losses and credits.
The Group estimates that the recognized deferred tax assets for temporary differences will be recovered within five years. The recognized tax loss and tax credit carryforwards will be recovered within ten years.
United States
The deferred tax assets recognized in the United States total EUR 1,525 million, of which EUR 620 million were for temporary differences and EUR 905 million for tax losses and credits.
The Group estimates that the recognized deferred tax assets for temporary differences will be recovered by 2024. The recognized tax loss and tax credit carryforwards will be recovered by 2028.
Mexico
The deferred tax assets recognized in Mexico total EUR 836 million, of which EUR 828 million were for temporary differences and EUR 8 million for tax losses and credits.
The Group estimates that substantially all the recognized deferred tax assets for temporary differences will be recovered in three years. It is estimated that the recognized tax loss and tax credit carryforwards will be recovered in full within five years.
The changes in Tax assets - Deferred and Tax liabilities - Deferred in the last three years were as follows:
| Millions of euros | ||||||||||||||||||||||||
| Balances at December 31, 2013 |
(Charge)/Credit to income |
Foreign currency balance translation differences and other items |
(Charge)/Credit to asset and liability valuation adjustments (equity) |
Acquisitions for the year (net) |
Balances as at December 31, 2014 |
|||||||||||||||||||
| Deferred tax assets |
21,193 | 36 | 194 | 21 | 720 | 22,164 | ||||||||||||||||||
| Deferred tax liabilities |
(1,825 | ) | (1,290 | ) | (328 | ) | (527 | ) | (557 | ) | (4,527 | ) | ||||||||||||
|
|
|
|
|
|
|
|
|
|
|
|
|
|||||||||||||
| 19,368 | (1,254 | ) | (134 | ) | (506 | ) | 163 | 17,637 | ||||||||||||||||
|
|
|
|
|
|
|
|
|
|
|
|
|
|||||||||||||
F-163
Table of Contents
| Millions of euros | ||||||||||||||||||||||||
| Balances at December 31, 2012 |
(Charge)/Credit to income |
Foreign currency balance translation differences and other items |
(Charge)/Credit to asset and liability valuation adjustments (equity) |
Acquisitions for the year (net) |
Balances at December 31, 2013 |
|||||||||||||||||||
| Deferred tax assets |
20,987 | 1,315 | (493 | ) | (616 | ) | — | 21,193 | ||||||||||||||||
| Deferred tax liabilities |
(2,603 | ) | 165 | 259 | 361 | (7 | ) | (1,825 | ) | |||||||||||||||
|
|
|
|
|
|
|
|
|
|
|
|
|
|||||||||||||
| 18,384 | 1,480 | (234 | ) | (255 | ) | (7 | ) | 19,368 | ||||||||||||||||
|
|
|
|
|
|
|
|
|
|
|
|
|
|||||||||||||
| Millions of euros | ||||||||||||||||||||||||
| Balances as at December 31, 2011 |
(Charge)/Credit to income |
Foreign currency balance translation differences and other items |
(Charge)/Credit to asset and liability valuation adjustments (equity) |
Acquisitions for the year (net) |
Balances at December 31, 2012 |
|||||||||||||||||||
| Deferred tax assets |
18,494 | 2,217 | (28 | ) | 326 | (22 | ) | 20,987 | ||||||||||||||||
| Deferred tax liabilities |
(2,865 | ) | 236 | 197 | (201 | ) | 30 | (2,603 | ) | |||||||||||||||
|
|
|
|
|
|
|
|
|
|
|
|
|
|||||||||||||
| 15,629 | 2,453 | 169 | 125 | 8 | 18,384 | |||||||||||||||||||
|
|
|
|
|
|
|
|
|
|
|
|
|
|||||||||||||
| f) | Tax reforms |
In 2014 two significant income tax reforms were approved in Spain and Chile.
In Spain the most important change for the Group was the elimination of the time limit for the utilization of tax losses against taxable profits of subsequent years and of double taxation tax credit carryforwards.
Of particular note in relation to the tax reform in Chile is the increase in the “first category” tax rate from 20% in 2013 to 21% in 2014, 22.5% in 2015, 24% in 2016, 25.5% in 2017 and 27% from 2018.
The impact of these two reforms on the Group’s consolidated financial statements was not material.
| g) | Other information |
In compliance with the disclosure requirement established in the Listing Rules Instrument 2005 published by the UK Financial Conduct Authority, it is hereby stated that shareholders of the Bank resident in the United Kingdom will be entitled to a tax credit in respect of the withholdings the Bank is required to make from the dividends to be paid to them. The shareholders of the Bank resident in the United Kingdom who hold their ownership interest in the Bank through Santander Nominee Service will be informed directly of the amount thus withheld and of any other data they may require to complete their tax returns in the United Kingdom. The other shareholders of the Bank resident in the United Kingdom should contact their bank or securities broker.
F-164
Table of Contents
| 28. | Non-controlling interests |
Non-controlling interests include the net amount of the equity of subsidiaries attributable to equity instruments that do not belong, directly or indirectly, to the Bank, including the portion attributed to them of profit for the year.
| a) | Breakdown |
The detail, by Group company, of Equity—Non-controlling interests is as follows:
| Millions of euros | ||||||||||||
| 2014 | 2013 | 2012 | ||||||||||
| Banco Santander (Brasil), S.A. |
1,662 | 4,292 | 4,920 | |||||||||
| Bank Zachodni WBK, S.A. |
1,545 | 1,372 | 168 | |||||||||
| Grupo Financiero Santander México, S.A.B. de C.V. |
1,192 | 978 | 1,296 | |||||||||
| Banco Santander - Chile |
1,049 | 950 | 1,027 | |||||||||
| Santander Consumer USA Holdings Inc. |
1,013 | — | — | |||||||||
| Metrovacesa, S.A. |
598 | — | — | |||||||||
| Banesto |
— | — | 627 | |||||||||
| Other companies |
731 | 568 | 609 | |||||||||
|
|
|
|
|
|
|
|||||||
| 7,790 | 8,160 | 8,647 | ||||||||||
|
|
|
|
|
|
|
|||||||
| Profit/(Loss) for the year attributable to non-controlling interests |
1,119 | 1,154 | 768 | |||||||||
| Of which: |
||||||||||||
| Banco Santander (Brasil), S.A. |
315 | 494 | 585 | |||||||||
| Santander Consumer USA Holdings Inc. |
219 | — | — | |||||||||
| Banco Santander - Chile |
210 | 221 | 208 | |||||||||
| Grupo Financiero Santander México, S.A.B. de C.V. |
193 | 251 | 59 | |||||||||
| Bank Zachodni WBK, S.A. |
121 | 123 | 13 | |||||||||
| Banesto |
— | — | (138 | ) | ||||||||
| Other companies |
61 | 65 | 41 | |||||||||
|
|
|
|
|
|
|
|||||||
| 8,909 | 9,314 | 9,415 | ||||||||||
|
|
|
|
|
|
|
|||||||
| b) | Changes |
The changes in Non-controlling interests are summarized as follows:
| Millions of euros | ||||||||||||
| 2014 | 2013 | 2012 | ||||||||||
| Balance at beginning of year |
9,314 | 9,415 | 6,354 | |||||||||
| Banesto Group merger (Note 3) |
— | (455 | ) | — | ||||||||
| Changes in the scope of consolidation (Note 3) |
1,465 | 199 | 27 | |||||||||
| Change in proportion of ownership interest |
(2,971 | ) | 925 | 3,337 | ||||||||
| Dividends paid to non-controlling interests |
(380 | ) | (747 | ) | (409 | ) | ||||||
| Changes in capital and other items |
(524 | ) | 57 | (10 | ) | |||||||
| Profit for the year attributable to non-controlling interests |
1,119 | 1,154 | 768 | |||||||||
| Valuation adjustments (including exchange differences) |
886 | (1,234 | ) | (652 | ) | |||||||
|
|
|
|
|
|
|
|||||||
| Balance at end of year |
8,909 | 9,314 | 9,415 | |||||||||
|
|
|
|
|
|
|
|||||||
F-165
Table of Contents
As indicated in Note 3, in 2012 the Group sold 24.9% of its ownership interest in Grupo Financiero Santander México, S.A.B. de C.V., thus giving rise to an increase of EUR 1,092 million in Reserves, EUR 1,493 million in Non-controlling interests and EUR 263 million in Valuation adjustments - Exchange differences.
In January and March 2012 the Group transferred shares representing for 4.41% and 0.77% of Banco Santander (Brasil), S.A. to two leading international financial institutions, generating an increase in the balance of Non-controlling interests of EUR 1,532 million (see Note 34).
Lastly, in 2013 the Group reduced its ownership interest in Bank Zachodni WBK, S.A. to 70%, thereby generating an increase in the balance of Non-controlling interests of EUR 1,329 million (see Note 3).
Lastly, in 2014 the Group increased its ownership interest in Banco Santander (Brasil), S.A., thereby generating a decrease in the balance of Non-controlling interests of EUR 2,572 million (see Note 3).
The foregoing changes are shown in the consolidated statement of changes in total equity.
| c) | Other information |
The financial information on the subsidiaries with significant non-controlling interests at December 31, 2014 is summarized below:
| Millions of euros (*) | ||||||||||||||||||||
| Banco Santander (Brazil) |
Banco Santander - Chile |
Grupo Financiero Santander (Mexico) |
Bank Zachodni WBK |
Santander Consumer USA Holdings Inc. |
||||||||||||||||
| Total assets |
156,287 | 42,763 | 53,726 | 27,794 | 27,357 | |||||||||||||||
| Total liabilities |
143,320 | 40,300 | 50,137 | 25,925 | 25,814 | |||||||||||||||
|
|
|
|
|
|
|
|
|
|
|
|||||||||||
| Net assets |
12,967 | 2,463 | 3,589 | 1,869 | 1,543 | |||||||||||||||
|
|
|
|
|
|
|
|
|
|
|
|||||||||||
| Total gross income |
12,008 | 2,197 | 3,072 | 1,376 | 3,568 | |||||||||||||||
|
|
|
|
|
|
|
|
|
|
|
|||||||||||
| Total profit |
1,926 | 739 | 851 | 485 | 582 | |||||||||||||||
|
|
|
|
|
|
|
|
|
|
|
|||||||||||
| (*) | Information prepared in accordance with the segment reporting criteria described in Note 52 and, therefore, it does not coincide with the information published separately by each entity. |
F-166
Table of Contents
| 29. | Valuation adjustments |
The balances of Valuation adjustments include the amounts, net of the related tax effect, of the adjustments to assets and liabilities recognized temporarily in equity through the consolidated statement of recognized income and expense. The amounts arising from subsidiaries are presented, on a line by line basis, in the appropriate items according to their nature.
It should be noted that the consolidated statement of recognized income and expense presents items separately according to their nature, grouping together those which, pursuant to the applicable accounting standards, will not be subsequently reclassified to profit or loss when the requirements established by the related accounting standards are met. Also, with respect to items that may be reclassified to profit or loss, the consolidated statement of recognized income and expense includes changes in Valuation adjustments as follows:
| • | Revaluation gains (losses): includes the amount of the income, net of the expenses incurred in the year, recognized directly in equity. The amounts recognized in equity in the year remain under this item, even if in the same year they are transferred to the income statement or to the initial carrying amount of the assets or liabilities or are reclassified to another line item. |
| • | Amounts transferred to income statement: includes the amount of the revaluation gains and losses previously recognized in equity, even in the same year, which are recognized in the income statement. |
| • | Amounts transferred to initial carrying amount of hedged items: includes the amount of the revaluation gains and losses previously recognized in equity, even in the same year, which are recognized in the initial carrying amount of assets or liabilities as a result of cash flow hedges. |
| • | Other reclassifications: includes the amount of the transfers made in the year between the various valuation adjustment items. |
The amounts of these items are recognized gross, including the amount of the valuation adjustments relating to non-controlling interests, and the corresponding tax effect is presented under a separate item, except in the case of entities accounted for using the equity method, the amounts for which are presented net of the tax effect.
| a) | Available-for-sale financial assets |
Valuation adjustments - Available-for-sale financial assets includes the net amount of unrealized changes in the fair value of assets classified as available-for-sale financial assets (see Notes 7 and 8).
F-167
Table of Contents
The breakdown, by type of instrument and geographical origin of the issuer, of Valuation adjustments—Available-for-sale financial assets at December 31, 2014, 2013 and 2012 is as follows:
| Millions of euros | ||||||||||||||||||||||||||||||||||||||||||||||||
| December 31, 2014 | December 31, 2013 | December 31, 2012 | ||||||||||||||||||||||||||||||||||||||||||||||
| Revaluation gains |
Revaluation losses |
Net revaluation gains/ (losses) |
Fair value |
Revaluation gains |
Revaluation losses |
Net revaluation gains/ (losses) |
Fair value |
Revaluation gains |
Revaluation losses |
Net revaluation gains/ (losses) |
Fair value |
|||||||||||||||||||||||||||||||||||||
| Debt instruments |
||||||||||||||||||||||||||||||||||||||||||||||||
| Government debt securities and debt instruments issued by central banks |
||||||||||||||||||||||||||||||||||||||||||||||||
| Spain |
835 | (176 | ) | 659 | 31,190 | 356 | (496 | ) | (140 | ) | 25,664 | 68 | (1,286 | ) | (1,218 | ) | 29,288 | |||||||||||||||||||||||||||||||
| Rest of Europe |
325 | (56 | ) | 269 | 20,597 | 28 | (143 | ) | (115 | ) | 12,080 | 112 | (178 | ) | (66 | ) | 10,891 | |||||||||||||||||||||||||||||||
| Latin America and rest of the world |
89 | (97 | ) | (8 | ) | 30,230 | 38 | (217 | ) | (179 | ) | 17,134 | 627 | (38 | ) | 589 | 23,759 | |||||||||||||||||||||||||||||||
| Private-sector debt securities |
243 | (193 | ) | 50 | 28,232 | 258 | (280 | ) | (22 | ) | 24,966 | 215 | (184 | ) | 31 | 23,786 | ||||||||||||||||||||||||||||||||
|
|
|
|
|
|
|
|
|
|
|
|
|
|
|
|
|
|
|
|
|
|
|
|
|
|||||||||||||||||||||||||
| 1,492 | (522 | ) | 970 | 110,249 | 680 | (1,136 | ) | (456 | ) | 79,844 | 1,022 | (1,686 | ) | (664 | ) | 87,724 | ||||||||||||||||||||||||||||||||
| Equity instruments |
||||||||||||||||||||||||||||||||||||||||||||||||
| Domestic |
||||||||||||||||||||||||||||||||||||||||||||||||
| Spain |
35 | (8 | ) | 27 | 1,447 | 132 | (10 | ) | 122 | 1,432 | 201 | (34 | ) | 167 | 1,233 | |||||||||||||||||||||||||||||||||
| International |
||||||||||||||||||||||||||||||||||||||||||||||||
| Rest of Europe |
282 | (23 | ) | 259 | 1,245 | 158 | (25 | ) | 133 | 974 | 75 | (46 | ) | 29 | 1,135 | |||||||||||||||||||||||||||||||||
| United States |
25 | — | 25 | 762 | 20 | (1 | ) | 19 | 661 | 15 | (5 | ) | 10 | 1,022 | ||||||||||||||||||||||||||||||||||
| Latin America and rest of the world |
298 | (19 | ) | 279 | 1,547 | 235 | (18 | ) | 217 | 888 | 265 | (56 | ) | 209 | 1,152 | |||||||||||||||||||||||||||||||||
|
|
|
|
|
|
|
|
|
|
|
|
|
|
|
|
|
|
|
|
|
|
|
|
|
|||||||||||||||||||||||||
| 640 | (50 | ) | 590 | 5,001 | 545 | (54 | ) | 491 | 3,955 | 556 | (141 | ) | 415 | 4,542 | ||||||||||||||||||||||||||||||||||
| Of which: |
||||||||||||||||||||||||||||||||||||||||||||||||
| Listed |
311 | (26 | ) | 285 | 1,787 | 313 | (26 | ) | 287 | 1,330 | 311 | (68 | ) | 243 | 1,849 | |||||||||||||||||||||||||||||||||
| Unlisted |
329 | (24 | ) | 305 | 3,214 | 232 | (28 | ) | 204 | 2,625 | 245 | (73 | ) | 172 | 2,693 | |||||||||||||||||||||||||||||||||
|
|
|
|
|
|
|
|
|
|
|
|
|
|
|
|
|
|
|
|
|
|
|
|
|
|||||||||||||||||||||||||
| 2,132 | (572 | ) | 1,560 | 115,250 | 1,225 | (1,190 | ) | 35 | 83,799 | 1,578 | (1,827 | ) | (249 | ) | 92,266 | |||||||||||||||||||||||||||||||||
|
|
|
|
|
|
|
|
|
|
|
|
|
|
|
|
|
|
|
|
|
|
|
|
|
|||||||||||||||||||||||||
F-168
Table of Contents
At each reporting date the Group assesses whether there is any objective evidence that the instruments classified as available-for-sale (debt securities and equity instruments) are impaired.
This assessment includes but is not limited to an analysis of the following information: i) the issuer’s economic and financial position, the existence of default or late payment, analysis of the issuer’s solvency, the evolution of its business, short-term projections, trends observed with respect to its earnings and, if applicable, its dividend distribution policy; ii) market-related information such as changes in the general economic situation, changes in the issuer’s sector which might affect its ability to pay; iii) changes in the fair value of the security analyzed, analysis of the origins of such changes - whether they are intrinsic or the result of the general uncertainty concerning the economy or the country - and iv) independent analysts’ reports and forecasts and other independent market information.
In the case of quoted equity instruments, when the changes in the fair value of the instrument under analysis are assessed, the duration and significance of the decline in its market price below cost for the Group is taken into account. As a general rule, for these purposes the Group considers a significant decline to be a 40% drop in the fair value of the instrument or a continued decline over a period of 18 months. Nevertheless, it should be noted that the Group assesses, on a case-by-case basis each of the instruments that have suffered losses, and monitors the performance of their prices, recognizing an impairment loss as soon as it is considered that the recoverable amount could be affected, even though the fair value may not have declined by the percentage or for the duration mentioned above.
If, after the above assessment has been carried out, the Group considers that the presence of one or more of these factors could affect recovery of the cost of the asset, an impairment loss is recognized in the income statement for the amount of the loss in equity under Valuation adjustments. Also, where the Group does not intend and/or is not able to hold the investment for a sufficient amount of time to recover the cost, the instrument is written down to its fair value.
At the end of 2014 the Group performed the assessment described above and recognized in the consolidated income statement impairment losses of EUR 42 million in respect of debt instruments (2013: EUR 89 million; 2012: EUR 18 million) and of EUR 147 million in respect of equity instruments which had suffered a significant and prolonged decline in price at December 31, 2014 (2013: EUR 169 million; 2012: EUR 344 million).
At the end of 2014, 45.62% of the losses recognized under Valuation adjustments - Available-for-sale financial assets arising from debt securities had been incurred in more than twelve months. Most of the losses on government debt securities recognized in the Group’s equity (approximately 53.63% of the total) related to the decline in value of Spanish and Portuguese government debt securities. This decline in value was not prompted by interest rate changes but rather by an increase, which occurred after the instruments were acquired, in the credit risk spreads (credit spreads that improved in 2014); there had not been any default on payments of interest nor was there any evidence that the issuers would fail to continue to meet their payment obligations in the future, with respect both to principal and interest, and thus prevent recovery of the carrying amount of such securities.
At the end of 2014, 49.72% of the losses recognized under Valuation adjustments - Available-for-sale financial assets arising from equity instruments had been incurred in more than twelve months. After carrying out the aforementioned assessment, the Group concluded that, given its ability and intention to hold the securities in the long term, it did not expect the factors giving rise to the decline in value described above to have an impact on future cash flows and, therefore, no impairment loss was required to be recognized at year-end.
F-169
Table of Contents
| b) | Cash flow hedges |
Valuation adjustments - Cash flow hedges includes the gains or losses attributable to hedging instruments that qualify as effective hedges. These amounts will remain under this heading until they are recognized in the consolidated income statement in the periods in which the hedged items affect it (see Note 11).
Accordingly, amounts representing valuation losses will be offset in the future by gains generated by the hedged instruments.
| c) | Hedges of net investments in foreign operations and Exchange differences |
Valuation adjustments - Hedges of net investments in foreign operations includes the net amount of changes in the value of hedging instruments in hedges of net investments in foreign operations, for the portion of these changes considered as effective hedges (see Note 11).
Valuation adjustments - Exchange differences includes the net amount of exchange differences arising on non-monetary items whose fair value is adjusted against equity and the differences arising on the translation to euros of the balances of the consolidated entities whose functional currency is not the euro (see Note 2.a).
The changes in 2014 reflect the positive effect of the appreciation of the US dollar and of the pound sterling, whereas the changes in 2013 reflected the depreciation of the Brazilian real.
Of the change in the balance in these years, a gain of EUR 1,093 million in 2014, and a loss of EUR 1,665 million in 2013 and EUR 388 million in 2012 related to the measurement of goodwill.
The detail, by country, of Valuation adjustments - Hedges of net investments in foreign operations and Valuation adjustments - Exchange differences is as follows:
| Millions of euros | ||||||||||||
| 2014 | 2013 | 2012 | ||||||||||
| Net balance at end of year |
(8,955 | ) | (10,642 | ) | (5,968 | ) | ||||||
| Of which: |
||||||||||||
| Brazil Group |
(5,936 | ) | (5,480 | ) | (2,627 | ) | ||||||
| Mexico Group |
(1,243 | ) | (1,171 | ) | (900 | ) | ||||||
| Santander UK Group |
(1,042 | ) | (2,364 | ) | (2,094 | ) | ||||||
| Argentina Group |
(729 | ) | (618 | ) | (287 | ) | ||||||
| Chile Group |
(528 | ) | (453 | ) | (80 | ) | ||||||
| SHUSA Group |
535 | (352 | ) | (50 | ) | |||||||
| Other |
(12 | ) | (204 | ) | 70 | |||||||
| d) | Entities accounted for using the equity method |
Valuation adjustments - Entities accounted for using the equity method includes the amounts of valuation adjustments recognized in equity arising from associates and jointly controlled entities.
F-170
Table of Contents
The changes in Valuation adjustments - Entities accounted for using the equity method were as follows:
| Millions of euros | ||||||||||||
| 2014 | 2013 | 2012 | ||||||||||
| Balance at beginning of year |
(446 | ) | (152 | ) | (95 | ) | ||||||
| Revaluation gains/(losses) |
266 | (283 | ) | (61 | ) | |||||||
| Net amounts transferred to profit or loss |
95 | 23 | 21 | |||||||||
| Transfers |
— | (34 | ) | (17 | ) | |||||||
|
|
|
|
|
|
|
|||||||
| Balance at end of year |
(85 | ) | (446 | ) | (152 | ) | ||||||
|
|
|
|
|
|
|
|||||||
| Of which: |
||||||||||||
| Metrovacesa, S.A. |
— | (63 | ) | (55 | ) | |||||||
| Zurich Santander Insurance América, S.L. |
(37 | ) | (135 | ) | 39 | |||||||
| Santander Consumer USA Inc. |
— | (145 | ) | (92 | ) | |||||||
| e) | Other valuation adjustments |
Valuation adjustments - Other valuation adjustments include the actuarial gains and losses and the return on plan assets, less the administrative expenses and taxes inherent to the plan, and any change in the effect of the asset ceiling, excluding amounts included in net interest on the net defined benefit liability (asset).
The changes in this balance are shown in the consolidated statement of recognized income and expense, and the most significant changes in 2014 related to:
| • | Increase of EUR 479 million in the cumulative actuarial losses relating to the Group’s entities in Spain, due basically to the change in the main actuarial assumptions – a decrease in the discount rate from 3% to 2%. |
| • | Increase of EUR 246 million in the cumulative actuarial losses relating to the Group’s businesses in Brazil, due basically to the change in the main actuarial assumptions – a decrease in the discount rate from 11.24% to 10.94%. |
| • | Decrease of EUR 204 million in the cumulative actuarial losses relating to the Group’s businesses in the UK, due basically to the change in the main actuarial assumptions – a decrease in the CPI from 3.40% to 3.05% and a higher than expected return on plan assets. |
| • | Also, changes arose as a result of fluctuations in exchange rates, mainly in the UK. |
| 30. | Shareholders’ equity |
Shareholders’ equity includes the amounts of equity contributions from shareholders, accumulated profit or loss recognized through the consolidated income statement, and components of compound financial instruments having the substance of permanent equity. Amounts arising from subsidiaries are presented in the appropriate items based on their nature.
The changes in Shareholders’ equity are presented in the consolidated statement of changes in total equity. Significant information on certain items of Shareholders’ equity and the changes therein in 2014 is set forth below.
F-171
Table of Contents
| 31. | Issued capital |
| a) | Changes |
At December 31, 2011, the Bank’s share capital consisted of 8,909,043,203 shares with a total par value of EUR 4,454.5 million.
On January 31, 2012 and May 2, 2012, the bonus issues through which the Santander Dividendo Elección program is instrumented took place, whereby 167,810,197 and 284,326,000 shares (1.85% and 3.04% of the share capital, respectively) were issued, giving rise to bonus issues of EUR 83.9 million and EUR 142.2 million, respectively.
The shareholders at the annual general meeting on March 30, 2012 resolved to grant holders of “Valores Santander” the option to request the voluntary conversion of their shares on four occasions prior to October 4, 2012, the date of their mandatory conversion. As a result of the exercise of this option and of the mandatory conversion, 73,927,779 shares were issued on June 7, 193,095,393 on July 5, 37,833,193 on August 7, 14,333,873 on September 6 and 200,311,513 on October 9, 2012, relating to capital increases of EUR 37 million, EUR 97 million, EUR 19 million, EUR 7 million and EUR 100 million, respectively.
Also, on July 31, 2012 and November 2, 2012, the bonus issues through which the Santander Dividendo Elección program is instrumented took place, whereby 218,391,102 and 222,107,497 shares (2.22% and 2.15% of the share capital, respectively) were issued, giving rise to bonus issues of EUR 109.2 and EUR 111.1 million, respectively.
At December 31, 2012, the Bank’s share capital consisted of 10,321,179,750 shares with a total par value of EUR 5,161 million.
On January 30, 2013, April 30, 2013, July 31, 2013 and October 31, 2013, the bonus issues through which the Santander Dividendo Elección program is instrumented took place, whereby 217,503,395, 270,917,436, 282,509,392 and 241,310,515 shares (2.06%, 2.51%, 2.55% and 2.13% of the share capital, respectively) were issued, giving rise to bonus issues of EUR 108.8 million, EUR 135.5 million, EUR 141.3 million and EUR 120.7 million, respectively.
At December 31, 2013, the Bank’s share capital consisted of 11,333,420,488 shares with a total par value of EUR 5,667 million.
On January 30, 2014, April 29, 2014, July 30, 2014 and November 5, 2014, the bonus issues through which the Santander Dividendo Elección scrip dividend scheme is instrumented took place, whereby 227,646,659, 217,013,477, 210,010,506 and 225,386,463 shares (2.01%, 1.88%, 1.78% and 1.82% of the share capital, respectively) were issued, giving rise to bonus issues of EUR 113.8 million, EUR 108.5 million, EUR 105 million and EUR 112.7 million, respectively.
Also, on November 4, 2014, a capital increase was carried out to cater for the exchange of Banco Santander (Brasil) S.A. shares (see Note 3), whereby 370,937,066 shares (3.09% of the share capital) were issued, corresponding to a capital increase of EUR 185.5 million (see Note 3).
At December 31, 2014, the Bank’s share capital consisted of 12,584,414,659 shares with a total par value of EUR 6,292 million.
F-172
Table of Contents
The Bank’s shares are listed on the Spanish Stock Market Interconnection System and on the New York, London, Milan, Lisbon, Buenos Aires, Mexico, São Paulo and Warsaw Stock Exchanges, and all of them have the same features and rights. At December 31, 2014, the only shareholders listed in the Bank’s shareholders register with ownership interests of more than 3% were State Street Bank & Trust (with an 11.43% holding), Chase Nominees Limited (with a 5.78% holding), The Bank of New York Mellon (with a 4.80% holding), EC Nominees Ltd. (with a 4.35% holding), Guaranty Nominees (with a 4.21% holding) and Clearstream Banking (with a 3.47% holding).
However, the Bank understands that these ownership interests are held in custody on behalf of third parties and that no individual third party, as far as the Bank is aware, has an ownership interest of more than 3% of the Bank’s share capital or voting power.
| b) | Other considerations |
The shareholders at the annual general meeting held on March 28, 2014 authorized additional share capital of EUR 2,890 million. The Bank’s directors have until March 28, 2017 to carry out capital increases up to this limit. The resolution empowers the board to fully or partially disapply the pre-emption right in accordance with the terms of Article 506 of the Spanish Limited Liability Companies Law, although this power is limited to EUR 1,156 million. This power was partially exercised in the capital increase carried out on January 8, 2015 (see Note 1.g).
The shareholders at the annual general meeting of March 28, 2014 resolved to increase the Bank’s capital by a par value of EUR 500 million and granted the board the broadest powers to set the date and establish the terms and conditions of this capital increase within one year from the date of the aforementioned annual general meeting. If the board does not exercise the powers delegated to it within the period established by the annual general meeting, these powers will be rendered null and void.
In addition, the aforementioned annual general meeting authorized the board to issue fixed-income securities, convertible into or exchangeable for shares of the Bank, for up to a total of EUR 10,000 million or the equivalent amount in another currency. The Bank’s directors have until March 28, 2019 to execute this resolution.
At December 31, 2014, the shares of the following companies were listed on official stock markets: Banco Santander Río, S.A.; Grupo Financiero Santander México, S.A.B. de C.V.; Banco Santander - Chile; Cartera Mobiliaria, S.A., SICAV; Santander Chile Holding S.A.; Banco Santander (Brasil) S.A., Bank Zachodni WBK S.A. and Santander Consumer USA Holdings Inc.
At December 31, 2014, the number of Bank shares owned by third parties and managed by Group management companies (mainly portfolio, collective investment undertaking and pension fund managers) and managed jointly was 56 million, which represented 0.44% of the Bank’s share capital. In addition, the number of Bank shares owned by third parties and received as security was 211 million (equal to 1.68% of the Bank’s share capital).
At December 31, 2014, the capital increases in progress at Group companies and the additional capital authorized by their shareholders at the respective general meetings were not material at Group level (see Exhibit V).
F-173
Table of Contents
| 32. | Share premium |
Share premium includes the amount paid up by the Bank’s shareholders in capital issues in excess of the par value.
The Spanish Limited Liability Companies Law expressly permits the use of the share premium account balance to increase capital at the entities at which it is recognized and does not establish any specific restrictions as to its use.
The increase in the balance of Share premium in 2013 and 2012 relates to the capital increases detailed in Note 31.a. The increase in 2014 is the result of the capital increase of EUR 2,372 million carried out to cater for the exchange of Banco Santander (Brasil) S.A. shares (see Note 3) and the reduction of EUR 440 million to cater for the capital increases arising from the Santander Dividendo Elección scrip dividend scheme.
Also, in 2014 an amount of EUR 125 million was transferred from the Share premium account to the Legal reserve (2013: EUR 102 million; 2012: EUR 141 million) (see Note 33.b.i).
| 33. | Reserves |
| a) | Definitions |
Shareholders’ equity - Reserves - Accumulated reserves (losses) includes the net amount of the accumulated profit or loss recognized in previous years through the consolidated income statement that, in the distribution of profit, was appropriated to equity, and the own equity instrument issuance expenses and the differences between the selling price of treasury shares and the cost of acquisition thereof.
Shareholders’ equity - Reserves - Reserves (losses) of entities accounted for using the equity method includes the net amount of the accumulated profit or loss generated in previous years by entities accounted for using the equity method, recognized through the consolidated income statement.
| b) | Breakdown |
The detail of Accumulated reserves and Reserves of entities accounted for using the equity method is as follows:
| Millions of euros | ||||||||||||
| 2014 | 2013 | 2012 | ||||||||||
| Accumulated reserves: |
||||||||||||
| Restricted reserves- |
||||||||||||
| Legal reserve |
1,259 | 1,134 | 1,032 | |||||||||
| Reserve for treasury shares |
1,487 | 1,509 | 1,549 | |||||||||
| Revaluation reserve Royal Decree-Law 7/1996 |
43 | 43 | 43 | |||||||||
| Reserve for retired capital |
11 | 11 | 11 | |||||||||
| Voluntary reserves |
2,997 | 3,048 | 18 | |||||||||
| Consolidation reserves attributable to the Bank |
7,908 | 7,968 | 8,551 | |||||||||
| Accumulated profit or loss at subsidiaries |
27,268 | 24,080 | 25,641 | |||||||||
|
|
|
|
|
|
|
|||||||
| 40,973 | 37,793 | 36,845 | ||||||||||
| Reserves of entities accounted for using the equity method: |
||||||||||||
| Associates |
187 | 263 | 255 | |||||||||
|
|
|
|
|
|
|
|||||||
| 41,160 | 38,056 | 37,100 | ||||||||||
|
|
|
|
|
|
|
|||||||
F-174
Table of Contents
| i. | Legal reserve |
Under the Consolidated Spanish Limited Liability Companies Law, 10% of net profit for each year must be transferred to the legal reserve. These transfers must be made until the balance of the legal reserve reaches 20% of the share capital. The legal reserve can be used to increase capital provided that the remaining reserve balance does not fall below 10% of the increased share capital amount.
In 2014 and 2013 the Bank transferred EUR 125 million and EUR 102 million, respectively, from the Share premium account to the Legal reserve. In 2012 the Bank transferred EUR 141 million from the Share premium account and EUR 34 million of 2011 profit to the Legal reserve.
Consequently, once again, after the capital increases described in Note 31 had been carried out, the balance of the Legal reserve reached 20% of the share capital, and at December 31, 2014 the Legal reserve was at the stipulated level.
| ii. | Reserve for treasury shares |
Pursuant to the Consolidated Spanish Limited Liability Companies Law, a restricted reserve has been recognized for an amount equal to the carrying amount of the Bank shares owned by subsidiaries. The balance of this reserve will become unrestricted when the circumstances that made it necessary to record it cease to exist. Additionally, this reserve covers the outstanding balance of loans granted by the Group secured by Bank shares and the amount equivalent to loans granted by Group companies to third parties for the acquisition of treasury shares.
| iii. | Revaluation reserve Royal Decree Law 7/1996, of June7 |
The balance of Revaluation reserve Royal Decree-Law 7/1996 can be used, free of tax, to increase share capital. From January 1, 2007, the balance of this account can be taken to unrestricted reserves, provided that the monetary surplus has been realized. The surplus will be deemed to have been realized in respect of the portion on which depreciation has been taken for accounting purposes or when the revalued assets have been transferred or derecognized .
If the balance of this reserve were used in a manner other than that provided for in Royal Decree-Law 7/1996, of June 7, it would be subject to taxation.
F-175
Table of Contents
| iv. | Reserves of subsidiaries and jointly controlled entities |
The detail, by company, of Reserves of subsidiaries and jointly controlled entities, based on the companies’ contribution to the Group (considering the effect of consolidation adjustments) is as follows:
| Millions of euros | ||||||||||||
| 2014 | 2013 | 2012 | ||||||||||
| Banco Santander (Brasil), S.A. (Consolidated Group) |
7,361 | 6,478 | 5,237 | |||||||||
| Santander UK Group |
5,842 | 5,540 | 4,871 | |||||||||
| Banesto (*) |
— | — | 4,284 | |||||||||
| Banco Santander (México), S.A., Institución de Banca Múltiple, Grupo Financiero Santander |
2,566 | 2,573 | 2,104 | |||||||||
| Banco Santander - Chile |
2,446 | 2,736 | 3,072 | |||||||||
| Banco Santander Totta, S.A. (Consolidated Group) |
2,021 | 1,890 | 1,860 | |||||||||
| Santander Consumer Finance Group |
1,815 | 1,189 | 1,351 | |||||||||
| Santander Holdings USA, Inc. |
1,712 | 1,084 | 624 | |||||||||
| Santander Seguros y Reaseguros, Compañía Aseguradora, S.A. |
725 | 515 | 387 | |||||||||
| Banco Banif, S.A. Unipersonal (*) |
— | — | 347 | |||||||||
| Banco Santander Río, S.A. |
703 | 395 | 61 | |||||||||
| Banco Santander International |
408 | 348 | 288 | |||||||||
| Cartera Mobiliaria, S.A., SICAV |
370 | 339 | 329 | |||||||||
| Bank Zachodni WBK, S.A. |
315 | 175 | 62 | |||||||||
| Banco Santander (Suisse) SA |
282 | 242 | 333 | |||||||||
| Santander Investment, S.A. |
282 | 222 | 218 | |||||||||
| Exchange differences, consolidation adjustments and other companies (**) |
420 | 354 | 213 | |||||||||
|
|
|
|
|
|
|
|||||||
| 27,268 | 24,080 | 25,641 | ||||||||||
|
|
|
|
|
|
|
|||||||
| Of which: restricted |
2,233 | 2,062 | 2,241 | |||||||||
| (*) | The reserves of these entities are recognized at December 31, 2014 and December 31, 2013 under Voluntary reserves and Consolidation reserves attributable to the Bank as a result of the merger by absorption of the two entities into the Bank (see Note 3). |
| (**) | Includes the charge relating to cumulative exchange differences in the transition to International Financial Reporting Standards. |
| 34. | Other equity instruments and Treasury shares |
| a) | Other equity instruments |
“Other equity instruments” includes the equity component of compound financial instruments, the increase in equity due to personnel remuneration, and other items not recognized in other “Shareholders’ equity” items.
| b) | Treasury shares |
Shareholders’ equity - Treasury shares includes the amount of own equity instruments held by all the Group entities.
Transactions involving own equity instruments, including their issuance and cancellation, are recognized directly in equity, and no profit or loss may be recognized on these transactions. The costs of any transaction involving own equity instruments are deducted directly from equity, net of any related tax effect.
On October 21, 2013 and October 23, 2014, the Bank’s board of directors amended the regulation of its treasury share policy in order to take into account the criteria recommended by the CNMV, establishing limits on average daily purchase trading and time limits. Also, a maximum price per share was set for purchase orders and a minimum price per share for sale orders.
F-176
Table of Contents
The Bank’s shares owned by the consolidated companies accounted for 0.012% of issued share capital at December 31, 2014 (December 31, 2013: 0.013%; December 31, 2012: 0.474%).
The average purchase price of the Bank’s shares in 2014 was EUR 7.06 per share and the average selling price was EUR 7.18 per share.
The effect on equity, net of tax, arising from the purchase and sale of Bank shares was a EUR 40 million increase in 2014 (2013: EUR 28 million reduction; 2012: EUR 85 million increase).
| 35. | Memorandum items |
Memorandum items relates to balances representing rights, obligations and other legal situations that in the future may have an impact on net assets, as well as any other balances needed to reflect all transactions performed by the consolidated entities although they may not impinge on their net assets.
| a) | Contingent liabilities |
Contingent liabilities includes all transactions under which an entity guarantees the obligations of a third party and which result from financial guarantees granted by the entity or from other types of contract. The detail is as follows:
| Millions of euros | ||||||||||||
| 2014 | 2013 | 2012 | ||||||||||
| Financial guarantees |
13,383 | 13,479 | 14,437 | |||||||||
| Financial bank guarantees |
12,121 | 12,186 | 13,706 | |||||||||
| Non-performing guarantees |
1,262 | 1,293 | 731 | |||||||||
| Irrevocable documentary credits |
2,381 | 2,430 | 2,866 | |||||||||
| Other bank guarantees and indemnities provided |
28,006 | 24,690 | 27,285 | |||||||||
| Other guarantees |
27,630 | 24,496 | 27,089 | |||||||||
| Undertakings to provide bank guarantees |
376 | 194 | 196 | |||||||||
| Other contingent liabilities |
308 | 450 | 445 | |||||||||
| Assets earmarked for third-party obligations |
25 | 128 | 108 | |||||||||
| Other contingent liabilities |
283 | 322 | 337 | |||||||||
|
|
|
|
|
|
|
|||||||
| 44,078 | 41,049 | 45,033 | ||||||||||
|
|
|
|
|
|
|
|||||||
A significant portion of these guarantees will expire without any payment obligation materializing for the consolidated entities and, therefore, the aggregate balance of these commitments cannot be considered as an actual future need for financing or liquidity to be provided by the Group to third parties.
Income from guarantee instruments is recognized under Fee and commission income in the consolidated income statements and is calculated by applying the rate established in the related contract to the nominal amount of the guarantee.
At December 31, 2014, the Group had recognized provisions of EUR 654 million to cover contingent liabilities (December 31, 2013: EUR 693 million; December 31, 2012: EUR 617 million) (see Note 25).
F-177
Table of Contents
i. Financial guarantees
Financial guarantees includes, inter alia, financial guarantee contracts such as financial bank guarantees, credit derivatives sold, and risks arising from derivatives arranged for the account of third parties.
ii. Other bank guarantees and indemnities provided
This item includes guarantees other than those classified as financial, such as technical guarantees, guarantees covering the import and export of goods and services, irrevocable formal undertakings to provide bank guarantees, legally enforceable letters of guarantee and other guarantees of any kind.
iii. Other contingent liabilities
Other contingent liabilities includes the amount of any contingent liability not included in other items.
| b) | Contingent commitments |
Contingent commitments includes those irrevocable commitments that could give rise to the recognition of financial assets.
The detail is as follows:
| Millions of euros | ||||||||||||
| 2014 | 2013 | 2012 | ||||||||||
| Drawable by third parties |
182,955 | 154,314 | 187,664 | |||||||||
| Financial asset forward purchase commitments |
530 | 82 | 891 | |||||||||
| Regular way financial asset purchase contracts |
11,725 | 8,222 | 15,040 | |||||||||
| Documents delivered to clearing houses |
12,444 | 9,901 | 12,132 | |||||||||
| Other contingent commitments |
386 | 278 | 315 | |||||||||
|
|
|
|
|
|
|
|||||||
| 208,040 | 172,797 | 216,042 | ||||||||||
|
|
|
|
|
|
|
|||||||
| c) | Off-balance-sheet funds under management |
The detail of off-balance-sheet funds managed by the Group and by jointly controlled companies is as follows:
| Millions of euros | ||||||||||||
| 2014 | 2013 | 2012 | ||||||||||
| Investment funds |
109,519 | 93,304 | 89,176 | |||||||||
| Pension funds |
11,481 | 10,879 | 10,076 | |||||||||
| Assets under management |
20,369 | 20,987 | 18,889 | |||||||||
|
|
|
|
|
|
|
|||||||
| 141,369 | 125,170 | 118,141 | ||||||||||
|
|
|
|
|
|
|
|||||||
| d) | Third-party securities held in custody |
At December 31, 2014, the Group held in custody debt securities and equity instruments totaling EUR 1,023,819 million (December 31, 2013: EUR 853,509 million; December 31, 2012: EUR 725,609 million) entrusted to it by third parties.
F-178
Table of Contents
| 36. | Derivatives - Notional amounts and market values of trading and hedging derivatives |
The detail of the notional and/or contractual amounts and the market values of the trading and hedging derivatives held by the Group is as follows:
| Millions of euros | ||||||||||||||||||||||||
| 2014 | 2013 | 2012 | ||||||||||||||||||||||
| Notional amount |
Market value |
Notional amount |
Market value |
Notional amount |
Market value |
|||||||||||||||||||
| Trading derivatives: |
||||||||||||||||||||||||
| Interest rate risk- |
||||||||||||||||||||||||
| Forward rate agreements |
192,659 | (50 | ) | 120,773 | (2 | ) | 324,031 | (7 | ) | |||||||||||||||
| Interest rate swaps |
2,738,960 | 1,253 | 2,454,752 | 1,190 | 2,114,198 | 2,942 | ||||||||||||||||||
| Options, futures and other derivatives |
665,658 | (1,035 | ) | 605,532 | (1,157 | ) | 655,091 | (487 | ) | |||||||||||||||
| Credit risk- |
||||||||||||||||||||||||
| Credit default swaps |
66,596 | 81 | 79,822 | 49 | 90,119 | 18 | ||||||||||||||||||
| Foreign currency risk- |
||||||||||||||||||||||||
| Foreign currency purchases and sales |
230,961 | 515 | 186,207 | 1,935 | 187,976 | 278 | ||||||||||||||||||
| Foreign currency options |
46,311 | (38 | ) | 45,196 | 200 | 49,442 | (18 | ) | ||||||||||||||||
| Currency swaps |
278,380 | (1,694 | ) | 255,731 | (1,001 | ) | 277,392 | (436 | ) | |||||||||||||||
| Securities and commodities derivatives and other |
105,901 | (1,222 | ) | 95,634 | (1,202 | ) | 149,737 | (1,714 | ) | |||||||||||||||
|
|
|
|
|
|
|
|
|
|
|
|
|
|||||||||||||
| 4,325,426 | (2,190 | ) | 3,843,647 | 12 | 3,847,986 | 576 | ||||||||||||||||||
|
|
|
|
|
|
|
|
|
|
|
|
|
|||||||||||||
| Hedging derivatives: |
||||||||||||||||||||||||
| Interest rate risk- |
||||||||||||||||||||||||
| Interest rate swaps |
190,872 | (185 | ) | 219,103 | 1,456 | 195,416 | 2,154 | |||||||||||||||||
| Options, futures and other derivatives |
9,569 | 13 | 2,144 | 12 | 8,006 | 19 | ||||||||||||||||||
| Credit risk- |
||||||||||||||||||||||||
| Credit default swaps |
607 | (9 | ) | 760 | (14 | ) | 833 | (7 | ) | |||||||||||||||
| Foreign currency risk- |
||||||||||||||||||||||||
| Foreign currency purchases and sales |
25,530 | 86 | 24,161 | 630 | 24,758 | (278 | ) | |||||||||||||||||
| Foreign currency options |
621 | 39 | 3,883 | 409 | 24,740 | (34 | ) | |||||||||||||||||
| Currency swaps |
46,727 | 147 | 38,760 | 525 | 38,895 | (399 | ) | |||||||||||||||||
| Securities and commodities derivatives and other |
168 | — | 258 | — | 278 | 37 | ||||||||||||||||||
|
|
|
|
|
|
|
|
|
|
|
|
|
|||||||||||||
| 274,094 | 91 | 289,069 | 3,018 | 292,926 | 1,492 | |||||||||||||||||||
|
|
|
|
|
|
|
|
|
|
|
|
|
|||||||||||||
The notional and/or contractual amounts of the contracts entered into do not reflect the actual risk assumed by the Group, since the net position in these financial instruments is the result of offsetting and/or combining them. This net position is used by the Group basically to hedge the interest rate, underlying asset price or foreign currency risk; the results on these financial instruments are recognized under Gains/losses on financial assets and liabilities (net) in the consolidated income statements and increase or offset, as appropriate, the gains or losses on the investments hedged (see Note 11).
Additionally, in order to interpret correctly the results on the Securities and commodities derivatives shown in the foregoing table, it should be considered that these items relate mostly to securities options for which a premium has been received which offsets their negative market value. Also, this market value is offset by positive market values generated by symmetrical positions in the Group’s held-for-trading portfolio.
F-179
Table of Contents
The Group manages the credit risk exposure of these contracts through netting arrangements with its main counterparties and by receiving assets as collateral for its risk positions (see Note 2.f).
The notional amounts and fair values of the hedging derivatives, by type of hedge, is as follows:
| Millions of euros | ||||||||||||||||||||||||
| 2014 | 2013 | 2012 | ||||||||||||||||||||||
| Notional amount |
Fair value | Notional amount |
Fair value | Notional amount |
Fair value | |||||||||||||||||||
| Fair value hedges |
234,939 | (249 | ) | 229,439 | 1,257 | 195,486 | 1,975 | |||||||||||||||||
| Cash flow hedges |
22,388 | 444 | 55,417 | 743 | 56,311 | (209 | ) | |||||||||||||||||
| Hedges of net investments in foreign operations |
16,767 | (104 | ) | 4,213 | 1,018 | 41,129 | (274 | ) | ||||||||||||||||
|
|
|
|
|
|
|
|
|
|
|
|
|
|||||||||||||
| 274,094 | 91 | 289,069 | 3,018 | 292,926 | 1,492 | |||||||||||||||||||
|
|
|
|
|
|
|
|
|
|
|
|
|
|||||||||||||
Following is a description of the main hedges (including the results of the hedging instrument and the hedged item attributable to the hedged risk):
Hedge accounting
The Group, as part of its financial risk management strategy and for the purpose of reducing mismatches in the accounting treatment of its transactions, enters into interest rate, foreign currency or equity hedging derivatives, depending on the nature of the hedged risk.
In line with its objective, the Group classifies its hedges into the following categories:
| • | Cash flow hedges: hedge the exposure to variability in cash flows associated with an asset, liability or highly probable forecast transaction. Thus, floating rate issues in foreign currencies, fixed rate issues in non-local currency, floating rate interbank financing and floating rate assets (bonds, commercial credit, mortgages, etc.) are hedged. |
| • | Fair value hedges: hedge the exposure to changes in the fair value of assets or liabilities attributable to an identified, hedged risk. Thus, the interest rate risk of assets and liabilities (bonds, loans, bills, issues, deposits, etc.) with coupons or fixed interest rates, investments in entities, issues in foreign currencies and deposits and other fixed rate liabilities are hedged. |
| • | Hedges of net investments in foreign operations: hedge the foreign currency risk of investments in subsidiaries domiciled in countries outside the euro zone. |
i. Cash flow hedges
The fair value of the cash flow hedges, net of the related tax effect, is recognized under Valuation adjustments - Cash flow hedges in the Group’s equity. The detail of the terms, from December 31, 2014, within which the amounts recognized under Valuation adjustments - Cash flow hedges in equity will be recognized in the consolidated income statements in the coming years is as follows:
F-180
Table of Contents
| Millions of euros | ||||||||||||||||
| 2014 |
Within 1 year | 1 to 5 years | More than 5 years |
Total | ||||||||||||
| Debit balances (losses) |
46 | 140 | 40 | 226 | ||||||||||||
The net amount recognized as an equity valuation adjustment in 2014, as a result of the cash flow hedges, was an increase of EUR 459 million.
The net amount transferred from equity to 2014 profit was EUR 345 million, relating to the accrual to the net interest margin of the cash flow hedges.
The impact on 2014 profit and loss of the ineffectiveness of the Group’s cash flow hedges was a net loss of EUR 159 million (see Note 44).
ii. Fair value hedges
In 2014 a net gain of EUR 90 million was recognized (gains of EUR 817 million on hedged items and losses of EUR 727 million on hedging derivatives) on fair value hedging transactions (see Note 44). In this connection, at December 31, the Bank accounted for most of the Group’s fair value hedges.
Hence, the financial management area of the Bank, as Parent of the Group, uses derivatives to hedge the interest rate risk and foreign currency risk of the issues of instrumental companies of the Group guaranteed by the Bank. Following are details of the main hedges taken out by the Bank which remained outstanding at the Group at December 31, 2014.
At December 31, 2014, the Group held hedging derivatives for a notional amount equivalent to EUR 30,191 million, the market value of which represented a gain of EUR 1,448 million which is offset in profit and loss on measurement of the hedged issues. The net result of this hedge is a net loss of EUR 53 million.
The main currencies of these fair value hedges are: the euro, with a notional amount of EUR 27,611 million and gains on derivatives of EUR 1,426 million, the US dollar, with a notional amount of EUR 1,790 million and gains on derivatives of EUR 35 million, and the pound sterling, with a notional amount of EUR 207 million and a gain on derivatives of EUR 0.2 million.
Also, the Bank uses derivatives to hedge the interest rate risk of government and corporate bonds recognized as available-for-sale assets. At December 31, 2014, the notional amount of these derivatives was EUR 9,072 million and their fair value gave rise to a loss of EUR 772 million, which was offset by the result of measuring the bonds at their hedged risk, giving rise to a net overall loss of EUR 1.7 million.
Lastly, the Bank has two fair value macro-hedges from its merger with Banesto. At year-end, the notional amount of the related derivatives was EUR 3,905 million and their fair value gave rise to a loss of EUR 96 million. Including the measurement of the hedged items, the net result of the macro-hedges was a gain of EUR 11.3 million.
F-181
Table of Contents
iii. Foreign currency hedges (net investments in foreign operations)
As part of its financial strategy, the Group hedges the foreign currency risk arising from its investments in non-euro-zone countries. To this end, it arranges foreign currency derivatives in order to take a long position in euros vis-à-vis the local currency of the investment.
At December 31, 2014, the total notional amount of the hedges of these investments was the equivalent of EUR 15,714 million, of which EUR 10,173 million related to foreign currency swaps and forwards, EUR 310 million to foreign currency options and EUR 5,231 million to spot foreign currency sales.
By currency,
| • | Hedges of the Brazilian real included hedging foreign currency options and forwards amounting to EUR 4,859 million. The amount hedged with foreign currency forwards totals EUR 4,549 million, with a loss of EUR 417 million; the amount hedged with foreign currency options totals EUR 310 million, which gave rise to a loss of EUR 359 million in 2014. At December 31, 2014, the market value of outstanding options represented a net gain of EUR 40 million. In 2014 options taken to hedge the Brazilian real were settled with an effect on valuation adjustments amounting to EUR 124 million. |
| • | The position in Mexican pesos is hedged through foreign currency swaps and forwards with a notional amount of EUR 2,728 million and a loss of EUR 123 million. |
| • | The Polish zloty is hedged through foreign currency swaps and forwards with a notional amount of EUR 1,376 million and a gain of EUR 5 million. |
| • | The hedging of the Chilean peso includes outstanding non-deliverable foreign currency forwards amounting to EUR 1,194 million, with a loss of EUR 44 million. |
| • | Norwegian kroner are hedged through foreign currency forwards amounting to EUR 326 million, with a gain of EUR 36 million. |
In addition to these hedges with derivatives, spot foreign currency sales were made to offset the structural foreign currency risk: spot sales were made of US dollars against euros, which amounted to EUR 1,593 million and gave rise to a loss of EUR 233 million, of pounds sterling against euros, which totaled EUR 3,523 million and gave rise to a loss of EUR 264 million and, lastly, of Swiss francs against euros, with a notional amount of EUR 115 million, which gave rise to a loss of EUR 2 million.
At 2013 year-end, the Bank held foreign currency options in this connection with an equivalent euro notional amount of EUR 8,846 million, which were denominated in Brazilian reals. In 2013 losses amounting to EUR 214 million, which arose from the settlement of options that were exercised, were taken to equity. At 2013 year-end, the market value of the options not yet exercised represented a net gain of EUR 399 million. In addition to foreign currency options, the Group had also arranged other hedging derivatives to round off its hedging of the structural foreign currency risk of its foreign currency investments: Chilean pesos for a notional amount of EUR 1,187 million, which gave rise to a gain of EUR 139 million; Brazilian reals for a notional amount of EUR 6,905 million, with a gain of EUR 720 million; Mexican pesos for a total notional amount of EUR 3,185 million, with a loss of EUR 2 million; and Polish zloty for a notional amount of EUR 1,651 million, with a loss of EUR 40 million, as well as a gain of EUR 6 million on options that had already expired.
Lastly, in addition to these hedges involving derivatives, foreign currency spot sales were made to offset structural foreign currency risk. By currency, spot sales were made of US dollars against euros, which amounted to EUR 1,293 million and gave rise to a gain of EUR 68 million, and of pounds sterling against euros, which totaled EUR 3,345 million and gave rise to a gain of EUR 214 million.
F-182
Table of Contents
At 2012 year-end, the Bank held foreign currency options in this connection with an equivalent euro notional amount of EUR 12,370 million, of which EUR 10,468 million were denominated in Brazilian reals and EUR 1,902 million in Polish zloty. In 2012 losses amounting to EUR 571 million, which arose from the settlement of options that were exercised, were taken to equity. At 2012 year-end, the market value of the options not yet exercised represented an unrealized net loss of EUR 33 million. In addition to foreign currency options, the Group had also arranged other hedging derivatives to round off its hedging of the structural foreign currency risk of its foreign currency investments: Chilean pesos for a notional amount of EUR 2,327 million, which gave rise to a loss of EUR 360 million; Brazilian reals for a notional amount of EUR 2,722 million, with a loss of EUR 377 million; and Mexican pesos for a total notional amount of EUR 4,172 million, with a loss of EUR 266 million.
Lastly, in addition to these hedges involving derivatives, foreign currency spot sales were made to offset structural foreign currency risk. By currency, spot sales were made of US dollars against euros, which amounted to EUR 1,805 million and gave rise to a gain of EUR 38 million, and of pounds sterling against euros, which totaled EUR 6,377 million and gave rise to a loss of EUR 170 million.
In line with the purpose of hedging the underlying carrying amount of net assets in foreign currencies, the overall valuation adjustments (gains/losses) obtained from the aforementioned hedges offset from an equity position the exchange differences arising from the conversion to euros of the Group’s investments in its investees’ net assets.
For their part, the hedges of net investments in foreign operations did not generate gains or losses for ineffectiveness in 2014.
| 37. | Discontinued operations |
No significant operations were discontinued in 2014, 2013 or 2012.
| a) | Profit or loss and net cash flows from discontinued operations |
The detail of the profit or loss from discontinued operations is set forth below.
The balance sheets and income statements for 2012 were restated in 2013 in order to present Santander UK’s cards business that was acquired from GE (General Electric) in prior years as a discontinued operation:
| Millions of euros | ||||||||||||
| 2014 | 2013 | 2012 | ||||||||||
| Interest income/(charges) |
4 | 84 | 232 | |||||||||
| Net fee and commission income |
— | 22 | 48 | |||||||||
| Gains/losses on financial assets and liabilities |
— | — | — | |||||||||
| Other operating income/(expenses) |
— | — | (2 | ) | ||||||||
|
|
|
|
|
|
|
|||||||
| Gross income |
4 | 106 | 278 | |||||||||
| Personnel expenses |
(1 | ) | (7 | ) | (19 | ) | ||||||
| Other general administrative expenses |
(3 | ) | (23 | ) | (114 | ) | ||||||
| Depreciation and amortization |
— | (2 | ) | (6 | ) | |||||||
| Provisions (net) |
(22 | ) | (6 | ) | (6 | ) | ||||||
| Impairment losses on financial assets |
(4 | ) | (6 | ) | (36 | ) | ||||||
|
|
|
|
|
|
|
|||||||
| Profit (loss) from operations |
(26 | ) | 62 | 97 | ||||||||
| Gains (losses) on disposal of assets not classified as non-current assets held for sale |
— | (80 | ) | 2 | ||||||||
|
|
|
|
|
|
|
|||||||
| Profit (loss) before tax |
(26 | ) | (18 | ) | 99 | |||||||
|
|
|
|
|
|
|
|||||||
| Income tax (Note 27) |
— | 3 | (29 | ) | ||||||||
|
|
|
|
|
|
|
|||||||
| Profit (loss) from discontinued operations |
(26 | ) | (15 | ) | 70 | |||||||
|
|
|
|
|
|
|
|||||||
F-183
Table of Contents
Additionally, following is a detail of the net cash flows attributable to the operating, investing and financing activities of discontinued operations.
| Millions of euros | ||||||||||||
| 2014 | 2013 | 2012 | ||||||||||
| Cash and cash equivalents as at beginning of year |
— | — | — | |||||||||
| Cash flows from operating activities |
(10 | ) | 2 | (3 | ) | |||||||
| Cash flows from investing activities |
10 | (2 | ) | 3 | ||||||||
| Cash flows from financing activities |
— | — | — | |||||||||
|
|
|
|
|
|
|
|||||||
| Cash and cash equivalents as at end of year |
— | — | — | |||||||||
|
|
|
|
|
|
|
|||||||
| b) | Earnings per share relating to discontinued operations |
The earnings per share relating to discontinued operations were as follows:
| 2014 | 2013 | 2012 | ||||||||||
| Basic earnings per share (euros) |
(0.00 | ) | (0.00 | ) | 0.01 | |||||||
| Diluted earnings per share (euros) |
(0.00 | ) | (0.00 | ) | 0.01 | |||||||
| 38. | Interest and similar income |
Interest and similar income in the consolidated income statement comprises the interest accruing in the year on all financial assets with an implicit or explicit return, calculated by applying the effective interest method, irrespective of measurement at fair value; and the rectifications of income as a result of hedge accounting. Interest is recognized gross, without deducting any tax withheld at source.
The detail of the main interest and similar income items earned in 2014, 2013 and 2012 is as follows:
| Millions of euros | ||||||||||||
| 2014 | 2013 | 2012 | ||||||||||
| Balances with the Bank of Spain and other central banks |
2,038 | 2,701 | 2,693 | |||||||||
| Loans and advances to credit institutions |
1,782 | 766 | 1,034 | |||||||||
| Debt instruments |
7,247 | 6,435 | 7,093 | |||||||||
| Loans and advances to customers |
42,175 | 40,206 | 46,127 | |||||||||
| Insurance contracts linked to pensions (Note 25) |
9 | 11 | 45 | |||||||||
| Other interest |
1,405 | 1,328 | 1,799 | |||||||||
|
|
|
|
|
|
|
|||||||
| 54,656 | 51,447 | 58,791 | ||||||||||
|
|
|
|
|
|
|
|||||||
Most of the interest and similar income was generated by the Group’s financial assets that are measured either at amortized cost or at fair value through equity.
F-184
Table of Contents
| 39. | Interest expense and similar charges |
Interest expense and similar charges in the consolidated income statement includes the interest accruing in the year on all financial liabilities with an implicit or explicit return, including remuneration in kind, calculated by applying the effective interest method, irrespective of measurement at fair value; the rectifications of cost as a result of hedge accounting; and the interest cost attributable to provisions recorded for pensions.
The detail of the main items of interest expense and similar charges accrued in 2014, 2013 and 2012 is as follows:
| Millions of euros | ||||||||||||
| 2014 | 2013 | 2012 | ||||||||||
| Balances with the Bank of Spain and other central banks |
55 | 118 | 522 | |||||||||
| Deposits from credit institutions |
2,144 | 1,852 | 1,959 | |||||||||
| Customer deposits |
13,415 | 14,805 | 16,403 | |||||||||
| Marketable debt securities |
6,844 | 6,880 | 7,277 | |||||||||
| Subordinated liabilities (Note 23) |
1,084 | 1,260 | 1,650 | |||||||||
| Provisions for pensions (Note 25) |
344 | 363 | 398 | |||||||||
| Other interest |
1,223 | 234 | 659 | |||||||||
|
|
|
|
|
|
|
|||||||
| 25,109 | 25,512 | 28,868 | ||||||||||
|
|
|
|
|
|
|
|||||||
Most of the interest expense and similar charges was generated by the Group’s financial liabilities that are measured at amortized cost.
| 40. | Income from equity instruments |
Income from equity instruments includes the dividends and payments on equity instruments out of profits generated by investees after the acquisition of the equity interest.
The detail of Income from equity instruments is as follows:
| Millions of euros | ||||||||||||
| 2014 | 2013 | 2012 | ||||||||||
| Equity instruments classified as: |
||||||||||||
| Financial assets held for trading |
287 | 264 | 290 | |||||||||
| Available-for-sale financial assets |
148 | 114 | 133 | |||||||||
|
|
|
|
|
|
|
|||||||
| 435 | 378 | 423 | ||||||||||
|
|
|
|
|
|
|
|||||||
| 41. | Income from companies accounted for using the equity method |
Income from companies accounted for using the equity method comprises the amount of profit or loss attributable to the Group generated during the year by associates and jointly controlled entities.
F-185
Table of Contents
The detail of Income from companies accounted for using the equity method is as follows:
| Millions of euros | ||||||||||||
| 2014 | 2013 | 2012 | ||||||||||
| Santander Consumer USA Inc. |
— | 322 | 349 | |||||||||
| Zurich Santander Insurance América, S.L. |
167 | 138 | 134 | |||||||||
| Metrovacesa, S.A. |
(68 | ) | (40 | ) | (100 | ) | ||||||
| SAM Investment Holdings Limited |
51 | — | — | |||||||||
| Allfunds Bank, S.A. |
23 | 17 | 11 | |||||||||
| Companhia de Crédito, Financiamento e Investimento RCI Brasil |
20 | 21 | 16 | |||||||||
| Other companies |
50 | 42 | 17 | |||||||||
|
|
|
|
|
|
|
|||||||
| 243 | 500 | 427 | ||||||||||
|
|
|
|
|
|
|
|||||||
| 42. | Fee and commission income |
Fee and commission income comprises the amount of all fees and commissions accruing in favor of the Group in the year, except those that form an integral part of the effective interest rate on financial instruments.
The detail of Fee and commission income is as follows:
| Millions of euros | ||||||||||||
| 2014 | 2013 | 2012 | ||||||||||
| Collection and payment services: |
||||||||||||
| Bills |
284 | 333 | 336 | |||||||||
| Demand accounts |
1,006 | 1,163 | 1,209 | |||||||||
| Cards |
2,769 | 2,890 | 2,746 | |||||||||
| Orders |
422 | 347 | 347 | |||||||||
| Cheques and other |
144 | 165 | 226 | |||||||||
|
|
|
|
|
|
|
|||||||
| 4,625 | 4,898 | 4,864 | ||||||||||
|
|
|
|
|
|
|
|||||||
| Marketing of non-banking financial products: |
||||||||||||
| Investment funds |
831 | 1,040 | 1,074 | |||||||||
| Pension funds |
111 | 163 | 143 | |||||||||
| Insurance |
2,304 | 2,399 | 2,451 | |||||||||
|
|
|
|
|
|
|
|||||||
| 3,246 | 3,602 | 3,668 | ||||||||||
|
|
|
|
|
|
|
|||||||
| Securities services: |
||||||||||||
| Securities underwriting and placement |
306 | 208 | 204 | |||||||||
| Securities trading |
303 | 316 | 323 | |||||||||
| Administration and custody |
248 | 212 | 214 | |||||||||
| Asset management |
78 | 107 | 103 | |||||||||
|
|
|
|
|
|
|
|||||||
| 935 | 843 | 844 | ||||||||||
|
|
|
|
|
|
|
|||||||
| Other: |
||||||||||||
| Foreign exchange |
264 | 243 | 229 | |||||||||
| Financial guarantees |
498 | 476 | 484 | |||||||||
| Commitment fees |
343 | 329 | 282 | |||||||||
| Other fees and commissions |
2,604 | 2,082 | 2,361 | |||||||||
| 3,709 | 3,130 | 3,356 | ||||||||||
|
|
|
|
|
|
|
|||||||
| 12,515 | 12,473 | 12,732 | ||||||||||
|
|
|
|
|
|
|
|||||||
F-186
Table of Contents
| 43. | Fee and commission expense |
Fee and commission expense shows the amount of all fees and commissions paid or payable by the Group in the year, except those that form an integral part of the effective interest rate on financial instruments.
The detail of Fee and commission expense is as follows:
| Millions of euros | ||||||||||||
| 2014 | 2013 | 2012 | ||||||||||
| Fees and commissions assigned to third parties |
1,618 | 1,718 | 1,616 | |||||||||
| Of which: Cards |
1,149 | 1,279 | 1,203 | |||||||||
| Brokerage fees on lending and deposit transactions |
42 | 37 | 36 | |||||||||
| Other fees and commissions |
1,159 | 957 | 819 | |||||||||
|
|
|
|
|
|
|
|||||||
| 2,819 | 2,712 | 2,471 | ||||||||||
|
|
|
|
|
|
|
|||||||
| 44. | Gains/losses on financial assets and liabilities |
Gains/losses on financial assets and liabilities includes the amount of the valuation adjustments of financial instruments, except those attributable to interest accrued as a result of application of the effective interest method and to allowances, and the gains or losses obtained from the sale and purchase thereof.
| a) | Breakdown |
The detail, by origin, of Gains/losses on financial assets and liabilities is as follows:
| Millions of euros | ||||||||||||
| 2014 | 2013 | 2012 | ||||||||||
| Financial assets and liabilities held for trading (*) |
2,377 | 1,733 | 1,460 | |||||||||
| Other financial instruments at fair value through profit or loss (*) |
239 | (6 | ) | 159 | ||||||||
| Financial instruments not measured at fair value through profit or loss |
1,427 | 1,622 | 1,789 | |||||||||
| Of which: Available-for-sale financial assets |
1,416 | 1,490 | 915 | |||||||||
| Of which: |
||||||||||||
| Debt instruments |
1,173 | 1,345 | 576 | |||||||||
| Equity instruments |
243 | 145 | 339 | |||||||||
| Of which: Other |
11 | 132 | 874 | |||||||||
| Of which: |
||||||||||||
| Due to exchange and repurchase of securities |
— | — | 870 | |||||||||
| Hedging derivatives (Note 36) |
(69 | ) | (115 | ) | (79 | ) | ||||||
|
|
|
|
|
|
|
|||||||
| 3,974 | 3,234 | 3,329 | ||||||||||
|
|
|
|
|
|
|
|||||||
| (*) Includes the net gain or loss arising from transactions involving debt securities, equity instruments and derivatives included in this portfolio, since the Group manages its risk in these instruments on a global basis. |
| |||||||||||
F-187
Table of Contents
Due to exchange and repurchase of securities
In 2012 the Group performed several securities exchange and repurchase transactions for which EUR 870 million were credited to income in that year. In July the Group offered the holders of certain securities issued by Santander UK plc the possibility of exchanging these securities for newly-issued Santander UK plc securities; in August Banco Santander, S.A. and Santander Financial Exchanges Limited invited the holders of securities of various issues of Santander Finance Preferred, S.A. (Sole-Shareholder Company), Santander Perpetual, S.A. (Sole-Shareholder Company) and Santander Issuances, S.A. (Sole-Shareholder Company) to submit offers for the sale of their securities, to be purchased in cash; in February Banco Español de Crédito, S.A. offered the holders of preference shares of various issues the possibility of exchanging these securities for securities of a new non-convertible bond issue and in September it offered the holders of securities of various issues to submit an offer for the sale of their securities, to be purchased in cash.
| b) | Financial assets and liabilities at fair value through profit or loss |
The detail of the amount of the asset balances is as follows:
| Millions of euros | ||||||||||||
| 2014 | 2013 | 2012 | ||||||||||
| Loans and advances to credit institutions |
30,407 | 18,947 | 20,115 | |||||||||
| Loans and advances to customers |
11,892 | 18,275 | 23,098 | |||||||||
| Debt instruments |
58,605 | 44,716 | 46,561 | |||||||||
| Equity instruments |
13,799 | 5,833 | 6,180 | |||||||||
| Derivatives |
76,858 | 58,899 | 110,319 | |||||||||
|
|
|
|
|
|
|
|||||||
| 191,561 | 146,670 | 206,273 | ||||||||||
|
|
|
|
|
|
|
|||||||
The Group mitigates and reduces this exposure as follows:
| • | With respect to derivatives, the Group has entered into framework agreements with a large number of credit institutions and customers for the netting-off of asset positions and the provision of collateral for non-payment. |
At December 31, 2014, the actual credit risk exposure of the derivatives was EUR 42,761 million.
| • | Loans and advances to credit institutions and Loans and advances to customers included reverse repos amounting to EUR 32,935 million at December 31, 2014. |
Also, mortgage-backed assets totaled EUR 2,659 million.
| • | Debt instruments include EUR 48,263 million of Spanish and foreign government securities. |
At December 31, 2014, the amount of the change in the year in the fair value of financial assets at fair value through profit or loss attributable to variations in their credit risk (spread) was not material.
F-188
Table of Contents
The detail of the amount of the liability balances is as follows:
| Millions of euros | ||||||||||||
| 2014 | 2013 | 2012 | ||||||||||
| Deposits from central banks |
(8,362 | ) | (5,963 | ) | (2,142 | ) | ||||||
| Deposits from credit institutions |
(24,570 | ) | (17,112 | ) | (19,154 | ) | ||||||
| Customer deposits |
(38,671 | ) | (34,984 | ) | (37,535 | ) | ||||||
| Marketable debt securities |
(3,830 | ) | (4,087 | ) | (4,905 | ) | ||||||
| Short positions |
(17,628 | ) | (15,951 | ) | (15,181 | ) | ||||||
| Derivatives |
(79,048 | ) | (58,887 | ) | (109,743 | ) | ||||||
|
|
|
|
|
|
|
|||||||
| (172,109 | ) | (136,984 | ) | (188,660 | ) | |||||||
|
|
|
|
|
|
|
|||||||
| 45. | Exchange differences |
Exchange differences shows basically the gains or losses on currency dealings, the differences that arise on translations of monetary items in foreign currencies to the functional currency, and those disclosed on non-monetary assets in foreign currency at the time of their disposal.
| 46. | Other operating income and Other operating expenses |
Other operating income and Other operating expenses in the consolidated income statements include:
| Millions of euros | ||||||||||||
| 2014 | 2013 | 2012 | ||||||||||
| Insurance activity |
137 | 117 | 593 | |||||||||
| Income from insurance and reinsurance contracts issued |
3,532 | 4,724 | 5,541 | |||||||||
| Of which: |
||||||||||||
| Insurance and reinsurance premium income |
3,284 | 4,513 | 4,667 | |||||||||
| Reinsurance income (Note 15) |
248 | 211 | 874 | |||||||||
| Expenses of insurance and reinsurance contracts |
(3,395 | ) | (4,607 | ) | (4,948 | ) | ||||||
| Of which: |
||||||||||||
| Claims paid and other insurance-related expenses |
(3,800 | ) | (4,497 | ) | (4,440 | ) | ||||||
| Net provisions for insurance contract liabilities |
910 | 382 | (323 | ) | ||||||||
| Reinsurance premiums paid |
(505 | ) | (492 | ) | (185 | ) | ||||||
| Non-financial services |
88 | 93 | 137 | |||||||||
| Sales and income from the provision of non-financial services |
343 | 322 | 369 | |||||||||
| Cost of sales |
(255 | ) | (229 | ) | (232 | ) | ||||||
| Other operating income and expenses |
(384 | ) | (512 | ) | (644 | ) | ||||||
| Other operating income |
1,339 | 857 | 783 | |||||||||
| Of which, fees and commissions offsetting direct costs |
106 | 115 | 130 | |||||||||
| Other operating expenses |
(1,723 | ) | (1,369 | ) | (1,427 | ) | ||||||
| Of which, Deposit Guarantee Fund |
(577 | ) | (570 | ) | (554 | ) | ||||||
|
|
|
|
|
|
|
|||||||
| (159 | ) | (302 | ) | 86 | ||||||||
|
|
|
|
|
|
|
|||||||
Most of the Bank’s insurance activity is carried on in life insurance.
F-189
Table of Contents
| 47. | Personnel expenses |
| a) | Breakdown |
The detail of Personnel expenses is as follows:
| Millions of euros | ||||||||||||
| 2014 | 2013 | 2012 | ||||||||||
| Wages and salaries |
7,412 | 7,215 | 7,343 | |||||||||
| Social security costs |
1,293 | 1,296 | 1,353 | |||||||||
| Additions to provisions for defined benefit pension plans (Note 25) |
75 | 88 | 145 | |||||||||
| Contributions to defined contribution pension funds (Note 25) |
247 | 223 | 155 | |||||||||
| Share-based remuneration costs |
66 | 103 | 133 | |||||||||
| Of which, Bank directors (*) |
— | 1 | 4 | |||||||||
| Other staff costs |
1,149 | 1,144 | 1,177 | |||||||||
|
|
|
|
|
|
|
|||||||
| 10,242 | 10,069 | 10,306 | ||||||||||
|
|
|
|
|
|
|
|||||||
| (*) | Relating to amounts associated with the performance share plans |
| b) | Headcount |
The average number of employees in the Group, by professional category, was as follows:
| Average number of employees (**) | ||||||||||||
| 2014 | 2013 | 2012 | ||||||||||
| The Bank (**): |
||||||||||||
| Senior management (**) |
101 | 133 | 96 | |||||||||
| Other line personnel |
21,376 | 23,403 | 16,545 | |||||||||
| Clerical staff |
2,563 | 3,421 | 2,845 | |||||||||
| General services personnel |
25 | 28 | 29 | |||||||||
|
|
|
|
|
|
|
|||||||
| 24,065 | 26,985 | 19,515 | ||||||||||
| Banesto (**) |
— | — | 8,762 | |||||||||
| Rest of Spain |
6,781 | 6,931 | 6,708 | |||||||||
| Santander UK plc |
19,866 | 19,773 | 20,355 | |||||||||
| Banco Santander (Brasil) S.A. |
47,296 | 51,462 | 53,543 | |||||||||
| Other companies (***) |
85,930 | 81,222 | 79,752 | |||||||||
|
|
|
|
|
|
|
|||||||
| 183,938 | 186,373 | 188,635 | ||||||||||
|
|
|
|
|
|
|
|||||||
| (*) | Categories of deputy assistant executive vice president and above, including senior management. |
| (**) | Banesto employees have been included under Banco Santander, S.A. since the merger in 2013 (see Note 3.b.vi). |
| (***) | Excluding personnel assigned to discontinued operations. |
F-190
Table of Contents
The functional breakdown, by gender, at December 31, 2014 is as follows:
| Functional breakdown by gender | ||||||||||||||||||||||||
| Senior executives | Other executives | Other personnel | ||||||||||||||||||||||
| Men | Women | Men | Women | Men | Women | |||||||||||||||||||
| Continental Europe |
995 | 217 | 5,844 | 2,841 | 21,470 | 28,599 | ||||||||||||||||||
| United Kingdom |
170 | 39 | 1,166 | 508 | 9,315 | 13,511 | ||||||||||||||||||
| Latin America |
675 | 129 | 5,834 | 3,496 | 37,794 | 52,802 | ||||||||||||||||||
|
|
|
|
|
|
|
|
|
|
|
|
|
|||||||||||||
| 1,840 | 385 | 12,844 | 6,845 | 68,579 | 94,912 | |||||||||||||||||||
|
|
|
|
|
|
|
|
|
|
|
|
|
|||||||||||||
The same information, expressed in percentage terms at December 31, 2014, is as follows:
| Functional breakdown by gender | ||||||||||||||||||||||||
| Senior executives | Other executives | Other personnel | ||||||||||||||||||||||
| Men | Women | Men | Women | Men | Women | |||||||||||||||||||
| Continental Europe |
82 | % | 18 | % | 67 | % | 33 | % | 43 | % | 57 | % | ||||||||||||
| United Kingdom |
81 | % | 19 | % | 70 | % | 30 | % | 41 | % | 59 | % | ||||||||||||
| Latin America |
84 | % | 16 | % | 63 | % | 37 | % | 42 | % | 58 | % | ||||||||||||
|
|
|
|
|
|
|
|
|
|
|
|
|
|||||||||||||
| 83 | % | 17 | % | 65 | % | 35 | % | 42 | % | 58 | % | |||||||||||||
|
|
|
|
|
|
|
|
|
|
|
|
|
|||||||||||||
The labor relations between employees and the various Group companies are governed by the related collective agreements or similar regulations.
| c) | Share-based payments |
The main share-based payments granted by the Group in force at December 31, 2014, 2013 and 2012 are described below.
i. Bank
The variable remuneration policy for the Bank’s executive directors and certain executive personnel of the Bank and of other Group companies includes Bank share-based payments, the implementation of which requires, in conformity with the law and the Bank’s Bylaws, specific resolutions to be adopted by the general meeting.
Were it necessary or advisable for legal, regulatory or other similar reasons, the delivery mechanisms described below may be adapted in specific cases without altering the maximum number of shares linked to the plan or the essential conditions to which the delivery thereof is subject. These adaptations may involve replacing the delivery of shares with the delivery of cash amounts of an equal value.
The plans that include share-based payments are as follows: (i) performance share plan; (ii) obligatory investment share plan; (iii) deferred conditional delivery share plan; (iv) deferred conditional variable remuneration plan and (v) performance share plan. The characteristics of the plans are set forth below:
F-191
Table of Contents
(i) Performance share plan
This deferred share-based variable remuneration was instrumented through a multiannual incentive plan payable in shares of the Bank. The beneficiaries of the plan were the executive directors and other members of senior management, together with any other Group executives determined by the board of directors or, when delegated by it, the executive committee, except for Plan PI14 (approved in 2011), of which the executive directors and senior executives who participated in the deferred conditional variable remuneration plan were not beneficiaries.
This plan involved successive three-year cycles of share deliveries to the beneficiaries. In June 2009, 2010 and 2011 the fourth, fifth and sixth and final cycles (PI12, PI13 and Pl14, respectively) were approved. On July 31, 2012, 2013 and 2014 the fourth, fifth and sixth cycles (PI12, PI13 and PI14, respectively) were cancelled.
For each cycle a maximum number of shares was established for each beneficiary who remained in the Group’s employ for the duration of the plan. The target, which, if met, would determine the number of shares to be delivered, was defined by comparing the Total Shareholder Return (TSR) performance of the shares of Banco Santander, S.A. with the TSR of a benchmark group of financial institutions.
The ultimate number of shares to be delivered in the aforementioned cycles was determined by the degree of achievement of the targets on the third anniversary of commencement of each cycle, and the shares would be delivered within a maximum period of seven months from the beginning of the year in which the corresponding cycle ended.
Plan PI14 expired in 2014, without any shares having been delivered to the plan beneficiaries, since the minimum target for shares to be delivered was not achieved.
Following is a summary of the changes in the cycles of this plan in the period from 2012 to 2014:
| Number of shares (thousands) |
Year granted |
Employee group |
Number of persons |
Date of commencement of exercise period |
Date of expiry of exercise period |
|||||||||||||||||||
| Plans outstanding at 01/01/12 |
54,766 | |||||||||||||||||||||||
|
|
|
|||||||||||||||||||||||
| Shares delivered (Plan I12) |
(5,056 | ) | 2009 | Executives | (5,749 | ) | 06/19/09 | 07/31/12 | ||||||||||||||||
| Options cancelled, net (Plan I12) |
(13,811 | ) | 2009 | Executives | (761 | ) | 06/19/09 | 07/31/12 | ||||||||||||||||
| Options cancelled, net (Plan I14) |
(1,810 | ) | 2011 | Executives | (199 | ) | 06/17/11 | 07/31/14 | ||||||||||||||||
|
|
|
|||||||||||||||||||||||
| Plans outstanding at 12/31/12 |
34,089 | |||||||||||||||||||||||
|
|
|
|||||||||||||||||||||||
| Options cancelled, net (Plan I13) |
(19,613 | ) | 2010 | Executives | (6,782 | ) | 06/11/10 | 07/31/13 | ||||||||||||||||
|
|
|
|||||||||||||||||||||||
| Plans outstanding at 12/31/13 |
14,476 | |||||||||||||||||||||||
|
|
|
|||||||||||||||||||||||
| Options cancelled, net (Plan I14) |
(14,476 | ) | 2011 | Executives | (6,699 | ) | 06/17/11 | 07/31/14 | ||||||||||||||||
|
|
|
|||||||||||||||||||||||
| Plans outstanding at 12/31/14 |
— | |||||||||||||||||||||||
|
|
|
|||||||||||||||||||||||
| (ii) | Obligatory investment share plan |
This deferred share-based variable remuneration was instrumented through a multiannual incentive plan payable in shares of the Bank and conditional upon compliance with certain investment and continued Group service requirements. The beneficiaries of this plan were the executive directors, members of the Bank’s senior management and other Group executives determined by the board of directors.
This plan, which was discontinued in 2010, was structured in three-year cycles. The beneficiaries of the plan had to use 10% of their gross annual variable cash-based remuneration (or bonus) to acquire shares of the Bank in the market (the “Obligatory Investment”). In accordance with the terms and conditions of the corresponding cycles, the Obligatory Investments were made before February 29, 2008, February 28, 2009 and February 28, 2010, respectively.
F-192
Table of Contents
Participants who held the shares acquired through the Obligatory Investment and remained in the Group’s employ for three years from the date on which the Obligatory Investment was made (until 2011, 2012 and 2013, respectively) were entitled to receive the same number of Bank shares as that composing their initial obligatory investment.
The shares would be delivered within a maximum period of one month from the third anniversary of the date on which the obligatory investment was made.
In 2009 a requirement was introduced for the third cycle additional to that of remaining in the Group’s employ, which was that in the three-year period from the investment in the shares, none of the following circumstances should occur: (i) poor financial performance of the Group; (ii) breach by the beneficiary of the codes of conduct or other internal regulations, including, in particular, those relating to risks, where applicable to the executive in question; or (iii) material restatement of the Group’s financial statements, except when it was required pursuant to a change in accounting standards.
This plan was cancelled with the delivery of the shares of the third cycle in March 2013.
(iii) Deferred conditional delivery share plan
In 2012 and 2013 the Bank’s board of directors, at the proposal of the appointments and remuneration committee, approved the third and fourth cycles of the deferred conditional delivery share plan to instrument payment of the share-based bonus of the Group executives or employees whose variable remuneration or annual bonus for 2012 and 2013, respectively, exceeded, in general, EUR 0.3 million (gross), with a view to deferring a portion of the aforementioned variable remuneration or bonus over a period of three years in which it will be paid in Santander shares. Since these cycles entailed the delivery of Bank shares, the shareholders at the annual general meetings of March 30, 2012 and March 22, 2013 approved, respectively, the application of the third and fourth cycles of the deferred conditional delivery share plan. These cycles are not applicable to the executive directors or other members of senior management or other executives who are beneficiaries of the deferred conditional variable remuneration plan described below.
The share-based bonus is deferred over three years and will be paid, where appropriate, in three instalments starting in the first year. The amount in shares is calculated based on the tranches of the following scale established by the board of directors on the basis of the gross variable cash-based remuneration or annual bonus for the year:
| Benchmark bonus |
Percentage (deferred) |
|||
| 300 or less |
0 | % | ||
| 300 to 600 (inclusive) |
20 | % | ||
| More than 600 |
30 | % | ||
The condition for accrual of the share-based deferred remuneration was, in addition to that of the beneficiary remaining in the Group’s employ, with the exceptions envisaged in the plan regulations, that none of the following circumstances should occur in the period prior to each of the deliveries: (i) poor financial performance of the Group; (ii) breach by the beneficiary of internal regulations, including, in particular, those relating to risks; (iii) material restatement of the Group’s financial statements, except when it is required pursuant to a change in accounting standards; or (iv) significant changes in the Group’s economic capital or risk profile.
F-193
Table of Contents
(iv) Deferred conditional variable remuneration plan
In 2012, 2013 and 2014 the Bank’s board of directors, at the proposal of the appointments and remuneration committee, approved the second, third and fourth cycles of the deferred conditional variable remuneration plan to instrument payment of the bonus for 2012, 2013 and 2014, respectively, of the executive directors and certain executives (including senior management) and employees who assume risk, who perform control functions or receive an overall remuneration which puts them on the same remuneration level as senior executives and employees who assume risks (all of whom are referred to as the “Identified Staff”, in accordance with the Guidelines on Remuneration Policies and Practices approved by the Committee of European Banking Supervisors on December 10, 2010 and, since 2014, pursuant to Article 92(2) of Directive 2013/36/EU of the European Parliament and of the Council, of June 26, 2013, and the related implementing legislation).
Since the aforementioned cycles entail the delivery of Bank shares, the shareholders at the annual general meetings of March 30, 2012, March 22, 2013 and March 28, 2014 approved, respectively, the application of the second, third and fourth cycles of the deferred conditional variable remuneration plan.
The purpose of these cycles is to defer a portion of the bonus of the beneficiaries thereof over a period of three years for it to be paid, where appropriate, in cash and in Santander shares; the other portion of the variable remuneration is also to be paid in cash and Santander shares, upon commencement of the cycles, in accordance with the rules set forth below.
The bonus will be paid in accordance with the following percentages, based on the timing of the payment and the group to which the beneficiary belongs (the “immediate payment percentage” identifies the portion of the bonus for which payment is not deferred, and the “deferred percentage” identifies the portion of the bonus for which payment is deferred):
| 2014 | ||||||||
| Immediate payment percentage (*) |
Deferred percentage (*) |
|||||||
| Executive directors and members of the Identified Staff with total variable remuneration ³ EUR 2.6 million |
40 | % | 60 | % | ||||
| Division managers, country heads, other executives of the Group with a similar profile and members of the Identified Staff with total variable remuneration ³ EUR 1.8 million (< EUR 2.6 million) |
50 | % | 50 | % | ||||
| Other beneficiaries |
60 | % | 40 | % | ||||
F-194
Table of Contents
| 2012-2013 | ||||||||
| Immediate payment percentage (*) |
Deferred percentage (*) |
|||||||
| Executive directors |
40 | % | 60 | % | ||||
| Division managers and other executives of the Group with a similar profile |
50 | % | 50 | % | ||||
| Other executives subject to supervision |
60 | % | 40 | % | ||||
| (*) | Generally applicable percentages. In some countries deferred percentages may be higher for certain categories of executives, thereby giving rise to lower immediate payment percentages. |
The payment of the deferred percentage of the bonus applicable in each case will be deferred over a period of three years and will be paid in three instalments, within 30 days following the anniversaries of the initial date (the date on which the immediate payment percentage is paid) in 2014, 2015 and 2016 for the second cycle, in 2015, 2016 and 2017 for the third cycle, and in 2016, 2017 and 2018 for the fourth cycle, 50% being paid in cash and 50% in shares, provided that the conditions described below are met.
In addition to the requirement that the beneficiary remains in the Group’s employ, with the exceptions included in the plan regulations, the accrual of the deferred remuneration is conditional upon none of the following circumstances existing -in the opinion of the board of directors following a proposal of the remuneration committee-, during the period prior to each of the deliveries, pursuant to the provisions set forth in each case in the plan regulations: (i) poor financial performance of the Group; (ii) breach by the beneficiary of internal regulations, including, in particular, those relating to risks; (iii) material restatement of the Group’s financial statements, except when it is required pursuant to a change in accounting standards; or (iv) significant changes in the Group’s economic capital or risk profile.
On each delivery, the beneficiaries will be paid an amount in cash equal to the dividends paid on the deferred amount in shares and the interest on the amount accrued in cash. If the Santander Dividendo Elección scrip dividend scheme is applied, they will be paid the price offered by the Bank for the bonus share rights corresponding to those shares.
The maximum number of shares to be delivered is calculated taking into account the amount resulting from applying the applicable taxes and the volume-weighted average prices for the 15 trading sessions prior to the date on which the board of directors approves the bonus for the Bank’s executive directors for 2012, 2013 and 2014 for the second, third and fourth cycle, respectively.
(v) Performance share plan
In 2014 the Bank’s board of directors approved the first cycle of the performance share plan by which to instrument a portion of the variable remuneration of the identified staff, consisting of a long-term incentive (ILP) in shares based on the Bank’s performance over a multiannual period.
Since the aforementioned cycle entails the delivery of Bank shares, the annual general meeting of March 28, 2014 approved the application of the first cycle of the plan.
The maximum amount of the plan and, consequently, the maximum number of shares to which a beneficiary may be entitled under this plan was set at 15% of the beneficiaries’ benchmark bonus.
F-195
Table of Contents
The board of directors, following a proposal of the remuneration committee, has set the amount of the ILP for each beneficiary for 2014. For this purpose, the following percentages were applied to 15% of the beneficiaries’ benchmark bonus in accordance with the relative performance of the Bank’s Total Shareholder Return (TSR) in 2014 compared to a benchmark group:
| Santander’s place in the TSR ranking |
Percentage of maximum shares to be delivered |
|||
| 1st to 8th |
100 | % | ||
| 9th to 12th |
50 | % | ||
| 13th and below |
0 | % | ||
Since the Bank’s TSR was in fourth place, the applicable percentage was 100%.
The agreed-upon amount of the ILP for each beneficiary will be deferred over a period of three years and will be paid, where appropriate, in thirds in June 2016, 2017 and 2018 based on compliance with the multiannual TSR targets. Thus, for each payment date, the board of directors, following a proposal of the remuneration committee, will calculate the amount, where appropriate, to be received by each beneficiary applying to the third of the agreed-upon amount of the ILP for that year the percentage resulting from the following table:
| Santander’s place in the TSR ranking |
Percentage of maximum shares to be delivered |
|||
| 1st to 4th |
100.0 | % | ||
| 5th |
87.5 | % | ||
| 6th |
75.0 | % | ||
| 7th |
62.5 | % | ||
| 8th |
50.0 | % | ||
| 9th and below |
0 | % | ||
For the accrual for 2016, the benchmark TSR will be that accumulated between January 1, 2014 and December 31, 2015, for the accrual for 2017, the benchmark TSR will be that accumulated between January 1, 2014 and December 31, 2016 and for the accrual for 2018, the benchmark TSR will be that accumulated between January 1, 2014 and December 31, 2017.
The shares to be delivered on each ILP payment date, based on based on compliance with the related multiannual TSR target will be conditional, in addition to the requirement that the beneficiary remains in the Group’s employ, with the exceptions included in the plan regulations, upon none of the following circumstances existing -in the opinion of the board of directors following a proposal of the remuneration committee-, during the period prior to each of the deliveries, as a consequence of actions performed in 2014: (i) poor financial performance of the Group; (ii) breach by the beneficiary of internal regulations, including, in particular, those relating to risks; (iii) material restatement of the Group’s financial statements, except when it is required pursuant to a change in accounting standards; or (iv) significant changes in the Group’s economic capital or risk profile.
F-196
Table of Contents
ii. Santander UK plc
The long-term incentive plans on shares of the Bank granted by management of Santander UK plc to its employees are as follows:
| Number of shares (in thousands) |
Exercise price in pounds sterling (*) |
Year granted |
Employee group |
Number of persons |
Date of commencement of exercise period |
Date of expiry of exercise period |
||||||||||||||||||||||
| Plans outstanding at 01/01/12 |
11,273 | |||||||||||||||||||||||||||
|
|
|
|||||||||||||||||||||||||||
| Options granted (Sharesave) |
10,012 | 3.66 | 2012 | Employees | 7,089 | (**) | 11/01/12 | 11/01/15 | ||||||||||||||||||||
| 11/01/12 | 11/01/17 | |||||||||||||||||||||||||||
| Options exercised |
(3 | ) | 4.56 | |||||||||||||||||||||||||
| Options cancelled (net) or not exercised |
(6,468 | ) | 5.34 | |||||||||||||||||||||||||
|
|
|
|||||||||||||||||||||||||||
| Plans outstanding at 12/31/12 |
14,814 | |||||||||||||||||||||||||||
|
|
|
|||||||||||||||||||||||||||
| Options granted (Sharesave) |
4,340 | 3.69 | 2013 | Employees | 13,110 | (**) | 11/01/13 | 11/01/16 | ||||||||||||||||||||
| 11/01/13 | 11/01/18 | |||||||||||||||||||||||||||
| Options exercised |
(78 | ) | 4.02 | |||||||||||||||||||||||||
| Options cancelled (net) or not exercised |
(3,169 | ) | 4.72 | |||||||||||||||||||||||||
|
|
|
|||||||||||||||||||||||||||
| Plans outstanding at 12/31/13 |
15,907 | |||||||||||||||||||||||||||
|
|
|
|||||||||||||||||||||||||||
| Options granted (Sharesave) |
6,745 | 4.91 | 2014 | Employees | 6,639 | (**) | 11/01/14 | 11/01/17 | ||||||||||||||||||||
| 11/01/14 | 11/01/19 | |||||||||||||||||||||||||||
| Options exercised |
(1,375 | ) | 4.36 | |||||||||||||||||||||||||
| Options cancelled (net) or not exercised |
(2,155 | ) | 4.85 | |||||||||||||||||||||||||
|
|
|
|||||||||||||||||||||||||||
| Plans outstanding at 12/31/14 |
19,122 | |||||||||||||||||||||||||||
|
|
|
|||||||||||||||||||||||||||
| (*) | At December 31, 2014, 2013 and 2012, the euro/pound sterling exchange rate was EUR 1.28386/GBP 1; EUR 1.19947/GBP 1 and EUR 1.22534/GBP 1, respectively. |
| (**) | Number of accounts/contracts. A single employee may have more than one account/contract. |
In 2008 the Group launched a voluntary savings scheme for Santander UK employees (Sharesave Scheme) whereby employees who join the scheme will have between GBP 5 and GBP 250 (between GBP 5 and GBP 500 in 2014) deducted from their net monthly pay over a period of three or five years. When this period has ended, the employees may use the amount saved to exercise options on shares of the Bank at an exercise price calculated by reducing by up to 20% the average purchase and sale prices of the Bank shares in the three trading sessions prior to the approval of the scheme by the UK tax authorities (HMRC). This approval must be received within 21 to 41 days following the publication of the Group’s results for the first half of the year. This scheme was approved by the board of directors, at the proposal of the appointments and remuneration committee, and, since it involved the delivery of Bank shares, its application was authorized by the annual general meeting held on June 21, 2008. Also, the scheme was authorized by the UK tax authorities (HMRC) and commenced in September 2008. In the subsequent years, at the annual general meetings held on June 19, 2009, June 11, 2010, June 17, 2011, March 30, 2012, March 22, 2013 and March 28, 2014, respectively, the shareholders approved the application of schemes previously approved by the board and with similar features to the scheme approved in 2008.
F-197
Table of Contents
iii. Fair value
The fair value of the performance share plans was calculated as follows:
| • | It was assumed that the beneficiaries will not leave the Group’s employ during the term of each plan. |
| • | The fair value of the Bank’s relative TSR position was calculated, on the grant date, on the basis of the report of an independent expert whose assessment was carried out using a Monte Carlo valuation model to perform 10,000 simulations to determine the TSR of each of the companies in the benchmark group, taking into account the variables set forth below. The results (each of which represents the delivery of a number of shares) are classified in decreasing order by calculating the weighted average and discounting the amount at the risk-free interest rate. |
| PI12 | PI13 | PI14 | ||||||||||
| Expected volatility (*) |
42.36 | % | 49.65 | % | 51.35 | % | ||||||
| Annual dividend yield based on last few years |
4.88 | % | 6.34 | % | 6.06 | % | ||||||
| Risk-free interest rate (Treasury Bond yield (zero coupon) over the period of the plan) |
2.04 | % | 3.33 | % | 4.073 | % | ||||||
| (*) | Calculated on the basis of historical volatility over the corresponding period (three years). |
The application of the simulation model results in a percentage value of 55.42% for Plan I-12, 62.62% for Plan I13 and 55.39% for Plan l14. Since this valuation refers to a market condition, it cannot be adjusted after the grant date.
The fair value of each option granted by Santander UK was estimated at the grant date using a European/American Partial Differential Equation model with the following assumptions:
| 2014 | 2013 | 2012 | ||||
| Risk-free interest rate |
1.56%-1.97% | 1.2%-1.7% | 0.73%-1.04% | |||
| Dividend increase |
10.16%-10.82% | 16%-19% | 16%-17% | |||
| Volatility of underlying shares based on historical volatility over five years |
24.16%-24.51% | 32.15%-32.32% | 38.62%-39.41% | |||
| Expected life of options granted |
3 and 5 years | 3 and 5 years | 3 and 5 years | |||
F-198
Table of Contents
| 48. | Other general administrative expenses |
| a) | Breakdown |
The detail of Other general administrative expenses is as follows:
| Millions of euros | ||||||||||||
| 2014 | 2013 | 2012 | ||||||||||
| Property, fixtures and supplies |
1,930 | 1,980 | 1,916 | |||||||||
| Technology and systems |
979 | 992 | 889 | |||||||||
| Advertising |
655 | 630 | 662 | |||||||||
| Technical reports |
606 | 493 | 491 | |||||||||
| Communications |
489 | 519 | 638 | |||||||||
| Taxes other than income tax |
462 | 445 | 415 | |||||||||
| Surveillance and cash courier services |
397 | 425 | 432 | |||||||||
| Per diems and travel expenses |
287 | 284 | 297 | |||||||||
| Insurance premiums |
64 | 59 | 61 | |||||||||
| Other administrative expenses |
1,788 | 1,556 | 1,694 | |||||||||
|
|
|
|
|
|
|
|||||||
| 7,657 | 7,383 | 7,495 | ||||||||||
|
|
|
|
|
|
|
|||||||
| b) | Technical reports and other |
Technical reports includes the fees paid by the various Group companies (detailed in the accompanying Appendices) for the services provided by their respective auditors, the detail being as follows:
| Millions of euros | ||||||||||||
| 2014 | 2013 | 2012 | ||||||||||
| Audit fees |
44.2 | 35.9 | 38.1 | |||||||||
| Audit-related fees |
31.1 | 20.8 | 20.6 | |||||||||
| Tax fees |
6.6 | 4.6 | 4.3 | |||||||||
| All other fees |
8.0 | 6.5 | 8.1 | |||||||||
|
|
|
|
|
|
|
|||||||
| Total |
89.9 | 67.8 | 71.1 | |||||||||
|
|
|
|
|
|
|
|||||||
F-199
Table of Contents
The detail of the main items included in Audit fees is as follows:
| Millions of euros | ||||||||||||
| 2014 | 2013 | 2012 | ||||||||||
| Audit of the financial statements of the companies audited by Deloitte |
28.3 | 21.7 | 21.0 | |||||||||
| Of which: |
||||||||||||
| Santander UK plc |
5.8 | 5.0 | 4.4 | |||||||||
| Santander Holdings USA, Inc./Santander Consumer USA Holdings Inc. |
5.7 | 2.4 | 2.2 | |||||||||
| Banco Santander (Brasil) S.A. |
1.8 | 1.7 | 1.8 | |||||||||
| Audit of the Bank’s separate and consolidated financial statements |
2.1 | 2.1 | 2.0 | |||||||||
| Other audit engagements |
15.9 | 14.2 | 17.1 | |||||||||
| Of which: |
||||||||||||
| Internal control audit (SOX) and capital audit (Basel) |
6.9 | 5.9 | 5.8 | |||||||||
| Audit of the Group’s half-yearly financial statements |
6.0 | 6.0 | 5.8 | |||||||||
| Issue of comfort letters |
3.0 | 2.3 | 2.5 | |||||||||
|
|
|
|
|
|
|
|||||||
| Audit fees |
44.2 | 35.9 | 38.1 | |||||||||
|
|
|
|
|
|
|
|||||||
The detail of the main items included in Audit-related fees is as follows:
| Millions of euros | ||||||||||||
| 2014 | 2013 | 2012 | ||||||||||
| Other recurring engagements and reports required by the various national supervisory bodies of the countries in which the Group operates |
8.8 | 7.6 | 6.7 | |||||||||
| Limited reviews and other reports required by the Group due to its listing in Brazil |
5.3 | — | — | |||||||||
| Non-recurring reviews required by regulators |
0.6 | 1.1 | 2.1 | |||||||||
| Due diligence audits and other reviews |
1.7 | 3.1 | 1.8 | |||||||||
| Issuance of other attest reports |
4.0 | 3.7 | 2.8 | |||||||||
| Reviews of procedures, data and controls and other checks |
10.7 | 5.3 | 7.2 | |||||||||
|
|
|
|
|
|
|
|||||||
| Total audit-related fees |
31.1 | 20.8 | 20.6 | |||||||||
|
|
|
|
|
|
|
|||||||
F-200
Table of Contents
Other information
The services performed by the Group’s auditors meet the independence requirements stipulated by the Consolidated Audit Law (Legislative Royal Decree 1/2011, of July 31) and by the U.S. Securities and Exchange Commission (SEC) and Public Accounting Oversight Board (PCAOB), and they did not involve the performance of any work that is incompatible with the audit function.
Lastly, the Group commissioned services from audit firms other than Deloitte amounting to EUR 97.3 million in 2014 (2013: EUR 48.6 million; 2012: EUR 38.7 million).
| 49. | Gains/(losses) on disposal of assets not classified as non-current assets held for sale |
The detail of Gains/(losses) on disposal of assets not classified as non-current assets held for sale is as follows:
| Millions of euros | ||||||||||||
| 2014 | 2013 | 2012 | ||||||||||
| Gains: |
||||||||||||
| On disposal of tangible assets (*) |
216 | 74 | 219 | |||||||||
| On disposal of investments |
3,026 | 2,167 | 775 | |||||||||
| Of which: |
||||||||||||
| Santander Consumer USA (Note 3) |
1,739 | — | — | |||||||||
| Altamira Asset Management (Note 3) |
550 | — | — | |||||||||
| Insurance companies in Ireland (Note 3) |
413 | — | — | |||||||||
| Management companies (Note 3) |
— | 1,372 | — | |||||||||
| Insurance companies in Spain (Note 3) |
— | 385 | — | |||||||||
| Payment services company (Note 3) |
— | 122 | — | |||||||||
| Banco Santander Colombia (Note 3) |
— | — | 619 | |||||||||
|
|
|
|
|
|
|
|||||||
| 3,242 | 2,241 | 994 | ||||||||||
|
|
|
|
|
|
|
|||||||
| Losses: |
||||||||||||
| On disposal of tangible assets |
(103 | ) | (78 | ) | (87 | ) | ||||||
| On disposal of investments |
(3 | ) | (11 | ) | (1 | ) | ||||||
|
|
|
|
|
|
|
|||||||
| (106 | ) | (89 | ) | (88 | ) | |||||||
|
|
|
|
|
|
|
|||||||
| 3,136 | 2,152 | 906 | ||||||||||
|
|
|
|
|
|
|
|||||||
| (*) | Includes in 2014 mainly the gains recognized on the sale of corporate buildings in Mexico and Argentina (EUR 85 million) and the gains arising from the sales of branches (EUR 76 million) in various countries in which the Group operates. Includes in 2012 the gains recognized on the sale of the Canalejas complex (Spain) (EUR 87 million), of certain branches and offices in Mexico (EUR 80 million) and of a property in New York (EUR 47 million). |
F-201
Table of Contents
| 50. | Gains/(losses) on non-current assets held for sale not classified as discontinued operations |
The detail of Gains/(losses) on non-current assets held for sale not classified as discontinued operations is as follows:
| Millions of euros | ||||||||||||
| Net balance |
2014 | 2013 | 2012 | |||||||||
| Non-current assets held for sale |
(291 | ) | (422 | ) | (757 | ) | ||||||
| Impairment (Note 12) |
(339 | ) | (335 | ) | (449 | ) | ||||||
| Gain (loss) on sale (Note 12) |
48 | (87 | ) | (308 | ) | |||||||
| Other gains and other losses |
48 | — | — | |||||||||
|
|
|
|
|
|
|
|||||||
| (243 | ) | (422 | ) | (757 | ) | |||||||
|
|
|
|
|
|
|
|||||||
| 51. | Other disclosures |
| a) | Residual maturity periods and average interest rates |
The detail, by maturity, of the balances of certain items in the consolidated balance sheet is as follows:
| December 31, 2014 | ||||||||||||||||||||||||||||||||||||
| Millions of euros | Average interest rate |
|||||||||||||||||||||||||||||||||||
| On demand | Within 1 month |
1 to 3 months |
3 to 12 months |
1 to 3 years | 3 to 5 years | More than 5 years |
Total | |||||||||||||||||||||||||||||
| Assets: |
||||||||||||||||||||||||||||||||||||
| Cash and balances with central banks |
46,521 | 17,667 | 4,060 | 518 | — | 645 | 17 | 69,428 | 3.21 | % | ||||||||||||||||||||||||||
| Available-for-sale financial assets- |
||||||||||||||||||||||||||||||||||||
| Debt instruments |
154 | 3,878 | 1,098 | 4,528 | 19,811 | 24,363 | 56,417 | 110,249 | 4.62 | % | ||||||||||||||||||||||||||
| Loans and receivables- |
||||||||||||||||||||||||||||||||||||
| Loans and advances to credit institutions |
18,270 | 16,481 | 3,285 | 4,951 | 3,738 | 317 | 4,264 | 51,306 | 2.11 | % | ||||||||||||||||||||||||||
| Loans and advances to customers |
17,095 | 41,520 | 31,093 | 67,627 | 97,744 | 80,123 | 387,617 | 722,819 | 5.45 | % | ||||||||||||||||||||||||||
| Debt instruments |
14 | 1,422 | 1,180 | 947 | 858 | 554 | 2,535 | 7,510 | 3.66 | % | ||||||||||||||||||||||||||
|
|
|
|
|
|
|
|
|
|
|
|
|
|
|
|
|
|
|
|||||||||||||||||||
| 82,054 | 80,968 | 40,716 | 78,571 | 122,151 | 106,002 | 450,850 | 961,312 | 5.00 | % | |||||||||||||||||||||||||||
|
|
|
|
|
|
|
|
|
|
|
|
|
|
|
|
|
|
|
|||||||||||||||||||
| Liabilities: |
||||||||||||||||||||||||||||||||||||
| Financial liabilities at amortized cost: |
||||||||||||||||||||||||||||||||||||
| Deposits from central banks |
4,614 | 2,703 | 1,179 | 500 | — | 8,294 | — | 17,290 | 0.24 | % | ||||||||||||||||||||||||||
| Deposits from credit institutions |
7,390 | 24,596 | 23,238 | 19,154 | 18,546 | 5,995 | 6,228 | 105,147 | 3.16 | % | ||||||||||||||||||||||||||
| Customer deposits |
347,108 | 79,128 | 28,570 | 66,632 | 56,359 | 8,629 | 22,530 | 608,956 | 2.50 | % | ||||||||||||||||||||||||||
| Marketable debt securities (*) |
54 | 10,802 | 22,847 | 35,913 | 49,978 | 22,457 | 51,008 | 193,059 | 3.50 | % | ||||||||||||||||||||||||||
| Subordinated liabilities |
114 | 24 | 15 | 109 | 3,699 | 5,458 | 7,713 | 17,132 | 6.46 | % | ||||||||||||||||||||||||||
| Other financial liabilities |
4,131 | 4,145 | 8,265 | 942 | 465 | 447 | 1,073 | 19,468 | n/a | |||||||||||||||||||||||||||
|
|
|
|
|
|
|
|
|
|
|
|
|
|
|
|
|
|
|
|||||||||||||||||||
| 363,411 | 121,398 | 84,114 | 123,250 | 129,047 | 51,280 | 88,552 | 961,052 | 2.81 | % | |||||||||||||||||||||||||||
|
|
|
|
|
|
|
|
|
|
|
|
|
|
|
|
|
|
|
|||||||||||||||||||
| Difference (assets less liabilities) |
(281,357 | ) | (40,430 | ) | (43,398 | ) | (44,679 | ) | (6,896 | ) | 54,722 | 362,298 | 260 | |||||||||||||||||||||||
|
|
|
|
|
|
|
|
|
|
|
|
|
|
|
|
|
|||||||||||||||||||||
| (*) | Includes promissory notes, certificates of deposit and other short-term debt issues. |
F-202
Table of Contents
The Group’s net borrowing position with the ECB was EUR 12 thousand million at December 31, 2014, mainly because in 2014 the Group borrowed funds under the ECB’s targeted longer-term refinancing operations (TLTRO) program.
| December 31, 2013 | ||||||||||||||||||||||||||||||||||||
| Millions of euros | Average interest rate |
|||||||||||||||||||||||||||||||||||
| On demand |
Within 1 month |
1 to 3 months |
3 to 12 months |
1 to 3 years | 3 to 5 years | More than 5 years |
Total | |||||||||||||||||||||||||||||
| Assets: |
||||||||||||||||||||||||||||||||||||
| Cash and balances with central banks |
70,303 | 4,565 | 1,410 | 706 | — | — | 119 | 77,103 | 2.53 | % | ||||||||||||||||||||||||||
| Available-for-sale financial assets- |
||||||||||||||||||||||||||||||||||||
| Debt instruments |
200 | 3,034 | 2,194 | 5,100 | 13,243 | 16,965 | 39,108 | 79,844 | 4.60 | % | ||||||||||||||||||||||||||
| Loans and receivables- |
||||||||||||||||||||||||||||||||||||
| Loans and advances to credit institutions |
13,794 | 25,619 | 3,710 | 2,120 | 3,360 | 2,415 | 4,999 | 56,017 | 2.36 | % | ||||||||||||||||||||||||||
| Loans and advances to customers |
13,475 | 45,117 | 28,939 | 70,130 | 88,822 | 67,727 | 336,371 | 650,581 | 5.69 | % | ||||||||||||||||||||||||||
| Debt instruments |
3 | 1,024 | 646 | 1,470 | 1,042 | 283 | 3,418 | 7,886 | 3.01 | % | ||||||||||||||||||||||||||
|
|
|
|
|
|
|
|
|
|
|
|
|
|
|
|
|
|
|
|||||||||||||||||||
| 97,775 | 79,359 | 36,899 | 79,526 | 106,467 | 87,390 | 384,015 | 871,431 | 5.07 | % | |||||||||||||||||||||||||||
|
|
|
|
|
|
|
|
|
|
|
|
|
|
|
|
|
|
|
|||||||||||||||||||
| Liabilities: |
||||||||||||||||||||||||||||||||||||
| Financial liabilities at amortized cost: |
||||||||||||||||||||||||||||||||||||
| Deposits from central banks |
485 | 3,207 | 156 | 312 | 5,628 | — | — | 9,788 | 0.27 | % | ||||||||||||||||||||||||||
| Deposits from credit institutions |
2,756 | 27,665 | 5,578 | 14,436 | 13,106 | 7,837 | 5,156 | 76,534 | 2.18 | % | ||||||||||||||||||||||||||
| Customer deposits |
328,508 | 53,108 | 26,039 | 80,639 | 63,278 | 9,576 | 11,705 | 572,853 | 2.55 | % | ||||||||||||||||||||||||||
| Marketable debt securities (*) |
146 | 8,551 | 17,198 | 27,092 | 53,966 | 20,667 | 43,770 | 171,390 | 3.72 | % | ||||||||||||||||||||||||||
| Subordinated liabilities |
24 | 159 | 2 | 821 | 2,468 | 2,723 | 9,942 | 16,139 | 6.02 | % | ||||||||||||||||||||||||||
| Other financial liabilities |
5,524 | 7,476 | 1,613 | 312 | 486 | 115 | 884 | 16,410 | n/a | |||||||||||||||||||||||||||
|
|
|
|
|
|
|
|
|
|
|
|
|
|
|
|
|
|
|
|||||||||||||||||||
| 337,443 | 100,166 | 50,586 | 123,612 | 138,932 | 40,918 | 71,457 | 863,114 | 2.80 | % | |||||||||||||||||||||||||||
|
|
|
|
|
|
|
|
|
|
|
|
|
|
|
|
|
|
|
|||||||||||||||||||
| Difference (assets less liabilities) |
(239,668 | ) | (20,807 | ) | (13,687 | ) | (44,086 | ) | (32,465 | ) | 46,472 | 312,558 | 8,317 | |||||||||||||||||||||||
|
|
|
|
|
|
|
|
|
|
|
|
|
|
|
|
|
|||||||||||||||||||||
| (*) | Includes promissory notes, certificates of deposit and other short-term debt issues. |
The Group continued to participate on these auctions and deposit at the ECB most of the funds captured, which significantly increased the liquidity buffer and improved its structure by replacing short-term maturities with longer term funding. The Group repaid most of these amounts to the ECB in the first quarter of 2013.
F-203
Table of Contents
| December 31, 2012 | ||||||||||||||||||||||||||||||||||||
| Millions of euros | Average interest rate |
|||||||||||||||||||||||||||||||||||
| On demand |
Within 1 month |
1 to 3 months |
3 to 12 months |
1 to 3 years | 3 to 5 years | More than 5 years |
Total | |||||||||||||||||||||||||||||
| Assets: |
||||||||||||||||||||||||||||||||||||
| Cash and balances with central banks |
68,501 | 45,030 | 2,061 | 2,699 | — | — | 197 | 118,488 | 1.74 | % | ||||||||||||||||||||||||||
| Available-for-sale financial assets- |
||||||||||||||||||||||||||||||||||||
| Debt instruments |
55 | 2,050 | 2,786 | 7,935 | 14,656 | 13,141 | 47,101 | 87,724 | 4.56 | % | ||||||||||||||||||||||||||
| Loans and receivables- |
||||||||||||||||||||||||||||||||||||
| Loans and advances to credit institutions |
11,120 | 26,482 | 3,406 | 3,987 | 1,507 | 753 | 6,530 | 53,785 | 2.37 | % | ||||||||||||||||||||||||||
| Loans and advances to customers |
16,560 | 38,953 | 29,528 | 74,048 | 103,089 | 70,857 | 362,979 | 696,014 | 5.29 | % | ||||||||||||||||||||||||||
| Debt instruments |
3 | 945 | 277 | 527 | 1,541 | 421 | 3,345 | 7,059 | 2.90 | % | ||||||||||||||||||||||||||
|
|
|
|
|
|
|
|
|
|
|
|
|
|
|
|
|
|
|
|||||||||||||||||||
| 96,239 | 113,460 | 38,058 | 89,196 | 120,793 | 85,172 | 420,152 | 963,070 | 4.61 | % | |||||||||||||||||||||||||||
|
|
|
|
|
|
|
|
|
|
|
|
|
|
|
|
|
|
|
|||||||||||||||||||
| Liabilities: |
||||||||||||||||||||||||||||||||||||
| Financial liabilities at amortized cost: |
||||||||||||||||||||||||||||||||||||
| Deposits from central banks |
948 | 4,678 | 1,173 | 1 | 44,138 | — | — | 50,938 | 0.77 | % | ||||||||||||||||||||||||||
| Deposits from credit institutions |
4,611 | 25,839 | 7,863 | 15,958 | 11,845 | 11,076 | 3,540 | 80,732 | 2.81 | % | ||||||||||||||||||||||||||
| Customer deposits |
306,051 | 79,513 | 34,738 | 88,012 | 60,827 | 13,992 | 5,971 | 589,104 | 1.90 | % | ||||||||||||||||||||||||||
| Marketable debt securities (*) |
707 | 13,616 | 13,924 | 44,466 | 54,158 | 27,291 | 46,902 | 201,064 | 3.76 | % | ||||||||||||||||||||||||||
| Subordinated liabilities |
203 | 230 | 280 | 1,226 | 1,377 | 5,169 | 9,753 | 18,238 | 5.45 | % | ||||||||||||||||||||||||||
| Other financial liabilities |
4,101 | 3,309 | 7,403 | 211 | 517 | 339 | 3,365 | 19,245 | n/a | |||||||||||||||||||||||||||
|
|
|
|
|
|
|
|
|
|
|
|
|
|
|
|
|
|
|
|||||||||||||||||||
| 316,621 | 127,185 | 65,381 | 149,874 | 172,862 | 57,867 | 69,531 | 959,321 | 2.38 | % | |||||||||||||||||||||||||||
|
|
|
|
|
|
|
|
|
|
|
|
|
|
|
|
|
|
|
|||||||||||||||||||
| Difference (assets less liabilities) |
(220,382 | ) | (13,725 | ) | (27,323 | ) | (60,678 | ) | (52,069 | ) | 27,305 | 350,621 | 3,749 | |||||||||||||||||||||||
|
|
|
|
|
|
|
|
|
|
|
|
|
|
|
|
|
|||||||||||||||||||||
| (*) | Includes promissory notes, certificates of deposit and other short-term debt issues. |
The detail of the undiscounted contractual maturities of the existing financial liabilities at amortized cost at December 31, 2014 is as follows:
| December 31, 2014 | ||||||||||||||||||||||||||||||||
| Millions of euros | ||||||||||||||||||||||||||||||||
| On demand |
Within 1 month |
1 to 3 months |
3 to 12 months |
1 to 3 years | 3 to 5 years | More than 5 years |
Total | |||||||||||||||||||||||||
| Financial liabilities at amortized cost (*): |
||||||||||||||||||||||||||||||||
| Deposits from central banks |
4,608 | 2,699 | 1,177 | 499 | — | 8,283 | — | 17,267 | ||||||||||||||||||||||||
| Deposits from credit institutions |
7,366 | 24,517 | 23,164 | 19,093 | 18,487 | 5,976 | 6,208 | 104,811 | ||||||||||||||||||||||||
| Customer deposits |
345,290 | 78,714 | 28,421 | 66,283 | 56,063 | 8,584 | 22,412 | 605,766 | ||||||||||||||||||||||||
| Marketable debt securities |
52 | 10,481 | 22,167 | 34,845 | 48,491 | 21,789 | 49,491 | 187,315 | ||||||||||||||||||||||||
| Subordinated liabilities |
105 | 22 | 14 | 100 | 3,406 | 5,025 | 7,101 | 15,774 | ||||||||||||||||||||||||
| Other financial liabilities |
4,131 | 4,145 | 8,265 | 942 | 465 | 447 | 1,073 | 19,468 | ||||||||||||||||||||||||
|
|
|
|
|
|
|
|
|
|
|
|
|
|
|
|
|
|||||||||||||||||
| 361,552 | 120,578 | 83,208 | 121,762 | 126,912 | 50,104 | 86,285 | 950,401 | |||||||||||||||||||||||||
|
|
|
|
|
|
|
|
|
|
|
|
|
|
|
|
|
|||||||||||||||||
| (*) | The analysis of the expiry dates of the derivatives is not broken down because this is not essential to the comprehension of the cash flow schedule, since substantially all of them are subject to netting arrangements with other derivatives held with the same counterparty. |
In the Group’s experience, no outflows of cash or other financial assets take place prior to the contractual maturity date that might affect the information broken down above.
F-204
Table of Contents
| b) | Equivalent euro value of assets and liabilities |
The detail of the main foreign currency balances in the consolidated balance sheet, based on the nature of the related items, is as follows:
| Equivalent value in millions of euros | ||||||||||||||||||||||||
| 2014 | 2013 | 2012 | ||||||||||||||||||||||
| Assets | Liabilities | Assets | Liabilities | Assets | Liabilities | |||||||||||||||||||
| Cash and balances with central banks |
64,839 | — | 71,328 | — | 70,756 | — | ||||||||||||||||||
| Financial assets/liabilities held for trading |
94,375 | 66,011 | 72,888 | 61,473 | 106,813 | 80,893 | ||||||||||||||||||
| Other financial assets at fair value through profit or loss |
7,107 | 15,494 | 9,177 | 9,953 | 10,448 | 10,480 | ||||||||||||||||||
| Available-for-sale financial assets |
65,031 | — | 43,558 | — | 50,144 | — | ||||||||||||||||||
| Loans and receivables |
521,497 | — | 454,791 | — | 466,933 | — | ||||||||||||||||||
| Investments |
1,231 | — | 3,941 | — | 3,336 | — | ||||||||||||||||||
| Tangible assets |
12,479 | — | 5,611 | — | 5,667 | — | ||||||||||||||||||
| Intangible assets |
26,710 | — | 22,422 | — | 24,269 | — | ||||||||||||||||||
| Financial liabilities at amortized cost |
— | 618,936 | — | 526,588 | — | 560,483 | ||||||||||||||||||
| Other |
23,915 | 23,997 | 20,700 | 23,817 | 22,360 | 50,971 | ||||||||||||||||||
|
|
|
|
|
|
|
|
|
|
|
|
|
|||||||||||||
| 817,184 | 724,438 | 704,416 | 621,831 | 760,726 | 702,827 | |||||||||||||||||||
|
|
|
|
|
|
|
|
|
|
|
|
|
|||||||||||||
| c) | Fair value of financial assets and liabilities not measured at fair value |
The financial assets owned by the Group are measured at fair value in the accompanying consolidated balance sheet, except for cash and balances with central banks, loans and receivables, equity instruments whose market value cannot be estimated reliably and derivatives that have these instruments as their underlyings and are settled by delivery thereof.
Similarly, the Group’s financial liabilities -except for financial liabilities held for trading, those measured at fair value and derivatives other than those having as their underlying equity instruments whose market value cannot be estimated reliably- are measured at amortized cost in the accompanying consolidated balance sheet.
F-205
Table of Contents
Following is a comparison of the carrying amounts of the Group’s financial instruments measured at other than fair value and their respective fair values at year-end:
| i) | Financial assets measured at other than fair value |
| Millions of euros | ||||||||||||||||||||||||||||||||||||
| 2014 | 2013 | 2012 | ||||||||||||||||||||||||||||||||||
| Assets |
Carrying amount |
Fair value |
Level 1 | Level 2 | Level 3 | Carrying amount |
Fair value |
Carrying amount |
Fair value |
|||||||||||||||||||||||||||
| Loans and receivables: |
||||||||||||||||||||||||||||||||||||
| Loans and advances to credit institutions |
51,306 | 51,202 | — | 25,660 | 25,542 | 56,017 | 56,213 | 53,785 | 54,397 | |||||||||||||||||||||||||||
| Loans and advances to customers |
722,819 | 727,383 | — | 197,187 | 530,196 | 650,581 | 651,338 | 696,014 | 702,685 | |||||||||||||||||||||||||||
| Debt instruments |
7,510 | 7,441 | — | 6,065 | 1,376 | 7,886 | 7,858 | 7,059 | 7,241 | |||||||||||||||||||||||||||
|
|
|
|
|
|
|
|
|
|
|
|
|
|
|
|
|
|
|
|||||||||||||||||||
| 781,635 | 786,026 | — | 228,912 | 557,114 | 714,484 | 715,409 | 756,858 | 764,323 | ||||||||||||||||||||||||||||
|
|
|
|
|
|
|
|
|
|
|
|
|
|
|
|
|
|
|
|||||||||||||||||||
| ii) | Financial liabilities measured at other than fair value |
| Millions of euros | ||||||||||||||||||||||||||||||||||||
| 2014 | 2013 | 2012 | ||||||||||||||||||||||||||||||||||
| Liabilities |
Carrying amount |
Fair value |
Level 1 | Level 2 | Level 3 | Carrying amount |
Fair value |
Carrying amount |
Fair value |
|||||||||||||||||||||||||||
| Financial liabilities at amortized cost: |
||||||||||||||||||||||||||||||||||||
| Deposits from central banks |
17,290 | 17,290 | — | — | 17,290 | 9,788 | 9,788 | 50,938 | 50,938 | |||||||||||||||||||||||||||
| Deposits from credit institutions |
105,147 | 105,557 | — | 105,557 | — | 76,534 | 76,636 | 80,732 | 81,819 | |||||||||||||||||||||||||||
| Customer deposits |
608,956 | 608,339 | — | — | 608,339 | 572,853 | 570,312 | 589,104 | 590,278 | |||||||||||||||||||||||||||
| Marketable debt securities |
193,059 | 197,093 | 53,925 | 143,168 | — | 171,390 | 170,787 | 201,064 | 204,014 | |||||||||||||||||||||||||||
| Subordinated liabilities |
17,132 | 17,428 | 7,971 | 9,457 | — | 16,139 | 16,342 | 18,238 | 18,356 | |||||||||||||||||||||||||||
| Other financial liabilities |
19,468 | 19,428 | — | — | 19,428 | 16,410 | 16,407 | 19,245 | 19,246 | |||||||||||||||||||||||||||
|
|
|
|
|
|
|
|
|
|
|
|
|
|
|
|
|
|
|
|||||||||||||||||||
| 961,052 | 965,135 | 61,896 | 258,182 | 645,057 | 863,114 | 860,272 | 959,321 | 964,651 | ||||||||||||||||||||||||||||
|
|
|
|
|
|
|
|
|
|
|
|
|
|
|
|
|
|
|
|||||||||||||||||||
F-206
Table of Contents
The main valuation methods and inputs used in the estimates at December 31, 2014 of the fair values of the financial assets and liabilities in the foregoing table were as follows:
| • | Loans and receivables: the fair value was estimated using the present value method. The estimates were made considering factors such as the expected maturity of the portfolio, market interest rates and spreads on newly approved transactions (or market spreads where these were not available). |
| • | Financial liabilities at amortized cost: |
| i) | The fair value of Deposits from central banks was taken to be their carrying amount since they are mainly short-term balances. |
| ii) | Deposits from credit institutions: the fair value was obtained by the present value method using market interest rates and spreads. |
| iii) | Customer deposits: the fair value was estimated using the present value method. The estimates were made considering factors such as the expected maturity of the transactions and the Group’s current cost of funding in similar transactions. |
| iv) | Marketable debt securities and Subordinated liabilities: the fair value was calculated based on market prices for these instruments -when available- or by the present value method using market interest rates and spreads. |
In addition, the fair value of Cash and balances with central banks was taken to be their carrying amount since they are mainly short-term balances.
Lastly, at December 31, 2014, 2013 and 2012, equity instruments amounting to EUR 1,646 million, EUR 1,041 million and EUR 1,290 million, respectively, and recognized as available-for-sale financial assets were measured at cost in the consolidated balance sheet because it was not possible to estimate their fair value reliably, since they related to investments in entities not listed on organized markets and, consequently, the non-observable inputs were significant.
| d) | Exposure of the Group to Europe’s peripheral countries |
The detail at December 31, 2014, 2013 and 2012, by type of financial instrument, of the Group’s sovereign risk exposure to Europe’s peripheral countries and of the short positions held with them, taking into consideration the criteria established by the European Banking Authority (EBA) –explained in Note 54– is as follows:
F-207
Table of Contents
| Sovereign risk by country of issuer/borrower at December 31, 2014 (*) |
||||||||||||||||||||||||||||||||
| Millions of euros | ||||||||||||||||||||||||||||||||
| Debt instruments | Loans and advances to customers (**) |
Total net direct exposure |
Derivatives (***) | |||||||||||||||||||||||||||||
| Financial assets held for trading and Other financial assets at fair value through profit or loss |
Short positions |
Available- for-sale financial assets |
Loans and receivables |
Other than CDSs |
CDSs | |||||||||||||||||||||||||||
| Spain |
4,374 | (2,558 | ) | 23,893 | 1,595 | 17,465 | 44,769 | (60 | ) | — | ||||||||||||||||||||||
| Portugal |
163 | (60 | ) | 7,811 | — | 590 | 8,504 | — | — | |||||||||||||||||||||||
| Italy |
3,448 | (1,723 | ) | — | — | — | 1,725 | — | — | |||||||||||||||||||||||
| Greece |
— | — | — | — | — | — | — | — | ||||||||||||||||||||||||
| Ireland |
— | — | — | — | — | — | 61 | — | ||||||||||||||||||||||||
| (*) | Information prepared under EBA standards. Also, there are government debt securities on insurance companies’ balance sheets amounting to EUR 8,420 million (of which EUR 7,414 million, EUR 691 million and EUR 315 million relate to Spain, Portugal and Italy, respectively) and off-balance-sheet exposure other than derivatives –contingent liabilities and commitments– amounting to EUR 3,081 million (EUR 2,929 million, EUR 97 million and EUR 55 million to Spain, Portugal and Italy, respectively). |
| (**) | Presented without taking into account the valuation adjustments recognized (EUR 45 million). |
| (***) | “Other than CDSs” refers to the exposure to derivatives based on the location of the counterparty, irrespective of the location of the underlying. “CDSs” refers to the exposure to CDSs based on the location of the underlying. |
| Sovereign risk by country of issuer/borrower at December 31, 2013 (*) |
||||||||||||||||||||||||||||||||
| Millions of euros | ||||||||||||||||||||||||||||||||
| Debt instruments | Loans and advances to customers (**) |
Total net direct exposure |
Derivatives (***) | |||||||||||||||||||||||||||||
| Financial assets held for trading and Other financial assets at fair value through profit or loss |
Short positions |
Available- for-sale financial assets |
Loans and receivables |
Other than CDSs |
CDSs | |||||||||||||||||||||||||||
| Spain |
4,783 | (2,079 | ) | 21,144 | 1,145 | 13,374 | 38,367 | (153 | ) | — | ||||||||||||||||||||||
| Portugal |
148 | — | 2,076 | — | 583 | 2,807 | — | — | ||||||||||||||||||||||||
| Italy |
2,571 | (1,262 | ) | 77 | — | — | 1,386 | — | 2 | |||||||||||||||||||||||
| Greece |
— | — | — | — | — | — | — | — | ||||||||||||||||||||||||
| Ireland |
— | — | — | — | — | — | 199 | — | ||||||||||||||||||||||||
| (*) | Information prepared under EBA standards. Also, there are government debt securities on insurance companies’ balance sheets amounting to EUR 5,645 million (of which EUR 4,783 million, EUR 654 million and EUR 208 million relate to Spain, Portugal and Italy, respectively) and off-balance-sheet exposure other than derivatives -contingent liabilities and commitments- amounting to EUR 1,884 million (EUR 1,627 million, EUR 118 million, EUR 137 million and EUR 2 million to Spain, Portugal, Italy and Ireland, respectively). |
| (**) | Presented without taking into account the valuation adjustments recognized (EUR 20 million). |
| (***) | “Other than CDSs” refers to the exposure to derivatives based on the location of the counterparty, irrespective of the location of the underlying. “CDSs” refers to the exposure to CDSs based on the location of the underlying. |
F-208
Table of Contents
| Sovereign risk by country of issuer/borrower at December 31, 2012 (*) |
||||||||||||||||||||||||||||||||
| Millions of euros | ||||||||||||||||||||||||||||||||
| Debt instruments | Loans and advances to customers (**) |
Total net direct exposure |
Derivatives (***) | |||||||||||||||||||||||||||||
| Financial assets held for trading and Other financial assets at fair value through profit or loss |
Short positions |
Available- for-sale financial assets |
Loans and receivables |
Other than CDSs |
CDSs | |||||||||||||||||||||||||||
| Spain |
6,473 | (2,070 | ) | 24,654 | 1,173 | 15,356 | 45,586 | (234 | ) | — | ||||||||||||||||||||||
| Portugal |
— | — | 1,684 | — | 616 | 2,300 | — | 1 | ||||||||||||||||||||||||
| Italy |
353 | (425 | ) | 76 | — | — | 4 | — | — | |||||||||||||||||||||||
| Greece |
— | — | — | — | — | — | — | — | ||||||||||||||||||||||||
| Ireland |
— | — | — | — | — | — | 284 | — | ||||||||||||||||||||||||
| (*) | Information prepared under EBA standards. Also, there are government debt securities on insurance companies’ balance sheets amounting to EUR 4,276 million (of which EUR 3,935 million, EUR 156 million and EUR 185 million relate to Spain, Portugal and Italy, respectively) and off-balance-sheet exposure other than derivatives –contingent liabilities and commitments– amounting to EUR 2,578 million (EUR 2,341 million, EUR 33 million and EUR 204 million to Spain, Portugal and Italy, respectively). |
| (**) | Presented without taking into account the valuation adjustments recognized (EUR 20 million). |
| (***) | “Other than CDSs” refers to the exposure to derivatives based on the location of the counterparty, irrespective of the location of the underlying. “CDSs” refers to the exposure to CDSs based on the location of the underlying. |
The detail of the Group’s other exposure to other counterparties (private sector, central banks and other public entities that are not considered to be sovereign risks) in the aforementioned countries at December 31, 2014, 2013 and 2012 is as follows:
| Exposure to other counterparties by country of issuer/borrower at December 31, 2014 (*) |
||||||||||||||||||||||||||||||||||||
| Millions of euros | ||||||||||||||||||||||||||||||||||||
| Debt instruments | Derivatives (***) | |||||||||||||||||||||||||||||||||||
| Balances with central banks |
Reverse repurchase agreements |
Financial assets held for trading and Other financial assets at fair value through profit or loss |
Available- for-sale financial assets |
Loans and receivables |
Loans and advances to customers (**) |
Total net direct exposure |
Other than CDSs |
CDSs | ||||||||||||||||||||||||||||
| Spain |
1,513 | 17,701 | 3,467 | 5,803 | 1,176 | 154,906 | 184,587 | 3,521 | (15 | ) | ||||||||||||||||||||||||||
| Portugal |
675 | — | 229 | 1,126 | 2,221 | 24,258 | 28,509 | 1,889 | — | |||||||||||||||||||||||||||
| Italy |
5 | — | 1,037 | 1,040 | — | 6,342 | 8,424 | 20 | 6 | |||||||||||||||||||||||||||
| Greece |
— | — | — | — | — | 50 | 50 | 37 | — | |||||||||||||||||||||||||||
| Ireland |
— | — | 161 | 133 | 111 | 538 | 943 | 299 | — | |||||||||||||||||||||||||||
| (*) | Also, the Group has off-balance-sheet exposure other than derivatives -contingent liabilities and commitments- amounting to EUR 60,318 million, EUR 6,051 million, EUR 3,049 million, EUR 17 million and EUR 237 million to counterparties in Spain, Portugal, Italy, Greece and Ireland, respectively. |
| (**) | Presented excluding valuation adjustments and impairment losses recognized (EUR 12,238 million). |
| (***) | “Other than CDSs” refers to the exposure to derivatives based on the location of the counterparty, irrespective of the location of the underlying. “CDSs” refers to the exposure to CDSs based on the location of the underlying. |
F-209
Table of Contents
| Exposure to other counterparties by country of issuer/borrower at December 31, 2013 (*) |
||||||||||||||||||||||||||||||||||||
| Millions of euros | ||||||||||||||||||||||||||||||||||||
| Debt instruments | Derivatives (***) | |||||||||||||||||||||||||||||||||||
| Balances with central banks |
Reverse repurchase agreements |
Financial assets held for trading and Other financial assets at fair value through profit or loss |
Available- for-sale financial assets |
Loans and receivables |
Loans and advances to customers (**) |
Total net direct exposure |
Other than CDSs |
CDSs | ||||||||||||||||||||||||||||
| Spain |
816 | 7,451 | 3,148 | 7,826 | 1,804 | 160,478 | 181,523 | 1,981 | (44 | ) | ||||||||||||||||||||||||||
| Portugal |
1,716 | — | 209 | 1,168 | 1,845 | 25,578 | 30,516 | 1,454 | (1 | ) | ||||||||||||||||||||||||||
| Italy |
11 | — | 368 | 273 | 93 | 6,490 | 7,235 | (115 | ) | (2 | ) | |||||||||||||||||||||||||
| Greece |
— | — | — | — | — | 80 | 80 | — | — | |||||||||||||||||||||||||||
| Ireland |
— | — | 229 | 360 | 259 | 507 | 1,355 | 1,031 | — | |||||||||||||||||||||||||||
| (*) | Also, the Group has off-balance-sheet exposure other than derivatives -contingent liabilities and commitments- amounting to EUR 48,659 million, EUR 5,982 million, EUR 2,717 million, EUR 4 million and EUR 93 million to counterparties in Spain, Portugal, Italy, Greece and Ireland, respectively. |
| (**) | Presented excluding valuation adjustments and impairment losses recognized (EUR 13,209 million). |
| (***) | “Other than CDSs” refers to the exposure to derivatives based on the location of the counterparty, irrespective of the location of the underlying. “CDSs” refers to the exposure to CDSs based on the location of the underlying. |
| Exposure to other counterparties by country of issuer/borrower at December 31, 2012 (*) |
||||||||||||||||||||||||||||||||||||
| Millions of euros | ||||||||||||||||||||||||||||||||||||
| Debt instruments | Derivatives (***) | |||||||||||||||||||||||||||||||||||
| Balances with central banks |
Reverse repurchase agreements |
Financial assets held for trading and Other financial assets at fair value through profit or loss |
Available- for-sale financial assets |
Loans and receivables |
Loans and advances to customers (**) |
Total net direct exposure |
Other than CDSs |
CDSs | ||||||||||||||||||||||||||||
| Spain |
1,218 | 11,471 | 2,598 | 7,225 | 1,130 | 184,658 | 208,300 | 7,180 | (40 | ) | ||||||||||||||||||||||||||
| Portugal |
1,156 | — | 997 | 676 | 1,547 | 25,243 | 29,619 | 1,809 | (4 | ) | ||||||||||||||||||||||||||
| Italy |
3 | — | 176 | 122 | 83 | 7,513 | 7,897 | (2 | ) | 8 | ||||||||||||||||||||||||||
| Greece |
— | — | — | — | — | 96 | 96 | — | — | |||||||||||||||||||||||||||
| Ireland |
— | — | 146 | 414 | 179 | 481 | 1,220 | 344 | — | |||||||||||||||||||||||||||
| (*) | Also, the Group has off-balance-sheet exposure other than derivatives -contingent liabilities and commitments- amounting to EUR 63,101 million, EUR 7,397 million, EUR 3,234 million, EUR 135 million and EUR 224 million to counterparties in Spain, Portugal, Italy, Greece and Ireland, respectively. |
| (**) | Presented excluding valuation adjustments and impairment losses recognized (EUR 12,671 million). |
| (***) | “Other than CDSs” refers to the exposure to derivatives based on the location of the counterparty, irrespective of the location of the underlying. “CDSs” refers to the exposure to CDSs based on the location of the underlying. |
F-210
Table of Contents
Following is certain information on the notional amount of the CDSs at December 31, 2014, 2013 and 2012 detailed in the foregoing tables:
| 12/31/14 |
||||||||||||||||||||||||||
| Millions of euros |
||||||||||||||||||||||||||
| Notional amount | Fair value | |||||||||||||||||||||||||
| Bought | Sold | Net | Bought | Sold | Net | |||||||||||||||||||||
| Spain |
Sovereign Other |
— | — | — | — | — | — | |||||||||||||||||||
| 1,260 | 1,576 | (316 | ) | (11 | ) | (4 | ) | (15 | ) | |||||||||||||||||
| Portugal |
Sovereign Other |
210 | 239 | (29 | ) | 1 | (1 | ) | — | |||||||||||||||||
| 149 | 162 | (13 | ) | — | — | — | ||||||||||||||||||||
| Italy |
Sovereign Other |
401 | 318 | 83 | (1 | ) | 1 | — | ||||||||||||||||||
| 668 | 735 | (67 | ) | 2 | 4 | 6 | ||||||||||||||||||||
| Greece |
Sovereign Other |
— | — | — | — | — | — | |||||||||||||||||||
| — | — | — | — | — | — | |||||||||||||||||||||
| Ireland |
Sovereign Other |
4 | 4 | — | — | — | — | |||||||||||||||||||
| — | — | — | — | — | — | |||||||||||||||||||||
| 12/31/13 |
||||||||||||||||||||||||||
| Millions of euros |
||||||||||||||||||||||||||
| Notional amount | Fair value | |||||||||||||||||||||||||
| Bought | Sold | Net | Bought | Sold | Net | |||||||||||||||||||||
| Spain |
Sovereign | — | — | — | — | — | — | |||||||||||||||||||
| Other | 1,735 | 2,277 | (542 | ) | (18 | ) | (26 | ) | (44 | ) | ||||||||||||||||
| Portugal |
Sovereign | 192 | 174 | 18 | 5 | (5 | ) | — | ||||||||||||||||||
| Other | 223 | 278 | (55 | ) | 1 | (2 | ) | (1 | ) | |||||||||||||||||
| Italy |
Sovereign | 603 | 570 | 33 | (1 | ) | 3 | 2 | ||||||||||||||||||
| Other | 834 | 913 | (79 | ) | (2 | ) | — | (2 | ) | |||||||||||||||||
| Greece |
Sovereign | — | — | — | — | — | — | |||||||||||||||||||
| Other | 5 | 5 | — | — | — | — | ||||||||||||||||||||
| Ireland |
Sovereign | 4 | 4 | — | — | — | — | |||||||||||||||||||
| Other | 6 | 6 | — | — | — | — | ||||||||||||||||||||
| 12/31/12 |
||||||||||||||||||||||||||
| Millions of euros |
||||||||||||||||||||||||||
| Notional amount | Fair value | |||||||||||||||||||||||||
| Bought | Sold | Net | Bought | Sold | Net | |||||||||||||||||||||
| Spain |
Sovereign | — | — | — | — | — | — | |||||||||||||||||||
| Other | 2,202 | 2,952 | (750 | ) | 3 | (43 | ) | (40 | ) | |||||||||||||||||
| Portugal |
Sovereign | 225 | 207 | 18 | 14 | (13 | ) | 1 | ||||||||||||||||||
| Other | 398 | 418 | (20 | ) | 7 | (11 | ) | (4 | ) | |||||||||||||||||
| Italy |
Sovereign | 518 | 608 | (90 | ) | 12 | (12 | ) | — | |||||||||||||||||
| Other | 1,077 | 1,025 | 52 | 40 | (32 | ) | 8 | |||||||||||||||||||
| Greece |
Sovereign | — | — | — | — | — | — | |||||||||||||||||||
| Other | 20 | 20 | — | 1 | (1 | ) | — | |||||||||||||||||||
| Ireland |
Sovereign | 9 | 9 | — | — | — | — | |||||||||||||||||||
| Other | 16 | 16 | — | — | — | — | ||||||||||||||||||||
F-211
Table of Contents
| 52. | Geographical and business segment reporting |
| a) | Geographical segments |
Business segment reporting is a basic tool used for monitoring and managing the Group’s various activities.
In 2014 the Group made the following changes to its criteria for the management and presentation of its financial information by segment:
| • | Geographical areas: The United States geographical area now includes Puerto Rico, which was previously included in Latin America. |
| • | Business: the name of the Asset management and insurance segment was changed to Private banking, asset management and insurance. |
Consequently, the segment information for 2013 and 2012 shown below has been recalculated using these criteria in order to make it comparable.
This primary level of segmentation, which is based on the Group’s management structure, comprises five segments: four operating areas plus the Corporate Activities Unit. The operating areas, which include all the business activities carried on therein by the Group, are Continental Europe, the United Kingdom, Latin America and the United States, based on the location of the Group’s assets.
The Continental Europe area encompasses all the commercial banking, wholesale and private banking, asset management and insurance business activities carried on in Europe excluding the United Kingdom, and the segment relating to Spain’s run-off real estate. The United Kingdom area includes the commercial banking, wholesale banking, asset management and insurance business activities carried on by the various units and branches with a presence in the UK. Latin America includes all the financial activities carried on by the Group through its banks and subsidiaries in the region, as well as the specialized units of Santander Private Banking, which is treated as a globally managed independent unit, and the New York business. The United States area includes the businesses of Santander Bank, Santander Consumer USA Inc. and Puerto Rico.
The Corporate Activities segment includes the centralized management business relating to financial and industrial investments, the financial management of the Parent’s structural currency position and its structural interest rate risk position and the management of liquidity and equity through issues and securitizations.
The financial information of each operating segment is prepared by aggregating the figures for the Group’s various business units. The basic information used for segment reporting comprises the accounting data of the legal units composing each segment and the data available in the management information systems. All segment financial statements have been prepared on a basis consistent with the accounting policies used by the Group.
Consequently, the sum of the figures in the various segment income statements is equal to those in the consolidated income statement. With regard to the balance sheet, due to the required segregation of the various business units (included in a single consolidated balance sheet), the amounts lent and borrowed between the units are shown as increases in the assets and liabilities of each business. These amounts relating to Intra-Group liquidity are eliminated and are shown in the Intra-Group eliminations column in the table below in order to reconcile the amounts contributed by each business unit to the consolidated Group’s balance sheet.
There are no customers located in areas other than those in which the Group’s assets are located that generate income exceeding 10% of gross income.
F-212
Table of Contents
The condensed balance sheets and income statements of the various geographical segments are as follows:
| Millions of euros | ||||||||||||||||||||||||||||
| 2014 | ||||||||||||||||||||||||||||
| (Condensed) balance sheet |
Continental Europe |
United Kingdom |
Latin America |
United States |
Corporate activities |
Intra-Group eliminations |
Total | |||||||||||||||||||||
| Total assets |
479,659 | 354,235 | 282,187 | 96,982 | 208,837 | (155,604 | ) | 1,266,296 | ||||||||||||||||||||
|
|
|
|
|
|
|
|
|
|
|
|
|
|
|
|||||||||||||||
| Loans and advances to customers |
266,827 | 251,191 | 144,714 | 67,176 | 4,803 | — | 734,711 | |||||||||||||||||||||
| Financial assets held for trading (excluding loans and advances) |
65,859 | 39,360 | 35,886 | 926 | 2,121 | — | 144,152 | |||||||||||||||||||||
| Available-for-sale financial assets |
52,858 | 11,196 | 31,216 | 12,695 | 7,285 | — | 115,250 | |||||||||||||||||||||
| Loans and advances to credit institutions |
65,754 | 14,093 | 23,899 | 2,463 | 19,800 | (44,296 | ) | 81,713 | ||||||||||||||||||||
| Non-current assets (*) |
5,838 | 2,700 | 3,967 | 6,857 | 6,747 | — | 26,109 | |||||||||||||||||||||
| Other asset accounts |
22,523 | 35,695 | 42,505 | 6,865 | 168,081 | (111,308 | ) | 164,361 | ||||||||||||||||||||
|
|
|
|
|
|
|
|
|
|
|
|
|
|
|
|||||||||||||||
| Total liabilities and equity |
479,659 | 354,235 | 282,187 | 96,982 | 208,837 | (155,604 | ) | 1,266,296 | ||||||||||||||||||||
|
|
|
|
|
|
|
|
|
|
|
|
|
|
|
|||||||||||||||
| Customer deposits |
255,719 | 202,328 | 137,726 | 46,575 | 5,279 | — | 647,627 | |||||||||||||||||||||
| Marketable debt securities |
19,435 | 69,581 | 31,920 | 15,999 | 59,954 | — | 196,889 | |||||||||||||||||||||
| Subordinated liabilities |
410 | 5,376 | 6,467 | 772 | 4,107 | — | 17,132 | |||||||||||||||||||||
| Liabilities under insurance contracts |
713 | — | — | — | — | — | 713 | |||||||||||||||||||||
| Deposits from central banks and credit institutions |
76,889 | 26,700 | 35,263 | 17,254 | 43,559 | (44,296 | ) | 155,369 | ||||||||||||||||||||
| Other accounts (**) |
101,950 | 35,834 | 48,053 | 5,910 | 9,620 | (39,119 | ) | 162,248 | ||||||||||||||||||||
| Share capital and reserves |
24,543 | 14,416 | 22,758 | 10,472 | 86,318 | (72,189 | ) | 86,318 | ||||||||||||||||||||
|
|
|
|
|
|
|
|
|
|
|
|
|
|
|
|||||||||||||||
| Other customer funds under management |
59,942 | 9,667 | 70,176 | 1,584 | — | — | 141,369 | |||||||||||||||||||||
|
|
|
|
|
|
|
|
|
|
|
|
|
|
|
|||||||||||||||
| Investment funds |
41,594 | 9,524 | 57,539 | 862 | — | — | 109,519 | |||||||||||||||||||||
| Pension funds |
11,481 | — | — | — | — | — | 11,481 | |||||||||||||||||||||
| Assets under management |
6,867 | 143 | 12,637 | 722 | — | — | 20,369 | |||||||||||||||||||||
|
|
|
|
|
|
|
|
|
|
|
|
|
|
|
|||||||||||||||
| Customer funds under management (***) |
335,506 | 286,952 | 246,289 | 64,930 | 69,340 | — | 1,003,017 | |||||||||||||||||||||
|
|
|
|
|
|
|
|
|
|
|
|
|
|
|
|||||||||||||||
| (*) | Including Tangible assets and Other intangible assets. |
| (**) | Including, in addition to liability items not broken down, the balances of Valuation adjustments, Non-controlling interests and Profit for the year attributable to the Parent. |
| (***) | Including Customer deposits, Marketable debt securities, Subordinated liabilities and Other customer funds under management. |
The Corporate Activities segment acts as the Group’s holding company. Therefore, it manages all equity (share capital and reserves of all the units) and determines the allocation thereof to each unit. The Group’s share capital and reserves (EUR 86,318 million) are initially assigned to this segment, and is then allocated in accordance with corporate policies to the business units (EUR 72,189 million). This allocation is shown as an asset of the Corporate Activities segment (included in Other asset accounts) and as a liability of each business unit (included in Share capital and reserves). Therefore, the allocation is reflected in the balance sheet net of adjustments for intra-Group eliminations in order not to duplicate the balances and obtain the total consolidated balance sheet for the Group.
F-213
Table of Contents
| Millions of euros | ||||||||||||||||||||||||||||
| 2013 | ||||||||||||||||||||||||||||
| (Condensed) balance sheet |
Continental Europe |
United Kingdom |
Latin America |
United States |
Corporate Activities |
Intra-Group eliminations |
Total | |||||||||||||||||||||
| Total assets |
436,641 | 323,743 | 244,927 | 59,383 | 181,847 | (130,778 | ) | 1,115,763 | ||||||||||||||||||||
|
|
|
|
|
|
|
|
|
|
|
|
|
|
|
|||||||||||||||
| Loans and advances to customers |
266,355 | 231,046 | 128,684 | 41,540 | 1,231 | — | 668,856 | |||||||||||||||||||||
| Financial assets held for trading (excluding loans and advances) |
50,318 | 28,831 | 23,098 | 127 | 2,333 | — | 104,707 | |||||||||||||||||||||
| Available-for-sale financial assets |
37,319 | 6,003 | 20,823 | 8,978 | 10,676 | — | 83,799 | |||||||||||||||||||||
| Loans and advances to credit institutions |
38,506 | 17,136 | 28,073 | 488 | 28,774 | (38,013 | ) | 74,964 | ||||||||||||||||||||
| Non-current assets (*) |
6,298 | 2,498 | 3,895 | 620 | 3,303 | — | 16,614 | |||||||||||||||||||||
| Other asset accounts |
37,845 | 38,229 | 40,354 | 7,630 | 135,530 | (92,765 | ) | 166,823 | ||||||||||||||||||||
|
|
|
|
|
|
|
|
|
|
|
|
|
|
|
|||||||||||||||
| Total liabilities and equity |
436,641 | 323,743 | 244,927 | 59,383 | 181,847 | (130,778 | ) | 1,115,763 | ||||||||||||||||||||
|
|
|
|
|
|
|
|
|
|
|
|
|
|
|
|||||||||||||||
| Customer deposits |
256,138 | 187,467 | 122,175 | 39,206 | 2,851 | — | 607,837 | |||||||||||||||||||||
| Marketable debt securities |
16,782 | 64,092 | 28,987 | 1,146 | 64,470 | — | 175,477 | |||||||||||||||||||||
| Subordinated liabilities |
406 | 5,805 | 4,832 | 1,225 | 3,871 | — | 16,139 | |||||||||||||||||||||
| Liabilities under insurance contracts |
1,430 | — | — | — | — | — | 1,430 | |||||||||||||||||||||
| Deposits from central banks and credit institutions |
59,040 | 26,882 | 24,490 | 8,436 | 28,562 | (38,013 | ) | 109,397 | ||||||||||||||||||||
| Other accounts (**) |
77,194 | 26,855 | 45,001 | 2,902 | 1,382 | (28,562 | ) | 124,772 | ||||||||||||||||||||
| Share capital and reserves |
25,651 | 12,642 | 19,442 | 6,468 | 80,711 | (64,203 | ) | 80,711 | ||||||||||||||||||||
|
|
|
|
|
|
|
|
|
|
|
|
|
|
|
|||||||||||||||
| Other customer funds under management |
50,962 | 9,645 | 59,188 | 5,375 | — | — | 125,170 | |||||||||||||||||||||
|
|
|
|
|
|
|
|
|
|
|
|
|
|
|
|||||||||||||||
| Investment funds |
33,445 | 9,645 | 49,424 | 790 | — | — | 93,304 | |||||||||||||||||||||
| Pension funds |
10,879 | — | — | — | — | — | 10,879 | |||||||||||||||||||||
| Assets under management |
6,638 | — | 9,764 | 4,585 | — | — | 20,987 | |||||||||||||||||||||
|
|
|
|
|
|
|
|
|
|
|
|
|
|
|
|||||||||||||||
| Customer funds under management (***) |
324,288 | 267,009 | 215,182 | 46,952 | 71,192 | — | 924,623 | |||||||||||||||||||||
|
|
|
|
|
|
|
|
|
|
|
|
|
|
|
|||||||||||||||
| (*) | Including Tangible assets and Other intangible assets. |
| (**) | Including, in addition to liability items not broken down, the balances of Valuation adjustments, Non-controlling interests and Profit for the year attributable to the Parent. |
| (***) | Including Customer deposits, Marketable debt securities, Subordinated liabilities and Other customer funds under management. |
F-214
Table of Contents
| Millions of euros | ||||||||||||||||||||||||||||
| 2012 | ||||||||||||||||||||||||||||
| (Condensed) balance sheet |
Continental Europe |
United Kingdom |
Latin America |
United States |
Corporate Activities |
Intra-Group eliminations |
Total | |||||||||||||||||||||
| Total assets |
495,272 | 359,058 | 263,939 | 68,637 | 243,497 | (160,758 | ) | 1,269,645 | ||||||||||||||||||||
|
|
|
|
|
|
|
|
|
|
|
|
|
|
|
|||||||||||||||
| Loans and advances to customers |
283,426 | 249,157 | 135,748 | 45,673 | 5,108 | — | 719,112 | |||||||||||||||||||||
| Financial assets held for trading (excluding loans and advances) |
87,992 | 38,177 | 28,272 | 406 | 4,065 | — | 158,912 | |||||||||||||||||||||
| Available-for-sale financial assets |
38,309 | 6,718 | 23,180 | 15,110 | 8,949 | — | 92,266 | |||||||||||||||||||||
| Loans and advances to credit institutions |
49,020 | 18,124 | 25,662 | 851 | 50,422 | (70,179 | ) | 73,900 | ||||||||||||||||||||
| Non-current assets (*) |
5,698 | 2,561 | 4,453 | 597 | 3,987 | — | 17,296 | |||||||||||||||||||||
| Other asset accounts |
30,827 | 44,321 | 46,624 | 6,000 | 170,966 | (90,579 | ) | 208,159 | ||||||||||||||||||||
|
|
|
|
|
|
|
|
|
|
|
|
|
|
|
|||||||||||||||
| Total liabilities and equity |
495,272 | 359,058 | 263,939 | 68,637 | 243,497 | (160,758 | ) | 1,269,645 | ||||||||||||||||||||
|
|
|
|
|
|
|
|
|
|
|
|
|
|
|
|||||||||||||||
| Customer deposits |
256,154 | 194,452 | 130,856 | 42,026 | 3,151 | — | 626,639 | |||||||||||||||||||||
| Marketable debt securities |
21,119 | 73,919 | 28,107 | 819 | 82,005 | — | 205,969 | |||||||||||||||||||||
| Subordinated liabilities |
118 | 5,534 | 5,578 | 2,142 | 4,866 | — | 18,238 | |||||||||||||||||||||
| Liabilities under insurance contracts |
1,425 | — | — | — | — | — | 1,425 | |||||||||||||||||||||
| Deposits from central banks and credit institutions |
78,177 | 29,313 | 31,600 | 14,753 | 69,304 | (70,181 | ) | 152,966 | ||||||||||||||||||||
| Other accounts (**) |
107,245 | 42,688 | 48,182 | 2,926 | 4,535 | (20,804 | ) | 184,772 | ||||||||||||||||||||
| Share capital and reserves |
31,034 | 13,152 | 19,616 | 5,971 | 79,636 | (69,773 | ) | 79,636 | ||||||||||||||||||||
|
|
|
|
|
|
|
|
|
|
|
|
|
|
|
|||||||||||||||
| Other customer funds under management |
43,391 | 13,919 | 54,716 | 6,115 | — | — | 118,141 | |||||||||||||||||||||
|
|
|
|
|
|
|
|
|
|
|
|
|
|
|
|||||||||||||||
| Investment funds |
27,079 | 13,919 | 46,843 | 1,335 | — | — | 89,176 | |||||||||||||||||||||
| Pension funds |
10,076 | — | — | — | — | — | 10,076 | |||||||||||||||||||||
| Assets under management |
6,236 | — | 7,873 | 4,780 | — | — | 18,889 | |||||||||||||||||||||
|
|
|
|
|
|
|
|
|
|
|
|
|
|
|
|||||||||||||||
| Customer funds under management (***) |
320,782 | 287,824 | 219,257 | 51,102 | 90,022 | — | 968,987 | |||||||||||||||||||||
|
|
|
|
|
|
|
|
|
|
|
|
|
|
|
|||||||||||||||
| (*) | Including Tangible assets and Other intangible assets. |
| (**) | Including, in addition to liability items not broken down, the balances of Valuation adjustments, Non-controlling interests and Profit for the year attributable to the Parent. |
| (***) | Including Customer deposits, Marketable debt securities, Subordinated liabilities and Other customer funds under management. |
F-215
Table of Contents
| Millions of euros | ||||||||||||||||||||||||
| 2014 | ||||||||||||||||||||||||
| (Condensed) income statement |
Continental Europe |
United Kingdom |
Latin America | United States |
Corporate Activities |
Total | ||||||||||||||||||
| INTEREST INCOME/(CHARGES) |
8,728 | 4,234 | 13,879 | 4,643 | (1,937 | ) | 29,547 | |||||||||||||||||
| Dividends |
287 | 1 | 88 | 29 | 30 | 435 | ||||||||||||||||||
| Income from companies accounted for using the equity method |
(25 | ) | 9 | 283 | 4 | (28 | ) | 243 | ||||||||||||||||
| Net fee and commission income (expense) |
3,457 | 1,028 | 4,565 | 683 | (37 | ) | 9,696 | |||||||||||||||||
| Gains/losses on financial assets and liabilities (net) and exchange differences (net) |
453 | 241 | 538 | 162 | 1,456 | 2,850 | ||||||||||||||||||
| Other operating income (expenses) |
(78 | ) | 28 | (288 | ) | 121 | 58 | (159 | ) | |||||||||||||||
| TOTAL INCOME |
12,822 | 5,541 | 19,065 | 5,642 | (458 | ) | 42,612 | |||||||||||||||||
| General administrative expenses |
(5,632 | ) | (2,565 | ) | (7,226 | ) | (1,813 | ) | (663 | ) | (17,899 | ) | ||||||||||||
| Personnel expenses |
(3,316 | ) | (1,642 | ) | (4,012 | ) | (1,029 | ) | (243 | ) | (10,242 | ) | ||||||||||||
| Other general administrative expenses |
(2,316 | ) | (923 | ) | (3,214 | ) | (784 | ) | (420 | ) | (7,657 | ) | ||||||||||||
| Depreciation and amortization |
(706 | ) | (461 | ) | (790 | ) | (219 | ) | (111 | ) | (2,287 | ) | ||||||||||||
| Provisions (net) |
(530 | ) | (184 | ) | (942 | ) | (24 | ) | (1,328 | ) | (3,009 | ) | ||||||||||||
| Impairment losses |
(2,960 | ) | (333 | ) | (5,143 | ) | (2,230 | ) | (44 | ) | (10,710 | ) | ||||||||||||
| PROFIT (LOSS) FROM OPERATIONS |
2,994 | 1,998 | 4,964 | 1,355 | (2,604 | ) | 8,707 | |||||||||||||||||
| Impairment losses on non-financial assets |
(74 | ) | — | 14 | (13 | ) | (865 | ) | (938 | ) | ||||||||||||||
| Other income and charges |
109 | 3 | 113 | 46 | 2,638 | 2,910 | ||||||||||||||||||
| PROFIT (LOSS) BEFORE TAX |
3,029 | 2,001 | 5,091 | 1,388 | (830 | ) | 10,679 | |||||||||||||||||
| Income tax |
(756 | ) | (425 | ) | (1,151 | ) | (369 | ) | (1,017 | ) | (3,718 | ) | ||||||||||||
| PROFIT (LOSS) FROM CONTINUING OPERATIONS |
2,273 | 1,576 | 3,940 | 1,019 | (1,847 | ) | 6,961 | |||||||||||||||||
| Profit (Loss) from discontinued operations |
(26 | ) | — | — | — | — | (26 | ) | ||||||||||||||||
| CONSOLIDATED PROFIT (LOSS) FOR THE YEAR |
2,247 | 1,576 | 3,940 | 1,019 | (1,847 | ) | 6,935 | |||||||||||||||||
| Attributable to non-controlling interests |
168 | — | 790 | 219 | (58 | ) | 1,119 | |||||||||||||||||
| PROFIT (LOSS) ATTRIBUTABLE TO THE PARENT |
2,079 | 1,576 | 3,150 | 800 | (1,789 | ) | 5,816 | |||||||||||||||||
F-216
Table of Contents
| Millions of euros | ||||||||||||||||||||||||||||||||||||||||||||||||
| 2013 | 2012 | |||||||||||||||||||||||||||||||||||||||||||||||
| (Condensed) income |
Continental Europe |
United Kingdom |
Latin America |
United States |
Corporate Activities |
Total | Continental Europe |
United Kingdom |
Latin America |
United States |
Corporate Activities |
Total | ||||||||||||||||||||||||||||||||||||
| INTEREST INCOME/(CHARGES) |
8,123 | 3,451 | 14,920 | 1,675 | (2,234 | ) | 25,935 | 8,854 | 3,336 | 17,596 | 1,980 | (1,843 | ) | 29,923 | ||||||||||||||||||||||||||||||||||
| Dividends |
265 | 1 | 54 | 23 | 35 | 378 | 289 | 1 | 59 | 21 | 53 | 423 | ||||||||||||||||||||||||||||||||||||
| Income from companies accounted for using the equity method |
(19 | ) | 4 | 202 | 321 | (8 | ) | 500 | (88 | ) | (5 | ) | 183 | 341 | (4 | ) | 427 | |||||||||||||||||||||||||||||||
| Net fee and commission income (expense) |
3,552 | 991 | 4,808 | 460 | (50 | ) | 9,761 | 3,625 | 1,190 | 5,020 | 455 | (29 | ) | 10,261 | ||||||||||||||||||||||||||||||||||
| Gains/losses on financial assets and liabilities (net) and exchange differences (net) |
775 | 403 | 1,041 | 66 | 1,109 | 3,394 | 306 | 1,231 | 1,068 | 247 | 288 | 3,140 | ||||||||||||||||||||||||||||||||||||
| Other operating income (expenses) |
(111 | ) | 30 | (268 | ) | (60 | ) | 107 | (302 | ) | (19 | ) | 24 | (360 | ) | (71 | ) | 512 | 86 | |||||||||||||||||||||||||||||
| TOTAL INCOME (LOSS) |
12,585 | 4,880 | 20,757 | 2,485 | (1,041 | ) | 39,666 | 12,967 | 5,777 | 23,566 | 2,973 | (1,023 | ) | 44,260 | ||||||||||||||||||||||||||||||||||
| General administrative expenses |
(5,807 | ) | (2,181 | ) | (7,624 | ) | (1,274 | ) | (566 | ) | (17,452 | ) | (5,790 | ) | (2,311 | ) | (8,069 | ) | (1,221 | ) | (410 | ) | (17,801 | ) | ||||||||||||||||||||||||
| Personnel expenses |
(3,527 | ) | (1,401 | ) | (4,235 | ) | (690 | ) | (216 | ) | (10,069 | ) | (3,498 | ) | (1,492 | ) | (4,551 | ) | (663 | ) | (102 | ) | (10,306 | ) | ||||||||||||||||||||||||
| Other general administrative expenses |
(2,280 | ) | (780 | ) | (3,389 | ) | (584 | ) | (350 | ) | (7,383 | ) | (2,292 | ) | (819 | ) | (3,518 | ) | (558 | ) | (308 | ) | (7,495 | ) | ||||||||||||||||||||||||
| Depreciation and amortization |
(769 | ) | (424 | ) | (897 | ) | (169 | ) | (132 | ) | (2,391 | ) | (667 | ) | (379 | ) | (863 | ) | (154 | ) | (120 | ) | (2,183 | ) | ||||||||||||||||||||||||
| Provisions (net) |
(158 | ) | (232 | ) | (782 | ) | (51 | ) | (1,222 | ) | (2,445 | ) | (130 | ) | (522 | ) | (1,017 | ) | (180 | ) | 377 | (1,472 | ) | |||||||||||||||||||||||||
| Impairment losses |
(3,766 | ) | (580 | ) | (6,485 | ) | (44 | ) | (352 | ) | (11,227 | ) | (9,903 | ) | (1,220 | ) | (7,300 | ) | (345 | ) | (112 | ) | (18,880 | ) | ||||||||||||||||||||||||
| PROFIT (LOSS) FROM OPERATIONS |
2,085 | 1,463 | 4,969 | 947 | (3,313 | ) | 6,151 | (3,523 | ) | 1,345 | 6,317 | 1,073 | (1,288 | ) | 3,924 | |||||||||||||||||||||||||||||||||
| Impairment losses on non-financial assets |
(65 | ) | (4 | ) | (24 | ) | (17 | ) | (393 | ) | (503 | ) | (27 | ) | — | (17 | ) | (24 | ) | (440 | ) | (508 | ) | |||||||||||||||||||||||||
| Other income and charges |
(374 | ) | — | 311 | (2 | ) | 1,795 | 1,730 | (757 | ) | 5 | 228 | 5 | 668 | 149 | |||||||||||||||||||||||||||||||||
| PROFIT (LOSS) BEFORE TAX |
1,646 | 1,459 | 5,256 | 928 | (1,911 | ) | 7,378 | (4,307 | ) | 1,350 | 6,528 | 1,054 | (1,060 | ) | 3,565 | |||||||||||||||||||||||||||||||||
| Income tax |
(376 | ) | (301 | ) | (1,197 | ) | (125 | ) | (35 | ) | (2,034 | ) | 1,490 | (312 | ) | (1,457 | ) | (192 | ) | (113 | ) | (584 | ) | |||||||||||||||||||||||||
| PROFIT (LOSS) FROM CONTINUING OPERATIONS |
1,270 | 1,158 | 4,059 | 803 | (1,946 | ) | 5,344 | (2,817 | ) | 1,038 | 5,071 | 862 | (1,173 | ) | 2,981 | |||||||||||||||||||||||||||||||||
| Profit (Loss) from discontinued operations |
(6 | ) | (9 | ) | — | — | — | (15 | ) | (7 | ) | 77 | — | — | — | 70 | ||||||||||||||||||||||||||||||||
| CONSOLIDATED PROFIT (LOSS) FOR THE YEAR |
1,264 | 1,149 | 4,059 | 803 | (1,946 | ) | 5,329 | (2,824 | ) | 1,115 | 5,071 | 862 | (1,173 | ) | 3,051 | |||||||||||||||||||||||||||||||||
| Attributable to non-controlling interests |
137 | — | 880 | — | 137 | 1,154 | (79 | ) | — | 866 | — | (19 | ) | 768 | ||||||||||||||||||||||||||||||||||
| PROFIT (LOSS) ATTRIBUTABLE TO THE PARENT |
1,127 | 1,149 | 3,179 | 803 | (2,082 | ) | 4,175 | (2,745 | ) | 1,115 | 4,205 | 862 | (1,154 | ) | 2,283 | |||||||||||||||||||||||||||||||||
F-217
Table of Contents
Following is the detail of revenue by the geographical segments used by the Group. For the purposes of the table below, revenue is deemed to be that recognized under Interest and similar income, Income from equity instruments, Fee and commission income, Gains/Losses on financial assets and liabilities (net) and Other operating income in the accompanying consolidated income statements for 2014, 2013 and 2012.
| Revenue (millions of euros) | ||||||||||||||||||||||||||||||||||||
| Revenue from external customers |
Inter-segment revenue | Total revenue | ||||||||||||||||||||||||||||||||||
| 2014 | 2013 | 2012 | 2014 | 2013 | 2012 | 2014 | 2013 | 2012 | ||||||||||||||||||||||||||||
| Continental Europe |
21,421 | 24,369 | 27,139 | 20 | 1,141 | 248 | 21,441 | 25,510 | 27,387 | |||||||||||||||||||||||||||
| United Kingdom |
9,091 | 9,612 | 11,019 | 1,204 | 1,180 | 1,294 | 10,295 | 10,792 | 12,313 | |||||||||||||||||||||||||||
| Latin America |
35,680 | 32,641 | 36,617 | (393 | ) | 394 | 233 | 35,287 | 33,035 | 36,850 | ||||||||||||||||||||||||||
| United States |
7,339 | 2,799 | 3,474 | (13 | ) | 113 | (33 | ) | 7,326 | 2,912 | 3,441 | |||||||||||||||||||||||||
| Corporate Activities |
3,263 | 4,015 | 3,718 | 7,323 | 6,862 | 9,056 | 10,586 | 10,877 | 12,774 | |||||||||||||||||||||||||||
| Inter-segment revenue adjustments and eliminations |
— | — | — | (8,141 | ) | (9,690 | ) | (10,798 | ) | (8,141 | ) | (9,690 | ) | (10,798 | ) | |||||||||||||||||||||
|
|
|
|
|
|
|
|
|
|
|
|
|
|
|
|
|
|
|
|||||||||||||||||||
| 76,794 | 73,436 | 81,967 | — | — | — | 76,794 | 73,436 | 81,967 | ||||||||||||||||||||||||||||
|
|
|
|
|
|
|
|
|
|
|
|
|
|
|
|
|
|
|
|||||||||||||||||||
| b) | Business segments |
At this secondary level of segment reporting, the Group is structured into commercial banking, global wholesale banking, private banking, asset management and insurance, and the segment relating to Spain’s run-off real estate; the sum of these segments is equal to that of the primary geographical operating segments. Total figures for the Group are obtained by adding to the business segments the data for the corporate activities segment.
The commercial banking segment encompasses the entire commercial banking business (except for the corporate banking business managed globally using the global relationship model). The global wholesale banking segment reflects the profit and loss from the global corporate banking business, those on investment banking and markets worldwide, including all the globally managed treasury departments and the equities business. The private banking, asset management and insurance segment includes the contribution to the Group arising from the design and management of the investment fund, pension and insurance businesses, which are performed in certain cases through various units wholly owned by the Group and in other cases through units in which the Group holds an ownership interest through joint ventures with specialists. The Spain’s run-off real estate include loans to customers engaging mainly in property development, for which a specialized management model is in place, the Group’s ownership interest in SAREB and foreclosed assets.
F-218
Table of Contents
The condensed income statements and other significant data are as follows:
| Millions of euros | ||||||||||||||||||||||||
| 2014 | ||||||||||||||||||||||||
| (Condensed) income statement |
Commercial banking |
Global wholesale banking |
Private banking, asset management and insurance |
Spain’s run-off real estate |
Corporate Activities |
Total | ||||||||||||||||||
| INTEREST INCOME/(CHARGES) |
28,493 | 2,533 | 462 | (4 | ) | (1,937 | ) | 29,547 | ||||||||||||||||
| Income from equity instruments |
132 | 273 | — | — | 30 | 435 | ||||||||||||||||||
| Income from companies accounted for using the equity method |
47 | (2 | ) | 294 | (68 | ) | (28 | ) | 243 | |||||||||||||||
| Net fee and commission income (expense) |
7,700 | 1,414 | 610 | 9 | (37 | ) | 9,696 | |||||||||||||||||
| Gains/losses on financial assets and liabilities (net) and exchange differences (net) |
615 | 747 | 32 | — | 1,456 | 2,850 | ||||||||||||||||||
| Other operating income (expenses) |
(356 | ) | 32 | 108 | (1 | ) | 58 | (159 | ) | |||||||||||||||
| TOTAL INCOME |
36,631 | 4,997 | 1,506 | (64 | ) | (458 | ) | 42,612 | ||||||||||||||||
| General administrative expenses |
(14,893 | ) | (1,615 | ) | (523 | ) | (205 | ) | (663 | ) | (17,899 | ) | ||||||||||||
| Personnel expenses |
(8,608 | ) | (1,015 | ) | (338 | ) | (38 | ) | (243 | ) | (10,242 | ) | ||||||||||||
| Other general administrative expenses |
(6,285 | ) | (600 | ) | (185 | ) | (167 | ) | (420 | ) | (7,657 | ) | ||||||||||||
| Depreciation and amortization |
(1,903 | ) | (205 | ) | (57 | ) | (11 | ) | (111 | ) | (2,287 | ) | ||||||||||||
| Provisions (net) |
(1,628 | ) | (43 | ) | (10 | ) | — | (1,328 | ) | (3,009 | ) | |||||||||||||
| Impairment losses |
(9,763 | ) | (556 | ) | — | (347 | ) | (44 | ) | (10,710 | ) | |||||||||||||
| PROFIT (LOSS) FROM OPERATIONS |
8,444 | 2,578 | 916 | (627 | ) | (2,604 | ) | 8,707 | ||||||||||||||||
| Net impairment losses on non-financial assets |
(30 | ) | (43 | ) | — | — | (865 | ) | (938 | ) | ||||||||||||||
| Other non-financial gains/(losses) |
487 | (12 | ) | 2 | (206 | ) | 2,639 | 2,910 | ||||||||||||||||
| PROFIT (LOSS) BEFORE TAX |
8,901 | 2,523 | 918 | (833 | ) | (830 | ) | 10,679 | ||||||||||||||||
| Income tax |
(2,070 | ) | (689 | ) | (192 | ) | 250 | (1,017 | ) | (3,718 | ) | |||||||||||||
| PROFIT (LOSS) FROM CONTINUING OPERATIONS |
6,831 | 1,834 | 726 | (583 | ) | (1,847 | ) | 6,961 | ||||||||||||||||
| Profit (Loss) from discontinued operations |
(26 | ) | — | — | — | — | (26 | ) | ||||||||||||||||
| CONSOLIDATED PROFIT (LOSS) FOR THE YEAR |
6,805 | 1,834 | 726 | (583 | ) | (1,847 | ) | 6,935 | ||||||||||||||||
| Attributable to non-controlling interests |
934 | 220 | 23 | — | (58 | ) | 1,119 | |||||||||||||||||
| PROFIT (LOSS) ATTRIBUTABLE TO THE PARENT |
5,871 | 1,614 | 703 | (583 | ) | (1,789 | ) | 5,816 | ||||||||||||||||
F-219
Table of Contents
| Millions of euros | ||||||||||||||||||||||||||||||||||||||||||||||||
| 2013 | 2012 | |||||||||||||||||||||||||||||||||||||||||||||||
| (Condensed) income |
Commercial banking |
Global wholesale banking |
Private banking, asset management and insurance |
Spain’s run-off real estate |
Corporate Activities |
Total | Commercial banking |
Global wholesale banking |
Private, banking, asset management and insurance |
Spain’s run-off real estate |
Corporate Activities |
Total | ||||||||||||||||||||||||||||||||||||
| INTEREST INCOME/(CHARGES) |
25,552 | 2,464 | 115 | 38 | (2,234 | ) | 25,935 | 28,865 | 2,708 | 119 | 74 | (1,843 | ) | 29,923 | ||||||||||||||||||||||||||||||||||
| Income from equity instruments |
78 | 265 | — | — | 35 | 378 | 86 | 284 | — | — | 53 | 423 | ||||||||||||||||||||||||||||||||||||
| Income from companies accounted for using the equity method |
401 | (1 | ) | 148 | (40 | ) | (8 | ) | 500 | 400 | — | 131 | (100 | ) | (4 | ) | 427 | |||||||||||||||||||||||||||||||
| Net fee and commission income (expense) |
8,193 | 1,254 | 349 | 15 | (50 | ) | 9,761 | 8,471 | 1,360 | 418 | 41 | (29 | ) | 10,261 | ||||||||||||||||||||||||||||||||||
| Gains/losses on financial assets and liabilities (net) and exchange differences (net) |
1,119 | 1,159 | 6 | 1 | 1,109 | 3,394 | 2,004 | 840 | 3 | 5 | 288 | 3,140 | ||||||||||||||||||||||||||||||||||||
| Other operating income (expenses) |
(553 | ) | 7 | 145 | (8 | ) | 107 | (302 | ) | (630 | ) | (16 | ) | 223 | (3 | ) | 512 | 86 | ||||||||||||||||||||||||||||||
| TOTAL INCOME |
34,790 | 5,148 | 763 | 6 | (1,041 | ) | 39,666 | 39,196 | 5,176 | 894 | 17 | (1,023 | ) | 44,260 | ||||||||||||||||||||||||||||||||||
| General administrative expenses |
(14,890 | ) | (1,549 | ) | (285 | ) | (162 | ) | (566 | ) | (17,452 | ) | (15,343 | ) | (1,592 | ) | (272 | ) | (184 | ) | (410 | ) | (17,801 | ) | ||||||||||||||||||||||||
| Personnel expenses |
(8,669 | ) | (988 | ) | (149 | ) | (47 | ) | (216 | ) | (10,069 | ) | (8,986 | ) | (1,013 | ) | (160 | ) | (45 | ) | (102 | ) | (10,306 | ) | ||||||||||||||||||||||||
| Other general administrative expenses |
(6,221 | ) | (561 | ) | (136 | ) | (115 | ) | (350 | ) | (7,383 | ) | (6,357 | ) | (579 | ) | (112 | ) | (139 | ) | (308 | ) | (7,495 | ) | ||||||||||||||||||||||||
| Depreciation and amortization |
(2,027 | ) | (186 | ) | (33 | ) | (13 | ) | (132 | ) | (2,391 | ) | (1,848 | ) | (171 | ) | (35 | ) | (9 | ) | (120 | ) | (2,183 | ) | ||||||||||||||||||||||||
| Provisions (net) |
(1,173 | ) | (47 | ) | (3 | ) | — | (1,222 | ) | (2,445 | ) | (1,815 | ) | (17 | ) | (17 | ) | — | 377 | (1,472 | ) | |||||||||||||||||||||||||||
| Impairment losses |
(9,506 | ) | (952 | ) | (7 | ) | (410 | ) | (352 | ) | (11,227 | ) | (12,182 | ) | (420 | ) | (2 | ) | (6,164 | ) | (112 | ) | (18,880 | ) | ||||||||||||||||||||||||
| PROFIT (LOSS) FROM OPERATIONS |
7,194 | 2,414 | 435 | (579 | ) | (3,313 | ) | 6,151 | 8,008 | 2,976 | 568 | (6,340 | ) | (1,288 | ) | 3,924 | ||||||||||||||||||||||||||||||||
| Net impairment losses on non-financial assets |
(73 | ) | (37 | ) | — | — | (393 | ) | (503 | ) | (44 | ) | (24 | ) | — | — | (440 | ) | (508 | ) | ||||||||||||||||||||||||||||
| Other non-financial gains/(losses) |
249 | 12 | 2 | (328 | ) | 1,795 | 1,730 | 219 | (5 | ) | 8 | (741 | ) | 668 | 149 | |||||||||||||||||||||||||||||||||
| PROFIT (LOSS) BEFORE TAX |
7,370 | 2,389 | 437 | (907 | ) | (1,911 | ) | 7,378 | 8,183 | 2,947 | 576 | (7,081 | ) | (1,060 | ) | 3,565 | ||||||||||||||||||||||||||||||||
| Income tax |
(1,509 | ) | (661 | ) | (101 | ) | 272 | (35 | ) | (2,034 | ) | (1,675 | ) | (827 | ) | (154 | ) | 2,185 | (113 | ) | (584 | ) | ||||||||||||||||||||||||||
| PROFIT (LOSS) FROM CONTINUING OPERATIONS |
5,861 | 1,728 | 336 | (635 | ) | (1,946 | ) | 5,344 | 6,508 | 2,120 | 422 | (4,896 | ) | (1,173 | ) | 2,981 | ||||||||||||||||||||||||||||||||
| Profit (Loss) from discontinued operations |
(15 | ) | — | — | — | — | (15 | ) | 70 | — | — | — | — | 70 | ||||||||||||||||||||||||||||||||||
| CONSOLIDATED PROFIT (LOSS) FOR THE YEAR |
5,846 | 1,728 | 336 | (635 | ) | (1,946 | ) | 5,329 | 6,578 | 2,120 | 422 | (4,896 | ) | (1,173 | ) | 3,051 | ||||||||||||||||||||||||||||||||
| Attributable to non-controlling interests |
769 | 224 | 24 | — | 137 | 1,154 | 686 | 209 | 20 | (128 | ) | (19 | ) | 768 | ||||||||||||||||||||||||||||||||||
| PROFIT (LOSS) ATTRIBUTABLE TO THE PARENT |
5,077 | 1,504 | 312 | (635 | ) | (2,083 | ) | 4,175 | 5,892 | 1,911 | 402 | (4,768 | ) | (1,154 | ) | 2,283 | ||||||||||||||||||||||||||||||||
F-220
Table of Contents
| 53. | Related parties |
The parties related to the Group are deemed to include, in addition to its subsidiaries, associates and jointly controlled entities, the Bank’s key management personnel (the members of its board of directors and the executive vice presidents, together with their close family members) and the entities over which the key management personnel may exercise significant influence or control.
Following is a detail of the ordinary business transactions performed by the Group with its related parties, distinguishing between associates and jointly controlled entities, members of the Bank’s board of directors, the Bank’s executive vice presidents, and other related parties. Related-party transactions were made on terms equivalent to those that prevail in arm’s-length transactions or, when this was not the case, the related compensation in kind was recognized .
F-221
Table of Contents
| Millions of euros | ||||||||||||||||||||||||||||||||||||||||||||||||
| 2014 | 2013 | 2012 | ||||||||||||||||||||||||||||||||||||||||||||||
| Associates and jointly controlled entities |
Members of the board of directors |
Executive vice presidents |
Other related parties |
Associates and jointly controlled entities |
Members of the board of directors |
Executive vice presidents |
Other related parties |
Associates and jointly controlled entities |
Members of the board of directors |
Executive vice presidents |
Other related parties |
|||||||||||||||||||||||||||||||||||||
| Assets: |
6,885 | 5 | 25 | 1,276 | 9,425 | 6 | 36 | 1,599 | 6,626 | 7 | 33 | 1,417 | ||||||||||||||||||||||||||||||||||||
| Loans and advances to credit institutions |
5 | — | — | — | 7,392 | — | — | — | 5,635 | — | — | — | ||||||||||||||||||||||||||||||||||||
| Loans and advances to customers |
6,202 | 5 | 25 | 284 | 1,331 | 6 | 36 | 424 | 544 | 7 | 33 | 1,233 | ||||||||||||||||||||||||||||||||||||
| Debt instruments |
678 | — | — | 992 | 702 | — | — | 1,175 | 447 | — | — | 184 | ||||||||||||||||||||||||||||||||||||
| Liabilities: |
(1,034 | ) | (9 | ) | (20 | ) | (315 | ) | (946 | ) | (9 | ) | (10 | ) | (197 | ) | (544 | ) | (14 | ) | (15 | ) | (529 | ) | ||||||||||||||||||||||||
| Deposits from credit institutions |
(337 | ) | — | — | — | (440 | ) | — | — | — | (422 | ) | — | — | — | |||||||||||||||||||||||||||||||||
| Customer deposits |
(696 | ) | (9 | ) | (20 | ) | (315 | ) | (498 | ) | (9 | ) | (10 | ) | (197 | ) | (122 | ) | (14 | ) | (15 | ) | (529 | ) | ||||||||||||||||||||||||
| Marketable debt securities |
(1 | ) | — | — | — | (8 | ) | — | — | — | — | — | — | — | ||||||||||||||||||||||||||||||||||
| Income statement: |
656 | — | — | 11 | 143 | — | — | 29 | 161 | — | (1 | ) | 69 | |||||||||||||||||||||||||||||||||||
| Interest and similar income |
89 | — | — | 6 | 109 | — | — | 6 | 94 | — | — | 36 | ||||||||||||||||||||||||||||||||||||
| Interest expense and similar charges |
(18 | ) | — | — | (2 | ) | (12 | ) | — | — | (7 | ) | (4 | ) | (1 | ) | (5 | ) | ||||||||||||||||||||||||||||||
| Gains/losses on financial assets and liabilities |
35 | — | — | 2 | 12 | — | — | 25 | 59 | — | — | 24 | ||||||||||||||||||||||||||||||||||||
| Fee and commission income |
572 | 5 | 56 | — | — | 5 | 43 | — | — | 14 | ||||||||||||||||||||||||||||||||||||||
| Fee and commission expense |
(22 | ) | — | — | — | (22 | ) | — | — | — | (31 | ) | — | — | — | |||||||||||||||||||||||||||||||||
| Other: |
4,270 | 2 | 3 | 3,720 | 14,029 | — | 4 | 4,137 | 12,573 | 1 | 7 | 2,958 | ||||||||||||||||||||||||||||||||||||
| Contingent liabilities |
43 | — | — | 265 | 74 | — | — | 145 | — | — | — | 303 | ||||||||||||||||||||||||||||||||||||
| Contingent commitments |
59 | 2 | 3 | 77 | 1,063 | — | 4 | 95 | 3,431 | 1 | 7 | 3 | ||||||||||||||||||||||||||||||||||||
| Derivative financial instruments |
4,168 | — | — | 3,378 | 12,892 | — | — | 3,897 | 9,142 | — | — | 2,652 | ||||||||||||||||||||||||||||||||||||
In addition to the detail provided above, there were insurance contracts linked to pensions amounting to EUR 345 million at December 31, 2014 (December 31, 2013: EUR 342 million; December 31, 2012: EUR 405 million).
F-222
Table of Contents
| 54. | Risk management |
1. CORPORATE RISK MANAGEMENT AND CONTROL PRINCIPLES
The Group’s risk policy focuses on maintaining a predictable medium-low risk profile for all its risks, and its risk management model is a key factor in achieving the Group’s strategic objectives.
The risk activity is governed by the following basic principles, which are in line with the Group’s strategy and business model and take into account the recommendations of the supervisory and regulatory bodies.
| • | A risk culture integrated throughout the organization. It consists of a series of attitudes, values, skills and guidelines for action vis-à-vis risks that are integrated in all processes, including change management and strategic and business planning decision-making. It is implemented through the heavy involvement of senior management in risk management and decision-making, remuneration schemes that are in line with the risk appetite, training processes at all levels of the organization, robust control mechanisms and a complete, detailed regulatory framework of risk management and control policies and processes. |
| • | Independence of the risk function, encompassing all risks and appropriately separating the risk generating units from those responsible for risk control and having sufficient authority and direct access to management and governing bodies responsible for setting and supervising risk strategy and policies. |
| • | The consideration of all risks on an integrated basis as an objective for the appropriate management and control thereof, including both directly originated risks and those originated indirectly (e.g. by suppliers). |
| • | An organizational and governance model that assigns management and control officers to all risks, while maintaining the principle of independence, and which has clear, coherent reporting mechanisms both at each Group subsidiary and from these to the Corporation. |
| • | Decision-making is instrumented through powers and responsibilities attributed to each risk managing unit, mainly through collective bodies, which is considered to be an effective instrument for furnishing the appropriate analysis and different perspectives to be taken into consideration in risk management. |
| • | The Group encourages the use of common management instruments among countries, without prejudice to their adaptation to regulations, supervisory requirements and each unit’s level of progress. |
| • | These instruments include the formulation and monitoring of the risk appetite and, accordingly, the Group calculates the amount and type of the risks it considers reasonable to assume in the performance of its business strategy and the development thereof within limits that are objective, verifiable and consistent with the risk appetite for each relevant activity; the use of scenario analysis and a forward-looking vision of risks in management processes, using advanced models and metrics and establishing a control, reporting and escalation framework to ensure that risks are identified and managed from different perspectives. |
| 2. | CORPORATE GOVERNANCE OF THE RISK FUNCTION |
2.1. Corporate risk governance structure
The board of directors is responsible for the approval of the Group’s general policies and strategies and, in particular, its general risk policy.
In addition to the executive committee, which pays particular attention to risk, the board has a risk supervision, regulation and compliance committee.
F-223
Table of Contents
2.1.1. The risk supervision, regulation and compliance committee
This committee’s mission is to assist the board in the oversight and control of risk, the definition of the Group’s risk policies, relationships with supervisory bodies, and regulation and compliance.
By resolution of the 2014 annual general meeting5 and at the proposal of the board, this committee was created in line with the European CRD IV Directive and best market practices. It comprises external or non-executive directors, with a majority of independent directors, and is chaired by an independent director.
The functions of the risk supervision, regulation and compliance committee are as follows:
| • | To support and advise the board on defining and assessing risk policies affecting the Group and establishing the risk propensity and risk strategy. |
| • | To provide the board with assistance in the oversight of the application of the risk strategy. |
| • | To conduct systematic reviews of the Group’s exposure to its main customers, economic activity sectors, geographical areas and types of risk. |
| • | To be acquainted with and measure the management tools, improvement initiatives, project development and any other relevant risk control actions, including the policy on internal risk models and their internal validation. |
| • | To support and advise the board in its relationships with supervisors and regulators in the various countries in which the Group has a presence. |
| • | To supervise compliance with the general code of conduct, with the anti-money laundering and financing of terrorism manuals and procedures and, in general, with the Bank’s rules of governance and compliance program, and to make the required proposals for improvement. |
| • | To supervise the Group’s governance and compliance policies and rules and, in particular, the adoption of the steps and measures arising from the reports or inspections conducted by the administrative supervision and control authorities. |
| • | To monitor and assess legislative proposals and regulatory developments that may be applicable and the possible consequences for the Group. |
2.1.2. The executive risk committee (CDR)
The executive risk committee is a body with risk-management powers delegated by the board and it takes decisions within the scope of those powers to ensure that the Group’s risk profile derived from its business strategy is in line with the risk appetite limits and global policies approved by the board.
The CDR is chaired by an executive deputy chairman of the board, and comprises another four of the Bank’s directors.
The committee’s main responsibilities are as follows:
| • | To decide upon transactions outside the powers delegated to lower-ranking bodies and the overall limits for pre-classified risk categories for economic groups or in relation to exposure by type of risk. |
| 5 | The risk supervision, regulation and compliance committee held its first meeting on July 23, 2014. |
F-224
Table of Contents
| • | To provide the risk supervision, regulation and compliance committee with the information it requires to perform the duties attributed to it by law, the Bylaws and the Rules and Regulations of the Board, without prejudice to the obligation to inform the board of directors, on a timely basis, of its risk management activities. |
| • | To monitor the Group’s general risk profile composed of all the risks detailed in the risk map. |
| • | To manage the Group’s exposure to its various customers, economic activity sectors, geographical areas and types of risk. |
| • | To authorize the management tools, improvement initiatives, project development and any other relevant risk control actions, including the policy on internal risk models and their internal validation. |
| • | To follow, within the scope of its activities, the indications issued by the supervisory authorities in the performance of their functions. |
| • | To ensure that the Group’s actions are consistent with the risk appetite previously established by the board of directors with the advice of the risk supervision, regulation and compliance committee, and to empower other, lower-ranking committees or executives to assume risks. |
2.1.3. Basic risk management committees
Some of the CDR’s powers have been delegated to corporate risk committees, which are structured by type of risk and activity, and this facilitates the appropriate escalation process to enable final decisions to be made and the risk profile to be monitored on an ongoing basis.
2.2. Risk function responsibility model
2.2.1. Lines of defense
The Group follows a risk management and control model based on three lines of defense.
| • | The first line of defense comprises the business units and support areas (including those specializing in risk) that originate the Bank’s risk exposure as part of their activity. These units are responsible for appropriately managing, monitoring and reporting the risk generated, which must be kept at a level consistent with the risk appetite and the authorized risk limits. |
| • | The second line of defense comprises risk control and oversight teams, including the compliance function. This second line seeks to ensure effective control of risks and guarantees that risks are managed in accordance with the defined risk appetite level. |
| • | Internal audit, as the third line of defense and in its role as the last control layer, performs regular assessments to ensure that the policies, methods and procedures are appropriate and checks their effective implementation. |
The three lines of defense have sufficient levels of separation and independence for the effectiveness of the general framework not to be compromised and they act in a coordinated way in order to maximize their efficiency and boost their effectiveness.
Over and above these lines of defense, the board committees and the executive risk committees, both at corporate and unit level, are entrusted with the proper management and control of risk from the highest echelon of the organization.
F-225
Table of Contents
2.2.2. Organizational risk function structure
The chief risk officer (CRO) is the head of the risk function and reports to an executive deputy chairman of the Bank who is a member of the board of directors and chairman of the executive risk committee.
The CRO, whose duties include advising and challenging the executive line, reports separately to the risk supervision, regulation and compliance committee and to the board.
The risk management and control model has the following key features:
| • | Specialist risk management, enabling the units to manage the risk they generate in accordance with the established policies and limits. |
| • | Control of financial, non-financial and transversal risks, checking, for each type of risk, that management and exposure are in keeping with the guidelines established by senior management. |
| • | Group-wide risk management, which involves taking a comprehensive aggregate view of risk, assessing the Group’s global risk profile and checking that it is consistent with the risk appetite and limit structure established by the board; and ensuring that the risk management and control systems are adequate and in line with the most demanding criteria and best practices observed in the industry and/or required by the regulators. |
| • | Development, in the sphere of risk, of reporting regulations, methodologies and infrastructure. |
| • | Planning and internal governance. |
| • | Internal validation of risk models in order to assess their suitability for management and regulatory purposes. The validation exercise consists of the review of the theoretical fundamentals of the model, the quality of the data used to build and calibrate the model, and its use and the associated governance process. |
| • | Control and coordination of regulatory projects to supervise the design and implementation of the best regulatory risk management standards at the Group and compliance with regulatory requirements in all countries in a consistent and efficient manner. |
2.3. The Group’s relationship with subsidiaries regarding risk management
2.3.1. Alignment of units with the Corporation
The risk management and control model, at all Group units, has a common set of basic principles, achieved by means of corporate frameworks.
Beyond these principles and fundamentals, each unit adapts its risk management to its local reality, within the framework of corporate policies and structures, which makes it possible to identify a risk management model at the Group.
One of the strengths of this model is the adoption of the best practices developed in each of the units and markets in which the Group is present. The corporate risk divisions pool and transfer these practices.
2.3.2. Committee structure
The Group units’ governing bodies are structured taking into account local regulatory and legal requirements and each unit’s size and complexity and are consistent with those of the Parent, as established in the internal governance framework, thus facilitating communication, reporting and effective control.
F-226
Table of Contents
The subsidiaries’ managing bodies, in accordance with the internal governance framework in place at the Group, have their own model of (quantitative and qualitative) risk management powers and must adhere to the principles of conduct contained in the benchmark models and frameworks developed at corporate level.
Given its ability to take an aggregate, comprehensive view of all risks, the Parent bank reserves for itself the powers to validate and question the operations and management policies at the various units, to the extent that they affect the Group’s risk profile.
| 3. | RISK MANAGEMENT AND CONTROL MODEL |
The risk management and control model ensures that the risk profile remains within the levels set for the risk appetite and other limits. Similarly, it includes the adoption of the corrective and mitigating measures required to keep risk levels in line with the defined objectives.
The tools that help ensure that all the risks arising from the Group’s business activity are properly managed and controlled are described below.
3.1. Risk map
The risk map covers the main risk categories in which the Group has its most significant current and/or potential exposures, thus facilitating the identification thereof. The risk map includes the following:
| • | Financial risks: |
| • | Credit risk: risk that might arise from the failure to meet agreed-upon contractual obligations in financial transactions. |
| • | Trading market risk: risk which is incurred as a result of the possibility of changes in market factors affecting the value of positions in the trading portfolios. |
| • | Liquidity risk: risk of non-compliance with payment obligations on time or of complying with them at an excessive cost. |
| • | Structural market risk: risk caused by the management of the various balance sheet items, including those relating to the adequacy of capital and those arising from the insurance and pensions businesses. |
| • | Non-financial risks: |
| • | Operational risk: the risk of incurring losses due to the inadequacy or failure of processes, staff and internal systems or due to external events. |
| • | Conduct risk: the risk caused by inappropriate practices in the Bank’s dealings with its customers, and the treatment and products offered to each particular customer and the adequacy thereof. |
| • | Compliance and legal risk: risk arising from non-compliance with the legal framework, internal rules or the requirements of regulators and supervisors. |
| • | Transversal risks: |
| • | Model risk: risk that includes losses arising from decisions based mainly on the results of models, due to errors in the design, application or use of the aforementioned models. |
| • | Reputational risk: risk of damage in the perception of the Bank by public opinion, its customers, investors or any other interested party. |
F-227
Table of Contents
| • | Strategic risk: the risk that results diverge significantly from the Group’s strategy or business plan due to changes in general business conditions and risks associated with strategic decisions. This includes the risk of poor implementation of decisions or lack of capacity to respond to changes in the business environment. |
| • | Capital risk: risk that the capital of the Group or any of its entities is not sufficient in terms of quantity and/or quality to meet the regulatory minimum capital requirements set to operate as a bank; respond to market expectations regarding its creditworthiness and support business growth and strategic possibilities that might arise. |
3.2. Group-wide risk management (GWRM)
GWRM involves the identification, valuation, appropriate management and control of all risks, using a comprehensive perspective integrated in all levels of the organization. The implementation and coordinated management of all the components of GWRM make it possible to evaluate the Group’s risk profile and its global management on an ongoing basis, thus enhancing risk management capabilities at all levels of the organization.
The Group has launched the Santander Advanced Management program to expedite implementation of its strategic projects for improved risk management and control capacity, with a view to positioning the Group as the entity having the best market practice in the current financial scenario.
The program aims to achieve excellence in risk management, at both corporate and local level, whilst at all times maintaining a focus on doing “more and better” business.
The scope of application of the program encompasses all Group units and guarantees the use of a set of uniform management principles in the various regulatory and competitive environments.
3.3. Risk assessment
As part of its routine management, the Group identifies and assesses the financial and non-financial risks inherent to its business activity to which it is exposed in the various geographical areas in which it operates.
3.4. Risk appetite and limits structure
Risk appetite is defined at the Group as the amount and type of risk that it considers reasonable to assume in implementing its business strategy, in order to ensure that it can continue to operate normally if unexpected events occur. To this end, severe scenarios are taken into account, which might have an adverse impact on its levels of capital or liquidity, its profits and/or its share price.
The board of directors is the body responsible for establishing and annually updating the Group’s risk appetite, for monitoring its actual risk profile and for ensuring consistency between the two. The risk appetite is determined both for the Group as a whole and for each of the main business units using a corporate methodology adapted to the circumstances of each unit/market. At local level, the boards of directors of the related subsidiaries are responsible for approving the respective risk appetite proposals once they have been validated by the Group.
3.4.1. Banking business model and fundamentals of the risk appetite
The definition and establishment of the Group’s risk appetite is consistent with its risk culture and its banking business model from the risk perspective. The main features defining the business model, which form the basis of the risk appetite at the Group, are as follows:
F-228
Table of Contents
| • | A predictable general medium-low risk profile based on a diversified business model focusing on retail banking with a diversified international presence and significant market shares, and a wholesale banking model which prioritizes the relationship with the customer base in the Group’s principal markets. |
| • | A stable, recurring earnings generation and shareholder remuneration policy based on a strong capital and liquidity base and a strategy to effectively diversify sources and maturities. |
| • | A corporate structure based on autonomous subsidiaries that are self-sufficient in capital and liquidity terms, minimizing the use of non-operating or purely instrumental companies, and ensuring that no subsidiary has a risk profile that might jeopardize the Group’s solvency. |
| • | An independent risk function with highly active involvement of senior management to guarantee a strong risk culture focused on protecting and ensuring an adequate return on capital. |
| • | Maintaining a management model that ensures that all risks are viewed in a global interrelated way through a robust corporate risk control and monitoring environment with global responsibilities: all risks, all businesses, and all geographical areas. |
| • | A business model that focuses on the products with respect to which the Group considers that it has sufficient knowledge and management capacity (systems, processes and resources). |
| • | The conduct of the Group’s business activity on the basis of a behavior model that safeguards the interests of its customers and shareholders. |
| • | The availability of sufficient and adequate human resources, systems and tools in order to enable the Group to maintain a risk profile compatible with the established risk appetite, at both global and local level. |
| • | The application of a remuneration policy containing the incentives required to ensure that the individual interests of employees and executives are in line with the corporate risk appetite framework and that the incentives are consistent with the Group’s long-term earnings performance. |
3.4.2. Corporate risk appetite principles
The Group’s risk appetite is governed by the following principles at all the entities:
| • | Responsibility of the board and of senior executives. The board of directors of the Bank is the body ultimately responsible for establishing the risk appetite and its supporting regulations, as well as for overseeing compliance therewith. |
| • | Integral view of risk, involving the checking and questioning of the risk profile. The risk appetite should take into consideration all the significant risks to which the Group may be exposed, providing an aggregate view of the Group’s risk profile through the use of quantitative metrics and qualitative indicators. |
| • | Future risk estimate. The risk appetite should take into consideration the desirable risk profile at the present time and in the medium term considering both the most likely circumstances and stress scenarios. |
| • | Links with strategic and business plans and integration in management. The risk appetite is a benchmark in strategic and business planning. |
| • | Risk appetites that are consistent across the various units and risk language that is common to the entire organization. |
| • | Periodic review, ongoing checking and adaptation to best practices and regulatory requirements. |
3.4.3. Limits, monitoring and control structure
The risk appetite exercise is performed annually and includes a series of metrics and limits on the aforementioned metrics that express in quantitative and qualitative terms the maximum risk exposure that each Group entity and the Group as a whole are willing to assume. Compliance with risk appetite limits is subject to ongoing monitoring.
F-229
Table of Contents
3.4.4. Pillars of the risk appetite
The risk appetite is expressed through limits on quantitative metrics and qualitative indicators that measure the Group’s exposure or risk profile by type of risk, portfolio, segment and business line, in both current and stressed conditions. The aforementioned risk appetite metrics and limits are structured around five main pillars that define the position that the Group’s senior management wishes to adopt or maintain in developing its business model.
| • | The volatility in the income statement that the Group is willing to assume. |
| • | The solvency position the Group wishes to maintain. |
| • | The minimum liquidity position the Group wishes to have. |
| • | The maximum concentration levels that the Group considers it reasonable to assume. |
| • | Qualitative aspects and complementary metrics. |
3.5. Scenario analysis
The Group conducts advanced risk management through the analysis of the impact that various scenarios in the environment in which the Bank operates might cause. These scenarios are expressed in terms of both macroeconomic variables and other variables that affect management.
Scenario analysis is a very useful tool for senior management since it allows them to test the Bank’s resistance to stressed environments or scenarios and to implement packages of measures to reduce the Bank’s risk profile vis-à-vis such scenarios.
The main uses of scenario analysis are described below:
| • | Regulatory uses: in which stress tests of scenarios are performed under guidelines set by the regulator. This group of uses includes, for example, the stress tests (comprehensive assessment and stress tests) requested in 2014 by the European Central Bank using the methodology set by the European Banking Authority (EBA). |
| • | Internal capital (ICAAP) or liquidity adequacy assessment processes in which, although the regulator can impose certain requirements, the Bank develops its own methodology to assess its capital and liquidity levels vis-à-vis various stress scenarios. These tools enable capital and liquidity management to be planned. |
| • | Risk appetite. This contains stressed metrics on which maximum loss levels (or minimum liquidity levels) are established that the Bank does not wish to exceed. |
| • | Daily risk management. Scenario analysis is used in budgetary processes for provisions and other balance-sheet aggregates by type of risk, in the generation of commercial risk approval policies, in senior management’s overall analysis of risk or in specific analyses of the profiles of activities or portfolios. |
Corporate scenario analysis project
In response to increasing regulatory pressure and the need for advanced risk management, in 2014 a project was launched to develop a robust scenario analysis structure at corporate level; it is expected that the project will be extended to include the Group’s main units in 2015. This project consists of three main pillars:
F-230
Table of Contents
| • | Scenario analysis tool: implementation of an advanced loss-estimation tool with more robust, automated data handling and a multi-user operating environment. |
| • | Governance: review of the governance framework for scenario analysis exercises in order to adapt to the increasing importance of these analyses, the heightened regulatory pressure and best market practices. |
| • | Stress methodologies: preparation of plans to develop advanced mathematical stress models to improve risk predictability, taking into account the organization’s calculation capabilities. |
3.6. Living wills (recovery and resolution plans)
The Group was the first international financial institution considered to be globally systemic by the Financial Stability Board to present (in 2010) its living will (the most important portion of which envisages the measures that the entity would have available to exit a highly severe crisis situation by itself) to its consolidated supervisor (at that time the Bank of Spain).
In 2014 the fifth version of the corporate living will was prepared. The living will comprises the corporate living will (corresponding to Banco Santander, S.A.) and the individual living wills for the most important local units (the UK, Brazil, Mexico, the US, Germany, Argentina, Chile, Poland and Portugal), thus complying with the commitment made by the Bank to the competent authorities in 2010.
The Group’s senior management keeps itself fully involved in the preparation and periodic monitoring of the content of the living wills by holding specific committee meetings of a technical nature, as well as for monitoring at institutional level, and this ensures that the content and structure of documents are adapted to local and international crisis management legislation, which has been in continuous development in recent years.
The corporate living will is approved by the board of directors or by the executive committee and the executive risk committee, exercising the functions delegated to them. In turn, the individual living wills are approved by local bodies, always in coordination with the Group since they must form part of the corporate living will.
3.7. Independent reporting
One of the key features of the management model is the risk reporting framework, which sets standards that ensure a consolidated view of all risks and facilitate decision-making by the board of directors and senior management.
Accordingly, in 2014 the Group launched a project to ensure that risk reporting to senior management includes the basic principles defined in Risk Data Aggregation, which are summarized in terms of the following cornerstones:
| • | Governance: a governance system and taxonomy are established for the data and reporting life cycles. |
| • | Database architecture: this guarantees the Bank’s ability to aggregate all the risk data in a reliable manner, thereby ensuring that they are accurate, comprehensive, complete, traceable, updated in a timely fashion, adaptable to requirements and flexible. |
| • | Preparation of risk reports for senior management. |
3.8. Internal risk control framework
The risk management model has an internal control environment that ensures appropriate control of all risks and provides an integrated view thereof. This control is performed at all the Group’s units and for each type of risk in order to ensure that the Group’s exposures and overall risk profile are within the framework of the mandates established by both the board of directors and the regulators.
F-231
Table of Contents
The main functions ensuring effective risk control are:
| • | the supervision and aggregate consolidation of all risks. The risk unit, both at corporate level and at each unit, performs the function of supervising all risks with the aim of questioning or independently challenging risk management and risk control mechanisms, providing value judgments and elements to support decision-making by senior management. |
| • | the assessment of internal control mechanisms. This consists of a periodic systematic review of all the necessary control processes and procedures in order to guarantee that they are effective and in force. |
| • | integrated risk control and internal risk validation. The main activities performed by the integrated risk control function include: |
| • | Verifying that the management and control systems for the various risks inherent in Santander Group’s activities comply with the most stringent criteria and the best practices observed in the industry and/or required by regulators. |
| • | Overseeing the adequate compliance, in due time and form, with any recommendations on risk management and control made as a result of inspections conducted by internal audit and by the supervisors to which the Group is subject. |
This function is characterized by having global and corporate scope, encompassing all risks, all businesses and all geographical areas. Performance of this function is based on an internally-developed methodology and a set of tools that support the function, in order to systematize its operation and tailor it to the Group’s specific requirements. As a result, it is possible to formalize application of this methodology and to render it traceable and targetable.
The internal validation of risk models function provides essential support to the executive risk committee and the local and corporate risk committees in the performance of their duties to authorize the use of the models (for management and regulatory purposes) and to review them regularly.
To this end, a fully independent specialized unit of the Group issues an expert opinion on the adequacy of the internal models for the intended internal management and/or regulatory purposes (calculation of regulatory capital, level of provisions, etc.), expressing a conclusion on their robustness, usefulness and effectiveness.
At the Group, internal validation covers all models used in the risk function, i.e. credit, market, structural and operational risk models and economic and regulatory capital models. The scope of the validation includes not only the more theoretical or methodological aspects, but also the technology systems and the data quality that underpin the effective operation of the models and, in general, all the relevant aspects of risk management (controls, reporting, uses, involvement of senior management, etc.).
This function is performed at a global and corporate level in order to ensure uniformity of application, and is implemented through five regional centers located in Madrid, London, São Paulo, Boston and Wroclaw (Poland). From a functional standpoint, these centers are fully accountable to the corporate center, which makes it possible to ensure consistency in the performance of their activities.
| • | Control by the compliance function that the risks assumed are compliant with the legal framework, internal regulations and regulatory and supervisory requirements. |
F-232
Table of Contents
| • | Assessment by internal audit, as the third line of defense, provides an independent review of the first two lines of defense, thus ensuring that the policies, methods and procedures are appropriate and are integrated in management. |
Internal audit is a permanent corporate function that is independent of any other Group function or unit, and its mission is to provide security on such matters to the board of directors and senior management, thus contributing to the protection of the organization and its reputation.
4. CREDIT RISK
4.1 Introduction to the treatment of credit risk
Credit risk is the possibility of loss stemming from the total or partial failure of our customers or counterparties to meet their financial obligations to the Group.
In credit risk management terms, segmentation is based on the distinction between three types of customers:
| • | The individuals segment includes all individuals, except for those engaging in a business activity. This segment is in turn divided into various sub-segments based on income levels, which makes it possible to tailor risk management to each type of customer. |
| • | The SMEs, companies and institutions segment includes legal entities and individuals engaging in a business activity. It also includes public-sector entities in general and not-for-profit private-sector entities. |
| • | The global wholesale banking -BMG- segment comprises corporate customers, financial institutions and sovereigns, which make up a closed list of entities that is reviewed on an annual basis. Inclusion of an entity on this list is determined on the basis of a comprehensive analysis of the enterprise (business, countries in which it operates, types of products used, level of income it represents for the Bank, length of relationship with the customer, etc.). |
The Group has a mainly retail profile, with 85% of its total risk exposure being generated by its commercial banking business.
F-233
Table of Contents
4.2 Main aggregates and variations
Following are the main aggregates relating to credit risk arising on customer business:
MAIN AGGREGATES – RISK MANAGEMENT*
| Credit risk exposure to customers (1) (millions of euros) |
Non-performing loans ratio (%) |
Coverage ratio (%) |
||||||||||||||||||||||
| 2014 | 2013 | 2014 | 2013 | 2014 | 2013 | |||||||||||||||||||
| Continental Europe |
308,205 | 312,167 | 8.93 | 9.13 | 57.2 | 57.3 | ||||||||||||||||||
| Spain |
182,974 | 189,783 | 7.38 | 7.49 | 45.5 | 44.0 | ||||||||||||||||||
| Santander Consumer Finance (1) |
63,654 | 58,628 | 4.82 | 4.01 | 100.1 | 105.3 | ||||||||||||||||||
| Portugal |
25,588 | 26,810 | 8.89 | 8.12 | 51.8 | 50.0 | ||||||||||||||||||
| Poland |
18,920 | 18,101 | 7.42 | 7.84 | 60.3 | 61.8 | ||||||||||||||||||
| UK |
256,337 | 235,627 | 1.79 | 1.98 | 41.9 | 41.6 | ||||||||||||||||||
| Latin America |
167,065 | 146,392 | 4.65 | 5.00 | 84.7 | 85.4 | ||||||||||||||||||
| Brazil |
90,572 | 79,216 | 5.05 | 5.64 | 95.4 | 95.1 | ||||||||||||||||||
| Mexico |
27,893 | 24,024 | 3.84 | 3.66 | 86.1 | 97.5 | ||||||||||||||||||
| Chile |
33,514 | 31,645 | 5.97 | 5.91 | 52.4 | 51.1 | ||||||||||||||||||
| Argentina |
5,703 | 5,283 | 1.61 | 1.42 | 143.3 | 140.4 | ||||||||||||||||||
| US |
72,477 | 44,372 | 2.54 | 2.60 | 192.8 | 86.6 | ||||||||||||||||||
| Puerto Rico |
3,871 | 4,023 | 7.45 | 6.29 | 55.6 | 61.6 | ||||||||||||||||||
| Santander Bank N.A. |
45,825 | 40,349 | 1.41 | 2.23 | 109.4 | 93.6 | ||||||||||||||||||
| SC USA |
22,782 | — | 3.97 | — | 296.2 | — | ||||||||||||||||||
| Total Group |
804,084 | 738,558 | 5.19 | 5.64 | 67.2 | 61.7 | ||||||||||||||||||
| (1) | Including gross loans and advances to customers, guarantees and documentary credits. |
In 2014 credit risk exposure to customers increased by 9%. This growth was experienced across-the-board, with the exception of Spain, Portugal and Puerto Rico. The Group’s non-performing loans ratio fell to 5.19%. Its coverage ratio stood at 67%. It is important to take into account that this ratio is reduced by the relatively high proportion of mortgage portfolios (especially in the UK and Spain), which require lower provisions since they are secured by collateral.
4.3. Detail of the main geographical areas
Following is a description of the portfolios in the geographical areas where the Group’s risk concentration is highest.
4.3.1. United Kingdom
Credit risk exposure to UK customers amounted to EUR 256,337 million at the end of December 2014, and represented 32% of the Group total.
Due to its importance, not only to Santander UK, but also to the Group’s lending activity as a whole, the mortgage loan portfolio (which totaled EUR 193,048 million at the end of December 2014) must be highlighted.
This portfolio is composed of first-mortgage home purchase or home improvements loans to new and existing customers, since transactions involving second or successive liens on mortgaged properties are no longer originated.
F-234
Table of Contents
The property on which the mortgage guarantee is constituted must always be located in the UK, irrespective of where the funding is to be employed, except for certain one-off transactions. Loans may be granted for the purchase of residences abroad, but the mortgage guarantee must in all cases be constituted on a property located in the UK.
Geographically speaking, the credit risk exposure is concentrated mainly in the South East of the country, particularly in the metropolitan area of London, where house price indices display a more stable behavior, even in times of economic slowdown.
All properties are appraised independently prior to the approval of each new transaction, in accordance with the Group’s risk management principles.
For mortgage loans that have already been granted, the appraised value of the mortgaged property is updated quarterly by an independent agency using an automatic appraisal system in accordance with standard procedure in the market and in compliance with current legislation.
The non-performing loans ratio of the mortgage segment fell from 1.88% in 2013 to 1.64% at 2014 year-end. This decrease in the non-performing loans ratio was based on the behavior of non-performing loans, which improved significantly as a result of the more favorable macroeconomic environment and the increase in re-performing loans due to the improved efficiency of the recovery teams.
The credit policies limit the maximum loan-to-value ratio to 90% for loans on which principal and interest are repaid and to 50% for loans on which interest is paid periodically and the principal is repaid on maturity.
Current credit risk policies expressly prohibit loans considered to be high risk (subprime mortgages), and establish demanding requirements regarding the credit quality of both loans and customers. For example, the granting of mortgage loans with LTVs exceeding 100% has been forbidden since 2009.
Another indicator of the sound performance of the portfolio is the small volume of foreclosed properties, which amounted to EUR 75 million at December 2014. The efficient management of foreclosures, coupled with the existence of a dynamic market for foreclosed homes, makes it possible to sell these properties in a short space of time (on average approximately 18 weeks).
4.3.2. Spain
Portfolio overview
Total credit risk exposure in Spain (including guarantees and documentary credits but excluding the discontinued real estate operations unit - discussed below) amounted to EUR 182,974 million (23% of the Group total), with an adequate degree of diversification in terms of both products and customer segments.
2014 marked a turning point in the downward trend in total credit risk exposure. Although in year-on-year terms lending was still down by 4%, the second half of the year already witnessed moderate growth figures, mirroring the improved economic situation and the various strategies implemented. The non-performing loans ratio for the total portfolio stood at 7.38% and the coverage ratio rose to 45%.
Portfolio of home purchase loans to families
Home purchase loans granted to families in Spain stood at EUR 52,942 million at 2014 year-end. Of this amount, 99% was secured by mortgages.
F-235
Table of Contents
| 12-31-14 | ||||||||
| In millions of euros |
Gross amount | Of which: Non-performing |
||||||
| Home purchase loans to families |
52,942 | 3,059 | ||||||
| Without mortgage guarantee |
493 | 61 | ||||||
| With mortgage guarantee |
52,449 | 2,998 | ||||||
The risk profile of the home purchase mortgage loan portfolio in Spain remained at a medium-low level, with limited prospects of additional impairment:
| • | All mortgage transactions include principal repayments from the very first day. |
| • | Early repayment is common practice and, accordingly, the average life of the transactions is far shorter than their contractual term. |
| • | Debtors provide all their assets as security, not just the home. |
| • | High quality of collateral, since the portfolio consists almost exclusively of principal-residence loans. |
| • | Stable average debt-to-income ratio at around 29%. |
| • | 73% of the portfolio has an LTV of less than 80%. In 2014 a re-appraisal encompassing substantially all the mortgage portfolio was conducted, in keeping with supervisory requirements. |
| 12-31-14 | ||||||||||||||||||||||||
| Loan to value ratio | ||||||||||||||||||||||||
| In millions of euros |
Less than or equal to 40% |
More than 40% and less than 60% |
More than 60% and less than 80% |
More than 80% and less than or equal to 100% |
More than 100% |
Total | ||||||||||||||||||
| Initial gross amount |
5,113 | 10,071 | 22,855 | 11,155 | 3,255 | 52,449 | ||||||||||||||||||
| Of which: Non-performing |
90 | 228 | 685 | 694 | 1,301 | 2,998 | ||||||||||||||||||
For internal management purposes, the Group updates the LTV ratios at least once a year, taking into consideration published house price indices. Also, if a debtor becomes non-performing the Group updates the appraisals undertaken by valuers, which are taken into account in the estimate of impairment losses.
Companies portfolio
The EUR 96,884 million of direct credit risk exposure to SMEs and companies constitute the most important lending segment in Spain, representing 53% of the total.
94% of the portfolio relates to customers to which an analyst has been assigned who monitors the customer on an ongoing basis in all the phases of the risk cycle.
The non-performing loans ratio of this portfolio stood at 8.91% in 2014, impacted mainly by the fall in lending.
F-236
Table of Contents
Real estate business
The Group manages, as a separate unit, its real estate business, which includes loans to customers engaging mainly in property development, for which a specialized management model is in place, the investment in SAREB and foreclosed assets.
In recent years the Group’s strategy has been geared towards reducing these assets. The changes in gross property development loans to customers were as follows:
| Millions of euros | ||||||||||||
| 12-31-14 | 12-31-13 | 12-31-12 | ||||||||||
| Balance as at beginning of year (net) |
12,105 | 15,867 | 23,442 | |||||||||
| Foreclosed assets |
(357 | ) | (848 | ) | (930 | ) | ||||||
| Reductions (1) |
(2,015 | ) | (2,114 | ) | (5,670 | ) | ||||||
| Charged-off assets |
(384 | ) | (800 | ) | (975 | ) | ||||||
|
|
|
|
|
|
|
|||||||
| Balance as at end of year (net) |
9,349 | 12,105 | 15,867 | |||||||||
|
|
|
|
|
|
|
|||||||
| (1) | Includes sales of portfolios, cash recoveries and third-party subrogations |
The NPL ratio of this portfolio ended the year at 67.3% (compared with 61.7% at December 2013) due to the increase in the proportion of non-performing assets in the problem loan portfolio and, in particular, to the sharp reduction in lending in this segment. The table below shows the distribution of the portfolio. The coverage ratio of the real estate exposure in Spain stands at 42.5%.
| 12-31-14 | ||||||||||||
| Millions of euros |
Gross amount | Excess over collateral value |
Specific allowance |
|||||||||
| Financing for construction and property development recognized by the Group’s credit institutions (business in Spain) |
9,349 | 4,218 | 3,974 | |||||||||
| Of which: Non-performing |
6,292 | 3,175 | 3,400 | |||||||||
| Of which: Substandard |
1,529 | 623 | 574 | |||||||||
| Memorandum item: Charged-off assets |
1,888 | |||||||||||
| Memorandum item: Data from the public consolidated balance sheet |
12-31-14 | |||
| Millions of euros |
Carrying amount |
|||
| Total loans and advances to customers excluding the public sector (business in Spain) |
154,906 | |||
| Total consolidated assets |
1,266,296 | |||
| Impairment losses and credit risk allowances. Collective coverage (business in Spain) |
253 | |||
F-237
Table of Contents
At year-end, the concentration of this portfolio was as follows:
| Loans: Gross amount |
||||
| 12-31-14 | ||||
| 1. Without mortgage guarantee |
1,011 | |||
| 2. With mortgage guarantee |
8,338 | |||
| 2.1 Completed buildings |
4,440 | |||
| 2.1.1 Residential |
2,096 | |||
| 2.1.2 Other |
2,344 | |||
| 2.2 Buildings under construction |
546 | |||
| 2.2.1 Residential |
457 | |||
| 2.2.2 Other |
89 | |||
| 2.3 Land |
3,352 | |||
| 2.3.1 Developed land |
2,882 | |||
| 2.3.2 Other land |
470 | |||
|
|
|
|||
| Total |
9,349 | |||
|
|
|
|||
Policies and strategies in place for the management of these risks
The policies in force for the management of this portfolio, which are reviewed and approved on a regular basis by the Group’s senior management, are currently geared towards reducing and securing the outstanding exposure, albeit without neglecting any viable new business that may be identified.
In order to manage this credit exposure, the Group has specialized teams that not only form part of the risk areas but also supplement the management of this exposure and cover the entire life cycle of these transactions: commercial management, legal procedures and potential recovery management.
As has already been discussed in this section, the Group’s anticipatory management of these risks enabled it to significantly reduce its exposure, and it has a granular, geographically diversified portfolio in which the financing of second residences accounts for a very small proportion of the total.
Mortgage lending on non-urban land represents a low percentage of mortgage exposure to land, while the remainder relates to land already classified as urban or approved for development.
The significant reduction of exposure in the case of residential financing projects in which the construction work has already been completed was based on various actions. As well as the specialized marketing channels already in existence, campaigns were carried out with the support of specific teams of managers for this function who, in the case of the Santander Network, were directly supervised by the recoveries business area. These campaigns, which involved the direct management of the projects with property developers and purchasers, reducing sale prices and adapting the lending conditions to the buyers’ needs, enabled loans already in force to be subrogated. These subrogations enable the Group to diversify its risk in a business segment that displays a clearly lower non-performing loans ratio.
The loan approval processes are managed by specialist teams which, working in direct coordination with the sales teams, have a set of clearly defined policies and criteria:
| • | Property developers with a robust solvency profile and a proven track record in the market. |
| • | Strict criteria regarding the specific parameters of the transactions: exclusive financing for the construction cost, high percentages of accredited sales, principal residence financing, etc. |
| • | Support of financing of government-subsidized housing, with accredited sales percentages. |
| • | Restricted financing of land purchases, subject to the restoration of a sufficient level of coverage in existing financing arrangements or to the obtainment of increased collateral. |
F-238
Table of Contents
In addition to the permanent control performed by its risk monitoring teams, the Group has a specialist technical unit that monitors and controls this portfolio with regard to the stage of completion of construction work, planning compliance and sales control, and validates and controls progress billing payments. The Group has created a set of specific tools for this function. All mortgage distributions, amounts drawn down of any kind, changes made to the grace periods, etc. are authorized on a centralized basis.
In the case of construction-phase projects that are experiencing difficulties of any kind, the policy adopted is to ensure completion of the construction work so as to obtain completed buildings that can be sold in the market. To achieve this aim, the projects are analyzed on a case-by-case basis in order to adopt the most effective series of measures for each case (structured payments to suppliers to ensure completion of the work, specific schedules for drawing down amounts, etc.).
The management of on-balance-sheet property assets is performed by companies that specialize in the sale of property, which is supplemented by the commercial network structure. The sale prices are reduced in line with market conditions.
Foreclosed properties
As a last resort, the acquisition and foreclosure of property assets is one of the mechanisms adopted in Spain in order to manage the portfolio efficiently. At December 31, 2014, the net balance of these assets amounted to EUR 4,597 million (gross amount: EUR 9,760 million; recognized allowance: EUR 5,163 million).
The following table shows the detail of the assets foreclosed by the businesses in Spain at the end of 2014:
| 12-31-14 | ||||||||
| Millions of euros |
Carrying amount |
Of which: Allowance |
||||||
| Property assets from financing provided to construction and property development companies |
3,648 | 4,443 | ||||||
| Of which: |
||||||||
| Completed buildings |
1,182 | 930 | ||||||
| Residential |
514 | 415 | ||||||
| Other |
668 | 515 | ||||||
| Buildings under construction |
465 | 449 | ||||||
| Residential |
465 | 449 | ||||||
| Other |
— | — | ||||||
| Land |
2,001 | 3,064 | ||||||
| Developed land |
723 | 1,065 | ||||||
| Other land |
1,278 | 1,999 | ||||||
| Property assets from home purchase mortgage loans to households |
949 | 720 | ||||||
| Other foreclosed property assets |
— | — | ||||||
|
|
|
|
|
|||||
| Total property assets |
4,597 | 5,163 | ||||||
|
|
|
|
|
|||||
| Equity instruments, ownership interests and financing provided to non-consolidated companies holding these assets |
473 | 924 | ||||||
|
|
|
|
|
|||||
| Total |
5,070 | 6,087 | ||||||
|
|
|
|
|
|||||
In recent years, the Group has considered foreclosure to be a more efficient method for resolving cases of default than legal proceedings. The Group initially recognizes foreclosed assets at the lower of the carrying amount of the debt (net of provisions) and the fair value of the foreclosed asset (less estimated costs to sell). If fair value (less costs to sell) is lower than the net value of the loan, the difference is recognized under Impairment losses on financial assets (net) - Loans and receivables in the consolidated income statement for the year. Subsequent to initial recognition, the assets are measured at the lower of fair value (less costs to sell) and the amount initially recognized . The fair value of this type of assets is determined by the Group’s directors based on evidence obtained from qualified valuers or evidence of recent transactions.
F-239
Table of Contents
The changes in foreclosed properties were as follows:
| Thousands of millions of euros |
||||||||
| 2014 | 2013 | |||||||
| Gross additions |
1.8 | 1.9 | ||||||
| Disposals |
(0.9 | ) | (0.9 | ) | ||||
| Difference |
0.9 | 1.0 | ||||||
4.3.3. Brazil
Credit risk exposure in Brazil amounts to EUR 90,572 million (11.2% of the Group total), is adequately diversified and has a predominantly retail profile, with 51% of lending granted to individual, consumer finance and SME customers.
In 2014 the exposure grew by 5.13% (excluding changes in exchange rates) as compared with 7.1% in 2013. This growth is in line with the average performance of private banks in Brazil. The non-performing loans ratio ended the year at 5.05%, down from 5.64% at 2013 year-end, and the NPL coverage ratio stood at 95% at December 2014.
4.4. Credit risk from other standpoints
4.4.1. Credit risk from financial market operations
This concept includes the credit risk arising in treasury operations with customers, mainly credit institutions. These operations are performed using both money market financing products arranged with various financial institutions and products with counterparty risk intended to provide service to the Group’s customers.
As defined in Chapter 6 of the CRR (Regulation (EU) No 575/2013), counterparty credit risk is the risk that the counterparty to a transaction could default before the final settlement of the transaction’s cash flows. It includes the following types of transaction: derivative instruments, repurchase agreements, securities or commodities lending transactions, deferred settlement transactions and guarantee financing transactions.
The Group uses two methods to measure its exposure to this risk: a mark-to-market method (replacement cost for derivatives or amount drawn down for committed facilities) including an add-on for potential future exposure; and another method, introduced in mid-2014 for certain regions and products, which calculates exposure using Monte Carlo simulations. Calculations are also performed of capital at risk or unexpected loss (i.e. the loss which, once the expected loss is subtracted, constitutes the economic capital, net of guarantees and recoveries).
When the markets close, the exposures are recalculated by adjusting all the transactions to their new time horizon, the potential future exposure is adjusted and mitigation measures are applied (netting arrangements, collateral arrangements, etc.) so that the exposures can be controlled daily against the limits approved by senior management. Risk control is performed using an integrated, real-time system that enables the Group to know at any time the unused exposure limit with respect to any counterparty, for any product and maturity and at any Group unit.
F-240
Table of Contents
4.4.2. Concentration risk
Concentration risk control is key to the risk management process. The Group continuously monitors the degree of credit risk concentration, by country, sector and customer group.
The board of directors, by reference to the risk appetite, determines the maximum levels of concentration over risk appetite and limit structure. In keeping with the risk appetite, the executive risk committee establishes the risk policies and reviews the appropriate exposure limits to ensure the adequate management of credit risk concentration.
The Group is subject to the regulation of “large exposures” contained in Part Four of CRR (Regulation (EU) No 575/2013), according to which an institution’s exposure to a customer or group of connected customers is considered a “large exposure” where its value is equal to or exceeds 10% of its eligible capital. Additionally, in order to limit large exposures, an institution may not incur an exposure to a customer or group of connected customers the value of which exceeds 25% of its eligible capital, after taking into account the effect of the credit risk mitigation contained in the Regulation.
At the end of December 2014, after applying risk mitigation techniques and the regulations applicable to large exposures, the exposure to each of the reported groups was below 4.7% of eligible capital, with the exception of one central counterparty in the EU, the exposure to which stood at 7.3%.
For its part, the Group’s regulatory credit exposure to the 20 largest groups classified as large exposures accounted for 5.5% of the credit risk exposure to customers (lending plus off-balance-sheet exposures). The regulatory credit exposure to the top 10 international financial institutions (IFIs) amounted to EUR 18,378 million.
The Group’s risk division works closely with the finance division in the active management of credit portfolios, which includes reducing the concentration of exposures through several techniques, such as the arrangement of credit derivatives for hedging purposes or the performance of securitization transactions, in order to optimize the risk/return ratio of the total portfolio.
F-241
Table of Contents
The detail, by activity and geographical area of the counterparty, of the concentration of the Group’s risk at December 31, 2014 is as follows:
| 12/31/14 | ||||||||||||||||||||
| Millions of euros |
Total | Spain | Other EU Countries |
Americas | Rest of the world |
|||||||||||||||
| Credit institutions |
167,414 | 28,770 | 85,429 | 45,949 | 7,266 | |||||||||||||||
| Public sector |
159,589 | 58,794 | 33,398 | 61,874 | 5,523 | |||||||||||||||
| Of which: |
||||||||||||||||||||
| Central government |
130,594 | 38,214 | 32,620 | 54,318 | 5,442 | |||||||||||||||
| Other |
28,995 | 20,580 | 778 | 7,556 | 81 | |||||||||||||||
| Other financial institutions |
55,115 | 13,501 | 15,976 | 23,535 | 2,103 | |||||||||||||||
| Non-financial companies and individual traders |
319,661 | 89,824 | 89,349 | 127,000 | 13,488 | |||||||||||||||
| Of which: |
||||||||||||||||||||
| Construction and property development |
25,880 | 7,123 | 7,028 | 10,844 | 885 | |||||||||||||||
| Civil engineering construction |
5,916 | 2,937 | 2,402 | 517 | 60 | |||||||||||||||
| Large companies |
175,865 | 42,190 | 45,392 | 78,127 | 10,156 | |||||||||||||||
| SMEs and individual traders |
112,000 | 37,574 | 34,527 | 37,512 | 2,387 | |||||||||||||||
| Other households and non-profit institutions serving households |
447,545 | 66,539 | 272,767 | 104,032 | 4,207 | |||||||||||||||
| Of which: |
||||||||||||||||||||
| Residential |
305,546 | 51,579 | 220,072 | 33,523 | 372 | |||||||||||||||
| Consumer loans |
121,458 | 9,412 | 50,389 | 58,168 | 3,489 | |||||||||||||||
| Other purposes |
20,541 | 5,548 | 2,306 | 12,341 | 346 | |||||||||||||||
|
|
|
|
|
|
|
|
|
|
|
|||||||||||
| Subtotal |
1,149,324 | 257,428 | 496,919 | 362,390 | 32,587 | |||||||||||||||
|
|
|
|
|
|
|
|
|
|
|
|||||||||||
| Less: collectively assessed impairment losses |
5,983 | |||||||||||||||||||
|
|
|
|||||||||||||||||||
| Total (*) |
1,143,341 | |||||||||||||||||||
|
|
|
|||||||||||||||||||
| (*) | For the purposes of this table, the definition of risk includes the following items in the consolidated balance sheet: Loans and advances to credit institutions, Loans and advances to customers, Debt instruments, Equity instruments, Trading derivatives, Hedging derivatives, Investments and Contingent liabilities. |
4.4.3. Country risk
Country risk is a credit risk component inherent in all cross-border credit transactions due to circumstances other than ordinary commercial risk. Its main elements are sovereign risk, transfer risk and other risks that can affect international financial operations (war, natural disasters, balance of payments crises, etc.).
At December 31, 2014, the provisionable country risk exposure amounted to EUR 176 million (2013: EUR 382 million). The allowance recognized in this connection at 2014 year-end amounted to EUR 22 million, as compared with EUR 47 million at 2013 year-end. It should be noted that in 2014 Colombia was considered to be a country belonging to Group 2 instead of Group 3 per the Bank of Spain country risk classification.
The exposure is moderate and has continued the downward trend witnessed in recent years, the decrease in 2014 being more pronounced as a result of transactions that matured in the year. Total country risk exposure, irrespective of whether or not it is provisionable, is also moderate. Except for the Group 1 countries (considered by the Bank of Spain to have the lowest level of risk 6), exposure to an individual country in no case exceeds 1% of the Group’s total assets.
The Group’s country risk management policies continued to adhere to a principle of maximum prudence, and country risk is assumed, applying highly selective criteria, in transactions that are clearly profitable for the Group and bolster its global relationship with its customers.
| 6 | This group includes transactions with ultimate obligors resident in European Union countries, Norway, Switzerland, Iceland, the US, Canada, Japan, Australia and New Zealand. |
F-242
Table of Contents
4.4.4. Sovereign risk and exposure to other public sector entities
As a general rule, the Group considers sovereign risk to be the risk assumed in transactions with the central bank (including the regulatory cash reserve requirement), the issuer risk of the Treasury or similar body (government debt securities) and the risk arising from transactions with public entities that have the following features: their funds are obtained only from fiscal income; they are legally recognized as entities directly included in the central government public sector; and their activities are of a non-commercial nature.
This criterion, which has been employed historically by the Group, differs in certain respects from that required by the European Banking Authority (EBA) for its periodic stress tests. The most significant differences are that the EBA’s criteria do not include risk exposure to central banks, exposure to insurance companies or indirect exposure by means of guarantees or other instruments. However, they do include exposure to public sector entities (including regional and local entities) in general, not only the central government public sector.
Sovereign risk exposure (per the criteria applied at the Group) arises mainly from the subsidiary banks’ obligations to make certain deposits at the corresponding central banks, from the arrangement of deposits using liquidity surpluses, and from the fixed-income portfolios held as part of the on-balance-sheet structural interest rate risk management strategy and in the trading books of the treasury departments. The vast majority of these exposures are taken in local currency and are financed out of local customer deposits, also denominated in local currency.
The detail at December 31, 2014, 2013 and 2012, based on the Group’s management of each portfolio, of the Group’s sovereign risk exposure, net of the short positions held with the respective countries, taking into consideration the aforementioned criterion established by the European Banking Authority (EBA), is as follows:
| 12-31-14 | ||||||||||||||||
| Millions of euros | ||||||||||||||||
| Portfolio | ||||||||||||||||
| Country |
Financial assets held for trading and Other financial assets at fair value through profit or loss (*) |
Available-for-sale financial assets |
Loans and receivables |
Total net direct exposure |
||||||||||||
| Spain |
5,778 | 23,893 | 15,098 | 44,769 | ||||||||||||
| Portugal |
104 | 7,811 | 589 | 8,504 | ||||||||||||
| Italy |
1,725 | — | — | 1,725 | ||||||||||||
| Greece |
— | — | — | — | ||||||||||||
| Ireland |
— | — | — | — | ||||||||||||
| Rest of eurozone |
(1,070 | ) | 3 | 1 | (1,066 | ) | ||||||||||
| UK |
(613 | ) | 6,669 | 144 | 6,200 | |||||||||||
| Poland |
5 | 5,831 | 30 | 5,866 | ||||||||||||
| Rest of Europe |
1,165 | 444 | 46 | 1,655 | ||||||||||||
| US |
88 | 2,897 | 664 | 3,649 | ||||||||||||
| Brazil |
11,144 | 17,685 | 783 | 29,612 | ||||||||||||
| Mexico |
2,344 | 2,467 | 3,464 | 8,275 | ||||||||||||
| Chile |
593 | 1,340 | 248 | 2,181 | ||||||||||||
| Rest of Americas |
181 | 1,248 | 520 | 1,949 | ||||||||||||
| Rest of the world |
4,840 | 906 | 618 | 6,364 | ||||||||||||
|
|
|
|
|
|
|
|
|
|||||||||
| Total |
26,284 | 71,194 | 22,205 | 119,683 | ||||||||||||
|
|
|
|
|
|
|
|
|
|||||||||
| (*) | Net of short positions amounting to EUR 3,187 million. |
F-243
Table of Contents
In addition, at December 31, 2014, the Group had net direct derivative exposures the fair value of which amounted to EUR 1,028 million and net indirect derivative exposures the fair value of which amounted to EUR 5 million. Also, the Group did not have any exposure to held-to-maturity investments.
| 12-31-13 | ||||||||||||||||
| Millions of euros | ||||||||||||||||
| Portfolio | ||||||||||||||||
| Country |
Financial assets held for trading and other financial assets at fair value through profit or loss (*) |
Available-for-sale financial assets |
Loans and receivables |
Total net direct exposure |
||||||||||||
| Spain |
4,359 | 21,144 | 12,864 | 38,367 | ||||||||||||
| Portugal |
148 | 2,076 | 583 | 2,807 | ||||||||||||
| Italy |
1,309 | 77 | — | 1,386 | ||||||||||||
| Greece |
— | — | — | — | ||||||||||||
| Ireland |
— | — | — | — | ||||||||||||
| Rest of eurozone |
(1,229 | ) | 67 | — | (1,161 | ) | ||||||||||
| UK |
(1,375 | ) | 3,777 | — | 2,402 | |||||||||||
| Poland |
216 | 4,770 | 43 | 5,030 | ||||||||||||
| Rest of Europe |
5 | 117 | — | 122 | ||||||||||||
| US |
519 | 2,089 | 63 | 2,671 | ||||||||||||
| Brazil |
8,618 | 8,901 | 223 | 17,743 | ||||||||||||
| Mexico |
3,188 | 2,362 | 2,145 | 7,695 | ||||||||||||
| Chile |
(485 | ) | 1,037 | 534 | 1,086 | |||||||||||
| Rest of Americas |
268 | 619 | 663 | 1,550 | ||||||||||||
| Rest of the world |
5,219 | 596 | 146 | 5,964 | ||||||||||||
|
|
|
|
|
|
|
|
|
|||||||||
| Total |
20,762 | 47,632 | 17,268 | 85,661 | ||||||||||||
|
|
|
|
|
|
|
|
|
|||||||||
| (*) | Net of short positions amounting to EUR 17,658 million. |
In addition, at December 31, 2013, the Group had net direct derivative exposures the fair value of which amounted to EUR (206) million and net indirect derivative exposures the fair value of which amounted to EUR 6 million. Also, the Group did not have any exposure to held-to-maturity investments.
F-244
Table of Contents
| 12-31-12 | ||||||||||||||||
| Millions of euros | ||||||||||||||||
| Portfolio | ||||||||||||||||
| Country |
Financial assets held for trading and other financial assets at fair value through profit or loss (*) |
Available-for-sale financial assets |
Loans and receivables |
Total net direct exposure |
||||||||||||
| Spain |
4,403 | 24,654 | 16,528 | 45,586 | ||||||||||||
| Portugal |
— | 1,684 | 616 | 2,300 | ||||||||||||
| Italy |
(71 | ) | 76 | — | 4 | |||||||||||
| Greece |
— | — | — | — | ||||||||||||
| Ireland |
— | — | — | — | ||||||||||||
| Rest of eurozone |
943 | 789 | — | 1,731 | ||||||||||||
| UK |
(2,628 | ) | 4,419 | — | 1,792 | |||||||||||
| Poland |
669 | 2,898 | 26 | 3,592 | ||||||||||||
| Rest of Europe |
10 | — | — | 10 | ||||||||||||
| US |
(101 | ) | 1,783 | 30 | 1,712 | |||||||||||
| Brazil |
14,067 | 11,745 | 351 | 26,163 | ||||||||||||
| Mexico |
4,510 | 2,444 | 2,381 | 9,335 | ||||||||||||
| Chile |
(293 | ) | 1,667 | 521 | 1,895 | |||||||||||
| Rest of Americas |
214 | 916 | 771 | 1,900 | ||||||||||||
| Rest of the world |
1,757 | 645 | 234 | 2,636 | ||||||||||||
|
|
|
|
|
|
|
|
|
|||||||||
| Total |
23,480 | 53,718 | 21,457 | 98,655 | ||||||||||||
|
|
|
|
|
|
|
|
|
|||||||||
| (*) | Net of short positions amounting to EUR 15,282 million. |
In addition, at December 31, 2012, the Group had net direct derivative exposures the fair value of which amounted to EUR (330) million and net indirect derivative exposures the fair value of which amounted to EUR (33) million. Also, the Group did not have any exposure to held-to-maturity investments.
4.4.5. Environmental risk
In line with the Group’s commitment to sustainability, the environmental risk analysis of credit transactions is one of the main features of the strategic corporate social responsibility plan. The analysis is founded on two major cornerstones:
| • | The Equator Principles: an initiative of the International Finance Corporation of the World Bank. These principles constitute an international standard for the analysis of the social and environmental implications of project finance transactions and corporate loans for known purposes. The assumption of these principles involves a commitment to assess and take into consideration social and environmental risk and, accordingly, to grant loans only to those projects that can evidence that their social and environmental impacts are properly managed. |
| • | The VIDA tool: implemented since 2004, the main aim of this tool is to assess the environmental risk of both current and potential individualized companies in commercial banking (Spain), using a system that classifies each of the companies into one of seven categories, depending on the degree of environmental risk incurred. |
4.5. Credit risk cycle
The credit risk management process consists of identifying, analyzing, controlling and deciding on, as appropriate, the risks incurred in the Group’s operations. The parties involved in this process are the business areas, senior management and the risk units.
F-245
Table of Contents
The process involves the board of directors, the executive committee and the executive risk committee, which establishes the risk policies and procedures, and the limits and delegations of powers, and approves and supervises the scope of action of the risk function.
The risk cycle comprises three different phases: pre-sale, sale and post-sale. The process is being permanently updated, with the findings and conclusions of the post-sale phase being fed back into the risk analysis and planning of the pre-sale phase.
4.5.1. Risk analysis and credit rating process
In general, the risk analysis consists of examining the customer’s ability to meet its contractual obligations to the Bank. This involves analyzing the customer’s credit quality, its risk transactions, its solvency and the return to be obtained in view of the risk assumed.
Since 1993 the Group has used rating models for this purpose. These mechanisms are used in both the wholesale segment (sovereigns, financial institutions and corporate banking) and the other companies and institutions segment.
The rating is obtained from a quantitative module based on balance sheet ratios or macroeconomic variables and supplemented by the analyst’s expert judgment.
Ratings assigned to customers are reviewed periodically to include any new financial information available and the experience in the banking relationship. The frequency of the reviews is increased in the case of customers that reach certain levels in the automatic warning systems and of customers classified as requiring special monitoring. The rating tools themselves are also reviewed in order to progressively fine-tune the ratings they provide.
In contrast to the use of ratings in the wholesale and other companies and institutions segments, in the individuals segment scoring techniques predominate; in general, these tools automatically assign a score to proposed transactions.
4.5.2. Risk limit planning and setting
The purpose of this phase is to efficiently and comprehensively limit the risk levels the Group assumes.
The credit risk planning process is used to establish the budgets and limits at portfolio or customer level depending on the segment in question.
Thus, the risk limits are planned and set using documents agreed upon by the business areas and risk units and approved by the executive risk committee or its delegated committees, which contain the expected results of transactions in terms of risk and return, as well as the limits applicable to the activity and the related risk management.
Risk limit planning is instrumented through the Commercial Strategic Plan (PEC), thus ensuring the coordination of the business plan, the risk-appetite-based lending policy and the resources required to implement it. This Plan serves as a reference for all the commercial banking businesses, and the highest-ranking executive risk committee of each entity is responsible for the approval and monitoring of the commercial strategic plans.
F-246
Table of Contents
Also, an analysis is conducted at customer level in the wholesale and other companies and institutions segments. When certain features concur, an individual limit is established for the customer (pre-classification).
Thus, for large corporate groups a pre-classification model based on an economic capital measurement and monitoring system is used. The result of the pre-classification is the maximum level of risk that can be assumed vis-à-vis a customer or group in terms of amount or maturity. In the companies segment, a simplified pre-classification model is applied for customers meeting certain requirements (thorough knowledge, rating, etc.).
Scenario analysis
Credit risk scenario analysis enables senior management to gain a clearer understanding of the performance of the portfolio in response to changing market and circumstantial conditions and it is a basic tool for assessing the adequacy of the provisions recognized and the capital held to cater for stress scenarios.
These analyses, which are performed for all the Group’s significant portfolios, comprise the following milestones:
| • | Definition of benchmark scenarios (at global level and for each of the Group units). |
| • | Determination of the value of the risk metrics and parameters (probability of default, loss given default, non-performing loans ratio, etc.) in various scenarios |
| • | Estimation of the expected loss associated with each of the scenarios considered and comparison of that loss against the level of provisions. |
| • | Analysis of the changes in the credit risk profile at portfolio, segment, unit and Group level in various scenarios and in comparison with previous years. |
The simulation models used by the Group rely on data from a complete economic cycle to calibrate the behavior of the credit risk parameters in response to changes in the macroeconomic variables. These models undergo regular backtesting and recalibration processes in order to ensure that they provide a correct reflection of the relationship between the macroeconomic variables and the risk parameters.
The risk and loss parameters are projected, usually with a three-year time horizon, using various economic scenarios that include the main macroeconomic variables (GDP, unemployment rate, housing prices, inflation, etc.).
The economic scenarios defined are based on different stress levels, ranging from the base or most probable scenario to more stressed economic scenarios which, although less probable, could possibly arise.
These scenarios are generally defined by the Group’s economic research service, in coordination with each unit, using as a reference the data published by the main international organizations.
A global stress scenario is defined that describes a situation of worldwide crisis and the manner in which it affects each of the main geographical regions in which the Group is present. In addition, a local stress scenario is defined which, affecting certain of the Group’s main units in an isolated fashion, includes a higher level of stress than the global stress scenario.
At the meetings of the executive risk committee, senior management of the Group is apprised of the definitive set of scenarios to be used in conducting the Group’s stress test, proposes any changes it deems appropriate and gives its formal approval.
F-247
Table of Contents
4.5.3. Transaction decision-making
The sale phase comprises the decision-making process, the aim of which is to analyze and resolve upon transactions, since approval by the risk unit is a pre-requisite for the arrangement of any risk transaction. This process must consider the transaction approval policies defined and take into account both the risk appetite and any transaction elements that are important in achieving a balance between risk and return.
In the sphere of lower-revenue individuals, businesses and SMEs, the management of large volumes of loan transactions is facilitated by the use of automatic decision-making models that rate the customer/loan relationship. Thus, loans are classified in homogeneous risk groups using the rating assigned to the transaction by the model on the basis of information on the features of the transaction and the borrower.
As stated above, the preliminary limit-setting stage can follow two different paths, giving rise to different types of decisions in the companies sphere:
| • | Automatic decisions, consisting of verification by the business that the proposed transaction (in terms of amount, product, maturity and other conditions) falls within the limits authorized pursuant to the aforementioned pre-classification. This process is generally applied to corporate pre-classifications. |
| • | Decisions always requiring the analyst’s authorization, even if the transaction meets the amount, maturity and other conditions established in the pre-classified limit. This process applies to pre-classifications of retail banking companies. |
Credit risk mitigation techniques
The Group applies various methods of reducing credit risk, depending, inter alia, on the type of customer and product. As we shall see, some of these methods are specific to a particular type of transaction (e.g. real estate guarantees) while others apply to groups of transactions (e.g. netting and collateral arrangements).
The various mitigation techniques can be grouped into the following categories:
Netting by counterparty
Netting refers to the possibility of determining a net balance of transactions of the same type, under the umbrella of a master agreement such as an ISDA or similar agreement.
It consists of aggregating the positive and negative market values of the derivatives transactions entered into by the Group with a particular counterparty, so that, in the event of default, the counterparty owes the Group (or the Group owes the counterparty, if the net figure is negative) a single net figure and not a series of positive or negative amounts relating to each of the transactions entered into with the counterparty.
An important aspect of master agreements is that they represent a single legal obligation encompassing all the transactions they cover. This is the key to being able to set off the risks of all the transactions covered by the agreement with the same counterparty (see Note 2.f).
F-248
Table of Contents
Collateral
Collateral refers to the assets pledged by the customer or a third party to secure the performance of an obligation. Collateral may be:
| • | Financial: cash, security deposits, gold, etc. |
| • | Non-financial: property (both residential and commercial), other movable property, etc. |
From the risk acceptance standpoint, collateral of the highest possible quality is required. For regulatory capital calculation purposes, only collateral that meets the minimum quality requirements described in the Basel capital accords can be taken into consideration.
One very important example of financial collateral is the collateral agreement. Collateral agreements comprise a set of highly liquid instruments with a certain economic value that are deposited or transferred by a counterparty in favor of another party in order to guarantee or reduce any counterparty credit risk that might arise from the portfolios of derivative transactions between the parties in which there is exposure to risk.
Collateral agreements vary in nature but, whichever the specific form of collateralization may be, the ultimate aim, as with the netting technique, is to reduce counterparty risk.
Transactions subject to a collateral agreement are assessed periodically (normally on a daily basis). The agreed-upon parameters defined in the agreement are applied to the net balance arising from these assessments, from which the collateral amount (normally cash or securities) payable to or receivable from the counterparty is obtained.
With regard to real estate collateral, periodic re-appraisal processes are in place, based on the actual market values for the different types of real estate, which meet all the requirements established by the regulator.
When mitigation techniques are used, the minimum requirements established in the credit risk management policy manual are adhered to. In short, these consist of monitoring the following:
| • | Legal certainty. Collateral and guarantees must be examined to ensure that at all times it is possible to legally enforce the settlement thereof. |
| • | A substantial positive correlation must not exist between the counterparty and the value of the collateral. |
| • | Collateral and guarantees must be correctly documented. |
| • | The availability of documentation of the methodologies used for each mitigation technique. |
| • | The appropriate periodic monitoring and control of the methodologies. |
Third party guarantees and credit derivatives
Third party guarantees are guarantees provided by a third party liable for another party’s obligations to the Group. They include, for example, security deposits, suretyships and standby letters of credit. Only guarantees provided by third parties that meet the minimum requirements established by the supervisor can be recognized for capital calculation purposes.
F-249
Table of Contents
Credit derivatives are financial instruments whose main purpose is to hedge credit risk by buying protection from a third party, whereby the Bank transfers the risk of the issuer of the underlying instrument. Credit derivatives are OTC instruments, i.e. they are not traded in organized markets. Credit derivative hedges, mainly credit default swaps, are entered into with leading financial institutions.
4.5.4. Monitoring
The monitoring function is founded on a process of ongoing observation, which makes it possible to detect early any changes that might arise in customers’ credit quality, so that action can be taken to correct any deviations with an adverse impact.
Monitoring is based on the segmentation of customers, is performed by dedicated local and global risk teams and is complemented by the work performed by internal audit.
The function involves, inter alia, identifying and monitoring companies under special surveillance, reviewing ratings and the ongoing monitoring of indicators.
The system called “companies under special surveillance” (FEVE, using the Spanish acronym) distinguishes four categories based on the degree of concern raised by the circumstances observed (extinguish, secure, reduce and monitor). The inclusion of a position in the FEVE system does not mean that there has been a default, but rather that it is deemed advisable to adopt a specific policy for the position in question, to place a person in charge and to set the policy implementation period. Customers classified as FEVE are reviewed at least every six months, or every three months for those classified in the most severe categories. A company can be classified as FEVE as a result of the monitoring process itself, a review performed by internal audit, a decision made by the sales manager responsible for that company or the triggering of the automatic warning system.
Assigned ratings are reviewed at least annually, but should any weakness be detected, or depending on the rating itself, more frequent reviews are performed.
For exposures to lower-revenue individuals, businesses and SMEs, the key indicators are monitored in order to detect any variance in the performance of the loan portfolio with respect to the forecasts made in the credit management programs.
4.5.5. Measurement and control
In addition to monitoring customers’ credit quality, the Group establishes the control procedures required to analyze the current credit risk portfolio and the changes therein over the various credit risk phases.
The risk control function is performed by assessing risks from various complementary perspectives, the main pillars being control by geographical location, business area, management model, product, etc., thus facilitating the early detection of specific areas requiring attention and the preparation of action plans to correct possible impairment. Each control pillar can be analyzed in two ways:
Quantitative and qualitative analysis of the portfolio
In the analysis of the portfolio, any variances in the Group’s risk exposure with respect to budgets, limits and benchmarks are controlled on an ongoing and systematic basis, and the impacts of these variances in certain future situations, both those of an external nature and those arising from strategic decisions, are assessed in order to establish measures aimed at placing the profile and amount of the risk portfolio within the parameters set by the Group.
F-250
Table of Contents
In addition to the traditional metrics, the following, inter alia, are used in the credit risk control phase:
| • | Change in non-performing loans (VMG, using the Spanish acronym): VMG measures the change in non-performing loans during a period, discounting loans charged off and taking recoveries into account. It is an aggregate measure at portfolio level that enables action to be taken in the event of deteriorations in the trend of non-performing loans. |
It is obtained as the result of the ending balance less the beginning balance of non-performing loans for the period in question, plus the loans charged off in the period, less any previously charged-off loans recovered in that same period.
VMG and its component parts play a decisive role as monitoring variables.
| • | EL (expected loss) and capital: EL is the estimated financial loss that will occur over the next twelve months on the portfolio existing at any given time. |
It is an additional cost of the activity and must be charged in the transaction price. It is calculated using three basic parameters:
| • | EAD (exposure at default): the maximum amount that could be lost as a result of a default. |
| • | PD (probability of default): is the probability that a customer will default in the next twelve months. |
| • | LGD (loss given default): represents the percentage of exposure that will not be recovered in the event of default. To calculate the LGD, the amounts recovered throughout the recovery process are discounted to the time of default, and this figure is compared, on a percentage basis, with the amount owed by the customer at that date. |
Thus, other relevant factors regarding the risk exposure of transactions are taken into account, such as the quantification of off-balance-sheet exposures or the expected percentage of recoveries, in relation to the guarantees associated with the transaction and other characteristics of the transaction: type of product, term, etc.
The risk parameters are also used in the calculation of both economic and regulatory capital. The inclusion of capital metrics in management is fundamental to the rationalization of the use of capital.
Assessment of the control processes
This includes a systematic periodic review of the procedures and methodology, and is performed over the entire credit risk cycle to ensure that they are in force and effective.
In 2006, within the corporate framework established in the Group for compliance with the Sarbanes-Oxley Act, a corporate tool was made available on the Group’s intranet for the documentation and certification of all the subprocesses, operational risks and related mitigating controls. In this connection, the risk division assesses the efficiency of the internal control of its activities on an annual basis.
Furthermore, the internal risk validation function, as part of its mission to supervise the quality of the Group’s risk management, guarantees that the systems for the management and control of the risks inherent to its activity comply with the strictest criteria and the best practices observed in the industry and/or required by the regulators. Also, internal audit is responsible for ensuring that the policies, methods and procedures are appropriate, effectively implemented and regularly reviewed.
F-251
Table of Contents
4.5.6. Recovery management
Recovery is a significant function within the sphere of the Group’s risk management. This function is performed by the asset recovery and clean-up area (DRSA), a unit created in July 2013 with the aim of achieving greater efficiency in the asset recovery process, while at the same time developing a global strategy and a comprehensive approach for recovery management.
The Group has in place a corporate management model that defines the general recovery action guidelines. These guidelines are applied in the various countries, always taking into account the local peculiarities required for the recovery activity, due either to the local economic environment, to the business model or to a combination of both. The recovery units are business areas involving direct customer management and, accordingly, this corporate model has a business approach that creates value sustainably over time on the basis of effective and efficient collection management, achieved through either the return of unpaid balances to performing status or the full recovery thereof.
The recovery management model requires the proper coordination of all management areas (recovery business, commercial, technology and operations, human resources and risk) and the management processes and methodology supporting it are reviewed and enhanced on an ongoing basis, through the application of the best practices developed in the various countries.
In order to manage recovery properly, action is taken in four main phases: early arrears management, recovery of non-performing loans, recovery of charged-off loans and management of foreclosed assets. In fact, the actions taken by the recovery function commence even before the first missed payment, i.e. when there are signs of a deterioration of the customer’s ability to pay, and they end when the customer’s debt has been paid or has returned to performing status. The recovery function aims to anticipate default events and focuses on preventive management.
The macroeconomic environment has a direct effect on the customer default rate. Therefore, the quality of the portfolios is fundamental to the development and growth of our businesses in the various countries, and particular attention is paid, on a permanent basis, to the debt collection and recovery functions in order to guarantee that this quality remains at the expected levels at all times.
The differing characteristics of customers make segmentation necessary in order to ensure proper recovery management. The mass management of large groups of customers with similar profiles and products is performed using highly technological processes, while personalized management is reserved for customers who, due to their profile, require the assignment of a specific manager and a more tailored analysis.
The recovery activity has been aligned with the social and economic reality of the different countries, and various management mechanisms have been used, all involving appropriate prudential criteria, based on the age, collateral and conditions of the transaction, while always ensuring that, at least, the required ratings and provisions are maintained.
Within the recovery function particular emphasis has been placed on using the mechanisms referred to above for early arrears management, in accordance with corporate policies, considering the various local realities and closely monitoring the production, inventory and performance of those local areas. The aforementioned policies are reviewed and adapted periodically in order to reflect both best management practices and any applicable regulatory amendments.
F-252
Table of Contents
In addition to the measures aimed at adapting transactions to the customer’s ability to pay, special mention should be made of recovery management, in which alternative solutions to legal action are sought to ensure the early collection of debts.
One of the channels for the recovery of debts of customers whose ability to pay has deteriorated severely is foreclosure (either court-ordered or through dation in payment) of the property assets securing the transactions. In geographical regions that are highly exposed to real estate risk, such as Spain, the Group has very efficient instruments in place to manage the sale of such assets, making it possible to maximize recovery and reduce the on-balance-sheet stock of property assets at a much faster pace than at other financial institutions.
Forborne loan portfolio
The term “forborne loan portfolio” refers, for the purposes of the Group’s risk management, to those transactions in which the customer has, or might foreseeably have, financial difficulty in meeting its payment obligations under the terms and conditions of the current agreement and, accordingly, the agreement has been modified or fulfilled or even a new transaction has been entered into.
The Group has a detailed customer debt forbearance policy that serves as a reference for the various local adaptations made for all the financial institutions forming part of the Group. This policy shares the general principles laid down in both Bank of Spain Circular 6/2012 and the technical standards published by the European Banking Authority in 2014, which it develops in greater detail based on the level of customer impairment.
This policy establishes strict criteria for the assessment of these exposures:
| • | The use of this practice is restricted, and any actions that might defer the recognition of impairment must be avoided. |
| • | The main aim must be to recover the amounts owed, and any amounts deemed unrecoverable must be recognized as soon as possible. |
| • | Forbearance must always envisage maintaining the existing guarantees and, if possible, enhance them. Not only can effective guarantees serve to mitigate losses given default, but they might also reduce the probability of default. |
| • | This practice must not give rise to the granting of additional funding, or be used to refinance debt of other entities or as a cross-selling instrument. |
| • | All the alternatives to forbearance and their impacts must be assessed, making sure that the results of this practice will exceed those which would foreseeably be obtained if it were not performed. |
| • | Forborne transactions are classified using more stringent criteria, which prudentially ensure that the customer’s ability to pay is restored from the date of forbearance and for an adequate period of time thereafter. |
| • | In addition, in the case of customers that have been assigned a risk analyst, it is particularly important to conduct an individual analysis of each specific case, for both the proper identification of the transaction and its subsequent classification, monitoring and adequate provisioning. |
The forbearance policy also sets out various criteria for determining the scope of transactions qualifying as forborne exposures by defining a detailed series of objective indicators that are indicative of situations of financial difficulty.
F-253
Table of Contents
Accordingly, transactions not classified as non-performing at the date of forbearance are generally considered to be experiencing financial difficulty if at that date they were more than one month past due. Where no payments have been missed or there are no payments more than one month past due, other indicators of financial difficulty are taken into account, including most notably the following:
| • | Transactions with customers who are already experiencing difficulties in other transactions. |
| • | Situations where a transaction has to be modified prematurely, and the Group has not yet had a previous satisfactory experience with the customer. |
| • | Cases in which the necessary modifications entail the grant of special conditions, such as the establishment of a grace period, or where these new conditions are deemed to be more favorable for the customer than those which would have been granted for an ordinary loan approval. |
| • | Where a customer submits successive loan modification requests at unreasonable time intervals. |
| • | In any case, if once the modification has been made any payment irregularity arises during a given probation period (as evidenced by backtesting), even in the absence of any other symptoms, the transaction will be deemed to be within the scope of forborne exposures. |
Once it has been determined that the reasons for the modification relate to financial difficulties, for management purposes a distinction is made between two types of forbearance based on the original status of the transactions: ex-ante forbearance, when the original transaction was classified as other than non-performing; and ex-post forbearance, when it had previously been classified as non-performing.
In addition, within the category of ex-post forbearance, distinct treatments are established for cases of advanced impairment, the classification requirements and criteria for which are even more stringent than those for other forborne transactions.
As regards the strategies to be applied, corporate policy requires the customer’s ability and willingness to pay to be analyzed and a distinction to be drawn between the severity and the estimated duration of the impairment. The results of this analysis will be used as a basis for deciding whether the debt should be forborne and the most appropriate way of doing so for each case:
| • | When borrowers display a severe but temporary deterioration in their ability to pay (which is expected to be recovered in a short space of time), short-term adjustment strategies are applied, such as a payment moratorium on the principal or the reduction of instalments for a short, limited period until the ability to pay is restored. |
| • | When borrowers display a slight deterioration in their ability to pay (an early recovery of which is not expected), more long-term strategies are applied, such as reducing instalments by deferring either the maturity date or a portion of the principal, which would be paid at the same time as the last instalment, at all times securing its payment through the provision of effective guarantees. |
In any case, through a case-by-case analysis, priority is given to modifications for customers displaying a slight but prolonged deterioration, since those experiencing severe but transitory deterioration carry a higher risk, as they depend on the accuracy of the estimated time of their future recovery. Cases of severe deterioration deemed to be prolonged over time are not considered for forbearance.
Corporate policy also establishes mechanisms for the management and control of forborne transactions, allowing them to be treated in a different way from other transactions, with particular attention being paid to the processes of:
| • | Planning and budgeting, including preparing the pertinent business plans, projections and limits for the most relevant aggregates. |
| • | Monitoring the performance of the portfolio and assessing the degree of achievement of the projections prepared in the planning phase. |
F-254
Table of Contents
Once forbearance measures have been adopted, transactions that have to remain classified as non-performing because at the date of forbearance they do not meet the requirements to be classified in a different category7 must comply with a prudential payment schedule in order to assure reasonable certainty as to the recovery of the customer’s ability to pay.
If there is any (non-technical) default in payments during that period, the aforementioned payment schedule starts again.
On successful completion of the period, the duration of which depends on the customer’s situation and the transaction features (term and guarantees provided), the transaction is no longer considered to be non-performing, although it continues to be subject to a probation period during which it undergoes special monitoring.
This monitoring continues until a series of requirements have been met, including most notably: a minimum observation period; repayment of a substantial percentage of the outstanding amounts; and settlement of the amounts that were past due at the time of forbearance.
When forbearance is applied to a transaction classified as non-performing, the original default dates continue to be considered for all purposes, irrespective of whether as a result of forbearance the transaction becomes current in its payments. Also, the forbearance of a transaction classified as non-performing does not give rise to any release of the related provisions.
By contrast, if following arrangement of forbearance there is no improvement in the customer’s payment performance, the possibility of extending new forbearance measures will be considered, with the application of more stringent classification/return-to-performing criteria. In this regard, the Group’s policy establishes a longer period (between 6 and 36 months) of uninterrupted payments before the transaction can return to performing status (between 3 and 12 months in the case of first forbearances). The duration of this period is determined by any collateral provided and the residual maturity of the loan. The Group’s policy permits a maximum of one modification per year and three modifications every five years.
The internal models used by the Group for provisioning purposes include forborne transactions as follows:
| • | Customers not subject to individual monitoring: the internal models consider forborne transactions as a distinct segment with its own probability of default calculated on the basis of past experience, considering, among other factors, the performance of the successive forbearance measures. |
| • | Customers subject to individual monitoring: the internal rating is an essential input in determining the probability of default and it takes into consideration the existence of successive forbearance measures. This rating must be updated at least once every six months for customers with forborne transactions. |
At December 31, 2014, EUR 18,849 million of the Group’s forborne loan portfolio (33% of the total forborne portfolio) had undergone several modifications.
| 7 | Bank of Spain Circular 6/2012: the refinancing or restructuring of transactions that are not current in their payments does not interrupt their arrears, nor does it give rise to their reclassification to one of the previous categories, unless there is reasonable certainty that the customer will be able to meet its payment obligations within the established time frame or new effective collateral is provided, and, in both cases, at least the ordinary outstanding interest is received, without taking into account late-payment interest. |
F-255
Table of Contents
Quantitative information required by Bank of Spain Circular 6/2012
Set forth below is the quantitative information required by Bank of Spain Circular 6/2012 on the restructured/refinanced transactions in force at December 31, 2014. The following terms are used in Bank of Spain Circular 6/2012 with the meanings specified:
| • | Refinancing transaction: transaction granted or used for reasons relating to -current or foreseeable- financial difficulties the borrower may have in repaying one or more of the transactions granted to it, or through which the payments on such transactions are brought fully or partially up to date, in order to enable the borrowers of cancelled or refinanced transactions to repay the debt (principal and interest) because the borrower is unable, or might foreseeably become unable, to comply with the conditions thereof in due time and form. |
| • | Restructured transaction: transaction with respect to which, for economic or legal reasons relating to current or foreseeable financial difficulties of the borrower, the financial terms and conditions are modified in order to facilitate the payment of the debt (principal and interest) because the borrower is unable, or might foreseeably become unable, to comply with the aforementioned terms and conditions in due time and form, even if such modification is envisaged in the agreement. |
F-256
Table of Contents
CURRENT REFINANCING AND RESTRUCTURING BALANCES (a)
| Millions of euros | ||||||||||||||||||||||||||||||||||||||||||||||||||||||||||||||||||||||||||||||||||||||||||||
| Standard (b) | Substandard | Non-performing | Total | |||||||||||||||||||||||||||||||||||||||||||||||||||||||||||||||||||||||||||||||||||||||||
| Full property mortgage guarantee |
Other collateral (c) |
Without collateral |
Full property mortgage guarantee |
Other collateral (c) |
Without collateral |
Allowance | Full property mortgage guarantee |
Other collateral (c) |
Without collateral |
Allowance | ||||||||||||||||||||||||||||||||||||||||||||||||||||||||||||||||||||||||||||||||||
| Number of trans- actions |
Gross amount |
Number of trans- actions |
Gross amount |
Number of trans- actions |
Gross amount |
Number of trans- actions |
Gross amount |
Number of trans- actions |
Gross amount |
Number of trans- actions |
Gross amount |
Number of trans- actions |
Gross amount |
Number of trans- actions |
Gross amount |
Number of trans- actions |
Gross amount |
Number of trans- actions |
Gross amount |
Allowance | ||||||||||||||||||||||||||||||||||||||||||||||||||||||||||||||||||||||||
| Public sector |
6 | 18 | 12 | 294 | 89 | 562 | 6 | 14 | — | — | 3 | 4 | 4 | 2 | 3 | — | — | 22 | 43 | 11 | 140 | 938 | 15 | |||||||||||||||||||||||||||||||||||||||||||||||||||||||||||||||||||||
| Other legal entities and individual traders |
6,019 | 2,644 | 14,907 | 1,249 | 57,125 | 2,968 | 5,526 | 1,978 | 6,200 | 1,466 | 38,674 | 1,427 | 910 | 10,608 | 5,651 | 8,704 | 6,321 | 69,546 | 4,522 | 8,003 | 217,309 | 28,226 | 8,913 | |||||||||||||||||||||||||||||||||||||||||||||||||||||||||||||||||||||
| Of which: Financing for construction and property development |
355 | 471 | 44 | 39 | 119 | 3 | 819 | 579 | 149 | 475 | 354 | 61 | 406 | 2,685 | 2,830 | 1,394 | 2,857 | 375 | 591 | 3,297 | 6,294 | 7,906 | 3,703 | |||||||||||||||||||||||||||||||||||||||||||||||||||||||||||||||||||||
| Other individuals |
66,147 | 5,099 | 543,763 | 7,090 | 853,873 | 1,587 | 37,154 | 3,642 | 17,096 | 2,142 | 344,797 | 951 | 556 | 32,889 | 2,189 | 81,953 | 2,912 | 862,280 | 1,927 | 2,585 | 2,839,952 | 27,539 | 3,141 | |||||||||||||||||||||||||||||||||||||||||||||||||||||||||||||||||||||
|
|
|
|
|
|
|
|
|
|
|
|
|
|
|
|
|
|
|
|
|
|
|
|
|
|
|
|
|
|
|
|
|
|
|
|
|
|
|
|
|
|
|
|
|
|
|
|||||||||||||||||||||||||||||||||||||||||||||||
| Total |
72,172 | 7,761 | 558,682 | 8,633 | 911,087 | 5,117 | 42,686 | 5,634 | 23,296 | 3,608 | 383,474 | 2,382 | 1,470 | 43,499 | 7,843 | 90,657 | 9,233 | 931,848 | 6,492 | 10,599 | 3,057,401 | 56,703 | 12,069 | |||||||||||||||||||||||||||||||||||||||||||||||||||||||||||||||||||||
|
|
|
|
|
|
|
|
|
|
|
|
|
|
|
|
|
|
|
|
|
|
|
|
|
|
|
|
|
|
|
|
|
|
|
|
|
|
|
|
|
|
|
|
|
|
|
|||||||||||||||||||||||||||||||||||||||||||||||
| (a) | Including all refinanced or restructured transactions as defined in section 1.g) of Annex IX of Bank of Spain Circular 4/2004 |
| (b) | Standard risks classified as under special monitoring pursuant to section 7.a) of Annex IX of Bank of Spain Circular 4/2004 |
| (c) | Including transactions without a full property mortgage guarantee, i.e. with a loan-to-value ratio of more than 1, and transactions with collateral other than a property mortgage, irrespective of their loan-to-value ratio |
F-257
Table of Contents
The transactions presented in the foregoing tables were classified at December 31, 2014, by nature, as follows:
| • | Non-performing: transactions that are in the process of being returned to performing status, those for which advantageous conditions had to be granted that would not have been granted for an ordinary loan approval or those which, having been classified as standard or substandard, have again encountered payment difficulties during the term of the transaction. |
| • | Substandard: transactions previously classified as non-performing with respect to which, following forbearance, sustained payments have been made for a certain period, depending on the transaction features and the type of guarantee, and transactions previously classified as standard: i) which have been granted an initial grace period and will remain in this category until three monthly instalments (or the equivalent) have been paid after the grace period, or ii) that following forbearance have become non-performing (default). |
| • | Standard: transactions previously classified as non-performing or substandard which have successfully completed the precautionary observation periods established in the corporate policy evidencing that payment capacity pursuant to the terms established has been restored, and transactions classified as standard at the date of forbearance, until they meet the requirements to cease to be subject to the special monitoring described above. |
The table below shows the changes in 2014 in the forborne loan portfolio:
| Millions of euros |
2014 | |||
| Beginning balance |
53,602 | |||
| Of which: Other than non-performing |
29,961 | |||
| Non-performing assets |
23.641 | |||
| Additions |
15,391 | |||
| Inclusions in the scope of consolidation |
6,330 | |||
| Reductions (*) |
(18,620 | ) | ||
| Balance at end of year |
56,703 | |||
| Of which: Other than non-performing |
33,135 | |||
| Non-performing assets |
23,568 | |||
| (*) | Including, mainly, debt repayments, foreclosures and charge-offs and transactions that have ceased to be subject to special monitoring because the aforementioned requirements have been met. |
On a like-for-like basis with respect to the 2013 scope of consolidation, the level of forborne transactions at the Group fell by 6% (EUR 3,229 million), thus continuing the downward trend of the previous year.
58% of the forborne loan transactions are classified as other than non-performing. Particularly noteworthy are the level of existing guarantees (75% of transactions are secured by collateral) and the coverage provided by specific allowances (representing 21% of the total forborne loan portfolio and 45% of the non-performing portfolio).
F-258
Table of Contents
5. TRADING MARKET AND STRUCTURAL RISK
5.1 Activities subject to market risk and types of market risk
The scope of activities subject to market risk encompasses all operations exposed to net worth risk as a result of changes in market factors. It includes both risks arising from trading activities and the structural risks that are also affected by market fluctuations:
This risk arises from changes in the risk factors -interest rates, inflation rates, exchange rates, equity prices, credit spreads, commodity prices and the volatility thereof- and from the liquidity risk of the various products and markets in which the Group operates.
| • | Interest rate risk is the possibility that fluctuations in interest rates might have an adverse effect on the value of a financial instrument, on a portfolio or on the Group as a whole. Interest rate risk affects, inter alia, loans, deposits, debt securities, most financial assets and liabilities held for trading and derivatives. |
| • | Inflation rate risk is the possibility that fluctuations in inflation rates might have an adverse effect on the value of a financial instrument, on a portfolio or on the Group as a whole. Inflation rate risk affects, inter alia, loans, debt securities and derivatives, the returns on which are linked to inflation or to an actual variation rate. |
| • | Foreign currency risk is defined as the sensitivity of the value of a position in a currency other than the base currency to a potential change in exchange rates. Accordingly, a long position in a foreign currency will generate a loss if this currency depreciates against the base currency. The positions affected by this risk include investments in subsidiaries in currencies other than the euro, and loans, securities and derivatives denominated in foreign currencies. |
| • | Equity risk is the sensitivity of the value of the open positions in equity securities to adverse changes in the market prices of those equity securities or in future dividend expectations. Equity risk affects, among other instruments, positions in shares, equity indices, convertible bonds and equity derivatives (puts, calls, equity swaps, etc.). |
| • | Credit spread risk is the sensitivity of the value of open positions in fixed-income securities or in credit derivatives to fluctuations in the credit spread curves or in the recovery rates (RR) of specific issuers and types of debt. The spread is the differential between the quoted price of certain financial instruments over other benchmark instruments, mainly the IRR of government bonds and interbank interest rates. |
| • | Commodity price risk is the risk arising from the effect of potential changes in commodity prices. The Group’s exposure to commodity price risk is not material and it is concentrated in commodity derivatives with customers. |
| • | Volatility risk is the sensitivity of the value of the portfolio to changes in the volatility of risk factors: interest rates, exchange rates, share prices, credit spreads and commodities. Volatility risk arises on financial instruments whose measurement model includes volatility as a variable, most notably financial option portfolios. |
All these market risks can be mitigated in part or in full through the use of derivatives such as options, futures, forwards and swaps.
In addition, there are other market risks, which are more difficult to hedge, the detail being as follows:
| • | Correlation risk. Correlation risk is defined as the sensitivity of the value of the portfolio to changes in the relationship between risk factors (correlation), whether they are the same type (e.g. between two exchange rates) or different (e.g. between an interest rate and a commodity price). |
F-259
Table of Contents
| • | Market liquidity risk. The risk that a Group entity or the Group as a whole may not able to unwind or close a position on time without affecting the market price or the cost of the transaction. Market liquidity risk may be caused by the reduction in the number of market makers or institutional investors, the execution of large volumes of transactions and market instability, and it increases as a result of the current concentration in certain products and currencies. |
| • | Prepayment or termination risk. When the contractual relationship in certain transactions explicitly or implicitly permits early repayment before maturity without negotiation, there is a risk that the cash flows might have to be reinvested at a potentially lower interest rate. It mainly affects mortgage loans or securities. |
| • | Underwriting risk. Underwriting risk arises as a result of an entity’s involvement in the underwriting of a placement of securities or other type of debt, thus assuming the risk of owning part of the issue or the loan if the entire issue is not placed among the potential buyers. |
Pension risk, actuarial risk and fiduciary risk are also affected by changes in market factors. The activities are segmented by risk type as follows:
| • | Trading: financial services for customers, trading operations and positions taken mainly in fixed-income, equity and foreign currency products. This activity is managed mainly by the global wholesale banking (BMG) division. |
| • | Structural risks: a distinction is made between on-balance-sheet risks and pensions and actuarial risks: |
| • | Structural balance sheet risks: market risks inherent to the balance sheet, excluding financial assets and liabilities held for trading. Decisions affecting the management of these risks are taken through the ALCO committees in the respective countries in coordination with the Group’s ALCO committee and are implemented by the financial management division. The aim pursued is to ensure the stability and recurring nature of both the net interest margin of the commercial activity and the Group’s economic value, whilst maintaining adequate liquidity and solvency levels. The structural balance sheet risks are as follows: |
| • | Structural interest rate risk: arises as a result of the maturity and reprising gaps of all the assets and liabilities on the balance sheet. |
| • | Structural foreign currency risk/hedges of results: foreign currency risk resulting from the fact that investments in consolidable and non-consolidable companies are made in currencies other than the euro (structural exchange rate). In addition, this item includes the positions to hedge the foreign currency risk on future results generated in currencies other than the euro (hedges of results). |
| • | Structural equity risk: this item includes equity investments in non-consolidated financial and non-financial companies and available-for-sale portfolios comprising equity positions. |
| • | Pensions and actuarial risks: |
| • | Pensions risk: the risk assumed by the entity in relation to pension obligations to its employees. This relates to the possibility that the fund may not cover these obligations in the accrual period of the benefits and the return obtained by the portfolio may not be sufficient and might oblige the Group to increase the level of contributions. |
| • | Actuarial risk: unexpected losses arising as a result of an increase in the obligations to policyholders, and losses arising from an unexpected increase in expenses. |
F-260
Table of Contents
5.2. Trading market risks
The Group’s trading risk profile remained low in 2014, in line with previous years, since the purpose of most of the activity is the provision of a service to customers and diversification by geographical area and risk factor.
The Group continued to have very limited exposure to complex structured instruments or vehicles, as a reflection of its culture of management in which prudence in risk management constitutes one of its principal symbols of identity. Specifically, at 2014 year-end, the Group had:
| • | CDOs and CLOs: the Group’s position was not material, at EUR 99 million. |
| • | Hedge funds: the total exposure was not material (EUR 192 million at December 31, 2014) and consisted largely of the financing provided to these funds (EUR 20 million), the remainder being direct equity interests held in hedge funds or counterparty risk arising on derivatives granted to hedge funds. This exposure featured low loan-to-value ratios, at around 31% (collateral of EUR 620 million at the end of December). The risk exposure to this type of counterparty is analyzed on a case-by-case basis, and the percentages of collateral are established according to the features and assets of each fund. |
| • | Conduits: there was no exposure. |
| • | Monolines: the Group’s exposure to monoline insurers amounted to EUR 137 million in December 20148, and related mainly to an indirect exposure of EUR 136 million, by virtue of the guarantee provided by entities of this kind for various traditional financing or securitization transactions. The exposure was to double-default in this case. The primary underlyings had high credit ratings. The small remainder was direct exposure (e.g. through the purchase of a credit default swap to protect it against the risk of default of these insurance companies). Exposure decreased by 2% with respect to 2013. |
In short, it can be affirmed that, in general, the exposure to instruments of this kind in the ordinary course of the Group’s business continued to decrease in 2014. It is due mainly to the integration of exposures at entities acquired by the Group, such as Sovereign in 2009. All these exposures were known at the time of the purchase and adequate provisions were recognized . Since their integration in the Group these exposures have been reduced notably, the final objective being their derecognition.
The Group’s policy with respect to the approval of new transactions involving these products continues to be very prudent and conservative and is subject to strict supervision by the Group’s senior management. Before authorizing a new transaction, product or underlying, the risk division checks:
| • | Whether there is an adequate valuation model (mark-to-market, mark-to-model or mark-to-liquidity) to monitor the value of each exposure. |
| • | Whether the inputs enabling application of this valuation model are observable in the market. |
Provided the two aforementioned conditions are met, the risk division ascertains:
| • | The availability of adequate systems duly adapted for the daily calculation and monitoring of the results, positions and risks of the new transactions envisaged. |
| • | The degree of liquidity of the product or underlying, with a view to arranging the related hedge on a timely basis. |
| 8 | The guarantees provided by monoline insurers in US Municipal Bonds are not treated as exposure. These bonds amounted to EUR 744 million at December 2014. |
F-261
Table of Contents
Calibration and test measures
Actual losses may differ from those projected by the value-at-risk (VaR) model for different reasons relating to the limitations of this metric. Therefore, the Group performs regular analyses and tests to check the accuracy of the VaR calculation model in order to verify its reliability.
The most important tests are the backtesting exercises, which are analyzed at both local and global level, following the same methodology in all cases. The backtesting exercise consists of comparing the projected VaR measurements, for a given confidence level and time horizon, with the actual losses obtained in the same time horizon. This facilitates the detection of any anomalies in the VaR model of the portfolio in question (e.g. deficiencies in the parameterization of the valuation models of certain instruments, scantly adequate proxies, etc.).
Three types of backtesting are calculated and assessed at the Group:
| • | Clean backtesting: the daily VaR is compared with the results obtained without taking into account the intra-day results or the changes in the portfolio’s positions. This model serves to check the accuracy of the individual models used to assess and measure the risks of the various positions. |
| • | Backtesting on complete results: daily VaR is compared with the day’s net results, including the results of intra-day operations and those generated by fees and commissions. |
| • | Backtesting on complete results without mark-ups or fees and commissions: daily VaR is compared with the day’s net results, including the results of intra-day operations but excluding those generated by mark-ups and fees and commissions. This method is intended to obtain an idea of the intra-day risk assumed by the Group’s treasury areas. |
In the first case, for the entire portfolio, in 2014 there was one violation at 99%, on June 6, mainly explained by Mexico, due to the fall in the sovereign and swap curves (in nominal and Mexican investment unit (UDI) inflation linked terms), following the 50 basis point reduction in the official rate (to 3%) by the Bank of Mexico, which had not been discounted by the market.
There was another violation at 99% (i.e. days when the daily loss was higher than VaR), on October 16, mainly explained by Spain, due to the rise in credit spreads in Europe and the fall in equity indices.
The number of violations is in line with the expected performance of the VaR calculation model, given that a confidence level of 99% and a time horizon of one year are used (with a longer time horizon one could expect an average of two or three violations a year).
F-262
Table of Contents
5.3. Structural balance sheet risks9
5.3.1. Main aggregates and variations
The market risk profile inherent to the Group’s balance sheet, in relation to the volume of assets and capital, and the projected net interest margin, remained at low levels in 2014, in line with previous years.
Structural interest rate risk
Europe and the United States
The main balance sheets in Europe, i.e. those of the Parent and the UK, reported positive sensitivities of the market value of equity to interest rate rises, given the expectations for long-term rates based on the economic performance indicators, whereas in the short term the net interest margin exposure was kept at very low levels. The US balance sheet has a positive sensitivity to interest rate rises at both short and long term.
In any case, the level of exposure in all countries is moderate in relation to the annual budget and the amount of capital.
At the end of December 2014, the exposure relating to the net interest margin at one year, measured as the sensitivity thereof to parallel shifts of ± 100 basis points, was concentrated on the US dollar yield curve, with EUR 67 million of exposure to falls in interest rates (a most unlikely scenario in the present circumstances). It must also be stated that the exposure to falls in interest rates on the Polish zloty yield curve was EUR 21 million.
At the end of December 2014, the most significant exposure relating to the market value of equity, measured as the sensitivity thereof to parallel shifts of ± 100 basis points, was that of the euro yield curve, with EUR 2,149 million of exposure to falls in interest rates. The exposure to falls in interest rates on the pound sterling and the US dollar yield curve was EUR 865 million and EUR 343 million, respectively. As noted above, these scenarios are very unlikely at present.
Latin America
The balance sheets are positioned in the long term for falls in interest rates due to the slowdown in economic growth. The situation in the short term is very similar, except in the case of Mexico, since the country’s excess liquidity is invested in local currency in the short term.
In 2014 the level of exposure in all countries continued to be moderate in relation to the annual budget and the amount of capital.
At year-end, the exposure relating to the net interest margin at one year, measured as the sensitivity thereof to parallel shifts of ± 100 basis points, was concentrated on three countries: Brazil (EUR 152 million), Mexico (EUR 55 million) and Chile (EUR 33 million).
VaR of on-balance-sheet structural interest rate risk
In addition to sensitivities to interest rate fluctuations (shifts not only of +/- 100 basis points but also of +/- 25, +/- 50 and +/- 75 basis points are assessed, in order to better characterize risk in countries with very low rate levels), Santander uses other methods to monitor on-balance-sheet structural interest rate risk including, inter alia, scenario analysis and VaR calculations, using a methodology similar to that used for the trading book.
| 9 | Includes the total balance sheet, except for financial assets and liabilities held for trading. |
F-263
Table of Contents
Structural interest rate risk, measured in terms of one-day VaR at 99%, averaged EUR 539 million in 2014. The contribution to structural interest rate risk by the balance sheets in Europe and the US is considerably higher than the balance sheets in Latin America. Mention must be made of the high level of diversification between these two areas and the fall in the VaR in Europe and the United States, due to a narrowing of sovereign debt spreads, especially those of Spain and Portugal.
Structural foreign currency risk/hedges of results
Structural foreign currency risk arises from the Group’s operations in foreign currencies, and relates mainly to long-term investments, the results thereof and the hedges for both.
Foreign currency risk is managed dynamically, in order to limit the impact on the core capital ratio of exchange rate fluctuations.
At 2014 year-end, the largest long-term exposures (with their potential impact on equity) corresponded, in descending order, to the Brazilian real, the pound sterling, the US dollar, the Mexican peso, the Chilean peso and the Polish zloty. The Group hedges a portion of these long-term exposures through foreign exchange derivatives.
Additionally, the financial management division at consolidated level is responsible for managing the foreign currency risk inherent in the expected results and dividends of the Group at the units whose base currency is not the euro.
Structural equity risk
The Group has equity positions in its balance sheet (banking book) in addition to the trading positions. These positions are classified as available-for-sale financial assets (equity instruments) or as investments, depending on the length of time they are expected to remain in the portfolio.
At the end of December 2014, the equity positions (banking book) were diversified across various geographical areas, the main ones being Spain, Brazil, the US, the Netherlands and China. As regards industries, the equity positions are mainly invested in financial services and insurance; other industries represented to a lesser extent are professional, scientific and technical activities, the public sector (the holding in SAREB), energy supply and hospitality.
The structural equity positions are exposed to market risk. VaR is calculated for these positions using series of market prices for listed shares and proxies for unlisted securities. At December 31, 2014, one-day VaR at 99% was EUR 209 million (December 31, 2013: EUR 235 million; December 31, 2012: EUR 281 million).
Structural VaR
In short, a homogeneous metric such as VaR can be used to monitor the total on-balance-sheet market risk (excluding the wholesale banking trading activity), distinguishing between fixed-income (considering both interest rates and credit spreads for ALCO portfolios), exchange rate and equities.
In general, it can be said that structural VaR is not high in terms of the Group’s volume of assets or capital.
5.3.2. Methodologies
Structural interest rate risk
The Group analyses the sensitivity of the net interest margin and market value of equity to changes in interest rates. This sensitivity arises from maturity and interest rate reprising gaps in the various balance sheet items.
F-264
Table of Contents
Taking into consideration the balance-sheet interest rate position and the market situation and outlook, the necessary financial measures are adopted to align this position with that desired by the Group. These measures can range from the taking of positions on markets to the definition of the interest rate features of commercial products.
The metrics used by the Group to control interest rate risk in these activities are the interest rate gap, the sensitivity of net interest margin and market value of equity to changes in interest rates, the duration of capital and value at risk (VaR) for economic capital calculation purposes.
Interest rate gap of assets and liabilities
The interest rate gap analysis focuses on the mismatches between the interest reset periods of on-balance-sheet assets and liabilities and of off-balance-sheet items. This analysis facilitates a basic snapshot of the balance sheet structure and enables concentrations of interest rate risk in the various maturities to be detected. Additionally, it is a useful tool for estimating the possible impact of potential changes in interest rates on the Group’s net interest margin and market value of equity.
The flows of all the on- and off-balance-sheet aggregates must be broken down and placed at the point of reprising or maturity. The duration and sensitivity of aggregates that do not have a contractual maturity date are analyzed and estimated using an internal model.
Net interest margin (NIM) sensitivity
The sensitivity of the net interest margin measures the change in the expected net interest income for a specific period (twelve months) given a shift in the yield curve.
The sensitivity of the net interest margin is calculated by simulating the margin both for a scenario of changes in the yield curve and for the current scenario, the sensitivity being the difference between the two margins so calculated.
Market value of equity (MVE) sensitivity
The sensitivity of the market value of equity is a complementary measure to the sensitivity of the net interest margin.
This sensitivity measures the interest rate risk implicit in the market value of equity based on the effect of changes in interest rates on the present values of financial assets and liabilities.
Treatment of liabilities with no defined maturity
In the corporate model, the total volume of the balances of accounts with no defined maturity is divided into stable balances and unstable balances. This disaggregation is obtained using a model based on the relationship between the balances and their own moving averages.
This simplified model is used to obtain the monthly cash flows that are used to calculate the NIM and MVE sensitivities.
The model requires a series of inputs, which are as follows:
| • | Parameters specific to the product. |
| • | Customer behavior parameters (in this case historical data analysis is combined with expert judgment of the business). |
| • | Market data. |
| • | Historical data of the portfolio. |
F-265
Table of Contents
Treatment of the prepayment of certain assets
Currently, the prepayment issue at the Group affects mainly the fixed-rate mortgages at units at which the relevant yield curves for these portfolios are at low levels. At these units, prepayment risk is modelled and this can be applied, with some changes, to assets with no defined maturity (credit card and similar businesses).
The usual option pricing techniques cannot be applied directly, due to the complexity of the factors that determine prepayment by obligors. Consequently, option pricing models must be combined with empirical statistical models designed to capture prepayment behavior. Some of the factors that influence prepayment behavior are as follows:
| • | Interest rates: the spread between the fixed rate of the mortgage and the market rate at which it could be refinanced, net of repayment and arrangement costs. |
| • | Seasoning: prepayment tends to be low at the start of the instrument’s life cycle (signing of the contract), and then increases and stabilizes as time passes. |
| • | Seasonality: prepayments usually take place on specific dates. |
| • | Burnout: the tendency of the speed of prepayment to decrease as the instrument’s maturity date draws closer, which includes: |
| • | Age: indicates lower prepayment rates. |
| • | Cash pooling: defines loans that have already survived various waves of interest rate falls as being more stable. In other words, when a portfolio of loans has already been through one or more cycles of downward rates and, therefore, of high prepayment levels, the “surviving” loans have a significantly lower prepayment probability. |
| • | Other: geographical mobility, demographic and social factors, disposable income, etc. |
The set of econometric relationships intended to capture the effect of all these factors is the probability of prepayment of a loan or pool of loans and is known as the prepayment model.
Value at Risk (VaR)
The VaR for balance sheet activity and investment portfolios is calculated using the same standard as for trading portfolios: historical simulation with a confidence level of 99% and a one-day horizon. A time window of two years, or 520 daily readings, backwards in time from the VaR calculation reference date, is used.
Structural foreign currency risk/hedges of results
These activities are monitored by measuring positions, VaR and results on a daily basis.
Structural equity risk
These activities are monitored by measuring positions, VaR and results on a monthly basis.
F-266
Table of Contents
5.3.3. Limit control system
As has been stated above for trading market risk, structural balance sheet risk limits are established, within the framework of the annual limit plan, in response to the level of the Group’s risk appetite.
The main limits are:
| • | On-balance-sheet structural interest rate risk: |
| • | Limit on net interest margin sensitivity at one year. |
| • | Limit on the sensitivity of the market value of equity. |
| • | Structural foreign currency risk: net position in each currency (for positions hedging results). |
If any of these limits or sublimits are breached, risk management officers must explain the reasons why and provide an action plan for remedying the situation.
5.4. Pension, actuarial and fiduciary risks
5.4.1 Pension risk
In managing the risk associated with the defined-benefit employee pension funds, the Group assumes the financial, market, credit and liquidity risks incurred in connection with the fund’s assets and investments and the actuarial risks arising from the fund’s liabilities, i.e. the pension obligations to its employees.
The aim pursued by the Group in pension risk control and management is primarily to identify, measure/assess, follow up and monitor, control, mitigate and report this risk. The Group’s priority, therefore, is to identify and eliminate all clusters of pension risk, irrespective of whether losses have been incurred.
Therefore, in the methodology used by Santander Group, the total losses on assets and liabilities in a stress scenario defined by changes in interest rates, discount rates, inflation, stock markets and property indices, as well as credit and operational risk, are estimated every year.
5.4.2 Actuarial risk
Actuarial risk arises from biometric changes in the life expectancy of insureds (life insurance), unexpected increases in projected indemnity payments in non-life insurance and, in any event, unexpected changes in the behavior of insurance policyholders in exercising the options envisaged in the contracts.
A distinction is made between the following actuarial risks:
| • | Life liability risk: risk of loss in the value of life insurance liabilities caused by fluctuations in the risk factors affecting such liabilities: |
| • | Mortality/longevity risk: risk of loss due to changes in the value of liabilities as a result of changes in the estimate of the probability of death/survival of insureds. |
| • | Morbidity risk: risk of loss due to changes in the value of liabilities as a result of changes in the estimate of the probability of disability/incapacity of insureds |
| • | Surrender/lapse risk: risk of loss due to changes in the value of liabilities as a result of the early termination of the contract or changes in the policyholders’ exercise of rights with regard to surrender, extraordinary contributions and/or paid up options. |
| • | Expense risk: risk of loss due to changes in the value of liabilities arising from adverse variances in expected expenses. |
| • | Catastrophe risk: losses caused by the occurrence of catastrophic events that increase the entity’s life liabilities. |
F-267
Table of Contents
| • | Non-life liability risk: risk of loss due to changes in the value of non-life insurance liabilities caused by fluctuations in the risk factors affecting such liabilities: |
| • | Premium risk: loss arising from the lack of sufficient premiums to cater for claims that might be made in the future. |
| • | Reserve risk: loss arising from the lack of sufficient reserves for claims incurred but not settled, including the expenses arising from the management of such claims. |
| • | Catastrophe risk: losses caused by the occurrence of catastrophic events that increase the entity’s non-life liabilities. |
5.4.3 Fiduciary risk
Fiduciary risk arises from management and/or administration of products and assets for the client’s account, and also from trustee services provided for a third party. Fiduciary risk is primarily associated with investment and protection product activities linked to asset management and insurance activities.
It is the risk that is incurred as a result of services provided as trustee for a third party or as administrator of assets for the benefit of a third party, where improper management or administration of assets could result in losses for the client and the trustee could be liable for such losses, with the ensuing economic and/or reputational impact.
Fiduciary risk could also be defined as the potential loss which might arise from significant changes in the value of the portfolios managed by the trustee for third parties (settlors/beneficiaries) and the image and reputation of the trust.
In this regard, there is a relationship between fiduciary risks and conduct risk, which is the risk caused by inappropriate practices in the Bank’s dealings with its customers, the service and products offered to the customer and the suitability thereof for each customer in particular, as well as compliance and reputational risks.
The principle governing all the activities and/or businesses involving fiduciary risk is the duty to serve the client’s best interests: “Look after the clients’ money as if it were your own”. This principle makes it imperative to always act in the client’s best interest, in accordance with the client’s mandate, instructions or orders.
This principle rests on some basic pillars for managing fiduciary risk and the defense of clients’ interests:
| • | Client knowledge: Risk management must be based on an appropriate knowledge, within the organization, of the needs and circumstances of the clients it serves. Knowing the client involves tailoring the product offered to clients in the asset management and insurance activities, while ensuring that it is in line with the marketing policy based on the clients’ profile. |
| • | Mandate compliance: The risk management process requires an analysis and control of mandates through regular mandate compliance assessments. The exposure associated with clients’ positions must be overseen under the same general principles as those used in the analysis and control of the Group’s own exposures. |
| • | Transparency: Clients must be provided, in an accurate and understandable fashion, with all the relevant information relating to the management of their positions, the exposures arising therefrom and the performance and returns generated by such positions. |
| • | Managing conflicts of interest: The interrelation between the management activity and that of other Group business units or divisions may give rise to potential or actual conflicts of interest. To avoid those situations, the Group’s standards must be adhered to at all times, always safeguarding the interests of the clients, participants, investors and/or insureds. |
| • | Monitoring and adapting to the regulations: for both the products and the management companies, to ensure that top-quality services are always provided and prevent regulatory risk. |
Hence, the main component of fiduciary risk is associated with asset management for the account of third parties: discretionary management of investment vehicles and portfolios performed by the management and insurance companies in which the Group has an ownership interest and/or with which it has entered into retail agreements, and also with the activity performed by the Group’s private banking units, which perform discretionary portfolio management and advisory duties for clients.
F-268
Table of Contents
The regulations require both the management companies and the companies providing investment services for third parties to always act and in all cases safeguard the clients’ interests.
This requirement is set out in the management agreement or fiduciary mandate, which stipulates the trustee’s terms of service and its relationship with clients. In order to ensure compliance with the mandate awarded by clients, risk is managed from the various vectors which may affect the portfolios and which are described below.
In order for the trustee to provide such services, at local level it must possess a legal structure subject to the requirements of its local supervisor. The trustee must also have the appropriate technical and human resources, and control and monitor risks in a risk and compliance unit that is independent from the business.
The three main vectors in fiduciary risk control are:
| • | Financial, market, credit and liquidity risks incurred in connection with the investment of clients’ assets in financial products and instruments, |
| • | The regulatory risk relating to compliance with regulatory limits and the fiduciary risk itself, relating to compliance with the investment mandates and to the security of the investment process. |
| • | Importance of monitoring the end result of the investments with regard to both the fiduciary relationship with the client, who expects the best results, and competitors. Always with the aim of providing a service of the highest quality possible, without losing sight of the Group’s principles governing risk. |
6. LIQUIDITY AND FUNDING RISK
6.1. Introduction to the treatment of liquidity and funding risk
Liquidity and funding management has always been a basic element of the Group’s business strategy and a fundamental cornerstone, together with capital, on which the strength of its balance sheet rests.
Liquidity became highly significant for bank management in recent years due to the stresses that arose in the financial markets in the context of a global economic crisis. This scenario emphasized the importance of banks having appropriate funding structures and strategies to ensure the continuity of their intermediation activity.
During that period of stress, the Group enjoyed an adequate liquidity position, surpassing that of its peers, which represented a competitive advantage in terms of carrying on and expanding its activity in a demanding environment.
Currently, in a more favorable scenario for liquidity, the Group continues to benefit from its proven robustness as it meets the new challenge of cost optimization amid the demanding liquidity standards required by regulations, and as it drives growth in geographical areas previously undergoing deleveraging.
This improved position achieved by the Group as a whole is based on a decentralized funding model composed of subsidiaries that are autonomous and self-sufficient in terms of liquidity. Each subsidiary is responsible for covering the liquidity needs arising from its current and future activity, either by taking deposits from its customers in its area of influence, or by resorting to the wholesale markets where it operates, subject to management and supervision procedures coordinated at Group level.
This is a funding structure that has proven to be most effective in situations of high market stress as it prevents difficulties in one area from affecting funding capacity in other areas and, therefore, the Group as a whole, which could occur if a centralized funding model were used.
F-269
Table of Contents
In addition, at the Group this funding structure also benefits from the advantages of having a commercial banking model with a significant presence in ten markets with great potential, with the focus on retail customers and a high level of efficiency. As a result, the subsidiaries have a considerable capacity to attract stable deposits, as well as a significant issue capacity in the wholesale markets of those countries, generally in local currencies, bolstered by the strength of their franchise and their membership of a leading group.
6.2. Liquidity management framework - Monitoring and control of liquidity risk
Structural liquidity management seeks to finance the Group’s recurring business with optimal maturity and cost conditions, avoiding the need to assume undesired liquidity risks.
Liquidity management at the Group is based on the following principles:
| • | Decentralized liquidity model. |
| • | Medium- and long-term liquidity needs arising from the business must be funded using medium- and long-term instruments. |
| • | High proportion of customer deposits, as a result of a commercial balance sheet. |
| • | Diversification of wholesale funding sources by: instrument/investor; market/currency; and maturity. |
| • | Restrictions on recourse to short-term wholesale financing. |
| • | Availability of a sufficient liquidity reserve, including a capacity for discounting at central banks, to be drawn upon in adverse situations. |
| • | Compliance with the regulatory liquidity requirements at Group and subsidiary level, as a new conditioning factor in management. |
In order to ensure the effective application of these principles by all the Group entities, it was necessary to develop a single management framework resting on the following three cornerstones:
| • | A sound organizational and governance model to ensure that senior management of the subsidiaries is involved in the decision-making process and is included in the Group’s global strategy. |
| • | An in-depth balance-sheet analysis and liquidity risk measurement to support the decision-making process and the control thereof. |
| • | A management approach adapted in practice to the liquidity needs of each business. |
6.2.1. Organizational and governance model
Decisions relating to all structural risks, including liquidity risk, are made though local asset-liability committees (ALCOs) in coordination with the Global ALCO.
The Global ALCO is the body empowered by the Bank’s board of directors to coordinate the asset and liability management (ALM) function throughout the Group, including the management of liquidity and funding, which is carried out by the local ALCOs in accordance with the corporate ALM framework.
F-270
Table of Contents
It is presided over by the Bank’s chair and its members are an executive deputy chairman (who, in turn, is the chairman of the executive risk committee), the CEO, the finance and risk executive vice presidents, and other executive vice presidents and heads of certain business and analysis units who perform advisory functions.
In line with governance best practice, the Group has traditionally maintained a clear division between the implementation of the financial management strategy (for which the financial management area is responsible) and its monitoring and control (which is the responsibility of the market risk area).
In recent years, this governance model has been reinforced by being integrated into a more global vision of the Group’s risks, namely the Group risk appetite framework. This framework responds to the demands from market regulators and participants, as a result of the financial crisis, for banks to strengthen their risk management and control systems.
As regards liquidity risk profile and appetite, the framework aims to reflect the Group’s business strategy in structuring the balance sheet to make it as resilient as possible to potential liquidity stress scenarios. Appetite metrics have therefore been structured to reflect the application, on an individual basis, of the principles of the Group’s management model, with specific levels for the structural funding ratio and minimum liquidity horizons under various stress scenarios.
6.2.2. Balance sheet analysis and liquidity risk measurement
Funding and liquidity decision-making is based on a thorough understanding of the Group’s current situation (environment, strategy, balance sheet and liquidity position), of the future liquidity needs of the various units and businesses (liquidity projection) and of the accessibility and situation of the funding sources in wholesale markets.
Its aim is to ensure that the Group maintains adequate liquidity levels to cover its short- and long-term requirements with stable funding sources, optimizing the impact of funding costs on the income statement.
This requires the monitoring of the balance sheet structure, the preparation of short- and medium-term liquidity projections and the establishment of basic metrics.
Simultaneously, various scenario analyses are conducted considering the additional liquidity needs that could arise if certain very severe but highly unlikely events occur. These events might have a varying effect on the various balance sheet items and/or funding sources (extent of roll-over of wholesale financing, level of run-off of deposits, impairment of liquid assets, etc.), due either to the global market conditions or to the Group’s specific situation.
The results of these balance-sheet, projection and scenario analyses provide the inputs required to prepare the Group’s various contingency plans, which, if necessary, would enable it to anticipate a broad spectrum of potential adverse situations.
All these measures are in line with the practices being promoted to strengthen the liquidity of financial institutions by the Basel Committee and the various regulators (in the European Union, the European Banking Authority). The objective is to define a framework of principles and metrics that are, in some cases, nearing implementation and, in others, at earlier stages of development.
F-271
Table of Contents
Methodology for liquidity risk monitoring and control
The liquidity risk metrics adopted by the Group pursue the following goals:
| • | To attain the highest degree of effectiveness in liquidity risk measurement and control. |
| • | To provide support for financial management, to which end the metrics are adapted to the manner in which the Group’s liquidity is managed. |
| • | To be aligned with the regulatory requirements arising from the transposition of Basel III in the European Union, in order to avoid any conflicts between limits and to facilitate management. |
| • | To act as an early warning system that anticipates potential risk situations by monitoring certain indicators. |
| • | To achieve involvement at country level. Although the metrics are developed on the basis of common, uniform concepts affecting liquidity, these have to be analyzed and adapted by each unit. |
Two kinds of basic metrics are used to control liquidity risk: short term and structural. Short-term metrics include basically the liquidity gap, while structural metrics feature the net structural balance-sheet position.
Liquidity gap
The liquidity gap provides information on potential cash inflows and outflows -both contractual and those estimated using assumptions- for a given period. Liquidity gap analyses are prepared for each of the main entities and for each of the currencies in which the Group operates.
The gap supplies data on the projected sources and applications of funds of all on- and off-balance sheet items in specific time periods. This analysis tool is obtained by considering the net result of the maturity and cash flow structure for each of the time buckets established. The tool is constructed by including the available liquidity and contrasting it with the liquidity requirements resulting from maturities.
In practice, since the same item will behave differently at the various Group subsidiaries, a set of common standards and methodologies are in place to make it possible to construct the liquidity risk profiles of each unit in a uniform manner and to submit these profiles in a comparable form to the Bank’s senior management.
Consequently, as this analysis has to be performed on an individual basis for each subsidiary, for the purpose of their autonomous management, a consolidated view of the Group’s liquidity gaps is of very limited use for the management and understanding of liquidity risk.
Net structural position
The purpose of this metric is to determine the reasonableness of the balance-sheet funding structure. The Group’s aim is to ensure that its structural needs (lending, non-current assets, etc.) are satisfied by means of an appropriate combination of wholesale funding sources and a stable retail customer base, as well as capital and other non-current liabilities.
Each unit prepares its liquidity balance sheet based on the nature of its business and compares its liquidity needs with the various funding sources available to it. The essential factors taken into account in determining this metric are the degree of recurrence of the business to be financed, the stability of the funding sources and the readiness with which assets can be converted into cash.
In practice, each subsidiary prepares its own liquidity balance sheet (different from the balance sheet for accounting purposes) by classifying the various asset, liability and off-balance-sheet items on the basis of
F-272
Table of Contents
their nature in terms of liquidity. Thus, the funding structure of each subsidiary is determined, which must at all times conform to a fundamental premise: namely that the core businesses must be financed with stable funds and medium- and long-term financing. The combination of these measures guarantees the robustness of the Group’s financial structure and the sustainability of its business plans.
At the end of 2014, the Group had a structural liquidity surplus of EUR 153,000 million, comprising debt securities (EUR 151,000 million), equity instruments (EUR 14,000 million) and net loans and advances to credit institutions and central banks (EUR 9,000 million), offset by short-term wholesale funding (EUR 21,000 million).
Accordingly, the average structural liquidity surplus amounted to EUR 158,000 million.
Scenario analysis
The Group supplements the aforementioned metrics by developing a series of stress scenarios.
Its main objective is to identify the critical factors in potential crises and, at the same time, to define the most appropriate management measures to address each of the situations assessed.
In their liquidity analyses the units generally consider three different scenarios: idiosyncratic, local systemic and global systemic. These scenarios constitute the minimum standard analysis established for all Group units to be reported to senior management. Also, each unit develops ad-hoc scenarios which replicate major historical crises or the liquidity risks specific to its particular environment.
The definition of scenarios and calculation of metrics under each scenario is directly related to the definition and execution of the liquidity contingency plan, which is the responsibility of financial management.
At the end of 2014, in the event of a potential systemic crisis the Group would have an adequate liquidity position.
6.2.3. Management tailored to business needs
The Group performs its liquidity management at subsidiary and/or business unit level in order to finance its recurring activities with the appropriate terms and prices.
In practice, the liquidity management at these units consists of:
| • | Preparation of a liquidity plan each year on the basis of the funding needs arising from the budgets of each business and the methodology described above. Based on these liquidity requirements and taking into account certain prudential limits on the raising of funds in the short-term markets, the financial management area establishes an issue and securitization plan for the year at subsidiary/global business level. |
| • | Year-round monitoring of the actual changes in the balance sheet and in the funding requirements of the subsidiaries/businesses, which results in the relevant updates of the plan. |
| • | Monitoring and management of the units’ compliance with the regulatory ratios, and oversight of the level of committed assets in each unit’s funding, from a structural standpoint and with regard to the component with the shortest term. |
| • | Continuous active presence in a wide range of wholesale funding markets, enabling the Group to maintain an adequate issue structure that is diversified in terms of product type and has a conservative average maturity. |
F-273
Table of Contents
The effectiveness of this management effort at Group level is based on the fact that it is implemented at all subsidiaries. Specifically, each subsidiary budgets the liquidity requirements resulting from its intermediation activity and assesses its own ability to raise funds in the wholesale markets so that, in ongoing coordination with the Group, it can establish an issue and securitization plan.
Traditionally, the Group’s main subsidiaries have been self-sufficient in terms of their structural funding. The exception is Santander Consumer Finance (SCF) which, because it specializes in consumer financing mainly through dealer/retailer recommendations, requires the financial support of other Group units, especially the Parent.
6.3. Funding strategy and evolution of liquidity in 2014
6.3.1. Funding strategy
In the last few years the Group’s funding activity has achieved its goal of obtaining sufficient funds for the Group’s recurring business in a more demanding environment. At its peak, during the global economic and financial crisis, the Group had to manage sharp increases in risk. As a result, liquidity levels were very low over certain terms and the related costs were very high. Following the interventions by the central banks of the major economies, these market conditions eased significantly throughout 2013 and even more so in 2014.
This sound performance by the Group was underpinned by the extension of the management model to all Group subsidiaries, including recent acquisitions, and, above all, by the adaptation of the subsidiaries’ strategies to the growing demands of both markets and regulators. These demands were not uniform across the markets and reached far higher levels of difficulty and pressure in certain areas, such as the peripheral regions of Europe.
In any case, it is possible to identify a series of general trends in the policies implemented by Group’s subsidiaries in their funding and liquidity management strategies since the beginning of the crisis, namely:
| • | Strong generation of liquidity from the commercial business due to the lower growth of credit and greater emphasis on attracting customer funds. |
| • | Maintenance of adequate, stable medium- and long-term wholesale funding levels at Group level. At 2014 year-end, this funding represented 21% of the liquidity balance sheet, a similar level to that of recent years but well below that of 2008 year-end when wholesale funding, which was more abundant and less expensive, had not yet suffered the pressures of the crisis. Following the tightening of conditions on the wholesale markets, the Group’s decentralized subsidiaries model, with proprietary issue and rating programs, contributed to maintaining the Group’s high-level participation in the developed wholesale markets, even in the most demanding periods, such as the two-year period encompassing 2011 and 2012. |
| • | Holding a sufficient volume of assets eligible for discount at central banks as part of the liquidity reserve to cater for episodes of stress on wholesale markets. In particular, in recent years the Group has significantly raised its total discount capacity, which currently stands at around EUR 170,000 million. |
Thanks to all these market and business developments, based on a sound liquidity management model, the Group currently enjoys a very robust funding structure, the main features of which are as follows:
| • | High proportion of customer deposits in a predominantly commercial balance sheet. Customer deposits are the Group’s major source of funding. These deposits represent around two thirds of the Group’s net liabilities (i.e. of the liquidity balance sheet) and at the end of 2014 they accounted for 88% of net loans. |
F-274
Table of Contents
| • | Diversified wholesale funding, primarily at medium and long term, with a very small proportion maturing in the short term. Medium- and long-term wholesale funding represents 21% of the Group’s net liabilities and enables it to comfortably cater for the net loans not financed with customer deposits (commercial gap). This funding is well-balanced by instrument (approximately 1/3 senior debt, 1/3 securitizations and secured, structured loans, 1/4 cédula-type covered bonds, with the remainder consisting of preference shares and subordinated debt) and by market: the markets with a greater proportion of issues are the ones where investment activity is higher. |
6.3.2. Evolution of liquidity in 2014
At the end of 2014, in comparison with 2013, the Group reported:
| • | A stable ratio of loans to net assets (total assets less trading derivatives and interbank balances) at 74% due to the improvement in lending following the end of deleveraging in mature markets. |
| • | A slight increase in the loan-to-deposit (LTD) ratio, to 113% (112% in 2013), within very comfortable levels (lower than 120%). The trend in this ratio reflects the recovery of credit in mature markets, both organic and inorganic, and the increased focus on optimizing the cost of retail deposits in countries with low interest rates. |
| • | A slight decline in the ratio of customer deposits plus medium- and long-term funding to loans, for similar reasons to the trend in the LTD ratio, since the increase in the wholesale funds raised at the Group is also lower than that of loans. This ratio stood at 116%. |
| • | There was a continuing limited recourse to short-term wholesale funds at the Group. The ratio of this funding, at around 2%, was in line with previous years. |
Lastly, the Group’s structural surplus (i.e. the excess of structural funding resources -deposits, medium- and long-term funding, and capital- over structural liquidity requirements -non-current assets and loans-) continued to rise in 2014. At December 31, 2014, the structural surplus stood at EUR 153,000 million on a consolidated basis.
Asset encumbrance
It is important to note the Group’s moderate use of assets as security for structural balance-sheet funding sources. Following the guidelines laid down by the European Banking Authority (EBA) in 2014, the concept of asset encumbrance includes both on-balance-sheet assets provided as security in transactions to obtain liquidity and off-balance-sheet assets that have been received and re-used for the same purpose, as well as other assets associated with liabilities for reasons other than funding.
The reporting of the Group information at 2014 year-end required by the EBA is as follows:
On-balance-sheet encumbered assets
| Thousands of millions of euros |
Carrying amount of encumbered assets |
Carrying amount of non- encumbered assets |
||||||
| Assets |
296.0 | 970.3 | ||||||
| Loans and advances |
186.3 | 692.1 | ||||||
| Equity instruments |
7.4 | 11.4 | ||||||
| Debt instruments |
84.2 | 92.2 | ||||||
| Other assets |
18.1 | 174.6 | ||||||
F-275
Table of Contents
Encumbrance of collateral received
| Thousands of millions of euros |
Fair value of encumbered collateral received or own debt securities issued |
Fair value of collateral received or own debt securities issued available for encumbrance |
||||||
| Collateral received |
57.5 | 37.4 | ||||||
| Loans and advances |
1.6 | 0.3 | ||||||
| Equity instruments |
1.8 | 0.6 | ||||||
| Debt instruments |
54.2 | 31.4 | ||||||
| Other collateral received |
— | 5.3 | ||||||
| Own debt securities issued other than own covered bonds or ABSs |
— | — | ||||||
Encumbered assets and collateral received and matching liabilities
| Thousands of millions of euros |
Matching liabilities, contingent liabilities or securities lent |
Assets, collateral received and own debt securities issued other than covered bonds and ABSs encumbered |
||||||
| Total sources of encumbrance (carrying amount) |
291.7 | 353.5 | ||||||
On-balance-sheet encumbered assets amounted to EUR 296 thousand million, almost two-thirds of which are loans (mortgage loans, corporate loans, etc.). For their part, off-balance-sheet encumbered assets amounted to EUR 57.5 thousand million, relating mostly to debt securities received as security in asset purchase transactions and re-used. Taken together, these two categories represent a total of EUR 353.5 billion of encumbered assets, which give rise to EUR 291.7 billion of associated liabilities.
At 2014 year-end, total assets encumbered in funding transactions represented 26% of the Group’s expanded balance sheet under EBA standards (total assets plus collateral received: EUR 1,361 thousand million at December 2014).
Within these encumbered assets, a distinction should be made between the different sources of encumbrance and the role they play in the Group’s funding:
| • | 50% of total encumbered assets relate to security provided in medium- and long-term financing transactions (with average maturity of more than two years) to fund the commercial balance-sheet activity. This places the level of “structural” asset encumbrance at 13% of the expanded balance sheet under EBA standards. |
| • | The other 50% relate to transactions in the short-term market (with average maturity of less than three months) or to security provided in derivative transactions whose purpose is not to fund the ordinary business activity but rather to ensure efficient short-term liquidity management. |
7. OPERATIONAL RISK
7.1. Definition and objectives
The Group defines operational risk (OR) as “the risk of loss resulting from inadequate or failed internal processes, people and systems or from external events”.
Operational risk is inherent in all products, activities, processes and systems, and is generated in all the business and support areas. Accordingly, all the employees are responsible for managing and controlling the operational risks generated in their area of activity.
The aim pursued by the Group in operational risk control and management is primarily to identify, measure/assess, monitor, control, mitigate and report on this risk.
F-276
Table of Contents
The Group’s priority, therefore, is to identify and mitigate any clusters of operational risk, irrespective of whether losses have been incurred. Measurement of this risk also contributes to the establishment of priorities in operational risk management.
For the purpose of calculating regulatory capital for operational risk, the Group has been applying the Standardized Approach provided for under Basel II standards. However, in 2014 the Group embarked on a project to shift to Advanced Measurement Approaches (AMA), for which it has already satisfied the majority of the regulatory requirements. In any event, it should be noted that the priority in operational risk management continues to be focused on mitigation.
7.2. Operational risk management and control model
7.2.1. Operational risk management cycle
The operational risk management and control model includes the following phases:
| • | Identification of the operational risk inherent in all the Group’s activities, products, processes and systems. |
| • | Definition of the target operational risk profile, specifying the strategies by unit and time horizon, through the establishment of the operational risk appetite and tolerance, the budget and the related monitoring. |
| • | Encouragement of the involvement of all employees in the operational risk culture, through appropriate training for all areas and levels of the organization. |
| • | Objective and continued measurement and assessment of operational risk, consistent with the industry and regulatory standards (Basel, Bank of Spain, etc.). |
| • | Continuous monitoring of operational risk exposures, implementation of control procedures, improvement of internal awareness and mitigation of losses. |
| • | Establishment of mitigation measures to eliminate or minimize operational risk. |
| • | Generation of periodic reports on the exposure to operational risk and its level of control for senior management and the Group’s areas/units, and reporting to the market and the regulatory authorities. |
| • | Definition and implementation of the methodology required for calculating capital in terms of expected and unexpected loss. |
The following is required for each of the key processes indicated above:
| • | Definition and implementation of systems enabling the Group to monitor and control operational risk exposures. These systems must be integrated into the Group’s daily management, using the current technology and maximizing the automation of applications. |
| • | Definition and documentation of operational risk management and control policies and implementation of the related methodologies and tools consistent with current regulations and best practices. |
The operational risk management and control model implemented by the Group provides the following benefits:
| • | It encourages the development of an operational risk culture. |
| • | Integrated and effective management of operational risk (identification, measurement/assessment, control/mitigation and reporting). |
| • | Improved knowledge of actual and potential operational risks and better assignment to business and support lines. |
F-277
Table of Contents
| • | The information on operational risk helps improve processes and controls and reduce losses and income volatility. |
| • | Setting of limits for operational risk appetite. |
7.2.2. Risk identification, measurement and assessment model
In order to identify, measure and assess operational risk, the Group defined a set of quantitative and qualitative corporate techniques/tools that are combined to perform a diagnosis based on the identified risks and obtain a valuation through the measurement/assessment of the area/unit.
The quantitative analysis of this risk is carried out mainly using tools that record and quantify the level of losses associated with operational risk events.
The tools defined for the qualitative analysis aim to assess aspects (coverage/exposure) linked to the risk profile, thereby making it possible to capture the control environment in place.
7.3. Mitigation measures
The Group has an inventory of mitigation measures established in response to the main sources of risk. They were identified through the analysis of the tools applied for managing operational risk, and from the organizational and development model, as well as from the preventive implementation of operational and technology risk management and control policies and procedures.
The most significant mitigation measures center on improving security for customers in their ordinary transactions, and continuous improvement of processes, technology and management to ensure that products are sold and services are provided appropriately.
In addition, with regard to measures relating to customer-, product- and business-related practices, the Group establishes corporate policies for marketing products and services.
Anti-cyber-risk measures
2014 provided confirmation of the upward trend in the number and impact of incidents relating to cybersecurity, which affect all types of companies and institutions, including those in the financial sector. This situation, which is generating concern among entities and regulators, is encouraging the adoption of preventive measures in order to be prepared for attacks of this nature. The implementation of the cybersecurity strategy at the various Group entities gave rise to various initiatives and lines of action, such as:
| • | Assessment of each entity’s situation with respect to the internal reference model in order to identify possibilities for improvement and to prioritise points of action with regard to cyber risks. |
| • | Strengthening of the technological solutions and services aimed at detecting and preventing cyber attacks and information leaks, and the recording, correlation and management of security events. |
| • | Improvement of the security monitoring services and extension of their scope. |
| • | Participation in the cyber exercises promoted by the Spanish Cybersecurity Institute (INCIBE) aimed at evaluating the response by companies to this type of incident. |
| • | Cooperation with international forums with the objective of identifying best practices and sharing information about threats. |
7.4. Business continuity plan
The Group has a business continuity management system to ensure the continuity of the business processes of its entities in the event of a disaster or serious incident.
F-278
Table of Contents
This basic objective consists of the following:
| • | Minimizing possible injury to persons, as well as adverse financial and business impacts for the Group, due to an interruption of normal business operations. |
| • | Reducing the operational effects of a disaster by supplying a series of pre-defined, flexible guidelines and procedures to be employed in order to resume and recover processes. |
| • | Resuming time-sensitive business operations and associated support functions, in order to achieve business continuity, stable earnings and planned growth. |
| • | Re-establishing the time-sensitive technology and transaction-support operations of the business if existing technologies are not operational. |
| • | Protecting the public image of, and confidence in, the Group. |
| • | Meeting the Group’s obligations to its employees, customers, shareholders and other third-party stakeholders. |
In 2014 the Group continued to make progress in the implementation and continuous improvement of its business continuity management system. It placed particular emphasis on tightening controls for monitoring the continuity plans of the suppliers that provide services deemed essential for the Bank.
7.5. Other matters relating to operational risk control and monitoring
Analysis and monitoring of controls in market operations
In view of the specific features and complexity of financial markets, the Group continually improves the operational control procedures in order to remain in line with new regulations and best market practices. Therefore, in 2014, the control model for this business continued to be improved, with particular emphasis on the following points:
| • | Analysis of the individual operations of each treasury operator to detect any possible anomalous conduct. |
| • | Implementation of a new tool enabling compliance with the new requirements regarding transaction recording and eavesdropping control. |
| • | Tightening of controls on cancellations of amendments to transactions. |
| • | Reinforcement of controls on contributions of prices to market indices. |
| • | Development of additional controls for operational detection and prevention. |
| • | Development of additional controls of accesses to front-office record keeping systems. |
The business is also undergoing a global transformation, combined with the modernization of the technology platforms and operating processes involving a robust control model that enables the operational risk associated with this activity to be reduced.
Corporate information
The operational risk function has an operational risk management information system that provides data on the Group’s main risk elements. The information available from each country/unit in the operational risk sphere is consolidated to obtain a global view with the following features:
| • | Two levels of information: one corporate, with consolidated information, and the other individualized for each country/unit. |
| • | Dissemination of the best practices among the countries/units of the Group, obtained from the combined study of the results of qualitative and quantitative analyses of operational risk. |
F-279
Table of Contents
More specifically, information is prepared on the following aspects:
| • | The operational risk management model in place at the Group and its main units and geographical areas. |
| • | The scope of operational risk management. |
| • | Monitoring of appetite metrics. |
| • | Analysis of the internal event database and of significant external events. |
| • | Analysis of the most significant risks, detected using various sources of information, such as the internal operational and technology risk assessment exercises. |
| • | Evaluation and analysis of risk indicators. |
| • | Mitigating measures/active management. |
| • | Business continuity plans and contingency plans. |
This information acts as the basis for meeting reporting requirements to the executive risk committee, the risk supervision, regulation and compliance committee, the operational risk committee, senior management, regulators, rating agencies, etc.
The role of insurance in operational risk management
The Group considers insurance as a key factor in operational risk management. In 2014 common guidelines were established for coordinating the various functions involved in the management cycle for operational risk-mitigating insurance, mainly the areas of proprietary insurance and operational risk control, but also the various front-line risk management areas.
8. COMPLIANCE, CONDUCT AND REPUTATIONAL RISK
8.1. Definitions and objective
Compliance risk is the risk of receiving penalties, even of a financial nature, or of being subject to other types of disciplinary measures by the supervisors as a result of failing to comply with laws, regulations, standards, the organization’s self-regulatory standards or codes of conduct applicable to the activity carried on.
Conduct risk is the risk caused by inappropriate practices in the Bank’s dealings with its customers, the treatment and products offered to them and the adequacy thereof for each particular customer.
Reputational risk is defined as the risk of damage to the perception of the Bank held by public opinion, the Bank’s customers, investors or any other interested party.
The Group’s objective regarding compliance and conduct risk is: (i) to minimize the probability of irregularities arising; and (ii) to identify, report and swiftly resolve any irregularities that might possibly arise. As for reputational risk, bearing in mind the diversity of sources from which it can arise, management efforts are aimed at identifying and controlling this risk so that the probability of its occurring is reduced and its possible impact is mitigated.
8.2. Corporate governance and organizational model
It is the responsibility of the Bank’s board of directors, as part of its supervisory function, to approve the Group’s general risk policy. In the corporate compliance, conduct and reputational risk area, the board is in charge of the Group’s general code of conduct, the governance frameworks on the prevention of money laundering and terrorist financing, and the marketing of products and services.
F-280
Table of Contents
The compliance function reports to the board of directors: (i) on an ongoing basis, directly through an executive deputy chairman of the board who supervises the Group’s compliance function; and (ii) through the monthly report submitted to the risk supervision, regulation and compliance committee. This committee supports and advises the board in the Group’s relationship with the supervisors and regulators of the various countries in which it is present, as well as in the supervision of internal codes and regulations.
At its meeting on January 16, 2015, the board of directors resolved to appoint an executive deputy chairman of the board, to whom the compliance function will report, in accordance with regulatory recommendations on corporate governance.
In addition, in order to bolster the importance of the compliance function, at its meeting on February 2, 2015 the executive committee resolved to appoint an executive vice president as chief compliance officer.
The corporate committees for regulatory compliance, analysis and resolution and marketing (the last two specialize in their respective subjects: the prevention of money laundering and the marketing of products and services) are collective bodies with basic competencies in this matter which have a global scope (all geographical areas, all businesses) and are replicated at local level.
The risk unit monitors the compliance risk control framework both from the integrated risk control and internal risk validation area (CIVIR), in the exercise of its functions to support the executive risk committee, and from the non-financial risk control area created in 2013.
The organizational model revolves around the corporate compliance and reputational risk area, which is entrusted with managing the Group’s compliance, conduct and reputational risks. Within this area are the corporate regulatory compliance risk management office, the corporate conduct risk management office and the corporate financial intelligence unit (UCIF), which is responsible for the prevention of money laundering and terrorist financing. This structure is replicated at local level and also in the global businesses, and the appropriate functional reporting channels to the corporate area have been established.
8.3. Risk appetite model and regulatory risk assessment exercise
The Group’s risk appetite model applicable to compliance and conduct risk is characterized by the following three elements:
| • | It is based on an express declaration of zero appetite for compliance and conduct risk. |
| • | The objective of the management performed by the Group is to minimize the incidence of compliance and conduct risk. Accordingly, systematic monitoring is performed using the compliance and conduct risk indicator resulting from the assessment matrices prepared for each country. |
| • | Quarterly monitoring of the level of risk is performed on a country-by-country basis. |
Data of the communications received from the various supervisors each month is fed into the assessment matrix. Each of these communications is allocated a score depending on the risk they represent in terms of: (i) costs due to fines; (ii) process reorganization costs; and (iii) the impact on the brand and reputational risk. These assessments complement the ratings assigned by internal audit with respect to compliance. Each local unit is allocated a weighting based on its attributable profit and volume of assets, which can be used to obtain an overall score for the Group.
The corporate compliance area carried out a regulatory risk assessment exercise in 2014 focusing on the Group’s main countries. This exercise, which centered on the identification of the regulatory obligations affecting the Group’s units, was based on a risk assessment of each obligation, which is conducted in two stages: the first, in relation to “inherent risk”, which stems from the activity relating to the business, and the second, in relation to residual risk, after taking the effect of the controls into consideration.
This regulatory risk assessment exercise is expected to complement the risk appetite model by contributing new metrics to it.
F-281
Table of Contents
8.4. Risk management model
The main responsibility for compliance, conduct and reputational risk management is shared by the compliance and reputational risk function and the various business and support units that conduct the activities giving rise to risk. The responsibility for fostering the development of standard policies across the entire Group, for establishing controls and monitoring and checking that they are applied, and for reporting incidents lies with the compliance and reputational risk function, which is also responsible for advising senior management on these matters and for fostering a culture of compliance, all as part of an annual program whose effectiveness is periodically evaluated.
The compliance function directly manages the basic components of these risks (money laundering, codes of conduct, product marketing, etc.) and ensures that the other components are duly addressed by the corresponding Group unit (responsible financing, data protection, customer claims, etc.), for which purpose it has established the appropriate control and verification systems.
The integrated risk control and internal risk validation area (CIVIR) ensures that the risk management model is properly executed. Also, as part of its functions, internal audit performs the tests and reviews required to check that the standards and procedures established at the Group are being complied with.
The central plank of the Group’s compliance program is the general code of conduct. This code contains the ethical principles and standards of conduct that must guide the actions of all the Group employees and is complemented in certain matters by the standards contained in the industry-specific codes and manuals10.
Also, the code establishes: i) the functions and responsibilities regarding compliance by the Group’s relevant governing bodies and divisions; ii) the standards regulating the consequences of the failure to comply; and iii) a channel for reporting and processing notifications of allegedly irregular actions.
It is the role of the corporate compliance office, under the supervision of the risk supervision, regulation and compliance committee and the regulatory compliance committee, to ensure the effective implementation and monitoring of the general code of conduct.
The regulatory compliance committee has authority on all matters relating to the compliance function, without prejudice to the matters assigned to the two specialist bodies in this area (the corporate marketing committee with regard to the marketing of products and services, and the analysis and resolution committee with regard to the prevention of money laundering and terrorist financing). The regulatory compliance committee is composed of representatives from the general secretary’s division, risk, human resources, organization and costs, technology and operations, internal audit, financial management and public policy.
The Group’s compliance department has been entrusted with the following compliance, conduct and reputational risk management functions:
| • | Implementing the Group’s general code of conduct and other industry-specific codes and manuals. |
| • | Supervising the training activities on the compliance program conducted by the human resources area. |
| • | Directing any investigations into possible breaches, with help from internal audit, and proposing the appropriate penalties to the related committee. |
| 10 | The industry-specific codes and manuals include the prevention of money laundering and terrorist financing manual, the code of conduct in securities markets, the procedures manual for the sale of financial products, the analysis code of conduct, the research policy manual, the use of information and communications technology conduct manual, the property management conduct manual, the purchasing management conduct manual, etc., in addition to the notes and circulars implementing specific points of these codes and manuals, including, in particular, the corporate circular on the corporate programme for the prevention of corruption. |
F-282
Table of Contents
| • | Cooperating with internal audit in the periodic reviews that it carries out on compliance with the general code of conduct and with the industry-specific codes and manuals, without prejudice to the periodic reviews of matters of regulatory compliance which are conducted by the compliance department directly. |
| • | Receiving and handling the complaints made by employees through the whistleblowing facility. |
| • | Advising on the resolution of doubts arising from the application of the codes and manuals. |
| • | Preparing an annual report on the application of the compliance program for submission to the risk supervision, regulation and compliance committee. |
| • | Regularly reporting to the risk supervision, regulation and compliance committee and the board of directors on the implementation of the compliance policy and the compliance program. |
| • | Assessing, every year, the changes that it might be appropriate to make to the compliance program, particularly in the event of detecting unregulated risk areas and improvable procedures, and proposing such changes to the risk supervision, regulation and compliance committee. |
As regards the industry-specific codes and manuals, the focus of the compliance program is on the following operational spheres, inter alia:
Prevention of money laundering and terrorist financing
Policies
As a socially responsible organization, it is a strategic objective for the Group to have an advanced effective system for the prevention of money laundering and the financing of terrorism that is constantly adapted to the latest international regulations and has the capacity to respond to the appearance of new techniques employed by criminal organizations.
The prevention of money laundering and terrorist financing function is articulated in certain policies that establish minimum standards that the Group’s units must observe, and which are prepared in conformity with the principles contained in the 40 recommendations of the Financial Action Task Force (FATF) and the obligations and stipulations of Directive 2005/60/EC of the European Parliament and of the Council of October 26, 2005 on the prevention of the use of the financial system for the purpose of money laundering and terrorist financing.
The corporate policy and the standards implementing it must obligatorily be complied with at all Group units worldwide. In this regard, units should be taken to be all the banks, subsidiaries, departments or branches of the Bank, both in Spain and abroad, which, in accordance with their legal status, must be subject to the regulations on the prevention of money laundering and terrorist financing.
Governance and organization
The organization of the prevention of money laundering and terrorist financing function at Santander Group lies with the following bodies: (i) the board of directors, (ii) the Group’s analysis and resolution committee (CAR), (iii) the corporate financial intelligence unit (UCIF), (iv) local CARs, (v) local prevention of money laundering and terrorist financing (PML/TF) units and (vi) heads of prevention at various levels.
The board of directors approves the internal governance framework for the prevention of money laundering and terrorist financing.
The Group’s CAR is a collective body with a corporate scope. It is composed of representatives of the following divisions: risk, internal audit, commercial banking, global wholesale banking, human resources, organization and costs, technology and operations, the controller’s unit and management control, consumer finance and the general secretary’s division. It defines the general policies and objectives, and formulates the policy rules for the Group’s various bodies and entities with regard to prevention and the related coordination.
F-283
Table of Contents
As a result of the separation of the local area in Spain from the corporate area, a local CAR was created for Spain in 2014. Previously part of the corporate CAR, it is now distinct from it and assumes the functions of an internal PML/TF control body with a local remit.
The corporate financial intelligence unit (UCIF) directs, supervises and coordinates the systems for the prevention of money laundering and terrorist financing of the Group’s subsidiaries, branches and business areas. This requires the adoption of programs, measures and improvements where necessary.
The local CARs are the internal control bodies designated for the prevention of money laundering and terrorist financing with a local remit. They are composed of representatives of the departments most directly involved in these matters.
The local prevention of money laundering units (UPBCs) are the technical units responsible for directing and coordinating the systems and procedures for the prevention of money laundering and terrorist financing in the countries where the Group has a presence, for investigating and reporting suspect transactions and for fulfilling the reporting requirements to the related authorities.
Also, there are persons responsible for the prevention of money laundering and terrorist financing at four different levels: area, unit, branch and account. Their mission in each case is to support the UCIF and the local UPBCs from a position of proximity to customers and operations.
At consolidated level, a total of 885 professionals perform the prevention of money laundering and terrorist financing function at the Group (85% on a full-time basis) at 149 units established in 35 countries.
The Group has established corporate systems at all its units and business areas based on decentralized computer software which makes it possible to present directly to the account branches or the relationship managers the transactions and customers which need to be analyzed because of their risk. These tools are supplemented by others that are used centrally by the teams of analysts in the prevention units and, based on certain risk profiles and changes in certain customer operational behavior patterns, they enable transactions that might be linked to money laundering or terrorist financing to be analyzed, identified on a preventative basis and monitored.
The Bank is a founder member, along with ten other large international banks, of the Wolfsberg Group. The Wolfsberg Group’s objective is to establish international standards to increase the effectiveness of programs to combat money laundering and terrorist financing in the financial community. Various initiatives have been developed which have addressed, inter alia, issues such as the prevention of money laundering in private banking and correspondent banking, and the financing of terrorism. The regulatory authorities and experts in this area consider that the Wolfsberg Group and the principles and guidelines set by it represent an important step in the fight against money laundering, corruption, terrorism and other serious crimes.
Marketing of products and services
Policies
The Group manages the risk that may arise from an inadequate sale of products or an improper provision of services by the Group in accordance with the corporate framework for the marketing of products and services.
The purpose of this corporate framework is to establish a standard system for the marketing of products and services at the Group, in order to minimize the Group’s exposure to risks in all the phases of marketing (approval, pre-sale, sale and follow-up).
In order to adapt the framework to the Bank and to the Group’s subsidiaries, it is adopted by the respective boards of directors, and made binding and adapted where necessary to ensure compliance with the applicable local regulatory requirements.
F-284
Table of Contents
Governance and organization
The organizational structure for managing the risk that might arise from the incorrect selling of products or services is based, at both corporate and local level, on the marketing committees, the monitoring committees and at the conduct risk management offices.
The corporate marketing committee (CCC) is the Group’s highest decision-making body regarding the approval of products and services. It is composed of representatives of the following divisions: risk, financial management, technology and operations, the general secretary’s division, the controller’s unit and management control, internal audit, commercial banking and global wholesale banking.
The CCC assesses the suitability of the product or service for the environment in which it is to be marketed, placing particular emphasis on ensuring that:
| • | Each product or service is sold by competent sales personnel. |
| • | Customers are furnished with the required appropriate information. |
| • | The product or service fits the customer’s risk profile. |
| • | Each product or service is assigned to the appropriate market, not only from a legal or tax standpoint, but also with regard to the financial culture of that market. |
| • | The product or service meets the requirements of the corporate marketing policies and, in general, the applicable internal or external regulations. |
Also, the local marketing committees (CLCs) approve new products and channel the related validation proposals to the CCC.
In their respective approval processes the marketing committees’ actions are guided by a risk-based approach, from the view point of both the Bank and the customer.
The corporate monitoring committee (CCS) is the Group’s decision-making body regarding the monitoring of products and services. It is composed of representatives from the following divisions: internal audit, the general secretary’s division, risk, and the business areas concerned (with the ongoing representation of commercial banking). It meets weekly, and considers and resolves specific issues relating to the selling of products and services at all the Group’s units.
The purpose of the corporate conduct risk management office (OCGRC) is to provide the relevant governing bodies with the information required to enable them: (i) to conduct an appropriate analysis of risk in the validation phase, with a twofold focus: impact on the Bank and impact on the customer; and (ii) to monitor products over their life cycle.
At local level conduct risk management offices have been established, which are responsible, inter alia, for promoting a corporate culture of correct marketing practices and ensuring that products are approved and monitored in the respective local spheres in keeping with the corporate framework.
Conduct in securities markets
Policy
This is set by the code of conduct in the securities markets (CCMV), complemented, inter alia, by the code of conduct for analysis activities, the research policy manual and the procedure for detecting, analyzing and communicating transactions suspected of market abuse.
Governance and organization
The organization is centered on the corporate compliance office and local and subsidiaries’ compliance divisions.
F-285
Table of Contents
The Group’s compliance department performs the following main functions in relation to the rules of conduct in securities markets:
| • | Registering and controlling sensitive information that is known by and/or generated at the Group. |
| • | Keeping lists of the securities affected and the initiated persons, and monitoring transactions with these securities. |
| • | Monitoring transactions with restricted securities depending on the type of activity, portfolios or groups to which the restriction applies. |
| • | Receiving and attending to notifications of, and requests for, authorization of transactions for own account. |
| • | Controlling transactions for own account of the persons subject to compliance with the code of conduct. |
| • | Managing breaches of the CCMV. |
| • | Resolving any issues raised concerning the CCMV. |
| • | Recording and resolving conflicts of interest and the situations that might give rise to them. |
| • | Assessing and managing any conflicts that might arise in the analysis activity. |
| • | Maintaining the files required to control compliance with the obligations established in the CCMV. |
| • | Developing ordinary contact with the regulators. |
| • | Organizing training and, in general, performing the actions required to apply the CCMV. |
| • | Analyzing actions that might be suspected of constituting market abuse and, where appropriate, reporting them to the supervisors. |
Criminal risk prevention
The Group’s compliance department has also been entrusted with the management of the criminal risk prevention model, which resulted from the entry into force of Organic Law 5/2010, which made legal entities criminally responsible for crimes committed on their account or for their benefit by directors or representatives or employees as a result of a lack of control.
In 2014 the Group obtained AENOR certification for the risk management system for crime prevention, of which the whistleblowing channel is a key component.
There are 26 whistleblowing channels in place at the Group. In 2014 complaints were made through six of them, in Germany, Brazil, the US, the UK, Poland and Spain.
In 2014, the total number of complaints received through all channels was over 400. They were processed in accordance with the Group’s internal procedures. The most common grounds for the complaints were employees’ failure to comply with the internal regulations, through either inappropriate behavior or non-observance of the Group’s policies or procedures.
Relationships with supervisors and dissemination of information to the markets
The compliance department is responsible for responding to the information requirements of the regulatory and supervisory bodies, both in Spain and in other countries where the Group operates, monitoring implementation of the measures arising from the reports or inspections conducted by these bodies and supervising the way in which the Group disseminates institutional information in the markets, transparently and in accordance with the regulators’ requirements. The risk supervision, regulation and compliance committee (prior to its creation in June 2014: the audit committee) is informed of the main issues at each of its meetings.
F-286
Table of Contents
In 2014 the Bank published 90 significant events, which may be consulted on the Group’s website and on that of the CNMV.
9. MODEL RISK
The use of models in risk management gives rise to model risk, i.e. the risk of losses arising from decisions based mainly on the results of models, due to errors in the definition, application or use of such models.
This risk occurs both in operational risk (the risk associated with errors in the data, construction, implementation and use of the model) and implicitly in the risk associated with the activity that it supports (in credit, market or other risk, due to the inadequate data, construction or use of the model).
As a result of the extension of the use of models to a wide range of activities, it is necessary to establish a series of actions and controls over the life cycle of these models in order to identify and minimize the associated risks.
Model risk can be mitigated through an appropriate control and management environment, i.e. through a series of controls over the life cycle of the model. The cycle encompasses all stages of the model, from the definition of the standards to be used in its development to the periodic monitoring of the model and its expiry.
The planning stage is particularly significant since this is when the development and management priorities are defined. When plans are prepared, the needs to be covered are identified and the materiality of the risk involved is assessed.
The extraction and validation of the information, and the development of the model are two other fundamental stages. In the case of development, control points must be established in order to check, inter alia, that the data used are suitable, that the objectives match the requested results, that the model was constructed in accordance with the set guidelines, or that the implementation is viable prior to formal roll-out of the model, which will occur after it has been formally approved.
There must be a validation process in place that is carried out by a function that is independent from that of the model developer, in order to control the risk associated with the development of models. The scope of the validation will depend on the type of model, the materiality and the type of development involved.
Lastly, all developments, whether a new model, a modification of an existing one or a new use for a model already being used, must be reviewed and approved based on its materiality by the relevant governing body. This process represents the recognition by the intervening parties that they are familiar with, and aware of, all the risks associated with the use of the model, of the various assumptions used in its construction, and of the existing limitations in its various intended uses.
Once implemented, the models will be supervised regularly to check that they are being used for the purpose for which they were approved and that they continue to work as expected.
10. CAPITAL MANAGEMENT AND CONTROL OF CAPITAL RISK
Capital management at the Group, which is carried out on an integrated basis in order to ensure the Group’s capital adequacy, meet regulatory requirements and maximize return on capital, is determined by the strategic objectives and the risk appetite set by the board of directors. With this objective in mind, a series of policies have been defined that shape the Group’s capital management approach:
| • | To establish adequate capital planning to enable the Group to cater for current requirements and to provide the capital required to cover the needs of the business plans, regulatory requirements, and the associated short- and medium-term risks, while maintaining the risk profile approved by the board. |
F-287
Table of Contents
| • | To ensure that, in stress scenarios, the Group and its companies maintain sufficient capital to cover their needs arising from the increase in risks caused by the deterioration in macroeconomic conditions. |
| • | To optimize the use of capital through an appropriate allocation of capital among the businesses based on the relative return on regulatory and economic capital, taking into consideration the risk appetite, their growth and the strategic objectives. |
The Group defines capital risk as the risk that the Group or one of its companies may have an insufficient amount and/or quality of capital to meet its stakeholders’ expectations and its strategic planning guidelines. The objectives in this connection include most notably:
| • | To meet the internal capital and capital adequacy targets |
| • | To meet the regulatory requirements |
| • | To align the Bank’s strategic plan with the capital expectations of external agents (rating agencies, shareholders and investors, customers, supervisors, etc.). |
| • | Support the growth of the businesses and any strategic opportunities that may arise. |
Capital adequacy position
The Group has a sound capital adequacy position that surpasses the levels required by regulations. In 2014 the Group continued to bolster its main capital ratios in response to the difficult economic and financial environment and the new regulatory demands.
On January 9, 2015, the Bank completed a capital increase of EUR 7,500 million. With this increase, the Bank has met its main objective of being able to sustain the organic growth of the business, by increasing credit and the market share in the main markets in which the Group operates.
Leverage ratio requirements
The new CRD IV regulations introduce a new leverage ratio that is not sensitive to the entities’ risk profile. It is calculated as the ratio of Tier 1 capital to exposure.
This exposure is calculated as the sum of total assets per books plus off-balance-sheet items (mainly guarantees, unused credit limits granted and documentary credits). Certain technical adjustments are made to this sum, such as by replacing the asset value of derivatives and securities financing transactions with the EAD considered for the calculation of risk-weighted assets and by eliminating the value of assets considered as deductions from Tier 1 capital. Additionally, the regulators have included certain value reductions for off-balance-sheet trade-related transactions.
Although compliance with this ratio is not yet mandatory, it must be published from 2015 onwards. The supervisors have announced their intention to make compliance with a minimum ratio obligatory from 2018 onwards (indicating a 3% minimum benchmark ratio).
10.1. New regulatory framework
From the capital standpoint, Basel III redefines what is considered to be available capital at financial institutions (including new deductions and raising the requirements for eligible equity instruments), increases the minimum capital requirements, requires financial institutions to operate permanently with capital buffers, and adds new requirements in relation to the risks considered.
The Group shares the ultimate objective pursued by the regulator with this new framework, namely to endow the international financial system with greater stability and resilience. In this regard, for many years the Group has collaborated on the impact studies for calibrating the new standards conducted by the Basel Committee and the European Banking Authority (EBA) and coordinated at local level by the Bank of Spain.
F-288
Table of Contents
In Europe, the new standards were implemented through Directive 2013/36/EU, known as the Capital Requirements Directive (“CRD IV”), and the related Capital Requirements Regulation 575/2013 (“CRR”), which is directly applicable in all EU member states (as part of the Single Rulebook). In addition, the standards are subject to Implementing Technical Standards commissioned from the European Banking Authority (EBA), some of which will be issued in the coming months/years.
The Capital Requirements Regulation came into force on January 1, 2014, with many of its rules subject to various implementation timetables. This transitional implementation phase, which affects mainly the definition of eligible capital, concludes at the end of 2017, except with regard to the deduction for deferred tax assets, the transition period for which lasts until 2023.
Subsequent to the transposition of Basel III into European legislation, the Basel Committee has continued to issue additional standards, some in the form of public consultation processes, which will entail a future amendment of CRD IV and the CRR. The Group will continue to support the regulators by offering its opinions and participating in impact studies.
10.2. Economic capital
Economic capital is the capital required, based on an internally-developed model, to support all the risks of the business activity with a given solvency level. In the Group’s case, the solvency level is determined by the AA-/A+ long-term target rating, which results in the application of a 99.95% confidence level (higher than the regulatory 99.90%) for the purpose of calculating the required capital.
The Group’s economic capital model complements the regulatory approach by including in its measurement all the significant risks incurred in the Group’s operations. Accordingly, it considers risks such as concentration risk, structural interest rate risk, business risk, pension risk and other risks outside the scope of regulatory Pillar I capital requirements. Economic capital also includes the diversification effect, which in the Group’s case, owing to the multinational, multibusiness nature of its operations, is of key importance in determining its overall risk and solvency profile.
Economic capital is a fundamental tool for the internal management and implementation of the Group’s strategy, from the viewpoint of both the assessment of capital adequacy and the management of portfolio and business risk.
With regard to capital adequacy, in the context of Pillar II of the Basel Capital Accord, the Group conducts the internal capital adequacy assessment process using its economic capital model. To this end, the Group plans the evolution of the business and the capital requirements under a central scenario and under alternative stress scenarios. With this planning the Group ensures that it will continue to meet its capital adequacy targets, even in adverse economic scenarios.
Also, the economic capital metrics make it possible to assess risk-return targets, price transactions on a risk basis and gauge the economic viability of projects, units or lines of business, with the ultimate objective of maximizing the generation of shareholder value.
Since it is a uniform risk measure, economic capital makes it possible to explain the distribution of risk across the Group, placing different activities and types of risk in a comparable metric.
RORAC and value creation
The Group has used RORAC methodology in its risk management since 1993, with the following objectives:
| • | Calculation of economic capital requirements and of the return thereon for the Group’s business units, segments, portfolios and customers, in order to facilitate an optimal allocation of capital. |
| • | Budgeting of capital requirements and RORACs of the Group’s business units. |
| • | Analysis and setting of prices in the decision-making process for transactions (loan approval) and customers (monitoring). |
F-289
Table of Contents
The RORAC methodology facilitates the comparison, on a like-for-like basis, of the performance of transactions, customers, portfolios and businesses, and identifies those which achieve a risk-adjusted return higher than the Group’s cost of capital, thus aligning risk management and business management with the aim of maximizing value creation, which is the ultimate objective of Group senior management.
The Group periodically assesses the level of and the changes in the value creation (VC) and return on risk-adjusted capital (RORAC) of the Group and of its main business units. The VC is the profit generated over and above the cost of the economic capital (EC) used, and is calculated using the following formula:
VC = Profit - (average EC x cost of capital)
The profit used is obtained by making the required adjustments to accounting profit in order to reflect only the recurring profit obtained by each unit from its business activity.
If a transaction or portfolio yields a positive return, it will be contributing to the Group’s profit, although it will only create shareholder value when this return exceeds the cost of capital.
2014 witnessed an uneven performance of the business units in terms of value creation. The Group’s results and, therefore, the RORAC and value creation figures were shaped by the varying trends in the economic cycle at the Group units.
10.3 Capital planning and stress tests
Capital stress tests have gained particular significance as a tool for the dynamic evaluation of banks’ risk exposure and capital adequacy. A new forward-looking assessment model has become a key component of capital adequacy analysis.
This forward-looking assessment is based on both macroeconomic and idiosyncratic scenarios that are highly improbable but nevertheless plausible. To conduct the assessment, it is necessary to have robust planning models capable of transferring the effects defined in the projected scenarios to the various elements that have a bearing on capital adequacy.
The ultimate goal of capital stress tests is to perform a complete evaluation of banks’ risk exposure and capital adequacy in order to determine any possible capital requirements that would arise if banks failed to meet the regulatory or internal capital targets set.
Internally, the Group has defined a capital planning and stress process, to serve not only as a response to the various regulatory exercises, but also as a key tool integrated in the Group’s management and strategy.
The aim of the internal capital planning and stress process is to guarantee current and future capital adequacy, even in adverse yet plausible economic scenarios. To this end, starting with the Group’s initial situation, the expected outcomes for the Group are estimated for various business environments and the Group’s capital ratios are obtained, normally projected over a three-year period.
The process implemented provides a comprehensive view of the Group’s capital for the time horizon analyzed and in each of the scenarios defined.
European Central Bank comprehensive assessment exercise
The European Central Bank comprehensive assessment exercise began in October 2013, with a view to launching the Single Supervisory Mechanism on November 4, 2014. Banks participating in this exercise were subjected to a risk assessment, an asset quality review and a stress test. Its objective was to increase transparency, control and credibility, in order for the results to bolster the private sector’s trust in the capital adequacy of European banks and the quality of their balance sheets.
The most significant banks in the EU took part, i.e. all banks meeting at least one of the following criteria: (1) assets exceeding EUR 30,000 million, (2) assets exceeding 20% of the country’s GDP, (3) the bank is one of the three largest credit institutions in a Member State.
F-290
Table of Contents
The comprehensive assessment was based on three pillars:
| • | Risk assessment: prior evaluation of the business model and the most significant risks, including those relating to liquidity, leverage and funding. Each entity’s risk profile was taken into account, together with its relationship with other entities and its vulnerability to exogenous factors. |
| • | Asset quality review (AQR): a qualitative and quantitative analysis of the credit and market exposures at December 2013 (including off-balance-sheet exposures, non-performing loans, refinancing transactions and sovereign risk). Its specific objective was to assess whether the provisions and the valuation of the collateral for the credit exposure were adequate, and to assess the valuation of complex instruments and high risk assets. It was structured in three phases: |
| • | Portfolio selection: at the proposal of the national competent authorities, the portfolios to be included in the analysis were selected, in accordance with the coverage criteria established at entity level. |
| • | Execution: data integrity validation, collateral valuation and recalculation of provisions and risk-weighted assets. |
| • | Verification: analysis of consistency to ensure the comparability of the results of all the portfolios and of all the banks across the European Union. This included an analysis of the quality control, guidelines and definitions. |
| • | Stress test: an analysis of the banks’ ability to withstand an adverse situation. This was carried out in cooperation with the EBA (European Banking Authority). The exercise established a baseline scenario and an adverse scenario affecting a bank’s performance, including its risks (credit, market, sovereign, securitization and cost of funding), with a three-year time horizon (2014-2016), using AQR-adjusted 2013 year-end data as the starting point. |
The adverse macroeconomic scenario took into consideration certain systemic risks for the banking sector such as an increase in bond yields at global level, particularly those relating to emerging economies, or a higher deterioration of asset quality in economies with weaker fundamentals and vulnerable financial sectors.
Minimum capital (CET1) was set at 8% in the baseline scenario and at 5.5% in the adverse scenario, in accordance with the Basel III definition (CRD IV/CRR) and its progressive introduction (phase-in) timetable.
The stress test results were based on the scenarios defined in the methodology and are not forecasts of financial performance or of capital ratios. The stress test was based on the common methodology designed by the EBA, which included key assumptions to simplify the exercise (for example, a static balance sheet, a dividend payout similar to the average for the last three years and valuation adjustments on public debt).
Result of the assessment for the Group
With regard to the AQR exercise, i.e. the review of the quality of the portfolios, an analysis was conducted of 16 major credit portfolios from seven countries and various segments (residential, SMEs and corporates) representing more than 50% of the credit risk exposure at December 31, 2013. In addition, a review was made of procedures and policies, taking samples of files and reviewing them, of appraisals of properties and collateral and of the valuation models for the trading book. The impact of the analysis on CET1 was not material (-4 basis points).
With respect to the stress test, the Group passed the proposed scenarios comfortably, particularly the adverse scenario which is very unlikely to occur.
F-291
Table of Contents
| 55. | Other Disclosures |
This Note includes relevant information about additional disclosure requirements.
55.1 Consolidated financial statements
Following are the consolidated balance sheets and consolidated statements of income of the Group under the IFRS reformatted to conform to the presentation guidelines for bank holding companies set forth in Regulation S-X Article 9 of the Securities and Exchange Commission of the United States of America.
The preparation of these financial statements requires management to make estimates and assumptions that affect the reported amounts and allocations of assets and liabilities and disclosure of contingent assets and liabilities and the reported amounts of revenues and expenses during the reported period. Actual results could differ from those estimates.
F-292
Table of Contents
CONSOLIDATED BALANCE SHEET
| Millions of Euros | ||||||||||||
| 2014 | 2013 | 2012 | ||||||||||
| Assets |
||||||||||||
| Cash and due from banks |
62,410 | 72,512 | 111,663 | |||||||||
| Interest earning deposits in other banks |
20,060 | 26,405 | 28,214 | |||||||||
| Securities purchased under agreements to resell |
17,884 | 16,192 | 13,527 | |||||||||
| Trading account assets |
191,561 | 146,670 | 206,273 | |||||||||
| Banks |
32,419 | 29,792 | 31,644 | |||||||||
| Loans |
9,880 | 7,430 | 11,569 | |||||||||
| Derivatives |
76,858 | 58,899 | 110,319 | |||||||||
| Debt securities |
58,605 | 44,716 | 46,561 | |||||||||
| Equity securities |
13,799 | 5,833 | 6,180 | |||||||||
| Investment securities |
122,760 | 91,685 | 99,325 | |||||||||
| Available-for-sale |
122,760 | 91,685 | 99,325 | |||||||||
| Net Loans and leases |
709,679 | 642,441 | 683,449 | |||||||||
| Loans and leases, net of unearned income |
736,826 | 667,270 | 708,831 | |||||||||
| Less-Allowance for loan losses |
(27,147 | ) | (24,829 | ) | (25,382 | ) | ||||||
| Premises and equipment, net |
22,772 | 13,812 | 14,483 | |||||||||
| Investment in affiliated companies |
3,471 | 5,536 | 4,454 | |||||||||
| Other assets |
115,699 | 100,167 | 107,851 | |||||||||
| Intangible Assets |
2,853 | 2,960 | 3,436 | |||||||||
| Goodwill in consolidation |
27,548 | 23,281 | 24,626 | |||||||||
| Accrual Accounts |
2,001 | 2,112 | 1,757 | |||||||||
| Hedge derivatives |
7,346 | 8,301 | 7,936 | |||||||||
| Others |
75,951 | 63,513 | 70,096 | |||||||||
|
|
|
|
|
|
|
|||||||
| Total assets |
1,266,296 | 1,115,420 | 1,269,239 | |||||||||
|
|
|
|
|
|
|
|||||||
| Liabilities |
||||||||||||
| Deposits |
695,417 | 624,616 | 678,383 | |||||||||
| Non interest deposits |
5,102 | 5,623 | 5,285 | |||||||||
| Interest bearing |
690,315 | 618,993 | 673,098 | |||||||||
| Demand deposits |
206,520 | 172,074 | 149,186 | |||||||||
| Savings deposits |
173,105 | 164,214 | 167,389 | |||||||||
| Time deposits |
310,690 | 282,705 | 356,523 | |||||||||
| Certificates of deposit |
— | — | — | |||||||||
| Short-term debt |
124,138 | 105,111 | 120,481 | |||||||||
| Long-term debt |
195,896 | 177,671 | 202,223 | |||||||||
| Other liabilities |
161,131 | 128,381 | 186,940 | |||||||||
| Taxes Payable |
9,379 | 6,079 | 7,765 | |||||||||
| Accounts Payable |
4,923 | 4,731 | 4,908 | |||||||||
| Accrual Accounts |
6,488 | 5,068 | 5,181 | |||||||||
| Pension Allowance |
9,412 | 8,784 | 9,948 | |||||||||
| Stock borrowing liabilities |
— | — | — | |||||||||
| Derivatives |
86,303 | 64,170 | 116,187 | |||||||||
| Liabilities under insurance contracts |
713 | 1,430 | 1,425 | |||||||||
| Other Provisions |
5,964 | 5,462 | 5,649 | |||||||||
| Short securities positions |
17,628 | 15,951 | 15,181 | |||||||||
| Others |
20,321 | 16,706 | 20,696 | |||||||||
|
|
|
|
|
|
|
|||||||
| Total liabilities |
1,176,582 | 1,035,779 | 1,188,027 | |||||||||
| Equity |
||||||||||||
| Stockholders’ equity |
||||||||||||
| Capital stock |
6,292 | 5,667 | 5,161 | |||||||||
| Additional paid-in-capital |
38,611 | 36,804 | 37,412 | |||||||||
| Other additional capital |
(481 | ) | (415 | ) | (937 | ) | ||||||
| Current year earnings |
5,816 | 4,175 | 2,283 | |||||||||
| Other reserves |
30,567 | 24,096 | 27,878 | |||||||||
|
|
|
|
|
|
|
|||||||
| Total stockholders’ equity |
80,805 | 70,327 | 71,797 | |||||||||
|
|
|
|
|
|
|
|||||||
| Non-controlling interests |
8,909 | 9,314 | 9,415 | |||||||||
| Total Equity |
89,714 | 79,641 | 81,212 | |||||||||
| Total liabilities and Equity |
1,266,296 | 1,115,420 | 1,269,239 | |||||||||
F-293
Table of Contents
The Group has issued Mortgage backed securities, called Cédulas Hipotecarias (see Note 22). Additionally, as of December 31, 2014, 2013 and 2012, the investment debt securities assigned to certain Group or third-party commitments amounted to €84,231 million, €42,433 million and €61,335 million, respectively.
CONSOLIDATED STATEMENTS OF INCOME
| Millions of Euros | ||||||||||||
| 2014 | 2013 | 2012 | ||||||||||
| Interest income: |
||||||||||||
| Interest and fees on loans and leases |
43,448 | 41,378 | 47,076 | |||||||||
| Interest on deposits in other banks |
1,712 | 1,778 | 2,851 | |||||||||
| Interest on securities purchased under agreements to resell |
2,240 | 1,813 | 1,474 | |||||||||
| Interest on investment securities |
7,682 | 6,846 | 7,767 | |||||||||
| Dividends |
— | — | — | |||||||||
| Total interest income |
55,082 | 51,815 | 59,168 | |||||||||
| Interest expenses: |
||||||||||||
| Interest on deposits |
(12,846 | ) | (14,663 | ) | (16,563 | ) | ||||||
| Interest on short-term borrowings |
(4,264 | ) | (3,852 | ) | (4,397 | ) | ||||||
| Interest on long-term debt |
(6,847 | ) | (5,901 | ) | (6,731 | ) | ||||||
| Total interest expense |
(23,957 | ) | (24,416 | ) | (27,691 | ) | ||||||
| Interest income / (Charges) |
31,125 | 27,399 | 31,477 | |||||||||
| Provision for credit losses |
(10,562 | ) | (11,058 | ) | (18,536 | ) | ||||||
| Interest income / (Charges) after provision for credit losses |
20,563 | 16,341 | 12,941 | |||||||||
| Non interest income: |
||||||||||||
| Commissions and fees from fiduciary activities |
942 | 1,204 | 1,217 | |||||||||
| Commissions and fees from securities activities, net |
763 | 678 | 702 | |||||||||
| Fees and commissions from insurance activities |
5,331 | 6,631 | 7,807 | |||||||||
| Other Fees and commissions, net |
5,687 | 5,480 | 5,890 | |||||||||
| Gains (losses) from: |
||||||||||||
| Affiliated companies’ securities |
3,266 | 2,662 | 1,200 | |||||||||
| Investment securities |
1,973 | 3,350 | 2,483 | |||||||||
| Foreign exchange, derivatives and other, net |
723 | (137 | ) | 339 | ||||||||
| Sale of premises |
113 | (4 | ) | 133 | ||||||||
| Income from non financial entities |
343 | 322 | 369 | |||||||||
| Gains on sale of non-current assets / liabilities held for sale not classified as discontinued operations |
198 | 122 | 325 | |||||||||
| Other income |
1,393 | 962 | 1,110 | |||||||||
| Total non interest income |
20,732 | 21,270 | 21,575 | |||||||||
| Non interest expense: |
||||||||||||
| Salaries and employee benefits |
(10,987 | ) | (10,838 | ) | (10,501 | ) | ||||||
| Occupancy expense of premises, depreciation and maintenance, net |
(3,019 | ) | (2,969 | ) | (2,940 | ) | ||||||
| General and administrative expenses |
(5,751 | ) | (5,451 | ) | (5,626 | ) | ||||||
| Impairment of goodwill |
(2 | ) | (40 | ) | (156 | ) | ||||||
| Impairment / amortization of intangible assets |
(1,926 | ) | (1,355 | ) | (1,106 | ) | ||||||
| Impairment of tangible assets |
(527 | ) | (764 | ) | (1,019 | ) | ||||||
| Provisions for specific allowances |
(2,609 | ) | (2,024 | ) | (1,640 | ) | ||||||
| Payments to Deposit Guarantee Fund |
(577 | ) | (570 | ) | (554 | ) | ||||||
| Insurance claims |
(3,649 | ) | (4,831 | ) | (5,516 | ) | ||||||
| Expenses of non financial entities |
(255 | ) | (231 | ) | (232 | ) | ||||||
| Losses on sale of non-current assets / liabilities held for sale not classified as discontinued operations |
(102 | ) | (210 | ) | (633 | ) | ||||||
| Other expenses |
(1,212 | ) | (950 | ) | (1,028 | ) | ||||||
| Total non interest expense |
(30,616 | ) | (30,233 | ) | (30,951 | ) | ||||||
| Income before income taxes |
10,679 | 7,378 | 3,565 | |||||||||
| Income tax expense |
(3,718 | ) | (2,034 | ) | (584 | ) | ||||||
| Net consolidated income for the year |
6,961 | 5,344 | 2,981 | |||||||||
| Net income attributed to non-controlling interests |
1,119 | 1,154 | 768 | |||||||||
| Income from discontinued operation, net of taxes |
(26 | ) | (15 | ) | 70 | |||||||
| NET INCOME ATTRIBUTED TO THE GROUP |
5,816 | 4,175 | 2,283 | |||||||||
F-294
Table of Contents
| 2014 | 2013 | 2012 | ||||||||||
| CONSOLIDATED PROFIT FOR THE YEAR |
6,935 | 5,329 | 3,051 | |||||||||
| OTHER RECOGNIZED INCOME AND EXPENSE |
4,180 | (5,913 | ) | (3,709 | ) | |||||||
| Items that will not be reclassified to profit or loss |
(703 | ) | 188 | (1,123 | ) | |||||||
| Actuarial gains/(losses) on defined benefit pension plans |
(1,009 | ) | 502 | (1,708 | ) | |||||||
| Non-current assets held for sale |
— | — | — | |||||||||
| Income tax relating to items that will not be reclassified to profit or loss |
306 | (314 | ) | 585 | ||||||||
| Items that may be reclassified to profit or loss |
4,883 | (6,101 | ) | (2,586 | ) | |||||||
| Available-for-sale financial assets: |
2,324 | (99 | ) | 1,171 | ||||||||
| Revaluation gains/(losses) |
3,604 | 1,150 | 1,729 | |||||||||
| Amounts transferred to income statement |
(1,280 | ) | (1,250 | ) | (558 | ) | ||||||
| Other reclassifications |
— | 1 | — | |||||||||
| Cash flow hedges: |
589 | 47 | (84 | ) | ||||||||
| Revaluation gains/(losses) |
934 | 463 | 129 | |||||||||
| Amounts transferred to income statement |
(345 | ) | (416 | ) | (249 | ) | ||||||
| Amounts transferred to initial carrying amount of hedged items |
— | — | — | |||||||||
| Other reclassifications |
— | — | 36 | |||||||||
| Hedges of net investments in foreign operations: |
(1,730 | ) | 1,117 | (1,107 | ) | |||||||
| Revaluation gains/(losses) |
(1,730 | ) | 1,074 | (1,336 | ) | |||||||
| Amounts transferred to income statement |
— | 38 | 229 | |||||||||
| Other reclassifications |
— | 5 | — | |||||||||
| Exchange differences: |
4,189 | (7,028 | ) | (2,168 | ) | |||||||
| Revaluation gains/(losses) |
4,184 | (7,020 | ) | (1,831 | ) | |||||||
| Amounts transferred to income statement |
5 | (37 | ) | (330 | ) | |||||||
| Other reclassifications |
— | 29 | (7 | ) | ||||||||
| Non-current assets held for sale: |
— | — | — | |||||||||
| Revaluation gains/(losses) |
— | — | — | |||||||||
| Amounts transferred to income statement |
— | — | — | |||||||||
| Other reclassifications |
— | — | — | |||||||||
| Entities accounted for using the equity method: |
361 | (294 | ) | (57 | ) | |||||||
| Revaluation gains/(losses) |
266 | (283 | ) | (61 | ) | |||||||
| Amounts transferred to income statement |
95 | 23 | 21 | |||||||||
| Other reclassifications |
— | (34 | ) | (17 | ) | |||||||
| Other recognized income and expense |
— | — | — | |||||||||
| Income tax relating to items that may be reclassified to profit or loss |
(850 | ) | 156 | (341 | ) | |||||||
| TOTAL RECOGNIZED INCOME AND EXPENSE |
11,115 | (584 | ) | (658 | ) | |||||||
| Attributable to the Parent |
9,110 | (504 | ) | (774 | ) | |||||||
| Attributable to non-controlling interests |
2,005 | (80 | ) | 116 | ||||||||
F-295
Table of Contents
Following are the condensed balance sheets of Banco Santander, S.A. as of December 31, 2014, 2013 and 2012.
| 2014 | 2013 | 2012 | ||||||||||
| CONDENSED BALANCE SHEETS (Parent company only) |
(Millions of Euros) | |||||||||||
| Assets |
||||||||||||
| Cash and due from banks |
54,238 | 64,402 | 94,931 | |||||||||
| Of which: |
||||||||||||
| To bank subsidiaries |
7,911 | 27,244 | 30,004 | |||||||||
| Trading account assets |
83,116 | 63,928 | 95,556 | |||||||||
| Investment securities |
58,427 | 53,598 | 47,097 | |||||||||
| Of which: |
||||||||||||
| To bank subsidiaries |
14,164 | 20,656 | 18,491 | |||||||||
| To non-bank subsidiaries |
6,469 | — | 164 | |||||||||
| Net Loans and leases |
203,239 | 187,758 | 152,933 | |||||||||
| Of which: |
||||||||||||
| To non-bank subsidiaries |
35,139 | 23,549 | 26,553 | |||||||||
| Investment in affiliated companies |
80,275 | 70,527 | 72,714 | |||||||||
| Of which: |
||||||||||||
| To bank subsidiaries |
68,135 | 62,234 | 64,550 | |||||||||
| To non-bank subsidiaries |
12,140 | 8,293 | 8,163 | |||||||||
| Premises and equipment, net |
1,770 | 1,851 | 990 | |||||||||
| Other assets |
15,737 | 16,973 | 11,768 | |||||||||
|
|
|
|
|
|
|
|||||||
| Total assets |
496,802 | 459,037 | 475,989 | |||||||||
| Liabilities |
||||||||||||
| Deposits |
258,306 | 247,206 | 249,928 | |||||||||
| Of which: |
||||||||||||
| To bank subsidiaries |
14,770 | 21,610 | 20,775 | |||||||||
| To non-bank subsidiaries |
50,662 | 46,347 | 54,300 | |||||||||
| Short-term debt |
48,645 | 38,391 | 34,080 | |||||||||
| Long-term debt |
48,596 | 54,632 | 48,643 | |||||||||
| Total debt |
97,241 | 93,023 | 82,723 | |||||||||
| Of which: |
||||||||||||
| To bank subsidiaries |
1,397 | 1,883 | 4,474 | |||||||||
| To non-bank subsidiaries |
14,160 | 18,680 | 18,174 | |||||||||
| Other liabilities |
89,306 | 70,396 | 98,952 | |||||||||
|
|
|
|
|
|
|
|||||||
| Total liabilities |
444,853 | 410,625 | 431,603 | |||||||||
| Stockholders’ equity |
||||||||||||
| Capital stock |
6,292 | 5,667 | 5,161 | |||||||||
| Retained earnings and other reserves |
45,657 | 42,745 | 39,225 | |||||||||
|
|
|
|
|
|
|
|||||||
| Total stockholders’ equity |
51,949 | 48,412 | 44,386 | |||||||||
| Total liabilities and Stockholders’ Equity |
496,802 | 459,037 | 475,989 | |||||||||
In the financial statements of the Parent Company, investments in subsidiaries, jointly controlled entities and associates are recorded at cost.
F-296
Table of Contents
Following are the condensed statements of income of Banco Santander, S.A. for the years ended December 31, 2014, 2013 and 2012.
| CONDENSED STATEMENTS OF INCOME (Parent company only) |
2014 | 2013 | 2012 | |||||||||
| (Millions of Euros) | ||||||||||||
| Interest income |
||||||||||||
| Interest from earning assets |
8,701 | 10,568 | 10,448 | |||||||||
| Dividends from affiliated companies |
2,249 | 2,769 | 5,311 | |||||||||
| Of which: |
||||||||||||
| From bank subsidiaries |
1,929 | 1,788 | 4,716 | |||||||||
| From non-bank subsidiaries |
320 | 981 | 595 | |||||||||
|
|
|
|
|
|
|
|||||||
| 10,950 | 13,337 | 15,759 | ||||||||||
| Interest expense |
(5,242 | ) | (7,178 | ) | (6,677 | ) | ||||||
|
|
|
|
|
|
|
|||||||
| Interest income / (Charges) |
5,708 | 6,159 | 9,082 | |||||||||
| Provision for credit losses |
(1,892 | ) | (2,887 | ) | (6,072 | ) | ||||||
|
|
|
|
|
|
|
|||||||
| Interest income / (Charges) after provision for credit losses |
3,816 | 3,272 | 3,010 | |||||||||
| Non interest income: |
5,010 | 4,875 | 4,638 | |||||||||
| Non interest expense: |
(7,815 | ) | (7,741 | ) | (6,665 | ) | ||||||
|
|
|
|
|
|
|
|||||||
| Income before income taxes |
1,011 | 406 | 983 | |||||||||
| Income tax expense |
424 | 462 | 389 | |||||||||
|
|
|
|
|
|
|
|||||||
| Net income |
1,435 | 868 | 1,372 | |||||||||
Following are the condensed statement of comprehensive income of Banco Santander, S.A. for the years ended December 31, 2014, 2013 and 2012:
| CONDENSED STATEMENTS OF COMPREHENSIVE INCOME (Parent company only) |
Millions of Euros | |||||||||||
| 2014 | 2013 | 2012 | ||||||||||
| NET INCOME |
1,435 | 868 | 1,372 | |||||||||
| OTHER COMPREHENSIVE INCOME |
603 | 1,380 | (450 | ) | ||||||||
| Items that may be reclassified subsequently to profit or loss |
817 | 1,315 | (111 | ) | ||||||||
| Available-for-sale financial assets: |
1,308 | 1,759 | (135 | ) | ||||||||
| Revaluation gains/(losses) |
2,154 | 2,767 | (112 | ) | ||||||||
| Amounts transferred to income statement |
(846 | ) | (1,008 | ) | (23 | ) | ||||||
| Other reclassifications |
— | — | — | |||||||||
| Cash flow hedges: |
(20 | ) | 3 | — | ||||||||
| Revaluation gains/(losses) |
(20 | ) | 10 | — | ||||||||
| Amounts transferred to income statement |
— | (7 | ) | — | ||||||||
| Amounts transferred to initial carrying amount of hedged items |
— | — | — | |||||||||
| Other reclassifications |
— | — | — | |||||||||
| Hedges of net investments in foreign operations: |
(111 | ) | 118 | (20 | ) | |||||||
| Revaluation gains/(losses) |
(111 | ) | 118 | (20 | ) | |||||||
| Amounts transferred to income statement |
— | — | — | |||||||||
| Other reclassifications |
— | — | — | |||||||||
| Exchange differences: |
— | — | — | |||||||||
| Non-current assets held for sale: |
— | — | — | |||||||||
| Actuarial gains/(losses) on pension plans |
— | — | — | |||||||||
| Other comprehensive income |
— | — | — | |||||||||
| Income tax |
(360 | ) | (565 | ) | 44 | |||||||
| Items that will not be reclassified to profit or loss: |
(214 | ) | 65 | (339 | ) | |||||||
| Actuarial gains/(losses) on pension plans |
(302 | ) | 93 | (470 | ) | |||||||
| Income tax |
88 | (28 | ) | 131 | ||||||||
| TOTAL COMPREHENSIVE INCOME |
2,038 | 2,248 | 922 | |||||||||
F-297
Table of Contents
Following are the condensed cash flow statements of Banco Santander, S.A. for the years ended December 31, 2014, 2013 and 2012.
| CONDENSED CASH FLOW STATEMENTS (Parent company only) |
2014 | 2013 | 2012 | |||||||||
| (Millions of Euros) | ||||||||||||
| 1. Cash flows from operating activities |
||||||||||||
| Consolidated profit |
1,435 | 868 | 1,372 | |||||||||
| Adjustments to profit |
4,602 | 6,588 | 6,825 | |||||||||
| Net increase/decrease in operating assets |
22,469 | (50,394 | ) | (18,872 | ) | |||||||
| Net increase/decrease in operating liabilities |
21,240 | (93,431 | ) | 5,784 | ||||||||
| Reimbursements/payments of income tax |
353 | 99 | 82 | |||||||||
| Total net cash flows from operating activities (1) |
5,161 | (35,482 | ) | 32,935 | ||||||||
| 2. Cash flows from investing activities |
||||||||||||
| Investments (-) |
(7,028 | ) | (1,398 | ) | (6,235 | ) | ||||||
| Divestments (+) |
1,508 | 698 | 4,281 | |||||||||
| Total net cash flows from investment activities (2) |
(5,520 | ) | (700 | ) | (1,954 | ) | ||||||
| 3. Cash flows from financing activities |
||||||||||||
| Disposal of own equity instruments |
6,934 | 2,893 | 1,266 | |||||||||
| Acquisition of own equity instruments |
(2,753 | ) | (2,857 | ) | (1,324 | ) | ||||||
| Issuance of debt securities |
— | — | — | |||||||||
| Redemption of debt securities |
(6,074 | ) | (36 | ) | (6,891 | ) | ||||||
| Dividends paid |
(909 | ) | (818 | ) | (1,287 | ) | ||||||
| Issuance/Redemption of equity instruments |
— | — | — | |||||||||
| Other collections/payments related to financing activities |
(173 | ) | (286 | ) | (675 | ) | ||||||
| Total net cash flows from financing activities (3) |
(2,975 | ) | (1,104 | ) | (8,911 | ) | ||||||
| 4. Effect of exchange rate changes on cash and cash equivalents (4) |
(570 | ) | (148 | ) | (66 | ) | ||||||
| 5. Net increase/decrease in cash and cash equivalents (1+2+3+4) |
(3,904 | ) | (37,434 | ) | 22,004 | |||||||
| Cash and cash equivalents at beginning of period |
10,929 | 48,363 | 19,347 | |||||||||
| Cash and cash equivalents at end of period |
7,025 | 10,929 | 41,351 | |||||||||
F-298
Table of Contents
55.2 Preference Shares and Preferred Securities
The following table shows the balance of the preference shares and preferred securities as of December 31, 2014, 2013 and 2012:
| 2014 | 2013 | 2012 | ||||||||||
| (Millions of Euros) | ||||||||||||
| Preference shares |
739 | 401 | 421 | |||||||||
| Preferred securities |
6,239 | 3,652 | 4,319 | |||||||||
|
|
|
|
|
|
|
|||||||
| Total at year-end |
6,978 | 4,053 | 4,740 | |||||||||
Both Preference Shares and Preferred Securities are recorded under the “Financial liabilities at amortized cost – Subordinated Liabilities” caption in the consolidated balance sheet as of December 31, 2014, 2013 and 2012.
Preference Shares include the financial instruments issued by the consolidated companies which, although equity for legal purposes, do not meet the requirements for classification as equity in the financial statements. These shares do not carry any voting rights and are non-cumulative. They were subscribed to by non-Group third parties except for the shares of Santander UK, plc amounting to GBP 200 million, are redeemable at the discretion of the issuer, based on the conditions of the issuer. At December 31, 2014, the following issues were convertible into Bank shares:
On March 5, May 8 and September 2, 2014, Banco Santander, S.A. announced that its executive committee had resolved to launch issues of preference shares contingently convertible into newly issued ordinary shares of the Bank (“CCPSs”) for a nominal amount of EUR 1,500 million, USD 1,500 million and EUR 1,500 million. The interest, payment of which is subject to certain conditions and is discretionary, was set at 6.25% per annum for the first five years (to be reprised thereafter by applying a 541 basis-point spread to the 5-year Mid-Swap Rate) for the March issue, at 6.375% per annum for the first five years (to be reprised thereafter by applying a 478.8 basis-point spread to the 5-year Mid-Swap Rate) for the May issue and at 6.25% per annum for the first seven years (to be reprised every five years thereafter by applying a 564 basis-point spread to the 5-year Mid-Swap Rate) for the September issue.
On March 25, 2014, May 28 and September 30, the Bank of Spain confirmed that the CCPSs were eligible as Additional Tier 1 capital under the new European capital requirements of Regulation (EU) No 575/2013. The CCPSs are perpetual, although they may be redeemed early in certain circumstances and would convert into newly issued ordinary shares of Banco Santander if the Common Equity Tier 1 ratio of the Bank or its consolidated group fell below 5.125%, calculated in accordance with Regulation (EU) No 575/2013. The CCPSs are traded on the Global Exchange Market of the Irish Stock Exchange.
Furthermore, on January 29, 2014, Banco Santander (Brasil), S.A. launched an issue of Tier 1 perpetual subordinated notes for a nominal amount of USD 1,248 million, of which the Group has acquired 89.6%. The notes are perpetual and would convert into ordinary shares of Banco Santander (Brasil), S.A. if the Common Equity Tier 1 ratio, calculated as established by the Central Bank of Brazil, were to fall below 5.125%.
This category includes non-cumulative preferred non-voting shares issued by Santander UK plc, Santander UK Group Holdings Limited, BST International Bank, Inc., Santander Holdings USA, Inc., Santander Bank, National Association and Santander Holdings, Ltd.
For the purposes of payment priority, Preferred Securities are junior to all general creditors and to subordinated deposits. The payment of dividends on these securities, which have no voting rights, is conditional upon the obtainment of sufficient distributable profit and upon the limits imposed by Spanish banking regulations on equity.
This category includes non-cumulative preferred non-voting securities issued by Santander Finance Capital, S.A. (Unipersonal), Santander Finance Preferred, S.A. (Unipersonal), and Santander International Preferred, S.A. (Sociedad Unipersonal), guaranteed by the Bank. It also includes non-cumulative preferred non-voting securities issued by Banco Santander, S.A., Banco Santander, (Brasil), S.A. and Santander UK Group.
F-299
Table of Contents
Preference shares and preferred securities are perpetual securities and there is no obligation that requires the Group to redeem them. All securities have been fully subscribed by third parties outside the Group. In the consolidated balance sheets, these securities are shown net of any temporary operations relating to liquidity guarantees (see Note 23 and Exhibit III), and are described in the table below:
| Outstanding at December 31, 2014 | ||||||||||
| Preference Shares |
Amount in currency (million) |
Interest rate | Redemption Option (1) | |||||||
| Issuer/Date of issue |
Currency | |||||||||
| Banesto Holding, Ltd, December 1992 |
US Dollar | 1.3 | 10.50% | June 30, 2012 | ||||||
| Santander UK plc, October 1995 |
Pounds Sterling | 80.3 | 10.375% | No option | ||||||
| Santander UK plc, February 1996 |
Pounds Sterling | 80.3 | 10.375% | No option | ||||||
| Santander UK plc, March 2004 |
Pounds Sterling | 6.6 | 5.827% | March 22, 2016 | ||||||
| Santander UK plc, May 2006 |
Pounds Sterling | 34.9 | 6.222%(2) | May 24, 2019 | ||||||
| Santander Bank, National Association, August 2000 |
US Dollar | 153.4 | 12.000% | May 16, 2020 | ||||||
| Santander Holdings USA, Inc., May 2006 (*) |
US Dollar | 75.5 | 7.300% | May 15, 2011 | ||||||
| Outstanding at December 31, 2014 | ||||||||||
| Preferred Securities |
Amount in currency (million) |
Interest rate | Maturity date | |||||||
| Issuer/Date of issue |
Currency | |||||||||
| Banco Santander, S.A. |
||||||||||
| Banco Español de Crédito, October 2004 |
Euro | 36.5 | €CMS 10 + 0.125% | Perpetuity | ||||||
| Banco Español de Crédito (1), November 2004 |
Euro | 106.7 | 5.5% | Perpetuity | ||||||
| March 2014 |
Euro | 1,500.0 | 6.25%(3) | Perpetuity | ||||||
| May 2014 |
US Dollar | 1,500.0 | 6.375%(4) | Perpetuity | ||||||
| September 2014 |
Euro | 1,500.0 | 6.250%(5) | Perpetuity | ||||||
| Santander Finance Capital, S.A. (Unipersonal) |
||||||||||
| March 2009 |
US Dollar | 18.2 | 2.0% | Perpetuity | ||||||
| March 2009 |
US Dollar | 25.0 | 2.0% | Perpetuity | ||||||
| March 2009 |
Euro | 309.6 | 2.0% | Perpetuity | ||||||
| March 2009 |
Euro | 153.4 | 2.0% | Perpetuity | ||||||
| Santander Finance Preferred, S.A. (Unipersonal) |
||||||||||
| March 2004 (*) |
US Dollar | 89.3 | 6.41% | Perpetuity | ||||||
| September 2004 |
Euro | 144.0 | €CMS 10 +0.05% subject to a maximum distribution of 8% per annum |
Perpetuity | ||||||
| October 2004 |
Euro | 155.0 | 5.75% | Perpetuity | ||||||
| November 2006 (*) |
US Dollar | 161.8 | 6.80% | Perpetuity | ||||||
| January 2007 (*) |
US Dollar | 109.5 | 6.50% | Perpetuity | ||||||
| March 2007 (*) |
US Dollar | 210.4 | US3M + 0.52% | Perpetuity | ||||||
| July 2007 |
Pounds Sterling | 4.9 | 7.01% | Perpetuity | ||||||
| Santander International Preferred S.A. (Sociedad Unipersonal) |
||||||||||
| March 2009 |
US Dollar | 980.3 | 2.00% | Perpetuity | ||||||
| March 2009 |
Euro | 8.6 | 2.00% | Perpetuity | ||||||
| Santander UK Group |
||||||||||
| Abbey National Plc, February 2001(6) |
Pounds Sterling | 101.8 | 7.037% | Perpetuity | ||||||
| Abbey National Plc, August 2002 |
Pounds Sterling | 12.0 | Fixed to 6.984% until February 9, 2018, and thereafter, at a rate reset semi-annually of 1.86% per annum + Libor GBP (6M) |
Perpetuity | ||||||
| Banco Santander (Brasil), S.A. |
||||||||||
| January 2014 |
US Dollar | 134.3 | 7.38% | October 29, 2049 | ||||||
| (1) | From these dates the issuer can redeem the shares, subject to prior authorization by the national supervisor. |
| (2) | That issuance is a Fixed/Floating Rate Non-Cumulative Callable Preference Shares. Dividends will accrue on a principal amount equal to £1,000 per Preference Share at a rate of 6.222 per cent. per annum in respect of the period from (and including) May 24, 2006 (the Issue Date) to (but excluding) May 24, 2019 (the First Call Date) and thereafter at a rate reset quarterly equal to 1.13 per cent. per annum above the London interbank offered rate for three-month sterling deposits. From (and including) the Issue Date to (but excluding) the First Call Date, dividends, if declared, will be paid annually in arrears on May 24, in each year. Subject as provided herein, the first such dividend payment date will be May 24, 2007 and the last such dividend payment date will be the First Call Date. From (and including) the First Call Date, dividends, if declared, will be paid quarterly in arrears on May 24, August 24, November 24 and February 24, in each year. Subject as provided herein, the first such dividend payment date will be August 24, 2019. |
F-300
Table of Contents
| (3) | Payment is subject to certain conditions and to the discretion of the Bank. The 6.25% interest rate is set for the first five years. After that, it will be reviewed by applying a margin of 541 basis points on the five-year Mid-Swap Rate. |
| (4) | Payment is subject to certain conditions and to the discretion of the Bank. The 6.375% interest rate is set for the first five years. After that, it will be reviewed by applying a margin of 478.8 basis points on the five-year Mid-Swap Rate. |
| (5) | Payment is subject to certain conditions and to the discretion of the Bank. The 6.25% interest rate is set for the first five years. After that, it will be reviewed by applying a margin of 564 basis points on the five-year Mid-Swap Rate. |
| (6) | From February 14, 2026, this issue will bear interest at a rate, reset every five years, of 3.75% per annum above the gross redemption yield on a five-year specified United Kingdom government security. |
| (*) | Listed in the U.S. |
In accordance with Reg. S-X Rule 3-10, Financial Statements of Guarantors and Issuers of Guaranteed Securities Registered or Being Registered, Santander Finance Preferred, S.A. (Unipersonal), Santander Finance Capital, S.A. (Unipersonal), Santander International Preferred, S.A. (Unipersonal) and Santander US Debt, S.A. (Sociedad Unipersonal) - issuers of registered preferred securities guaranteed by Banco Santander, S.A. - do not file the financial statements required for a registrant by Regulation S-X as:
| • | Santander Finance Preferred, S.A. (Unipersonal) is 100% owned finance subsidiary of Banco Santander, S.A. who fully and unconditionally guarantees the preferred securities (Series 1, 4, 5 and 6 are listed in the United States). No other subsidiary of the Bank guarantees such securities. |
| • | Santander Finance Capital, S.A. (Unipersonal) is 100% owned finance subsidiary of Banco Santander, S.A. that fully and unconditionally guarantees the preferred securities (not listed in United States). No other subsidiary of the Bank guarantees such securities. |
| • | Santander International Preferred, S.A. (Unipersonal) is 100% owned finance subsidiary of Banco Santander, S.A. that fully and unconditionally guarantees the preferred securities (not listed in United States). No other subsidiary of the Bank guarantees such securities. |
| • | Santander US Debt, S.A. (Sociedad Unipersonal) is 100% owned finance subsidiary of Banco Santander, S.A. that fully and unconditionally guarantees the senior debt (not listed in United States). No other subsidiary of the Bank guarantees such securities. |
F-301
Table of Contents
Exhibit I
Subsidiaries of Banco Santander, S.A. (1)
| % of ownership held by the Bank |
% of voting power (c) | |||||||||||||||||||||||
| Company |
Location |
Direct | Indirect | 2014 | 2013 | 2012 | Line of business | |||||||||||||||||
| 2 & 3 Triton Limited |
United Kingdom | 0.00 | % | 100.00 | % | 100.00 | % | 100.00 | % | 100.00 | % | PROPERTY | ||||||||||||
| A & L CF (Guernsey) Limited (e) |
Guernsey | 0.00 | % | 100.00 | % | 100.00 | % | 100.00 | % | 100.00 | % | LEASING | ||||||||||||
| A & L CF (Jersey) Limited (e) |
Jersey | 0.00 | % | 100.00 | % | 100.00 | % | 100.00 | % | 100.00 | % | LEASING | ||||||||||||
| A & L CF December (1) Limited |
United Kingdom | 0.00 | % | 100.00 | % | 100.00 | % | 100.00 | % | 100.00 | % | LEASING | ||||||||||||
| A & L CF December (10) Limited |
United Kingdom | 0.00 | % | 100.00 | % | 100.00 | % | 100.00 | % | 100.00 | % | LEASING | ||||||||||||
| A & L CF December (11) Limited |
United Kingdom | 0.00 | % | 100.00 | % | 100.00 | % | 100.00 | % | 100.00 | % | LEASING | ||||||||||||
| A & L CF June (2) Limited |
United Kingdom | 0.00 | % | 100.00 | % | 100.00 | % | 100.00 | % | 100.00 | % | LEASING | ||||||||||||
| A & L CF June (3) Limited |
United Kingdom | 0.00 | % | 100.00 | % | 100.00 | % | 100.00 | % | 100.00 | % | LEASING | ||||||||||||
| A & L CF June (8) Limited (b) |
United Kingdom | 0.00 | % | 100.00 | % | 100.00 | % | 100.00 | % | 100.00 | % | LEASING | ||||||||||||
| A & L CF March (1) Limited (b) |
United Kingdom | 0.00 | % | 100.00 | % | 100.00 | % | 100.00 | % | 100.00 | % | LEASING | ||||||||||||
| A & L CF March (5) Limited |
United Kingdom | 0.00 | % | 100.00 | % | 100.00 | % | 100.00 | % | 100.00 | % | LEASING | ||||||||||||
| A & L CF March (6) Limited |
United Kingdom | 0.00 | % | 100.00 | % | 100.00 | % | 100.00 | % | 100.00 | % | LEASING | ||||||||||||
| A & L CF September (3) Limited |
United Kingdom | 0.00 | % | 100.00 | % | 100.00 | % | 100.00 | % | 100.00 | % | LEASING | ||||||||||||
| A & L CF September (4) Limited |
United Kingdom | 0.00 | % | 100.00 | % | 100.00 | % | 100.00 | % | 100.00 | % | LEASING | ||||||||||||
| A & L CF September (5) Limited (b) |
United Kingdom | 0.00 | % | 100.00 | % | 100.00 | % | 100.00 | % | 100.00 | % | LEASING | ||||||||||||
| A N (123) Limited |
United Kingdom | 0.00 | % | 100.00 | % | 100.00 | % | 100.00 | % | 100.00 | % | HOLDING COMPANY | ||||||||||||
| A N Loans Limited (b) |
United Kingdom | 0.00 | % | 100.00 | % | 100.00 | % | 100.00 | % | 100.00 | % | FINANCE | ||||||||||||
| A&L Services Limited |
Isle of Man | 0.00 | % | 100.00 | % | 100.00 | % | 100.00 | % | 100.00 | % | SERVICES | ||||||||||||
| Abbey Business Services (India) Private Limited |
India | 0.00 | % | 100.00 | % | 100.00 | % | 100.00 | % | 100.00 | % | HOLDING COMPANY | ||||||||||||
F-302
Table of Contents
| % of ownership held by the Bank |
% of voting power (c) | |||||||||||||||||||||||
| Company |
Location |
Direct | Indirect | 2014 | 2013 | 2012 | Line of business | |||||||||||||||||
| Abbey Covered Bonds (Holdings) Limited |
United Kingdom | — | (a) | — | — | — | SECURITIZATION | |||||||||||||||||
| Abbey Covered Bonds (LM) Limited |
United Kingdom | 0.00 | % | 100.00 | % | 100.00 | % | — | — | SECURITIZATION | ||||||||||||||
| Abbey Covered Bonds LLP |
United Kingdom | — | (a) | — | — | — | SECURITIZATION | |||||||||||||||||
| Abbey National (America) Holdings Inc. |
United States | 0.00 | % | 100.00 | % | 100.00 | % | 100.00 | % | 100.00 | % | HOLDING COMPANY | ||||||||||||
| Abbey National (America) Holdings Limited |
United Kingdom | 0.00 | % | 100.00 | % | 100.00 | % | 100.00 | % | 100.00 | % | HOLDING COMPANY | ||||||||||||
| Abbey National (Holdings) Limited (b) |
United Kingdom | 0.00 | % | 100.00 | % | 100.00 | % | 100.00 | % | 100.00 | % | HOLDING COMPANY | ||||||||||||
| Abbey National Beta Investments Limited |
United Kingdom | 0.00 | % | 100.00 | % | 100.00 | % | 100.00 | % | 100.00 | % | FINANCE | ||||||||||||
| Abbey National Business Office Equipment Leasing Limited |
United Kingdom | 0.00 | % | 100.00 | % | 100.00 | % | 100.00 | % | 100.00 | % | LEASING | ||||||||||||
| Abbey National International Limited |
Jersey | 0.00 | % | 100.00 | % | 100.00 | % | 100.00 | % | 100.00 | % | BANKING | ||||||||||||
| Abbey National Investments (b) |
United Kingdom | 0.00 | % | 100.00 | % | 100.00 | % | 100.00 | % | 100.00 | % | FINANCE | ||||||||||||
| Abbey National Investments Holdings Limited (b) |
United Kingdom | 0.00 | % | 100.00 | % | 100.00 | % | 100.00 | % | 100.00 | % | HOLDING COMPANY | ||||||||||||
| Abbey National Nominees Limited |
United Kingdom | 0.00 | % | 100.00 | % | 100.00 | % | 100.00 | % | 100.00 | % | SECURITIES COMPANY | ||||||||||||
| Abbey National North America Holdings Limited |
United Kingdom | 0.00 | % | 100.00 | % | 100.00 | % | 100.00 | % | 100.00 | % | HOLDING COMPANY | ||||||||||||
| Abbey National North America LLC |
United States | 0.00 | % | 100.00 | % | 100.00 | % | 100.00 | % | 100.00 | % | FINANCE | ||||||||||||
| Abbey National Pension (Escrow Services) |
United Kingdom | 0.00 | % | 100.00 | % | 100.00 | % | 100.00 | % | 100.00 | % | PENSION FUND MANAGEMENT COMPANY | ||||||||||||
| Abbey National PLP (UK) Limited |
United Kingdom | 0.00 | % | 100.00 | % | 100.00 | % | 100.00 | % | 100.00 | % | FINANCE | ||||||||||||
| Abbey National Property Investments |
United Kingdom | 0.00 | % | 100.00 | % | 100.00 | % | 100.00 | % | 100.00 | % | FINANCE | ||||||||||||
| Abbey National Securities Inc. |
United States | 0.00 | % | 100.00 | % | 100.00 | % | 100.00 | % | 100.00 | % | SECURITIES COMPANY | ||||||||||||
| Abbey National September Leasing (3) Limited (b) |
United Kingdom | 0.00 | % | 100.00 | % | 100.00 | % | 100.00 | % | 100.00 | % | LEASING | ||||||||||||
| Abbey National Treasury Investments |
United Kingdom | 0.00 | % | 100.00 | % | 100.00 | % | 100.00 | % | 100.00 | % | FINANCE | ||||||||||||
| Abbey National Treasury Services Investments Limited |
United Kingdom | 0.00 | % | 100.00 | % | 100.00 | % | 100.00 | % | 100.00 | % | FINANCE | ||||||||||||
| Abbey National Treasury Services Overseas Holdings |
United Kingdom | 0.00 | % | 100.00 | % | 100.00 | % | 100.00 | % | 99.99 | % | HOLDING COMPANY | ||||||||||||
| Abbey National Treasury Services plc |
United Kingdom | 0.00 | % | 100.00 | % | 100.00 | % | 100.00 | % | 100.00 | % | BANKING | ||||||||||||
| Abbey National UK Investments |
United Kingdom | 0.00 | % | 100.00 | % | 100.00 | % | 100.00 | % | 100.00 | % | FINANCE | ||||||||||||
| Abbey Stockbrokers (Nominees) Limited |
United Kingdom | 0.00 | % | 100.00 | % | 100.00 | % | 100.00 | % | 100.00 | % | SECURITIES COMPANY | ||||||||||||
| Abbey Stockbrokers Limited |
United Kingdom | 0.00 | % | 100.00 | % | 100.00 | % | 100.00 | % | 100.00 | % | SECURITIES COMPANY | ||||||||||||
F-303
Table of Contents
| % of ownership held by the Bank |
% of voting power (c) | |||||||||||||||||||||||
| Company |
Location |
Direct | Indirect | 2014 | 2013 | 2012 | Line of business | |||||||||||||||||
| Ablasa Participaciones, S.L. |
Spain | 100.00 | % | 0.00 | % | 100.00 | % | 100.00 | % | 100.00 | % | HOLDING COMPANY | ||||||||||||
| Acoghe, S.L. |
Spain | 0.00 | % | 55.89 | % | 100.00 | % | — | — | HOTEL OPERATIONS | ||||||||||||||
| Administración de Bancos Latinoamericanos Santander, S.L. |
Spain | 24.11 | % | 75.89 | % | 100.00 | % | 100.00 | % | 100.00 | % | HOLDING COMPANY | ||||||||||||
| Aevis Europa, S.L. |
Spain | 68.80 | % | 0.00 | % | 68.80 | % | 68.80 | % | — | CARDS | |||||||||||||
| AFB SAM Holdings, S.L. |
Spain | 1.00 | % | 49.50 | % | 100.00 | % | — | — | HOLDING COMPANY | ||||||||||||||
| Afisa S.A. |
Chile | 0.00 | % | 100.00 | % | 100.00 | % | 100.00 | % | 100.00 | % | FUND MANAGEMENT COMPANY | ||||||||||||
| Aguas de Iria, S.L. |
Spain | 0.00 | % | 100.00 | % | 100.00 | % | — | — | WATER SUPPLY | ||||||||||||||
| AKB Marketing Services Sp. Z.o.o. |
Poland | 0.00 | % | 81.65 | % | 100.00 | % | 100.00 | % | 100.00 | % | MARKETING | ||||||||||||
| AL (ROUTH) Limited |
United Kingdom | 0.00 | % | 100.00 | % | 100.00 | % | 100.00 | % | — | HOLDING COMPANY | |||||||||||||
| Alcaidesa Golf, S.L. |
Spain | 0.00 | % | 50.00 | % | 100.00 | % | 100.00 | % | 50.00 | % | SPORTS OPERATIONS | ||||||||||||
| Alcaidesa Holding, S.A. |
Spain | 0.00 | % | 50.00 | % | 50.00 | % | 50.00 | % | 50.00 | % | PROPERTY | ||||||||||||
| Alcaidesa Inmobiliaria, S.A. |
Spain | 0.00 | % | 50.00 | % | 100.00 | % | 100.00 | % | 50.00 | % | PROPERTY | ||||||||||||
| Alcaidesa Servicios, S.A. |
Spain | 0.00 | % | 50.00 | % | 100.00 | % | 100.00 | % | 50.00 | % | SERVICES | ||||||||||||
| ALIL Services Limited |
Isle of Man | 0.00 | % | 100.00 | % | 100.00 | % | 100.00 | % | 100.00 | % | SERVICES | ||||||||||||
| Aljarafe Golf, S.A. |
Spain | 0.00 | % | 89.41 | % | 89.41 | % | 89.41 | % | 89.41 | % | PROPERTY | ||||||||||||
| Aljardi SGPS, Lda. |
Portugal | 0.00 | % | 100.00 | % | 100.00 | % | 100.00 | % | 100.00 | % | HOLDING COMPANY | ||||||||||||
| Alliance & Leicester (Jersey) Limited (b) |
United Kingdom | 0.00 | % | 100.00 | % | 100.00 | % | 100.00 | % | 100.00 | % | FINANCE | ||||||||||||
| Alliance & Leicester Cash Solutions Limited |
United Kingdom | 0.00 | % | 100.00 | % | 100.00 | % | 100.00 | % | 100.00 | % | FINANCE | ||||||||||||
| Alliance & Leicester Commercial Bank plc |
United Kingdom | 0.00 | % | 100.00 | % | 100.00 | % | 100.00 | % | 100.00 | % | FINANCE | ||||||||||||
| Alliance & Leicester Commercial Finance (Holdings) plc (b) |
United Kingdom | 0.00 | % | 100.00 | % | 100.00 | % | 100.00 | % | 100.00 | % | HOLDING COMPANY | ||||||||||||
| Alliance & Leicester Equity Investments (Guarantee) Limited (b) |
United Kingdom | — | (a) | — | — | — | FINANCE | |||||||||||||||||
| Alliance & Leicester Financing plc (b) |
United Kingdom | 0.00 | % | 100.00 | % | 100.00 | % | 100.00 | % | 100.00 | % | FINANCE | ||||||||||||
| Alliance & Leicester Investments (Derivatives No.3) Limited (b) |
United Kingdom | 0.00 | % | 100.00 | % | 100.00 | % | 100.00 | % | 100.00 | % | FINANCE | ||||||||||||
| Alliance & Leicester Investments (Derivatives) Limited |
United Kingdom | 0.00 | % | 100.00 | % | 100.00 | % | 100.00 | % | 100.00 | % | FINANCE | ||||||||||||
| Alliance & Leicester Investments (No.2) Limited |
United Kingdom | 0.00 | % | 100.00 | % | 100.00 | % | 100.00 | % | 100.00 | % | FINANCE | ||||||||||||
F-304
Table of Contents
| % of ownership held by the Bank |
% of voting power (c) | |||||||||||||||||||||||
| Company |
Location |
Direct | Indirect | 2014 | 2013 | 2012 | Line of business | |||||||||||||||||
| Alliance & Leicester Investments (No.3) LLP (b) |
United Kingdom | 0.00 | % | 100.00 | % | 100.00 | % | 100.00 | % | 100.00 | % | FINANCE | ||||||||||||
| Alliance & Leicester Investments (No.4) |
United Kingdom | 0.00 | % | 100.00 | % | 100.00 | % | 100.00 | % | 100.00 | % | FINANCE | ||||||||||||
| Alliance & Leicester Investments Limited |
United Kingdom | 0.00 | % | 100.00 | % | 100.00 | % | 100.00 | % | 100.00 | % | FINANCE | ||||||||||||
| Alliance & Leicester Limited |
United Kingdom | 0.00 | % | 100.00 | % | 100.00 | % | 100.00 | % | 100.00 | % | BANKING | ||||||||||||
| Alliance & Leicester Personal Finance Limited |
United Kingdom | 0.00 | % | 100.00 | % | 100.00 | % | 100.00 | % | 100.00 | % | FINANCE | ||||||||||||
| Alliance & Leicester Print Services Limited (b) |
United Kingdom | 0.00 | % | 100.00 | % | 100.00 | % | 100.00 | % | 100.00 | % | SERVICES | ||||||||||||
| Alliance Bank Limited (b) |
United Kingdom | 0.00 | % | 100.00 | % | 100.00 | % | 100.00 | % | 100.00 | % | FINANCE | ||||||||||||
| Alliance Corporate Services Limited (b) |
United Kingdom | 0.00 | % | 100.00 | % | 100.00 | % | 100.00 | % | 100.00 | % | FINANCE | ||||||||||||
| Altamira Santander Real Estate, S.A. |
Spain | 100.00 | % | 0.00 | % | 100.00 | % | 100.00 | % | 100.00 | % | PROPERTY | ||||||||||||
| Amazonia Trade Limited |
United Kingdom | 100.00 | % | 0.00 | % | 100.00 | % | 100.00 | % | 100.00 | % | HOLDING COMPANY | ||||||||||||
| Andaluza de Inversiones, S.A. |
Spain | 0.00 | % | 100.00 | % | 100.00 | % | 100.00 | % | 100.00 | % | HOLDING COMPANY | ||||||||||||
| ANITCO Limited |
United Kingdom | 0.00 | % | 100.00 | % | 100.00 | % | 100.00 | % | 100.00 | % | HOLDING COMPANY | ||||||||||||
| Aquanima Brasil Ltda. |
Brazil | 0.00 | % | 100.00 | % | 100.00 | % | 100.00 | % | 100.00 | % | E-COMMERCE | ||||||||||||
| Aquanima Chile S.A. |
Chile | 0.00 | % | 100.00 | % | 100.00 | % | 100.00 | % | 100.00 | % | SERVICES | ||||||||||||
| Aquanima México S. de R.L. de C.V. |
Mexico | 0.00 | % | 100.00 | % | 100.00 | % | 100.00 | % | 100.00 | % | E-COMMERCE | ||||||||||||
| Aquanima S.A. |
Argentina | 0.00 | % | 100.00 | % | 100.00 | % | 100.00 | % | 100.00 | % | SERVICES | ||||||||||||
| Argenline, S.A. |
Uruguay | 0.00 | % | 100.00 | % | 100.00 | % | 100.00 | % | 100.00 | % | FINANCE | ||||||||||||
| Asesoría Estratega, S.C. |
Mexico | 0.00 | % | 100.00 | % | 100.00 | % | 100.00 | % | 100.00 | % | SERVICES | ||||||||||||
| Atlantys Espacios Comerciales, S.L. |
Spain | 0.00 | % | 55.89 | % | 100.00 | % | — | — | PROPERTY | ||||||||||||||
| Atual Companhia Securitizadora de Créditos Financeiros |
Brazil | 0.00 | % | 89.02 | % | 100.00 | % | 100.00 | % | 100.00 | % | FINANCIAL SERVICES | ||||||||||||
| Aurum Inversiones Limitada |
Chile | 50.00 | % | 50.00 | % | 100.00 | % | 100.00 | % | 100.00 | % | HOLDING COMPANY | ||||||||||||
| Auttar HUT Processamento de Dados Ltda. |
Brazil | 0.00 | % | 78.78 | % | 100.00 | % | — | — | TECHNOLOGY SERVICES | ||||||||||||||
| Aviación Antares, A.I.E. |
Spain | 99.99 | % | 0.01 | % | 100.00 | % | 100.00 | % | 100.00 | % | FULL-SERVICE LEASING | ||||||||||||
| Aviación Británica, A.I.E. |
Spain | 99.99 | % | 0.01 | % | 100.00 | % | 100.00 | % | 100.00 | % | FULL-SERVICE LEASING | ||||||||||||
| Aviación Centaurus, A.I.E. |
Spain | 99.99 | % | 0.01 | % | 100.00 | % | 100.00 | % | 100.00 | % | FULL-SERVICE LEASING | ||||||||||||
| Aviación Intercontinental, A.I.E. |
Spain | 65.00 | % | 0.00 | % | 65.00 | % | 65.00 | % | 65.00 | % | FULL-SERVICE LEASING | ||||||||||||
| Aviación RC II, A.I.E. |
Spain | 99.99 | % | 0.01 | % | 100.00 | % | 100.00 | % | 100.00 | % | FULL-SERVICE LEASING | ||||||||||||
F-305
Table of Contents
| % of ownership held by the Bank |
% of voting power (c) | |||||||||||||||||||||||
| Company |
Location |
Direct | Indirect | 2014 | 2013 | 2012 | Line of business | |||||||||||||||||
| Aviación Real, A.I.E. |
Spain | 99.99 | % | 0.01 | % | 100.00 | % | 100.00 | % | 100.00 | % | FULL-SERVICE LEASING | ||||||||||||
| Aviación Regional Cántabra, A.I.E. |
Spain | 73.58 | % | 0.00 | % | 73.58 | % | 73.58 | % | 73.58 | % | FULL-SERVICE LEASING | ||||||||||||
| Aviación Scorpius, A.I.E. |
Spain | 99.99 | % | 0.01 | % | 100.00 | % | 100.00 | % | 100.00 | % | FULL-SERVICE LEASING | ||||||||||||
| Aviación Tritón, A.I.E. |
Spain | 99.99 | % | 0.01 | % | 100.00 | % | 100.00 | % | 100.00 | % | FULL-SERVICE LEASING | ||||||||||||
| Aymoré Crédito, Financiamento e Investimento S.A. |
Brazil | 0.00 | % | 89.02 | % | 100.00 | % | 100.00 | % | 100.00 | % | FINANCE | ||||||||||||
| Banbou S.A.R.L. |
France | 0.00 | % | 90.00 | % | 100.00 | % | 100.00 | % | 100.00 | % | HOLDING COMPANY | ||||||||||||
| Banco Bandepe S.A. |
Brazil | 0.00 | % | 89.02 | % | 100.00 | % | 100.00 | % | 100.00 | % | BANKING | ||||||||||||
| Banco de Albacete, S.A. |
Spain | 100.00 | % | 0.00 | % | 100.00 | % | 100.00 | % | 100.00 | % | BANKING | ||||||||||||
| Banco de Asunción, S.A. in voluntary |
Paraguay | 0.00 | % | 99.33 | % | 99.33 | % | 99.33 | % | 99.33 | % | BANKING | ||||||||||||
| Banco Madesant - Sociedade Unipessoal, S.A. |
Portugal | 0.00 | % | 100.00 | % | 100.00 | % | 100.00 | % | 100.00 | % | BANKING | ||||||||||||
| Banco Santander - Chile |
Chile | 0.00 | % | 67.01 | % | 67.18 | % | 67.18 | % | 67.18 | % | BANKING | ||||||||||||
| Banco Santander (Brasil) S.A. |
Brazil | 13.65 | % | 75.37 | % | 89.66 | % | 76.19 | % | 76.09 | % | BANKING | ||||||||||||
| Banco Santander (México), S.A., Institución de Banca Múltiple, Grupo Financiero Santander México |
Mexico | 0.00 | % | 75.05 | % | 99.99 | % | 99.99 | % | 99.99 | % | BANKING | ||||||||||||
| Banco Santander (Panamá), S.A. |
Panama | 0.00 | % | 100.00 | % | 100.00 | % | 100.00 | % | 100.00 | % | BANKING | ||||||||||||
| Banco Santander (Suisse) SA |
Switzerland | 0.00 | % | 100.00 | % | 100.00 | % | 100.00 | % | 100.00 | % | BANKING | ||||||||||||
| Banco Santander Bahamas International Limited |
Bahamas | 0.00 | % | 100.00 | % | 100.00 | % | 100.00 | % | 100.00 | % | BANKING | ||||||||||||
| Banco Santander Consumer Portugal, S.A. |
Portugal | 0.00 | % | 100.00 | % | 100.00 | % | 100.00 | % | 100.00 | % | BANKING | ||||||||||||
| Banco Santander de Negocios Colombia S.A. |
Colombia | 0.00 | % | 99.99 | % | 99.99 | % | 99.99 | % | — | FINANCE | |||||||||||||
| Banco Santander International |
United States | 100.00 | % | 0.00 | % | 100.00 | % | 100.00 | % | 100.00 | % | BANKING | ||||||||||||
| Banco Santander Perú S.A. |
Peru | 99.00 | % | 1.00 | % | 100.00 | % | 100.00 | % | 100.00 | % | BANKING | ||||||||||||
| Banco Santander Puerto Rico |
Puerto Rico | 0.00 | % | 100.00 | % | 100.00 | % | 100.00 | % | 100.00 | % | BANKING | ||||||||||||
| Banco Santander Río S.A. |
Argentina | 8.23 | % | 91.07 | % | 98.44 | % | 98.45 | % | 99.02 | % | BANKING | ||||||||||||
| Banco Santander Totta, S.A. |
Portugal | 0.00 | % | 99.80 | % | 99.91 | % | 99.91 | % | 99.89 | % | BANKING | ||||||||||||
| Banco Santander, S.A. |
Uruguay | 97.75 | % | 2.25 | % | 100.00 | % | 100.00 | % | 100.00 | % | BANKING | ||||||||||||
| Banco Santander, S.A., Fideicomiso 100740 |
Mexico | 0.00 | % | 75.05 | % | 100.00 | % | 100.00 | % | 100.00 | % | FINANCE | ||||||||||||
| Bank Zachodni WBK S.A. |
Poland | 69.41 | % | 0.00 | % | 69.41 | % | 70.00 | % | 94.23 | % | BANKING | ||||||||||||
| Bansa Santander S.A. |
Chile | 0.00 | % | 100.00 | % | 100.00 | % | 100.00 | % | 100.00 | % | PROPERTY | ||||||||||||
F-306
Table of Contents
| % of ownership held by the Bank |
% of voting power (c) | |||||||||||||||||||||||
| Company |
Location |
Direct | Indirect | 2014 | 2013 | 2012 | Line of business | |||||||||||||||||
| Bansalud, S.L. |
Spain | 72.34 | % | 12.00 | % | 84.34 | % | 65.00 | % | 65.00 | % | TECHNOLOGY SERVICES | ||||||||||||
| Bansamex, S.A. |
Spain | 50.00 | % | 0.00 | % | 50.00 | % | 50.00 | % | 50.00 | % | CARDS | ||||||||||||
| Bayones ECA Limited |
Ireland | — | (a) | — | — | — | FINANCE | |||||||||||||||||
| BCLF 2013-1 B.V. |
The Netherlands | — | (a) | — | — | — | SECURITIZATION | |||||||||||||||||
| Bel Canto SICAV |
Luxembourg | 100.00 | % | 0.00 | % | 100.00 | % | 100.00 | % | 100.00 | % | OPEN-END INVESTMENT COMPANY | ||||||||||||
| Besaya ECA Limited |
Ireland | — | (a) | — | — | — | FINANCE | |||||||||||||||||
| Bilkreditt 1 Limited (b) |
Ireland | — | (a) | — | — | — | SECURITIZATION | |||||||||||||||||
| Bilkreditt 2 Limited |
Ireland | — | (a) | — | — | — | SECURITIZATION | |||||||||||||||||
| Bilkreditt 3 Limited |
Ireland | — | (a) | — | — | — | SECURITIZATION | |||||||||||||||||
| Bilkreditt 4 Limited |
Ireland | — | (a) | — | — | — | SECURITIZATION | |||||||||||||||||
| Bilkreditt 5 Limited |
Ireland | — | (a) | — | — | — | SECURITIZATION | |||||||||||||||||
| Bilkreditt 6 Limited |
Ireland | — | (a) | — | — | — | SECURITIZATION | |||||||||||||||||
| Blue Energy Ridgewind Investments Limited |
United Kingdom | 0.00 | % | 100.00 | % | 100.00 | % | 100.00 | % | — | ELECTRICITY PRODUCTION | |||||||||||||
| Blue Energy Ridgewind Operations Limited |
United Kingdom | 0.00 | % | 100.00 | % | 100.00 | % | 100.00 | % | — | HOLDING COMPANY | |||||||||||||
| Brazil Foreign Diversified Payment Rights Finance Company (b) |
Cayman Islands | — | (b) | — | — | — | SECURITIZATION | |||||||||||||||||
| Broxted Solar Co Limited |
United Kingdom | 0.00 | % | 100.00 | % | 100.00 | % | 100.00 | % | — | ELECTRICITY PRODUCTION | |||||||||||||
| BRS Investments S.A. |
Argentina | 0.00 | % | 100.00 | % | 100.00 | % | 100.00 | % | 100.00 | % | FINANCE | ||||||||||||
| BST International Bank, Inc. |
Puerto Rico | 0.00 | % | 99.80 | % | 100.00 | % | 100.00 | % | 100.00 | % | BANKING | ||||||||||||
| BZ WBK Asset Management S.A. |
Poland | 50.00 | % | 34.71 | % | 100.00 | % | 100.00 | % | 100.00 | % | FUND MANAGEMENT COMPANY | ||||||||||||
| BZ WBK Faktor Sp. z o.o. |
Poland | 0.00 | % | 69.41 | % | 100.00 | % | 100.00 | % | 100.00 | % | FINANCIAL SERVICES | ||||||||||||
| BZ WBK Finanse Sp. z o.o. |
Poland | 0.00 | % | 69.41 | % | 100.00 | % | 100.00 | % | 100.00 | % | FINANCIAL SERVICES | ||||||||||||
| BZ WBK Inwestycje Sp. z o.o. |
Poland | 0.00 | % | 69.41 | % | 100.00 | % | 100.00 | % | 100.00 | % | SECURITIES COMPANY | ||||||||||||
| BZ WBK Lease S.A. |
Poland | 0.00 | % | 69.41 | % | 100.00 | % | 100.00 | % | — | LEASING | |||||||||||||
| BZ WBK Leasing S.A. |
Poland | 0.00 | % | 69.41 | % | 100.00 | % | 100.00 | % | 100.00 | % | LEASING | ||||||||||||
| BZ WBK Nieruchomości S.A. |
Poland | 0.00 | % | 69.40 | % | 99.99 | % | 99.99 | % | 99.99 | % | SERVICES | ||||||||||||
| BZ WBK Towarzystwo Funduszy Inwestycyjnych S.A. |
Poland | 0.00 | % | 84.71 | % | 100.00 | % | 100.00 | % | 100.00 | % | FUND MANAGEMENT COMPANY | ||||||||||||
F-307
Table of Contents
| % of ownership held by the Bank |
% of voting power (c) | |||||||||||||||||||||||
| Company |
Location |
Direct | Indirect | 2014 | 2013 | 2012 | Line of business | |||||||||||||||||
| BZ WBK-Aviva Towarzystwo Ubezpieczeń na Życie S.A. |
Poland | 0.00 | % | 45.81 | % | 66.00 | % | 66.00 | % | 50.00 | % | INSURANCE | ||||||||||||
| BZ WBK-Aviva Towarzystwo Ubezpieczeń Ogólnych S.A. |
Poland | 0.00 | % | 45.81 | % | 66.00 | % | 66.00 | % | 50.00 | % | INSURANCE | ||||||||||||
| C.S.N.S.P. 451, S.A. |
Portugal | 0.00 | % | 100.00 | % | 100.00 | % | 100.00 | % | — | ELECTRICITY PRODUCTION | |||||||||||||
| Caja de Emisiones con Garantía de Anualidades Debidas por el Estado, S.A. |
Spain | 62.87 | % | 0.00 | % | 62.87 | % | 62.87 | % | 62.87 | % | FINANCE | ||||||||||||
| Cántabra de Inversiones, S.A. |
Spain | 100.00 | % | 0.00 | % | 100.00 | % | 100.00 | % | 100.00 | % | HOLDING COMPANY | ||||||||||||
| Cántabro Catalana de Inversiones, S.A. |
Spain | 100.00 | % | 0.00 | % | 100.00 | % | 100.00 | % | 100.00 | % | HOLDING COMPANY | ||||||||||||
| CAPB Limited (b) |
United Kingdom | 0.00 | % | 100.00 | % | 100.00 | % | 100.00 | % | 100.00 | % | BANKING | ||||||||||||
| Capital Riesgo Global, SCR de Régimen Simplificado, S.A. |
Spain | 95.46 | % | 4.54 | % | 100.00 | % | 100.00 | % | 100.00 | % | VENTURE CAPITAL COMPANY | ||||||||||||
| Capital Street Delaware, LP |
United States | 0.00 | % | 100.00 | % | 100.00 | % | 100.00 | % | 100.00 | % | HOLDING COMPANY | ||||||||||||
| Capital Street Holdings, LLC |
United States | 0.00 | % | 100.00 | % | 100.00 | % | 100.00 | % | 100.00 | % | HOLDING COMPANY | ||||||||||||
| Capital Street REIT Holdings, LLC |
United States | 0.00 | % | 100.00 | % | 100.00 | % | 100.00 | % | 100.00 | % | HOLDING COMPANY | ||||||||||||
| Capital Street S.A. |
Luxembourg | 0.00 | % | 100.00 | % | 100.00 | % | 100.00 | % | 100.00 | % | FINANCE | ||||||||||||
| Carfax (Guernsey) Limited (e) |
Guernsey | 0.00 | % | 100.00 | % | 100.00 | % | 100.00 | % | 100.00 | % | INSURANCE BROKER | ||||||||||||
| Carpe Diem Salud, S.L. |
Spain | 100.00 | % | 0.00 | % | 100.00 | % | 100.00 | % | 100.00 | % | SECURITIES INVESTMENT | ||||||||||||
| Cartera Mobiliaria, S.A., SICAV |
Spain | 0.00 | % | 82.18 | % | 93.43 | % | 93.24 | % | 93.08 | % | SECURITIES INVESTMENT | ||||||||||||
| Casa de Bolsa Santander, S.A. de C.V., Grupo Financiero Santander México |
Mexico | 0.00 | % | 75.03 | % | 99.97 | % | 99.97 | % | 99.97 | % | SECURITIES COMPANY | ||||||||||||
| Cater Allen Holdings Limited |
United Kingdom | 0.00 | % | 100.00 | % | 100.00 | % | 100.00 | % | 100.00 | % | HOLDING COMPANY | ||||||||||||
| Cater Allen International Limited |
United Kingdom | 0.00 | % | 100.00 | % | 100.00 | % | 100.00 | % | 100.00 | % | SECURITIES COMPANY | ||||||||||||
| Cater Allen Limited |
United Kingdom | 0.00 | % | 100.00 | % | 100.00 | % | 100.00 | % | 100.00 | % | BANKING | ||||||||||||
| Cater Allen Lloyd’s Holdings Limited |
United Kingdom | 0.00 | % | 100.00 | % | 100.00 | % | 100.00 | % | 100.00 | % | HOLDING COMPANY | ||||||||||||
| Cater Allen Pensions Limited (b) |
United Kingdom | 0.00 | % | 100.00 | % | 100.00 | % | 100.00 | % | 100.00 | % | PENSION FUND MANAGEMENT COMPANY | ||||||||||||
| Cater Allen Syndicate Management Limited |
United Kingdom | 0.00 | % | 100.00 | % | 100.00 | % | 100.00 | % | 100.00 | % | ADVISORY SERVICES | ||||||||||||
| Cavalsa Gestión, S.A. |
Spain | 100.00 | % | 0.00 | % | 100.00 | % | 100.00 | % | — | SECURITIES INVESTMENT | |||||||||||||
| CCAP Auto Lease Ltd. |
United States | 0.00 | % | 60.46 | % | 100.00 | % | — | — | LEASING | ||||||||||||||
| Central Eólica Santo Antonio De Padua S.A. |
Brazil | 0.00 | % | 89.02 | % | 100.00 | % | 100.00 | % | 100.00 | % | ELECTRICITY PRODUCTION | ||||||||||||
| Central Eólica Sao Cristovao S.A. |
Brazil | 0.00 | % | 89.02 | % | 100.00 | % | 100.00 | % | 100.00 | % | ELECTRICITY PRODUCTION | ||||||||||||
F-308
Table of Contents
| % of ownership held by the Bank |
% of voting power (c) | |||||||||||||||||||||||
| Company |
Location |
Direct | Indirect | 2014 | 2013 | 2012 | Line of business | |||||||||||||||||
| Central Eólica Sao Jorge S.A. |
Brazil | 0.00 | % | 89.02 | % | 100.00 | % | 100.00 | % | 100.00 | % | ELECTRICITY PRODUCTION | ||||||||||||
| Centros Comerciales Metropolitanos, S.A. |
Spain | 0.00 | % | 55.89 | % | 100.00 | % | — | — | SHOPPING CENTRE | ||||||||||||||
| Certidesa, S.L. |
Spain | 0.00 | % | 100.00 | % | 100.00 | % | 100.00 | % | 100.00 | % | LEASE OF AIRCRAFT | ||||||||||||
| Chiplow Wind Farm Limited |
United Kingdom | 0.00 | % | 100.00 | % | 100.00 | % | — | — | ELECTRICITY PRODUCTION | ||||||||||||||
| Chrysler Capital Auto Receivables LLC (consolidated) |
United States | 0.00 | % | 60.46 | % | 100.00 | % | — | — | FINANCE | ||||||||||||||
| Chrysler Capital Auto Receivables Trust 2013-A |
United States | — | (a) | — | — | — | SECURITIZATION | |||||||||||||||||
| Chrysler Capital Auto Receivables Trust 2013-B |
United States | — | (a) | — | — | — | SECURITIZATION | |||||||||||||||||
| Chrysler Capital Auto Receivables Trust 2014-A |
United States | — | (a) | — | — | — | SECURITIZATION | |||||||||||||||||
| Chrysler Capital Auto Receivables Trust 2014-B |
United States | — | (a) | — | — | — | SECURITIZATION | |||||||||||||||||
| Chrysler Capital Master Auto Receivables Funding LLC |
United States | 0.00 | % | 60.46 | % | 100.00 | % | — | — | FINANCE | ||||||||||||||
| Clínica Sear, S.A. |
Spain | 50.58 | % | 0.00 | % | 50.58 | % | 50.58 | % | 50.58 | % | HEALTHCARE | ||||||||||||
| Club Zaudin Golf, S.A. |
Spain | 0.00 | % | 85.04 | % | 95.11 | % | 95.11 | % | 95.11 | % | SERVICES | ||||||||||||
| Conaraz Inversiones, SICAV, S.A. |
Spain | 76.24 | % | 4.54 | % | 81.86 | % | 80.78 | % | — | OPEN-END INVESTMENT COMPANY | |||||||||||||
| Crawfall S.A. |
Uruguay | 100.00 | % | 0.00 | % | 100.00 | % | 100.00 | % | 100.00 | % | SERVICES | ||||||||||||
| Credisol, S.A. (b) |
Uruguay | 0.00 | % | 100.00 | % | 100.00 | % | 100.00 | % | 100.00 | % | FINANCE | ||||||||||||
| Dansk Auto Finansiering 1 Ltd |
Ireland | — | (a) | — | — | — | SECURITIZATION | |||||||||||||||||
| Darep Limited |
Ireland | 100.00 | % | 0.00 | % | 100.00 | % | 100.00 | % | 100.00 | % | REINSURANCE | ||||||||||||
| Desarrollo de Infraestructuras de Castilla, S.A. |
Spain | 0.00 | % | 55.89 | % | 100.00 | % | — | — | WATER SUPPLY | ||||||||||||||
| Desarrollos Estructurales Vaines, S.L. |
Spain | 0.00 | % | 55.89 | % | 100.00 | % | — | — | PROPERTY | ||||||||||||||
| Digital Procurement Holdings N.V. |
The Netherlands | 0.00 | % | 100.00 | % | 100.00 | % | 100.00 | % | 100.00 | % | HOLDING COMPANY | ||||||||||||
| Diners Club Spain, S.A. |
Spain | 75.00 | % | 0.00 | % | 75.00 | % | 75.00 | % | 75.00 | % | CARDS | ||||||||||||
| Dirección Estratega, S.C. |
Mexico | 0.00 | % | 100.00 | % | 100.00 | % | 100.00 | % | 100.00 | % | SERVICES | ||||||||||||
| Dirgenfin, S.L. |
Spain | 0.00 | % | 100.00 | % | 100.00 | % | 50.00 | % | 40.00 | % | REAL ESTATE DEVELOPMENT | ||||||||||||
| Drive Auto Receivables Trust 2014-A |
United States | — | (a) | — | — | — | INACTIVE | |||||||||||||||||
| Drive Residual Holdings GP LLC |
United States | 0.00 | % | 60.46 | % | 100.00 | % | — | — | HOLDING COMPANY | ||||||||||||||
| Drive Residual Holdings LP |
United States | 0.00 | % | 60.46 | % | 100.00 | % | — | — | FINANCE | ||||||||||||||
| Electrolyser, S.A. de C.V. |
Mexico | 0.00 | % | 74.78 | % | 100.00 | % | — | — | SERVICES | ||||||||||||||
F-309
Table of Contents
| % of ownership held by the Bank |
% of voting power (c) | |||||||||||||||||||||||
| Company |
Location |
Direct | Indirect | 2014 | 2013 | 2012 | Line of business | |||||||||||||||||
| Empresas Banesto 5, Fondo de Titulización de Activos |
Spain | — | (a) | — | — | — | SECURITIZATION | |||||||||||||||||
| Empresas Banesto 6, Fondo de Titulización de Activos |
Spain | — | (a) | — | — | — | SECURITIZATION | |||||||||||||||||
| Energy Efficient Global UK Project Limited |
United Kingdom | 0.00 | % | 100.00 | % | 100.00 | % | — | — | SECURITIZATION | ||||||||||||||
| EOL Brisa Energias Renováveis S.A. |
Brazil | 0.00 | % | 100.00 | % | 100.00 | % | 100.00 | % | 100.00 | % | ELECTRICITY PRODUCTION | ||||||||||||
| EOL Vento Energias Renováveis S.A. |
Brazil | 0.00 | % | 100.00 | % | 100.00 | % | 100.00 | % | 100.00 | % | ELECTRICITY PRODUCTION | ||||||||||||
| EOL Wind Energias Renováveis S.A. |
Brazil | 0.00 | % | 100.00 | % | 100.00 | % | 100.00 | % | 100.00 | % | ELECTRICITY PRODUCTION | ||||||||||||
| Eolsiponto S.r.l. |
Italy | 0.00 | % | 92.00 | % | 92.00 | % | 92.00 | % | — | ELECTRICITY PRODUCTION | |||||||||||||
| Erestone S.A.S. |
France | 0.00 | % | 90.00 | % | 90.00 | % | 90.00 | % | 90.00 | % | PROPERTY | ||||||||||||
| Evidence Previdência S.A. |
Brazil | 0.00 | % | 89.02 | % | 100.00 | % | 100.00 | % | 100.00 | % | HOLDING COMPANY | ||||||||||||
| Explotaciones Urbanas Españolas, S.A. |
Spain | 0.00 | % | 55.89 | % | 100.00 | % | — | — | HOTEL OPERATIONS | ||||||||||||||
| FFB - Participações e Serviços, Sociedade Unipessoal, S.A. |
Portugal | 0.00 | % | 100.00 | % | 100.00 | % | 100.00 | % | 100.00 | % | HOLDING COMPANY | ||||||||||||
| Fideicomiso 2002114 |
Mexico | 0.00 | % | 75.01 | % | 100.00 | % | 100.00 | % | 100.00 | % | HOLDING COMPANY | ||||||||||||
| Fideicomiso Financiero Super Letras Hipotecarias - clase I |
Argentina | 0.00 | % | 99.30 | % | 100.00 | % | 100.00 | % | 100.00 | % | TRUST SERVICES | ||||||||||||
| Fideicomiso Financiero Super Letras Hipotecarias - clase II |
Argentina | 0.00 | % | 99.30 | % | 100.00 | % | 100.00 | % | 100.00 | % | TRUST SERVICES | ||||||||||||
| Fideicomiso GFSSLPT Banco Santander, S.A. |
Mexico | 0.00 | % | 75.05 | % | 100.00 | % | 100.00 | % | 100.00 | % | FINANCE | ||||||||||||
| Financiera El Corte Inglés, E.F.C., S.A. |
Spain | 0.00 | % | 51.00 | % | 51.00 | % | — | — | FINANCE | ||||||||||||||
| First National Motor Business Limited |
United Kingdom | 0.00 | % | 100.00 | % | 100.00 | % | 100.00 | % | 100.00 | % | LEASING | ||||||||||||
| First National Motor Contracts Limited |
United Kingdom | 0.00 | % | 100.00 | % | 100.00 | % | 100.00 | % | 100.00 | % | LEASING | ||||||||||||
| First National Motor Facilities Limited |
United Kingdom | 0.00 | % | 100.00 | % | 100.00 | % | 100.00 | % | 100.00 | % | LEASING | ||||||||||||
| First National Motor Finance Limited |
United Kingdom | 0.00 | % | 100.00 | % | 100.00 | % | 100.00 | % | 100.00 | % | ADVISORY SERVICES | ||||||||||||
| First National Motor Leasing Limited |
United Kingdom | 0.00 | % | 100.00 | % | 100.00 | % | 100.00 | % | 100.00 | % | LEASING | ||||||||||||
| First National Motor plc |
United Kingdom | 0.00 | % | 100.00 | % | 100.00 | % | 100.00 | % | 100.00 | % | LEASING | ||||||||||||
| First National Tricity Finance Limited |
United Kingdom | 0.00 | % | 100.00 | % | 100.00 | % | 100.00 | % | 100.00 | % | FINANCE | ||||||||||||
| Fomento e Inversiones, S.A. |
Spain | 100.00 | % | 0.00 | % | 100.00 | % | 100.00 | % | 100.00 | % | HOLDING COMPANY | ||||||||||||
| Fondo de Titulización de Activos PYMES Banesto 3 |
Spain | — | (a) | — | — | — | SECURITIZATION | |||||||||||||||||
| Fondo de Titulización de Activos PYMES Santander 10 |
Spain | — | (a) | — | — | — | SECURITIZATION | |||||||||||||||||
F-310
Table of Contents
| % of ownership held by the Bank |
% of voting power (c) | |||||||||||||||||||||||
| Company |
Location |
Direct | Indirect | 2014 | 2013 | 2012 | Line of business | |||||||||||||||||
| Fondo de Titulización de Activos PYMES Santander 3 |
Spain | — | (a) | — | — | — | SECURITIZATION | |||||||||||||||||
| Fondo de Titulización de Activos PYMES Santander 4 |
Spain | — | (a) | — | — | — | SECURITIZATION | |||||||||||||||||
| Fondo de Titulización de Activos PYMES Santander 5 |
Spain | — | (a) | — | — | — | SECURITIZATION | |||||||||||||||||
| Fondo de Titulización de Activos PYMES Santander 6 |
Spain | — | (a) | — | — | — | SECURITIZATION | |||||||||||||||||
| Fondo de Titulización de Activos PYMES Santander 7 |
Spain | — | (a) | — | — | — | SECURITIZATION | |||||||||||||||||
| Fondo de Titulización de Activos PYMES Santander 8 |
Spain | — | (a) | — | — | — | SECURITIZATION | |||||||||||||||||
| Fondo de Titulización de Activos PYMES Santander 9 |
Spain | — | (a) | — | — | — | SECURITIZATION | |||||||||||||||||
| Fondo de Titulización de Activos RMBS Santander 1 |
Spain | — | (a) | — | — | — | SECURITIZATION | |||||||||||||||||
| Fondo de Titulización de Activos RMBS Santander 2 |
Spain | — | (a) | — | — | — | SECURITIZATION | |||||||||||||||||
| Fondo de Titulización de Activos RMBS Santander 3 |
Spain | — | (a) | — | — | — | SECURITIZATION | |||||||||||||||||
| Fondo de Titulización de Activos Santander 2 |
Spain | — | (a) | — | — | — | SECURITIZATION | |||||||||||||||||
| Fondo de Titulización de Activos Santander Consumer |
Spain | — | (a) | — | — | — | SECURITIZATION | |||||||||||||||||
| Fondo de Titulización de Activos Santander Consumer Spain Auto 2010-1 |
Spain | — | (a) | — | — | — | SECURITIZATION | |||||||||||||||||
| Fondo de Titulización de Activos Santander Consumer Spain Auto 2011-1 |
Spain | — | (a) | — | — | — | SECURITIZATION | |||||||||||||||||
| Fondo de Titulización de Activos Santander Consumer Spain Auto 2012-1 |
Spain | — | (a) | — | — | — | SECURITIZATION | |||||||||||||||||
| Fondo de Titulización de Activos Santander Consumer Spain Auto 2013-1 |
Spain | — | (a) | — | — | — | SECURITIZATION | |||||||||||||||||
| Fondo de Titulización de Activos Santander Consumer Spain Auto 2014-1 |
Spain | — | (a) | — | — | — | SECURITIZATION | |||||||||||||||||
| Fondo de Titulización de Activos Santander Empresas 1 |
Spain | — | (a) | — | — | — | SECURITIZATION | |||||||||||||||||
| Fondo de Titulización de Activos Santander |
Spain | — | (a) | — | — | — | SECURITIZATION | |||||||||||||||||
| Fondo de Titulización de Activos Santander Empresas 2 |
Spain | — | (a) | — | — | — | SECURITIZATION | |||||||||||||||||
| Fondo de Titulización de Activos Santander Empresas 3 |
Spain | — | (a) | — | — | — | SECURITIZATION | |||||||||||||||||
| Fondo de Titulización de Activos Santander Financiación 5 |
Spain | — | (a) | — | — | — | SECURITIZATION | |||||||||||||||||
| Fondo de Titulización de Activos Santander |
Spain | — | (a) | — | — | — | SECURITIZATION | |||||||||||||||||
| Fondo de Titulización de Activos Santander |
Spain | — | (a) | — | — | — | SECURITIZATION | |||||||||||||||||
F-311
Table of Contents
| % of ownership held by the Bank |
% of voting power (c) | |||||||||||||||||||||||
| Company |
Location |
Direct | Indirect | 2014 | 2013 | 2012 | Line of business | |||||||||||||||||
| Fondo de Titulización de Activos Santander Hipotecario 9 |
Spain | — | (a) | — | — | — | SECURITIZATION | |||||||||||||||||
| Fondo de Titulización de Activos Santander Público 1 |
Spain | — | (a) | — | — | — | SECURITIZATION | |||||||||||||||||
| Fondo de Titulización Santander Financiación 1 |
Spain | — | (a) | — | — | — | SECURITIZATION | |||||||||||||||||
| Fondos Santander, S.A. Administradora de Fondos de Inversión (in liquidation) (b) |
Uruguay | 0.00 | % | 100.00 | % | 100.00 | % | 100.00 | % | 100.00 | % | FUND MANAGEMENT COMPANY | ||||||||||||
| Formación Integral, S.A. |
Spain | 100.00 | % | 0.00 | % | 100.00 | % | 100.00 | % | 100.00 | % | TRAINING | ||||||||||||
| Fortensky Trading, Ltd. |
Ireland | 0.00 | % | 100.00 | % | 100.00 | % | 100.00 | % | 100.00 | % | FINANCE | ||||||||||||
| Fosse (Master Issuer) Holdings Limited |
United Kingdom | — | (a) | — | — | — | SECURITIZATION | |||||||||||||||||
| Fosse Funding (No.1) Limited |
United Kingdom | 0.00 | % | 100.00 | % | 100.00 | % | 100.00 | % | 100.00 | % | SECURITIZATION | ||||||||||||
| Fosse Master Issuer PLC |
United Kingdom | 0.00 | % | 100.00 | % | 100.00 | % | 100.00 | % | 100.00 | % | SECURITIZATION | ||||||||||||
| Fosse PECOH Limited |
United Kingdom | — | (a) | — | — | — | SECURITIZATION | |||||||||||||||||
| Fosse Trustee (UK) Limited |
United Kingdom | 0.00 | % | 100.00 | % | 100.00 | % | — | — | SECURITIZATION | ||||||||||||||
| Fosse Trustee Limited |
Jersey | — | (a) | — | — | — | SECURITIZATION | |||||||||||||||||
| Franklin Acquisition Funding LLC |
United States | 0.00 | % | 60.46 | % | 100.00 | % | — | — | FINANCE | ||||||||||||||
| FTPYME Banesto 2, Fondo de Titulización de Activos |
Spain | — | (a) | — | — | — | SECURITIZATION | |||||||||||||||||
| FTPYME Santander 2 Fondo de Titulización de Activos |
Spain | — | (a) | — | — | — | SECURITIZATION | |||||||||||||||||
| Fuencarral Agrupanorte, S.L. |
Spain | 0.00 | % | 55.89 | % | 100.00 | % | — | — | PROPERTY | ||||||||||||||
| Garilar, S.A. |
Uruguay | 0.00 | % | 100.00 | % | 100.00 | % | 100.00 | % | 100.00 | % | INTERNET | ||||||||||||
| Geoban UK Limited |
United Kingdom | 0.00 | % | 100.00 | % | 100.00 | % | 100.00 | % | 100.00 | % | SERVICES | ||||||||||||
| Geoban, S.A. |
Spain | 100.00 | % | 0.00 | % | 100.00 | % | 100.00 | % | 100.00 | % | SERVICES | ||||||||||||
| Gesban México Servicios Administrativos Globales, S.A. de C.V. |
Mexico | 0.00 | % | 100.00 | % | 100.00 | % | 100.00 | % | 100.00 | % | SERVICES | ||||||||||||
| Gesban Santander Servicios Profesionales Contables Limitada |
Chile | 0.00 | % | 100.00 | % | 100.00 | % | 100.00 | % | 100.00 | % | INTERNET | ||||||||||||
| Gesban Servicios Administrativos Globales, S.L. |
Spain | 99.99 | % | 0.01 | % | 100.00 | % | 100.00 | % | 100.00 | % | SERVICES | ||||||||||||
| Gesban UK Limited |
United Kingdom | 0.00 | % | 100.00 | % | 100.00 | % | 100.00 | % | 100.00 | % | COLLECTION AND PAYMENT SERVICES | ||||||||||||
| Gestamp Eólica Lagoa Nova S.A. |
Brazil | 0.00 | % | 62.32 | % | 70.00 | % | — | — | ELECTRICITY PRODUCTION | ||||||||||||||
| Gestamp Eólica Lanchinha S.A. |
Brazil | 0.00 | % | 80.12 | % | 90.00 | % | — | — | ELECTRICITY PRODUCTION | ||||||||||||||
| Gestamp Eólica Paraíso S.A. |
Brazil | 0.00 | % | 80.12 | % | 90.00 | % | — | — | ELECTRICITY PRODUCTION | ||||||||||||||
F-312
Table of Contents
| % of ownership held by the Bank |
% of voting power (c) | |||||||||||||||||||||||
| Company |
Location |
Direct | Indirect | 2014 | 2013 | 2012 | Line of business | |||||||||||||||||
| Gestamp Eólica Seridó S.A. |
Brazil | 0.00 | % | 80.12 | % | 90.00 | % | — | — | ELECTRICITY PRODUCTION | ||||||||||||||
| Gestamp Eólica Serra de Santana S.A. |
Brazil | 0.00 | % | 62.32 | % | 70.00 | % | — | — | ELECTRICITY PRODUCTION | ||||||||||||||
| Gestión de Instalaciones Fotovoltaicas, S.L. Sole-Shareholder Company |
Spain | 0.00 | % | 100.00 | % | 100.00 | % | 100.00 | % | 100.00 | % | ELECTRICITY PRODUCTION | ||||||||||||
| Gestora de Procesos S.A. in liquidation (b) |
Peru | 0.00 | % | 100.00 | % | 100.00 | % | 100.00 | % | 100.00 | % | HOLDING COMPANY | ||||||||||||
| Gestora Patrimonial Calle Francisco Sancha 12, S.L. |
Spain | 68.80 | % | 0.00 | % | 68.80 | % | 68.80 | % | — | SECURITIES AND PROPERTY MANAGEMENT | |||||||||||||
| Getnet Adquirência e Serviços para Meios de Pagamento S.A. |
Brazil | 0.00 | % | 78.78 | % | 88.50 | % | 50.00 | % | 50.00 | % | PAYMENT SERVICES | ||||||||||||
| Gieldokracja Spólka z o.o. |
Poland | 0.00 | % | 69.41 | % | 100.00 | % | — | — | SERVICES | ||||||||||||||
| Girobank Carlton Investments Limited (b) |
United Kingdom | 0.00 | % | 100.00 | % | 100.00 | % | 100.00 | % | 100.00 | % | FINANCE | ||||||||||||
| Girobank Investments Limited (b) |
United Kingdom | 0.00 | % | 100.00 | % | 100.00 | % | 100.00 | % | 100.00 | % | FINANCE | ||||||||||||
| Global Carihuela, S.A. |
Spain | 0.00 | % | 55.89 | % | 100.00 | % | — | — | PROPERTY | ||||||||||||||
| Global Murex Iberia, S.L. |
Spain | 0.00 | % | 55.89 | % | 100.00 | % | — | — | PROPERTY | ||||||||||||||
| Go Pay Comércio e Serviços de Tecnologia da Informação Ltda. |
Brazil | 0.00 | % | 78.78 | % | 100.00 | % | — | — | TECHNOLOGY SERVICES | ||||||||||||||
| Golden Bar (Securitisation) S.r.l. |
Italy | — | (a | ) | — | — | — | SECURITIZATION | ||||||||||||||||
| Golden Bar Securitization Programme IV 2009-1 |
Italy | — | (a | ) | — | — | — | SECURITIZATION | ||||||||||||||||
| Golden Bar Stand Alone 2011-1 |
Italy | — | (a | ) | — | — | — | SECURITIZATION | ||||||||||||||||
| Golden Bar Stand Alone 2011-2 |
Italy | — | (a | ) | — | — | — | SECURITIZATION | ||||||||||||||||
| Golden Bar Stand Alone 2012-1 |
Italy | — | (a | ) | — | — | — | SECURITIZATION | ||||||||||||||||
| Golden Bar Stand Alone 2012-2 |
Italy | — | (a | ) | — | — | — | SECURITIZATION | ||||||||||||||||
| Golden Bar Stand Alone 2013-1 |
Italy | — | (a | ) | — | — | — | SECURITIZATION | ||||||||||||||||
| Golden Bar Stand Alone 2013-2 |
Italy | — | (a | ) | — | — | — | SECURITIZATION | ||||||||||||||||
| Golden Bar Stand Alone 2014-1 |
Italy | — | (a | ) | — | — | — | SECURITIZATION | ||||||||||||||||
| Green Energy Holding Company, S.L. |
Spain | 0.00 | % | 100.00 | % | 100.00 | % | — | — | HOLDING COMPANY | ||||||||||||||
| Grupo Alcanza, S.A. de C.V. |
Mexico | 100.00 | % | 0.00 | % | 100.00 | % | 100.00 | % | 100.00 | % | HOLDING COMPANY | ||||||||||||
| Grupo Empresarial Santander, S.L. |
Spain | 99.11 | % | 0.89 | % | 100.00 | % | 100.00 | % | 100.00 | % | HOLDING COMPANY | ||||||||||||
| Grupo Financiero Santander México, S.A.B. de C.V. |
Mexico | 51.05 | % | 24.01 | % | 75.09 | % | 75.13 | % | 75.17 | % | HOLDING COMPANY | ||||||||||||
| Grupo Konecta Centros Especiales de Empleo, S.L. |
Spain | 0.00 | % | 51.86 | % | 100.00 | % | 100.00 | % | 100.00 | % | TELEMARKETING | ||||||||||||
F-313
Table of Contents
| % of ownership held by the Bank |
% of voting power (c) | |||||||||||||||||||||||
| Company |
Location |
Direct | Indirect | 2014 | 2013 | 2012 | Line of business | |||||||||||||||||
| Grupo Konecta Maroc S.A.R.L. à associé unique |
Morocco | 0.00 | % | 51.86 | % | 100.00 | % | 100.00 | % | 100.00 | % | TELEMARKETING | ||||||||||||
| Grupo Konecta UK Limited |
United Kingdom | 0.00 | % | 51.86 | % | 100.00 | % | 100.00 | % | 100.00 | % | FINANCE | ||||||||||||
| Grupo Konectanet México, S.A. de C.V. |
Mexico | 0.00 | % | 51.86 | % | 100.00 | % | 100.00 | % | 100.00 | % | TELEMARKETING | ||||||||||||
| Grupo Konectanet, S.L. |
Spain | 7.08 | % | 44.77 | % | 51.86 | % | 51.86 | % | 51.86 | % | HOLDING COMPANY | ||||||||||||
| GTS El Centro Equity Holdings, LLC |
United States | 0.00 | % | 81.94 | % | 81.94 | % | 74.20 | % | — | HOLDING COMPANY | |||||||||||||
| GTS El Centro Project Holdings, LLC |
United States | 0.00 | % | 81.94 | % | 100.00 | % | — | — | HOLDING COMPANY | ||||||||||||||
| Guaranty Car, S.A. Sole-Shareholder Company |
Spain | 0.00 | % | 100.00 | % | 100.00 | % | 100.00 | % | 100.00 | % | AUTOMOTIVE | ||||||||||||
| Habitatrix, S.L. |
Spain | 0.00 | % | 55.89 | % | 100.00 | % | — | — | PROPERTY | ||||||||||||||
| Hall Farm Wind Holdings Limited |
United Kingdom | 0.00 | % | 100.00 | % | 100.00 | % | 100.00 | % | — | HOLDING COMPANY | |||||||||||||
| Hipototta No. 1 FTC |
Portugal | — | (a | ) | — | — | — | SECURITIZATION | ||||||||||||||||
| Hipototta No. 1 plc |
Ireland | — | (a | ) | — | — | — | SECURITIZATION | ||||||||||||||||
| Hipototta No. 4 FTC |
Portugal | — | (a | ) | — | — | — | SECURITIZATION | ||||||||||||||||
| Hipototta No. 4 plc |
Ireland | — | (a | ) | — | — | — | SECURITIZATION | ||||||||||||||||
| Hipototta No. 5 FTC |
Portugal | — | (a | ) | — | — | — | SECURITIZATION | ||||||||||||||||
| Hipototta No. 5 plc |
Ireland | — | (a | ) | — | — | — | SECURITIZATION | ||||||||||||||||
| Hipototta No. 7 FTC (b) |
Portugal | — | (a | ) | — | — | — | SECURITIZATION | ||||||||||||||||
| Hipototta No. 7 Limited (b) |
Ireland | — | (a | ) | — | — | — | SECURITIZATION | ||||||||||||||||
| Hipototta No. 8 FTC (b) |
Portugal | — | (a | ) | — | — | — | SECURITIZATION | ||||||||||||||||
| Hipototta No. 8 Limited (b) |
Ireland | — | (a | ) | — | — | — | SECURITIZATION | ||||||||||||||||
| Hispamer Renting, S.A. Sole-Shareholder Company |
Spain | 0.00 | % | 100.00 | % | 100.00 | % | 100.00 | % | 100.00 | % | FULL-SERVICE LEASING | ||||||||||||
| Holbah II Limited |
Bahamas | 0.00 | % | 100.00 | % | 100.00 | % | 100.00 | % | 100.00 | % | HOLDING COMPANY | ||||||||||||
| Holbah Limited |
Bahamas | 0.00 | % | 100.00 | % | 100.00 | % | 100.00 | % | 100.00 | % | HOLDING COMPANY | ||||||||||||
| Holding Jaureguizahar 2002, S.A. |
Spain | 0.00 | % | 55.89 | % | 100.00 | % | — | — | SECURITIES INVESTMENT | ||||||||||||||
| Holmes Funding Limited |
United Kingdom | 0.00 | % | 100.00 | % | 100.00 | % | — | — | SECURITIZATION | ||||||||||||||
| Holmes Holdings Limited |
United Kingdom | — | (a | ) | — | — | — | SECURITIZATION | ||||||||||||||||
| Holmes Master Issuer plc |
United Kingdom | 0.00 | % | 100.00 | % | 100.00 | % | — | — | SECURITIZATION | ||||||||||||||
| Holmes Trustees Limited |
United Kingdom | 0.00 | % | 100.00 | % | 100.00 | % | — | — | SECURITIZATION | ||||||||||||||
F-314
Table of Contents
| % of ownership held by the Bank |
% of voting power (c) | |||||||||||||||||||||||
| Company |
Location |
Direct | Indirect | 2014 | 2013 | 2012 | Line of business | |||||||||||||||||
| Holneth B.V. |
The Netherlands | 0.00 | % | 100.00 | % | 100.00 | % | 100.00 | % | 100.00 | % | HOLDING COMPANY | ||||||||||||
| Ibérica de Compras Corporativas, S.L. |
Spain | 97.17 | % | 2.82 | % | 100.00 | % | 100.00 | % | 100.00 | % | E-COMMERCE | ||||||||||||
| Independence Community Bank Corp. |
United States | 0.00 | % | 100.00 | % | 100.00 | % | 100.00 | % | 100.00 | % | HOLDING COMPANY | ||||||||||||
| Independence Community Commercial Reinvestment Corp. |
United States | 0.00 | % | 100.00 | % | 100.00 | % | 100.00 | % | 100.00 | % | HOLDING COMPANY | ||||||||||||
| Indias Capital Holdings Limited |
United Kingdom | 100.00 | % | 0.00 | % | 100.00 | % | — | — | ELECTRICITY PRODUCTION | ||||||||||||||
| Indias Capital Limited |
United Kingdom | 0.00 | % | 100.00 | % | 100.00 | % | — | — | ELECTRICITY PRODUCTION | ||||||||||||||
| ING Hipotecaria S.A. de C.V. SOFOM ENR (Fideicomiso Bursa) |
Mexico | — | (a) | — | — | — | SECURITIZATION | |||||||||||||||||
| Ingeniería de Software Bancario, S.L. |
Spain | 100.00 | % | 0.00 | % | 100.00 | % | 100.00 | % | 100.00 | % | IT SERVICES | ||||||||||||
| Inmo Francia 2, S.A. |
Spain | 100.00 | % | 0.00 | % | 100.00 | % | 100.00 | % | 100.00 | % | PROPERTY | ||||||||||||
| Inmobiliária Das Avenidas Novas, S.A. |
Portugal | 0.00 | % | 55.89 | % | 100.00 | % | — | — | PROPERTY | ||||||||||||||
| Inmobiliaria Metrogolf, S.A. |
Portugal | 0.00 | % | 55.89 | % | 100.00 | % | — | — | SHOPPING CENTRE | ||||||||||||||
| Instituto Santander Serfin, A.C. |
Mexico | 0.00 | % | 75.05 | % | 100.00 | % | 100.00 | % | 100.00 | % | NOT-FOR-PROFIT INSTITUTE | ||||||||||||
| Insurance Funding Solutions Limited |
United Kingdom | 0.00 | % | 100.00 | % | 100.00 | % | 100.00 | % | 100.00 | % | FINANCE | ||||||||||||
| Integry Tecnologia e Serviços A H U Ltda. |
Brazil | 0.00 | % | 78.78 | % | 100.00 | % | — | — | TECHNOLOGY SERVICES | ||||||||||||||
| Interfinance Holanda B.V. |
The Netherlands | 100.00 | % | 0.00 | % | 100.00 | % | 100.00 | % | 100.00 | % | HOLDING COMPANY | ||||||||||||
| Inversiones Marítimas del Mediterráneo, S.A. |
Spain | 100.00 | % | 0.00 | % | 100.00 | % | 100.00 | % | 100.00 | % | INACTIVE | ||||||||||||
| Isban Argentina S.A. |
Argentina | 87.42 | % | 12.58 | % | 100.00 | % | 100.00 | % | 100.00 | % | FINANCIAL SERVICES | ||||||||||||
| Isban Brasil S.A. |
Brazil | 0.00 | % | 100.00 | % | 100.00 | % | 100.00 | % | 100.00 | % | SERVICES | ||||||||||||
| Isban Chile S.A. |
Chile | 0.00 | % | 100.00 | % | 100.00 | % | 100.00 | % | 100.00 | % | IT SERVICES | ||||||||||||
| Isban DE GmbH |
Germany | 0.00 | % | 100.00 | % | 100.00 | % | 100.00 | % | 100.00 | % | IT SERVICES | ||||||||||||
| Isban México, S.A. de C.V. |
Mexico | 0.00 | % | 100.00 | % | 100.00 | % | 100.00 | % | 100.00 | % | IT SERVICES | ||||||||||||
| Isban U.K., Ltd. |
United Kingdom | 0.00 | % | 100.00 | % | 100.00 | % | 100.00 | % | 100.00 | % | IT SERVICES | ||||||||||||
| Kassadesign 2005, S.L. |
Spain | 0.00 | % | 100.00 | % | 100.00 | % | 50.00 | % | 50.00 | % | PROPERTY | ||||||||||||
| Kelmarsh Wind Farm Limited |
United Kingdom | 0.00 | % | 100.00 | % | 100.00 | % | — | — | ELECTRICITY PRODUCTION | ||||||||||||||
| Konecta Activos Inmobiliarios, S.L. |
Spain | 0.00 | % | 49.34 | % | 52.80 | % | 52.80 | % | 52.80 | % | PROPERTY | ||||||||||||
| Konecta Brazil Outsourcing, Ltda. |
Brazil | 0.00 | % | 51.85 | % | 99.99 | % | 99.99 | % | 99.99 | % | SERVICES | ||||||||||||
F-315
Table of Contents
| % of ownership held by the Bank |
% of voting power (c) | |||||||||||||||||||||||
| Company |
Location |
Direct | Indirect | 2014 | 2013 | 2012 | Line of business | |||||||||||||||||
| Konecta Broker, S.L. |
Spain | 0.00 | % | 51.86 | % | 100.00 | % | 100.00 | % | 100.00 | % | SERVICES | ||||||||||||
| Konecta Bto, S.L. |
Spain | 0.00 | % | 51.86 | % | 100.00 | % | 100.00 | % | 100.00 | % | TELECOMMUNICATIONS | ||||||||||||
| Konecta Chile Limitada |
Chile | 0.00 | % | 51.86 | % | 100.00 | % | 100.00 | % | 100.00 | % | SERVICES | ||||||||||||
| Konecta Colombia Grupo Konecta Colombia Ltda |
Colombia | 0.00 | % | 51.86 | % | 100.00 | % | 100.00 | % | 100.00 | % | TELEMARKETING | ||||||||||||
| Konecta Field Marketing, S.A. |
Spain | 0.00 | % | 51.86 | % | 100.00 | % | 100.00 | % | 100.00 | % | MARKETING | ||||||||||||
| Konecta Gestión Integral de Procesos, S.L. |
Spain | 0.00 | % | 51.86 | % | 100.00 | % | 100.00 | % | 100.00 | % | SERVICES | ||||||||||||
| Konecta Portugal, Lda. |
Portugal | 0.00 | % | 51.86 | % | 100.00 | % | 100.00 | % | 100.00 | % | MARKETING | ||||||||||||
| Konecta Servicios Administrativos y Tecnológicos, S.L. |
Spain | 0.00 | % | 51.86 | % | 100.00 | % | 100.00 | % | 100.00 | % | SERVICES | ||||||||||||
| Konecta Servicios de BPO, S.L. |
Spain | 0.00 | % | 51.86 | % | 100.00 | % | 100.00 | % | 99.97 | % | SERVICES | ||||||||||||
| Konecta Soluciones Globales, S.L. |
Spain | 0.00 | % | 51.86 | % | 100.00 | % | 100.00 | % | 100.00 | % | SERVICES | ||||||||||||
| Konectanet Andalucía, S.L. |
Spain | 0.00 | % | 51.86 | % | 100.00 | % | 100.00 | % | 100.00 | % | SERVICES | ||||||||||||
| Konectanet Comercialización, S.L. |
Spain | 0.00 | % | 51.86 | % | 100.00 | % | 100.00 | % | 100.00 | % | MARKETING | ||||||||||||
| Kontacta Comunicaciones, S.A. |
Spain | 0.00 | % | 51.86 | % | 100.00 | % | 99.27 | % | 75.00 | % | SERVICES | ||||||||||||
| La Unión Resinera Española, S.A. |
Spain | 76.79 | % | 19.55 | % | 96.35 | % | 96.35 | % | 96.44 | % | CHEMICALS | ||||||||||||
| La Vital Centro Comercial y de Ocio, S.L. |
Spain | 0.00 | % | 55.89 | % | 100.00 | % | — | — | SHOPPING CENTRE | ||||||||||||||
| Langton Funding (No.1) Limited |
United Kingdom | 0.00 | % | 100.00 | % | 100.00 | % | 100.00 | % | 100.00 | % | SECURITIZATION | ||||||||||||
| Langton Mortgages Trustee (UK) Limited |
United Kingdom | 0.00 | % | 100.00 | % | 100.00 | % | — | — | SECURITIZATION | ||||||||||||||
| Langton Mortgages Trustee Limited |
Jersey | — | (a) | — | — | — | SECURITIZATION | |||||||||||||||||
| Langton PECOH Limited |
United Kingdom | — | (a) | — | — | — | SECURITIZATION | |||||||||||||||||
| Langton Securities (2008-1) plc |
United Kingdom | 0.00 | % | 100.00 | % | 100.00 | % | 100.00 | % | 100.00 | % | SECURITIZATION | ||||||||||||
| Langton Securities (2010-1) PLC |
United Kingdom | 0.00 | % | 100.00 | % | 100.00 | % | 100.00 | % | 100.00 | % | SECURITIZATION | ||||||||||||
| Langton Securities (2010-2) PLC |
United Kingdom | 0.00 | % | 100.00 | % | 100.00 | % | 100.00 | % | 100.00 | % | SECURITIZATION | ||||||||||||
| Langton Securities (2012-1) PLC |
United Kingdom | 0.00 | % | 100.00 | % | 100.00 | % | 100.00 | % | 100.00 | % | SECURITIZATION | ||||||||||||
| Langton Securities Holdings Limited |
United Kingdom | — | (a) | — | — | — | SECURITIZATION | |||||||||||||||||
| Laparanza, S.A. |
Spain | 61.59 | % | 0.00 | % | 61.59 | % | 61.59 | % | 61.59 | % | AGRICULTURE AND LIVESTOCK | ||||||||||||
| Larix Chile Inversiones Limitada |
Chile | 0.00 | % | 100.00 | % | 100.00 | % | 100.00 | % | 100.00 | % | FINANCE | ||||||||||||
| Lease Totta No. 1 FTC |
Portugal | — | (a) | — | — | — | SECURITIZATION | |||||||||||||||||
F-316
Table of Contents
| % of ownership held by the Bank |
% of voting power (c) | |||||||||||||||||||||||
| Company |
Location |
Direct | Indirect | 2014 | 2013 | 2012 | Line of business | |||||||||||||||||
| Leasetotta No. 1 Limited |
Ireland | — | (a) | — | — | — | SECURITIZATION | |||||||||||||||||
| Liquidity Import Finance Limited (b) |
United Kingdom | 0.00 | % | 100.00 | % | 100.00 | % | 100.00 | % | 100.00 | % | FACTORING | ||||||||||||
| Liquidity Limited |
United Kingdom | 0.00 | % | 100.00 | % | 100.00 | % | 100.00 | % | 100.00 | % | FACTORING | ||||||||||||
| Lizar Sp. z o.o. |
Poland | 0.00 | % | 69.41 | % | 100.00 | % | 100.00 | % | — | LEASING | |||||||||||||
| Luri 1, S.A. (d) |
Spain | 5.80 | % | 0.00 | % | 100.00 | % | 100.00 | % | 100.00 | % | PROPERTY | ||||||||||||
| Luri 2, S.A. (d) |
Spain | 10.00 | % | 0.00 | % | 100.00 | % | 100.00 | % | 100.00 | % | PROPERTY | ||||||||||||
| Luri 4, S.A. Sole-Shareholder Company |
Spain | 100.00 | % | 0.00 | % | 100.00 | % | 100.00 | % | 100.00 | % | PROPERTY | ||||||||||||
| Luri 6, S.A., S.I.I. |
Spain | 100.00 | % | 0.00 | % | 100.00 | % | 99.65 | % | 98.73 | % | REAL ESTATE INVESTMENT | ||||||||||||
| Luri Land, S.A. (d) |
Belgium | 0.00 | % | 8.11 | % | 100.00 | % | 100.00 | % | 100.00 | % | PROPERTY | ||||||||||||
| MAC No. 1 Limited |
United Kingdom | — | (a) | — | — | — | MORTGAGE LOAN COMPANY | |||||||||||||||||
| Mantiq Investimentos Ltda. |
Brazil | 0.00 | % | 89.02 | % | 100.00 | % | 100.00 | % | 100.00 | % | SECURITIES COMPANY | ||||||||||||
| Master Red Europa, S.L. |
Spain | 68.80 | % | 0.00 | % | 68.80 | % | 68.80 | % | — | CARDS | |||||||||||||
| Mata Alta, S.L. |
Spain | 0.00 | % | 61.59 | % | 100.00 | % | 100.00 | % | 100.00 | % | PROPERTY | ||||||||||||
| Med 2001 Inversiones, SICAV, S.A. |
Spain | 39.99 | % | 60.01 | % | 100.00 | % | 99.99 | % | — | OPEN-END INVESTMENT COMPANY | |||||||||||||
| Merciver, S.L. |
Spain | 99.90 | % | 0.10 | % | 100.00 | % | 100.00 | % | 100.00 | % | FINANCIAL ADVISORY | ||||||||||||
| Merlion Aviation One Limited |
Ireland | — | (a) | — | — | — | FULL-SERVICE LEASING | |||||||||||||||||
| Metroparque, S.A. |
Spain | 0.00 | % | 55.89 | % | 100.00 | % | — | — | SHOPPING CENTRE | ||||||||||||||
| Metropolitana Castellana, S.L. |
Spain | 0.00 | % | 55.89 | % | 100.00 | % | — | — | PROPERTY MANAGEMENT | ||||||||||||||
| Metrovacesa Access Tower GmbH |
Germany | 0.00 | % | 55.89 | % | 100.00 | % | — | — | PROPERTY MANAGEMENT | ||||||||||||||
| Metrovacesa Alquileres Urbanos, S.L. Sole-Shareholder Company |
Spain | 0.00 | % | 55.89 | % | 100.00 | % | — | — | PROPERTY | ||||||||||||||
| Metrovacesa France, S.A.S. |
France | 0.00 | % | 55.89 | % | 100.00 | % | — | — | PROPERTY | ||||||||||||||
| Metrovacesa Inmuebles y Promociones, S.L. |
Spain | 0.00 | % | 55.89 | % | 100.00 | % | — | — | PROPERTY | ||||||||||||||
| Metrovacesa Mediterranée, S.A.S. |
France | 0.00 | % | 55.89 | % | 100.00 | % | — | — | PROPERTY | ||||||||||||||
| Metrovacesa, S.A. |
Spain | 55.89 | % | 0.00 | % | 55.89 | % | 36.82 | % | 34.87 | % | PROPERTY | ||||||||||||
| Middlewick Wind Farm Holdings Limited |
United Kingdom | 0.00 | % | 100.00 | % | 100.00 | % | 100.00 | % | — | ELECTRICITY PRODUCTION | |||||||||||||
| Middlewick Wind Farm Limited |
United Kingdom | 0.00 | % | 100.00 | % | 100.00 | % | 100.00 | % | — | ELECTRICITY PRODUCTION | |||||||||||||
| Motor 2011 Holdings Limited (b) |
United Kingdom | — | (a) | — | — | — | SECURITIZATION | |||||||||||||||||
F-317
Table of Contents
| % of ownership held by the Bank |
% of voting power (c) | |||||||||||||||||||||||
| Company |
Location |
Direct | Indirect | 2014 | 2013 | 2012 | Line of business | |||||||||||||||||
| Motor 2011 PLC (b) |
United Kingdom | 0.00 | % | 100.00 | % | 100.00 | % | 100.00 | % | 100.00 | % | SECURITIZATION | ||||||||||||
| Motor 2012 Holdings Limited |
United Kingdom | — | (a) | — | — | — | SECURITIZATION | |||||||||||||||||
| Motor 2012 PLC |
United Kingdom | 0.00 | % | 100.00 | % | 100.00 | % | 100.00 | % | 100.00 | % | SECURITIZATION | ||||||||||||
| Motor 2013-1 Holdings Limited |
United Kingdom | — | (a) | — | — | — | SECURITIZATION | |||||||||||||||||
| Motor 2013-1 PLC |
United Kingdom | 0.00 | % | 100.00 | % | 100.00 | % | 100.00 | % | — | SECURITIZATION | |||||||||||||
| Motor 2014-1 Holdings Limited |
United Kingdom | — | (a) | — | — | — | SECURITIZATION | |||||||||||||||||
| Motor 2014-1 PLC |
United Kingdom | 0.00 | % | 100.00 | % | 100.00 | % | — | — | SECURITIZATION | ||||||||||||||
| Multinegocios S.A. |
Chile | 0.00 | % | 99.54 | % | 100.00 | % | 100.00 | % | 100.00 | % | ADVISORY SERVICES | ||||||||||||
| Multiservicios de Negocios Limitada |
Chile | 0.00 | % | 100.00 | % | 100.00 | % | 100.00 | % | 100.00 | % | FINANCIAL SERVICES | ||||||||||||
| Natixis Corporate Financement – Compartment Hexagone |
France | 100.00 | % | 0.00 | % | 100.00 | % | 100.00 | % | — | INVESTMENT FUND | |||||||||||||
| Naviera Mirambel, S.L. |
Spain | 0.00 | % | 100.00 | % | 100.00 | % | 100.00 | % | 100.00 | % | FINANCE | ||||||||||||
| Naviera Trans Gas, A.I.E. |
Spain | 99.99 | % | 0.01 | % | 100.00 | % | 100.00 | % | 100.00 | % | FULL-SERVICE LEASING | ||||||||||||
| Naviera Trans Iron, S.L. |
Spain | 100.00 | % | 0.00 | % | 100.00 | % | — | — | LEASING | ||||||||||||||
| Naviera Trans Ore, A.I.E. |
Spain | 99.99 | % | 0.01 | % | 100.00 | % | 100.00 | % | 100.00 | % | FULL-SERVICE LEASING | ||||||||||||
| Naviera Trans Wind, S.L. |
Spain | 99.99 | % | 0.01 | % | 100.00 | % | 100.00 | % | 100.00 | % | FULL-SERVICE LEASING | ||||||||||||
| Nebraska Wind I LLC |
United States | 0.00 | % | 100.00 | % | 100.00 | % | 100.00 | % | 100.00 | % | HOLDING COMPANY | ||||||||||||
| Norbest AS |
Norway | 7.94 | % | 92.06 | % | 100.00 | % | 100.00 | % | 100.00 | % | SECURITIES INVESTMENT | ||||||||||||
| Novimovest – Fundo de Investimento Imobiliário |
Portugal | 0.00 | % | 77.11 | % | 77.26 | % | 71.60 | % | — | INVESTMENT FUND | |||||||||||||
| NW Services CO. |
United States | 0.00 | % | 100.00 | % | 100.00 | % | 100.00 | % | 100.00 | % | E-COMMERCE | ||||||||||||
| Oildor, S.A. |
Spain | 100.00 | % | 0.00 | % | 100.00 | % | 100.00 | % | 99.99 | % | FINANCE | ||||||||||||
| Open Bank, S.A. |
Spain | 100.00 | % | 0.00 | % | 100.00 | % | 100.00 | % | 100.00 | % | BANKING | ||||||||||||
| Optimal Alternative Investments, S.G.I.I.C., S.A. |
Spain | 0.00 | % | 100.00 | % | 100.00 | % | 100.00 | % | 100.00 | % | FUND MANAGEMENT COMPANY | ||||||||||||
| Optimal Investment Services SA |
Switzerland | 0.00 | % | 100.00 | % | 100.00 | % | 100.00 | % | 100.00 | % | FUND MANAGEMENT COMPANY | ||||||||||||
| Optimal Multiadvisors Ireland Plc / Optimal Strategic US Equity Ireland Euro Fund |
Ireland | 0.00 | % | 54.18 | % | 51.25 | % | 51.25 | % | 51.09 | % | FUND MANAGEMENT COMPANY | ||||||||||||
| Optimal Multiadvisors Ireland Plc / Optimal Strategic US Equity Ireland US Dollar Fund |
Ireland | 0.00 | % | 44.14 | % | 51.62 | % | 51.26 | % | 54.47 | % | FUND MANAGEMENT COMPANY | ||||||||||||
F-318
Table of Contents
| % of ownership held by the Bank |
% of voting power (c) | |||||||||||||||||||||||
| Company |
Location |
Direct | Indirect | 2014 | 2013 | 2012 | Line of business | |||||||||||||||||
| Optimal Multiadvisors Ltd / Optimal Strategic US Equity Series (consolidated) |
Bahamas | 0.00 | % | 54.35 | % | 54.89 | % | 54.10 | % | 63.79 | % | FUND MANAGEMENT COMPANY | ||||||||||||
| Parasant SA |
Switzerland | 100.00 | % | 0.00 | % | 100.00 | % | 100.00 | % | 100.00 | % | HOLDING COMPANY | ||||||||||||
| Parque Eólico el Mezquite, S.A.P.I. de C.V. |
Mexico | 0.00 | % | 82.15 | % | 82.15 | % | 41.07 | % | 50.00 | % | ELECTRICITY PRODUCTION | ||||||||||||
| Parque Eólico la Carabina I, S.A.P.I. de C.V. |
Mexico | 0.00 | % | 82.15 | % | 82.15 | % | 41.07 | % | 50.00 | % | ELECTRICITY PRODUCTION | ||||||||||||
| Parque Eólico la Carabina II, S.A.P.I. de C.V. |
Mexico | 0.00 | % | 82.15 | % | 82.15 | % | 41.07 | % | 50.00 | % | ELECTRICITY PRODUCTION | ||||||||||||
| Paseo Comercial Carlos III, S.A. |
Spain | 0.00 | % | 27.94 | % | 50.00 | % | — | — | SHOPPING CENTRE | ||||||||||||||
| PBE Companies, LLC |
United States | 0.00 | % | 100.00 | % | 100.00 | % | 100.00 | % | 100.00 | % | PROPERTY | ||||||||||||
| PECOH Limited |
United Kingdom | 0.00 | % | 100.00 | % | 100.00 | % | — | — | SECURITIZATION | ||||||||||||||
| Penmanshiel Energy Limited |
United Kingdom | 0.00 | % | 100.00 | % | 100.00 | % | — | — | ELECTRICITY PRODUCTION | ||||||||||||||
| Pentapolitano, S.A. |
Spain | 0.00 | % | 55.89 | % | 100.00 | % | — | — | PROPERTY | ||||||||||||||
| Pereda Gestión, S.A. |
Spain | 99.99 | % | 0.01 | % | 100.00 | % | 100.00 | % | 100.00 | % | HOLDING COMPANY | ||||||||||||
| Phoenix C1 Aviation Limited |
Ireland | — | (a) | — | — | — | FULL-SERVICE LEASING | |||||||||||||||||
| Pingham International, S.A. |
Uruguay | 0.00 | % | 100.00 | % | 100.00 | % | 100.00 | % | 100.00 | % | SERVICES | ||||||||||||
| Portada S.A. in liquidation (b) |
Chile | 0.00 | % | 96.17 | % | 96.17 | % | 96.17 | % | 96.17 | % | FINANCE | ||||||||||||
| Portal Universia Argentina S.A. |
Argentina | 0.00 | % | 75.75 | % | 75.75 | % | 75.75 | % | 75.75 | % | INTERNET | ||||||||||||
| Portal Universia Portugal, Prestação de Serviços de Informática, S.A. |
Portugal | 0.00 | % | 100.00 | % | 100.00 | % | 100.00 | % | 100.00 | % | INTERNET | ||||||||||||
| Portal Universia, S.A. |
Spain | 0.00 | % | 88.07 | % | 88.07 | % | 56.56 | % | 56.56 | % | INTERNET | ||||||||||||
| Produban Servicios Informáticos Generales, S.L. |
Spain | 99.96 | % | 0.04 | % | 100.00 | % | 100.00 | % | 100.00 | % | SERVICES | ||||||||||||
| Produban Serviços de Informática S.A. |
Brazil | 0.00 | % | 100.00 | % | 100.00 | % | 100.00 | % | 100.00 | % | IT SERVICES | ||||||||||||
| Programa Multi Sponsor PMS, S.A. |
Spain | 50.00 | % | 50.00 | % | 100.00 | % | 100.00 | % | 100.00 | % | ADVERTISING | ||||||||||||
| Project Maple I B.V. |
The Netherlands | 0.00 | % | 55.89 | % | 100.00 | % | — | — | SECURITIES INVESTMENT | ||||||||||||||
| Promociones Vallebramen, S.L. |
Spain | 0.00 | % | 55.89 | % | 100.00 | % | — | — | PROPERTY | ||||||||||||||
| Promociones y Servicios Monterrey, S.A. de C.V. |
Mexico | 0.00 | % | 100.00 | % | 100.00 | % | 100.00 | % | 100.00 | % | PROPERTY | ||||||||||||
| Promociones y Servicios Santiago, S.A. de C.V. |
Mexico | 0.00 | % | 100.00 | % | 100.00 | % | 100.00 | % | 100.00 | % | PROPERTY | ||||||||||||
| Promodomus Desarrollo de Activos, S.L. |
Spain | 0.00 | % | 100.00 | % | 100.00 | % | 51.00 | % | 51.00 | % | PROPERTY | ||||||||||||
| Proyecto Huajache SpA |
Chile | 0.00 | % | 80.00 | % | 80.00 | % | — | — | ELECTRICITY PRODUCTION | ||||||||||||||
F-319
Table of Contents
| % of ownership held by the Bank |
% of voting power (c) | |||||||||||||||||||||||
| Company |
Location |
Direct | Indirect | 2014 | 2013 | 2012 | Line of business | |||||||||||||||||
| Proyecto Raki SpA |
Chile | 0.00 | % | 80.00 | % | 80.00 | % | — | — | ELECTRICITY PRODUCTION | ||||||||||||||
| PSA Italia S.p.A. |
Italy | 0.00 | % | 50.00 | % | 50.00 | % | — | — | SECURITIZATION | ||||||||||||||
| Punta Lima, LLC |
United States | 0.00 | % | 100.00 | % | 100.00 | % | 100.00 | % | — | LEASING | |||||||||||||
| Puntoform, S.L. |
Spain | 0.00 | % | 51.86 | % | 100.00 | % | 100.00 | % | 100.00 | % | TRAINING | ||||||||||||
| REB Empreendimentos e Administradora de Bens S.A. |
Brazil | 0.00 | % | 100.00 | % | 100.00 | % | 100.00 | % | 100.00 | % | HOLDING COMPANY | ||||||||||||
| Reintegra, S.A. |
Spain | 55.00 | % | 45.00 | % | 100.00 | % | 100.00 | % | 100.00 | % | SERVICES | ||||||||||||
| Reliz Sp. z o.o. w upadłości likwidacyjnej (b) |
Poland | 0.00 | % | 69.41 | % | 100.00 | % | 100.00 | % | — | FULL-SERVICE LEASING | |||||||||||||
| Retail Financial Services Limited (b) |
United Kingdom | 0.00 | % | 100.00 | % | 100.00 | % | 100.00 | % | 100.00 | % | FINANCE | ||||||||||||
| Riobank International (Uruguay) SAIFE (b) |
Uruguay | 0.00 | % | 100.00 | % | 100.00 | % | 100.00 | % | 100.00 | % | BANKING | ||||||||||||
| Rosenlease, S.L. |
Spain | 99.99 | % | 0.01 | % | 100.00 | % | 100.00 | % | 99.99 | % | FULL-SERVICE LEASING | ||||||||||||
| Rosteral, SICAV, S.A. |
Spain | 99.85 | % | 0.13 | % | 99.98 | % | 99.98 | % | — | OPEN-END INVESTMENT COMPANY | |||||||||||||
| Ruevilliot 26, S.L. |
Spain | 70.00 | % | 0.00 | % | 70.00 | % | 70.00 | % | 70.00 | % | PROPERTY | ||||||||||||
| Sadorma 2003, S.L. |
Spain | 0.00 | % | 55.89 | % | 100.00 | % | — | — | HOTEL OPERATIONS | ||||||||||||||
| Saja Eca Limited |
Ireland | — | (a) | — | — | — | FINANCE | |||||||||||||||||
| SAM UK Investment Holdings Limited |
United Kingdom | 77.67 | % | 22.33 | % | 100.00 | % | 100.00 | % | — | HOLDING COMPANY | |||||||||||||
| Sancap Investimentos e Participações S.A. |
Brazil | 0.00 | % | 89.02 | % | 100.00 | % | 100.00 | % | 100.00 | % | HOLDING COMPANY | ||||||||||||
| Saninv - Gestão e Investimentos, Sociedade Unipessoal, S.A. |
Portugal | 0.00 | % | 100.00 | % | 100.00 | % | 100.00 | % | 100.00 | % | HOLDING COMPANY | ||||||||||||
| Sansol S.r.l. |
Italy | 0.00 | % | 100.00 | % | 100.00 | % | 100.00 | % | 100.00 | % | HOLDING COMPANY | ||||||||||||
| Santander (CF Trustee Property Nominee) Limited |
United Kingdom | 0.00 | % | 100.00 | % | 100.00 | % | 100.00 | % | 100.00 | % | SERVICES | ||||||||||||
| Santander (CF Trustee) Limited |
United Kingdom | 0.00 | % | 100.00 | % | 100.00 | % | 100.00 | % | 100.00 | % | ASSET MANAGEMENT COMPANY | ||||||||||||
| Santander (UK) Group Pension Schemes Trustees Limited |
United Kingdom | 0.00 | % | 100.00 | % | 100.00 | % | 100.00 | % | 100.00 | % | ASSET MANAGEMENT COMPANY | ||||||||||||
| Santander Agente de Valores Limitada |
Chile | 0.00 | % | 67.33 | % | 100.00 | % | 100.00 | % | 100.00 | % | SECURITIES COMPANY | ||||||||||||
| Santander Ahorro Inmobiliario 2 S.I.I., S.A. |
Spain | 85.50 | % | 0.01 | % | 85.51 | % | 85.51 | % | 78.06 | % | REAL ESTATE INVESTMENT | ||||||||||||
| Santander AM Holding, S.L. |
Spain | 100.00 | % | 0.00 | % | 100.00 | % | 100.00 | % | 100.00 | % | HOLDING COMPANY | ||||||||||||
| Santander Asset Finance (December) Limited |
United Kingdom | 0.00 | % | 100.00 | % | 100.00 | % | 100.00 | % | 100.00 | % | LEASING | ||||||||||||
| Santander Asset Finance plc |
United Kingdom | 0.00 | % | 100.00 | % | 100.00 | % | 100.00 | % | 100.00 | % | LEASING | ||||||||||||
F-320
Table of Contents
| % of ownership held by the Bank |
% of voting power (c) | |||||||||||||||||||||||
| Company |
Location |
Direct | Indirect | 2014 | 2013 | 2012 | Line of business | |||||||||||||||||
| Santander Asset Management - Sociedade Gestora de Fundos de Investimento Mobiliário, S.A. |
Portugal | 0.00 | % | 100.00 | % | 100.00 | % | 100.00 | % | 100.00 | % | FUND MANAGEMENT COMPANY | ||||||||||||
| Santander Asset Management Chile S.A. |
Chile | 0.01 | % | 99.83 | % | 100.00 | % | 100.00 | % | 100.00 | % | SECURITIES INVESTMENT | ||||||||||||
| Santander Back-Offices Globales Especializados, S.A. |
Spain | 99.99 | % | 0.01 | % | 100.00 | % | 100.00 | % | 100.00 | % | SERVICES | ||||||||||||
| Santander Back-Offices Globales Mayoristas, S.A. |
Spain | 100.00 | % | 0.00 | % | 100.00 | % | 100.00 | % | 100.00 | % | SERVICES | ||||||||||||
| Santander Banca de Inversión Colombia, S.A.S. |
Colombia | 0.00 | % | 100.00 | % | 100.00 | % | 100.00 | % | — | FINANCIAL SERVICES | |||||||||||||
| Santander BanCorp |
Puerto Rico | 0.00 | % | 100.00 | % | 100.00 | % | 100.00 | % | 100.00 | % | HOLDING COMPANY | ||||||||||||
| Santander Bank & Trust Ltd. |
Bahamas | 0.00 | % | 100.00 | % | 100.00 | % | 100.00 | % | 100.00 | % | BANKING | ||||||||||||
| Santander Bank, National Association |
United States | 0.00 | % | 100.00 | % | 100.00 | % | 100.00 | % | 100.00 | % | BANKING | ||||||||||||
| Santander Benelux, S.A./N.V. |
Belgium | 100.00 | % | 0.00 | % | 100.00 | % | 100.00 | % | 100.00 | % | BANKING | ||||||||||||
| Santander Brasil Administradora de Consórcio Ltda. |
Brazil | 0.00 | % | 89.02 | % | 100.00 | % | 100.00 | % | 100.00 | % | SERVICES | ||||||||||||
| Santander Brasil Advisory Services S.A. |
Brazil | 0.00 | % | 85.93 | % | 96.52 | % | 96.52 | % | 96.52 | % | CONSULTANCY SERVICES | ||||||||||||
| Santander Brasil, EFC, S.A. |
Spain | 0.00 | % | 89.02 | % | 100.00 | % | 100.00 | % | 100.00 | % | FINANCE | ||||||||||||
| Santander Capital Desarrollo, SGECR, S.A. |
Spain | 100.00 | % | 0.00 | % | 100.00 | % | 100.00 | % | 100.00 | % | VENTURE CAPITAL COMPANY | ||||||||||||
| Santander Capital Structuring, S.A. de C.V. |
Mexico | 0.00 | % | 100.00 | % | 100.00 | % | 100.00 | % | 100.00 | % | COMMERCE | ||||||||||||
| Santander Capitalização S.A. |
Brazil | 0.00 | % | 89.02 | % | 100.00 | % | 100.00 | % | 100.00 | % | INSURANCE | ||||||||||||
| Santander Carbón Finance, S.A. |
Spain | 99.98 | % | 0.02 | % | 100.00 | % | 100.00 | % | 100.00 | % | SECURITIES INVESTMENT | ||||||||||||
| Santander Cards Ireland Limited |
Ireland | 0.00 | % | 100.00 | % | 100.00 | % | 100.00 | % | 100.00 | % | CARDS | ||||||||||||
| Santander Cards Limited |
United Kingdom | 0.00 | % | 100.00 | % | 100.00 | % | 100.00 | % | 100.00 | % | CARDS | ||||||||||||
| Santander Cards UK Limited |
United Kingdom | 0.00 | % | 100.00 | % | 100.00 | % | 100.00 | % | 100.00 | % | FINANCE | ||||||||||||
| Santander Carteras, S.G.C., S.A. |
Spain | 100.00 | % | 0.00 | % | 100.00 | % | 100.00 | % | 100.00 | % | FUND MANAGEMENT COMPANY | ||||||||||||
| Santander Central Hispano Financial Services Limited (b) |
Cayman Islands | 100.00 | % | 0.00 | % | 100.00 | % | 100.00 | % | 100.00 | % | FINANCE | ||||||||||||
| Santander Central Hispano Issuances Limited |
Cayman Islands | 100.00 | % | 0.00 | % | 100.00 | % | 100.00 | % | 100.00 | % | FINANCE | ||||||||||||
| Santander Chile Holding S.A. |
Chile | 22.11 | % | 77.43 | % | 99.54 | % | 99.54 | % | 99.54 | % | HOLDING COMPANY | ||||||||||||
| Santander Commercial Paper, S.A. Sole-Shareholder Company |
Spain | 100.00 | % | 0.00 | % | 100.00 | % | 100.00 | % | 100.00 | % | FINANCE | ||||||||||||
| Santander Consulting (Beijing) Co., Ltd. |
China | 0.00 | % | 100.00 | % | 100.00 | % | 100.00 | % | 100.00 | % | ADVISORY SERVICES | ||||||||||||
| Santander Consumer (UK) plc |
United Kingdom | 0.00 | % | 100.00 | % | 100.00 | % | 100.00 | % | 100.00 | % | FINANCE | ||||||||||||
F-321
Table of Contents
| % of ownership held by the Bank |
% of voting power (c) | |||||||||||||||||||||||
| Company |
Location |
Direct | Indirect | 2014 | 2013 | 2012 | Line of business | |||||||||||||||||
| Santander Consumer ABS Funding 1 LLC |
United States | 0.00 | % | 60.46 | % | 100.00 | % | — | — | FINANCE | ||||||||||||||
| Santander Consumer ABS Funding 2 LLC |
United States | 0.00 | % | 60.46 | % | 100.00 | % | — | — | FINANCE | ||||||||||||||
| Santander Consumer Auto Receivables Funding 2011-A LLC |
United States | 0.00 | % | 60.46 | % | 100.00 | % | — | — | FINANCE | ||||||||||||||
| Santander Consumer Auto Receivables Funding 2013-B1 LLC |
United States | 0.00 | % | 60.46 | % | 100.00 | % | — | — | FINANCE | ||||||||||||||
| Santander Consumer Auto Receivables Funding 2013-B2 LLC |
United States | 0.00 | % | 60.46 | % | 100.00 | % | — | — | FINANCE | ||||||||||||||
| Santander Consumer Auto Receivables Funding 2013-B3 LLC |
United States | 0.00 | % | 60.46 | % | 100.00 | % | — | — | FINANCE | ||||||||||||||
| Santander Consumer Auto Receivables Funding 2013-L1 LLC |
United States | 0.00 | % | 60.46 | % | 100.00 | % | — | — | FINANCE | ||||||||||||||
| Santander Consumer Auto Receivables Funding 2014-B1 LLC |
United States | 0.00 | % | 60.46 | % | 100.00 | % | — | — | FINANCE | ||||||||||||||
| Santander Consumer Auto Receivables Funding 2014-B2 LLC |
United States | 0.00 | % | 60.46 | % | 100.00 | % | — | — | FINANCE | ||||||||||||||
| Santander Consumer Auto Receivables Funding 2014-B3 LLC |
United States | 0.00 | % | 60.46 | % | 100.00 | % | — | — | FINANCE | ||||||||||||||
| Santander Consumer Auto Receivables Funding 2014-B4 LLC |
United States | 0.00 | % | 60.46 | % | 100.00 | % | — | — | FINANCE | ||||||||||||||
| Santander Consumer Auto Receivables Funding 2014-B5 LLC |
United States | 0.00 | % | 60.46 | % | 100.00 | % | — | — | FINANCE | ||||||||||||||
| Santander Consumer Auto Receivables Funding 2014-B6 LLC |
United States | 0.00 | % | 60.46 | % | 100.00 | % | — | — | INACTIVE | ||||||||||||||
| Santander Consumer Auto Receivables Funding 2014-L1 LLC |
United States | 0.00 | % | 60.46 | % | 100.00 | % | — | — | FINANCE | ||||||||||||||
| Santander Consumer Bank AB |
Sweden | 0.00 | % | 100.00 | % | 100.00 | % | — | — | BANKING | ||||||||||||||
| Santander Consumer Bank AG |
Germany | 0.00 | % | 100.00 | % | 100.00 | % | 100.00 | % | 100.00 | % | BANKING | ||||||||||||
| Santander Consumer Bank AS |
Norway | 0.00 | % | 100.00 | % | 100.00 | % | 100.00 | % | 100.00 | % | FINANCE | ||||||||||||
| Santander Consumer Bank GmbH |
Austria | 0.00 | % | 100.00 | % | 100.00 | % | 100.00 | % | 100.00 | % | BANKING | ||||||||||||
| Santander Consumer Bank S.A. |
Poland | 0.00 | % | 81.65 | % | 100.00 | % | 100.00 | % | 70.00 | % | BANKING | ||||||||||||
| Santander Consumer Bank S.p.A. |
Italy | 0.00 | % | 100.00 | % | 100.00 | % | 100.00 | % | 100.00 | % | BANKING | ||||||||||||
| Santander Consumer Beteiligungsverwaltungsgesellschaft mbH |
Germany | 0.00 | % | 100.00 | % | 100.00 | % | 100.00 | % | 100.00 | % | HOLDING COMPANY | ||||||||||||
| Santander Consumer Captive Auto Funding 5 LLC |
United States | 0.00 | % | 60.46 | % | 100.00 | % | — | — | FINANCE | ||||||||||||||
F-322
Table of Contents
| % of ownership held by the Bank |
% of voting power (c) | |||||||||||||||||||||||
| Company |
Location |
Direct | Indirect | 2014 | 2013 | 2012 | Line of business | |||||||||||||||||
| Santander Consumer Captive Auto Funding LLC |
United States | 0.00 | % | 60.46 | % | 100.00 | % | — | — | FINANCE | ||||||||||||||
| Santander Consumer Chile S.A. |
Chile | 51.00 | % | 0.00 | % | 51.00 | % | 51.00 | % | 51.00 | % | FINANCE | ||||||||||||
| Santander Consumer Credit Funding 2 LLC |
United States | 0.00 | % | 60.46 | % | 100.00 | % | — | — | FINANCE | ||||||||||||||
| Santander Consumer Credit Funding I LLC |
United States | 0.00 | % | 60.46 | % | 100.00 | % | — | — | FINANCE | ||||||||||||||
| Santander Consumer Credit Services Limited |
United Kingdom | 0.00 | % | 100.00 | % | 100.00 | % | 100.00 | % | 100.00 | % | FINANCE | ||||||||||||
| Santander Consumer Finance Benelux B.V. |
The Netherlands | 0.00 | % | 100.00 | % | 100.00 | % | 100.00 | % | 100.00 | % | FINANCE | ||||||||||||
| Santander Consumer Finance Media S.r.l. - in liquidazione (b) |
Italy | 0.00 | % | 65.00 | % | 65.00 | % | 65.00 | % | 65.00 | % | FINANCE | ||||||||||||
| Santander Consumer Finance Oy |
Finland | 0.00 | % | 100.00 | % | 100.00 | % | 100.00 | % | 100.00 | % | FINANCE | ||||||||||||
| Santander Consumer Finance Zrt. |
Hungary | 0.00 | % | 100.00 | % | 100.00 | % | 100.00 | % | 100.00 | % | FINANCE | ||||||||||||
| Santander Consumer Finance, S.A. |
Spain | 63.19 | % | 36.81 | % | 100.00 | % | 100.00 | % | 100.00 | % | BANKING | ||||||||||||
| Santander Consumer Finanse S.A. |
Poland | 0.00 | % | 81.65 | % | 100.00 | % | 100.00 | % | 70.00 | % | SERVICES | ||||||||||||
| Santander Consumer France S.A.S. |
France | 0.00 | % | 100.00 | % | 100.00 | % | — | — | HOLDING COMPANY | ||||||||||||||
| Santander Consumer Funding 3 LLC |
United States | 0.00 | % | 60.46 | % | 100.00 | % | — | — | FINANCE | ||||||||||||||
| Santander Consumer Funding 5 LLC |
United States | 0.00 | % | 60.46 | % | 100.00 | % | — | — | FINANCE | ||||||||||||||
| Santander Consumer Holding Austria GmbH |
Austria | 0.00 | % | 100.00 | % | 100.00 | % | 100.00 | % | 100.00 | % | HOLDING COMPANY | ||||||||||||
| Santander Consumer Holding GmbH |
Germany | 0.00 | % | 100.00 | % | 100.00 | % | 100.00 | % | 100.00 | % | HOLDING COMPANY | ||||||||||||
| Santander Consumer Leasing GmbH |
Germany | 0.00 | % | 100.00 | % | 100.00 | % | 100.00 | % | 100.00 | % | LEASING | ||||||||||||
| Santander Consumer Multirent Sp. z o.o. |
Poland | 0.00 | % | 81.65 | % | 100.00 | % | 100.00 | % | 100.00 | % | LEASING | ||||||||||||
| Santander Consumer Receivables 10 LLC |
United States | 0.00 | % | 60.46 | % | 100.00 | % | — | — | FINANCE | ||||||||||||||
| Santander Consumer Receivables 11 LLC |
United States | 0.00 | % | 60.46 | % | 100.00 | % | — | — | FINANCE | ||||||||||||||
| Santander Consumer Receivables 3 LLC |
United States | 0.00 | % | 60.46 | % | 100.00 | % | — | — | FINANCE | ||||||||||||||
| Santander Consumer Receivables 4 LLC |
United States | 0.00 | % | 60.46 | % | 100.00 | % | — | — | FINANCE | ||||||||||||||
| Santander Consumer Receivables 7 LLC |
United States | 0.00 | % | 60.46 | % | 100.00 | % | — | — | FINANCE | ||||||||||||||
| Santander Consumer Receivables 9 LLC |
United States | 0.00 | % | 60.46 | % | 100.00 | % | — | — | FINANCE | ||||||||||||||
| Santander Consumer Receivables Funding LLC |
United States | 0.00 | % | 60.46 | % | 100.00 | % | — | — | FINANCE | ||||||||||||||
| Santander Consumer Renting, S.L. |
Spain | 0.00 | % | 100.00 | % | 100.00 | % | 100.00 | % | 100.00 | % | FULL-SERVICE LEASING | ||||||||||||
| Santander Consumer Services GmbH |
Austria | 0.00 | % | 100.00 | % | 100.00 | % | 100.00 | % | 100.00 | % | SERVICES | ||||||||||||
F-323
Table of Contents
| % of ownership held by the Bank |
% of voting power (c) | |||||||||||||||||||||||
| Company |
Location |
Direct | Indirect | 2014 | 2013 | 2012 | Line of business | |||||||||||||||||
| Santander Consumer Unifin S.p.A. |
Italy | 0.00 | % | 100.00 | % | 100.00 | % | 100.00 | % | 100.00 | % | FINANCE | ||||||||||||
| Santander Consumer USA Holdings Inc. |
United States | 0.00 | % | 60.46 | % | 60.46 | % | 64.97 | % | 64.97 | % | HOLDING COMPANY | ||||||||||||
| Santander Consumer USA Inc. |
United States | 0.00 | % | 60.46 | % | 100.00 | % | — | — | FINANCE | ||||||||||||||
| Santander Consumer, EFC, S.A. |
Spain | 0.00 | % | 100.00 | % | 100.00 | % | 100.00 | % | 100.00 | % | FINANCE | ||||||||||||
| Santander Consumo Perú S.A. |
Peru | 55.00 | % | 0.00 | % | 55.00 | % | 55.00 | % | 55.00 | % | FINANCE | ||||||||||||
| Santander Consumo, S.A. de C.V., SOFOM, E.R. |
Mexico | 0.00 | % | 75.05 | % | 100.00 | % | 100.00 | % | 100.00 | % | CARDS | ||||||||||||
| Santander Corredora de Seguros Limitada |
Chile | 0.00 | % | 67.10 | % | 100.00 | % | 100.00 | % | 100.00 | % | INSURANCE BROKER | ||||||||||||
| Santander Corretora de Câmbio e Valores Mobiliários S.A. |
Brazil | 0.00 | % | 89.02 | % | 100.00 | % | 100.00 | % | 100.00 | % | SECURITIES COMPANY | ||||||||||||
| Santander de Titulización S.G.F.T., S.A. |
Spain | 81.00 | % | 19.00 | % | 100.00 | % | 100.00 | % | 100.00 | % | FUND MANAGEMENT COMPANY | ||||||||||||
| Santander Drive Auto Receivables LLC |
United States | 0.00 | % | 60.46 | % | 100.00 | % | — | — | FINANCE | ||||||||||||||
| Santander Drive Auto Receivables Trust 2010-3 |
United States | — | (a) | — | — | — | SECURITIZATION | |||||||||||||||||
| Santander Drive Auto Receivables Trust 2010-B |
United States | — | (a) | — | — | — | SECURITIZATION | |||||||||||||||||
| Santander Drive Auto Receivables Trust 2011-1 |
United States | — | (a) | — | — | — | SECURITIZATION | |||||||||||||||||
| Santander Drive Auto Receivables Trust 2011-2 |
United States | — | (a) | — | — | — | SECURITIZATION | |||||||||||||||||
| Santander Drive Auto Receivables Trust 2011-3 |
United States | — | (a) | — | — | — | SECURITIZATION | |||||||||||||||||
| Santander Drive Auto Receivables Trust 2011-4 |
United States | — | (a) | — | — | — | SECURITIZATION | |||||||||||||||||
| Santander Drive Auto Receivables Trust 2012-1 |
United States | — | (a) | — | — | — | SECURITIZATION | |||||||||||||||||
| Santander Drive Auto Receivables Trust 2012-2 |
United States | — | (a) | — | — | — | SECURITIZATION | |||||||||||||||||
| Santander Drive Auto Receivables Trust 2012-3 |
United States | — | (a) | — | — | — | SECURITIZATION | |||||||||||||||||
| Santander Drive Auto Receivables Trust 2012-4 |
United States | — | (a) | — | — | — | SECURITIZATION | |||||||||||||||||
| Santander Drive Auto Receivables Trust 2012-5 |
United States | — | (a) | — | — | — | SECURITIZATION | |||||||||||||||||
| Santander Drive Auto Receivables Trust 2012-6 |
United States | — | (a) | — | — | — | SECURITIZATION | |||||||||||||||||
| Santander Drive Auto Receivables Trust 2012-A |
United States | — | (a) | — | — | — | SECURITIZATION | |||||||||||||||||
| Santander Drive Auto Receivables Trust 2013-1 |
United States | — | (a) | — | — | — | SECURITIZATION | |||||||||||||||||
| Santander Drive Auto Receivables Trust 2013-2 |
United States | — | (a) | — | — | — | SECURITIZATION | |||||||||||||||||
| Santander Drive Auto Receivables Trust 2013-3 |
United States | — | (a) | — | — | — | SECURITIZATION | |||||||||||||||||
| Santander Drive Auto Receivables Trust 2013-4 |
United States | — | (a) | — | — | — | SECURITIZATION | |||||||||||||||||
F-324
Table of Contents
| % of ownership held by the Bank |
% of voting power (c) | |||||||||||||||||||||||
| Company |
Location |
Direct | Indirect | 2014 | 2013 | 2012 | Line of business | |||||||||||||||||
| Santander Drive Auto Receivables Trust 2013-5 |
United States | — | (a) | — | — | — | SECURITIZATION | |||||||||||||||||
| Santander Drive Auto Receivables Trust 2013-A |
United States | — | (a) | — | — | — | SECURITIZATION | |||||||||||||||||
| Santander Drive Auto Receivables Trust 2014-1 |
United States | — | (a) | — | — | — | SECURITIZATION | |||||||||||||||||
| Santander Drive Auto Receivables Trust 2014-2 |
United States | — | (a) | — | — | — | SECURITIZATION | |||||||||||||||||
| Santander Drive Auto Receivables Trust 2014-3 |
United States | — | (a) | — | — | — | SECURITIZATION | |||||||||||||||||
| Santander Drive Auto Receivables Trust 2014-4 |
United States | — | (a) | — | — | — | SECURITIZATION | |||||||||||||||||
| Santander Drive Auto Receivables Trust 2014-5 |
United States | — | (a) | — | — | — | SECURITIZATION | |||||||||||||||||
| Santander Drive Auto Receivables Trust 2014-S1 |
United States | — | (a) | — | — | — | SECURITIZATION | |||||||||||||||||
| Santander Drive Auto Receivables Trust 2014-S2 |
United States | — | (a) | — | — | — | SECURITIZATION | |||||||||||||||||
| Santander Drive Auto Receivables Trust 2014-S3 |
United States | — | (a) | — | — | — | SECURITIZATION | |||||||||||||||||
| Santander Drive Auto Receivables Trust 2014-S4 |
United States | — | (a) | — | — | — | SECURITIZATION | |||||||||||||||||
| Santander Drive Auto Receivables Trust 2014-S5 |
United States | — | (a) | — | — | — | SECURITIZATION | |||||||||||||||||
| Santander Drive Auto Receivables Trust 2014-S6 |
United States | — | (a) | — | — | — | SECURITIZATION | |||||||||||||||||
| Santander Energías Renovables I, SCR de Régimen Simplificado, S.A. |
Spain | 56.76 | % | 0.00 | % | 56.76 | % | 56.76 | % | 56.76 | % | VENTURE CAPITAL COMPANY | ||||||||||||
| Santander Envíos, S.A. |
Spain | 100.00 | % | 0.00 | % | 100.00 | % | 100.00 | % | 100.00 | % | TRANSFER OF FUNDS FOR IMMIGRANTS | ||||||||||||
| Santander Equity Investments Limited |
United Kingdom | 0.00 | % | 100.00 | % | 100.00 | % | 100.00 | % | 100.00 | % | FINANCE | ||||||||||||
| Santander Estates Limited |
United Kingdom | 0.00 | % | 100.00 | % | 100.00 | % | 100.00 | % | 100.00 | % | PROPERTY | ||||||||||||
| Santander Factoring S.A. |
Chile | 0.00 | % | 99.54 | % | 100.00 | % | 100.00 | % | 100.00 | % | FACTORING | ||||||||||||
| Santander Factoring y Confirming, S.A., E.F.C. |
Spain | 100.00 | % | 0.00 | % | 100.00 | % | 100.00 | % | 100.00 | % | FACTORING | ||||||||||||
| Santander Finance 2012-1 LLC |
United States | 0.00 | % | 100.00 | % | 100.00 | % | 100.00 | % | 100.00 | % | FINANCIAL SERVICES | ||||||||||||
| Santander Financial Exchanges Limited |
United Kingdom | 100.00 | % | 0.00 | % | 100.00 | % | 100.00 | % | 100.00 | % | FINANCE | ||||||||||||
| Santander Financial Products plc |
Ireland | 0.00 | % | 100.00 | % | 100.00 | % | 100.00 | % | 100.00 | % | FINANCE | ||||||||||||
| Santander Financial Services, Inc. |
Puerto Rico | 100.00 | % | 0.00 | % | 100.00 | % | 100.00 | % | 100.00 | % | FINANCE | ||||||||||||
| Santander Fintech Limited |
United Kingdom | 0.00 | % | 100.00 | % | 100.00 | % | — | — | SECURITIZATION | ||||||||||||||
| Santander Fund Administration, S.A. |
Spain | 0.00 | % | 100.00 | % | 100.00 | % | — | — | FUND MANAGEMENT COMPANY | ||||||||||||||
| Santander Fundo de Investimento Amazonas Multimercado Crédito Privado Investimento no Exterior |
Brazil | 0.00 | % | 89.02 | % | 100.00 | % | 100.00 | % | — | INVESTMENT FUND | |||||||||||||
F-325
Table of Contents
| % of ownership held by the Bank |
% of voting power (c) | |||||||||||||||||||||||
| Company |
Location |
Direct | Indirect | 2014 | 2013 | 2012 | Line of business | |||||||||||||||||
| Santander Fundo de Investimento Diamantina Multimercado Crédito Privado Investimento no Exterior |
Brazil | 0.00 | % | 89.02 | % | 100.00 | % | 100.00 | % | — | INVESTMENT FUND | |||||||||||||
| Santander Fundo de Investimento em Cotas de Fundos de Investimento Contract i Referenciado DI |
Brazil | 0.00 | % | 93.34 | % | 100.00 | % | 100.00 | % | — | INVESTMENT FUND | |||||||||||||
| Santander Fundo de Investimento Financial Curto Prazo |
Brazil | 0.00 | % | 89.01 | % | 100.00 | % | 100.00 | % | — | INVESTMENT FUND | |||||||||||||
| Santander Fundo de Investimento Guarujá Multimercado Crédito Privado Investimento no Exterior |
Brazil | 0.00 | % | 89.02 | % | 100.00 | % | 100.00 | % | — | INVESTMENT FUND | |||||||||||||
| Santander Fundo de Investimento Renda Fixa Capitalization |
Brazil | 0.00 | % | 89.02 | % | 100.00 | % | 100.00 | % | — | INVESTMENT FUND | |||||||||||||
| Santander Fundo de Investimento SBAC Referenciado di Crédito Privado |
Brazil | 0.00 | % | 89.02 | % | 100.00 | % | 100.00 | % | — | INVESTMENT FUND | |||||||||||||
| Santander Fundo de Investimento Unix Multimercado Crédito Privado |
Brazil | 0.00 | % | 89.02 | % | 100.00 | % | 100.00 | % | — | INVESTMENT FUND | |||||||||||||
| Santander GBM Secured Financing Limited |
Ireland | — | (a) | — | — | — | SECURITIZATION | |||||||||||||||||
| Santander Gestão de Activos, SGPS, S.A. |
Portugal | 0.00 | % | 99.80 | % | 100.00 | % | 100.00 | % | 100.00 | % | HOLDING COMPANY | ||||||||||||
| Santander Gestión de Recaudación y Cobranzas Ltda. |
Chile | 0.00 | % | 99.54 | % | 100.00 | % | 100.00 | % | 100.00 | % | FINANCIAL SERVICES | ||||||||||||
| Santander Gestión Inmobiliaria, S.A. |
Spain | 0.01 | % | 99.99 | % | 100.00 | % | 100.00 | % | 100.00 | % | PROPERTY | ||||||||||||
| Santander Global Consumer Finance Limited |
United Kingdom | 0.00 | % | 100.00 | % | 100.00 | % | 100.00 | % | 100.00 | % | FINANCE | ||||||||||||
| Santander Global Facilities, S.A. de C.V. |
Mexico | 100.00 | % | 0.00 | % | 100.00 | % | 100.00 | % | 100.00 | % | PROPERTY MANAGEMENT | ||||||||||||
| Santander Global Facilities, S.L. |
Spain | 100.00 | % | 0.00 | % | 100.00 | % | 100.00 | % | 100.00 | % | PROPERTY | ||||||||||||
| Santander Global Property México, S.A. de C.V. |
Mexico | 0.00 | % | 100.00 | % | 100.00 | % | 100.00 | % | 100.00 | % | PROPERTY | ||||||||||||
| Santander Global Property U.S.A., Inc. |
United States | 0.00 | % | 100.00 | % | 100.00 | % | 100.00 | % | 100.00 | % | SERVICES | ||||||||||||
| Santander Global Property, S.L. |
Spain | 97.34 | % | 2.66 | % | 100.00 | % | 100.00 | % | 100.00 | % | SECURITIES INVESTMENT | ||||||||||||
| Santander Global Services, S.A. (b) |
Uruguay | 0.00 | % | 100.00 | % | 100.00 | % | 100.00 | % | 100.00 | % | SERVICES | ||||||||||||
| Santander Global Sport, S.A. |
Spain | 100.00 | % | 0.00 | % | 100.00 | % | 100.00 | % | 100.00 | % | SPORTS OPERATIONS | ||||||||||||
| Santander Guarantee Company |
United Kingdom | 0.00 | % | 100.00 | % | 100.00 | % | 100.00 | % | 100.00 | % | LEASING | ||||||||||||
| Santander Hipotecario 1 Fondo de Titulización de Activos |
Spain | — | (a) | — | — | — | SECURITIZATION | |||||||||||||||||
| Santander Hipotecario 2 Fondo de Titulización de Activos |
Spain | — | (a) | — | — | — | SECURITIZATION | |||||||||||||||||
| Santander Hipotecario 3 Fondo de Titulización de Activos |
Spain | — | (a) | — | — | — | SECURITIZATION | |||||||||||||||||
| Santander Hipotecario, S.A. de C.V., SOFOM, E.R. |
Mexico | 0.00 | % | 75.05 | % | 100.00 | % | 100.00 | % | 100.00 | % | FINANCE | ||||||||||||
| Santander Holanda B.V. |
The Netherlands | 0.00 | % | 100.00 | % | 100.00 | % | 100.00 | % | 100.00 | % | HOLDING COMPANY | ||||||||||||
F-326
Table of Contents
| % of ownership held by the Bank |
% of voting power (c) | |||||||||||||||||||||||
| Company |
Location |
Direct | Indirect | 2014 | 2013 | 2012 | Line of business | |||||||||||||||||
| Santander Holding Canada Inc. |
Canada | 100.00 | % | 0.00 | % | 100.00 | % | — | — | HOLDING COMPANY | ||||||||||||||
| Santander Holding Internacional, S.A. |
Spain | 99.95 | % | 0.05 | % | 100.00 | % | 100.00 | % | 100.00 | % | HOLDING COMPANY | ||||||||||||
| Santander Holding Vivienda, S.A. de C.V. |
Mexico | 0.00 | % | 75.05 | % | 100.00 | % | 100.00 | % | 100.00 | % | SERVICES | ||||||||||||
| Santander Holdings USA, Inc. |
United States | 100.00 | % | 0.00 | % | 100.00 | % | 100.00 | % | 100.00 | % | HOLDING COMPANY | ||||||||||||
| Santander Insurance Agency, Inc. |
Puerto Rico | 0.00 | % | 100.00 | % | 100.00 | % | 100.00 | % | 100.00 | % | INSURANCE BROKER | ||||||||||||
| Santander Insurance Agency, U.S., LLC |
United States | 0.00 | % | 100.00 | % | 100.00 | % | 100.00 | % | 100.00 | % | INSURANCE | ||||||||||||
| Santander Insurance Holding, S.L. |
Spain | 99.99 | % | 0.01 | % | 100.00 | % | 100.00 | % | 100.00 | % | HOLDING COMPANY | ||||||||||||
| Santander Insurance Services UK Limited |
United Kingdom | 0.00 | % | 100.00 | % | 100.00 | % | 100.00 | % | 100.00 | % | ASSET MANAGEMENT COMPANY | ||||||||||||
| Santander Intermediación Correduría de Seguros, S.A. |
Spain | 0.00 | % | 100.00 | % | 100.00 | % | 100.00 | % | 100.00 | % | INSURANCE BROKER | ||||||||||||
| Santander International Debt, S.A. Sole-Shareholder Company |
Spain | 100.00 | % | 0.00 | % | 100.00 | % | 100.00 | % | 100.00 | % | FINANCE | ||||||||||||
| Santander International Products, Plc. |
Ireland | 99.99 | % | 0.01 | % | 100.00 | % | 100.00 | % | 99.99 | % | FINANCE | ||||||||||||
| Santander Inversiones S.A. |
Chile | 0.00 | % | 100.00 | % | 100.00 | % | 100.00 | % | 100.00 | % | HOLDING COMPANY | ||||||||||||
| Santander Investment Bank Limited |
Bahamas | 0.00 | % | 100.00 | % | 100.00 | % | 100.00 | % | 100.00 | % | BANKING | ||||||||||||
| Santander Investment Bolsa, S.V., S.A. |
Spain | 0.00 | % | 100.00 | % | 100.00 | % | 100.00 | % | 100.00 | % | SECURITIES COMPANY | ||||||||||||
| Santander Investment Chile Limitada |
Chile | 0.00 | % | 100.00 | % | 100.00 | % | 100.00 | % | 100.00 | % | FINANCE | ||||||||||||
| Santander Investment I, S.A. |
Spain | 100.00 | % | 0.00 | % | 100.00 | % | 100.00 | % | 100.00 | % | HOLDING COMPANY | ||||||||||||
| Santander Investment Limited |
Bahamas | 0.00 | % | 100.00 | % | 100.00 | % | 100.00 | % | 100.00 | % | INACTIVE | ||||||||||||
| Santander Investment Securities Inc. |
United States | 0.00 | % | 100.00 | % | 100.00 | % | 100.00 | % | 100.00 | % | SECURITIES COMPANY | ||||||||||||
| Santander Investment, S.A. |
Spain | 100.00 | % | 0.00 | % | 100.00 | % | 100.00 | % | 100.00 | % | BANKING | ||||||||||||
| Santander ISA Managers Limited |
United Kingdom | 0.00 | % | 100.00 | % | 100.00 | % | 50.00 | % | 100.00 | % | FUND AND PORTFOLIO MANAGER | ||||||||||||
| Santander Issuances, S.A. Sole-Shareholder Company |
Spain | 100.00 | % | 0.00 | % | 100.00 | % | 100.00 | % | 100.00 | % | FINANCE | ||||||||||||
| Santander Lease, S.A., E.F.C. |
Spain | 70.00 | % | 30.00 | % | 100.00 | % | 100.00 | % | 100.00 | % | LEASING | ||||||||||||
| Santander Leasing S.A. Arrendamento Mercantil |
Brazil | 0.00 | % | 89.01 | % | 99.99 | % | 99.99 | % | 99.99 | % | LEASING | ||||||||||||
| Santander Leasing, LLC |
United States | 0.00 | % | 100.00 | % | 100.00 | % | 100.00 | % | 100.00 | % | LEASING | ||||||||||||
| Santander Lending Limited |
United Kingdom | 0.00 | % | 100.00 | % | 100.00 | % | 100.00 | % | 100.00 | % | MORTGAGE LOAN COMPANY | ||||||||||||
| Santander Mediación Operador de Banca-Seguros Vinculado, S.A. |
Spain | 34.00 | % | 65.50 | % | 100.00 | % | 100.00 | % | 100.00 | % | INSURANCE BROKERAGE | ||||||||||||
F-327
Table of Contents
| % of ownership held by the Bank |
% of voting power (c) | |||||||||||||||||||||||
| Company |
Location |
Direct | Indirect | 2014 | 2013 | 2012 | Line of business | |||||||||||||||||
| Santander Merchant S.A. |
Argentina | 0.00 | % | 100.00 | % | 100.00 | % | 100.00 | % | 100.00 | % | FINANCE | ||||||||||||
| Santander Microcrédito Assessoria Financeira S.A. |
Brazil | 0.00 | % | 89.02 | % | 100.00 | % | 100.00 | % | 100.00 | % | FINANCIAL SERVICES | ||||||||||||
| Santander Multiobrigações - Fundo de Investimento Mobiliário Aberto de Obrigações de Taxa variável |
Portugal | 0.00 | % | 91.77 | % | 91.94 | % | 91.20 | % | — | INVESTMENT FUND | |||||||||||||
| Santander Operaciones Retail, S.A. |
Spain | 0.00 | % | 100.00 | % | 100.00 | % | 100.00 | % | 100.00 | % | SERVICES | ||||||||||||
| Santander Overseas Bank, Inc. |
Puerto Rico | 0.00 | % | 100.00 | % | 100.00 | % | 100.00 | % | 100.00 | % | BANKING | ||||||||||||
| Santander Paraty Qif PLC |
Ireland | 0.00 | % | 89.02 | % | 100.00 | % | 100.00 | % | — | INVESTMENT COMPANY | |||||||||||||
| Santander Participações S.A. |
Brazil | 0.00 | % | 89.02 | % | 100.00 | % | 100.00 | % | 100.00 | % | HOLDING COMPANY | ||||||||||||
| Santander Pensões - Sociedade Gestora de Fundos de Pensões, S.A. |
Portugal | 0.00 | % | 100.00 | % | 100.00 | % | 100.00 | % | 100.00 | % | PENSION FUND MANAGEMENT COMPANY | ||||||||||||
| Santander Perpetual, S.A. Sole-Shareholder Company |
Spain | 100.00 | % | 0.00 | % | 100.00 | % | 100.00 | % | 100.00 | % | FINANCE | ||||||||||||
| Santander Private Banking Gestión, S.A., S.G.I.I.C. |
Spain | 0.00 | % | 100.00 | % | 100.00 | % | 100.00 | % | 100.00 | % | FUND MANAGEMENT COMPANY | ||||||||||||
| Santander Private Banking S.p.A. |
Italy | 100.00 | % | 0.00 | % | 100.00 | % | 100.00 | % | 100.00 | % | BANKING | ||||||||||||
| Santander Private Banking UK Limited |
United Kingdom | 0.00 | % | 100.00 | % | 100.00 | % | 100.00 | % | 100.00 | % | PROPERTY | ||||||||||||
| Santander Private Equity, S.A., S.G.E.C.R. |
Spain | 90.00 | % | 9.98 | % | 100.00 | % | 100.00 | % | 100.00 | % | VENTURE CAPITAL MANAGEMENT COMPANY | ||||||||||||
| Santander Private Real Estate Advisory & Management, S.A. |
Spain | 0.00 | % | 100.00 | % | 100.00 | % | 100.00 | % | 100.00 | % | PROPERTY | ||||||||||||
| Santander Private Real Estate Advisory, S.A. |
Spain | 100.00 | % | 0.00 | % | 100.00 | % | 100.00 | % | 100.00 | % | PROPERTY | ||||||||||||
| Santander Public Sector SCF, S.A. |
France | 94.00 | % | 6.00 | % | 100.00 | % | 100.00 | % | — | FINANCE | |||||||||||||
| Santander Real Estate, S.G.I.I.C., S.A. |
Spain | 0.00 | % | 100.00 | % | 100.00 | % | 100.00 | % | 100.00 | % | FUND MANAGEMENT COMPANY | ||||||||||||
| Santander Revolving Asset Funding 1 LLC |
United States | 0.00 | % | 60.46 | % | 100.00 | % | — | — | INACTIVE | ||||||||||||||
| Santander Río Servicios S.A. |
Argentina | 0.00 | % | 99.97 | % | 100.00 | % | 100.00 | % | 100.00 | % | ADVISORY SERVICES | ||||||||||||
| Santander Río Trust S.A. |
Argentina | 0.00 | % | 99.97 | % | 100.00 | % | 100.00 | % | 100.00 | % | SERVICES | ||||||||||||
| Santander Río Valores S.A. |
Argentina | 0.00 | % | 99.34 | % | 100.00 | % | 100.00 | % | 100.00 | % | SECURITIES COMPANY | ||||||||||||
| Santander RSPE 1 LLC |
United States | 0.00 | % | 60.46 | % | 100.00 | % | — | — | INACTIVE | ||||||||||||||
| Santander RSPE 5 LLC |
United States | 0.00 | % | 60.46 | % | 100.00 | % | — | — | INACTIVE | ||||||||||||||
| Santander RSPE 6 LLC |
United States | 0.00 | % | 60.46 | % | 100.00 | % | — | — | INACTIVE | ||||||||||||||
| Santander S.A. - Serviços Técnicos, Administrativos e de Corretagem de Seguros |
Brazil | 0.00 | % | 93.34 | % | 100.00 | % | 100.00 | % | 100.00 | % | INSURANCE BROKER | ||||||||||||
F-328
Table of Contents
| % of ownership held by the Bank |
% of voting power (c) | |||||||||||||||||||||||
| Company |
Location |
Direct | Indirect | 2014 | 2013 | 2012 | Line of business | |||||||||||||||||
| Santander S.A. Corredores de Bolsa |
Chile | 0.00 | % | 83.18 | % | 100.00 | % | 100.00 | % | 100.00 | % | SECURITIES COMPANY | ||||||||||||
| Santander S.A. Sociedad Securitizadora |
Chile | 0.00 | % | 67.13 | % | 100.00 | % | 100.00 | % | 100.00 | % | FUND MANAGEMENT COMPANY | ||||||||||||
| Santander Secretariat Services Limited |
United Kingdom | 0.00 | % | 100.00 | % | 100.00 | % | 100.00 | % | 100.00 | % | HOLDING COMPANY | ||||||||||||
| Santander Securities LLC |
Puerto Rico | 0.00 | % | 100.00 | % | 100.00 | % | 100.00 | % | 100.00 | % | SECURITIES COMPANY | ||||||||||||
| Santander Securities Services Brasil Distribuidora de Títulos e Valores Mobiliários S.A. |
Brazil | 0.00 | % | 89.02 | % | 100.00 | % | 100.00 | % | 100.00 | % | MANAGEMENT COMPANY | ||||||||||||
| Santander Securities Services Brasil Participações S.A. |
Brazil | 0.00 | % | 100.00 | % | 100.00 | % | — | — | HOLDING COMPANY | ||||||||||||||
| Santander Securities Services, S.A. |
Spain | 0.00 | % | 100.00 | % | 100.00 | % | 100.00 | % | 100.00 | % | BANKING | ||||||||||||
| Santander Seguros y Reaseguros, Compañía Aseguradora, S.A. |
Spain | 0.00 | % | 100.00 | % | 100.00 | % | 100.00 | % | 100.00 | % | INSURANCE | ||||||||||||
| Santander Service GmbH |
Germany | 0.00 | % | 100.00 | % | 100.00 | % | 100.00 | % | 100.00 | % | SERVICES | ||||||||||||
| Santander Servicios Corporativos, S.A. de C.V. |
Mexico | 0.00 | % | 75.05 | % | 100.00 | % | 100.00 | % | 100.00 | % | SERVICES | ||||||||||||
| Santander Servicios Especializados, S.A. de C.V. |
Mexico | 0.00 | % | 75.05 | % | 100.00 | % | 100.00 | % | 100.00 | % | FINANCIAL SERVICES | ||||||||||||
| Santander Tecnología y Operaciones A.E.I.E. |
Spain | — | (a) | — | — | — | SERVICES | |||||||||||||||||
| Santander Totta Seguros, Companhia de Seguros de Vida, S.A. |
Portugal | 0.00 | % | 99.89 | % | 100.00 | % | 100.00 | % | 100.00 | % | INSURANCE | ||||||||||||
| Santander Totta, SGPS, S.A. |
Portugal | 0.00 | % | 99.89 | % | 99.89 | % | 99.88 | % | 99.87 | % | HOLDING COMPANY | ||||||||||||
| Santander Trade Services Limited |
Hong Kong | 0.00 | % | 100.00 | % | 100.00 | % | 100.00 | % | 100.00 | % | SERVICES | ||||||||||||
| Santander UK Foundation Limited |
United Kingdom | — | (a) | — | — | — | CHARITY | |||||||||||||||||
| Santander UK Group Holdings Limited |
United Kingdom | 77.67 | % | 22.33 | % | 100.00 | % | 0.00 | % | — | FINANCE | |||||||||||||
| Santander UK Investments |
United Kingdom | 100.00 | % | 0.00 | % | 100.00 | % | 100.00 | % | 100.00 | % | FINANCE | ||||||||||||
| Santander UK plc |
United Kingdom | 0.00 | % | 100.00 | % | 100.00 | % | 100.00 | % | 100.00 | % | BANKING | ||||||||||||
| Santander US Debt, S.A. Sole-Shareholder Company |
Spain | 100.00 | % | 0.00 | % | 100.00 | % | 100.00 | % | 100.00 | % | FINANCE | ||||||||||||
| Santander Vivienda, S.A. de C.V. SOFOM E.R. Grupo Financiero Santander México |
Mexico | 0.00 | % | 75.05 | % | 100.00 | % | 100.00 | % | — | FINANCE | |||||||||||||
| Santos Energia Participações S.A. |
Brazil | 0.00 | % | 89.02 | % | 100.00 | % | 100.00 | % | 99.99 | % | HOLDING COMPANY | ||||||||||||
| Santotta-Internacional, SGPS, Sociedade Unipessoal, Lda. |
Portugal | 0.00 | % | 99.80 | % | 100.00 | % | 100.00 | % | 100.00 | % | HOLDING COMPANY | ||||||||||||
| Santusa Holding, S.L. |
Spain | 69.76 | % | 30.24 | % | 100.00 | % | 100.00 | % | 100.00 | % | HOLDING COMPANY | ||||||||||||
| SC Austria Finance 2013-1 S.A. |
Luxembourg | — | (a) | — | — | — | SECURITIZATION | |||||||||||||||||
F-329
Table of Contents
| % of ownership held by the Bank |
% of voting power (c) | |||||||||||||||||||||||
| Company |
Location |
Direct | Indirect | 2014 | 2013 | 2012 | Line of business | |||||||||||||||||
| SC Germany Auto 08-2 Limited (b) |
Ireland | — | (a) | — | — | — | SECURITIZATION | |||||||||||||||||
| SC Germany Auto 2009-1 Limited (b) |
Ireland | — | (a) | — | — | — | SECURITIZATION | |||||||||||||||||
| SC Germany Auto 2010-1 UG |
Germany | — | (a) | — | — | — | SECURITIZATION | |||||||||||||||||
| SC Germany Auto 2011-1 UG (haftungsbeschränkt) |
Germany | — | (a) | — | — | — | SECURITIZATION | |||||||||||||||||
| SC Germany Auto 2011-2 UG (haftungsbeschränkt) |
Germany | — | (a) | — | — | — | SECURITIZATION | |||||||||||||||||
| SC Germany Auto 2013-1 UG (haftungsbeschränkt) |
Germany | — | (a) | — | — | — | SECURITIZATION | |||||||||||||||||
| SC Germany Auto 2013-2 UG (haftungsbeschränkt) |
Germany | — | (a) | — | — | — | SECURITIZATION | |||||||||||||||||
| SC Germany Auto 2014-1 UG (haftungsbeschränkt) |
Germany | — | (a) | — | — | — | SECURITIZATION | |||||||||||||||||
| SC Germany Auto 2014-2 UG (haftungsbeschränkt) |
Germany | — | (a) | — | — | — | SECURITIZATION | |||||||||||||||||
| SC Germany Consumer 10-1 Limited (b) |
Ireland | — | (a) | — | — | — | SECURITIZATION | |||||||||||||||||
| SC Germany Consumer 2013-1 UG (haftungsbeschränkt) |
Germany | — | (a) | — | — | — | SECURITIZATION | |||||||||||||||||
| SC Germany Consumer 2014-1 UG (haftungsbeschränkt) |
Germany | — | (a) | — | — | — | SECURITIZATION | |||||||||||||||||
| SC Germany Vehicles 2013-1 UG (haftungsbeschränkt) |
Germany | — | (a) | — | — | — | SECURITIZATION | |||||||||||||||||
| SC Poland Auto 2014-1 Limited |
Ireland | — | (a) | — | — | — | SECURITIZATION | |||||||||||||||||
| SCF Ajoneuvohallinta Limited |
Ireland | — | (a) | — | — | — | SECURITIZATION | |||||||||||||||||
| SCF Ajoneuvohallinto Limited (b) |
Ireland | — | (a) | — | — | — | SECURITIZATION | |||||||||||||||||
| SCF Rahoituspalvelut 2013 Limited |
Ireland | — | (a) | — | — | — | SECURITIZATION | |||||||||||||||||
| SCF Rahoituspalvelut Limited |
Ireland | — | (a) | — | — | — | SECURITIZATION | |||||||||||||||||
| SCFI Ajoneuvohallinto Limited |
Ireland | — | (a) | — | — | — | SECURITIZATION | |||||||||||||||||
| SCFI Rahoituspalvelut Limited (b) |
Ireland | — | (a) | — | — | — | SECURITIZATION | |||||||||||||||||
| SCI BANBY PRO |
France | 0.00 | % | 90.00 | % | 100.00 | % | 100.00 | % | 100.00 | % | PROPERTY | ||||||||||||
| Scottish Mutual Pensions Limited (b) |
United Kingdom | 0.00 | % | 100.00 | % | 100.00 | % | 100.00 | % | 100.00 | % | INSURANCE | ||||||||||||
| Secucor Finance 2013-1 Limited |
Ireland | — | (a) | — | — | — | SECURITIZATION | |||||||||||||||||
| Serfin International Bank and Trust, Limited |
Cayman Islands | 0.00 | % | 99.80 | % | 100.00 | % | 100.00 | % | 100.00 | % | BANKING | ||||||||||||
| Services and Promotions Delaware Corp. |
United States | 0.00 | % | 100.00 | % | 100.00 | % | 100.00 | % | 100.00 | % | HOLDING COMPANY | ||||||||||||
| Services and Promotions Miami LLC |
United States | 0.00 | % | 100.00 | % | 100.00 | % | 100.00 | % | 100.00 | % | PROPERTY | ||||||||||||
| Servicio de Alarmas Controladas por Ordenador, S.A. |
Spain | 99.99 | % | 0.01 | % | 100.00 | % | 100.00 | % | 100.00 | % | SECURITY | ||||||||||||
F-330
Table of Contents
| % of ownership held by the Bank |
% of voting power (c) | |||||||||||||||||||||||
| Company |
Location |
Direct | Indirect | 2014 | 2013 | 2012 | Line of business | |||||||||||||||||
| Servicios Administrativos y Financieros Ltda. |
Chile | 0.00 | % | 100.00 | % | 100.00 | % | 100.00 | % | 100.00 | % | SERVICES | ||||||||||||
| Servicios Corporativos Seguros Serfin, S.A. de C.V. (b) |
Mexico | 0.00 | % | 100.00 | % | 100.00 | % | 100.00 | % | 100.00 | % | SERVICES | ||||||||||||
| Servicios de Cobranza, Recuperación y Seguimiento, S.A. de C.V. |
Mexico | 0.00 | % | 100.00 | % | 100.00 | % | 100.00 | % | 100.00 | % | FINANCE | ||||||||||||
| Sheppards Moneybrokers Limited |
United Kingdom | 0.00 | % | 100.00 | % | 100.00 | % | 100.00 | % | 100.00 | % | ADVISORY SERVICES | ||||||||||||
| Shiloh III Wind Project, LLC |
United States | 0.00 | % | 100.00 | % | 100.00 | % | 100.00 | % | 100.00 | % | ELECTRICITY PRODUCTION | ||||||||||||
| SIAF LLC |
United States | 0.00 | % | 60.46 | % | 100.00 | % | — | — | FINANCE | ||||||||||||||
| Silk Finance No. 3 Limited |
Ireland | — | (a) | — | — | — | SECURITIZATION | |||||||||||||||||
| Sinvest Inversiones y Asesorías Limitada |
Chile | 0.00 | % | 100.00 | % | 100.00 | % | 100.00 | % | 100.00 | % | FINANCE | ||||||||||||
| Sistema 4B, S.L. (consolidated) |
Spain | 68.80 | % | 0.00 | % | 68.80 | % | 68.80 | % | 67.67 | % | CARDS | ||||||||||||
| Sociedad Integral de Valoraciones Automatizadas, S.A. |
Spain | 100.00 | % | 0.00 | % | 100.00 | % | 100.00 | % | 100.00 | % | APPRAISALS | ||||||||||||
| Società Energetica Vibonese Due S.r.l. |
Italy | 0.00 | % | 100.00 | % | 100.00 | % | 100.00 | % | — | ELECTRICITY PRODUCTION | |||||||||||||
| Socur, S.A. |
Uruguay | 100.00 | % | 0.00 | % | 100.00 | % | 100.00 | % | 100.00 | % | FINANCE | ||||||||||||
| Sol Orchard Imperial 1 LLC |
United States | 0.00 | % | 81.94 | % | 100.00 | % | — | — | ELECTRICITY PRODUCTION | ||||||||||||||
| Solar Red, SGPS, S.A. |
Portugal | 0.00 | % | 100.00 | % | 100.00 | % | 100.00 | % | 50.00 | % | HOLDING COMPANY | ||||||||||||
| Solarlaser Limited |
United Kingdom | 0.00 | % | 100.00 | % | 100.00 | % | 100.00 | % | 100.00 | % | PROPERTY | ||||||||||||
| SOV APEX LLC |
United States | 0.00 | % | 100.00 | % | 100.00 | % | 100.00 | % | 100.00 | % | HOLDING COMPANY | ||||||||||||
| Sovereign Capital Trust IX |
United States | 0.00 | % | 100.00 | % | 100.00 | % | 100.00 | % | 100.00 | % | INACTIVE | ||||||||||||
| Sovereign Capital Trust VI |
United States | 0.00 | % | 100.00 | % | 100.00 | % | 100.00 | % | 100.00 | % | FINANCE | ||||||||||||
| Sovereign Community Development Company |
United States | 0.00 | % | 100.00 | % | 100.00 | % | 100.00 | % | 100.00 | % | HOLDING COMPANY | ||||||||||||
| Sovereign Delaware Investment Corporation |
United States | 0.00 | % | 100.00 | % | 100.00 | % | 100.00 | % | 100.00 | % | HOLDING COMPANY | ||||||||||||
| Sovereign Lease Holdings, LLC |
United States | 0.00 | % | 100.00 | % | 100.00 | % | 100.00 | % | 100.00 | % | FINANCIAL SERVICES | ||||||||||||
| Sovereign Precious Metals, LLC |
United States | 0.00 | % | 100.00 | % | 100.00 | % | 100.00 | % | 100.00 | % | PURCHASE AND SALE OF PRECIOUS METALS | ||||||||||||
| Sovereign REIT Holdings, Inc. |
United States | 0.00 | % | 100.00 | % | 100.00 | % | 100.00 | % | 100.00 | % | HOLDING COMPANY | ||||||||||||
| Sovereign Securities Corporation, LLC |
United States | 0.00 | % | 100.00 | % | 100.00 | % | 100.00 | % | 100.00 | % | INACTIVE | ||||||||||||
| Sovereign Spirit Limited (e) |
Bermuda | 0.00 | % | 100.00 | % | 100.00 | % | 100.00 | % | 100.00 | % | LEASING | ||||||||||||
| Sterrebeeck B.V. |
The Netherlands | 100.00 | % | 0.00 | % | 100.00 | % | 100.00 | % | 100.00 | % | HOLDING COMPANY | ||||||||||||
F-331
Table of Contents
| % of ownership held by the Bank |
% of voting power (c) | |||||||||||||||||||||||
| Company |
Location |
Direct | Indirect | 2014 | 2013 | 2012 | Line of business | |||||||||||||||||
| Suleyado 2003, S.L. |
Spain | 0.00 | % | 100.00 | % | 100.00 | % | 100.00 | % | 100.00 | % | SECURITIES INVESTMENT | ||||||||||||
| Super Pagamentos e Administração de Meios Eletrônicos S.A. |
Brazil | 0.00 | % | 44.51 | % | 50.00 | % | — | — | PAYMENT SERVICES | ||||||||||||||
| Suzuki Servicios Financieros, S.L. |
Spain | 0.00 | % | 51.00 | % | 51.00 | % | 51.00 | % | 51.00 | % | INTERMEDIATION | ||||||||||||
| Svensk Autofinans 1 Limited |
Ireland | — | (a) | — | — | — | SECURITIZATION | |||||||||||||||||
| Svensk Autofinans WH 1 Ltd |
Ireland | — | (a) | — | — | — | SECURITIZATION | |||||||||||||||||
| Swesant SA |
Switzerland | 0.00 | % | 100.00 | % | 100.00 | % | 100.00 | % | 100.00 | % | HOLDING COMPANY | ||||||||||||
| Synergy Abstract, LP |
United States | 0.00 | % | 70.00 | % | 70.00 | % | 70.00 | % | 70.00 | % | INSURANCE | ||||||||||||
| Taxagest Sociedade Gestora de Participações Sociais, S.A. |
Portugal | 0.00 | % | 99.80 | % | 100.00 | % | 100.00 | % | 100.00 | % | HOLDING COMPANY | ||||||||||||
| Teatinos Siglo XXI Inversiones S.A. |
Chile | 50.00 | % | 50.00 | % | 100.00 | % | 100.00 | % | 100.00 | % | HOLDING COMPANY | ||||||||||||
| Texas Wind I LLC |
United States | 0.00 | % | 100.00 | % | 100.00 | % | — | — | ELECTRICITY PRODUCTION | ||||||||||||||
| Texas Wind II LLC |
United States | 0.00 | % | 100.00 | % | 100.00 | % | — | — | ELECTRICITY PRODUCTION | ||||||||||||||
| The Alliance & Leicester Corporation Limited |
United Kingdom | 0.00 | % | 100.00 | % | 100.00 | % | 100.00 | % | 100.00 | % | PROPERTY | ||||||||||||
| The National & Provincial Building Society Pension Fund Trustees Limited |
United Kingdom | — | (a) | — | — | — | ASSET MANAGEMENT COMPANY | |||||||||||||||||
| Time Finance Limited (b) |
United Kingdom | 0.00 | % | 100.00 | % | 100.00 | % | 100.00 | % | 100.00 | % | SERVICES | ||||||||||||
| Time Retail Finance Limited (b) |
United Kingdom | 0.00 | % | 100.00 | % | 100.00 | % | 100.00 | % | 100.00 | % | SERVICES | ||||||||||||
| Títulos de Renta Fija, S.A. |
Spain | 100.00 | % | 0.00 | % | 100.00 | % | 100.00 | % | 100.00 | % | SECURITIES INVESTMENT | ||||||||||||
| Tonopah Solar I, LLC |
United States | 0.00 | % | 100.00 | % | 100.00 | % | 100.00 | % | 100.00 | % | HOLDING COMPANY | ||||||||||||
| Toque Fale Serviços de Telemarketing Ltda. |
Brazil | 0.00 | % | 78.78 | % | 100.00 | % | — | — | TELEMARKETING | ||||||||||||||
| Tornquist Asesores de Seguros S.A. (b) |
Argentina | 0.00 | % | 99.99 | % | 99.99 | % | 99.99 | % | 99.99 | % | ADVISORY SERVICES | ||||||||||||
| Totta & Açores Inc. Newark |
United States | 0.00 | % | 99.80 | % | 100.00 | % | 100.00 | % | 100.00 | % | BANKING | ||||||||||||
| Totta (Ireland), PLC |
Ireland | 0.00 | % | 99.80 | % | 100.00 | % | 100.00 | % | 100.00 | % | FINANCE | ||||||||||||
| Totta Urbe - Empresa de Administração e Construções, S.A. |
Portugal | 0.00 | % | 99.80 | % | 100.00 | % | 100.00 | % | 100.00 | % | PROPERTY | ||||||||||||
| Trade Maps 3 Hong Kong Limited |
Hong Kong | — | (a) | — | — | — | SECURITIZATION | |||||||||||||||||
| Trade Maps 3 Ireland Limited |
Ireland | — | (a) | — | — | — | SECURITIZATION | |||||||||||||||||
| Trans Rotor Limited |
United Kingdom | 100.00 | % | 0.00 | % | 100.00 | % | — | — | FULL-SERVICE LEASING | ||||||||||||||
F-332
Table of Contents
| % of ownership held by the Bank |
% of voting power (c) | |||||||||||||||||||||||
| Company |
Location |
Direct | Indirect | 2014 | 2013 | 2012 | Line of business | |||||||||||||||||
| Transacciones Electrónicas Pos Móvil S.A. |
Chile | 0.00 | % | 78.78 | % | 100.00 | % | — | — | E-COMMERCE | ||||||||||||||
| Tuttle & Son Limited |
United Kingdom | 0.00 | % | 100.00 | % | 100.00 | % | 100.00 | % | 100.00 | % | COLLECTION AND PAYMENT SERVICES | ||||||||||||
| Universal Support, S.A. |
Spain | 0.00 | % | 51.86 | % | 100.00 | % | 100.00 | % | 100.00 | % | TELEMARKETING | ||||||||||||
| Universia Brasil S.A. |
Brazil | 0.00 | % | 100.00 | % | 100.00 | % | 100.00 | % | 100.00 | % | INTERNET | ||||||||||||
| Universia Chile S.A. |
Chile | 0.00 | % | 85.85 | % | 85.85 | % | 85.11 | % | 84.39 | % | INTERNET | ||||||||||||
| Universia Colombia S.A.S. |
Colombia | 0.00 | % | 100.00 | % | 100.00 | % | 100.00 | % | 100.00 | % | INTERNET | ||||||||||||
| Universia Holding, S.L. |
Spain | 100.00 | % | 0.00 | % | 100.00 | % | 100.00 | % | 100.00 | % | HOLDING COMPANY | ||||||||||||
| Universia México, S.A. de C.V. |
Mexico | 0.00 | % | 100.00 | % | 100.00 | % | 100.00 | % | 100.00 | % | INTERNET | ||||||||||||
| Universia Perú, S.A. |
Peru | 0.00 | % | 79.93 | % | 79.93 | % | 76.66 | % | 84.45 | % | INTERNET | ||||||||||||
| Universia Puerto Rico, Inc. |
Puerto Rico | 0.00 | % | 100.00 | % | 100.00 | % | 100.00 | % | 100.00 | % | INTERNET | ||||||||||||
| Vailen Management, S.L. |
Spain | 0.00 | % | 55.89 | % | 100.00 | % | — | — | PROPERTY | ||||||||||||||
| Varitelia Distribuciones, S.L. |
Spain | 0.00 | % | 55.89 | % | 100.00 | % | — | — | PROPERTY | ||||||||||||||
| Vertiarama, S.L. |
Spain | 0.00 | % | 55.89 | % | 100.00 | % | — | — | SECURITIES INVESTMENT | ||||||||||||||
| Viking Collection Services Limited (b) |
United Kingdom | 0.00 | % | 100.00 | % | 100.00 | % | 100.00 | % | 100.00 | % | FINANCE | ||||||||||||
| Vista Capital de Expansión, S.A. SGECR |
Spain | 0.00 | % | 50.00 | % | 50.00 | % | 50.00 | % | 50.00 | % | VENTURE CAPITAL MANAGEMENT COMPANY | ||||||||||||
| Vista Desarrollo, S.A. SCR de Régimen Simplificado |
Spain | 100.00 | % | 0.00 | % | 100.00 | % | 100.00 | % | 100.00 | % | VENTURE CAPITAL COMPANY | ||||||||||||
| W.N.P.H. Gestão e Investimentos Sociedade Unipessoal, S.A. |
Portugal | 0.00 | % | 100.00 | % | 100.00 | % | 100.00 | % | 100.00 | % | PORTFOLIO MANAGEMENT | ||||||||||||
| Wallcesa, S.A. |
Spain | 100.00 | % | 0.00 | % | 100.00 | % | 100.00 | % | 100.00 | % | SECURITIES INVESTMENT | ||||||||||||
| Wandylaw Holdings Ltd |
United Kingdom | 0.00 | % | 100.00 | % | 100.00 | % | 100.00 | % | — | HOLDING COMPANY | |||||||||||||
| Wandylaw Wind Farm Ltd |
United Kingdom | 0.00 | % | 100.00 | % | 100.00 | % | 100.00 | % | — | ELECTRICITY PRODUCTION | |||||||||||||
| Waypoint Capital Trust I |
United States | 0.00 | % | 100.00 | % | 100.00 | % | — | — | INACTIVE | ||||||||||||||
| Waypoint Capital Trust II |
United States | 0.00 | % | 100.00 | % | 100.00 | % | — | — | INACTIVE | ||||||||||||||
| Waypoint Insurance Group, Inc. |
United States | 0.00 | % | 100.00 | % | 100.00 | % | 100.00 | % | 100.00 | % | HOLDING COMPANY | ||||||||||||
| Webcasas, S.A. |
Brazil | 0.00 | % | 93.34 | % | 100.00 | % | 100.00 | % | — | INTERNET | |||||||||||||
| Whitewick Limited |
Jersey | 0.00 | % | 100.00 | % | 100.00 | % | 100.00 | % | 100.00 | % | INACTIVE | ||||||||||||
| WIM Servicios Corporativos, S.A. de C.V. |
Mexico | 0.00 | % | 100.00 | % | 100.00 | % | 100.00 | % | 100.00 | % | ADVISORY SERVICES | ||||||||||||
F-333
Table of Contents
| % of ownership held by the Bank |
% of voting power (c) | |||||||||||||||||||||||
| Company |
Location |
Direct | Indirect | 2014 | 2013 | 2012 | Line of business | |||||||||||||||||
| Winwick Wind Farm Limited |
United Kingdom | 0.00 | % | 100.00 | % | 100.00 | % | — | — | ELECTRICITY PRODUCTION | ||||||||||||||
| WTW Shipping Limited |
Ireland | 100.00 | % | 0.00 | % | 100.00 | % | — | — | LEASING | ||||||||||||||
| (a) | Companies over which effective control is exercised. |
| (b) | Company in liquidation as at December 31, 2014. |
| (c) | Pursuant to Article 3 of Royal Decree 1159/2010, of September 17, approving the rules for the preparation of consolidated financial statements, in order to determine voting power, the voting power relating to subsidiaries or to other persons acting in their own name but on behalf of Group companies was added to the voting power directly held by the Parent. For these purposes, the number of votes corresponding to the Parent in relation to companies over which it exercises indirect control is the number corresponding to each subsidiary holding a direct ownership interest in such companies. |
| (d) | See Note 2.b.v. |
| (e) | Company resident in the UK for tax purposes. |
| (1) | The preference share issuer companies are detailed in Exhibit III, together with other relevant information. |
F-334
Table of Contents
Exhibit II
Companies in which Santander Group has ownership interests of more than 5% (c), associates of Santander Group and jointly controlled entities
| % of ownership held by the Bank |
% of voting power (b) |
|||||||||||||||||||||||||
| Company |
Location |
Direct | Indirect | 2014 | 2013 | 2012 | Line of business |
Type of company | ||||||||||||||||||
| 3E1 Sp. z o.o. |
Poland | 0.00 | % | 12.26 | % | 21.60 | % | 21.60 | % | — | ELECTRICITY PRODUCTION |
— | ||||||||||||||
| AAC Spanish BOF 2005 B.V. |
The Netherlands | 0.00 | % | 45.22 | % | 45.22 | % | — | — | HOLDING COMPANY |
— | |||||||||||||||
| Administrador Financiero de Transantiago S.A. |
Chile | 0.00 | % | 13.40 | % | 20.00 | % | 20.00 | % | 20.00 | % | COLLECTION AND PAYMENT SERVICES |
Associate | |||||||||||||
| Aegon Santander Generales Seguros y Reaseguros, S.A. |
Spain | 0.00 | % | 49.00 | % | 49.00 | % | 49.00 | % | 100.00 | % | INSURANCE |
Jointly controlled entity | |||||||||||||
| Aegon Santander Portugal Não Vida - Companhia de Seguros, S.A. |
Portugal | 0.00 | % | 48.95 | % | 49.00 | % | — | — | INSURANCE |
Jointly controlled entity | |||||||||||||||
| Aegon Santander Portugal Vida - Companhia de Seguros Vida, S.A. |
Portugal | 0.00 | % | 48.95 | % | 49.00 | % | — | — | INSURANCE |
Jointly controlled entity | |||||||||||||||
| Aegon Santander Vida Seguros y Reaseguros, S.A. |
Spain | 0.00 | % | 49.00 | % | 49.00 | % | 49.00 | % | 100.00 | % | INSURANCE |
Jointly controlled entity | |||||||||||||
| Affirmative Insurance Holdings Inc. (consolidated) |
United States | 0.00 | % | 5.03 | % | 0.00 | % | 0.00 | % | 0.00 | % | INSURANCE |
— | |||||||||||||
| Affirmative Investment LLC |
United States | 0.00 | % | 5.03 | % | 4.99 | % | 4.99 | % | 4.99 | % | HOLDING COMPANY |
— | |||||||||||||
| Agres, Agrupación Restauradores, S.L. |
Spain | 0.00 | % | 43.00 | % | 43.00 | % | 43.00 | % | 43.01 | % | RESTAURANTS |
Associate | |||||||||||||
| Aguas de Fuensanta, S.A. |
Spain | 36.78 | % | 0.00 | % | 36.78 | % | 36.78 | % | 42.21 | % | FOOD |
Associate | |||||||||||||
| Allfunds Bank International S.A. |
Luxembourg | 0.00 | % | 25.25 | % | 50.00 | % | 50.00 | % | 50.00 | % | BANKING |
Jointly controlled entity | |||||||||||||
| Allfunds Bank, S.A. |
Spain | 0.00 | % | 25.25 | % | 50.00 | % | 50.00 | % | 50.00 | % | BANKING |
Jointly controlled entity | |||||||||||||
| Allfunds International Schweiz AG |
Switzerland | 0.00 | % | 25.25 | % | 50.00 | % | 50.00 | % | 50.00 | % | SERVICES |
Jointly controlled entity | |||||||||||||
| Allfunds Nominee Limited |
United Kingdom | 0.00 | % | 25.25 | % | 50.00 | % | 50.00 | % | 50.00 | % | HOLDING COMPANY |
Jointly controlled entity | |||||||||||||
| Anekis, S.A. |
Spain | 24.75 | % | 24.75 | % | 49.50 | % | 49.50 | % | 49.50 | % | ADVERTISING |
Associate | |||||||||||||
| Aquajerez, S.L. |
Spain | 0.00 | % | 49.00 | % | 49.00 | % | 49.00 | % | — | WATER SUPPLY |
Associate | ||||||||||||||
F-335
Table of Contents
| % of ownership held by the Bank |
% of voting power (b) |
|||||||||||||||||||||||||
| Company |
Location |
Direct | Indirect | 2014 | 2013 | 2012 | Line of business |
Type of company | ||||||||||||||||||
| Arena Communications Network, S.L. |
Spain | 20.00 | % | 0.00 | % | 20.00 | % | 20.00 | % | 20.00 | % | ADVERTISING |
Associate | |||||||||||||
| Ascan Water Services, S.L. |
Spain | 0.00 | % | 60.00 | % | 60.00 | % | — | — | WATER SUPPLY |
Jointly controlled entity | |||||||||||||||
| Asturcontinental de Edificaciones, S.L. (consolidated) |
Spain | 0.00 | % | 25.15 | % | 45.00 | % | — | — | PROPERTY |
— | |||||||||||||||
| Attijari Factoring Maroc, S.A. |
Morocco | 0.00 | % | 28.95 | % | 28.95 | % | 28.95 | % | 28.99 | % | FACTORING |
Associate | |||||||||||||
| Attijariwafa Bank Société Anonyme (consolidated) |
Morocco | 0.00 | % | 5.26 | % | 5.26 | % | 5.26 | % | 5.32 | % | BANKING |
— | |||||||||||||
| Autopistas del Sol S.A. |
Argentina | 0.00 | % | 7.14 | % | 7.14 | % | 7.14 | % | 14.17 | % | MOTORWAY CONCESSIONS |
— | |||||||||||||
| Aviva Powszechne Towarzystwo Emerytalne Aviva BZ WBK S.A. |
Poland | 0.00 | % | 6.94 | % | 10.00 | % | 10.00 | % | 10.00 | % | PENSION FUND MANAGEMENT COMPANY |
— | |||||||||||||
| Aviva Towarzystwo Ubezpieczeń na Życie S.A. |
Poland | 0.00 | % | 6.94 | % | 10.00 | % | 10.00 | % | 10.00 | % | INSURANCE |
— | |||||||||||||
| Banco Caixa Geral Totta de Angola, S.A. |
Angola | 0.00 | % | 24.94 | % | 24.99 | % | 24.99 | % | 24.99 | % | BANKING |
Associate | |||||||||||||
| Banco Internacional da Guiné-Bissau, S.A. (a) |
Guinea-Bissau | 0.00 | % | 48.90 | % | 49.00 | % | 49.00 | % | 49.00 | % | BANKING |
— | |||||||||||||
| Bank of Beijing Consumer Finance Company |
China | 0.00 | % | 20.00 | % | 20.00 | % | 20.00 | % | — | FINANCE |
Associate | ||||||||||||||
| Bank of Shanghai Co., Ltd. (consolidated) |
China | 7.20 | % | 0.00 | % | 7.20 | % | — | — | BANKING |
— | |||||||||||||||
| Benim - Sociedade Imobiliária, S.A. (consolidated) |
Portugal | 0.00 | % | 25.76 | % | 25.81 | % | 25.81 | % | 25.81 | % | PROPERTY |
Associate | |||||||||||||
| BW Guirapá I S.A. |
Brazil | 0.00 | % | 58.93 | % | 66.19 | % | 40.57 | % | — | HOLDING COMPANY |
Jointly controlled entity | ||||||||||||||
| Cantabria Capital, SGECR, S.A. |
Spain | 50.00 | % | 0.00 | % | 50.00 | % | 50.00 | % | 50.00 | % | VENTURE CAPITAL MANAGEMENT COMPANY |
Associate | |||||||||||||
| Carnes Estellés, S.A. (a) |
Spain | 21.41 | % | 0.00 | % | 21.41 | % | 21.41 | % | 21.41 | % | FOOD |
Associate | |||||||||||||
| Cartera del Norte, S.L. |
Spain | 36.10 | % | 0.00 | % | 36.10 | % | 36.10 | % | 36.10 | % | FINANCE |
Associate | |||||||||||||
| CCPT - ComprarCasa, Rede Serviços Imobiliários, S.A. |
Portugal | 0.00 | % | 47.56 | % | 47.56 | % | 47.56 | % | 47.56 | % | PROPERTY SERVICES |
Jointly controlled entity | |||||||||||||
| Central Eólica Angical S.A. |
Brazil | 0.00 | % | 58.93 | % | 66.19 | % | 40.57 | % | — | ELECTRICITY PRODUCTION |
Jointly controlled entity | ||||||||||||||
| Central Eólica Caititu S.A. |
Brazil | 0.00 | % | 58.93 | % | 66.19 | % | 40.57 | % | — | ELECTRICITY PRODUCTION |
Jointly controlled entity | ||||||||||||||
| Central Eólica Coqueirinho S.A. |
Brazil | 0.00 | % | 58.93 | % | 66.19 | % | 40.57 | % | — | ELECTRICITY PRODUCTION |
Jointly controlled entity | ||||||||||||||
| Central Eólica Corrupião S.A. |
Brazil | 0.00 | % | 58.93 | % | 66.19 | % | 40.57 | % | — | ELECTRICITY PRODUCTION |
Jointly controlled entity | ||||||||||||||
| Central Eólica Inhambu S.A. |
Brazil | 0.00 | % | 58.93 | % | 66.19 | % | 40.57 | % | — | ELECTRICITY PRODUCTION |
Jointly controlled entity | ||||||||||||||
F-336
Table of Contents
| % of ownership held by the Bank |
% of voting power (b) |
|||||||||||||||||||||||||
| Company |
Location |
Direct | Indirect | 2014 | 2013 | 2012 | Line of business |
Type of company | ||||||||||||||||||
| Central Eólica Tamanduá Mirim S.A. |
Brazil | 0.00 | % | 58.93 | % | 66.19 | % | 40.57 | % | — | ELECTRICITY PRODUCTION |
Jointly controlled entity | ||||||||||||||
| Central Eólica Teiu S.A. |
Brazil | 0.00 | % | 58.93 | % | 66.19 | % | 40.57 | % | — | ELECTRICITY PRODUCTION |
Jointly controlled entity | ||||||||||||||
| Centro de Compensación Automatizado S.A. |
Chile | 0.00 | % | 22.34 | % | 33.33 | % | 33.33 | % | 33.33 | % | COLLECTION AND PAYMENT SERVICES |
Associate | |||||||||||||
| Centro para el Desarrollo, Investigación y Aplicación de Nuevas Tecnologías, S.A. |
Spain | 0.00 | % | 49.00 | % | 49.00 | % | 49.00 | % | 49.00 | % | TECHNOLOGY |
Associate | |||||||||||||
| Comder Contraparte Central S.A. |
Chile | 0.00 | % | 7.43 | % | 11.09 | % | 11.09 | % | — | FINANCIAL SERVICES |
Associate | ||||||||||||||
| Companhia de Arrendamento Mercantil RCI Brasil |
Brazil | 0.00 | % | 35.51 | % | 39.89 | % | 39.89 | % | 39.90 | % | LEASING |
Jointly controlled entity | |||||||||||||
| Companhia de Crédito, Financiamento e Investimento RCI Brasil |
Brazil | 0.00 | % | 35.51 | % | 39.90 | % | 39.90 | % | 39.90 | % | FINANCE |
Jointly controlled entity | |||||||||||||
| Companhia Promotora UCI |
Brazil | 0.00 | % | 25.00 | % | 25.00 | % | 25.00 | % | 25.00 | % | FINANCIAL SERVICES |
Jointly controlled entity | |||||||||||||
| Compañía Española de Seguros de Crédito a la Exportación, S.A., Compañía de Seguros y Reaseguros (consolidated) |
Spain | 20.53 | % | 0.55 | % | 21.08 | % | 21.08 | % | 21.08 | % | CREDIT INSURANCE |
— | |||||||||||||
| Comprarcasa Servicios Inmobiliarios, S.A. |
Spain | 0.00 | % | 50.00 | % | 50.00 | % | 50.00 | % | 47.50 | % | PROPERTY SERVICES |
Jointly controlled entity | |||||||||||||
| Desarrollo Urbano de Patraix, S.A. |
Spain | 0.00 | % | 25.24 | % | 45.16 | % | — | — | PROPERTY |
— | |||||||||||||||
| Eko Energy Sp. z o.o. |
Poland | 0.00 | % | 12.49 | % | 22.00 | % | 22.00 | % | — | ELECTRICITY PRODUCTION |
— | ||||||||||||||
| Elincasiol, S.L. (consolidated) |
Spain | 0.00 | % | 46.19 | % | 46.19 | % | 46.19 | % | — | ELECTRICITY PRODUCTION |
Jointly controlled entity | ||||||||||||||
| Energía Eólica de México, S.A. de C.V. (consolidated) |
Mexico | 0.00 | % | 50.00 | % | 50.00 | % | 50.00 | % | 100.00 | % | HOLDING COMPANY |
Jointly controlled entity | |||||||||||||
| Energía Renovable del Istmo, S.A. de C.V. |
Mexico | 0.00 | % | 50.00 | % | 50.00 | % | 50.00 | % | — | ELECTRICITY PRODUCTION |
Jointly controlled entity | ||||||||||||||
| Enerstar Villena, S.A. |
Spain | 0.00 | % | 42.20 | % | 42.20 | % | 42.20 | % | — | ELECTRICITY PRODUCTION |
Jointly controlled entity | ||||||||||||||
| Farma Wiatrowa Jablowo Sp. z o.o. |
Poland | 0.00 | % | 12.26 | % | 21.60 | % | 21.60 | % | — | ELECTRICITY PRODUCTION |
— | ||||||||||||||
| FC2Egestión, S.L. |
Spain | 0.00 | % | 50.00 | % | 50.00 | % | 50.00 | % | 50.00 | % | ENVIRONMENTAL MANAGEMENT |
Jointly controlled entity | |||||||||||||
| Federal Home Loan Bank of Pittsburgh |
United States | 0.00 | % | 14.00 | % | 14.00 | % | 15.23 | % | 21.01 | % | BANKING |
— | |||||||||||||
| Federal Reserve Bank of Boston |
United States | 0.00 | % | 30.81 | % | 30.81 | % | 28.38 | % | 40.18 | % | BANKING |
— | |||||||||||||
| Fondo de Titulización de Activos |
Spain | — | (d) | — | — | — | SECURITIZATION |
Jointly controlled entity | ||||||||||||||||||
F-337
Table of Contents
| % of ownership held by the Bank |
% of voting power (b) |
|||||||||||||||||||||||||
| Company |
Location |
Direct | Indirect | 2014 | 2013 | 2012 | Line of business |
Type of company | ||||||||||||||||||
| Fondo de Titulización de Activos UCI 14 |
Spain | — | (d) | — | — | — | SECURITIZATION |
Jointly controlled entity | ||||||||||||||||||
| Fondo de Titulización de Activos UCI 15 |
Spain | — | (d) | — | — | — | SECURITIZATION |
Jointly controlled entity | ||||||||||||||||||
| Fondo de Titulización de Activos UCI 16 |
Spain | — | (d) | — | — | — | SECURITIZATION |
Jointly controlled entity | ||||||||||||||||||
| Fondo de Titulización de Activos UCI 17 |
Spain | — | (d) | — | — | — | SECURITIZATION |
Jointly controlled entity | ||||||||||||||||||
| Fondo de Titulización de Activos UCI 18 |
Spain | — | (d) | — | — | — | SECURITIZATION |
Jointly controlled entity | ||||||||||||||||||
| Fondo de Titulización Hipotecaria UCI 10 |
Spain | — | (d) | — | — | — | SECURITIZATION |
Jointly controlled entity | ||||||||||||||||||
| Fondo de Titulización Hipotecaria UCI 12 |
Spain | — | (d) | — | — | — | SECURITIZATION |
Jointly controlled entity | ||||||||||||||||||
| Fortune Auto Finance Co., Ltd |
China | 0.00 | % | 50.00 | % | 50.00 | % | 50.00 | % | — | FINANCE |
Jointly controlled entity | ||||||||||||||
| Friedrichstrasse, S.L. |
Spain | 35.00 | % | 0.00 | % | 35.00 | % | 35.00 | % | 35.00 | % | PROPERTY |
Associate | |||||||||||||
| Generación Andina S.A.C. |
Peru | 0.00 | % | 49.78 | % | 49.78 | % | — | — | ELECTRICITY PRODUCTION |
— | |||||||||||||||
| Gestión Santander, S.A. de C.V., Sociedad Operadora de Sociedades de Inversión |
Mexico | 0.00 | % | 50.00 | % | 50.00 | % | 50.00 | % | 100.00 | % | FUND MANAGEMENT COMPANY |
Jointly controlled entity | |||||||||||||
| Gire S.A. |
Argentina | 0.00 | % | 57.92 | % | 58.33 | % | 58.33 | % | 58.33 | % | COLLECTION AND PAYMENT SERVICES |
Associate | |||||||||||||
| Grupo Alimentario de Exclusivas, S.A. (a) |
Spain | 40.46 | % | 0.00 | % | 40.46 | % | 40.46 | % | 47.23 | % | FOOD |
Associate | |||||||||||||
| HCUK Auto Funding Ltd |
United Kingdom | — | (d) | — | — | — | SECURITIZATION |
Jointly controlled entity | ||||||||||||||||||
| Helican Desarrollo Eólico, S.L. |
Spain | 0.00 | % | 46.00 | % | 46.00 | % | 46.00 | % | 46.00 | % | ELECTRICITY PRODUCTION |
Jointly controlled entity | |||||||||||||
| Hidroatlixco, S.A.P.I. de C.V. |
Mexico | 0.00 | % | 50.76 | % | 50.76 | % | 50.76 | % | — | ELECTRICITY PRODUCTION |
Jointly controlled entity | ||||||||||||||
| HSH Delaware L.P. |
United States | 0.00 | % | 69.19 | % | 0.00 | % | 0.00 | % | 0.00 | % | HOLDING COMPANY |
— | |||||||||||||
| Hyundai Capital Germany GmbH |
Germany | 0.00 | % | 49.99 | % | 49.99 | % | 49.99 | % | 49.99 | % | SERVICES |
Jointly controlled entity | |||||||||||||
| Hyundai Capital UK Limited |
United Kingdom | 0.00 | % | 50.01 | % | 50.01 | % | 50.01 | % | 50.01 | % | FINANCE |
Jointly controlled entity | |||||||||||||
| Ideia Produções e Design Ltda - ME |
Brazil | 0.00 | % | 65.34 | % | 70.00 | % | 70.00 | % | — | SERVICES |
Jointly controlled entity | ||||||||||||||
| Imperial Holding S.C.A. |
Luxembourg | 0.00 | % | 36.36 | % | 36.36 | % | 36.36 | % | 36.36 | % | SECURITIES INVESTMENT |
— | |||||||||||||
F-338
Table of Contents
| % of ownership held by the Bank |
% of voting power (b) |
|||||||||||||||||||||||||
| Company |
Location |
Direct | Indirect | 2014 | 2013 | 2012 | Line of business |
Type of company | ||||||||||||||||||
| Indice Iberoamericano de Investigación y Conocimiento, A.I.E. |
Spain | 0.00 | % | 51.00 | % | 51.00 | % | 51.00 | % | 51.00 | % | INFORMATION SYSTEM |
Jointly controlled entity | |||||||||||||
| Inmo Alemania Gestión de Activos Inmobiliarios, S.A. |
Spain | 0.00 | % | 20.00 | % | 20.00 | % | 20.00 | % | 20.00 | % | HOLDING COMPANY |
— | |||||||||||||
| Inversiones ZS América Dos Ltda |
Chile | 0.00 | % | 49.00 | % | 49.00 | % | 49.00 | % | 49.00 | % | SECURITIES AND REAL ESTATE INVESTMENT |
Associate | |||||||||||||
| Inversiones ZS América SpA |
Chile | 0.00 | % | 49.00 | % | 49.00 | % | 49.00 | % | 49.00 | % | SECURITIES AND REAL ESTATE INVESTMENT |
Associate | |||||||||||||
| Invico S.A. |
Poland | 0.00 | % | 14.64 | % | 21.09 | % | 21.09 | % | 12.21 | % | COMMERCE |
— | |||||||||||||
| Izettle do Brasil Meios de Pagamento S.A. |
Brazil | 0.00 | % | 39.39 | % | 50.00 | % | — | — | CARDS |
Jointly controlled entity | |||||||||||||||
| J.C. Flowers I L.P. |
United States | 0.00 | % | 10.60 | % | 4.99 | % | 4.99 | % | 4.99 | % | HOLDING COMPANY |
— | |||||||||||||
| J.C. Flowers II-A L.P. |
Canada | 0.00 | % | 69.50 | % | 4.43 | % | 4.43 | % | 4.43 | % | HOLDING COMPANY |
— | |||||||||||||
| Jacinta Solar Farm S.R.L. |
Uruguay | 0.00 | % | 49.00 | % | 49.00 | % | — | — | ELECTRICITY PRODUCTION |
Jointly controlled entity | |||||||||||||||
| JCF AIV P L.P. |
Canada | 0.00 | % | 7.67 | % | 4.99 | % | 4.99 | % | 4.99 | % | HOLDING COMPANY |
— | |||||||||||||
| JCF BIN II-A |
Mauritania | 0.00 | % | 69.52 | % | 4.43 | % | 4.43 | % | 4.43 | % | HOLDING COMPANY |
— | |||||||||||||
| JCF II-A AIV K L.P. |
Canada | 0.00 | % | 69.52 | % | 0.00 | % | 0.00 | % | 0.00 | % | HOLDING COMPANY |
— | |||||||||||||
| JCF II-A Special AIV K L.P. |
Canada | 0.00 | % | 72.29 | % | 4.99 | % | 4.99 | % | 4.99 | % | HOLDING COMPANY |
— | |||||||||||||
| Jupiter III C.V. |
The Netherlands | 0.00 | % | 72.75 | % | 4.99 | % | 4.99 | % | 4.99 | % | HOLDING COMPANY |
— | |||||||||||||
| Jupiter JCF AIV II-A C.V. |
The Netherlands | 0.00 | % | 69.41 | % | 4.99 | % | 4.99 | % | 4.99 | % | HOLDING COMPANY |
— | |||||||||||||
| KM Locanet Ltda - ME |
Brazil | 0.00 | % | 65.34 | % | 70.00 | % | — | — | ADVERTISING |
Jointly controlled entity | |||||||||||||||
| Konesticial, S.L. |
Spain | 0.00 | % | 50.00 | % | 50.00 | % | 50.00 | % | — | HOLDING COMPANY |
Jointly controlled entity | ||||||||||||||
| L’Esplai Valencia, S.L. |
Spain | 0.00 | % | 20.68 | % | 37.00 | % | — | — | PROPERTY |
— | |||||||||||||||
| Luri 3, S.A. |
Spain | 10.00 | % | 0.00 | % | 10.00 | % | 10.00 | % | 10.00 | % | PROPERTY |
Jointly controlled entity | |||||||||||||
| Massachusetts Business Development Corp. (consolidated) |
United States | 0.00 | % | 21.60 | % | 21.60 | % | — | — | FINANCE |
— | |||||||||||||||
| Metrohouse Franchise S.A. |
Poland | 0.00 | % | 15.08 | % | 21.73 | % | — | — | PROPERTY |
Associate | |||||||||||||||
| Metrohouse S.A. |
Poland | 0.00 | % | 15.08 | % | 21.73 | % | 21.23 | % | 21.23 | % | PROPERTY |
Associate | |||||||||||||
| Monitise PLC (consolidated) |
United Kingdom | 5.08 | % | 0.00 | % | 5.08 | % | — | — | PAYMENT SERVICES |
— | |||||||||||||||
F-339
Table of Contents
| % of ownership held by the Bank |
% of voting power (b) |
|||||||||||||||||||||||||
| Company |
Location |
Direct | Indirect | 2014 | 2013 | 2012 | Line of business |
Type of company | ||||||||||||||||||
| Nevis Power Limited |
United Kingdom | 0.00 | % | 50.00 | % | 50.00 | % | 50.00 | % | 50.00 | % | ELECTRICITY PRODUCTION |
Jointly controlled entity | |||||||||||||
| New PEL S.a.r.l. |
Luxembourg | 0.00 | % | 7.67 | % | 0.00 | % | 0.00 | % | 0.00 | % | HOLDING COMPANY |
— | |||||||||||||
| NH Hoteles, S.A. (consolidated) |
Spain | 8.56 | % | 0.00 | % | 8.56 | % | — | — | HOTEL OPERATIONS |
— | |||||||||||||||
| NIB Special Investors IV-A LP |
Canada | 0.00 | % | 99.70 | % | 4.99 | % | 4.99 | % | 4.99 | % | HOLDING COMPANY |
— | |||||||||||||
| NIB Special Investors IV-B LP |
Canada | 0.00 | % | 95.80 | % | 4.99 | % | 4.99 | % | 4.99 | % | HOLDING COMPANY |
— | |||||||||||||
| Norchem Holdings e Negócios S.A. |
Brazil | 0.00 | % | 19.36 | % | 29.00 | % | 29.00 | % | 29.00 | % | HOLDING COMPANY |
Associate | |||||||||||||
| Norchem Participações e Consultoria S.A. |
Brazil | 0.00 | % | 44.51 | % | 50.00 | % | 50.00 | % | 50.00 | % | SECURITIES COMPANY |
Jointly controlled entity | |||||||||||||
| Nowotna Farma Wiatrowa Sp. z o.o. |
Poland | 0.00 | % | 12.26 | % | 21.60 | % | 21.60 | % | — | ELECTRICITY PRODUCTION |
— | ||||||||||||||
| NPG Wealth Management S.àr.l (consolidated) |
Luxembourg | 0.00 | % | 7.63 | % | 0.00 | % | 0.00 | % | 0.00 | % | HOLDING COMPANY |
— | |||||||||||||
| Odc Ambievo Tecnologia e Inovacao Ambiental, Industria e Comercio de Insumos Naturais Ltda. |
Brazil | 0.00 | % | 20.55 | % | 23.08 | % | — | — | TECHNOLOGY |
— | |||||||||||||||
| Olivant Investments Switzerland S.A. |
Luxembourg | 0.00 | % | 35.18 | % | 35.18 | % | 35.18 | % | 35.18 | % | HOLDING COMPANY |
Associate | |||||||||||||
| Olivant Limited (consolidated) |
Guernsey | 0.00 | % | 10.39 | % | 10.39 | % | 10.39 | % | 10.39 | % | HOLDING COMPANY |
— | |||||||||||||
| Omega Financial Services GmbH |
Germany | 0.00 | % | 50.00 | % | 50.00 | % | 50.00 | % | 50.00 | % | SERVICES |
Jointly controlled entity | |||||||||||||
| Operadora de Activos Alfa, S.A. de C.V. |
Mexico | 0.00 | % | 49.98 | % | 49.98 | % | 49.98 | % | 49.98 | % | FINANCE |
Associate | |||||||||||||
| Operadora de Activos Beta, S.A. de C.V. |
Mexico | 0.00 | % | 49.99 | % | 49.99 | % | 49.99 | % | 49.99 | % | FINANCE |
Associate | |||||||||||||
| Operadora de Tarjetas de Crédito Nexus S.A. |
Chile | 0.00 | % | 8.65 | % | 12.90 | % | 12.90 | % | — | CARDS |
Associate | ||||||||||||||
| Parque Eólico Reynosa I, S.A. de C.V. |
Mexico | 0.00 | % | 80.00 | % | 80.00 | % | — | — | ELECTRICITY PRODUCTION |
Jointly controlled entity | |||||||||||||||
| Parque Solar Afortunado, S.L. |
Spain | 98.00 | % | 0.00 | % | 25.00 | % | 25.00 | % | 25.00 | % | ELECTRICITY PRODUCTION |
Jointly controlled entity | |||||||||||||
| Parque Solar la Robla, S.L. |
Spain | 95.00 | % | 0.00 | % | 25.00 | % | 25.00 | % | 25.00 | % | ELECTRICITY PRODUCTION |
— | |||||||||||||
| Parque Solar Páramo, S.L. |
Spain | 92.00 | % | 0.00 | % | 25.00 | % | 25.00 | % | 25.00 | % | ELECTRICITY PRODUCTION |
Jointly controlled entity | |||||||||||||
| Parque Solar Saelices, S.L. |
Spain | 95.00 | % | 0.00 | % | 25.00 | % | 25.00 | % | 25.00 | % | ELECTRICITY PRODUCTION |
— | |||||||||||||
| Parques Empresariales Gran Europa, S.A. (consolidated) |
Spain | 0.00 | % | 27.94 | % | 50.00 | % | — | — | LAND MANAGEMENT |
— | |||||||||||||||
| Partang, SGPS, S.A. |
Portugal | 0.00 | % | 48.90 | % | 49.00 | % | 49.00 | % | 49.00 | % | HOLDING COMPANY |
Associate | |||||||||||||
| Polesine, S.A. |
Uruguay | 0.00 | % | 40.00 | % | 40.00 | % | — | — | ELECTRICITY PRODUCTION |
Jointly controlled entity | |||||||||||||||
F-340
Table of Contents
| % of ownership held by the Bank |
% of voting power (b) |
|||||||||||||||||||||||||
| Company |
Location |
Direct | Indirect | 2014 | 2013 | 2012 | Line of business |
Type of company | ||||||||||||||||||
| POLFUND - Fundusz Poręczeń Kredytowych S.A. |
Poland | 0.00 | % | 34.71 | % | 50.00 | % | 50.00 | % | 50.00 | % | MANAGEMENT COMPANY |
Associate | |||||||||||||
| Ponte Albanito S.r.l. |
Italy | 0.00 | % | 30.00 | % | 30.00 | % | 30.00 | % | — | ELECTRICITY PRODUCTION |
Jointly controlled entity | ||||||||||||||
| Prodesur Mediterráneo, S.L. |
Spain | 0.00 | % | 50.23 | % | 50.23 | % | 50.23 | % | 50.00 | % | PROPERTY |
Jointly controlled entity | |||||||||||||
| Proinsur Mediterráneo, S.L. |
Spain | 0.00 | % | 50.00 | % | 50.00 | % | 50.00 | % | 50.00 | % | PROPERTY |
Jointly controlled entity | |||||||||||||
| Promotora de Informaciones, S.A. |
Spain | 4.56 | % | 5.30 | % | 9.86 | % | — | — | COMMUNICATIONS |
— | |||||||||||||||
| PSA Finance PLC |
United Kingdom | 0.00 | % | 50.00 | % | 50.00 | % | 50.00 | % | 50.00 | % | LEASING |
Associate | |||||||||||||
| Q 205 Real Estate GmbH |
Germany | 0.00 | % | 17.50 | % | 17.50 | % | 17.50 | % | 17.50 | % | PROPERTY |
— | |||||||||||||
| Queenford, S.L. |
Spain | 0.00 | % | 49.00 | % | 49.00 | % | 49.00 | % | 49.00 | % | PROPERTY |
Associate | |||||||||||||
| Redbanc S.A. |
Chile | 0.00 | % | 22.40 | % | 33.43 | % | 33.43 | % | 33.43 | % | SERVICES |
Associate | |||||||||||||
| Redsys Servicios de Procesamiento, S.L.U. |
Spain | 16.97 | % | 0.00 | % | 16.97 | % | 16.97 | % | 16.29 | % | CARDS |
Associate | |||||||||||||
| Retama Real Estate, S.A. |
Spain | 0.00 | % | 50.00 | % | 50.00 | % | 50.00 | % | 50.00 | % | SERVICES |
Jointly controlled entity | |||||||||||||
| Rías Redbanc, S.A. |
Uruguay | 0.00 | % | 20.00 | % | 20.00 | % | 20.00 | % | 20.00 | % | SERVICES |
— | |||||||||||||
| Rio Alto Gestão de Créditos e Participações, S.A. |
Brazil | 0.00 | % | 44.51 | % | 50.00 | % | 50.00 | % | — | COLLECTION AND PAYMENT SERVICES |
— | ||||||||||||||
| S Portfolio M UK Limited |
United Kingdom | 0.00 | % | 50.00 | % | 50.00 | % | 50.00 | % | 100.00 | % | FINANCE |
Jointly controlled entity | |||||||||||||
| SAM Brasil Participações Ltda. |
Brazil | 1.00 | % | 49.50 | % | 50.50 | % | 50.00 | % | — | HOLDING COMPANY |
Jointly controlled entity | ||||||||||||||
| SAM Finance Lux S.à.r.l. |
Luxembourg | 0.00 | % | 50.00 | % | 50.00 | % | 50.00 | % | — | MANAGEMENT COMPANY |
Jointly controlled entity | ||||||||||||||
| SAM Investment Holdings Limited |
Jersey | 0.00 | % | 50.00 | % | 50.00 | % | 50.00 | % | — | HOLDING COMPANY |
Jointly controlled entity | ||||||||||||||
| Santander Ahorro Inmobiliario 1, S.I.I., S.A. |
Spain | 30.94 | % | 0.01 | % | 30.95 | % | 30.95 | % | 28.77 | % | REAL ESTATE INVESTMENT |
Associate | |||||||||||||
| Santander Asset Management Luxembourg, S.A. |
Luxembourg | 0.00 | % | 50.00 | % | 50.00 | % | 50.00 | % | 100.00 | % | FUND MANAGEMENT COMPANY |
Jointly controlled entity | |||||||||||||
| Santander Asset Management S.A. Administradora General de Fondos |
Chile | 0.00 | % | 49.99 | % | 49.99 | % | 49.99 | % | 100.00 | % | FUND MANAGEMENT COMPANY |
Jointly controlled entity | |||||||||||||
| Santander Asset Management UK Holdings Limited |
United Kingdom | 0.00 | % | 50.00 | % | 50.00 | % | 50.00 | % | 100.00 | % | HOLDING COMPANY |
Jointly controlled entity | |||||||||||||
| Santander Asset Management UK Limited |
United Kingdom | 0.00 | % | 50.00 | % | 50.00 | % | 50.00 | % | 100.00 | % | FUND AND PORTFOLIO MANAGER |
Jointly controlled entity | |||||||||||||
F-341
Table of Contents
| % of ownership held by the Bank |
% of voting power (b) |
|||||||||||||||||||||||||
| Company |
Location |
Direct | Indirect | 2014 | 2013 | 2012 | Line of business |
Type of company | ||||||||||||||||||
| Santander Asset Management USA, LLC |
United States | 0.00 | % | 50.00 | % | 50.00 | % | 50.00 | % | — | FUND AND ASSET MANAGEMENT COMPANY |
Jointly controlled entity | ||||||||||||||
| Santander Asset Management, LLC |
Puerto Rico | 0.00 | % | 50.00 | % | 50.00 | % | 50.00 | % | 100.00 | % | MANAGEMENT COMPANY |
Jointly controlled entity | |||||||||||||
| Santander Asset Management, S.A., S.G.I.I.C. |
Spain | 0.00 | % | 50.00 | % | 50.00 | % | 50.00 | % | 100.00 | % | FUND MANAGEMENT COMPANY |
Jointly controlled entity | |||||||||||||
| Santander Brasil Asset Management Distribuidora de Títulos e Valores Mobiliários S.A. |
Brazil | 0.00 | % | 50.50 | % | 50.50 | % | 50.00 | % | 100.00 | % | MANAGEMENT COMPANY |
Jointly controlled entity | |||||||||||||
| Santander Brasil Gestão de Recursos Ltda. |
Brazil | 0.00 | % | 50.00 | % | 50.00 | % | 50.00 | % | — | REAL ESTATE INVESTMENT |
Jointly controlled entity | ||||||||||||||
| Santander Elavon Merchant Services Entidad de Pago, S.L. |
Spain | 49.00 | % | 0.00 | % | 49.00 | % | 49.00 | % | — | PAYMENT SERVICES |
Jointly controlled entity | ||||||||||||||
| Santander Insurance Europe Limited |
Ireland | 0.00 | % | 49.00 | % | 49.00 | % | 100.00 | % | 100.00 | % | INSURANCE BROKER |
Associate | |||||||||||||
| Santander Insurance Life Limited |
Ireland | 0.00 | % | 49.00 | % | 49.00 | % | 100.00 | % | 100.00 | % | INSURANCE BROKER |
Associate | |||||||||||||
| Santander Insurance Services Ireland Limited |
Ireland | 0.00 | % | 49.00 | % | 49.00 | % | 100.00 | % | 100.00 | % | SERVICES |
Associate | |||||||||||||
| Santander Pensiones, S.A., E.G.F.P. |
Spain | 0.00 | % | 50.00 | % | 50.00 | % | 50.00 | % | 100.00 | % | PENSION FUND MANAGEMENT COMPANY |
Jointly controlled entity | |||||||||||||
| Santander Río Asset Management Gerente de Fondos Comunes de Inversión S.A. |
Argentina | 0.00 | % | 50.00 | % | 50.00 | % | 50.00 | % | 100.00 | % | FUND MANAGEMENT COMPANY |
Jointly controlled entity | |||||||||||||
| Saturn Japan II Sub C.V. |
The Netherlands | 0.00 | % | 69.30 | % | 0.00 | % | 0.00 | % | 0.00 | % | HOLDING COMPANY |
— | |||||||||||||
| Saturn Japan III Sub C.V. |
The Netherlands | 0.00 | % | 72.71 | % | 0.00 | % | 0.00 | % | 0.00 | % | HOLDING COMPANY |
— | |||||||||||||
| Saudi Hollandi Bank (consolidated) |
Saudi Arabia | 0.00 | % | 11.16 | % | 11.16 | % | 11.16 | % | 11.16 | % | BANKING |
— | |||||||||||||
| Servicios de Infraestructura de Mercado OTC S.A. |
Chile | 0.00 | % | 7.45 | % | 11.11 | % | 11.11 | % | — | SERVICES |
Associate | ||||||||||||||
| Sociedad de Gestión de Activos Procedentes de la Reestructuración Bancaria, S.A. |
Spain | 17.28 | % | 0.00 | % | 17.28 | % | 17.28 | % | 17.15 | % | FINANCIAL SERVICES |
— | |||||||||||||
| Sociedad Interbancaria de Depósitos de Valores S.A. |
Chile | 0.00 | % | 19.63 | % | 29.29 | % | 29.29 | % | 29.29 | % | SECURITIES DEPOSITORY SERVICES |
Associate | |||||||||||||
| Sociedad Promotora Bilbao Plaza Financiera, S.A. |
Spain | 19.04 | % | 14.86 | % | 33.90 | % | 33.90 | % | 33.90 | % | ADVISORY SERVICES |
— | |||||||||||||
| Solar Energy Capital Europe S.à.r.l. (consolidated) |
Luxembourg | 0.00 | % | 33.33 | % | 33.33 | % | 33.33 | % | 33.33 | % | HOLDING COMPANY |
Jointly controlled entity | |||||||||||||
| Stephens Ranch Wind Energy Holdco LLC |
United States | 0.00 | % | 44.00 | % | 44.00 | % | — | — | ELECTRICITY PRODUCTION |
— | |||||||||||||||
| SUTM Limited |
United Kingdom | 0.00 | % | 50.00 | % | 50.00 | % | 50.00 | % | 100.00 | % | FUND AND PORTFOLIO MANAGER |
Jointly controlled entity | |||||||||||||
| Tbforte Segurança e Transporte de Valores Ltda. |
Brazil | 0.00 | % | 18.49 | % | 19.81 | % | — | — | SECURITY |
Associate | |||||||||||||||
| Tbnet Comércio, Locação e Administração Ltda. |
Brazil | 0.00 | % | 18.49 | % | 19.81 | % | — | — | TELECOMMUNICATIONS |
Associate | |||||||||||||||
F-342
Table of Contents
| % of ownership held by the Bank |
% of voting power (b) |
|||||||||||||||||||||||||
| Company |
Location |
Direct | Indirect | 2014 | 2013 | 2012 | Line of business |
Type of company | ||||||||||||||||||
| Tecnologia Bancária S.A. |
Brazil | 0.00 | % | 18.49 | % | 19.81 | % | 20.82 | % | 20.82 | % | ATMs |
Associate | |||||||||||||
| Tecnologia e Sistemas Avançados S.A. |
Brazil | 0.00 | % | 22.10 | % | 24.83 | % | — | — | TECHNOLOGY |
— | |||||||||||||||
| Teka Industrial, S.A. (consolidated) |
Spain | 0.00 | % | 9.42 | % | 9.42 | % | 9.42 | % | 9.42 | % | DOMESTIC APPLIANCES |
— | |||||||||||||
| The HSH AIV 4 Trust |
United States | 0.00 | % | 69.19 | % | 4.99 | % | 4.99 | % | 4.99 | % | HOLDING COMPANY |
— | |||||||||||||
| Tonopah Solar Energy Holdings I, LLC (consolidated) |
United States | 0.00 | % | 26.80 | % | 26.80 | % | 26.80 | % | — | HOLDING COMPANY |
Associate | ||||||||||||||
| TOPSAM, S.A de C.V. |
Mexico | 0.00 | % | 50.00 | % | 50.00 | % | — | — | FUND MANAGEMENT COMPANY |
Jointly controlled entity | |||||||||||||||
| Trabajando.com Chile S.A. |
Chile | 0.00 | % | 33.33 | % | 33.33 | % | 33.33 | % | 33.33 | % | SERVICES |
Associate | |||||||||||||
| Transbank S.A. |
Chile | 0.00 | % | 16.75 | % | 25.00 | % | 25.00 | % | 25.00 | % | CARDS |
Associate | |||||||||||||
| Transolver Finance EFC, S.A. |
Spain | 0.00 | % | 50.00 | % | 50.00 | % | 50.00 | % | 50.00 | % | LEASING |
Jointly controlled entity | |||||||||||||
| U.C.I., S.A. |
Spain | 50.00 | % | 0.00 | % | 50.00 | % | 50.00 | % | 50.00 | % | HOLDING COMPANY |
Jointly controlled entity | |||||||||||||
| UCI Holding Brasil Ltda |
Brazil | 0.00 | % | 50.00 | % | 50.00 | % | 50.00 | % | 50.00 | % | HOLDING COMPANY |
Jointly controlled entity | |||||||||||||
| UCI Mediação de Seguros Unipessoal, Lda. |
Portugal | 0.00 | % | 50.00 | % | 50.00 | % | 50.00 | % | 50.00 | % | INSURANCE BROKER |
Jointly controlled entity | |||||||||||||
| Unicre-Instituição Financeira de Crédito, S.A. |
Portugal | 0.00 | % | 21.46 | % | 21.50 | % | 21.50 | % | 21.50 | % | FINANCE |
Associate | |||||||||||||
| Unión de Créditos Inmobiliarios, S.A., EFC |
Spain | 0.00 | % | 50.00 | % | 50.00 | % | 50.00 | % | 50.00 | % | MORTGAGE LOAN COMPANY |
Jointly controlled entity | |||||||||||||
| Urbanizadora Valdepolo I, S.A. |
Spain | 0.00 | % | 27.94 | % | 50.00 | % | — | — | PROPERTY |
— | |||||||||||||||
| Urbanizadora Valdepolo II, S.A. |
Spain | 0.00 | % | 27.94 | % | 50.00 | % | — | — | PROPERTY |
— | |||||||||||||||
| Urbanizadora Valdepolo III, S.A. |
Spain | 0.00 | % | 27.94 | % | 50.00 | % | — | — | PROPERTY |
— | |||||||||||||||
| Urbanizadora Valdepolo IV, S.A. |
Spain | 0.00 | % | 27.94 | % | 50.00 | % | — | — | PROPERTY |
— | |||||||||||||||
| Valdicsa, S.A. |
Spain | 0.00 | % | 18.44 | % | 33.00 | % | — | — | PROPERTY |
— | |||||||||||||||
| Vector Software Factory, S.L. (consolidated) |
Spain | 0.00 | % | 45.00 | % | 45.00 | % | 45.00 | % | 45.00 | % | IT |
Associate | |||||||||||||
| Viking Consortium Holdings Limited (consolidated) |
United Kingdom | 0.00 | % | 24.99 | % | 24.99 | % | 24.99 | % | 24.99 | % | HOLDING COMPANY |
— | |||||||||||||
| Virtual Motors Páginas Eletrônicas Ltda |
Brazil | 0.00 | % | 65.34 | % | 70.00 | % | — | — | INTERNET |
Jointly controlled entity | |||||||||||||||
| Webmotors S.A. |
Brazil | 0.00 | % | 65.34 | % | 70.00 | % | 70.00 | % | 100.00 | % | SERVICES |
Jointly controlled entity | |||||||||||||
| Yaap Digital Services, S.L. |
Spain | 33.33 | % | 0.00 | % | 33.33 | % | 33.33 | % | — | SERVICES |
Associate | ||||||||||||||
F-343
Table of Contents
| % of ownership held by the Bank |
% of voting power (b) |
|||||||||||||||||||||||||
| Company |
Location |
Direct | Indirect | 2014 | 2013 | 2012 | Line of business |
Type of company | ||||||||||||||||||
| Zakłady Przemysłu Jedwabniczego DOLWIS S.A. w upadłości likwidacyjnej (a) |
Poland | 0.00 | % | 30.54 | % | 44.00 | % | 44.00 | % | — | TEXTILE PRODUCTION | — | ||||||||||||||
| Zurich Santander Brasil Seguros e Previdência S.A. |
Brazil | 0.00 | % | 48.79 | % | 48.79 | % | 48.79 | % | 49.00 | % | INSURANCE | Associate | |||||||||||||
| Zurich Santander Brasil Seguros S.A. |
Brazil | 0.00 | % | 48.79 | % | 48.79 | % | 48.79 | % | 49.00 | % | INSURANCE | Associate | |||||||||||||
| Zurich Santander Holding (Spain), S.L. |
Spain | 0.00 | % | 49.00 | % | 49.00 | % | 49.00 | % | 49.00 | % | HOLDING COMPANY | Associate | |||||||||||||
| Zurich Santander Holding Dos (Spain), S.L. |
Spain | 0.00 | % | 49.00 | % | 49.00 | % | 49.00 | % | 49.00 | % | HOLDING COMPANY | Associate | |||||||||||||
| Zurich Santander Insurance América, S.L. |
Spain | 49.00 | % | 0.00 | % | 49.00 | % | 49.00 | % | 49.00 | % | HOLDING COMPANY | Associate | |||||||||||||
| Zurich Santander Seguros Argentina S.A. |
Argentina | 0.00 | % | 49.00 | % | 49.00 | % | 49.00 | % | 49.00 | % | INSURANCE | Associate | |||||||||||||
| Zurich Santander Seguros de Vida Chile S.A. |
Chile | 0.00 | % | 49.00 | % | 49.00 | % | 49.00 | % | 49.00 | % | INSURANCE | Associate | |||||||||||||
| Zurich Santander Seguros Generales Chile S.A. |
Chile | 0.00 | % | 49.00 | % | 49.00 | % | 49.00 | % | 49.00 | % | INSURANCE | Associate | |||||||||||||
| Zurich Santander Seguros México, S.A. |
Mexico | 0.00 | % | 49.00 | % | 49.00 | % | 49.00 | % | 49.00 | % | INSURANCE | Associate | |||||||||||||
| Zurich Santander Seguros Uruguay, S.A. |
Uruguay | 0.00 | % | 49.00 | % | 49.00 | % | 49.00 | % | 49.00 | % | INSURANCE | Associate | |||||||||||||
| (a) | Company in liquidation as at December 31, 2014. |
| (b) | Pursuant to Article 3 of Royal Decree 1159/2010, of September 17, approving the rules for the preparation of consolidated financial statements, in order to determine voting power, the voting power relating to subsidiaries or to other persons acting in their own name but on behalf of Group companies was added to the voting power directly held by the Parent. For these purposes, the number of votes corresponding to the Parent in relation to companies over which it exercises indirect control is the number corresponding to each subsidiary holding a direct ownership interest in such companies. |
| (c) | Excluding the Group companies listed in Exhibit I and those of negligible interest with respect to the fair presentation that the consolidated financial statements must express (pursuant to Article 48 of the Spanish Commercial Code and Article 260 of the Spanish Limited Liability Companies Law). |
| (d) | Companies over which the non-subsidiary investee of the Group exercises effective control. |
F-344
Table of Contents
Exhibit III
Preference share issuer subsidiaries
| % of ownership held by the Bank |
||||||||||||
| Company |
Location | Direct | Indirect | Line of business | ||||||||
| Banesto Holdings, Ltd. (a) |
Guernsey | 99.99 | % | 0.00 | % | INACTIVE | ||||||
| Emisora Santander España, S.A. Sole-Shareholder Company |
Spain | 100.00 | % | 0.00 | % | FINANCE | ||||||
| Santander Emisora 150, S.A. Sole-Shareholder Company |
Spain | 100.00 | % | 0.00 | % | FINANCE | ||||||
| Santander Finance Capital, S.A. Sole-Shareholder Company |
Spain | 100.00 | % | 0.00 | % | FINANCE | ||||||
| Santander Finance Preferred, S.A. Sole-Shareholder Company |
Spain | 100.00 | % | 0.00 | % | FINANCE | ||||||
| Santander International Preferred, S.A. Sole-Shareholder Company |
Spain | 100.00 | % | 0.00 | % | FINANCE | ||||||
| Sovereign Real Estate Investment Trust |
United States | 0.00 | % | 100.00 | % | FINANCE | ||||||
| Totta & Açores Financing, Limited |
Cayman Islands | 0.00 | % | 99.80 | % | FINANCE | ||||||
| (a) | Company in liquidation as at December 31, 2014. |
F-345
Table of Contents
Exhibit IV
Notifications of acquisitions and disposals of investments in 2014
(Article 155 of the Spanish Limited Liability Companies Law and Article 53 of Securities Market Law 24/1998).
On January 3, 2014, the CNMV registered a notification from Banco Santander which disclosed that Santander Group’s ownership interest in BOLSAS Y MERCADOS ESPAÑOLES, SOCIEDAD HOLDING DE MERCADOS Y SISTEMAS FINANCIEROS, S.A. had exceeded 3% on December 23, 2013.
On January 8, 2014, the CNMV registered a notification from Banco Santander which disclosed that Santander Group’s ownership interest in BOLSAS Y MERCADOS ESPAÑOLES, SOCIEDAD HOLDING DE MERCADOS Y SISTEMAS FINANCIEROS, S.A. had fallen below 3% on January 3, 2014.
On April 3, 2014, the CNMV registered a notification from Banco Santander which disclosed that Santander Group’s ownership interest in BOLSAS Y MERCADOS ESPAÑOLES, SOCIEDAD HOLDING DE MERCADOS Y SISTEMAS FINANCIEROS, S.A. had fallen below 1% on March 31, 2014.
On May 14, 2014, the CNMV registered a notification from Banco Santander which disclosed that Santander Group’s ownership interest in OBRASCON HUARTE LAIN, S.A. had exceeded 3% on May 6, 2014.
On May 14, 2014, the CNMV registered a notification from Banco Santander which disclosed that Santander Group’s ownership interest in OBRASCON HUARTE LAIN, S.A. had fallen below 3% on May 8, 2014.
On July 25, 2014, the CNMV registered a notification from Banco Santander which disclosed that Santander Group’s ownership interest in PROMOTORA DE INFORMACIONES, S.A. had exceeded 5% on July 17, 2014.
On September 18, 2014, the CNMV registered a notification from Banco Santander which disclosed that Santander Group’s ownership interest in PROMOTORA DE INFORMACIONES, S.A. had fallen below 5% on September 11, 2014.
F-346
Table of Contents
Exhibit V
Other information on the Group’s banks
| A) | Following is certain information on the share capital of the Group’s main banks based on their total assets. |
| 1. | Santander UK plc |
a) Number of financial equity instruments held by the Group
Santander UK plc has issued 31,051,768,866 ordinary shares with a par value of GBP 0.10 each, amounting to GBP 3,105,176,886.6. On January 10, 2014, Cántabro Catalana de Inversiones, S.A. transferred one ordinary share with a par value of GBP 0.10 to Banco Santander, S.A. for GBP 1. Subsequently, on April 1, 2014, Banco Santander, S.A. transferred 24,117,268,866.6 ordinary shares with a par value of GBP 0.10 each to Santander UK Group Holdings Limited for GBP 2,411,726,886.6. Also, on April 1, 2014, Santusa Holding, S.L. transferred 6,934,500,000 shares with a par value of GBP 0.10 each to Santander UK Group Holdings Limited for GBP 693,450,000. As at December 31, 2014, the Group holds all the ordinary share capital (31,051,768,866 ordinary shares with a par value of GBP 0.10 each, amounting to GBP 3,105,176,886.6) through Santander UK Group Holdings Limited.
On October 23, 1995, Santander UK plc issued 10.0625% exchangeable capital securities amounting to GBP 200,000,000, exchangeable into 200,000,000 10.375% non-cumulative sterling preference shares with a par value of GBP 1 each. At December 31, 2014, the Group held all the 10.0625% exchangeable capital securities (amounting to GBP 200,000,000) through Banco Santander, S.A.
Also, on October 23, 1995, Santander UK plc issued 10.375% non-cumulative sterling preference shares amounting to GBP 100,000,000 with a par value of GBP 1 each, and on February 9, 1996 Santander UK plc issued additional 10.375% non-cumulative sterling preference shares amounting to GBP 100,000,000 with a par value of GBP 1 each. At December 31, 2014, the Group held all the 10.375% non-cumulative sterling preference shares (amounting to GBP 200,000,000) through Banco Santander, S.A.
On June 6, 1997, Santander UK plc issued 8.625% non-cumulative sterling preference shares amounting to GBP 125,000,000 with a par value of GBP 1 each. At December 31, 2014, the Group held all the 8.625% non-cumulative sterling preference shares (amounting to GBP 125,000,000) through Banco Santander, S.A.
On April 28, 2010, pursuant to current legislation, preference shares of Alliance & Leicester Limited (formerly Alliance & Leicester plc) were exchanged for 300,002 redeemable fixed/floating rate series A non-cumulative preference shares of Santander UK plc amounting to GBP 300,002,000, with a par value of GBP 1 each and a liquidation preference of GBP 1,000. On December 16, 2014, Santander UK plc repurchased 265,069 redeemable fixed/floating rate series A non-cumulative preference shares for GBP 265,069,000. At December 31, 2014, 34,933 redeemable fixed/floating rate series A non-cumulative preference shares, amounting to GBP 34,933,000, were still outstanding.
b) Capital increases in progress
No approved capital increases are in progress.
F-347
Table of Contents
c) Repurchases of share capital authorized by the shareholders at the general meeting
The shareholders at the annual general meeting held on April 17, 2014 resolved to unconditionally authorize the company to carry out the following repurchases of share capital.
1. The repurchase of its own 8.625% non-cumulative sterling preference shares subject to the following conditions:
| (a) | The company may repurchase up to 125,000,000 of the 8.625% non-cumulative sterling preference shares. |
| (b) | The lowest price that the company may pay for the 8.625% non-cumulative sterling preference shares will be 75% of the average market price of the preference shares for the five days prior to the purchase; and |
| (c) | The highest price (excluding costs) that the company may pay for each 8.625% non-cumulative preference sterling share will be 125% of the average market price of the preference shares for the five days prior to the purchase. |
It is hereby stated that this authorization will expire at the date of the company’s next annual general meeting unless it is renewed, amended or revoked by the company. However, prior to such expiry, the company may enter into an agreement on the repurchase of its 8.625% preference shares even if the purchase is finalized after this authorization expires.
2. The repurchase of its own 10.375% non-cumulative sterling preference shares subject to the following conditions:
| (a) | The company may repurchase up to 200,000,000 of the 10.375% preference shares; |
| (b) | The lowest price that the company may pay for the 10.375% non-cumulative sterling preference shares will be 75% of the average market price of the preference shares for the five days prior to the purchase; and |
| (c) | The highest price (excluding costs) that the company may pay for each 10.375% non-cumulative preference sterling share will be 125% of the average market price of the preference shares for the five days prior to the purchase. |
It is hereby stated that this authorization will expire at the date of the company’s next annual general meeting unless it is renewed, amended or revoked by the company. However, prior to such expiry, the company may enter into an agreement on the repurchase of its 10.375% preference shares even if the purchase is finalized after this authorization expires.
3. The repurchase of its own redeemable fixed/floating rate series A non-cumulative preference shares subject to the following conditions:
| (a) | The company may repurchase up to 300,002 redeemable fixed/floating rate series A non-cumulative preference shares; |
| (b) | The lowest price that the company may pay for the redeemable fixed/floating rate series A non-cumulative preference shares will be 75% of the average market price of the preference shares for the five days prior to the purchase; and |
F-348
Table of Contents
| (c) | The highest price (excluding costs) that the company may pay for each of the redeemable fixed/floating rate series A non-cumulative preference shares will be 125% of the average market price of the preference shares for the five days prior to the purchase. |
It is hereby stated that this authorization will expire at the date of the company’s next annual general meeting unless it is renewed, amended or revoked by the company. However, prior to such expiry, the company may enter into an agreement on the repurchase of its redeemable fixed/floating rate series A non-cumulative preference shares even if the purchase is finalized after this authorization expires.
However, prior to such expiry, the company may submit bids or adopt resolutions that could require the allocation of shares and the directors may allocate shares in accordance with any bid or resolution, considering the expiry of the authorization granted in this resolution.
In accordance with this resolution, any previous authorizations granted to the directors and not exercised for the allocation of shares are hereby revoked and substituted, notwithstanding any allocation of shares or grant of rights already completed, offered or agreed.
d) Rights on founder’s shares, “rights” bonds, convertible debentures and similar securities or rights
Not applicable.
e) Specific circumstances that restrict the availability of reserves
Not applicable.
f) Non-Group entities which hold, directly or through subsidiaries, 10% or more of equity
Not applicable.
g) Quoted equity instruments
Not applicable.
| 2. | Abbey National Treasury Services plc |
a) Number of financial equity instruments held by the Group
The Group holds ordinary shares amounting to GBP 2,549,000,000 through Santander UK plc (2,548,999,999 ordinary shares with a par value of GBP 1 each) and Abbey National Nominees Limited (1 ordinary share with a par value of GBP 1).
The Group also holds 1,000 tracker shares (shares without voting rights but with preferential dividend rights) amounting to GBP 1,000 and 1,000 B tracker shares amounting to GBP 1,000 through Santander UK plc, both with a par value of GBP 1 each.
b) Capital increases in progress
No approved capital increases are in progress.
F-349
Table of Contents
c) Capital authorized by the shareholders at the general meeting
Not applicable.
d) Rights on founder’s shares, “rights” bonds, convertible debentures and similar securities or rights
Not applicable.
e) Specific circumstances that restrict the availability of reserves
Not applicable.
f) Entities which hold, directly or through subsidiaries, 10% or more of equity
Not applicable.
g) Quoted equity instruments
Not applicable.
| 3. | Banco Santander (Brasil) S.A. |
a) Number of equity instruments held by the Group
The Group holds 3,440,170,512 ordinary shares and 3,273,507,089 preference shares through Banco Santander, S.A. and its subsidiaries Sterrebeeck B.V., Grupo Empresarial Santander, S.L., Santander Insurance Holding, S.L. and Banco Madesant - Sociedade Unipessoal, S.A.
The shares composing the share capital of Banco Santander (Brasil), S.A. have no par value and there are no capital payments payable. At 2014 year-end the bank’s treasury shares consisted of 29,611,742 ordinary shares and 29,611,742 preference shares, with a total of 59,223,484 shares.
In accordance with current Bylaws (Article 5.7) the preference shares do not confer voting rights on their holders, except under the following circumstances:
a) In the event of the transformation, merger, consolidation or spin-off of the company.
b) In the event of approval of agreements between the company and the shareholders, either directly, through third parties or other companies in which the shareholders hold a stake, provided that, due to legal or bylaw provisions, they are submitted to a general meeting.
c) In the event of an assessment of the assets used to increase the company’s share capital.
d) In the event of the selection of a specialized entity or company to determine the economic value of the company.
e) In the event of a public offering due to a change in control of the company, the holders of preference shares are guaranteed the right to sell the shares at the same price paid for the block of shares that changed hands as part of the change of control, i.e. they are treated the same as shareholders with voting rights.
F-350
Table of Contents
The General Assembly may, at any moment, decide to convert the preference shares into ordinary shares, establishing a reason for the conversion.
However, the preference shares do have the following advantages (Article 5.6):
a) Their dividends are 10% higher than those on ordinary shares.
b) Priority in the distribution of dividends.
c) Participation, on the same terms as ordinary shares, in capital increases resulting from the capitalization of reserves and profits and in the distribution of bonus shares arising from the capitalization of retained earnings, reserves or any other funds.
d) Priority in the reimbursement of capital in the event of the dissolution of the company.
e) In the event of a public offering due to a change in control of the company, the holders of preference shares are guaranteed the right to sell the shares at the same price paid for the block of shares that changed hands as part of the change of control, i.e. they are treated the same as shareholders with voting rights.
b) Capital increases in progress
No approved capital increases are in progress.
c) Capital authorized by the shareholders at the general meeting
The company is authorized to increase share capital, subject to approval by the board of directors, up to a limit of 9,090,909,090 ordinary shares or preference shares, and without the need to maintain any ratio between any of the different classes of shares, provided they remain within the limits of the maximum number of preference shares established by Law.
At present the share capital consists of 7,600,840,325 shares (3,869,849,668 ordinary shares and 3,730,990,657 preference shares).
d) Rights on founder’s shares, “rights” bonds, convertible debentures and similar securities or rights
Not applicable.
e) Specific circumstances that restrict the availability of reserves
The only restriction on the availability of Banco Santander (Brasil), S.A.’s reserves relates to the legal reserve (restricted reserves), which can only be used to offset losses or to increase capital.
The legal reserve is provided for in Article 196 of the Spanish Public Limited Liability Companies Law, which establishes that before being allocated to any other purpose, 5% of profits must be transferred to the legal reserve, which must not exceed 20% of share capital.
F-351
Table of Contents
f) Non-Group entities which hold, directly or through subsidiaries, 10% or more of equity
Not applicable.
g) Quoted equity instruments
All the shares are listed on the Brazilian Securities, Commodities and Futures Exchange (BM&FBOVESPA) and the share deposit certificates (units) are listed on the New York Stock Exchange (NYSE).
| 4. | Santander Bank, National Association |
a) Number of financial equity instruments held by the Group
At December 31, 2014, the Group held 530,391,043 ordinary shares that carry the same voting and dividend acquisition rights over Santander Holdings USA, Inc. (SHUSA). This holding company and Independence Community Bank Corp. (ICBC) hold 1,237 ordinary shares with a par value of USD 1 each, which carry the same voting rights. These shares constitute all the share capital of Santander Bank, National Association (SBNA).
b) Capital increases in progress
At December 31, 2014 there were no approved capital increases.
c) Capital authorized by the shareholders at the general meeting
SHUSA holds an 80.84% ownership interest in SBNA, and the remaining 19.16% belongs to ICBC. ICBC is wholly owned by SHUSA. There is no shareholders’ meeting for the ordinary shares of SBNA.
d) Rights on founder’s shares, “rights” bonds, convertible debentures and similar securities or rights
Not applicable.
e) Specific circumstances that restrict the availability of reserves
Not applicable.
f) Non-Group entities which hold, directly or through subsidiaries, 10% or more of equity
Not applicable.
g) Quoted equity instruments
Class C preference shares are listed on the New York Stock Exchange (NYSE).
F-352
Table of Contents
| 5. | Banco Santander (México), S.A., Institución de Banca Múltiple, Grupo Financiero Santander México |
a) Number of equity instruments held by the Group
The Group holds a 75% ownership interest in the subsidiary in Mexico through the holding company Grupo Financiero Santander México, S.A.B. de C.V. At December 31, 2014, this holding company and Santander Global Facilities, S.A. de C.V. (Mexico) held 80,848,278,413 ordinary shares that constitute 99.99% of the share capital of Banco Santander (México), S.A., Institución de Banca Múltiple, Grupo Financiero Santander México.
b) Capital increases in progress
At December 31, 2014 there were no approved capital increases in progress.
c) Capital authorized by the shareholders at the general meeting
The shareholders at the general meeting held on February 22, 2012 resolved to increase the authorized share capital of Banco Santander (México), S.A., Institución de Banca Múltiple, Grupo Financiero Santander to MXN 8,085,540,380.30, represented by a total of 80,855,403,803 fully subscribed and paid shares of MXN 0.10 par value each.
d) Rights on founder’s shares, bonds or debt issues, convertible debentures and similar securities or rights
(i) At the board of directors meeting held on July 22, 2014 the directors ratified the limits approved at the board meeting held on October 17, 2013 for the issue of debt up to USD 6,500 million in local or international markets. They stipulated that the debt should be senior or subordinated for a maximum term of 15 years and that debt instruments that qualify as capital under current legislation should be included, and resolved that such issue may be instrumented individually or through various issue programs.
At present, the detail of Banco Santander’s debt issue is as follows:
| Instrument |
Type |
Amount |
Undrawn balance | |||
| Stock-market certificate program |
Revolving | MXN 55 thousand million | MXN 49.2 thousand million | |||
| Private structured bank bond certificate |
Non-revolving (*) | MXN 20 thousand million | MXN 20 thousand million | |||
| Equity instruments (Tier 2 capital) |
Non-revolving | USD 1 thousand million | — |
| (*) | The issue of private structured bank bonds is non-revolving. Once the amount established in the related certificate is placed, a new certificate is issued for the authorized amount. |
F-353
Table of Contents
The issue of structured bank bonds with subsequent placements was approved for up to MXN 10 thousand million, the equivalent amount in US dollars or in any other currency, for a term of 1 day to 15 years, with the understanding that the bonds may not be redeemed after the term of the related certificate of issue. They may be issued with or without loss of capital, with a public offering and with registration in the Mexican National Securities Register. This issue had not yet been launched at the reporting date.
(ii) At the board of directors meeting held on October 17, 2013 the directors ratified the limits approved at the board meeting held on October 26, 2011 relating to the issue of senior or subordinated debt for a maximum term of 15 years. They also approved including debt instruments that qualify as capital under current legislation and resolved that such issue may be instrumented individually or through various issue programs. On December 13, 2013, the shareholders at the general meeting approved issue by the bank, pursuant to such limits, of capitalization instruments qualifying as Tier 2 capital amounting to approximately USD 1,000,000 million.
On December 19, 2013, Banco Santander (Mexico) issued a total of USD 1,300,000,000 in subordinated notes that meet the capital requirements established by Basel III for Tier 2 capital at a rate of 6.125% and maturing in 2023. The Parent of Santander México, Banco Santander, S.A. Spain, resolved to purchase USD 975,000,000, i.e. 75% of the total amount of the notes.
These notes were offered through a private placement to qualified institutional buyers only in accordance with Rule 144A under the US Securities Act of 1933 and subsequent amendments thereto. Outside the US, they were offered in accordance with Regulation S of the Securities Act.
The issue was approved with a view to increasing the efficiency of the bank’s capital structure, adapting the bank’s profile with regard to capitalization to that of its competitors and obtaining greater returns on capital with the same strength of capital and capacity for growth of risk-weighted assets.
(iii) The shareholders at the general meeting held on May 14, 2012 ratified the resolution adopted by the shareholders at the extraordinary general meeting held on March 17, 2009, which approved the arrangement of a collective loan from the shareholders for USD 1,000,000,000 through the placement of unsecured subordinated non-preference debentures not convertible into shares. This issue had not yet been launched at the reporting date.
(iv) At the board of directors meeting held on January 27, 2011 the directors approved the general terms and conditions for the issue of senior debt in international markets. This issue of USD 500 million and USD 1,000 million at a five to ten year term was authorized on October 18, 2012. The issue was approved in order to obtain resources to finance the increase of business assets and the management of the Bank’s liquidity. As a result of these resolutions adopted by the board of directors, on November 9, 2012, debt amounting to USD 1,000 million was issued.
e) Specific circumstances that restrict the availability of reserves
Pursuant to the Mexican Credit Institutions Law and the general provisions applicable to credit institutions, the Mexican Companies Law and the institutions’ own Bylaws, universal banking institutions are required to constitute or increase capital reserves for the purposes of ensuring solvency and protecting payment systems and savers.
The bank increases its legal reserve annually directly from the profit obtained in the year.
F-354
Table of Contents
The bank must recognize the various reserves as stipulated in the legal provisions applicable to credit institutions. Credit loss reserves are calculated on the basis of the credit rating assigned to each loan and are released when the rating of the related loan improves or when the loan is settled.
f) Non-Group entities which hold, directly or through subsidiaries, 10% or more of equity
Not applicable.
g) Quoted equity instruments
The company does not have any equity instruments quoted on a stock exchange.
| 6. | Banco Santander Totta, S.A. |
a) Number of equity instruments held by the Group
The Group holds 656,134,179 ordinary shares through its subsidiaries: Santander Totta, SGPS, S.A. with 641,269,620 shares, Taxagest Sociedade Gestora de Participações Socíais, S.A. with 14,593,315 shares, and Banco Santander Totta, S.A. with 271,244 treasury shares, all of which have a par value of EUR 1 each and identical voting and dividend rights and are subscribed and paid in full.
b) Capital increases in progress
No approved capital increases are in progress.
c) Capital authorized by the shareholders at the general meeting
Not applicable.
d) Rights on founder’s shares, “rights” bonds, convertible debentures and similar securities or rights
At December 31, 2014, no securities with these characteristics had been issued.
e) Specific circumstances that restrict the availability of reserves
Under Article 296 of the Portuguese Companies’ Code, the legal and merger reserves can only be used to offset losses or to increase capital.
Non-current asset revaluation reserves are regulated by Decree-Law 31/98, under which losses can be offset or capital increased by the amounts for which the underlying asset is depreciated, amortized or sold.
f) Non-Group entities which hold, directly or through subsidiaries, 10% or more of equity
Not applicable.
g) Quoted equity instruments
The shares of Banco Santander Totta, S.A. are not listed.
F-355
Table of Contents
| 7. | Santander Consumer Bank AG |
a) Number of financial equity instruments held by the Group
At December 31, 2014, through Santander Consumer Holding GmbH, the Group held 30,002 ordinary shares with a par value of EUR 1,000 each, all of which carry the same voting rights.
b) Capital increases in progress
Not applicable.
c) Capital authorized by the shareholders at the general meeting
Not applicable.
d) Rights on founder’s shares, “rights” bonds, convertible debentures and similar securities or rights
Not applicable.
e) Specific circumstances that restrict the availability of reserves
Not applicable.
f) Entities which hold, directly or through subsidiaries, 10% or more of equity
Banco Santander, S.A., Madrid, Spain.
Santander Consumer Finance, S.A., Madrid, Spain.
Santander Consumer Holding GmbH, Mönchengladbach, Germany.
g) Quoted equity instruments
Not applicable.
| 8. | Banco Santander - Chile |
a) Number of equity instruments held by the Group
The Group holds a 67% ownership interest in its subsidiary in Chile corresponding to 126,593,017,845 ordinary shares of Banco Santander - Chile through its subsidiaries: Santander Chile Holding S.A. with 66,822,519,695 ordinary shares, Teatinos Siglo XXI Inversiones S.A., with 59,770,481,573 ordinary shares and Santander Inversiones S.A. with 16,577 fully subscribed and paid ordinary shares that carry the same voting and dividend rights.
b) Capital increases in progress
No approved capital increases are in progress.
F-356
Table of Contents
c) Capital authorized by the shareholders at the general meeting
Share capital at December 31, 2014 amounted to CLP 891,302,881,691.
d) Rights on founder’s shares, “rights” bonds, convertible debentures and similar securities or rights
At December 31, 2014, no securities with these characteristics had been issued.
e) Specific circumstances that restrict the availability of reserves
Remittances to foreign investors in relation to investments made under the Statute of Foreign Investment (Decree-Law 600/1974) and the amendments thereto require the prior authorization of the foreign investment committee.
f) Non-Group entities which hold, directly or through subsidiaries, 10% or more of equity
Not applicable.
g) Quoted equity instruments
All the shares are listed on the Chilean stock exchanges and, through American Depositary Receipts (ADRs), on the New York Stock Exchange (NYSE).
| 9. | Bank Zachodni WBK S.A. |
a) Number of financial equity instruments held by the Group
At December 31, 2014, Banco Santander, S.A. held 68,880,774 ordinary shares with a par value of PLN 10 each, all of which carry the same voting rights.
b) Capital increases in progress
There were no capital increases in progress at the end of 2014.
c) Capital authorized by the shareholders at the general meeting
The shareholders at the general meeting held on April 16, 2014 approved the capital increase amounting to PLN 3,055,430 through the issue of 305,543 series K bearer ordinary shares with a par value of PLN 10 each.
The shareholders at the general meeting held on June 30, 2014 approved the capital increase amounting to PLN 53,839,020 through the issue of 5,383,902 series L bearer ordinary shares with a par value of PLN 10 each.
d) Rights on founder’s shares, “rights” bonds, convertible debentures and similar securities or rights
At the general meeting held on June 30, 2014, the shareholders resolved to approve the “Incentive Scheme V” as an initiative to attract, motivate and retain the bank’s employees. Delivery of the shares is tied to the achievement of certain targets in the years from 2014 to 2016. The bank considers that the exercise of these rights might give rise to the issuance of more than 250,000 shares.
F-357
Table of Contents
e) Specific circumstances that restrict the availability of reserves
Not applicable.
f) Entities which hold, directly or through subsidiaries, 10% or more of equity
Not applicable.
g) Quoted equity instruments
All the shares of Bank Zachodni WBK S.A. are listed on the Warsaw stock exchange.
| B) | The restrictions on the ability to access or use the assets and also to settle the Group’s liabilities, as required under paragraph 13 of IFRS 12, are described below. |
In certain jurisdictions, restrictions have been established on the distribution of dividends on the basis of the new, much more stringent capital adequacy regulations. However, there is currently no evidence of any practical or legal impediment to the transfer of funds by Group subsidiaries to the Parent in the form of dividends, loans, advances, repatriation of capital or any other means.
F-358
Table of Contents
Exhibit VI
Annual banking report
This Annual Banking Report was prepared in compliance with Article 87 of Law 10/2014, of June 26, on the Regulation, Supervision and Capital adequacy of credit institutions.
Pursuant to the aforementioned Article, from January 1, 2015, credit institutions must send the Bank of Spain and publish annually a report as an appendix to the financial statements audited in accordance with the legislation regulating audits of financial statements, which specifies, by country in which they are established, the following information on a consolidated basis for each year:
| a) | Name(s), nature of activities and geographical location. |
| b) | Turnover. |
| c) | Number of employees on a full time equivalent basis. |
| d) | Gross profit or loss before tax. |
| e) | Tax on profit or loss. |
| f) | Public subsidies received. |
Transitional Provision Two of this law established the obligation for credit institutions to publish, on July 1, 2014, the information relating to a), b) and c) above (an obligation which Banco Santander, S.A. met by publishing the information on its corporate website) and, for systemically important institutions worldwide, the obligation to submit in confidence to the European Commission the information relating to d), e) and f). Banco Santander, S.A. includes in this annual banking report the information submitted in confidence to the European Commission.
Following is a detail of the criteria used to prepare the annual banking report for 2014 and 2013:
| a) | Name(s), nature of activities and geographical location |
The aforementioned information is available in Appendices I and III to the Group’s consolidated financial statements, which contain details of the companies operating in each jurisdiction, including, among other information, their name(s), geographical location and the nature of their activities.
As can be seen in the aforementioned Appendices, the main activity carried on by the Group in the various jurisdictions in which it operates is commercial banking. The Group operates mainly in ten markets through a model of subsidiaries that are autonomous in capital and liquidity terms, which has clear strategic and regulatory advantages, since it limits the risk of contagion between Group units, imposes a double layer of global and local oversight and facilitates crisis management and resolution. The number of Group offices totals 12,951 (the largest commercial network of any international bank) and these offices provide our customers with all their basic financial needs.
| b) | Turnover |
For the purposes of this report, turnover is considered to be total income, as defined and presented in the consolidated income statement that forms part of the Group’s consolidated financial statements.
F-359
Table of Contents
The data on turnover by country was obtained from the statutory accounting records of the Group companies with the corresponding geographical location and translated to euros. Accordingly, this is aggregate information from the separate financial statements of the companies that operate in each jurisdiction, reconciliation of which with the information from the Group’s consolidated financial statements requires a series of unifying adjustments and the elimination of transactions between the various Group companies, such as those relating to the distribution of dividends by subsidiaries to their respective parents.
| c) | Number of employees on a full time equivalent basis |
The data on employees on a full time equivalent basis were obtained from the average headcount of each jurisdiction.
| d) | Gross profit or loss before tax (Operating profit/ (loss) before tax) |
For the purposes of this report, gross profit or loss before tax is considered to be profit or loss before tax, as defined and presented in the consolidated income statement that forms part of the Group’s consolidated financial statements.
As with the information relating to turnover, the data included was obtained from the statutory accounting records of the Group companies with the corresponding geographical location and translated to euros. Accordingly, this is aggregate information from the separate financial statements of the companies that operate in each jurisdiction, reconciliation of which with the information from the Group’s consolidated financial statements requires a series of unifying adjustments and the elimination of transactions between the various Group companies, such as those relating to the distribution of dividends by subsidiaries to their respective parents.
| e) | Tax on profit or loss |
In the absence of specific criteria, this is the amount of tax effectively paid in respect of the taxes the effect of which is recognized in Income tax in the consolidated income statement.
Taxes effectively paid in the year by each of the companies in each jurisdiction include:
| • | supplementary payments relating to income tax returns, normally for prior years. |
| • | advances, prepayments, withholdings made or borne in respect of tax on profit or loss for the year. Given their scantly representative amount, it was decided that taxes borne abroad would be included in the jurisdiction of the company that bore them. |
| • | refunds collected in the year with respect to returns for prior years that resulted in a refund. |
| • | where appropriate, the tax payable arising from tax assessments and litigation relating to these taxes. |
The foregoing amounts are part of the statement of cash flows and, therefore, differ from the income tax expense recognized in the consolidated income statement. Such is the case because the tax legislation of each country establishes:
| • | the time at which taxes must be paid and, normally, there is a timing mismatch between the dates of payment and the date of generation of the income bearing the tax. |
| • | its own criteria for calculating the tax and establishes temporary or permanent restrictions on, inter alia, expense deduction, exemptions, relief or deferrals of certain income, thereby generating the related differences between the accounting profit (or loss) and taxable profit (or tax loss) which is ultimately taxed; tax loss carryforwards from prior years, tax credits and/or relief, etc. must also be added to this. Also, in certain cases special regimes are established, such as the tax consolidation of companies in the same jurisdiction, etc. |
F-360
Table of Contents
| f) | Public subsidies received |
In the context of the disclosures required by current legislation, this term was interpreted to mean any aid or subsidy in line with the European Commission’s State Aid Guide and, in such context, the Group companies did not receive public subsidies in 2014.
F-361
Table of Contents
The detail of the information for 2014 and 2013 is as follows:
| 2014 | 2013 (*) | |||||||||||||||||||||||
| Jurisdiction |
Turnover (millions of euros) |
Number of employees |
Operating profit/ (loss) before tax (millions of euros) |
Tax on profit or loss (millions of euros) |
Operating profit/ (loss) before tax (millions of euros) |
Tax on profit or loss (millions of euros) |
||||||||||||||||||
| Germany |
1,861 | 4,586 | 207 | 102 | 730 | 123 | ||||||||||||||||||
| Argentina |
1,282 | 6,983 | 503 | 153 | 407 | 199 | ||||||||||||||||||
| Australia |
3 | 5 | 1 | — | 1 | — | ||||||||||||||||||
| Austria |
159 | 391 | 53 | — | 533 | — | ||||||||||||||||||
| Bahamas |
201 | 41 | 60 | — | 68 | — | ||||||||||||||||||
| Belgium |
96 | 125 | 68 | 10 | 117 | 4 | ||||||||||||||||||
| Brazil (1) |
11,829 | 44,325 | 1,604 | 410 | 932 | 1,033 | ||||||||||||||||||
| Chile |
3,339 | 11,907 | 1,737 | 279 | 1,548 | 193 | ||||||||||||||||||
| China |
93 | 151 | 44 | 5 | 11 | 3 | ||||||||||||||||||
| Colombia |
21 | 49 | (3 | ) | — | (6 | ) | — | ||||||||||||||||
| Spain |
12,723 | 30,537 | 2,926 | (315 | ) | 2,298 | 695 | |||||||||||||||||
| United States |
6,590 | 13,830 | 3,727 | (61 | ) | 1,084 | 17 | |||||||||||||||||
| Denmark |
119 | 110 | 52 | 8 | 26 | 3 | ||||||||||||||||||
| Finland |
75 | 132 | 40 | 3 | 38 | — | ||||||||||||||||||
| France |
62 | 47 | 43 | 10 | 27 | 11 | ||||||||||||||||||
| Hungary |
4 | 33 | (25 | ) | — | (3 | ) | — | ||||||||||||||||
| Ireland |
43 | 36 | 38 | 5 | 37 | 7 | ||||||||||||||||||
| Isle of Man |
14 | 27 | 4 | — | 1 | 1 | ||||||||||||||||||
| Cayman Islands |
(1 | ) | — | (1 | ) | — | — | — | ||||||||||||||||
| Italy |
351 | 731 | 37 | 27 | (40 | ) | 40 | |||||||||||||||||
| Jersey |
35 | 105 | 16 | 2 | 21 | 2 | ||||||||||||||||||
| Morocco |
1 | — | — | — | — | — | ||||||||||||||||||
| Mexico (2) |
4,396 | 15,542 | 2,076 | 243 | 2,650 | 666 | ||||||||||||||||||
| Norway |
384 | 362 | 178 | 21 | 98 | 33 | ||||||||||||||||||
| The Netherlands |
427 | 203 | 379 | 21 | 304 | 10 | ||||||||||||||||||
| Panama |
2 | 5 | — | — | — | — | ||||||||||||||||||
| Peru |
56 | 128 | 16 | 6 | 11 | 3 | ||||||||||||||||||
| Poland |
1,707 | 15,186 | 791 | 165 | 681 | 129 | ||||||||||||||||||
| Portugal (3) |
1,071 | 5,922 | 293 | (38 | ) | 151 | 174 | |||||||||||||||||
| Puerto Rico |
467 | 1,409 | 142 | 16 | 94 | 37 | ||||||||||||||||||
| United Kingdom |
9,152 | 24,394 | 3,204 | 248 | 2,895 | 154 | ||||||||||||||||||
| Singapore |
7 | 9 | 4 | — | (1 | ) | — | |||||||||||||||||
| Sweden |
173 | 129 | 81 | 3 | 16 | 4 | ||||||||||||||||||
| Switzerland |
82 | 148 | 35 | 10 | 48 | 19 | ||||||||||||||||||
| Uruguay |
245 | 1,184 | 46 | 19 | 62 | 17 | ||||||||||||||||||
|
|
|
|
|
|
|
|
|
|
|
|
|
|||||||||||||
| Total |
57,069 | 178,772 | 18,376 | 1,352 | 14,839 | 3,577 | ||||||||||||||||||
|
|
|
|
|
|
|
|
|
|
|
|
|
|||||||||||||
| Consolidation adjustments |
(14,457 | ) | (7,697 | ) | (7,461 | ) | ||||||||||||||||||
|
|
|
|
|
|
|
|||||||||||||||||||
| Consolidated Group total |
42,612 | 10,679 | 7,378 | |||||||||||||||||||||
| (*) | Data submitted in confidence on July 1, 2014 to the European Commission in compliance with Transitional Provision Twelve (transitional arrangements for the annual banking report) of Law 10/2014, of June 26, on the Regulation, Supervision and Capital Adequacy of Credit Institutions. |
| (1) | Including the information relating to a branch in the Cayman Islands the profits of which are taxed in full in Brazil. The contribution of this branch to profit before tax for 2014 is EUR 306 million (2013: EUR 137 million). |
| (2) | Including the information on a branch in the Bahamas the profits of which are taxed in full in Mexico. In 2014 the contribution of this branch to profit before tax was EUR 10 million (2013: EUR 54 million). |
| (3) | Including the information relating to the branch in the UK, which is taxed both in the UK and in Portugal. In 2014 the contribution of this branch to profit before tax was EUR 165 million (2013: EUR 110 million). |
At December 31, 2014, the Group’s return on assets (ROA) was estimated at 0.6% (2013: 0.4%).
F-362
Table of Contents
Exhibit VII
| (Millions of Euros) | Year end December 31, | |||||||||||||||||||||||||||||||||||||||
| 2014 | 2013 | 2012 | 2011 | 2010 | ||||||||||||||||||||||||||||||||||||
| IFRS: |
Including interest on deposits |
Excluding interest on deposits |
Including interest on deposits |
Excluding interest on deposits |
Including interest on deposits |
Excluding interest on deposits |
Including interest on deposits |
Excluding interest on deposits |
Including interest on deposits |
Excluding interest on deposits |
||||||||||||||||||||||||||||||
| FIXED CHARGES: |
||||||||||||||||||||||||||||||||||||||||
| Fixed charges and preferred stock dividends |
24,799 | 11,953 | 25,162 | 10,499 | 28,466 | 11,903 | 29,624 | 12,590 | 23,197 | 9,476 | ||||||||||||||||||||||||||||||
| Preferred dividends |
126 | 126 | 112 | 112 | 132 | 132 | 99 | 99 | 61 | 61 | ||||||||||||||||||||||||||||||
| Fixed charges |
24,673 | 11,827 | 25,050 | 10,387 | 28,334 | 11,771 | 29,525 | 12,491 | 23,136 | 9,415 | ||||||||||||||||||||||||||||||
| EARNINGS: |
||||||||||||||||||||||||||||||||||||||||
| Income from continuing operations before taxes and extraordinary items |
10,679 | 10,679 | 7,378 | 7,378 | 3,565 | 3,565 | 7,789 | 7,789 | 12,049 | 12,049 | ||||||||||||||||||||||||||||||
| Less: Earnings from associated companies |
65 | 65 | 197 | 197 | 427 | 427 | 57 | 57 | 17 | 17 | ||||||||||||||||||||||||||||||
| Fixed charges |
24,673 | 11,827 | 25,050 | 10,387 | 28,334 | 11,771 | 29,525 | 12,491 | 23,136 | 9,415 | ||||||||||||||||||||||||||||||
|
|
|
|
|
|
|
|
|
|
|
|
|
|
|
|
|
|
|
|
|
|||||||||||||||||||||
| Total earnings |
35,287 | 22,441 | 32,231 | 17,568 | 31,472 | 14,909 | 37,257 | 20,223 | 35,168 | 21,447 | ||||||||||||||||||||||||||||||
| Ratio of earnings to fixed charges |
1.43 | 1.90 | 1.29 | 1.69 | 1.11 | 1.27 | 1.26 | 1.62 | 1.52 | 2.28 | ||||||||||||||||||||||||||||||
| Ratio of earnings to combined fixed charges and preferred stock dividends |
1.42 | 1.88 | 1.28 | 1.67 | 1.11 | 1.25 | 1.26 | 1.61 | 1.52 | 2.26 | ||||||||||||||||||||||||||||||
F-363