FORM 6-K
SECURITIES AND EXCHANGE COMMISSION
Washington, D.C. 20549
Report of Foreign Issuer
Pursuant to Rule 13a-16 or 15d-16
of the Securities Exchange Act of 1934
For the month of July, 2024
Commission File Number: 001-12518
Banco Santander, S.A.
(Exact name of registrant as specified in its charter)
Ciudad Grupo Santander
28660 Boadilla del Monte (Madrid) Spain
(Address of principal executive office)
Indicate by check mark whether the registrant files or will file annual reports under cover of Form 20-F or Form 40-F:
Form 20-F ☒ Form 40-F ☐
BANCO SANTANDER, S.A.
________________________
TABLE OF CONTENTS
Item 1. January - June 2024 Half yearly financial report | |||||

| January - June | 2024 | ||||
Interim consolidated directors' report | |||||
| Business model | |||||
Corporate governance | |||||
| Interim condensed consolidated financial statements | |||||

This report was approved by the board of directors on 23 July 2024, following a favourable report from the audit committee. Important information regarding this report can be found on pages 92 and 93.

Key consolidated data
| BALANCE SHEET (EUR million) | Jun-24 | Mar-24 | % | Jun-24 | Jun-23 | % | Dec-23 | ||||||||||||||||
| Total assets | 1,786,261 | 1,800,006 | (0.8) | 1,786,261 | 1,780,493 | 0.3 | 1,797,062 | ||||||||||||||||
| Loans and advances to customers | 1,065,596 | 1,049,533 | 1.5 | 1,065,596 | 1,045,044 | 2.0 | 1,036,349 | ||||||||||||||||
| Customer deposits | 1,037,646 | 1,044,453 | (0.7) | 1,037,646 | 1,013,778 | 2.4 | 1,047,169 | ||||||||||||||||
| Total funds | 1,309,903 | 1,315,779 | (0.4) | 1,309,903 | 1,255,783 | 4.3 | 1,306,942 | ||||||||||||||||
| Total equity | 103,648 | 105,025 | (1.3) | 103,648 | 102,044 | 1.6 | 104,241 | ||||||||||||||||
| Note: total funds includes customer deposits, mutual funds, pension funds and managed portfolios. | |||||||||||||||||||||||
| INCOME STATEMENT (EUR million) | Q2'24 | Q1'24 | % | H1'24 | H1'23 | % | 2023 | ||||||||||||||||
| Net interest income | 11,474 | 11,983 | (4.2) | 23,457 | 20,920 | 12.1 | 43,261 | ||||||||||||||||
| Total income | 15,670 | 15,045 | 4.2 | 30,715 | 28,010 | 9.7 | 57,423 | ||||||||||||||||
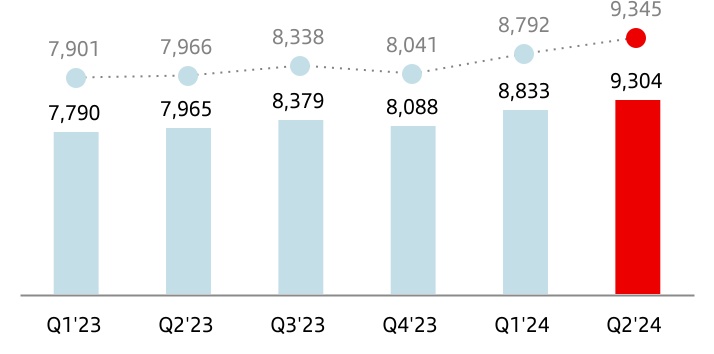
| Net operating income | 9,304 | 8,498 | 9.5 | 17,802 | 15,531 | 14.6 | 31,998 | ||||||||||||||||
| Profit before tax | 4,925 | 4,583 | 7.5 | 9,508 | 8,090 | 17.5 | 16,459 | ||||||||||||||||
| Profit attributable to the parent | 3,207 | 2,852 | 12.4 | 6,059 | 5,241 | 15.6 | 11,076 | ||||||||||||||||
EPS, PROFITABILITY AND EFFICIENCY (%) 1 | Q2'24 | Q1'24 | % | H1'24 | H1'23 | % | 2023 | ||||||||||||||||
| EPS (euros) | 0.20 | 0.17 | 15.4 | 0.37 | 0.31 | 19.2 | 0.65 | ||||||||||||||||
| RoE | 13.4 | 11.8 | 12.6 | 11.5 | 11.9 | ||||||||||||||||||
| RoTE | 16.8 | 14.9 | 15.9 | 14.5 | 15.1 | ||||||||||||||||||
| RoA | 0.78 | 0.69 | 0.74 | 0.67 | 0.69 | ||||||||||||||||||
| RoRWA | 2.18 | 1.96 | 2.07 | 1.88 | 1.96 | ||||||||||||||||||
Efficiency ratio 2 | 40.6 | 42.6 | 41.6 | 44.2 | 44.1 | ||||||||||||||||||
UNDERLYING INCOME STATEMENT 2 (EUR million) | Q2'24 | Q1'24 | % | H1'24 | H1'23 | % | 2023 | ||||||||||||||||
| Net interest income | 11,474 | 11,983 | (4.2) | 23,457 | 20,920 | 12.1 | 43,261 | ||||||||||||||||
| Total income | 15,670 | 15,380 | 1.9 | 31,050 | 28,234 | 10.0 | 57,647 | ||||||||||||||||
| Net operating income | 9,304 | 8,833 | 5.3 | 18,137 | 15,755 | 15.1 | 32,222 | ||||||||||||||||
| Profit before tax | 4,925 | 4,583 | 7.5 | 9,508 | 8,329 | 14.2 | 16,698 | ||||||||||||||||
| Profit attributable to the parent | 3,207 | 2,852 | 12.4 | 6,059 | 5,241 | 15.6 | 11,076 | ||||||||||||||||
| Changes in constant euros: | |||||||||||||||||||||||
| Q2'24 / Q1'24: NII: -3.5%; Total income: +2.6%; Net operating income: +6.3%; Profit before tax: +8.2%; Attributable profit: +13.1%. | |||||||||||||||||||||||
| H1'24 / H1'23: NII: +11.2%; Total income: +9.3%; Net operating income: +14.3%; Profit before tax: +13.3%; Attributable profit: +14.7%. | |||||||||||||||||||||||
Note: for Argentina and any grouping which includes it, the variations in constant euros have been calculated considering the Argentine peso exchange rate on the last working day for each of the periods presented. Additionally, from Q2 2024 onwards, a theoretical rate, which differs from official exchange rate, has been used for the Argentine peso as it better reflects the evolution of inflation (we continue to apply the official ARS exchange rate to all prior periods). For further information, see the section 'Alternative performance measures' in the appendix to this report. | ||
January - June 2024 |  | 3 | ||||||
| SOLVENCY (%) | Jun-24 | Mar-24 | Jun-24 | Jun-23 | Dec-23 | ||||||||||||||||||
| Fully-loaded CET1 ratio | 12.5 | 12.3 | 12.5 | 12.2 | 12.3 | ||||||||||||||||||
| Fully-loaded total capital ratio | 16.4 | 16.5 | 16.4 | 15.9 | 16.3 | ||||||||||||||||||
| CREDIT QUALITY (%) | Q2'24 | Q1'24 | H1'24 | H1'23 | 2023 | ||||||||||||||||||
Cost of risk 2, 3 | 1.21 | 1.20 | 1.21 | 1.08 | 1.18 | ||||||||||||||||||
| NPL ratio | 3.02 | 3.10 | 3.02 | 3.07 | 3.14 | ||||||||||||||||||
| NPL coverage ratio | 66 | 66 | 66 | 68 | 66 | ||||||||||||||||||
| MARKET CAPITALIZATION AND SHARES | Jun-24 | Mar-24 | % | Jun-24 | Jun-23 | % | Dec-23 | ||||||||||||||||
| Shares (millions) | 15,494 | 15,826 | (2.1) | 15,494 | 16,184 | (4.3) | 16,184 | ||||||||||||||||
| Share price (euros) | 4.331 | 4.522 | (4.2) | 4.331 | 3.385 | 27.9 | 3.780 | ||||||||||||||||
| Market capitalization (EUR million) | 67,098 | 71,555 | (6.2) | 67,098 | 54,783 | 22.5 | 61,168 | ||||||||||||||||
| Tangible book value per share (euros) | 4.94 | 4.86 | 4.94 | 4.57 | 4.76 | ||||||||||||||||||
| Price / Tangible book value per share (X) | 0.88 | 0.93 | 0.88 | 0.74 | 0.79 | ||||||||||||||||||
| CUSTOMERS (thousands) | Q2'24 | Q1'24 | % | H1'24 | H1'23 | % | 2023 | ||||||||||||||||
| Total customers | 168,243 | 165,752 | 1.5 | 168,243 | 163,756 | 2.7 | 164,542 | ||||||||||||||||
| Active customers | 101,277 | 100,092 | 1.2 | 101,277 | 99,472 | 1.8 | 99,503 | ||||||||||||||||
| Digital customers | 57,000 | 55,305 | 3.1 | 57,000 | 52,517 | 8.5 | 54,161 | ||||||||||||||||
| OTHER DATA | Jun-24 | Mar-24 | % | Jun-24 | Jun-23 | % | Dec-23 | ||||||||||||||||
| Number of shareholders | 3,526,649 | 3,584,294 | (1.6) | 3,526,649 | 3,802,161 | (7.2) | 3,662,377 | ||||||||||||||||
| Number of employees | 209,553 | 211,141 | (0.8) | 209,553 | 212,410 | (1.3) | 212,764 | ||||||||||||||||
| Number of branches | 8,285 | 8,405 | (1.4) | 8,285 | 8,823 | (6.1) | 8,518 | ||||||||||||||||
| 1. | For further information, see the section 'Alternative performance measures' in the appendix to this report. | ||||
| 2. | In addition to financial information prepared in accordance with International Financial Reporting Standards (IFRS) and derived from our consolidated financial statements, this report contains certain financial measures that constitute alternative performance measures (APMs) as defined in the Guidelines on Alternative Performance Measures issued by the European Securities and Markets Authority (ESMA) on 5 October 2015, and other non-IFRS measures, including the figures related to “underlying” results, which do not include factors that are outside the ordinary course of our business, or have been reclassified within the underlying income statement. Further details are provided in the 'Alternative performance measures' section of the appendix to this report. For further details on the APMs and non-IFRS measures used, including their definition or a reconciliation between any applicable management indicators and the financial data presented in the annual consolidated financial statements prepared under IFRS, please see our 2023 Annual Financial Report, published in the CNMV on 19 February 2024, our 20-F report for the year ending 31 December 2023 filed with the SEC in the United States on 21 February 2024 as well as the 'Alternative performance measures' section of the appendix to this report. | ||||
| 3. | Allowances for loan-loss provisions over the last 12 months / Average loans and advances to customers over the last 12 months. | ||||
4 | | January - June 2024 | ||||||
| Group financial information | Financial information by segment | Responsible banking Corporate governance Santander share | Appendix | ||||||||||||||||||||||||||
Our business model
| Customer focus | ||||||||||||||||||||||||||
Building a digital bank with branches | → New operating model to build a digital bank with branches, with a multichannel offer to fulfil all our customers' financial needs. | 168 mn | 101 mn | |||||||||||||||||||||||
| total customers | active customers | |||||||||||||||||||||||||
| Scale | ||||||||||||||||||||||||||
→ Our global and in-market scale helps us to improve our local banks' profitability, adding value and network benefits. → Our activities are organized under five global businesses: Retail & Commercial Banking (Retail), Digital Consumer Bank (Consumer), Corporate & Investment Banking (CIB), Wealth Management & Insurance (Wealth) and Payments. → Our five global businesses and our presence in Europe, DCB Europe, North America and South America support value creation based on the profitable growth and operational leverage that ONE Santander provides. | ||||||||||||||||||||||||||
| Global and in-market scale |  | |||||||||||||||||||||||||
| Diversification | ||||||||||||||||||||||||||
| Business, geographical and balance sheet | → Well-balanced diversification between businesses and markets with a solid and simple balance sheet that gives us recurrent net operating income with low volatility and more predictable results. | |||||||||||||||||||||||||
Our corporate culture
The Santander Way remains unchanged to continue to deliver for all our stakeholders
Our purpose To help people and businesses prosper. |  | ||||||||||
Our aim To be the best open financial services platform, by acting responsibly and earning the lasting loyalty of our people, customers, shareholders and communities. | |||||||||||
Our how Everything we do should be Simple, Personal and Fair. | |||||||||||
January - June 2024 | | 5 | ||||||
Group financial information
General background
In H1 2024, Santander operated in an environment characterized by a gentle global economic slowdown, with relatively stable interest rates and a gradual decline in inflation in most regions. Geopolitical tensions, while still present, have not resulted in significant economic impacts. Labour markets withstood the monetary tightening period, with unemployment rates at or close to full employment across most of Santander's footprint.
Country | GDP Change1 | Economic performance | |||||||||
 | Eurozone | +0.4% | Having stagnated in 2023, the economy has entered a phase of soft recovery driven by external demand. Inflation continued to moderate (+2.5% year-on-year in June), which allowed for a 25 bp interest rate cut in June. The ECB is expected to make further interest rate cuts in the second half of the year, but it will depend on whether inflation continues to approach the ECB's target. | ||||||||
 | Spain | +2.5% | In Q1 2024, GDP grew 2.5% year-on-year, supported by strong exports of services, while investment remained below pre-pandemic levels. The labour market remains strong, with the number of people enrolled in social security at record levels. In June, inflation was rose 3.4% year-on-year, while core inflation remained at 3%, due to persistently high inflation in services sector. | ||||||||
 | United Kingdom | +0.3% | The economy grew in Q1 2024, ending the technical recession that began in H2 2023. The outlook has also improved, with increased business and consumer confidence and real wage growth. The unemployment rate remained low, although it increased to 4.4% in April. Inflation continues to decline (2.0% year-on-year in June) due to lower food prices. Inflationary pressures on wages and services led the Bank of England to hold the official interest rate at 5.25%. | ||||||||
 | Portugal | +1.5% | Growth in Q1 2024 surprised positively due to the contribution from external demand. On the other hand, the contribution from domestic demand decreased, due to the slowdown in investment and private consumption. Labour market data remained strong with employment rising and unemployment at low levels (6.5% in May). After moderating in recent months, inflation rose slightly in June (2.8% year-on-year). | ||||||||
 | Poland | +2.0% | In Q1 2024, GDP rose supported by private consumption. Supply constraints in the labour market and resilient labour demand kept the unemployment rate low (4.9% in June), supporting higher wages (+11.4% year-on-year in May). Inflation is within the central bank’s target range (2.6% year-on-year in June). However, core inflation remained high (+3.8% year-on-year in May) and, as such, the central bank decided to hold interest rates at 5.75%. | ||||||||
 | United States | +2.9% | Domestic demand grew at a good pace in Q1 2024, but private consumption showed signs of slowdown in Q2 2024. The unemployment rate rose to 4.1% in June. Inflation, which had increased in Q1 2024, has since declined (3.0% year-on-year in June). | ||||||||
 | Mexico | +1.6% | After having started the year with slight growth, the economy is now showing signs of weakening, though the labour market remains resilient. Year-on-year inflation rebounded to 5.0% in June. After a first 25 bp interest rate cut in Q1 2024, the central bank held interest rates at 11% in Q2 2024. | ||||||||
 | Brazil | +2.5% | The economy recovered dynamism in early 2024, driven by private consumption, investment and a strong labour market. Year-on-year inflation rebounded to 4.2% in June and medium-term expectations rose, moving away from the target. Following the latest interest rate cut in May (-25 bps to 10.5%), the central bank held interest rates in June. | ||||||||
 | Chile | +2.3% | After a weak 2023, the economy is recovering with growth in mining, industry and services sectors. Inflation rose slightly to 4.2% year-on-year in June. The central bank continued its process of rapid interest rate cuts, with a 150 bp reduction in Q2 2024 to 5.75%, though it said that interest rate cuts will slow down. | ||||||||
 | Argentina | -5.1% | The economy remained weak at the beginning of the year, due to the impact of the fiscal and monetary adjustments and high inflation, although inflation has moderated faster than expected as the year has progressed (down to a monthly average of 5.9% during Q2 2024). The external sector is showing signs of recovery, with increases in exports and trade surpluses, in contrast to the 2023 deficit. | ||||||||
1.Year-on-year changes for Q1'24.
6 | | January - June 2024 | ||||||
Highlights of the period
Main figures | |||||||||||
 | u | In Q2 2024, profit attributable to the parent was EUR 3,207 million, a new record quarter, despite charges totalling EUR 452 million (provisions relating to our CHF mortgage portfolio in Poland and write-downs after discontinuing our merchant platform in Germany and Superdigital in Latin America). | |||||||||
| u | Attributable profit was 12% higher compared to Q1 2024 (+13% in constant euros), mainly driven by the good performance in Retail, Consumer and Wealth, and after having recorded the temporary levy on revenue obtained in Spain in Q1 2024 and the aforementioned charges in Q2 2024. | ||||||||||
| u | Attributable profit increased 20% (in both euros and constant euros) compared to Q2 2023, with Retail, Wealth and Consumer growing. No contribution to the Single Resolution Fund (SRF) has been recorded in 2024, as contributions ended in 2023. | ||||||||||
| u | In H1 2024, attributable profit was EUR 6,059 million, 16% higher than in the same period of 2023 (+15% in constant euros) boosted by solid revenue growth across all global businesses and regions. | ||||||||||
| u | These positive results enabled us to improve the targets we had set for the year in revenue (from mid-single digit growth to high-single digit growth), efficiency (from less than 43% to close to 42%) and profitability (from 16% RoTE to more than 16%), while maintaining our objectives in capital and cost of risk. | ||||||||||
 | u | Profitability improved year-on-year and quarter-on-quarter. RoTE stood at 15.9% in H1 2024, compared to 14.5% in the same period of 2023. Annualizing the impact of the temporary levy on revenue obtained in Spain, RoTE was 16.3%, boosted by strong revenue growth. | |||||||||
| u | Sustained earnings per share growth in H1 2024, which rose 19% compared to H1 2023 to EUR 36.7 cents, supported by the positive performance in results and the share buybacks in the last 12 months. | ||||||||||
 | u | Business volumes continued to reflect the impact that the economic and interest rate environment had on customer behaviour and our active and disciplined capital management. Gross loans and advances to customers (excluding reverse repos) increased 2% year-on-year in constant euros, with all businesses growing except Retail, which decreased slightly as higher volumes in South America and Mexico largely offset lower loans in Europe and the US. Customer funds (customer deposits excluding repurchase agreements plus mutual funds) rose 5% year-on-year in constant euros, with deposits growing across all businesses except CIB (lower volumes in Spain and the US), while mutual funds rose double digits. | |||||||||
| u | The benefits from our global scale, margin management and higher customer activity were reflected in year-on-year increases in net interest income (+12% in euros, +11% in constant euros) and net fee income (+6% both in euros and constant euros), resulting in total income growth of 10% in euros (+9% in constant euros). | ||||||||||
 | u | Structural changes towards a simpler and more integrated model through ONE Transformation are contributing to efficiency gains and profitable growth. The efficiency ratio improved 2.6 pp compared to H1 2023 to 41.6%, driven mainly by Retail and Consumer. | |||||||||
 | u | Credit quality remains robust, driven by the strong macroeconomic environment and employment across our footprint. The NPL ratio was 3.02%, improving 5 bps year-on-year. Total loan-loss reserves reached EUR 23,323 million, resulting in a total coverage ratio of 66%. | |||||||||
| u | The Group's cost of risk stood at 1.21% (1.18% in December 2023 and 1.08% in June 2023), in line with our expectations. Retail and Consumer accounted for 85% of Group's net loan-loss provisions. In Retail, the cost of risk remained under control at 1.03%. In Consumer, CoR continued to normalize (to 2.17%) and remained at controlled levels and in line with expectations. | ||||||||||
 | u | As at end June 2024, the fully-loaded CET1 ratio stood at 12.5%. In the quarter, we generated 52 bps organically, including a 7 bp positive contribution from RWAs, as RWA growth was more than offset by significant risk transfer and asset rotation initiatives. We also recorded a 25 bp charge for shareholder remuneration against profit earned in Q2 2024 in line with our 50% payout target1. Additionally, we recorded charges of -7 bps relating to deductions, mainly intangible assets and held to collect and sell portfolio valuations. There were no significant regulatory charges in the quarter. | |||||||||
1.In line with the current shareholder remuneration policy of approximately 50% of the Group's reported profit (excluding non-cash, non-capital ratios impact items), divided approximately equally between cash dividends and share repurchases. Execution of the shareholder remuneration policy is subject to future corporate and regulatory decisions and approvals.
January - June 2024 | | 7 | ||||||
 | Think Value | |||||||
 | u | The AGM approved a cash dividend of EUR 9.50 cents per share that was paid in May. Including the cash dividend per share paid in November 2023 (EUR 8.10 cents), the total cash dividend per share paid against 2023 results was EUR 17.60 cents, around 50% more than the dividends per share paid against 2022 results. | |||||||||
u | In addition to this payment, there were two share buyback programmes which have been completed for a total of EUR 2,769 million. Including purchases made under such buyback programmes, the Group has repurchased c.11% of its outstanding shares since we began our buybacks in 2021. | ||||||||||
u | Total shareholder remuneration against 2023 results totalled EUR 5,552 million, 45% higher than the remuneration against 2022 results, distributed approximately equally between cash dividends and share buybacks. | ||||||||||
 | |||||||||||
u | As at end June 2024, TNAV per share was EUR 4.94. Including both cash dividends charged against 2023 results, the TNAV per share + cash dividend per share increased 12% year-on-year. | ||||||||||
| Think Customer | |||||||
 | u | Our efforts to simplify and improve our product offering and quality of service were reflected in a more than 4 million year-on-year increase in total customers to 168 million, while active customers reached 101 million, up almost 2 million year-on-year. | |||||||||
u | Transaction volumes per active customer rose 9% year-on-year in H1 2024. | ||||||||||
u | We continue to deliver great customer experience and improve our service quality, ranking in the top 3 in NPS1 in seven of our markets. | ||||||||||
| Think Global | |||||||
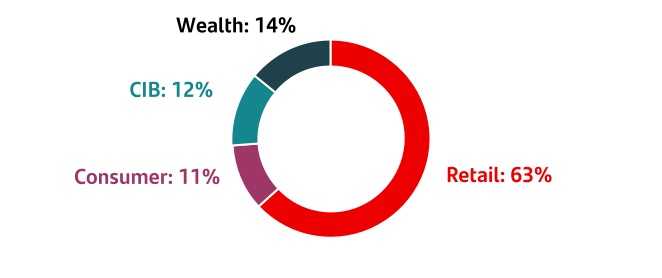
Contribution to Group revenue2 | Year-on-year changes in constant euros | |||||||||||||
 | u | In Retail, attributable profit was EUR 3,326 million (+35%) driven by double-digit growth in total income and the good performance in costs (due to our transformation efforts) and provisions. | ||||||||||||
u | Efficiency improved 4.8 pp to 39.5%, cost of risk remained controlled (1.03%) and RoTE increased to 17.4% (18.1% annualizing the impact of the temporary levy). | |||||||||||||
 | u | In Consumer, net operating income increased 12%, supported by total income growth (+7%) and good cost management, reaching an attributable profit of EUR 1,070 million, (+4%) despite higher LLPs (CHF mortgages, cost of risk normalization, higher volumes and some regulatory impacts). | ||||||||||||
u | Efficiency stood at 40.6%, improving 2.7 pp, cost of risk was 2.17% and RoTE stood at 12.8% (13.0% annualizing the impact of the temporary levy). | |||||||||||||
 | u | In CIB, revenue continued to grow, reaching record figures for H1 2024. However, attributable profit (EUR 1,405 million), declined 5%, impacted by costs relating to our transformation investments and lower gains on financial transactions in Brazil. | ||||||||||||
u | The efficiency ratio was 43.4%, remaining one the best in the sector. RoTE was 19.0% (19.1% annualizing the impact of the temporary levy). | |||||||||||||
 | u | In Wealth, attributable profit amounted to EUR 818 million (+14%) driven by higher activity and margin management, boosted especially by Private Banking. | ||||||||||||
u | Efficiency improved 2.3 pp to 34.4% and RoTE was 79.3% (80.4% annualizing the impact of the temporary levy). | |||||||||||||
 | u | In Payments, attributable profit reached EUR 49 million, impacted by write-downs in PagoNxt related to the discontinuation of our merchant platform in Germany and Superdigital in Latin America. Excluding it, profit would be 30% higher than in H1 2023, due to revenue growth and lower LLPs. | ||||||||||||
u | Cost of risk slightly improved 8 bps to 7.03%. In PagoNxt, EBITDA margin was 20.1% (+8.9 pp year-on-year). | |||||||||||||
1.Net Promoter Score, internal benchmark of individual customers' satisfaction audited by Stiga/Deloitte in H1 2024.
2.As % of total operating areas, excluding the Corporate Centre.
8 | | January - June 2024 | ||||||
Grupo Santander results
| Grupo Santander. Summarized income statement | ||||||||||||||||||||
| EUR million | ||||||||||||||||||||
| Change | Change | |||||||||||||||||||
| Q2'24 | Q1'24 | % | H1'24 | H1'23 | % | |||||||||||||||
| Net interest income | 11,474 | 11,983 | (4.2) | 23,457 | 20,920 | 12.1 | ||||||||||||||
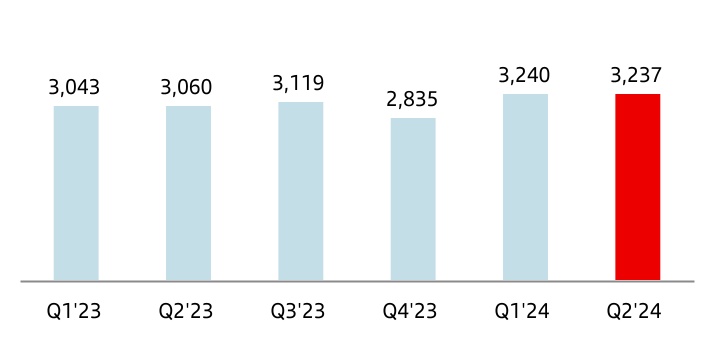
Net fee income1 | 3,237 | 3,240 | (0.1) | 6,477 | 6,103 | 6.1 | ||||||||||||||
Gains or losses on financial assets and liabilities and exchange differences2 | 334 | 623 | (46.4) | 957 | 1,302 | (26.5) | ||||||||||||||
| Dividend income | 400 | 93 | 330.1 | 493 | 382 | 29.1 | ||||||||||||||
| Share of results of entities accounted for using the equity method | 180 | 123 | 46.3 | 303 | 296 | 2.4 | ||||||||||||||
Other operating income/expenses3 (net) | 45 | (1,017) | — | (972) | (993) | (2.1) | ||||||||||||||
| Total income | 15,670 | 15,045 | 4.2 | 30,715 | 28,010 | 9.7 | ||||||||||||||
| Operating expenses | (6,366) | (6,547) | (2.8) | (12,913) | (12,479) | 3.5 | ||||||||||||||
| Administrative expenses | (5,538) | (5,719) | (3.2) | (11,257) | (10,873) | 3.5 | ||||||||||||||
| Staff costs | (3,467) | (3,594) | (3.5) | (7,061) | (6,603) | 6.9 | ||||||||||||||
| Other general administrative expenses | (2,071) | (2,125) | (2.5) | (4,196) | (4,270) | (1.7) | ||||||||||||||
| Depreciation and amortization | (828) | (828) | 0.0 | (1,656) | (1,606) | 3.1 | ||||||||||||||
| Provisions or reversal of provisions | (1,129) | (633) | 78.4 | (1,762) | (1,330) | 32.5 | ||||||||||||||
| Impairment or reversal of impairment of financial assets not measured at fair value through profit or loss (net) | (3,443) | (3,134) | 9.9 | (6,577) | (6,237) | 5.5 | ||||||||||||||
| Impairment on other assets (net) | (161) | (129) | 24.8 | (290) | (92) | 215.2 | ||||||||||||||
| Gains or losses on non-financial assets and investments, net | 364 | 2 | — | 366 | 277 | 32.1 | ||||||||||||||
| Negative goodwill recognized in results | — | — | — | — | — | — | ||||||||||||||
| Gains or losses on non-current assets held for sale not classified as discontinued operations | (10) | (21) | (52.4) | (31) | (59) | (47.5) | ||||||||||||||
| Profit or loss before tax from continuing operations | 4,925 | 4,583 | 7.5 | 9,508 | 8,090 | 17.5 | ||||||||||||||
| Tax expense or income from continuing operations | (1,448) | (1,468) | (1.4) | (2,916) | (2,281) | 27.8 | ||||||||||||||
| Profit from the period from continuing operations | 3,477 | 3,115 | 11.6 | 6,592 | 5,809 | 13.5 | ||||||||||||||
| Profit or loss after tax from discontinued operations | — | — | — | — | — | — | ||||||||||||||
| Profit for the period | 3,477 | 3,115 | 11.6 | 6,592 | 5,809 | 13.5 | ||||||||||||||
| Profit attributable to non-controlling interests | (270) | (263) | 2.7 | (533) | (568) | (6.2) | ||||||||||||||
| Profit attributable to the parent | 3,207 | 2,852 | 12.4 | 6,059 | 5,241 | 15.6 | ||||||||||||||
| EPS (euros) | 0.20 | 0.17 | 15.4 | 0.37 | 0.31 | 19.2 | ||||||||||||||
| Diluted EPS (euros) | 0.20 | 0.17 | 15.4 | 0.37 | 0.31 | 19.2 | ||||||||||||||
| Memorandum items: | ||||||||||||||||||||
| Average total assets | 1,780,522 | 1,804,334 | (1.3) | 1,792,428 | 1,754,207 | 2.2 | ||||||||||||||
| Average stockholders' equity | 95,994 | 96,308 | (0.3) | 96,151 | 91,368 | 5.2 | ||||||||||||||
| Note: the summarized income statement groups some lines of the consolidated statutory income statement on page 90 as follows: | |||||
1.‘Commission income’ and ‘Commission expense’. | |||||
2.‘Gain or losses on financial assets and liabilities not measured at fair value through profit or loss, net’; ‘Gain or losses on financial assets and liabilities held for trading, net’; ‘Gains or losses on non-trading financial assets and liabilities mandatorily at fair value through profit or loss’; ‘Gain or losses on financial assets and liabilities measured at fair value through profit or loss, net’; ‘Gain or losses from hedge accounting, net’; and ‘Exchange differences, net’. | |||||
3.‘Other operating income’; ‘Other operating expenses’; ’Income from insurance and reinsurance contracts’; and ‘Expenses from insurance and reinsurance contracts’. | |||||
January - June 2024 | | 9 | ||||||
| Statutory income statement | ||||||||||||||||||||||||||||||||||||||
Results performance compared to H1 2023
In Q2 2024, profit attributable to the parent totalled EUR 3,207 million, reaching a new quarterly record, despite incorporating charges of EUR 452 million net of tax and minority interests: EUR 209 million related to higher provisions for our CHF mortgage portfolio in Poland (in Retail and Consumer), which brings the current ratio of these on-balance sheet assets to provisions to 100%; and EUR 243 million from write-downs in PagoNxt related to the discontinuation of our merchant platform in Germany (to focus on our core markets) and Superdigital in Latin America (in line with our strategy to promote the use of our common platforms across the Group to maximize operational leverage and provide the best service, while increasing access to banking services in the mass segment).
Additionally, from Q2 2024 onwards, a theoretical exchange rate has been used for the Argentine peso. For further information, see the 'Alternative performance measures' section in the appendix to this report.
Profit attributable to the parent amounted to EUR 6,059 million in H1 2024, compared to EUR 5,241 million in the same period in 2023, 16% higher year-on-year. This increase is due to the good performance of total income, which grew at a much faster pace than operating expenses, and with provisions growing in line with expectations, driven by the normalization in our Consumer business. SRF contributions ended in 2023 and therefore there is no contribution in 2024.
Total income
Total income amounted to EUR 30,715 million, up 10% year-on-year. By line:
•Net interest income (NII) totalled EUR 23,457 million, 12% higher than in H1 2023 with widespread growth across businesses and regions.
Growth was driven by Retail in Europe, due to good price management, and greater volumes and good margin management in Retail in Brazil and Consumer, benefitting from a lower interest rate environment given the negative sensitivity of its balance sheet. NII was also backed by increased activity in CIB, Wealth and Payments.
| Net interest income | |||||
| EUR million | |||||

•Net fee income amounted to EUR 6,477 million, up 6% compared to H1 2023, with solid performance across all our businesses, except Payments which was impacted by a one-time positive fee recorded in Q1 2023.
| Net fee income | |||||
| EUR million | |||||
•Gains or losses on financial assets and liabilities and exchange differences declined to EUR 957 million (EUR 1,302 million in H1 2023) affected by lower results in CIB, mainly in Brazil in a weak market.
•Dividend income was EUR 493 million (EUR 382 million in H1 2023).
•Income from companies accounted for by the equity method reached EUR 303 million, compared to EUR 296 million in H1 2023.
•Other operating income recorded a loss of EUR 972 million (compared to a EUR 993 million loss in H1 2023), owing to the negative impact from hyperinflation adjustment in Argentina (EUR 687 million), and the temporary levy on revenue earned in Spain (EUR 335 million in Q1 2024 and EUR 224 million in Q1 2023). As mentioned above, no contributions to the SRF were charged in 2024 (EUR 293 million in Q2 2023).
| Total income | |||||
| EUR million | |||||

All in all, good performance of total income, supported by year-on-year growth across all our businesses and regions.
10 | | January - June 2024 | ||||||
Operating expenses
Operating expenses in H1 2024 amounted to EUR 12,913 million, and rose 3% year-on-year (at a much slower pace than total income), mainly due to the impact of inflation.
Our cost management continued to focus on structurally improving our efficiency and, as a result, we remained among the most efficient banks in the world.
We continued to drive our business transformation plan, ONE Transformation, across our footprint, reflected in greater operational leverage and better business dynamics.
| Operating expenses | |||||
| EUR million | |||||

Provisions or reversal of provisions
Provisions (net of provisions reversals) amounted to EUR 1,762 million and included a write-down in PagoNxt related to the discontinuation of our Superdigital platform in Latin America. In H1 2023, this provisions totalled EUR 1,330 million.
Impairment or reversal of impairment of financial assets not measured at fair value through profit or loss (net)
Impairment or reversal of impairment on financial assets not measured at fair value through profit or loss (net) was EUR 6,577 million (EUR 6,237 million in H1 2023), driven by volumes growth, normalization and regulatory impacts in Consumer. It also includes provisions for our CHF mortgage portfolio in Poland, both in H1 2024 and H1 2023.
Credit quality indicators remained robust, supported by the good performance of the global economy and labour markets across our footprint.
Impairment on other assets (net)
The impairment on other assets (net) was EUR 290 million, including the write-down in PagoNxt related to the discontinuation of our merchant platform in Germany. In H1 2023, impairments totalled EUR 92 million.
Gains or losses on non-financial assets and investments (net)
Net gains on non-financial assets and investments were EUR 366 million in H1 2024, including a EUR 352 million capital gain resulting from having closed the joint-venture agreement with Sodexo in Brazil. In H1 2023 net gains were EUR 277 million .
Negative goodwill recognized in results
There was no negative goodwill recorded in H1 2024 or in H1 2023.
Gains or losses on non-current assets held for sale not classified as discontinued operations
This item, which mainly includes impairment of foreclosed assets recorded and the sale of properties acquired upon foreclosure, recorded a EUR 31 million loss in H1 2024 (EUR 59 million loss in H1 2023).
Profit before tax
Profit before tax was EUR 9,508 million in H1 2024, up 18% year-on-year, supported by the solid performance in net interest income and net fee income.
Income tax
Total income tax amounted to EUR 2,916 million compared to EUR 2,281 million in H1 2023.
Profit attributable to non-controlling interests
Profit attributable to non-controlling interests amounted to EUR 533 million (EUR 568 million in H1 2023).
Profit attributable to the parent
Profit attributable to the parent rose to EUR 6,059 million in H1 2024, compared to EUR 5,241 million in the same period in 2023, 16% higher year-on-year.
These results do not fully reflect the underlying business performance due to the impact of the aforementioned charges.
January - June 2024 | | 11 | ||||||
| Underlying income statement | ||||||||||||||||||||||||||||||||||||||
→ Record profit in the quarter and first half of the year, with solid revenue growth in all our global businesses and regions. → Efficiency improvement and profitable growth, supported by the operational leverage resulting from ONE Transformation. → Risk indicators were robust, due to good risk management, the economic environment and low unemployment. → Positive 2024 results enabled us to improve our targets for the year in revenue, efficiency and profitability. | ||||||||||||||||||||
| Attributable profit | RoTE | RoRWA | ||||||||||||||||||
| EUR 6,059 million | +16% in euros | 15.9% | 2.07% | |||||||||||||||||
| +15% in constant euros | +1.4 pp | +0.2 pp | ||||||||||||||||||
| Note: changes vs. H1 2023. | ||||||||||||||||||||
Results performance compared to H1 2023
The Group presents, both at the total Group level and for each of the business units, the changes in euros registered in the income statement, as well as variations excluding the exchange rate effect (i.e. in constant euros) except for Argentina and any grouping which includes it, understanding that the latter provide a better analysis of the Group’s management. Additionally, from Q2 2024 onwards, a theoretical exchange rate has been used for the Argentine peso. For further information, see the 'Alternative performance measures' section in the appendix to this report.
At the Group level, exchange rates had a positive impact of 0.7 pp in revenue and a negative impact of 0.5 pp in costs.
To better understand the business trends, we reclassified certain items under some headings of the underlying income statement. These items explain the differences between the statutory and underlying income statements and are:
•In H1 2024:
–The impact of the temporary levy on revenue earned in Spain totalling EUR 335 million in Q1 2024, which was moved from total income to other gains (losses) and provisions.
–Provisions which strengthen the balance sheet in Brazil of EUR 352 million in Q2 2024 (EUR 174 million net of tax and minority interests).
•In H1 2023:
–The impact of the temporary levy on revenue earned in Spain totalling EUR 224 million in Q1 2023, which was moved from total income to other gains (losses) and provisions.
–Provisions which strengthen the balance sheet in Brazil of EUR 235 million, net of tax and minority interests in Q1 2023.
For more details, see the 'Alternative Performance Measures' section in the appendix of this report.
As profit was not affected by results that fell outside the ordinary course of our business, no amount was recorded in the net capital gains and provisions line in H1 2024 or in H1 2023 and so both profit attributable to the parent and underlying profit were the same; EUR 6,059 million in H1 2024 and EUR 5,241 million in H1 2023. This represents a 16% year-on-year increase, a 15% rise in constant euros.
This year-on-year comparison is impacted by a higher charge of the temporary levy and by the EUR 243 million net of tax and minority interests from the write-downs in PagoNxt in Q2 2024 related to the discontinuation of our merchant platform in Germany and Superdigital in Latin America. Additionally, there was no contribution to the SRF in 2024, as contributions ended in 2023.
| Summarized underlying income statement | ||||||||||||||||||||||||||
| EUR million | Change | Change | ||||||||||||||||||||||||
| Q2'24 | Q1'24 | % | % excl. FX | H1'24 | H1'23 | % | % excl. FX | |||||||||||||||||||
| Net interest income | 11,474 | 11,983 | (4.2) | (3.5) | 23,457 | 20,920 | 12.1 | 11.2 | ||||||||||||||||||
| Net fee income | 3,237 | 3,240 | (0.1) | 0.8 | 6,477 | 6,103 | 6.1 | 5.8 | ||||||||||||||||||
Gains (losses) on financial transactions 1 | 334 | 623 | (46.4) | (46.4) | 957 | 1,302 | (26.5) | (25.7) | ||||||||||||||||||
| Other operating income | 625 | (466) | — | — | 159 | (91) | — | — | ||||||||||||||||||
| Total income | 15,670 | 15,380 | 1.9 | 2.6 | 31,050 | 28,234 | 10.0 | 9.3 | ||||||||||||||||||
| Administrative expenses and amortizations | (6,366) | (6,547) | (2.8) | (2.3) | (12,913) | (12,479) | 3.5 | 3.0 | ||||||||||||||||||
| Net operating income | 9,304 | 8,833 | 5.3 | 6.3 | 18,137 | 15,755 | 15.1 | 14.3 | ||||||||||||||||||
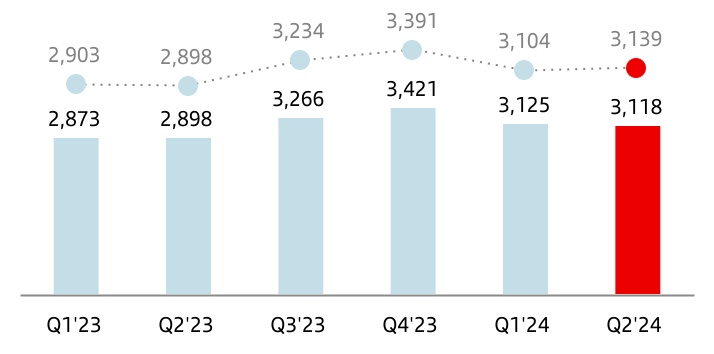
| Net loan-loss provisions | (3,118) | (3,125) | (0.2) | 1.1 | (6,243) | (5,771) | 8.2 | 7.6 | ||||||||||||||||||
| Other gains (losses) and provisions | (1,261) | (1,125) | 12.1 | 12.8 | (2,386) | (1,655) | 44.2 | 42.7 | ||||||||||||||||||
| Profit before tax | 4,925 | 4,583 | 7.5 | 8.2 | 9,508 | 8,329 | 14.2 | 13.3 | ||||||||||||||||||
| Tax on profit | (1,448) | (1,468) | (1.4) | (0.4) | (2,916) | (2,494) | 16.9 | 15.6 | ||||||||||||||||||
| Profit from continuing operations | 3,477 | 3,115 | 11.6 | 12.2 | 6,592 | 5,835 | 13.0 | 12.3 | ||||||||||||||||||
| Net profit from discontinued operations | — | — | — | — | — | — | — | — | ||||||||||||||||||
| Consolidated profit | 3,477 | 3,115 | 11.6 | 12.2 | 6,592 | 5,835 | 13.0 | 12.3 | ||||||||||||||||||
| Non-controlling interests | (270) | (263) | 2.7 | 2.9 | (533) | (594) | (10.3) | (9.3) | ||||||||||||||||||
| Net capital gains and provisions | — | — | — | — | — | — | — | — | ||||||||||||||||||
| Profit attributable to the parent | 3,207 | 2,852 | 12.4 | 13.1 | 6,059 | 5,241 | 15.6 | 14.7 | ||||||||||||||||||
Underlying profit attributable to the parent 2 | 3,207 | 2,852 | 12.4 | 13.1 | 6,059 | 5,241 | 15.6 | 14.7 | ||||||||||||||||||
1. Includes exchange differences.
2. Excludes net capital gains and provisions.
12 | | January - June 2024 | ||||||
Total income amounted to EUR 31,050 million, a new record, up 10% year-on-year. In constant euros, total income rose 9% year-on-year, as follows:
•Net interest income (NII) was 11% higher than H1 2023 with growth across businesses and regions:
–Strong growth in Retail, (+12%) with increases in all regions, especially in Europe, driven by good liability margin management, and in South America which benefitted from higher volumes and lower deposit costs in Brazil and Chile following interest rate cuts.
–In Consumer, NII rose 7% supported by our active asset repricing actions and volumes growth in Europe, and higher volumes and lower interest rates in Brazil (favouring consumption).
–CIB increased strongly (+22%), backed by solid performance in Global Banking.
–In Wealth, NII rose 13%, driven by good margin management and increased activity in Private Banking in a favourable macroeconomic environment.
–In Payments, NII rose 10% driven by the solid performance in Cards, which is the main NII business in Payments, driven by higher volumes in Mexico and Brazil.
| Net interest income | |||||
| EUR million | |||||
 | constant euros | ||||

•Net fee income grew 6% compared with H1 2023, reaching a new record of EUR 6,477 million with widespread growth across all businesses except Payments, whose year-on-year comparison was impacted by a one-time positive fee from commercial agreements in Brazil in Q1 2023. By business:
–In Retail, net fee income increased 3%, supported by growth across most countries, especially in Brazil, mainly due to insurance and foreign exchange fees.
–In Consumer, net fee income rose 27%, driven by growth in Europe due to increased insurance penetration (particularly in Germany), in Brazil boosted by volumes growth, and in the US in part due to auto fees.
–In CIB, it increased 12%, driven by greater activity in Global Banking, backed by our US Banking Build-Out (BBO) initiatives.
–In Wealth, net fee income rose 15%, mainly due to the good commercial activity in Private Banking and Asset Management.
–In Payments, it declined 7% affected by the impact of the aforementioned one-time positive fee in Q1 2023 in Cards,
while net fee income rose in PagoNxt due to the good performance in Ebury and the increase in Getnet in Chile, Mexico and Europe.
| Net fee income | |||||
| EUR million | |||||
| constant euros | ||||

•Gains on financial transactions declined 26% driven by CIB (lower gains in Global Markets down from a very strong H1 2023, especially by Brazil in a weak market, partially offset by higher results in Retail.
•Other operating income included a greater negative impact from hyperinflation adjustment in Argentina. In 2024, there is no contribution to the SRF, as contributions ended in 2023.
This positive performance in revenue during H1 2024, enabled us to improve growth expectations for the whole year and upgrade our total income target from mid-single digit growth to high-single digits.
| Total income | |||||
| EUR million | |||||
| constant euros | ||||

•Administrative expenses and amortizations in H1 2024 totalled EUR 12,913 million, up 3% year-on-year. In real terms, excluding the impact of the average inflation, and in constant euros, they were 1% lower year-on-year.
Our cost management continued to focus on structurally improving our efficiency. As a result, we remained among the most efficient banks in the world with an efficiency of 41.6%, having improved 2.6 pp vs. H1 2023 and better than our target for 2024. This is why we have upgraded our efficiency ratio target from under 43% to close to 42%.
We continued to progress with our business transformation plan, ONE Transformation, reflected in greater operational leverage and better business dynamics. By business and in constant euros:
January - June 2024 | | 13 | ||||||
–In Retail, costs remained flat, but were down 4% in real terms (i.e excluding inflation), driven by the efforts in transformation (mainly in Spain and the US) and the lower costs in Argentina. The efficiency ratio stood at 39.5%, improving 4.8 pp year-on-year.
–In Consumer, costs were stable year-on-year, in real terms they fell 3% driven by cost discipline in the US, absorbing strategic investments in platforms in leasing (launched in two European markets) and check-out lending. This resulted in a 2.7 pp improvement in the efficiency ratio year-on-year, falling to 40.6%.
–In CIB, they increased by 20%, +16% in real terms, due to our investments in new products and capabilities, as we invest for future growth. The efficiency ratio stood at 43.4%.
–In Wealth, costs rose 5% mainly due to inflation. In real terms, they increased 2% due to investments in key initiatives such as reinforcing our Private Banking teams to respond to higher commercial activity. The efficiency ratio improved 2.3 pp year-on-year to 34.4%.
–In Payments, they were 4% up impacted by inflationary pressures, as they were flat in real terms despite investments in global platforms in both PagoNxt and Cards. The efficiency ratio remained relatively stable year-on-year at 46.9%.
| Operating expenses | |||||
| EUR million | |||||
| constant euros | ||||

Net operating income in H1 2024 grew 15% year-on-year (14% in constant euros), reaching a new record of EUR 18,137 million.
| Net operating income | |||||
| EUR million | |||||
| constant euros | ||||
•Net loan-loss provisions in H1 2024 amounted to EUR 6,243 million, up 8%. In constant euros, they also increased 8%, as the good performance in Retail, due to lower levels of provisions in Europe, partially offset the expected increase in Consumer, driven by the normalization of the cost of risk from very low levels, volumes growth and regulatory impacts.
Additionally, we increased the coverage of the CHF mortgage portfolio in Poland. The cost of risk stood at 1.21%, in line with the Group’s target for 2024.
| Net loan-loss provisions | |||||
| EUR million | |||||
| constant euros | ||||
•Other gains (losses) and provisions had a loss of EUR 2,386 million, versus a EUR 1,655 million loss in H1 2023, mainly affected by write-downs in PagoNxt related to the discontinuation of our merchant platform in Germany and Superdigital in Latin America, as well as by the higher impact of the temporary levy on revenue earned in Spain.
•Profit attributable to the parent in H1 2024 was EUR 6,059 million, 16% more than in the same period in 2023 (+15% in constant euros), supported by double-digit net operating income growth, as total income greatly outpaced cost growth.
| Profit attributable to the parent | |||||
| EUR million | |||||
| constant euros | ||||

RoTE in H1 2024 stood at 15.9% (14.5% in H1 2023), RoRWA at 2.07% (1.88% in H1 2023) and earnings per share stood at EUR 0.37 (EUR 0.31 in H1 2023). Annualizing the impact of the temporary levy on revenue earned in Spain, RoTE in H1 2024 would have been 16.3%. Positive H1 2024 results enabled us to improve our profitability target for the year, from a 16% RoTE to more than 16%.
14 | | January - June 2024 | ||||||
Underlying results performance compared to Q1 2024
Underlying profit attributable to the parent and profit attributable to the parent were the same both in Q2 2024, at EUR 3,207 million, and in Q1 2024, at EUR 2,852 million, as profit was not affected by results outside the ordinary course of our business.
Quarterly variations in the income statement are impacted by the application of the new theoretical exchange rate for the Argentine peso. For further information, see the 'Alternative performance measures' section in the appendix to this report.
Profit increased 12% compared to Q1 2024. In constant euros, it increased 13%, by line:
Total income rose 3% driven by the positive performance of the main lines:
•Net interest income decreased 4%, largely impacted by Argentina. Excluding Argentina, it rose 2% driven by Retail (mainly Brazil and Chile supported by lower cost of deposits and greater volumes) and the increased activity in CIB.
•Net fee income grew 1% quarter-on-quarter. Excluding Argentina, they rose 3%, backed by the good performances in Retail, Consumer and Payments.
•Gains on financial transactions fell 46% (-42% excluding Argentina), due to the performance in CIB, mainly in Brazil, partially offset by higher results in Retail and the Corporate Centre.
•Operating expenses in Q2 2024 fell 2% quarter-on-quarter. Excluding Argentina, they were flat as cost efficiencies captured in Retail were offset by our investments in CIB.
•Net loan-loss provisions were practically flat, as the significant declines in Consumer in the US and Brazil offset the increase in Retail, due to volumes growth, and higher CHF provisions in Poland (Retail and Consumer).
•Other gains (losses) and provisions had a EUR 1,261 million loss in Q2 2024, which includes the write-downs in PagoNxt related to the discontinuation of our merchant platform in Germany and Superdigital in Latin America, compared to a EUR 1,125 million loss recorded in Q1 2024, which was affected by the impact of the temporary tax on revenue earned in Spain.
January - June 2024 | | 15 | ||||||
Grupo Santander balance sheet
| Grupo Santander. Condensed balance sheet | |||||||||||||||||
| EUR million | |||||||||||||||||
| Change | |||||||||||||||||
| Assets | Jun-24 | Jun-23 | Absolute | % | Dec-23 | ||||||||||||
| Cash, cash balances at central banks and other demand deposits | 156,234 | 207,546 | (51,312) | (24.7) | 220,342 | ||||||||||||
| Financial assets held for trading | 206,874 | 183,834 | 23,040 | 12.5 | 176,921 | ||||||||||||
| Debt securities | 71,523 | 55,823 | 15,700 | 28.1 | 62,124 | ||||||||||||
| Equity instruments | 16,764 | 13,349 | 3,415 | 25.6 | 15,057 | ||||||||||||
| Loans and advances to customers | 19,899 | 11,051 | 8,848 | 80.1 | 11,634 | ||||||||||||
| Loans and advances to central banks and credit institutions | 39,760 | 35,998 | 3,762 | 10.5 | 31,778 | ||||||||||||
| Derivatives | 58,928 | 67,613 | (8,685) | (12.8) | 56,328 | ||||||||||||
Financial assets designated at fair value through profit or loss1 | 15,335 | 15,441 | (106) | (0.7) | 15,683 | ||||||||||||
| Loans and advances to customers | 6,601 | 6,782 | (181) | (2.7) | 7,201 | ||||||||||||
| Loans and advances to central banks and credit institutions | 444 | 627 | (183) | (29.2) | 459 | ||||||||||||
| Other (debt securities an equity instruments) | 8,290 | 8,032 | 258 | 3.2 | 8,023 | ||||||||||||
| Financial assets at fair value through other comprehensive income | 82,270 | 86,756 | (4,486) | (5.2) | 83,308 | ||||||||||||
| Debt securities | 71,160 | 76,010 | (4,850) | (6.4) | 73,565 | ||||||||||||
| Equity instruments | 1,842 | 1,729 | 113 | 6.5 | 1,761 | ||||||||||||
| Loans and advances to customers | 8,933 | 8,714 | 219 | 2.5 | 7,669 | ||||||||||||
| Loans and advances to central banks and credit institutions | 335 | 303 | 32 | 10.6 | 313 | ||||||||||||
| Financial assets measured at amortized cost | 1,217,341 | 1,180,302 | 37,039 | 3.1 | 1,191,403 | ||||||||||||
| Debt securities | 114,347 | 91,559 | 22,788 | 24.9 | 103,559 | ||||||||||||
| Loans and advances to customers | 1,030,163 | 1,018,497 | 11,666 | 1.1 | 1,009,845 | ||||||||||||
| Loans and advances to central banks and credit institutions | 72,831 | 70,246 | 2,585 | 3.7 | 77,999 | ||||||||||||
| Investments in subsidiaries, joint ventures and associates | 8,235 | 7,679 | 556 | 7.2 | 7,646 | ||||||||||||
| Tangible assets | 33,709 | 34,159 | (450) | (1.3) | 33,882 | ||||||||||||
| Intangible assets | 19,359 | 19,528 | (169) | (0.9) | 19,871 | ||||||||||||
| Goodwill | 13,668 | 14,126 | (458) | (3.2) | 14,017 | ||||||||||||
| Other intangible assets | 5,691 | 5,402 | 289 | 5.3 | 5,854 | ||||||||||||
Other assets2 | 46,904 | 45,248 | 1,656 | 3.7 | 48,006 | ||||||||||||
| Total assets | 1,786,261 | 1,780,493 | 5,768 | 0.3 | 1,797,062 | ||||||||||||
| Liabilities and shareholders' equity | |||||||||||||||||
| Financial liabilities held for trading | 133,856 | 134,888 | (1,032) | (0.8) | 122,270 | ||||||||||||
| Customer deposits | 23,729 | 19,921 | 3,808 | 19.1 | 19,837 | ||||||||||||
| Debt securities issued | — | — | — | — | — | ||||||||||||
| Deposits by central banks and credit institutions | 28,213 | 30,356 | (2,143) | (7.1) | 25,670 | ||||||||||||
| Derivatives | 52,261 | 62,259 | (9,998) | (16.1) | 50,589 | ||||||||||||
| Other | 29,653 | 22,352 | 7,301 | 32.7 | 26,174 | ||||||||||||
| Financial liabilities designated at fair value through profit or loss | 34,493 | 36,220 | (1,727) | (4.8) | 40,367 | ||||||||||||
| Customer deposits | 24,809 | 27,297 | (2,488) | (9.1) | 32,052 | ||||||||||||
| Debt securities issued | 6,726 | 5,684 | 1,042 | 18.3 | 5,371 | ||||||||||||
| Deposits by central banks and credit institutions | 2,942 | 3,239 | (297) | (9.2) | 2,944 | ||||||||||||
| Other | 16 | — | 16 | — | — | ||||||||||||
| Financial liabilities measured at amortized cost | 1,454,896 | 1,446,882 | 8,014 | 0.6 | 1,468,703 | ||||||||||||
| Customer deposits | 989,108 | 966,560 | 22,548 | 2.3 | 995,280 | ||||||||||||
| Debt securities issued | 305,136 | 285,869 | 19,267 | 6.7 | 303,208 | ||||||||||||
| Deposits by central banks and credit institutions | 117,752 | 149,348 | (31,596) | (21.2) | 130,028 | ||||||||||||
| Other | 42,900 | 45,105 | (2,205) | (4.9) | 40,187 | ||||||||||||
| Liabilities under insurance contracts | 17,592 | 17,584 | 8 | 0.0 | 17,799 | ||||||||||||
| Provisions | 8,401 | 8,389 | 12 | 0.1 | 8,441 | ||||||||||||
Other liabilities3 | 33,375 | 34,486 | (1,111) | (3.2) | 35,241 | ||||||||||||
| Total liabilities | 1,682,613 | 1,678,449 | 4,164 | 0.2 | 1,692,821 | ||||||||||||
| Shareholders' equity | 132,836 | 127,258 | 5,578 | 4.4 | 130,443 | ||||||||||||
| Capital stock | 7,747 | 8,092 | (345) | (4.3) | 8,092 | ||||||||||||
Reserves (including treasury stock)4 | 119,030 | 113,925 | 5,105 | 4.5 | 112,573 | ||||||||||||
| Profit attributable to the Group | 6,059 | 5,241 | 818 | 15.6 | 11,076 | ||||||||||||
| Less: dividends | — | — | — | — | (1,298) | ||||||||||||
| Other comprehensive income | (36,963) | (33,789) | (3,174) | 9.4 | (35,020) | ||||||||||||
| Minority interests | 7,775 | 8,575 | (800) | (9.3) | 8,818 | ||||||||||||
| Total equity | 103,648 | 102,044 | 1,604 | 1.6 | 104,241 | ||||||||||||
| Total liabilities and equity | 1,786,261 | 1,780,493 | 5,768 | 0.3 | 1,797,062 | ||||||||||||
| Note: The condensed balance sheet groups some lines of the consolidated balance sheet on pages 88 and 89 as follows: | ||
1.'Non-trading financial assets mandatorily at fair value through profit or loss' and 'Financial assets designated at fair value through profit or loss'. | ||
2.‘Hedging derivatives’; ‘Changes in the fair value of hedged items in portfolio hedges of interest risk’; 'Assets under reinsurance contracts'; ‘Tax assets’; ‘Other assets’; and 'Non-current assets held for sale’. | ||
3.‘Hedging derivatives’; ‘Changes in the fair value of hedged items in portfolio hedges of interest rate risk’; ‘Tax liabilities’; ‘Other liabilities’; and ‘Liabilities associated with non-current assets held for sale‘. | ||
4.‘Share premium’; ‘Equity instruments issued other than capital’; ‘Other equity’; ‘Accumulated retained earnings’; ‘Revaluation reserves’; ‘Other reserves’; and ‘Own shares (-)’. | ||
16 | | January - June 2024 | ||||||
| Balance sheet | ||||||||||||||||||||||||||||||||||||||
Gross loans and advances to customers (excl. reverse repos) | Customer funds (deposits excl. repos + mutual funds) | |||||||||||||||||||
| Lending volumes rose 2% year-on-year. Quarter-on-quarter, lending volumes also increased 2%, with growth across most businesses and regions. | Customer funds grew year-on-year and remained flat quarter-on-quarter, as the decline in corporate deposits was offset by higher mutual funds. | |||||||||||||||||||
Gross loans and advances to customers (excl. reverse repos) | Customer funds (deposits excl. repos + mutual funds) | |||||||||||||||||||
| 1,027 | +2% QoQ | 1,171 | 0% QoQ | |||||||||||||||||
| EUR billion | +2% YoY | EUR billion | +5% YoY | |||||||||||||||||
è By segment: | è By product: | |||||||||||||||||||
| Solid growth year-on-year in our Consumer and CIB businesses, with a slight decrease in Retail. | Year-on-year growth in time deposits and mutual funds at the expense of demand deposits. | |||||||||||||||||||
| Retail | Consumer | CIB | Demand | Time | Mutual funds | |||||||||||||||
| -1% | +6% | +7% | -1% | +12% | +17% | |||||||||||||||
| Note: changes in constant euros. | ||||||||||||||||||||
Loans and advances to customers
Loans and advances to customers stood at EUR 1,065,596 million as at end June 2024, a 2% increase both year-on-year and quarter-on-quarter.
For the purpose of analysing traditional banking loans, the Group uses gross loans and advances to customers excluding reverse repos (EUR 1,027,346 million). Additionally, the comments below do not include the exchange rate impact (i.e in constant euros), except for Argentina and any grouping which includes it. From Q2 2024 onwards, a theoretical exchange rate has been used for the Argentine peso. For further information, see the 'Alternative performance measures' section in the appendix to this report. However, the use of this new exchange rate did not significantly impact quarter-on-quarter balance variations given the small size of Argentina’s balance sheet relative to the total Group.
In Q2 2024, gross loans and advances to customers, excluding reverse repos, rose 2% quarter-on-quarter in constant euros, as follows:
•They increased 1% in Retail, driven by growth in corporates, as individuals and SMEs were stable. By region, they increased in South America (mainly in Brazil), North America (mainly Mexico) and were flat in Europe (good performance in Spain and Poland offset the fall in the UK).
•In Consumer, loans grew 3%, driven by the increases in auto in Europe, the US and Brazil.
| Gross loans and advances to customers (excl. reverse repos) | |||||
| EUR billion | |||||

| +1 | % | 1 | |||
| Jun-24 / Jun-23 | |||||
1. In constant euros: +2%.
•In CIB, loans grew 5%, with increases in all regions, especially in Spain driven by higher activity levels.
•They increased 1% in Wealth and declined 1% in Payments.
Compared to June 2023, gross loans and advances to customers (excluding reverse repos and in constant euros) grew 2%, as follows:
•In Retail, they dropped 1%, as falls in the UK (in line with our strategy of increasing profitability) and Spain (affected by mortgage prepayments and lower SME lending) was partially offset by growth in Brazil, Poland, Mexico and Chile.
•They rose 6% in Consumer, boosted by the good performance in auto in Europe and Brazil.
•In CIB, they grew 7% boosted by solid growth in the US, on the back of our US BBO initiatives.
•They increased 3% in Wealth and 4% in Payments.
As at end June 2024, gross loans and advances to customers excluding reverse repos maintained a diversified mix among the markets in which the Group operates: Europe (55%), DCB Europe (14%), North America (16%) and South America (15%).
| Gross loans and advances to customers (excl. reverse repos) | ||
| % operating areas. June 2024 | ||

January - June 2024 | | 17 | ||||||
Customer funds
Customer deposits amounted to EUR 1,037,646 million in June 2024, falling 1% quarter-on-quarter and growing 2% year-on-year.
The Group uses customer funds (customer deposits excluding repos, plus mutual funds) for the purpose of analysing traditional retail banking funds, which amounted to EUR 1,171,085 million as at end June 2024. Additionally, the comments below do not include the exchange rate impact (i.e in constant euros), except for Argentina and any grouping which includes it. From Q2 2024 onwards, a theoretical exchange rate has been used for the Argentine peso. For further information, see the 'Alternative performance measures' section in the appendix to this report. However, the use of this new exchange rate did not significantly impact quarter-on-quarter balance variations given the small size of Argentina’s balance sheet relative to the total Group.
In the quarter, customer funds were flat in constant euros, as follows:
•By product, customer deposits excluding repos decreased slightly, offset by mutual funds which grew 3%.
•By primary segment, customer funds grew 3% in Consumer, up 1% in Retail and Wealth. On the other hand, they fell 7% in CIB, mainly driven by strategy changes to reduce excess corporate deposits.
Compared to June 2023, customer funds were up 5% in constant euros:
•By product, deposits excluding repurchase agreements rose 2%, driven by an increase in time deposits (+12%) given the current interest rate environment, with time deposit growth in most markets (except in the US and Argentina), to the detriment of demand deposits, which fell 1%. Mutual funds increased 17%.
•By business, they rose 4% in Retail, backed by strong growth in Brazil, Spain, Mexico and Poland, up 14% in Consumer as part of our strategy to increase deposit funding, while they fell 3% in CIB due to lower volumes in Spain and the US, and increased 10% in Wealth, due to mutual funds.
•By secondary segment, strong growth in Brazil, Spain Mexico, Poland and DCB Europe.
As at June 2024, customer funds maintained a diversified mix among the markets in which the Group operates: Europe (62%), DCB Europe (7%), North America (14%) and South America (17%). The weight of demand deposits as a percentage of total customer funds was 56%, while time deposits accounted for 25% of the total and mutual funds for 19%.
| Customer funds | ||
| EUR billion | ||

| +3 | % | 1a | ||||||
| +13 | % | |||||||
| +1 | % | |||||||
•Total | ||||||||
• Mutual funds | ||||||||
•Deposits exc. repos | ||||||||
| Jun-24 / Jun-23 | ||||||||
1. In constant euros: +5%.
In addition to capturing customer deposits, the Group, for strategic reasons, maintains a selective policy of issuing securities in the international fixed income markets and strives to adapt the frequency and volume of its market operations to the structural liquidity needs of each unit, as well as to the receptiveness of each market.
In H1 2024, the Group issued:
•Medium- and long-term senior debt placed in the market of EUR 12,053 million and covered bonds amounting to EUR 6,272 million.
•TLAC eligible instruments issued amounted to EUR 11,998 million, of which EUR 8,092 million was senior non-preferred, EUR 2,406 million was subordinated debt and EUR 1,500 million was AT1.
•Maturities of medium- and long-term debt totalled EUR 25,682 million.
The net loan-to-deposit ratio was 103% (103% in June 2023). The ratio of deposits plus medium- and long-term funding to the Group’s loans was 123%, underscoring the comfortable funding structure. The liquidity coverage ratio (LCR) was an estimated 163% in June 2024 (158% in June 2023).
The Group's access to wholesale funding markets and the cost of issuances depends, in part, on the ratings of the rating agencies.
| Rating agencies | |||||||||||
| Long term | Short term | Outlook | |||||||||
| Fitch Ratings | A-(Senior A) | F2 (Senior F1) | Stable | ||||||||
| Moody's | A2 | P-1 | Positive | ||||||||
| Standard & Poor's | A+ | A-1 | Stable | ||||||||
| DBRS | A (High) | R-1 (Middle) | Stable | ||||||||
Moody's confirmed its A2 long-term and P-1 short-term ratings in April of this year, and also improved its outlook from stable to positive following the same movement in the rating of the Kingdom of Spain, remaining two notches above sovereign. In April, Standard & Poor's (S&P) rated our additional tier 1 debt as BBB- (investment grade), a new rating for this instrument.
In terms of outlooks, DBRS and Fitch maintained their stable outlooks, above the sovereign's, while S&P also maintained its outlook but in line with the sovereign.
Sometimes the methodology applied by the agencies limits a bank's rating to the sovereign rating of the country where it is headquartered. Banco Santander, S.A. is still rated above the sovereign debt rating of the Kingdom of Spain by Moody’s, DBRS and S&P and at the same level by Fitch, which demonstrates our financial strength and diversification.
| Customer funds | ||
| % operating areas. June 2024 | ||
18 | | January - June 2024 | ||||||
Solvency ratios
| Executive summary | ||||||||||||||||||||||||||||||||||||||
| Fully-loaded capital ratio | Fully-loaded CET1 ratio | |||||||||||||||||||
| The fully-loaded CET1 ratio remained above 12% at the end of June, in line with the Group's objective. | We continued to generate capital organically in the quarter, backed by profit growth. | |||||||||||||||||||
| Fully-loaded CET1 performance (%) | Organic generation | +52 bps | ||||||||||||||||||
 | ||||||||||||||||||||
Accrual for shareholder remuneration1 | -25 bps | |||||||||||||||||||
| TNAV per share | ||||||||||||||||||||
TNAV per share was EUR 4.94, increasing 12% year-on-year including the cash dividends. | ||||||||||||||||||||
As at end June 2024, the total phased-in capital ratio (applying the IFRS 9 transitional arrangements) stood at 16.7% and the phased-in CET1 ratio at 12.5%. We comfortably meet the levels required by the ECB on a consolidated basis (estimated 13.9% for the total capital ratio and 9.6% for the CET1 ratio)2. This resulted in a distance to the maximum distributable amount (MDA) of 245 bps and a CET1 management buffer of 286 bps.
In fully-loaded terms, we generated 52 bps organically in the quarter, including a 7 bp positive contribution from RWAs, as RWA growth was more than offset by significant risk transfer and asset rotation initiatives. We also recorded a 25 bp charge for shareholder remuneration against profit earned in Q2 2024 in line with our 50% payout target1.
Additionally, we recorded charges of -7 bps relating to deductions, mainly intangible assets and held to collect and sell portfolio valuations. There were no significant regulatory charges in the quarter.
This resulted in a fully-loaded CET1 ratio of 12.5%. The total fully-loaded capital ratio stood at 16.4%.
TNAV per share ended the quarter at EUR 4.94. Including the cash dividend paid in November 2023 (EUR 8.10 cents) and the second cash dividend charged against 2023 results (EUR 9.50 cents) paid in May, TNAV plus cash dividend per share increased 12% in the last twelve months (+2% in the quarter).
Lastly, the fully-loaded leverage ratio stood at 4.74% and the phased-in was also 4.74%.
Eligible capital. June 2024 | ||||||||
| EUR million | ||||||||
| Fully-loaded | Phased-in | |||||||
| CET1 | 77,848 | 77,975 | ||||||
| Basic capital | 86,681 | 86,809 | ||||||
| Eligible capital | 102,419 | 104,420 | ||||||
| Risk-weighted assets | 625,017 | 624,831 | ||||||
| % | % | |||||||
| CET1 capital ratio | 12.5 | 12.5 | ||||||
| Tier 1 capital ratio | 13.9 | 13.9 | ||||||
| Total capital ratio | 16.4 | 16.7 | ||||||
| Fully-loaded CET1 ratio performance | ||
| % | ||

Note: The phased-in ratio includes the transitory treatment of IFRS 9, calculated in accordance with article 473 bis of the Capital Requirements Regulation (CRR2) and subsequent modifications introduced by Regulation 2020/873 of the European Union. Total phased-in capital ratios include the transitory treatment according to chapter 4, title 1, part 10 of the CRR2.
1.Shareholder remuneration charged against profit earned in Q2 2024 in line with our target of approximately 50% payout, divided approximately equally between cash dividends and share repurchases. The implementation of the shareholder remuneration policy is subject to future corporate and regulatory decisions and approvals.
2.On 1 January 2024, our systemic buffer requirement increased from 1% to 1.25% due to a higher D-SIB requirement due to i) a methodological change by the ECB which was later adopted by Banco de España and ii) because institutions must hold capital at the consolidated level for the higher of the G-SIB (currently at 1%) and D-SIB requirements. Additionally, the ECB revised Banco Santander, S.A.'s P2R requirement from 1.58% to 1.74%, mainly due to a change in the ECB's methodology.
January - June 2024 | | 19 | ||||||
Risk management
| Executive summary | ||||||||||||||||||||||||||||||||||||||
| Credit risk | Market risk | |||||||||||||||||||
| Credit quality indicators remain within expected levels due to proactive risk management, despite the macroeconomic and geopolitical environment. | Stability in our risk profile. VaR remained at moderate levels in an economic environment with persistent inflation and greater geopolitical risk. | |||||||||||||||||||
| Cost of risk | NPL ratio | Coverage ratio | Average VaR | |||||||||||||||||
| 1.21% | 3.02% | 66% | Q2'24 | EUR 16 million | -EUR 1 mn / Q1'24 | |||||||||||||||
| +1 bps vs. Q1'24 | -8 bps vs. Q1'24 | 0 pp vs. Q1'24 | ||||||||||||||||||
| Structural and liquidity risk | Operational risk | |||||||||||||||||||
| Robust and diversified liquidity buffer, with ratios well above regulatory requirements. | The operational risk profile deteriorated slightly in Q2 2024, caused by an increase in execution and cyber risk. Operational losses have increased compared to Q1 2024. | |||||||||||||||||||
| Liquidity Coverage Ratio (LCR) | ||||||||||||||||||||
| 163% | +5 pp vs. Q1'24 | |||||||||||||||||||
Credit risk 1
During H1 2024, one of the main factors influencing market behaviour was the uncertainly around the decline of inflation, where the ECB recently cut interest rates slightly while the Federal Reserve and the Bank of England held rates. Other determining factors were the growing geopolitical tensions and the various electoral processes in Europe and Latin America.
Nevertheless, in the current soft-landing scenario with a slight slowdown in inflation, economic activity has not been significantly affected, partially due to strong labour markets and fiscal policies that have been supportive of households and businesses.
Our business model, together with our conservative risk management, help us to maintain a medium-low risk profile even in a less favourable macroeconomic and geopolitical environment.
| Key risk metrics | ||||||||||||||||||||||||||||||||||||||||||||||||||
Net loan-loss provisions 2 | Cost of risk (%) 3 | NPL ratio (%) | NPL coverage ratio (%) | |||||||||||||||||||||||||||||||||||||||||||||||
| Q2'24 | H1'24 | Chg (%) / H1'23 | Chg (%) / Q1'24 | H1'24 | Chg (bps) / H1'23 | Chg (bps) / Q1'24 | H1'24 | Chg (bps) / H1'23 | Chg (bps) / Q1'24 | H1'24 | Chg (pp) / H1'23 | Chg (pp) / Q1'24 | ||||||||||||||||||||||||||||||||||||||
| Retail | 1,564 | 3,087 | (1.3) | 4.6 | 1.03 | 11 | 0 | 3.15 | (7) | (9) | 60.4 | (2.8) | 0.3 | |||||||||||||||||||||||||||||||||||||
| Consumer | 1,055 | 2,193 | 21.4 | (7.0) | 2.17 | 31 | 4 | 4.81 | 63 | (5) | 75.9 | (12.0) | (0.2) | |||||||||||||||||||||||||||||||||||||
| CIB | 56 | 96 | — | 39.4 | 0.15 | (4) | 1 | 1.05 | (33) | (9) | 45.0 | 8.2 | (1.3) | |||||||||||||||||||||||||||||||||||||
| Wealth | 10 | 14 | — | 147.9 | 0.05 | 6 | 11 | 0.77 | (5) | 14 | 64.6 | 11.4 | 3.0 | |||||||||||||||||||||||||||||||||||||
| Payments | 434 | 852 | (2.8) | 6.0 | 7.03 | (8) | 14 | 5.00 | (13) | 15 | 149.5 | 7.4 | 4.6 | |||||||||||||||||||||||||||||||||||||
| TOTAL GROUP | 3,118 | 6,243 | 7.6 | 1.1 | 1.21 | 13 | 1 | 3.02 | (5) | (8) | 66.5 | (1.9) | 0.4 | |||||||||||||||||||||||||||||||||||||
| Europe | 532 | 1,017 | (22.7) | 9.6 | 0.39 | (3) | (2) | 2.25 | (11) | (7) | 49.1 | (1.9) | 0.0 | |||||||||||||||||||||||||||||||||||||
| DCB Europe | 308 | 584 | 39.5 | 12.0 | 0.72 | 17 | 5 | 2.31 | 28 | 5 | 85.4 | (9.0) | (0.7) | |||||||||||||||||||||||||||||||||||||
| North America | 908 | 1,893 | 21.2 | (8.1) | 2.23 | 54 | 9 | 3.93 | 70 | (14) | 74.3 | (15.7) | 0.1 | |||||||||||||||||||||||||||||||||||||
| South America | 1,370 | 2,748 | 9.5 | 2.7 | 3.50 | 18 | 5 | 5.30 | (58) | (7) | 81.5 | 3.7 | 1.2 | |||||||||||||||||||||||||||||||||||||
| TOTAL GROUP | 3,118 | 6,243 | 7.6 | 1.1 | 1.21 | 13 | 1 | 3.02 | (5) | (8) | 66.5 | (1.9) | 0.4 | |||||||||||||||||||||||||||||||||||||
1.Changes in constant euros.
2.EUR million and % change in constant euros.
3.Provisions to cover losses due to impairment of loans in the last 12 months / average customer loans and advances of the last 12 months.
For more detailed information, please see the 'Alternative Performance Measures' section.
20 | | January - June 2024 | ||||||
In terms of credit quality:
•The NPL ratio stood at 3.02% (-8 bps compared to Q1 2024), mainly driven by higher gross credit risk with customers (total risk), that increased 2% quarter-on-quarter, reaching EUR 1,164 billion, while credit impaired loans remained stable in the quarter at EUR 35,091 million, due to the good performance in Retail.
•Net loan-loss provisions rose 8% year-on-year in H1 2024 to EUR 6,243 million, due to the expected normalization in Consumer and increases in Retail in Mexico and Brazil, partially offset by lower levels of provisions in the European Retail portfolio.
In the quarter, provisions slightly increased (+1%), as lower provisions in the Consumer portfolio in the US offset higher provisions in CHF mortgage portfolio.
The cost of risk was 1.21%, remaining in line with our target for the year, in a context of a slight increase in credit risk exposure in the last 12 months.
•The total coverage ratio for credit impaired loans remained flat in the quarter at 66%, with loan-loss allowances of EUR 23,323 million. The coverage ratio remained at comfortable levels considering that 68% of the Group’s portfolio backed by quality collateral.
The IFRS 9 stage distribution of the portfolio was largely unchanged in the quarter in percentage terms. Stage 2 balances increased slightly due to changes in the classification criteria, improving our early risk detection systems. It does not significantly affect the total loan-loss provisions.
| Coverage ratio by stage | |||||||||||||||||||||||
| EUR billion | |||||||||||||||||||||||
Exposure1 | Coverage | ||||||||||||||||||||||
| Jun-24 | Mar-24 | Jun-23 | Jun-24 | Mar-24 | Jun-23 | ||||||||||||||||||
| Stage 1 | 1,008 | 1,007 | 1,011 | 0.4 | % | 0.4 | % | 0.4 | % | ||||||||||||||
| Stage 2 | 94 | 83 | 75 | 5.6 | % | 6.3 | % | 7.2 | % | ||||||||||||||
| Stage 3 | 35 | 36 | 35 | 41.2 | % | 40.5 | % | 41.0 | % | ||||||||||||||
Stage 1: financial instruments for which no significant increase in credit risk has been identified since its initial recognition.
Stage 2: if there has been a significant increase in credit risk since the date of initial recognition but the impairment event has not materialized, the financial instrument is classified in Stage 2.
Stage 3: a financial instrument is catalogued in this stage when it shows effective signs of impairment as a result of one or more events that have already occurred resulting in a loss.
| Credit impaired loans and loan-loss allowances | |||||||||||
| EUR million | |||||||||||
| Change (%) | |||||||||||
| Q2'24 | QoQ | YoY | |||||||||
| Balance at beginning of period | 35,637 | — | 3.5 | ||||||||
| Net additions | 3,296 | 4.1 | 4.8 | ||||||||
| Increase in scope of consolidation | 13 | — | — | ||||||||
| Exchange rate differences and other | (611) | — | — | ||||||||
| Write-offs | (3,244) | 1.5 | 6.0 | ||||||||
| Balance at period-end | 35,091 | (1.5) | 0.4 | ||||||||
| Loan-loss allowances | 23,323 | (0.9) | (2.4) | ||||||||
| For impaired assets | 14,461 | 0.1 | 0.9 | ||||||||
| For other assets | 8,862 | (2.6) | (7.5) | ||||||||
Our Retail, Consumer, CIB and Payments businesses account for more than 95% of the Group's total portfolio. The performance of the main businesses in Q2 2024 was as follows:
 | Retail & Commercial Banking | Credit risk exposure | |||||||||
| 56% of total Group | |||||||||||
Retail's portfolio mainly comprises high quality mortgage loans, where 90% of loans have an LTV lower than 80%, and a corporate portfolio in which more than 50% have property collateral or other collateral.
The NPL ratio dropped 9 bps in the quarter to 3.15%, driven by the decrease in credit impaired loans, mainly in Europe. On the other hand, gross credit risk with customers (total risk) remained practically flat in the quarter.
Net loan-loss provisions declined 1% year-on-year, mainly due to the positive performance of the European portfolios. Provisions rose 5% quarter-on-quarter, driven by the increases in Brazil and in the CHF mortgage portfolio in Poland.
The cost of risk stood at 1.03%, having increased 11 bps year-on-year and remaining stable in the quarter.
The total coverage ratio of credit impaired loans was stable quarter-on-quarter at 60%. Given the Retail portfolio includes the mortgage portfolios in Spain and the UK, which have high-quality collateral, we consider the coverage is at appropriate levels for the risk of the portfolio.
| Digital Consumer Bank | Credit risk exposure | |||||||||
| 18% of total Group | |||||||||||
The Consumer portfolio mainly comprises auto loans (representing around 80% of the portfolio) through strategic alliances and our leasing business, as well as personal loans with good credit quality.
The NPL ratio stood at 4.81%, improving 5 bps quarter-on-quarter. Gross credit risk with customers (total risk) growth compensated the slight increase in credit impaired loans, which stood at EUR 10,280 million, 2% up in the quarter.
Net loan-loss provisions increased 21% year-on-year, affected by the continued normalization in Europe and the US (but still below our historical average). In the quarter, they improved 7% due to lower provisions in the US and Brazil.
The cost of risk stood at 2.17%, +31 bps quarter-on-quarter, performing as expected.
The total coverage ratio of credit impaired loans remained stable in the quarter and stood at 76%, a level we are comfortable with, considering more than 80% of the portfolio is auto loans.
January - June 2024 | | 21 | ||||||
| Corporate & Investment Banking | Credit risk exposure | |||||||||
| 21% of total Group | |||||||||||
CIB's portfolio consists of high credit quality wholesale customers (more than 85% of which have a rating above investment grade), with a strong advisory component and high value-added solutions.
The NPL ratio decreased 9 bps in the quarter to 1.05%, due to the portfolio increases (+5%), mainly in Spain, Poland and North America (supported by business growth in the CIB franchise in the US).
Net loan-loss provisions stood at EUR 96 million versus EUR 7 million in H1 2023 (net releases in Q1 2023). Compared to Q1 2024, they increased EUR 15 million.
The cost of risk was stable in the quarter at 0.15%.
The total coverage ratio of credit impaired loans declined 1 pp in the quarter to 45%, a level we believe to be adequate considering the credit quality of the portfolio.
| Payments | Credit risk exposure | |||||||||
| 2% of total Group | |||||||||||
Payments has a portfolio characterized by a high rapid turnover and high returns that offset its level of risk.
The NPL ratio stood at 5.00% (+15 bps vs. Q1 2024), due to the 2% increase in impaired loans in Cards, mainly in Europe and Brazil. Gross credit risk with customers decreased slightly in the quarter due to PagoNxt.
Net loan-loss provisions, which are mainly concentrated in the Cards portfolio, fell 3% year-on-year, but picked up 6% compared to Q1 2024, mainly driven by Brazil and the UK, partially offset by the decrease in Mexico.
The cost of risk rose to 7.03%.
The total coverage ratio of credit impaired assets stood at 149% having increased 5 pp in the quarter, remaining at levels we are comfortable with.
Market risk
Markets continue to be conditioned by central banks' monetary policies as well as by geopolitical tensions. Additionally, the elections in Europe and in Mexico have also affected markets, and led to an increase in volatility in the Mexican peso, depreciating against the US dollar.
Stock markets continue to be supported by the resilience of the global economies, while market interest rates remain volatile, impacted by inflation expectations.
Global corporate banking trading activity is focused on serving the needs of our clients. Their risk is measured in terms of daily VaR at 99% and is mainly driven by possible movements in interest rates.
In Q2 2024, the average VaR reached a value of EUR 16 million (EUR 1 million lower than Q1 2024), remaining stable with some occasional bouts of volatility either due to markets or to a higher exposure mainly to interest rates.
By market risk factor, VaR continued to be driven mostly by interest rate risk. VaR figures remain low compared to the size of the Group's balance sheet and activity.
Trading portfolios.1 VaR by region | ||||||||||||||
| EUR million | ||||||||||||||
| 2024 | 2023 | |||||||||||||
| Second quarter | Average | Last | Average | |||||||||||
| Total | 16.4 | 14.9 | 12.1 | |||||||||||
| Europe | 12.2 | 12.0 | 9.4 | |||||||||||
| North America | 7.7 | 8.1 | 3.5 | |||||||||||
| South America | 7.9 | 10.6 | 8.5 | |||||||||||
1. Activity performance in Santander Corporate & Investment Banking markets.
Trading portfolios.1 VaR by market factor | ||||||||||||||
| EUR million | ||||||||||||||
| Second quarter 2024 | Min. | Avg. | Max. | Last | ||||||||||
| VaR total | 13.0 | 16.4 | 20.2 | 14.9 | ||||||||||
| Diversification effect | (12.0) | (17.2) | (23.7) | (19.0) | ||||||||||
| Interest rate VaR | 13.6 | 17.4 | 22.3 | 16.4 | ||||||||||
| Equity VaR | 2.8 | 3.8 | 5.1 | 5.1 | ||||||||||
| FX VaR | 2.8 | 5.2 | 7.7 | 5.2 | ||||||||||
| Credit spreads VaR | 3.6 | 4.3 | 5.2 | 4.3 | ||||||||||
| Commodities VaR | 2.3 | 2.9 | 3.7 | 2.8 | ||||||||||
1.Activity performance in Santander Corporate & Investment Banking markets.
Note: in the North America, South America and Asia portfolios, VaR corresponding to the credit spreads factor other than sovereign risk is not relevant and is included in the interest rate factor.
22 | | January - June 2024 | ||||||
Trading portfolios1. VaR performance | ||
| EUR million | ||
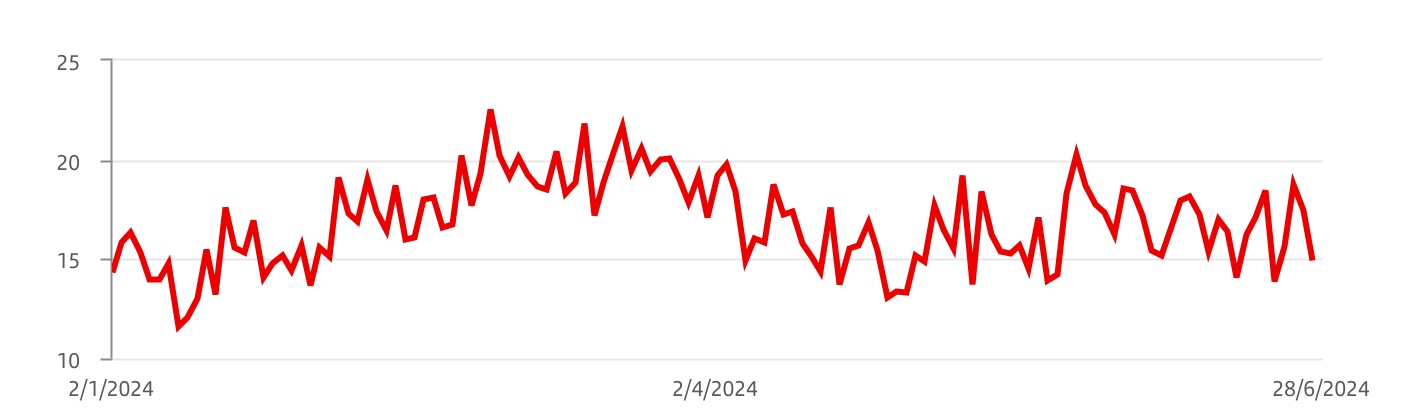
Structural and liquidity risk
Structural exchange rate risk: mainly driven by transactions in foreign currencies relating to permanent financial investments, their results and associated hedges. Our dynamic management of this risk seeks to limit the impact of foreign exchange rate movements on the CET1 ratio. In the quarter, hedging of currencies impacting this ratio remained close to 100%.
Structural interest rate risk: in Q2 2024, market interest rates showed high levels of volatility, conditioned by inflation trends and expectations for the possible monetary policy adjustments by the major central banks. Our structural debt portfolios continued to perform negatively, although our structural interest rate risk remained at comfortable levels during the period.
Liquidity risk: the Group maintained its comfortable liquidity risk position in the quarter, supported by a robust and diversified liquidity buffer, with ratios well above regulatory limits.
Operational risk
Our operational risk profile deteriorated slightly in Q2 2024. In terms of operational risk losses, there was an increase compared to Q1 2024. Legal proceedings and fraud continue to be the main drivers of these losses, which are concentrated in the Group's Retail business.
The Group continuously monitors the evolution of operational risks in general, and technological risk in particular, arising from transformation plans, the services provided by third parties, external fraud and the relevant judicial processes.
Regarding supplier risk and cyber risk, on 14 May 2024, we announced that we became aware of an unauthorized access to a Santander database hosted by a third-party provider. We immediately implemented measures to contain the incident, including blocking the compromised access to the database and establishing additional fraud prevention controls to protect affected customers.
January - June 2024 | | 23 | ||||||
Financial information by segment
Description of segments
As we previously announced, following the creation of two new global segments and in order to align the operating and management model, we adapted our reporting, starting with the financial information for Q1 2024, with global businesses becoming the primary segments.
Main changes to the composition of Santander's segments
The main changes, which apply from 1 January 2024 to the management information for all periods included in the consolidated financial statements, are as follows:
•All of the Group's businesses across all markets were consolidated into five global areas: Retail & Commercial Banking, Digital Consumer Bank, Corporate & Investment Banking, Wealth Management & Insurance and Payments. These became the new primary segments.
•The changes in financial information were:
–The former Retail Banking was split into two new segments: Retail & Commercial Banking and Digital Consumer Bank. Our cards business now forms part of the new Payments segment.
–The results of activities mainly related to financial management located in the countries are fully allocated to their global businesses based on the segment that generates the financial position.
–The local corporate centres are fully allocated to the global businesses.
–The revenue sharing criteria between global businesses were revised to better reflect the contribution of each business to the Group.
•The former primary segments (Europe, North America, South America and Digital Consumer Bank - which is renamed DCB Europe) became our secondary segments. 2023 published figures for the countries, regions and the Corporate Centre remain unchanged.
All the changes described above have no impact on the reported Group consolidated financial statements.
Composition of Santander's segments
Primary segments
This primary level of segmentation, which is based on the Group's management structure from 1 January 2024, comprises six reportable segments: five operating areas plus the Corporate Centre.
The operating areas are:
Retail & Commercial Banking (Retail): area that integrates the retail banking business and commercial banking (individuals, SMEs and corporates), except for business originated in the consumer finance and the cards businesses.
Digital Consumer Bank (Consumer): comprises all business originated in the consumer finance companies, plus Openbank, Open Digital Services (ODS) and SBNA Consumer.
Corporate & Investment Banking (CIB): this business, which includes Global Transaction Banking, Global Banking (Global Debt Financing and Corporate Finance) and Global Markets, offers products and services on a global scale to corporate and institutional customers, and collaborates with other global businesses to better serve our broad customer base.
Wealth Management & Insurance (Wealth): includes the corporate unit of Private Banking and International Private Banking in Miami and Switzerland (Santander Private Banking), the asset management business (Santander Asset Management) and the insurance business (Santander Insurance).
Payments: the Group's digital payments solutions, providing global technology solutions for our banks and new customers in the open market. It is structured in two businesses: PagoNxt (Getnet, Ebury and PagoNxt Payments) and Cards (cards platform and business in the countries where we operate).
Secondary segments
At this secondary level, Santander is structured into the segments that made up the primary segments until 2023, which are Europe, DCB Europe, North America and South America:
Europe: comprises all business activity carried out in the region, except that included in DCB Europe. Detailed financial information is provided on Spain, the UK, Portugal and Poland.
DCB Europe: includes Santander Consumer Finance, which incorporates the entire consumer finance business in Europe, Openbank in Spain and ODS.
North America: comprises all the business activities carried out in Mexico and the US, which includes the holding company (SHUSA) and the businesses of Santander Bank (SBNA), Santander Consumer USA (SC USA), the specialized business unit Banco Santander International, the New York branch and Santander US Capital Markets (SanCap).
South America: includes all the financial activities carried out by Santander through its banks and subsidiary banks in the region. Detailed information is provided on Brazil, Chile, Argentina, Uruguay, Peru and Colombia.
24 | | January - June 2024 | ||||||
In addition to these operating units, both at the primary and secondary segment level, the Group continues to maintain the area of the Corporate Centre, which includes the centralized activities relating to equity stakes in financial companies, financial management of the structural exchange rate position, assumed within the sphere of the Group’s assets and liabilities committee, as well as management of liquidity and of shareholders’ equity via issuances.
As the Group’s holding entity, this area manages all capital and reserves and allocations of capital and liquidity with the other businesses. It also incorporates goodwill impairment but not the costs related to the Group’s central services (charged to the areas), except for corporate and institutional expenses related to the Group’s functioning.
The businesses included in each of the segments in this report and the accounting principles under which their results are presented here may differ from the businesses included and accounting principles applied in the financial information separately prepared and disclosed by our subsidiaries (some of which are publicly listed) which in name or geographical description may seem to correspond to the business areas covered in this report. Accordingly, the results of operations and trends shown for our business areas in this document may differ materially from those of such subsidiaries. As explained on the previous page, the results of our segments presented below are provided on the basis of underlying results only and include the impact of foreign exchange rate fluctuations. However, for a better understanding of the changes in the performance of our business areas, we also provide and discuss the year-on-year changes to our results excluding such exchange rate impacts (i.e. in constant euros), except for Argentina, and any grouping which includes it. Additionally, from Q2 2024 onwards, a theoretical exchange rate has been used for the Argentine peso. For further information, see methodology in the 'Alternative performance measures' section in the appendix to this report. Certain figures contained in this report, have been subject to rounding to enhance their presentation. Accordingly, in certain instances, the sum of the numbers in a column or a row in tables contained in this report may not conform exactly to the total figure given for that column or row. | ||
January - June 2024 | | 25 | ||||||
| January-June 2024 | ||||||||||||||||||||
| Main items of the underlying income statement | ||||||||||||||||||||
| EUR million | ||||||||||||||||||||
| Primary segments | Net interest income | Net fee income | Total income | Net operating income | Profit before tax | Profit attributable to the parent | ||||||||||||||
| Retail & Commercial Banking | 14,015 | 2,366 | 16,274 | 9,851 | 5,187 | 3,326 | ||||||||||||||
| Digital Consumer Bank | 5,364 | 742 | 6,449 | 3,831 | 1,341 | 1,070 | ||||||||||||||
| Corporate & Investment Banking | 2,031 | 1,280 | 4,188 | 2,371 | 2,151 | 1,405 | ||||||||||||||
| Wealth Management & Insurance | 827 | 719 | 1,789 | 1,173 | 1,130 | 818 | ||||||||||||||
| Payments | 1,320 | 1,371 | 2,701 | 1,435 | 306 | 49 | ||||||||||||||
| PagoNxt | 62 | 456 | 583 | (18) | (286) | (304) | ||||||||||||||
| Cards | 1,258 | 915 | 2,117 | 1,452 | 592 | 353 | ||||||||||||||
| Corporate Centre | (100) | 1 | (350) | (524) | (606) | (609) | ||||||||||||||
| TOTAL GROUP | 23,457 | 6,477 | 31,050 | 18,137 | 9,508 | 6,059 | ||||||||||||||
| Secondary segments | ||||||||||||||||||||
| Europe | 8,288 | 2,368 | 11,718 | 7,116 | 4,983 | 3,187 | ||||||||||||||
| Spain | 3,656 | 1,484 | 6,065 | 3,999 | 2,681 | 1,756 | ||||||||||||||
| United Kingdom | 2,381 | 142 | 2,516 | 1,065 | 849 | 630 | ||||||||||||||
| Portugal | 844 | 242 | 1,142 | 874 | 834 | 563 | ||||||||||||||
| Poland | 1,384 | 339 | 1,711 | 1,245 | 779 | 386 | ||||||||||||||
| Other | 24 | 161 | 284 | (68) | (159) | (147) | ||||||||||||||
| DCB Europe | 2,187 | 451 | 2,854 | 1,534 | 757 | 453 | ||||||||||||||
| North America | 5,247 | 1,300 | 7,039 | 3,686 | 1,586 | 1,347 | ||||||||||||||
| US | 2,824 | 539 | 3,769 | 1,866 | 612 | 664 | ||||||||||||||
| Mexico | 2,421 | 733 | 3,244 | 1,901 | 1,149 | 840 | ||||||||||||||
| Other | 2 | 27 | 26 | (82) | (175) | (158) | ||||||||||||||
| South America | 7,835 | 2,358 | 9,790 | 6,324 | 2,788 | 1,681 | ||||||||||||||
| Brazil | 5,235 | 1,734 | 6,984 | 4,719 | 1,935 | 1,141 | ||||||||||||||
| Chile | 824 | 265 | 1,187 | 721 | 450 | 253 | ||||||||||||||
| Argentina | 1,423 | 204 | 1,020 | 606 | 332 | 266 | ||||||||||||||
| Other | 353 | 154 | 599 | 278 | 71 | 22 | ||||||||||||||
| Corporate Centre | (100) | 1 | (350) | (524) | (606) | (609) | ||||||||||||||
| TOTAL GROUP | 23,457 | 6,477 | 31,050 | 18,137 | 9,508 | 6,059 | ||||||||||||||
Profit attributable to the parent distribution1 | ||
| H1 2024 | ||

1. As a % of operating areas. Excluding the Corporate Centre.
Profit attributable to the parent. H1 2024 | ||
| EUR million. % change YoY | ||
 | ||
 | ||
 | ||
 | ||
 | ||
 | ||
 | ||
 | ||
 | ||

| Var | Var2 | ||||
| +37 | % | +35 | % | ||
| +4 | % | +4 | % | ||
| -5 | % | -5 | % | ||
| +15 | % | +14 | % | ||
| -78 | % | -78 | % | ||
| +26 | % | +24 | % | ||
| -13 | % | -13 | % | ||
| 0 | % | -3 | % | ||
| +15 | % | +19 | % | ||
2. Changes in constant euros.
26 | | January - June 2024 | ||||||
| January-June 2023 | ||||||||||||||||||||
| Main items of the underlying income statement | ||||||||||||||||||||
| EUR million | ||||||||||||||||||||
| Primary segments | Net interest income | Net fee income | Total income | Net operating income | Profit before tax | Profit attributable to the parent | ||||||||||||||
| Retail & Commercial Banking | 12,400 | 2,286 | 14,392 | 8,018 | 3,638 | 2,421 | ||||||||||||||
| Digital Consumer Bank | 5,024 | 584 | 6,026 | 3,419 | 1,504 | 1,027 | ||||||||||||||
| Corporate & Investment Banking | 1,670 | 1,142 | 3,956 | 2,444 | 2,305 | 1,478 | ||||||||||||||
| Wealth Management & Insurance | 726 | 625 | 1,589 | 1,005 | 985 | 711 | ||||||||||||||
| Payments | 1,194 | 1,472 | 2,613 | 1,400 | 498 | 223 | ||||||||||||||
| PagoNxt | 31 | 446 | 521 | (51) | (77) | (103) | ||||||||||||||
| Cards | 1,162 | 1,026 | 2,092 | 1,452 | 574 | 326 | ||||||||||||||
| Corporate Centre | (94) | (7) | (342) | (531) | (601) | (620) | ||||||||||||||
| TOTAL GROUP | 20,920 | 6,103 | 28,234 | 15,755 | 8,329 | 5,241 | ||||||||||||||
| Secondary segments | ||||||||||||||||||||
| Europe | 7,565 | 2,244 | 10,464 | 6,081 | 3,888 | 2,536 | ||||||||||||||
| Spain | 3,161 | 1,413 | 5,113 | 3,074 | 1,679 | 1,132 | ||||||||||||||
| United Kingdom | 2,583 | 167 | 2,759 | 1,395 | 1,127 | 818 | ||||||||||||||
| Portugal | 575 | 235 | 824 | 559 | 484 | 321 | ||||||||||||||
| Poland | 1,209 | 289 | 1,509 | 1,105 | 657 | 321 | ||||||||||||||
| Other | 37 | 140 | 259 | (52) | (59) | (57) | ||||||||||||||
| DCB Europe | 2,040 | 394 | 2,658 | 1,344 | 928 | 521 | ||||||||||||||
| North America | 4,931 | 1,077 | 6,417 | 3,357 | 1,739 | 1,346 | ||||||||||||||
| US | 2,901 | 390 | 3,624 | 1,825 | 762 | 667 | ||||||||||||||
| Mexico | 2,027 | 663 | 2,763 | 1,600 | 1,048 | 760 | ||||||||||||||
| Other | 3 | 23 | 30 | (68) | (71) | (81) | ||||||||||||||
| South America | 6,477 | 2,395 | 9,037 | 5,504 | 2,376 | 1,458 | ||||||||||||||
| Brazil | 4,285 | 1,675 | 6,281 | 4,073 | 1,410 | 823 | ||||||||||||||
| Chile | 727 | 316 | 1,229 | 708 | 531 | 330 | ||||||||||||||
| Argentina | 1,138 | 282 | 1,029 | 508 | 308 | 252 | ||||||||||||||
| Other | 327 | 122 | 499 | 214 | 127 | 53 | ||||||||||||||
| Corporate Centre | (94) | (7) | (342) | (531) | (601) | (620) | ||||||||||||||
| TOTAL GROUP | 20,920 | 6,103 | 28,234 | 15,755 | 8,329 | 5,241 | ||||||||||||||
January - June 2024 | | 27 | ||||||
| Retail & Commercial Banking | Underlying attributable profit | |||||||||
| EUR 3,326 mn | |||||||||||
→ To support our vision of becoming a digital bank with branches, we continued to drive our ONE Transformation programme forwards with the implementation of a common operating model and the rollout of our global technological platform. → Loans decreased 1% year-on-year in constant euros due to lower mortgage and SME balances in Europe, partially offset by increases in South America and Mexico. Deposits rose 2% in constant euros. → Attributable profit of EUR 3,326 million, increasing 37% year-on-year (+35% in constant euros) driven by the good revenue performance, efficiency gains from our transformation programme and lower provisions in Europe. | |||||||||||
Strategy
In Q2 2024, we advanced in our strategic priorities:
•Implement a common operating model, leveraging the Group’s global scale and our local presence. Our vision is to make Santander into a digital bank with branches, offering all our products and services digitally through our own global platform and use our branch network to advise and help our customers.
•We have almost 143 million customers who can access most of our products and services digitally. Sales through our web and apps and digital customers continued to rise at a good pace.
•We have a network of more than 8,000 branches, present in 12 markets. Branches continued to strengthen their role as an essential driver of sales and advisory, reducing operational activities thereby increasing their focus on commercial functions and supporting customers.
•Continue our transformation efforts, based on three pillars:
•Customer experience. We reduced the number of products by 20% year-on-year, as part of our commitment to offer a simple and attractive product portfolio that provides the best experience for our customers. We also continued to innovate our catalogue of products and services through different initiatives. Of note in the quarter was the new simpler and competitive campaign in Brazil, which targets individuals, and complements our new digital and customer-oriented service model.
–Operational leverage. Year-on-year, we have reduced the number of resources dedicated to non-commercial activities
per million customers by 8% and resources dedicated to operational activities per million customers by 18%, supported by economies of scale, process automation and organization simplification. This has freed up time to focus on value added activities. Process digitalization and cash management optimization in branches are some examples of what we have achieved.
–Global Technology Platform. Our goal is to leverage the Group's scale and roll out a global platform. This platform is based on our back-end Gravity technology and on ODS’s in- house, cloud-based technology for our apps and websites.
In Q2 2024, we successfully implemented our Gravity platform in the US, which is also operative at the Group level in the UK, Spain, Mexico, Brazil and Chile. The volume of transactions running through Gravity continued to grow, increasing 20% year-on-year. Finally, the app is available in Spain, Portugal and Poland and we will launch it in the UK, Brazil and Colombia during the year.
•We continue to drive profitable growth and structural efficiency improvements. New digital processes to attract customers, a more targeted offer and enhanced customer experience drove further customer growth (+4% year-on-year). The efficiency which the global platform's scale provides, together with increased simplification and process automation were significant drivers of these results.
Retail. Customers. June 2024 | ||||||||||||||||||||||||||||||||
| Thousands and year-on-year change | ||||||||||||||||||||||||||||||||
 | Europe | | | North America | | South America | | |||||||||||||||||||
| Total customers | 142,913 | 46,239 | 14,972 | 22,430 | 20,960 | 20,946 | 75,715 | 65,834 | ||||||||||||||||||
| +4% | +2% | +3% | 0% | +3% | +3% | +5% | +5% | |||||||||||||||||||
| Active customers | 77,176 | 28,585 | 8,488 | 13,714 | 10,592 | 10,578 | 37,999 | 31,344 | ||||||||||||||||||
| +3% | +2% | +6% | -1% | +7% | +7% | +2% | 0% | |||||||||||||||||||
28 | | January - June 2024 | ||||||
Business performance
Loans and advances to customers decreased 2% year-on-year. Excluding reverse repos and in constant euros, gross loans fell 1%, due to decreases in individuals and SMEs despite growth in corporates.
In individuals, mortgage balances fell both in the UK (in line with our strategy) and in Spain, still impacted by prepayments (but new business volumes are picking up). This was partially offset by increases in Poland, Brazil, Mexico and Chile. Personal loans performed well in Brazil (double-digit growth), Spain, Poland and Mexico.
SME loans decreased mainly due to declines in Spain, the UK and Portugal, partially offset by higher volumes in Brazil and Poland. Corporate loans rose, driven by Spain, Brazil, Mexico and Poland.
Customer deposits decreased 1% year-on-year. Excluding repurchase agreements and in constant euros, they rose 2%, with increases in time deposits (+9%, especially in individuals and SMEs) and mutual funds (+22%, mainly in individuals) due to the current interest rate environment. As a result, customer funds increased 4% in constant euros.
Retail. Business performance. June 2024 | ||||||||||||||||||||
| EUR billion and YoY % change in constant euros | ||||||||||||||||||||
| 619 | -1% | 729 | +4% | |||||||||||||||||
| ||
| ||
| ||

| ||
| ||
| ||

| Gross loans and advances to customers excl. reverse repos | Customer deposits excl. repos + mutual funds | |||||||||||||||||||||||||||||||||||||
Results
Attributable profit in H1 2024 was EUR 3,326 million, 37% higher year-on-year. In constant euros, profit rose 35% year-on-year, as follows:
•Total income increased 12%, driven by net interest income, net fee income and gains on financial transactions which more than offset the higher negative impact of the hyperinflation adjustment in Argentina. SRF contributions ended in 2023, therefore there is no contribution in 2024.
Retail. Total income. June 2024 | ||||||||||||||||||||||||||||||||
| EUR million and YoY % change in constant euros | ||||||||||||||||||||||||||||||||
| ||
| ||
| ||
| ||
| Others | ||

| Var | ||
| +22% | ||
| -12% | ||
| +7% | ||
| +20% | ||
| +14% | ||
| EUR 16,274 mn | +12% | |||||||||
Net interest income increased 12%, with increases in most countries, but especially in Spain and Portugal (due to good margin management), in Poland (higher activity and lower cost of deposits), in Brazil and Chile (higher volumes and deposit costs in a context of falling interest rates) and in Argentina (with double-digit growth). The exceptions were the UK (lower mortgage loans and higher deposit costs) and the US (lower volumes).
Our more targeted products and services offer boosted net fee income growth (+3%) mainly in Brazil (insurance fees and FX), Mexico (insurance and mutual funds), Poland (FX and funds) and in the US (real estate portfolio servicing fees with the FDIC).
•Costs remained flat year-on-year (-4% in real terms), reflecting transformation efforts through organizational simplification, process automation and global platform implementation. Of note were the performances in the US (-7%), Spain (-2%) and Argentina.
These transformation efforts, together with the strong revenue growth, contributed to a 4.8 pp efficiency ratio improvement year-on-year to 39.5%.
•Net loan-loss provisions fell slightly (-1%), due to a positive performance in Europe, mainly in Spain (credit quality improvement) and in the UK (macro improvement), which offset greater provisions in Brazil due to higher activity and the normalization in Mexico and Chile.
The cost of risk was 1.03% (compared to 0.92% in June 2023 and was stable versus 1.02% in December 2023). The NPL ratio stood at 3.15% (3.22% in June 2023).
RoTE in H1 2024 was 17.4% (18.1% annualizing the impact of temporary levy on revenue earned in Spain).
Compared to Q1 2024, attributable profit grew 22% in constant euros, with variations across the income statement impacted by the use of the new Argentine peso exchange rate and temporary levy on revenue earned in Spain in the first quarter. Excluding the temporary levy and Argentina, attributable profit would have increased 4% quarter-on-quarter due to good performance of net interest income and cost reduction.
| Retail. Underlying income statement | |||||||||||||||||||||||
| EUR million and % change | |||||||||||||||||||||||
| / | Q1'24 | / | H1'23 | ||||||||||||||||||||
| Q2'24 | % | excl. FX | H1'24 | % | excl. FX | ||||||||||||||||||
| Total income | 8,226 | +2 | +3 | 16,274 | +13 | +12 | |||||||||||||||||
| Expenses | -3,119 | -6 | -5 | -6,423 | +1 | 0 | |||||||||||||||||
| Net operating income | 5,107 | +8 | +9 | 9,851 | +23 | +21 | |||||||||||||||||
| LLPs | -1,564 | +3 | +5 | -3,087 | -1 | -1 | |||||||||||||||||
| PBT | 2,810 | +18 | +19 | 5,187 | +43 | +40 | |||||||||||||||||
| Attributable profit | 1,824 | +21 | +22 | 3,326 | +37 | +35 | |||||||||||||||||
January - June 2024 | | 29 | ||||||
| Digital Consumer Bank | Underlying attributable profit | |||||||||
| EUR 1,070 mn | |||||||||||
→ Our priority is to continue expanding our leadership in consumer finance across our footprint, converging towards a more digital global operating model and implementing enhanced solutions (check-out lending, digital journeys in auto lending and operational leasing) through common platforms. → Loans increased 6% year-on-year in constant euros, +8% in auto in a market that is starting to recover. Deposits rose 14% in constant euros, in line with our strategy aimed at lowering funding costs and reducing net interest income volatility across the cycle, to be able to offer our customers better pricing. → Attributable profit reached EUR 1,070 million in H1 2024, a 4% increase year-on-year in both euros and constant euros, mainly driven by the solid net interest income and net fee income performances and cost control, despite the cost of risk normalization towards pre-pandemic levels. | |||||||||||
Strategy
Digital Consumer Bank (Consumer) is a leading consumer finance company globally. It operates in 26 countries in Europe and the Americas and it serves the financing needs at the point of sale (both physical and digital) of 25 million customers. It combines our auto financing business, where we are the world leaders, our consumer lending business supported by Zinia and Openbank's advanced digital and retail banking capabilities.
The vision for Consumer is to become the preferred partner of our end customers and partners, offering greater profitability and value creation.
To respond to the changes the mobility and consumer finance ecosystem is undergoing and to support our aim of becoming Santander's platform to expand into new markets, we continue to transform our operating model:
•Offering global and best-in-class solutions, integrated into our partners' (OEMs, importers or retailers) processes, accompanying them as their increasingly digital business models evolve. We continue to work on improving local relationships with manufacturers to achieve global agreements.
•Simplifying and automating our processes to improve customer experience and increase scalability.
•Building and developing global platforms such as the leasing platform in auto, already operative in three European markets having expanded its functionalities in H1 2024, and Zinia’s technology in check-out lending, operative in Germany.
As part of our profitable growth strategy, we continue to capture deposits to increase NII stability and funding autonomy and boost growth while we also actively manage our balance sheet to make it more capital light. We launched our digital deposit gathering activities in January 2024 in the Netherlands and continue to work on expanding Openbank to other markets.
In the quarter, we made progress with our strategic priorities:
•In Europe, we are focusing on the transformation of the operating model with the aim of recovering pre-pandemic profitability levels, while providing the best services to our partners. To achieve this, we continue to pursue and develop commercial opportunities, such as strengthening our operational leasing solution or launching instalment loans with Apple through Zinia in Germany.
Moreover, we continue to simplify our operating model, having moved from one platform per country to three, towards our final goal of having one common platform.
•In the US, our focus is on recovering pre-pandemic profitability, driving efficiency savings and improving our service. In H1 2024, we continued to incorporate new strategic agreements in auto and prepare the launch of Openbank in H2 2024.
•In Latin America, our aim is to continue driving greater profitable growth where there are large commercial opportunities at good profitability levels. In Mexico, we plan to launch Openbank with a full value proposition to compete with other neobanks.
| Consumer. Total Customers | ||
| Millions | ||
| 0% | ||||||||

Business performance
After a difficult environment in previous years, H1 2024 showed signs of recovery resulting from inflation moderation, lower interest rate expectations and auto sales growth in our main markets.
In this environment, new lending increased 8% year-on-year, with solid growth across our main markets, especially in South America (led by Brazil). We continued to prioritize new business profitability over volumes growth in a high interest rate environment which is supporting the progressive RoRWA improvement.
The stock of loans and advances to customers rose 7%. In gross terms, excluding reverse repos and in constant euros, they were 6% up year-on-year, driven by Europe and Latin America.
We have a EUR 17 billion leasing portfolio which increased 2% year-on-year in constant euros, as growth in DCB Europe more than offset a decline in the US due to higher volumes of repurchases by dealers and despite increased electric vehicle activity.
30 | | January - June 2024 | ||||||
Customer deposits, which accounted for 57% of Consumer's total funding, increased 15% year-on-year. Excluding repos and in constant euros, they grew 14%, in line with our deposit gathering strategy. By market, they rose 24% in DCB Europe and 3% in the US. Mutual funds also increased, albeit from very low levels. Our access to wholesale funding markets remained strong and diversified.
Consumer. Business. June 2024 | |||||||||||||||||||||||||||||
| EUR billion and YoY % change in constant euros | |||||||||||||||||||||||||||||
| 213 | +6% | 130 | +14% | ||||||||||||||||||||||||||
| DCB Europe | |||||
| US | |||||

| DCB Europe | |||||
| US | |||||

| Gross loans and advances to customers excl. reverse repos | Customer deposits excl. repos + mutual funds | |||||||||||||||||||||||||||||||||||||
Consumer. Leasing portfolio. June 2024 | |||||||||||
| EUR billion and YoY % change in constant euros | |||||||||||
| Total leasing | 17 | +2% | |||||||||

Results
In H1 2024, attributable profit reached EUR 1,070 million, 4% higher than H1 2023. In constant euros, profit also increased 4%. By line:
•Total income improved 7%, mainly due to net interest income, which also rose 7%, supported by our active asset repricing actions and volumes growth in Europe, and higher volumes and lower interest rates in Brazil. However, performance in the US was weaker due to lower credit volumes which were offset by higher yields.
Net fee income also increased strongly, rising 27% in the period, driven by growth in Europe due to increased insurance penetration (particularly in Germany), in Brazil driven by volumes growth, and in the US in part due to auto fees.
Other revenue fell 18% due to lower gains on financial transactions in Europe (from high levels in 2023), the greater impact of the hyperinflation adjustment in Argentina and lower leasing income in the US due to lower volumes and passing on fiscal benefits (recorded in the tax line) from electric vehicle leasing to prices.
Consumer. Total income. June 2024 | ||||||||||||||||||||||||||||||||
| EUR million and YoY % change in constant euros | ||||||||||||||||||||||||||||||||
| DCB Europe | |||||
| US* | |||||
| Other | |||||

| Var | ||
| +7 | % | |
| -1 | % | |
| +36 | % | |
* Year-on-year growth in revenue in the US of +1% if we include the impact of the EV incentives in the tax line.
•Costs remained flat, reflecting our efficiency and transformation efforts. This is particularly evident in the US where costs declined 8% and in DCB Europe where they were flat despite our strategic investments in leasing and check-out lending platforms and business growth. As a result, the efficiency ratio improved 2.7 pp to 40.6%.
•Net loan-loss provisions increased 21%, affected by continued normalization in Europe and the US towards pre-pandemic levels (but still below our historical average) and higher volumes. Additionally, we increased the coverage of our CHF mortgage portfolio, there were lower portfolio sales than in 2023 and we recorded some regulatory charges. Credit quality remained controlled with the cost of risk at 2.17% and the NPL ratio at 4.81%.
RoTE in H1 2024 was 12.8% (13.0% annualizing the impact of the temporary levy on revenue earned in Spain).
Compared to Q1 2024, profit rose 31% in constant euros driven mainly by lower LLPs in the US (which more than offset higher provisions related to the CHF mortgage portfolio in Poland), and also by continued positive trends in total income, stable costs and the temporary levy recorded in Q1. There was some negative impact from the new peso exchange rate in Argentina in the quarter, particularly in NII which fell 2% (+1% excluding Argentina) mitigated by a positive impact in other income, with little impact on the bottom line.
| Consumer. Underlying income statement | |||||||||||||||||||||||
| EUR million and % change | |||||||||||||||||||||||
| / | Q1'24 | / | H1'23 | ||||||||||||||||||||
| Q2'24 | % | excl. FX | H1'24 | % | excl. FX | ||||||||||||||||||
| Total income | 3,264 | +2 | +3 | 6,449 | +7 | +7 | |||||||||||||||||
| Expenses | -1,307 | 0 | 0 | -2,618 | 0 | 0 | |||||||||||||||||
| Net operating income | 1,957 | +4 | +5 | 3,831 | +12 | +12 | |||||||||||||||||
| LLPs | -1,055 | -7 | -7 | -2,193 | +22 | +21 | |||||||||||||||||
| PBT | 722 | +17 | +17 | 1,341 | -11 | -11 | |||||||||||||||||
| Attributable profit | 606 | +31 | +31 | 1,070 | +4 | +4 | |||||||||||||||||
January - June 2024 | | 31 | ||||||
| Corporate & Investment Banking | Underlying attributable profit | |||||||||
| EUR 1,405 mn | |||||||||||
→ We continue making our centres of expertise more sophisticated, deepening client relationships with focus on our Global Markets plan to build institutional wallet share, the US Banking Build-Out strategy, and actively managing capital. → Strong activity year-on-year, mainly supported by Global Banking (Global Debt Finance and Corporate Finance) and Global Markets as we execute our growth initiatives, and, to a lesser extent, in Global Transaction Banking. → Attributable profit reached EUR 1,405 million, a 5% drop year-on-year (in euros and in constant euros). A record first half revenue was offset by higher costs related to investments in the development of new capabilities, and higher provisions. Nevertheless, we maintained a leading position in efficiency and profitability. | |||||||||||
Strategy
Innovation will continue to transform the global economy and shape competition as new technology develops. In this changing environment, the corporate and investment banking industry will continue to coexist with fintechs, digital assets and new digital players (e.g. virtual asset services providers), presenting collaboration opportunities within new sectors.
Substantial transition finance opportunities remain in ESG (e.g. Inflation Reduction Act, Net Zero initiatives) and certain sectors are expected to present significant financial needs, namely infrastructure, energy, life sciences, healthcare and technology.
At Santander, we are well prepared to capitalize on these opportunities, given our unique combination of global approach and local leadership, which we demonstrate through our position in various rankings.
We continue to make progress in the execution of our strategy to become a world-class CIB business, positioning ourselves as a trusted advisor to our clients while delivering profitable growth and maintaining dynamic capital management.
In H1 2024, we continued to make progress across our priorities:
•We are making our centres of expertise more sophisticated, with important reinforcements in sales, trading and banking across the businesses:
–In Global Banking (GB), we complemented our Global Industrials Group (GIGs) product offering through hires in Chemicals, US Specialty Finance, Paper & Packaging and Technology.
–In Global Markets (GM), we continue to execute our plan to increase activity with our corporate and institutional clients and further leverage technology. We have bolstered our institutional and leveraged loan sales teams. We also brought in traders for rates, FX and US inflation-linked derivatives.
As a result, we are starting to reap the rewards of our investments in 2023, with solid performance in institutional sales in Europe and the US.
As well as investing in markets infrastructure, we are focused on increasing revenue from cross-border flows and on supporting the US Banking Build-Out (US BBO) initiative, with enhanced trading and distribution capabilities, mainly in Leveraged Finance, Strategic Equity Solutions and Convertible Bonds.
•We are deepening our client relationships with a particular focus on the US, where we are taking our CIB franchise to the next level through the execution of the US BBO initiative, selectively expanding our client universe and product capabilities in areas adjacent to our strengths.
We have already made progress in targeting untapped wallets in M&A, Equity and Debt Capital Markets (ECM and DCM) and Leveraged Finance. Our new global Leveraged Finance franchise is helping us to create deeper relationships, especially in the US and EMEA, and leading to follow-on business opportunities
The collaboration plan for US BBO is already providing results and numerous ‘firsts’ as platforms come online and coverage teams are ramped up. Examples of this are: we closed the first corporate share buyback for a US company and we were appointed first global coordinator win for a US-listed IPO for the first time. In DCM, large US companies have relied on CIB for USD placements, and we are leading the reverse yankee bond market.
In Mexico, we are capitalizing on business opportunities leveraging our GM and US BBO initiatives, creating significant partnerships within the MEX-US corridor.
•We continued to actively manage capital through our Originate-to-Share model to drive forward industrial scale capital recycling. This has contributed to a limited increase in our capital consumption despite our business growth, enabling us to continue to deliver high profitability ratios.
| Recent awards | Leading positions in League Tables H1 2024 |  | |||||||||||||||||||||
| IJ Global | PFI | Structured Finance | Debt Capital Markets | ||||||||||||||||||||
Gigafactory Deal of the Year in Europe Renewables Deal of the Year (onshore and offshore wind) in North America | Bank of the Year in Europe Petrochemical Deal of the Year in APAC and EMEA |  |  | ||||||||||||||||||||
| Proximo | Global Finance | Equity Capital Markets | ECAs | M&A | |||||||||||||||||||
LatAm Bank of the Year LatAm PPP Deal of the Year | Best Bank for Cash Management and for Payments in LatAm |  |  |  | |||||||||||||||||||
32 | | January - June 2024 | ||||||
Business performance
A high proportion of CIB's activity is customer related (84% of total income). Moreover, we have a high and growing percentage of capital-light activity and we actively manage our balance sheet, as reflected in our total revenue to risk-weighted assets ratio, which has improved 1.1 pp since 2022 to 7.0%.
Customer loans, which are concentrated in our Global Transaction Banking (GTB) and GB businesses, increased 11% year-on-year. In gross terms, excluding reverse repos and in constant euros, they increased 7%. Customer deposits rose 6% year-on-year. Excluding repos and in constant euros, they fell 6%, mainly driven by strategy changes to reduce excess corporate deposits.
By business line, we had the following performance:
•In Global Transaction Banking, strong increase in Export Finance, while Trade & Working Capital Solutions remained flat, partially offset by slightly lower activity year-on-year in Cash Management, affected by interest rate cuts, mainly in Latin America.
Trade & Working Capital Solutions continued to implement innovative trade solutions within the corporate segment, such as Trade Select, our integrated global supply chain finance platform.
We once again led the Export Finance market, especially in the sustainable technology sector, where we were awarded the Export Finance Deal of the Year for Baltic Power (offshore wind farm in Poland).
•Global Banking showed significant growth year-on-year in both Global Debt Financing (GDF), with DCM gaining market share in Europe, Latin America and the US, and Corporate Finance (CF) continuing to benefit from positive market momentum.
In GDF, Fund Financing performed well, as many funds re-leveraged their portfolios and big players continued to raise funds. CIB remains consistently among the top 3 European lead managers across all core securitized products. Structured Finance remained flat despite the lower activity in refinancing and greenfield projects compared to last year.
In CF, we closed several 'first' transactions in Leveraged Finance and ECM, while our M&A activity continues to span all sectors. Our role as one of MásMóvil's financial advisors was key in the completion of its joint venture with Orange.
•In Global Markets, we had good activity levels, mainly in Europe, where the institutional platform and the investments in human capital and technology are paying off. We had strong activity in rates, credit and securitized products. We saw significant growth in the US, where the US BBO is starting to show results across different businesses, with notable transactions closed, particularly in Equity Derivatives.
Results
Attributable profit in H1 2024 decreased 5% year-on-year to EUR 1,405 million. In constant euros, it also fell 5%, with the following detail:
•Total income rose 6% year-on-year, backed by double-digit growth in net interest income and net fee income, achieving record revenue in H1 2024. SRF contributions ended in 2023, therefore there is no contribution in 2024. Net interest income grew 22% boosted by GB, due to increased Leveraged Finance activity in CF and good performance in GDF. Net fee income grew 12%, particularly in GB on the back of the US BBO initiative. Gains on financial transactions fell due to lower results in Global Markets, especially in Brazil in a weak market.
By region, good revenue performance in North America and Europe, partially offset by a decrease in South America due to weaker activity mainly in Brazil.
CIB. Total income by region. June 2024. | ||||||||||||||||||||||||||||||||
| EUR million and % change in constant euros | ||||||||||||||||||||||||||||||||
| Europe | ||
| North America | ||
| South America | ||

| Var | ||
| +9 | % | |
| +31 | % | |
| -11 | % | |
By business, revenue growth was mainly driven by GB (+17%), on the back of strong activity in both GDF and CF, benefitting from the ramp-up of our investments. Revenue also rose in Global Markets and GTB (+4% and +1%, respectively) from high levels in 2023.
CIB. Total income by business. June 2024. | ||||||||||||||||||||||||||||||||
| EUR million and % change in constant euros | ||||||||||||||||||||||||||||||||
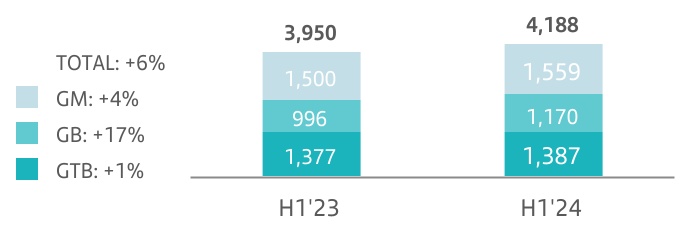
Note: total income includes less material revenue from other activities (EUR 76 million in H1'23 and EUR 72 million in H1'24). | |||||||||||
•Costs increased 20% due to our investments in new products and capabilities, as we invest for future growth. The efficiency ratio stood at 43.4% and remained one of the best in the sector.
•Net loan-loss provisions amounted to EUR 96 million, up from very low levels in H1 2023 (EUR 7 million due to releases at the beginning of 2023).
RoTE was 19.0% in H1 2024 (19.1% annualizing the impact of the temporary levy on revenue earned in Spain), supported by our efforts in active capital management.
Compared to Q1 2024, attributable profit remained flat in constant euros, impacted by seasonality in revenue, interest rate cuts in some countries affecting net interest income and higher costs.
| CIB. Underlying income statement | |||||||||||||||||||||||
| EUR million and % change | |||||||||||||||||||||||
| / | Q1'24 | / | H1'23 | ||||||||||||||||||||
| Q2'24 | % | excl. FX | H1'24 | % | excl. FX | ||||||||||||||||||
| Total income | 2,076 | -2 | -1 | 4,188 | +6 | +6 | |||||||||||||||||
| Expenses | -930 | +5 | +5 | -1,817 | +20 | +20 | |||||||||||||||||
| Net operating income | 1,146 | -6 | -6 | 2,371 | -3 | -3 | |||||||||||||||||
| LLPs | -56 | +38 | +39 | -96 | — | — | |||||||||||||||||
| PBT | 1,044 | -6 | -5 | 2,151 | -7 | -6 | |||||||||||||||||
| Attributable profit | 700 | -1 | 0 | 1,405 | -5 | -5 | |||||||||||||||||
January - June 2024 | | 33 | ||||||
| Wealth Management & Insurance | Underlying attributable profit | |||||||||
| EUR 818 mn | |||||||||||
→ We continue building the best wealth and insurance manager in Europe and the Americas supported by our leading global private banking platform and our best-in-class funds and insurance product factories that leverage our scale and global capabilities to offer the best value proposition to our customers. → Total assets under management at record levels of EUR 480 billion, +13% year-on-year, due to excellent commercial dynamics both in Private Banking and SAM. In Insurance, gross written premiums reached EUR 6.1 billion in H1 2024. → Attributable profit amounted to EUR 818 million, 15% higher year-on-year (+14% in constant euros), with an RoTE of 79%. | |||||||||||
Strategy
Wealth Management & Insurance business was established in 2017 with the aim of enhancing its service model and value proposition as part of a common platform that leverages Santander's scale and capabilities.
Since then, it has been a relevant growth driver for the Group through its three businesses, delivering consistent double-digit growth and generating around one third of the Group's total fees, including those ceded to the commercial network.
•Santander Private Banking (PB) is our leading global platform serving private banking clients across 11 countries. We have a best-in-class service model and value proposition connecting clients and countries through a single platform.
•Santander Asset Management (SAM) is our global asset manager, which manufactures investment solutions for retail and institutional customers, with presence in more than ten countries and over 50 years of experience. SAM makes the most of its local client knowledge and global capabilities to provide customers the best investment opportunities.
•Santander Insurance provides protection solutions following a model based on strategic alliances with leading insurance companies, that enables us to have a comprehensive value proposition across 12 countries. We pair this with in-person and digital distribution capabilities to better serve our clients.
We continued with focus on the following strategic initiatives:
•In Private Banking, we already have a best-in-class global platform leading investment flows between Latin America, Europe and the US. Going forward, we are developing key growth opportunities to expand our footprint, such as in the Middle East where we have established a branch in the Dubai International Financial Center.
We also continue to complete our sophisticated value proposition to make the most of our connectivity between countries and segments, which exceeded EUR 3.3 billion in total alternatives commitments and more than EUR 52 billion in fee-based mandates.
| Private Banking clients | ||
| Thousands | ||
| +13% | ||||||||

During Q2 2024, we were named the Best Global Private Bank for Cyber Security by the Professional Wealth Management Magazine, a Financial Times publication.
•In SAM, we operate as a global asset manager leveraging our scale, global investment capabilities and product distribution hubs. In terms of retail distribution, we are implementing an advisory model, having established common investment views across all countries, supported by a global platform offering enhanced customer experience.
In terms of our Alternatives business, we are working on completing our value proposition while improving our scale. We already have EUR 3.1 billion of total global commitments across four different investment strategies: Private Debt, Infrastructure & Energy, Real Estate and Fund of Funds.
The main awards received by SAM during Q2 2024 include the Best Solidarity Fund in Spain by Expansion-Allfunds as well as being the asset manager with most awards at the Salmon awards in Chile with five prize-winning funds.
•In Insurance, we are delivering more value to our customers and simplifying our operations. In addition to our traditional focus on life and home businesses, we are shifting our mix towards higher growth verticals such as savings, health and SMEs, having launched the new health value offer (OneCare in Portugal and the UC Christus in Chile), and a new Unit Linked offer in Chile and Mexico.
Additionally, we are focused on improving customer growth and loyalty by developing fully digital servicing and claims capabilities while work is underway to maximize the value of our customer portfolio. Finally, we are also developing global platforms such as the new Latin American Autocompara, an integration of our motor insurance comparison engines in our Latin American markets, to capture additional business and unlock synergies.
| Wealth awards | ||

34 | | January - June 2024 | ||||||
Business performance
Total assets under management (AuMs) at record levels of EUR 480 billion, +13% when compared to June 2023 and +7% versus year end 2023, driven by excellent commercial activity and positive market performance. In terms of Insurance, gross written premiums reached EUR 6.1 billion with positive results from the non-related business. By business and in constant euros:
•In Private Banking, customer assets and liabilities exceed EUR 315 billion for the first time (+13% year-on-year), with all product categories growing. This is the result of very positive commercial activity, with net new money totalling EUR 11.9 billion in H1 2024.
We remain close to our clients, offering them the benefits of our scale and international presence, resulting in our client base growing 13% year-on-year to 283,000.
•In SAM, total assets under management reached EUR 225 billion, +14% year-on-year, on the back of high commercial activity, with net sales in H1 2024 reaching EUR 8.9 billion, and favourable market performance.
As a result of this remarkable activity, we are delivering market share growth in most of the countries where we operate while being in the top 3 in terms of market share in the majority of them.
•In Insurance, gross written premiums amounted to EUR 6.1 billion, slightly down despite the good performance in non-related business which is growing 4% year-on-year.
Wealth. Business performance. June 2024. | ||||||||||||||||||||
| EUR billion and % change in constant euros | ||||||||||||||||||||
| Total AuMs | ||
| Funds and investment* | ||
| - SAM | ||
| - Private Banking | ||
| Custody | ||
| Customer deposits | ||
| Customer loans | ||
| GWPs | ||

| vs. Mar-24 | vs. Jun-23 | ||||
| +2 | % | +13 | % | ||
| +3 | % | +13 | % | ||
| +3 | % | +14 | % | ||
| +3 | % | +18 | % | ||
| -2 | % | +17 | % | ||
| +3 | % | +6 | % | ||
| +1 | % | +2 | % | ||
| +11 | % | -1 | % | ||
Note: total products marketed, advised, under custody and/or managed.
*Excluding overlaps between PB and SAM (PB clients with investment funds managed by SAM).
Results
Attributable profit in H1 2024 amounted to EUR 818 million, 15% higher year-on-year. In constant euros, it grew 14%, with the following results by line:
•Total income reached EUR 1,789 million, 12% higher year-on-year supported by solid growth in net fee income and net interest income.
Net interest income increased 13% driven by a favourable macro environment, solid interest margin management and strong commercial activity in Private Banking.
Net fee income rose 15% year-on-year to EUR 719 million, with growth in all three business, boosted especially by Private Banking and SAM, driven by higher volumes with positive commercial activity and market performance.
•Costs increased 5% year-on-year, due to investments in key initiatives such as reinforcing PB teams to respond to increased commercial activity.
Also considering fees ceded to our commercial network, total revenue including these ceded fees reached EUR 3,116 million, up 12%, driven by more recurrent activity in PB, higher volumes in SAM and the good performance of the protection business in Insurance.
Wealth. Total income. H1 2024. | ||||||||||||||||||||||||||||||||
| EUR million and % change in constant euros | ||||||||||||||||||||||||||||||||
| PB | |||||
| SAM | |||||
| Insurance | |||||
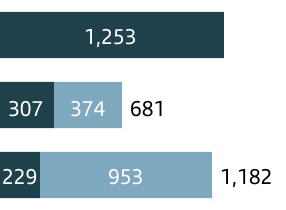
| Total income | Revenue + ceded fees | ||||
| +13% | +13% | ||||
| +17% | +14% | ||||
| +1% | +8% | ||||
| Total income | Fees ceded to the commercial network | ||||||||||
Note: information at the total Wealth level excludes overlaps between businesses.
When considering these ceded fees along with our PAT, the total contribution to Group profit (PAT+Fees) reached EUR 1,714 million, up 12% year-on-year (also +12% in constant euros).
H1 2024 RoTE was 79.3% (80.4% annualizing the impact of the temporary levy on revenue earned in Spain).
Compared to Q1 2024, attributable profit increased 4% in constant euros due to good revenue performance, mainly in Insurance, with controlled cost growth and after recording in Q1 2024 the impact of the temporary levy on revenue earned in Spain.
| Wealth. Underlying income statement | |||||||||||||||||||||||
| EUR million and % change | |||||||||||||||||||||||
| / | Q1'24 | / | H1'23 | ||||||||||||||||||||
| Q2'24 | % | excl. FX | H1'24 | % | excl. FX | ||||||||||||||||||
| Total income | 897 | +1 | +1 | 1,789 | +13 | +12 | |||||||||||||||||
| Expenses | -309 | +1 | +1 | -615 | +5 | +5 | |||||||||||||||||
| Net operating income | 588 | 0 | +1 | 1,173 | +17 | +16 | |||||||||||||||||
| LLPs | -10 | +147 | +148 | -14 | — | — | |||||||||||||||||
| PBT | 573 | +3 | +3 | 1,130 | +15 | +14 | |||||||||||||||||
| Attributable profit | 417 | +4 | +4 | 818 | +15 | +14 | |||||||||||||||||
January - June 2024 | | 35 | ||||||
| Payments | Underlying attributable profit | |||||||||
| EUR 49 mn | |||||||||||
→ PagoNxt and Cards bring a unique position in the payments industry to the Group, covering both sides of the value chain of card payments (issuing and acquiring businesses) and account payments. → Activity increased in both businesses supported by global platform development, enabling further scale gains. In PagoNxt, Getnet's Total Payments Volume (TPV) rose 12% year-on-year in constant euros and the number of transactions improved 7%. In Cards, turnover increased 5% year-on-year in constant euros and transactions rose 8%. → Attributable profit was EUR 49 million, EUR 292 million (+30% YoY in constant euros) excluding write-downs after discontinuing our merchant platform in Germany and Superdigital in Latin America. The EBITDA margin in PagoNxt improved 8.9 pp to 20.1%. | |||||||||||
PagoNxt and Cards strategy
PagoNxt continued to make progress in its key strategic priorities:
•In Getnet, we continued to consolidate our platform. We deployed new global solutions which are enabling us to gain market share across most of our footprint.
In addition, as part of our transformation in merchant in Europe, we remain focused on our current value proposition in Spain and Portugal, working with local partners in other European markets and doubling down in our strategic markets in Latin America. In line with this strategy, in June we decided to discontinue our merchant platform in Germany.
•In Ebury, we continued our expansion by developing specialist vertical-specific solutions, such as mass payments, accelerating the geographical expansion in emerging markets such as South Africa, expanding its product suite, especially FX risk management solutions, and continuously evolving online capabilities to better serve our customers.
•In PagoNxt Payments, we made progress in the development of Payments Hub, our modern global A2A payments processing platform, aiming to achieve an industry-leading cost per transaction combined with value-added services. Our goal is to deploy all these services to benefit both the Group and other open market participants.
Also, as part of our strategy to promote the use of common platforms across the Group to maximize operational leverage and provide the best service, we decided to discontinue our Superdigital platform in Latin America. Through our global platform we will continue to promote banking services in the mass segment and develop financial inclusion proposals.
In Cards, we continued to make progress in our priorities:
•Expand the business: we made progress implementing Card Risk Data Lab in Spain, Chile, Mexico and Uruguay, reaching more than 500,000 new pre-approved customers in H1 2024.
We are also increasing the connection between card issuing and acquiring platforms to offer value-added products and services. We launched a differential joint value proposition (card + PoS) in Spain, and will follow soon in Chile.
•Improve customer satisfaction: we are working to offer the best card payment experience in a simple way at any time, through what we call Invisible Payments. We made progress in the implementation of Click to Pay, an industry solution for e-commerce payments. We continued to roll out digital services on a global scale, such as the token manager, which already manages than 150 million of tokens at Santander banks.
•Implement Plard, our global card platform, which already manages more than 75,000 new debit cards in Brazil, where we expect the migration of the debit portfolio before year-end. In
Chile, we will start to manage new customer debit cards in Q3. In Mexico, the new authorizer engine is now live serving 2.9 million cards.
Business performance
Loans and advances to customers decreased 3% year-on-year. Excluding reverse repurchase agreements and in constant euros, gross loans rose 4%, driven mainly by Cards in Brazil and Mexico.
Payments has very small amount of deposits, concentrated in PagoNxt. These deposits (excluding repos) amounted to EUR 994 million and rose 66% year-on-year in euros and in constant euros.
Results
Attributable profit was EUR 49 million in H1 2024, 78% down year-on-year affected by write-downs related to the discontinuation of our merchant platform in Germany and Superdigital in Latin America. Excluding these impacts, profit was EUR 292 million, up 31% year-on-year. In constant euros, profit rose 30%, by line:
•Total income grew 3%. Excluding a one-time positive fee recorded in Q1 2023 from commercial agreements in Brazil, total income increased 6%, driven by activity improvement.
•Costs up 4%, but flat in real terms, despite our investments in platforms both in Cards and PagoNxt.
•Net loan-loss provisions, which are mainly related to the Cards business, decreased 3%, driven by the good performances in South America and Europe.
Compared to Q1 2024, worse bottom line affected by the already mentioned write-downs. Excluding them, profit rose 16% in constant euros driven by good revenue and cost performance.
| Payments. Underlying income statement | |||||||||||||||||||||||
| EUR million and % change | |||||||||||||||||||||||
| / | Q1'24 | / | H1'23 | ||||||||||||||||||||
| Q2'24 | % | excl. FX | H1'24 | % | excl. FX | ||||||||||||||||||
| Total income | 1,347 | 0 | +1 | 2,701 | +3 | +3 | |||||||||||||||||
| Expenses | -615 | -5 | -5 | -1,266 | +4 | +4 | |||||||||||||||||
| Net operating income | 732 | +4 | +7 | 1,435 | +2 | +2 | |||||||||||||||||
| LLPs | -434 | +4 | +6 | -852 | -2 | -3 | |||||||||||||||||
| PBT | 41 | -84 | -82 | 306 | -38 | -38 | |||||||||||||||||
| Attributable profit | -89 | — | — | 49 | -78 | -78 | |||||||||||||||||
36 | | January - June 2024 | ||||||
PagoNxt
Business performance
In H1 2024, the total number of transactions in Getnet reached 4.8 billion, 7% higher year-on-year, and the total payments volume (TPV) was EUR 108 billion, 12% more than in the same period of 2023 in constant euros.
Ebury had 23,000 active customers, a 23% rise year-on-year.
PagoNxt Payments processed 405 million transactions compared to 79 million in 2023 and 57% more in Q2 2024 than in Q1 2024.
| PagoNxt. Activity | ||
| TPV (Getnet) | ||
| EUR billion and changes in constant euros | ||
| +12% | ||||||||

Results
In H1 2024, attributable loss of EUR 304 million (EUR 61 million loss if we exclude the write-downs related to the discontinuation of our merchant platform in Germany and Superdigital in Latin America), compared to a EUR 103 million loss in the same period of 2023. There was no material impact from exchange rates in the period. In constant euros:
•Total income reached EUR 583 million, up 12% year-on-year, driven by a good performance in Ebury and the increase in Getnet's revenue in Chile, Mexico and Europe.
•Costs rose 5% year-on-year, reflecting inflationary pressures and continued investment in the global payment platforms.
EBITDA margin was 20.1%, 8.9 pp higher than in H1 2023.
Compared to Q1 2024, results were impacted by the aforementioned write-downs. Excluding them, attributable loss was EUR 22 million, compared to a EUR 39 million loss in Q1 2024, driven by strong fee growth in Chile and Europe and costs improvement.
| PagoNxt. Underlying income statement | |||||||||||||||||||||||
| EUR million and % change | |||||||||||||||||||||||
| / | Q1'24 | / | H1'23 | ||||||||||||||||||||
| Q2'24 | % | excl. FX | H1'24 | % | excl. FX | ||||||||||||||||||
| Total income | 300 | +6 | +8 | 583 | +12 | +12 | |||||||||||||||||
| Expenses | -297 | -3 | -2 | -601 | +5 | +5 | |||||||||||||||||
| Net operating income | 4 | — | — | -18 | -66 | -65 | |||||||||||||||||
| LLPs | -5 | +36 | +41 | -9 | -26 | -26 | |||||||||||||||||
| PBT | -258 | +842 | +808 | -286 | +273 | +280 | |||||||||||||||||
| Attributable profit | -265 | +573 | +562 | -304 | +196 | +198 | |||||||||||||||||
Cards
Business performance
Card turnover increased 5% year-on-year in constant euros, driven by growth both in credit and debit cards.
The number of transactions rose 8%, boosted by a larger card pool and a payment acceptance rate that continued to improve, allowing our customers to have the best payments experience.
Loans and advances to customers decreased 3% year-on-year. Excluding reverse repurchase agreements and in constant euros, gross loans rose 4%, driven mainly by Brazil and Mexico.
| Cards. Activity | ||
| Turnover | ||
| EUR billion and changes in constant euros | ||
| +5% | ||||||||

Results
In H1 2024, attributable profit amounted to EUR 353 million, an 8% rise. In constant euros, profit also rose 8%, by line:
•Total income was flat year-on-year, affected by a one-time positive fee that was recorded in Q1 2023 in Brazil. Excluding this effect, revenue rose 4%. NII grew 7% driven by higher volumes in Brazil and Mexico, offsetting the fall in fees, affected by the one-off already mentioned.
•Costs rose 2% year-on-year, growing below inflation, despite our investment in platforms.
•Net loan-loss provisions fell 3%, due to good risk management and to a lower interest rate environment in South America.
In H1 2024, RoTE in Cards was 35.0%.
Compared to Q1 2024, variations were significantly impacted by the use of the new Argentine peso exchange rate. Excluding Argentina, profit rose 6% in constant euros, supported by good performance in revenue and costs (mainly in the UK).
| Cards. Underlying income statement | |||||||||||||||||||||||
| EUR million and % change | |||||||||||||||||||||||
| / | Q1'24 | / | H1'23 | ||||||||||||||||||||
| Q2'24 | % | excl. FX | H1'24 | % | excl. FX | ||||||||||||||||||
| Total income | 1,047 | -2 | 0 | 2,117 | +1 | 0 | |||||||||||||||||
| Expenses | -319 | -8 | -7 | -665 | +4 | +2 | |||||||||||||||||
| Net operating income | 728 | +1 | +3 | 1,452 | 0 | 0 | |||||||||||||||||
| LLPs | -428 | +3 | +6 | -843 | -1 | -3 | |||||||||||||||||
| PBT | 300 | +3 | +5 | 592 | +3 | +4 | |||||||||||||||||
| Attributable profit | 176 | 0 | +2 | 353 | +8 | +8 | |||||||||||||||||
January - June 2024 | | 37 | ||||||
 | Corporate Centre | Underlying attributable profit | ||||||
| -EUR 609 mn | ||||||||
→ The Corporate Centre continued to support the Group. → The Corporate Centre’s objective is to define, develop and coordinate the Group's strategy and aid the operating units by contributing value and carrying out the corporate oversight and control function. It also carries out functions related to financial and capital management. → Attributable loss of EUR 609 million, improving 2% compared to H1 2023 mainly due to lower costs, more than offsetting the worse performance of gains on financial transactions (higher negative impact from foreign currency hedging), with net interest income virtually flat year-on-year. | ||||||||
Strategy and functions
The Corporate Centre contributes value to the Group, through the following functions, among others:
•Global control frameworks and supervision.
•Fostering the exchange of best practices in cost management, which enables us to be one of the most efficient banks.
•Collaborating in the definition and execution of the global strategy, competitive development operations and projects that ensure we meet the business plan.
•Contributing to the launch of projects that will be developed by our global businesses aimed at leveraging our worldwide presence to generate economies of scale.
•Ensuring open and constructive communication with shareholders, analysts, investors, bondholders, rating agencies and other market players.
•Adding value to our businesses, countries and divisions by encouraging the exchange of best practices, driving and managing innovative global initiatives and defining corporate policies to improve efficiency in our processes and service quality for our customers.
It also coordinates the relationship with European regulators and supervisors and carries out functions related to financial and capital management, as follows:
•Financial Management functions:
–Structural management of liquidity risk associated with funding the Group’s recurring activity and stakes of a financial nature. At the end of June 2024, the liquidity buffer was EUR 304 billion.
This is done ensuring the diversification of funding sources (issuances and other), maintaining an adequate profile in volumes, maturities and costs.
The price of these transactions with other Group units is the market rate that includes all liquidity concepts (which the Group supports by immobilizing funds during the term of the transaction) and regulatory requirements (TLAC/MREL).
–We also actively manage interest rate risk is also in order to dampen the impact of interest rate changes on net interest income, conducted via high credit quality, very liquid and low capital consumption derivatives.
–Strategic management of exposure to exchange rates in equity and dynamic management of the FX hedges related to the units’ next twelve months results in euros. The net investments in equity currently hedged totalled EUR 17,247 million (mainly in Mexico, Brazil and the UK) with different FX instruments (spots and forwards).
•Management of total capital and reserves: capital analysis, adequacy and management of the Group including: coordination with subsidiaries, monitoring profitability to maximize shareholder returns, setting solvency targets and capital contributions, and monitoring the capital ratio in both regulatory and economic terms, and efficient capital allocation to the units.
Results
In H1 2024, the attributable loss was EUR 609 million, 2% better than in H1 2023 (a EUR 620 million loss), by line:
•Net interest income remained steady (worsening EUR 6 million), as the higher liquidity buffer remuneration nearly offset higher interest expense related to TLAC/MREL issuances.
•Weaker gains on financial transactions (EUR 95 million more negative than H1 2023), due to greater negative impacts from foreign currency hedging.
•On the other hand, costs improved 8% compared to H1 2023, driven by ongoing simplification measures.
•Lastly, other results and provisions increased slightly year-on-year.
| Corporate Centre. Underlying income statement | |||||||||||||||||||||||
| EUR million and % change | |||||||||||||||||||||||
| Q2'24 | Q1'24 | Chg. | H1'24 | H1'23 | Chg. | ||||||||||||||||||
| Total income | -140 | -210 | -33 | -350 | -342 | +2% | |||||||||||||||||
| Net operating income | -227 | -297 | -24 | -524 | -531 | -1% | |||||||||||||||||
| PBT | -266 | -340 | -22 | -606 | -601 | +1% | |||||||||||||||||
| Attributable profit | -252 | -357 | -30 | -609 | -620 | -2% | |||||||||||||||||
38 | | January - June 2024 | ||||||
 | Europe | Underlying attributable profit | ||||||
| EUR 3,187 mn | ||||||||
→ We continue to accelerate our business transformation to achieve higher growth and a more efficient operating model. → New business lending volumes improved year-on-year, however the stock of loans declined, still affected by prepayments and in a context of higher interest rates. Customer deposits rose, mainly due to time deposits. → Attributable profit increased 26% (+24% in constant euros) to EUR 3,187 million, with strong revenue growth, mainly from net interest income in Spain, Portugal and Poland. | ||||||||
Strategy
In Q2 2024, we remained focused on growing our business and transforming our operating model, to improve efficiency and customer experience.
•In Retail, we continued to drive digitalization through a common online banking and mobile experience, while reducing running costs and streamlining products and processes.
•In CIB, we were focused on deepening customer relationships and boosting our distribution capabilities.
•We continued to grow our Wealth business, which is a key driver of fee generation, while increasing its efficiency by developing centralized global technology platforms.
•In Payments, we expanded our businesses across Europe through PagoNxt and Cards.
Additionally, our capital discipline allowed us to maximize the value of the businesses, through sustainable asset rotation and high-value origination.
Business performance
There were positive dynamics in the quarter, with new business volumes improving year-on-year, supported by 525,000 more customers year-on-year.
Loans and advances to customers rose 2% year-on-year. In gross terms, excluding reverse repurchase agreements and in constant euros, they decreased 1%, with falls across most countries, except Poland due to record mortgage and personal loan origination and CIB portfolio growth. By business, they decreased in Retail (due to mortgage prepayments in the UK and Spain and lower loans in SMEs) and Payments.
Customer deposits increased 1% year-on-year. Excluding repurchase agreements and in constant euros they also rose 1%, as the increase in time deposits (+16%) offset the decrease in
Europe. Business performance. June 2024 | |||||||||||||||||||||||||||||
| EUR billion and YoY % change in constant euros | |||||||||||||||||||||||||||||
| Europe | 561 | -1% | Europe | 727 | +3% | ||||||||||||||||||||||||
| ||
| ||
| ||
| ||

| ||
| ||
| ||
| ||

| Gross loans and advances to customers excl. reverse repos | Customer deposits excl. repos + mutual funds | |||||||||||||||||||||||||||||||||||||
demand deposits (-3%). By business, deposits rose mainly due to time deposits in Retail, CIB and Wealth. Mutual funds increased 16% in constant euros, with growth in all countries.
Results
Attributable profit in H1 2024 was EUR 3,187 million, up 26% year-on-year. In constant euros, it grew 24%, as follows:
•Total income increased 10%, due to higher net interest income (+7%), with strong growth in Spain, Portugal and Poland (good margin management), which more than offset the fall in the UK (lower mortgage volumes and higher deposit costs). Net fee income rose 4%, mainly driven by mutual fund fees in Spain (Objetivo campaign). SRF contributions ended in 2023, therefore there was no contribution in 2024.
•Costs increased 4%, in line with inflation, especially in the UK where salaries were impacted by inflation and in Poland due to the tight labour market. Net operating income rose 15% and the efficiency ratio improved by 2.6 pp, reaching 39.3%.
•Net loan-loss provisions decreased 23%, driven by credit quality improvement across countries and also due to macro improvement in the UK. We had additional provisions related to the CHF mortgage portfolio in Poland, increasing its coverage. The cost of risk stood at 0.39% (0.42% June 2023).
•Other results and provisions increased 22%, impacted by the higher temporary levy on revenue earned in Spain.
Compared to Q1 2024, profit rose 7% in constant euros, due to having recorded the temporary levy on revenue earned in Spain in Q1 2024 and a positive performance in costs. The quarter was impacted by the higher CHF mortgage portfolio provisions in Poland.
| Europe. Underlying income statement | |||||||||||||||||||||||
| EUR million and % change | |||||||||||||||||||||||
| / | Q1'24 | / | H1'23 | ||||||||||||||||||||
| Q2'24 | % | excl. FX | H1'24 | % | excl. FX | ||||||||||||||||||
| Total income | 5,910 | +2 | +2 | 11,718 | +12 | +10 | |||||||||||||||||
| Expenses | -2,297 | 0 | -1 | -4,602 | +5 | +4 | |||||||||||||||||
| Net operating income | 3,612 | +3 | +3 | 7,116 | +17 | +15 | |||||||||||||||||
| LLPs | -532 | +10 | +10 | -1,017 | -21 | -23 | |||||||||||||||||
| PBT | 2,545 | +4 | +4 | 4,983 | +28 | +26 | |||||||||||||||||
| Attributable profit | 1,647 | +7 | +7 | 3,187 | +26 | +24 | |||||||||||||||||
January - June 2024 | | 39 | ||||||
Business model | Financial information by segment | Responsible banking Corporate governance Santander share | Appendix | ||||||||||||||||||||||||||
| Secondary segments | |||||||||||||||||||||||||||||
| DCBE | Digital Consumer Bank Europe | Underlying attributable profit | ||||||
| EUR 453 mn | ||||||||
→ Our strategy is focused on strengthening our leadership in auto and non-auto through strategic alliances and better service through new operational and non-auto leasing platforms, with Zinia in check-out lending. → In H1 2024, new business volumes rose 2% year-on-year in constant euros (+4% in auto), in an environment that is still tending to limit consumption (despite this, the auto market performed well). Deposits increased 24% in constant euros, in line with our objective to increase retail funding through common platforms to reduce liability costs. → Attributable profit of EUR 453 million, down 13% year-on-year in constant euros as the good performance in net interest income and net fee income with flat costs, were more than offset by cost of risk normalization towards pre-pandemic levels and higher CHF mortgage provisions. | ||||||||
Strategy
The vision in our DCB Europe business is to become the preferred partner of our final customers and partners, offering greater profitability and value creation.
We are thus transforming our operating model:
•We continue to offer global solutions integrated into the processes of our partners - manufacturers, importers and retailers - accompanying them as their increasingly digital business models evolve.
•Simplifying and automating our processes to improve customer experience and gain in scalability.
•Building and developing global platforms. In Q2 2024, we continued strengthening our operational leasing solution in Italy, Spain, France and Germany. Zinia, our check-out lending platform, launched a service of instalment loans with Apple (physical point of sale and e-commerce) in Germany. Openbank is present in four markets (Spain, the Netherlands, Portugal and Germany).
Business performance
The stock of loans and advances to customers rose 8%. In gross terms, excluding reverse repos and in constant euros, it also rose 8% year-on-year, reaching EUR 138 billion. New business volumes rose 2% year-on-year in constant euros (+4% in auto).
In line with our strategy to increase retail funding to reduce funding costs, customer deposits increased 24% year-on-year. Excluding repos and in constant euros, they also grew 24% to EUR 77 billion. Mutual funds increased double-digits from very low levels. Our access to wholesale funding markets remained strong and diversified.
DCB Europe. June 2024 | ||||||||||||||||||||||||||||||||
| EUR billion and % change in constant euros | ||||||||||||||||||||||||||||||||
| +2% | ||||||||||||||||||||||||||||||||
| QoQ | +5% | |||||||||||||||||||||||||||||||
| QoQ | ||||||||||||||||||||||||||||||||
| 138 | ||||||||||||||||||||||||||||||||
| +8% | 81 | +23% | ||||||||||||||||||||||||||||||
| YoY | YoY | |||||||||||||||||||||||||||||||
| Gross loans and advances to customers excl. reverse repos | Customer deposits excl. repos + mutual funds | |||||||||||||||||||||||||||||||
Results
In H1 2024, attributable profit reached EUR 453 million, a 13% decline year-on-year. In constant euros, profit also decreased 13%, as follows:
•Total income improved 7%, mainly due to net interest income (+7%), supported by active loan repricing and customer deposit growth. In addition, net fee income grew 14%, driven by greater penetration in direct insurance, especially in Germany. SRF contributions ended in 2023, therefore there is no contribution in 2024.
•Costs remained flat, absorbing the effects of inflation and business growth. Net operating income grew 14% and the efficiency ratio improved 3.2 pp to 46.2%.
•Net loan-loss provisions increased 40%, significantly impacted by additional provisions in Q2 2024 to increase the coverage of the CHF mortgage portfolio. Additionally, they rose due to expected normalization (still below our historical average), volumes growth, some regulatory impacts and lower portfolio sales than in 2023. Despite all of this, cost of risk remained at very low levels (0.72%), normalizing in line with expectations and the NPL ratio stood at 2.31%.
The largest contribution to profit came from Germany (EUR 123 million), followed by the Nordic countries (EUR 122 million), France (EUR 63 million) and the UK (EUR 57 million).
Compared to Q1 2024, profit fell 2% in constant euros as the good performance in total income and especially in costs, were more than offset by the higher CHF mortgage provisions.
| DCB Europe. Underlying income statement | |||||||||||||||||||||||
| EUR million and % change | |||||||||||||||||||||||
| / | Q1'24 | / | H1'23 | ||||||||||||||||||||
| Q2'24 | % | excl. FX | H1'24 | % | excl. FX | ||||||||||||||||||
| Total income | 1,444 | +2 | +3 | 2,854 | +7 | +7 | |||||||||||||||||
| Expenses | -655 | -1 | -1 | -1,319 | 0 | 0 | |||||||||||||||||
| Net operating income | 789 | +6 | +6 | 1,534 | +14 | +14 | |||||||||||||||||
| LLPs | -308 | +12 | +12 | -584 | +41 | +40 | |||||||||||||||||
| PBT | 356 | -11 | -11 | 757 | -18 | -18 | |||||||||||||||||
| Attributable profit | 224 | -2 | -2 | 453 | -13 | -13 | |||||||||||||||||
40 | | January - June 2024 | ||||||
Business model | Financial information by segment | Responsible banking Corporate governance Santander share | Appendix | ||||||||||||||||||||||||||
| Secondary segments | |||||||||||||||||||||||||||||
 | North America | Underlying attributable profit | ||||||
| EUR 1,347 mn | ||||||||
→ We continue to leverage the strength of our global businesses to transform our presence in the US and Mexico while continuing our digital transformation and refining our tailored service and product suite for a better customer experience. → Loans and advances to customers increased 3% year-on-year in constant euros driven by growth in both countries. Customer deposits declined 4% in deposits in constant euros, mainly due to funding strategy changes in CIB in the US, partially mitigated by higher deposits in Mexico and Consumer in the US. → Attributable profit in H1 2024 was EUR 1,347 million, flat year-on-year (-3% in constant euros), with top line growth in both countries offset by higher costs (inflation and investments) and cost of risk normalization. | ||||||||
Strategy
We continued to pursue business transformation across the US and Mexico, while leveraging our global and regional scale. We:
•Remained focused on executing the transformation of our Retail and Consumer businesses in both countries. The simplification of our product portfolio and streamlining of our operations continued.
•Advanced in the adoption of global technology platforms to deliver an enhanced digital experience. For example, in April we announced the launch of our national deposit platform under the Openbank brand later this year in the US.
•Continued to invest in our Corporate & Investment Banking Build-Out in the US, with the expansion of our advisory services and enhanced product offering capabilities, resulting in strong revenue growth.
•Pursued growth in Wealth, with targeted investments to enhance our capabilities and strengthen growth levers.
•Strengthened our regional operating model in technology and operations to consolidate know-how, digitalization, digital hubs, front and back-office automation driving more effective and efficient operations.
Business performance
Loans and advances to customers rose 5% year-on-year. In gross terms, excluding reverse repos and in constant euros, they were 3% up primarily driven by robust growth in mortgages, auto, cards and corporates in Mexico and CIB and auto in the US.
Customer deposits rose 2% year-on-year. Excluding repos and in constant euros, they declined 4%. This was mainly driven by strategy changes to reduce excess corporate deposits in CIB in the US, partially offset by deposit growth in Retail in Mexico and in Consumer in the US.
North America. Business performance. June 2024 | |||||||||||||||||||||||||||||
| EUR billion and YoY % change in constant euros | |||||||||||||||||||||||||||||
| North America | 165 | +3% | North America | 167 | 0% | ||||||||||||||||||||||||
| ||
| ||

| ||
| ||

| Gross loans and advances to customers excl. reverse repos | Customer deposits excl. repos + mutual funds | |||||||||||||||||||||||||||||||||||||
Mutual funds grew strongly, +19% year-on-year in constant euros driven mainly by Mexico, supported by a strategy based on offering attractive products to our customers through enhanced digital platforms.
Results
Attributable profit in H1 2024 was EUR 1,347 million, flat year-on-year. In constant euros, profit decreased 3%, as follows:
•Total income grew 7% year-on-year, driven by a strong revenue performance in CIB in the US, where we are moving forward with our capabilities build-out, and by a good performance across the board in Mexico (volumes growth and wider customer margins).
•Costs increased 7%, driven by inflation and higher digital and investments embedded in our transformation programme in Retail in Mexico and in CIB in the US. These were partially compensated by significant efficiencies in our Consumer and Commercial businesses in the US resulting from our transformation initiatives.
•Net loan-loss provisions rose 21%, reflecting the strong business growth in Retail and Cards in Mexico, as well as the expected cost of risk normalization in Mexico and auto in the US.
Compared to Q1 2024, attributable profit grew 9% in constant euros, fuelled by revenue growth in Retail in Mexico and Consumer in the US and lower net loan-loss provisions, particularly in Consumer in the US and Payments in Mexico.
| North America. Underlying income statement | |||||||||||||||||||||||
| EUR million and % change | |||||||||||||||||||||||
| / | Q1'24 | / | H1'23 | ||||||||||||||||||||
| Q2'24 | % | excl. FX | H1'24 | % | excl. FX | ||||||||||||||||||
| Total income | 3,554 | +2 | +2 | 7,039 | +10 | +7 | |||||||||||||||||
| Expenses | -1,691 | +2 | +2 | -3,352 | +10 | +7 | |||||||||||||||||
| Net operating income | 1,863 | +2 | +2 | 3,686 | +10 | +7 | |||||||||||||||||
| LLPs | -908 | -8 | -8 | -1,893 | +24 | +21 | |||||||||||||||||
| PBT | 810 | +4 | +4 | 1,586 | -9 | -12 | |||||||||||||||||
| Attributable profit | 703 | +9 | +9 | 1,347 | 0 | -3 | |||||||||||||||||
January - June 2024 | | 41 | ||||||
Business model | Financial information by segment | Responsible banking Corporate governance Santander share | Appendix | ||||||||||||||||||||||||||
| Secondary segments | |||||||||||||||||||||||||||||
 | South America | Underlying attributable profit | ||||||
| EUR 1,681 mn | ||||||||
→ We are focused on being the primary bank for our customers and the most profitable bank in each of our countries in the region, taking advantage of the synergies between our global and regional businesses. We continued to grow our solid customer base (increasing 3.6 million year-on-year to almost 77 million), supported by our focus on service quality. → In terms of activity, year-on-year growth in both loans and deposits in constant euros, as we seek to become the leading bank in inclusive and sustainable businesses through differential value propositions. → Attributable profit was EUR 1,681 million in H1 2024, with a 15% increase year-on-year (+19% in constant euros) driven by the strong net interest income growth which more than offset lower gains on financial transactions and higher provisions. | ||||||||
Strategy
In Q2 2024, the main initiatives by business were:
•In Retail, we continued to focus on becoming a digital bank with branches, optimizing our product and service offering in digital channels and improving customer experience.
•In Consumer, we continued developing new business models and strengthening OEM agreements.
•In CIB, we are evolving towards a pan-regional offering, focusing on Markets and Corporate Finance.
•In Wealth, we are working to increase liability gathering to drive loyalty, improving our value offer and developing our distribution channels.
•In Payments, we continued to boost profitable growth, through new business development and efficiency improvement.
Business performance
The variations in constant euros, both in the balance sheet and results, have been calculated considering the Argentine peso exchange rate on the last working day of each of the periods presented. Additionally, from Q2 2024 onwards, a theoretical exchange rate has been used for the Argentine peso. For further information, see the 'Alternative performance measures' section in the appendix to this report.
Loans and advances to customers fell 4% year-on-year. In gross terms, excluding reverse repos and in constant euros, they rose 7%, with increases in all global businesses. Retail loans grew due to SMEs and corporates (Brazil and Uruguay), mortgages (Brazil, Chile and Uruguay) and personal loans (Brazil). Loans in Consumer, Wealth and Payments rose in the main countries, except in Argentina.
South America. Business performance. June 2024 | ||||||||||||||||||||||||||
| EUR billion and YoY % change in constant euros | ||||||||||||||||||||||||||
| South America | 157 | +7% | South America | 195 | +11 | % | ||||||||||||||||||||
| ||
| ||
| ||
 | ||

| ||
| ||
| ||
| ||

| Gross loans and advances to customers excl. reverse repos | Customer deposits excl. repos + mutual funds | |||||||||||||||||||||||||||||||||||||
Customer deposits decreased 3% year-on-year. Excluding repos and in constant euros, they rose 8%, driven by time deposits (+13%) with strong growth in Brazil, Chile and Uruguay. Mutual funds rose 18% in constant euros, with double-digit increases in most countries.
Results
In H1 2024, attributable profit reached EUR 1,681 million, 15% higher than in H1 2023. In constant euros, profit rose 19%, as follows:
•Total income increased 10%, supported by 23% net interest income growth, up in all global businesses and rising double-digits in Brazil and Chile (higher volumes and benefiting from negative sensitivity of their balance sheet in a context of falling interest rates) and in Argentina. In net fee income, the good performance in Brazil (insurance and foreign exchange fees) Uruguay (Consumer) and Peru (CIB) offset lower fees in Argentina and Chile (from high levels in 2023). Gains on financial transactions were impacted by lower results in CIB in Brazil and Argentina.
•Costs remained flat and fell 4% in real terms, driven by lower costs in Argentina and our good cost management in Brazil and Chile. Efficiency improved by 3.7 pp to 35.4%.
•Net loan-loss provisions were up 10% due to Brazil, where provisions increased below portfolio growth, and normalization in Chile. The cost of risk stood at 3.50% (3.32% in June 2023).
Compared to Q1 2024, variations were significantly impacted by the use of the new Argentine peso exchange rate. Excluding Argentina, profit rose 7% in constant euros, supported by higher net interest income and net fee income in Brazil and Chile and controlled costs.
| South America. Underlying income statement | |||||||||||||||||||||||
| EUR million and % change | |||||||||||||||||||||||
| / | Q1'24 | / | H1'23 | ||||||||||||||||||||
| Q2'24 | % | excl. FX | H1'24 | % | excl. FX | ||||||||||||||||||
| Total income | 4,903 | 0 | +3 | 9,790 | +8 | +10 | |||||||||||||||||
| Expenses | -1,636 | -11 | -8 | -3,466 | -2 | 0 | |||||||||||||||||
| Net operating income | 3,267 | +7 | +10 | 6,324 | +15 | +17 | |||||||||||||||||
| LLPs | -1,370 | -1 | +3 | -2,748 | +8 | +10 | |||||||||||||||||
| PBT | 1,480 | +13 | +16 | 2,788 | +17 | +21 | |||||||||||||||||
| Attributable profit | 885 | +11 | +14 | 1,681 | +15 | +19 | |||||||||||||||||
42 | | January - June 2024 | ||||||
Business model | Responsible banking | ||||||||||||||||||||||||||||
Responsible Banking
STRATEGY AND TARGET | ||
Our sustainability strategy focuses on supporting business growth, meeting our stakeholders' expectations and making Santander more resilient through sound risk management, data protection and privacy, transparency, culture and governance. This strategy focuses on areas with the greatest risks or opportunities for the Group or where we can have the greatest impact.
We continued to make progress towards meeting the goals set at Investor Day, which include supporting the transition to a green economy and promoting inclusive growth.
| Green finance | Socially Responsible Investments (SRI) AuMs | Financial inclusion | ||||||||||||||||||
EUR 123.4 billion | EUR 74.0 billion | 2.8 million people | ||||||||||||||||||
| Target 1: EUR 120 bn 2025 | Target: EUR 100 bn 2025 | Target: 5 mn 2025 | ||||||||||||||||||
| Target 2: EUR 220 bn 2030 | ||||||||||||||||||||
Note: targets were set before the publication of the European taxonomy in Q2 2023. Therefore, target definitions are not fully aligned with the taxonomy. For further information, see the 'Alternative performance measures' section in the appendix to this report. | ||||||||||||||||||||
GROUP | ||
•We achieved the target we set in 2019 to invest or mobilize EUR 120 billion in green finance before 2025 18 months early. This put us in a good position to achieve our objective to reach EUR 220 billion in green finance between 2019 and 2030.
•In Q2 2024, Euromoney gave us the following awards:
–Best Bank for Corporate Responsibility in Western Europe, and also in Mexico, Portugal and Uruguay.
–Best Bank for ESG in Brazil, Chile and Argentina.
–Best Bank for Diversity and Inclusion in the UK and Spain.
| RETAIL | |||||
•Since 2023, we have financially included 2.8 million people, of which more than 1.4 million were through access initiatives and around 1.4 million through finance initiatives. In H1 2024, we also supported microentrepreneurs with EUR 631 million through our Prospera, Tuiio and Surgir programmes, now present in four countries.
•As part of our objective to invest EUR 400 million between 2023 and 2026 to foster education, employability and entrepreneurship, we have reached EUR 146.6 million, of which EUR 41.6 million was in H1 2024. In addition, in H1 2024 we invested EUR 21 million in communities.
•We signed an asset securitization together with EIB Group. This will allow us to mobilize EUR 1.2 billion, that will contribute to financing green and women's entrepreneurship projects of SMEs and mid-caps in Spain.
•In Q2 2024, we published sustainability reports in Brazil, Mexico and the US, where we explain our local sustainability actions. In May, we published the 2023 University Report with information on all the activities throughout the year done by Santander Universidades and Universia to boost education, employability and entrepreneurship.
•We also launched another Santander X Global Challenge in 11 countries, an initiative for startups and scaleups that bring innovative solutions to education, employability and entrepreneurship.
January - June 2024 | | 43 | ||||||
Business model | Responsible banking | ||||||||||||||||||||||||||||
| CONSUMER | |||||
•In Europe, we financed more than 119,000 new electric vehicles (EV) in H1 2024 for a total of EUR 3.4 billion, equivalent to a market share of EV sales in Europe of more than 12%. Our offering includes a wide range of green solutions including the financing of electric vehicles, electric chargers, solar panels and electric bicycles.
•Also during H2 2024, we published our decarbonization target for our European auto lending portfolio for 2030, and we automated the calculation for enhanced monitoring.
| CIB | |||||
•As at 30 June 2024, we had financed or mobilized a total of EUR 123.4 billion in green finance since we set our target in 2019, having mobilized EUR 8 billion in H1 2024.
•We continued to make progress towards achieving our 2030 decarbonization objectives in the electric power generation, energy (oil and gas), aviation, steel, auto manufacturing and thermal coal sectors. In addition, during H1 2024, we published our decarbonization target for the auto manufacturing portfolio.
| WEALTH | |||||
•We continued to increase our socially responsible investment (SRI) product offering, advancing towards our target of reaching EUR 100 billion in SRI AuMs in 2025. As at end June, the total volume of AuMs in socially responsible investments was EUR 74.0 billion, of which EUR 51.2 billion were in SAM and EUR 22.7 billion from third party funds in Private Banking.
•We continued to make progress in our objective to reduce the emissions of 50% of AuMs by half by 2030, within the perimeter of our commitment. Also, we made progress in our net zero engagement activities, through participation in collaborative initiatives and individual engagements.
•In Santander Asset Management, we launched Santander GO Global Environmental Solutions funds, which invest in companies related to circular economy, natural capital, renewable energies or energy infrastructure, among others.
•We published 'Climate adaptations vs. mitigation' and 'From linear to circular, the future of business and the economy', our first articles related to sustainability for our global Private Banking clients.
| PAYMENTS | |||||
•As at 31 May 2024, in Cards, we had acquired 10.7 million cards made of sustainable materials (recycled PVC or PLA).

44 | | January - June 2024 | ||||||
Business model | Corporate governance | ||||||||||||||||||||||||||||
Corporate governance
Share capital reduction of 2.09% under the shareholder remuneration charged against 2023 results
On 25 June, the board of directors reduced the Bank's share capital by EUR 165,652,500, cancelling 331,305,000 of its own shares. These shares accounted for 2.09% of share capital prior to the reduction and were acquired as part of the buyback programme that ran between February and June 2024 under the shareholder remuneration charged against 2023 results. The capital reduction, which was approved at the general shareholders’ meeting on 22 March 2024, was registered with the Commercial Registry of Cantabria on 1 July. Consequently, Article 5 of the Bylaws was amended to reflect that the Bank’s share capital is set at EUR 7,747,136,786, comprising 15,494,273,572 shares with a nominal value of EUR 0.50 per share, all of the same class and affording the same rights.
The six share buyback programmes charged against 2021, 2022 and 2023 results and the related share capital reductions have resulted in the cancellation of almost 11% of the Bank's shares (1,846,367,730 shares) since November 2021.
Changes to the board of directors
On 27 June, having obtained the corresponding regulatory approvals, Carlos Barrabés (filling the vacancy left by Bruce Carnegie-Brown), and Antonio Weiss (to succeed Ramiro Mato, who also ceased to be a member of the board of directors), joined the board as independent directors.
Changes to the board committees
On 27 June, Carlos Barrabés joined the nomination committee, the responsible banking, sustainability and culture committee and the innovation and technology committee to replace Ramiro Mato, who also ceased to be a member of other committees (executive, audit and risk supervision, regulation and compliance).
Also, on 23 July, Sol Daurella was appointed Chair of the responsible banking, sustainability and culture committee.
The updated composition of the board committees is available on our corporate website (www.santander.com).
Changes to the organizational structure of the Group's Senior Management
On 29 April, the board of directors approved the following appointments, subject to regulatory approval:
•Javier García Carranza as the new Global Head of Wealth Management & Insurance to succeed Víctor Matarranz, who will support Héctor Grisi in executing our strategy. Mr García Carranza led the Investment Platforms and Corporate Investments unit, which is merging with Wealth Management & Insurance to leverage synergies across the respective businesses.
•Javier Roglá as head of the Group's new People and Culture division, which brings together the Talent area headed by Mr Roglá, and Human Resources, led until now by Alexandra Brandão, who remains in the Group as a director of Banco Santander (Uruguay).
Also, on 25 June, the board of directors agreed the appointment, subject to regulatory approval, of Alexsandro Broedel Lopes as the new Group Chief Accounting Officer to succeed José Doncel, who will leave his executive role in the Group in March 2025. Mr Broedel Lopes, who, until now, was CFO of Itaú Unibanco where he has worked for the past 12 years, will begin this role early next year.
January - June 2024 | | 45 | ||||||
Santander Share
Dividends and shareholder remuneration
In application of the shareholder remuneration policy for 2023, the bank paid an additional cash dividend of EUR 9.50 cents per share against 2023 results in May 2024.
Likewise, and in application of the shareholder remuneration policy for 2023, a second share buyback programme was carried out between February and June 2024 for EUR 1,459 million, in which a total of 331,305,000 shares were acquired, representing 2.09% of the share capital. Under the authorization of the 22 March 2024 AGM, on 25 June 2024, the board agreed to amortize the shares acquired and to the corresponding reduction of share capital under the terms described in the 'Corporate governance' section.
As a result, the total shareholder remuneration against 2023 results, including the cash dividend of EUR 8.10 cent per share paid in November 2023 and the first share buyback programme (EUR 1,310 million) completed in January 2024, was EUR 5,552 million, equivalent to approximately 50% of the Group’s reported profit (excluding non-cash, non-capital ratios impact items) in 2023. This remuneration was split approximately equally with around 50% in cash dividends and 50% through share buybacks.
Share price performance
Santander's shares are listed on five markets: on four exchanges in Spain (Madrid, Barcelona, Bilbao and Valencia), in the US (as an ADR), in the UK (as a CDI), in Poland and in Mexico (Sistema Internacional de Cotizaciones).
During Q2 2024, disinflation slowed down. Fluctuations in interest rate expectations reflected market uncertainties about central bank decisions. While the ECB made its first interest rate cut in June, the Federal Reserve and the Bank of England decided to hold interest rates.
There has also been some volatility due to the recent electoral processes, which has impacted the markets in Mexico and Europe, although growth expectations in the eurozone remain reasonably positive. In the UK, the economic outlook is not expected to be greatly impacted by the results of the elections.
In this environment, equity markets performed well. Santander's share price ended June 2024 with positive return of 14.6% in the year to date. In the banking sector, the Eurostoxx Banks, the eurozone's main index, was 15.6% up, while the DJ Stoxx Banks rose by 15.2% and the MSCI World Banks increased 11.3%. The other main indices also closed up (the Ibex 35 +8.3% and the DJ Stoxx 50 +9.7% since end 2023).
| Share price | ||||||||||||||
 |  | |||||||||||||
START 29/12/2023 | END 28/06/2024 | |||||||||||||
| €3.780 | €4.331 | |||||||||||||
 |  | |||||||||||||
Maximum 29/04/2024 | Minimum 30/01/2024 | |||||||||||||
| €4.928 | €3.563 | |||||||||||||
| Comparative share performance | ||

46 | | January - June 2024 | ||||||
Market capitalization and trading
As at 28 June 2024, Santander’s market capitalization of EUR 67,098 million was the second largest in the eurozone and 25th largest in the world among financial institutions.
The share’s weighting in the Stoxx Europe 600 Banks index was 6.8% and 11.5% in the Euro Stoxx Banks. In the domestic market, its weight in the Ibex 35 was 12.2% as at end June 2024.
A total of 4,297 million shares were traded in the period for an effective value of EUR 18,194 million and an annualized liquidity ratio of 54%.
The average daily trading volume was 34.1 million shares with an effective value of EUR 144 million.
Shareholder base
The total number of Santander shareholders at the end of June 2024 was 3,526,649, of which 3,192,026 were European (72.63% of the capital stock) and 323,462 from the Americas (25.93% of the capital stock).
Excluding the board, which holds 1.26% of the bank’s capital stock, retail shareholders accounted for 39.75% and institutional shareholders accounted for 58.99%.
| Share capital distribution by geographic area | ||||||||
| June 2024 | ||||||||
| The Americas | Europe | Other | ||||||
| 25.93% | 72.63% | 1.44% | ||||||
 | ||||||||
| Source: Banco Santander, S.A. Shareholder register. | ||||||||
 | 2nd | Bank in the eurozone by market capitalization | |||||||||
| EUR | 67,098 | million 1 | |||||||||
| The Santander share | |||||
| June 2024 | |||||
| Shares and trading data | |||||
| Shares (number) | 15,494,273,572 | ||||
| Average daily turnover (number of shares) | 34,106,207 | ||||
| Share liquidity (%) | 54 | ||||
| (Annualized number of shares traded during the period / number of shares) | |||||
| Stock market indicators | |||||
| Price / Tangible book value (X) | 0.88 | ||||
| Free float (%) | 99.99 | ||||
1.After cancelling the shares from the second share buyback programme against 2023 results.
| Share capital distribution by type of shareholder | |||||
| June 2024 | |||||
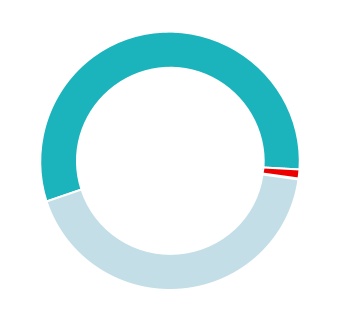
| Institutions | ||
| 58.99% | ||
| Board * | ||
| 1.26% | ||
| Retail | ||
| 39.75% | ||
* Shares owned or represented by directors.
January - June 2024 | | 47 | ||||||
A P P E N D I X

48 | | January - June 2024 | ||||||
Business model | |||||||||||||||||||||||||||||
| Group financial information | |||||||||||||||||||||||||||||
Financial information
Note: from Q2 2024, we have begun to apply a new theoretical exchange rate for the Argentine peso which better reflects inflation in the country. For more information, see the calculation method detailed in the ‘Alternative Performance Measures’ section in this appendix.
| Net fee income. Consolidated | ||||||||||||||||||||
| EUR million | ||||||||||||||||||||
| Q2'24 | Q1'24 | Change (%) | H1'24 | H1'23 | Change (%) | |||||||||||||||
| Fees from services | 1,789 | 1,821 | (1.8) | 3,610 | 3,591 | 0.5 | ||||||||||||||
| Wealth management and marketing of customer funds | 1,126 | 1,076 | 4.6 | 2,202 | 1,956 | 12.6 | ||||||||||||||
| Securities and custody | 322 | 343 | (6.1) | 665 | 556 | 19.6 | ||||||||||||||
| Net fee income | 3,237 | 3,240 | (0.1) | 6,477 | 6,103 | 6.1 | ||||||||||||||
| Underlying operating expenses. Consolidated | ||||||||||||||||||||
| EUR million | ||||||||||||||||||||
| Q2'24 | Q1'24 | Change (%) | H1'24 | H1'23 | Change (%) | |||||||||||||||
| Staff costs | 3,467 | 3,594 | (3.5) | 7,061 | 6,603 | 6.9 | ||||||||||||||
| Other general administrative expenses | 2,071 | 2,125 | (2.5) | 4,196 | 4,270 | (1.7) | ||||||||||||||
| Information technology | 651 | 645 | 0.9 | 1,296 | 1,247 | 3.9 | ||||||||||||||
| Communications | 98 | 104 | (5.8) | 202 | 208 | (2.9) | ||||||||||||||
| Advertising | 137 | 139 | (1.4) | 276 | 299 | (7.7) | ||||||||||||||
| Buildings and premises | 179 | 192 | (6.8) | 371 | 373 | (0.5) | ||||||||||||||
| Printed and office material | 20 | 23 | (13.0) | 43 | 47 | (8.5) | ||||||||||||||
| Taxes (other than tax on profits) | 118 | 150 | (21.3) | 268 | 295 | (9.2) | ||||||||||||||
| Other expenses | 868 | 872 | (0.5) | 1,740 | 1,801 | (3.4) | ||||||||||||||
| Administrative expenses | 5,538 | 5,719 | (3.2) | 11,257 | 10,873 | 3.5 | ||||||||||||||
| Depreciation and amortization | 828 | 828 | 0.0 | 1,656 | 1,606 | 3.1 | ||||||||||||||
| Operating expenses | 6,366 | 6,547 | (2.8) | 12,913 | 12,479 | 3.5 | ||||||||||||||
| Operating means. Consolidated | |||||||||||||||||||||||
Employees1 | Branches | ||||||||||||||||||||||
| Jun-24 | Jun-23 | Change | Jun-24 | Jun-23 | Change | ||||||||||||||||||
| Europe | 67,633 | 66,820 | 813 | 3,033 | 3,103 | (70) | |||||||||||||||||
| Spain | 24,229 | 24,811 | (582) | 1,833 | 1,884 | (51) | |||||||||||||||||
| United Kingdom | 22,214 | 22,163 | 51 | 444 | 445 | (1) | |||||||||||||||||
| Portugal | 4,885 | 4,977 | (92) | 374 | 377 | (3) | |||||||||||||||||
| Poland | 10,988 | 10,682 | 306 | 373 | 389 | (16) | |||||||||||||||||
| Other | 5,317 | 4,187 | 1,130 | 9 | 8 | 1 | |||||||||||||||||
| DCB Europe | 16,704 | 16,624 | 80 | 327 | 363 | (36) | |||||||||||||||||
| North America | 43,388 | 45,657 | (2,269) | 1,765 | 1,814 | (49) | |||||||||||||||||
| US | 12,746 | 14,250 | (1,504) | 409 | 443 | (34) | |||||||||||||||||
| Mexico | 29,195 | 30,280 | (1,085) | 1,356 | 1,371 | (15) | |||||||||||||||||
| Other | 1,447 | 1,127 | 320 | — | — | — | |||||||||||||||||
| South America | 79,967 | 81,413 | (1,446) | 3,160 | 3,543 | (383) | |||||||||||||||||
| Brazil | 56,803 | 58,505 | (1,702) | 2,446 | 2,772 | (326) | |||||||||||||||||
| Chile | 9,519 | 9,928 | (409) | 242 | 259 | (17) | |||||||||||||||||
| Argentina | 8,356 | 8,233 | 123 | 314 | 362 | (48) | |||||||||||||||||
| Other | 5,289 | 4,747 | 542 | 158 | 150 | 8 | |||||||||||||||||
| Corporate Centre | 1,861 | 1,896 | (35) | ||||||||||||||||||||
| Total Group | 209,553 | 212,410 | (2,857) | 8,285 | 8,823 | (538) | |||||||||||||||||
1. Employee data for Spain and Other Europe have been modified slightly to better reflect the allocation of CIB employees.
January - June 2024 | | 49 | ||||||
Business model | |||||||||||||||||||||||||||||
| Group financial information | |||||||||||||||||||||||||||||
| Underlying net loan-loss provisions. Consolidated | ||||||||||||||||||||
| EUR million | ||||||||||||||||||||
| Q2'24 | Q1'24 | Change (%) | H1'24 | H1'23 | Change (%) | |||||||||||||||
| Non-performing loans | 3,582 | 3,464 | 3.4 | 7,046 | 6,635 | 6.2 | ||||||||||||||
| Country-risk | — | — | — | — | — | — | ||||||||||||||
| Recovery of written-off assets | (464) | (339) | 36.9 | (803) | (864) | (7.1) | ||||||||||||||
| Net loan-loss provisions | 3,118 | 3,125 | (0.2) | 6,243 | 5,771 | 8.2 | ||||||||||||||
| Loans and advances to customers. Consolidated | |||||||||||||||||
| EUR million | |||||||||||||||||
| Change | |||||||||||||||||
| Jun-24 | Jun-23 | Absolute | % | Dec-23 | |||||||||||||
| Commercial bills | 53,763 | 53,596 | 167 | 0.3 | 55,628 | ||||||||||||
| Secured loans | 558,338 | 566,991 | (8,653) | (1.5) | 554,375 | ||||||||||||
| Other term loans | 304,917 | 293,360 | 11,557 | 3.9 | 295,485 | ||||||||||||
| Finance leases | 39,725 | 36,831 | 2,894 | 7.9 | 38,723 | ||||||||||||
| Receivable on demand | 13,602 | 14,229 | (627) | (4.4) | 12,277 | ||||||||||||
| Credit cards receivable | 23,387 | 23,889 | (502) | (2.1) | 24,371 | ||||||||||||
| Impaired assets | 33,614 | 33,295 | 319 | 1.0 | 34,094 | ||||||||||||
| Gross loans and advances to customers (excl. reverse repos) | 1,027,346 | 1,022,191 | 5,155 | 0.5 | 1,014,953 | ||||||||||||
| Reverse repos | 60,875 | 45,999 | 14,876 | 32.3 | 44,184 | ||||||||||||
| Gross loans and advances to customers | 1,088,221 | 1,068,190 | 20,031 | 1.9 | 1,059,137 | ||||||||||||
| Loan-loss allowances | 22,625 | 23,146 | (521) | (2.3) | 22,788 | ||||||||||||
| Loans and advances to customers | 1,065,596 | 1,045,044 | 20,552 | 2.0 | 1,036,349 | ||||||||||||
| Total funds. Consolidated | |||||||||||||||||
| EUR million | |||||||||||||||||
| Change | |||||||||||||||||
| Jun-24 | Jun-23 | Absolute | % | Dec-23 | |||||||||||||
| Demand deposits | 659,270 | 670,106 | (10,836) | (1.6) | 661,262 | ||||||||||||
| Time deposits | 293,608 | 270,609 | 22,999 | 8.5 | 307,085 | ||||||||||||
| Mutual funds | 218,207 | 193,401 | 24,806 | 12.8 | 208,528 | ||||||||||||
| Customer funds | 1,171,085 | 1,134,116 | 36,969 | 3.3 | 1,176,875 | ||||||||||||
| Pension funds | 15,091 | 14,352 | 739 | 5.1 | 14,831 | ||||||||||||
| Managed portfolios | 38,959 | 34,252 | 4,707 | 13.7 | 36,414 | ||||||||||||
| Repos | 84,768 | 73,063 | 11,705 | 16.0 | 78,822 | ||||||||||||
| Total funds | 1,309,903 | 1,255,783 | 54,120 | 4.3 | 1,306,942 | ||||||||||||
50 | | January - June 2024 | ||||||
Business model | |||||||||||||||||||||||||||||
| Group financial information | |||||||||||||||||||||||||||||
Eligible capital (phased-in) 1. Consolidated | |||||||||||||||||
| EUR million | |||||||||||||||||
| Change | |||||||||||||||||
| Jun-24 | Jun-23 | Absolute | % | Dec-23 | |||||||||||||
| Capital stock and reserves | 126,179 | 121,643 | 4,536 | 3.7 | 121,185 | ||||||||||||
| Attributable profit | 6,059 | 5,241 | 818 | 15.6 | 11,076 | ||||||||||||
| Dividends | (1,515) | (1,310) | (204) | 15.6 | (2,769) | ||||||||||||
| Other retained earnings | (37,938) | (31,882) | (6,056) | 19.0 | (34,484) | ||||||||||||
| Minority interests | 7,554 | 6,702 | 852 | 12.7 | 6,899 | ||||||||||||
| Goodwill and intangible assets | (16,725) | (17,878) | 1,153 | (6.5) | (17,220) | ||||||||||||
| Other deductions | (5,639) | (4,887) | (753) | 15.4 | (7,946) | ||||||||||||
| Core CET1 | 77,975 | 77,628 | 346 | 0.4 | 76,741 | ||||||||||||
| Preferred shares and other eligible tier 1 | 8,834 | 8,856 | (22) | (0.3) | 9,002 | ||||||||||||
| Tier 1 | 86,809 | 86,485 | 324 | 0.4 | 85,742 | ||||||||||||
| Generic funds and eligible tier 2 instruments | 17,612 | 14,669 | 2,943 | 20.1 | 16,497 | ||||||||||||
| Eligible capital | 104,420 | 101,154 | 3,267 | 3.2 | 102,240 | ||||||||||||
| Risk-weighted assets | 624,831 | 631,149 | (6,318) | (1.0) | 623,731 | ||||||||||||
| CET1 capital ratio | 12.5 | 12.3 | 0.2 | 12.3 | |||||||||||||
| Tier 1 capital ratio | 13.9 | 13.7 | 0.2 | 13.7 | |||||||||||||
| Total capital ratio | 16.7 | 16.0 | 0.7 | 16.4 | |||||||||||||
1. The phased-in ratio includes the transitory treatment of IFRS 9, calculated in accordance with article 473 bis of the Capital Requirements Regulation (CRR2) and subsequent modifications introduced by Regulation 2020/873 of the European Union. Total phased-in capital ratios include the transitory treatment according to chapter 4, title 1, part 10 of the CRR2.
January - June 2024 | | 51 | ||||||
Business model | |||||||||||||||||||||||||||||
| Segments information | |||||||||||||||||||||||||||||
| RETAIL & COMMERCIAL BANKING | |||||||||||||||||||||||
| EUR million | |||||||||||||||||||||||
| / | Q1'24 | / | H1'23 | ||||||||||||||||||||
| Underlying income statement | Q2'24 | % | % excl. FX | H1'24 | % | % excl. FX | |||||||||||||||||
| Net interest income | 6,870 | (3.8) | (3.0) | 14,015 | 13.0 | 11.6 | |||||||||||||||||
| Net fee income | 1,173 | (1.6) | (0.4) | 2,366 | 3.5 | 3.1 | |||||||||||||||||
Gains (losses) on financial transactions 1 | 263 | 60.1 | 59.2 | 427 | 82.2 | 89.2 | |||||||||||||||||
| Other operating income | (80) | (82.3) | (82.2) | (533) | 0.9 | (0.1) | |||||||||||||||||
| Total income | 8,226 | 2.2 | 3.2 | 16,274 | 13.1 | 11.9 | |||||||||||||||||
| Administrative expenses and amortizations | (3,119) | (5.6) | (4.8) | (6,423) | 0.8 | 0.1 | |||||||||||||||||
| Net operating income | 5,107 | 7.7 | 8.7 | 9,851 | 22.9 | 21.2 | |||||||||||||||||
| Net loan-loss provisions | (1,564) | 2.7 | 4.6 | (3,087) | (0.8) | (1.3) | |||||||||||||||||
| Other gains (losses) and provisions | (733) | (13.2) | (12.5) | (1,577) | 24.4 | 22.9 | |||||||||||||||||
| Profit before tax | 2,810 | 18.3 | 18.8 | 5,187 | 42.6 | 39.5 | |||||||||||||||||
| Tax on profit | (865) | 11.0 | 11.7 | (1,645) | 60.7 | 55.8 | |||||||||||||||||
| Profit from continuing operations | 1,945 | 21.8 | 22.2 | 3,542 | 35.4 | 33.1 | |||||||||||||||||
| Net profit from discontinued operations | — | — | — | — | — | — | |||||||||||||||||
| Consolidated profit | 1,945 | 21.8 | 22.2 | 3,542 | 35.4 | 33.1 | |||||||||||||||||
| Non-controlling interests | (122) | 28.7 | 28.8 | (216) | 11.4 | 10.7 | |||||||||||||||||
| Profit attributable to the parent | 1,824 | 21.4 | 21.8 | 3,326 | 37.4 | 34.9 | |||||||||||||||||
| Note: in Q1 2024, some adjustments to the quarterly series related to the revenue sharing criteria between CIB and Retail & Commercial Banking were incorporated into the quarterly series to better reflect the business dynamics of our new operating model with five global businesses as new primary segments. These adjustments did not affect the Group’s results, nor did they affect the annual results of Retail & Commercial Banking and CIB. | |||||||||||||||||||||||
| Balance sheet and activity metrics | |||||||||||||||||||||||
| Loans and advances to customers | 622,705 | 0.0 | 0.0 | 622,705 | (1.6) | (0.2) | |||||||||||||||||
| Customer deposits | 645,145 | (1.8) | (0.8) | 645,145 | (1.3) | (0.1) | |||||||||||||||||
| Memorandum items: | |||||||||||||||||||||||
| Gross loans and advances to customers ² | 618,938 | (0.3) | 0.5 | 618,938 | (2.3) | (0.8) | |||||||||||||||||
| Customer funds | 729,175 | (0.4) | 0.8 | 729,175 | 2.3 | 3.7 | |||||||||||||||||
| Customer deposits ³ | 637,306 | (0.8) | 0.2 | 637,306 | 0.4 | 1.5 | |||||||||||||||||
| Mutual funds | 91,868 | 2.8 | 5.6 | 91,868 | 17.5 | 22.5 | |||||||||||||||||
| Risk-weighted assets | 292,885 | (2.4) | 292,885 | (5.6) | |||||||||||||||||||
| Note: in Q1 2024, adjustments to some of the 2023 business volumes metrics in Retail & Commercial Banking, Digital Consumer Bank, CIB and Wealth Management & Insurance were incorporated into the quarterly series to better reflect the perimeters of our five global businesses in accordance with our new operating model. These adjustments did not affect the Group’s business volumes metrics. | |||||||||||||||||||||||
| Ratios (%) and customers | |||||||||||||||||||||||
| RoTE ⁴ | 19.2 | 3.6 | 17.4 | 4.1 | |||||||||||||||||||
| Efficiency ratio | 37.9 | (3.1) | 39.5 | (4.8) | |||||||||||||||||||
| NPL ratio | 3.15 | (0.09) | 3.15 | (0.07) | |||||||||||||||||||
| NPL coverage ratio | 60.4 | 0.3 | 60.4 | (2.8) | |||||||||||||||||||
| Number of total customers (thousands) | 142,913 | 1.8 | 142,913 | 3.6 | |||||||||||||||||||
| Number of active customers (thousands) | 77,176 | 1.5 | 77,176 | 2.6 | |||||||||||||||||||
| 1. Includes exchange differences. | ||
| 2. Excluding reverse repos. | ||
| 3. Excluding repos. | ||
| 4. Allocated according to RWA consumption. | ||
52 | | January - June 2024 | ||||||
Business model | |||||||||||||||||||||||||||||
| Segments information | |||||||||||||||||||||||||||||
| DIGITAL CONSUMER BANK | |||||||||||||||||||||||
| EUR million | |||||||||||||||||||||||
| / | Q1'24 | / | H1'23 | ||||||||||||||||||||
| Underlying income statement | Q2'24 | % | % excl. FX | H1'24 | % | % excl. FX | |||||||||||||||||
| Net interest income | 2,655 | (2.0) | (1.9) | 5,364 | 6.8 | 6.7 | |||||||||||||||||
| Net fee income | 387 | 9.2 | 9.7 | 742 | 27.1 | 26.8 | |||||||||||||||||
Gains (losses) on financial transactions 1 | 9 | 25.0 | 25.3 | 16 | (70.9) | (71.0) | |||||||||||||||||
| Other operating income | 213 | 88.4 | 87.4 | 326 | (10.1) | (10.3) | |||||||||||||||||
| Total income | 3,264 | 2.5 | 2.6 | 6,449 | 7.0 | 6.9 | |||||||||||||||||
| Administrative expenses and amortizations | (1,307) | (0.3) | (0.5) | (2,618) | 0.4 | 0.3 | |||||||||||||||||
| Net operating income | 1,957 | 4.5 | 4.8 | 3,831 | 12.1 | 12.0 | |||||||||||||||||
| Net loan-loss provisions | (1,055) | (7.2) | (7.0) | (2,193) | 21.6 | 21.4 | |||||||||||||||||
| Other gains (losses) and provisions | (180) | 52.5 | 52.9 | (298) | 168.3 | 164.4 | |||||||||||||||||
| Profit before tax | 722 | 16.7 | 17.1 | 1,341 | (10.8) | (10.7) | |||||||||||||||||
| Tax on profit | (54) | (34.0) | (32.7) | (136) | (51.8) | (51.7) | |||||||||||||||||
| Profit from continuing operations | 668 | 24.5 | 24.7 | 1,205 | (1.4) | (1.3) | |||||||||||||||||
| Net profit from discontinued operations | — | — | — | — | — | — | |||||||||||||||||
| Consolidated profit | 668 | 24.5 | 24.7 | 1,205 | (1.4) | (1.3) | |||||||||||||||||
| Non-controlling interests | (62) | (14.4) | (14.3) | (135) | (30.6) | (30.6) | |||||||||||||||||
| Profit attributable to the parent | 606 | 30.6 | 30.8 | 1,070 | 4.2 | 4.3 | |||||||||||||||||
| Balance sheet and activity metrics | |||||||||||||||||||||||
| Loans and advances to customers | 205,442 | 2.8 | 2.9 | 205,442 | 6.5 | 6.4 | |||||||||||||||||
| Customer deposits | 122,053 | 2.9 | 2.4 | 122,053 | 14.8 | 13.6 | |||||||||||||||||
| Memorandum items: | |||||||||||||||||||||||
| Gross loans and advances to customers ² | 213,211 | 2.7 | 2.9 | 213,211 | 6.5 | 6.5 | |||||||||||||||||
| Customer funds | 129,509 | 3.0 | 2.5 | 129,509 | 15.6 | 14.5 | |||||||||||||||||
| Customer deposits ³ | 122,014 | 2.9 | 2.4 | 122,014 | 15.6 | 14.4 | |||||||||||||||||
| Mutual funds | 7,495 | 5.4 | 5.0 | 7,495 | 16.2 | 15.2 | |||||||||||||||||
| Risk-weighted assets | 156,560 | (0.2) | 156,560 | 0.9 | |||||||||||||||||||
| Note: in Q1 2024, adjustments to some of the 2023 business volumes metrics in Retail & Commercial Banking, Digital Consumer Bank, CIB and Wealth Management & Insurance were incorporated into the quarterly series to better reflect the perimeters of our five global businesses in accordance with our new operating model. These adjustments did not affect the Group’s business volumes metrics. | |||||||||||||||||||||||
| Ratios (%) and customers | |||||||||||||||||||||||
| RoTE ⁴ | 14.3 | 3.1 | 12.8 | 0.3 | |||||||||||||||||||
| Efficiency ratio | 40.0 | (1.1) | 40.6 | (2.7) | |||||||||||||||||||
| NPL ratio | 4.81 | (0.05) | 4.81 | 0.63 | |||||||||||||||||||
| NPL coverage ratio | 75.9 | (0.2) | 75.9 | (12.0) | |||||||||||||||||||
| Number of total customers (thousands) | 24,989 | (0.2) | 24,989 | 0.2 | |||||||||||||||||||
| 1. Includes exchange differences. | ||
| 2. Excluding reverse repos. | ||
| 3. Excluding repos. | ||
| 4. Allocated according to RWA consumption. | ||
January - June 2024 | | 53 | ||||||
Business model | |||||||||||||||||||||||||||||
| Segments information | |||||||||||||||||||||||||||||
| CORPORATE & INVESTMENT BANKING | |||||||||||||||||||||||
| EUR million | |||||||||||||||||||||||
| / | Q1'24 | / | H1'23 | ||||||||||||||||||||
| Underlying income statement | Q2'24 | % | % excl. FX | H1'24 | % | % excl. FX | |||||||||||||||||
| Net interest income | 969 | (8.7) | (7.9) | 2,031 | 21.6 | 22.0 | |||||||||||||||||
| Net fee income | 626 | (4.3) | (4.0) | 1,280 | 12.0 | 11.6 | |||||||||||||||||
Gains (losses) on financial transactions 1 | 136 | (76.2) | (76.2) | 706 | (37.5) | (37.2) | |||||||||||||||||
| Other operating income | 345 | — | — | 171 | — | — | |||||||||||||||||
| Total income | 2,076 | (1.7) | (1.2) | 4,188 | 5.9 | 6.0 | |||||||||||||||||
| Administrative expenses and amortizations | (930) | 4.7 | 4.8 | (1,817) | 20.2 | 19.7 | |||||||||||||||||
| Net operating income | 1,146 | (6.4) | (5.6) | 2,371 | (3.0) | (2.5) | |||||||||||||||||
| Net loan-loss provisions | (56) | 38.3 | 39.4 | (96) | — | — | |||||||||||||||||
| Other gains (losses) and provisions | (46) | (40.8) | (40.8) | (124) | (5.5) | (6.4) | |||||||||||||||||
| Profit before tax | 1,044 | (5.6) | (4.8) | 2,151 | (6.7) | (6.1) | |||||||||||||||||
| Tax on profit | (298) | (14.1) | (13.0) | (644) | (7.8) | (7.2) | |||||||||||||||||
| Profit from continuing operations | 746 | (1.8) | (1.0) | 1,506 | (6.2) | (5.7) | |||||||||||||||||
| Net profit from discontinued operations | — | — | — | — | — | — | |||||||||||||||||
| Consolidated profit | 746 | (1.8) | (1.0) | 1,506 | (6.2) | (5.7) | |||||||||||||||||
| Non-controlling interests | (47) | (14.9) | (14.2) | (101) | (21.5) | (18.1) | |||||||||||||||||
| Profit attributable to the parent | 700 | (0.8) | — | 1,405 | (4.9) | (4.6) | |||||||||||||||||
Note: in Q1 2024, some adjustments to the quarterly series related to the revenue sharing criteria between CIB and Retail & Commercial Banking were incorporated into the quarterly series to better reflect the business dynamics of our new operating model with five global businesses as new primary segments. These adjustments did not affect the Group’s results, nor did they affect the annual results of Retail & Commercial Banking and CIB. | |||||||||||||||||||||||
| Balance sheet and activity metrics | |||||||||||||||||||||||
| Loans and advances to customers | 187,977 | 6.7 | 7.6 | 187,977 | 10.9 | 12.0 | |||||||||||||||||
| Customer deposits | 206,347 | (0.3) | 1.6 | 206,347 | 6.4 | 8.6 | |||||||||||||||||
| Memorandum items: | |||||||||||||||||||||||
| Gross loans and advances to customers ² | 143,829 | 3.3 | 4.5 | 143,829 | 5.0 | 6.6 | |||||||||||||||||
| Customer funds | 144,201 | (8.7) | (6.6) | 144,201 | (6.0) | (2.8) | |||||||||||||||||
| Customer deposits ³ | 130,473 | (8.8) | (7.3) | 130,473 | (8.1) | (5.6) | |||||||||||||||||
| Mutual funds | 13,727 | (7.7) | 0.3 | 13,727 | 20.9 | 34.4 | |||||||||||||||||
| Risk-weighted assets | 122,086 | 1.7 | 122,086 | 6.1 | |||||||||||||||||||
Note: in Q1 2024, adjustments to some of the 2023 business volumes metrics in Retail & Commercial Banking, Digital Consumer Bank, CIB and Wealth Management & Insurance were incorporated into the quarterly series to better reflect the perimeters of our five global businesses in accordance with our new operating model. These adjustments did not affect the Group’s business volumes metrics. | |||||||||||||||||||||||
| Ratios (%) | |||||||||||||||||||||||
| RoTE ⁴ | 18.7 | (0.5) | 19.0 | (2.3) | |||||||||||||||||||
| Efficiency ratio | 44.8 | 2.8 | 43.4 | 5.2 | |||||||||||||||||||
| NPL ratio | 1.05 | (0.09) | 1.05 | (0.33) | |||||||||||||||||||
| NPL coverage ratio | 45.0 | (1.3) | 45.0 | 8.2 | |||||||||||||||||||
| 1. Includes exchange differences. | ||
| 2. Excluding reverse repos. | ||
| 3. Excluding repos. | ||
| 4. Allocated according to RWA consumption. | ||
54 | | January - June 2024 | ||||||
Business model | |||||||||||||||||||||||||||||
| Segments information | |||||||||||||||||||||||||||||
| WEALTH MANAGEMENT & INSURANCE | |||||||||||||||||||||||
| EUR million | |||||||||||||||||||||||
| / | Q1'24 | / | H1'23 | ||||||||||||||||||||
| Underlying income statement | Q2'24 | % | % excl. FX | H1'24 | % | % excl. FX | |||||||||||||||||
| Net interest income | 404 | (4.4) | (4.4) | 827 | 13.8 | 13.4 | |||||||||||||||||
| Net fee income | 355 | (2.6) | (2.6) | 719 | 14.9 | 14.6 | |||||||||||||||||
Gains (losses) on financial transactions 1 | 46 | 11.3 | 11.6 | 88 | 11.6 | 11.1 | |||||||||||||||||
| Other operating income | 92 | 45.0 | 46.9 | 156 | (1.7) | (2.2) | |||||||||||||||||
| Total income | 897 | 0.6 | 0.7 | 1,789 | 12.6 | 12.2 | |||||||||||||||||
| Administrative expenses and amortizations | (309) | 0.9 | 1.0 | (615) | 5.5 | 5.2 | |||||||||||||||||
| Net operating income | 588 | 0.4 | 0.6 | 1,173 | 16.7 | 16.2 | |||||||||||||||||
| Net loan-loss provisions | (10) | 147.5 | 147.9 | (14) | — | — | |||||||||||||||||
| Other gains (losses) and provisions | (5) | (78.4) | (78.4) | (30) | (15.6) | (15.9) | |||||||||||||||||
| Profit before tax | 573 | 2.9 | 3.1 | 1,130 | 14.7 | 14.2 | |||||||||||||||||
| Tax on profit | (136) | (0.4) | (0.3) | (273) | 16.3 | 16.2 | |||||||||||||||||
| Profit from continuing operations | 436 | 3.9 | 4.1 | 856 | 14.2 | 13.6 | |||||||||||||||||
| Net profit from discontinued operations | — | — | — | — | — | — | |||||||||||||||||
| Consolidated profit | 436 | 3.9 | 4.1 | 856 | 14.2 | 13.6 | |||||||||||||||||
| Non-controlling interests | (19) | (2.3) | (2.2) | (39) | (0.7) | 0.5 | |||||||||||||||||
| Profit attributable to the parent | 417 | 4.2 | 4.5 | 818 | 15.0 | 14.3 | |||||||||||||||||
| Balance sheet and activity metrics | |||||||||||||||||||||||
| Loans and advances to customers | 22,958 | 0.6 | 1.0 | 22,958 | 2.2 | 2.7 | |||||||||||||||||
| Customer deposits | 61,378 | 2.9 | 3.2 | 61,378 | 5.8 | 6.3 | |||||||||||||||||
| Memorandum items: | |||||||||||||||||||||||
| Gross loans and advances to customers ² | 23,073 | 0.7 | 1.1 | 23,073 | 2.3 | 2.7 | |||||||||||||||||
| Customer funds | 165,613 | (0.1) | 1.4 | 165,613 | 7.5 | 9.7 | |||||||||||||||||
| Customer deposits ³ | 60,496 | 2.8 | 3.0 | 60,496 | 6.9 | 7.3 | |||||||||||||||||
| Mutual funds | 105,117 | (1.7) | 0.5 | 105,117 | 7.9 | 11.1 | |||||||||||||||||
| Risk-weighted assets | 10,730 | (33.2) | 10,730 | (35.8) | |||||||||||||||||||
| Assets under management | 479,720 | (0.6) | 1.6 | 479,720 | 9.5 | 12.8 | |||||||||||||||||
| Gross written premiums | 3,190 | 7.8 | 5.1 | 6,150 | (0.5) | (1.0) | |||||||||||||||||
| Note: in Q1 2024, adjustments to some of the 2023 business volumes metrics in Retail & Commercial Banking, Digital Consumer Bank, CIB and Wealth Management & Insurance were incorporated into the quarterly series to better reflect the perimeters of our five global businesses in accordance with our new operating model. These adjustments did not affect the Group’s business volumes metrics. | |||||||||||||||||||||||
| Ratios (%) and customers | |||||||||||||||||||||||
| RoTE ⁴ | 81.4 | 4.1 | 79.3 | 3.4 | |||||||||||||||||||
| Efficiency ratio | 34.5 | 0.1 | 34.4 | (2.3) | |||||||||||||||||||
| NPL ratio | 0.77 | 0.14 | 0.77 | (0.05) | |||||||||||||||||||
| NPL coverage ratio | 64.6 | 3.0 | 64.6 | 11.4 | |||||||||||||||||||
| Number of Private Banking customers (thousands) | 283 | 2.3 | 283 | 12.5 | |||||||||||||||||||
| 1. Includes exchange differences. | ||
| 2. Excluding reverse repos. | ||
| 3. Excluding repos. | ||
| 4. Allocated according to RWA consumption. | ||
January - June 2024 | | 55 | ||||||
Business model | |||||||||||||||||||||||||||||
| Segments information | |||||||||||||||||||||||||||||
| PAYMENTS | |||||||||||||||||||||||
| EUR million | |||||||||||||||||||||||
| / | Q1'24 | / | H1'23 | ||||||||||||||||||||
| Underlying income statement | Q2'24 | % | % excl. FX | H1'24 | % | % excl. FX | |||||||||||||||||
| Net interest income | 645 | (4.5) | (2.6) | 1,320 | 10.6 | 9.5 | |||||||||||||||||
| Net fee income | 695 | 2.7 | 4.4 | 1,371 | (6.9) | (7.3) | |||||||||||||||||
Gains (losses) on financial transactions 1 | 3 | 194.4 | 171.7 | 4 | — | — | |||||||||||||||||
| Other operating income | 4 | 468.5 | 429.2 | 5 | — | — | |||||||||||||||||
| Total income | 1,347 | (0.4) | 1.3 | 2,701 | 3.4 | 2.7 | |||||||||||||||||
| Administrative expenses and amortizations | (615) | (5.4) | (4.6) | (1,266) | 4.4 | 3.6 | |||||||||||||||||
| Net operating income | 732 | 4.1 | 6.8 | 1,435 | 2.5 | 1.9 | |||||||||||||||||
| Net loan-loss provisions | (434) | 3.7 | 6.0 | (852) | (1.8) | (2.8) | |||||||||||||||||
| Other gains (losses) and provisions | (257) | — | — | (277) | 694.2 | 685.5 | |||||||||||||||||
| Profit before tax | 41 | (84.4) | (82.5) | 306 | (38.5) | (38.2) | |||||||||||||||||
| Tax on profit | (110) | 3.5 | 6.9 | (215) | (8.9) | (8.7) | |||||||||||||||||
| Profit from continuing operations | (68) | — | — | 91 | (65.2) | (65.0) | |||||||||||||||||
| Net profit from discontinued operations | — | — | — | — | — | — | |||||||||||||||||
| Consolidated profit | (68) | — | — | 91 | (65.2) | (65.0) | |||||||||||||||||
| Non-controlling interests | (20) | (5.7) | (4.5) | (42) | 10.7 | 16.8 | |||||||||||||||||
| Profit attributable to the parent | (89) | — | — | 49 | (78.1) | (78.2) | |||||||||||||||||
| Balance sheet and activity metrics | |||||||||||||||||||||||
| Loans and advances to customers | 20,884 | (6.5) | (1.3) | 20,884 | (3.4) | 3.5 | |||||||||||||||||
| Customer deposits | 994 | 25.8 | 25.8 | 994 | 65.7 | 65.7 | |||||||||||||||||
| Memorandum items: | |||||||||||||||||||||||
| Gross loans and advances to customers ² | 22,569 | (6.0) | (0.7) | 22,569 | (3.2) | 3.7 | |||||||||||||||||
| Customer funds | 994 | 25.8 | 25.8 | 994 | 65.7 | 65.7 | |||||||||||||||||
| Customer deposits ³ | 994 | 25.8 | 25.8 | 994 | 65.7 | 65.7 | |||||||||||||||||
| Mutual funds | — | — | — | — | — | — | |||||||||||||||||
| Risk-weighted assets | 18,918 | (8.9) | 18,918 | (4.9) | |||||||||||||||||||
| Ratios (%) | |||||||||||||||||||||||
| RoTE ⁴ | (14.5) | (35.3) | 3.8 | (14.0) | |||||||||||||||||||
| NPL ratio | 5.00 | 0.15 | 5.00 | (0.13) | |||||||||||||||||||
| NPL coverage ratio | 149.5 | 4.6 | 149.5 | 7.4 | |||||||||||||||||||
| 1. Includes exchange differences. | ||
| 2. Excluding reverse repos. | ||
| 3. Excluding repos. | ||
| 4. Allocated according to RWA consumption. | ||
56 | | January - June 2024 | ||||||
Business model | |||||||||||||||||||||||||||||
| Segments information | |||||||||||||||||||||||||||||
| PagoNxt | |||||||||||||||||||||||
| EUR million | |||||||||||||||||||||||
| / | Q1'24 | / | H1'23 | ||||||||||||||||||||
| Underlying income statement | Q2'24 | % | % excl. FX | H1'24 | % | % excl. FX | |||||||||||||||||
| Net interest income | 31 | 2.0 | 5.5 | 62 | 97.7 | 96.8 | |||||||||||||||||
| Net fee income | 233 | 4.0 | 5.8 | 456 | 2.2 | 2.0 | |||||||||||||||||
Gains (losses) on financial transactions 1 | 2 | — | — | — | — | — | |||||||||||||||||
| Other operating income | 34 | 11.9 | 11.9 | 64 | 18.0 | 17.2 | |||||||||||||||||
| Total income | 300 | 5.9 | 7.7 | 583 | 12.0 | 11.7 | |||||||||||||||||
| Administrative expenses and amortizations | (297) | (2.6) | (1.7) | (601) | 5.0 | 4.9 | |||||||||||||||||
| Net operating income | 4 | — | — | (18) | (65.9) | (65.1) | |||||||||||||||||
| Net loan-loss provisions | (5) | 36.4 | 41.0 | (9) | (26.1) | (26.1) | |||||||||||||||||
| Other gains (losses) and provisions | (256) | — | — | (259) | — | — | |||||||||||||||||
| Profit before tax | (258) | 841.8 | 807.6 | (286) | 273.3 | 279.5 | |||||||||||||||||
| Tax on profit | (6) | (34.5) | (28.7) | (16) | (43.4) | (44.3) | |||||||||||||||||
| Profit from continuing operations | (265) | 613.2 | 600.2 | (302) | 187.9 | 190.1 | |||||||||||||||||
| Net profit from discontinued operations | — | — | — | — | — | — | |||||||||||||||||
| Consolidated profit | (265) | 613.2 | 600.2 | (302) | 187.9 | 190.1 | |||||||||||||||||
| Non-controlling interests | — | (78.5) | (79.1) | (3) | — | — | |||||||||||||||||
| Profit attributable to the parent | (265) | 573.4 | 561.6 | (304) | 195.8 | 198.5 | |||||||||||||||||
| Balance sheet and activity metrics | |||||||||||||||||||||||
| Loans and advances to customers | 733 | (48.2) | (43.7) | 733 | (14.7) | (7.4) | |||||||||||||||||
| Customer deposits | 994 | 25.8 | 25.8 | 994 | 65.7 | 65.7 | |||||||||||||||||
| Memorandum items: | |||||||||||||||||||||||
| Gross loans and advances to customers ² | 755 | (47.7) | (43.2) | 755 | (15.5) | (8.5) | |||||||||||||||||
| Customer funds | 994 | 25.8 | 25.8 | 994 | 65.7 | 65.7 | |||||||||||||||||
| Customer deposits ³ | 994 | 25.8 | 25.8 | 994 | 65.7 | 65.7 | |||||||||||||||||
| Mutual funds | — | — | — | — | — | — | |||||||||||||||||
| Risk-weighted assets | 4,279 | (16.2) | 4,279 | 0.2 | |||||||||||||||||||
| Total transactions (Getnet, million) | 2,346 | (2.8) | 4,759 | 7.2 | |||||||||||||||||||
| Total payments volume (Getnet) | 53,905 | 0.3 | 2.2 | 107,647 | 12.8 | 12.2 | |||||||||||||||||
| Ratios (%) | |||||||||||||||||||||||
| EBITDA margin | 23.0 | 5.9 | 20.1 | 8.9 | |||||||||||||||||||
| Efficiency ratio | 98.8 | -8.6 | 103.0 | (6.9) | |||||||||||||||||||
| 1. Includes exchange differences. | ||
| 2. Excluding reverse repos. | ||
| 3. Excluding repos. | ||
January - June 2024 | | 57 | ||||||
Business model | |||||||||||||||||||||||||||||
| Segments information | |||||||||||||||||||||||||||||
| Cards | |||||||||||||||||||||||
| EUR million | |||||||||||||||||||||||
| / | Q1'24 | / | H1'23 | ||||||||||||||||||||
| Underlying income statement | Q2'24 | % | % excl. FX | H1'24 | % | % excl. FX | |||||||||||||||||
| Net interest income | 613 | (4.8) | (3.0) | 1,258 | 8.2 | 7.2 | |||||||||||||||||
| Net fee income | 462 | 2.1 | 3.7 | 915 | (10.8) | (11.3) | |||||||||||||||||
Gains (losses) on financial transactions 1 | 1 | (55.6) | (59.6) | 4 | (16.6) | (2.8) | |||||||||||||||||
| Other operating income | (30) | (0.3) | 0.1 | (59) | (41.3) | (41.4) | |||||||||||||||||
| Total income | 1,047 | (2.1) | (0.4) | 2,117 | 1.2 | 0.5 | |||||||||||||||||
| Administrative expenses and amortizations | (319) | (7.9) | (7.1) | (665) | 3.9 | 2.3 | |||||||||||||||||
| Net operating income | 728 | 0.6 | 2.8 | 1,452 | — | (0.4) | |||||||||||||||||
| Net loan-loss provisions | (428) | 3.4 | 5.6 | (843) | (1.5) | (2.5) | |||||||||||||||||
| Other gains (losses) and provisions | — | (97.7) | (97.4) | (18) | (20.2) | (21.8) | |||||||||||||||||
| Profit before tax | 300 | 2.5 | 4.9 | 592 | 3.1 | 3.7 | |||||||||||||||||
| Tax on profit | (103) | 7.3 | 10.4 | (199) | (4.2) | (3.7) | |||||||||||||||||
| Profit from continuing operations | 196 | 0.2 | 2.2 | 392 | 7.2 | 7.9 | |||||||||||||||||
| Net profit from discontinued operations | — | — | — | — | — | — | |||||||||||||||||
| Consolidated profit | 196 | 0.2 | 2.2 | 392 | 7.2 | 7.9 | |||||||||||||||||
| Non-controlling interests | (20) | 2.9 | 4.3 | (39) | (1.5) | 3.3 | |||||||||||||||||
| Profit attributable to the parent | 176 | (0.1) | 1.9 | 353 | 8.3 | 8.5 | |||||||||||||||||
| Balance sheet and activity metrics | |||||||||||||||||||||||
| Loans and advances to customers | 20,151 | (3.6) | 1.5 | 20,151 | (2.9) | 3.9 | |||||||||||||||||
| Customer deposits | — | — | — | — | — | — | |||||||||||||||||
| Memorandum items: | |||||||||||||||||||||||
| Gross loans and advances to customers ² | 21,814 | (3.4) | 1.9 | 21,814 | (2.7) | 4.2 | |||||||||||||||||
| Customer funds | — | — | — | — | — | — | |||||||||||||||||
| Customer deposits ³ | — | — | — | — | — | — | |||||||||||||||||
| Mutual funds | — | — | — | — | — | — | |||||||||||||||||
| Risk-weighted assets | 14,639 | (6.6) | 14,639 | (6.3) | |||||||||||||||||||
| Number of cards (million) | 99 | 1.5 | 99 | 3.7 | |||||||||||||||||||
| Ratios (%) | |||||||||||||||||||||||
| RoTE ⁴ | 34.5 | (0.9) | 35.0 | 2.1 | |||||||||||||||||||
| Efficiency ratio | 30.4 | (1.9) | 31.4 | 0.8 | |||||||||||||||||||
| NPL ratio | 5.03 | 0.05 | 5.03 | (0.14) | |||||||||||||||||||
| NPL coverage ratio | 151.7 | 4.2 | 151.7 | 8.1 | |||||||||||||||||||
| 1. Includes exchange differences. | ||
| 2. Excluding reverse repos. | ||
| 3. Excluding repos. | ||
| 4. Allocated according to RWA consumption. | ||
58 | | January - June 2024 | ||||||
Business model | |||||||||||||||||||||||||||||
| Segments information | |||||||||||||||||||||||||||||
| CORPORATE CENTRE | |||||||||||||||||||||||
| EUR million | |||||||||||||||||||||||
| / | Q1'24 | / | H1'23 | ||||||||||||||||||||
| Underlying income statement | Q2'24 | Q1'24 | % | H1'24 | H1'23 | % | |||||||||||||||||
| Net interest income | (69) | (31) | 123.1 | (100) | (94) | 6.4 | |||||||||||||||||
| Net fee income | 2 | (1) | — | 1 | (7) | — | |||||||||||||||||
Gains (losses) on financial transactions 1 | (122) | (162) | (24.4) | (284) | (189) | 50.3 | |||||||||||||||||
| Other operating income | 49 | (16) | — | 33 | (52) | — | |||||||||||||||||
| Total income | (140) | (210) | (33.1) | (350) | (342) | 2.5 | |||||||||||||||||
| Administrative expenses and amortizations | (86) | (87) | (1.3) | (174) | (189) | (8.1) | |||||||||||||||||
| Net operating income | (227) | (297) | (23.7) | (524) | (531) | (1.3) | |||||||||||||||||
| Net loan-loss provisions | 0 | (2) | (96.8) | (2) | 4 | — | |||||||||||||||||
| Other gains (losses) and provisions | (40) | (41) | (2.7) | (80) | (74) | 8.7 | |||||||||||||||||
| Profit before tax | (266) | (340) | (21.6) | (606) | (601) | 0.8 | |||||||||||||||||
| Tax on profit | 15 | (18) | — | (3) | (19) | (85.2) | |||||||||||||||||
| Profit from continuing operations | (252) | (357) | (29.6) | (609) | (620) | (1.7) | |||||||||||||||||
| Net profit from discontinued operations | — | — | — | — | — | — | |||||||||||||||||
| Consolidated profit | (252) | (357) | (29.6) | (609) | (620) | (1.7) | |||||||||||||||||
| Non-controlling interests | — | — | — | — | — | — | |||||||||||||||||
| Profit attributable to the parent | (252) | (357) | (29.6) | (609) | (620) | (1.7) | |||||||||||||||||
| Balance sheet | |||||||||||||||||||||||
| Loans and advances to customers | 5,629 | 5,580 | 0.9 | 5,629 | 5,583 | 0.8 | |||||||||||||||||
| Cash, central banks and credit institutions | 96,925 | 100,663 | (3.7) | 96,925 | 107,118 | (9.5) | |||||||||||||||||
| Debt instruments | 9,622 | 8,388 | 14.7 | 9,622 | 7,827 | 22.9 | |||||||||||||||||
| Other financial assets | 934 | 820 | 13.9 | 934 | 1,003 | (6.9) | |||||||||||||||||
| Other asset accounts | 124,659 | 130,691 | (4.6) | 124,659 | 127,867 | (2.5) | |||||||||||||||||
| Total assets | 237,769 | 246,142 | (3.4) | 237,769 | 249,398 | (4.7) | |||||||||||||||||
| Customer deposits | 1,729 | 1,428 | 21.1 | 1,729 | 1,181 | 46.4 | |||||||||||||||||
| Central banks and credit institutions | 21,463 | 21,970 | (2.3) | 21,463 | 45,181 | (52.5) | |||||||||||||||||
| Marketable debt securities | 110,786 | 115,063 | (3.7) | 110,786 | 100,538 | 10.2 | |||||||||||||||||
| Other financial liabilities | 1,748 | 1,774 | (1.5) | 1,748 | 1,284 | 36.1 | |||||||||||||||||
| Other liabilities accounts | 7,762 | 8,001 | (3.0) | 7,762 | 8,042 | (3.5) | |||||||||||||||||
| Total liabilities | 143,488 | 148,236 | (3.2) | 143,488 | 156,226 | (8.2) | |||||||||||||||||
| Total equity | 94,281 | 97,907 | (3.7) | 94,281 | 93,172 | 1.2 | |||||||||||||||||
| Memorandum items: | |||||||||||||||||||||||
Gross loans and advances to customers 2 | 5,726 | 5,651 | 1.3 | 5,726 | 5,623 | 1.8 | |||||||||||||||||
| Customer funds | 1,594 | 1,428 | 11.7 | 1,594 | 1,181 | 35.0 | |||||||||||||||||
Customer deposits 3 | 1,594 | 1,428 | 11.7 | 1,594 | 1,181 | 35.0 | |||||||||||||||||
| Mutual funds | — | — | — | — | — | — | |||||||||||||||||
| Resources | |||||||||||||||||||||||
| Number of employees | 1,861 | 1,877 | (0.9) | 1,861 | 1,896 | (1.8) | |||||||||||||||||
1. Includes exchange differences.
2. Excluding reverse repos.
3. Excluding repos.
January - June 2024 | | 59 | ||||||
Business model | |||||||||||||||||||||||||||||
| Segments information | |||||||||||||||||||||||||||||
| EUROPE | |||||||||||||||||||||||
| EUR million | |||||||||||||||||||||||
| / | Q1'24 | / | H1'23 | ||||||||||||||||||||
| Underlying income statement | Q2'24 | % | % excl. FX | H1'24 | % | % excl. FX | |||||||||||||||||
| Net interest income | 4,165 | 1.0 | 0.8 | 8,288 | 9.6 | 7.4 | |||||||||||||||||
| Net fee income | 1,167 | (2.9) | (3.1) | 2,368 | 5.5 | 4.4 | |||||||||||||||||
Gains (losses) on financial transactions 1 | 201 | (51.0) | (51.0) | 612 | 28.2 | 27.6 | |||||||||||||||||
| Other operating income | 377 | 411.8 | 412.8 | 450 | 153.7 | 155.6 | |||||||||||||||||
| Total income | 5,910 | 1.7 | 1.5 | 11,718 | 12.0 | 10.1 | |||||||||||||||||
| Administrative expenses and amortizations | (2,297) | (0.3) | (0.5) | (4,602) | 5.0 | 3.5 | |||||||||||||||||
| Net operating income | 3,612 | 3.1 | 2.9 | 7,116 | 17.0 | 14.9 | |||||||||||||||||
| Net loan-loss provisions | (532) | 9.9 | 9.6 | (1,017) | (21.1) | (22.7) | |||||||||||||||||
| Other gains (losses) and provisions | (535) | (8.1) | (8.2) | (1,116) | 23.4 | 21.8 | |||||||||||||||||
| Profit before tax | 2,545 | 4.4 | 4.2 | 4,983 | 28.2 | 25.8 | |||||||||||||||||
| Tax on profit | (814) | 2.2 | 2.1 | (1,610) | 35.2 | 32.9 | |||||||||||||||||
| Profit from continuing operations | 1,731 | 5.5 | 5.2 | 3,373 | 25.1 | 22.6 | |||||||||||||||||
| Net profit from discontinued operations | — | — | — | — | — | — | |||||||||||||||||
| Consolidated profit | 1,731 | 5.5 | 5.2 | 3,373 | 25.1 | 22.6 | |||||||||||||||||
| Non-controlling interests | (85) | (16.0) | (16.7) | (186) | 15.5 | 7.8 | |||||||||||||||||
| Profit attributable to the parent | 1,647 | 6.9 | 6.7 | 3,187 | 25.7 | 23.6 | |||||||||||||||||
| Balance sheet | |||||||||||||||||||||||
| Loans and advances to customers | 591,207 | 1.9 | 1.5 | 591,207 | 1.5 | 0.8 | |||||||||||||||||
| Cash, central banks and credit institutions | 151,044 | (5.7) | (6.0) | 151,044 | (22.8) | (23.2) | |||||||||||||||||
| Debt instruments | 127,655 | 1.3 | 1.2 | 127,655 | 31.7 | 31.0 | |||||||||||||||||
| Other financial assets | 50,804 | (6.2) | (6.2) | 50,804 | (0.8) | (0.9) | |||||||||||||||||
| Other asset accounts | 26,364 | (3.0) | (3.2) | 26,364 | 4.8 | 4.3 | |||||||||||||||||
| Total assets | 947,074 | (0.1) | (0.4) | 947,074 | (0.4) | (1.0) | |||||||||||||||||
| Customer deposits | 638,256 | (0.9) | (1.2) | 638,256 | 1.4 | 0.7 | |||||||||||||||||
| Central banks and credit institutions | 97,203 | 4.3 | 3.9 | 97,203 | (16.1) | (16.7) | |||||||||||||||||
| Marketable debt securities | 80,054 | 0.4 | — | 80,054 | 6.0 | 5.3 | |||||||||||||||||
| Other financial liabilities | 60,853 | 4.5 | 4.4 | 60,853 | 2.4 | 2.2 | |||||||||||||||||
| Other liabilities accounts | 28,635 | (1.0) | (1.0) | 28,635 | (1.6) | (1.8) | |||||||||||||||||
| Total liabilities | 905,000 | 0.1 | (0.2) | 905,000 | (0.5) | (1.1) | |||||||||||||||||
| Total equity | 42,074 | (3.9) | (4.1) | 42,074 | 0.8 | (0.1) | |||||||||||||||||
| Memorandum items: | |||||||||||||||||||||||
Gross loans and advances to customers 2 | 560,623 | 1.4 | 1.1 | 560,623 | (0.6) | (1.3) | |||||||||||||||||
| Customer funds | 726,957 | 0.2 | 0.0 | 726,957 | 3.4 | 2.7 | |||||||||||||||||
Customer deposits 3 | 611,328 | (0.4) | (0.7) | 611,328 | 1.3 | 0.6 | |||||||||||||||||
| Mutual funds | 115,629 | 3.8 | 3.7 | 115,629 | 16.1 | 15.8 | |||||||||||||||||
| Ratios (%), operating means and customers | |||||||||||||||||||||||
| RoTE | 17.1 | 1.3 | 16.4 | 2.9 | |||||||||||||||||||
| Efficiency ratio | 38.9 | (0.8) | 39.3 | (2.6) | |||||||||||||||||||
| NPL ratio | 2.25 | (0.07) | 2.25 | (0.11) | |||||||||||||||||||
| NPL coverage ratio | 49.1 | 0.0 | 49.1 | (1.9) | |||||||||||||||||||
| Number of employees | 67,633 | (0.2) | 67,633 | 1.2 | |||||||||||||||||||
| Number of branches | 3,033 | (1.2) | 3,033 | (2.3) | |||||||||||||||||||
| Number of total customers (thousands) | 46,469 | 0.1 | 46,469 | 1.1 | |||||||||||||||||||
| Number of active customers (thousands) | 28,796 | 0.5 | 28,796 | 1.6 | |||||||||||||||||||
1. Includes exchange differences.
2. Excluding reverse repos.
3. Excluding repos.
60 | | January - June 2024 | ||||||
Business model | |||||||||||||||||||||||||||||
| Segments information | |||||||||||||||||||||||||||||
| Spain | Q | ||||||||||||||||
| EUR million | |||||||||||||||||
| / Q1'24 | / H1'23 | ||||||||||||||||
| Underlying income statement | Q2'24 | % | H1'24 | % | |||||||||||||
| Net interest income | 1,840 | 1.3 | 3,656 | 15.6 | |||||||||||||
| Net fee income | 738 | (1.1) | 1,484 | 5.0 | |||||||||||||
Gains (losses) on financial transactions 1 | 107 | (70.5) | 468 | 40.9 | |||||||||||||
| Other operating income | 364 | 291.1 | 457 | 121.5 | |||||||||||||
| Total income | 3,048 | 1.1 | 6,065 | 18.6 | |||||||||||||
| Administrative expenses and amortizations | (1,033) | 0.1 | (2,065) | 1.3 | |||||||||||||
| Net operating income | 2,015 | 1.6 | 3,999 | 30.1 | |||||||||||||
| Net loan-loss provisions | (327) | (1.2) | (658) | (18.1) | |||||||||||||
| Other gains (losses) and provisions | (244) | (41.6) | (660) | 11.7 | |||||||||||||
| Profit before tax | 1,445 | 16.9 | 2,681 | 59.7 | |||||||||||||
| Tax on profit | (461) | (0.7) | (925) | 69.1 | |||||||||||||
| Profit from continuing operations | 984 | 27.5 | 1,756 | 55.1 | |||||||||||||
| Net profit from discontinued operations | — | — | — | — | |||||||||||||
| Consolidated profit | 984 | 27.5 | 1,756 | 55.1 | |||||||||||||
| Non-controlling interests | 0 | 252.5 | 0 | — | |||||||||||||
| Profit attributable to the parent | 984 | 27.5 | 1,756 | 55.1 | |||||||||||||
| Balance sheet | |||||||||||||||||
| Loans and advances to customers | 251,609 | 2.6 | 251,609 | 2.2 | |||||||||||||
| Cash, central banks and credit institutions | 82,862 | 6.6 | 82,862 | (25.9) | |||||||||||||
| Debt instruments | 77,172 | (1.3) | 77,172 | 33.6 | |||||||||||||
| Other financial assets | 45,915 | (9.4) | 45,915 | (0.8) | |||||||||||||
| Other asset accounts | 17,079 | 0.7 | 17,079 | (2.7) | |||||||||||||
| Total assets | 474,638 | 1.2 | 474,638 | (1.0) | |||||||||||||
| Customer deposits | 315,055 | (1.4) | 315,055 | 0.5 | |||||||||||||
| Central banks and credit institutions | 40,371 | 19.6 | 40,371 | (16.6) | |||||||||||||
| Marketable debt securities | 28,204 | 6.2 | 28,204 | 4.0 | |||||||||||||
| Other financial liabilities | 51,374 | 3.3 | 51,374 | (2.9) | |||||||||||||
| Other liabilities accounts | 21,863 | 1.5 | 21,863 | 5.3 | |||||||||||||
| Total liabilities | 456,867 | 1.3 | 456,867 | (1.2) | |||||||||||||
| Total equity | 17,771 | (0.2) | 17,771 | 3.8 | |||||||||||||
| Memorandum items: | |||||||||||||||||
Gross loans and advances to customers 2 | 234,321 | 2.6 | 234,321 | (1.4) | |||||||||||||
| Customer funds | 382,346 | 0.3 | 382,346 | 2.3 | |||||||||||||
Customer deposits 3 | 296,568 | (0.7) | 296,568 | (0.7) | |||||||||||||
| Mutual funds | 85,777 | 3.9 | 85,777 | 14.4 | |||||||||||||
| Ratios (%), operating means and customers | |||||||||||||||||
| RoTE | 22.8 | 4.7 | 20.4 | 7.0 | |||||||||||||
| Efficiency ratio | 33.9 | (0.3) | 34.1 | (5.8) | |||||||||||||
| NPL ratio | 2.91 | (0.10) | 2.91 | (0.21) | |||||||||||||
| NPL coverage ratio | 50.1 | 0.3 | 50.1 | (0.6) | |||||||||||||
Number of employees 4 | 24,229 | (1.4) | 24,229 | (2.3) | |||||||||||||
| Number of branches | 1,833 | (1.7) | 1,833 | (2.7) | |||||||||||||
| Number of total customers (thousands) | 15,126 | (0.1) | 15,126 | 3.0 | |||||||||||||
| Number of active customers (thousands) | 8,630 | 1.6 | 8,630 | 6.2 | |||||||||||||
1. Includes exchange differences.
2. Excluding reverse repos.
3. Excluding repos.
4. Employee data for Spain and Other Europe have been modified slightly to better reflect the allocation of CIB employees.
January - June 2024 | | 61 | ||||||
Business model | |||||||||||||||||||||||||||||
| Segments information | |||||||||||||||||||||||||||||
| United Kingdom | Q | ||||||||||||||||||||||
| EUR million | |||||||||||||||||||||||
| / | Q1'24 | / | H1'23 | ||||||||||||||||||||
| Underlying income statement | Q2'24 | % | % excl. FX | H1'24 | % | % excl. FX | |||||||||||||||||
| Net interest income | 1,196 | 0.9 | 0.5 | 2,381 | (7.8) | (10.1) | |||||||||||||||||
| Net fee income | 64 | (19.0) | (19.3) | 142 | (14.8) | (16.9) | |||||||||||||||||
Gains (losses) on financial transactions 1 | — | (96.5) | (96.7) | (8) | — | — | |||||||||||||||||
| Other operating income | 0 | 92.0 | 91.5 | 1 | (68.2) | (69.0) | |||||||||||||||||
| Total income | 1,260 | 0.2 | (0.1) | 2,516 | (8.8) | (11.0) | |||||||||||||||||
| Administrative expenses and amortizations | (717) | (2.3) | (2.6) | (1,451) | 6.5 | 3.8 | |||||||||||||||||
| Net operating income | 542 | 3.8 | 3.4 | 1,065 | (23.7) | (25.6) | |||||||||||||||||
| Net loan-loss provisions | (44) | 153.4 | 152.8 | (61) | (40.6) | (42.1) | |||||||||||||||||
| Other gains (losses) and provisions | (64) | (29.6) | (29.9) | (155) | (6.3) | (8.6) | |||||||||||||||||
| Profit before tax | 434 | 4.8 | 4.5 | 849 | (24.7) | (26.5) | |||||||||||||||||
| Tax on profit | (110) | 0.2 | (0.1) | (219) | (29.1) | (30.8) | |||||||||||||||||
| Profit from continuing operations | 325 | 6.5 | 6.1 | 630 | (23.0) | (24.9) | |||||||||||||||||
| Net profit from discontinued operations | — | — | — | — | — | — | |||||||||||||||||
| Consolidated profit | 325 | 6.5 | 6.1 | 630 | (23.0) | (24.9) | |||||||||||||||||
| Non-controlling interests | — | — | — | — | — | — | |||||||||||||||||
| Profit attributable to the parent | 325 | 6.5 | 6.1 | 630 | (23.0) | (24.9) | |||||||||||||||||
| Balance sheet | |||||||||||||||||||||||
| Loans and advances to customers | 250,820 | 0.7 | (0.1) | 250,820 | (1.1) | (2.3) | |||||||||||||||||
| Cash, central banks and credit institutions | 50,456 | (21.3) | (21.9) | 50,456 | (22.0) | (22.9) | |||||||||||||||||
| Debt instruments | 12,467 | 21.2 | 20.2 | 12,467 | 43.1 | 41.4 | |||||||||||||||||
| Other financial assets | 306 | (3.9) | (4.7) | 306 | (71.6) | (71.9) | |||||||||||||||||
| Other asset accounts | 4,368 | (8.7) | (9.5) | 4,368 | 84.9 | 82.6 | |||||||||||||||||
| Total assets | 318,417 | (3.1) | (3.9) | 318,417 | (3.7) | (4.8) | |||||||||||||||||
| Customer deposits | 229,975 | (2.6) | (3.4) | 229,975 | (1.6) | (2.8) | |||||||||||||||||
| Central banks and credit institutions | 25,700 | (6.4) | (7.2) | 25,700 | (28.4) | (29.3) | |||||||||||||||||
| Marketable debt securities | 44,912 | (0.7) | (1.5) | 44,912 | 3.8 | 2.6 | |||||||||||||||||
| Other financial liabilities | 4,707 | (12.8) | (13.5) | 4,707 | 51.5 | 49.6 | |||||||||||||||||
| Other liabilities accounts | 1,435 | (9.2) | (9.9) | 1,435 | (28.6) | (29.5) | |||||||||||||||||
| Total liabilities | 306,729 | (2.9) | (3.7) | 306,729 | (3.5) | (4.7) | |||||||||||||||||
| Total equity | 11,689 | (8.6) | (9.3) | 11,689 | (7.1) | (8.2) | |||||||||||||||||
| Memorandum items: | |||||||||||||||||||||||
Gross loans and advances to customers 2 | 235,979 | (0.2) | (1.0) | 235,979 | (2.5) | (3.7) | |||||||||||||||||
| Customer funds | 230,481 | (2.0) | (2.8) | 230,481 | 0.3 | (1.0) | |||||||||||||||||
Customer deposits 3 | 222,887 | (2.1) | (2.9) | 222,887 | 0.1 | (1.1) | |||||||||||||||||
| Mutual funds | 7,594 | 1.4 | 0.5 | 7,594 | 5.0 | 3.7 | |||||||||||||||||
| Ratios (%), operating means and customers | |||||||||||||||||||||||
| RoTE | 11.2 | 0.8 | 10.8 | (3.0) | |||||||||||||||||||
| Efficiency ratio | 56.9 | (1.5) | 57.7 | 8.3 | |||||||||||||||||||
| NPL ratio | 1.46 | (0.02) | 1.46 | 0.15 | |||||||||||||||||||
| NPL coverage ratio | 28.5 | 0.2 | 28.5 | (3.5) | |||||||||||||||||||
| Number of employees | 22,214 | (0.6) | 22,214 | 0.2 | |||||||||||||||||||
| Number of branches | 444 | 0.0 | 444 | (0.2) | |||||||||||||||||||
| Number of total customers (thousands) | 22,478 | (0.1) | 22,478 | 0.5 | |||||||||||||||||||
| Number of active customers (thousands) | 13,756 | (0.4) | 13,756 | (0.9) | |||||||||||||||||||
1. Includes exchange differences.
2. Excluding reverse repos.
3. Excluding repos.
62 | | January - June 2024 | ||||||
Business model | |||||||||||||||||||||||||||||
| Segments information | |||||||||||||||||||||||||||||
| Portugal | Q | ||||||||||||||||
| EUR million | |||||||||||||||||
| / Q1'24 | / H1'23 | ||||||||||||||||
| Underlying income statement | Q2'24 | % | H1'24 | % | |||||||||||||
| Net interest income | 413 | (4.1) | 844 | 46.8 | |||||||||||||
| Net fee income | 115 | (9.4) | 242 | 3.0 | |||||||||||||
Gains (losses) on financial transactions 1 | 18 | 1.8 | 35 | 192.0 | |||||||||||||
| Other operating income | 12 | 41.7 | 21 | 936.0 | |||||||||||||
| Total income | 558 | (4.4) | 1,142 | 38.6 | |||||||||||||
| Administrative expenses and amortizations | (134) | (0.2) | (267) | 1.1 | |||||||||||||
| Net operating income | 425 | (5.7) | 874 | 56.4 | |||||||||||||
| Net loan-loss provisions | 5 | — | (2) | (93.1) | |||||||||||||
| Other gains (losses) and provisions | (36) | — | (39) | (6.3) | |||||||||||||
| Profit before tax | 394 | (10.6) | 834 | 72.2 | |||||||||||||
| Tax on profit | (133) | (2.5) | (270) | 66.3 | |||||||||||||
| Profit from continuing operations | 260 | (14.2) | 564 | 75.2 | |||||||||||||
| Net profit from discontinued operations | — | — | — | — | |||||||||||||
| Consolidated profit | 260 | (14.2) | 564 | 75.2 | |||||||||||||
| Non-controlling interests | (1) | 20.1 | (1) | 77.9 | |||||||||||||
| Profit attributable to the parent | 260 | (14.3) | 563 | 75.2 | |||||||||||||
| Balance sheet | |||||||||||||||||
| Loans and advances to customers | 37,680 | 1.0 | 37,680 | (0.2) | |||||||||||||
| Cash, central banks and credit institutions | 6,951 | 1.2 | 6,951 | (25.1) | |||||||||||||
| Debt instruments | 12,538 | 0.9 | 12,538 | 58.6 | |||||||||||||
| Other financial assets | 1,118 | (0.1) | 1,118 | (2.0) | |||||||||||||
| Other asset accounts | 1,051 | 0.2 | 1,051 | (23.4) | |||||||||||||
| Total assets | 59,338 | 1.0 | 59,338 | 3.3 | |||||||||||||
| Customer deposits | 37,732 | 3.3 | 37,732 | 3.1 | |||||||||||||
| Central banks and credit institutions | 8,933 | 1.2 | 8,933 | 4.7 | |||||||||||||
| Marketable debt securities | 4,753 | (18.3) | 4,753 | 19.3 | |||||||||||||
| Other financial liabilities | 340 | 4.2 | 340 | 10.2 | |||||||||||||
| Other liabilities accounts | 3,581 | 3.6 | 3,581 | (21.2) | |||||||||||||
| Total liabilities | 55,339 | 0.7 | 55,339 | 2.5 | |||||||||||||
| Total equity | 4,000 | 4.0 | 4,000 | 14.5 | |||||||||||||
| Memorandum items: | |||||||||||||||||
Gross loans and advances to customers 2 | 38,412 | 0.8 | 38,412 | (0.8) | |||||||||||||
| Customer funds | 42,235 | 3.3 | 42,235 | 4.2 | |||||||||||||
Customer deposits 3 | 37,732 | 3.3 | 37,732 | 3.1 | |||||||||||||
| Mutual funds | 4,504 | 3.3 | 4,504 | 14.0 | |||||||||||||
| Ratios (%), operating means and customers | |||||||||||||||||
| RoTE | 26.5 | (4.6) | 28.8 | 10.1 | |||||||||||||
| Efficiency ratio | 23.9 | 1.0 | 23.4 | (8.7) | |||||||||||||
| NPL ratio | 2.42 | (0.21) | 2.42 | (0.68) | |||||||||||||
| NPL coverage ratio | 79.9 | (1.0) | 79.9 | (1.9) | |||||||||||||
| Number of employees | 4,885 | (0.5) | 4,885 | (1.8) | |||||||||||||
| Number of branches | 374 | (0.3) | 374 | (0.8) | |||||||||||||
| Number of total customers (thousands) | 2,946 | 0.5 | 2,946 | 2.0 | |||||||||||||
| Number of active customers (thousands) | 1,860 | 1.0 | 1,860 | 3.4 | |||||||||||||
1. Includes exchange differences.
2. Excluding reverse repos.
3. Excluding repos.
January - June 2024 | | 63 | ||||||
Business model | |||||||||||||||||||||||||||||
| Segments information | |||||||||||||||||||||||||||||
| Poland | Q | ||||||||||||||||||||||
| EUR million | |||||||||||||||||||||||
| / | Q1'24 | / | H1'23 | ||||||||||||||||||||
| Underlying income statement | Q2'24 | % | % excl. FX | H1'24 | % | % excl. FX | |||||||||||||||||
| Net interest income | 697 | 1.7 | 0.9 | 1,384 | 14.4 | 6.9 | |||||||||||||||||
| Net fee income | 163 | (7.2) | (7.9) | 339 | 17.3 | 9.5 | |||||||||||||||||
Gains (losses) on financial transactions 1 | 19 | 314.2 | 312.2 | 24 | (20.9) | (26.2) | |||||||||||||||||
| Other operating income | (2) | (93.6) | (94.0) | (35) | 85.2 | 72.9 | |||||||||||||||||
| Total income | 878 | 5.3 | 4.5 | 1,711 | 13.4 | 5.9 | |||||||||||||||||
| Administrative expenses and amortizations | (237) | 3.6 | 2.9 | (466) | 15.3 | 7.6 | |||||||||||||||||
| Net operating income | 640 | 5.9 | 5.1 | 1,245 | 12.7 | 5.2 | |||||||||||||||||
| Net loan-loss provisions | (166) | 27.6 | 26.7 | (297) | (13.4) | (19.2) | |||||||||||||||||
| Other gains (losses) and provisions | (108) | 74.0 | 72.9 | (170) | 60.9 | 50.2 | |||||||||||||||||
| Profit before tax | 366 | (11.1) | (11.9) | 779 | 18.6 | 10.7 | |||||||||||||||||
| Tax on profit | (108) | 9.8 | 9.0 | (207) | 19.6 | 11.7 | |||||||||||||||||
| Profit from continuing operations | 258 | (17.7) | (18.4) | 572 | 18.2 | 10.4 | |||||||||||||||||
| Net profit from discontinued operations | — | — | — | — | — | — | |||||||||||||||||
| Consolidated profit | 258 | (17.7) | (18.4) | 572 | 18.2 | 10.4 | |||||||||||||||||
| Non-controlling interests | (85) | (15.5) | (16.2) | (185) | 14.1 | 6.6 | |||||||||||||||||
| Profit attributable to the parent | 173 | (18.8) | (19.5) | 386 | 20.3 | 12.3 | |||||||||||||||||
| Balance sheet | |||||||||||||||||||||||
| Loans and advances to customers | 36,342 | 4.6 | 4.6 | 36,342 | 13.1 | 9.8 | |||||||||||||||||
| Cash, central banks and credit institutions | 8,157 | (9.5) | (9.4) | 8,157 | (7.6) | (10.3) | |||||||||||||||||
| Debt instruments | 15,676 | (1.0) | (1.0) | 15,676 | 17.5 | 14.1 | |||||||||||||||||
| Other financial assets | 487 | (6.2) | (6.2) | 487 | (21.1) | (23.4) | |||||||||||||||||
| Other asset accounts | 1,801 | (6.3) | (6.3) | 1,801 | 2.4 | (0.5) | |||||||||||||||||
| Total assets | 62,463 | 0.7 | 0.7 | 62,463 | 10.2 | 7.0 | |||||||||||||||||
| Customer deposits | 47,051 | 2.5 | 2.5 | 47,051 | 11.6 | 8.4 | |||||||||||||||||
| Central banks and credit institutions | 4,277 | 2.6 | 2.6 | 4,277 | (5.9) | (8.7) | |||||||||||||||||
| Marketable debt securities | 2,185 | 4.4 | 4.4 | 2,185 | 92.4 | 86.9 | |||||||||||||||||
| Other financial liabilities | 1,648 | 16.3 | 16.3 | 1,648 | 33.8 | 29.9 | |||||||||||||||||
| Other liabilities accounts | 1,282 | (22.3) | (22.3) | 1,282 | (13.3) | (15.8) | |||||||||||||||||
| Total liabilities | 56,443 | 2.2 | 2.2 | 56,443 | 11.7 | 8.5 | |||||||||||||||||
| Total equity | 6,020 | (11.5) | (11.5) | 6,020 | (2.1) | (5.0) | |||||||||||||||||
| Memorandum items: | |||||||||||||||||||||||
Gross loans and advances to customers 2 | 37,140 | 4.1 | 4.1 | 37,140 | 12.6 | 9.4 | |||||||||||||||||
| Customer funds | 52,011 | 2.2 | 2.3 | 52,011 | 12.7 | 9.5 | |||||||||||||||||
Customer deposits 3 | 46,114 | 1.8 | 1.8 | 46,114 | 9.4 | 6.3 | |||||||||||||||||
| Mutual funds | 5,896 | 5.9 | 6.0 | 5,896 | 48.1 | 43.8 | |||||||||||||||||
| Ratios (%), operating means and customers | |||||||||||||||||||||||
| RoTE | 18.6 | (1.6) | 19.4 | 1.5 | |||||||||||||||||||
| Efficiency ratio | 27.0 | (0.4) | 27.2 | 0.4 | |||||||||||||||||||
| NPL ratio | 3.40 | (0.17) | 3.40 | (0.35) | |||||||||||||||||||
| NPL coverage ratio | 75.1 | 0.2 | 75.1 | 1.1 | |||||||||||||||||||
| Number of employees | 10,988 | 1.3 | 10,988 | 2.9 | |||||||||||||||||||
| Number of branches | 373 | (1.1) | 373 | (4.1) | |||||||||||||||||||
| Number of total customers (thousands) | 5,915 | 1.0 | 5,915 | 2.2 | |||||||||||||||||||
| Number of active customers (thousands) | 4,546 | 1.2 | 4,546 | 3.7 | |||||||||||||||||||
1. Includes exchange differences.
2. Excluding reverse repos.
3. Excluding repos.
64 | | January - June 2024 | ||||||
Business model | |||||||||||||||||||||||||||||
| Segments information | |||||||||||||||||||||||||||||
| Other Europe | |||||||||||||||||||||||
| EUR million | |||||||||||||||||||||||
| / | Q1'24 | / | H1'23 | ||||||||||||||||||||
| Underlying income statement | Q2'24 | % | % excl. FX | H1'24 | % | % excl. FX | |||||||||||||||||
| Net interest income | 19 | 293.2 | 274.3 | 24 | (35.4) | (35.3) | |||||||||||||||||
| Net fee income | 87 | 16.7 | 16.2 | 161 | 14.9 | 14.9 | |||||||||||||||||
Gains (losses) on financial transactions 1 | 58 | 68.5 | 67.7 | 92 | (3.6) | (3.6) | |||||||||||||||||
| Other operating income | 2 | (55.9) | (56.0) | 6 | — | — | |||||||||||||||||
| Total income | 166 | 40.3 | 39.4 | 284 | 9.5 | 9.6 | |||||||||||||||||
| Administrative expenses and amortizations | (176) | 0.5 | 0.2 | (351) | 13.1 | 13.1 | |||||||||||||||||
| Net operating income | (10) | (81.7) | (81.3) | (68) | 31.0 | 30.9 | |||||||||||||||||
| Net loan-loss provisions | — | (87.2) | (87.8) | 2 | — | — | |||||||||||||||||
| Other gains (losses) and provisions | (84) | 795.8 | 795.8 | (93) | — | — | |||||||||||||||||
| Profit before tax | (94) | 44.4 | 45.1 | (159) | 168.1 | 167.9 | |||||||||||||||||
| Tax on profit | (2) | — | — | 11 | — | — | |||||||||||||||||
| Profit from continuing operations | (96) | 82.4 | 83.2 | (148) | 151.7 | 151.5 | |||||||||||||||||
| Net profit from discontinued operations | — | — | — | — | — | — | |||||||||||||||||
| Consolidated profit | (96) | 82.4 | 83.2 | (148) | 151.7 | 151.5 | |||||||||||||||||
| Non-controlling interests | 1 | — | — | 1 | (71.6) | (71.6) | |||||||||||||||||
| Profit attributable to the parent | (95) | 80.8 | 81.6 | (147) | 159.3 | 159.2 | |||||||||||||||||
| Balance sheet | |||||||||||||||||||||||
| Loans and advances to customers | 14,755 | 6.6 | 5.9 | 14,755 | 18.9 | 16.9 | |||||||||||||||||
| Cash, central banks and credit institutions | 2,618 | 8.8 | 8.3 | 2,618 | 169.3 | 168.6 | |||||||||||||||||
| Debt instruments | 9,801 | 5.3 | 5.2 | 9,801 | 6.6 | 6.3 | |||||||||||||||||
| Other financial assets | 2,978 | 97.5 | 96.3 | 2,978 | 43.2 | 41.0 | |||||||||||||||||
| Other asset accounts | 2,065 | (16.2) | (16.5) | 2,065 | (2.7) | (3.5) | |||||||||||||||||
| Total assets | 32,217 | 9.1 | 8.6 | 32,217 | 20.3 | 19.0 | |||||||||||||||||
| Customer deposits | 8,443 | 42.3 | 41.0 | 8,443 | 132.7 | 127.9 | |||||||||||||||||
| Central banks and credit institutions | 17,922 | (5.7) | (6.0) | 17,922 | (3.3) | (4.1) | |||||||||||||||||
| Marketable debt securities | — | — | — | — | — | — | |||||||||||||||||
| Other financial liabilities | 2,784 | 103.6 | 102.3 | 2,784 | 46.5 | 44.2 | |||||||||||||||||
| Other liabilities accounts | 473 | (30.4) | (30.4) | 473 | 54.8 | 54.0 | |||||||||||||||||
| Total liabilities | 29,623 | 9.7 | 9.2 | 29,623 | 21.6 | 20.3 | |||||||||||||||||
| Total equity | 2,595 | 2.6 | 2.0 | 2,595 | 7.4 | 6.0 | |||||||||||||||||
| Memorandum items: | |||||||||||||||||||||||
Gross loans and advances to customers 2 | 14,771 | 6.6 | 5.9 | 14,771 | 18.9 | 16.8 | |||||||||||||||||
| Customer funds | 19,884 | 15.8 | 15.2 | 19,884 | 53.8 | 52.3 | |||||||||||||||||
Customer deposits 3 | 8,027 | 39.4 | 38.1 | 8,027 | 132.4 | 127.4 | |||||||||||||||||
| Mutual funds | 11,858 | 3.9 | 3.6 | 11,858 | 25.2 | 24.5 | |||||||||||||||||
| Resources | |||||||||||||||||||||||
Number of employees 4 | 5,317 | 4.6 | 5,317 | 27.0 | |||||||||||||||||||
1. Includes exchange differences.
2. Excluding reverse repos.
3. Excluding repos.
4. Employee data for Spain and Other Europe have been modified slightly to better reflect the allocation of CIB employees.
January - June 2024 | | 65 | ||||||
Business model | |||||||||||||||||||||||||||||
| Segments information | |||||||||||||||||||||||||||||
| DCB EUROPE | |||||||||||||||||||||||
| EUR million | |||||||||||||||||||||||
| / | Q1'24 | / | H1'23 | ||||||||||||||||||||
| Underlying income statement | Q2'24 | % | % excl. FX | H1'24 | % | % excl. FX | |||||||||||||||||
| Net interest income | 1,092 | (0.2) | (0.1) | 2,187 | 7.2 | 6.8 | |||||||||||||||||
| Net fee income | 231 | 5.2 | 5.2 | 451 | 14.4 | 14.1 | |||||||||||||||||
Gains (losses) on financial transactions 1 | 6 | 51.9 | 54.3 | 10 | (82.3) | (82.3) | |||||||||||||||||
| Other operating income | 114 | 25.0 | 25.0 | 206 | 23.6 | 22.9 | |||||||||||||||||
| Total income | 1,444 | 2.4 | 2.5 | 2,854 | 7.4 | 7.0 | |||||||||||||||||
| Administrative expenses and amortizations | (655) | (1.5) | (1.4) | (1,319) | 0.4 | 0.1 | |||||||||||||||||
| Net operating income | 789 | 5.9 | 6.0 | 1,534 | 14.2 | 13.6 | |||||||||||||||||
| Net loan-loss provisions | (308) | 11.9 | 12.0 | (584) | 40.7 | 39.5 | |||||||||||||||||
| Other gains (losses) and provisions | (124) | 80.7 | 80.3 | (193) | — | — | |||||||||||||||||
| Profit before tax | 356 | (11.1) | (10.9) | 757 | (18.4) | (18.5) | |||||||||||||||||
| Tax on profit | (78) | (24.8) | (24.7) | (181) | (20.1) | (20.2) | |||||||||||||||||
| Profit from continuing operations | 279 | (6.3) | (6.1) | 576 | (17.8) | (17.9) | |||||||||||||||||
| Net profit from discontinued operations | — | — | — | — | — | — | |||||||||||||||||
| Consolidated profit | 279 | (6.3) | (6.1) | 576 | (17.8) | (17.9) | |||||||||||||||||
| Non-controlling interests | (55) | (20.2) | (20.2) | (124) | (31.5) | (31.7) | |||||||||||||||||
| Profit attributable to the parent | 224 | (2.1) | (1.9) | 453 | (13.1) | (13.2) | |||||||||||||||||
| Balance sheet | |||||||||||||||||||||||
| Loans and advances to customers | 135,576 | 2.6 | 2.3 | 135,576 | 8.1 | 7.6 | |||||||||||||||||
| Cash, central banks and credit institutions | 19,127 | (0.1) | (0.5) | 19,127 | 15.3 | 14.7 | |||||||||||||||||
| Debt instruments | 5,921 | (14.9) | (15.1) | 5,921 | 13.0 | 12.2 | |||||||||||||||||
| Other financial assets | 98 | (9.7) | (9.7) | 98 | (39.6) | (39.8) | |||||||||||||||||
| Other asset accounts | 10,564 | 3.9 | 3.7 | 10,564 | 14.1 | 13.8 | |||||||||||||||||
| Total assets | 171,286 | 1.6 | 1.3 | 171,286 | 9.3 | 8.8 | |||||||||||||||||
| Customer deposits | 76,901 | 5.0 | 4.6 | 76,901 | 24.1 | 23.6 | |||||||||||||||||
| Central banks and credit institutions | 29,239 | (3.0) | (3.6) | 29,239 | (24.1) | (24.6) | |||||||||||||||||
| Marketable debt securities | 44,342 | 0.6 | 0.5 | 44,342 | 22.6 | 22.4 | |||||||||||||||||
| Other financial liabilities | 2,508 | 9.7 | 9.6 | 2,508 | 8.0 | 7.7 | |||||||||||||||||
| Other liabilities accounts | 5,145 | 1.2 | 0.9 | 5,145 | 0.8 | 0.5 | |||||||||||||||||
| Total liabilities | 158,135 | 2.1 | 1.8 | 158,135 | 9.7 | 9.3 | |||||||||||||||||
| Total equity | 13,151 | (3.8) | (4.3) | 13,151 | 4.3 | 3.6 | |||||||||||||||||
| Memorandum items: | |||||||||||||||||||||||
Gross loans and advances to customers 2 | 138,296 | 2.6 | 2.3 | 138,296 | 8.1 | 7.6 | |||||||||||||||||
| Customer funds | 81,052 | 5.1 | 4.8 | 81,052 | 23.9 | 23.4 | |||||||||||||||||
Customer deposits 3 | 76,901 | 5.0 | 4.6 | 76,901 | 24.1 | 23.6 | |||||||||||||||||
| Mutual funds | 4,151 | 7.0 | 7.0 | 4,151 | 19.9 | 19.9 | |||||||||||||||||
| Ratios (%), operating means and customers | |||||||||||||||||||||||
| RoTE | 8.9 | 0.0 | 8.9 | (1.9) | |||||||||||||||||||
| Efficiency ratio | 45.3 | (1.8) | 46.2 | (3.2) | |||||||||||||||||||
| NPL ratio | 2.31 | 0.05 | 2.31 | 0.28 | |||||||||||||||||||
| NPL coverage ratio | 85.4 | (0.7) | 85.4 | (9.0) | |||||||||||||||||||
| Number of employees | 16,704 | (0.9) | 16,704 | 0.5 | |||||||||||||||||||
| Number of branches | 327 | (3.8) | 327 | (9.9) | |||||||||||||||||||
| Number of total customers (thousands) | 19,515 | (0.5) | 19,515 | (1.0) | |||||||||||||||||||
1. Includes exchange differences.
2. Excluding reverse repos.
3. Excluding repos.
66 | | January - June 2024 | ||||||
Business model | |||||||||||||||||||||||||||||
| Segments information | |||||||||||||||||||||||||||||
| NORTH AMERICA | |||||||||||||||||||||||
| EUR million | |||||||||||||||||||||||
| / | Q1'24 | / | H1'23 | ||||||||||||||||||||
| Underlying income statement | Q2'24 | % | % excl. FX | H1'24 | % | % excl. FX | |||||||||||||||||
| Net interest income | 2,636 | 1.0 | 0.8 | 5,247 | 6.4 | 3.8 | |||||||||||||||||
| Net fee income | 662 | 3.7 | 3.6 | 1,300 | 20.7 | 16.3 | |||||||||||||||||
Gains (losses) on financial transactions 1 | 169 | 3.9 | 3.7 | 331 | 44.2 | 40.0 | |||||||||||||||||
| Other operating income | 87 | 18.4 | 16.9 | 161 | (10.5) | (9.1) | |||||||||||||||||
| Total income | 3,554 | 2.0 | 1.8 | 7,039 | 9.7 | 6.9 | |||||||||||||||||
| Administrative expenses and amortizations | (1,691) | 1.8 | 1.6 | (3,352) | 9.6 | 7.1 | |||||||||||||||||
| Net operating income | 1,863 | 2.1 | 2.0 | 3,686 | 9.8 | 6.7 | |||||||||||||||||
| Net loan-loss provisions | (908) | (7.8) | (8.1) | (1,893) | 23.7 | 21.2 | |||||||||||||||||
| Other gains (losses) and provisions | (144) | 129.9 | 129.1 | (207) | 136.8 | 132.1 | |||||||||||||||||
| Profit before tax | 810 | 4.3 | 4.5 | 1,586 | (8.8) | (12.0) | |||||||||||||||||
| Tax on profit | (107) | (18.5) | (17.9) | (238) | (37.4) | (40.0) | |||||||||||||||||
| Profit from continuing operations | 703 | 9.0 | 9.0 | 1,348 | (0.8) | (4.1) | |||||||||||||||||
| Net profit from discontinued operations | — | — | — | — | — | — | |||||||||||||||||
| Consolidated profit | 703 | 9.0 | 9.0 | 1,348 | (0.8) | (4.1) | |||||||||||||||||
| Non-controlling interests | 0 | (66.0) | (65.7) | (2) | (87.6) | (88.4) | |||||||||||||||||
| Profit attributable to the parent | 703 | 9.1 | 9.1 | 1,347 | 0.1 | (3.2) | |||||||||||||||||
| Balance sheet | |||||||||||||||||||||||
| Loans and advances to customers | 183,084 | 2.9 | 4.8 | 183,084 | 4.6 | 4.3 | |||||||||||||||||
| Cash, central banks and credit institutions | 34,561 | (2.5) | (0.8) | 34,561 | (18.2) | (17.2) | |||||||||||||||||
| Debt instruments | 56,809 | 2.1 | 6.7 | 56,809 | 15.0 | 16.7 | |||||||||||||||||
| Other financial assets | 8,687 | 1.7 | 8.2 | 8,687 | (32.6) | (31.5) | |||||||||||||||||
| Other asset accounts | 23,160 | (2.8) | (1.0) | 23,160 | 2.0 | 1.6 | |||||||||||||||||
| Total assets | 306,300 | 1.7 | 4.1 | 306,300 | 1.3 | 1.6 | |||||||||||||||||
| Customer deposits | 177,982 | 1.2 | 3.4 | 177,982 | 2.1 | 2.0 | |||||||||||||||||
| Central banks and credit institutions | 42,294 | 11.9 | 15.0 | 42,294 | 14.0 | 15.8 | |||||||||||||||||
| Marketable debt securities | 39,471 | 2.8 | 4.2 | 39,471 | 4.1 | 3.6 | |||||||||||||||||
| Other financial liabilities | 15,346 | (10.7) | (5.8) | 15,346 | (24.8) | (23.6) | |||||||||||||||||
| Other liabilities accounts | 6,515 | (5.3) | (1.4) | 6,515 | (0.6) | 0.3 | |||||||||||||||||
| Total liabilities | 281,607 | 2.0 | 4.4 | 281,607 | 1.9 | 2.2 | |||||||||||||||||
| Total equity | 24,692 | (2.0) | 0.8 | 24,692 | (4.4) | (3.9) | |||||||||||||||||
| Memorandum items: | |||||||||||||||||||||||
Gross loans and advances to customers 2 | 165,322 | (0.8) | 1.3 | 165,322 | 3.4 | 3.3 | |||||||||||||||||
| Customer funds | 166,590 | (5.4) | (2.7) | 166,590 | (0.8) | (0.5) | |||||||||||||||||
Customer deposits 3 | 133,709 | (6.9) | (4.7) | 133,709 | (4.4) | (4.3) | |||||||||||||||||
| Mutual funds | 32,881 | 1.5 | 6.4 | 32,881 | 17.1 | 19.0 | |||||||||||||||||
| Ratios (%), operating means and customers | |||||||||||||||||||||||
| RoTE | 12.0 | 0.7 | 11.7 | 0.6 | |||||||||||||||||||
| Efficiency ratio | 47.6 | (0.1) | 47.6 | (0.1) | |||||||||||||||||||
| NPL ratio | 3.93 | (0.14) | 3.93 | 0.70 | |||||||||||||||||||
| NPL coverage ratio | 74.3 | 0.1 | 74.3 | (15.7) | |||||||||||||||||||
| Number of employees | 43,388 | (2.3) | 43,388 | (5.0) | |||||||||||||||||||
| Number of branches | 1,765 | (1.0) | 1,765 | (2.7) | |||||||||||||||||||
| Number of total customers (thousands) | 25,476 | 1.4 | 25,476 | 2.1 | |||||||||||||||||||
| Number of active customers (thousands) | 14,952 | 1.7 | 14,952 | 5.8 | |||||||||||||||||||
1. Includes exchange differences.
2. Excluding reverse repos.
3. Excluding repos.
January - June 2024 | | 67 | ||||||
Business model | |||||||||||||||||||||||||||||
| Segments information | |||||||||||||||||||||||||||||
| United States | Q | ||||||||||||||||||||||
| EUR million | |||||||||||||||||||||||
| / | Q1'24 | / | H1'23 | ||||||||||||||||||||
| Underlying income statement | Q2'24 | % | % excl. FX | H1'24 | % | % excl. FX | |||||||||||||||||
| Net interest income | 1,428 | 2.2 | 1.4 | 2,824 | (2.6) | (2.6) | |||||||||||||||||
| Net fee income | 272 | 2.1 | 1.3 | 539 | 38.3 | 38.3 | |||||||||||||||||
Gains (losses) on financial transactions 1 | 97 | (4.5) | (5.3) | 198 | 71.4 | 71.5 | |||||||||||||||||
| Other operating income | 104 | (0.4) | (1.2) | 208 | (4.4) | (4.3) | |||||||||||||||||
| Total income | 1,900 | 1.7 | 0.9 | 3,769 | 4.0 | 4.1 | |||||||||||||||||
| Administrative expenses and amortizations | (963) | 2.4 | 1.6 | (1,903) | 5.8 | 5.8 | |||||||||||||||||
| Net operating income | 938 | 1.0 | 0.1 | 1,866 | 2.3 | 2.3 | |||||||||||||||||
| Net loan-loss provisions | (556) | (9.7) | (10.4) | (1,171) | 16.5 | 16.5 | |||||||||||||||||
| Other gains (losses) and provisions | (43) | 7.7 | 6.9 | (83) | 45.1 | 45.2 | |||||||||||||||||
| Profit before tax | 339 | 23.8 | 22.9 | 612 | (19.7) | (19.6) | |||||||||||||||||
| Tax on profit | 46 | 695.4 | 691.8 | 52 | — | — | |||||||||||||||||
| Profit from continuing operations | 385 | 37.7 | 36.7 | 664 | (0.4) | (0.3) | |||||||||||||||||
| Net profit from discontinued operations | — | — | — | — | — | — | |||||||||||||||||
| Consolidated profit | 385 | 37.7 | 36.7 | 664 | (0.4) | (0.3) | |||||||||||||||||
| Non-controlling interests | — | — | — | — | — | — | |||||||||||||||||
| Profit attributable to the parent | 385 | 37.7 | 36.7 | 664 | (0.4) | (0.3) | |||||||||||||||||
| Balance sheet | |||||||||||||||||||||||
| Loans and advances to customers | 136,225 | 7.1 | 6.3 | 136,225 | 5.2 | 3.2 | |||||||||||||||||
| Cash, central banks and credit institutions | 24,507 | (2.5) | (3.3) | 24,507 | 17.3 | 15.2 | |||||||||||||||||
| Debt instruments | 26,560 | 8.2 | 7.3 | 26,560 | 17.3 | 15.1 | |||||||||||||||||
| Other financial assets | 2,406 | 20.0 | 19.0 | 2,406 | (56.9) | (57.7) | |||||||||||||||||
| Other asset accounts | 16,544 | (1.6) | (2.3) | 16,544 | (3.8) | (5.6) | |||||||||||||||||
| Total assets | 206,241 | 5.4 | 4.6 | 206,241 | 5.3 | 3.4 | |||||||||||||||||
| Customer deposits | 123,679 | 3.8 | 3.0 | 123,679 | 1.2 | (0.7) | |||||||||||||||||
| Central banks and credit institutions | 27,169 | 18.1 | 17.2 | 27,169 | 67.1 | 64.0 | |||||||||||||||||
| Marketable debt securities | 30,796 | 4.8 | 4.0 | 30,796 | 5.0 | 3.1 | |||||||||||||||||
| Other financial liabilities | 5,830 | (0.3) | (1.1) | 5,830 | (33.4) | (34.6) | |||||||||||||||||
| Other liabilities accounts | 3,020 | (5.5) | (6.2) | 3,020 | (15.9) | (17.4) | |||||||||||||||||
| Total liabilities | 190,495 | 5.5 | 4.7 | 190,495 | 5.7 | 3.8 | |||||||||||||||||
| Total equity | 15,747 | 4.2 | 3.4 | 15,747 | 0.5 | (1.4) | |||||||||||||||||
| Memorandum items: | |||||||||||||||||||||||
Gross loans and advances to customers 2 | 117,955 | 2.5 | 1.7 | 117,955 | 4.0 | 2.1 | |||||||||||||||||
| Customer funds | 101,898 | (4.9) | (5.7) | 101,898 | (5.4) | (7.2) | |||||||||||||||||
Customer deposits 3 | 88,551 | (5.8) | (6.6) | 88,551 | (7.4) | (9.1) | |||||||||||||||||
| Mutual funds | 13,347 | 1.6 | 0.8 | 13,347 | 9.9 | 7.9 | |||||||||||||||||
| Ratios (%), operating means and customers | |||||||||||||||||||||||
| RoTE | 10.5 | 2.5 | 9.2 | 0.8 | |||||||||||||||||||
| Efficiency ratio | 50.7 | 0.4 | 50.5 | 0.8 | |||||||||||||||||||
| NPL ratio | 4.33 | (0.27) | 4.33 | 0.87 | |||||||||||||||||||
| NPL coverage ratio | 67.9 | 0.1 | 67.9 | (17.7) | |||||||||||||||||||
| Number of employees | 12,746 | (2.1) | 12,746 | (10.6) | |||||||||||||||||||
| Number of branches | 409 | (1.0) | 409 | (7.7) | |||||||||||||||||||
| Number of total customers (thousands) | 4,504 | 0.2 | 4,504 | 2.1 | |||||||||||||||||||
| Number of active customers (thousands) | 4,349 | 0.2 | 4,349 | 7.9 | |||||||||||||||||||
1. Includes exchange differences.
2. Excluding reverse repos.
3. Excluding repos.
68 | | January - June 2024 | ||||||
Business model | |||||||||||||||||||||||||||||
| Segments information | |||||||||||||||||||||||||||||
| Mexico | Q | ||||||||||||||||||||||
| EUR million | |||||||||||||||||||||||
| / | Q1'24 | / | H1'23 | ||||||||||||||||||||
| Underlying income statement | Q2'24 | % | % excl. FX | H1'24 | % | % excl. FX | |||||||||||||||||
| Net interest income | 1,207 | (0.6) | 0.0 | 2,421 | 19.4 | 12.6 | |||||||||||||||||
| Net fee income | 374 | 4.2 | 4.8 | 733 | 10.5 | 4.1 | |||||||||||||||||
Gains (losses) on financial transactions 1 | 74 | 6.1 | 6.7 | 144 | 25.2 | 18.0 | |||||||||||||||||
| Other operating income | (19) | (45.4) | (45.0) | (54) | 28.2 | 20.9 | |||||||||||||||||
| Total income | 1,636 | 1.8 | 2.3 | 3,244 | 17.4 | 10.6 | |||||||||||||||||
| Administrative expenses and amortizations | (677) | 1.8 | 2.4 | (1,343) | 15.4 | 8.8 | |||||||||||||||||
| Net operating income | 959 | 1.7 | 2.3 | 1,901 | 18.9 | 12.0 | |||||||||||||||||
| Net loan-loss provisions | (351) | (4.9) | (4.4) | (721) | 37.9 | 30.0 | |||||||||||||||||
| Other gains (losses) and provisions | (17) | 18.0 | 18.6 | (32) | 7.9 | 1.7 | |||||||||||||||||
| Profit before tax | 590 | 5.7 | 6.3 | 1,149 | 9.6 | 3.3 | |||||||||||||||||
| Tax on profit | (161) | 10.1 | 10.6 | (307) | 12.5 | 6.0 | |||||||||||||||||
| Profit from continuing operations | 430 | 4.2 | 4.7 | 842 | 8.6 | 2.4 | |||||||||||||||||
| Net profit from discontinued operations | — | — | — | — | — | — | |||||||||||||||||
| Consolidated profit | 430 | 4.2 | 4.7 | 842 | 8.6 | 2.4 | |||||||||||||||||
| Non-controlling interests | (1) | (5.5) | (5.0) | (2) | (85.3) | (86.2) | |||||||||||||||||
| Profit attributable to the parent | 429 | 4.2 | 4.8 | 840 | 10.5 | 4.1 | |||||||||||||||||
| Balance sheet | |||||||||||||||||||||||
| Loans and advances to customers | 46,824 | (7.6) | 0.8 | 46,824 | 3.0 | 7.7 | |||||||||||||||||
| Cash, central banks and credit institutions | 9,636 | (3.1) | 5.6 | 9,636 | (54.1) | (52.1) | |||||||||||||||||
| Debt instruments | 30,247 | (2.6) | 6.2 | 30,247 | 13.1 | 18.2 | |||||||||||||||||
| Other financial assets | 6,154 | (4.1) | 4.6 | 6,154 | (14.2) | (10.3) | |||||||||||||||||
| Other asset accounts | 6,304 | (5.1) | 3.5 | 6,304 | 21.2 | 26.7 | |||||||||||||||||
| Total assets | 99,166 | (5.3) | 3.2 | 99,166 | (6.1) | (1.8) | |||||||||||||||||
| Customer deposits | 53,971 | (4.4) | 4.2 | 53,971 | 3.8 | 8.5 | |||||||||||||||||
| Central banks and credit institutions | 14,882 | 2.2 | 11.4 | 14,882 | (28.0) | (24.7) | |||||||||||||||||
| Marketable debt securities | 8,674 | (3.8) | 4.9 | 8,674 | 1.1 | 5.7 | |||||||||||||||||
| Other financial liabilities | 9,395 | (16.2) | (8.6) | 9,395 | (18.5) | (14.8) | |||||||||||||||||
| Other liabilities accounts | 3,416 | (5.4) | 3.2 | 3,416 | 17.9 | 23.2 | |||||||||||||||||
| Total liabilities | 90,338 | (4.8) | 3.8 | 90,338 | (5.6) | (1.3) | |||||||||||||||||
| Total equity | 8,828 | (10.6) | (2.5) | 8,828 | (10.9) | (6.9) | |||||||||||||||||
| Memorandum items: | |||||||||||||||||||||||
Gross loans and advances to customers 2 | 47,325 | (8.1) | 0.2 | 47,325 | 1.9 | 6.4 | |||||||||||||||||
| Customer funds | 64,360 | (6.1) | 2.3 | 64,360 | 7.3 | 12.1 | |||||||||||||||||
Customer deposits 3 | 44,825 | (9.1) | (0.9) | 44,825 | 1.7 | 6.3 | |||||||||||||||||
| Mutual funds | 19,534 | 1.4 | 10.6 | 19,534 | 22.6 | 28.1 | |||||||||||||||||
| Ratios (%), operating means and customers | |||||||||||||||||||||||
| RoTE | 19.5 | 0.8 | 19.1 | 1.2 | |||||||||||||||||||
| Efficiency ratio | 41.4 | 0.0 | 41.4 | (0.7) | |||||||||||||||||||
| NPL ratio | 2.78 | 0.04 | 2.78 | 0.18 | |||||||||||||||||||
| NPL coverage ratio | 102.5 | 1.7 | 102.5 | (3.8) | |||||||||||||||||||
| Number of employees | 29,195 | (2.9) | 29,195 | (3.6) | |||||||||||||||||||
| Number of branches | 1,356 | (1.0) | 1,356 | (1.1) | |||||||||||||||||||
| Number of total customers (thousands) | 20,972 | 1.7 | 20,972 | 3.1 | |||||||||||||||||||
| Number of active customers (thousands) | 10,603 | 2.3 | 10,603 | 6.7 | |||||||||||||||||||
1. Includes exchange differences.
2. Excluding reverse repos.
3. Excluding repos.
January - June 2024 | | 69 | ||||||
Business model | |||||||||||||||||||||||||||||
| Segments information | |||||||||||||||||||||||||||||
| Other North America | |||||||||||||||||||||||
| EUR million | |||||||||||||||||||||||
| / | Q1'24 | / | H1'23 | ||||||||||||||||||||
| Underlying income statement | Q2'24 | % | % excl. FX | H1'24 | % | % excl. FX | |||||||||||||||||
| Net interest income | 2 | 224.7 | 228.4 | 2 | (32.9) | (32.9) | |||||||||||||||||
| Net fee income | 15 | 22.9 | 23.0 | 27 | 17.1 | 17.1 | |||||||||||||||||
Gains (losses) on financial transactions 1 | (2) | (78.0) | (78.5) | (10) | — | — | |||||||||||||||||
| Other operating income | 2 | (47.8) | (47.8) | 7 | 74.8 | 74.8 | |||||||||||||||||
| Total income | 17 | 98.5 | 100.0 | 26 | (13.3) | (13.3) | |||||||||||||||||
| Administrative expenses and amortizations | (51) | (9.1) | (9.1) | (107) | 10.2 | 10.2 | |||||||||||||||||
| Net operating income | (34) | (28.5) | (28.7) | (82) | 20.5 | 20.5 | |||||||||||||||||
| Net loan-loss provisions | (1) | — | — | (1) | (54.0) | (54.0) | |||||||||||||||||
| Other gains (losses) and provisions | (84) | 930.6 | 925.9 | (92) | — | — | |||||||||||||||||
| Profit before tax | (119) | 113.7 | 113.3 | (175) | 147.0 | 147.0 | |||||||||||||||||
| Tax on profit | 8 | (14.1) | (14.4) | 17 | — | — | |||||||||||||||||
| Profit from continuing operations | (111) | 138.4 | 137.9 | (158) | 90.8 | 90.8 | |||||||||||||||||
| Net profit from discontinued operations | — | — | — | — | — | — | |||||||||||||||||
| Consolidated profit | (111) | 138.4 | 137.9 | (158) | 90.8 | 90.8 | |||||||||||||||||
| Non-controlling interests | 1 | — | — | 1 | (66.7) | (66.7) | |||||||||||||||||
| Profit attributable to the parent | (111) | 136.5 | 136.0 | (158) | 94.0 | 94.0 | |||||||||||||||||
| Balance sheet | |||||||||||||||||||||||
| Loans and advances to customers | 35 | 1.0 | 1.0 | 35 | (36.7) | (36.7) | |||||||||||||||||
| Cash, central banks and credit institutions | 418 | 9.3 | 9.3 | 418 | 23.2 | 23.2 | |||||||||||||||||
| Debt instruments | 2 | (20.5) | (20.5) | 2 | 588.5 | 588.5 | |||||||||||||||||
| Other financial assets | 127 | 1.7 | 1.7 | 127 | (6.4) | (6.4) | |||||||||||||||||
| Other asset accounts | 311 | (17.0) | (17.0) | 311 | 2.4 | 2.4 | |||||||||||||||||
| Total assets | 892 | (2.9) | (2.9) | 892 | 7.0 | 7.0 | |||||||||||||||||
| Customer deposits | 332 | 25.8 | 25.8 | 332 | 65.7 | 65.7 | |||||||||||||||||
| Central banks and credit institutions | 243 | 1.1 | 1.1 | 243 | 34.3 | 34.1 | |||||||||||||||||
| Marketable debt securities | — | — | — | — | — | — | |||||||||||||||||
| Other financial liabilities | 120 | 0.2 | 0.2 | 120 | (9.9) | (9.9) | |||||||||||||||||
| Other liabilities accounts | 79 | 6.2 | 6.2 | 79 | 21.0 | 21.0 | |||||||||||||||||
| Total liabilities | 775 | 10.8 | 10.8 | 775 | 33.5 | 33.4 | |||||||||||||||||
| Total equity | 117 | (46.4) | (46.4) | 117 | (53.6) | (53.6) | |||||||||||||||||
| Memorandum items: | |||||||||||||||||||||||
Gross loans and advances to customers 2 | 42 | (3.0) | (3.0) | 42 | (33.7) | (33.7) | |||||||||||||||||
| Customer funds | 332 | 25.8 | 25.8 | 332 | 65.7 | 65.7 | |||||||||||||||||
Customer deposits 3 | 332 | 25.8 | 25.8 | 332 | 65.7 | 65.7 | |||||||||||||||||
| Mutual funds | — | — | — | — | — | — | |||||||||||||||||
| Resources | |||||||||||||||||||||||
| Number of employees | 1,447 | 9.5 | 1,447 | 28.4 | |||||||||||||||||||
1. Includes exchange differences.
2. Excluding reverse repos.
3. Excluding repos.
70 | | January - June 2024 | ||||||
Business model | |||||||||||||||||||||||||||||
| Segments information | |||||||||||||||||||||||||||||
| SOUTH AMERICA | |||||||||||||||||||||||
| EUR million | |||||||||||||||||||||||
| / | Q1'24 | / | H1'23 | ||||||||||||||||||||
| Underlying income statement | Q2'24 | % | % excl. FX | H1'24 | % | % excl. FX | |||||||||||||||||
| Net interest income | 3,649 | (12.8) | (10.5) | 7,835 | 21.0 | 23.0 | |||||||||||||||||
| Net fee income | 1,176 | (0.5) | 2.2 | 2,358 | (1.6) | 0.3 | |||||||||||||||||
Gains (losses) on financial transactions 1 | 81 | (61.1) | (61.1) | 288 | (60.3) | (59.1) | |||||||||||||||||
| Other operating income | (3) | (99.5) | (99.5) | (691) | 23.1 | 22.8 | |||||||||||||||||
| Total income | 4,903 | 0.3 | 3.1 | 9,790 | 8.3 | 10.5 | |||||||||||||||||
| Administrative expenses and amortizations | (1,636) | (10.6) | (8.3) | (3,466) | (1.9) | 0.1 | |||||||||||||||||
| Net operating income | 3,267 | 6.8 | 9.9 | 6,324 | 14.9 | 17.1 | |||||||||||||||||
| Net loan-loss provisions | (1,370) | (0.6) | 2.7 | (2,748) | 8.2 | 9.5 | |||||||||||||||||
| Other gains (losses) and provisions | (417) | 12.5 | 14.9 | (788) | 34.3 | 33.7 | |||||||||||||||||
| Profit before tax | 1,480 | 13.1 | 16.1 | 2,788 | 17.4 | 21.2 | |||||||||||||||||
| Tax on profit | (465) | 10.7 | 14.2 | (885) | 30.5 | 32.3 | |||||||||||||||||
| Profit from continuing operations | 1,015 | 14.2 | 16.9 | 1,903 | 12.1 | 16.6 | |||||||||||||||||
| Net profit from discontinued operations | — | — | — | — | — | — | |||||||||||||||||
| Consolidated profit | 1,015 | 14.2 | 16.9 | 1,903 | 12.1 | 16.6 | |||||||||||||||||
| Non-controlling interests | (130) | 41.0 | 43.0 | (222) | (7.4) | 0.8 | |||||||||||||||||
| Profit attributable to the parent | 885 | 11.1 | 13.9 | 1,681 | 15.3 | 19.1 | |||||||||||||||||
| Balance sheet | |||||||||||||||||||||||
| Loans and advances to customers | 150,100 | (2.3) | 2.7 | 150,100 | (4.3) | 7.6 | |||||||||||||||||
| Cash, central banks and credit institutions | 60,293 | (6.7) | 0.3 | 60,293 | 0.5 | 12.7 | |||||||||||||||||
| Debt instruments | 60,882 | (6.1) | (0.1) | 60,882 | (10.5) | 0.4 | |||||||||||||||||
| Other financial assets | 21,442 | (4.2) | (4.0) | 21,442 | (0.3) | 14.1 | |||||||||||||||||
| Other asset accounts | 18,493 | (5.8) | 0.3 | 18,493 | (2.8) | 8.8 | |||||||||||||||||
| Total assets | 311,210 | (4.3) | 1.0 | 311,210 | (4.3) | 7.6 | |||||||||||||||||
| Customer deposits | 142,779 | (4.8) | 1.0 | 142,779 | (2.8) | 8.8 | |||||||||||||||||
| Central banks and credit institutions | 51,053 | 3.5 | 8.3 | 51,053 | (3.7) | 8.1 | |||||||||||||||||
| Marketable debt securities | 37,209 | (5.4) | (0.1) | 37,209 | (10.2) | 1.9 | |||||||||||||||||
| Other financial liabilities | 44,376 | (8.7) | (4.3) | 44,376 | (4.1) | 8.8 | |||||||||||||||||
| Other liabilities accounts | 11,310 | (0.9) | 4.2 | 11,310 | (3.1) | 9.4 | |||||||||||||||||
| Total liabilities | 286,727 | (4.0) | 1.4 | 286,727 | (4.2) | 7.8 | |||||||||||||||||
| Total equity | 24,484 | (7.7) | (2.6) | 24,484 | (6.1) | 5.0 | |||||||||||||||||
| Memorandum items: | |||||||||||||||||||||||
Gross loans and advances to customers 2 | 157,379 | (2.1) | 3.0 | 157,379 | (4.5) | 7.4 | |||||||||||||||||
| Customer funds | 194,892 | (4.3) | 1.5 | 194,892 | (0.8) | 11.1 | |||||||||||||||||
Customer deposits 3 | 129,347 | (2.8) | 2.7 | 129,347 | (3.6) | 7.8 | |||||||||||||||||
| Mutual funds | 65,546 | (7.2) | (0.8) | 65,546 | 5.3 | 18.3 | |||||||||||||||||
| Ratios (%), operating means and customers | |||||||||||||||||||||||
| RoTE | 17.2 | 2.4 | 16.0 | 2.1 | |||||||||||||||||||
| Efficiency ratio | 33.4 | (4.1) | 35.4 | (3.7) | |||||||||||||||||||
| NPL ratio | 5.30 | (0.07) | 5.30 | (0.58) | |||||||||||||||||||
| NPL coverage ratio | 81.5 | 1.2 | 81.5 | 3.7 | |||||||||||||||||||
| Number of employees | 79,967 | (0.3) | 79,967 | (1.8) | |||||||||||||||||||
| Number of branches | 3,160 | (1.6) | 3,160 | (10.8) | |||||||||||||||||||
| Number of total customers (thousands) | 76,782 | 2.9 | 76,782 | 5.0 | |||||||||||||||||||
| Number of active customers (thousands) | 39,064 | 2.2 | 39,064 | 1.7 | |||||||||||||||||||
1. Includes exchange differences.
2. Excluding reverse repos.
3. Excluding repos.
January - June 2024 | | 71 | ||||||
Business model | |||||||||||||||||||||||||||||
| Segments information | |||||||||||||||||||||||||||||
| Brazil | Q | ||||||||||||||||||||||
| EUR million | |||||||||||||||||||||||
| / | Q1'24 | / | H1'23 | ||||||||||||||||||||
| Underlying income statement | Q2'24 | % | % excl. FX | H1'24 | % | % excl. FX | |||||||||||||||||
| Net interest income | 2,605 | (1.0) | 3.3 | 5,235 | 22.2 | 22.4 | |||||||||||||||||
| Net fee income | 888 | 4.9 | 9.3 | 1,734 | 3.6 | 3.8 | |||||||||||||||||
Gains (losses) on financial transactions 1 | (42) | — | — | (6) | — | — | |||||||||||||||||
| Other operating income | 27 | — | — | 21 | (13.2) | (13.0) | |||||||||||||||||
| Total income | 3,477 | (0.9) | 3.4 | 6,984 | 11.2 | 11.4 | |||||||||||||||||
| Administrative expenses and amortizations | (1,109) | (4.1) | 0.1 | (2,265) | 2.6 | 2.8 | |||||||||||||||||
| Net operating income | 2,368 | 0.7 | 5.1 | 4,719 | 15.8 | 16.1 | |||||||||||||||||
| Net loan-loss provisions | (1,158) | (0.4) | 3.9 | (2,322) | 7.3 | 7.6 | |||||||||||||||||
| Other gains (losses) and provisions | (251) | 19.1 | 23.8 | (462) | (7.7) | (7.5) | |||||||||||||||||
| Profit before tax | 958 | (1.9) | 2.4 | 1,935 | 37.3 | 37.5 | |||||||||||||||||
| Tax on profit | (318) | (11.2) | (7.2) | (677) | 41.0 | 41.2 | |||||||||||||||||
| Profit from continuing operations | 640 | 3.6 | 8.0 | 1,258 | 35.4 | 35.6 | |||||||||||||||||
| Net profit from discontinued operations | — | — | — | — | — | — | |||||||||||||||||
| Consolidated profit | 640 | 3.6 | 8.0 | 1,258 | 35.4 | 35.6 | |||||||||||||||||
| Non-controlling interests | (60) | 6.3 | 10.7 | (117) | 9.7 | 9.9 | |||||||||||||||||
| Profit attributable to the parent | 580 | 3.3 | 7.7 | 1,141 | 38.7 | 39.0 | |||||||||||||||||
| Balance sheet | |||||||||||||||||||||||
| Loans and advances to customers | 93,001 | (5.6) | 3.8 | 93,001 | (1.9) | 10.9 | |||||||||||||||||
| Cash, central banks and credit institutions | 49,670 | (4.5) | 5.0 | 49,670 | 3.5 | 17.0 | |||||||||||||||||
| Debt instruments | 46,565 | (3.4) | 6.3 | 46,565 | (0.7) | 12.3 | |||||||||||||||||
| Other financial assets | 7,761 | 1.6 | 11.8 | 7,761 | 0.9 | 14.1 | |||||||||||||||||
| Other asset accounts | 13,618 | (5.5) | 4.0 | 13,618 | (4.3) | 8.2 | |||||||||||||||||
| Total assets | 210,615 | (4.6) | 4.9 | 210,615 | (0.5) | 12.5 | |||||||||||||||||
| Customer deposits | 98,911 | (6.8) | 2.6 | 98,911 | 1.8 | 15.1 | |||||||||||||||||
| Central banks and credit institutions | 32,771 | 10.7 | 21.7 | 32,771 | 4.2 | 17.8 | |||||||||||||||||
| Marketable debt securities | 25,373 | (9.9) | (0.9) | 25,373 | (13.4) | (2.1) | |||||||||||||||||
| Other financial liabilities | 29,417 | (9.1) | 0.0 | 29,417 | (4.2) | 8.3 | |||||||||||||||||
| Other liabilities accounts | 8,087 | 9.6 | 20.6 | 8,087 | 30.7 | 47.8 | |||||||||||||||||
| Total liabilities | 194,559 | (4.4) | 5.1 | 194,559 | (0.1) | 12.9 | |||||||||||||||||
| Total equity | 16,056 | (6.8) | 2.5 | 16,056 | (4.3) | 8.2 | |||||||||||||||||
| Memorandum items: | |||||||||||||||||||||||
Gross loans and advances to customers 2 | 98,724 | (5.1) | 4.3 | 98,724 | (2.3) | 10.5 | |||||||||||||||||
| Customer funds | 135,611 | (6.1) | 3.2 | 135,611 | 3.5 | 17.0 | |||||||||||||||||
Customer deposits 3 | 85,548 | (4.1) | 5.5 | 85,548 | 1.1 | 14.3 | |||||||||||||||||
| Mutual funds | 50,063 | (9.5) | (0.4) | 50,063 | 7.8 | 21.9 | |||||||||||||||||
| Ratios (%), operating means and customers | |||||||||||||||||||||||
| RoTE | 16.3 | 0.9 | 15.9 | 3.8 | |||||||||||||||||||
| Efficiency ratio | 31.9 | (1.1) | 32.4 | (2.7) | |||||||||||||||||||
| NPL ratio | 5.96 | (0.09) | 5.96 | (1.03) | |||||||||||||||||||
| NPL coverage ratio | 90.4 | 3.5 | 90.4 | 7.6 | |||||||||||||||||||
| Number of employees | 56,803 | (0.4) | 56,803 | (2.9) | |||||||||||||||||||
| Number of branches | 2,446 | (1.8) | 2,446 | (11.8) | |||||||||||||||||||
| Number of total customers (thousands) | 66,362 | 3.0 | 66,362 | 4.8 | |||||||||||||||||||
| Number of active customers (thousands) | 31,872 | 2.4 | 31,872 | 0.1 | |||||||||||||||||||
1. Includes exchange differences.
2. Excluding reverse repos.
3. Excluding repos.
72 | | January - June 2024 | ||||||
Business model | |||||||||||||||||||||||||||||
| Segments information | |||||||||||||||||||||||||||||
| Chile | Q | ||||||||||||||||||||||
| EUR million | |||||||||||||||||||||||
| / | Q1'24 | / | H1'23 | ||||||||||||||||||||
| Underlying income statement | Q2'24 | % | % excl. FX | H1'24 | % | % excl. FX | |||||||||||||||||
| Net interest income | 472 | 34.1 | 31.4 | 824 | 13.3 | 32.2 | |||||||||||||||||
| Net fee income | 137 | 6.4 | 4.0 | 265 | (16.1) | (2.1) | |||||||||||||||||
Gains (losses) on financial transactions 1 | 54 | 3.6 | 1.3 | 107 | (40.0) | (30.0) | |||||||||||||||||
| Other operating income | (4) | (33.9) | (35.8) | (10) | — | — | |||||||||||||||||
| Total income | 659 | 25.1 | 22.5 | 1,187 | (3.4) | 12.7 | |||||||||||||||||
| Administrative expenses and amortizations | (241) | 7.6 | 5.2 | (465) | (10.6) | 4.3 | |||||||||||||||||
| Net operating income | 418 | 38.0 | 35.3 | 721 | 1.8 | 18.8 | |||||||||||||||||
| Net loan-loss provisions | (126) | 1.0 | (1.3) | (251) | 23.6 | 44.2 | |||||||||||||||||
| Other gains (losses) and provisions | (2) | (90.8) | (92.0) | (20) | — | — | |||||||||||||||||
| Profit before tax | 290 | 81.7 | 78.5 | 450 | (15.2) | (1.1) | |||||||||||||||||
| Tax on profit | (58) | 70.2 | 67.1 | (92) | 38.8 | 62.0 | |||||||||||||||||
| Profit from continuing operations | 232 | 84.8 | 81.6 | 358 | (23.0) | (10.1) | |||||||||||||||||
| Net profit from discontinued operations | — | — | — | — | — | — | |||||||||||||||||
| Consolidated profit | 232 | 84.8 | 81.6 | 358 | (23.0) | (10.1) | |||||||||||||||||
| Non-controlling interests | (70) | 99.3 | 95.9 | (105) | (21.7) | (8.7) | |||||||||||||||||
| Profit attributable to the parent | 162 | 79.2 | 76.0 | 253 | (23.5) | (10.7) | |||||||||||||||||
| Balance sheet | |||||||||||||||||||||||
| Loans and advances to customers | 40,597 | 3.6 | (1.1) | 40,597 | (11.0) | 3.0 | |||||||||||||||||
| Cash, central banks and credit institutions | 5,290 | (14.7) | (18.7) | 5,290 | (19.2) | (6.5) | |||||||||||||||||
| Debt instruments | 10,221 | (15.9) | (19.8) | 10,221 | (24.1) | (12.1) | |||||||||||||||||
| Other financial assets | 12,959 | (8.5) | (12.7) | 12,959 | (3.4) | 11.8 | |||||||||||||||||
| Other asset accounts | 2,563 | (11.5) | (15.6) | 2,563 | (8.0) | 6.5 | |||||||||||||||||
| Total assets | 71,630 | (4.0) | (8.4) | 71,630 | (12.4) | 1.3 | |||||||||||||||||
| Customer deposits | 28,390 | 2.0 | (2.7) | 28,390 | (7.8) | 6.7 | |||||||||||||||||
| Central banks and credit institutions | 11,699 | (14.6) | (18.6) | 11,699 | (23.8) | (11.8) | |||||||||||||||||
| Marketable debt securities | 10,852 | 6.6 | 1.6 | 10,852 | (4.6) | 10.4 | |||||||||||||||||
| Other financial liabilities | 13,529 | (9.0) | (13.2) | 13,529 | (4.1) | 10.9 | |||||||||||||||||
| Other liabilities accounts | 1,895 | (32.1) | (35.3) | 1,895 | (56.8) | (50.1) | |||||||||||||||||
| Total liabilities | 66,365 | (4.4) | (8.8) | 66,365 | (12.7) | 1.0 | |||||||||||||||||
| Total equity | 5,265 | 1.4 | (3.3) | 5,265 | (8.9) | 5.4 | |||||||||||||||||
| Memorandum items: | |||||||||||||||||||||||
Gross loans and advances to customers 2 | 41,782 | 3.7 | (1.1) | 41,782 | (10.9) | 3.1 | |||||||||||||||||
| Customer funds | 39,591 | 4.1 | (0.7) | 39,591 | (3.5) | 11.7 | |||||||||||||||||
Customer deposits 3 | 28,321 | 2.0 | (2.7) | 28,321 | (7.5) | 7.0 | |||||||||||||||||
| Mutual funds | 11,270 | 9.8 | 4.7 | 11,270 | 8.4 | 25.5 | |||||||||||||||||
| Ratios (%), operating means and customers | |||||||||||||||||||||||
| RoTE | 17.9 | 8.1 | 13.7 | (2.7) | |||||||||||||||||||
| Efficiency ratio | 36.6 | (6.0) | 39.2 | (3.2) | |||||||||||||||||||
| NPL ratio | 5.12 | 0.17 | 5.12 | 0.17 | |||||||||||||||||||
| NPL coverage ratio | 53.1 | (1.1) | 53.1 | (3.1) | |||||||||||||||||||
| Number of employees | 9,519 | (2.3) | 9,519 | (4.1) | |||||||||||||||||||
| Number of branches | 242 | (1.2) | 242 | (6.6) | |||||||||||||||||||
| Number of total customers (thousands) | 4,049 | 2.2 | 4,049 | 8.4 | |||||||||||||||||||
| Number of active customers (thousands) | 2,492 | 2.4 | 2,492 | 14.0 | |||||||||||||||||||
1. Includes exchange differences.
2. Excluding reverse repos.
3. Excluding repos.
January - June 2024 | | 73 | ||||||
Business model | |||||||||||||||||||||||||||||
| Segments information | |||||||||||||||||||||||||||||
| Argentina | ||||||||||||||||||||
| EUR million | ||||||||||||||||||||
| / Q1'24 | / H1'23 | |||||||||||||||||||
| Underlying income statement | Q2'24 | Q1'24 | % | H1'24 | % | |||||||||||||||
| Net interest income | 397 | 1,025 | (61.2) | 1,423 | 25.0 | |||||||||||||||
| Net fee income | 73 | 131 | (44.6) | 204 | (27.6) | |||||||||||||||
Gains (losses) on financial transactions 1 | 18 | 76 | (76.3) | 93 | (52.1) | |||||||||||||||
| Other operating income | (23) | (677) | (96.5) | (700) | 19.6 | |||||||||||||||
| Total income | 465 | 555 | (16.4) | 1,020 | (0.9) | |||||||||||||||
| Administrative expenses and amortizations | (129) | (286) | (54.9) | (414) | (20.5) | |||||||||||||||
| Net operating income | 336 | 270 | 24.4 | 606 | 19.3 | |||||||||||||||
| Net loan-loss provisions | (31) | (35) | (11.6) | (66) | (32.0) | |||||||||||||||
| Other gains (losses) and provisions | (77) | (131) | (41.0) | (208) | 100.7 | |||||||||||||||
| Profit before tax | 228 | 104 | 118.6 | 332 | 7.9 | |||||||||||||||
| Tax on profit | (63) | (3) | — | (66) | 19.5 | |||||||||||||||
| Profit from continuing operations | 165 | 102 | 62.0 | 267 | 5.4 | |||||||||||||||
| Net profit from discontinued operations | — | — | — | — | — | |||||||||||||||
| Consolidated profit | 165 | 102 | 62.0 | 267 | 5.4 | |||||||||||||||
| Non-controlling interests | 0 | 0 | 29.1 | (1) | (6.6) | |||||||||||||||
| Profit attributable to the parent | 164 | 101 | 62.1 | 266 | 5.4 | |||||||||||||||
| Balance sheet | ||||||||||||||||||||
| Loans and advances to customers | 5,256 | 5,229 | 0.5 | 5,256 | (15.3) | |||||||||||||||
| Cash, central banks and credit institutions | 2,276 | 3,829 | (40.6) | 2,276 | (21.8) | |||||||||||||||
| Debt instruments | 1,841 | 1,754 | 5.0 | 1,841 | (63.4) | |||||||||||||||
| Other financial assets | 54 | 49 | 11.5 | 54 | 37.2 | |||||||||||||||
| Other asset accounts | 671 | 1,121 | (40.2) | 671 | (34.4) | |||||||||||||||
| Total assets | 10,099 | 11,982 | (15.7) | 10,099 | (33.6) | |||||||||||||||
| Customer deposits | 5,553 | 6,346 | (12.5) | 5,553 | (44.0) | |||||||||||||||
| Central banks and credit institutions | 1,590 | 1,666 | (4.6) | 1,590 | (8.5) | |||||||||||||||
| Marketable debt securities | 180 | 189 | (4.5) | 180 | 22.2 | |||||||||||||||
| Other financial liabilities | 920 | 837 | 10.0 | 920 | (4.1) | |||||||||||||||
| Other liabilities accounts | 285 | 579 | (50.7) | 285 | (45.0) | |||||||||||||||
| Total liabilities | 8,529 | 9,617 | (11.3) | 8,529 | (35.8) | |||||||||||||||
| Total equity | 1,570 | 2,364 | (33.6) | 1,570 | (18.6) | |||||||||||||||
| Memorandum items: | ||||||||||||||||||||
Gross loans and advances to customers 2 | 5,368 | 5,357 | 0.2 | 5,368 | (16.0) | |||||||||||||||
| Customer funds | 8,676 | 10,392 | (16.5) | 8,676 | (39.4) | |||||||||||||||
Customer deposits 3 | 5,553 | 6,346 | (12.5) | 5,553 | (44.0) | |||||||||||||||
| Mutual funds | 3,123 | 4,046 | (22.8) | 3,123 | (28.9) | |||||||||||||||
| Ratios (%), operating means and customers | ||||||||||||||||||||
| RoTE | 54.5 | 34.0 | 39.1 | 8.5 | ||||||||||||||||
| Efficiency ratio | 27.7 | (23.7) | 40.6 | (10.0) | ||||||||||||||||
| NPL ratio | 1.51 | (0.32) | 1.51 | (0.41) | ||||||||||||||||
| NPL coverage ratio | 145.2 | (2.1) | 145.2 | (17.9) | ||||||||||||||||
| Number of employees | 8,356 | 0.0 | 8,356 | 1.49 | ||||||||||||||||
| Number of branches | 314 | (1.3) | 314 | (13.3) | ||||||||||||||||
| Number of total customers (thousands) | 4,938 | 2.4 | 4,938 | 8.18 | ||||||||||||||||
| Number of active customers (thousands) | 3,590 | 0.4 | 3,590 | 13.2 | ||||||||||||||||
1. Includes exchange differences.
2. Excluding reverse repos.
3. Excluding repos.
74 | | January - June 2024 | ||||||
Business model | |||||||||||||||||||||||||||||
| Segments information | |||||||||||||||||||||||||||||
| Other South America | |||||||||||||||||||||||
| EUR million | |||||||||||||||||||||||
| / | Q1'24 | / | H1'23 | ||||||||||||||||||||
| Underlying income statement | Q2'24 | % | % excl. FX | H1'24 | % | % excl. FX | |||||||||||||||||
| Net interest income | 175 | (1.4) | (2.7) | 353 | 8.2 | 6.6 | |||||||||||||||||
| Net fee income | 78 | 4.0 | 3.0 | 154 | 26.4 | 22.7 | |||||||||||||||||
Gains (losses) on financial transactions 1 | 50 | 15.6 | 14.4 | 94 | 64.2 | 54.8 | |||||||||||||||||
| Other operating income | (2) | — | — | (2) | (71.3) | (72.5) | |||||||||||||||||
| Total income | 302 | 1.6 | 0.4 | 599 | 20.2 | 17.4 | |||||||||||||||||
| Administrative expenses and amortizations | (157) | (3.7) | (4.5) | (321) | 12.7 | 10.3 | |||||||||||||||||
| Net operating income | 145 | 8.0 | 6.3 | 278 | 30.0 | 26.7 | |||||||||||||||||
| Net loan-loss provisions | (54) | (1.5) | (2.7) | (109) | 40.4 | 37.2 | |||||||||||||||||
| Other gains (losses) and provisions | (87) | 688.4 | 686.8 | (98) | — | — | |||||||||||||||||
| Profit before tax | 3 | (95.6) | (96.8) | 71 | (44.6) | (46.2) | |||||||||||||||||
| Tax on profit | (25) | 2.5 | 0.9 | (50) | (34.8) | (35.8) | |||||||||||||||||
| Profit from continuing operations | (22) | — | — | 21 | (59.0) | (61.0) | |||||||||||||||||
| Net profit from discontinued operations | — | — | — | — | — | — | |||||||||||||||||
| Consolidated profit | (22) | — | — | 21 | (59.0) | (61.0) | |||||||||||||||||
| Non-controlling interests | 1 | — | — | 1 | (67.7) | (67.7) | |||||||||||||||||
| Profit attributable to the parent | (21) | — | — | 22 | (59.3) | (61.2) | |||||||||||||||||
| Balance sheet | |||||||||||||||||||||||
| Loans and advances to customers | 11,246 | 4.5 | 8.8 | 11,246 | 10.3 | 12.5 | |||||||||||||||||
| Cash, central banks and credit institutions | 3,057 | 19.8 | 23.8 | 3,057 | 21.7 | 24.0 | |||||||||||||||||
| Debt instruments | 2,254 | (17.4) | (14.0) | 2,254 | (13.8) | (11.1) | |||||||||||||||||
| Other financial assets | 668 | 26.7 | 32.1 | 668 | 89.2 | 89.1 | |||||||||||||||||
| Other asset accounts | 1,642 | 36.5 | 39.1 | 1,642 | 65.2 | 67.3 | |||||||||||||||||
| Total assets | 18,866 | 6.2 | 10.3 | 18,866 | 13.2 | 15.5 | |||||||||||||||||
| Customer deposits | 9,924 | 2.1 | 6.2 | 9,924 | 10.6 | 13.6 | |||||||||||||||||
| Central banks and credit institutions | 4,993 | 15.6 | 19.8 | 4,993 | 12.3 | 13.1 | |||||||||||||||||
| Marketable debt securities | 803 | 2.2 | 6.2 | 803 | 28.1 | 32.7 | |||||||||||||||||
| Other financial liabilities | 510 | (6.8) | (3.4) | 510 | 7.6 | 8.2 | |||||||||||||||||
| Other liabilities accounts | 1,043 | 58.5 | 63.7 | 1,043 | 82.4 | 87.5 | |||||||||||||||||
| Total liabilities | 17,273 | 7.7 | 11.9 | 17,273 | 14.5 | 16.8 | |||||||||||||||||
| Total equity | 1,593 | (8.1) | (4.9) | 1,593 | 0.6 | 2.9 | |||||||||||||||||
| Memorandum items: | |||||||||||||||||||||||
Gross loans and advances to customers 2 | 11,505 | 4.5 | 8.7 | 11,505 | 10.5 | 12.8 | |||||||||||||||||
| Customer funds | 11,014 | 2.1 | 6.2 | 11,014 | 10.3 | 13.4 | |||||||||||||||||
Customer deposits 3 | 9,924 | 2.1 | 6.2 | 9,924 | 10.6 | 13.6 | |||||||||||||||||
| Mutual funds | 1,090 | 2.5 | 6.8 | 1,090 | 7.7 | 11.6 | |||||||||||||||||
| Resources | |||||||||||||||||||||||
| Number of employees | 5,289 | 3.5 | 5,289 | 11.4 | |||||||||||||||||||
1. Includes exchange differences.
2. Excluding reverse repos.
3. Excluding repos.
January - June 2024 | | 75 | ||||||
Alternative performance measures (APMs)
In addition to the financial information prepared under IFRS, this consolidated directors’ report contains financial measures that constitute alternative performance measures (APMs) to comply with the guidelines on alternative performance measures issued by the European Securities and Markets Authority on 5 October 2015 and non-IFRS measures.
The financial measures contained in this consolidated directors’ report that qualify as APMs and non-IFRS measures have been calculated using the financial information from Santander but are not defined or detailed in the applicable financial information framework or under IFRS and therefore have neither been audited nor are susceptible to being fully audited.
We use these APMs and non-IFRS measures when planning, monitoring and evaluating our performance. We consider these APMs and non-IFRS financial measures to be useful metrics for management and investors to facilitate operating performance comparisons from period to period. While we believe that these APMs and non-IFRS financial measures are useful in evaluating our business, this information should be considered as supplemental in nature and is not meant as a substitute of IFRS measures. In addition, the way in which Santander defines and
calculates these APMs and non-IFRS measures may differ from the calculations by other companies with similar measures and, therefore, may not be comparable.
The APMs and non-IFRS measures we use in this document can be categorized as follows:
Underlying results
In addition to IFRS results measures, we present some results measures which are non-IFRS and which we refer to as underlying measures. These measures allow in our view a better year-on-year comparability given that they exclude items outside the ordinary performance of our business (e.g. capital gains, write-downs, impairment of goodwill) or certain line items have been reclassified in the underlying ("adjusted") income statement, as their impact on profit is zero, to facilitate comparisons with prior quarters and better understand the trends in the business.
In addition, in the section "Financial information by segment", relative to the primary and secondary segments, results are only presented on an underlying basis in accordance with IFRS 8, and reconciled on an aggregate basis to our IFRS consolidated results to the consolidated financial statements, which are set out below.
| Reconciliation of underlying results to statutory results | |||||||||||
| EUR million | |||||||||||
| January-June 2024 | |||||||||||
| Statutory results | Adjustments | Underlying results | |||||||||
| Net interest income | 23,457 | — | 23,457 | ||||||||
| Net fee income | 6,477 | — | 6,477 | ||||||||
Gains (losses) on financial transactions 1 | 957 | — | 957 | ||||||||
| Other operating income | (176) | 335 | 159 | ||||||||
| Total income | 30,715 | 335 | 31,050 | ||||||||
| Administrative expenses and amortizations | (12,913) | — | (12,913) | ||||||||
| Net operating income | 17,802 | 335 | 18,137 | ||||||||
| Net loan-loss provisions | (6,595) | 352 | (6,243) | ||||||||
| Other gains (losses) and provisions | (1,699) | (687) | (2,386) | ||||||||
| Profit before tax | 9,508 | — | 9,508 | ||||||||
| Tax on profit | (2,916) | — | (2,916) | ||||||||
| Profit from continuing operations | 6,592 | — | 6,592 | ||||||||
| Net profit from discontinued operations | — | — | — | ||||||||
| Consolidated profit | 6,592 | — | 6,592 | ||||||||
| Non-controlling interests | (533) | — | (533) | ||||||||
| Profit attributable to the parent | 6,059 | — | 6,059 | ||||||||
1. Includes exchange differences.
| Explanation of adjustments: | |||||
| 1. | Temporary levy on revenue in Spain in Q1 2024, totalling EUR 335 million, which was moved from total income to other gains (losses) and provisions. | ||||
| 2. | Provisions which strengthen the balance sheet in Brazil of EUR 352 million in Q2 2024 (EUR 174 million net of tax and minority interests). | ||||
76 | | January - June 2024 | ||||||
| Reconciliation of underlying results to statutory results | |||||||||||
| EUR million | |||||||||||
| January-June 2023 | |||||||||||
| Statutory results | Adjustments | Underlying results | |||||||||
| Net interest income | 20,920 | — | 20,920 | ||||||||
| Net fee income | 6,103 | — | 6,103 | ||||||||
Gains (losses) on financial transactions 1 | 1,302 | — | 1,302 | ||||||||
| Other operating income | (315) | 224 | (91) | ||||||||
| Total income | 28,010 | 224 | 28,234 | ||||||||
| Administrative expenses and amortizations | (12,479) | — | (12,479) | ||||||||
| Net operating income | 15,531 | 224 | 15,755 | ||||||||
| Net loan-loss provisions | (6,245) | 474 | (5,771) | ||||||||
| Other gains (losses) and provisions | (1,196) | (459) | (1,655) | ||||||||
| Profit before tax | 8,090 | 239 | 8,329 | ||||||||
| Tax on profit | (2,281) | (213) | (2,494) | ||||||||
| Profit from continuing operations | 5,809 | 26 | 5,835 | ||||||||
| Net profit from discontinued operations | — | — | — | ||||||||
| Consolidated profit | 5,809 | 26 | 5,835 | ||||||||
| Non-controlling interests | (568) | (26) | (594) | ||||||||
| Profit attributable to the parent | 5,241 | — | 5,241 | ||||||||
1. Includes exchange differences.
| Explanation of adjustments: | |||||
| 1. | Temporary levy on revenue in Spain in Q1 2023, totalling EUR 224 million, which was moved from total income to other gains (losses) and provisions. | ||||
| 2. | Provisions which strengthen the balance sheet in Brazil in Q1 2023, totalling EUR 235 million, net of tax and non-controlling interests (EUR 474 million recorded in net loan-loss provisions, EUR 213 million positive impact in tax and EUR 26 million in non-controlling interests). | ||||
January - June 2024 | | 77 | ||||||
Profitability and efficiency ratios
The purpose of the profitability and efficiency ratios is to measure the ratio of profit to capital, to tangible capital, to assets and to risk- weighted assets, while the efficiency ratio measures how much general administrative expenses (personnel and other) and amortization costs are needed to generate revenue.
Additionally, goodwill adjustments have been removed from the RoTE numerator as, since they are not considered in the denominator, we believe this calculation is more correct.
| Ratio | Formula | Relevance of the metric | ||||||||||||
| RoE | Profit attributable to the parent (annualized) | This ratio measures the return that shareholders obtain on the funds invested in the bank and as such measures the company's ability to pay shareholders. | ||||||||||||
| (Return on equity) | Average stockholders’ equity 1 (excl. minority interests) | |||||||||||||
| RoTE | Profit attributable to the parent (annualized)2 | This indicator is used to evaluate the profitability of the company as a percentage of its tangible equity. It's measured as the return that shareholders receive as a percentage of the funds invested in the entity less intangible assets. | ||||||||||||
| (Return on tangible equity) | Average stockholders' equity 1 (excl. minority interests) - intangible assets | |||||||||||||
| RoA | Consolidated profit (annualized) | This metric measures the profitability of a company as a percentage of its total assets. It is an indicator that reflects the efficiency of the company's total funds in generating profit. | ||||||||||||
| (Return on assets) | Average total assets | |||||||||||||
| RoRWA | Consolidated profit (annualized) | The return adjusted for risk is a derivative of the RoA metric. The difference is that RoRWA measures profit in relation to the bank's risk-weighted assets. | ||||||||||||
| (Return on risk-weighted assets) | Average risk-weighted assets | |||||||||||||
| Efficiency ratio | Operating expenses 3 | One of the most commonly used indicators when comparing productivity of different financial entities. It measures the amount of funds used to generate the bank's total income. | ||||||||||||
| Total income | ||||||||||||||
1. Stockholders’ equity = Capital and Reserves + Accumulated other comprehensive income + Profit attributable to the parent + Dividends.
2. Excluding the adjustment to the valuation of goodwill.
3. Operating expenses = Administrative expenses + amortizations.
78 | | January - June 2024 | ||||||
Profitability and efficiency 1, 2 | Q2'24 | Q1'24 | H1'24 | H1'23 | ||||||||||
| (EUR million and %) | ||||||||||||||
| RoE | 13.4 | % | 11.8 | % | 12.6 | % | 11.5 | % | ||||||
| Profit attributable to the parent (annualized) | 12,827 | 11,409 | 12,118 | 10,482 | ||||||||||
| Average stockholders' equity (excluding minority interests) | 95,994 | 96,308 | 96,151 | 91,368 | ||||||||||
| RoTE | 16.8 | % | 14.9 | % | 15.9 | % | 14.5 | % | ||||||
| Profit attributable to the parent (annualized) | 12,827 | 11,409 | 12,118 | 10,482 | ||||||||||
| (-) Goodwill impairment | -2 | — | -2 | — | ||||||||||
| Profit attributable to the parent excluding goodwill impairment (annualized) | 12,829 | 11,409 | 12,120 | 10,482 | ||||||||||
| Average stockholders' equity (excluding minority interests) | 95,994 | 96,308 | 96,151 | 91,368 | ||||||||||
| (-) Average intangible assets | 19,621 | 19,888 | 19,755 | 19,051 | ||||||||||
| Average stockholders' equity (excl. minority interests) - intangible assets | 76,373 | 76,420 | 76,396 | 72,317 | ||||||||||
| RoA | 0.78 | % | 0.69 | % | 0.74 | % | 0.67 | % | ||||||
| Consolidated profit (annualized) | 13,906 | 12,461 | 13,184 | 11,671 | ||||||||||
| Average total assets | 1,780,522 | 1,804,334 | 1,792,428 | 1,754,207 | ||||||||||
| RoRWA | 2.18 | % | 1.96 | % | 2.07 | % | 1.88 | % | ||||||
| Consolidated profit (annualized) | 13,906 | 12,461 | 13,184 | 11,671 | ||||||||||
| Average risk-weighted assets | 636,621 | 635,673 | 636,147 | 620,647 | ||||||||||
| Efficiency ratio | 40.6 | % | 42.6 | % | 41.6 | % | 44.2 | % | ||||||
| Underlying operating expenses | 6,366 | 6,547 | 12,913 | 12,479 | ||||||||||
| Operating expenses | 6,366 | 6,547 | 12,913 | 12,479 | ||||||||||
| Adjustments to operating expenses for items outside ordinary course of businesses | — | — | — | — | ||||||||||
| Underlying total income | 15,670 | 15,380 | 31,050 | 28,234 | ||||||||||
| Total income | 15,670 | 15,045 | 30,715 | 28,010 | ||||||||||
| Adjustments to total income for items outside ordinary course of businesses | — | 335 | 335 | 224 | ||||||||||
1.Averages included in the RoE, RoTE, RoA and RoRWA denominators are calculated using the monthly average over the period, which we believe should not differ materially from using daily balances. | ||||||||||||||
2.The risk-weighted assets included in the denominator of the RoRWA metric are calculated in line with the criteria laid out in the CRR (Capital Requirements Regulation). | ||||||||||||||
January - June 2024 | | 79 | ||||||
| Ratio | Formula | Relevance of the metric | ||||||||||||
| Global business RoTE | Profit attributable to the parent excluding goodwill impairment (annualized) | This indicator is used to evaluate the profitability of the company as a percentage of its tangible equity. It's measured as the return that shareholders receive as a percentage of the funds invested in the entity less intangible assets. | ||||||||||||
Average stockholders' equity (excl. minority interests) - intangible assets 1 | ||||||||||||||
1.Allocated according to RWA consumption.
| RoTE (EUR million and %) | ||||||||||||||||||||
| H1'24 | H1'23 | |||||||||||||||||||
| % | Numerator | Denominator | % | Numerator | Denominator | |||||||||||||||
| Retail & Commercial Banking | 17.4 | 6,654 | 38,193 | 13.3 | 4,843 | 36,417 | ||||||||||||||
| Digital Consumer Bank | 12.8 | 2,140 | 16,752 | 12.5 | 2,055 | 16,502 | ||||||||||||||
| Corporate & Investment Banking | 19.0 | 2,810 | 14,825 | 21.2 | 2,955 | 13,909 | ||||||||||||||
| Wealth Management & Insurance | 79.3 | 1,636 | 2,062 | 75.9 | 1,422 | 1,873 | ||||||||||||||
| Payments | 3.8 | 98 | 2,543 | 17.8 | 446 | 2,504 | ||||||||||||||
| PagoNxt | - | - | - | - | - | - | ||||||||||||||
| Cards | 35.0 | 706 | 2,018 | 32.9 | 652 | 1,985 | ||||||||||||||
| Europe | 16.4 | 6,375 | 38,885 | 13.5 | 5,071 | 37,547 | ||||||||||||||
| Spain | 20.4 | 3,512 | 17,215 | 13.4 | 2,264 | 16,856 | ||||||||||||||
| United Kingdom | 10.8 | 1,260 | 11,633 | 13.9 | 1,636 | 11,795 | ||||||||||||||
| Portugal | 28.8 | 1,125 | 3,903 | 18.7 | 642 | 3,432 | ||||||||||||||
| Poland | 19.4 | 773 | 3,984 | 17.9 | 642 | 3,583 | ||||||||||||||
| DCB Europe | 8.9 | 905 | 10,170 | 10.8 | 1,042 | 9,656 | ||||||||||||||
| North America | 11.7 | 2,693 | 23,080 | 11.1 | 2,691 | 24,293 | ||||||||||||||
| US | 9.2 | 1,329 | 14,370 | 8.5 | 1,334 | 15,759 | ||||||||||||||
| Mexico | 19.1 | 1,680 | 8,778 | 17.9 | 1,520 | 8,497 | ||||||||||||||
| South America | 16.0 | 3,364 | 20,996 | 14.0 | 2,916 | 20,886 | ||||||||||||||
| Brazil | 15.9 | 2,284 | 14,404 | 12.0 | 1,646 | 13,670 | ||||||||||||||
| Chile | 13.7 | 505 | 3,685 | 16.5 | 660 | 4,011 | ||||||||||||||
| Argentina | 39.1 | 532 | 1,359 | 30.7 | 504 | 1,645 | ||||||||||||||
Numerator: profit attributable to the parent excluding goodwill impairment (annualized).
Denominator: average stockholders' equity (excluding minority interests) - intangible assets, for global businesses allocated according to RWA consumption.
PagoNxt's RoTE is not provided as we do not consider it a relevant metric to measure performance in this type of business.
PagoNxt's RoTE is not provided as we do not consider it a relevant metric to measure performance in this type of business.
| Efficiency ratio (EUR million and %) | ||||||||||||||||||||
| H1'24 | H1'23 | |||||||||||||||||||
| % | Numerator | Denominator | % | Numerator | Denominator | |||||||||||||||
| Retail & Commercial Banking | 39.5 | 6,423 | 16,274 | 44.3 | 6,374 | 14,392 | ||||||||||||||
| Digital Consumer Bank | 40.6 | 2,618 | 6,449 | 43.3 | 2,608 | 6,026 | ||||||||||||||
| Corporate & Investment Banking | 43.4 | 1,817 | 4,188 | 38.2 | 1,512 | 3,956 | ||||||||||||||
| Wealth Management & Insurance | 34.4 | 615 | 1,789 | 36.7 | 584 | 1,589 | ||||||||||||||
| Payments | 46.9 | 1,266 | 2,701 | 46.4 | 1,212 | 2,613 | ||||||||||||||
| PagoNxt | 103.0 | 601 | 583 | 109.9 | 572 | 521 | ||||||||||||||
| Cards | 31.4 | 665 | 2,117 | 30.6 | 640 | 2,092 | ||||||||||||||
| Europe | 39.3 | 4,602 | 11,718 | 41.9 | 4,382 | 10,464 | ||||||||||||||
| Spain | 34.1 | 2,065 | 6,065 | 39.9 | 2,039 | 5,113 | ||||||||||||||
| United Kingdom | 57.7 | 1,451 | 2,516 | 49.4 | 1,363 | 2,759 | ||||||||||||||
| Portugal | 23.4 | 267 | 1,142 | 32.1 | 265 | 824 | ||||||||||||||
| Poland | 27.2 | 466 | 1,711 | 26.8 | 405 | 1,509 | ||||||||||||||
| DCB Europe | 46.2 | 1,319 | 2,854 | 49.4 | 1,314 | 2,658 | ||||||||||||||
| North America | 47.6 | 3,352 | 7,039 | 47.7 | 3,060 | 6,417 | ||||||||||||||
| US | 50.5 | 1,903 | 3,769 | 49.6 | 1,799 | 3,624 | ||||||||||||||
| Mexico | 41.4 | 1,343 | 3,244 | 42.1 | 1,163 | 2,763 | ||||||||||||||
| South America | 35.4 | 3,466 | 9,790 | 39.1 | 3,534 | 9,037 | ||||||||||||||
| Brazil | 32.4 | 2,265 | 6,984 | 35.1 | 2,207 | 6,281 | ||||||||||||||
| Chile | 39.2 | 465 | 1,187 | 42.4 | 521 | 1,229 | ||||||||||||||
| Argentina | 40.6 | 414 | 1,020 | 50.7 | 522 | 1,029 | ||||||||||||||
Denominator: underlying total income.
80 | | January - June 2024 | ||||||
Credit risk indicators
The credit risk indicators measure the quality of the credit portfolio and the percentage of non-performing loans covered by provisions.
| Ratio | Formula | Relevance of the metric | ||||||||||||
| NPL ratio (Non-performing loans) | Credit impaired loans and advances to customers, customer guarantees and customer commitments granted | The NPL ratio is an important variable regarding financial institutions' activity since it gives an indication of the level of risk the entities are exposed to. It calculates risks that are, in accounting terms, declared to be credit impaired as a percentage of the total outstanding amount of customer credit and contingent liabilities. | ||||||||||||
Total Risk 1 | ||||||||||||||
| Total coverage ratio | Total allowances to cover impairment losses on loans and advances to customers, customer guarantees and customer commitments granted | The total coverage ratio is a fundamental metric in the financial sector. It reflects the level of provisions as a percentage of the credit impaired assets. Therefore it is a good indicator of the entity's solvency against customer defaults both present and future. | ||||||||||||
| Credit impaired loans and advances to customers, customer guarantees and customer commitments granted | ||||||||||||||
| Cost of risk | Allowances for loan-loss provisions over the last 12 months | This ratio quantifies loan-loss provisions arising from credit risk over a defined period of time for a given loan portfolio. As such, it acts as an indicator of credit quality. | ||||||||||||
| Average loans and advances to customers over the last 12 months | ||||||||||||||
1. Total risk = Total loans and advances and guarantees to customers (including credit impaired assets) + contingent liabilities granted that are credit impaired.
| Credit risk (I) | Jun-24 | Mar-24 | Jun-23 | ||||||||
| (EUR million and %) | |||||||||||
| NPL ratio | 3.02 | % | 3.10 | % | 3.07 | % | |||||
| Credit impaired loans and advances to customers, customer guarantees and customer commitments granted | 35,091 | 35,637 | 34,949 | ||||||||
| Gross loans and advances to customers registered under the headings “financial assets measured at amortized cost” and "financial assets designated at fair value through profit or loss" classified in stage 3 (OCI), excluding POCI (Purchased or Originated Credit Impaired) | 33,362 | 33,885 | 33,045 | ||||||||
| POCI exposure (Purchased or Originated Credit Impaired) that is additionally impaired | 252 | 262 | 251 | ||||||||
| Customer guarantees and customer commitments granted classified in stage 3 | 1,467 | 1,481 | 1,643 | ||||||||
| Doubtful exposure of loans and advances to customers at fair value through profit or loss | 10 | 9 | 10 | ||||||||
| Total risk | 1,163,654 | 1,150,459 | 1,137,823 | ||||||||
| Impaired and non-impaired gross loans and advances to customers | 1,088,220 | 1,072,377 | 1,068,190 | ||||||||
| Impaired and non-impaired customer guarantees and customer commitments granted | 75,434 | 78,082 | 69,633 | ||||||||
January - June 2024 | | 81 | ||||||
| Credit risk (II) | Jun-24 | Mar-24 | Jun-23 | ||||||||
| (EUR million and %) | |||||||||||
| Total coverage ratio | 66 | % | 66 | % | 68 | % | |||||
| Total allowances to cover impairment losses on loans and advances to customers, customer guarantees and customer commitments granted | 23,323 | 23,542 | 23,902 | ||||||||
| Total allowances to cover impairment losses on loans and advances to customers measured at amortized cost and designated at fair value through OCI | 22,625 | 22,844 | 23,146 | ||||||||
| Total allowances to cover impairment losses on customer guarantees and customer commitments granted | 698 | 698 | 756 | ||||||||
| Credit impaired loans and advances to customers, customer guarantees and customer commitments granted | 35,091 | 35,637 | 34,949 | ||||||||
| Gross loans and advances to customers registered under the headings “financial assets measured at amortized cost” and "financial assets designated at fair value through profit or loss" classified in stage 3 (OCI), excluding POCI (Purchased or Originated Credit Impaired) | 33,362 | 33,885 | 33,045 | ||||||||
| POCI exposure (Purchased or Originated Credit Impaired) that is additionally impaired | 252 | 262 | 251 | ||||||||
| Customer guarantees and customer commitments granted classified in stage 3 | 1,467 | 1,481 | 1,643 | ||||||||
| Doubtful exposure of loans and advances to customers at fair value through profit or loss | 10 | 9 | 10 | ||||||||
| Cost of risk | 1.21 | % | 1.20 | % | 1.08 | % | |||||
| Underlying allowances for loan-loss provisions over the last 12 months | 12,930 | 12,710 | 11,545 | ||||||||
| Allowances for loan-loss provisions over the last 12 months | 13,282 | 12,710 | 12,019 | ||||||||
| Adjustments to loan-loss provisions for items outside ordinary course of businesses | -352 | -474 | |||||||||
| Average loans and advances to customers over the last 12 months | 1,064,870 | 1,060,024 | 1,070,729 | ||||||||
| NPL ratio | ||||||||||||||||||||
| (EUR million and %) | ||||||||||||||||||||
| H1'24 | H1'23 | |||||||||||||||||||
| % | Numerator | Denominator | % | Numerator | Denominator | |||||||||||||||
| Retail & Commercial Banking | 3.15 | 20,667 | 655,637 | 3.22 | 21,464 | 666,677 | ||||||||||||||
| Digital Consumer Bank | 4.81 | 10,280 | 213,667 | 4.18 | 8,383 | 200,578 | ||||||||||||||
| Corporate & Investment Banking | 1.05 | 2,533 | 242,196 | 1.38 | 3,012 | 218,285 | ||||||||||||||
| Wealth Management & Insurance | 0.77 | 183 | 23,684 | 0.82 | 193 | 23,500 | ||||||||||||||
| Payments | 5.00 | 1,128 | 22,570 | 5.13 | 1,195 | 23,307 | ||||||||||||||
| PagoNxt | - | - | - | - | - | - | ||||||||||||||
| Cards | 5.03 | 1,096 | 21,814 | 5.17 | 1,158 | 22,413 | ||||||||||||||
| Europe | 2.25 | 14,499 | 644,939 | 2.35 | 14,941 | 634,775 | ||||||||||||||
| Spain | 2.91 | 8,365 | 287,919 | 3.11 | 8,853 | 284,263 | ||||||||||||||
| United Kingdom | 1.46 | 3,688 | 252,420 | 1.32 | 3,358 | 255,287 | ||||||||||||||
| Portugal | 2.42 | 984 | 40,669 | 3.09 | 1,253 | 40,503 | ||||||||||||||
| Poland | 3.40 | 1,438 | 42,324 | 3.74 | 1,382 | 36,921 | ||||||||||||||
| DCB Europe | 2.31 | 3,210 | 138,698 | 2.04 | 2,612 | 128,246 | ||||||||||||||
| North America | 3.93 | 7,898 | 200,941 | 3.23 | 6,144 | 189,962 | ||||||||||||||
| US | 4.33 | 6,435 | 148,724 | 3.46 | 4,825 | 139,641 | ||||||||||||||
| Mexico | 2.78 | 1,452 | 52,175 | 2.60 | 1,307 | 50,258 | ||||||||||||||
| South America | 5.30 | 9,184 | 173,176 | 5.88 | 10,550 | 179,365 | ||||||||||||||
| Brazil | 5.96 | 6,502 | 109,033 | 7.00 | 7,730 | 110,472 | ||||||||||||||
| Chile | 5.12 | 2,275 | 44,429 | 4.95 | 2,460 | 49,733 | ||||||||||||||
| Argentina | 1.51 | 89 | 5,882 | 1.92 | 129 | 6,693 | ||||||||||||||
Numerator: credit impaired loans and advances to customers, customer guarantees and customer commitments granted.
Denominator: total risk.
PagoNxt's NPL ratio is not provided as we do not consider it a relevant metric for this type of business.
PagoNxt's NPL ratio is not provided as we do not consider it a relevant metric for this type of business.
82 | | January - June 2024 | ||||||
| NPL coverage ratio | ||||||||||||||||||||
| (EUR million and %) | ||||||||||||||||||||
| H1'24 | H1'23 | |||||||||||||||||||
| % | Numerator | Denominator | % | Numerator | Denominator | |||||||||||||||
| Retail & Commercial Banking | 60.4 | 12,473 | 20,667 | 63.2 | 13,557 | 21,464 | ||||||||||||||
| Digital Consumer Bank | 75.9 | 7,798 | 10,280 | 87.9 | 7,366 | 8,383 | ||||||||||||||
| Corporate & Investment Banking | 45.0 | 1,139 | 2,533 | 36.8 | 1,109 | 3,012 | ||||||||||||||
| Wealth Management & Insurance | 64.6 | 118 | 183 | 53.2 | 103 | 193 | ||||||||||||||
| Payments | 149.5 | 1,686 | 1,128 | 142.1 | 1,698 | 1,195 | ||||||||||||||
| PagoNxt | - | - | - | - | - | - | ||||||||||||||
| Cards | 151.7 | 1,663 | 1,096 | 143.6 | 1,663 | 1,158 | ||||||||||||||
| Europe | 49.1 | 7,123 | 14,499 | 51.1 | 7,628 | 14,940 | ||||||||||||||
| Spain | 50.1 | 4,190 | 8,365 | 50.7 | 4,487 | 8,853 | ||||||||||||||
| United Kingdom | 28.5 | 1,050 | 3,688 | 32.0 | 1,073 | 3,358 | ||||||||||||||
| Portugal | 79.9 | 786 | 984 | 81.8 | 1,025 | 1,253 | ||||||||||||||
| Poland | 75.1 | 1,080 | 1,438 | 74.0 | 1,022 | 1,382 | ||||||||||||||
| DCB Europe | 85.4 | 2,741 | 3,210 | 94.5 | 2,467 | 2,612 | ||||||||||||||
| North America | 74.3 | 5,865 | 7,898 | 90.0 | 5,527 | 6,144 | ||||||||||||||
| US | 67.9 | 4,369 | 6,435 | 85.6 | 4,130 | 4,825 | ||||||||||||||
| Mexico | 102.5 | 1,488 | 1,452 | 106.3 | 1,389 | 1,307 | ||||||||||||||
| South America | 81.5 | 7,486 | 9,184 | 77.8 | 8,209 | 10,550 | ||||||||||||||
| Brazil | 90.4 | 5,875 | 6,502 | 82.7 | 6,395 | 7,730 | ||||||||||||||
| Chile | 53.1 | 1,208 | 2,275 | 56.2 | 1,382 | 2,460 | ||||||||||||||
| Argentina | 145.2 | 129 | 89 | 163.1 | 210 | 129 | ||||||||||||||
Numerator: total allowances to cover impairment losses on loans and advances to customers. customer guarantees and customer commitments granted.
Denominator: credit impaired loans and advances to customers, customer guarantees and customer commitments granted.
PagoNxt's coverage ratio is not provided as we do not consider it a relevant metric for this type of business.
PagoNxt's coverage ratio is not provided as we do not consider it a relevant metric for this type of business.
| Cost of risk | ||||||||||||||||||||
| (EUR million and %) | ||||||||||||||||||||
| H1'24 | H1'23 | |||||||||||||||||||
| % | Numerator | Denominator | % | Numerator | Denominator | |||||||||||||||
| Retail & Commercial Banking | 1.03 | 6,516 | 635,288 | 0.92 | 6,146 | 667,935 | ||||||||||||||
| Digital Consumer Bank | 2.17 | 4,495 | 207,326 | 1.86 | 3,655 | 196,795 | ||||||||||||||
| Corporate & Investment Banking | 0.15 | 254 | 170,095 | 0.18 | 288 | 156,260 | ||||||||||||||
| Wealth Management & Insurance | 0.05 | 12 | 22,738 | 0.00 | (1) | 22,682 | ||||||||||||||
| Payments | 7.03 | 1,650 | 23,467 | 7.11 | 1,477 | 20,766 | ||||||||||||||
| PagoNxt | - | - | - | - | - | - | ||||||||||||||
| Cards | 7.24 | 1,629 | 22,498 | 7.27 | 1,432 | 19,696 | ||||||||||||||
| Europe | 0.39 | 2,261 | 581,337 | 0.42 | 2,539 | 599,861 | ||||||||||||||
| Spain | 0.56 | 1,377 | 245,194 | 0.62 | 1,614 | 258,503 | ||||||||||||||
| United Kingdom | 0.08 | 205 | 249,276 | 0.11 | 294 | 258,274 | ||||||||||||||
| Portugal | 0.12 | 45 | 37,991 | 0.10 | 40 | 39,803 | ||||||||||||||
| Poland | 1.81 | 628 | 34,702 | 1.87 | 581 | 31,037 | ||||||||||||||
| DCB Europe | 0.72 | 961 | 133,804 | 0.54 | 672 | 123,516 | ||||||||||||||
| North America | 2.23 | 4,096 | 183,310 | 1.70 | 3,106 | 182,848 | ||||||||||||||
| US | 2.06 | 2,758 | 133,863 | 1.57 | 2,155 | 137,686 | ||||||||||||||
| Mexico | 2.71 | 1,334 | 49,273 | 2.13 | 944 | 44,223 | ||||||||||||||
| South America | 3.50 | 5,609 | 160,464 | 3.32 | 5,249 | 158,215 | ||||||||||||||
| Brazil | 4.77 | 4,859 | 101,828 | 4.74 | 4,565 | 96,257 | ||||||||||||||
| Chile | 0.97 | 413 | 42,551 | 0.88 | 397 | 45,236 | ||||||||||||||
| Argentina | 4.80 | 119 | 2,485 | 3.46 | 157 | 4,530 | ||||||||||||||
Numerator: underlying allowances for loan-loss provisions over the last 12 months.
Denominator: average loans and advances to customers over the last 12 months.
PagoNxt's cost of risk is not provided as we do not consider it a relevant metric for this type of business.
PagoNxt's cost of risk is not provided as we do not consider it a relevant metric for this type of business.
January - June 2024 | | 83 | ||||||
Other indicators
The Group has a series of additional financial metrics which facilitate analysis of the underlying business trends and performance. It also has another set of ESG indicators which enable us to track the progress of our Responsible Banking objectives.
| Ratio | Formula | Relevance of the metric | ||||||||||||
| TNAV per share | Tangible book value 1 | This is a very commonly used ratio used to measure the company's accounting value per share having deducted the intangible assets. It is useful in evaluating the amount each shareholder would receive if the company were to enter into liquidation and had to sell all the company's tangible assets. | ||||||||||||
| (Tangible equity net asset value per share) | Number of shares excluding treasury stock | |||||||||||||
| Price / tangible book value per share (X) | Share price | This is one of the most commonly used ratios by market participants for the valuation of listed companies both in absolute terms and relative to other entities. This ratio measures the relationship between the price paid for a company and its accounting equity value. | ||||||||||||
| TNAV per share | ||||||||||||||
| LTD ratio | Net loans and advances to customers | This is an indicator of the bank's liquidity. It measures the total (net) loans and advances to customers as a percentage of customer deposits. | ||||||||||||
| (Loan-to-deposit) | Customer deposits | |||||||||||||
| Loans and advances (excl. reverse repos) | Gross loans and advances to customers excluding reverse repos | In order to aid analysis of the commercial banking activity, reverse repos are excluded as they are highly volatile treasury products. | ||||||||||||
| Deposits (excl. repos) | Customer deposits excluding repos | In order to aid analysis of the commercial banking activity, repos are excluded as they are highly volatile treasury products. | ||||||||||||
| PAT + After tax fees paid to SAN (in Wealth Management & Insurance) | Net profit + fees paid from Santander Asset Management and Santander Insurance to Santander, net of taxes, excluding Private Banking customers | Metric to assess Wealth Management & Insurance's total contribution to Grupo Santander profit. | ||||||||||||
1. Tangible book value = Stockholders' equity (excl. minority interests) - intangible assets.
| Others | Jun-24 | Mar-24 | Jun-23 | |||||||||||
| TNAV (tangible book value) per share | 4.94 | 4.86 | 4.57 | |||||||||||
| Tangible book value | 76,514 | 76,346 | 73,941 | |||||||||||
| Number of shares excl. treasury stock (million) | 15,492 | 15,715 | 16,170 | |||||||||||
| Price / Tangible book value per share (X) | 0.88 | 0.93 | 0.74 | |||||||||||
| Share price (euros) | 4.331 | 4.522 | 3.385 | |||||||||||
| TNAV (tangible book value) per share | 4.94 | 4.86 | 4.57 | |||||||||||
| Loan-to-deposit ratio | 103 | % | 100 | % | 103 | % | ||||||||
| Net loans and advances to customers | 1,065,596 | 1,049,533 | 1,045,044 | |||||||||||
| Customer deposits | 1,037,646 | 1,044,453 | 1,013,778 | |||||||||||
| Q2'24 | Q1'24 | H1'24 | H1'23 | |||||||||||
| PAT + After tax fees paid to SAN (in WM&I) (Constant EUR million) | 879 | 835 | 1,714 | 1,529 | ||||||||||
| Profit after tax | 437 | 420 | 856 | 754 | ||||||||||
| Net fee income net of tax | 442 | 415 | 857 | 775 | ||||||||||
84 | | January - June 2024 | ||||||
| ESG indicators | ||||||||||||||
| Metric | Definition | Jun-24 | ||||||||||||
| Green finance raised and facilitated (EUR billion) | Nominal amount of project finance, financial advisory, project bonds, green bonds (DCM), export finance (ECA), mergers and acquisitions (M&A), and equity capital markets (ECM) transactions ranked by the SCFS panel and reported in the League Tables of Dealogic, Inframation News, TXF and Mergermarket since the beginning of the year. | 8 | ||||||||||||
| Green finance raised and facilitated accumulated from 2019-2025 (EUR billion) | Cumulative amount of green finance disbursed and made available since 2019. | 123.4 | ||||||||||||
| Socially responsible investment assets under management (SRI AUM) (EUR billion) | Value corresponding to total volume of assets under management registered as article 8 - promoting ESG characteristics - and 9 - with explicit sustainability objectives - of the SFDR regulation (EU Reg. 2019/2088) except for illiquid investments in Private Banking which are reported in terms of committed capital. Includes assets managed by Santander Asset Management (SAM) in the EU and with equivalent criteria in countries where SFDR does not apply (mainly Latin America) and Third Party Funds. | 74.0 | ||||||||||||
| Credit disbursed to microentrepreneurs (EUR million) | Total amount of credit disbursed during the year to low-income entrepreneurs with low access to banking service, or with difficulties in accessing credit, with the objective of creating and/or growing their businesses. Data include information on microfinance programmes in Brazil, Colombia, Mexico and Peru. | 631 | ||||||||||||
| Support (investment) for education, employment and entrepreneurship (EUR million) | Total amount invested to support education, employment and entrepreneurship. | 41.6 | ||||||||||||
| Support (investment) for education, employment and entrepreneurship accumulated from 2023-2025 (EUR million) | Cumulative amount of investment in education, employability and entrepreneurship since 2023. | 146.6 | ||||||||||||
| Support (investment) for other local initiatives (EUR million) | Total amount invested through local initiatives to promote childhood education, social welfare (especially among vulnerable groups), art and culture. | 21 | ||||||||||||
| Financing volume of renewable electric vehicles (EUR billion) | Financing volume of vehicles powered exclusively by a rechargeable electric battery (no petrol engine). | 3.4 | ||||||||||||
Note: targets were set before the publication of the European taxonomy in Q2 2023. Therefore, target definitions are not fully aligned with the taxonomy.
January - June 2024 | | 85 | ||||||
Local currency measures
We make use of certain financial measures in local currency to help in the assessment of our ongoing operating performance. These non-IFRS financial measures include the results of operations of our subsidiary banks located outside the eurozone, excluding the impact of foreign exchange. Because changes in foreign currency exchange rates do not have an operating impact on the results, we believe that evaluating their performance on a local currency basis provides an additional and meaningful assessment of performance to both management and the company’s investors.
The Group presents, at both the Group level as well as the business unit level, the real changes in the income statement as well as the changes excluding the exchange rate effect ("excluding FX" or "constant euros"), as it considers the latter facilitates analysis, since it enables businesses movements to be identified without taking into account the impact of converting each local currency into euros.
Said variations, excluding the impact of exchange rate movements, are calculated by converting income statement lines for the different business units comprising the Group into our presentation currency, the euro, applying the average exchange rate for H1 2024 to all periods contemplated in the analysis. We use this method for all countries with the exception of Argentina, where we use the exchange rate on the last working day of each period presented, given it is a hyperinflationary economy, to mitigate the distortions caused by the hyperinflation.
The Group presents, at both the Group level as well as the business unit level, the changes in euros in the balance sheet as well as the changes excluding the exchange rate effect for loans and advances to customers excluding reverse repurchase
agreements (repos) and customer funds (which comprise deposits and mutual funds) excluding repos. As with the income statement, the reason is to facilitate analysis by isolating the changes in the balance sheet that are not caused by converting each local currency into euros.
These changes excluding the impact of exchange rate movements are calculated by converting loans and advances to customers excluding reverse repos and customer funds excluding repos, into our presentation currency, the euro, applying the closing exchange rate on the last working day of June 2024 to all periods contemplated in the analysis. We use this method to calculate the variations in loans and advances to customers excluding reverse repos and customer funds excluding repos for all countries with the exception of Argentina, where we use the exchange rate on the last working day of each period presented, given it is a hyperinflationary economy, to mitigate the distortions caused by the hyperinflation.
The average and period-end exchange rates for the main currencies in which the Group operates are set out in the table below.
From Q2 2024, we have begun to apply a new theoretical exchange rate for the Argentine peso. This decision is due to the significant divergence that we have observed between the official exchange rate and other macroeconomic magnitudes, mainly inflation. The new theoretical exchange rate also reflects the implicit exchange rate observed in certain transactions ordered between market participants under the prevailing economic conditions, such as the repatriation of dividends from businesses in Argentina. This theoretical rate has been modelled by our Economic Research Team primarily taking into account the inflation differential of Argentina with respect to the US.
| Exchange rates: 1 euro / currency parity | ||||||||||||||||||||
| Average (income statement) | Period-end (balance sheet) | |||||||||||||||||||
| H1'24 | H1'23 | Jun-24 | Mar-24 | Jun-23 | ||||||||||||||||
| US dollar | 1.081 | 1.080 | 1.071 | 1.080 | 1.091 | |||||||||||||||
| Pound sterling | 0.855 | 0.876 | 0.848 | 0.855 | 0.858 | |||||||||||||||
| Brazilian real | 5.490 | 5.478 | 5.943 | 5.402 | 5.255 | |||||||||||||||
| Mexican peso | 18.492 | 19.623 | 19.561 | 17.939 | 18.719 | |||||||||||||||
| Chilean peso | 1,016.087 | 870.824 | 1,011.373 | 1,060.256 | 874.022 | |||||||||||||||
Argentine peso1 | 1,498.930 | 226.761 | 1,498.930 | 925.934 | 279.984 | |||||||||||||||
| Polish zloty | 4.316 | 4.623 | 4.308 | 4.307 | 4.436 | |||||||||||||||
1. From Q2 2024 onwards, a theoretical exchange rate has been used, as explained in the text above. We continue to apply the official ARS exchange rate to all prior periods.
86 | | January - June 2024 | ||||||
Impact of inflation rate on the variations of operating expenses
Santander presents, for both the Group and the business units included in the primary and secondary segments: i) the changes in operating expenses in euros, ii) the changes excluding the exchange rate effect with the exception of Argentina which is calculated as described above in "Local currency measures", and iii) the changes excluding the exchange rate effect minus the effect of average inflation over the last twelve months except for Argentina as cost growth in euros should already largely reflect the effect of hyperinflation on exchange rates. The reason is that the two latter facilitate analysis for management purposes.
Inflation is calculated as the arithmetic average of the last twelve months for each country and, for the regions, as the weighted average of each country comprising the region's inflation rate, weighted by each country's operating expenses in the region. For South America, we exclude the impact of inflation in Argentina from the calculation of the region's average inflation as cost growth in euros should already largely reflect the effect of hyperinflation on exchange rates.
The table below shows the average inflation rates calculated as indicated.
| Average inflation last 12 months | |||||
| % | |||||
| Retail & Commercial Banking | 3.8 | ||||
| Digital Consumer Bank | 3.3 | ||||
| Corporate & Investment Banking | 3.6 | ||||
| Wealth Management & Insurance | 3.5 | ||||
| Payments | 3.7 | ||||
| Europe | 3.7 | ||||
| Spain | 3.2 | ||||
| United Kingdom | 4.1 | ||||
| Portugal | 2.5 | ||||
| Poland | 5.4 | ||||
| North America | 3.8 | ||||
| US | 3.3 | ||||
| Mexico | 4.6 | ||||
South America1 | 3.8 | ||||
| Brazil | 4.4 | ||||
| Chile | 4.6 | ||||
| DCB Europe | 3.2 | ||||
Total Group1 | 3.7 | ||||
1. Excluding the impact of inflation in Argentina.
January - June 2024 | | 87 | ||||||
Business model | |||||||||||||||||||||||||||||
| Condensed consolidated financial statements | |||||||||||||||||||||||||||||
Interim condensated consolidated financial statements
•CONDENSED CONSOLIDATED BALANCE SHEET
•CONDENSED CONSOLIDATED INCOME STATEMENT
| NOTE: | The following financial information for the first six months of 2023 and 2022 (attached herewith) corresponds to the condensed consolidated financial statements prepared in accordance with the International Financial Reporting Standards. | ||||
| Condensed consolidated balance sheet | |||||||||||
| EUR million | |||||||||||
| ASSETS | Jun-24 | Dec-23 | Jun-23 | ||||||||
| Cash, cash balances at central banks and other deposits on demand | 156,234 | 220,342 | 207,546 | ||||||||
| Financial assets held for trading | 206,874 | 176,921 | 183,834 | ||||||||
| Non-trading financial assets mandatorily at fair value through profit or loss | 6,166 | 5,910 | 5,796 | ||||||||
| Financial assets designated at fair value through profit or loss | 9,169 | 9,773 | 9,645 | ||||||||
| Financial assets at fair value through other comprehensive income | 82,270 | 83,308 | 86,756 | ||||||||
| Financial assets at amortised cost | 1,217,341 | 1,191,403 | 1,180,302 | ||||||||
| Hedging derivatives | 5,413 | 5,297 | 7,532 | ||||||||
| Changes in the fair value of hedged items in portfolio hedges of interest risk | (1,337) | (788) | (4,711) | ||||||||
| Investments | 8,235 | 7,646 | 7,679 | ||||||||
| Joint ventures entities | 2,026 | 1,964 | 1,935 | ||||||||
| Associated entities | 6,209 | 5,682 | 5,744 | ||||||||
| Assets under reinsurance contracts | 214 | 237 | 243 | ||||||||
| Tangible assets | 33,709 | 33,882 | 34,159 | ||||||||
| Property, plant and equipment | 32,764 | 32,926 | 33,118 | ||||||||
| For own-use | 12,808 | 13,408 | 13,718 | ||||||||
| Leased out under an operating lease | 19,956 | 19,518 | 19,400 | ||||||||
| Investment property | 945 | 956 | 1,041 | ||||||||
| Of which : Leased out under an operating lease | 806 | 851 | 872 | ||||||||
| Intangible assets | 19,359 | 19,871 | 19,528 | ||||||||
| Goodwill | 13,668 | 14,017 | 14,126 | ||||||||
| Other intangible assets | 5,691 | 5,854 | 5,402 | ||||||||
| Tax assets | 29,992 | 31,390 | 29,840 | ||||||||
| Current tax assets | 10,017 | 10,623 | 8,793 | ||||||||
| Deferred tax assets | 19,975 | 20,767 | 21,047 | ||||||||
| Other assets | 9,707 | 8,856 | 9,193 | ||||||||
| Insurance contracts linked to pensions | 87 | 93 | 97 | ||||||||
| Inventories | 6 | 7 | 10 | ||||||||
| Other | 9,614 | 8,756 | 9,086 | ||||||||
| Non-current assets held for sale | 2,915 | 3,014 | 3,151 | ||||||||
| TOTAL ASSETS | 1,786,261 | 1,797,062 | 1,780,493 | ||||||||
88 | | January - June 2024 | ||||||
Business model | |||||||||||||||||||||||||||||
| Condensed consolidated financial statements | |||||||||||||||||||||||||||||
| Condensed consolidated balance sheet | |||||||||||
| EUR million | |||||||||||
| LIABILITIES | Jun-24 | Dec-23 | Jun-23 | ||||||||
| Financial liabilities held for trading | 133,856 | 122,270 | 134,888 | ||||||||
| Financial liabilities designated at fair value through profit or loss | 34,493 | 40,367 | 36,220 | ||||||||
| Financial liabilities at amortized cost | 1,454,896 | 1,468,703 | 1,446,882 | ||||||||
| Hedging derivatives | 5,535 | 7,656 | 10,288 | ||||||||
| Changes in the fair value of hedged items in portfolio hedges of interest rate risk | 12 | 55 | (309) | ||||||||
| Liabilities under insurance or reinsurance contracts | 17,592 | 17,799 | 17,584 | ||||||||
| Provisions | 8,401 | 8,441 | 8,389 | ||||||||
| Pensions and other post-retirement obligations | 1,936 | 2,225 | 2,284 | ||||||||
| Other long term employee benefits | 894 | 880 | 859 | ||||||||
| Taxes and other legal contingencies | 2,631 | 2,715 | 2,558 | ||||||||
| Contingent liabilities and commitments | 698 | 702 | 756 | ||||||||
| Other provisions | 2,242 | 1,919 | 1,932 | ||||||||
| Tax liabilities | 9,802 | 9,932 | 9,648 | ||||||||
| Current tax liabilities | 3,691 | 3,846 | 3,164 | ||||||||
| Deferred tax liabilities | 6,111 | 6,086 | 6,484 | ||||||||
| Other liabilities | 18,026 | 17,598 | 14,859 | ||||||||
| Liabilities associated with non-current assets held for sale | — | — | — | ||||||||
| TOTAL LIABILITIES | 1,682,613 | 1,692,821 | 1,678,449 | ||||||||
| EQUITY | |||||||||||
| Shareholders' equity | 132,836 | 130,443 | 127,258 | ||||||||
| Capital | 7,747 | 8,092 | 8,092 | ||||||||
| Called up paid capital | 7,747 | 8,092 | 8,092 | ||||||||
| Unpaid capital which has been called up | — | — | — | ||||||||
| Share premium | 41,604 | 44,373 | 44,373 | ||||||||
| Equity instruments issued other than capital | 735 | 720 | 704 | ||||||||
| Equity component of the compound financial instrument | — | — | — | ||||||||
| Other equity instruments issued | 735 | 720 | 704 | ||||||||
| Other equity | 189 | 195 | 196 | ||||||||
| Accumulated retained earnings | 82,324 | 74,114 | 74,112 | ||||||||
| Revaluation reserves | — | — | — | ||||||||
| Other reserves | (5,816) | (5,751) | (5,413) | ||||||||
| (-) Own shares | (6) | (1,078) | (47) | ||||||||
| Profit attributable to shareholders of the parent | 6,059 | 11,076 | 5,241 | ||||||||
| (-) Interim dividends | — | (1,298) | — | ||||||||
| Other comprehensive income (loss) | (36,963) | (35,020) | (33,789) | ||||||||
| Items not reclassified to profit or loss | (5,118) | (5,212) | (4,956) | ||||||||
| Items that may be reclassified to profit or loss | (31,845) | (29,808) | (28,833) | ||||||||
| Non-controlling interest | 7,775 | 8,818 | 8,575 | ||||||||
| Other comprehensive income | (1,872) | (1,559) | (1,484) | ||||||||
| Other items | 9,647 | 10,377 | 10,059 | ||||||||
| TOTAL EQUITY | 103,648 | 104,241 | 102,044 | ||||||||
| TOTAL LIABILITIES AND EQUITY | 1,786,261 | 1,797,062 | 1,780,493 | ||||||||
| MEMORANDUM ITEMS: OFF BALANCE SHEET AMOUNTS | |||||||||||
| Loan commitments granted | 290,151 | 279,589 | 283,903 | ||||||||
| Financial guarantees granted | 15,598 | 15,435 | 14,401 | ||||||||
| Other commitments granted | 127,420 | 113,273 | 113,266 | ||||||||
January - June 2024 | | 89 | ||||||
Business model | |||||||||||||||||||||||||||||
| Condensed consolidated financial statements | |||||||||||||||||||||||||||||
| Condensed consolidated income statement | ||||||||
| EUR million | ||||||||
| H1'24 | H1'23 | |||||||
| Interest income | 56,838 | 49,922 | ||||||
| Financial assets at fair value through other comprehensive income | 3,426 | 3,629 | ||||||
| Financial assets at amortized cost | 42,198 | 37,503 | ||||||
| Other interest income | 11,214 | 8,790 | ||||||
| Interest expense | (33,381) | (29,002) | ||||||
| Interest income/ (charges) | 23,457 | 20,920 | ||||||
| Dividend income | 493 | 382 | ||||||
| Income from companies accounted for using the equity method | 303 | 296 | ||||||
| Commission income | 8,738 | 8,277 | ||||||
| Commission expense | (2,261) | (2,174) | ||||||
| Gain or losses on financial assets and liabilities not measured at fair value through profit or loss, net | 20 | 22 | ||||||
| Financial assets at amortized cost | (43) | 6 | ||||||
| Other financial assets and liabilities | 63 | 16 | ||||||
| Gain or losses on financial assets and liabilities held for trading, net | 441 | 263 | ||||||
| Reclassification of financial assets at fair value through other comprehensive income | — | — | ||||||
| Reclassification of financial assets from amortized cost | — | — | ||||||
| Other gains (losses) | 441 | 263 | ||||||
| Gains or losses on non-trading financial assets and liabilities mandatorily at fair value through profit or loss | 314 | 26 | ||||||
| Reclassification of financial assets at fair value through other comprehensive income | — | — | ||||||
| Reclassification of financial assets from amortized cost | — | — | ||||||
| Other gains (losses) | 314 | 26 | ||||||
| Gain or losses on financial assets and liabilities measured at fair value through profit or loss, net | 427 | (194) | ||||||
| Gain or losses from hedge accounting, net | 14 | 108 | ||||||
| Exchange differences, net | (259) | 1,077 | ||||||
| Other operating income (*) | 409 | 480 | ||||||
| Other operating expenses | (1,391) | (1,504) | ||||||
| Income from insurance and reinsurance contracts | 249 | 414 | ||||||
| Expenses from insurance and reinsurance contracts | (239) | (383) | ||||||
| Total income | 30,715 | 28,010 | ||||||
| Administrative expenses | (11,257) | (10,873) | ||||||
| Staff costs | (7,061) | (6,603) | ||||||
| Other general and administrative expenses | (4,196) | (4,270) | ||||||
| Depreciation and amortization | (1,656) | (1,606) | ||||||
| Provisions or reversal of provisions, net | (1,762) | (1,330) | ||||||
| Impairment or reversal of impairment of financial assets not measured at fair value through profit or loss and net gains and losses from modifications | (6,577) | (6,237) | ||||||
| Financial assets at fair value through other comprehensive income | (8) | 6 | ||||||
| Financial assets at amortized cost | (6,569) | (6,243) | ||||||
| Impairment of investments in subsidiaries, joint ventures and associates, net | — | — | ||||||
| Impairment on non-financial assets, net | (290) | (92) | ||||||
| Tangible assets | (183) | (78) | ||||||
| Intangible assets | (105) | (5) | ||||||
| Others | (2) | (9) | ||||||
| Gain or losses on non-financial assets and investments, net | 366 | 277 | ||||||
| Negative goodwill recognized in results | — | — | ||||||
| Gains or losses on non-current assets held for sale not classified as discontinued operations | (31) | (59) | ||||||
| Operating profit/(loss) before tax | 9,508 | 8,090 | ||||||
| Tax expense or income from continuing operations | (2,916) | (2,281) | ||||||
| Profit/(loss) for the period from continuing operations | 6,592 | 5,809 | ||||||
| Profit/( loss) after tax from discontinued operations | — | — | ||||||
| Profit/(loss) for the period | 6,592 | 5,809 | ||||||
| Profit attributable to non-controlling interests | 533 | 568 | ||||||
| Profit/(loss) attributable to the parent | 6,059 | 5,241 | ||||||
| Earnings/(losses) per share | ||||||||
| Basic | 0.37 | 0.31 | ||||||
| Diluted | 0.37 | 0.31 | ||||||
(*) Includes -EUR 687 million at 30 June 2024 (-EUR 574 million at 30 June 2023) derived from the net monetary loss generated in Argentina as a result of the application of IAS 29 Financial reporting in hyperinflationary economies.
90 | | January - June 2024 | ||||||
Glossary
•Active customer: Those customers who comply with the minimum balance, income and/or transactionality requirements as defined according to the business area
•ADR: American Depositary Receipt
•APM: Alternative Performance Measures
•A2A: account-to-account payment
•AuMs: Assets under management
•bn: Billion
•BNPL: Buy now, pay later
•bps: basis points
•CDI: CREST Depository Interest
•CET1: Common Equity Tier 1
•CF: Corporate Finance
•CHF: Swiss francs
•CIB: Corporate & Investment Banking
•CNMV: Spanish National Securities Market Commission (Comisión Nacional del Mercado de Valores)
•Consumer: Digital Consumer Bank
•Costs in real terms: variations excluding the effect of average inflation over the last twelve months
•DCBE: Digital Consumer Bank Europe
•Digital customers: Every consumer of a commercial bank’s services who has logged on to their personal online banking and/or mobile banking in the last 30 days
•ECB: European Central Bank
•EPS: Earnings per share
•ESG: Environmental, Social and Governance
•ESMA: European Securities and Markets Authority
•Fed: Federal Reserve
•Financial inclusion: Number of people who are unbanked, underbanked, in financial difficulty, with difficulties in accessing credit who, through the Group's products and services, are able to access the financial system or receive tailored finance. Financially underserved groups are defined as people who do not have a current account, or who have an account but obtained alternative (non-bank) financial services in the last 12 months. Beneficiaries of various programmes are included in the quantification process only once in the entire period. Only new empowered people are counted, taking as a base year those existing since 2019.
•FX: Foreign Exchange
•GB: Global Banking
•GDF: Global Debt Financing
•GDP: Gross Domestic Product
•GTB: Global Transaction Banking
•IA: Artificial intelligence
•IFRS 9: International Financial Reporting Standard 9, regarding financial instruments
•IFRS 17: International Financial Reporting Standard 9, regarding insurance contracts
•IT: Information technology
•LCR: Liquidity Coverage Ratio
•LLPs: Loan-loss provisions
•MDA: Maximum Distributable Amount
•mn: Million
•MREL: Minimum Requirement for own funds and eligible liabilities)
•NII: Net Interest Income
•NPS: Net Promoter Score
•ODS: Open Digital Services
•PBT: Profit before tax
•pp: percentage points
•QoQ: quarter-on-quarter
•P2R: Pillar 2 requirement
•Payments: PagoNxt (Getnet, Ebury y PagoNxt Payments) y Cards
•PB: Private Banking
•Retail: Retail & Commercial Banking
•Repos: Repurchase agreements
•RoA: Return on assets
•RoE: Return on equity
•RoRWA: Return on risk-weighted assets
•RoTE: Return on tangible equity
•RWAs: Risk-weighted assets
•SAM: Santander Asset Management
•SBNA: Santander Bank N.A.
•SCIB: Santander Corporate & Investment Banking
•SC USA: Santander Consumer USA
•SEC: Securities and Exchanges Commission
•SHUSA: Santander Holdings USA, Inc.
•SMEs: Small and medium enterprises
•SRF: Single Resolution Fund
•TLAC: The total loss-absorbing capacity requirement which is required to be met under the CRD V package
•TNAV: Tangible net asset value
•TPV: Total payments volume
•VaR: Value at Risk
•Wealth: Wealth Management & Insurance
•YoY: year-on-year
January - June 2024 | | 91 | ||||||
Business model | |||||||||||||||||||||||||||||
| Important Information | |||||||||||||||||||||||||||||
Important information
Non-IFRS and alternative performance measures
This report contains financial information prepared according to International Financial Reporting Standards (IFRS) and taken from our consolidated financial statements, as well as alternative performance measures (APMs) as defined in the Guidelines on Alternative Performance Measures issued by the European Securities and Markets Authority (ESMA) on 5 October 2015, and other non-IFRS measures. The APMs and non-IFRS measures were calculated with information from Grupo Santander; however, they are neither defined or detailed in the applicable financial reporting framework nor audited or reviewed by our auditors. We use these APMs and non-IFRS measures when planning, monitoring and evaluating our performance. We consider them to be useful metrics for our management and investors to compare operating performance between periods. APMs we use are presented unless otherwise specified on a constant FX basis, which is computed by adjusting comparative period reported data for the effects of foreign currency translation differences, which distort period-on-period comparisons. Nonetheless, the APMs and non-IFRS measures are supplemental information; their purpose is not to substitute IFRS measures. Furthermore, companies in our industry and others may calculate or use APMs and non-IFRS measures differently, thus making them less useful for comparison purposes. APMs using ESG labels have not been calculated in accordance with the Taxonomy Regulation or with the indicators for principal adverse impact in SFDR. For further details on APMs and Non-IFRS Measures, including their definition or a reconciliation between any applicable management indicators and the financial data presented in the consolidated financial statements prepared under IFRS, please see the 2023 Annual Report on Form 20-F filed with the U.S. Securities and Exchange Commission (the SEC) on 21 February 2024 (https://www.santander.com/content/dam/santander-com/en/documentos/informacion-sobre-resultados-semestrales-y-anuales-suministrada-a-la-sec/2024/sec-2023-annual-20-f-2023-en.pdf), as well as the section “Alternative performance measures” of this Banco Santander, S.A. (Santander) Q2 2024 Financial Report, published on 24 July 2024 (https://www.santander.com/en/shareholders-and-investors/financial-and-economic-information#quarterly-results). Underlying measures, which are included in this report, are non-IFRS measures.
The businesses included in each of our geographic segments and the accounting principles under which their results are presented here may differ from the businesses included and local applicable accounting principles of our public subsidiaries in such geographies. Accordingly, the results of operations and trends shown for our geographic segments may differ materially from those of such subsidiaries.
Non-financial information
This report contains, in addition to financial information, non-financial information (NFI), including environmental, social and governance-related metrics, statements, goals, commitments and opinions.
NFI is not audited nor reviewed by an external auditor. NFI is prepared following various external and internal frameworks, reporting guidelines and measurement, collection and verification methods and practices, which are materially different from those applicable to financial information and are in many cases emerging and evolving. NFI is based on various materiality thresholds, estimates, assumptions, judgments and underlying data derived internally and from third parties. NFI is thus subject to significant measurement uncertainties, may not be comparable to NFI of other companies or over time or across periods and its inclusion is not meant to imply that the information is fit for any particular purpose or that it is material to us under mandatory reporting standards. NFI is for informational purposes only and without any liability being accepted in connection with it except where such liability cannot be limited under overriding provisions of applicable law.
Forward-looking statements
Santander hereby warns that this report contains “forward-looking statements” as per the meaning of the U.S. Private Securities Litigation Reform Act of 1995. Such statements can be understood through words and expressions like “expect”, “project”, “anticipate”, “should”, “intend”, “probability”, “risk”, “VaR”, “RoRAC”, “RoRWA”, “TNAV”, “target”, “goal”, “objective”, “estimate”, “future”, “commitment”, “commit”, “focus”, “pledge” and similar expressions. They include (but are not limited to) statements on future business development, shareholder remuneration policy and NFI.
While these forward-looking statements represent our judgement and future expectations concerning our business developments, results may differ materially from those anticipated, expected, projected or assumed in forward-looking statements.
In particular, forward looking statements are based on current expectations and future estimates about Santander’s and third-parties’ operations and businesses and address matters that are uncertain to varying degrees and may change, including, but not limited to (a) expectations, targets, objectives, strategies and goals relating to environmental, social, safety and governance performance, including expectations regarding future execution of Santander’s and third-parties’ (including governments and other public actors) energy and climate strategies, and the underlying assumptions and estimated impacts on Santander’s and third-parties’ businesses related thereto; (b) Santander’s and third-parties’ approach, plans and expectations in relation to carbon use and targeted reductions of emissions, which may be affected by conflicting interests such as energy security; (c) changes in operations or investments under existing or future environmental laws and regulations; (d) changes in rules and regulations, regulatory requirements and internal policies, including those related to climate-related initiatives; (e) our own decisions and actions including those affecting or changing our practices, operations, priorities, strategies, policies or procedures; (f) events that lead to damage to our reputation and brand; (g) exposure to operational losses, including as a result of cyberattacks, data breaches or other security incidents; and (h) the uncertainty over the scope of actions that may be required by us, governments and others to achieve goals relating to climate, environmental and social matters, as well as the evolving nature of underlying science and industry and governmental standards and regulations.
In addition, the important factors described in this report and other risk factors, uncertainties or contingencies detailed in our most recent Form 20-F and subsequent 6-Ks filed with, or furnished to, the SEC, as well as other unknown or unpredictable factors, could affect our future development and results and could lead to outcomes materially different from what our forward-looking statements anticipate, expect, project or assume.
92 | | January - June 2024 | ||||||
Business model | |||||||||||||||||||||||||||||
| Important Information | |||||||||||||||||||||||||||||
Forward-looking statements are therefore aspirational, should be regarded as indicative, preliminary and for illustrative purposes only, speak only as of the date of this report, are informed by the knowledge, information and views available on such date and are subject to change without notice. Santander is not required to update or revise any forward-looking statements, regardless of new information, future events or otherwise, except as required by applicable law. Santander does not accept any liability in connection with forward-looking statements except where such liability cannot be limited under overriding provisions of applicable law.
Not a securities offer
This report and the information it contains does not constitute an offer to sell nor the solicitation of an offer to buy any securities.
Past performance does not indicate future outcomes
Statements about historical performance or growth rates must not be construed as suggesting that future performance, share price or results (including earnings per share) will necessarily be the same or higher than in a previous period. Nothing in this report should be taken as a profit and loss forecast.
Third Party Information
In this report, Santander relies on and refers to certain information and statistics obtained from publicly-available information and third-party sources, which it believes to be reliable. Neither Santander nor its directors, officers and employees have independently verified the accuracy or completeness of any such publicly-available and third-party information, make any representation or warranty as to the quality, fitness for a particular purpose, non-infringement, accuracy or completeness of such information or undertake any obligation to update such information after the date of this report. In no event shall Santander be liable for any use by any party of, for any decision made or action taken by any party in reliance upon, or for inaccuracies or errors in, or omission from, such publicly-available and third-party information contained herein. Any sources of publicly-available information and third-party information referred or contained herein retain all rights with respect to such information and use of such information herein shall not be deemed to grant a license to any third party.
This document is a translation of a document originally issued in Spanish. Should there be any discrepancies between the English and the Spanish versions, only the original Spanish version should be binding. | ||
January - June 2024 | | 93 | ||||||
Main risks and uncertainties
At the date of preparation of this management report, Grupo Santander considers that the important factors below (and others described elsewhere in this report), as well as other unknown or unpredictable factors, could affect our future development and results and could lead to outcomes materially different from what our forward-looking statements anticipate, expect, project or assume:
•General economic or industry conditions (e.g., an economic downturn; higher volatility in the capital markets; inflation or deflation; changes in demographics or consumer spending, investment or saving habits; and the effects of wars and conflicts (including the war in Ukraine and the conflict in the Middle East) or the outbreak of public health emergencies on the global economy) in areas where we have significant operations or investments.
•Climate-related conditions, regulations, targets and weather events.
•Exposure to market risks (e.g., risks from interest rates, foreign exchange rates, equity prices and new benchmark indices).
•Potential losses from early loan repayments, collateral depreciation or counterparty risk.
•Political instability in Spain, the UK, other European countries, Latin America and the US.
•Legislative, regulatory or tax changes (including regulatory capital and liquidity requirements), especially in view of the UK's exit from the European Union and greater regulation prompted by financial crises.
•Acquisition integration and challenges arising from deviating management’s resources and attention from other strategic opportunities and operational matters.
•Uncertainty over the scope of actions that may be required by us, governments and other to achieve goals relating to climate, environmental and social matters, as well as the evolving nature of underlying science and industry and governmental standards and regulations.
•Changes affecting our access to liquidity and funding on acceptable terms, especially due to credit spread shifts or credit rating downgrades for the entire Group or core subsidiaries.
•Damage to our reputation and to our brand.
•Exposure to operational losses, including as a result of cyberattacks, data breaches or other cybersecurity incidents.
These are not the only risks that the bank may face. Other unknown risks or those not considered relevant at this time, may materialize in the future.
Our geographic and business diversification protects us, to some extent, from adverse circumstances and enables us to resiliently face them. Although it is difficult to make estimations in the current environment, our strategy and business model are a clear competitive advantage.
94 | | January - June 2024 | ||||||
| Other disclosures required by the Bank of Spain | ||||||||||||||||||||||||||||||||
OTHER DISCLOSURES REQUIRED BY THE BANK OF SPAIN
Disclosures required under Bank of Spain Circular 6/2012 on sector and geographic concentration of risk
Concentration of risk
The breakdown at 30 June 2024 of the concentration of the Group's risk, by activity and geographic location of counterparties, is as follows:
| Million euros | 30-06-2024 | ||||||||||||||||
| Total | Spain | Rest of the European Union | America | Rest of the world | |||||||||||||
| Central banks and Credit institutions | 322,660 | 52,103 | 79,167 | 119,266 | 72,124 | ||||||||||||
| Public sector | 230,500 | 65,397 | 49,807 | 99,288 | 16,008 | ||||||||||||
| Of which: | |||||||||||||||||
| Central government | 199,335 | 50,780 | 44,076 | 88,833 | 15,646 | ||||||||||||
| Other central government | 31,165 | 14,617 | 5,731 | 10,455 | 362 | ||||||||||||
| Other financial institutions (financial business activity) | 185,178 | 15,012 | 48,224 | 76,062 | 45,880 | ||||||||||||
| Non-financial companies and individual entrepreneurs (non-financial business activity) (broken down by purpose) | 458,761 | 108,086 | 108,397 | 180,244 | 62,034 | ||||||||||||
| Of which: | |||||||||||||||||
| Construction and property development | 20,754 | 3,383 | 4,220 | 7,461 | 5,690 | ||||||||||||
| Civil engineering construction | 5,811 | 2,357 | 2,005 | 1,342 | 107 | ||||||||||||
| Large companies | 287,648 | 51,259 | 64,420 | 125,353 | 46,616 | ||||||||||||
| SMEs and individual entrepreneurs | 144,548 | 51,087 | 37,752 | 46,088 | 9,621 | ||||||||||||
| Households – other (broken down by purpose) | 569,817 | 89,367 | 108,236 | 148,088 | 224,126 | ||||||||||||
| Of which: | |||||||||||||||||
| Residential | 351,663 | 62,523 | 37,667 | 46,234 | 205,239 | ||||||||||||
| Consumer loans | 198,102 | 17,398 | 68,267 | 95,948 | 16,489 | ||||||||||||
| Other purposes | 20,052 | 9,446 | 2,302 | 5,906 | 2,398 | ||||||||||||
| Total (*) | 1,766,916 | 329,965 | 393,831 | 622,948 | 420,172 | ||||||||||||
(*) For the purpose of this table, the definition of risk includes the following public balance sheet items: loans and advances to credit institutions, deposits at central banks, loans and advances to customers, debt securities, capital instruments, trading derivatives, hedging derivatives, equity investments and guarantees extended.
January - June 2024 | | 95 | ||||||
| Other disclosures required by the Bank of Spain | ||||||||||||||||||||||||||||||||
| Million euros (*) | |||||||||||||||||||||||||||||
| Secured loans | |||||||||||||||||||||||||||||
| Net exposure | Loan-to-value (**) | ||||||||||||||||||||||||||||
| Total | Unsecured loans | Of which: Mortgage collateral | Of which: Other collateral | Less than or equal to 40% | Greater than 40% and less than or equal to 60% | Greater than 60% and less than or equal to 80% | Greater than 80% and less than or equal to 100% | Greater than 100% | |||||||||||||||||||||
| Public sector | 25,991 | 25,726 | 180 | 85 | 85 | 66 | 21 | 74 | 19 | ||||||||||||||||||||
| Other financial institutions (financial business activity) | 104,941 | 34,578 | 2,220 | 68,143 | 1,988 | 842 | 348 | 66,267 | 918 | ||||||||||||||||||||
| Non-financial corporations and individual entrepreneurs (non-financial business activity) (broken down by purpose) | 346,949 | 189,515 | 73,424 | 84,010 | 31,758 | 26,173 | 20,612 | 51,477 | 27,414 | ||||||||||||||||||||
| Of which: | |||||||||||||||||||||||||||||
| Construction and property development | 18,358 | 2,108 | 14,540 | 1,710 | 5,286 | 5,263 | 1,530 | 2,788 | 1,383 | ||||||||||||||||||||
| Civil engineering construction | 3,091 | 1,965 | 246 | 880 | 139 | 80 | 38 | 827 | 42 | ||||||||||||||||||||
| Large companies | 193,033 | 125,195 | 24,871 | 42,967 | 13,257 | 6,850 | 7,382 | 26,313 | 14,036 | ||||||||||||||||||||
| SMEs and individual entrepreneurs | 132,467 | 60,247 | 33,767 | 38,453 | 13,076 | 13,980 | 11,662 | 21,549 | 11,953 | ||||||||||||||||||||
| Households – other (broken down by purpose) | 564,605 | 114,544 | 357,262 | 92,799 | 99,578 | 125,023 | 123,769 | 60,735 | 40,956 | ||||||||||||||||||||
| Of which: | |||||||||||||||||||||||||||||
| Residential | 350,801 | 1,401 | 348,717 | 683 | 90,484 | 114,506 | 113,113 | 28,732 | 2,565 | ||||||||||||||||||||
| Consumer loans | 195,315 | 107,757 | 2,205 | 85,353 | 5,155 | 7,884 | 8,478 | 28,247 | 37,794 | ||||||||||||||||||||
| Other purposes | 18,489 | 5,386 | 6,340 | 6,763 | 3,939 | 2,633 | 2,178 | 3,756 | 597 | ||||||||||||||||||||
| Total | 1,042,486 | 364,363 | 433,086 | 245,037 | 133,409 | 152,104 | 144,750 | 178,553 | 69,307 | ||||||||||||||||||||
| Memorandum item | |||||||||||||||||||||||||||||
| Refinanced and restructured transactions | 22,025 | 8,570 | 7,895 | 5,560 | 3,474 | 1,796 | 1,814 | 4,796 | 1,575 | ||||||||||||||||||||
(*) In addition, the Group has granted advances to customers amounting to EUR 23,110 million; therefore, the total amount of loans and advances to customers amounts to EUR 1,065,596 million.
(**) Includes balances net of impairment or accumulated losses in fair value due to credit risk.
96 | | January - June 2024 | ||||||
| Interim condensed consolidated financial statements | |||||
| Condensed consolidated balance sheet | |||||
| Condensed consolidated income statements | |||||
| Condensed consolidated statements of recognised income and expense | |||||
| Condensed consolidated statements of changes in total equity | |||||
| Condensed consolidated statements of cash flows | |||||
| Explanatory notes to the interim condensed consolidated financial statements | |||||
| Note 1: Introduction, basis of presentation of the interim condensed consolidated financial statements and other information | |||||
| Note 2: Grupo Santander | |||||
| Note 3: Shareholder remuneration system and earnings per share | |||||
Note 4: Remuneration and other benefits paid to Banco Santander's directors and senior managers | |||||
| Note 5: Financial assets | |||||
| Note 6: Non-current assets held for sale | |||||
| Note 7: Tangible assets | |||||
| Note 8: Intangible assets | |||||
| Note 9: Financial liabilities | |||||
| Note 10: Provisions | |||||
| Note 11: Equity | |||||
| Note 12: Segment information (primary segment) | |||||
| Note 13: Related parties | |||||
| Note 14: Off-balance-sheet exposures | |||||
| Note 15: Average headcount and number of branches | |||||
| Note 16: Other disclosures | |||||
Note 17: Explanation added for translation to English | |||||
Translation of interim condensed consolidated financial statements originally issued in Spanish and prepared in accordance with the regulatory financial reporting framework applicable to the Group in Spain (see Notes 1 and 17). In the event of a discrepancy, the Spanish-language version prevails.
GRUPO SANTANDER
CONDENSED CONSOLIDATED BALANCE SHEETS AS AT 30 JUNE 2024 AND 31 DECEMBER 2023
(EUR million)
| ASSETS | Note | 30-06-2024 | 31-12-2023 (*) | ||||||||
| CASH, CASH BALANCES AT CENTRAL BANKS AND OTHER DEPOSITS ON DEMAND | 156,234 | 220,342 | |||||||||
| FINANCIAL ASSETS HELD FOR TRADING | 5 | 206,874 | 176,921 | ||||||||
| NON-TRADING FINANCIAL ASSETS MANDATORILY AT FAIR VALUE THROUGH PROFIT OR LOSS | 5 | 6,166 | 5,910 | ||||||||
| FINANCIAL ASSETS DESIGNATED AT FAIR VALUE THROUGH PROFIT OR LOSS | 5 | 9,169 | 9,773 | ||||||||
| FINANCIAL ASSETS AT FAIR VALUE THROUGH OTHER COMPREHENSIVE INCOME | 5 | 82,270 | 83,308 | ||||||||
| FINANCIAL ASSETS AT AMORTISED COST | 5 | 1,217,341 | 1,191,403 | ||||||||
| HEDGING DERIVATIVES | 5,413 | 5,297 | |||||||||
| CHANGES IN THE FAIR VALUE OF HEDGED ITEMS IN PORTFOLIO HEDGES OF INTEREST RISK | (1,337) | (788) | |||||||||
| INVESTMENTS | 8,235 | 7,646 | |||||||||
| Joint venture entities | 2,026 | 1,964 | |||||||||
| Associated entities | 6,209 | 5,682 | |||||||||
| ASSETS UNDER REINSURANCE CONTRACTS | 214 | 237 | |||||||||
| TANGIBLE ASSETS | 7 | 33,709 | 33,882 | ||||||||
| Property, plant and equipment | 32,764 | 32,926 | |||||||||
| For own-use | 12,808 | 13,408 | |||||||||
| Leased out under an operating lease | 19,956 | 19,518 | |||||||||
| Investment properties | 945 | 956 | |||||||||
| Of which : Leased out under an operating lease | 806 | 851 | |||||||||
| INTANGIBLE ASSETS | 8 | 19,359 | 19,871 | ||||||||
| Goodwill | 13,668 | 14,017 | |||||||||
| Other intangible assets | 5,691 | 5,854 | |||||||||
| TAX ASSETS | 29,992 | 31,390 | |||||||||
| Current tax assets | 10,017 | 10,623 | |||||||||
| Deferred tax assets | 19,975 | 20,767 | |||||||||
| OTHER ASSETS | 9,707 | 8,856 | |||||||||
| Insurance contracts linked to pensions | 87 | 93 | |||||||||
| Inventories | 6 | 7 | |||||||||
| Other | 9,614 | 8,756 | |||||||||
| NON-CURRENT ASSETS HELD FOR SALE | 6 | 2,915 | 3,014 | ||||||||
| TOTAL ASSETS | 1,786,261 | 1,797,062 | |||||||||
(*)Presented for comparison purposes only (see Note 1.e).
The accompanying explanatory Notes 1 to 17 are an integral part of the condensed consolidated balance sheet as at 30 June 2024.
| January - June 2024 | | 99 | ||||||
Translation of interim condensed consolidated financial statements originally issued in Spanish and prepared in accordance with the regulatory financial reporting framework applicable to the Group in Spain (see Notes 1 and 17). In the event of a discrepancy, the Spanish-language version prevails.
GRUPO SANTANDER
CONDENSED CONSOLIDATED BALANCE SHEETS AS AT 30 JUNE 2024 AND 31 DECEMBER 2023
(EUR million)
| LIABILITIES | Note | 30-06-2024 | 31-12-2023 (*) | ||||||||
| FINANCIAL LIABILITIES HELD FOR TRADING | 9 | 133,856 | 122,270 | ||||||||
| FINANCIAL LIABILITIES DESIGNATED AT FAIR VALUE THROUGH PROFIT OR LOSS (**) | 9 | 34,493 | 40,367 | ||||||||
| FINANCIAL LIABILITIES AT AMORTISED COST | 9 | 1,454,896 | 1,468,703 | ||||||||
| HEDGING DERIVATIVES | 5,535 | 7,656 | |||||||||
| CHANGES IN THE FAIR VALUE OF HEDGED ITEMS IN PORTFOLIO HEDGES OF INTEREST RATE RISK | 12 | 55 | |||||||||
| LIABILITIES UNDER INSURANCE CONTRACTS | 17,592 | 17,799 | |||||||||
| PROVISIONS | 8,401 | 8,441 | |||||||||
| Pension and other post-retirement obligations | 10 | 1,936 | 2,225 | ||||||||
| Other long term employee benefits | 10 | 894 | 880 | ||||||||
| Taxes and other legal contingencies | 10 | 2,631 | 2,715 | ||||||||
| Contingent liabilities and commitments | 14 | 698 | 702 | ||||||||
| Other provisions | 10 | 2,242 | 1,919 | ||||||||
| TAX LIABILITIES | 9,802 | 9,932 | |||||||||
| Current tax liabilities | 3,691 | 3,846 | |||||||||
| Deferred tax liabilities | 6,111 | 6,086 | |||||||||
| OTHER LIABILITIES | 18,026 | 17,598 | |||||||||
| LIABILITIES ASSOCIATED WITH NON-CURRENT ASSETS HELD FOR SALE | — | — | |||||||||
| TOTAL LIABILITIES | 1,682,613 | 1,692,821 | |||||||||
| SHAREHOLDERS´ EQUITY | 132,836 | 130,443 | |||||||||
| CAPITAL | 11 | 7,747 | 8,092 | ||||||||
| Called up paid capital | 7,747 | 8,092 | |||||||||
| Unpaid capital which has been called up | — | — | |||||||||
| SHARE PREMIUM | 41,604 | 44,373 | |||||||||
| EQUITY INSTRUMENTS ISSUED OTHER THAN CAPITAL | 735 | 720 | |||||||||
| Equity component of the compound financial instrument | — | — | |||||||||
| Other equity instruments issued | 735 | 720 | |||||||||
| OTHER EQUITY | 189 | 195 | |||||||||
| ACCUMULATED RETAINED EARNINGS | 82,324 | 74,114 | |||||||||
| REVALUATION RESERVES | — | — | |||||||||
| OTHER RESERVES | (5,816) | (5,751) | |||||||||
| (-) OWN SHARES | (6) | (1,078) | |||||||||
| PROFIT ATTRIBUTABLE TO SHAREHOLDERS OF THE PARENT | 3 | 6,059 | 11,076 | ||||||||
| (-) INTERIM DIVIDENDS | — | (1,298) | |||||||||
| OTHER COMPREHENSIVE INCOME (LOSS) | 11 | (36,963) | (35,020) | ||||||||
| ITEMS NOT RECLASSIFIED TO PROFIT OR LOSS | (5,118) | (5,212) | |||||||||
| ITEMS THAT MAY BE RECLASSIFIED TO PROFIT OR LOSS | (31,845) | (29,808) | |||||||||
| NON-CONTROLLING INTEREST | 7,775 | 8,818 | |||||||||
| Other comprehensive income | (1,872) | (1,559) | |||||||||
| Other items | 9,647 | 10,377 | |||||||||
| TOTAL EQUITY | 103,648 | 104,241 | |||||||||
| TOTAL LIABILITIES AND EQUITY | 1,786,261 | 1,797,062 | |||||||||
| MEMORANDUM ITEMS: OFF BALANCE SHEET AMOUNTS | 14 | ||||||||||
| Loan commitments granted | 290,151 | 279,589 | |||||||||
| Financial guarantees granted | 15,598 | 15,435 | |||||||||
| Other commitments granted | 127,420 | 113,273 | |||||||||
(*)Presented for comparison purposes only (see Note 1.e).
The accompanying explanatory Notes 1 to 17 are an integral part of the condensed consolidated balance sheet as at 30 June 2024.
100 | | January - June 2024 | ||||||
Translation of interim condensed consolidated financial statements originally issued in Spanish and prepared in accordance with the regulatory financial reporting framework applicable to the Group in Spain (see Notes 1 and 17). In the event of a discrepancy, the Spanish-language version prevails.
GRUPO SANTANDER
CONDENSED CONSOLIDATED INCOME STATEMENTS
FOR THE SIX-MONTH PERIODS ENDED 30 JUNE 2024 AND 2023
(EUR million) | (Debit) / Credit | ||||||||||
| Note | 01-01-2024 to 30-06-2024 | 01-01-2023 to 30-06-2023 (*) | |||||||||
| Interest income | 56,838 | 49,922 | |||||||||
| Financial assets at fair value through other comprehensive income | 3,426 | 3,629 | |||||||||
| Financial assets at amortised cost | 42,198 | 37,503 | |||||||||
| Other interest income | 11,214 | 8,790 | |||||||||
| Interest expense | (33,381) | (29,002) | |||||||||
| Interest income/ (charges) | 23,457 | 20,920 | |||||||||
| Dividend income | 493 | 382 | |||||||||
| Income from companies accounted for using the equity method | 303 | 296 | |||||||||
| Commission income | 8,738 | 8,277 | |||||||||
| Commission expense | (2,261) | (2,174) | |||||||||
| Gain or losses on financial assets and liabilities not measured at fair value through profit or loss, net | 20 | 22 | |||||||||
| Financial assets at amortised cost | (43) | 6 | |||||||||
| Other financial assets and liabilities | 63 | 16 | |||||||||
| Gain or losses on financial assets and liabilities held for trading, net | 441 | 263 | |||||||||
| Reclassification of financial assets at fair value through other comprehensive income | — | — | |||||||||
| Reclassification of financial assets at amortised cost | — | — | |||||||||
| Other gains (losses) | 441 | 263 | |||||||||
| Gains or losses on non-trading financial assets and liabilities mandatorily at fair value through profit or loss | 314 | 26 | |||||||||
| Reclassification of financial assets at fair value through other comprehensive income | — | — | |||||||||
| Reclassification of financial assets at amortised cost | — | — | |||||||||
| Other gains (losses) | 314 | 26 | |||||||||
| Gain or losses on financial assets and liabilities measured at fair value through profit or loss, net | 427 | (194) | |||||||||
| Gain or losses from hedge accounting, net | 14 | 108 | |||||||||
| Exchange differences, net | (259) | 1,077 | |||||||||
| Other operating income (**) | 409 | 480 | |||||||||
| Other operating expenses | (1,391) | (1,504) | |||||||||
| Income from insurance and reinsurance contracts | 249 | 414 | |||||||||
| Expenses from insurance and reinsurance contracts | (239) | (383) | |||||||||
| Total income | 30,715 | 28,010 | |||||||||
| Administrative expenses | (11,257) | (10,873) | |||||||||
| Staff costs | (7,061) | (6,603) | |||||||||
| Other general and administrative expenses | (4,196) | (4,270) | |||||||||
| Depreciation and amortisation cost | (1,656) | (1,606) | |||||||||
| Provisions or reversal of provisions, net | (1,762) | (1,330) | |||||||||
| Impairment or reversal of impairment of financial assets not measured at fair value through profit or loss and net gains and losses from modifications | (6,577) | (6,237) | |||||||||
| Financial assets at fair value through other comprehensive income | (8) | 6 | |||||||||
| Financial assets at amortised cost | 5 | (6,569) | (6,243) | ||||||||
| Impairment of investments in subsidiaries, joint ventures and associates, net | — | — | |||||||||
| Impairment on non-financial assets, net | (290) | (92) | |||||||||
| Tangible assets | (183) | (78) | |||||||||
| Intangible assets | (105) | (5) | |||||||||
| Others | (2) | (9) | |||||||||
| Gain or losses on non financial assets and investments, net | 366 | 277 | |||||||||
| Negative goodwill recognised in results | — | — | |||||||||
| Gains or losses on non-current assets held for sale not classified as discontinued operations | 6 | (31) | (59) | ||||||||
| Operating profit/(loss) before tax | 9,508 | 8,090 | |||||||||
| Tax expense or income from continuing operations | (2,916) | (2,281) | |||||||||
| Profit/(loss) for the period from continuing operations | 6,592 | 5,809 | |||||||||
| Profit/( loss) after tax from discontinued operations | — | — | |||||||||
| Profit/(loss) for the period | 6,592 | 5,809 | |||||||||
| Profit attributable to non-controlling interests | 533 | 568 | |||||||||
| Profit/(loss) attributable to the parent | 6,059 | 5,241 | |||||||||
| Earnings/(losses) per share | 3 | ||||||||||
| Basic | 0.37 | 0.31 | |||||||||
| Diluted | 0.37 | 0.31 | |||||||||
(*)Presented for comparison purposes only (see Note 1.e).
(**) Includes EUR -687 million at 30 June 2024 (EUR -574 million at 30 June 2023) derived from the net monetary loss generated in Argentina as a result of the application of IAS 29 Financial reporting in hyperinflationary economies.
The accompanying explanatory Notes 1 to 17 are an integral part of the condensed consolidated income statement
for the six-month period ended 30 June 2024.
| January - June 2024 | | 101 | ||||||
Translation of interim condensed consolidated financial statements originally issued in Spanish and prepared in accordance with the regulatory financial reporting framework applicable to the Group in Spain (see Notes 1 and 17). In the event of a discrepancy, the Spanish-language version prevails.
GRUPO SANTANDER
CONDENSED CONSOLIDATED STATEMENTS OF RECOGNISED INCOME AND EXPENSE
FOR THE SIX-MONTH PERIODS ENDED 30 JUNE 2024 AND 2023
(EUR million)
| (Debit) / Credit | |||||||||||
| Note | 01-01-2024 to 30-06-2024 | 01-01-2023 to 30-06-2023 (*) | |||||||||
| CONSOLIDATED PROFIT/(LOSS) FOR THE PERIOD | 6,592 | 5,809 | |||||||||
| OTHER RECOGNISED INCOME AND EXPENSE | (2,393) | 2,091 | |||||||||
| Items that will not be reclassified to profit or loss | 11 | (29) | (489) | ||||||||
| Actuarial gains and losses on defined benefit pension plans | (59) | (402) | |||||||||
| Non-current assets held for sale | — | — | |||||||||
| Other recognised income and expense of investments in subsidiaries, joint ventures and associates | (4) | (5) | |||||||||
| Changes in the fair value of equity instruments measured at fair value through other comprehensive income | 107 | (201) | |||||||||
| Gains or losses resulting from the accounting for hedges of equity instruments measured at fair value through other comprehensive income, net | — | — | |||||||||
| Changes in the fair value of equity instruments measured at fair value through other comprehensive income (hedged item) | 4 | (41) | |||||||||
| Changes in the fair value of equity instruments measured at fair value through other comprehensive income (hedging instrument) | (4) | 41 | |||||||||
| Changes in the fair value of financial liabilities at fair value through profit or loss attributable to changes in credit risk | (90) | (50) | |||||||||
| Income tax relating to items that will not be reclassified | 17 | 169 | |||||||||
| Items that may be reclassified to profit or loss | 11 | (2,364) | 2,580 | ||||||||
| Hedges of net investments in foreign operations (effective portion) | 11 | 101 | (1,527) | ||||||||
| Revaluation gains (losses) | 101 | (1,527) | |||||||||
| Amounts transferred to income statement | — | — | |||||||||
| Other reclassifications | — | — | |||||||||
| Exchange differences | 11 | (1,932) | 3,094 | ||||||||
| Revaluation gains (losses) | (1,932) | 3,056 | |||||||||
| Amounts transferred to income statement | — | 38 | |||||||||
| Other reclassifications | — | — | |||||||||
| Cash flow hedges (effective portion) | (403) | 596 | |||||||||
| Revaluation gains (losses) | (887) | (1,318) | |||||||||
| Amounts transferred to income statement | 484 | 1,914 | |||||||||
| Transferred to initial carrying amount of hedged items | — | — | |||||||||
| Other reclassifications | — | — | |||||||||
| Hedging instruments (items not designated) | — | — | |||||||||
| Revaluation gains (losses) | — | — | |||||||||
| Amounts transferred to income statement | — | — | |||||||||
| Other reclassifications | — | — | |||||||||
| Debt instruments at fair value with changes in other comprehensive income | (325) | 790 | |||||||||
| Revaluation gains (losses) | (291) | 782 | |||||||||
| Amounts transferred to income statement | (34) | 8 | |||||||||
| Other reclassifications | — | — | |||||||||
| Non-current assets held for sale | — | — | |||||||||
| Revaluation gains (losses) | — | — | |||||||||
| Amounts transferred to income statement | — | — | |||||||||
| Other reclassifications | — | — | |||||||||
| Share of other recognised income and expense of investments | (57) | 88 | |||||||||
| Income tax relating to items that may be reclassified to profit or loss | 252 | (461) | |||||||||
| Total recognised income and expenses for the year | 4,199 | 7,900 | |||||||||
| Attributable to non-controlling interests | 220 | 937 | |||||||||
| Attributable to the parent | 3,979 | 6,963 | |||||||||
(*)Presented for comparison purposes only (see Note 1.e).
The accompanying explanatory Notes 1 to 17 are an integral part of the condensed consolidated statement of recognised income and expense for the six-month period ended 30 June 2024.
102 | | January - June 2024 | ||||||
Translation of interim condensed consolidated financial statements originally issued in Spanish and prepared in accordance with the regulatory financial reporting framework applicable to the Group in Spain (see Notes 1 and 17). In the event of a discrepancy, the Spanish-language version prevails.
GRUPO SANTANDER
CONDENSED CONSOLIDATED STATEMENTS OF CHANGES IN TOTAL EQUITY
FOR THE SIX-MONTH PERIODS ENDED 30 JUNE 2024 AND 2023
FOR THE SIX-MONTH PERIODS ENDED 30 JUNE 2024 AND 2023
(EUR million)
| Capital | Share premium | Equity instruments issued (not capital) | Other equity instruments | Accumulated retained earnings | Revaluation reserves | Other reserves | (-) Own shares | Profit Attributable to shareholders of the parent | (-) Interim dividends | Other comprehensive income | Non-Controlling interest | Total | ||||||||||||||||||||||||||||||||
| Other comprehensive income | Other items | |||||||||||||||||||||||||||||||||||||||||||
| Balance as at 12-31-2023 (*) | 8,092 | 44,373 | 720 | 195 | 74,114 | — | (5,751) | (1,078) | 11,076 | (1,298) | (35,020) | (1,559) | 10,377 | 104,241 | ||||||||||||||||||||||||||||||
| Adjustments due to errors | — | — | — | — | — | — | — | — | — | — | — | — | — | — | ||||||||||||||||||||||||||||||
| Adjustments due to changes in accounting policies | — | — | — | — | — | — | — | — | — | — | — | — | — | — | ||||||||||||||||||||||||||||||
| Opening balance as at 01-01-2024 (*) | 8,092 | 44,373 | 720 | 195 | 74,114 | — | (5,751) | (1,078) | 11,076 | (1,298) | (35,020) | (1,559) | 10,377 | 104,241 | ||||||||||||||||||||||||||||||
| Total recognised income and expense | — | — | — | — | — | — | — | — | 6,059 | — | (2,080) | (313) | 533 | 4,199 | ||||||||||||||||||||||||||||||
| Other changes in equity | (345) | (2,769) | 15 | (6) | 8,210 | — | (65) | 1,072 | (11,076) | 1,298 | 137 | — | (1,263) | (4,792) | ||||||||||||||||||||||||||||||
| Issuance of ordinary shares | — | — | — | — | — | — | — | — | — | — | — | — | — | — | ||||||||||||||||||||||||||||||
| Issuance of preferred shares | — | — | — | — | — | — | — | — | — | — | — | — | — | — | ||||||||||||||||||||||||||||||
| Issuance of other financial instruments | — | — | — | — | — | — | — | — | — | — | — | — | — | — | ||||||||||||||||||||||||||||||
| Maturity of other financial instruments | — | — | — | — | — | — | — | — | — | — | — | — | (590) | (590) | ||||||||||||||||||||||||||||||
| Conversion of financial liabilities into equity | — | — | — | — | — | — | — | — | — | — | — | — | — | — | ||||||||||||||||||||||||||||||
| Capital reduction | (345) | (2,769) | — | — | — | — | 345 | 2,769 | — | — | — | — | (93) | (93) | ||||||||||||||||||||||||||||||
| Dividends | — | — | — | — | (1,485) | — | — | — | — | — | — | — | (603) | (2,088) | ||||||||||||||||||||||||||||||
| Purchase of equity instruments | — | — | — | — | — | — | — | (2,159) | — | — | — | — | — | (2,159) | ||||||||||||||||||||||||||||||
| Disposal of equity instruments | — | — | — | — | — | — | 6 | 462 | — | — | — | — | — | 468 | ||||||||||||||||||||||||||||||
| Transfer from equity to liabilities | — | — | — | — | — | — | — | — | — | — | — | — | — | — | ||||||||||||||||||||||||||||||
| Transfer from liabilities to equity | — | — | — | — | — | — | — | — | — | — | — | — | — | — | ||||||||||||||||||||||||||||||
| Transfers between equity items | — | — | — | — | 9,695 | — | (54) | — | (11,076) | 1,298 | 137 | — | — | — | ||||||||||||||||||||||||||||||
| Increases (decreases) due to business combinations | — | — | — | — | — | — | — | — | — | — | — | — | — | — | ||||||||||||||||||||||||||||||
| Share-based payment | — | — | — | (55) | — | — | — | — | — | — | — | — | — | (55) | ||||||||||||||||||||||||||||||
| Others increases or (-) decreases of the equity | — | — | 15 | 49 | — | — | (362) | — | — | — | — | — | 23 | (275) | ||||||||||||||||||||||||||||||
| Balance as at 06-30-2024 | 7,747 | 41,604 | 735 | 189 | 82,324 | — | (5,816) | (6) | 6,059 | — | (36,963) | (1,872) | 9,647 | 103,648 | ||||||||||||||||||||||||||||||
(*)Presented for comparison purposes only (see Note 1.e).
The accompanying explanatory Notes 1 to 17 are an integral part of the condensed consolidated statement of changes in total equity
for the six-month period ended 30 June 2024.
| January - June 2024 | | 103 | ||||||
Translation of interim condensed consolidated financial statements originally issued in Spanish and prepared in accordance with the regulatory financial reporting framework applicable to the Group in Spain (see Notes 1 and 17). In the event of a discrepancy, the Spanish-language version prevails.
GRUPO SANTANDER
CONDENSED CONSOLIDATED STATEMENTS OF CHANGES IN TOTAL EQUITY
FOR THE SIX-MONTH PERIODS ENDED 30 JUNE 2024 AND 2023
(EUR million)
| Capital | Share premium | Equity instruments issued (not capital) | Other equity instruments | Accumulated retained earnings | Revaluation reserves | Other reserves | (-) Own shares | Profit Attributable to shareholders of the parent | (-) Interim dividends | Other comprehensive income | Non-Controlling interest | Total | ||||||||||||||||||||||||||||||||
| Other comprehensive income | Other items | |||||||||||||||||||||||||||||||||||||||||||
| Balance as at 12-31-2022 (*) | 8,397 | 46,273 | 688 | 175 | 66,702 | — | (5,454) | (675) | 9,605 | (979) | (35,628) | (1,856) | 10,337 | 97,585 | ||||||||||||||||||||||||||||||
| Adjustments due to errors | — | — | — | — | — | — | — | — | — | — | — | — | — | — | ||||||||||||||||||||||||||||||
| Adjustments due to changes in accounting policies | — | — | — | — | — | — | — | — | — | — | — | — | — | — | ||||||||||||||||||||||||||||||
| Opening balance as at 01-01-2023 (*) | 8,397 | 46,273 | 688 | 175 | 66,702 | — | (5,454) | (675) | 9,605 | (979) | (35,628) | (1,856) | 10,337 | 97,585 | ||||||||||||||||||||||||||||||
| Total recognised income and expense | — | — | — | — | — | — | — | — | 5,241 | — | 1,722 | 369 | 568 | 7,900 | ||||||||||||||||||||||||||||||
| Other changes in equity | (305) | (1,900) | 16 | 21 | 7,410 | — | 41 | 628 | (9,605) | 979 | 117 | 3 | (846) | (3,441) | ||||||||||||||||||||||||||||||
| Issuance of ordinary shares | — | — | — | — | — | — | — | — | — | — | — | — | 1 | 1 | ||||||||||||||||||||||||||||||
| Issuance of preferred shares | — | — | — | — | — | — | — | — | — | — | — | — | — | — | ||||||||||||||||||||||||||||||
| Issuance of other financial instruments | — | — | — | — | — | — | — | — | — | — | — | — | — | — | ||||||||||||||||||||||||||||||
| Maturity of other financial instruments | — | — | — | — | — | — | — | — | — | — | — | — | — | — | ||||||||||||||||||||||||||||||
| Conversion of financial liabilities into equity | — | — | — | — | — | — | — | — | — | — | — | — | — | — | ||||||||||||||||||||||||||||||
| Capital reduction | (305) | (1,900) | — | — | — | — | 305 | 1,900 | — | — | — | — | — | — | ||||||||||||||||||||||||||||||
| Dividends | — | — | — | — | (963) | — | — | — | — | — | — | — | (436) | (1,399) | ||||||||||||||||||||||||||||||
| Purchase of equity instruments | — | — | — | — | — | — | — | (1,723) | — | — | — | — | — | (1,723) | ||||||||||||||||||||||||||||||
| Disposal of equity instruments | — | — | — | — | — | — | 11 | 451 | — | — | — | — | — | 462 | ||||||||||||||||||||||||||||||
| Transfer from equity to liabilities | — | — | — | — | — | — | — | — | — | — | — | — | — | — | ||||||||||||||||||||||||||||||
| Transfer from liabilities to equity | — | — | — | — | — | — | — | — | — | — | — | — | — | — | ||||||||||||||||||||||||||||||
| Transfers between equity items | — | — | — | — | 8,373 | — | 136 | — | (9,605) | 979 | 117 | 3 | (3) | — | ||||||||||||||||||||||||||||||
| Increases (decreases) due to business combinations | — | — | — | — | — | — | — | — | — | — | — | — | (304) | (304) | ||||||||||||||||||||||||||||||
| Share-based payment | — | — | — | (66) | — | — | — | — | — | — | — | — | — | (66) | ||||||||||||||||||||||||||||||
| Others increases or (-) decreases of the equity | — | — | 16 | 87 | — | — | (411) | — | — | — | — | — | (104) | (412) | ||||||||||||||||||||||||||||||
| Balance as at 06-30-2023 (*) | 8,092 | 44,373 | 704 | 196 | 74,112 | — | (5,413) | (47) | 5,241 | — | (33,789) | (1,484) | 10,059 | 102,044 | ||||||||||||||||||||||||||||||
(*)Presented for comparison purposes only (see Note 1.e).
The accompanying explanatory Notes 1 to 17 are an integral part of the condensed consolidated statement of changes in total equity
for the six-month period ended 30 June 2024.
104 | | January - June 2024 | ||||||
Translation of interim condensed consolidated financial statements originally issued in Spanish and prepared in accordance with the regulatory financial reporting framework applicable to the Group in Spain (see Notes 1 and 17). In the event of a discrepancy, the Spanish-language version prevails.
GRUPO SANTANDER
CONDENSED CONSOLIDATED STATEMENTS OF CASH FLOWS
FOR THE SIX-MONTH PERIODS ENDED 30 JUNE 2024 AND 2023
FOR THE SIX-MONTH PERIODS ENDED 30 JUNE 2024 AND 2023
(EUR million)
| Note | 30-06-2024 | 30-06-2023 (*) | |||||||||
| A. CASH FLOWS FROM OPERATING ACTIVITIES | (60,172) | (11,895) | |||||||||
| Profit/(loss) for the period | 6,592 | 5,809 | |||||||||
| Adjustments made to obtain the cash flows from operating activities | 13,925 | 13,720 | |||||||||
| Depreciation and amortisation cost | 1,656 | 1,606 | |||||||||
| Other adjustments | 12,269 | 12,114 | |||||||||
| Net increase/(decrease) in operating assets | 82,440 | 45,762 | |||||||||
| Financial assets held-for-trading | 35,042 | 23,291 | |||||||||
| Non-trading financial assets mandatorily at fair value through profit or loss | 402 | 120 | |||||||||
| Financial assets at fair value through profit or loss | (592) | 647 | |||||||||
| Financial assets at fair value through other comprehensive income | 1,295 | (1,819) | |||||||||
| Financial assets at amortised cost | 45,626 | 26,151 | |||||||||
| Other operating assets | 667 | (2,628) | |||||||||
| Net increase/(decrease) in operating liabilities | 3,232 | 15,842 | |||||||||
| Financial liabilities held-for-trading | 13,709 | 16,830 | |||||||||
| Financial liabilities designated at fair value through profit or loss | (5,968) | (4,202) | |||||||||
| Financial liabilities at amortised cost | (1,103) | 4,132 | |||||||||
| Other operating liabilities | (3,406) | (918) | |||||||||
| Income tax recovered/(paid) | (1,481) | (1,504) | |||||||||
| B. CASH FLOWS FROM INVESTING ACTIVITIES | (2,301) | (2,498) | |||||||||
| Payments | 6,034 | 6,832 | |||||||||
| Tangible assets | 7 | 4,738 | 4,705 | ||||||||
| Intangible assets | 909 | 954 | |||||||||
| Investments | 362 | 25 | |||||||||
| Subsidiaries and other business units | 2 | 25 | 1,148 | ||||||||
| Non-current assets held for sale and associated liabilities | — | — | |||||||||
| Other payments related to investing activities | — | — | |||||||||
| Proceeds | 3,733 | 4,334 | |||||||||
| Tangible assets | 7 | 2,991 | 2,737 | ||||||||
| Intangible assets | — | — | |||||||||
| Investments | 294 | 374 | |||||||||
| Subsidiaries and other business units | 4 | 838 | |||||||||
| Non-current assets held for sale and associated liabilities | 6 | 444 | 385 | ||||||||
| Other proceeds related to investing activities | — | — | |||||||||
| C. CASH FLOW FROM FINANCING ACTIVITIES | (4,173) | (2,358) | |||||||||
| Payments | 8,587 | 4,623 | |||||||||
| Dividends | 3 | 1,485 | 963 | ||||||||
| Subordinated liabilities | 3,210 | 748 | |||||||||
| Redemption of own equity instruments | — | — | |||||||||
| Acquisition of own equity instruments | 2,159 | 1,723 | |||||||||
| Other payments related to financing activities | 1,733 | 1,189 | |||||||||
| Proceeds | 4,414 | 2,265 | |||||||||
| Subordinated liabilities | 3,908 | 1,654 | |||||||||
| Issuance of own equity instruments | 11 | — | — | ||||||||
| Disposal of own equity instruments | 471 | 467 | |||||||||
| Other proceeds related to financing activities | 35 | 144 | |||||||||
| D. EFFECT OF FOREIGN EXCHANGE RATE DIFFERENCES | 2,538 | 1,224 | |||||||||
| E. NET INCREASE/(DECREASE) IN CASH AND CASH EQUIVALENTS | (64,108) | (15,527) | |||||||||
| F. CASH AND CASH EQUIVALENTS AT BEGINNING OF PERIOD | 220,342 | 223,073 | |||||||||
| G. CASH AND CASH EQUIVALENTS AT END OF PERIOD | 156,234 | 207,546 | |||||||||
| COMPONENTS OF CASH AND CASH EQUIVALENTS AT END OF PERIOD | |||||||||||
| Cash | 7,113 | 8,195 | |||||||||
| Cash equivalents at central banks | 134,228 | 186,134 | |||||||||
| Other financial assets | 14,893 | 13,217 | |||||||||
| Less: Bank overdrafts refundable on demand | — | — | |||||||||
| TOTAL CASH AND CASH EQUIVALENTS AT END OF PERIOD | 156,234 | 207,546 | |||||||||
| In which: restricted cash | — | — | |||||||||
(*)Presented for comparison purposes only (see Note 1.e).
The accompanying explanatory Notes 1 to 17 are an integral part of the condensed consolidated statement of recognised income and expense for the six-month period ended 30 June 2024.
| January - June 2024 | | 105 | ||||||
Banco Santander, S.A. and Companies composing Grupo Santander
Explanatory notes to the interim condensed consolidated financial statements for the six-month period ended 30 June 2024.
1. Introduction, basis of presentation of the interim condensed consolidated financial statements and other information
a) Introduction
Banco Santander, S.A. ('the parent' or 'Banco Santander') is a private-law entity subject to the rules and regulations applicable to banks operating in Spain. The Bylaws and other public information of the Bank can be consulted at its registered office at Paseo de Pereda 9 -12, Santander.
In addition to the operations carried on directly by it, Banco Santander is the head of a group of subsidiaries that engage in various business activities and which compose, together with it, Grupo Santander ('Santander' or 'The Group').
Grupo Santander's interim condensed consolidated financial statements ('interim financial statements') for the six-month period ended 30 June 2024 were authorised and approved by Grupo Santander's directors at the board of directors meeting held on 23 July 2024. Grupo Santander's consolidated annual accounts for year 2023 were approved by shareholders at Banco Santander annual general meeting on 22 March 2024.
b) Basis of presentation of the interim financial statements
Under Regulation (EC) n.º 1606/2002 of the European Parliament and of the Council of 19 July 2002 all companies governed by the law of an EU Member State and whose securities are admitted to trading on a regulated market of any Member State must prepare their consolidated financial statements for the years beginning on or after 1 January, 2005 in conformity with the International Financial Reporting Standards ('IFRS') previously adopted by the European Union ('EU-IFRS'). In order to adapt the accounting system of Spanish credit institutions with the principles and criteria established by the IFRS adopted by the European Union ('EU-IFRS'), the Bank of Spain published circular 4/2017, dated 27 November 2017, and subsequent changes, on Public and Confidential Financial Reporting Standards and Financial Statement Formats.
The consolidated annual accounts for 2023 were authorised at the board of directors meeting on 19 February 2024 in compliance with International Financial Reporting Standards as adopted by the European Union, taking into account Bank of Spain Circular 4/2017, and subsequent modifications, using the basis of consolidation, accounting policies and measurement bases described in Note 2 to the aforementioned consolidated annual accounts and, accordingly, they presented fairly Grupo Santander’s consolidated equity and consolidated financial position at 31 December 2023 and the consolidated results of its operations, and the consolidated cash flows in 2022. The aforementioned consolidated annual accounts, which are included in Grupo Santander’s Form 20-F filed with the U.S. Securities and Exchange Commission on 21 February 2024, and these interim financial statements are also in compliance with International Financial Reporting Standards as issued by the International Accounting Standards Board ('IFRS-IASB', and together with EU-IFRS, 'IFRS').
These interim financial statements were prepared and are presented in accordance with International Accounting Standard (IAS 34), Interim Financial Reporting, for the preparation of interim financial statements in accordance with the provisions of article 12 of Royal Decree 1362/2007 taking into account the requirements of Circular 3/2018, of June 28, of the Securities and Exchange Commission (CNMV). These interim financial statements will be included in the Half-Yearly Financial Information corresponding to the first half of 2024 that the Group presents in accordance with the aforementioned Circular 3/2018.
In accordance with IAS 34, the interim financial statements are intended only to provide an update on the content of the latest consolidated annual accounts authorised for issue, focusing on new activities, events and circumstances occurring during the first six months, and does not duplicate information previously reported in the latest consolidated annual accounts. Consequently, these interim financial statements do not include all the information that would be required for a complete set of consolidated annual accounts prepared in accordance with IFRS and, accordingly, for a proper comprehension of the information included in these interim financial statements, they should be read together with Grupo Santander’s consolidated annual accounts for the year ended 31 December 2023.
Grupo Santander policies include presenting the interim financial statements for its use in the different markets using the Euro as its presentation currency. The amounts held in other currencies and the balances of entities whose functional currency is not the Euro, have been translated to the presentation currency in accordance with the criteria indicated in Note 2.a to the consolidated annual accounts for 2023. As indicated in that note, for practical reasons, the balance sheet amount has been converted to the closing exchange rate, the equity to the historical type, and the income and expenses have been converted by applying the average exchange rate of the period; the application of such exchange rate or that corresponding to the date of each transaction does not lead to significant differences in the interim financial statements of Grupo Santander.
106 | | January - June 2024 | ||||||
The accounting policies and methods used in preparing these interim financial statements are the same as those applied in the consolidated annual accounts for 2023 taking into account the standards and interpretations with effective application date during the first six months of 2024, which are detailed below:
•Amendment to IFRS 16 Lease Liability in a Sale and Leaseback requires a seller-lessee to subsequently measure lease liabilities arising from a leaseback without recognising any amount of the gain or loss that relates to the right of use retained. This new requirement does not prevent a seller-lessee from recognising in profit or loss any gain or loss relating to the partial or full termination of a lease. Applicable, retrospectively, from 1 January 2024.
•Classification of Liabilities, amendments to IAS 1 Presentation of Financial Statements, considering non-current liabilities those in which the entity has the possibility of deferring payment for more than 12 months from the closing date of the reporting period.
Likewise, an additional amendment to IAS 1 on the classification of liabilities with covenants as current or non-current has been approved, specifying that covenants that must be complied with after the reporting date do not affect the classification of liabilities and require additionally their respective breakdowns.
They should be applied retrospectively in accordance with the normal requirements of IAS 8 Accounting Policies, Changes in Accounting Estimates and Errors. Applicable from 1 January 2024.
•IAS 7 Statement of Cash Flows and IFRS 7 Financial Instruments: Additional disclosures are required for companies entering into supplier financing arrangements. The objective of the new disclosures is to provide information on Supplier Finance Arrangements (SFA) that allows investors to evaluate the effects on an entity's liabilities, cash flows and liquidity risk exposure (effective from 1 January 2024).
The aforementioned accounting standards and modifications have not had a significant effect on Grupo Santander’s financial statements, except for what was disclosed before.
All accounting policies and measurement bases with a material effect on the interim financial statements for 30 June 2024 were applied in their preparation.
By the time of the preparation of these interim financial statements, there are no standards pending adoption by the European Union for the current exercise by the IASB with an effective date of 1 January 2024.
c) Use of critical estimates
The consolidated results and the determination of the consolidated equity are sensitive to the accounting principles and policies, valuation criteria and estimates used by the directors of Banco Santander in preparing the interim financial statements. The main accounting principles, policies, and valuation criteria are indicated in Note 2 of the consolidated annual accounts of the year 2023, except for those indicated in these interim financial statements due to the accounting standards and modifications that have come into effect during the first six months of the year 2024.
The interim financial statements contain estimates made by the senior management of Banco Santander and of the consolidated entities in order to quantify certain of the assets, liabilities, income, expenses and obligations reported in the consolidated entities. These estimates, which were made on the basis of the best information available, relate mainly to the following:
•The income tax expense, which is recognised in interim periods based on the best estimate of the weighted average tax rate expected by Grupo Santander for the full financial year;
•The impairment losses on certain assets – financial assets at fair value through other comprehensive income, financial assets at amortised cost, non-current assets held for sale, investments in subsidiaries, joint ventures and associates, tangible assets and intangible assets;
•The assumptions used in the calculation of the post-employment benefit liabilities and commitments and other obligations;
•The useful life of the tangible and intangible assets;
•The measurement of goodwill impairment arising on consolidation;
•The calculation of provisions and the consideration of contingent liabilities;
•The fair value of certain unquoted assets and liabilities;
•The recoverability of deferred tax assets; and
•The fair value of the identifiable assets acquired and the liabilities assumed in business combinations in accordance with IFRS 3.
To update the previous estimates, the Group's management has taken into account the current macroeconomic scenario resulting from the complex geopolitical situation, the levels of inflation and interest rates, as well as the resilience of the labour market being a priority monitoring focus due to the potential uncertainty generated in the Group's estimates.
The Group's management has evaluated in particular the uncertainties caused by the current environment in relation to credit, liquidity and market risks, taking into account the best available information, to estimate the impact on the credit portfolio's impairment provision, and in the debt instruments' interest rates and valuation.
| January - June 2024 | | 107 | ||||||
In addition, the Group has applied in the interim financial statements a new theoretical exchange rate for the Argentine peso (1,499 pesos on 30 June 2024). This decision is due to the significant divergence that has been observed between the official exchange rate and other macroeconomic magnitudes, mainly inflation. The new theoretical exchange rate also reflects the implicit exchange rate observed in certain transactions ordered between market participants under the prevailing economic conditions, such as the repatriation of dividends from businesses in Argentina. This matter has not had a material impact in the Group’s interim financial statements.
During the six-month period ended 30 June 2024, there have been no additional significant changes in the estimates made at the end of 2023, other than those indicated in these interim financial statements.
d) Contingent assets and liabilities
Note 25 to Grupo Santander's consolidated annual accounts for the year ended 31 December 2023 includes information on the contingent assets and liabilities at that date. There were no significant changes in Grupo Santander's contingent assets and liabilities from 31 December 2023 to the date of formal preparation of these interim financial statements.
e) Comparative information
The information for the year 2023 contained in these interim financial statements is only presented for comparison purposes with the information relating to the six-month period ended 30 June 2024.
The information in Note 12 related to segment information for March 2023 has been restated, in accordance with the new organizational structure of Grupo Santander, as required by IFRS 8 (see note 12).
In order to interpret the changes in the balances with respect to 31 December 2023, it is necessary to take into consideration the exchange rate effect arising from the volume of foreign currency balances held by the Group in view of its geographic diversity (Note 51.b to the consolidated annual accounts for the annual year ended 31 December 2023) and the impact of the appreciation/depreciation of the various currencies against the euro in the first six months of 2024: Mexican peso (-4.45%), US dollar (3.18%), Brazilian real (-9.73%), Pound sterling (2.38%), Chilean peso (-4.57%) and Polish zloty (0.82%); as well as the evolution of the average exchange rates between comparable periods: Mexican peso (6.12%), US dollar (-0.06%), Brazilian real (-0.21%), Pound sterling (2.52%), Chilean peso (-14.30%) and Polish zloty (7.11%).
f) Seasonality of the Grupo Santander’s transactions
The business activities carried on by Grupo Santander entities, and their transactions are not cyclical or seasonal in nature. Therefore, no specific disclosures are included in these explanatory notes to the interim financial statements for the six-month period ended 30 June 2024.
g) Materiality
In determining the note disclosures to be made on the various items in the interim financial statements or other matters, Grupo Santander, in accordance with IAS 34, took into account their materiality in relation to the interim financial statements for the six-month period ended 30 June 2024.
h) Other information
On 28 December 2022, the law establishing a temporary levy on credit institutions and financial credit establishments was published in Spain. On 1 January 2024, an amount of EUR 335 million (EUR 224 million on 1 January 2023) was recorded under the heading "Other operating expenses" in the profit and loss account in accordance with IFRIC 21 due to this new tax.
i) Events after the reporting period
From 1 July 2024 and up to the date of issuance of these interim financial statements corresponding to the first six months of 2024, there have been no relevant events other than those indicated in the interim financial statements.
2. Grupo Santander
Appendices I, II and III to the consolidated annual accounts for the year ended 31 December 2023 provide relevant information on Grupo Santander companies at that date and on the companies accounted for under the equity method.
Also, Note 3 to the aforementioned consolidated annual accounts includes a description of the most significant acquisitions and disposals of companies performed by Grupo Santander in 2023, 2022 and 2021.
During the first six months of 2024, no significant operations have been carried out or those are pending execution at 30 June 2023.
108 | | January - June 2024 | ||||||
3. Shareholder remuneration system and earnings per share
a) Shareholder remuneration system
The cash remuneration paid by Banco Santander to its shareholders in the first six months of 2024 and 2023 was as follows:
| 30-06-2024 | 30-06-2023 | |||||||||||||||||||
| % of par value | Euros per share | Amount (EUR million) | % of par value | Euros per share | Amount (EUR million) | |||||||||||||||
| Ordinary shares | 0.1917 | 0.095 | 1,485 | 11.90 | % | 0.0595 | 963 | |||||||||||||
| Other shares (without vote, redeemable, etc.) | — | — | — | — | — | — | ||||||||||||||
| Total remuneration paid | 0.1917 | 0.095 | 1,485 | 11.90 | % | 0.0595 | 963 | |||||||||||||
| Dividend paid out of profit | 0.1917 | 0.095 | 1,485 | 11.90 | % | 0.0595 | 963 | |||||||||||||
| Dividend paid with a charge to reserves or share premium | — | — | — | — | — | — | ||||||||||||||
| Dividend in kind | — | — | — | — | — | — | ||||||||||||||
| Flexible payment | — | — | — | — | — | — | ||||||||||||||
At the board of directors held on 22 March 2024, it was agreed to pay an interim dividend in cash against 2023 results of EUR 9.50 cents per share agreed by the board of directors on 19 February 2024, which became effective on 2 May 2024.
In addition, the general meeting of shareholders approved the implementation of a share repurchase program agreed by the board of directors for a maximum amount of 1,459 million euros, which began on 20 February 2024 and finalized on 21 June 2024.
In the general meeting of shareholders on 31 March 2023 it was approved the payment of a complementary dividend in cash charged to the results of the financial year 2022, agreed at the board of directors on 27 February 2023, of EUR 5.95 cents per share that was effective as of 2 May 2023. Likewise, the implementation of a share repurchase program charged to income for the year of 2022 agreed by this board of directors for a maximum amount of EUR 921 million, completed in April 2023, was also approved.
b) Earnings per share from continuing and discontinued operations
i. Basic earnings per share
Basic earnings per share for the period are calculated by dividing the net profit attributable to Grupo Santander for the first six months adjusted by the after-tax amount relating to the remuneration of contingently convertible preference shares recognised in equity by the weighted average number of ordinary shares outstanding during the period, excluding the average number of treasury shares held in the period.
Accordingly:
| 30-06-2024 | 30-06-2023 | |||||||
| Profit attributable to the Parent (EUR million) | 6,059 | 5,241 | ||||||
| Remuneration of contingently convertible preferred securities (CCPS) (EUR million) | (309) | (229) | ||||||
| 5,750 | 5,012 | |||||||
| Of which: | ||||||||
| Profit or Loss from discontinued operations (non controlling interest net) (EUR million) | — | — | ||||||
| Profit or Loss from continuing operations (CCPS net) (EUR million) | 5,750 | 5,012 | ||||||
| Weighted average number of shares outstanding | 15,664,707,190 | 16,279,041,269 | ||||||
| Basic earnings per share (euros) | 0.37 | 0.31 | ||||||
| Of which: from discontinued operations (euros) | — | — | ||||||
| from continuing operations (euros) | 0.37 | 0.31 | ||||||
| January - June 2024 | | 109 | ||||||
ii. Diluted earnings per share
Diluted earnings per share for the period are calculated by dividing the net profit attributable to Grupo Santander for the first six months adjusted by the after-tax amount relating to the remuneration of contingently convertible preference shares recognised in equity and of perpetual liabilities contingently amortisable in their case by the weighted average number of ordinary shares outstanding during the period, excluding the average number of treasury shares and adjusted for all the dilutive effects inherent to potential ordinary shares (share options, warrants and convertible debt instruments).
Accordingly, diluted earnings per share were determined as follows:
| 30-06-2024 | 30-06-2023 | |||||||
| Profit attributable to the Parent (EUR million) | 6,059 | 5,241 | ||||||
| Remuneration of contingently convertible preferred securities (CCPS) (EUR million) | (309) | (229) | ||||||
| 5,750 | 5,012 | |||||||
| Of which: | ||||||||
| Profit or Loss from discontinued operations (non controlling interest net) (EUR million) | — | — | ||||||
| Profit or Loss from continuing operations (CCPS net) (EUR million) | 5,750 | 5,012 | ||||||
| Weighted average number of shares outstanding | 15,664,707,190 | 16,279,041,269 | ||||||
| Dilutive effect of options/receipt of shares | 70,622,287 | 67,704,709 | ||||||
| Adjusted number of shares | 15,735,329,477 | 16,346,745,978 | ||||||
| Diluted earnings per share (euros) | 0.37 | 0.31 | ||||||
| Of which: from discontinued operations (euros) | — | — | ||||||
| from continuing operations (euros) | 0.37 | 0.31 | ||||||
4. Remuneration and other benefits paid to Banco Santander’s directors and senior managers
Note 5 to Grupo Santander’s consolidated annual accounts for the year ended 31 December 2023 details the remuneration and other benefits to members of Banco Santander’s Board of Directors and senior management in 2023.
Following is a summary of the most significant data on the remunerations and benefits for the six-month periods ended 30 June 2024 and 2023:
Remuneration of members of the board of directors (1)
| EUR thousand | ||||||||
| 30-06-2024 | 30-06-2023 | |||||||
| Members of the board of directors: (2) | ||||||||
| Remuneration concept | ||||||||
| Fixed salary remuneration of executive directors | 3,292 | 3,136 | ||||||
| Variable salary remuneration of executive directors | — | — | ||||||
| Directors' fees | 597 | 628 | ||||||
| Bylaw-stipulated emoluments (annual emolument) | 1,754 | 2,113 | ||||||
| Other | 2,173 | 2,083 | ||||||
| Sub-total | 7,816 | 7,960 | ||||||
| Transactions with shares and/or other financial instruments | — | — | ||||||
| 7,816 | 7,960 | |||||||
1.The Notes to the consolidated annual accounts for 2024 will contain detailed and complete information on the remuneration paid to all the directors, including executive directors.
2.From 1 October 2023, the Lead Independent Director, non-executive Vice Chair and Chair of remuneration committee is Mr. Glenn Hutchins, succeeding Mr. Carnegie-Brown. From 27 June 2024, Mr. Carlos Barrabés, in replacement of Mr. Ramiro Mato, and Mr. Antonio Francesco Weiss joined the board.
Mr. Bruce Carnegie-Brown stepped down as member of the board on 23 March 2024. Mr. Ramiro Mato stepped down as member of the board on 27 June 2024.
110 | | January - June 2024 | ||||||
Other benefits of members of the board of directors
| EUR thousand | ||||||||
| 30-06-2024 | 30-06-2023 | |||||||
| Members of the board of directors | ||||||||
| Other benefits | ||||||||
| Advances | — | — | ||||||
| Loans granted | 99 | 144 | ||||||
| Pension funds and plans: Endowments and/or contributions (1) | 1,197 | 1,055 | ||||||
| Pension funds and plans: Accumulated rights (2) | 73,481 | 66,792 | ||||||
| Life insurance premiums | 720 | 563 | ||||||
| Guarantees provided for directors | — | — | ||||||
1. These correspond to the endowments and/or contributions made during the first six months of 2024 and 2023 in respect of retirement pensions, widowhood, orphanhood and permanent disability.
2. Corresponds to the rights accrued by the directors in matters of pensions. Additionally, former members of the board had at 30 June 2024 and 30 June 2023 rights accrued for this concept for EUR 44,456 thousand and EUR 46,275 thousand, respectively.
Remuneration of senior management (1)(2)
The table below includes the corresponding amounts related to remunerations of senior management at 30 June 2024 and 2023, excluding the executive directors:
| EUR thousand | ||||||||
| 30-06-2024 | 30-06-2023 | |||||||
| Senior management (1) | ||||||||
| Total remuneration of senior management (2) | 13,423 | 12,761 | ||||||
1.Remunerations received during the first six months by members of the senior management who ceased in their functions by 30 June 2024, amounted to EUR 2,594 thousand (EUR 511 thousand by 30 June 2023).
2.The number of members of Banco Santander's senior management, excluding executive directors, is 13 as at 30 June 2024 (14 persons at 30 June 2023)
The variable annual remuneration (or bonuses) received for fiscal year 2023, both for directors and the rest of senior management, were included in the information on remuneration included in the annual report for that year. Similarly, the variable remuneration attributable to the 2024 results, which will be submitted for approval by the Board of Directors at the appropriate time, will be included in the financial statements for the current year.
Funds and pension plans of senior management
| EUR thousand | ||||||||
| 30-06-2024 | 30-06-2023 | |||||||
| Senior management (1) | ||||||||
| Pension funds: Endowments and / or contributions (2) | 2,376 | 2,550 | ||||||
| Pension funds: Accumulated rights (3) | 59,672 | 55,451 | ||||||
1.Contributions made during the first six months to members of the senior management who ceased in their functions by 30 June 2024, amounted to EUR 168 thousand (EUR 108 thousand by 30 June 2023).
2.Corresponds to the allocations and/or contributions made during the first six months of 2024 and 2023 as retirement pensions.
3.Corresponds to the rights accrued by members of senior management in the area of pensions. In addition, former members of senior management had at 30 June 2024 and 30 June 2023 rights accumulated for this same concept for EUR 83,485 thousand and EUR 90,401 thousand, respectively.
| January - June 2024 | | 111 | ||||||
5. Financial assets
a) Breakdown
The detail, by nature and category for measurement purposes, of Grupo Santander's financial assets, other than the balances relating to Cash, cash balances at central banks and other deposits on demand and Hedging derivatives, at 30 June 2024 and 31 December 2023 is as follows, presented by the nature and categories for valuation purposes:
| EUR million | |||||||||||||||||
| 30-06-2024 | |||||||||||||||||
| Financial assets held for trading | Non-trading financial assets mandatorily at fair value through profit or loss | Financial assets designated at fair value through profit or loss | Financial assets at fair value through other comprehensive income | Financial assets at amortised cost | |||||||||||||
| Derivatives | 58,928 | ||||||||||||||||
| Equity instruments | 16,764 | 4,432 | 1,842 | ||||||||||||||
| Debt instruments | 71,523 | 684 | 3,174 | 71,160 | 114,347 | ||||||||||||
| Loans and advances | 59,659 | 1,050 | 5,995 | 9,268 | 1,102,994 | ||||||||||||
| Central Banks | 17,283 | — | — | — | 16,541 | ||||||||||||
| Credit institutions | 22,477 | — | 444 | 335 | 56,290 | ||||||||||||
| Customers | 19,899 | 1,050 | 5,551 | 8,933 | 1,030,163 | ||||||||||||
| Total | 206,874 | 6,166 | 9,169 | 82,270 | 1,217,341 | ||||||||||||
| EUR million | |||||||||||||||||
| 31-12-2023 | |||||||||||||||||
| Financial assets held for trading | Non-trading financial assets mandatorily at fair value through profit or loss | Financial assets designated at fair value through profit or loss | Financial assets at fair value through other comprehensive income | Financial assets at amortised cost | |||||||||||||
| Derivatives | 56,328 | ||||||||||||||||
| Equity instruments | 15,057 | 4,068 | 1,761 | ||||||||||||||
| Debt instruments | 62,124 | 860 | 3,095 | 73,565 | 103,559 | ||||||||||||
| Loans and advances | 43,412 | 982 | 6,678 | 7,982 | 1,087,844 | ||||||||||||
| Central Banks | 17,717 | — | — | — | 20,082 | ||||||||||||
| Credit institutions | 14,061 | — | 459 | 313 | 57,917 | ||||||||||||
| Customers | 11,634 | 982 | 6,219 | 7,669 | 1,009,845 | ||||||||||||
| Total | 176,921 | 5,910 | 9,773 | 83,308 | 1,191,403 | ||||||||||||
112 | | January - June 2024 | ||||||
Following is the gross exposure of financial assets subject to impairment stages at 30 June 2024 and 31 December 2023:
| EUR million | ||||||||||||||||||||||||||
| 30-06-2024 | 31-12-2023 | |||||||||||||||||||||||||
| Gross amount | Gross amount | |||||||||||||||||||||||||
| Stage 1 | Stage 2 | Stage 3 | Total | Stage 1 | Stage 2 | Stage 3 | Total | |||||||||||||||||||
| Financial assets at fair value through other comprehensive income | 79,697 | 651 | 281 | 80,629 | 81,183 | 305 | 192 | 81,680 | ||||||||||||||||||
| Debt instruments | 71,163 | 13 | 6 | 71,182 | 73,570 | — | 6 | 73,576 | ||||||||||||||||||
| Loans and advances | 8,534 | 638 | 275 | 9,447 | 7,613 | 305 | 186 | 8,104 | ||||||||||||||||||
| Credit institutions | 335 | — | — | 335 | 313 | — | — | 313 | ||||||||||||||||||
| Customers | 8,199 | 638 | 275 | 9,112 | 7,300 | 305 | 186 | 7,791 | ||||||||||||||||||
| Financial assets at amortised cost | 1,116,202 | 89,495 | 33,785 | 1,239,482 | 1,102,968 | 76,552 | 34,090 | 1,213,610 | ||||||||||||||||||
| Debt instruments | 113,462 | 501 | 698 | 114,661 | 103,127 | 203 | 455 | 103,785 | ||||||||||||||||||
| Loans and advances | 1,002,740 | 88,994 | 33,087 | 1,124,821 | 999,841 | 76,349 | 33,635 | 1,109,825 | ||||||||||||||||||
| Central Banks | 16,541 | — | — | 16,541 | 20,082 | — | — | 20,082 | ||||||||||||||||||
| Credit institutions | 56,294 | — | — | 56,294 | 57,926 | — | — | 57,926 | ||||||||||||||||||
| Customers | 929,905 | 88,994 | 33,087 | 1,051,986 | 921,833 | 76,349 | 33,635 | 1,031,817 | ||||||||||||||||||
| Total | 1,195,899 | 90,146 | 34,066 | 1,320,111 | 1,184,151 | 76,857 | 34,282 | 1,295,290 | ||||||||||||||||||
On 30 June 2024, Grupo Santander has EUR 674 million (EUR 743 million on 31 December 2023) of exposure in impaired assets purchased with impairment, of which EUR 252 million still show signs of impairment, which mainly correspond to the business combinations carried out by Grupo Santander.
b) Impairment allowances of financial assets at amortised cost portfolio
The following is the movement that has taken place, during the six-month periods ended 30 June 2024 and 2023, in the balance of provisions that cover losses due to impairment of assets which comprise the heading balance of the financial assets at amortised cost:
| EUR million | ||||||||
| 30-06-2024 | 30-06-2023 | |||||||
| Balance as at beginning of period | 22,950 | 22,888 | ||||||
| Impairment losses charged to income for the period | 7,112 | 6,843 | ||||||
| Of which: | ||||||||
| Impairment losses charged to income | 13,186 | 11,225 | ||||||
| Impairment losses reversed with a credit to income | (6,074) | (4,382) | ||||||
| Perimeter change | — | (37) | ||||||
| Write-off of impaired balances against recorded impairment allowance | (6,439) | (6,831) | ||||||
| Exchange differences and other | (808) | 492 | ||||||
| Balance as at end of period | 22,815 | 23,355 | ||||||
| Of which, relating to: | ||||||||
| Impaired assets | 14,429 | 14,271 | ||||||
| Other assets | 8,386 | 9,084 | ||||||
| Of which: | ||||||||
| Individually calculated | 2,964 | 2,858 | ||||||
| Collectively calculated | 19,851 | 20,497 | ||||||
| January - June 2024 | | 113 | ||||||
Following is the movement of the loan loss provision broken down by impairment stage of loans and advances to customers recognised under 'Financial assets at amortised cost' as at 30 June 2024 and 30 June 2023:
| EUR million | ||||||||||||||
| 30-06-2024 | ||||||||||||||
| Stage 1 | Stage 2 | Stage 3 | Total | |||||||||||
| Impairment allowance as at beginning of period | 3,587 | 4,930 | 14,149 | 22,666 | ||||||||||
| Transfers between stages | (627) | 609 | 3,941 | 3,923 | ||||||||||
| Net changes of the exposure and modifications in the credit risk | 530 | (423) | 2,962 | 3,069 | ||||||||||
| Write-offs | — | — | (6,439) | (6,439) | ||||||||||
| Exchange differences and other | (186) | (78) | (509) | (773) | ||||||||||
| Carrying amount at end of period | 3,304 | 5,038 | 14,104 | 22,446 | ||||||||||
| EUR million | ||||||||||||||
| 30-06-2023 | ||||||||||||||
| Stage 1 | Stage 2 | Stage 3 | Total | |||||||||||
| Impairment allowance as at beginning of period | 3,611 | 5,124 | 13,931 | 22,666 | ||||||||||
| Transfers between stages | (454) | 355 | 3,767 | 3,668 | ||||||||||
| Variation due to credit risk | 605 | (377) | 2,891 | 3,119 | ||||||||||
| Write-offs | — | — | (6,801) | (6,801) | ||||||||||
| Exchange differences and other | 88 | 97 | 249 | 434 | ||||||||||
| Carrying amount at end of period | 3,850 | 5,199 | 14,037 | 23,086 | ||||||||||
Previously written-off assets recovered during the first six months of 2024 and 2023 amount to EUR 803 million and to EUR 864 million, respectively. In addition, during the first six months of 2024 EUR 260 million (EUR 264 million during the first six months of 2023) were recognized for losses in the income statement due to renegotiation or contractual modifications mainly due to the CHF mortgage portfolio in Poland. Considering these amounts, the recorded impairment of financial assets at amortised cost is EUR 6,569 million and EUR 6,243 million during the first six months of 2024 and 2023, respectively.
c) Impaired assets of financial assets at amortised cost portfolio
The movement during the six-month periods ended 30 June 2024 and 2023, in the balance of financial assets classified at amortised cost and considered impaired by reason for the credit risk is as follows:
| EUR million | ||||||||
| 30-06-2024 | 30-06-2023 | |||||||
| Balance as at beginning of period | 34,363 | 33,269 | ||||||
| Net additions | 6,747 | 6,480 | ||||||
| Written-off assets | (6,439) | (6,831) | ||||||
| Perimeter Changes | 13 | (45) | ||||||
| Exchange differences and other | (647) | 773 | ||||||
| Balance at end of period | 34,037 | 33,646 | ||||||
This amount, after deducting the related allowances, represents Grupo Santander's best estimate of the discounted value of the flows that are expected to be recovered from the impaired assets.
114 | | January - June 2024 | ||||||
d) Collaterals received
Following is the breakdown of the value of the collaterals received to ensure the collection of the financial assets that comprise the heading of financial assets at amortized cost, distinguishing between real collaterals and other collaterals at 30 June 2024 and 31 December 2023:
| EUR million | ||||||||
| 30-06-2024 | 31-12-2023 | |||||||
| Real collaterals value | 639,735 | 630,939 | ||||||
| Of which: Impaired | 12,920 | 12,894 | ||||||
| Other collaterals value | 94,442 | 96,164 | ||||||
| Of which: Impaired | 1,917 | 2,131 | ||||||
| Total value of the collaterals received | 734,177 | 727,103 | ||||||
e) Fair value of financial assets not measured at fair value
Following is a comparison of the carrying amounts of Grupo Santander’s financial assets measured at other than fair value and their respective fair values at 30 June 2024 and 31 December 2023:
| EUR million | ||||||||||||||
| 30-06-2024 | 31-12-2023 | |||||||||||||
| Carrying amount | Fair value | Carrying amount | Fair value | |||||||||||
| Loans and advances | 1,102,994 | 1,091,255 | 1,087,844 | 1,077,543 | ||||||||||
| Debt instruments | 114,347 | 112,141 | 103,559 | 102,888 | ||||||||||
| ASSETS | 1,217,341 | 1,203,396 | 1,191,403 | 1,180,431 | ||||||||||
The main valuation methods and inputs used in the estimation of the fair value of the financial assets of the previous table are detailed in Note 51.c of the consolidated annual accounts for the year 2023.
6. Non-current assets held for sale
The detail, by nature, of Grupo Santander’s non-current assets held for sale at 30 June 2024 and 31 December 2023 is as follows presented by nature:
| EUR million | ||||||||
| 30-06-2024 | 31-12-2023 | |||||||
| Tangible assets | 2,892 | 2,991 | ||||||
| Of which: | ||||||||
| Foreclosed assets | 2,668 | 2,773 | ||||||
| Of which: Property assets in Spain | 2,037 | 2,138 | ||||||
| Other tangible assets held for sale | 224 | 218 | ||||||
| Other assets | 23 | 23 | ||||||
| 2,915 | 3,014 | |||||||
The balance of the provisions at 30 June 2024 is EUR 2,784 million (EUR 2,956 million at 31 December 2023). The charges recorded in the first six months of 2024 and 2023 amounted to EUR 80 million and EUR 63 million, respectively, and the recoveries undergone during those periods amount to EUR 25 million and EUR 16 million, respectively.
| January - June 2024 | | 115 | ||||||
7. Tangible assets
a) Changes in the period
In the first six months of 2024 and 2023, tangible assets (rights of use are not included) were acquired for EUR 4,738 million and EUR 4,705 million, respectively.
Likewise, in the first six months of 2024 and 2023 tangible asset items were disposed of with a carrying amount of EUR 2,979 million and EUR 2,713 million, generating a net profit of EUR 12 million and EUR 24 million, respectively.
b) Property, plant and equipment purchase commitments
At 30 June 2024 and 2023, Grupo Santander did not have any significant commitments to purchase property, plant and equipment items.
c) Leasing rights
As of 30 June 2024, Grupo Santander has tangible assets under lease for the amount of EUR 1,999 million (EUR 2,182 million at 31 December 2023).
8. Intangible assets
The detail of Intangible Assets - Goodwill at 30 June 2024 and 31 December 2023, based on the cash-generating units giving rise thereto, is as follows:
| EUR million | ||||||||
| 30-06-2024 | 31-12-2023 | |||||||
| Banco Santander (Brazil) | 3,321 | 3,679 | ||||||
| SAM Investment Holdings Limited | 1,444 | 1,444 | ||||||
| Santander Consumer Germany | 1,304 | 1,304 | ||||||
| Santander Bank Polska | 1,169 | 1,159 | ||||||
| Santander Portugal | 1,040 | 1,040 | ||||||
| Santander US Auto | 1,035 | 1,003 | ||||||
| Santander España | 998 | 998 | ||||||
| Santander Holding USA (ex. Auto) | 839 | 814 | ||||||
| Santander UK | 627 | 612 | ||||||
| Grupo Financiero Santander (Mexico) | 500 | 523 | ||||||
| Banco Santander - Chile | 492 | 516 | ||||||
| Ebury Partners | 333 | 350 | ||||||
| Santander Consumer Nordics | 216 | 206 | ||||||
| Other entities | 350 | 369 | ||||||
| Total Goodwill | 13,668 | 14,017 | ||||||
During the first six months of 2024 there has been a decrease in goodwill of EUR 349 million mainly due to exchange differences (see Note 11), which in accordance with current regulations, have been recorded with a credit to the heading Other comprehensive income - Items that can be reclassified in results- Foreign currency translation of equity through the Statement of recognized income and expenses.
Note 17 of the consolidated annual accounts for the year ended 31 December 2023 includes detailed information on the procedures followed by Grupo Santander to analyse the potential impairment of the goodwill recognised with the respect to its recoverable amount and to recognise the related impairment losses, where appropriate.
In accordance with IAS 36, a Cash Generating Unit (CGU) to which goodwill has been assigned should be subjected to an annual impairment test, and when there are signs of impairment.
In accordance with all mentioned before and the analysis made of the information available on the evolution of the different cash-generating units that could reveal the existence of indications of impairment, the directors of the Grupo Santander have concluded that during the first six months of 2024 , there were no triggers that required the recording of impairments.
116 | | January - June 2024 | ||||||
9. Financial liabilities
a) Breakdown
The following is a breakdown of Grupo Santander's financial liabilities, other than the balances corresponding to the Derivatives - hedge accounting heading, as of 30 June 2024 and 31 December 2023, presented by nature and categories for valuation purposes:
| EUR million | ||||||||||||||||||||
| 30-06-2024 | 31-12-2023 | |||||||||||||||||||
| Financial liabilities held for trading | Financial liabilities designated at fair value through profit or loss | Financial liabilities at amortised cost | Financial liabilities held for trading | Financial liabilities designated at fair value through profit or loss | Financial liabilities at amortised cost | |||||||||||||||
| Derivatives | 52,261 | 50,589 | ||||||||||||||||||
| Short Positions | 29,653 | 26,174 | ||||||||||||||||||
| Deposits | 51,942 | 27,751 | 1,106,860 | 45,507 | 34,996 | 1,125,308 | ||||||||||||||
| Central banks | 11,057 | 1,605 | 34,097 | 7,808 | 1,209 | 48,782 | ||||||||||||||
| Credit institutions | 17,156 | 1,337 | 83,655 | 17,862 | 1,735 | 81,246 | ||||||||||||||
| Customer | 23,729 | 24,809 | 989,108 | 19,837 | 32,052 | 995,280 | ||||||||||||||
| Debt instruments | — | 6,726 | 305,136 | — | 5,371 | 303,208 | ||||||||||||||
| Other financial liabilities | — | 16 | 42,900 | — | — | 40,187 | ||||||||||||||
| Total | 133,856 | 34,493 | 1,454,896 | 122,270 | 40,367 | 1,468,703 | ||||||||||||||
b) Information on issuances, repurchases or redemptions of debt instruments issued
The detail of the balance of debt instruments issued according to their nature is:
| EUR million | ||||||||
| 30-06-2024 | 31-12-2023 | |||||||
| Bonds and debentures outstanding | 239,696 | 231,880 | ||||||
| Subordinated | 32,111 | 30,529 | ||||||
| Promissory notes and other securities | 40,055 | 46,170 | ||||||
| Total debt instruments issued | 311,862 | 308,579 | ||||||
The detail, at 30 June 2024 and 2023, of the outstanding balance of the debt instruments, excluding promissory notes, which at these dates had been issued by Banco Santander or any other Group entity is disclosed below. Also included is the detail of the changes in this balance in the first six months of 2024 and 2023:
| EUR million | ||||||||||||||||||||
| 30-06-2024 | ||||||||||||||||||||
| Opening balance at 01-01-24 | Perimeter | Issuances or placements | Repurchases or redemptions | Exchange rate and other adjustments | Closing balance at 30-06-24 | |||||||||||||||
| Bonds and debentures outstanding | 231,880 | (1,224) | 41,185 | (32,172) | 27 | 239,696 | ||||||||||||||
| Subordinated | 30,529 | — | 3,908 | (2,422) | 96 | 32,111 | ||||||||||||||
| Bonds and debentures outstanding and subordinated liabilities issued | 262,409 | (1,224) | 45,093 | (34,594) | 123 | 271,807 | ||||||||||||||
| EUR million | ||||||||||||||||||||
| 30-06-2023 | ||||||||||||||||||||
| Opening balance at 01-01-23 | Perimeter | Issuances or placements | Repurchases or redemptions | Exchange rate and other adjustments | Closing balance at 30-06-23 | |||||||||||||||
| Bonds and debentures outstanding | 211,597 | (1,467) | 34,438 | (28,534) | 1,701 | 217,735 | ||||||||||||||
| Subordinated | 25,717 | — | 1,500 | (36) | (317) | 26,864 | ||||||||||||||
| Bonds and debentures outstanding and subordinated liabilities issued | 237,314 | (1,467) | 35,938 | (28,570) | 1,384 | 244,599 | ||||||||||||||
| January - June 2024 | | 117 | ||||||
On 20 May 2024, Banco Santander, S.A., proceeded to partially redeem in advance the contingently convertible preferred shares with ISIN code XS1793250041, for a total nominal amount of 1,312.4 million euros and which are traded on the market of the Irish Stock Exchange “Global Exchange Market” (the 'PPCC'), leaving the amount in circulation at 187.6 million euros.
On 20 May 2024, Banco Santander, S.A. carried out a placement of preference shares contingently convertible into newly issued ordinary shares of the Bank (PPCC), for a nominal amount of 1,500 million euros. The Issuance has been made at par and the remuneration of the PPCC, whose payment is subject to certain conditions and is also discretionary, has been set at 7% annually for the first six years, being reviewed every five years thereafter by applying a margin of 443.2 basis points over the five-year mid-swap rate.
On 14 March 2024, Banco Santander, S.A. issued subordinated obligations for an amount of 1,250 million dollars (valued at 1,158 million euros) for a term of 10 years. The issuance was made at par and the issue coupon was set at 6.35% per year, payable bi-annually.
On 8 February 2024, Banco Santander, S.A., proceeded to prepay all of the contingently convertible Tier 1 preferred shares with ISIN code XS1951093894, for a total nominal amount of 1,200 million dollars (valued at 1,110 million euros). and that were traded on the Irish Stock Exchange “Global Exchange Market” (the 'PPCC').
On 22 January 2024, Banco Santander, S.A. issued subordinated bonds for an amount of 1,250 million euros for a term of 10 years and 3 months. The issue was carried out at 99.739% and the issue coupon was set at 5.00% per year for the first 5 years and 3 months, with an amortization option in April 2029, reviewing the coupon, in case of non-amortization, at a fixed rate equivalent to a margin of 250 points plus the 5-year Euro swap rate.
On 23 May 2023, Banco Santander, S.A. carried out an issue of subordinated bonds for an amount of EUR 1,500 million at a term of 10 years and 3 months. The issue coupon was fixed at 5.75% per year for the first 5 years and 3 months, with an option to redeem in August 2028, revising the coupon, in the event of non-amortization, even a margin of 285 points more the 5-year Euro Swap rate.
c) Other issuances guaranteed by Grupo Santander
At 30 June 2024 and 2023, there were no debt instruments issued by associates or non-Group third parties (unrelated) that had been guaranteed by Banco Santander or any other Group entity.
d) Fair value of financial liabilities not measured at fair value
Following is a comparison between the value by which Grupo Santander’s financial liabilities are recorded that are measured using criteria other than fair value and their corresponding fair value at 30 June 2024 and 31 December 2023:
| EUR million | ||||||||||||||
| 30-06-2024 | 31-12-2023 | |||||||||||||
| Carrying amount | Fair value | Carrying amount | Fair value | |||||||||||
| Deposits | 1,106,860 | 1,105,646 | 1,125,308 | 1,124,373 | ||||||||||
| Debt instruments | 305,136 | 301,813 | 303,208 | 298,792 | ||||||||||
| Liabilities | 1,411,996 | 1,407,459 | 1,428,516 | 1,423,165 | ||||||||||
Additionally, other financial liabilities are accounted for EUR 42,900 million and EUR 40,187 million as of 30 June 2024 and 31 December 2023, respectively.
The main valuation methods and inputs used in the estimation of the fair value of the financial liabilities in the previous table are detailed in Note 51.c of the consolidated annual accounts for 2023, other than those mentioned in these interim financial statements.
118 | | January - June 2024 | ||||||
10. Provisions
a) Provisions for Pensions and other post-retirements obligations and Other long term employee benefits
The variation experienced by the balance of the Pensions and other post-retirements obligations and other long-term employee benefits from 31 December 2023 to 30 June 2024, is mainly due to benefit and premium payments or contributions (see Note 11.d).
b) Provisions for taxes and other legal contingencies and Other provisions
Set forth below is the detail, by type of provision, of the balances at 30 June 2024 and at 31 December 2023 of Provisions for taxes and other legal contingencies and Other provisions. The types of provision were determined by grouping together items of a similar nature:
| EUR million | ||||||||
| 30-06-2024 | 31-12-2023 | |||||||
| Provisions for taxes | 714 | 745 | ||||||
| Provisions for employment-related proceedings (Brazil) | 612 | 611 | ||||||
| Provisions for other legal proceedings | 1,305 | 1,359 | ||||||
| Provision for customer remediation | 535 | 454 | ||||||
| Provision for restructuring | 663 | 596 | ||||||
| Other | 1,044 | 869 | ||||||
| 4,873 | 4,634 | |||||||
Relevant information is set forth below in relation to each type of provision shown in the preceding table:
The provisions for taxes include provisions for tax-related proceedings.
The provisions for employment-related proceedings (Brazil) relate to claims filed by trade unions, associations, the prosecutor’s office and ex-employees claiming employment rights to which, in their view, they are entitled, particularly the payment of overtime and other employment rights, including litigation concerning retirement benefits. The number and nature of these proceedings, which are common for banks in Brazil, justify the classification of these provisions in a separate category or as a separate type from the rest. The Group calculates the provisions associated with these claims in accordance with past experience of payments made in relation to claims for similar items. When claims do not fall within these categories, a case-by-case assessment is performed and the amount of the provision is calculated in accordance with the status of each proceeding and the risk assessment carried out by the legal advisers.
The provisions for other legal proceedings include provisions for court, arbitration or administrative proceedings (other than those included in other categories or types of provisions disclosed separately) brought against Grupo Santander companies.
The provisions for customer remediation include mainly the estimated cost of payments to remedy errors relating to the sale of certain products in the UK, as well as the estimated amount related to the floor clauses of Banco Popular Español, S.A.U. To calculate the provision for customer remediation, the best estimate of the provision made by management is used, which is based on the estimated number of claims to be received and, of these, the number that will be accepted, as well as the estimated average payment per case.
The provisions for restructuring include only the costs arising from restructuring processes carried out by the various Group companies.
Lastly, the Other heading contains very atomized and individually insignificant provisions, such as the provisions to cover the operational risk of the different offices of the Group.
Qualitative information on the main litigation is provided in Note 10.c.
The Group's general policy is to record provisions for tax and legal proceedings in which the Group assesses the chances of loss to be probable and the Group does not record provisions when the chances of loss are possible or remote. Grupo Santander determines the amounts to be provided for as its best estimate of the expenditure required to settle the corresponding claim based, among other factors, on a case-by-case analysis of the facts and the legal opinion of internal and external counsel or by considering the historical average amount of the loss incurred in claims of the same nature. The definitive date of the outflow of resources embodying economic benefits for the Group depends on each obligation. In certain cases, the obligations do not have a fixed settlement term and, in others, they depend on legal proceedings in progress.
With respect to changes in provisions in the first six months of 2024, for employment and other legal proceedings, in Brazil, provisions of EUR 267 million and EUR 140 million were recorded, making payments of EUR 202 million and EUR 100 million, respectively.
| January - June 2024 | | 119 | ||||||
c) Litigation and other matters
i. Tax-related litigation
At 30 June 2024 the main tax-related proceedings concerning the Group were as follows:
•Legal actions filed by Banco Santander (Brasil) S.A. and other Group entities to avoid the application of Law 9.718/98, which modifies the basis to calculate Programa de Integraçao Social (PIS) and Contribuição para Financiamento da Seguridade Social (COFINS), extending it to all the entities income, and not only to the income from the provision of services. In relation of Banco Santander (Brasil) S.A. process, in 2015 the Federal Supreme Court (FSC) admitted the extraordinary appeal filed by the Federal Union regarding PIS, and dismissed the extraordinary appeal lodged by the Brazilian Public Prosecutor's Office regarding COFINS contribution, confirming the decision of Federal Regional Court favourable to Banco Santander (Brasil) S.A. of August 2007. The Federal Supreme Court also admitted the appeals related to the other Group entities both for PIS and COFINS. On June 13, 2023, the Federal Supreme Court ruled unfavorably two cases through General Repercussion (Theme 372), including Banco Santander (Brasil) S.A. case. The Bank has filed a new appeal, considering the possible loss as a contingent liability. The cases of the other Group entities are no longer susceptible of appeal and a provision has been recognized for the amount of the estimated loss.
•Banco Santander (Brasil) S.A. and other Group companies in Brazil have appealed against the assessments issued by the Brazilian tax authorities questioning the deduction of loan losses in their income tax returns (Imposto sobre a Renda das Pessoas Jurídicas - IRPJ - and Contribuçao Social sobre o Lucro Liquido -CSLL-) in relation to different administrative processes of various years on the ground that the requirements under the applicable legislation were not met. The appeals, which involves several cases, are pending decision in different administrative and judicial instances. No provision was recognised in connection with the amount considered to be a contingent liability.
•Banco Santander (Brasil) S.A. and other Group companies in Brazil are involved in administrative and legal proceedings against several municipalities that demand payment of the Service Tax on certain items of income from transactions not classified as provisions of services. There are several cases in different judicial instances. A provision was recognised in connection with the amount of the estimated loss.
•Banco Santander (Brasil) S.A. and other Group companies in Brazil are involved in administrative and legal proceedings against the tax authorities in connection with the taxation for social security purposes of certain items which are not considered to be employee remuneration. There are several cases in different judicial instances. A provision was recognised in connection with the amount of the estimated loss.
•In May 2003 the Brazilian tax authorities issued separate infringement notices against Santander Distribuidora de Títulos e Valores Mobiliarios, Ltda. (DTVM, actually Santander Brasil Tecnología S.A.) and Banco Santander (Brasil) S.A. in relation to the Provisional Tax on Financial Movements (Contribuição Provisória sobre Movimentação Financeira) of the years 2000 to 2002. The administrative discussion ended unfavourably for both companies, and on July 3, 2015, filed a lawsuit requesting the cancellation of both tax assessments. The lawsuit was judged unfavourably in first instance. Therefore, both plaintiffs appealed to the court of second instance. On December 2020, the appeal was decided unfavourably. Against the judgment, the bank filed a motion for clarification which has not been accepted. Currently it is appealed to higher courts. There is a provision recognized for the estimated loss.
•In December 2010 the Brazilian tax authorities issued an infringement notice against Santander Seguros S.A. (Brasil), (currently Zurich Santander Brasil Seguros e Previdência S.A.), as the successor by merger to ABN AMRO Brasil dois Participações S.A., in relation to income tax (IRPJ and CSLL) for 2005, questioning the tax treatment applied to a sale of shares of Real Seguros, S.A. The administrative discussion ended unfavourably, and the CARF decision has been appealed at the Federal Justice. As the former parent of Santander Seguros S.A. (Brasil) (currently Zurich Santander Brasil Seguros e Previdência S.A.), Banco Santander (Brasil) S.A. is liable in the event of any adverse outcome of this proceeding. No provision was recognised in connection with this proceeding as it is considered to be a contingent liability.
•In November 2014 the Brazilian tax authorities issued an infringement notice against Banco Santander (Brasil) S.A. in relation to corporate income tax (IRPJ and CSLL) for 2009 questioning the tax-deductibility of the amortisation of the goodwill of Banco ABN AMRO Real S.A. performed prior to the absorption of this bank by Banco Santander (Brasil) S.A., but accepting the amortisation performed after the merger. The Bank appealed before the Higher Chamber of CARF, and a final favourable decision was obtained in April 2024. No provision was recognised in connection with this proceeding as it was considered to be a contingent liability.
•Banco Santander (Brasil) S.A. has also appealed against infringement notices issued by the tax authorities questioning the tax deductibility of the amortisation of the goodwill arising on the acquisition of Banco Comercial e de Investimento Sudameris S.A from years 2007 to 2012. In May 2024, the appeal related to period 2009 to 2012 was rejected by the CARF and the resolution was appealed at the Federal Justice. No provision was recognised in connection with this matter as it was considered to be a contingent liability.
•Banco Santander (Brasil) S.A. and other companies of the Group in Brazil are undergoing administrative and judicial procedures against Brazilian tax authorities for not admitting tax compensation with credits derived from other tax concepts, not having registered a provision for the amount considered to be a contingent liability.
•Banco Santander (Brasil) S.A. is involved in appeals in relation to infringement notices initiated by tax authorities regarding the offsetting of tax losses in the CSLL of year 2009 and 2019. The appeals are pending decision at the administrative level. No provision was recognised in connection with this matter as it is considered to be a contingent liability.
120 | | January - June 2024 | ||||||
•Banco Santander (Brasil) S.A. filed a suspensive judicial measure aiming to avoid the withholding income tax (Imposto sobre a Renda Retido na Fonte - IRRF), on payments derived from technology services provided by Group foreign entities. A favorable decision was handed down and an appeal was filed by the tax authority at the Federal Regional Court, where it awaits judgment. No provision was recognized as it is considered to be a contingent liability.
•Brazilian tax authorities have issued infringement notices against Getnet Adquirência e Serviços para Meios de Pagamento S.A and Banco Santander (Brasil) S.A. as jointly liable in relation to corporate income tax (IRPJ and CSLL) for 2014 to 2018 questioning the tax-deductibility of the amortization of the goodwill from the acquisition of Getnet Tecnologia Proces S.A., considering that the company would not have complied with the legal requirements for such amortization. The tax assessment notices were appealed to the CARF. In March 2024, the CARF issued a favourable partial decision on the infraction notice of 2014/2015. No provision was recognized as it is considered to be a contingent liability.
The total amount for the aforementioned Brazil lawsuits that are fully provisioned is EUR 759 million, and for lawsuits that qualify as contingent liabilities is EUR 4,815 million.
•Banco Santander appealed before European Courts the Decisions 2011/5/CE of 28 October 2009 (First Decision), andc2011/282/UE of 12 January 2011 (Second Decision) of the European Commission, ruling that the deduction of the financial goodwill regulated pursuant to Article 12.5 of the Corporate Income Tax Law constituted illegal State aid. On October 2021 the Court of Justice definitively confirmed these Decisions. The dismissal of the appeal, that only affects these two decisions, had no impact on results.
At the date of approval of these interim financial statements, there are other less significant tax disputes.
ii. Non-tax-related proceedings
At 30 June 2024the main non-tax-related proceedings concerning the Group were as follows:
•Payment Protection Insurance (PPI): AXA France IARD and AXA France Vie (former GE Capital Corporation Group entities (GE Capital), known as Financial Insurance Company Ltd (FICL) and Financial Assurance Company Ltd (FACL), acquired by AXA SA in 2015) (together, AXA France) have brought a claim for GBP 552 million (EUR 651.3 million)(plus interest) against (i) Santander Cards UK Limited (former GE Capital entity known as GE Capital Bank Limited (GECB), which was acquired by Banco Santander, S.A. in 2008 and subsequently transferred to Santander UK plc); and (ii) Santander Insurance Services UK Limited (a Banco Santander, S.A. subsidiary) (together the Santander Entities). The claim relates to the allocation of liability for compensation and associated costs in respect of a large number of PPI policies distributed by GECB pre-2005, which were underwritten by FICL and FACL. AXA France reduced their claim from GBP 670 million (plus interest) to GBP 552 million (EUR 651.3 million) (plus interest) in their Re-Re-Amended Particulars of Claim dated 29 June 2023. The Santander Entities strongly refute the claim. Trial has been fixed on 3 March 2025.
There are ongoing factual issues to be resolved which may have legal consequences including in relation to liability. These issues create uncertainties which mean that it is difficult to reliably predict the outcome or the timing of the definitive resolution of the matter. The provision recognized includes the best estimate of the Santander Entities’ liability to the specific portfolio.
•Motor Finance Broker Commissions: following the Financial Conduct Authority's (FCA) Motor Market review in 2019 which resulted in a change in rules in January 2021, Santander Consumer (UK) plc (SCUK) has received a number of county court claims and complaints in respect of its historical use of discretionary commission arrangements (DCAs) prior to the 2021 rule changes. In the context of the complaints made to the Financial Ombudsman Service (FOS) relating to such commission arrangements, the FCA announced on 11 January 2024 that it intends to use its powers under s166 of the Financial Services and Markets Act 2000 to review the historical use of DCAs between lenders and credit brokers (the “FCA Review”) and whether redress should be payable within all the industry. In line with the FCA's announcement, we have paused the response to customer complaints until at least 20 November 2024. A claim has been issued against SCUK, Santander UK plc and others in the Competition Appeal Tribunal (CAT), alleging that SCUK’s historical commission arrangements in respect of used car financing operated in breach of the Competition Act 1998. The CAT proceedings have been stayed until 25 November 2024 given the ongoing FCA Review. While it is possible that certain charges may be incurred in relation to the FCA's review or related existing or future county court claims, FOS complaints and the CAT proceedings, it is not considered that a legal or constructive obligation has been incurred in relation to these matters that would require a provision to be recognised at this stage. The resolution of such matters is not possible to predict with any certainty and there remain significant inherent uncertainties regarding the existence, scope and timing of any possible outflow which make it impracticable to disclose the extent of any potential financial impact.
•Delforca: dispute arising from equity swaps entered into by Gaesco (now Delforca 2008, S.A. (Delforca)) on shares of Inmobiliaria Colonial, S.A. Banco Santander, S.A. is claiming to Delforca before the Court of Barcelona in charge of the bankruptcy proceedings, a total of EUR 66 million from the liquidation resulting from the early termination of financial transactions due to Delforca's non-payment of the equity swaps. In the same bankruptcy proceedings, Delforca and Mobiliaria Monesa, S.A., parent of Delforca (Monesa) have in turn claimed the Bank to repay EUR 57 million, which the Bank received for the enforcement of the agreed guarantee, as a result of the aforementioned liquidation. On 16 September 2021 the Commercial Court Number 10 of Barcelona has ordered Delforca to pay the Bank EUR 66 million plus EUR 11 million in interest and has dismissed the claims filed by Delforca. This decision has been appealed by Delforca, Monesa and the bankruptcy administrator. On 1 June 2023, the appeal hearing took place and on 15 November 2023 the Provincial Court of Barcelona rendered a judgment dismissing the appeals filed by Delforca, Monesa and the bankruptcy administrator and confirming the first instance judgment. Delforca and Monesa (not the bankruptcy administrator) have filed an appeal in cassation before the Supreme Court against the judgment of the Provincial Court of Barcelona.
Separately, Monesa, filed in 2009 a civil procedure with the Courts of Santander against the Bank claiming damages that have not been specified to date. The procedure is suspended.
| January - June 2024 | | 121 | ||||||
•Former employees of Banco do Estado de São Paulo S.A., Santander Banespa, Cia. de Arrendamiento Mercantil: class action filed by AFABESP (an association of retirees and former Banespa employees) claiming payment of a semi-annual bonus provided for in the Bank's bylaws. The final decision rendered on the merits was unfavorable to Santander. However, a favorable decision was subsequently rendered stating that each beneficiary of the decision shall file an individual lawsuit to receive the due amount.
Since the judgments adopted different positions for each case, a procedure called Incident for the Resolution of Repetitive Demands (IRDR) was commenced before the Regional Labor Court (TRT) with the purpose of establishing objective criteria regarding the arguments brought by the Bank, mainly the statute of limitations and limitation of payments until December 2006 (Plan V). On 11 March 2024, the IRDR was admitted for future judgment, and it was determined that all cases filed in São Paulo - Capital remained suspended from its second instance (TRT).
Finally, due to the divergence between the interpretation of the Federal Constitution, an Action for Allegation of Non- Compliance with a Fundamental Precept (ADPF) was also filed, so that the Federal Supreme Court (STF) settles the issue and indicates the correct statute of limitations to be used in the individual cases filed.
On 27 June 2024, an agreement was signed with the indication of a nominal and exhaustive list of 7,299 retirees who, according to the criteria presented by the Bank, are entitled to payment of the amounts related to semi-annual bonuses. The total value of the agreement will be BRL 2.7 billion (EUR 454.3 million); though it will ultimately depend on the individual and voluntary adherence of each beneficiary until 31 July 2024, period that may be extended until 15 August 2024. After the end of the voluntary adherence period, payments will be made in five instalments for living retirees (first installment on 20 October 2024) and a single installment for the heirs of the deceased people (31 October 2024). Considering that it is not possible to estimate the number beneficiaries and the total volume of the obligations that will be involved in the agreement; and that recognition of the obligation is conditional upon the adherence of the beneficiaries within the fixed period, as of 30 June 2024, the recorded provision is based on the estimation of the risk associated to individual claims against the Bank, being subject to the mentioned circumstances the future evolution of the provision and the final cost of the agreement.
•Planos Económicos': like the rest of the banking system in Brazil, Santander Brazil has been the target of customer complaints and collective civil suits stemming mainly from legislative changes and its application to bank deposits (economic plans). At the end of 2017, an agreement between regulatory entities and the Brazilian Federation of Banks (Febraban) with the purpose of closing the lawsuits was reached and was approved by the Supremo Tribunal Federal. Discussions focused on specifying the amount to be paid to each affected client according to the balance in their notebook at the time of the Plan. Finally, the total value of the payments will depend on the number of adhesions there may be and the number of savers who have proved the existence of the account and its balance on the date the indexes were changed. In November 2018, the STF ordered the suspension of all economic plan proceedings for two years from May 2018. On 29 May 2020, the STF approved the extension of the agreement for 5 additional years starting from 3 June 2020. Condition for this extension was to include in the agreement actions related to the 'Collor I Plan'. On 30 June 2024, the provision recorded for the economic plan proceedings amounts to EUR 175.8 million.
•Floor clauses: as a consequence of the acquisition of Banco Popular Español, S.A.U. (Banco Popular), the Group has been exposed to a material number of transactions with floor clauses. The so-called floor clauses are those under which the borrower accepts a minimum interest rate to be paid to the lender, regardless of the applicable reference interest rate. Banco Popular included floor clauses in certain asset-side transactions with customers. In relation to this type of clauses, and after several rulings issued by the Court of Justice of the European Union (CJEU) and the Spanish Supreme Court, and the extrajudicial process established by the Spanish Royal Decree-Law 1/2017, of 20 January, Banco Popular made provisions that were updated in order to cover the effect of the potential return of the excess interest charged for the application of the floor clauses between the contract date of the corresponding mortgage loans and May 2013. On 30 June 2024, after having processed most of the customer requests, the potential residual loss associated with ongoing court proceedings is estimated at EUR 53.67 million, amount which is fully covered by provisions.
•Banco Popular´s acquisition: after the declaration of the resolution of Banco Popular, some investors filed claims against the EU’s Single Resolution Board decision, and the FROB's resolution executed in accordance with the aforementioned decision. Likewise, numerous appeals were filed against Banco Santander, S.A. alleging that the information provided by Banco Popular was erroneous and requesting from Banco Santander, S.A. the restitution of the price paid for the acquisition of the investment instruments or, where appropriate, the corresponding compensation.
In relation to these appeals, on the one hand, the General Court of the European Union (GCUE) selected 5 appeals from among all those filed before the European courts by various investors against the European institutions and processed them as pilot cases. On 1 June 2022, the GCUE rendered five judgements in which it completely dismissed the appeals, (i) supporting the legality of the resolution framework applied to Banco Popular, (ii) confirming the legality of the action of the European institutions in the resolution of Banco Popular and (iii) rejecting, in particular, all the allegations that there were irregularities in the sale process of Banco Popular to Banco Santander, S.A. Although four of these five judgments were initially appealed in cassation before the CJEU, in July 2023 one of the appellants withdrew his appeal. Therefore, only the appeals against three judgments are pending before the CJEU and in June 2024, the CJEU upheld the appeal in case C-551/22-P brought by the Commission. Appeals which are still pending in cassation refer to cases C-448/22-P, C-535/22-P and C-541/22-P.
122 | | January - June 2024 | ||||||
On the other hand, in relation to the lawsuits initiated by investors directly against Banco Santander, S.A. derived from the acquisition of Banco Popular, on 2 September 2020, the Provincial Court of La Coruña submitted a preliminary ruling to the CJEU in which it asked for the correct interpretation of the Article 60, section 2 of Directive 2014/59/EU of the European Parliament and of the Council of 15 May, establishing a framework for the restructuring and resolution of credit institutions and investment services companies. Said article establishes that, in the cases of redemption of capital instruments in a bank resolution, no liability will subsist in relation to the amount of the instrument that has been redeemed. On 5 May 2022, the CJEU rendered its judgement confirming that Directive 2014/59/EU of the European Parliament and of the Council does not allow that, after the total redemption of the shares of the share capital of a credit institution or an investment services company subject to a resolution procedure, the shareholders who have acquired shares within the framework of a public subscription offer issued by said company before the start of such a resolution procedure, exercise against that entity or against its successor, an action for liability for the information contained in the prospectus, under Directive 2003/71/EC of the European Parliament and of the Council, or an action for annulment of the subscription contract for those shares, which, taking into account its retroactive effects, gives rise to the restitution of the equivalent value of said shares, plus the interest accrued from the date of execution of said contract.
Regarding this judgment, several courts have referred additional preliminary rulings before the CJEU: (i) in December 2022 the Supreme Court requested three preliminary rulings in respect of its applicability to the holders of subordinated obligations, preferred stocks and subordinated bonds of Banco Popular; (ii) in April 2023, the First Instance Court 3 of Santa Coloma de Farners requested three preliminary rulings to the CJEU asking about pre-emptive subscription rights and the compatibility of the principles of proportionality and legal certainty with the bringing of legal actions by former holders of pre-emptive subscription rights and shares against the entity issuing the securities or against the entity succeeding it, which have been stayed by the CJEU until the preliminary rulings raised by the Supreme Court are resolved; and (iii) in November 2023, the Supreme Court requested another two preliminary rulings which supplement the ones requested in December 2022, regarding to a holder of subordinated bonds who filed a claim against Banco Popular before the resolution.
On 4 March 2024, in the context of preliminary proceedings 42/2017, the Central Court of Instruction No. 4 issued a ruling transforming the proceedings into Summary Proceedings and terminating the investigation phase. The ruling considers that the circumstantial evidence resulting from the investigation which could constitute a crime is basically the following: (i) an alleged misrepresentation in the prospectus of the 2016 capital increase of Banco Popular; (ii) an alleged misrepresentation in the annual accounts of Banco Popular for 2015, the interim financial statements for 2016 and the annual accounts for 2016; and (iii) the offer to the market of a distorted amount of regulatory capital, after the capital increase of 2016 (for allegedly having been granted by Banco Popular financing to clients for the subscription of shares in the aforementioned capital increase, without discounting it from the regulatory capital). According to the aforementioned ruling, these facts could constitute the crimes of fraud of investors (art. 282 of the Criminal Code) and accounting falsehood (art. 290 of the Criminal Code). All appeals filed against the ruling have been dismissed. On 11 July 2024 the parties were summoned to file their indictment briefs within a 40-day term.
During the course of the proceedings, on 30 April 2019, the Spanish National Court, ruled in favour of Banco Santander, S.A. declaring that Banco Santander, S.A. cannot inherit Banco Popular’s potential criminal liability. This ruling was appealed before the Supreme Court, which rejected it. In these proceedings, Banco Santander, S.A. could potentially be subsidiarily liable for the civil consequences. In view of the CJEU ruling of 5 May 2022, the Bank requested confirmation of the exclusion of its subsidiary civil liability status in this criminal proceeding. On 26 July 2022, the Court rejected this request stating that it is a matter to be determined at a later procedural time. This decision was confirmed on appeal by the Chamber of the National Court by judgment of 5 October 2022.
The estimated cost of any compensation to shareholders and bondholders of Banco Popular recognized in the 2017 accounts amounted to EUR 680 million, of which EUR 535 million were applied to the commercial loyalty program. The CJEU judgement of 5 May 2022 represented a very significant reduction in the risk associated with these claims.
•German shares investigation: the Cologne Public Prosecution Office is conducting an investigation against the Bank, and other group entities based in UK - Santander UK plc, Santander Financial Services Plc and Cater Allen International Limited -, in relation to a particular type of tax dividend linked transactions known as cum-ex transactions.
The Group is cooperating with the German authorities. According to the state of the investigations, the result and the effects for the Group, which may potentially include the imposition of material financial consequences (penalties and/or disgorgement of proceeds), cannot be anticipated. For this reason, the Bank has not recognized any provisions in relation to the potential imposition of financial penalties.
•Banco Santander, S.A. was sued in a legal proceeding in which the plaintiff alleges that the Bank breached his contract as CEO of the institution: in the lawsuit, the claimant mainly requested a declaratory ruling upholding the existence, validity and effectiveness of such contract and its enforcement together with the payment of certain amounts. For the case that the main request is not granted, the claimant sought a compensation for a total amount of approximately EUR 112 million or, an alternative relief for other minor amounts. Banco Santander, S.A. answered to the legal action stating that the conditions to which the appointment of that position was subject to were not met; that the executive services contract required by law was not concluded; and that in any case, the parties could terminate the contract without any justified cause.
| January - June 2024 | | 123 | ||||||
On 17 May 2021, the plaintiff reduced his claims for compensation to EUR 61.9 million. On 9 December 2021, the Court upheld the claim and ordered the Bank to compensate the claimant in the amount of EUR 67.8 million. By court order of 13 January 2022, the Court corrected and supplemented its judgment, reducing the total amount to be paid by the Bank to EUR 51.4 million and clarifying that part of this amount (buy out) was to be paid under the terms of the offer letter, i.e., entirely in Banco Santander shares, within the deferral period for this type of remuneration at the plaintiff's former employer and subject to the performance metrics or parameters of the plan in force at the Bank, which was that of 2018. As explained in note 5 of the report of the consolidated annual accounts of the year 2022, the degree of performance of these objectives was 33.3%.
The Bank filed an appeal against the judgment before the Madrid Court of Appeal, which was opposed by the plaintiff. At the same time, the plaintiff filed an application for provisional enforcement of the judgment in the First Instance Court. A court order was issued ordering enforcement of the judgment, and the Bank deposited in the court bank account the full amount provisionally awarded to the claimant, including interest, for an approximate sum of EUR. 35.5 million, within the voluntary compliance period.
On 6 February 2023, Banco Santander was notified with the judgment of 20 January 2023 by which the Madrid Court of Appeal partially upheld the appeal filed by the Bank. The judgment has reduced the amount to be paid by EUR 8 million, which, to the extent that this amount was already paid in the provisional partial enforcement of the judgement of first instance court, must be returned to the Bank together with other amounts for interest, which the appeal judgement also rejects. The plaintiff deposited circa EUR 9.6 million. This amount was received by the Bank on 11 July 2023.
On 11 April 2023, the Bank filed an extraordinary appeal for procedural infringement and an appeal in cassation against the Madrid Court of Appeal’s judgment before Spanish Supreme Court. Existing provisions cover the estimated risk of loss.
•Universalpay Entidad de Pago, S.L. (Upay): has filed a lawsuit against Banco Santander, S.A. for breach of the marketing alliance agreement (MAA) and claims payment (EUR 1,050 million). The MAA was originally entered into by Banco Popular and its purpose is the rendering of acquiring services (point of sale payment terminals) for businesses in the Spanish market. The lawsuit was mainly based on the potential breach of clause 6 of the MAA, which establishes certain obligations of exclusivity, non-competition and customer referral. On 16 December 2022, the Court ruled in favour of the Bank and dismissed the plaintiff's claim in its entirety. The decision has been appealed before the Provincial Court of Madrid and the Bank has filed its opposition to Upay's appeal.
Considering the decision at first instance and following the analysis carried out by the Bank's external lawyers, with the best information available to date, it is considered that no provision needs to be registered.
•CHF Polish Mortgage Loans: on 3 October 2019, the CJEU rendered its decision in relation to a judicial proceeding against an unrelated bank in Poland considering that certain contractual clauses in CHF-Indexed loan agreements were abusive. The CJEU left to Polish courts the decision on whether the whole contract can be maintained once the abusive terms have been removed, which should in turn decide whether the effects of the annulment of the contract are prejudicial to the consumer. In case of maintenance of the contract, the court may only integrate the contract with subsidiary provisions of national law and decide, in accordance with those provisions, on the applicable rate.
On 15 June 2023, the CJEU issued its judgment in Case C-520/21, in which it confirmed that it is national law that is relevant to determine the effect of cancellation of a contract - respecting the principles arising from Directive 93/13/EEC. According to the ruling of the CJEU in that case, the bank's claims in excess of the repayment of the nominal amount of the loan's principal and, as the case may be, the payment of default interest are contrary to the objectives of Directive 93/13/EEC if they were to lead to a profit analogous to the one it intended to make from the performance of the contract and thus eliminate the deterrent effect.
At the same time, the CJEU ruled that, under European law, there is no obstacle to the consumer being able to claim compensation from the bank beyond the return of the installments paid, but at the same time stipulated that such a claim should be evaluated in light of all the circumstances of the case, so that the consumer's possible benefits from the cancellation of the contract do not exceed what is necessary to restore the factual and legal situation in which he would have been without entering into the defective contract and do not constitute an excessive sanction for the entrepreneur (principle of proportionality).
On 25 April 2024, the Civil Chamber of the Supreme Court rendered a decision according to which: (i) in the event that a provision of an indexed or denominated loan agreement relating to the manner of determining the exchange rate of a foreign currency constitutes an abusive contractual term and is not binding, based on the current case law, it is not possible for this provision to be replaced by any other method of determining exchange rates under the law or prevailing practices; (ii) in the event that it is not possible to determine a foreign currency exchange rate binding for the parties in an indexed or denominated credit agreement, the agreement is not binding. Further, referring to the issues related to the cancellation of a credit agreement, the Supreme Court pointed out that: (i) if the bank has paid all or part of the credit amount to the borrower and the borrower has made repayments of the credit, independent claims for the repayment of the undue payment arise in favour of each party (the so-called two condition theory); (ii) the limitation period of the bank's claim for reimbursement of amounts paid under the credit begins from the day following the day on which the borrower challenged the bindingness of the terms of the agreement; (iii) there is no legal basis for either party to claim interest or other benefits for the use of its funds during the period between the undue payment and the date when the repayment became due. The criteria set out by the Supreme Court in its decision could clarify the previous decisions described above. Nine judges of the Supreme Court declined to participate in the resolution raising questions of a constitutional nature and six judges submitted dissenting opinions mainly on issues related to the maintenance of the agreement after the elimination of abusive clauses. The grounds of the above resolution are being awaited.
124 | | January - June 2024 | ||||||
Santander Bank Polska and Santander Consumer Bank Poland estimate legal risk using a model which considers different possible outcomes and regularly monitor court rulings on foreign currency loans to verify changes in case law practice, including the impact of the aforementioned Supreme Court resolution on this case law.
As of 30 June 2024, Santander Bank Polska S.A. and Santander Consumer Bank S.A. maintained a portfolio of loans affected by the legal risk connected with CHF mortgage for an approximate gross amount of PLN 5,739.4 million (EUR 1,332.2 million). As of 1 January 2022, in accordance with IFRS 9 and based on the new best available information, the accounting methodology was adapted so that the gross carrying amount of mortgage loans denominated and indexed in foreign currencies is reduced by the amount in which the estimated cash flows are not expected to cover the gross amount of loans, including as a result of legal controversies relating to these loans. In the absence of exposure or insufficient gross exposure, a provision according to IAS 37 is recorded.
As of the same date, the total value of adjustment to gross carrying amount in accordance with IFRS9 as well as provisions recorded under IAS37, amount to PLN 5,815.2 million (EUR 1,349.8 million) of which PLN 4,565.5 million (EUR 1,059.7 million) corresponds to adjustment to gross carrying amount under IFRS 9 and PLN 1,249.8 million (EUR 290.1 million) to provisions recognized in accordance with IAS 37. The adjustment to gross carrying amount in accordance with IFRS9 in the first 6 months of 2024 amounted to PLN 794.4 million (EUR 184 million), the additional provisions under IAS 37 amounted to PLN 511.8 million (EUR 118.6 million). Other costs related to the dispute amounted to PLN 239.3 million (EUR 55.4 million). These provisions represent the best estimate as at 30 June 2024. Santander Bank Polska and Santander Consumer Bank Poland will continue to monitor and assess appropriateness of those provisions.
In December 2020, the KNF presented a proposal for voluntary settlements between banks and borrowers under which CHF loans would be retrospectively settled as PLN loans bearing an interest rate based on WIBOR plus margin. The KNF continues to support the concept of offering such settlements by banks after the verdict of the CJEU on 15 June 2023. The Bank has prepared settlement proposals which consider both the key elements of conversion of home loans indexed to CHF, as proposed by the KNF Chairman, and the conditions defined internally by the Bank. The proposals are being presented to customers. This is reflected in the model which is currently used to calculate legal risk provisions.
•Banco Santander Mexico: dispute regarding a testamentary trust constituted in 1994 by Mr. Roberto Garza Sada in Banca Serfin (currently Santander Mexico) in favor of his four sons in which he affected shares of Alfa, S.A.B. de C.V. (respectively, Alfa and the Trust). During 1999, Mr. Roberto Garza Sada instructed Santander México in its capacity as trustee to transfer 36,700,000 shares from the Trust's assets to his sons and daughters and himself. These instructions were ratified in 2004 by Mr. Roberto Garza Sada before a Notary Public.
Mr. Roberto Garza Sada passed away on 14 August 2010 and subsequently, in 2012, his daughters filed a complaint against Santander Mexico alleging it had been negligent in its trustee role. The lawsuit was dismissed at first instance in April 2017 and on appeal in 2018. In May 2018, the plaintiffs filed an appeal (recurso de amparo) before the First Collegiate Court of the Fourth Circuit based in Nuevo León, which ruled in favor of the plaintiffs on 7 May 2021, annulling the 2018 appeal judgment and condemning Santander Mexico to the petitions claimed, consisting of the recovery of the amount of 36,700,000 Alfa shares, together with dividends, interest and damages.
Santander Mexico has filed various constitutional reviews and appeals against the recurso de amparo referred to above, which have been dismissed by the Supreme Court of Justice of the Nation. As of this date, an amparo review filed by the Bank is pending to be resolved in the Collegiate Courts in the State of Nuevo León, thus the judgment is not final.
On 29 June 2022, Santander México, within the framework of the amparo review filed by the Bank, requested the First Collegiate Court in Civil Matters of the Fourth Circuit of Nuevo León the recusal of two of the three Magistrates who rendered against Santander Mexico, which was resolved in favour of Santander Mexico. Plaintiffs requested the recusal of the third Magistrate who ruled with a dissenting vote against the recurso de amparo referred above and this was resolved in favour of Plaintiffs, and consequently the matter was referred to the Second Collegiate Court of the Fourth Circuit based in Nuevo León. The President of this Court considered that the Seventh Civil Chamber of the Superior Court of Justice of Nuevo León had fulfilled the Amparo granted to Mrs. Garza, therefore the Bank presented disconformity “inconformidad”, which was sent for resolution by the Second Collegiate Court of the Fourth Circuit based in Nuevo León. However, on 22 April 2024, the Bank asked the Supreme Court of Justice of the Nation to take up the matter. This has been accepted and consequently, the Supreme Court of Justice will resolve the matter.
Santander México believes that the actions taken should prevail and reverse the decision against it. The impact of a potential unfavorable resolution for Santander México will be determined in a subsequent proceeding and will also depend on the additional actions that Santander México may take in its defense, so it is not possible to determine it at this time. At the current stage of the proceedings, the provisions recorded are considered to be sufficient to cover the risks deriving from this claim.
| January - June 2024 | | 125 | ||||||
•URO Property Holdings, S.A. (before URO Property Holdings, SOCIMI SA): on 16 February 2022, legal proceedings were commenced in the Commercial Court of London against Uro Property Holdings, S.A. (Uro), a subsidiary of Banco Santander, S.A., by BNP Paribas Trust Corporation UK Limited (BNP) in its capacity as trustee on behalf of certain bondholders and beneficiaries of security rights. The litigation concerns certain terms of a financing granted to Uro which was supported by a bond issue in 2015. The claimant seeks a declaration by the Court and a monetary award against Uro, in connection with an additional premium above the nominal value of the financing repayment because of Uro having lost its status as SOCIMI (Sociedad Anónima Cotizada de Inversión Inmobiliaria), such loss causing the prepayment of the bond issue and, in the opinion of the claimant BNP, also the obligation to pay the additional premium by Uro. Uro denies being liable to pay that additional premium and filed its defense statement and a counterclaim against the claimant. The trial hearing has been scheduled for November and December 2024. Furthermore, Uro filed a summary judgement application for BNP's claim to be dismissed before trial. The dismissal of this application by the Commercial Court was confirmed by the Appeal Court. It is estimated that the maximum loss associated with this possible contingency, amounts to approximately EUR 250 million.
•Mortgage Expenses: In December 2015 the Spanish Supreme Court ruled that mortgage clauses relating to the payment of fees associated to formalizing the mortgage were abusive. On 27 November 2018, the Supreme Court agreed that the taxpayer of the documented legal acts stamp duty tax (IAJD) on the mortgage loans should be the borrower. On 9 November 2018, RDL 17/2018 came into force and modified the Law of the IAJD, establishing that the taxpayer is the Bank. On 23 January 2019, the Supreme Court ruled the distribution of the same must be 50% between the Bank and the borrower in public notary expenses and agency expenses. The Supreme Court also ruled that the Bank must pay 100% of the Registry. On 26 October 2020, the Supreme Court ruled that the Bank is fully responsible for the management expenses; and on 27 January 2021, the Supreme Court ruled that the Bank is also responsible for the valuation expenses.
In September 2020, the Barcelona Court of Appeal, rendered a decision stating that the commencement (dies a quo) for the statute of limitation starts running from the day the consumer fully paid mortgage expenses. The judgment has been appealed to the Supreme Court, which referred a preliminary matter to the ECJ for the establishment of the dies a quo from which the limitation period for the refund action starts running (C-561/21).
On 25 January 2024 the ECJ rendered a judgment (joint cases C‑810/21 and C‑813/21) stating that Directive 93/13 must be fixed on a case-by-case basis by national courts based on the moment when the consumer was aware of the unfair nature of the clause and the legal consequences of such unfair nature. Further, on 25 April 2024, two additional judgments were rendered (cases C-561/21 and C-484/21) in which the ECJ stated that the dies a quo of the statute of limitations for the annulment of the mortgage expenses shall be fixed on the moment when the consumer has an effective knowledge of the abusive nature of the clause and its effects and that this date must not be fixed (a) on the date of payment of such expense nor of the execution of the agreement; (b) when the Supreme Court has handed down judgments stating the abusive nature of a clause similar to the one included in the consumer contract; nor (c) when the ECJ has handed down judgments confirming that the statute of limitations for the annulment of contractual provisions is valid subject to its compliance with the principles of equivalence and effectiveness.
The Supreme Court has confirmed this criterion in its 14 June 2024 judgment, establishing that the public dissemination of case-law declaring the abusive nature of a clause does not necessarily give rise to the limitation period of the reimbursement action derived from similar clauses. However, the 4 July 2024 judgment, rendered in the case C-450/22, the ECJ has established that it cannot be excluded a priori that, as a consequence of the occurrence of an objective event or of a notorious event, such as the amendment of the applicable legislation or a widely disseminated and debated development of jurisprudence, the court considers that the average consumer's overall perception of the floor clause has changed during the reference period and has enabled him to become aware of the potentially significant economic consequences arising from such clause. A further preliminary question concerning the statute of limitations of the annulment of mortgage expenses has been raised before the ECJ by the First Instance Court No 8 of La Coruña.
In light of the foregoing, there are ongoing issues to be resolved which may have legal consequences. These issues create uncertainties which mean that it is difficult to reliably predict the outcome or the timing of the resolution of the matter. Therefore, the provision recognized includes the best estimate of Group’s liability to this matter.
Banco Santander, S.A. and the other Group companies are subject to claims and, therefore, are party to certain legal proceedings incidental to the normal course of their business including those in connection with lending activities, relationships with employees and other commercial or tax matters additional to those referred to here.
With the information available to it, the Group considers that, at 30 June 2024, it had reliably estimated the obligations associated with each proceeding and had recognized, where necessary, sufficient provisions to cover reasonably any liabilities that may arise as a result of these tax and legal risks. Those cases in which provisions have been registered but are not disclosed are justified on the basis that it would be prejudicial to the proper defense of the Group. Subject to the qualifications made, the Group believes that any liability arising from such claims and proceedings will not have, overall, a material adverse effect on the Group’s business, financial position, or results of operations.
126 | | January - June 2024 | ||||||
11. Equity
In the six-month periods ended 30 June 2024 and 2023 there were no quantitative or qualitative changes in Grupo Santander's equity other than those indicated in the condensed consolidated statements of changes in total equity.
a) Capital
Banco Santander's share capital at 30 June 2024 and 31 December 2023 consisted of EUR 7,747 million and EUR 8,092 million, respectively, represented by 15,494,273,572 and 16,184,146,059 shares of EUR 0.50 of nominal value each, respectively, and all of them of a unique class and series.
On 26 June 2024, there was a capital reduction amounting to EUR 165,652,500 through the redemption of 331,305,000 shares, corresponding to the share buyback program carried out between February and June 2024.
Likewise, on 30 January 2024, there was a capital reduction amounting to EUR 179,283,744 through the redemption of 358,567,487 shares, corresponding to the share buyback program for the year 2023 ended in January 2024.
The operations have not entailed the return of contributions to the shareholders as the Bank is the holder of the redeemed shares.
b) Share premium
Includes the amount paid by the bank's shareholders in capital issuances in excess of par value.
As a result of the capital reductions described in Note 11.a, during the first semester of 2024, the share premium has been reduced by EUR 2,424 million corresponding to the difference between the purchase value of the shares amortised (EUR 2,769 million) and the nominal value of said shares (EUR 345 million) (see Total Statement of Changes in Shareholders' Equity).
Likewise, and in accordance with applicable legislation, a reserve for amortized capital has been allocated with a charge to the share premium for an equal amount to the nominal value of said amortised shares (EUR 345 million).
| January - June 2024 | | 127 | ||||||
c) Breakdown of other comprehensive income - Items not reclassified to profit or loss and Items that may be reclassified to profit or loss
| EUR million | ||||||||
| 30-06-2024 | 31-12-2023 | |||||||
| Other comprehensive income accumulated | (36,963) | (35,020) | ||||||
| Items not reclassified to profit or loss | (5,118) | (5,212) | ||||||
| Actuarial gains or losses on defined benefit pension plans | (4,234) | (4,324) | ||||||
| Non-current assets held for sale | — | — | ||||||
| Share in other income and expenses recognised in investments, joint ventures and associates | (3) | 1 | ||||||
| Other valuation adjustments | — | — | ||||||
| Changes in the fair value of equity instruments measured at fair value with changes in other comprehensive income | (705) | (776) | ||||||
| Inefficacy of fair value hedges of equity instruments measured at fair value with changes in other comprehensive income | — | — | ||||||
| Changes in the fair value of equity instruments measured at fair value with changes in other comprehensive income (hedged item) | 268 | 264 | ||||||
| Changes in the fair value of equity instruments measured at fair value with changes in other comprehensive income (hedging instrument) | (268) | (264) | ||||||
| Changes in the fair value of financial liabilities measured at fair value through profit or loss attributable to changes in credit risk | (176) | (113) | ||||||
| Items that may be reclassified to profit or loss | (31,845) | (29,808) | ||||||
| Hedge of net investments in foreign operations (effective portion) | (8,583) | (8,684) | ||||||
| Exchange differences | (21,187) | (19,510) | ||||||
| Hedging derivatives (effective portion) | (966) | (740) | ||||||
| Changes in the fair value of debt instruments measured at fair value with changes in other comprehensive income | (733) | (555) | ||||||
| Hedging instruments (items not designated) | — | — | ||||||
| Non-current assets held for sale | — | — | ||||||
| Share in other income and expenses recognised in investments, joint ventures and associates | (376) | (319) | ||||||
d) Other comprehensive income - Items not reclassified to profit or loss - Actuarial gains or losses on defined benefit pension plans
The balance of the heading Other accumulated comprehensive income - Items not reclassified to profit or loss - Actuarial gains or losses on defined benefit pension plans, includes the actuarial gains or losses and the return on the assets assigned to the plan, less administration costs and plan's own taxes, and any change in the effects of the asset limit, excluding amounts included in net interest on net defined benefit liability (asset). Its variation is shown in the consolidated condensed statement of recognized income and expense.
During the first six months of 2024, the amount of actuarial losses (net of actuarial gains) has increased by EUR 59 million. The main impacts are:
•Increase of EUR 187 million in the cumulative actuarial losses relating to the Group´s businesses in the UK, mainly due to the behaviour of the asset portfolio and the variation in inflation hypotheses (both short and long term). These effects have been partially offset by the variation in the discount rate (increase from 4.63% to 5.15%).
•Decrease of 63 million in the cumulative actuarial losses relating to the Group's businesses in Brasil, mainly due to the discount rate variation (increase from 8.65% to 9.57% in the main pension plans, from 8.70% to 9.56% in the main medical plan). These effects have been partially offset by the effect of short-term inflation and the behaviour of the asset portfolio.
•Decrease of EUR 43 million in the cumulative actuarial losses relating to the Group's businesses in Mexico, mainly due to the increase in the discount rate (from 9.25% to 10.25%).
•Decrease of EUR 10 million in the cumulative actuarial losses relating to the Group's businesses in Germany, mainly due to the discount rate variation (increase from 3.57% to 3.74%).
The other modification in accumulated actuarial profit or losses is a decrease of EUR 12 million as a result of the evolution of exchange rates and other movements.
128 | | January - June 2024 | ||||||
e) Other comprehensive income - Items not reclassified to profit or loss – Changes in the fair value of equity instruments measured at fair value with changes in other comprehensive income
Includes the net amount of unrealised fair value changes in equity instruments at fair value with changes in other comprehensive income.
Below is a breakdown of the composition of the balance as of 30 June 2024 and 31 December 2023 under 'Other comprehensive income - Items not reclassified to profit or loss - Changes in the fair value of equity instruments measured at fair value with changes in other comprehensive income' depending on the geographical origin of the issuer:
| EUR million | ||||||||||||||||||||||||||
| 30-06-2024 | 31-12-2023 | |||||||||||||||||||||||||
| Revaluation gains | Revaluation losses | Net revaluation gains/(losses) | Fair value | Revaluation gains | Revaluation losses | Net revaluation gains/(losses) | Fair value | |||||||||||||||||||
| Equity instruments | ||||||||||||||||||||||||||
| Domestic | ||||||||||||||||||||||||||
| Spain | 33 | (1,325) | (1,292) | 106 | 32 | (1,173) | (1,141) | 252 | ||||||||||||||||||
| International | ||||||||||||||||||||||||||
| Rest of Europe | 123 | (71) | 52 | 284 | 117 | (71) | 46 | 267 | ||||||||||||||||||
| United States | 17 | — | 17 | 19 | 16 | — | 16 | 19 | ||||||||||||||||||
| Latin America and rest | 519 | (1) | 518 | 1,433 | 370 | (67) | 303 | 1,223 | ||||||||||||||||||
| 692 | (1,397) | (705) | 1,842 | 535 | (1,311) | (776) | 1,761 | |||||||||||||||||||
| Of which: | ||||||||||||||||||||||||||
| Listed | 472 | (49) | 423 | 1,462 | 316 | (118) | 198 | 1,225 | ||||||||||||||||||
| Unlisted | 220 | (1,348) | (1,128) | 380 | 219 | (1,193) | (974) | 536 | ||||||||||||||||||
f) Other comprehensive income - Items that may be reclassified to profit or loss – Hedges of net investments in foreign operations (effective portion) and exchange differences
Other comprehensive income - Items that may be reclassified to profit or loss - Hedges of net investments in foreign operations (effective portion) includes the net amount of the changes in value of hedging instruments in hedges of net investments in foreign operations, in respect of the portion of these changes considered to be effective hedges.
Other comprehensive income - Items that may be reclassified to profit or loss - Exchange differences includes the net amount of exchange differences arising on non-monetary items whose fair value is adjusted against equity and the differences arising on the translation to euros of the balances of the consolidated entities whose functional currency is not the euro.
The net variation of both headings recognised during the first six months of 2024 in the interim condensed consolidated statement of recognised income and expenses, reflects the impact of the evolution of the currencies during the year, reflecting mainly the appreciation of the Pound Sterling, US dollar and Mexican peso as well as the depreciation of the Brazilian real and Chilean peso (see Note 1.e).
Of this variation, a capital loss of EUR 335 million corresponds to the valuation at the closing exchange rate of goodwill for the first six months of 2024 (see Note 8).
| January - June 2024 | | 129 | ||||||
g) Other comprehensive income – Items that may be reclassified to profit or loss – Changes in the fair value of debt instruments measured at fair value through other comprehensive income
Includes the net amount of unrealised fair value changes in debt instruments at fair value through other comprehensive income.
Below is a breakdown of the composition of the balance as of 30 June 2024 and 31 December 2023 under Other comprehensive income - Items that may be reclassified to profit or loss - Changes in the fair value of debt instruments measured at fair value through other comprehensive income depending on the type of instrument and the geographical origin of the issuer:
| EUR million | ||||||||||||||||||||||||||
| 30-06-2024 | 31-12-2023 | |||||||||||||||||||||||||
| Revaluation gains | Revaluation losses | Net revaluation gains/(losses) | Fair value | Revaluation gains | Revaluation losses | Net revaluation gains/(losses) | Fair value | |||||||||||||||||||
| Debt instruments | ||||||||||||||||||||||||||
| Issued by public Public-sector | ||||||||||||||||||||||||||
| Spain | 102 | (1) | 101 | 10,136 | 17 | 0 | 17 | 9,867 | ||||||||||||||||||
| Rest of Europe | 257 | (82) | 175 | 14,850 | 333 | (96) | 237 | 18,258 | ||||||||||||||||||
| Latin America and rest of the world | 69 | (873) | (804) | 37,838 | 194 | (820) | (626) | 38,169 | ||||||||||||||||||
| Issued by Private-sector | ||||||||||||||||||||||||||
| Spain | 73 | (13) | 60 | 6,366 | 98 | (9) | 89 | 5,129 | ||||||||||||||||||
| Rest of Europe | 21 | (30) | (9) | 5,776 | 19 | (30) | (11) | 5,018 | ||||||||||||||||||
| Latin America and rest of the world | 12 | (268) | (256) | 5,462 | 6 | (267) | (261) | 5,106 | ||||||||||||||||||
| 534 | (1,267) | (733) | 80,428 | 667 | (1,222) | (555) | 81,547 | |||||||||||||||||||
130 | | January - June 2024 | ||||||
12. Segment information (Primary segment)
Grupo Santander has aligned the information in this note with the underlying information used internally for management reporting and with that presented in Grupo Santander's other public documents.
Grupo Santander's executive committee has been selected to be its chief operating decision maker. Grupo Santander's operating segments reflect its organizational and managerial structures. The executive committee reviews internal reporting based on these segments to assess performance and allocate resources.
On September 18, 2023, Grupo Santander announced that it is consolidating its retail & commercial and consumer activities across all markets under two new global businesses: Retail & Commercial and Digital Consumer Bank. The changes align these businesses with Santander’s at 30 June 2024, global model in Corporate & Investment Banking, Wealth Management & Insurance and Payments, helping the bank achieve the strategic goals.
The segments are split by business units in which profits are made and by geographic area. The information is prepared by aggregating the figures for Grupo Santander’s various geographic areas and business units, relating it to both the accounting data of the units integrated in each segment and that provided by management information systems. The same general principles as those used in Grupo Santander are applied.
The Group's main level of segmentation, derived from its management model, consolidates the retail, commercial and consumer banking businesses of all markets under the umbrella of two new global business areas:
•Retail & Commercial Banking (Retail): new area that integrates the retail banking business (individuals) and commercial banking (SMEs and corporates), except for business originated in the consumer finance and the cards businesses.
•Digital Consumer Bank (Consumer): comprises all business originated in the consumer finance companies, plus Openbank, Open Digital Services (ODS) and SBNA Consumer.
•Corporate & Investment Banking (CIB): this business, which includes Global Transactional Banking, Global Banking (Global Debt Finance and Corporate Finance) and Markets, offers products and services on a global scale to corporate and institutional customers, and collaborates with other global businesses to better serve our broad customer base.
•Wealth Management & Insurance (Wealth): includes the asset management business (Santander Asset Management), the corporate unit of Private Banking and International Private Banking in Miami and Switzerland and the insurance business (Santander Insurance).
•Payments: digital payments solutions, providing global technology solutions for our banks and new customers in the open market. It is structured in two businesses: PagoNxt (Getnet, Ebury and PagoNxt Payments) and Cards (cards platform and business in the countries).
In accordance with the information used by the Group's executive committee for decision making, following is a distribution of the gross margin by business segment accompanying consolidated income statements for the six-month periods ended 30 June 2024 and 2023.
In addition to these operating units, which report by geographic area and businesses, Grupo Santander continues to maintain the area of Corporate Center, that includes the centralized activities relating to equity stakes in financial companies, financial management of the structural exchange rate position, assumed within the sphere of Grupo Santander's assets and liabilities committee, as well as management of liquidity and of shareholders' equity via issuances.
This financial information ('underlying basis') is computed by adjusting reported results for the effects of certain gains and losses (e.g.: capital gains, write-downs, etc.). These gains and losses are items that management and investors ordinarily identify and consider separately to understand better the underlying trends in the business.
Following is the reconciliation between the adjusted profit and the statutory profit corresponding to the six-month periods ended 30 June 2024 and 2023:
| EUR million | ||||||||||||||||||||
| Gross Margin | Profit before taxes | Profit | ||||||||||||||||||
| Segment | 30-06-2024 | 30-06-2023 | 30-06-2024 | 30-06-2023 | 30-06-2024 | 30-06-2023 | ||||||||||||||
| Retail & Commercial Banking | 16,274 | 14,392 | 5,187 | 3,638 | 3,326 | 2,421 | ||||||||||||||
| Digital Consumer Bank | 6,449 | 6,026 | 1,341 | 1,504 | 1,070 | 1,027 | ||||||||||||||
| Corporate & Investment Banking | 4,188 | 3,956 | 2,151 | 2,305 | 1,405 | 1,478 | ||||||||||||||
| Wealth Management & Insurance | 1,789 | 1,589 | 1,130 | 985 | 818 | 711 | ||||||||||||||
| Payments | 2,701 | 2,613 | 306 | 498 | 49 | 223 | ||||||||||||||
| Corporate Center | (350) | (342) | (606) | (601) | (609) | (620) | ||||||||||||||
| Underlying Profit | 31,050 | 28,234 | 9,508 | 8,329 | 6,059 | 5,241 | ||||||||||||||
| Adjustments | (335) | (224) | — | (239) | — | — | ||||||||||||||
| Statutory Profit | 30,715 | 28,010 | 9,508 | 8,090 | 6,059 | 5,241 | ||||||||||||||
| January - June 2024 | | 131 | ||||||
113. Related parties
The parties related to Grupo Santander are deemed to include, in addition to its subsidiaries, associates and joint ventures, Banco Santander’s key management personnel (the members of its board of directors and the executive vice presidents, together with their close family members) and the entities over which the key management personnel may exercise significant influence or control.
Following is a detail of the transactions performed by Grupo Santander with its related parties in the first six months of 2024 and 2023, distinguishing between significant shareholders, members of Banco Santander’s board of directors, Banco Santander’s executive vice presidents, Grupo Santander entities and other related parties. Related party transactions were made on terms equivalent to those that prevail in arm’s-length transactions or, when this was not the case, the related compensation in kind was recognised:
| EUR million | |||||||||||||||||
| 30-06-2024 | |||||||||||||||||
| Expenses and income | Significant shareholders | Directors and executives | Group companies or entities | Other related parties | Total | ||||||||||||
| Expenses | |||||||||||||||||
| Finance costs | — | — | 75 | 2 | 77 | ||||||||||||
| Leases | — | — | — | — | — | ||||||||||||
| Services received | — | — | — | — | — | ||||||||||||
| Purchases of stocks | — | — | — | — | — | ||||||||||||
| Other expenses | — | — | 97 | — | 97 | ||||||||||||
| — | — | 172 | 2 | 174 | |||||||||||||
| Income | |||||||||||||||||
| Finance income | — | — | 249 | 4 | 253 | ||||||||||||
| Dividends received | — | — | — | — | — | ||||||||||||
| Services rendered | — | — | — | — | — | ||||||||||||
| Sale of stocks | — | — | — | — | — | ||||||||||||
| Other income | — | — | 798 | 1 | 799 | ||||||||||||
| — | — | 1,047 | 5 | 1,052 | |||||||||||||
| EUR million | |||||||||||||||||
| 30-06-2024 | |||||||||||||||||
| Other transactions | Significant shareholders | Directors and executives | Group companies or entities | Other related parties | Total | ||||||||||||
| Financing agreements: loans and capital contributions (lender) | — | — | 363 | 50 | 413 | ||||||||||||
| Financing agreements: loans and capital contributions (borrower) | — | (2) | 545 | 84 | 627 | ||||||||||||
| Guarantees provided | — | — | 8 | (291) | (283) | ||||||||||||
| Guarantees received | — | — | — | — | — | ||||||||||||
| Commitments acquired | — | — | 44 | 2 | 46 | ||||||||||||
| Dividends and other distributed profit | — | 2 | — | 17 | 19 | ||||||||||||
| Other transactions | — | — | (127) | — | (127) | ||||||||||||
132 | | January - June 2024 | ||||||
| EUR million | |||||||||||||||||
| 30-06-2024 | |||||||||||||||||
| Balance closing period | Significant shareholders | Directors and executives | Group companies or entities | Other related parties | Total | ||||||||||||
| Debt balances: | |||||||||||||||||
| Customers and commercial debtors | — | — | — | — | — | ||||||||||||
| Loans and credits granted | — | 10 | 10,043 | 234 | 10,287 | ||||||||||||
| Other collection rights | — | — | 704 | — | 704 | ||||||||||||
| — | 10 | 10,747 | 234 | 10,991 | |||||||||||||
| Credit balances: | |||||||||||||||||
| Suppliers and creditors granted | — | — | — | — | — | ||||||||||||
| Loans and credits received | — | 16 | 2,735 | 234 | 2,985 | ||||||||||||
| Other payment obligations | — | — | 304 | — | 304 | ||||||||||||
| — | 16 | 3,039 | 234 | 3,289 | |||||||||||||
| EUR million | |||||||||||||||||
| 30-06-2023 | |||||||||||||||||
| Expenses and income | Significant shareholders | Directors and executives | Group companies or entities | Other related parties | Total | ||||||||||||
| Expenses | |||||||||||||||||
| Finance costs | — | — | 79 | — | 79 | ||||||||||||
| Leases | — | — | — | — | — | ||||||||||||
| Services received | — | — | — | — | — | ||||||||||||
| Purchases of stocks | — | — | — | — | — | ||||||||||||
| Other expenses | — | — | 57 | — | 57 | ||||||||||||
| — | — | 136 | — | 136 | |||||||||||||
| Income | |||||||||||||||||
| Finance income | — | — | 188 | 3 | 191 | ||||||||||||
| Dividends received | — | — | — | — | — | ||||||||||||
| Services rendered | — | — | — | — | — | ||||||||||||
| Sale of stocks | — | — | — | — | — | ||||||||||||
| Other income | — | — | 709 | 1 | 710 | ||||||||||||
| — | — | 897 | 4 | 901 | |||||||||||||
| January - June 2024 | | 133 | ||||||
| EUR million | |||||||||||||||||
| 30-06-2023 | |||||||||||||||||
| Other transactions | Significant shareholders | Directors and executives | Group companies or entities | Other related parties | Total | ||||||||||||
| Financing agreements: loans and capital contributions (lender) | — | 2 | 376 | (199) | 179 | ||||||||||||
| Financing agreements: loans and capital contributions (borrower) | — | — | (29) | 7 | (22) | ||||||||||||
| Guarantees provided | — | — | — | 680 | 680 | ||||||||||||
| Guarantees received | — | — | — | — | — | ||||||||||||
| Commitments acquired | — | — | 51 | 3 | 54 | ||||||||||||
| Dividends and other distributed profit | — | 1 | — | 10 | 11 | ||||||||||||
| Other transactions | — | — | 36 | — | 36 | ||||||||||||
| EUR million | |||||||||||||||||
| 31-12-2023 | |||||||||||||||||
| Balance closing period | Significant shareholders | Directors and executives | Group companies or entities | Other related parties | Total | ||||||||||||
| Debt balances: | |||||||||||||||||
| — | — | — | — | — | |||||||||||||
| Loans and credits granted | — | 12 | 9,680 | 185 | 9,877 | ||||||||||||
| Other collection rights | — | — | 817 | 1 | 818 | ||||||||||||
| — | 12 | 10,497 | 186 | 10,695 | |||||||||||||
| Credit balances: | |||||||||||||||||
| Suppliers and creditors granted | — | — | — | — | — | ||||||||||||
| Loans and credits received | — | 19 | 2,190 | 150 | 2,359 | ||||||||||||
| Other payment obligations | — | — | 290 | — | 290 | ||||||||||||
| — | 19 | 2,480 | 150 | 2,649 | |||||||||||||
134 | | January - June 2024 | ||||||
14. Off-balance-sheet exposures
The off-balance-sheet exposures related to balances representing loans commitments, financial guarantees and other commitments granted (recoverables and non recoverables).
Financial guarantees granted include financial guarantees contracts such as financial bank guarantees, credit derivatives, and risks arising from derivatives granted to third parties; non-financial guarantees include other guarantees and irrevocable documentary credits.
Loan and other commitments granted include all off-balance-sheet exposures, which are not classified as guarantees provided, including loans commitment granted.
| EUR million | ||||||||
| 30-06-2024 | 31-12-2023 | |||||||
| Loan commitments granted | 290,151 | 279,589 | ||||||
| Of which impaired | 488 | 406 | ||||||
| Financial guarantees granted | 15,598 | 15,435 | ||||||
| Of which impaired | 497 | 578 | ||||||
| Bank sureties | 15,561 | 15,400 | ||||||
| Credit derivatives sold | 37 | 35 | ||||||
| Other commitments granted | 127,420 | 113,273 | ||||||
| Of which impaired | 486 | 542 | ||||||
| Other granted guarantees | 57,519 | 57,363 | ||||||
| Other | 69,901 | 55,910 | ||||||
The breakdown of the off-balance sheet exposure and impairment on 30 June 2024 and 31 December 2023 by impairment stages is EUR 413,251 million and EUR 398,243 million of exposure and EUR 274 million and EUR 302 million of impairment in stage 1, EUR 18,447 million and EUR 8,528 million of exposure and EUR 210 million and EUR 174 million of impairment in stage 2, and EUR 1,471 million and EUR 1,526 million of exposure and EUR 214 million and EUR 226 million of impairment in stage 3, respectively.
15. Average headcount and number of branches
The average number of employees at Banco Santander and Grupo Santander, by gender, in the six-month periods ended 30 June 2024 and 2023 is as follows:
| Average headcount | ||||||||||||||
| Bank | Group | |||||||||||||
| 30-06-2024 | 30-06-2023 | 30-06-2024 | 30-06-2023 | |||||||||||
| Men | 12,246 | 12,260 | 99,865 | 97,353 | ||||||||||
| Women | 11,734 | 11,732 | 111,011 | 112,663 | ||||||||||
| 23,980 | 23,992 | 210,876 | 210,016 | |||||||||||
The number of branches at 30 June 2024 and 31 December 2023 is as follow:
| Number of branches | ||||||||
| Group | ||||||||
| 30-06-2024 | 31-12-2023 | |||||||
| Spain | 1,883 | 1,924 | ||||||
| Group | 6,402 | 6,594 | ||||||
| 8,285 | 8,518 | |||||||
| January - June 2024 | | 135 | ||||||
16. Other disclosures
a) Valuation techniques for financial assets and liabilities
The following table shows a summary of the fair values, at 30 June 2024 and 31 December 2023, of the financial assets and liabilities indicated below, classified on the basis of the various measurement methods used by Grupo Santander to determine their fair value:
| EUR million | ||||||||||||||||||||
| 30-06-2024 | 31-12-2023 | |||||||||||||||||||
| Published price quotations in active markets (Level 1) | Internal models (Levels 2 and 3) | Total | Published price quotations in active markets (Level 1) | Internal models (Levels 2 and 3) | Total | |||||||||||||||
| Financial assets held for trading | 77,854 | 129,020 | 206,874 | 67,842 | 109,079 | 176,921 | ||||||||||||||
| Non-trading financial assets mandatorily at fair value through profit or loss | 2,014 | 4,152 | 6,166 | 1,765 | 4,145 | 5,910 | ||||||||||||||
| Financial assets at fair value through profit and loss | 2,494 | 6,675 | 9,169 | 2,746 | 7,027 | 9,773 | ||||||||||||||
| Financial assets at fair value through other comprehensive income | 63,114 | 19,156 | 82,270 | 64,631 | 18,677 | 83,308 | ||||||||||||||
| Hedging derivatives (assets) | — | 5,413 | 5,413 | — | 5,297 | 5,297 | ||||||||||||||
| Financial liabilities held for trading | 24,028 | 109,828 | 133,856 | 20,298 | 101,972 | 122,270 | ||||||||||||||
| Financial liabilities designated at fair value through profit or loss | — | 34,493 | 34,493 | 25 | 40,342 | 40,367 | ||||||||||||||
| Hedging derivatives (liabilities) | — | 5,535 | 5,535 | — | 7,656 | 7,656 | ||||||||||||||
| Liabilities under insurance contracts | — | 17,592 | 17,592 | — | 17,799 | 17,799 | ||||||||||||||
The financial instruments at fair value determined on the basis of published price quotations in active markets (level 1) include government debt securities, private-sector debt securities, derivatives traded in organised markets, securitised assets, shares, short positions and fixed-income securities issued.
In cases where price quotations cannot be observed, management makes its best estimate of the price that the market would set, using its own internal models. In most cases, these internal models use data based on observable market parameters as significant inputs (level 2) and, in cases, they use significant inputs not observable in market data (level 3). In order to make these estimates, various techniques are employed, including the extrapolation of observable market data. The best evidence of the fair value of a financial instrument on initial recognition is the transaction price, unless the fair value of the instrument can be obtained from other market transactions performed with the same or similar instruments or can be measured by using a valuation technique in which the variables used include only observable market data, mainly interest rates.
During the first six months of 2024 and 2023, Grupo Santander did not make any material transfers of financial instruments between measurement levels other than the transfers included in level 3 table.
Grupo Santander has developed a formal process for the systematic valuation and management of financial instruments, which has been implemented worldwide across all the Group’s units. The governance scheme for this process distributes responsibilities between two independent divisions: Treasury (development, marketing and daily management of financial products and market data) and Risk (on a periodic basis, validation of pricing models and market data, computation of risk metrics, new transaction approval policies, management of market risk and implementation of fair value adjustment policies).
The approval of new products follows a sequence of steps (request, development, validation, integration in corporate systems and quality assurance) before the product is brought into production. This process ensures that pricing systems have been properly reviewed and are stable before they are used.
The most important products and types of derivatives, and the related valuation techniques and inputs, by asset class, are detailed in the consolidated annual accounts as at 31 December 2023.
As the end of 30 June 2024, the CVA (Credit Valuation Adjustment) accounted for was EUR 274 million (a decrease of 6.5% compared to 31 December 2023) and adjustments of DVA (Debt Valuation Adjustment) was EUR 265 million (a decrease of 19.7% compared to the end of December 2023). The reduction is mainly due to a decline in the spread curves of the credit markets.
136 | | January - June 2024 | ||||||
Set forth below are the financial instruments at fair value whose measurement was based on internal models (levels 2 and 3) at 30 June 2024 and 31 December 2023:
| EUR million | EUR million | |||||||||||||||||||
| Fair values calculated using internal models at 30-06-2024 (*) | Fair values calculated using internal models at 31-12-2023 (*) | |||||||||||||||||||
| Level 2 | Level 3 | Level 2 | Level 3 | Valuation techniques | Main inputs | |||||||||||||||
| ASSETS | 153,221 | 11,195 | 133,874 | 10,351 | ||||||||||||||||
| Financial assets held for trading | 126,977 | 2,043 | 106,993 | 2,086 | ||||||||||||||||
| Central banks (**) | 17,283 | — | 17,717 | — | Present value method | Yield curves, FX market prices | ||||||||||||||
| Credit institutions (**) | 22,477 | — | 14,061 | — | Present value method | Yield curves, FX market prices | ||||||||||||||
| Customers (**) | 19,265 | 307 | 11,418 | 24 | Present value method | Yield curves, FX market prices | ||||||||||||||
| Debt instruments and equity instruments | 10,329 | 535 | 8,683 | 915 | Present value method | Yield curves, FX market prices | ||||||||||||||
| Derivatives | 57,623 | 1,201 | 55,114 | 1,147 | ||||||||||||||||
| Swaps | 45,459 | 799 | 44,987 | 577 | Present value method, Gaussian Copula | Yield curves, FX market prices, HPI, Basis, Liquidity | ||||||||||||||
| Exchange rate options | 734 | 8 | 836 | 9 | Black-Scholes Model | Yield curves, Volatility surfaces, FX market prices, Liquidity | ||||||||||||||
| Interest rate options | 2,029 | 30 | 2,210 | 153 | Black's Model, multifactorial advanced models interest rate | Yield curves, Volatility surfaces, FX market prices, Liquidity | ||||||||||||||
| Interest rate futures | 2,890 | — | 33 | — | Present value method | Yield curves, FX market prices | ||||||||||||||
| Index and securities options | 252 | 196 | 126 | 235 | Black’s Model, multifactorial advanced models interest rate | Yield curves, Volatility surfaces, FX & EQ market prices, Dividends, Liquidity | ||||||||||||||
| Other | 6,259 | 168 | 6,922 | 173 | Present value method, Advanced stochastic volatility models and others | Yield curves, Volatility surfaces, FX and EQ market prices, Dividends, Liquidity, Dividends, Correlation, HPI, Credit, Others | ||||||||||||||
| Hedging derivatives | 5,413 | — | 5,297 | — | ||||||||||||||||
| Swaps | 4,433 | — | 4,665 | — | Present value method | Yield curves, FX market prices, Basis | ||||||||||||||
| Interest rate options | — | — | 2 | — | Black Model | Yield curves, FX market prices, Volatility surfaces | ||||||||||||||
| Other | 980 | — | 630 | — | Present value method, Advanced stochastic volatility models and others | Yield curves, Volatility surfaces, FX market prices, Credit, Liquidity, Others | ||||||||||||||
| Non-trading financial assets mandatorily at fair value through profit or loss | 2,057 | 2,095 | 2,050 | 2,095 | ||||||||||||||||
| Equity instruments | 708 | 1,719 | 815 | 1,495 | Present value method | Yield curves, Market price, Dividends and Others | ||||||||||||||
| Debt instruments | 431 | 244 | 539 | 313 | Present value method | Yield curves | ||||||||||||||
| Loans and receivables | 918 | 132 | 696 | 287 | Present value method, swap asset model and CDS | Yield curves and Credit curves | ||||||||||||||
| Financial assets designated at fair value through profit or loss | 5,966 | 709 | 6,846 | 181 | ||||||||||||||||
| Credit institutions | 444 | — | 459 | — | Present value method | Yield curves, FX market prices | ||||||||||||||
| Customers (***) | 5,327 | 224 | 6,189 | 31 | Present value method | Yield curves, FX market prices, HPI | ||||||||||||||
| Debt instruments | 195 | 485 | 198 | 150 | Present value method | Yield curves, FX market prices | ||||||||||||||
| Financial assets at fair value through other comprehensive income | 12,808 | 6,348 | 12,688 | 5,989 | ||||||||||||||||
| Equity instruments | 4 | 355 | 5 | 492 | Present value method | Yield curves,Market price, Dividends and Others | ||||||||||||||
| Debt instruments | 8,852 | 677 | 9,638 | 559 | Present value method | Yield curves, FX market prices | ||||||||||||||
| Loans and receivables | 3,952 | 5,316 | 3,045 | 4,938 | Present value method | Yield curves, FX market prices and Credit curves | ||||||||||||||
| January - June 2024 | | 137 | ||||||
| LIABILITIES | 166,015 | 1,433 | 166,542 | 1,227 | ||||||||||||||||
| Financial liabilities held for trading | 109,026 | 802 | 101,103 | 869 | ||||||||||||||||
| Central banks (**) | 11,056 | — | 7,808 | — | Present value method | FX market prices, Yield curves | ||||||||||||||
| Credit institutions (**) | 17,156 | — | 17,862 | — | Present value method | FX market prices, Yield curves | ||||||||||||||
| Customers | 23,729 | — | 19,837 | — | Present value method | FX market prices, Yield curves | ||||||||||||||
| Derivatives | 51,073 | 802 | 49,380 | 869 | ||||||||||||||||
| Swaps | 41,175 | 304 | 39,395 | 388 | Present value method, Gaussian Copula | Yield curves, FX market prices, Basis, Liquidity, HPI | ||||||||||||||
| Exchange rate options | 589 | — | 549 | 8 | Black Model, multifactorial advanced models interest rate | Yield curves, Volatility surfaces, FX market prices, Liquidity | ||||||||||||||
| Interest rate options | 2,388 | 65 | 2,207 | 139 | Black-Scholes Model | Yield curves, Volatility surfaces, FX market prices | ||||||||||||||
| Index and securities options | 920 | 222 | 466 | 187 | Black-Scholes Model | Yield curves, FX market prices, Liquidity | ||||||||||||||
| Interest rate and equity futures | 36 | — | 101 | — | Present value method | Yield curves, Volatility surfaces, FX & EQ market prices, Dividends, Correlation, Liquidity, HPI | ||||||||||||||
| Other | 5,965 | 211 | 6,662 | 147 | Present value method, Advanced stochastic volatility models and others | Yield curves, Volatility surfaces, FX & EQ market prices, Dividends, Correlation, HPI, Credit, Others | ||||||||||||||
| Short positions | 6,012 | — | 6,216 | — | Present value method | Yield curves ,FX market prices, Equity | ||||||||||||||
| Hedging derivatives | 5,530 | 5 | 7,650 | 6 | ||||||||||||||||
| Swaps | 5,038 | 4 | 6,866 | 6 | Present value method | Yield curves ,FX market prices, Basis | ||||||||||||||
| Interest rate options | 1 | 1 | 1 | — | Black's Model | Yield curves, Volatility surfaces, FX market prices and Liquidity | ||||||||||||||
| Other | 491 | — | 783 | — | Present value method, Advanced stochastic volatility models and others | Yield curves, Volatility surfaces, FX market prices, Credit, Liquidity and others | ||||||||||||||
| Financial liabilities designated at fair value through profit or loss | 34,141 | 352 | 40,313 | 29 | Present value method | Yield curves, FX market prices | ||||||||||||||
| Liabilities under insurance contracts | 17,318 | 274 | 17,476 | 323 | Present Value Method with actuarial techniques | Mortality tables and yield curves | ||||||||||||||
(*) The internal models of level 2 implement figures based on the parameters observed in the market, while level 3 internal models use significant inputs that are not observable in market data.
(**) Includes mainly short-term loans/deposits and repurchase/reverse repurchase agreements with corporate customers (mainly brokerage and investment companies).
(***) Includes mainly structured loans to corporate clients.
138 | | January - June 2024 | ||||||
Level 3 financial instruments
Set forth below are the Group’s main financial instruments measured using unobservable market data as significant inputs of the internal models (level 3):
•HTC&S (Hold to collect and sale) syndicated loans classified in the fair value category with changes in other comprehensive income, where the cost of liquidity is not directly observable in the market, as well as the prepayment option in favour of the borrower.
•Illiquid equity instruments in non-trading portfolios, classified at fair value through profit or loss and at fair value through equity.
•Instruments in Santander UK’s portfolio (loans, debt instruments and derivatives) linked to the House Price Index (HPI). Even if the valuation techniques used for these instruments may be the same as those used to value similar products (present value in the case of loans and debt instruments, and the Black-Scholes model for derivatives), the main factors used in the valuation of these instruments are the HPI spot rate, the growth and volatility thereof, and the mortality rates, which are not always observable in the market and, accordingly, these instruments are considered illiquid.
•Callable interest rate derivatives (Bermudan-style options) where the main unobservable input is mean reversion of interest rates.
•Trading derivatives on interest rates, taking as an underlying asset titling and with the amortization rate (CPR, Conditional prepayment rate) as unobservable main entry.
•Derivatives from trading on inflation in Spain, where volatility is not observable in the market.
•Equity volatility derivatives, specifically indices and equities, where volatility is not observable in the long term.
•Derivatives on long-term interest rate and FX in some units (mainly South America) where for certain underlyings it is not possible to demonstrate observability to these terms.
•Debt instruments referenced to certain illiquid interest rates, for which there is no reasonable market observability.
The measurements obtained using the internal models might have been different if other methods or assumptions had been used with respect to interest rate risk, to credit risk, market risk and foreign currency risk spreads, or to their related correlations and volatilities. Nevertheless, the Bank’s directors consider that the fair value of the financial assets and liabilities recognised in the interim condensed consolidated balance sheet and the gains and losses arising from these financial instruments are reasonable.
The net amount recorded in the results of the first six months of 2024 arising from models whose significant inputs are unobservable market data (level 3) amounted to EUR 160 million profit (EUR 178 million in the first six months of 2023).
| January - June 2024 | | 139 | ||||||
The table below shows the effect, at 30 June 2024 and 31 December 2023, on the fair value of the main financial instruments classified as Level 3 of a reasonable change in the assumptions used in the valuation. This effect was determined by applying the probable valuation ranges of the main unobservable inputs detailed in the following table:
| 30/06/2024 | ||||||||||||||||||||
| Portfolio/Instrument | Valuation technique | Main unobservable inputs | Range | Weighted average | Impacts (EUR million) | |||||||||||||||
| (Level 3) | Unfavourable scenario | Favourable scenario | ||||||||||||||||||
| Financial assets held for trading | ||||||||||||||||||||
| Loans and advances to customers | ||||||||||||||||||||
| Repos/Reverse repos | Others | Long-term repo spread | n.a. | n.a. | (0.07) | 0.00 | ||||||||||||||
| Debt securities | ||||||||||||||||||||
| Corporate debt | Discounted Cash Flows | Credit spread | 0% - 10% | 5.07% | (4.88) | 5.03 | ||||||||||||||
| Government debt | Discounted Cash Flows | Discount curve | 0% - 8% | 3.99% | (6.86) | 6.82 | ||||||||||||||
| Others | Discounted Cash Flows | Credit spread | 10% - 90% | 33.53% | (0.45) | 0.18 | ||||||||||||||
| Derivatives | ||||||||||||||||||||
| Cap&Floor | Forward estimation | Interest rate | (2)bp - 2bp | 0.02bp | (0.02) | 0.02 | ||||||||||||||
| EQ Options | EQ option pricing model | Volatility | 0% - 70% | 42.49% | (0.41) | 0.63 | ||||||||||||||
| EQ Options | Local volatility | Volatility | 10% - 90% | 50.00% | (6.22) | 6.22 | ||||||||||||||
| Fx Options | Fx option pricing model | Volatility | 0% - 40% | 20.81% | (0.53) | 0.57 | ||||||||||||||
| Inflation Derivatives | Asset Swap model | Inflation Swap Rate | 2% - 8% | 4.35% | (0.32) | 0.20 | ||||||||||||||
| IR Options | IR option pricing model | Volatility | 0% - 30% | 17.56% | (0.20) | 0.28 | ||||||||||||||
| IRS | Others | Others | 5% - n.a. | n.a. | (2.30) | 0.00 | ||||||||||||||
| IRS | Discounted Cash Flows | Credit spread | 70.9% - 322.7% | 209.79% | (1.71) | 2.11 | ||||||||||||||
| IRS | Discounted Cash Flows | Swap rate | 9% - 10% | 9.57% | (0.69) | 0.92 | ||||||||||||||
| IRS | Forward estimation | Interest rate | 60bps - 300bps | 181.5bps | (2.87) | 2.94 | ||||||||||||||
| IRS | Prepayment modelling | Prepayment rate | 2.5% - 9.0% | 9.00% | 0.00 | 0.03 | ||||||||||||||
| Property derivatives | Option pricing model | Growth rate | (6)% - 5% | 0.00% | (3.78) | 3.78 | ||||||||||||||
| Securitisation Swap | Discounted Cash Flows | Constant prepayment rates | (25.2)% - 30.8% | 2.80% | (5.59) | 5.59 | ||||||||||||||
| Structured notes | Price based | Price | (10)% - 10% | 0.00% | (1.53) | 1.53 | ||||||||||||||
| Financial assets designated at fair value through profit or loss | ||||||||||||||||||||
| Loans and advances to customers | ||||||||||||||||||||
| Loans | Discounted Cash Flows | Credit spreads | 0.1% - 2% | 1.05% | (0.19) | 0.19 | ||||||||||||||
| Mortgage portfolio | Black Scholes model | Growth rate | (5)% - 5% | 0.00% | (0.24) | 0.24 | ||||||||||||||
| Debt securities | ||||||||||||||||||||
| Other debt securities | Others | Inflation Swap Rate | 0% - 8% | 3.89% | (4.11) | 3.90 | ||||||||||||||
140 | | January - June 2024 | ||||||
| 30/06/2024 | ||||||||||||||||||||
| Portfolio/Instrument | Valuation technique | Main unobservable inputs | Range | Weighted average | Impacts (EUR million) | |||||||||||||||
| (Level 3) | Unfavourable scenario | Favourable scenario | ||||||||||||||||||
| Non-trading financial assets mandatorily at fair value through profit or loss | ||||||||||||||||||||
| Debt securities | ||||||||||||||||||||
| Property securities | Probability weighting | Growth rate | (5)% - 5% | 0.00% | (0.35) | 0.35 | ||||||||||||||
| Equity instruments | ||||||||||||||||||||
| Equities | Price Based | Price | 90% - 110% | 100% | (171.92) | 171.92 | ||||||||||||||
| Financial assets at fair value through other comprehensive income | ||||||||||||||||||||
| Loans and advances to customers | ||||||||||||||||||||
| Loans | Discounted Cash Flows | Credit spread | 10% - 90% | 10.00% | (19.50) | 0.00 | ||||||||||||||
| Loans | Discounted Cash Flows | Interest rate curve | 4.5% - 8.1% | 6.28% | (0.57) | 0.57 | ||||||||||||||
| Loans | Discounted Cash Flows | Margin of a reference portfolio | (1)bp - 1bp | 0bp | (20.30) | 20.30 | ||||||||||||||
| Loans | Forward estimation | Credit spread | 167.7bps - 365.8bps | 167.74bps | (0.20) | 0.00 | ||||||||||||||
| Loans | Market price | Market price | (10)% - 20% | 0.00% | (2.78) | 1.39 | ||||||||||||||
| Debt securities | ||||||||||||||||||||
| Corporate debt | Discounted Cash Flows | Margin of a reference portfolio | (1)bp - 1bp | 0bp | (0.09) | 0.09 | ||||||||||||||
| Government debt | Discounted Cash Flows | Interest rate | 0.4% - 2.4% | 1.42% | 0.00 | 0.00 | ||||||||||||||
| Mortgage Letters | Discounted Cash Flows | Mortgage Letters | 5.9% - 6.2% | 6.08% | 0.13 | 0.13 | ||||||||||||||
| Equity instruments | ||||||||||||||||||||
| Equities | Price Based | Price | 90% - 110% | 100.00% | (35.46) | 35.46 | ||||||||||||||
| Financial liabilities held for trading | ||||||||||||||||||||
| Derivatives | ||||||||||||||||||||
| Cap&Floor | Volatility option model | Volatility | 10% - 90% | 50.62% | (0.04) | 0.04 | ||||||||||||||
| FX Options | Volatility option model | Volatility | 10% - 90% | 36.10% | (0.44) | 0.21 | ||||||||||||||
| IRS | Discounted Cash Flows | Inflation Swap Rate | 10% - 99% | 50.54% | (4.17) | 4.26 | ||||||||||||||
| Swaptions | Volatility option model | Volatility | 60bps - 114bps | 70.47bps | (5.77) | 1.39 | ||||||||||||||
| January - June 2024 | | 141 | ||||||
| 31/12/2023 | |||||||||||||||||||||||
| Portfolio/Instrument | Valuation technique | Main unobservable inputs | Range | Weighted average | Impacts (EUR million) | ||||||||||||||||||
| (Level 3) | Unfavourable scenario | Favourable scenario | |||||||||||||||||||||
| Financial assets held for trading | |||||||||||||||||||||||
| Loans and advances to customers | |||||||||||||||||||||||
| Repos/Reverse repos | Other | Long-term repo spread | n.a. | n.a. | (0.08) | — | |||||||||||||||||
| Debt securities | |||||||||||||||||||||||
| Corporate debt | Discounted Cash Flows | Credit spread | 0% - 10% | 5.01% | (1.90) | 1.90 | |||||||||||||||||
| Government debt | Discounted Cash Flows | Discount curve | 0% - 8% | 3.99% | (7.77) | 7.72 | |||||||||||||||||
| Derivatives | |||||||||||||||||||||||
| CCS | Forward estimation | Interest rate | (6)bps - 6bps | 0.40bps | (0.90) | 1.03 | |||||||||||||||||
| CDS | Credit default models | Illiquid credit default spread curves | 100bps - 200bps | 149.14bps | (0.14) | 0.14 | |||||||||||||||||
| EQ Options | EQ option pricing model | Volatility | 0% - 70% | 44.39% | (0.51) | 0.89 | |||||||||||||||||
| EQ Options | Local volatility | Volatility | 10% - 90% | 50.00% | (1.26) | 1.26 | |||||||||||||||||
| Fx Options | Fx option pricing model | Volatility | 0% - 40% | 20.81% | (0.55) | 0.59 | |||||||||||||||||
| Inflation Derivatives | Asset Swap model | Inflation Swap Rate | 2% - 8% | 4.18% | (0.28) | 0.16 | |||||||||||||||||
| IR Options | IR option pricing model | Volatility | 0.4% - 32.2% | 18.86% | (0.29) | 0.41 | |||||||||||||||||
| IRS | Others | Others | 5% - n.a | n.a | (1.25) | — | |||||||||||||||||
| IRS | Discounted Cash Flows | Credit spread | 2.6% - 8.3% | 5.60% | (1.97) | 2.18 | |||||||||||||||||
| IRS | Discounted Cash Flows | Swap rate | 9.4% - 9.8% | 9.60% | (1.01) | 0.95 | |||||||||||||||||
| IRS | Forward estimation | Interest rate | (5.2)bps - 5.2bps | 0.09bps | (0.03) | 0.03 | |||||||||||||||||
| IRS | Prepayment modelling | Prepayment rate | 2.5% - 6.2% | 4.17% | (0.06) | 0.05 | |||||||||||||||||
| Property derivatives | Option pricing model | Growth rate | (5)% - 5% | 0.00% | (3.92) | 3.92 | |||||||||||||||||
| Securitisation Swap | Discounted Cash Flows | Constant prepayment rates | (22.30)% - 27.20% | 2.47% | (4.95) | 4.95 | |||||||||||||||||
| Structured notes | Price based | Price | (10)% - 10% | 0.00% | (1.53) | 1.53 | |||||||||||||||||
| Financial assets designated at fair value through profit or loss | |||||||||||||||||||||||
| Loans and advances to customers | |||||||||||||||||||||||
| Loans | Discounted Cash Flows | Credit spreads | 0.1% - 3% | 1.55% | (0.21) | 0.21 | |||||||||||||||||
| Mortgage portfolio | Black Scholes model | Growth rate | (5)% - 5% | 0.00% | (0.23) | 0.23 | |||||||||||||||||
| Debt securities | |||||||||||||||||||||||
| Other debt securities | Others | Inflation Swap Rate | 0% - 8% | 3.89% | (4.48) | 4.25 | |||||||||||||||||
142 | | January - June 2024 | ||||||
| 31/12/2023 | |||||||||||||||||||||||
| Portfolio/Instrument | Valuation technique | Main unobservable inputs | Range | Weighted average | Impacts (EUR million) | ||||||||||||||||||
| (Level 3) | Unfavourable scenario | Favourable scenario | |||||||||||||||||||||
| Non-trading financial assets mandatorily at fair value through profit or loss | |||||||||||||||||||||||
| Debt securities | |||||||||||||||||||||||
| Property securities | Probability weighting | Growth rate | (5)% - 5% | 0.00% | (0.35) | 0.35 | |||||||||||||||||
| Equity instruments | |||||||||||||||||||||||
| Equities | Price Based | Price | 90% - 110% | 100.00% | (149.49) | 149.49 | |||||||||||||||||
| Financial assets at fair value through other comprehensive income | |||||||||||||||||||||||
| Loans and advances to customers | |||||||||||||||||||||||
| Loans | Discounted Cash Flows | Credit spread | n.a. | n.a | (20.80) | 0.00 | |||||||||||||||||
| Loans | Discounted Cash Flows | Interest rate curve | 4.6% - 9.0% | 6.80% | (0.68) | 0.68 | |||||||||||||||||
| Loans | Discounted Cash Flows | Margin of a reference portfolio | (1)bp - 1bp | 0bp | (20.30) | 20.30 | |||||||||||||||||
| Loans | Forward estimation | Credit spread | 167.7bps - 365.8bps | 167.74bps | (3.46) | 0.00 | |||||||||||||||||
| Loans | Market price | Market price | (10)% - 20% | 0.00% | (5.02) | 2.51 | |||||||||||||||||
| Debt securities | |||||||||||||||||||||||
| Corporate debt | Discounted Cash Flows | Margin of a reference portfolio | (1)% - 1% | 0.00% | (0.09) | 0.09 | |||||||||||||||||
| Government debt | Discounted Cash Flows | Interest rate | 0% - 2% | 0.99% | 0.00 | 0.00 | |||||||||||||||||
| Equity instruments | |||||||||||||||||||||||
| Equities | Price Based | Price | 90% - 110% | 100.00% | (49.24) | 49.24 | |||||||||||||||||
| Financial liabilities held for trading | |||||||||||||||||||||||
| Derivatives | |||||||||||||||||||||||
| Cap&Floor | Volatility option model | Volatility | 10% - 90% | 39.03% | (0.45) | 0.25 | |||||||||||||||||
| CMS | Discounted Cash Flows | Volatility | 10% - 90% | 47.66% | 0.00 | 0.00 | |||||||||||||||||
| Fx Options | Volatility option model | Volatility | 10% - 90% | 28.09% | (0.45) | 0.13 | |||||||||||||||||
| IRS | Discounted Cash Flows | Inflation Swap Rate | 10% - 90% | 39.03% | (0.45) | 0.25 | |||||||||||||||||
| Swaptions | Volatility option model | Volatility | 10% - 90% | 35.55% | 0.21 | 0.10 | |||||||||||||||||
1. For each instrument, the valuation technique is shown, the unobservable inputs described in the "Main unobservable inputs" column under probable scenarios, variation range, average value and impact resulting from valuing the position in the established maximum and minimum range.
2. The breakdown of impacts is shown by type of instrument and unobservable inputs.
3. The estimation of the range of variation of the unobservable inputs has been carried out taking into account plausible movements of said parameters depending on the type of instrument.
4. Zero impacts from fully hedged or back-to-back transactions have not been included in this exercise.
| January - June 2024 | | 143 | ||||||
Lastly, the changes in the financial instruments classified as level 3 in the first six months of 2024 and 2023 were as follows:
| 01-01-2024 | Changes | 30-06-2024 | ||||||||||||||||||||||||
| EUR million | Fair value calculated using internal models (Level 3) | Purchases/Settlements | Sales/Amortisation | Changes in fair value recognized in profit or loss | Changes in fair value recognised in equity | Level reclassifications | Other | Fair value calculated using internal models (Level 3) | ||||||||||||||||||
| Financial assets held for trading | 2,086 | 726 | (194) | 33 | — | (566) | (42) | 2,043 | ||||||||||||||||||
| Customers | 24 | 275 | (24) | 2 | — | 30 | — | 307 | ||||||||||||||||||
| Debt instruments | 914 | 84 | (2) | (18) | — | (428) | (16) | 534 | ||||||||||||||||||
| Equity instruments | 1 | — | — | — | — | — | — | 1 | ||||||||||||||||||
| Trading derivatives | 1,147 | 367 | (168) | 49 | — | (168) | (26) | 1,201 | ||||||||||||||||||
| Swaps | 577 | 281 | (94) | (3) | — | 38 | — | 799 | ||||||||||||||||||
| Exchange rate options | 9 | — | (1) | 3 | — | (2) | (1) | 8 | ||||||||||||||||||
| Interest rate options | 153 | — | — | (16) | — | (107) | — | 30 | ||||||||||||||||||
| Index and securities options | 235 | 11 | (47) | 79 | — | (66) | (16) | 196 | ||||||||||||||||||
| Other | 173 | 75 | (26) | (14) | — | (31) | (9) | 168 | ||||||||||||||||||
| Financial assets designated at fair value through profit or loss | 181 | 593 | (126) | 28 | — | 61 | (28) | 709 | ||||||||||||||||||
| Loans and advances to customers | 31 | 188 | (3) | (8) | — | — | 16 | 224 | ||||||||||||||||||
| Debt instruments | 150 | 405 | (123) | 36 | — | 61 | (44) | 485 | ||||||||||||||||||
| Non-trading financial assets mandatorily at fair value through profit or loss | 2,095 | 167 | (189) | 71 | — | (69) | 20 | 2,095 | ||||||||||||||||||
| Loans and advances to customers | 287 | 43 | (97) | 45 | — | (140) | (6) | 132 | ||||||||||||||||||
| Debt instruments | 313 | 5 | (73) | 2 | — | — | (3) | 244 | ||||||||||||||||||
| Equity instruments | 1,495 | 119 | (19) | 24 | — | 71 | 29 | 1,719 | ||||||||||||||||||
| Financial assets at fair value through other comprehensive income | 5,989 | 3,034 | (2,522) | — | (123) | 23 | (53) | 6,348 | ||||||||||||||||||
| Loans and advances to customers | 4,938 | 2,845 | (2,505) | — | 20 | 16 | 2 | 5,316 | ||||||||||||||||||
| Debt instruments | 559 | 186 | (2) | — | (17) | 7 | (56) | 677 | ||||||||||||||||||
| Equity instruments | 492 | 3 | (15) | — | (126) | — | 1 | 355 | ||||||||||||||||||
| TOTAL ASSETS | 10,351 | 4,520 | (3,031) | 132 | (123) | (551) | (103) | 11,195 | ||||||||||||||||||
| Financial liabilities held for trading | 869 | 293 | (135) | (46) | — | (166) | (13) | 802 | ||||||||||||||||||
| Trading derivatives | 869 | 293 | (135) | (46) | — | (166) | (13) | 802 | ||||||||||||||||||
| Swaps | 388 | 84 | (23) | (52) | — | (93) | — | 304 | ||||||||||||||||||
| Exchange rate options | 8 | — | (1) | (4) | — | (2) | (1) | — | ||||||||||||||||||
| Interest rate options | 139 | 1 | (19) | 7 | — | (64) | 1 | 65 | ||||||||||||||||||
| Index and securities options | 187 | 1 | (17) | 71 | — | (7) | (13) | 222 | ||||||||||||||||||
| Others | 147 | 207 | (75) | (68) | — | — | — | 211 | ||||||||||||||||||
| Hedging derivatives (Liabilities) | 6 | — | — | (1) | — | — | — | 5 | ||||||||||||||||||
| Swaps | 6 | — | — | (2) | — | — | — | 4 | ||||||||||||||||||
| Interest rate options | — | — | — | 1 | — | — | — | 1 | ||||||||||||||||||
| Financial liabilities designated at fair value through profit or loss | 29 | 264 | (8) | 38 | — | 29 | — | 352 | ||||||||||||||||||
| Liabilities under insurance contracts | 323 | — | — | (19) | — | — | (30) | 274 | ||||||||||||||||||
| TOTAL LIABILITIES | 1,227 | 557 | (143) | (28) | — | (137) | (43) | 1,433 | ||||||||||||||||||
144 | | January - June 2024 | ||||||
| 01-01-2023 | Changes | 30-06-2023 | ||||||||||||||||||||||||
| EUR million | Fair value calculated using internal models (Level 3) | Purchases/Settlements | Sales/Amortisation | Changes in fair value recognized in profit or loss | Changes in fair value recognised in equity | Level reclassifications | Other | Fair value calculated using internal models (Level 3) | ||||||||||||||||||
| Financial assets held for trading | 383 | 198 | (72) | 77 | — | 303 | 151 | 1,040 | ||||||||||||||||||
| Debt instruments | 42 | 52 | (4) | 1 | — | 316 | 6 | 413 | ||||||||||||||||||
| Equity instruments | 1 | — | — | — | — | — | — | 1 | ||||||||||||||||||
| Trading derivatives | 340 | 146 | (68) | 77 | — | (13) | (1) | 481 | ||||||||||||||||||
| Swaps | 139 | — | (3) | 93 | — | — | (12) | 217 | ||||||||||||||||||
| Exchange rate options | 4 | — | — | (1) | — | — | — | 3 | ||||||||||||||||||
| Interest rate options | 39 | — | — | (10) | — | — | — | 29 | ||||||||||||||||||
| Index and securities options | 48 | 52 | — | 3 | — | (23) | 5 | 85 | ||||||||||||||||||
| Other | 110 | 94 | (65) | (8) | — | 10 | 6 | 147 | ||||||||||||||||||
| Financial assets designated at fair value through profit or loss | 427 | — | — | (40) | — | — | 30 | 417 | ||||||||||||||||||
| Loans and advances to customers | 5 | — | — | — | — | — | — | 5 | ||||||||||||||||||
| Debt instruments | 422 | — | — | (40) | — | — | 30 | 412 | ||||||||||||||||||
| Non-trading financial assets mandatorily at fair value through profit or loss | 1,833 | 163 | (116) | 48 | — | — | (16) | 1,912 | ||||||||||||||||||
| Loans and advances to customers | 239 | 59 | (63) | (16) | — | — | 9 | 228 | ||||||||||||||||||
| Debt instruments | 325 | 32 | (25) | 3 | — | — | 2 | 337 | ||||||||||||||||||
| Equity instruments | 1,269 | 72 | (28) | 61 | — | — | (27) | 1,347 | ||||||||||||||||||
| Financial assets at fair value through other comprehensive income | 5,647 | 4,197 | (3,595) | — | (222) | 505 | 86 | 6,618 | ||||||||||||||||||
| Loans and advances to customers | 4,718 | 4,196 | (3,590) | — | 23 | 473 | 39 | 5,859 | ||||||||||||||||||
| Debt instruments | 229 | — | (3) | — | (1) | 32 | 6 | 263 | ||||||||||||||||||
| Equity instruments | 700 | 1 | (2) | — | (244) | — | 41 | 496 | ||||||||||||||||||
| TOTAL ASSETS | 8,290 | 4,558 | (3,783) | 85 | (222) | 809 | 251 | 9,988 | ||||||||||||||||||
| Financial liabilities held for trading | 415 | 304 | (101) | (91) | — | (118) | (7) | 402 | ||||||||||||||||||
| Trading derivatives | 415 | 304 | (101) | (91) | — | (118) | (7) | 402 | ||||||||||||||||||
| Swaps | 235 | 104 | (70) | (25) | — | (97) | (14) | 133 | ||||||||||||||||||
| Exchange rate options | — | 24 | (24) | — | — | — | — | — | ||||||||||||||||||
| Interest rate options | 19 | 7 | (1) | (3) | — | — | — | 22 | ||||||||||||||||||
| Index and securities options | 42 | 38 | (6) | 3 | — | (21) | 7 | 63 | ||||||||||||||||||
| Others | 119 | 131 | — | (66) | — | — | — | 184 | ||||||||||||||||||
| Hedging derivatives (Liabilities) | 14 | — | — | 3 | — | 36 | — | 53 | ||||||||||||||||||
| Swaps | 14 | — | — | 3 | — | 36 | — | 53 | ||||||||||||||||||
| Financial liabilities designated at fair value through profit or loss | 151 | — | (5) | 1 | — | — | (147) | — | ||||||||||||||||||
| Liabilities under insurance contracts | 345 | — | — | (6) | — | — | 26 | 365 | ||||||||||||||||||
| TOTAL LIABILITIES | 925 | 304 | (106) | (93) | — | (82) | (128) | 820 | ||||||||||||||||||
| January - June 2024 | | 145 | ||||||
b) Refinancing and restructured transactions
The following terms are used with the meanings specified below:
•Refinancing transaction: transaction that is granted or used, for reasons relating to current or foreseeable financial difficulties of the borrower, to repay one or more of the transactions granted to it, or through which the payments on such transactions are brought fully or partially up to date, in order to enable the borrowers of the cancelled or refinanced transactions to repay their debt (principal and interest) because they are unable, or might foreseeably become unable, to comply with the conditions thereof in due time and form.
•Restructured transaction: transaction with respect to which, for economic or legal reasons relating to current or foreseeable financial difficulties of the borrower, the financial terms and conditions are modified in order to facilitate the payment of the debt (principal and interest) because the borrower is unable, or might foreseeably become unable, to comply with the aforementioned terms and conditions in due time and form, even if such modification is envisaged in the agreement.
For maximum guarantees amount, we will consider as follows:
•Collateral: the appraisal amount or valuation amount of the collateral received; for each transaction it cannot be higher than the covered amount of exposure.
146 | | January - June 2024 | ||||||
| 30-06-2024 | ||||||||||||||||||||||||||||||||||||||||||||
| Total | Of which: impaired | |||||||||||||||||||||||||||||||||||||||||||
| Without collateral | With collateral | Without collateral | With collateral | |||||||||||||||||||||||||||||||||||||||||
| Maximum amount of the actual collateral that can be considered | Maximum amount of the actual collateral that can be considered | |||||||||||||||||||||||||||||||||||||||||||
| Amounts in million euros, except number of transactions in units | Number of transactions | Gross amount | Number of operations | Gross amount | Mortgage collateral | Other collateral | Impairment of accumulated value or accumulated losses in fair value due to credit risk | Number of transactions | Gross amount | Number of operations | Gross amount | Mortgage collateral | Other collateral | Impairment of accumulated value or accumulated losses in fair value due to credit risk | ||||||||||||||||||||||||||||||
| Credit entities | — | — | — | — | — | — | — | — | — | — | — | — | — | — | ||||||||||||||||||||||||||||||
| Public sector | 13,541 | 417 | 49 | 7 | 2 | — | 4 | 8 | 3 | 7 | 1 | 1 | — | 3 | ||||||||||||||||||||||||||||||
| Other financial institutions and: individual shareholder | 940 | 83 | 679 | 233 | 83 | 106 | 53 | 438 | 22 | 340 | 61 | 21 | 10 | 43 | ||||||||||||||||||||||||||||||
| Non financial institutions and individual shareholder | 594,786 | 6,496 | 53,944 | 6,716 | 3,883 | 1,555 | 3,134 | 312,108 | 2,922 | 33,165 | 3,302 | 1,863 | 659 | 2,712 | ||||||||||||||||||||||||||||||
| Of which: Financing for constructions and property development | 13,477 | 93 | 1,933 | 552 | 460 | 38 | 128 | 7,480 | 52 | 1,054 | 216 | 157 | 23 | 101 | ||||||||||||||||||||||||||||||
| Other warehouses | 3,803,716 | 5,369 | 481,815 | 10,090 | 4,576 | 3,782 | 4,195 | 1,735,175 | 2,321 | 291,622 | 5,343 | 1,705 | 2,382 | 3,273 | ||||||||||||||||||||||||||||||
| Total | 4,412,983 | 12,365 | 536,487 | 17,046 | 8,544 | 5,443 | 7,386 | 2,047,729 | 5,268 | 325,134 | 8,707 | 3,590 | 3,051 | 6,031 | ||||||||||||||||||||||||||||||
| Financing classified as non-current assets and disposable groups of items that have been classified as held for sale | — | — | — | — | — | — | — | — | — | — | — | — | — | — | ||||||||||||||||||||||||||||||
| January - June 2024 | | 147 | ||||||
| 31-12-2023 | ||||||||||||||||||||||||||||||||||||||||||||
| Total | Of which: impaired | |||||||||||||||||||||||||||||||||||||||||||
| Without collateral | With collateral | Without collateral | With collateral | |||||||||||||||||||||||||||||||||||||||||
| Maximum amount of the actual collateral that can be considered | Maximum amount of the actual collateral that can be considered | |||||||||||||||||||||||||||||||||||||||||||
| Amounts in million euros, except number of transactions in units | Number of transactions | Gross amount | Number of operations | Gross amount | Mortgage collateral | Other collateral | Impairment of accumulated value or accumulated losses in fair value due to credit risk | Number of transactions | Gross amount | Number of operations | Gross amount | Mortgage collateral | Other collateral | Impairment of accumulated value or accumulated losses in fair value due to credit risk | ||||||||||||||||||||||||||||||
| Credit entities | — | — | — | — | — | — | — | — | — | — | — | — | — | — | ||||||||||||||||||||||||||||||
| Public sector | 12,851 | 437 | 37 | 5 | 2 | — | 4 | 7 | 3 | 7 | 1 | 1 | — | 3 | ||||||||||||||||||||||||||||||
| Other financial institutions and: individual shareholder | 1,011 | 258 | 833 | 285 | 38 | 182 | 58 | 472 | 25 | 428 | 107 | 21 | 51 | 50 | ||||||||||||||||||||||||||||||
| Non financial institutions and individual shareholder | 728,123 | 7,709 | 61,110 | 6,977 | 4,079 | 1,461 | 3,543 | 385,859 | 3,307 | 37,225 | 3,751 | 2,134 | 709 | 3,078 | ||||||||||||||||||||||||||||||
| Of which: Financing for constructions and property development | 14,236 | 106 | 2,035 | 506 | 415 | 41 | 134 | 7,759 | 56 | 1,155 | 235 | 183 | 18 | 112 | ||||||||||||||||||||||||||||||
| Other warehouses | 4,400,346 | 6,107 | 507,378 | 10,185 | 4,602 | 4,043 | 4,484 | 2,092,099 | 2,593 | 293,433 | 5,257 | 1,744 | 2,394 | 3,415 | ||||||||||||||||||||||||||||||
| Total | 5,142,331 | 14,511 | 569,358 | 17,452 | 8,721 | 5,686 | 8,089 | 2,478,437 | 5,928 | 331,093 | 9,116 | 3,900 | 3,154 | 6,546 | ||||||||||||||||||||||||||||||
| Financing classified as non-current assets and disposable groups of items that have been classified as held for sale | — | — | — | — | — | — | — | — | — | — | — | — | — | — | ||||||||||||||||||||||||||||||
148 | | January - June 2024 | ||||||
c) Real estate business – Spain
i) Portfolio of home purchase loans to families
Home purchase loans granted to families in Spain on 30 June 2024 amounted to EUR 60,431 million (EUR 61,097 million at 31 December 2023). Of which mortgage collateral are 99.66%:
| Million euros | ||||||||||||||
| 30-06-2024 | 31-12-2023 | |||||||||||||
| Gross Amount | Of which: impaired | Gross Amount | Of which: impaired | |||||||||||
| Home purchase loans to families | 60,431 | 959 | 61,097 | 924 | ||||||||||
-Without mortgage collateral | 203 | 14 | 215 | 16 | ||||||||||
- With mortgage collateral | 60,228 | 945 | 60,882 | 908 | ||||||||||
The risk profile of the home purchase mortgage loan portfolio in Spain remained at a medium-low level, with limited prospects of additional impairment:
•Principal is repaid on all mortgages from the start.
•Early repayment is common so the average life of the transaction is well below that of the contract.
•High quality of collateral concentrated almost exclusively in financing the first home.
•Average affordability rate at the end of June stood at 24%.
•93% of the portfolio has a LTV below 80%, calculated as total risk/latest available house appraisal.
| 30-06-2024 | ||||||||||||||||||||
| Gross amount in books on the amount of the last appraisal (loan to value) | ||||||||||||||||||||
| Million euros | Less than or equal to 40% | More than 40% or less than 60% | More than 60% and less than 80% | More than 80% and less or equal to 100% | More than 100% | Total | ||||||||||||||
| Gross amount | 17,665 | 20,089 | 18,003 | 3,234 | 1,237 | 60,228 | ||||||||||||||
| Of which: impaired | 119 | 177 | 217 | 167 | 265 | 945 | ||||||||||||||
| 31-12-2023 | ||||||||||||||||||||
| Gross amount in books on the amount of the last appraisal (loan to value) | ||||||||||||||||||||
| Million euros | Less than or equal to 40% | More than 40% or less than 60% | More than 60% and less than 80% | More than 80% and less or equal to 100% | More than 100% | Total | ||||||||||||||
| Gross amount | 18,728 | 20,720 | 18,083 | 2,294 | 1,057 | 60,882 | ||||||||||||||
| Of which: impaired | 131 | 192 | 199 | 151 | 235 | 908 | ||||||||||||||
ii) Financing construction and property development
At 30 June 2024 and 31 December 2023 the financing amount related to construction and real estate business in Spain amounted to EUR 2,491 million and EUR 2,393 million net of allowances, respectively.
| 30-06-2024 | |||||||||||
| Million euros | Gross amount | Excess of gross exposure over maximum recoverable amount of effective collateral | Specific allowance | ||||||||
| Financing for construction and property development recognised by the Group's credit institutions (including land) (business in Spain) | 2,525 | 278 | 34 | ||||||||
| Of which: watchlist/ impaired | 54 | 5 | 25 | ||||||||
| Memorandum items: Written-off assets | 345 | ||||||||||
| January - June 2024 | | 149 | ||||||
| 31-12-2023 | |||||||||||
| Million euros | Gross amount | Excess of gross exposure over maximum recoverable amount of effective collateral | Specific allowance | ||||||||
| Financing for construction and property development recognised by the Group's credit institutions (including land) (business in Spain) | 2,433 | 259 | 40 | ||||||||
| Of which: watchlist/ impaired | 74 | 5 | 29 | ||||||||
| Memorandum items: Written-off assets | 346 | ||||||||||
| 30-06-2024 | 31-12-2023 | |||||||
| Million euros | Carrying amount | |||||||
| Memorandum items: | ||||||||
| Total loans and advances to customers excluding the public sector (business in Spain) (book value) | 244,349 | 241,695 | ||||||
| Total consolidated assets (Total business) (book value) | 1,786,261 | 1,797,062 | ||||||
| Impairment losses and provision for exposure classified as normal (business in Spain) | 1,162 | 1,230 | ||||||
At the end 30 June 2024 and 31 December 2023 the concentration of this portfolio was as follows:
| Loans: gross amount | |||||||||||
| Million euros | 30-06-2024 | 31-12-2023 | |||||||||
1. Without mortgage collateral | 14 | 16 | |||||||||
2. With mortgage collateral | 2,511 | 2,417 | |||||||||
| 2.1 Completed buildings | 994 | 1,032 | |||||||||
| 2.1.1 Residential | 663 | 642 | |||||||||
| 2.1.2 Other | 331 | 390 | |||||||||
| 2.2 Buildings and other constructions under construction | 1,497 | 1,364 | |||||||||
| 2.2.1 Residential | 1,424 | 1,292 | |||||||||
| 2.2.2 Other | 73 | 72 | |||||||||
| 2.3 Land | 20 | 21 | |||||||||
| 2.3.1 Developed consolidated land | 13 | 14 | |||||||||
| 2.3.2 Other land | 7 | 7 | |||||||||
| Total | 2,525 | 2,433 | |||||||||
150 | | January - June 2024 | ||||||
d) Foreclosed real estate assets
The following table shows the breakdown at 30 June 2024 and 31 December 2023 of the foreclosed assets for the Spanish business:
| 30-06-2024 | ||||||||||||||
| Million euros | Gross carrying amount | Valuation Adjustments | Of which: Impairment losses since time of the foreclosure | Carrying amount | ||||||||||
| Property assets arising from financing provided to construction and property development companies | 4,634 | 2,630 | 1,935 | 2,004 | ||||||||||
| Of which: | ||||||||||||||
| Completed Buildings | 817 | 484 | 406 | 333 | ||||||||||
| Residential | 195 | 100 | 80 | 95 | ||||||||||
| Other | 622 | 384 | 326 | 238 | ||||||||||
| Buildings under construction | 126 | 58 | 45 | 68 | ||||||||||
| Residential | 9 | 7 | 5 | 2 | ||||||||||
| Other | 117 | 51 | 40 | 66 | ||||||||||
| Land | 3,691 | 2,088 | 1,484 | 1,603 | ||||||||||
| Developed Land | 1,001 | 530 | 333 | 471 | ||||||||||
| Other land | 2,690 | 1,558 | 1,151 | 1,132 | ||||||||||
| Property assets from home purchase mortgage loans to households | 435 | 193 | 131 | 242 | ||||||||||
| Other foreclosed property assets | 114 | 54 | 42 | 60 | ||||||||||
| Total property assets | 5,183 | 2,877 | 2,108 | 2,306 | ||||||||||
| 31-12-2023 | ||||||||||||||
| Million euros | Gross carrying amount | Valuation Adjustments | Of which: Impairment losses since time of the foreclosure | Carrying amount | ||||||||||
| Property assets arising from financing provided to construction and property development companies | 4,901 | 2,801 | 2,072 | 2,100 | ||||||||||
| Of which: | ||||||||||||||
| Completed Buildings | 1,054 | 615 | 519 | 439 | ||||||||||
| Residential | 224 | 111 | 89 | 113 | ||||||||||
| Other | 830 | 504 | 430 | 326 | ||||||||||
| Buildings under construction | 101 | 45 | 36 | 56 | ||||||||||
| Residential | 12 | 9 | 6 | 3 | ||||||||||
| Other | 89 | 36 | 30 | 53 | ||||||||||
| Land | 3,746 | 2,141 | 1,517 | 1,605 | ||||||||||
| Developed Land | 1,107 | 589 | 366 | 518 | ||||||||||
| Other land | 2,639 | 1,552 | 1,151 | 1,087 | ||||||||||
| Property assets from home purchase mortgage loans to households | 473 | 197 | 131 | 276 | ||||||||||
| Other foreclosed property assets | 132 | 60 | 46 | 72 | ||||||||||
| Total property assets | 5,506 | 3,058 | 2,249 | 2,448 | ||||||||||
Additionally, Grupo Santander has participation in entities holding real estate assets foreclosed or received in payment of debts for an amount of EUR 19 million and capital instruments foreclosed or received in payment of debts for an amount of EUR 13 million.
| January - June 2024 | | 151 | ||||||
e) Solvency information
The Group commands a solvency position above the levels required by regulators and by the European Central bank. At 30 June 2024, at a consolidated level, the Group must maintain a minimum capital ratio of 9.62% of CET1 fully loaded (4.50% being the requirement for Pillar I, 0.98% being the requirement for Pillar II, 2.5% being the requirement for capital conservation buffer, 1.25% being the requirement for G-SIB and 0.39% being the requirement for anti-cyclical capital buffer).
Grupo Santander must also maintain a minimum capital ratio of 11.45% of Tier 1 fully loaded and a minimum total ratio of 13.88% fully loaded.
At 30 June 2024, the Group has a capital ratio regulatory CET1 of 12.48% and a total ratio of 16.71%, the CET1 fully loaded is 12.46%.
Capital ratio
| 30-06-2024 | 31-12-2023 | |||||||
Capital ratio | ||||||||
| Level 1 ordinary eligible capital (EUR million) | 77,975 | 76,741 | ||||||
| Level 1 additional eligible capital (EUR million) | 8,834 | 9,002 | ||||||
| Level 2 eligible capital (EUR million) | 17,612 | 16,497 | ||||||
| Risk-weighted assets (EUR million) | 624,831 | 623,731 | ||||||
| Level 1 ordinary capital coefficient (CET 1) | 12.48 | % | 12.30 | % | ||||
| Level 1 additional capital coefficient (AT1) | 1.41 | % | 1.45 | % | ||||
| Level 1 capital coefficient (TIER1) | 13.89 | % | 13.75 | % | ||||
| Level 2 capital coefficient (TIER 2) | 2.82 | % | 2.64 | % | ||||
Total capital ratio | 16.71 | % | 16.39 | % | ||||
Leverage
| 30-06-2024 | 31-12-2023 | |||||||
| Leverage | ||||||||
| Tier 1 capital (EUR million) | 86,809 | 85,742 | ||||||
| Exposure (EIR million) | 1,830,215 | 1,826,922 | ||||||
| Leverage ratio | 4.74 | % | 4.69 | % | ||||
17. Explanation added for translation to English
These interim condensed consolidated financial statements are presented on the basis of the regulatory financial reporting framework applicable to Grupo Santander in Spain (see Note 1.b).
152 | | January - June 2024 | ||||||

SIGNATURE
Pursuant to the requirements of the Securities Exchange Act of 1934, the registrant has duly caused this report to be signed on its behalf by the undersigned, thereunto duly authorized.
| Banco Santander, S.A. | ||||||||
| Date: 26 July 2024 | By: | /s/ José García Cantera | ||||||
| Name: | José García Cantera | |||||||
| Title: | Chief Financial Officer | |||||||