00008911032020FYfalseus-gaap:AccountingStandardsUpdate201409MemberP5DP5DP3YP2Yus-gaap:OtherLiabilitiesNoncurrentus-gaap:OtherLiabilitiesNoncurrentus-gaap:AccruedLiabilitiesCurrentus-gaap:AccruedLiabilitiesCurrent00008911032020-01-012020-12-31xbrli:shares00008911032021-02-22iso4217:USD00008911032020-06-3000008911032020-12-3100008911032019-12-31iso4217:USDxbrli:shares0000891103us-gaap:CommonClassAMember2019-12-310000891103us-gaap:CommonClassAMember2020-12-310000891103mtch:FormerClassACommonStockMember2020-12-310000891103mtch:FormerClassACommonStockMember2019-12-310000891103us-gaap:CommonClassBMember2020-12-310000891103us-gaap:CommonClassBMember2019-12-3100008911032019-01-012019-12-3100008911032018-01-012018-12-310000891103us-gaap:CostOfSalesMember2020-01-012020-12-310000891103us-gaap:CostOfSalesMember2019-01-012019-12-310000891103us-gaap:CostOfSalesMember2018-01-012018-12-310000891103us-gaap:SellingAndMarketingExpenseMember2020-01-012020-12-310000891103us-gaap:SellingAndMarketingExpenseMember2019-01-012019-12-310000891103us-gaap:SellingAndMarketingExpenseMember2018-01-012018-12-310000891103us-gaap:GeneralAndAdministrativeExpenseMember2020-01-012020-12-310000891103us-gaap:GeneralAndAdministrativeExpenseMember2019-01-012019-12-310000891103us-gaap:GeneralAndAdministrativeExpenseMember2018-01-012018-12-310000891103us-gaap:ResearchAndDevelopmentExpenseMember2020-01-012020-12-310000891103us-gaap:ResearchAndDevelopmentExpenseMember2019-01-012019-12-310000891103us-gaap:ResearchAndDevelopmentExpenseMember2018-01-012018-12-310000891103mtch:RedeemableNoncontrollingInterestMember2017-12-310000891103us-gaap:CommonClassAMemberus-gaap:CommonStockMember2017-12-310000891103us-gaap:CommonStockMembermtch:FormerClassACommonStockMember2017-12-310000891103us-gaap:CommonClassBMemberus-gaap:CommonStockMember2017-12-310000891103us-gaap:AdditionalPaidInCapitalMember2017-12-310000891103us-gaap:RetainedEarningsMember2017-12-310000891103us-gaap:AccumulatedOtherComprehensiveIncomeMember2017-12-310000891103us-gaap:TreasuryStockMember2017-12-310000891103us-gaap:ParentMember2017-12-310000891103us-gaap:NoncontrollingInterestMember2017-12-3100008911032017-12-310000891103mtch:RedeemableNoncontrollingInterestMember2018-01-012018-12-310000891103us-gaap:RetainedEarningsMember2018-01-012018-12-310000891103us-gaap:ParentMember2018-01-012018-12-310000891103us-gaap:NoncontrollingInterestMember2018-01-012018-12-310000891103us-gaap:AccumulatedOtherComprehensiveIncomeMember2018-01-012018-12-310000891103us-gaap:AdditionalPaidInCapitalMember2018-01-012018-12-310000891103us-gaap:CommonStockMembermtch:FormerClassACommonStockMember2018-01-012018-12-310000891103us-gaap:TreasuryStockMember2018-01-012018-12-310000891103us-gaap:AdditionalPaidInCapitalMembermtch:MatchGroupAndANGIHomeservicesMember2018-01-012018-12-310000891103us-gaap:ParentMembermtch:MatchGroupAndANGIHomeservicesMember2018-01-012018-12-310000891103mtch:MatchGroupAndANGIHomeservicesMember2018-01-012018-12-3100008911032017-01-012017-12-310000891103srt:CumulativeEffectPeriodOfAdoptionAdjustmentMemberus-gaap:RetainedEarningsMember2017-12-310000891103us-gaap:ParentMembersrt:CumulativeEffectPeriodOfAdoptionAdjustmentMember2017-12-310000891103srt:CumulativeEffectPeriodOfAdoptionAdjustmentMemberus-gaap:NoncontrollingInterestMember2017-12-310000891103srt:CumulativeEffectPeriodOfAdoptionAdjustmentMember2017-12-310000891103mtch:RedeemableNoncontrollingInterestMember2018-12-310000891103us-gaap:CommonClassAMemberus-gaap:CommonStockMember2018-12-310000891103us-gaap:CommonStockMembermtch:FormerClassACommonStockMember2018-12-310000891103us-gaap:CommonClassBMemberus-gaap:CommonStockMember2018-12-310000891103us-gaap:AdditionalPaidInCapitalMember2018-12-310000891103us-gaap:RetainedEarningsMember2018-12-310000891103us-gaap:AccumulatedOtherComprehensiveIncomeMember2018-12-310000891103us-gaap:TreasuryStockMember2018-12-310000891103us-gaap:ParentMember2018-12-310000891103us-gaap:NoncontrollingInterestMember2018-12-3100008911032018-12-310000891103mtch:RedeemableNoncontrollingInterestMember2019-01-012019-12-310000891103us-gaap:RetainedEarningsMember2019-01-012019-12-310000891103us-gaap:ParentMember2019-01-012019-12-310000891103us-gaap:NoncontrollingInterestMember2019-01-012019-12-310000891103us-gaap:AccumulatedOtherComprehensiveIncomeMember2019-01-012019-12-310000891103us-gaap:AdditionalPaidInCapitalMember2019-01-012019-12-310000891103us-gaap:CommonStockMembermtch:FormerClassACommonStockMember2019-01-012019-12-310000891103us-gaap:AdditionalPaidInCapitalMembermtch:MatchGroupAndANGIHomeservicesMember2019-01-012019-12-310000891103us-gaap:ParentMembermtch:MatchGroupAndANGIHomeservicesMember2019-01-012019-12-310000891103mtch:MatchGroupAndANGIHomeservicesMember2019-01-012019-12-310000891103mtch:RedeemableNoncontrollingInterestMember2019-12-310000891103us-gaap:CommonClassAMemberus-gaap:CommonStockMember2019-12-310000891103us-gaap:CommonStockMembermtch:FormerClassACommonStockMember2019-12-310000891103us-gaap:CommonClassBMemberus-gaap:CommonStockMember2019-12-310000891103us-gaap:AdditionalPaidInCapitalMember2019-12-310000891103us-gaap:RetainedEarningsMember2019-12-310000891103us-gaap:AccumulatedOtherComprehensiveIncomeMember2019-12-310000891103us-gaap:TreasuryStockMember2019-12-310000891103us-gaap:ParentMember2019-12-310000891103us-gaap:NoncontrollingInterestMember2019-12-310000891103mtch:RedeemableNoncontrollingInterestMember2020-01-012020-12-310000891103us-gaap:RetainedEarningsMember2020-01-012020-12-310000891103us-gaap:ParentMember2020-01-012020-12-310000891103us-gaap:NoncontrollingInterestMember2020-01-012020-12-310000891103us-gaap:AccumulatedOtherComprehensiveIncomeMember2020-01-012020-12-310000891103us-gaap:AdditionalPaidInCapitalMember2020-01-012020-12-310000891103mtch:MatchGroupInc.Memberus-gaap:CommonClassAMemberus-gaap:CommonStockMember2020-01-012020-12-310000891103mtch:MatchGroupInc.Memberus-gaap:AdditionalPaidInCapitalMember2020-01-012020-12-310000891103mtch:MatchGroupInc.Memberus-gaap:ParentMember2020-01-012020-12-310000891103mtch:MatchGroupInc.Member2020-01-012020-12-310000891103us-gaap:CommonStockMembermtch:FormerClassACommonStockMembermtch:FormerIACMember2020-01-012020-12-310000891103us-gaap:AdditionalPaidInCapitalMembermtch:FormerIACMember2020-01-012020-12-310000891103us-gaap:ParentMembermtch:FormerIACMember2020-01-012020-12-310000891103mtch:FormerIACMember2020-01-012020-12-310000891103us-gaap:AdditionalPaidInCapitalMembermtch:MatchGroupAndANGIHomeservicesMember2020-01-012020-12-310000891103us-gaap:ParentMembermtch:MatchGroupAndANGIHomeservicesMember2020-01-012020-12-310000891103mtch:MatchGroupAndANGIHomeservicesMember2020-01-012020-12-310000891103us-gaap:CommonStockMembermtch:FormerClassACommonStockMember2020-01-012020-12-310000891103us-gaap:CommonClassBMemberus-gaap:CommonStockMember2020-01-012020-12-310000891103us-gaap:TreasuryStockMember2020-01-012020-12-310000891103us-gaap:CommonClassAMemberus-gaap:CommonStockMember2020-01-012020-12-310000891103mtch:RedeemableNoncontrollingInterestMember2020-12-310000891103us-gaap:CommonClassAMemberus-gaap:CommonStockMember2020-12-310000891103us-gaap:CommonStockMembermtch:FormerClassACommonStockMember2020-12-310000891103us-gaap:CommonClassBMemberus-gaap:CommonStockMember2020-12-310000891103us-gaap:AdditionalPaidInCapitalMember2020-12-310000891103us-gaap:RetainedEarningsMember2020-12-310000891103us-gaap:AccumulatedOtherComprehensiveIncomeMember2020-12-310000891103us-gaap:TreasuryStockMember2020-12-310000891103us-gaap:ParentMember2020-12-310000891103us-gaap:NoncontrollingInterestMember2020-12-310000891103us-gaap:SeniorNotesMember2020-01-012020-12-310000891103us-gaap:SeniorNotesMember2019-01-012019-12-310000891103us-gaap:SeniorNotesMember2018-01-012018-12-310000891103mtch:ExchangeableSeniorNotesMember2020-01-012020-12-310000891103mtch:ExchangeableSeniorNotesMember2019-01-012019-12-310000891103mtch:ExchangeableSeniorNotesMember2018-01-012018-12-31mtch:languangemtch:segment0000891103mtch:NewMatchCommonStockMember2020-01-012020-12-31mtch:app_storexbrli:pure0000891103mtch:AppStoreAMemberus-gaap:AccountsReceivableMemberus-gaap:CustomerConcentrationRiskMember2020-01-012020-12-310000891103mtch:AppStoreBMemberus-gaap:AccountsReceivableMemberus-gaap:CustomerConcentrationRiskMember2020-01-012020-12-310000891103mtch:AppStoreAMemberus-gaap:AccountsReceivableMemberus-gaap:CustomerConcentrationRiskMember2019-01-012019-12-310000891103mtch:AppStoreBMemberus-gaap:AccountsReceivableMemberus-gaap:CustomerConcentrationRiskMember2019-01-012019-12-310000891103us-gaap:SalesChannelDirectlyToConsumerMembersrt:NorthAmericaMember2020-01-012020-12-310000891103us-gaap:SalesChannelDirectlyToConsumerMembersrt:NorthAmericaMember2019-01-012019-12-310000891103us-gaap:SalesChannelDirectlyToConsumerMembersrt:NorthAmericaMember2018-01-012018-12-310000891103us-gaap:SalesChannelDirectlyToConsumerMemberus-gaap:NonUsMember2020-01-012020-12-310000891103us-gaap:SalesChannelDirectlyToConsumerMemberus-gaap:NonUsMember2019-01-012019-12-310000891103us-gaap:SalesChannelDirectlyToConsumerMemberus-gaap:NonUsMember2018-01-012018-12-310000891103us-gaap:SalesChannelDirectlyToConsumerMember2020-01-012020-12-310000891103us-gaap:SalesChannelDirectlyToConsumerMember2019-01-012019-12-310000891103us-gaap:SalesChannelDirectlyToConsumerMember2018-01-012018-12-310000891103us-gaap:SalesChannelThroughIntermediaryMember2020-01-012020-12-310000891103us-gaap:SalesChannelThroughIntermediaryMember2019-01-012019-12-310000891103us-gaap:SalesChannelThroughIntermediaryMember2018-01-012018-12-310000891103us-gaap:ServiceMember2020-01-012020-12-310000891103us-gaap:ServiceMember2019-01-012019-12-310000891103us-gaap:ServiceMember2018-01-012018-12-310000891103us-gaap:ProductAndServiceOtherMember2020-01-012020-12-310000891103us-gaap:ProductAndServiceOtherMember2019-01-012019-12-310000891103us-gaap:ProductAndServiceOtherMember2018-01-012018-12-310000891103us-gaap:BuildingAndBuildingImprovementsMembersrt:MinimumMember2020-01-012020-12-310000891103us-gaap:BuildingAndBuildingImprovementsMembersrt:MaximumMember2020-01-012020-12-310000891103mtch:ComputerEquipmentAndCapitalizedSoftwareMembersrt:MinimumMember2020-01-012020-12-310000891103mtch:ComputerEquipmentAndCapitalizedSoftwareMembersrt:MaximumMember2020-01-012020-12-310000891103mtch:FurnitureAndOtherEquipmentMember2020-01-012020-12-310000891103us-gaap:LeaseholdImprovementsMembersrt:MinimumMember2020-01-012020-12-310000891103us-gaap:LeaseholdImprovementsMembersrt:MaximumMember2020-01-012020-12-310000891103us-gaap:SoftwareAndSoftwareDevelopmentCostsMember2020-12-310000891103us-gaap:SoftwareAndSoftwareDevelopmentCostsMember2019-12-31mtch:unit0000891103us-gaap:MeasurementInputDiscountRateMemberus-gaap:IndefinitelivedIntangibleAssetsMembersrt:MinimumMember2020-12-310000891103us-gaap:MeasurementInputDiscountRateMemberus-gaap:IndefinitelivedIntangibleAssetsMembersrt:MaximumMember2020-12-310000891103us-gaap:MeasurementInputDiscountRateMemberus-gaap:IndefinitelivedIntangibleAssetsMembersrt:MinimumMember2019-12-310000891103us-gaap:MeasurementInputDiscountRateMemberus-gaap:IndefinitelivedIntangibleAssetsMembersrt:MaximumMember2019-12-310000891103us-gaap:IndefinitelivedIntangibleAssetsMembersrt:MinimumMember2020-01-012020-12-310000891103us-gaap:IndefinitelivedIntangibleAssetsMembersrt:MaximumMember2020-01-012020-12-310000891103us-gaap:IndefinitelivedIntangibleAssetsMembersrt:MinimumMember2019-01-012019-12-310000891103us-gaap:IndefinitelivedIntangibleAssetsMembersrt:MaximumMember2019-01-012019-12-310000891103srt:EuropeMemberus-gaap:TradeNamesMember2020-01-012020-12-310000891103srt:EuropeMemberus-gaap:TradeNamesMember2019-01-012019-12-310000891103us-gaap:AccumulatedTranslationAdjustmentMember2020-01-012020-12-310000891103us-gaap:AccumulatedTranslationAdjustmentMember2018-01-012018-12-310000891103us-gaap:AccumulatedTranslationAdjustmentMember2019-01-012019-12-310000891103us-gaap:ScenarioPlanMembermtch:AccountingStandardsUpdate202006Membersrt:RevisionOfPriorPeriodAccountingStandardsUpdateAdjustmentMember2020-01-012020-12-310000891103us-gaap:ScenarioPlanMembermtch:AccountingStandardsUpdate202006Membersrt:RevisionOfPriorPeriodAccountingStandardsUpdateAdjustmentMember2020-12-310000891103us-gaap:DomesticCountryMember2020-12-310000891103us-gaap:StateAndLocalJurisdictionMember2020-12-310000891103us-gaap:DomesticCountryMember2020-01-012020-12-310000891103us-gaap:StateAndLocalJurisdictionMembermtch:CarriedForwardIndefinitelyMember2020-01-012020-12-310000891103us-gaap:StateAndLocalJurisdictionMembermtch:ExpiresWithinTwentyYearsMember2020-01-012020-12-310000891103us-gaap:ForeignCountryMember2020-12-310000891103us-gaap:ForeignCountryMembermtch:CarriedForwardIndefinitelyMember2020-01-012020-12-310000891103mtch:ExpiresWithinTwentyYearsMemberus-gaap:ForeignCountryMember2020-01-012020-12-310000891103us-gaap:ResearchMember2020-12-310000891103mtch:ExpiresWithinTwentyYearsMember2020-12-310000891103us-gaap:ForeignCountryMemberus-gaap:GeneralBusinessMember2020-12-310000891103mtch:ExpiresWithinTenYearsMember2020-12-310000891103us-gaap:DiscontinuedOperationsDisposedOfBySaleMembermtch:IACInterActiveCorpMember2019-12-310000891103us-gaap:DiscontinuedOperationsDisposedOfBySaleMembermtch:IACInterActiveCorpMember2020-01-012020-12-310000891103us-gaap:DiscontinuedOperationsDisposedOfBySaleMembermtch:IACInterActiveCorpMember2019-01-012019-12-310000891103us-gaap:DiscontinuedOperationsDisposedOfBySaleMembermtch:IACInterActiveCorpMember2018-01-012018-12-310000891103us-gaap:TechnologyBasedIntangibleAssetsMember2020-12-310000891103us-gaap:TechnologyBasedIntangibleAssetsMember2020-01-012020-12-310000891103us-gaap:TradeNamesMember2020-12-310000891103us-gaap:OtherIntangibleAssetsMember2020-12-310000891103us-gaap:OtherIntangibleAssetsMember2020-01-012020-12-310000891103us-gaap:TechnologyBasedIntangibleAssetsMember2019-12-310000891103us-gaap:TechnologyBasedIntangibleAssetsMember2019-01-012019-12-310000891103us-gaap:TradeNamesMember2019-12-310000891103us-gaap:TradeNamesMember2019-01-012019-12-310000891103us-gaap:OtherIntangibleAssetsMember2019-12-310000891103us-gaap:OtherIntangibleAssetsMember2019-01-012019-12-310000891103us-gaap:FairValueInputsLevel1Memberus-gaap:MoneyMarketFundsMember2020-12-310000891103us-gaap:FairValueInputsLevel2Memberus-gaap:MoneyMarketFundsMember2020-12-310000891103us-gaap:MoneyMarketFundsMember2020-12-310000891103us-gaap:FairValueInputsLevel1Memberus-gaap:BankTimeDepositsMember2020-12-310000891103us-gaap:FairValueInputsLevel2Memberus-gaap:BankTimeDepositsMember2020-12-310000891103us-gaap:BankTimeDepositsMember2020-12-310000891103us-gaap:FairValueInputsLevel1Member2020-12-310000891103us-gaap:FairValueInputsLevel2Member2020-12-310000891103us-gaap:FairValueInputsLevel1Memberus-gaap:MoneyMarketFundsMember2019-12-310000891103us-gaap:FairValueInputsLevel2Memberus-gaap:MoneyMarketFundsMember2019-12-310000891103us-gaap:MoneyMarketFundsMember2019-12-310000891103us-gaap:FairValueInputsLevel1Memberus-gaap:BankTimeDepositsMember2019-12-310000891103us-gaap:FairValueInputsLevel2Memberus-gaap:BankTimeDepositsMember2019-12-310000891103us-gaap:BankTimeDepositsMember2019-12-310000891103us-gaap:FairValueInputsLevel1Member2019-12-310000891103us-gaap:FairValueInputsLevel2Member2019-12-310000891103us-gaap:CarryingReportedAmountFairValueDisclosureMember2020-12-310000891103us-gaap:EstimateOfFairValueFairValueDisclosureMember2020-12-310000891103us-gaap:CarryingReportedAmountFairValueDisclosureMember2019-12-310000891103us-gaap:EstimateOfFairValueFairValueDisclosureMember2019-12-310000891103mtch:CreditFacilityDueFebruary132025Memberus-gaap:LineOfCreditMember2020-12-310000891103mtch:CreditFacilityDueFebruary132025Memberus-gaap:LineOfCreditMember2019-12-310000891103mtch:TermLoanDueFebruary132027Memberus-gaap:LoansPayableMember2020-12-310000891103mtch:TermLoanDueFebruary132027Memberus-gaap:LoansPayableMember2019-12-310000891103mtch:A6.375SeniorNotesdueJune012024Memberus-gaap:SeniorNotesMember2020-12-310000891103mtch:A6.375SeniorNotesdueJune012024Memberus-gaap:SeniorNotesMember2019-12-310000891103mtch:A5.00SeniorNotesdueDecember152027Memberus-gaap:SeniorNotesMember2020-12-310000891103mtch:A5.00SeniorNotesdueDecember152027Memberus-gaap:SeniorNotesMember2019-12-310000891103mtch:A4625SeniorNotesDueJune12028Memberus-gaap:SeniorNotesMember2020-12-310000891103mtch:A4625SeniorNotesDueJune12028Memberus-gaap:SeniorNotesMember2019-12-310000891103us-gaap:SeniorNotesMembermtch:A5.625SeniorNotesdueFebruary152029Member2020-12-310000891103us-gaap:SeniorNotesMembermtch:A5.625SeniorNotesdueFebruary152029Member2019-12-310000891103us-gaap:SeniorNotesMembermtch:A4125SeniorNotesDueAugust012030Member2020-12-310000891103us-gaap:SeniorNotesMembermtch:A4125SeniorNotesDueAugust012030Member2019-12-310000891103us-gaap:SeniorNotesMembermtch:A0875ExchangeableSeniorNotesDueOctober12022Member2020-12-310000891103us-gaap:SeniorNotesMembermtch:A0875ExchangeableSeniorNotesDueOctober12022Member2019-12-310000891103mtch:A0875ExchangeableSeniorNotesDueJune152026Memberus-gaap:SeniorNotesMember2020-12-310000891103mtch:A0875ExchangeableSeniorNotesDueJune152026Memberus-gaap:SeniorNotesMember2019-12-310000891103us-gaap:SeniorNotesMembermtch:A200ExchangeableSeniorNotesDueJanuary152030Member2020-12-310000891103us-gaap:SeniorNotesMembermtch:A200ExchangeableSeniorNotesDueJanuary152030Member2019-12-310000891103mtch:TermLoanDueFebruary132027Memberus-gaap:LondonInterbankOfferedRateLIBORMemberus-gaap:LoansPayableMember2020-02-132020-02-1300008911032020-02-1200008911032020-02-1300008911032020-02-132020-02-130000891103us-gaap:LetterOfCreditMember2020-12-310000891103us-gaap:LetterOfCreditMember2019-12-310000891103mtch:CreditFacilityDueFebruary132025Memberus-gaap:LineOfCreditMember2020-01-012020-12-310000891103srt:MaximumMembermtch:CreditFacilityDueFebruary132025Memberus-gaap:LineOfCreditMember2020-01-012020-12-310000891103srt:MinimumMembermtch:CreditFacilityDueFebruary132025Memberus-gaap:LineOfCreditMember2020-01-012020-12-310000891103us-gaap:DebtInstrumentRedemptionPeriodOneMembermtch:A4625SeniorNotesDueJune12028Memberus-gaap:SeniorNotesMember2020-01-012020-12-310000891103us-gaap:DebtInstrumentRedemptionPeriodTwoMembermtch:A4625SeniorNotesDueJune12028Memberus-gaap:SeniorNotesMember2020-01-012020-12-310000891103us-gaap:DebtInstrumentRedemptionPeriodThreeMembermtch:A4625SeniorNotesDueJune12028Memberus-gaap:SeniorNotesMember2020-01-012020-12-310000891103us-gaap:DebtInstrumentRedemptionPeriodOneMemberus-gaap:SeniorNotesMembermtch:A4125SeniorNotesDueAugust012030Member2020-01-012020-12-310000891103us-gaap:DebtInstrumentRedemptionPeriodTwoMemberus-gaap:SeniorNotesMembermtch:A4125SeniorNotesDueAugust012030Member2020-01-012020-12-310000891103us-gaap:DebtInstrumentRedemptionPeriodThreeMemberus-gaap:SeniorNotesMembermtch:A4125SeniorNotesDueAugust012030Member2020-01-012020-12-310000891103us-gaap:DebtInstrumentRedemptionPeriodFourMemberus-gaap:SeniorNotesMembermtch:A4125SeniorNotesDueAugust012030Member2020-01-012020-12-310000891103us-gaap:DebtInstrumentRedemptionPeriodOneMemberus-gaap:SeniorNotesMembermtch:A5.625SeniorNotesdueFebruary152029Member2020-01-012020-12-310000891103us-gaap:DebtInstrumentRedemptionPeriodTwoMemberus-gaap:SeniorNotesMembermtch:A5.625SeniorNotesdueFebruary152029Member2020-01-012020-12-310000891103us-gaap:DebtInstrumentRedemptionPeriodThreeMemberus-gaap:SeniorNotesMembermtch:A5.625SeniorNotesdueFebruary152029Member2020-01-012020-12-310000891103us-gaap:DebtInstrumentRedemptionPeriodFourMemberus-gaap:SeniorNotesMembermtch:A5.625SeniorNotesdueFebruary152029Member2020-01-012020-12-310000891103mtch:A5.00SeniorNotesdueDecember152027Memberus-gaap:DebtInstrumentRedemptionPeriodOneMemberus-gaap:SeniorNotesMember2020-01-012020-12-310000891103mtch:A5.00SeniorNotesdueDecember152027Memberus-gaap:DebtInstrumentRedemptionPeriodTwoMemberus-gaap:SeniorNotesMember2020-01-012020-12-310000891103mtch:A5.00SeniorNotesdueDecember152027Memberus-gaap:DebtInstrumentRedemptionPeriodThreeMemberus-gaap:SeniorNotesMember2020-01-012020-12-310000891103mtch:A5.00SeniorNotesdueDecember152027Memberus-gaap:DebtInstrumentRedemptionPeriodFourMemberus-gaap:SeniorNotesMember2020-01-012020-12-310000891103mtch:A6.375SeniorNotesdueJune012024Memberus-gaap:SeniorNotesMember2020-06-110000891103srt:MaximumMemberus-gaap:SeniorNotesMember2020-01-012020-12-310000891103us-gaap:SeniorNotesMembermtch:A0875ExchangeableSeniorNotesDueOctober12022Member2017-12-310000891103us-gaap:SeniorNotesMembermtch:A0875ExchangeableSeniorNotesDueOctober12022Member2020-01-012020-12-310000891103mtch:A0875ExchangeableSeniorNotesDueJune152026Memberus-gaap:SeniorNotesMember2020-01-012020-12-310000891103us-gaap:SeniorNotesMembermtch:A200ExchangeableSeniorNotesDueJanuary152030Member2020-01-012020-12-31mtch:trading_day0000891103us-gaap:SeniorNotesMember2020-01-012020-12-310000891103us-gaap:SeniorNotesMembermtch:A0875ExchangeableSeniorNotesDueOctober12022Member2019-01-012019-12-310000891103mtch:A0875ExchangeableSeniorNotesDueOctober120220875ExchangeableSeniorNotesDueJune152026200ExchangeableSeniorNotesDueJanuary152030Membermtch:MatchGroupFinanceCo2IncMatchGroupFinanceCo3IncMemberus-gaap:SeniorNotesMember2020-01-012020-12-310000891103mtch:A0875ExchangeableSeniorNotesDueJune152026Memberus-gaap:SeniorNotesMember2019-01-012019-12-310000891103us-gaap:SeniorNotesMembermtch:A200ExchangeableSeniorNotesDueJanuary152030Member2019-01-012019-12-310000891103us-gaap:SeniorNotesMembermtch:A0875ExchangeableSeniorNotesDueOctober12022Member2018-01-012018-12-310000891103us-gaap:SeniorNotesMembermtch:A0875ExchangeableSeniorNotesDueOctober12022Membermtch:ExchangeableNotesHedgeMember2020-12-310000891103mtch:A0875ExchangeableSeniorNotesDueJune152026Memberus-gaap:SeniorNotesMembermtch:ExchangeableNotesHedgeMember2020-12-310000891103us-gaap:SeniorNotesMembermtch:A200ExchangeableSeniorNotesDueJanuary152030Membermtch:ExchangeableNotesHedgeMember2020-12-310000891103mtch:ExchangeableNotesWarrantMemberus-gaap:SeniorNotesMembermtch:A0875ExchangeableSeniorNotesDueOctober12022Member2020-12-310000891103mtch:A0875ExchangeableSeniorNotesDueJune152026Membermtch:ExchangeableNotesWarrantMemberus-gaap:SeniorNotesMember2020-12-310000891103mtch:ExchangeableNotesWarrantMemberus-gaap:SeniorNotesMembermtch:A200ExchangeableSeniorNotesDueJanuary152030Member2020-12-310000891103mtch:Series1MandatorilyExchangeablePreferredStockMember2020-12-310000891103mtch:Series2MandatorilyExchangeablePreferredStockMember2020-12-3100008911032020-07-012020-07-310000891103us-gaap:AccumulatedTranslationAdjustmentMember2019-12-310000891103us-gaap:AociGainLossDebtSecuritiesAvailableForSaleWithAllowanceForCreditLossParentMember2019-12-310000891103us-gaap:AociGainLossDebtSecuritiesAvailableForSaleWithAllowanceForCreditLossParentMember2020-01-012020-12-310000891103us-gaap:AccumulatedTranslationAdjustmentMember2020-12-310000891103us-gaap:AociGainLossDebtSecuritiesAvailableForSaleWithAllowanceForCreditLossParentMember2020-12-310000891103us-gaap:AccumulatedTranslationAdjustmentMember2018-12-310000891103us-gaap:AociGainLossDebtSecuritiesAvailableForSaleWithAllowanceForCreditLossParentMember2018-12-310000891103us-gaap:AociGainLossDebtSecuritiesAvailableForSaleWithAllowanceForCreditLossParentMember2019-01-012019-12-310000891103us-gaap:AccumulatedTranslationAdjustmentMember2017-12-310000891103us-gaap:AociGainLossDebtSecuritiesAvailableForSaleWithAllowanceForCreditLossParentMember2017-12-310000891103us-gaap:AociGainLossDebtSecuritiesAvailableForSaleWithAllowanceForCreditLossParentMember2018-01-012018-12-310000891103mtch:StockOptionsAndRestrictedStockUnitsMember2020-01-012020-12-310000891103mtch:StockOptionsAndRestrictedStockUnitsMember2019-01-012019-12-310000891103mtch:StockOptionsAndRestrictedStockUnitsMember2018-01-012018-12-310000891103mtch:MarketBasedAwardsAndPerformanceBasedOptionsAndUnitsMember2020-01-012020-12-310000891103mtch:MarketBasedAwardsAndPerformanceBasedOptionsAndUnitsMember2019-01-012019-12-310000891103mtch:MarketBasedAwardsAndPerformanceBasedOptionsAndUnitsMember2018-01-012018-12-310000891103mtch:MatchGroupInc.Memberus-gaap:SeniorNotesMembermtch:A0875ExchangeableSeniorNotesDueOctober12022Member2020-01-012020-12-310000891103mtch:MatchGroupInc.Membermtch:A0875ExchangeableSeniorNotesDueJune152026Memberus-gaap:SeniorNotesMember2020-01-012020-12-310000891103mtch:MatchGroupInc.Memberus-gaap:SeniorNotesMembermtch:A200ExchangeableSeniorNotesDueJanuary152030Member2020-01-012020-12-310000891103mtch:MatchGroupInc.Member2020-07-012020-12-310000891103us-gaap:SeniorNotesMembermtch:FormerIACMembermtch:A0875ExchangeableSeniorNotesDueOctober12022Member2020-01-012020-12-310000891103mtch:A0875ExchangeableSeniorNotesDueJune152026Memberus-gaap:SeniorNotesMembermtch:FormerIACMember2020-01-012020-12-310000891103us-gaap:SeniorNotesMembermtch:A200ExchangeableSeniorNotesDueJanuary152030Membermtch:FormerIACMember2020-01-012020-12-310000891103mtch:FormerIACMember2020-01-012020-06-300000891103mtch:ExchangeableNotesMembermtch:FormerIACMembermtch:A0875ExchangeableSeniorNotesDueOctober12022Member2020-01-012020-12-310000891103mtch:A0875ExchangeableSeniorNotesDueJune152026Membermtch:ExchangeableNotesMembermtch:FormerIACMember2020-01-012020-12-310000891103mtch:ExchangeableNotesMembermtch:A200ExchangeableSeniorNotesDueJanuary152030Membermtch:FormerIACMember2020-01-012020-12-310000891103mtch:FormerIACMember2019-01-012019-12-310000891103mtch:FormerIACMember2018-01-012018-12-310000891103mtch:ExchangeableNotesMembermtch:FormerIACMember2019-01-012019-12-310000891103mtch:ExchangeableNotesMembermtch:FormerIACMember2018-01-012018-12-31mtch:planmtch:installment0000891103us-gaap:EmployeeStockOptionMember2020-01-012020-12-310000891103us-gaap:RestrictedStockUnitsRSUMembersrt:MinimumMember2020-01-012020-12-310000891103srt:MaximumMemberus-gaap:RestrictedStockUnitsRSUMember2020-01-012020-12-310000891103srt:MinimumMembermtch:MarketBasedAwardsMember2020-01-012020-12-310000891103srt:MaximumMembermtch:MarketBasedAwardsMember2020-01-012020-12-3100008911032020-01-012020-06-300000891103mtch:PreSeparationMember2020-06-300000891103mtch:PostSeparationMember2020-06-300000891103mtch:AdoptionOfPlansMember2020-06-3000008911032020-07-012020-12-31mtch:stockOption0000891103mtch:IACInterActiveCorpMember2020-06-300000891103mtch:MatchGroupInc.Member2020-06-300000891103mtch:ExercisePriceRangeOneMember2020-01-012020-12-310000891103mtch:ExercisePriceRangeOneMember2020-12-310000891103mtch:ExercisePriceRangeTwoMember2020-01-012020-12-310000891103mtch:ExercisePriceRangeTwoMember2020-12-310000891103mtch:ExercisePriceRangeThreeMember2020-01-012020-12-310000891103mtch:ExercisePriceRangeThreeMember2020-12-310000891103mtch:ExercisePriceRangeFourMember2020-01-012020-12-310000891103mtch:ExercisePriceRangeFourMember2020-12-310000891103us-gaap:RestrictedStockUnitsRSUMember2019-12-310000891103us-gaap:PerformanceSharesMember2019-12-310000891103mtch:MarketBasedAwardsMember2019-12-310000891103us-gaap:RestrictedStockUnitsRSUMember2020-01-012020-06-300000891103us-gaap:PerformanceSharesMember2020-01-012020-06-300000891103mtch:MarketBasedAwardsMember2020-01-012020-06-300000891103us-gaap:RestrictedStockUnitsRSUMember2020-07-012020-12-310000891103us-gaap:PerformanceSharesMember2020-07-012020-12-310000891103mtch:MarketBasedAwardsMember2020-07-012020-12-310000891103us-gaap:RestrictedStockUnitsRSUMember2020-12-310000891103us-gaap:PerformanceSharesMember2020-12-310000891103mtch:MarketBasedAwardsMember2020-12-310000891103mtch:RestrictedStockUnitsandPerformanceStockUnitsMember2020-07-012020-12-310000891103country:US2020-01-012020-12-310000891103country:US2019-01-012019-12-310000891103country:US2018-01-012018-12-310000891103us-gaap:NonUsMember2020-01-012020-12-310000891103us-gaap:NonUsMember2019-01-012019-12-310000891103us-gaap:NonUsMember2018-01-012018-12-310000891103us-gaap:GeographicConcentrationRiskMembercountry:USus-gaap:SalesRevenueNetMember2020-01-012020-12-310000891103country:US2020-12-310000891103country:US2019-12-310000891103us-gaap:NonUsMember2020-12-310000891103us-gaap:NonUsMember2019-12-310000891103us-gaap:GeographicConcentrationRiskMembercountry:USus-gaap:PropertyPlantAndEquipmentMember2020-01-012020-12-310000891103us-gaap:PurchaseCommitmentMember2020-12-310000891103us-gaap:SuretyBondMember2020-12-31mtch:lawsuitmtch:plaintiff0000891103mtch:TinderOptionholderLitigationMember2018-08-142018-08-140000891103us-gaap:PendingLitigationMembermtch:TinderOptionholderLitigationMember2018-08-142018-08-140000891103mtch:TinderOptionholderLitigationMember2018-08-312018-08-310000891103mtch:TinderOptionholderLitigationMember2019-06-132019-06-130000891103mtch:TinderOptionholderLitigationMember2020-07-132020-07-13mtch:arbitration0000891103mtch:TinderOptionholderLitigationMember2020-09-032020-09-030000891103mtch:LeasingArrangementsMembersrt:AffiliatedEntityMember2020-01-012020-12-310000891103mtch:PassThroughTransactionsMembersrt:AffiliatedEntityMember2020-12-310000891103mtch:SeparationAgreementMembersrt:AffiliatedEntityMemberus-gaap:CommonStockMember2020-07-012020-07-310000891103mtch:TaxSharingAgreementMembersrt:AffiliatedEntityMember2020-12-310000891103us-gaap:OtherCurrentAssetsMembermtch:TaxSharingAgreementMembersrt:AffiliatedEntityMember2020-12-310000891103mtch:TaxSharingAgreementMemberus-gaap:OtherNoncurrentAssetsMembersrt:AffiliatedEntityMember2020-12-310000891103mtch:TaxSharingAgreementMembersrt:AffiliatedEntityMember2020-01-012020-12-310000891103mtch:TransitionServicesAgreementMembersrt:AffiliatedEntityMember2020-01-012020-12-310000891103mtch:EquityAwardTransactionsMembersrt:AffiliatedEntityMember2020-01-012020-12-310000891103mtch:EquityAwardTransactionsMembersrt:AffiliatedEntityMember2020-12-310000891103mtch:HealthAndWelfareAnd401kPlansMembersrt:AffiliatedEntityMember2020-01-012020-12-3100008911032019-07-012020-12-3100008911032019-01-012019-06-300000891103country:US2020-01-012020-12-310000891103country:US2019-01-012019-12-310000891103country:US2018-01-012018-12-310000891103us-gaap:ForeignPlanMember2020-01-012020-12-310000891103us-gaap:ForeignPlanMember2019-01-012019-12-310000891103us-gaap:ForeignPlanMember2018-01-012018-12-310000891103mtch:ComputerEquipmentAndCapitalizedSoftwareMember2020-12-310000891103mtch:ComputerEquipmentAndCapitalizedSoftwareMember2019-12-310000891103us-gaap:BuildingAndBuildingImprovementsMember2020-12-310000891103us-gaap:BuildingAndBuildingImprovementsMember2019-12-310000891103us-gaap:LandMember2020-12-310000891103us-gaap:LandMember2019-12-310000891103mtch:FurnitureAndOtherEquipmentMember2020-12-310000891103mtch:FurnitureAndOtherEquipmentMember2019-12-310000891103us-gaap:ConstructionInProgressMember2020-12-310000891103us-gaap:ConstructionInProgressMember2019-12-3100008911032020-01-012020-03-3100008911032020-04-012020-06-3000008911032020-07-012020-09-3000008911032020-10-012020-12-3100008911032019-01-012019-03-3100008911032019-04-012019-06-3000008911032019-07-012019-09-3000008911032019-10-012019-12-310000891103mtch:HyperconnectMemberus-gaap:SubsequentEventMember2021-02-280000891103mtch:HyperconnectMembersrt:MaximumMemberus-gaap:SubsequentEventMember2021-02-280000891103us-gaap:AllowanceForCreditLossMember2019-12-310000891103us-gaap:AllowanceForCreditLossMember2020-01-012020-12-310000891103us-gaap:AllowanceForCreditLossMember2020-12-310000891103us-gaap:ValuationAllowanceOfDeferredTaxAssetsMember2019-12-310000891103us-gaap:ValuationAllowanceOfDeferredTaxAssetsMember2020-01-012020-12-310000891103us-gaap:ValuationAllowanceOfDeferredTaxAssetsMember2020-12-310000891103mtch:OtherReservesMember2019-12-310000891103mtch:OtherReservesMember2020-12-310000891103us-gaap:AllowanceForCreditLossMember2018-12-310000891103us-gaap:AllowanceForCreditLossMember2019-01-012019-12-310000891103us-gaap:ValuationAllowanceOfDeferredTaxAssetsMember2018-12-310000891103us-gaap:ValuationAllowanceOfDeferredTaxAssetsMember2019-01-012019-12-310000891103mtch:OtherReservesMember2018-12-310000891103us-gaap:AllowanceForCreditLossMember2017-12-310000891103us-gaap:AllowanceForCreditLossMember2018-01-012018-12-310000891103us-gaap:ValuationAllowanceOfDeferredTaxAssetsMember2017-12-310000891103us-gaap:ValuationAllowanceOfDeferredTaxAssetsMember2018-01-012018-12-310000891103mtch:OtherReservesMember2017-12-31
As filed with the Securities and Exchange Commission on February 25, 2021
UNITED STATES
SECURITIES AND EXCHANGE COMMISSION
Washington, D.C. 20549
FORM 10-K
| | | | | | | | |
| ☑ | ANNUAL REPORT PURSUANT TO SECTION 13 OR 15(d) OF THE SECURITIES EXCHANGE ACT OF 1934 |
| For the Fiscal Year Ended | December 31, 2020 |
| Or |
| ☐ | TRANSITION REPORT PURSUANT TO SECTION 13 OR 15(d) OF THE SECURITIES EXCHANGE ACT OF 1934 |
| For the transition period from__________to__________ |
Commission File No. 001-34148
Match Group, Inc.
(Exact name of registrant as specified in its charter)
| | | | | | | | |
Delaware | | 59-2712887 |
| (State or other jurisdiction of incorporation or organization) | | (I.R.S. Employer Identification No.) |
8750 North Central Expressway, Suite 1400, Dallas, Texas 75231
(Address of Registrant’s principal executive offices and zip code)
(214) 576-9352
(Registrant’s telephone number, including area code)
Securities registered pursuant to Section 12(b) of the Act:
| | | | | | | | | | | | | | |
Title of each class | | Trading Symbol | | Name of exchange on which registered |
| Common Stock, par value $0.001 | | MTCH | | The Nasdaq Global Market LLC |
| | | | (Nasdaq Global Select Market) |
Securities registered pursuant to Section 12(g) of the Act:
None
Indicate by check mark if the Registrant is a well-known seasoned issuer, as defined in Rule 405 of the Securities Act. Yes ☑ No ☐
Indicate by check mark if the Registrant is not required to file reports pursuant to Section 13 or 15(d) of the Act. Yes ☐ No ☑
Indicate by check mark whether the Registrant (1) has filed all reports required to be filed by Section 13 or 15(d) of the Securities Exchange Act of 1934 during the preceding 12 months (or for such shorter period that the Registrant was required to file such reports) and (2) has been subject to such filing requirements for the past 90 days. Yes ☑ No ☐
Indicate by check mark whether the Registrant has submitted electronically every Interactive Data File required to be submitted pursuant to Rule 405 of Regulation S-T (§232.405 of this chapter) during the preceding 12 months (or for such shorter period that the Registrant was required to submit such files). Yes ☑ No ☐
Indicate by check mark whether the Registrant is a large accelerated filer, an accelerated filer, a non-accelerated filer, smaller reporting company, or an emerging growth company. See the definitions of “large accelerated filer,” “accelerated filer,” “smaller reporting company,” and “emerging growth company” in Rule 12b-2 of the Exchange Act.
| | | | | | | | | | | | | | | | | | | | | | | | | | | | | | | | | | | | | | | | | |
| Large accelerated filer | ☑ | | Accelerated filer | ☐ | | Non-accelerated filer | ☐ | | Smaller reporting company | ☐ | | Emerging growth company | ☐ |
If an emerging growth company, indicate by check mark if the registrant has elected not to use the extended transition period for complying with any new or revised financial accounting standards provided pursuant to Section 13(a) of the Exchange Act. ☐
Indicate by check mark whether the registrant has filed a report on and attestation to its management's assessment of the effectiveness of its internal controls over financial reporting under Section 404(b) of the Sarbanes-Oxley Act (15 U.S.C. 7262(b)) by the registered public accounting firm that prepared or issued its audit report. ☑
Indicate by check mark whether the Registrant is a shell company (as defined in Rule 12b-2 of the Exchange Act). Yes ☐ No ☑
As of February 22, 2021, there were 268,971,789 shares of common stock outstanding.
The aggregate market value of the voting common stock held by non-affiliates of the registrant as of June 30, 2020 was $25,004,429,888. For the purpose of the foregoing calculation only, shares held by all directors and executive officers of the registrant are assumed to be held by affiliates of the registrant.
Documents Incorporated By Reference:
Portions of Part III of this Annual Report are incorporated by reference to the Registrant’s proxy statement for its 2021 Annual Meeting of Stockholders.
TABLE OF CONTENTS
Cautionary Statement Regarding Forward-Looking Information
This annual report on Form 10-K contains “forward-looking statements” within the meaning of the Private Securities Litigation Reform Act of 1995. The use of words such as “anticipates,” “estimates,” “expects,” “plans” and “believes,” among others, generally identify forward-looking statements. These forward-looking statements include, among others, statements relating to: Match Group’s future financial performance, Match Group’s business prospects and strategy, anticipated trends and prospects in the industries in which Match Group’s businesses operate and other similar matters. These forward-looking statements are based on Match Group management’s current expectations and assumptions about future events as of the date of this annual report, which are inherently subject to uncertainties, risks and changes in circumstances that are difficult to predict.
Actual results could differ materially from those contained in these forward-looking statements for a variety of reasons, including, among others: the risk factors set forth in “Item 1A—Risk Factors.” Other unknown or unpredictable factors that could also adversely affect Match Group’s business, financial condition and results of operations may arise from time to time. In light of these risks and uncertainties, these forward-looking statements discussed in this annual report may not prove to be accurate. Accordingly, you should not place undue reliance on these forward-looking statements, which only reflect the views of Match Group management as of the date of this annual report. Match Group does not undertake to update these forward-looking statements.
PART I
Item 1. Business
Who we are
Match Group, Inc., through its portfolio companies, is a leading provider of dating products available globally. Our portfolio of brands includes Tinder®, Match®, Meetic®, OkCupid®, Hinge®, Pairs™, PlentyOfFish®, and OurTime®, as well as a number of other brands, each designed to increase our users’ likelihood of finding a meaningful connection. Through our portfolio companies and their trusted brands, we provide tailored products to meet the varying preferences of our users. Our products are available in over 40 languages to our users all over the world.
As used herein, “Match Group,” the “Company,” “we,” “our,” “us,” and similar terms refer to Match Group, Inc. and its subsidiaries after the completion of the Separation (defined below), unless the context indicates otherwise.
Separation of Match Group and IAC
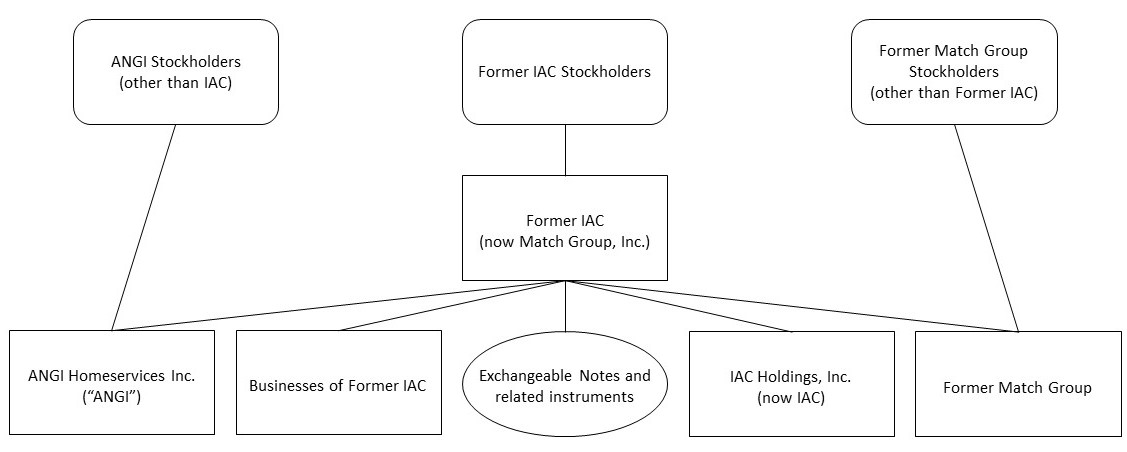
On June 30, 2020, the companies formerly known as Match Group, Inc. (referred to as “Former Match Group”) and IAC/InterActiveCorp (referred to as “Former IAC”) completed the separation of the Company from IAC through a series of transactions that resulted in two, separate public companies—(1) Match Group, which consists of the businesses of Former Match Group and certain financing subsidiaries previously owned by Former IAC, and (2) IAC/InterActiveCorp, formerly known as IAC Holdings, Inc. (“IAC”), consisting of Former IAC’s businesses other than Match Group (the “Separation”).
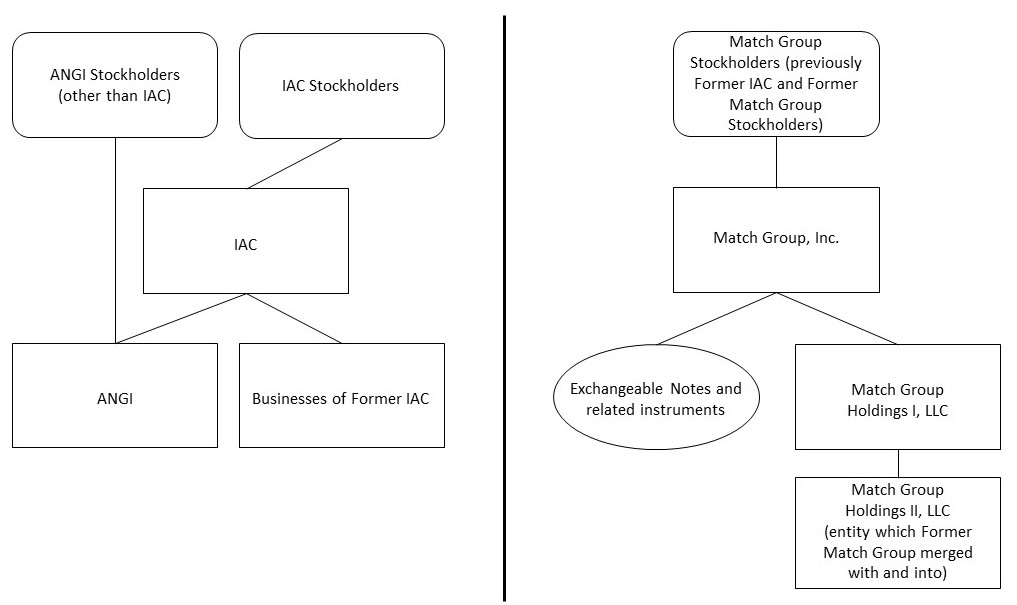
The following diagram illustrates the simplified organizational and ownership structure immediately prior to the Separation.
Under the terms of the Transaction Agreement (the “Transaction Agreement”) dated as of December 19, 2019 and amended as of April 28, 2020 and as further amended as of June 22, 2020, Former Match Group merged with and into Match Group Holdings II, LLC (“MG Holdings II”), an indirect wholly-owned subsidiary of Match Group, with MG Holdings II surviving the merger as an indirect wholly-owned subsidiary of Match Group. Former Match Group stockholders (other than Former IAC) received, through the merger, in exchange for each outstanding share of Former Match Group common stock that they held, one share of Match Group common stock and, at the holder’s election, either (i) $3.00 in cash or (ii) a fraction of a share of Match Group common stock with a value of $3.00 (calculated pursuant to the Transaction Agreement). As a result of the merger and other transactions contemplated by the Transaction Agreement, Former Match Group stockholders (other than Former IAC) became stockholders of the Company.
The following diagram illustrates the simplified organizational and ownership structure of IAC and Match Group immediately after the Separation.
The Company was incorporated in 1986 in Delaware and underwent many name changes before becoming IAC/InterActiveCorp prior to the Separation described above. Former Match Group completed an initial public offering in 2015 and had operated as a stand-alone public company since that time. Upon the Separation described above, the Company changed its name to Match Group, Inc.
The business of creating meaningful connections
Our goal is to spark meaningful connections for users around the world. Consumers’ dating preferences vary significantly, influenced in part by demographics, geography, cultural norms, religion, and intent (for example, seeking casual dating or more serious relationships). As a result, the market for dating products is fragmented, and no single product has been able to effectively serve the dating category as a whole.
Prior to the proliferation of the internet and mobile devices, human connections traditionally were limited by social circles, geography, and time. People met through work colleagues, friends and family, in school, at church, at social gatherings, in bars and restaurants, or in other social settings. Today, the adoption of mobile technology and the internet has significantly expanded the ways in which people can build relationships, create new interactions, and develop meaningful connections. Additionally, the ongoing adoption of technology into more aspects of daily life continues to further erode biases and stigmas across the world that previously served as barriers to individuals using technology to help find and develop those connections.
We believe that dating products serve as a natural extension of the traditional means of meeting people and provide a number of benefits for their users, including:
•Expanded options: Dating products provide users access to a large pool of people they otherwise would not have a chance to meet.
•Efficiency: The search and matching features, as well as the profile information available on dating products, allow users to filter a large number of individuals in a short period of time, increasing the likelihood that users will make a connection with someone.
•More comfort and control: Compared to the traditional ways that people meet, dating products provide an environment that reduces the awkwardness around identifying and reaching out to new people who are interested in connecting. This leads to many people who would otherwise be passive participants in the dating process taking a more active role.
•Safely meet new people: Dating products can offer a safer way to contact new people for the first-time by limiting the amount of personal information exchanged and providing an opportunity to vet a new connection before meeting in person, including via video communication.
•Convenience: The nature of the internet and the proliferation of mobile devices allow users to connect with new people at any time, regardless of where they are.
Depending on a person’s circumstances at any given time, dating products can act as a supplement to, or substitute for, traditional means of meeting people. When selecting a dating product, we believe that users consider the following attributes:
•Brand recognition and scale: Brand is very important. Users generally associate strong dating brands with a higher likelihood of success and more tools to help the user date safely and securely. Generally, successful dating brands depend on large, active communities of users, strong algorithmic filtering technology, and awareness of successful usage among similar users.
•Successful experiences: Demonstrated success of other users attracts new users through word-of-mouth recommendations. Successful experiences also drive repeat usage.
•Community identification: Users typically look for dating products that offer a community or communities with which the user can relate. By selecting a dating product that is focused on a particular demographic, religion, geography, or intent, users can increase the likelihood that they will make a connection with someone with whom they identify.
•Product features and user experience: Users tend to gravitate towards dating products that offer features and user experiences that resonate with them, such as question-based matching algorithms, location-based features, or search capabilities. User experience is also driven by the type of user interface (for example, using our patented Swipe® technology versus scrolling), a particular mix of free and paid features, ease of use, privacy, and security. Users expect every interaction with a dating product to be seamless and intuitive.
Given varying consumer preferences, we have adopted a brand portfolio approach, through which we attempt to offer dating products that collectively appeal to the broadest spectrum of consumers. We believe that this approach maximizes our ability to capture additional users.
Our portfolio
Dating is a highly personal endeavor and consumers have a wide variety of preferences that determine what type of dating product they choose. As a result, our strategy focuses on a portfolio approach of various brands in order to reach a broad range of users. Many of our brands have a long legacy, while others emerged during the time when mobile devices proliferated. The following is a list of our key brands:
Tinder. Tinder, incubated at the Company, was launched in 2012 and has since risen to scale and popularity faster than any other product in the online dating category, growing to over 6.7 million average subscribers as of the fourth quarter of 2020. Tinder’s patented Swipe technology has led to significant adoption, particularly among 18 to 30 year-old users, who were previously underserved by the online dating category. Tinder employs a freemium model, through which users are allowed to enjoy many of the core features of Tinder for free, including limited use of the Swipe Right® feature with unlimited communication with other users. However, to enjoy premium features, such as unlimited use of the Swipe Right feature, a Tinder user must subscribe to one of several subscription offerings: Tinder Plus®, launched in early 2015; Tinder Gold™, which was launched in late summer 2017; or Tinder Platinum™, launched in late 2020. Tinder users and subscribers may also pay for certain premium features, such as Super Likes™ and Boosts, on a pay-per-use basis. In 2020, Tinder launched Face to Face, a one-to-one real time video feature allowing users to connect in a new way within the app.
Match. Match was launched in 1995 and helped create the online dating category with the ability to search profiles and receive algorithmic matches. Match remains the most recognized dating app for singles over age 35
in the United States. In 2020, Match introduced a softer paywall to allow limited free access to messaging and other features before requiring a subscription and also introduced a one-to-one real-time video feature. Additionally, Match offers its subscribers a higher level of service than most of our other brands, including access to date coaching services and profile reviews. Match is a brand that focuses on users with a higher level of intent to enter into a serious relationship and its product and marketing are designed to reinforce that purpose.
Meetic. Meetic, a leading European online dating brand based in France, was launched in 2001. Meetic is the most recognized dating app for singles over age 35 in Europe. Meetic is a brand that focuses on users with a higher level of intent to enter into a serious relationship and its product and marketing are designed to reinforce that purpose. In 2020, Meetic also launched a one-to-one real-time video feature.
OkCupid. OkCupid was launched in 2004 and has attracted users through a Q&A approach to the dating category. OkCupid relies on a freemium model and has a loyal, culturally progressive user base predominately located in larger metropolitan areas in English-speaking markets, with an increasing presence in other global markets such as India and Israel.
Hinge. Hinge was launched in 2012 and has grown to be a popular app for relationship-minded individuals, particularly among the millennial and younger generations, in the United States and the United Kingdom. Hinge is a mobile-only experience and employs a freemium model. Hinge focuses on users with a higher level of intent to enter into a serious relationship and its product is designed to reinforce that purpose.
Pairs. Pairs was launched in 2012 and is a leading provider of dating products in Japan, with a presence in Taiwan and South Korea. Pairs is a dating app that was specifically designed to address social barriers generally associated with the use of dating products in Eastern Asian countries, particularly Japan.
PlentyOfFish. PlentyOfFish was launched in 2003. Among its distinguishing features is the ability to both search profiles and receive algorithmic matches. PlentyOfFish has grown in popularity over the years and relies on a freemium model. PlentyOfFish has broad appeal in the central United States, Canada, the United Kingdom, and a number of other international markets. In 2020, PlentyOfFish launched POF Live™, a one-to-many live streaming video feature that allows users to engage with other users at PlentyOfFish in a new and different format from traditional dating profiles.
OurTime. OurTime is the largest community of singles over age 50 of any dating product. We offer this product in the United States and a number of European markets.
In addition to the brands above, our portfolio includes brands such as Chispa, BLK, and Upward, each of which brings the Swipe feature made popular by Tinder to the Latino, Black, and Christian communities, respectively. Our Hawaya brand focuses on the dating needs of the Muslim community globally by incorporating unique cultural aspects of dating in this community into its product design and feature sets. Ablo is a one-to-one video and text chat product that brings together people from all over the world with real-time translations allowing social discovery across language barriers.
We strive to empower individual brand leaders with the authority and incentives to grow their respective brand. Our brands compete with each other and with third-party dating businesses on brand characteristics, product features, and business model.
We also work to apply a centralized discipline to our portfolio of brands, by sharing best practices across our brands in order to increase growth, reduce costs, improve user safety, and maximize profitability. Additionally, we centralize certain other administrative functions, such as legal, trust and safety, human resources, accounting, finance, and tax. This approach allows us to quickly introduce new products and features, optimize marketing strategies, and more effectively deploy talent across our organization. We attempt to centrally facilitate excellence and efficiency across the entire portfolio by:
•centralizing operational functions across certain brands where we have strength in personnel and sufficient commonality of business interest (for example, ad sales, online marketing, and information technology are centralized across some, but not all, brands);
•developing talent across the portfolio to allow for development of specific proficiencies and promoting career advancement while giving us the ability to deploy the best talent in the most critical positions across the company at any given time; and
•sharing analytics and similar data to leverage product and marketing successes across our businesses rapidly for competitive advantage.
Staying competitive
The dating industry is competitive and has no single, dominant brand globally. We compete with a number of other companies that provide similar dating and matchmaking products. In addition to these other dating brands, we also compete with social media platforms; social-discovery apps; offline dating services, such as in-person matchmakers; and other traditional means of meeting people.
We believe that our ability to attract new users to our brands will depend primarily upon the following factors:
•our ability to continue to increase consumer acceptance and adoption of dating products, particularly in emerging markets and other parts of the world where the associated stigma is only beginning to erode;
•continued growth in internet access and smart phone adoption in certain regions of the world, particularly emerging markets;
•the continued strength of our established brands and the growth of our newer brands;
•the breadth and depth of our active communities of users;
•our brands’ reputation for trust and safety;
•our ability to evolve our products to keep up with user requirements, social trends, and the ever-evolving technological landscape;
•our products’ ability to keep up with the constantly changing regulatory landscape, in particular, as it relates to the regulation of consumer digital media platforms;
•our ability to efficiently acquire new users for our products;
•our ability to continue to optimize our monetization strategies; and
•the design and functionality of our products.
A large portion of dating customers use multiple products over a given period of time, either concurrently or sequentially, making our broad portfolio of brands a competitive advantage.
Where we earn our revenue
All our products enable users to establish a profile and review other users’ profiles without charge. Each product also offers additional features, some of which are free, and some of which require payment depending on the particular product. In general, access to premium features requires a subscription, which is typically offered in packages (primarily ranging from one month to six months), depending on the product and circumstance. Prices differ meaningfully within a given brand depending on the duration of a subscription, the bundle of paid features that a user chooses to access, and whether or not a Subscriber is taking advantage of any special offers. In addition to subscriptions, many of our products offer users certain features, such as the ability to promote themselves for a given period of time, or highlight themselves to a specific user, and these features are offered on a pay-per-use, or à la carte, basis. The precise mix of paid and premium features is established over time on a brand-by-brand basis and is constantly subject to iteration and evolution.
Our direct revenue is primarily derived from users in the form of recurring subscriptions, which typically provide unlimited access to a bundle of features for a specific period of time, and to a lesser extent from à la carte features, where users pay a non-recurring fee for a specific consumable benefit or feature. Each of our brands offers a combination of free and paid features targeted to its own unique community. In addition to direct revenue from our users, we generate indirect revenue from advertising, which makes up a much smaller percentage of our overall revenue as compared to direct revenue.
Dependencies on services provided by others
App Stores
We fully rely on the Apple App Store and the Google Play Store to distribute our mobile applications and related in-app products. While our mobile applications are generally free to download from these stores, we offer our users the opportunity to purchase subscriptions and certain à la carte features through these applications. We determine the prices at which these subscriptions and features are sold; however, purchases of these subscriptions and features are required in most cases to be processed through the in-app payment systems provided by Apple and Google. Due to these requirements, we pay Apple and Google, as applicable, a meaningful share (generally 30%) of the revenue we receive from these transactions.
Additionally, when our users and subscribers access and pay through the app stores, the platforms may receive personal data about our users and subscribers that we would otherwise receive if we transacted with our users and subscribers directly. The platforms have restricted our access to much of that data.
Both Apple and Google have broad discretion to change their respective terms and conditions applicable to the distribution of our applications, including the amount of, and requirement to pay, certain fees associated with purchases required to be facilitated by Apple and Google through our applications, and to interpret their respective terms and conditions in ways that may limit, eliminate or otherwise interfere with our ability to distribute our applications through their stores, the features we provide, the manner in which we market our in-app products, and our ability to access information about our users and subscribers that they collect. Apple or Google could also make changes to their operating systems or payment services that could negatively impact our business, including by unilaterally raising the prices for those services.
Cloud Services
We rely on third parties, primarily data center service providers and cloud-based, hosted web service providers, such as Amazon Web Services, as well as third party computer systems, broadband and other communications systems and service providers, in connection with the provision of our products generally, as well as to facilitate and process certain transactions with our users. We have no control over any of these third parties or their operations.
Problems experienced by third-party data center service providers and cloud-based, hosted web service providers, such as Amazon Web Services, upon which brands including Tinder, Pairs, and Hinge rely, the telecommunications network providers with which we or they contract, or with the systems through which telecommunications providers allocate capacity among their customers could also adversely affect us. Any changes in service levels at our data centers or hosted web service providers, such as Amazon Web Services, or any interruptions, outages or delays in our systems or those of our third party providers, or deterioration in the performance of these systems, could impair our ability to provide our products or process transactions with our users, which would adversely impact our business, financial condition and results of operations.
Sales and marketing
All of our brands rely on word-of-mouth, or free, user acquisition to varying degrees. Other brands rely on paid user acquisition for a significant percentage of their users. Our online marketing activities generally consist of purchasing social media advertising, banner, and other display advertising, search engine marketing, email campaigns, video advertising, business development or partnership deals, creating content, and partnering with influencers to promote our products. Our offline marketing activities generally consist of television advertising, out-of-home advertising, and public relations efforts.
Intellectual property
We regard our intellectual property rights, including trademarks, domain names and other intellectual property, as critical to our success.
For example, we rely heavily upon the use of trademarks (primarily Tinder, Match, PlentyOfFish, OkCupid, Meetic, OurTime, Pairs, and Hinge, and associated domain names, taglines and logos) to market our products and applications and build and maintain brand loyalty and recognition. We have an ongoing trademark and service mark registration program, pursuant to which we register our brand names, product names, taglines and
logos and renew existing trademark and service mark registrations in the United States and other jurisdictions to the extent we determine it to be necessary or otherwise appropriate and cost-effective. In addition, we have a trademark and service mark monitoring policy pursuant to which we monitor applications filed by third parties to register trademarks and service marks that may be confusingly similar to ours, as well as potential unauthorized use of our material trademarks and service marks. Our enforcement of this policy affords us valuable protection under current laws, rules and regulations. We also reserve and file registrations (to the extent available) and renew existing registrations for domain names that we believe are material to our business.
We also rely upon a combination of in-licensed third-party and proprietary trade secrets, including proprietary algorithms, and upon patented and patent-pending technologies, processes, and features relating to our matching process systems or features, products, and services with expiration dates from 2023 to 2036. We have an ongoing invention recognition program pursuant to which we apply for patents to the extent we determine it to be core to our product or businesses or otherwise appropriate and cost-effective.
We rely on a combination of internal and external controls, including applicable laws, rules and regulations, and contractual restrictions with employees, contractors, customers, suppliers, affiliates and others, to establish, protect and otherwise control access to our various intellectual property rights.
Government regulation
We are subject to a variety of laws and regulations in the United States and abroad that involve matters that are important to or may otherwise impact our business, including, among others, broadband internet access, online commerce, advertising, user privacy, data protection, intermediary liability, protection of minors, consumer protection, general safety, sex-trafficking, taxation and securities law compliance. As a result, we could be subject to actions based on negligence, regulatory compliance, various torts, and trademark and copyright infringement, among other actions. See “Risk factors—Risks relating to our business—Our business is subject to complex and evolving U.S. and international laws and regulations, including with respect to data privacy and platform liability. These laws and regulations are subject to change and uncertain interpretation, and could result in changes to our business practices, increased cost of operations, declines in user growth or engagement, claims, monetary penalties, or otherwise harm our business” and “—Risks relating to our business—We may fail to adequately protect our intellectual property rights or may be accused of infringing the intellectual property rights of third parties.”
Because we receive, store, and use a substantial amount of information received from or generated by our users, we are particularly impacted by laws and regulations governing privacy; the storage, sharing, use, processing, disclosure, and protection of personal data; and data breaches, in many of the countries in which we operate. For example, in 2016, the European Commission adopted the General Data Protection Act (which we refer to as “GDPR”), a comprehensive EU privacy and data protection reform that became effective in May 2018. The act applies to companies established in the EU or otherwise providing services or monitoring the behavior of people located in the EU and provides for significant penalties in case of non-compliance as well as a private right of action for individual claimants. GDPR will continue to be interpreted by EU data protection regulators, which have and may in the future require that we make changes to our business practices, and could generate additional costs, risks, and liabilities. The EU is also considering an update to its Privacy and Electronic Communications (so-called “e-Privacy”) Directive, notably to amend rules on the use of cookies, direct marketing and processing of private communications and related metadata, which may also require that we make changes to our business practices and could generate additional costs, risks and liabilities. In July 2020, the Court of Justice of the EU declared transfers of personal data on the basis of the European Commission’s Privacy Shield Decision illegal and stipulated stricter requirements for the transfer of personal data based on standard contract clauses. This judgement and the resulting decisions and guidelines from EU supervisory authorities may require changes to our business practices and generate additional costs, risks and liabilities. Brexit could result in the application of new and conflicting data privacy and protection laws and standards to our operations in the United Kingdom and our handling of personal data of users located in the United Kingdom. At the same time, many countries in which we do business have already adopted or are also currently considering adopting privacy and data protection laws and regulations. Multiple legislative proposals concerning privacy and the protection of user information have been introduced in the U.S. Congress. Various U.S. state legislatures, including those in New York, Illinois, California, and many other states, are considering privacy legislation in 2021. Other U.S. state
legislatures have already passed and enacted privacy legislation, most prominently the California Consumer Privacy Act of 2018, which was signed into law in June 2018 and came into effect on January 1, 2020, with full enforcement commencing on June 30, 2020. On November 3, 2020 the “California Privacy Rights Act of 2020” (CPRA) was enacted, which expands the state’s consumer privacy laws and creates a new government organization, the California Privacy Protection Agency (CPPA), to enforce the law. The majority of the CPRA’s provisions will enter into force on January 1, 2023, with a lookback to January 2022. Additionally, the Federal Trade Commission has increased its focus on privacy and data security practices at digital companies, as evidenced by its levying, in July 2019, of a first-of-its kind, $5 billion fine against Facebook for privacy violations. Finally, talks of a U.S. federal privacy law are ongoing in Congress, with multiple proposals having been made already, and may lead to the passing of a new law in 2021 or the coming years.
Concerns about harms and the use of dating products and social networking platforms for illegal conduct, such as romance scams, promotion of false or inaccurate information, financial fraud, and sex-trafficking, have produced and could continue to produce future legislation or other governmental action. For example, in January 2020, the Oversight Subcommittee on Economic and Consumer Policy of the U.S. House of Representatives launched an investigation into the online dating industry’s user safety policies, including certain practices of Match Group’s businesses relating to the identification and removal of registered sex offenders and underage individuals from our platforms. The EU and the United Kingdom are also considering new legislation on this topic, with the United Kingdom having released its Online Harms White Paper and the EU introducing the Digital Services Act, which in each case, would expose platforms to similar or more expansive liability. In the United States, government authorities, elected officials, and political candidates have called for amendments to Section 230 of the Communications Decency Act that would purport to limit or remove protections afforded interactive computer service providers. Proposed legislation includes the EARN IT Act, the PACT Act, the BAD ADS Act, the SAFE TECH Act, and others. If these proposed laws are passed, or if future legislation or governmental action is proposed or taken to address concerns regarding such harms, changes could be required to our products that could restrict or impose additional costs upon the conduct of our business generally or cause users to abandon our products. See “Risk factors—Risks relating to our business—Inappropriate actions by certain of our users could be attributed to us and damage our brands’ reputations, which in turn could adversely affect our business.”
Our global businesses are subject to a variety of complex and continuously evolving income and other tax frameworks. For example, the Organization for Economic Co-Operation and Development (“OECD”) is revising its recommendations on how to tax international businesses, including expanding the jurisdiction of member countries to tax businesses based on some level of digital presence and subjecting these companies to a minimum tax. Also, the European Commission, as well as several countries both inside and outside the EU, have recently adopted or considered proposals that would change various aspects of the current tax framework under which we are taxed, including proposals to change or impose new types of non-income taxes, including taxes based on a percentage of revenue.
As the provider of dating products with a subscription-based element, we are also subject to laws and regulations in certain U.S. states and other countries that apply to our automatically-renewing subscription payment models. For example, the EU’s Payment Services Directive (PSD2), which became effective in 2018, could impact our ability to process auto-renewal payments or offer promotional or differentiated pricing for users in the EU. Similar legislation or regulation, or changes to existing legislation or regulation governing subscription payments, are being considered in many U.S. states.
Finally, certain U.S. states and certain countries in the Middle East and Asia have laws that specifically govern dating services.
Human talent
Our people are critical to Match Group’s continued success and we work hard to attract, retain and motivate qualified talent. As of December 31, 2020, we had approximately 1,880 full-time and approximately 20 part-time employees, which represents a 15% year-over-year increase in employee headcount. We expect headcount growth to continue for the foreseeable future, particularly as we continue to focus on recruiting employees in technical functions such as software engineers. In addition, we plan to continue to hire a number of employees and contractors to continue to bolster various privacy, safety and data security initiatives as well as other functions to support our expected growth. We may also increase headcount through the completion of
merger and acquisition transactions, including the acquisition of Hyperconnect, Inc., announced in February 2021, which, pending regulatory approvals, is expected to close in the second quarter of 2021 and would increase our headcount by approximately 400 employees, based primarily in South Korea. As of December 31, 2020, approximately 68%, 1%, 20%, and 11% of our employees reside in the North America, Latin America, EMEA, and Asia-Pacific regions, respectively, spanning 22 countries and reflecting various cultures, backgrounds, ages, sexes, gender identities, sexual orientations, and ethnicities. Our global workforce is highly educated, with the majority of our employees working in engineering or technical roles that are central to the technological and product innovations that drive our business. Competition for qualified talent has historically been intense, particularly for software engineers and other technical staff.
We believe that an equitable and inclusive environment with diverse teams produces more creative solutions, results in better, more innovative products and is crucial to our efforts to attract and retain key talent. We work to support our goals of diversifying our workforce through recruiting, retention, and people development. Our goal is to create a culture where everybody, from everywhere and with every background, can contribute, grow, and thrive.
Our compensation and benefits programs are designed to attract and reward talented individuals who possess the skills necessary to support our business objectives, assist in the achievement of our strategic goals and create long-term value for our stockholders. In addition to salaries, these programs (which vary by country/region) include annual bonuses, stock-based awards, retirement benefits, healthcare, and insurance benefits, paid time off, family leave, flexible work schedules, and employee assistance programs. We are committed to providing competitive and equitable pay. We base our compensation on market data and conduct evaluations of our compensation practices on a regular basis to determine the competitiveness and fairness of our packages.
We are committed to empowering our people with career advancement and learning opportunities. Our talent development programs provide employees with resources to help achieve their career goals, build management skills and contribute to and, where applicable, lead their organizations.
We regularly conduct anonymous surveys to seek feedback from our employees on a variety of topics, including but not limited to, confidence in company leadership, competitiveness of our compensation and benefits, career growth opportunities and ways to improve our company’s position as an employer of choice. The results are shared with our employees and reviewed by senior leadership, who analyze areas of progress or opportunity and prioritize actions and activities in response to this feedback to drive meaningful improvements in employee engagement.
We believe that our approach to talent has been instrumental in our growth, and has made Match Group a desirable destination for current and future employees.
Additional information
Company website and public filings. Investors and others should note that we announce material financial and operational information to our investors using our investor relations website at https://ir.mtch.com, Securities and Exchange Commission (“SEC”) filings, press releases, and public conference calls. We use these channels as well as social media to communicate with our users and the public about our company, our services, and other issues. It is possible that the information we post on social media could be deemed to be material information. Accordingly, investors, the media, and others interested in our company should monitor the social media channels listed on our investor relations website in addition to following our SEC filings, press releases, and public conference calls. Neither the information on our website, nor the information on the website of any Match Group business, is incorporated by reference into this report, or into any other filings with, or into any other information furnished or submitted to, the SEC.
The Company makes available, free of charge through its website, its Annual Reports on Form 10-K, Quarterly Reports on Form 10-Q, and Current Reports on Form 8-K (including related amendments) as soon as reasonably practicable after they have been electronically filed with (or furnished to) the SEC.
Code of ethics. The Company’s code of ethics applies to all employees (including Match Group’s principal executive officer, principal financial officer and principal accounting officer) and directors and is posted on the Company’s website at https://ir.mtch.com under the heading of “Corporate Governance.” This code of ethics complies with Item 406 of SEC Regulation S-K and the rules of The Nasdaq Stock Market LLC. Any changes to the
code of ethics that affect the provisions required by Item 406 of Regulation S-K, and any waivers of such provisions of the code of ethics for Match Group’s executive officers, senior financial officers or directors, will also be disclosed on Match Group’s website.
Relationship with IAC after the Separation
In connection with the Separation, the Company entered into certain agreements with IAC to govern the relationship between the Company and IAC following the Separation. These agreements, in certain cases, supersede the agreements entered into between Former Match Group and Former IAC in connection with Former Match Group’s IPO in November 2015 (the “IPO Agreements”) and include: a tax matters agreement; a transition services agreement; and an employee matters agreement. The IPO Agreements that were not superseded were terminated at closing of the Separation.
In addition to the agreements entered into at the time of the Separation, Match Group leases office space to IAC in a building owned by the Company in Los Angeles. Match Group also leases office space from IAC in New York City on a month-to-month basis, which the Company terminated in 2020 and expects to vacate in the first half of 2021.
Tax Matters Agreement
Pursuant to the tax matters agreement, each of Match Group and IAC is responsible for certain tax liabilities and obligations following the transfer by Former IAC (i) to Match Group of certain assets and liabilities of, or related to, the businesses of Former IAC (other than Former Match Group) and (ii) to holders of Former IAC common stock and Former IAC Class B common stock, as a result of the reclassification and mandatory exchange of certain series of Former IAC exchangeable preferred stock (collectively, the “IAC Distribution”). Under the tax matters agreement, IAC generally is responsible for, and has agreed to indemnify Match Group against, any liabilities incurred as a result of the failure of the IAC Distribution to qualify for the intended tax-free treatment unless, subject to certain exceptions, the failure to so qualify is attributable to Match Group's or Former Match Group’s actions or failure to act, Match Group's or Former Match Group’s breach of certain representations or covenants or certain acquisitions of equity securities of Match Group, in each case, described in the tax matters agreement (a "Match Group fault-based action"). If the failure to so qualify is attributable to a Match Group fault-based action, Match Group is responsible for liabilities incurred as a result of such failure and will indemnify IAC against such liabilities so incurred by IAC or its affiliates.
Transition Services Agreement
Pursuant to the transition services agreement, IAC continues to provide certain services to Match Group that Former IAC had historically provided to Former Match Group. Match Group also provides certain services to IAC that Former Match Group previously provided to Former IAC. The transition services agreement also provides that Match Group and IAC will make efforts to replace, amend, or divide certain joint contracts with third-parties relating to services or products used by both Match Group and IAC. Match Group and IAC also agreed to continue sharing certain services provided pursuant to certain third-party vendor contracts that were not replaced, amended, or divided prior to closing of the Separation.
Employee Matters Agreement
Pursuant to the amended and restated employee matters agreement, Match Group will reimburse IAC for the cost of any IAC equity awards held by the Company’s employees and former employees upon exercise or vesting. In addition, Match Group employees continued to participate in IAC’s U.S. health and welfare plans, 401(k) plan and flexible benefits plan through December 31, 2020. Match Group reimbursed IAC for the costs of such participation pursuant to the amended and restated employee matters agreement. Match Group established its own employee benefit plans effective January 1, 2021.
Other Agreements
The Transaction Agreement provides that each of Match Group and IAC has agreed to indemnify, defend and hold harmless the other party from and against any liabilities arising out of: (i) any asset or liability allocated to such party or the other members of such party's group under the Transaction Agreement or the businesses of such party's group after the closing of the Separation; (ii) any breach of, or failure to perform or comply with, any covenant, undertaking or obligation of a member of such party's group contained in the Transaction
Agreement that survives the closing of the Separation or is contained in any ancillary agreement; and (iii) any untrue or misleading statement or alleged untrue or misleading statement of a material fact or omission, with respect to information contained in or incorporated into the Form S-4 Registration Statement (the “Form S-4”) filed with the Securities and Exchange Commission (the “SEC”) by IAC and Former IAC in connection with the Separation or the joint proxy statement/prospectus filed by Former IAC and Former Match Group with the SEC pursuant to the Form S-4.
Item 1A. Risk Factors
Risks relating to our business
The dating industry is competitive, with low switching costs and a consistent stream of new products and entrants, and innovation by our competitors may disrupt our business.
The dating industry is competitive, with a consistent stream of new products and entrants. Some of our competitors may enjoy better competitive positions in certain geographical regions, user demographics or other key areas that we currently serve or may serve in the future. These advantages could enable these competitors to offer products that are more appealing to users and potential users than our products or to respond more quickly and/or cost-effectively than us to new or changing opportunities.
In addition, within the dating industry generally, costs for consumers to switch between products are low, and consumers have a propensity to try new approaches to connecting with people and to use multiple dating products at the same time. As a result, new products, entrants and business models are likely to continue to emerge. It is possible that a new product could gain rapid scale at the expense of existing brands through harnessing a new technology or a new or existing distribution channel, creating a new or different approach to connecting people or some other means.
Potential competitors include larger companies that could devote greater resources to the promotion or marketing of their products and services, take advantage of acquisition or other opportunities more readily or develop and expand their products and services more quickly than we do. Potential competitors also include established social media companies that may develop products, features, or services that may compete with ours or operators of mobile operating systems and app stores. For example, Facebook has introduced a dating feature on its platform, which it has rolled out in North America and other markets and has stated it plans to roll out globally. These social media and mobile platform competitors could use strong or dominant positions in one or more markets, and ready access to existing large pools of potential users and personal information regarding those users, to gain competitive advantages over us, including by offering different product features or services that users may prefer or offering their products and services to users at no charge, which may enable them to acquire and engage users at the expense of our user growth or engagement.
If we are not able to compete effectively against our current or future competitors and products that may emerge, the size and level of engagement of our user base may decrease, which could have an adverse effect on our business, financial condition and results of operations.
The limited operating history of our newer brands and products makes it difficult to evaluate our current business and future prospects.
We seek to tailor each of our brands and products to meet the preferences of specific communities of users. Building a given brand or product is generally an iterative process that occurs over a meaningful period of time and involves considerable resources and expenditures. Although certain of our newer brands and products have experienced significant growth over relatively short periods of time, the historical growth rates of these brands and products may not be an indication of future growth rates for such products or our newer brands and products generally. We have encountered, and may continue to encounter, risks and difficulties as we build our newer brands and products. The failure to successfully scale these brands and products and address these risks and difficulties could adversely affect our business, financial condition and results of operations.
Our growth and profitability rely, in part, on our ability to attract and retain users through cost-effective marketing efforts. Any failure in these efforts could adversely affect our business, financial condition, and results of operations.
Attracting and retaining users for our products involve considerable expenditures for online and offline marketing. Historically, we have had to increase our marketing expenditures over time in order to attract and retain users and sustain our growth.
Evolving consumer behavior can affect the availability of profitable marketing opportunities. For example, as traditional television viewership declines and as consumers spend more time on mobile devices rather than desktop computers, the reach of many of our traditional advertising channels continues to contract. Similarly, as consumers communicate less via email and more via text messaging, messaging apps and other virtual means,
the reach of email campaigns designed to attract new and repeat users (and retain current users) for our products is adversely impacted. Additionally, changes proposed by large tech platforms, such as Apple and Google, to advertisers’ ability to access and use unique advertising identifiers, cookies and other information to acquire potential users, may adversely impact our advertising efforts. To continue to reach potential users and grow our businesses, we must identify and devote more of our overall marketing expenditures to newer advertising channels, such as mobile and online video platforms. Generally, the opportunities in and sophistication of newer advertising channels and methods continue to be less developed, proven and precise, making it more difficult to assess returns on investment associated with our advertising efforts and to cost-effectively identify potential users. There can be no assurance that we will be able to continue to appropriately manage our marketing efforts in response to these and other trends in the advertising industry. Any failure to do so could adversely affect our business, financial condition and results of operations.
Our business and results of operations have been and may continue to be adversely affected by the recent COVID-19 outbreak or other similar outbreaks.
Our business could be materially and adversely affected by the outbreak of a widespread health epidemic or pandemic, including the Coronavirus Disease 2019 (COVID-19) pandemic. The COVID-19 pandemic has reached across the globe, resulting in the implementation of significant governmental measures intended to control the spread of the virus, including lockdowns, closures, quarantines, and travel bans, as well as changes in consumer behavior as individuals have become reluctant to engage in social activities with people outside their households. While some of these measures have been relaxed in certain parts of the world, ongoing and future prevention and mitigation measures, as well as the potential for some of these measures to be reinstituted in the event of repeat waves of the virus, are likely to have an adverse impact on global economic conditions and consumer confidence and spending, and could materially adversely affect demand, or users’ ability to pay, for our products and services.
A public health epidemic, including COVID-19, poses the risk that Match Group or its employees, contractors, vendors, and other business partners may be prevented or impaired from conducting ordinary course business activities for an indefinite period of time, including due to shutdowns necessitated for the health and wellbeing of our employees, the employees of business partners, or shutdowns that may be requested or mandated by governmental authorities. For example, early on in the pandemic, certain of our customer support vendors were impacted by government mandated shutdowns which adversely impacted the capability of the affected brands to respond timely and effectively to user inquiries and requests. In addition, in response to the COVID-19 outbreak, we have taken several precautions that may adversely impact employee productivity, such as continuing to allow employees to work remotely, imposing travel restrictions, and ongoing closures of office locations.
The ultimate extent of the impact of any epidemic, pandemic, or other health crisis on our business will depend on multiple factors that are highly uncertain and cannot be predicted, including its severity, location and duration, and actions taken to contain or prevent further its spread. Additionally, the COVID-19 pandemic could increase the magnitude of many of the other risks described in this annual report, and have other adverse effects on our operations that we are not currently able to predict. If our business and the markets in which we operate experience a prolonged occurrence of adverse public health conditions, such as COVID-19, it could materially and adversely affect our business, financial condition, and results of operations. See “Item 7—Management’s Discussion and Analysis of Financial Condition and Results of Operations—Trends affecting our business—Impacts of the Coronavirus.”
Foreign currency exchange rate fluctuations could adversely affect our results of operations.
We operate in various international markets, including jurisdictions within the European Union (which we refer to as the “EU”) and Asia. During periods of a strengthening U.S. dollar, our international revenues will be reduced when translated into U.S. dollars. In addition, as foreign currency exchange rates fluctuate, the translation of our international revenues into U.S. dollar-denominated operating results affects the period-over-period comparability of such results and can result in foreign currency exchange gains and losses.
The departure of the United Kingdom from the European Union, commonly referred to as “Brexit,” has caused, and may continue to cause, volatility in currency exchange rates between the U.S. dollar and the British Pound and the full impact of Brexit remains uncertain. See ‘‘Item 7—Management’s Discussion and Analysis of Financial Condition and Results of Operations—Principles of Financial Reporting—Effects of Changes in Foreign
Exchange Rates on Revenue,“ and Item 7A—Quantitative and Qualitative Disclosures About Market Risk—Foreign Currency Exchange Risk.”
Distribution and marketing of, and access to, our products relies, in significant part, on a variety of third-party platforms, in particular, mobile app stores. If these third parties limit, prohibit, or otherwise interfere with or change their policies in any material way, it could adversely affect our business, financial condition, and results of operations.
We market and distribute our products (including related mobile applications) through a variety of third-party distribution channels, including Facebook, which has rolled out its own dating product. Our ability to market our brands on any given property or channel is subject to the policies of the relevant third party. Certain platforms and channels have, from time to time, limited or prohibited advertisements for our products for a variety of reasons, including poor behavior by other industry participants. There is no assurance that we will not be limited or prohibited from using certain marketing channels in the future. If this were to happen with a significant marketing channel and/or for a significant period of time, our business, financial condition and results of operations could be adversely affected.
Additionally, our mobile applications are almost exclusively accessed through the Apple App Store and Google Play Store. Both Apple and Google have broad discretion to change their policies regarding their mobile operating systems and app stores in ways that may limit, eliminate or otherwise interfere with our ability to distribute or market our applications through their stores, our ability to update our applications, including to make bug fixes or other feature updates or upgrades, the features we provide, our ability to access native functionality or other aspects of mobile devices, and our ability to access information about our users that they collect. To the extent either or both of them do so, our business, financial condition and results of operations could be adversely affected. For example, Apple has indicated that in the future it will require app users to opt in before their identifier for advertisers (“IDFA”) can be accessed by an app (which is currently expected to come into effect in 2021). As a consequence, the ability of advertisers to accurately target and measure their advertising campaigns at the user level may become significantly limited and we and other app developers may experience increased cost per registration. Additionally, Apple and Google are known to retaliate against app developers who publicly or privately challenge their app store rules and policies, and such retaliation has and could adversely affect our business, financial condition and results of operations.
The success of our products will depend, in part, on our ability to access, collect, and use personal data about our users and subscribers.
We rely on the Apple App Store and Google Play Store to distribute and monetize our mobile applications. Our users and subscribers engage with these platforms directly and may be subject to requirements regarding the use of their payment systems for various transactions. As a result of this disintermediation, these platforms receive and do not share with us key user data that we would otherwise receive if we transacted with our users and subscribers directly. If these platforms continue to or increasingly limit, eliminate, or otherwise interfere with our ability to access, collect, and use key user data, our ability to identify and communicate with a meaningful portion of our user and subscriber bases may be adversely impacted. If so, our customer relationship management efforts, our ability to reach new segments of our user and subscriber bases and the population generally, the efficiency of our paid marketing efforts, the rates we are able to charge advertisers seeking to reach users and subscribers on our various properties, and our ability to identify and exclude users and subscribers whose access would violate applicable terms and conditions, including underage individuals and bad actors, may be negatively impacted, and our business, financial condition and results of operations could be adversely affected.
As the distribution of our products through app stores increases, in order to maintain our profit margins, we may need to offset increasing app store fees by decreasing traditional marketing expenditures, increasing user volume, or monetization per user or by engaging in other efforts to increase revenue or decrease costs generally, or our business, financial condition, and results of operations could be adversely affected.
We rely on the Apple App Store and the Google Play Store to distribute and monetize our mobile applications and related in-app products. While our mobile applications are generally free to download from these stores, we offer our users the opportunity to purchase subscriptions and certain à la carte features within these applications. We determine the prices at which these subscriptions and features are sold; however, purchases of these subscriptions and features via our mobile applications are required to be processed through
the in-app payment systems provided by Apple and Google. Due to these requirements, we pay Apple and Google, as applicable, a meaningful share (generally 30%) of the revenue we receive from these transactions. While we are constantly innovating on and creating our own payment systems and methods, given the ever increasing distribution of our products through app stores and the strict mandates to use the in-app payments systems tied into Apple’s and Google’s app stores, we may need to offset these increased app store fees by decreasing traditional marketing expenditures as a percentage of revenue, increasing user volume or monetization per user, or by engaging in other efforts to increase revenue or decrease costs generally, or our business, financial condition and results of operations could be adversely affected. Google announced that it will require all developers to process all in-app purchases of subscriptions and features entirely through their in-app payment system beginning on September 30, 2021. To date, Google has not enforced such a requirement, but if Google does so, our business, financial condition and results of operations would be adversely affected.
We depend on our key personnel.
Our future success will depend upon our continued ability to identify, hire, develop, motivate and retain highly skilled individuals across the globe, with the continued contributions of our senior management being especially critical to our success. Competition for well-qualified employees across Match Group and its various businesses is intense and our continued ability to compete effectively depends, in part, upon our ability to attract new employees. Effective succession planning is also important to our future success. If we fail to ensure the effective transfer of senior management knowledge and smooth transitions involving senior management across our various businesses, our ability to execute short and long term strategic, financial and operating goals, as well as our business, financial condition and results of operations generally, could be adversely affected.
Our success depends, in part, on the integrity of our systems and infrastructures and on our ability to enhance, expand, and adapt these systems and infrastructures in a timely and cost-effective manner.
To succeed, our systems and infrastructures must perform well on a consistent basis. We have and may from time to time, experience system interruptions that make some or all of our systems or data unavailable and prevent our products from functioning properly for our users. Any such interruption could arise for any number of reasons. Further, our systems and infrastructures are vulnerable to damage from fire, power loss, telecommunications failures, acts of God and similar events. While we have backup systems in place for certain aspects of our operations, not all of our systems and infrastructures are fully redundant, disaster recovery planning is not sufficient for all eventualities and our property and business interruption insurance coverage may not be adequate to fully compensate us for any losses that we may suffer. Any interruptions or outages, regardless of the cause, could negatively impact our users’ experiences with our products, tarnish our brands’ reputations and decrease demand for our products, any or all of which could adversely affect our business, financial condition and results of operations.
We also continually work to expand and enhance the efficiency and scalability of our technology and network systems to improve the experience of our users, accommodate substantial increases in the volume of traffic to our various products, ensure acceptable load times for our products and keep up with changes in technology and user preferences. Any failure to do so in a timely and cost-effective manner could adversely affect our users’ experience with our various products and thereby negatively impact the demand for our products, and could increase our costs, either of which could adversely affect our business, financial condition and results of operations.
We may not be able to protect our systems and infrastructure from cyberattacks and may be adversely affected by cyberattacks experienced by third parties.
We are regularly under attack by perpetrators of random or targeted malicious technology-related events, such as cyberattacks, computer viruses, worms, bot attacks or other destructive or disruptive software, distributed denial of service attacks and attempts to misappropriate customer information, including personal user data, credit card information and account login credentials. While we have invested (and continue to invest) in the protection of our systems and infrastructure, in related personnel and training and in employing a data minimization strategy, where appropriate, there can be no assurance that our efforts will prevent significant breaches in our systems or other such events from occurring. Some of our systems have experienced past security incidents, and, although they did not have a material adverse effect on our operating results, there can be no assurance of a similar result in the future. Any cyber or similar attack we are unable to protect ourselves against could damage our systems and infrastructure, prevent us from providing our products, tarnish our brand
reputation, result in the disclosure of confidential or sensitive information of our users and/or be costly to remedy, as well as subject us to investigations by regulatory authorities and/or litigation that could result in liability to third parties.
The impact of cyber or similar attacks experienced by third parties who provide services to us or otherwise process data on our behalf could have a similar effect on us. Moreover, even cyber or similar attacks that do not directly affect us or our third party service providers or data processors may result in widespread access to user account login credentials that such users have used across multiple internet sites, including our sites, or a loss of consumer confidence generally, which could make users less likely to use or continue to use online products generally, including our products. The occurrence of any of these events could have an adverse effect on our business, financial condition and results of operations.
Our success depends, in part, on the integrity of third-party systems and infrastructure.
We rely on third parties, primarily data center and cloud-based, hosted web service providers, such as Amazon Web Services, as well as third party computer systems, broadband and other communications systems and service providers, in connection with the provision of our products generally, as well as to facilitate and process certain transactions with our users. We have no control over any of these third parties or their operations. Any changes in service levels at our data centers or hosted web service providers or any interruptions, outages or delays in our systems or those of our third party providers, deterioration in the performance of these systems, or cyber or similar attacks on these systems could impair our ability to provide our products or process transactions with our users, which would adversely impact our business, financial condition and results of operations.
If the security of personal and confidential or sensitive user information that we maintain and store is breached or otherwise accessed by unauthorized persons, it may be costly to mitigate the impact of such an event and our reputation could be harmed.
We receive, process, store, and transmit a significant amount of personal user and other confidential or sensitive information, including credit card information and user-to-user communications, and enable our users to share their personal information with each other. In some cases, we engage third party service providers to store this information. We continuously develop and maintain systems to protect the security, integrity and confidentiality of this information, but we have experienced past incidents and cannot guarantee that inadvertent or unauthorized use or disclosure will not occur in the future or that third parties will not gain unauthorized access to this information despite our efforts. When such events occur, we may not be able to remedy them, be required by law to notify regulators and individuals whose personal information was used or disclosed without authorization, be subject to claims against us, including government enforcement actions, fines and litigation, and have to expend significant capital and other resources to mitigate the impact of such events, including developing and implementing protections to prevent future events of this nature from occurring. When breaches of security (or the security of our service providers) occur, the perception of the effectiveness of our security measures, the security measures of our service providers and our reputation may be harmed, we may lose current and potential users and the our various brands’ reputation and competitive positions may be tarnished, any or all of which might adversely affect our business, financial condition and results of operations.
Our business is subject to complex and evolving U.S. and international laws and regulations, including with respect to data privacy and platform liability. These laws and regulations are subject to change and uncertain interpretation, and could result in changes to our business practices, increased cost of operations, declines in user growth or engagement, claims, monetary penalties, or otherwise harm our business.
We are subject to a variety of laws and regulations in the United States and abroad that involve matters that are important to or may otherwise impact our business. See “Item 1—Business—Government regulation.” These U.S. federal, state, and municipal and foreign laws and regulations, which in some cases can be enforced by private parties in addition to government entities, are constantly evolving and subject to change. As a result, the application, interpretation, and enforcement of these laws and regulations are often uncertain, particularly in the rapidly evolving industry in which we operate, and may be interpreted and applied inconsistently from state to state and country to country and inconsistently with our current policies and practices. These laws and regulations, as well as any associated inquiries, investigations or other government actions, may be costly to comply with and may delay or impede the development of new products, require changes to or cessation of
certain business practices, result in negative publicity, increase our operating costs, require significant management time and attention, and subject us to remedies that may harm our business, including fines or modifications to existing business practices.
In the case of tax laws, positions that we have taken or will take are subject to interpretation by the relevant taxing authorities. While we believe that the positions we have taken to date comply with applicable law, there can be no assurances that the relevant taxing authorities will not take a contrary position, and if so, that such positions will not adversely affect us. Any events of this nature could adversely affect our business, financial condition and results of operations.
Proposed or new legislation and regulations could also adversely affect our business. See “Item 1—Business—Government regulation.” To the extent such new or more stringent measures are required to be implemented, impose new liability or limit or remove existing protections, our business, financial condition and results of operations could be adversely affected.
The adoption of any laws or regulations that adversely affect the popularity or growth in use of the internet or our services, including laws or regulations that undermine open and neutrally administered internet access, could decrease user demand for our service offerings and increase our cost of doing business. For example, in December 2017, the Federal Communications Commission adopted an order reversing net neutrality protections in the United States, including the repeal of specific rules against blocking, throttling or “paid prioritization” of content or services by internet service providers. To the extent internet service providers engage in such blocking, throttling, “paid prioritization” of content or similar actions as a result of this order and the adoption of similar laws or regulations, our business, financial condition and results of operations could be adversely affected.
We are subject to a number of risks related to credit card payments, including data security breaches and fraud that we or third parties experience, any of which could adversely affect our business, financial condition, and results of operations.
We accept payment from our users primarily through credit card transactions and certain online payment service providers. When we or a third party experiences a data security breach involving credit card information, affected cardholders will often cancel their credit cards. In the case of a breach experienced by a third party, the more sizable the third party’s customer base and the greater the number of credit card accounts impacted, the more likely it is that our users would be impacted by such a breach. To the extent our users are affected by such a breach experienced by us or a third party, such users would need to be contacted to obtain new credit card information and process any pending transactions. It is likely that we would not be able to reach all affected users, and even if we could, some users’ new credit card information may not be obtained and some pending transactions may not be processed, which could adversely affect our business, financial condition and results of operations.
Even if our users are not directly impacted by a given data security breach, they may lose confidence in the ability of service providers to protect their personal information generally, which could cause them to stop using their credit cards online or choose alternative payment methods that are less convenient or more costly for us or otherwise restrict our ability to process payments without significant user effort.
Additionally, if we fail to adequately prevent fraudulent credit card transactions, we may face litigation, fines, governmental enforcement action, civil liability, diminished public perception of our security measures, significantly higher credit card-related costs and remediation costs, or refusal by credit card processors to continue to process payments on our behalf, any of which could adversely affect our business, financial condition and results of operations.
Inappropriate actions by certain of our users could be attributed to us and damage our brands’ reputations, which in turn could adversely affect our business.
Users of our products have been, and may in the future be, physically, financially, emotionally or otherwise harmed by other individuals that such users met or may meet through the use of one of our products. When one or more of our users suffers or alleges to have suffered any such harm, we have in the past, and could in the future, experience negative publicity or legal action that could damage our reputation and our brands. Similar events affecting users of our competitors’ products have in the past, and could in the future, result in negative publicity for the dating industry generally, which could in turn negatively affect our business.
In addition, the reputations of our brands may be adversely affected by the actions of our users that are deemed to be hostile, offensive, defamatory, inappropriate, untrue or unlawful. While we have systems and processes in place that aim to monitor and review the appropriateness of the content accessible through our products, and have adopted policies regarding illegal, offensive or inappropriate use of our products, our users have in the past, and could in the future, nonetheless engage in activities that violate our policies. These safeguards may not be sufficient to avoid harm to our reputation and brands, especially if such hostile, offensive or inappropriate use is well-publicized.
We may fail to adequately protect our intellectual property rights or may be accused of infringing the intellectual property rights of third parties.
We rely heavily upon our trademarks and related domain names and logos to market our brands and to build and maintain brand loyalty and recognition. We also rely upon patented and patent-pending proprietary technologies and trade secrets relating to our products.
We rely on a combination of laws, and contractual restrictions with employees, customers, suppliers and others, to establish and protect our intellectual property rights. For example, we have generally registered and continue to apply to register and renew, or secure by contract where appropriate, trademarks and service marks as they are developed and used, and reserve, register and renew domain names as we deem appropriate. Effective trademark protection may not be available or sought in every country in which our products are made available, and contractual disputes may affect the use of marks governed by private contract. Similarly, not every variation of a domain name may be available or registered, even if available.
We generally seek to apply for patents or other similar statutory protections as and when we deem appropriate, based on then-current facts and circumstances, and will continue to do so in the future. No assurances can be given that any patent application we have filed or will file will result in a patent being issued, or that any existing or future patents will afford adequate protection against competitors and similar technologies. In addition, no assurances can be given that third parties will not create new products or methods that achieve similar results without infringing upon patents we own.
Despite these measures, our intellectual property rights may still not be protected in a meaningful manner, challenges to contractual rights could arise, third parties could copy or otherwise obtain and use our intellectual property without authorization, our existing trademarks, patents, or trade secrets may be determined to be invalid or unenforceable, or laws and interpretations of laws regarding the enforceability of existing intellectual property rights may change over time in a manner that provides less protection. The occurrence of any of these events could tarnish of our brands’ reputation, limit our ability to market them, or impede our ability to effectively compete against competitors with similar technologies, any of which could adversely affect our business, financial condition and results of operations.
From time to time, we have been subject to legal proceedings and claims, including claims of alleged infringement of trademarks, copyrights, patents and other intellectual property rights held by third parties. In addition, litigation may be necessary in the future to enforce our intellectual property rights, protect our trade secrets and patents or to determine the validity and scope of proprietary rights claimed by others. For example, in June 2020, we settled our longstanding litigation with Bumble Trading Inc. for patent and trademark infringement, as well as trade secret misappropriation. Any litigation of this nature, regardless of outcome or merit, could result in substantial costs and diversion of management and technical resources, any of which could adversely affect our business, financial condition and results of operations.
We operate in various international markets, including certain markets in which we have limited experience. As a result, we face additional risks in connection with certain of our international operations.
Operating internationally, particularly in countries in which we have limited experience, exposes us to a number of risks in addition to those otherwise described in this annual report, such as:
•operational and compliance challenges caused by distance, language, and cultural differences;
•difficulties in staffing and managing international operations;
•differing levels of social and technological acceptance of our products or lack of acceptance of them generally;
•compliance challenges due to different laws and regulatory environments, particularly in the case of privacy, data security, intermediary liability, and consumer protection;
•competitive environments that favor local businesses or local knowledge of such environments;
•limitations on the level of intellectual property protection; and
•trade sanctions, political unrest, terrorism, war, and epidemics or the threat of any of these events (such as COVID-19).
The occurrence of any or all of the events described above could adversely affect our international operations, which could in turn adversely affect our business, financial condition, and results of operations.
We may experience operational and financial risks in connection with acquisitions.
We have made acquisitions in the past, have recently announced a pending acquisition and continue to seek potential acquisition candidates. We may experience operational and financial risks in connection with historical and future acquisitions if we are unable to:
•properly value prospective acquisitions, especially those with limited operating histories;
•fully identify potential risks and liabilities associated with acquired businesses;
•successfully integrate the operations and accounting, financial controls, management information, technology, human resources, and other administrative systems, of the acquired businesses with our existing operations and systems;
•retain or hire senior management and other key personnel at acquired businesses; and
•successfully support the acquired businesses in executing on strategic plans, including expansion into geographies where we have presence and experience.
Furthermore, we may not be successful in addressing other challenges encountered in connection with our acquisitions and the anticipated benefits of one or more of our acquisitions may not be realized. In addition, such acquisitions can result in material diversion of management’s attention or other resources from our existing businesses. The occurrence of any these events could have an adverse effect on our business, financial condition and results of operations.
We are subject to litigation, and adverse outcomes in such litigation could have an adverse effect on our financial condition.
We are, and from time to time may become, subject to litigation and various legal proceedings, including litigation and proceedings related to employment matters, intellectual property matters, privacy and consumer protection laws, as well as stockholder derivative suits, class action lawsuits and other matters, that involve claims for substantial amounts of money or for other relief or that might necessitate changes to our business or operations. The defense of these actions is time consuming and expensive. We evaluate these litigation claims and legal proceedings to assess the likelihood of unfavorable outcomes and to estimate, if possible, the amount of potential losses. Based on these assessments and estimates, we may establish reserves and/or disclose the relevant litigation claims or legal proceedings, as and when required or appropriate. These assessments and estimates are based on information available to management at the time of such assessment or estimation and involve a significant amount of judgment. As a result, actual outcomes or losses could differ materially from those envisioned by our current assessments and estimates. Our failure to successfully defend or settle any of these litigations or legal proceedings could result in liability that, to the extent not covered by our insurance, could have an adverse effect on our business, financial condition and results of operations. See “Item 3—Legal Proceedings.”
Risks relating to our indebtedness
Our indebtedness may affect our ability to operate our business, which could have a material adverse effect on our financial condition and results of operations. We and our subsidiaries may incur additional indebtedness, including secured indebtedness.
As of December 31, 2020, we had total debt outstanding of approximately $3.9 billion and borrowing availability of $749.8 million under our revolving credit facility.
Our indebtedness could have important consequences, such as:
•limiting our ability to obtain additional financing to fund working capital needs, acquisitions, capital expenditures, or other debt service requirements or for other purposes;
•limiting our ability to use operating cash flow to pursue acquisitions or invest in other areas, such as developing new brands, products, or exploiting business opportunities;
•restricting our business operations due to financial and operating covenants in the agreements governing our and certain of our subsidiaries’ existing and future indebtedness, including certain covenants that restrict the ability of our subsidiaries to pay dividends or make other distributions to us; and
•exposing us to potential events of default (if not cured or waived) under financial and operating covenants contained in our or our subsidiaries’ debt instruments that could have a material adverse effect on our business, financial condition and operating results.
Although the terms of our credit agreement and the indentures related to our senior notes contain restrictions on the incurrence of additional indebtedness, these restrictions are subject to a number of qualifications and exceptions, and additional indebtedness incurred in compliance with these restrictions could be significant. If new debt is added to our and our subsidiaries’ current debt levels, the risks described above could increase.
We may not be able to generate sufficient cash to service all of our indebtedness and may be forced to take other actions to satisfy our obligations under our indebtedness that may not be successful.
Our ability to satisfy our debt obligations will depend upon, among other things:
•our future financial and operating performance, which will be affected by prevailing economic conditions and financial, business, regulatory, and other factors, many of which are beyond our control; and
•our future ability to borrow under our revolving credit facility, the availability of which will depend on, among other things, our complying with the covenants in the then-existing agreements governing our indebtedness.
There can be no assurance that our business will generate sufficient cash flow from operations, or that we will be able to draw under our revolving credit facility or otherwise, in an amount sufficient to fund our liquidity needs.
If our cash flows and capital resources are insufficient to service our indebtedness, we may be forced to reduce or delay capital expenditures, sell assets, seek additional capital or restructure or refinance our indebtedness. These alternative measures may not be successful and may not permit us to meet our scheduled debt service obligations. Our ability to restructure or refinance our debt will depend on the condition of the capital markets and our financial condition at such time. Any refinancing of our debt could be at higher interest rates and may require us to comply with more onerous covenants, which could further restrict our business operations. In addition, the terms of existing or future debt agreements may restrict us from adopting some of these alternatives.
Variable rate indebtedness that we have incurred or may incur under our credit agreement will subject us to interest rate risk, which could cause our debt service obligations to increase significantly.
We currently have $425 million of indebtedness outstanding under our term loan and no outstanding borrowings under our revolving credit agreement. Borrowings under term loan are, and any borrowings under
the revolving credit facility will be, at variable rates of interest. Indebtedness that bears interest at variable rates exposes us to interest rate risk. See “Item 7A—Quantitative and Qualitative Disclosures About Market Risk—Interest Rate Risk.”
Exchange of the exchangeable notes may dilute the ownership interests of existing stockholders or may otherwise depress the price of our common stock.
We are obligated as a guarantor under the indentures relating to the exchangeable notes. The exchange of some or all of the exchangeable notes may dilute the ownership interests of our stockholders to the extent we deliver shares of our common stock upon exchange. While the exchangeable note hedges are expected to reduce the potential dilutive effect on our common stock upon any exchange and/or offset any cash payment the issuers of the exchangeable notes would be required to make in excess of the principal amount of the exchanged notes, the warrants have a dilutive effect to the extent that the market price per share of our common stock exceeds the strike price of the warrants. Any sales in the public market of our common stock issuable upon such exchange could adversely affect prevailing market prices of our common stock. In addition, the existence of the exchangeable notes may encourage short selling of our common stock by market participants because the exchange of the exchangeable notes could be used to satisfy short positions. In addition, the anticipated exchange of the exchangeable notes could depress the price of our common stock.
Risks relating to the Separation
We may be unable to achieve some or all of the benefits that we expect to achieve through the Separation.
We believe that the intended strategic and financial benefits of the Separation should be achieved. However, there can be no assurance of this or that we will be able to attract transaction partners using our capital stock as acquisition currency and that analysts and investors will regard our new corporate structure as more clear and simple than our former corporate structure.
If the transactions effected in connection with the Separation were to fail to qualify as generally tax-free for U.S. federal income tax purposes, we and our stockholders could suffer material adverse consequences.
Following the completion of the Separation and the merger of Former Match Group into a wholly-owned subsidiary (“Merger Sub”) of Former IAC (the “Merger”), Former Match Group’s successor became a wholly-owned subsidiary of Match Group and most of Former IAC’s existing other subsidiaries came to be held under a separate public company. Former IAC and IAC received opinions from outside counsel that the Separation and related transactions taken together, and the Merger, were tax-free for U.S. federal income tax purposes. These opinions were based upon and rely on various facts and assumptions, as well as certain representations and undertakings of Former IAC, Former Match Group, IAC, and Match Group, including relating to the past and future conduct of Former IAC, Former Match Group, IAC, and Match Group. If any of these representations or undertakings is, or becomes, inaccurate or incomplete, or if any of the representations or covenants contained in any of the transaction-related agreements or in any document relating to the opinions of counsel is, or becomes, inaccurate or is not complied with by Former IAC, Former Match Group, IAC, Match Group, or any of their respective subsidiaries, the opinions of counsel may be invalid and the conclusions reached therein could be jeopardized.
Notwithstanding receipt of the opinions of counsel regarding the transactions, the U.S. Internal Revenue Service (“IRS”) could determine that some or all of the transactions effected in connection with the Separation should be treated as taxable for U.S. federal income tax purposes if it determines that any of the representations, assumptions or undertakings upon which the opinions of counsel were based are inaccurate or have not been complied with. Moreover, even if the foregoing representations, assumptions or undertakings are accurate and have been complied with, the opinions of counsel merely represent the judgment of such counsel and are not binding on the IRS or any court, and the IRS or a court may disagree with the conclusions in the opinions of counsel. Accordingly, there can be no assurance that the IRS will not assert that the transactions effected in connection with the Separation do not qualify for tax-free treatment for U.S. federal income tax purposes or that a court would not sustain such a challenge. In the event the IRS were to prevail with such a challenge, parties to the Separation, including Match Group could be subject to tax with respect to the Separation.
For example, if the transactions effected in connection with the Separation were to fail to qualify as a transaction that is generally tax-free for U.S. federal income tax purposes under Sections 355 and 368(a)(1)(D) of the Internal Revenue Code of 1986 (as amended, the “Code”), in general, for U.S. federal income tax purposes, we would recognize a taxable gain as if the distribution of New IAC stock in connection with the Separation had been sold in a taxable sale for its fair market value. Even if the transactions effected in connection with the Separation were to otherwise qualify as a tax-free transaction under Sections 355 and 368(a)(1)(D) of the Code, taxable gain may be triggered under Section 355(e) of the Code if the transactions effected in connection with the Separation were, or later transactions are, deemed to be part of a plan (or series of related transactions) pursuant to which one or more persons acquire, directly or indirectly, shares representing a 50 percent or greater interest (by vote or value) in us or IAC. For this purpose, any acquisitions of (i) Former IAC stock or Former Match Group stock before the Separation or (ii) IAC stock or Match Group stock within the period beginning two years before the Separation and ending two years after the Separation are presumed to be part of such a plan, although we or IAC may be able to rebut that presumption.
In addition to potential tax liabilities relating to Former Match Group, we and our subsidiaries could be liable to satisfy any tax liabilities relating to Former IAC or IAC with respect to the Separation if their tax-free treatment for U.S. federal income tax purposes were successfully challenged by the IRS. While, in some cases, IAC may be obligated under the Tax Matters Agreement to indemnify us for some or all of such taxes, even in those cases, there is no assurance that they will in fact indemnify us.
In addition, if the Merger were determined to be taxable for U.S. federal income tax purposes, we would be subject to tax on the transfer of the assets of Former Match to Merger Sub. If we or our subsidiaries were required to pay taxes imposed on us with respect to the Separation, our cash flows would be adversely affected.
We may not be able to engage in desirable capital-raising or strategic transactions following the Separation.
We believe we will generally be able to engage in desirable capital-raising or strategic transactions. However, under current U.S. federal income tax law, a distribution that otherwise qualifies for tax-free treatment can be rendered taxable to the distributing corporation and its stockholders as a result of certain post-distribution transactions, including certain acquisitions of shares or assets of both the distributing corporation and the corporation the stock of which is distributed. To preserve the tax-free treatment of the transactions effected in connection with the Separation, the Tax Matters Agreement imposes certain restrictions on us and our subsidiaries during the two-year period following the Separation. Except in specific circumstances, we are generally restricted from (1) ceasing to actively conduct certain of our businesses; (2) entering into certain transactions or series of transactions pursuant to which all or a portion of our shares of common stock would be acquired, whether by merger or otherwise; (3) liquidating or merging or consolidating with any other person; (4) issuing equity securities beyond certain thresholds; (5) repurchasing shares of our common stock, other than in certain open-market transactions; or (6) taking or failing to take any other action that would cause the transactions effected in connection with the Separation to fail to qualify as a transaction that is generally tax-free for U.S. federal income tax purposes under Sections 355 and 368(a)(1)(D) of the Code. These restrictions may limit our ability to pursue certain equity issuances, strategic transactions, repurchases or other transactions that we may otherwise believe to be in the best interests of our stockholders or that might increase the value of our business.
Actual or potential conflicts of interest may develop between our management and directors, on the one hand, and the management and directors of IAC, on the other hand.
Certain of our directors and executive officers and directors of IAC own both Match Group common stock and IAC common stock. This ownership overlap could create, or appear to create, potential conflicts of interest when Match Group’s directors and IAC’s executive officers and directors face decisions that could have different implications for Match Group and IAC. For example, potential conflicts of interest could arise in connection with the resolution of any dispute between Match Group and IAC regarding the terms of the agreements governing the Separation and the relationship between Match Group and IAC thereafter. Potential conflicts of interest could also arise if Match Group and IAC enter into any commercial arrangements in the future.
In addition, Joseph Levin serves as the executive chairman of our board of directors, while also serving as the Chief Executive Officer and a director of IAC, Glenn H. Schiffman serves as a director of Match Group while also serving as an executive officer of IAC, and Alan G. Spoon serves as a director of each of Match Group and IAC. We believe that having a limited number of senior IAC management members serve on our Board for a
transitional period will be beneficial to us. However, the fact that Messrs. Levin, Schiffman, and Spoon hold positions with both Match Group and IAC could create, or appear to create, potential conflicts of interest for each of them when facing decisions that may affect both Match Group and IAC, and each of them also faces conflicts of interest with regard to the allocation of his time between Match Group and IAC.
Our certificate of incorporation could prevent us from benefiting from corporate opportunities that might otherwise have been available to us.
Our certificate of incorporation includes a “corporate opportunity” provision in which Match Group and its affiliates renounce any interests or expectancy in corporate opportunities which become known to any of Match Group’s directors or officers who are also officers or directors of IAC.
Generally, Match Group’s officers or directors who are also IAC’s officers or directors will not be liable to Match Group or its stockholders for breach of any fiduciary duty because such person fails to communicate or offer to Match Group a corporate opportunity that has been communicated or offered to IAC, that may also be a corporate opportunity of Match Group or because such person communicates or offers to IAC any corporate opportunity that may also be a corporate opportunity of Match Group. In order for any Match Group director or officer who is also an IAC director or officer not to be liable to Match Group or its stockholders, such opportunity cannot become known to the officer or director in his or her capacity as a Match Group director or officer and cannot be presented to any party other than IAC. In addition, such officer or director cannot pursue such opportunity in his or her individual capacity. The corporate opportunity provision may exacerbate conflicts of interest between Match Group and IAC because the provision effectively permits any of Match Group’s directors or officers who also serve as an officer or director of IAC to choose to direct a corporate opportunity to IAC instead of to Match Group.
Risks relating to ownership of our common stock
You may experience dilution due to the issuance of additional securities in the future.
Our dilutive securities consist of vested and unvested options to purchase shares of our common stock, restricted stock unit awards, equity awards denominated in the equity of our non-public subsidiaries but settleable in shares of our common stock, the exchangeable notes and the exchangeable note warrants.
These dilutive securities are reflected in our dilutive earnings per share calculation contained in our financial statements for fiscal years ended December 31, 2020, 2019 and 2018. For more information, see “Note 10—Earnings per Share” to the consolidated financial statements included in “Part II, Item 8—Consolidated Financial Statements and Supplementary Data.” Intra-quarter movements in our stock price, could lead to more or less dilution than reflected in these calculations.
We do not expect to declare any regular cash dividends in the foreseeable future.
We have no current plans to pay cash dividends on our common stock. Instead, we anticipate that all of our future earnings will be retained to support our operations and to finance the growth and development of our business. We are not obligated to pay dividends on our common stock. Consequently, investors may need to rely on sales of their common stock after price appreciation, which may never occur, as the only way to realize any future gains on their investment. Investors seeking regular cash dividends should not purchase our common stock.
Provisions in our certificate of incorporation and bylaws or Delaware law may discourage, delay, or prevent a change of control of our company or changes in our management and, therefore, depress the trading price of our common stock.
Delaware corporate law and our certificate of incorporation and bylaws contain provisions that could discourage, delay or prevent a change in control of our company or changes in our management that the stockholders of our company may deem advantageous, including provisions which:
•authorize the issuance of “blank check” preferred stock that our board of directors could issue to increase the number of outstanding shares and to discourage a takeover attempt;
•establish a classified board of directors, as a result of which our board is divided into three classes, with each class serving for staggered three-year terms, which prevents stockholders from electing an entirely new board of directors at an annual meeting;
•prohibit stockholder action by written consent, thereby requiring all actions to be taken at a meeting of the stockholders;
•eliminate the ability of our stockholders to call special meetings of stockholders;
•provide that certain litigation against us can be brought only in Delaware (subject to certain exceptions); and
•provide that the board of directors is expressly authorized to make, alter, or repeal our bylaws.
Any provision of our certificate of incorporation, our bylaws or Delaware law that has the effect of delaying or deterring a change in control could limit the opportunity for our stockholders to receive a premium for their shares of our common stock, and could also affect the price that some investors are willing to pay for our common stock.
Item 1B. Unresolved Staff Comments
None.
Item 2. Properties
Match Group believes that the facilities for its management and operations are generally adequate for its current and near-term future needs. Match Group’s facilities, most of which are leased in various cities in the United States and abroad, generally consist of executive and administrative offices and data centers. We also believe that, if we require additional space, we will be able to lease additional facilities on commercially reasonable terms.
Item 3. Legal Proceedings
Overview
We are, and from time to time may become, involved in various legal proceedings arising in the normal course of our business activities, such as patent infringement claims, trademark oppositions, and consumer or advertising complaints, as well as stockholder derivative actions, class action lawsuits, and other matters. The amounts that may be recovered in such matters may be subject to insurance coverage. The litigation matters described below involve issues or claims that may be of particular interest to our stockholders, regardless of whether any of these matters may be material to our financial position or operations based upon the standard set forth in the SEC’s rules.
Pursuant to the Transaction Agreement, we have agreed to indemnify IAC for matters relating to any business of Former Match Group, including indemnifying IAC for costs related to the matters described below other than the matter described under the heading “Newman Derivative and Stockholder Class Action Regarding Separation Transaction”.
The official names of legal proceedings in the descriptions below (shown in italics) reflect the original names of the parties when the proceedings were filed as opposed to the current names of the parties following the separation of Match Group and IAC.
Consumer Class Action Litigation Challenging Tinder’s Age-Tiered Pricing
On May 28, 2015, a putative state-wide class action was filed against Tinder in state court in California. See Allan Candelore v. Tinder, Inc., No. BC583162 (Superior Court of California, County of Los Angeles). The complaint principally alleged that Tinder violated California’s Unruh Civil Rights Act by offering and charging users age 30 and over a higher price than younger users for subscriptions to its premium Tinder Plus service. The complaint sought certification of a class of California Tinder Plus subscribers age 30 and over and damages in an unspecified amount. On December 29, 2015, in accordance with a prior ruling sustaining Tinder’s demurrer, the court entered judgment dismissing the action. On January 29, 2018, the California Court of Appeal (Second Appellate District, Division Three) issued an opinion reversing the judgment of dismissal. On May 9, 2018, the
California Supreme Court denied Tinder’s petition seeking interlocutory review of the Court of Appeal’s decision and the case was returned to the trial court for further proceedings.
In a related development, on June 21, 2019, in a substantially similar putative class action asserting the same substantive claims and pending in federal district court in California, the court entered judgment granting final approval of a class-wide settlement, the terms of which are not material to the Company. See Lisa Kim v. Tinder, Inc., No. 18-cv-3093 (Central District of California). Because the approved settlement class in Kim subsumes the proposed settlement class in Candelore, the judgment in Kim would effectively render Candelore a single-plaintiff lawsuit. Accordingly, on July 11, 2019, two objectors to the Kim settlement, represented by the plaintiff’s counsel in Candelore, filed a notice of appeal from the Kim judgment with the U.S. Court of Appeals for the Ninth Circuit. Oral argument on the appeal occurred on January 15, 2021.
On November 13, 2019, the trial court in Candelore issued an order staying the class claims in the case pending the Ninth Circuit’s decision on the Kim appeal. We believe that the allegations in the Candelore lawsuit are without merit and will continue to defend vigorously against it.
Tinder Optionholder Litigation Against Former Match Group and Match Group
On August 14, 2018, ten then-current and former employees of Match Group, LLC or Tinder, Inc. (“Tinder”), a former subsidiary of Former Match Group, filed a lawsuit in New York state court against Former Match Group and Match Group. See Sean Rad et al. v. IAC/InterActiveCorp and Match Group, Inc., No. 654038/2018 (Supreme Court, New York County). The complaint alleges that in 2017, the defendants: (i) wrongfully interfered with a contractually established process for the independent valuation of Tinder by certain investment banks, resulting in a substantial undervaluation of Tinder and a consequent underpayment to the plaintiffs upon exercise of their Tinder stock options, and (ii) then wrongfully merged Tinder into Former Match Group, thereby depriving certain of the plaintiffs of their contractual right to later valuations of Tinder on a stand-alone basis. The complaint asserts claims for breach of contract, breach of the implied covenant of good faith and fair dealing, unjust enrichment, interference with contractual relations (as against Former Match Group only), and interference with prospective economic advantage, and seeks compensatory damages in the amount of at least $2 billion, as well as punitive damages. On August 31, 2018, four plaintiffs who were still employed by Former Match Group filed a notice of discontinuance of their claims without prejudice, leaving the six former employees as the remaining plaintiffs. On June 13, 2019, the court issued a decision and order granting defendants’ motion to dismiss the claims for breach of the implied covenant of good faith and fair dealing and for unjust enrichments, as well as the merger-related claim for breach of contract as to two of the remaining six plaintiffs, and otherwise denying defendants’ motion to dismiss. On July 13, 2020, the four former plaintiffs filed arbitration demands with the American Arbitration Association asserting the same valuation claims and on September 3, 2020, the four arbitrations were consolidated. The four former plaintiffs’ request to stay the arbitration was denied on January 28, 2021, and arbitration is scheduled to begin on February 7, 2022. On November 17, 2020, the defendants’ motion to stay the trial in Rad was denied. Trial has been scheduled for November 2021. We believe that the allegations against Former Match Group and Match Group in this lawsuit are without merit and will continue to defend vigorously against them.
FTC Lawsuit Against Former Match Group
On September 25, 2019, the FTC filed a lawsuit in federal district court in Texas against Former Match Group. See FTC v. Match Group, Inc., No. 3:19:cv-02281-K (Northern District of Texas). The complaint alleges that, prior to mid-2018, for marketing purposes Match.com notified non-paying users that other users were attempting to communicate with them, even though Match.com had identified those subscriber accounts as potentially fraudulent, thereby inducing non-paying users to subscribe and exposing them to the risk of fraud should they subscribe. The complaint also challenges the adequacy of Match.com’s disclosure of the terms of its six-month guarantee, the efficacy of its cancellation process, and its handling of chargeback disputes. The complaint seeks among other things permanent injunctive relief, civil penalties, restitution, disgorgement, and costs of suit. On October 9, 2020, the court granted the Company’s motion to stay the case until the United States Supreme Court issues a decision in the consolidated appeal of Federal Trade Commission v. Credit Bureau Center, LLC and AMG Capital Management, LLC v. FTC. We believe that the FTC’s claims regarding Match.com’s practices, policies, and procedures are without merit and will defend vigorously against them.
Securities Class Action Lawsuit Against Former Match Group
On October 3, 2019, a Former Match Group shareholder filed a securities class action lawsuit in federal district court in Texas against Former Match Group, its Chief Executive Officer, and its Chief Financial Officer, on behalf of a class of acquirers of Former Match Group securities between August 6, 2019 and September 25, 2019. See Phillip R. Crutchfield v. Match Group, Inc., Amanda W. Ginsberg, and Gary Swidler, No. 3:19-cv-02356-C (Northern District of Texas). Invoking the allegations in the FTC lawsuit described above, the complaint alleges (i) that defendants failed to disclose to investors that Former Match Group induced customers to buy and upgrade subscriptions using misleading advertisements, that Former Match Group made it difficult for customers to cancel their subscriptions, and that, as a result, Former Match Group was likely to be subject to regulatory scrutiny; (ii) that Former Match Group lacked adequate disclosure controls and procedures; and (iii) that, as a result of the foregoing, defendants’ positive statements about Former Match Group’s business, operations, and prospects, were materially misleading and/or lacked a reasonable basis. We believe that the allegations in this lawsuit are without merit and will defend vigorously against them.
Derivative Complaint against Former Match Group
On February 28, 2020, a Former Match Group shareholder filed a shareholder derivative complaint in federal district court in Delaware against Former Match Group and its board of directors seeking to recover unspecified monetary damages on behalf of the Company and require the Company to implement and maintain unspecified internal controls and corporate governance practices and procedures. See Michael Rubin et al. v. Match Group, Inc. et al., Case No. 1:20-cv-00299 (District of Delaware). Invoking the allegations of the FTC lawsuit and Crutchfield securities class action lawsuit described above, the complaint alleges that the defendants caused or failed to prevent the alleged issues giving rise to the FTC complaint, received or approved compensation tied to the alleged wrongful conduct and sold Former Match Group stock with inside knowledge of the purported conduct. The parties filed a proposed stipulation and order staying the case until the motion to dismiss is decided in the Crutchfield litigation. The court granted the stay on April 9, 2020.
House Oversight Committee Investigation of Online Dating
On January 30, 2020, Former Match Group received a letter from the House of Representatives’ Subcommittee on Economic and Consumer Policy (the “Oversight Committee”) regarding its inquiry into underage use of online dating services and efforts by those services to remove registered sex offenders from their platforms. The Oversight Committee is also inquiring under what circumstances online dating services share or sell sensitive user information with third parties. The Company is cooperating with the investigation.
Irish Data Protection Commission Inquiry Regarding Tinder’s Practices
On February 3, 2020, we received a letter from the Irish Data Protection Commission (the “DPC”) notifying us that the DPC has commenced an inquiry examining Tinder’s compliance with the EU’s General Data Protection Regulation, focusing on Tinder’s processes for handling access and deletion requests and Tinder’s user data retention policies. We are fully cooperating with the DPC in connection with this inquiry.
Newman Derivative and Stockholder Class Action Regarding Separation Transaction
On June 24, 2020, a Former Match Group shareholder filed a complaint in the Delaware Court of Chancery against Former Match Group and its board of directors, as well as Match Group, IAC Holdings, Inc., and Barry Diller seeking to recover unspecified monetary damages on behalf of the Company and directly as a result of his ownership of Former Match Group stock in relation to the separation of Former Match Group from its former majority shareholder, Match Group. See David Newman et al. v. IAC/Interactive Corp. et al., C.A. No. 2020-0505-MTZ (Delaware Court of Chancery). The complaint alleges that that the special committee established by Former Match Group’s board of directors to negotiate with Match Group regarding the separation transaction was not sufficiently independent of control from Match Group and Mr. Diller and that Former Match Group board members failed to adequately protect Former Match Group’s interest in negotiating the separation transaction, which resulted in a transaction that was unfair to Former Match Group and its shareholders. We believe that the allegations in this lawsuit are without merit and will defend vigorously against it.
Item 4. Mine Safety Disclosure
Not applicable.
PART II
Item 5. Market for Registrant’s Common Equity, Related Stockholder Matters and Issuer Purchases of Equity Securities
Market for Registrant’s Common Equity and Related Stockholder Matters
Our common stock is quoted on the Nasdaq Global Select Market (“NASDAQ”) under the ticker symbol “MTCH.”
As of January 31, 2020, there were 1,028 holders of record of the Company’s common stock. Because the substantial majority of the outstanding shares of our common stock are held by brokers and other institutions on behalf of shareholders, we are not able to estimate the total number of beneficial shareholders represented by these record holders.
Stock Performance Graph
The following graph compares the cumulative total return (assuming dividend reinvestment, as applicable) of Match Group common stock (including such cumulative total return of Former Match Group common stock for the period prior to, and adjusted for, the separation of Match Group and IAC), the NASDAQ Composite index, the Russell 1000 Technology Index, and the Standard & Poor’s 500 Stock Index, in each case, based on $100 invested at the close of trading on December 31, 2015 through December 31, 2020. In accordance with applicable SEC rules, Match Group presents the cumulative return of peer issuers. Match Group has selected the NASDAQ Composite Index and the Russell 1000 Technology Index as its peer issuers because they both include companies engaged in many of the same businesses as Match Group. The returns shown are based on historical results and are not intended to suggest future performance.
COMPARISON OF CUMULATIVE TOTAL RETURN
Match Group, Inc. Common Stock
Among Match Group, Inc., the NASDAQ Composite Index,
the Russell 1000 Technology Index, and the S&P 500 Index
| | | | | | | | | | | | | | | | | | | | | | | | | | | | | | | | | | | |
| 12/31/2015 | | 12/31/2016 | | 12/31/2017 | | 12/31/2018 | | 12/31/2019 | | 12/31/2020 |
| Match Group, Inc. | $100.00 | | $126.20 | | $231.07 | | $332.08 | | $637.52 | | $1,115.79 |
| NASDAQ Composite Index | $100.00 | | $108.97 | | $141.36 | | $137.39 | | $187.87 | | $272.51 |
| Russell 1000 Technology Index | $100.00 | | $114.08 | | $157.89 | | $155.99 | | $229.64 | | $336.89 |
| S&P 500 Index | $100.00 | | $111.95 | | $136.38 | | $130.39 | | $171.44 | | $202.96 |
Item 6. Reserved
Not applicable.
Item 7. Management’s Discussion and Analysis of Financial Condition and Results of Operations
Separation
On June 30, 2020, the companies formerly known as Match Group, Inc. (referred to as “Former Match Group”) and IAC/InterActiveCorp (referred to as “Former IAC”) completed the separation of the Company from IAC through a series of transactions that resulted in two, separate public companies—(1) Match Group, which consists of the businesses of Former Match Group and certain financing subsidiaries previously owned by Former IAC, and (2) IAC, consisting of Former IAC’s businesses other than Match Group (the “Separation”). As part of the Separation, Former Match Group merged with and into Match Group Holdings II, LLC (“MG Holdings II”), an indirect wholly-owned subsidiary of Match Group, with MG Holdings II surviving the merger as an indirect wholly-owned subsidiary of Match Group. As a result of the Separation, the operations of Former IAC businesses other than Match Group are presented as discontinued operations.
For additional information relating to the Separation and the related transactions and agreements, see “Part I—Item 1—Business—Separation of Match Group and IAC” and “Part I—Item 1—Business—Relationship with IAC after the Separation.”
Other 2020 Developments
On February 11, 2020, MG Holdings II completed a private offering of $500 million aggregate principal amount of 4.125% Senior Notes. The proceeds from these notes were used to pay expenses associated with the offering and to fund a portion of the cash consideration of $3.00 per Former Match Group common share in connection with the Separation.
On February 13, 2020, the Credit Facility was amended to, among other things, increase the available borrowing capacity to $750 million, reduce interest rate margins by 0.125%, and extend its maturity to February 13, 2025. Additionally, on February 13, 2020, the Term Loan was amended to reprice the outstanding balance to LIBOR plus 1.75% and extend its maturity to February 13, 2027.
On May 19, 2020, MG Holdings II completed a private offering of $500 million aggregate principal amount of 4.625% Senior Notes. The proceeds from these notes were used to redeem the outstanding 6.375% Senior Notes, for general corporate purposes, and to pay expenses associated with the offering.
In July 2020, in connection with the Separation, the sale of 17.3 million newly issued shares of Match Group common stock was completed by IAC. The proceeds of $1.4 billion, net of associated fees, were transferred directly to IAC pursuant to the terms of the Transaction Agreement.
Key Terms:
Operating metrics:
•North America - consists of the financial results and metrics associated with users located in the United States and Canada.
•International - consists of the financial results and metrics associated with users located outside of the United States and Canada.
•Direct Revenue - is revenue that is received directly from end users of our products and includes both subscription and à la carte revenue.
•Indirect Revenue - is revenue that is not received directly from an end user of our products, substantially all of which is advertising revenue.
•Subscribers - are users who purchase a subscription to one of our products. Users who purchase only à la carte features are not included in Subscribers.
•Average Subscribers - is the number of Subscribers at the end of each day in the relevant measurement period divided by the number of calendar days in that period.
•Average Revenue per Subscriber (“ARPU”) - is Direct Revenue from Subscribers in the relevant measurement period (whether in the form of subscription or à la carte revenue) divided by the Average Subscribers in such period and further divided by the number of calendar days in such period.
Direct Revenue from users who are not Subscribers and have purchased only à la carte features is not included in ARPU.
Operating costs and expenses:
•Cost of revenue - consists primarily of the amortization of in-app purchase fees, compensation expense (including stock-based compensation expense) and other employee-related costs for personnel engaged in data center and customer care functions, credit card processing fees, hosting fees, live video costs, and data center rent, energy, and bandwidth costs. In-app purchase fees are monies paid to Apple and Google in connection with the processing of in-app purchases of subscriptions and product features through the in-app payment systems provided by Apple and Google.
•Selling and marketing expense - consists primarily of advertising expenditures and compensation expense (including stock-based compensation expense) and other employee-related costs for personnel engaged in selling and marketing, and sales support functions. Advertising expenditures includes online marketing, including fees paid to search engines and social media sites, offline marketing (which is primarily television advertising), and payments to partners that direct traffic to our brands.
•General and administrative expense - consists primarily of compensation expense (including stock-based compensation expense) and other employee-related costs for personnel engaged in executive management, finance, legal, tax and human resources, acquisition-related contingent consideration fair value adjustments (described below), fees for professional services (including transaction-related costs for acquisitions), and facilities costs.
•Product development expense - consists primarily of compensation expense (including stock-based compensation expense) and other employee-related costs that are not capitalized for personnel engaged in the design, development, testing, and enhancement of product offerings and related technology.
•Acquisition-related contingent consideration fair value adjustments - relate to the portion of the purchase price of certain acquisitions that is contingent upon the financial performance and/or operating metric targets of the acquired company. The fair value of the liability is estimated at the date of acquisition and adjusted each reporting period until the liability is settled. Significant changes in forecasted earnings and/or operating metrics for the acquired company will result in a significantly higher or lower fair value measurement. The changes in the estimated fair value of the contingent consideration arrangements during each reporting period, including the accretion of the discount if the arrangement is longer than one year, are recognized in “General and administrative expense” in the accompanying consolidated statement of operations.
Long-term debt:
•Credit Facility - The revolving credit facility of MG Holdings II. At December 31, 2019, $500 million was available under the Credit Facility. On February 13, 2020, the Credit Facility was amended to, among other things, increase the available borrowing capacity from $500 million to $750 million, reduce interest rate margins by 0.125%, and extend its maturity from December 7, 2023 to February 13, 2025. At December 31, 2020, the Company had letters of credit of $0.2 million outstanding and therefore $749.8 million was available under the Credit Facility.
•Term Loan - MG Holdings II’s term loan. At December 31, 2019, the Term Loan bore interest at LIBOR plus 2.50% and the then applicable rate was 4.44%. On February 13, 2020, the Term Loan was amended to reprice the outstanding balance to LIBOR plus 1.75% and extend its maturity from November 16, 2022 to February 13, 2027. At December 31, 2020, the applicable interest rate was 1.96% and $425 million was outstanding.
•6.375% Senior Notes - MG Holdings II’s 6.375% Senior Notes, which were redeemed on June 11, 2020 with the proceeds from the 4.625% Senior Notes.
•5.00% Senior Notes - MG Holdings II’s 5.00% Senior Notes due December 15, 2027, with interest payable each June 15 and December 15, which were issued on December 4, 2017. At December 31, 2020, $450 million aggregate principal amount was outstanding.
•5.625% Senior Notes - MG Holdings II’s 5.625% Senior Notes due February 15, 2029, with interest payable each February 15 and August 15, which were issued on February 15, 2019. At December 31, 2020, $350 million aggregate principal amount was outstanding.
•4.125% Senior Notes - MG Holdings II’s 4.125% Senior Notes due August 1, 2030, with interest payable each February 1 and August 1, which were issued on February 11, 2020. The proceeds were used to pay expenses associated with the offering and fund a portion of the $3.00 per common share of Former Match Group that was payable in connection with the Separation. At December 31, 2020, $500 million aggregate principal amount was outstanding.
•4.625% Senior Notes - MG Holdings II’s 4.625% Senior Notes due June 1, 2028, with interest payable each June 1 and December 1, which were issued on May 19, 2020. The proceeds were used to redeem the outstanding 6.375% Senior Notes, for general corporate purposes, and to pay expenses associated with the offering. At December 31, 2020, $500 million aggregate principal amount was outstanding.
•2022 Exchangeable Notes - During the third quarter of 2017, Match Group FinanceCo, Inc., a subsidiary of the Company, issued $517.5 million aggregate principal amount of 0.875% Exchangeable Senior Notes due October 1, 2022, which are exchangeable into shares of the Company's common stock. Interest is payable each April 1 and October 1. The outstanding balance of the 2022 Exchangeable Notes at December 31, 2020 was $517.5 million.
•2026 Exchangeable Notes - During the second quarter of 2019, Match Group FinanceCo 2, Inc., a subsidiary of the Company, issued $575.0 million aggregate principal amount of 0.875% Exchangeable Senior Notes due June 15, 2026, which are exchangeable into shares of the Company's common stock. Interest is payable each June 15 and December 15. The outstanding balance of the 2026 Exchangeable Notes at December 31, 2020 was $575 million.
•2030 Exchangeable Notes - During the second quarter of 2019, Match Group FinanceCo 3, Inc., a subsidiary of the Company, issued $575.0 million aggregate principal amount of 2.00% Exchangeable Senior Notes due January 15, 2030, which are exchangeable into shares of the Company's common stock. Interest is payable each January 15 and July 15. The outstanding balance of the 2030 Exchangeable Notes at December 31, 2020 was $575 million.
Non-GAAP financial measure:
•Adjusted Earnings Before Interest, Taxes, Depreciation and Amortization (“Adjusted EBITDA”) - is a Non-GAAP financial measure. See “Principles of Financial Reporting” for the definition of Adjusted EBITDA and a reconciliation of net earnings attributable to Match Group, Inc. shareholders to operating income and Adjusted EBITDA.
MANAGEMENT OVERVIEW
Match Group, Inc., through its portfolio companies, is a leading provider of dating products available globally. Our portfolio of brands includes Tinder®, Match®, Meetic®, OkCupid®, Hinge®, Pairs™, PlentyOfFish®, and OurTime®, as well as a number of other brands, each designed to increase our users’ likelihood of finding a meaningful connection. Through our portfolio companies and their trusted brands, we provide tailored products to meet the varying preferences of our users. Our products are available in over 40 languages to our users all over the world.
Sources of Revenue
All our products provide the use of certain features for free, and then offer a variety of additional features to Subscribers. Our revenue is primarily derived directly from users in the form of recurring subscription fees.
Subscription revenue is presented net of credits and credit card chargebacks. Subscribers pay in advance, primarily by using a credit card or through mobile app stores, and, subject to certain conditions identified in our terms and conditions, all purchases are final and nonrefundable. Fees collected, or contractually due, in advance
for subscriptions are deferred and recognized as revenue using the straight-line method over the term of the applicable subscription period, which primarily ranges from one to six months, and corresponding in-app purchase fees incurred on such transactions, if any, are deferred and expensed over the same period. We also earn revenue from the purchase of à la carte features and from online advertising. Revenue from the purchase of à la carte features is recognized based on usage. Online advertising revenue is recognized every time an ad is displayed.
Trends affecting our business
Over the last several years, we have seen significant changes in our business. Tinder has grown from incubation to the largest contributing brand in our portfolio and in 2020 our other brands also returned to growth in the aggregate. This in turn has allowed us to invest in or acquire brands such as Hinge and Hawaya and incubate new brands such as Chispa, BLK, and Upward, where we see additional growth opportunities. With our evolving portfolio of brands, we have seen a number of significant trends in our business in recent years, including the following:
Lower cost users. All of our brands rely on word-of-mouth, or free, user acquisition to varying degrees. Word-of-mouth acquisition is typically a function of scale (with larger communities driving greater numbers of referrals), youthfulness (with the viral effect being more pronounced in younger populations due, in part, to a significantly higher concentration of single people in any given social circle and the increased adoption of social media and similar platforms among such populations), and monetization rate (with people generally more likely to talk openly about using dating products that are less heavily monetized). Additionally, some, but not all, of our brands spend meaningfully on paid marketing. Accordingly, the average amount we spend to acquire a user differs significantly across brands based in large part on each brand’s mix of paid and free acquisition channels. As our mix has shifted toward younger users, our mix of acquisition channels has shifted toward lower cost channels, driving a decline over the past several years in the average amount we spend to acquire a new user across our portfolio. As a percentage of revenue, our costs of acquiring users have declined.
Changing paid acquisition dynamics. Even as our acquisition of lower cost users increases, paid acquisition of users remains an important driver of our business. The channels through which we market our brands are always evolving, but we are currently in a period of rapid change as TV and video consumption patterns evolve and internet consumption occurs regularly on mobile devices. As we adapt our paid marketing activities to maximize user engagement with our brands, we may increase our use of paid advertising at brands where we traditionally relied on word-of-mouth engagement to leverage these shifts in media consumption patterns and fuel international growth. Other brands in our portfolio may reduce paid marketing activities to reflect the change in audience engagement.
In-App Purchase Fees. Purchases made by our customers through mobile applications, as opposed to desktop or mobile web, continue to increase. Purchases processed through the in-app payments systems provided by the Apple App Store and Google Play Store are subject to in-app purchase fees, which are generally 30% of the purchase price. As a result, the percentage of our revenues paid to Apple and Google continues to be a significant expense. In 2019, Tinder began offering subscribers an alternative payment method to Google’s in-app payment system similar to the payment alternatives other brands in our portfolio have historically offered to subscribers through mobile apps on Android. Google has announced that beginning in September 2021, all purchases will be required to be processed through the Google Play Store and subject to in-app purchase fees. To the extent that app stores fee change, or the mix of our revenue generated through app stores shifts, our results, in particular our profit measures, could be impacted.
Increase in acceptance and growth of dating products globally. Over the past decade, there has been meaningful growth in dating product usage in North America and Western Europe, and we see the potential for similar growth in the rest of the world in the years ahead. As more internet-connected singles utilize online dating products and the stigma around dating continues to erode, we believe that there is potential for accelerating growth in the use of dating products globally.
Impacts of the Coronavirus. When the novel coronavirus (“COVID-19”) first hit Western Europe and then certain major metropolitan centers in the U.S. in the Spring of 2020, particularly New York City, engagement (messages sent, daily active users, Swipes® on Tinder) increased significantly, but subscribers who purchase a subscription for the first time (“first-time subscribers”) declined at most of our brands as meeting in person was restricted. Over the summer, as users began to meet outdoors first-time subscribers increased to above pre-
COVID-19 levels. Since the end of the summer, the resurgence of COVID-19 lockdowns has once again negatively impacted first-time subscriber trends, though not as severely as in the spring of 2020.
Other factors affecting the comparability of our results
Advertising spend. Our advertising spend, which is included in our selling and marketing expense, has consistently been one of our larger operating expenses. How we deploy our advertising spend varies among brands, with the majority of our advertising spend taking place online, including search engines, social media sites, streaming services and influencers. Additionally, some brands utilize television and out-of-home marketing campaigns, such as on outdoor billboards. For established brands, we seek to optimize for total return on advertising spend by frequently analyzing and adjusting spend to focus on marketing channels and markets that generate returns above our thresholds. Our data-driven approach provides us the flexibility to scale and optimize our advertising spend. We spend advertising dollars against an expected lifetime value of a Subscriber that is realized over a multi-year period; and while this advertising spend is intended to be profitable on that basis, it is nearly always negative during the period in which the expense is incurred. For newer brands that are gaining scale, or existing brands that are expanding into new geographies, we may make incremental advertising investments to establish the brand before optimizing monetization of the brand. In general, our more established brands spend a higher proportion of their revenue on advertising while our newer brands spend a lower proportion and tend to rely more on word of mouth and other viral marketing. Additionally, advertising spend is typically higher during the first quarter of our fiscal year, and lower during the fourth quarter. See “Seasonality” below. We increased our advertising spend as advertising rates declined during the COVID-19 outbreak.
Seasonality. Historically, our business has experienced seasonal fluctuations in quarterly operating results, particularly with respect to our profit measurements. This is driven primarily by a higher concentration of advertising spend in the first quarter, when advertising prices tend to be the lowest and demand for our products tends to be highest, and a lower concentration of advertising spend in the fourth quarter, when advertising costs tend to be highest and demand for our products tends to be lowest. Seasonality is not consistent across our brands, with brands targeted at older users generally showing more seasonality than brands targeted at younger users.
International markets. Our products are available across the world. Our international revenue represented 53% of our total revenue for both of the years ended December 31, 2020 and 2019. We vary our pricing to align with local market conditions and our international businesses typically earn revenue in local currencies. As foreign currency exchange rates change, translation of the statement of operations of our international businesses into U.S. dollars affects year-over-year comparability of operating results.
2020 Consolidated Results
In 2020, revenue, operating income and Adjusted EBITDA grew 17%, 16% and 15%, respectively. Revenue growth was primarily due to strong growth at Tinder and additional contributions from Hinge, Pairs, and PlentyOfFish. The growth in operating income and Adjusted EBITDA was due to the higher revenue and lower selling and marketing expense as a percentage of revenue due to the continued product mix shift toward brands with lower marketing spend as a percentage of revenue. Operating income and Adjusted EBTIDA were also impacted by an increase in cost of revenue expense primarily due to higher in-app purchase fees as a result of growing revenue sourced through mobile app stores, increased web operation costs, and live video costs.
Results of Operations for the years ended December 31, 2020, 2019 and 2018
The following discussion should be read in conjunction with “Item 8. Consolidated Financial Statements and Supplementary Data.”
Revenue
| | | | | | | | | | | | | | | | | | | | | | | | | | | | | | | | | | | | | | | | | |
| Years Ended December 31, |
| 2020 | | Change | | % Change | | 2019 | | Change | | % Change | | 2018 |
| | | | | | | | | | | | | |
| (Amounts in thousands, except ARPU) |
| Direct Revenue: | | | | | | | | | | | | | |
| North America | $ | 1,185,307 | | | $ | 161,146 | | | 16% | | $ | 1,024,161 | | | $ | 121,683 | | | 13% | | $ | 902,478 | |
| International | 1,159,417 | | | 176,404 | | | 18% | | 983,013 | | | 208,320 | | | 27% | | 774,693 | |
| Total Direct Revenue | 2,344,724 | | | 337,550 | | | 17% | | 2,007,174 | | | 330,003 | | | 20% | | 1,677,171 | |
| Indirect Revenue | 46,545 | | | 2,461 | | | 6% | | 44,084 | | | (8,595) | | | (16)% | | 52,679 | |
Total Revenue | $ | 2,391,269 | | | $ | 340,011 | | | 17% | | $ | 2,051,258 | | | $ | 321,408 | | | 19% | | $ | 1,729,850 | |
| | | | | | | | | | | | | |
| | | | | | | | | | | | | |
| | | | | | | | | | | | | |
| Direct Revenue | | | | | | | | | | | | | |
| Tinder | $ | 1,355,400 | | | $ | 203,355 | | | 18% | | $ | 1,152,045 | | | $ | 346,729 | | | 43% | | $ | 805,316 | |
| Other brands | 989,324 | | | 134,195 | | | 16% | | 855,129 | | | (16,726) | | | (2)% | | 871,855 | |
| Total Direct Revenue | $ | 2,344,724 | | | $ | 337,550 | | | 17% | | $ | 2,007,174 | | | $ | 330,003 | | | 20% | | $ | 1,677,171 | |
| | | | | | | | | | | | | |
| Percentage of Total Revenue: | | | | | | | | | | | | |
| Direct Revenue: | | | | | | | | | | | | | |
| North America | 50% | | | | | | 50% | | | | | | 52% |
| International | 48% | | | | | | 48% | | | | | | 45% |
| Total Direct Revenue | 98% | | | | | | 98% | | | | | | 97% |
| Indirect Revenue | 2% | | | | | | 2% | | | | | | 3% |
| Total Revenue | 100% | | | | | | 100% | | | | | | 100% |
| | | | | | | | | | | | | |
| | | | | | | | | | | | | |
| | | | | | | | | | | | | |
| Average Subscribers: | | | | | | | | | | | | |
| North America | 4,858 | | | 304 | | | 7% | | 4,554 | | | 393 | | | 9% | | 4,161 | |
| International | 5,572 | | | 843 | | | 18% | | 4,729 | | | 1,017 | | | 27% | | 3,712 | |
| Total | 10,430 | | | 1,147 | | | 12% | | 9,283 | | | 1,410 | | | 18% | | 7,873 | |
| | | | | | | | | | | | | |
| (Change calculated using non-rounded numbers) |
| ARPU: | | | | | | | | | | | | | |
| North America | $ | 0.65 | | | | | 7% | | $ | 0.61 | | | | | 4% | | $ | 0.59 | |
| International | $ | 0.56 | | | | | —% | | $ | 0.56 | | | | | —% | | $ | 0.56 | |
| Total | $ | 0.60 | | | $ | 0.02 | | | 3% | | $ | 0.58 | | | $ | 0.01 | | | 2% | | $ | 0.57 | |
For the year ended December 31, 2020 compared to the year ended December 31, 2019
International Direct Revenue grew $176.4 million, or 18%, in 2020 versus 2019, driven by 18% growth in Average Subscribers. North America Direct Revenue grew $161.1 million, or 16%, in 2020 versus 2019, driven by 7% growth in Average Subscribers, a 7% increase in ARPU, and growth of non-subscriber live streaming video revenue at PlentyOfFish.
Growth in International and North America Average Subscribers was primarily driven by Tinder. Hinge, BLK and Chispa also contributed to North America Average Subscriber growth and Pairs contributed to International Average Subscriber growth. North America ARPU increased primarily due to increases in à la carte purchases at Tinder and PlentyOfFish and optimized subscription pricing at Hinge.
Indirect Revenue increased $2.5 million primarily due to higher rates per impression.
For the year ended December 31, 2019 compared to the year ended December 31, 2018
International Direct Revenue grew $208.3 million, or 27%, in 2019 versus 2018, driven by 27% growth in Average Subscribers. North America Direct Revenue grew $121.7 million, or 13%, in 2019 versus 2018, driven by 9% growth in Average Subscribers, and a 4% increase in ARPU.
Growth in International and North America Average Subscribers was primarily driven by Tinder. Hinge and Pairs also contributed to subscriber growth in North America and International, respectively. North America ARPU increased primarily due to increases in ARPU at Tinder as Subscribers purchased premium subscriptions, such as Tinder Gold, as well as additional à la carte features. International ARPU was unfavorably impacted by the strength of the U.S. dollar relative to the Euro, British pound (“GBP”), and certain other currencies.
Indirect Revenue decreased $8.6 million primarily due to lower impressions and a lower price per impression received from an advertising network provider.
Cost of revenue (exclusive of depreciation)
| | | | | | | | | | | | | | | | | | | | | | | | | | | | | | | | | | | | | | | | | |
| Years Ended December 31, |
| 2020 | | $ Change | | % Change | | 2019 | | $ Change | | % Change | | 2018 |
| | | | | | | | | | | | | |
| (Dollars in thousands) |
| Cost of revenue | $635,833 | | $108,649 | | 21% | | $527,184 | | $117,184 | | 29% | | $410,000 |
| Percentage of revenue | 27% | | | | | | 26% | | | | | | 24% |
For the year ended December 31, 2020 compared to the year ended December 31, 2019
Cost of revenue increased due to an increase in in-app purchase fees of $50.0 million, as revenue continues to be increasingly sourced through mobile app stores; an increase in hosting fees of $24.0 million; an increase of $17.9 million in partner related costs associated with our live video streaming; and an increase in compensation expense of $11.5 million related to increased headcount and other operating costs in customer care.
For the year ended December 31, 2019 compared to the year ended December 31, 2018
Cost of revenue increased due to an increase in in-app purchase fees of $80.1 million, as revenue continues to be increasingly sourced through mobile app stores; an increase in hosting fees of $21.9 million; and an increase in compensation expense of $11.2 million related to increased headcount and other operating costs in customer care.
Selling and marketing expense
| | | | | | | | | | | | | | | | | | | | | | | | | | | | | | | | | | | | | | | | | |
| Years Ended December 31, |
| 2020 | | $ Change | | % Change | | 2019 | | $ Change | | % Change | | 2018 |
| | | | | | | | | | | | | |
| (Dollars in thousands) |
Selling and marketing expense | $479,907 | | $52,467 | | 12% | | $427,440 | | $7,486 | | 2% | | $419,954 |
| Percentage of revenue | 20% | | | | | | 21% | | | | | | 24% |
For the year ended December 31, 2020 compared to the year ended December 31, 2019
Selling and marketing expense increased primarily due to higher marketing spend at multiple brands, and an increase in compensation expense of $5.7 million. Selling and marketing expense continued to decline as a percentage of revenue as we continue to generate revenue growth from brands with relatively lower marketing expense.
For the year ended December 31, 2019 compared to the year ended December 31, 2018
Selling and marketing expense increased primarily due to increases in spending at Tinder, Hinge, and Pairs, partially offset by decreases at Meetic, Match, and PlentyOfFish. Selling and marketing expense declined as a percentage of revenue as we continue to generate revenue growth from brands with relatively lower marketing expense.
General and administrative expense
| | | | | | | | | | | | | | | | | | | | | | | | | | | | | | | | | | | | | | | | | |
| Years Ended December 31, |
| 2020 | | $ Change | | % Change | | 2019 | | $ Change | | % Change | | 2018 |
| | | | | | | | | | | | | |
| (Dollars in thousands) |
General and administrative expense | $311,207 | | $55,069 | | 21% | | $256,138 | | $73,886 | | 41% | | $182,252 |
| Percentage of revenue | 13% | | | | | | 12% | | | | | | 11% |
For the year ended December 31, 2020 compared to the year ended December 31, 2019
General and administrative expense increased primarily due to an increase in compensation of $39.3 million primarily related to an increase in headcount and an increase in stock-based compensation expense resulting from a modification charge in 2020; an increase of $6.7 million for non-income taxes, primarily digital services taxes; and an increase of $6.4 million in legal expenses.
For the year ended December 31, 2019 compared to the year ended December 31, 2018
General and administrative expense increased primarily due to an increase of $38.1 million in legal fees; an increase in compensation of $19.0 million primarily related to stock-based compensation expense due to new equity awards made since the prior year period, modification charges during 2019, and an increase in headcount; and an increase of $4.7 million for non-income taxes that includes the recently enacted French Digital Services Tax, which was made effective retroactively to January 1, 2019.
Product development expense
| | | | | | | | | | | | | | | | | | | | | | | | | | | | | | | | | | | | | | | | | |
| Years Ended December 31, |
| 2020 | | $ Change | | % Change | | 2019 | | $ Change | | % Change | | 2018 |
| | | | | | | | | | | | | |
| (Dollars in thousands) |
Product development expense | $169,811 | | $17,851 | | 12% | | $151,960 | | $19,930 | | 15% | | $132,030 |
| Percentage of revenue | 7% | | | | | | 7% | | | | | | 8% |
For the year ended December 31, 2020 compared to the year ended December 31, 2019
Product development expense increased primarily as a result of an increase of $18.7 million in compensation primarily due to increased headcount at Tinder.
For the year ended December 31, 2019 compared to the year ended December 31, 2018
Product development expense increased primarily as a result of an increase of $18.6 million in compensation, including an increase of $10.3 million in stock-based compensation expense primarily due to the vesting of certain awards for which the market condition was met, and increased headcount at Tinder.
Depreciation
| | | | | | | | | | | | | | | | | | | | | | | | | | | | | | | | | | | | | | | | | |
| Years Ended December 31, |
| 2020 | | $ Change | | % Change | | 2019 | | $ Change | | % Change | | 2018 |
| | | | | | | | | | | | | |
| (Dollars in thousands) |
| Depreciation | $41,271 | | $6,916 | | 20% | | $34,355 | | $(472) | | (1)% | | $34,827 |
| Percentage of revenue | 2% | | | | | | 2% | | | | | | 2% |
For the year ended December 31, 2020 compared to the year ended December 31, 2019
Depreciation increased primarily due to an increase in internally developed software being placed in service.
For the year ended December 31, 2019 compared to the year ended December 31, 2018
Depreciation decreased primarily due to certain internally developed software becoming fully depreciated, partially offset by increased depreciation related to leasehold improvements.
Operating Income and Adjusted EBITDA
| | | | | | | | | | | | | | | | | | | | | | | | | | | | | | | | | | | | | | | | | |
| Years Ended December 31, |
| 2020 | | $ Change | | % Change | | 2019 | | $ Change | | % Change | | 2018 |
| | | | | | | | | | | | | |
| (Dollars in thousands) |
| | | | | | | | | | | | | |
| Operating income | $745,715 | | $100,261 | | 16% | | $645,454 | | $95,985 | | 17% | | $549,469 |
| | | | | | | | | | | | | |
| | | | | | | | | | | | | |
| | | | | | | | | | | | | |
| Percentage of revenue | 31% | | | | | | 31% | | | | | | 32% |
| | | | | | | | | | | | | |
| Adjusted EBITDA | $896,779 | | $118,519 | | 15% | | $778,260 | | $126,295 | | 19% | | $651,965 |
| | | | | | | | | | | | | |
| | | | | | | | | | | | | |
| | | | | | | | | | | | | |
| Percentage of revenue | 38% | | | | | | 38% | | | | | | 38% |
For a reconciliation of net earnings attributable to Match Group, Inc. shareholders to operating income and Adjusted EBITDA, see “Principles of Financial Reporting.”
For the year ended December 31, 2020 compared to the year ended December 31, 2019
Operating income and Adjusted EBITDA increased 16% to $100.3 million and 15% to $118.5 million, respectively, primarily as a result of the increase in revenue of $340.0 million driven by growth at multiple brands and lower selling and marketing expense as a percentage of revenue, partially offset by an increase in cost of revenue due to higher in-app purchase fees, as revenue is increasingly sourced through mobile app stores, increased web operation costs, and live video costs.
At December 31, 2020, there was $142.5 million of unrecognized compensation cost, net of estimated forfeitures, related to all equity-based awards, which is expected to be recognized over a weighted average period of approximately 2.3 years.
For the year ended December 31, 2019 compared to the year ended December 31, 2018
Operating income and Adjusted EBITDA increased 17% to $96.0 million and 19% to $126.3 million, respectively, primarily as a result of the increase in revenue of $321.4 million and lower selling and marketing expense as a percentage of revenue due to the ongoing product mix shift toward brands with lower marketing spend as a percentage of revenue, partially offset by an increase in cost of revenue due to higher in-app purchase fees and an increase in legal fees. Operating income was also impacted by higher stock-based compensation expense as a percentage of revenue and an increase in amortization due to the impairment of the Match brand in the UK, resulting in decreased growth compared to Adjusted EBITDA.
Interest expense
| | | | | | | | | | | | | | | | | | | | | | | | | | | | | | | | | | | | | | | | | |
| Years Ended December 31, |
| 2020 | | $ Change | | % Change | | 2019 | | $ Change | | % Change | | 2018 |
| | | | | | | | | | | | | |
| (Dollars in thousands) |
Interest expense | $174,791 | | $34,221 | | 24% | | $140,570 | | $46,002 | | 49% | | $94,568 |
| | | | | | | | | | | | | |
For the year ended December 31, 2020 compared to the year ended December 31, 2019
Interest expense increased primarily due to the issuance of the 4.125% Senior Notes on February 11, 2020 and the issuance of the 4.625% Senior Notes on May 19, 2020. Additionally, the 2026 and 2030 Senior Exchangeable Notes were outstanding for the entire year. Partially offsetting these increases were decreases due to the redemption of the 6.375% Senior Notes during 2020 and a lower LIBOR rate on the Term Loan.
For the year ended December 31, 2019 compared to the year ended December 31, 2018
Interest expense increased primarily due to the issuance of the 5.625% Senior Notes in February 2019. Additionally, the interest rate on the Term Loan, which is based on LIBOR, was higher in 2019.
Other income (expense), net
| | | | | | | | | | | | | | | | | | | | | | | | | | | | | | | | | | | | | | | | | |
| Years Ended December 31, |
| 2020 | | $ Change | | % Change | | 2019 | | $ Change | | % Change | | 2018 |
| | | | | | | | | | | | | |
| (Dollars in thousands) |
| Other income (expense), net | $15,861 | | $17,887 | | NM | | $(2,026) | | $(9,536) | | NM | | $7,510 |
________________________
NM = not meaningful
Other income, net, in 2020 includes a legal settlement of $35.0 million and interest income of $2.7 million, partially offset by a loss on redemption of bonds of $16.5 million, expense of $3.4 million related to mark-to-market adjustments pertaining to liability classified equity instruments, and $0.6 million in net foreign currency losses in the period.
Other expense, net, in 2019 includes a $4.0 million impairment of an equity investment, expense of $1.7 million related to a mark-to-market adjustment pertaining to a liability classified equity instrument, and $0.9 million in net foreign currency losses in the period, partially offset by interest income of $4.4 million.
Other income, net in 2018 includes $5.3 million in net foreign currency exchange gains due primarily to a strengthening of the U.S. dollar relative to the British Pound in the period and $4.9 million of interest income, partially offset by $2.1 million related to impairments of certain equity investments and $0.7 million related to a mark-to-market adjustment pertaining to a subsidiary denominated equity instrument.
Income tax provision
| | | | | | | | | | | | | | | | | | | | | | | | | | | | | | | | | | | | | | | | | |
| Years Ended December 31, |
| 2020 | | $ Change | | % Change | | 2019 | | $ Change | | % Change | | 2018 |
| | | | | | | | | | | | | |
| (Dollars in thousands) |
Income tax provision | $32,874 | | $24,649 | | 300% | | $8,225 | | $(3,082) | | (27)% | | $11,307 |
Effective income tax rate | 6% | | | | | | 2% | | | | | | 2% |
For discussion of income taxes, see “Note 3—Income Taxes” to the consolidated financial statements included in “Item 8—Consolidated Financial Statements and Supplementary Data.”
For the years ended December 31, 2020, 2019, and 2018, the Company recorded an income tax provision of $32.9 million, $8.2 million, and $11.3 million, respectively, representing an effective tax rate of 6%, 2%, and 2%, respectively, which is lower than the U.S. statutory rate of 21% due primarily to excess tax benefits generated by (i) the exercise and vesting of stock-based awards and (ii) research credits. In 2020, these benefits were partially offset by an increase in the valuation allowance for foreign tax credits.
On March 27, 2020, the Coronavirus Aid, Relief and Economic Security Act (the “CARES Act”) was enacted to respond to economic challenges due to COVID-19. The CARES Act provided Match Group accelerated depreciation deductions and a relaxation of limitations on interest expense deductions, both of which impact the timing of the realizability of our federal and state net operating loss deferred tax assets. The CARES Act did not have a material impact on our income tax provision for the year ended December 31, 2020, or our ability to recover our deferred tax assets.
Related party transactions
For discussion of related party transactions, see “Note 15—Related Party Transactions” to the consolidated financial statements included in “Item 8—Consolidated Financial Statements and Supplementary Data.”
PRINCIPLES OF FINANCIAL REPORTING
Match Group reports Adjusted EBITDA and Revenue excluding foreign exchange effects, both of which are supplemental measures to U.S. generally accepted accounting principles (“GAAP”). Adjusted EBITDA is among the primary metrics by which we evaluate the performance of our business, on which our internal budget is based, and by which management is compensated. Revenue excluding foreign exchange effects provides a comparable framework for assessing how our business performed without the effect of exchange rate differences when compared to prior periods. We believe that investors should have access to the same set of tools that we use in analyzing our results. These non-GAAP measures should be considered in addition to results prepared in accordance with GAAP, but should not be considered a substitute for or superior to GAAP results. Match Group endeavors to compensate for the limitations of the non-GAAP measures presented by providing the comparable GAAP measure with equal or greater prominence and descriptions of the reconciling items, including quantifying such items, to derive the non-GAAP measure. We encourage investors to examine the reconciling adjustments between the GAAP and non-GAAP measures, which we discuss below.
Adjusted EBITDA
Adjusted Earnings Before Interest, Taxes, Depreciation and Amortization (“Adjusted EBITDA”) is defined as operating income excluding: (1) stock-based compensation expense; (2) depreciation; and (3) acquisition-related items consisting of (i) amortization of intangible assets and impairments of goodwill and intangible assets, if applicable, and (ii) gains and losses recognized on changes in the fair value of contingent consideration arrangements. We believe this measure is useful for analysts and investors as this measure allows a more meaningful comparison between our performance and that of our competitors. The above items are excluded from our Adjusted EBITDA measure because they are non-cash in nature. Adjusted EBITDA has certain limitations because it excludes the impact of these expenses.
Non-Cash Expenses That Are Excluded From Adjusted EBITDA
Stock-based compensation expense consists principally of expense associated with the grants of stock options, restricted stock units (“RSUs”), performance-based RSUs, and market-based awards. These expenses are not paid in cash, and we include the related shares in our fully diluted shares outstanding using the treasury stock method; however, performance-based RSUs and market-based awards are included only to the extent the applicable performance or market condition(s) have been met (assuming the end of the reporting period is the end of the contingency period). To the extent that stock-based awards are settled on a net basis, we remit the required tax-withholding amounts from our current funds.
Depreciation is a non-cash expense relating to our property and equipment and is computed using the straight-line method to allocate the cost of depreciable assets to operations over their estimated useful lives, or, in the case of leasehold improvements, the lease term, if shorter.
Amortization of intangible assets and impairments of goodwill and intangible assets are non-cash expenses related primarily to acquisitions. At the time of acquisition, the identifiable definite-lived intangible assets of the acquired company, such as customer lists, trade names, and technology, are valued and amortized over their estimated lives. Value is also assigned to (i) acquired indefinite-lived intangible assets, which consist of trade names and trademarks, and (ii) goodwill, which are not subject to amortization. An impairment is recorded when the carrying value of an intangible asset or goodwill exceeds its fair value. We believe that intangible assets represent costs incurred by the acquired company to build value prior to acquisition and the related amortization and impairment charges of intangible assets or goodwill, if applicable, are not ongoing costs of doing business.
Gains and losses recognized on changes in the fair value of contingent consideration arrangements are accounting adjustments to report contingent consideration liabilities at fair value. These adjustments can be highly variable and are excluded from our assessment of performance because they are considered non-operational in nature and, therefore, are not indicative of current or future performance or the ongoing cost of doing business.
The following table reconciles net earnings attributable to Match Group, Inc. shareholders to operating income and Adjusted EBITDA:
| | | | | | | | | | | | | | | | | |
| Years Ended December 31, |
| 2020 | | 2019 | | 2018 |
| | | | | |
| (In thousands) |
| Net earnings attributable to Match Group, Inc. shareholders | $ | 128,561 | | | $ | 431,131 | | | $ | 626,961 | |
Add back: | | | | | |
| Net earnings attributable to noncontrolling interests | 59,280 | | | 112,689 | | | 130,786 | |
| Loss (earnings) from discontinued operations, net of tax | 366,070 | | | (49,187) | | | (306,643) | |
| Income tax provision | 32,874 | | | 8,225 | | | 11,307 | |
| Other (income) expense, net | (15,861) | | | 2,026 | | | (7,510) | |
Interest expense | 174,791 | | | 140,570 | | | 94,568 | |
Operating Income | 745,715 | | | 645,454 | | | 549,469 | |
| Stock-based compensation expense | 102,268 | | | 89,724 | | | 66,031 | |
| Depreciation | 41,271 | | | 34,355 | | | 34,827 | |
Amortization of intangibles | 7,525 | | | 8,727 | | | 1,318 | |
Acquisition-related contingent consideration fair value adjustments | — | | | — | | | 320 | |
| Adjusted EBITDA | $ | 896,779 | | | $ | 778,260 | | | $ | 651,965 | |
Effects of Changes in Foreign Exchange Rates on Revenue
The impact of foreign exchange rates on the Company, due to its global reach, may be an important factor in understanding period over period comparisons if movement in exchange rates is significant. Since our results are reported in U.S. dollars, international revenue is favorably impacted as the U.S. dollar weakens relative to other currencies, and unfavorably impacted as the U.S. dollar strengthens relative to other currencies. We believe the presentation of revenue excluding the effects from foreign exchange, in addition to reported revenue, helps improve the ability to understand the Company’s performance because it excludes the impact of foreign currency volatility that is not indicative of Match Group’s core operating results.
Revenue excluding foreign exchange effects compares results between periods as if exchange rates had remained constant period over period. Revenue excluding foreign exchange effects is calculated by translating current period revenue using prior period exchange rates. The percentage change in revenue excluding foreign exchange effects is calculated by determining the change in current period revenue over prior period revenue where current period revenue is translated using prior period exchange rates.
The following tables presents the impact of foreign exchange on total revenue, ARPU, and International ARPU for the year ended December 31, 2020 compared to the year ended December 31, 2019 and the year ended December 31, 2019 compared to the year ended December 31, 2018:
| | | | | | | | | | | | | | | | | | | | | | | |
| | Years Ended December 31, |
| | 2020 | | $ Change | | % Change | | 2019 |
| | | | | | | |
| | (Dollars in thousands, except ARPU) |
| Revenue, as reported | $ | 2,391,269 | | | $ | 340,011 | | | 17% | | $ | 2,051,258 | |
| Foreign exchange effects | 6,412 | | | | | | | |
| Revenue excluding foreign exchange effects | $ | 2,397,681 | | | $ | 346,423 | | | 17% | | $ | 2,051,258 | |
| | | | | | | |
| | | | | | | |
| | | | | | | |
| | | | | | | |
| | | | | | | |
| (Percentage change calculated using non-rounded numbers) | | | | | | | |
| ARPU, as reported | $ | 0.60 | | | | | 3% | | $ | 0.58 | |
| Foreign exchange effects | 0.00 | | | | | | | |
| ARPU, excluding foreign exchange effects | $ | 0.60 | | | | | 3% | | $ | 0.58 | |
| | | | | | | |
| International ARPU, as reported | $ | 0.56 | | | | | 0% | | $ | 0.56 | |
| Foreign exchange effects | 0.00 | | | | | | | |
| International ARPU, excluding foreign exchange effects | $ | 0.56 | | | | | 0% | | $ | 0.56 | |
| | | | | | | | | | | | | | | | | | | | | | | |
| | Years Ended December 31, |
| | 2019 | | $ Change | | % Change | | 2018 |
| | | | | | | |
| | (Dollars in thousands, except ARPU) |
| Revenue, as reported | $ | 2,051,258 | | | $ | 321,408 | | | 19% | | $ | 1,729,850 | |
| Foreign exchange effects | 47,459 | | | | | | | |
| Revenue excluding foreign exchange effects | $ | 2,098,717 | | | $ | 368,867 | | | 21% | | $ | 1,729,850 | |
| | | | | | | |
| | | | | | | |
| | | | | | | |
| | | | | | | |
| | | | | | | |
| (Percentage change calculated using non-rounded numbers) | | | | | | | |
| ARPU, as reported | $ | 0.58 | | | | | 2% | | $ | 0.57 | |
| Foreign exchange effects | 0.02 | | | | | | | |
| ARPU, excluding foreign exchange effects | $ | 0.60 | | | | | 4% | | $ | 0.57 | |
| | | | | | | |
| International ARPU, as reported | $ | 0.56 | | | | | —% | | $ | 0.56 | |
| Foreign exchange effects | 0.03 | | | | | | | |
| International ARPU, excluding foreign exchange effects | $ | 0.59 | | | | | 5% | | $ | 0.56 | |
FINANCIAL POSITION, LIQUIDITY AND CAPITAL RESOURCES
Financial Position
| | | | | | | | | | | |
| December 31, 2020 | | December 31, 2019 |
| | | |
| (In thousands) |
| Cash and cash equivalents: | | | |
United States | $ | 581,038 | | | $ | 322,267 | |
All other countries | 158,126 | | | 143,409 | |
| Total cash and cash equivalents | $ | 739,164 | | | $ | 465,676 | |
| | | |
| | | |
| | | |
| Long-term debt, net: | | | |
| Credit Facility due February 13, 2025 | $ | — | | | $ | — | |
| Term Loan due February 13, 2027 | 425,000 | | | 425,000 | |
| 6.375% Senior Notes | — | | | 400,000 | |
5.00% Senior Notes due December 15, 2027 | 450,000 | | | 450,000 | |
| 4.625% Senior Notes due June 1, 2028 | 500,000 | | | — | |
| 5.625% Senior Notes due February 15, 2029 | 350,000 | | | 350,000 | |
| 4.125% Senior Notes due August 1, 2030 | 500,000 | | | — | |
| 2022 Exchangeable Notes | 517,500 | | | 517,500 | |
| 2026 Exchangeable Notes | 575,000 | | | 575,000 | |
| 2030 Exchangeable Notes | 575,000 | | | 575,000 | |
| Total long-term debt | 3,892,500 | | | 3,292,500 | |
| | | |
Less: unamortized original issue discount and original issue premium, net | 312,891 | | | 357,887 | |
| Less: unamortized debt issuance costs | 44,903 | | | 44,987 | |
| Total long-term debt, net | $ | 3,534,706 | | | $ | 2,889,626 | |
Long-term Debt
For a detailed description of long-term debt, see “Note 7—Long-term Debt, net” to the consolidated financial statements included in “Item 8. Consolidated Financial Statements and Supplementary Data.”
Cash Flow Information
In summary, the Company’s cash flows are as follows:
| | | | | | | | | | | | | | | | | |
| Years ended December 31, |
| 2020 | | 2019 | | 2018 |
| | | | | |
| (In thousands) |
Net cash provided by operating activities attributable to continuing operations | $ | 788,552 | | | $ | 647,989 | | | $ | 611,455 | |
Net cash used in investing activities attributable to continuing operations | (3,922,131) | | | (41,730) | | | (38,204) | |
Net cash provided by (used in) financing activities attributable to continuing operations | 1,787,846 | | | 654,024 | | | (198,768) | |
2020
Net cash provided by operating activities attributable to continuing operations in 2020 includes adjustments to earnings consisting primarily of $102.3 million of stock-based compensation expense; $44.7 million of original issue discount accretion on the Exchangeable Senior Notes; $41.3 million of depreciation; $7.5 million of amortization of intangibles; other adjustments of $26.7 million, which includes a loss on bond
redemption of $16.5 million; and deferred income tax of $5.0 million. The increase in cash from changes in working capital primarily consists of an increase from income taxes payable and receivable of $16.9 million due primarily to the timing of tax payments and refunds; an increase in accounts payable and accrued expenses and other current liabilities of $24.2 million due mainly to the timing of payments, including interest payments; and an increase in deferred revenue of $23.5 million, due mainly to growth in subscription sales. These increases in cash were partially offset by a decrease related to an increase in other assets of $33.2 million primarily related to an increase in prepaid hosting services and an increase in accounts receivable of $24.2 million primarily related to an increase in revenue.
Net cash used in investing activities attributable to continuing operations in 2020 consists primarily of the $3.9 billion of net cash distributed to IAC related to the Separation, which was partially funded by $1.4 billion of net proceeds from the stock issuance in connection with the Separation as noted below, and capital expenditures of $42.4 million that are primarily related to internal development of software and computer hardware to support our products and services.
Net cash provided by financing activities attributable to continuing operations in 2020 is primarily due to proceeds of $1.4 billion from the stock offering in connection with the Separation, which were subsequently transferred to IAC as noted above, proceeds of $1.0 billion from the issuance of the 4.125% and 4.625% Senior Notes, partially offset by the redemption of the $400.0 million 6.375% Senior Notes, payments of $212.0 million for withholding taxes paid on behalf of employees for net settled equity awards of both Former Match Group and Match Group, and purchases of treasury stock of Former Match Group of $132.9 million.
2019
Net cash provided by operating activities attributable to continuing operations in 2019 includes adjustments to earnings consisting primarily of $89.7 million of stock-based compensation expense, $34.4 million of depreciation, $30.4 million of original issue discount accretion on the Exchangeable Senior Notes, and $8.7 million of amortization of intangibles. Partially offsetting these adjustments was deferred income tax of $19.6 million primarily related to net operating loss created by settlement of stock-based awards. The decrease in cash from changes in working capital primarily consists of an increase in other assets of $24.2 million primarily related to an increase in prepaid hosting services, an increase in accounts receivable of $17.9 million primarily related to an increase in revenue, and a decrease from income taxes payable and receivable of $4.2 million due primarily to the timing of tax payments. These decreases in cash were partially offset by an increase in accounts payable and accrued expenses and other current liabilities of $33.7 million due mainly to the timing of payments, including interest payments; and an increase in deferred revenue of $9.5 million, due mainly to growth in subscription sales.
Net cash used in investing activities attributable to continuing operations in 2019 consists primarily of capital expenditures of $39.0 million that are primarily related to internal development of software and computer hardware to support our products and services.
Net cash provided by financing activities attributable to continuing operations in 2019 is primarily due to $1.2 billion from the issuance of the 2026 and 2030 Exchangeable Notes; proceeds of $350.0 million from the issuance of the 5.625% Senior Notes and proceeds of $40.0 million from borrowings under the Credit Facility. Partially offsetting these proceeds were cash payments of $300.0 million for the repayment of borrowings under the Credit Facility, purchases of treasury stock of $216.4 million, $203.2 million for withholding taxes paid on behalf of employees for net settled equity awards, and $136.9 million used to pay the net premium on the 2026 and 2030 Exchangeable Notes hedge and warrant transactions.
2018
Net cash provided by operating activities attributable to continuing operations in 2018 includes adjustments to earnings consisting primarily of $66.0 million of stock-based compensation expense, $34.8 million of depreciation, and $1.3 million of amortization of intangibles. Partially offsetting these adjustments was deferred income tax of $23.0 million primarily related to an increase in tax credit carryforwards, partially offset by the utilization of net operating losses. The increase in cash from changes in working capital primarily consists of an increase in accounts payable and accrued expenses and other current liabilities of $21.4 million due to the timing of payments; a decrease in accounts receivable of $17.3 million primarily related to an accelerated cash receipt from a mobile app store provider; an increase in deferred revenue of $13.1 million, due mainly to growth
in subscription sales; and an increase from income taxes payable and receivable of $26.9 million due primarily to the timing of tax payments. These increases in cash were partially offset by an increase in other assets of $14.6 million primarily related to an increase in capitalized mobile app fees.
Net cash used in investing activities attributable to continuing operations in 2018 consists primarily of capital expenditures of $31.4 million that are primarily related to computer hardware and internal development of software to support our products and services and purchases of investments of $3.8 million, partially offset by net cash acquired in a business combination of $1.1 million.
Net cash used in financing activities attributable to continuing operations in 2018 is primarily due to withholding taxes paid on behalf of employees for net settled stock awards of $207.7 million, purchases of treasury stock of $133.5 million, a cash dividend of $105.1 million, purchases of non-controlling interests of $10.0 million, and debt issuance costs of $1.7 million. Partially offsetting these payments were proceeds of $260.0 million from a draw on the Credit Facility.
Liquidity and Capital Resources
The Company’s principal sources of liquidity are its cash flows generated from operations as well as cash and cash equivalents. At December 31, 2020, $749.8 million was available under the Credit Facility that expires on February 13, 2025.
The Company anticipates that it will need to make capital and other expenditures in connection with the development and expansion of its operations. The Company expects that 2021 cash capital expenditures will be between $80 million and $90 million, an increase from 2020 cash capital expenditures primarily related to leasehold improvements in our new leased New York office space, and building improvements at our company owned buildings in Los Angeles.
In February 2021, the Company entered into a definitive agreement to acquire Hyperconnect, Inc. (“Hyperconnect”), a leading social discovery and video technology company based in Seoul, South Korea. The acquisition is valued at approximately $1.725 billion, subject to customary adjustments for cash, debt-like items, and net working capital at the closing of the acquisition. The Company has the option to pay up to 50% of the consideration in common stock of the Company, with the remaining balance of the consideration paid in cash. The Company expects to fund the cash portion of the consideration with cash on hand and its existing revolving credit facility. The Company may also opt to use additional third-party financing. The acquisition is anticipated to close in the second quarter of 2021, subject to customary closing conditions and receipt of certain regulatory approvals.
At December 31, 2020, all of the Company’s international cash can be repatriated without significant tax consequences.
Our indebtedness could limit our ability to: (i) obtain additional financing to fund working capital needs, acquisitions, capital expenditures, debt service, or other requirements; and (ii) use operating cash flow to pursue acquisitions or invest in other areas, such as developing properties and exploiting business opportunities. The Company may need to raise additional capital through future debt or equity financing to make additional acquisitions and investments or to provide for greater financial flexibility. Additional financing may not be available on terms favorable to the Company or at all.
CONTRACTUAL OBLIGATIONS AND COMMERCIAL COMMITMENTS
| | | | | | | | | | | | | | | | | | | | | | | | | | | | | |
| | Payments Due by Period |
Contractual Obligations(a) | Less Than
1 Year | | 1–3
Years | | 3–5
Years | | More Than
5 Years | | Total |
| | | | | | | | | |
| | (In thousands) |
Long-term debt(b) | $ | 115,581 | | | $ | 744,102 | | | $ | 222,097 | | | $ | 3,714,837 | | | $ | 4,796,617 | |
Operating leases(c) | 14,806 | | | 22,813 | | | 18,172 | | | 62,458 | | | 118,249 | |
Purchase obligation(d) | 54,000 | | | 9,000 | | | 12,000 | | | — | | | 75,000 | |
| Total contractual obligations | $ | 184,387 | | | $ | 775,915 | | | $ | 252,269 | | | $ | 3,777,295 | | | $ | 4,989,866 | |
_______________________________________________________________________________
(a)The Company has excluded $41.8 million in unrecognized tax benefits and related interest from the table above as we are unable to make a reasonably reliable estimate of the period in which these liabilities might be paid. For additional information on income taxes, see “Note 3—Income Taxes” to the consolidated financial statements included in “Item 8—Consolidated Financial Statements and Supplementary Data.”
(b)Represents contractual amounts due including interest on both fixed and variable rate instruments. Long-term debt at December 31, 2020 consists of the 5.00%, 5.625%, 4.125%, and 4.625% Senior Notes of $450 million, $350 million, $500 million, and $500 million, respectively, which bear interest at fixed rates; the 2022, 2026, and 2030 Exchangeable Notes of $518 million, $575 million, and $575 million, respectively, which bear interest at fixed rates; and the Term Loan balance of $425 million, which bears interest at a variable rate. The Term Loan bears interest at LIBOR plus 1.75%, or 1.96%, at December 31, 2020. The amount of interest ultimately paid on the Term Loan may differ based on changes in interest rates and outstanding balances. For additional information on long-term debt, see “Note 7—Long-term Debt, net” to the consolidated financial statements included in “Item 8—Consolidated Financial Statements and Supplementary Data.”
(c)The Company leases office space, data center facilities and equipment used in connection with its operations under various operating leases, many of which contain escalation clauses. The Company is also committed to pay a portion of the related operating expenses under certain lease agreements. These operating expenses are not included in the table above. For additional information on operating leases, see “Note 13—Leases” to the consolidated financial statements included in “Item 8—Consolidated Financial Statements and Supplementary Data.”
(d)The purchase obligations consist primarily of a web hosting commitment.
We also had $0.2 million of letters of credit and surety bonds outstanding at December 31, 2020 that could potentially require performance by the Company in the event of demands by third parties or other contingent events.
Off-Balance Sheet Arrangements
Other than the items described above, the Company did not have any off-balance sheet arrangements at December 31, 2020.
CRITICAL ACCOUNTING POLICIES AND ESTIMATES
The following disclosure is provided to supplement the descriptions of Match Group’s accounting policies contained in “Note 2—Summary of Significant Accounting Policies” to the consolidated financial statements included in “Item 8—Consolidated Financial Statements and Supplementary Data” in regard to significant areas of judgment. Management of the Company is required to make certain estimates, judgments and assumptions during the preparation of its consolidated financial statements in accordance with U.S. generally accepted accounting principles (“GAAP”). These estimates, judgments and assumptions impact the reported amount of assets, liabilities, revenue and expenses and the related disclosure of contingent assets and liabilities. Actual results could differ from these estimates. Because of the size of the financial statement elements to which they relate, some of our accounting policies and estimates have a more significant impact on our consolidated financial statements than others. What follows is a discussion of some of our more significant accounting policies and estimates.
Business Combinations and Contingent Consideration Arrangements
Acquisitions have been, and will continue to be, an important part of the Company’s growth strategy. The purchase price of each acquisition is attributed to the assets acquired and liabilities assumed based on their fair values at the date of acquisition, including identifiable intangible assets that either arise from a contractual or legal right or are separable from goodwill. The fair value of these intangible assets is based on valuations that use information and assumptions provided by management. The excess purchase price over the net tangible and identifiable intangible assets is recorded as goodwill and is assigned to the reporting unit that is expected to benefit from the combination as of the acquisition date.
In connection with certain business combinations in the past, the Company has entered into contingent consideration arrangements that are determined to be part of the purchase price. Each of these arrangements is initially recorded at its fair value at the time of the acquisition and reflected at current fair value for each subsequent reporting period thereafter until settled. The contingent consideration arrangements are generally based upon earnings performance and/or operating metrics. The Company determines the fair value of the contingent consideration arrangements by using probability-weighted analyses to determine the amounts of the gross liability, and, if the arrangement is long-term in nature, applying a discount rate that appropriately captures the risk associated with the obligation to determine the net amount reflected in the consolidated financial statements. Significant changes in forecasted earnings or operating metrics would result in a significantly higher or lower fair value measurement. The changes in the remeasured fair value of the contingent consideration arrangements during each reporting period, including the accretion of the discount, if applicable, are recognized in “General and administrative expense” in the accompanying consolidated statement of operations.
Recoverability of Goodwill and Indefinite-Lived Intangible Assets
Goodwill is the Company’s largest asset with a carrying value of $1.3 billion and $1.2 billion at December 31, 2020 and 2019, representing 43% and 15%, respectively, of the Company’s total assets. Indefinite-lived intangible assets, which consist of the Company’s acquired trade names and trademarks, have a carrying value of $226.6 million and $221.2 million at December 31, 2020 and 2019, respectively.
Goodwill and indefinite-lived intangible assets are assessed annually for impairment as of October 1, or more frequently if an event occurs or circumstances change that would more likely than not reduce the fair value of a reporting unit or the fair value of an indefinite-lived intangible asset below its carrying value.
In performing its annual goodwill impairment assessment, the Company has the option under GAAP to qualitatively assess whether it is more likely than not that the fair value of a reporting unit is less than its carrying value; if the conclusion of the qualitative assessment is that there are no indicators of impairment, the Company does not perform a quantitative test, which would require a valuation of the reporting unit, as of October 1. If needed, the annual or interim quantitative test of the recovery of goodwill involves a comparison of the estimated fair value of each reporting unit to its carrying value, including goodwill. If the estimated fair value of the reporting unit exceeds its carrying value, goodwill of the reporting unit is not impaired. If the carrying value of the reporting unit exceeds its estimated fair value, an impairment loss equal to the excess is recorded. The 2020 and 2019 annual assessments did not identify any impairments.
As a result of the Separation, the Company had a negative carrying value for the Company’s annual goodwill test at October 1, 2020. Additionally, an impairment test of goodwill was not necessary because there were no factors identified that would indicate an impairment loss. The Company continued to have a negative carrying value at December 31, 2020.
While the Company has the option to qualitatively assess whether it is more likely than not that the fair values of its indefinite-lived intangible assets are less than their carrying values, the Company’s policy is to determine the fair value of each of its indefinite-lived intangible assets annually as of October 1, in part, because the level of effort required to perform the quantitative and qualitative assessments is essentially equivalent. The Company determines the fair value of its indefinite-lived intangible assets using an avoided royalty DCF valuation analysis. Significant judgments inherent in this analysis include the selection of appropriate royalty and discount rates and estimating the amount and timing of expected future cash flows. The discount rates used in the DCF analyses are intended to reflect the risks inherent in the expected future cash flows generated by the respective intangible assets. The royalty rates used in the DCF analyses are based upon an estimate of the royalty rates that a market participant would pay to license the Company’s trade names and trademarks. The future cash flows are based on the Company’s most recent forecast and budget and, for years beyond the budget, the Company’s estimates, which are based, in part, on forecasted growth rates. Assumptions used in the avoided royalty DCF analyses, including the discount rate and royalty rate, are assessed annually based on the actual and projected cash flows related to the asset, as well as macroeconomic and industry specific factors. The discount rates used in the Company’s annual indefinite-lived impairment assessment ranged from 10% to 23% in 2020 and 11% to 26% in 2019, and the royalty rates used ranged from 5% to 8% in 2020 and 3% to 8% in 2019.
If the carrying value of an indefinite-lived intangible asset exceeds its estimated fair value, an impairment equal to the excess is recorded. During the year ended December 31, 2020, the Company recognized an impairment charge related to the Match brand in the UK and the Meetic brand in Europe of $4.6 million. During the year ended December 31, 2019, the Company recognized an impairment charge on the Match brand in the UK of $6.6 million. At December 31, 2019, the aggregate indefinite-lived intangible asset balance for which the estimate of fair value at that time was less than 110% of their carrying values was approximately $92.3 million. At December 31, 2020, no indefinite-lived intangible asset balance had an estimated fair value less than 110% of carrying value.
Recoverability and Estimated Useful Lives of Long-Lived Assets
We review the carrying value of all long-lived assets, consisting of property and equipment and definite-lived intangible assets, for impairment whenever events or changes in circumstances indicate that the carrying value of an asset may not be recoverable. The carrying value of a long-lived asset is not recoverable if it exceeds the sum of the undiscounted cash flows expected to result from the use and eventual disposition of the asset. If the carrying value is deemed not to be recoverable, an impairment loss is recorded equal to the amount by which the carrying value of the long-lived asset exceeds its fair value. In addition, the Company reviews the useful lives of its long-lived assets whenever events or changes in circumstances indicate that these lives may be changed. The carrying value of property and equipment and definite-lived intangible assets was $112.1 million and $108.2 million, at December 31, 2020 and 2019, respectively.
Income Taxes
Match Group is subject to income taxes in the United States and numerous foreign jurisdictions. Significant judgment is required in determining our provision for income taxes and income tax assets and liabilities, including evaluating uncertainties in the application of accounting principles and complex tax laws.
We record a provision for income taxes for the anticipated tax consequences of our reported results of operations using the asset and liability method. Under this method, we recognize deferred income tax assets and liabilities for the future tax consequences of temporary differences between the financial reporting and tax bases of asset and liabilities, as well as for net operating loss and tax credit carryforwards. Deferred tax assets and liabilities are measured using enacted tax rates in effect for the year in which those temporary differences are expected to be realized or settled. We recognize the deferred income tax effects of a change in tax rates in the period of enactment.
A valuation allowance is provided on deferred tax assets if it is determined that it is more likely than not that the deferred tax asset will not be realized. We consider all available evidence, both positive and negative,
including historical levels of income, expectations and risks associated with estimates of future taxable income, and tax planning strategies in assessing the need for a valuation allowance.
We recognize tax benefits from uncertain tax positions only if we believe that it is more likely than not that the tax position will be sustained based on the technical merits of the position. Such tax benefits are measured based on the largest benefit that has a greater than 50% likelihood of being realized upon settlement. This measurement step is inherently difficult and requires subjective estimations of such amounts to determine the probability of various possible outcomes. We consider many factors when evaluating and estimating our tax positions and tax benefits, which may require periodic adjustment. We make adjustments to our unrecognized tax benefits when facts and circumstances change, such as the closing of a tax audit or the refinement of an estimate. Although we believe that we have adequately reserved for our uncertain tax positions, the final outcome of these matters may vary significantly from our estimates. To the extent that the final outcome of these matters is different from the amounts recorded, such differences will affect the income tax provision in the period in which such determination is made, and could have a material impact on our financial condition and operating results.
As of December 31, 2020, $158.1 million in cash and cash equivalents was held by our foreign subsidiaries. Generally, our ability to distribute cash from these subsidiaries is limited to that subsidiary’s distributable reserves and after considering other corporate legal restrictions. As a result of the Tax Cuts and Jobs Act enacted in the U.S. in 2017, earnings in our foreign jurisdictions are generally available for distribution to the U.S. without significant tax consequences.
Stock-Based Compensation
The Company recorded stock-based compensation expense of $102.3 million and $89.7 million for the years ended December 31, 2020 and 2019, respectively.
Stock-based compensation at the Company is complex due to our desire to attract, retain, and reward employees at many of our brands by allowing them to benefit from the value they help to create. We also utilize equity awards as part of our acquisition strategy. We accomplish these objectives, in part, by issuing equity awards denominated in the equity of our non-public subsidiaries as well as in Match Group, Inc. We further refine this approach by tailoring the terms of equity awards as appropriate. For example, we issue certain equity awards with vesting conditioned on the achievement of specified performance targets such as revenue or profits; these awards are referred to as performance awards. In other cases, we condition the vesting of equity awards to the achievement of value targets for a specific subsidiary or the Company’s stock price; these awards are referred to as market-based awards.
The Company issues restricted stock units (“RSUs”) and performance-based stock units (“PSUs”). The value of RSUs with vesting subject only to continued service is based on the fair value of Match Group common stock on the grant date. The value of RSUs that include a market condition is based on fair value estimated using a lattice model. The value of RSUs is expensed as stock-based compensation expense over the applicable vesting term. For PSU grants, the expense is measured at the grant date as the fair value of Match Group common stock and expensed as stock-based compensation over the vesting term if the performance targets are considered probable of being achieved.
Recent Accounting Pronouncements
For a discussion of recent accounting pronouncements, see “Note 2—Summary of Significant Accounting Policies” to the consolidated financial statements included in “Item 8—Consolidated Financial Statements and Supplementary Data.”
Item 7A. Quantitative and Qualitative Disclosures About Market Risk
Interest Rate Risk
The Company’s exposure to market risk for changes in interest rates relates primarily to the Company’s long-term debt.
At December 31, 2020, the Company’s outstanding long-term debt was $3.9 billion, of which $3.5 billion consists of Senior Notes and Exchangeable Senior Notes that bear interest at fixed rates. If market rates decline, the Company runs the risk that the required payments on the fixed-rate debt will exceed those on debt based on market rates. A 100 basis point increase or decrease in the level of interest rates would, respectively, decrease or increase the fair value of the fixed-rate debt by $135.5 million. Such potential increase or decrease in fair value is based on certain simplifying assumptions, including a constant level and rate of fixed-rate debt for all maturities and an immediate across-the-board increase or decrease in the level of interest rates with no other subsequent changes for the remainder of the period. At December 31, 2020, the $425 million Term Loan bore interest at a variable rate, LIBOR plus 1.75%. At December 31, 2020, the rate in effect was 1.96%. If LIBOR were to increase or decrease by 100 basis points, then the annual interest expense and payments on the Term Loan would increase or decrease, respectively, by $4.3 million based upon the outstanding balance and rate in effect at December 31, 2020.
On February 13, 2020, the Credit Facility and the Term Loan were amended to, among other things, provide for a benchmark replacement should the LIBOR rate not be available in the future. The rate used would be agreed to between the administrative agent and Match Group and may be based upon a secured overnight financing rate at the Federal Reserve Bank of New York. Additional information about the benchmark replacement can be found Amendment No. 6 to the Credit Agreement.
Foreign Currency Exchange Risk
The Company conducts business in certain foreign markets, primarily in various jurisdictions within the European Union (“EU”) and Asia. We are exposed to foreign exchange risk for primarily the Euro and British Pound (“GBP”).
For the years ended December 31, 2020, 2019 and 2018, international revenue accounted for 53%, 53% and 50%, respectively, of our consolidated revenue. We have exposure to foreign currency exchange risk related to transactions carried out in a currency other than the U.S. dollar, and investments in foreign subsidiaries with a functional currency other than the U.S. dollar. As foreign currency exchange rates change, translation of the statement of operations of our international businesses into U.S. dollars affects year-over-year comparability of operating results. The average GBP and Euro exchange rates strengthened against the U.S. Dollar by 1% and 2%, respectively, in 2020 compared to 2019. Foreign currency exchange rate changes during the years ended December 31, 2020 and 2019 negatively impacted revenue by $6.4 million and $47.5 million, respectively, or less than 1% and 2% of total revenue, respectively. See “Principles of Financial Reporting” in “Item 7—Management’s Discussion and Analysis of Financial Condition and Results of Operations” for the definition of Revenue excluding foreign exchange effects and a reconciliation of Revenue to Revenue excluding foreign exchange effects.
Foreign currency exchange gains and losses included in the Company’s earnings for the years ended December 31, 2020, 2019 and 2018 are (losses) and gains of $(0.6) million, $(0.9) million and $5.3 million, respectively.
Foreign currency exchange gains or losses historically have not been material to the Company. As a result, we have not historically, hedged any foreign currency exposures. The continued growth and expansion of our international operations into new countries increases our exposure to foreign exchange rate fluctuations. Significant foreign exchange rate fluctuations, in the case of one currency or collectively with other currencies, could adversely affect our future results of operations.
Item 8. Consolidated Financial Statements and Supplementary Data
Report of Independent Registered Public Accounting Firm
To the Shareholders and the Board of Directors of Match Group, Inc.
Opinion on the Financial Statements
We have audited the accompanying consolidated balance sheet of Match Group, Inc. and subsidiaries (the Company) as of December 31, 2020 and 2019, and the related consolidated statements of operations, comprehensive operations, shareholders’ equity and cash flows for each of the three years in the period ended December 31, 2020, and the related notes and the financial statement schedule listed in the Index at Item 15(a) (collectively referred to as the “consolidated financial statements”). In our opinion, the consolidated financial statements present fairly, in all material respects, the financial position of the Company at December 31, 2020 and 2019, and the results of its operations and its cash flows for each of the three years in the period ended December 31, 2020, in conformity with U.S. generally accepted accounting principles.
We also have audited, in accordance with the standards of the Public Company Accounting Oversight Board (United States) (PCAOB), the Company’s internal control over financial reporting as of December 31, 2020, based on criteria established in Internal Control-Integrated Framework issued by the Committee of Sponsoring Organizations of the Treadway Commission (2013 framework) and our report dated February 25, 2021 expressed an unqualified opinion thereon.
Basis for Opinion
These financial statements are the responsibility of the Company’s management. Our responsibility is to express an opinion on the Company’s financial statements based on our audits. We are a public accounting firm registered with the PCAOB and are required to be independent with respect to the Company in accordance with the U.S. federal securities laws and the applicable rules and regulations of the Securities and Exchange Commission and the PCAOB.
We conducted our audits in accordance with the standards of the PCAOB. Those standards require that we plan and perform the audit to obtain reasonable assurance about whether the financial statements are free of material misstatement, whether due to error or fraud. Our audits included performing procedures to assess the risks of material misstatement of the financial statements, whether due to error or fraud, and performing procedures that respond to those risks. Such procedures included examining, on a test basis, evidence regarding the amounts and disclosures in the financial statements. Our audits also included evaluating the accounting principles used and significant estimates made by management, as well as evaluating the overall presentation of the financial statements. We believe that our audits provide a reasonable basis for our opinion.
Critical Audit Matters
The critical audit matters communicated below are matters arising from the current period audit of the financial statements that were communicated or required to be communicated to the audit committee and that: (1) relate to accounts or disclosures that are material to the financial statements and (2) involved our especially challenging, subjective or complex judgments. The communication of critical audit matters does not alter in any way our opinion on the consolidated financial statements, taken as a whole, and we are not, by communicating the critical audit matters below, providing separate opinions on the critical audit matters or on the accounts or disclosures to which they relate.
| | | | | |
| Stock-Based Compensation |
| Description of the Matter | During the year ended December 31, 2020, the Company recorded stock-based compensation expense of $102.3 million. As discussed in Note 11 to the consolidated financial statements, the Company issues various types of equity awards, including stock options, restricted stock units, performance-based awards, market-based awards and equity instruments denominated in the shares of certain subsidiaries. Auditing the Company’s accounting for stock-based compensation required complex auditor judgment due to the number and the variety of the types of equity awards, the subjectivity of assumptions used to value stock-based awards (e.g., expected term), the frequent use of performance-based vesting conditions and the existence of awards denominated in the shares of certain subsidiaries. |
| |
| How We Addressed the Matter in Our Audit | We obtained an understanding, evaluated the design and tested the operating effectiveness of the Company’s controls over stock-based compensation. For example, we tested controls over the Company’s process to assess the completeness of its share-based awards and for measuring and recording stock-based compensation, including management’s review of the underlying calculations, and the significant assumptions used in valuing certain awards. To test stock-based compensation expense, we performed audit procedures that included, among others, assessing the completeness of the awards granted and evaluating the methodologies used to estimate the fair value of the awards granted and the significant assumptions described above. Our procedures also included, evaluating the key terms and conditions of awards granted to assess the accounting treatment for a sample of awards and testing the clerical accuracy of the calculation of the expense recorded. Additionally, we involved our internal valuation specialists to assess certain assumptions used in estimating the fair value of the awards. |
| |
| Recoverability of Indefinite-Lived Intangible Assets |
| Description of the Matter | As of December 31, 2020, the Company’s indefinite-lived intangible asset balance, excluding goodwill, was $226.6 million. As disclosed in Note 2 to the consolidated financial statements, indefinite-lived intangible assets are assessed annually for impairment as of October 1, or more frequently if an event occurs or circumstances change that would more likely than not reduce the fair value of an indefinite-lived intangible asset below its carrying value. Auditing management’s impairment tests for indefinite-lived intangible assets was complex and judgmental due to the measurement uncertainty in estimating the fair value of indefinite-lived intangible assets. Specifically, the fair value estimates for indefinite-lived intangible assets were sensitive to assumptions such as discount rates, revenue growth rates, royalty rates and projected cash flow terminal growth rates. These assumptions are affected by such factors as expected future market or economic conditions. |
| |
| | | | | |
| How We Addressed the Matter in Our Audit | We obtained an understanding, evaluated the design and tested the operating effectiveness of the Company’s controls over its indefinite-lived intangible assets impairment review process. For example, we tested controls over the Company’s forecasting and budgeting process as well as controls over management’s review of the significant assumptions used to estimate the fair values of the indefinite-lived intangible assets. To test the estimated fair value of indefinite-lived intangible assets, our audit procedures included, among others, assessing the methodologies and testing the significant assumptions and underlying data used by the Company. We evaluated the Company’s underlying forecast and budget information by comparing the significant assumptions to current industry and economic trends, changes in the Company’s business model and assessed the historical accuracy of management’s estimates. For example, we evaluated management’s forecasted revenue to identify, understand and evaluate changes as compared to historical results. We performed sensitivity analyses of significant assumptions to evaluate the change in the fair value of indefinite-lived intangible assets resulting from changes in the assumptions. In addition, we involved an internal valuation specialist to assist in evaluating management’s methodologies and significant assumptions applied in developing the fair value estimates. |
| |
| Separation of Match Group and IAC/InterActiveCorp |
| Description of the Matter | As described in Note 1 to the consolidated financial statements, the companies formerly known as Match Group, Inc. (“Former Match Group”) and IAC/InterActiveCorp (“Former IAC”) completed the separation of Match Group from IAC on June 30, 2020. At the effective date, the two public companies were fully separated as follows: (1) Match Group, which consists of the businesses of Former Match Group and certain financing subsidiaries previously owned by Former IAC, and (2) IAC/InterActiveCorp, formerly known as IAC Holdings, Inc. (“IAC”), consisting of Former IAC’s businesses other than Match Group and certain financing subsidiaries (the “Separation”). As disclosed in Note 4, the operations of the Former IAC businesses other than Match Group and certain financing subsidiaries, are presented as discontinued operations. Auditing the Separation transaction required a significant amount of audit effort due to the especially complex nature of the transaction among related parties and the presentation of the Former IAC businesses as discontinued operations. In particular, significant audit effort was necessary to perform procedures and evaluate evidence relating to management's evaluation of the Separation transaction, including the determination of the U.S. federal income tax consequences, which required complex auditor judgement in determining the appropriate tax treatment for the Separation. |
| |
| | | | | |
| How We Addressed the Matter in Our Audit | We obtained an understanding, evaluated the design and tested the operating effectiveness of the Company’s controls over its accounting for the Separation and basis of presentation. For example, we tested controls over management’s analysis and review of the Separation documents, management’s review of the accounting conclusions reached related to the discounted operations presentation, management’s review of the recording of the related journal entries and management’s review and analysis of the appropriate tax treatment for the Separation. To test the accounting for the transactions related to the Separation among related parties and the basis of presentation, our audit procedures included, among others, inspecting the Separation related documents, such as the transaction agreement and tax matters agreement; inquiring of executive officers, key members of management, the Audit Committee of the Board of Directors and legal counsel regarding the Separation; inspecting the Company’s minutes from meetings of the Board of Directors and related committees; verifying that the discontinued operations were properly determined, calculated and presented and assessing the appropriateness of the composition of the consolidated financial statements. For example, we tested the Separation journal entries recorded and vouched the cash transactions. In addition, we involved internal tax specialists to assist in reviewing the series of steps that effectuated the Separation and the related tax opinion, verifying the appropriateness of the tax treatment for the Separation. |
We have served as the Company’s auditor since 1996.
New York, New York
February 25, 2021
MATCH GROUP, INC. AND SUBSIDIARIES
CONSOLIDATED BALANCE SHEET
| | | | | | | | | | | |
| | December 31, |
| | 2020 | | 2019 |
| | | |
| (In thousands, except share data) |
| ASSETS | | | |
| Cash and cash equivalents | $ | 739,164 | | | $ | 465,676 | |
| | | |
Accounts receivable, net of allowance of $286 and $578, respectively | 137,023 | | | 116,459 | |
| | | |
| Other current assets | 144,025 | | | 97,850 | |
| Current assets of discontinued operations | — | | | 3,028,079 | |
| Total current assets | 1,020,212 | | | 3,708,064 | |
| | | |
| Property and equipment, net | 107,799 | | | 101,065 | |
| Goodwill | 1,270,532 | | | 1,239,839 | |
| Intangible assets, net | 230,900 | | | 228,324 | |
| Deferred income taxes | 224,013 | | | 192,496 | |
| | | |
| Other non-current assets | 123,524 | | | 64,232 | |
| Non-current assets of discontinued operations | — | | | 2,830,783 | |
| TOTAL ASSETS | $ | 2,976,980 | | | $ | 8,364,803 | |
| LIABILITIES AND SHAREHOLDERS’ EQUITY | | | |
| LIABILITIES | | | |
| | | |
| | | |
| Accounts payable | $ | 29,200 | | | $ | 20,191 | |
| Deferred revenue | 239,088 | | | 218,843 | |
| | | |
| Accrued expenses and other current liabilities | 231,748 | | | 182,250 | |
| Current liabilities of discontinued operations | — | | | 588,896 | |
| Total current liabilities | 500,036 | | | 1,010,180 | |
| Long-term debt, net | 3,534,706 | | | 2,889,626 | |
| Income taxes payable | 14,582 | | | 30,295 | |
| Deferred income taxes | 17,213 | | | 18,285 | |
| Other long-term liabilities | 86,428 | | | 26,158 | |
| Non-current liabilities of discontinued operations | — | | | 447,414 | |
| Redeemable noncontrolling interests | 640 | | | 44,527 | |
| Commitments and contingencies | | | |
| SHAREHOLDERS’ EQUITY | | | |
Common stock; $0.001 par value; authorized 1,600,000,000 shares; 267,329,284 and 0 shares issued and outstanding at December 31, 2020 and December 31, 2019, respectively | 267 | | | — | |
Former IAC common stock; $0.001 par value; authorized 1,600,000,000 shares; 0 and 263,229,724 shares issued; and 0 and 78,889,779 shares outstanding at December 31, 2020 and December 31, 2019, respectively | — | | | 263 | |
Former IAC Class B convertible common stock; $0.001 par value; authorized 400,000,000 shares; 0 and 16,157,499 shares issued; and 0 and 5,789,499 shares outstanding at December 31, 2020 and December 31, 2019, respectively | — | | | 16 | |
| Additional paid-in capital | 7,394,646 | | | 11,683,799 | |
| Retained earnings | (8,491,126) | | | 1,689,925 | |
| Accumulated other comprehensive loss | (81,454) | | | (136,349) | |
Treasury stock; 0 and 194,707,945 shares, respectively | — | | | (10,309,612) | |
| Total Match Group, Inc. shareholders’ equity | (1,177,667) | | | 2,928,042 | |
| Noncontrolling interests | 1,042 | | | 970,276 | |
Total shareholders’ equity | (1,176,625) | | | 3,898,318 | |
| TOTAL LIABILITIES AND SHAREHOLDERS’ EQUITY | $ | 2,976,980 | | | $ | 8,364,803 | |
The accompanying Notes to Consolidated Financial Statements are an integral part of these statements.
MATCH GROUP, INC. AND SUBSIDIARIES
CONSOLIDATED STATEMENT OF OPERATIONS
| | | | | | | | | | | | | | | | | |
| | Years Ended December 31, |
| | 2020 | | 2019 | | 2018 |
| | | | | |
| | (In thousands, except per share data) |
| Revenue | $ | 2,391,269 | | | $ | 2,051,258 | | | $ | 1,729,850 | |
| Operating costs and expenses: | | | | | |
Cost of revenue (exclusive of depreciation shown separately below) | 635,833 | | | 527,184 | | | 410,000 | |
| Selling and marketing expense | 479,907 | | | 427,440 | | | 419,954 | |
| General and administrative expense | 311,207 | | | 256,138 | | | 182,252 | |
| Product development expense | 169,811 | | | 151,960 | | | 132,030 | |
| Depreciation | 41,271 | | | 34,355 | | | 34,827 | |
| Amortization of intangibles | 7,525 | | | 8,727 | | | 1,318 | |
| Total operating costs and expenses | 1,645,554 | | | 1,405,804 | | | 1,180,381 | |
Operating income | 745,715 | | | 645,454 | | | 549,469 | |
| Interest expense | (174,791) | | | (140,570) | | | (94,568) | |
| | | | | |
Other income (expense), net | 15,861 | | | (2,026) | | | 7,510 | |
Earnings from continuing operations, before tax | 586,785 | | | 502,858 | | | 462,411 | |
Income tax provision | (32,874) | | | (8,225) | | | (11,307) | |
Net earnings from continuing operations | 553,911 | | | 494,633 | | | 451,104 | |
(Loss) earnings from discontinued operations, net of tax | (366,070) | | | 49,187 | | | 306,643 | |
Net earnings | 187,841 | | | 543,820 | | | 757,747 | |
Net earnings attributable to noncontrolling interests | (59,280) | | | (112,689) | | | (130,786) | |
Net earnings attributable to Match Group, Inc. shareholders | $ | 128,561 | | | $ | 431,131 | | | $ | 626,961 | |
| | | | | |
| Net earnings per share from continuing operations: | | | | | |
| Basic | $ | 2.21 | | | $ | 2.15 | | | $ | 2.03 | |
| Diluted | $ | 2.00 | | | $ | 1.88 | | | $ | 1.73 | |
| | | | | |
Net earnings per share attributable to Match Group, Inc. shareholders: | | | | | |
| Basic | $ | 0.58 | | | $ | 2.37 | | | $ | 3.48 | |
| Diluted | $ | 0.49 | | | $ | 2.08 | | | $ | 3.05 | |
| | | | | |
| Stock-based compensation expense by function: | | | | | |
| Cost of revenue | $ | 4,201 | | | $ | 3,693 | | | $ | 2,287 | |
| Selling and marketing expense | 5,141 | | | 5,112 | | | 3,599 | |
| General and administrative expense | 59,174 | | | 42,863 | | | 32,346 | |
| Product development expense | 33,752 | | | 38,056 | | | 27,799 | |
| Total stock-based compensation expense | $ | 102,268 | | | $ | 89,724 | | | $ | 66,031 | |
The accompanying Notes to Consolidated Financial Statements are an integral part of these statements.
MATCH GROUP, INC. AND SUBSIDIARIES
CONSOLIDATED STATEMENT OF COMPREHENSIVE OPERATIONS
| | | | | | | | | | | | | | | | | |
| Years Ended December 31, |
| 2020 | | 2019 | | 2018 |
| | | | | |
| (In thousands) |
| Net earnings | $ | 187,841 | | | $ | 543,820 | | | $ | 757,747 | |
| Other comprehensive income (loss), net of tax | | | | | |
Change in foreign currency translation adjustment | 39,415 | | | (9,961) | | | (31,411) | |
Change in unrealized losses and gains on available-for-sale securities | (1) | | | (5) | | | 5 | |
| Total other comprehensive income (loss) | 39,414 | | | (9,966) | | | (31,406) | |
| Comprehensive income | 227,255 | | | 533,854 | | | 726,341 | |
| Comprehensive loss (income) attributable to noncontrolling interests: | | | | | |
| Net earnings attributable to noncontrolling interests | (59,280) | | | (112,689) | | | (130,786) | |
| Change in foreign currency translation adjustment attributable to noncontrolling interests | 1,072 | | | 2,023 | | | 6,129 | |
| Change in unrealized losses and gains of available-for-sale debt securities attributable to noncontrolling interests | — | | | 1 | | | (1) | |
| Comprehensive income attributable to noncontrolling interests | (58,208) | | | (110,665) | | | (124,658) | |
| Comprehensive income attributable to Match Group, Inc. shareholders | $ | 169,047 | | | $ | 423,189 | | | $ | 601,683 | |
The accompanying Notes to Consolidated Financial Statements are an integral part of these statements.
MATCH GROUP, INC. AND SUBSIDIARIES
CONSOLIDATED STATEMENT OF SHAREHOLDERS’ EQUITY
Years Ended December 31, 2020, 2019, and 2018
| | | | | | | | | | | | | | | | | | | | | | | | | | | | | | | | | | | | | | | | | | | | | | | | | | | | | | | | | | | | | | | | | | | | | | | | | | | | | | | | | | | | | | |
| | | | Match Group, Inc. Shareholders’ Equity | | | | |
| | | | | Common Stock $0.001 Par Value | | Former IAC Common Stock $0.001 Par Value | | Former IAC Class B Convertible Common Stock $0.001 Par Value | | | | | | | | | | | | | | |
| | Redeemable
Noncontrolling
Interests | | | $ | | Shares | | $ | | Shares | | $ | | Shares | | Additional Paid-in Capital | | Retained Earnings | | Accumulated
Other
Comprehensive
Loss | | Treasury Stock | | Total
Match Group, Inc.
Shareholders’
Equity | | Noncontrolling
Interests | | Total
Shareholders’
Equity |
| | | | | (In thousands) |
| Balance as of December 31, 2017 | $ | 42,867 | | | | $ | — | | | — | | | $ | 261 | | | 260,624 | | | $ | 16 | | | 16,157 | | | $ | 12,165,002 | | | $ | 595,038 | | | $ | (103,568) | | | $ | (10,226,721) | | | $ | 2,430,028 | | | $ | 516,795 | | | $ | 2,946,823 | |
| Net earnings for the year ended December 31, 2018 | 33,897 | | | | — | | | — | | | — | | | — | | | — | | | — | | | — | | | 626,961 | | | — | | | — | | | 626,961 | | | 96,889 | | | 723,850 | |
| Other comprehensive loss, net of tax | (702) | | | | — | | | — | | | — | | | — | | | — | | | — | | | — | | | — | | | (25,278) | | | — | | | (25,278) | | | (5,426) | | | (30,704) | |
| Stock-based compensation expense | 1,138 | | | | — | | | — | | | — | | | — | | | — | | | — | | | 75,311 | | | — | | | — | | | — | | | 75,311 | | | 161,971 | | | 237,282 | |
Issuance of Former IAC common stock pursuant to stock-based awards, net of withholding taxes | — | | | | — | | | — | | | 1 | | | 1,679 | | | — | | | — | | | 21,785 | | | — | | | — | | | — | | | 21,786 | | | — | | | 21,786 | |
Issuance of Former Match Group and ANGI Homeservices common stock pursuant to stock-based awards, net of withholding taxes | — | | | | — | | | — | | | — | | | — | | | — | | | — | | | (102,922) | | | — | | | 124 | | | — | | | (102,798) | | | 35,559 | | | (67,239) | |
| | | | | | | | | | | | | | | | | | | | | | | | | | | | |
| Dividends paid to Former Match Group noncontrolling interests | — | | | | | | | | — | | | — | | | — | | | — | | | — | | | — | | | — | | | — | | | — | | | (105,126) | | | (105,126) | |
| Purchase of treasury stock | — | | | | | | | | — | | | — | | | — | | | — | | | — | | | — | | | — | | | (82,891) | | | (82,891) | | | — | | | (82,891) | |
| | | | | | | | | | | | | | | | | | | | | | | | | | | | |
Purchase of noncontrolling interest | (14,785) | | | | | | | | — | | | — | | | — | | | — | | | — | | | — | | | — | | | — | | | — | | | (9,364) | | | (9,364) | |
Adjustment of redeemable noncontrolling interests to fair value | 4,098 | | | | — | | | — | | | — | | | — | | | — | | | — | | | (4,098) | | | — | | | — | | | — | | | (4,098) | | | — | | | (4,098) | |
| Noncontrolling interests created in acquisitions | 2,261 | | | | | | | | — | | | — | | | — | | | — | | | — | | | — | | | — | | | — | | | — | | | 14,307 | | | 14,307 | |
| | | | | | | | | | | | | | | | | | | | | | | | | | | | |
| | | | | | | | | | | | | | | | | | | | | | | | | | | | |
| | | | | | | | | | | | | | | | | | | | | | | | | | | | |
| Purchase of Match Group and ANGI treasury stock | — | | | | — | | | — | | | — | | | — | | | — | | | — | | | (133,455) | | | — | | | — | | | — | | | (133,455) | | | — | | | (133,455) | |
Cumulative effect of adoption of ASU 2014-09 | — | | | | — | | | — | | | — | | | — | | | — | | | — | | | — | | | 36,795 | | | — | | | — | | | 36,795 | | | 3,410 | | | 40,205 | |
| Other | (3,087) | | | | — | | | — | | | — | | | — | | | — | | | — | | | 764 | | | — | | | — | | | — | | | 764 | | | (339) | | | 425 | |
| Balance as of December 31, 2018 | 65,687 | | | | — | | | — | | | 262 | | | 262,303 | | | 16 | | | 16,157 | | | 12,022,387 | | | 1,258,794 | | | (128,722) | | | (10,309,612) | | | 2,843,125 | | | 708,676 | | | 3,551,801 | |
| Net earnings for the year ended December 31, 2019 | 2,835 | | | | — | | | — | | | — | | | — | | | — | | | — | | | — | | | 431,131 | | | — | | | — | | | 431,131 | | | 109,854 | | | 540,985 | |
| Other comprehensive income (loss), net of tax | 39 | | | | — | | | — | | | — | | | — | | | — | | | — | | | — | | | — | | | (7,942) | | | — | | | (7,942) | | | (2,063) | | | (10,005) | |
| Stock-based compensation expense | 148 | | | | — | | | — | | | — | | | — | | | — | | | — | | | 82,619 | | | — | | | — | | | — | | | 82,619 | | | 155,457 | | | 238,076 | |
| Issuance of Former IAC common stock pursuant to stock-based awards, net of withholding taxes | — | | | | — | | | — | | | 1 | | | 927 | | | — | | | — | | | (82,463) | | | — | | | — | | | — | | | (82,462) | | | — | | | (82,462) | |
| Issuance of Former Match Group and ANGI Homeservices common stock pursuant to stock-based awards, net of withholding taxes | — | | | | — | | | — | | | — | | | — | | | — | | | — | | | (236,897) | | | — | | | 315 | | | — | | | (236,582) | | | (1,794) | | | (238,376) | |
| | | | | | | | | | | | | | | | | | | | | | | | | | | | |
| | | | | | | | | | | | | | | | | | | | | | | | | | | | |
| | | | | | | | | | | | | | | | | | | | | | | | | | | | |
| Purchase of redeemable noncontrolling interests | (40,432) | | | | — | | | — | | | — | | | — | | | — | | | — | | | — | | | — | | | — | | | — | | | — | | | — | | | — | |
| | | | | | | | | | | | | | | | | | | | | | | | | | | | |
Adjustment of redeemable noncontrolling interests to fair value | 11,554 | | | | — | | | — | | | — | | | — | | | — | | | — | | | (11,554) | | | — | | | — | | | — | | | (11,554) | | | — | | | (11,554) | |
| Noncontrolling interests created in an acquisition | 4,781 | | | | — | | | — | | | — | | | — | | | — | | | — | | | — | | | — | | | — | | | — | | | — | | | — | | | — | |
| | | | | | | | | | | | | | | | | | | | | | | | | | | | |
| | | | | | | | | | | | | | | | | | | | | | | | | | | | |
| Purchase of exchangeable note hedges | — | | | | — | | | — | | | — | | | — | | | — | | | — | | | (303,428) | | | — | | | — | | | — | | | (303,428) | | | — | | | (303,428) | |
| Equity component of exchangeable Senior Notes, net of deferred financing costs and deferred tax liabilities | — | | | | — | | | — | | | — | | | — | | | — | | | — | | | 320,998 | | | — | | | — | | | — | | | 320,998 | | | — | | | 320,998 | |
| Issuance of warrants | — | | | | — | | | — | | | — | | | — | | | — | | | — | | | 166,520 | | | — | | | — | | | — | | | 166,520 | | | — | | | 166,520 | |
| Purchase of Match Group and ANGI treasury stock | — | | | | — | | | — | | | — | | | — | | | — | | | — | | | (274,302) | | | — | | | — | | | — | | | (274,302) | | | — | | | (274,302) | |
| Other | (85) | | | | — | | | — | | | — | | | — | | | — | | | — | | | (81) | | | — | | | — | | | — | | | (81) | | | 146 | | | 65 | |
| Balance as of December 31, 2019 | $ | 44,527 | | | | $ | — | | | — | | | $ | 263 | | | 263,230 | | | $ | 16 | | | 16,157 | | | $ | 11,683,799 | | | $ | 1,689,925 | | | $ | (136,349) | | | $ | (10,309,612) | | | $ | 2,928,042 | | | $ | 970,276 | | | $ | 3,898,318 | |
MATCH GROUP, INC. AND SUBSIDIARIES
CONSOLIDATED STATEMENT OF SHAREHOLDERS’ EQUITY
Years Ended December 31, 2020, 2019, and 2018 (continued)
| | | | | | | | | | | | | | | | | | | | | | | | | | | | | | | | | | | | | | | | | | | | | | | | | | | | | | | | | | | | | | | | | | | | | | | | | | | | | | | | | | | | | | |
| | | | Match Group, Inc. Shareholders’ Equity | | | | |
| | | | | Common Stock $0.001 Par Value | | Former IAC Common Stock $0.001 Par Value | | Former IAC Class B Convertible Common Stock $0.001 Par Value | | | | | | | | | | | | | | |
| | Redeemable
Noncontrolling
Interests | | | $ | | Shares | | $ | | Shares | | $ | | Shares | | Additional Paid-in Capital | | Retained Earnings | | Accumulated
Other
Comprehensive
Loss (Income) | | Treasury Stock | | Total
Match Group, Inc.
Shareholders’
Equity | | Noncontrolling
Interests | | Total
Shareholders’
Equity |
| | | | | (In thousands) |
| Balance as of December 31, 2019 | $ | 44,527 | | | | $ | — | | | — | | | $ | 263 | | | 263,230 | | | $ | 16 | | | 16,157 | | | $ | 11,683,799 | | | $ | 1,689,925 | | | $ | (136,349) | | | $ | (10,309,612) | | | $ | 2,928,042 | | | $ | 970,276 | | | $ | 3,898,318 | |
| Net (loss) earnings for the year ended December 31, 2020 | (3,136) | | | | — | | | — | | | — | | | — | | | — | | | — | | | — | | | 128,561 | | | — | | | — | | | 128,561 | | | 62,416 | | | 190,977 | |
| Other comprehensive (loss) income, net of tax | (686) | | | | — | | | — | | | — | | | — | | | — | | | — | | | — | | | — | | | 40,486 | | | — | | | 40,486 | | | (386) | | | 40,100 | |
| Stock-based compensation expense | 15 | | | | — | | | — | | | — | | | — | | | — | | | — | | | 134,528 | | | — | | | — | | | — | | | 134,528 | | | 86,363 | | | 220,891 | |
| Issuance of Match Group common stock pursuant to stock-based awards, net of withholding taxes | — | | | | 8 | | | 8,373 | | | — | | | — | | | — | | | — | | | 155,285 | | | — | | | — | | | — | | | 155,293 | | | — | | | 155,293 | |
| Issuance of Former IAC common stock pursuant to stock-based awards, net of withholding taxes | — | | | | — | | | — | | | 1 | | | 453 | | | — | | | — | | | (34,518) | | | — | | | — | | | — | | | (34,517) | | | — | | | (34,517) | |
| Issuance of Former Match Group and ANGI Homeservices common stock pursuant to stock-based awards, net of withholding taxes | — | | | | — | | | — | | | — | | | — | | | — | | | — | | | (212,270) | | | — | | | 628 | | | — | | | (211,642) | | | (11,405) | | | (223,047) | |
| | | | | | | | | | | | | | | | | | | | | | | | | | | | |
| | | | | | | | | | | | | | | | | | | | | | | | | | | | |
| | | | | | | | | | | | | | | | | | | | | | | | | | | | |
| Purchase of redeemable noncontrolling interests | (3,165) | | | | | | | | — | | | — | | | — | | | — | | | — | | | — | | | — | | | — | | | — | | | — | | | — | |
| Adjustment of redeemable noncontrolling interests to fair value | 6,669 | | | | | | | | — | | | — | | | — | | | — | | | (6,669) | | | — | | | — | | | — | | | (6,669) | | | — | | | (6,669) | |
| | | | | | | | | | | | | | | | | | | | | | | | | | | | |
| | | | | | | | | | | | | | | | | | | | | | | | | | | | |
| | | | | | | | | | | | | | | | | | | | | | | | | | | | |
| | | | | | | | | | | | | | | | | | | | | | | | | | | | |
| | | | | | | | | | | | | | | | | | | | | | | | | | | | |
| Purchase of Match Group and ANGI treasury stock | — | | | | — | | | — | | | — | | | — | | | — | | | — | | | (187,735) | | | — | | | — | | | — | | | (187,735) | | | — | | | (187,735) | |
| Retire treasury stock | — | | | | — | | | — | | | (184) | | | (184,340) | | | (10) | | | (10,368) | | | 194 | | | (10,309,612) | | | — | | | 10,309,612 | | | — | | | — | | | — | |
| Exchange Common stock and Class B for Class M Common stock and spin off IAC | (43,583) | | | | 184 | | | 183,749 | | | (80) | | | (79,343) | | | (6) | | | (5,789) | | | (4,745,323) | | | — | | | 13,781 | | | — | | | (4,731,444) | | | (498,792) | | | (5,230,236) | |
| Acquire Former Match Group noncontrolling interest | — | | | | 58 | | | 57,868 | | | — | | | — | | | — | | | — | | | 608,110 | | | — | | | — | | | — | | | 608,168 | | | (608,168) | | | — | |
| Issuance of common stock | — | | | | 17 | | | 17,339 | | | — | | | — | | | — | | | — | | | (17) | | | — | | | — | | | — | | | — | | | — | | | — | |
| Other | (1) | | | | — | | | — | | | — | | | — | | | — | | | — | | | (738) | | | — | | | — | | | — | | | (738) | | | 738 | | | — | |
| Balance as of December 31, 2020 | $ | 640 | | | | $ | 267 | | | 267,329 | | | $ | — | | | — | | | $ | — | | | — | | | $ | 7,394,646 | | | $ | (8,491,126) | | | $ | (81,454) | | | $ | — | | | $ | (1,177,667) | | | $ | 1,042 | | | $ | (1,176,625) | |
The accompanying Notes to Consolidated Financial Statements are an integral part of these statements.
MATCH GROUP, INC. AND SUBSIDIARIES
CONSOLIDATED STATEMENT OF CASH FLOWS
| | | | | | | | | | | | | | | | | |
| | Years Ended December 31, |
| | 2020 | | 2019 | | 2018 |
| | | | | |
| | (In thousands) |
| Cash flows from operating activities attributable to continuing operations: | | | | | |
| Net earnings from continuing operations | $ | 553,911 | | | $ | 494,633 | | | $ | 451,104 | |
| Adjustments to reconcile net earnings from continuing operations to net cash provided by operating activities attributable to continuing operations: | | | | | |
| Stock-based compensation expense | 102,268 | | | 89,724 | | | 66,031 | |
| Depreciation | 41,271 | | | 34,355 | | | 34,827 | |
| Amortization of intangibles | 7,525 | | | 8,727 | | | 1,318 | |
| | | | | |
| Deferred income taxes | 4,985 | | | (19,608) | | | (23,005) | |
| | | | | |
| Accretion of original issue discount of Exchangeable Senior Notes | 44,743 | | | 30,429 | | | 13,134 | |
| Other adjustments, net | 26,705 | | | 12,694 | | | 4,032 | |
| Changes in assets and liabilities | | | | | |
| Accounts receivable | (24,213) | | | (17,861) | | | 17,272 | |
| Other assets | (33,224) | | | (24,162) | | | (14,600) | |
| Accounts payable and other liabilities | 24,155 | | | 33,741 | | | 21,386 | |
| Income taxes payable and receivable | 16,913 | | | (4,161) | | | 26,898 | |
| Deferred revenue | 23,513 | | | 9,478 | | | 13,058 | |
Net cash provided by operating activities attributable to continuing operations | 788,552 | | | 647,989 | | | 611,455 | |
| Cash flows from investing activities attributable to continuing operations: | | | | | |
| Net cash (used) acquired in business combinations | — | | | (3,759) | | | 1,136 | |
| Capital expenditures | (42,376) | | | (39,035) | | | (31,397) | |
| | | | | |
| | | | | |
| | | | | |
| Purchases of investments | (9,115) | | | — | | | (3,800) | |
| Net cash distribution related to Separation of IAC | (3,870,550) | | | — | | | — | |
| Other, net | (90) | | | 1,064 | | | (4,143) | |
Net cash used in investing activities attributable to continuing operations | (3,922,131) | | | (41,730) | | | (38,204) | |
| Cash flows from financing activities attributable to continuing operations: | | | | | |
| Borrowings under the Credit Facility | 20,000 | | | 40,000 | | | 260,000 | |
| | | | | |
| Proceeds from Senior Notes offerings | 1,000,000 | | | 350,000 | | | — | |
| Proceeds from Exchangeable Senior Notes offerings | — | | | 1,150,000 | | | — | |
| Principal payment on Senior Notes | (400,000) | | | — | | | — | |
| Principal payments on Credit Facility | (20,000) | | | (300,000) | | | — | |
| Purchase of exchangeable note hedges | — | | | (303,428) | | | — | |
| Proceeds from issuance of warrants | — | | | 166,520 | | | — | |
| Debt issuance costs | (13,517) | | | (27,815) | | | (1,740) | |
| Purchase of Former Match Group treasury stock | (132,868) | | | (216,353) | | | (133,455) | |
| Dividends | — | | | — | | | (105,126) | |
| | | | | |
| | | | | |
| | | | | |
| | | | | |
| | | | | |
| | | | | |
| Proceeds from stock offering | 1,421,801 | | | — | | | — | |
| Proceeds from issuance of common stock pursuant to stock-based awards | 155,402 | | | — | | | 12 | |
| Withholding taxes paid on behalf of employees on net settled stock-based awards | (211,958) | | | (203,177) | | | (207,720) | |
| | | | | |
| Purchase of noncontrolling interests | (15,827) | | | (1,650) | | | (9,980) | |
| | | | | |
| | | | | |
| | | | | |
| Other, net | (15,187) | | | (73) | | | (759) | |
Net cash provided by (used in) financing activities attributable to continuing operations | 1,787,846 | | | 654,024 | | | (198,768) | |
| Total cash (used in) provided by continuing operations | (1,345,733) | | | 1,260,283 | | | 374,483 | |
| Net cash provided by operating activities attributable to discontinued operations | 13,630 | | | 289,949 | | | 376,672 | |
| Net cash used in investing activities attributable to discontinued operations | (963,420) | | | (287,798) | | | (135,235) | |
Net cash used in financing activities attributable to discontinued operations | (110,959) | | | (254,193) | | | (114,030) | |
| Total cash (used in) provided by discontinued operations | (1,060,749) | | | (252,042) | | | 127,407 | |
| Effect of exchange rate changes on cash, cash equivalents, and restricted cash | 5,426 | | | (1,568) | | | (1,887) | |
| Net (decrease) increase in cash, cash equivalents, and restricted cash | (2,401,056) | | | 1,006,673 | | | 500,003 | |
| Cash, cash equivalents, and restricted cash at beginning of period | 3,140,358 | | | 2,133,685 | | | 1,633,682 | |
| Cash, cash equivalents, and restricted cash at end of period | $ | 739,302 | | | $ | 3,140,358 | | | $ | 2,133,685 | |
The accompanying Notes to Consolidated Financial Statements are an integral part of these statements.
MATCH GROUP, INC. AND SUBSIDIARIES
NOTES TO CONSOLIDATED FINANCIAL STATEMENTS
NOTE 1—ORGANIZATION
Match Group, Inc., through its portfolio companies, is a leading provider of dating products available globally. Our portfolio of brands includes Tinder®, Match®, Meetic®, OkCupid®, Hinge®, Pairs™, PlentyOfFish®, and OurTime®, as well as a number of other brands, each designed to increase our users’ likelihood of finding a meaningful connection. Through our portfolio companies and their trusted brands, we provide tailored products to meet the varying preferences of our users. Our products are available in over 40 languages to our users all over the world. Match Group has one operating segment, Dating, which is managed as a portfolio of dating brands.
Separation of Match Group and IAC
On June 30, 2020, the companies formerly known as Match Group, Inc. (referred to as “Former Match Group”) and IAC/InterActiveCorp (referred to as “Former IAC”) completed the separation of the Company from IAC through a series of transactions that resulted in two, separate public companies—(1) Match Group, which consists of the businesses of Former Match Group and certain financing subsidiaries previously owned by Former IAC, and (2) IAC/InterActiveCorp, formerly known as IAC Holdings, Inc. (“IAC”), consisting of Former IAC’s businesses other than Match Group (the “Separation”). See “Note 8—Shareholders’ Equity” for additional information about the series of transactions.
As used herein, “Match Group,” the “Company,” “we,” “our,” “us,” and similar terms refer to Match Group, Inc. and its subsidiaries after the completion of the Separation, unless the context indicates otherwise.
The following diagram illustrates the simplified organizational and ownership structure immediately prior to the Separation.
Under the terms of the Transaction Agreement (the “Transaction Agreement”) dated as of December 19, 2019 and amended as of April 28, 2020 and as further amended as of June 22, 2020, Former Match Group merged with and into Match Group Holdings II, LLC (“MG Holdings II”), an indirect wholly-owned subsidiary of Match Group, with MG Holdings II surviving the merger as an indirect wholly-owned subsidiary of Match Group. Former Match Group stockholders (other than Former IAC) received, through the merger, in exchange for each outstanding share of Former Match Group common stock that they held, one share of Match Group common stock and, at the holder’s election, either (i) $3.00 in cash or (ii) a fraction of a share of Match Group common stock with a value of $3.00 (calculated pursuant to the Transaction Agreement). As a result of the merger and other transactions contemplated by the Transaction Agreement, Former Match Group stockholders (other than Former IAC) became stockholders of the Company.
MATCH GROUP, INC. AND SUBSIDIARIES
NOTES TO CONSOLIDATED FINANCIAL STATEMENTS (Continued)
The following diagram illustrates the simplified organizational and ownership structures of IAC and Match Group immediately after the Separation.
NOTE 2—SUMMARY OF SIGNIFICANT ACCOUNTING POLICIES
Basis of Presentation and Consolidation
The Company prepares its consolidated financial statements in accordance with U.S. generally accepted accounting principles (“GAAP”). The consolidated financial statements include the accounts of the Company, all entities that are wholly-owned by the Company and all entities in which the Company has a controlling financial interest. Intercompany transactions and accounts have been eliminated.
Discontinued Operations
As a result of the Separation, the operations of Former IAC businesses other than Match Group are presented as discontinued operations. See “Note 4—Discontinued Operations” for additional details.
Accounting for Investments in Equity Securities
Investments in equity securities, other than those of our consolidated subsidiaries, are accounted for at fair value or under the measurement alternative of the Financial Accounting Standards Board’s (“FASB”) Accounting Standards Update (“ASU”) No. 2016-01, Recognition and Measurement of Financial Assets and Financial Liabilities, with any changes to fair value recognized within other income (expense), net each reporting period. Under the measurement alternative, equity investments without readily determinable fair values are carried at cost minus impairment, if any, plus or minus changes resulting from observable price changes in orderly transactions for identical or similar securities of the same issuer; value is generally determined based on a market approach as of the transaction date. A security will be considered identical or similar if it has identical or similar rights to the equity securities held by the Company. The Company reviews its investments in equity securities without readily determinable fair values for impairment each reporting period when there are qualitative factors or events that indicate possible impairment. Factors we consider in making this determination include negative changes in industry and market conditions, financial performance, business prospects, and other relevant events and factors. When indicators of impairment exist, the Company prepares quantitative assessments of the fair value of our investments in equity securities, which require judgment and the use of
MATCH GROUP, INC. AND SUBSIDIARIES
NOTES TO CONSOLIDATED FINANCIAL STATEMENTS (Continued)
estimates. When our assessment indicates that the fair value of the investment is below its carrying value, the Company writes down the investment to its fair value and records the corresponding charge within Other income (expense), net.
Accounting Estimates
Management of the Company is required to make certain estimates, judgments, and assumptions during the preparation of its consolidated financial statements in accordance with GAAP. These estimates, judgments, and assumptions impact the reported amounts of assets, liabilities, revenue, and expenses and the related disclosure of contingent assets and liabilities. Actual results could differ from these estimates.
On an ongoing basis, the Company evaluates its estimates and judgments including those related to: the fair values of cash equivalents; the carrying value of accounts receivable, including the determination of the allowance for doubtful accounts; the determination of revenue reserves; the carrying value of right-of-use assets (“ROU assets”); the useful lives and recoverability of definite-lived intangible assets and property and equipment; the recoverability of goodwill and indefinite-lived intangible assets; the fair value of equity securities without readily determinable fair values; contingencies; unrecognized tax benefits; the valuation allowance for deferred income tax assets; and the fair value of and forfeiture rates for stock-based awards, among others. The Company bases its estimates and judgments on historical experience, its forecasts and budgets, and other factors that the Company considers relevant.
Revenue Recognition
The Company accounts for a contract with a customer when it has approval and commitment from all parties, the rights of the parties and payment terms are identified, the contract has commercial substance, and collectability of consideration is probable. Revenue is recognized when control of the promised services is transferred to our customers and in an amount that reflects the consideration the Company expects to be entitled to in exchange for those services.
The Company’s revenue is primarily derived directly from users in the form of recurring subscriptions. Subscription revenue is presented net of credits and credit card chargebacks. Subscribers pay in advance, primarily by credit card or through mobile app stores, and, subject to certain conditions identified in our terms and conditions, generally all purchases are final and nonrefundable. Revenue is initially deferred and is recognized using the straight-line method over the term of the applicable subscription period, which generally ranges from one to six months. Revenue is also earned from online advertising, the purchase of à la carte features and offline events. Online advertising revenue is recognized when an advertisement is displayed. Revenue from the purchase of à la carte features is recognized based on usage. Revenue associated with offline events is recognized when each event occurs.
As permitted under the practical expedient available under ASU No. 2014-09, the Company does not disclose the value of unsatisfied performance obligations for (i) contracts with an original expected length of one year or less, (ii) contracts with variable consideration that is allocated entirely to unsatisfied performance obligations or to a wholly unsatisfied promise accounted for under the series guidance, and (iii) contracts for which the Company recognizes revenue at the amount which we have the right to invoice for services performed.
Transaction Price
The objective of determining the transaction price is to estimate the amount of consideration the Company is due in exchange for its services, including amounts that are variable. The Company determines the total transaction price, including an estimate of any variable consideration, at contract inception and reassesses this estimate each reporting period.
The Company excludes from the measurement of transaction price all taxes assessed by governmental authorities that are both (i) imposed on and concurrent with a specific revenue-producing transaction and (ii) collected from customers. Accordingly, such tax amounts are not included as a component of revenue or cost of revenue.
MATCH GROUP, INC. AND SUBSIDIARIES
NOTES TO CONSOLIDATED FINANCIAL STATEMENTS (Continued)
For contracts that have an original duration of one year or less, the Company uses the practical expedient available under ASU No. 2014-09 applicable to such contracts and does not consider the time value of money.
Assets Recognized from the Costs to Obtain a Contract with a Customer
The Company has determined that certain costs, primarily mobile app store fees, meet the requirements to be capitalized as a cost of obtaining a contract. The Company recognizes an asset for these costs if we expect to recover those costs. Mobile app store fees are amortized over the period of contract performance. Specifically, the Company capitalizes and amortizes mobile app store fees over the term of the applicable subscription.
During the years ended December 31, 2020 and 2019, the Company recognized expense of $414.7 million and $364.7 million, respectively, related to the amortization of these costs. The contract asset balances at December 31, 2020 and 2019, and 2018 related to costs to obtain a contract are $33.5 million, $28.5 million, and $29.2 million, respectively, included in “Other current assets” in the accompanying consolidated balance sheet.
Accounts Receivables, Net of Allowance for Credit Losses and Revenue Reserves
The majority of our users purchase our products through mobile app stores. At December 31, 2020, two mobile app stores accounted for approximately 65% and 11%, respectively, of our gross accounts receivables. The comparable amounts at December 31, 2019 were 56% and 13%, respectively. We evaluate the credit worthiness of these two mobile app stores on an ongoing basis and do not require collateral from these entities. We generally collect these balances between 30 and 45 days following the purchase. Payments made directly through our applications are processed by third-party payment processors. We generally collect these balances within 3 to 5 days following the purchase. The Company also maintains allowances to reserve for potential credits issued to users or other revenue adjustments. The amounts of these reserves are based primarily upon historical experience.
Accounts receivable related to indirect revenue include amounts billed and currently due from customers. The Company maintains an allowance for credit losses to provide for the estimated amount of accounts receivable that will not be collected. The allowance for credit losses is based upon historical collection trends adjusted for economic conditions using reasonable and supportable forecasts. The time between the Company issuance of an invoice and payment due date is not significant; customer payments that are not collected in advance of the transfer of promised services are generally due no later than 30 days from invoice date.
Deferred Revenue
Deferred revenue consists of advance payments that are received or are contractually due in advance of the Company’s performance. The Company’s deferred revenue is reported on a contract by contract basis at the end of each reporting period. The Company classifies deferred revenue as current when the term of the applicable subscription period or expected completion of our performance obligation is one year or less. The deferred revenue balances are $239.1 million, $218.8 million, and $209.9 million at December 31, 2020 and 2019, and 2018, respectively. During the years ended December 31, 2020 and 2019, the Company recognized $218.8 million and $209.9 million of revenue that was included in the deferred revenue balance as of December 31, 2019 and 2018, respectively. At December 31, 2020 and 2019, there is no non-current portion of deferred revenue.
MATCH GROUP, INC. AND SUBSIDIARIES
NOTES TO CONSOLIDATED FINANCIAL STATEMENTS (Continued)
Disaggregation of Revenue
The following table presents disaggregated revenue:
| | | | | | | | | | | | | | | | | |
| | For the Years Ended December 31, |
| | 2020 | | 2019 | | 2018 |
| | | | | |
| | (In thousands) |
| Direct Revenue: | | | | | |
| North America | $ | 1,185,307 | | | $ | 1,024,161 | | | $ | 902,478 | |
| International | 1,159,417 | | | 983,013 | | | 774,693 | |
| Total Direct Revenue | 2,344,724 | | | 2,007,174 | | | 1,677,171 | |
Indirect Revenue (principally advertising revenue) | 46,545 | | | 44,084 | | | 52,679 | |
| Total Revenue | $ | 2,391,269 | | | $ | 2,051,258 | | | $ | 1,729,850 | |
| | | | | |
| Direct Revenue | | | | | |
| Tinder | $ | 1,355,400 | | | $ | 1,152,045 | | | $ | 805,316 | |
| Other brands | 989,324 | | | 855,129 | | | 871,855 | |
| Total Direct Revenue | $ | 2,344,724 | | | $ | 2,007,174 | | | $ | 1,677,171 | |
Cash and Cash Equivalents
Cash and cash equivalents include cash and short-term investments, with maturities of less than 91 days from the date of purchase. Domestically, cash equivalents primarily consist of (i) AAA rated government money market funds and (ii) time deposits. Internationally, cash equivalents primarily consist of money market funds.
Property and Equipment
Property and equipment, including significant improvements, are recorded at cost. Repairs and maintenance costs are expensed as incurred. Depreciation is computed using the straight-line method over the estimated useful lives of the assets or, in the case of leasehold improvements, the lease term, if shorter.
| | | | | |
| Asset Category | Estimated
Useful Lives |
| Buildings and building improvements | 10 to 39 years |
| Computer equipment and capitalized software | 2 to 3 years |
| Furniture and other equipment | 5 years |
| Leasehold improvements | 6 to 10 years |
The Company capitalizes certain internal use software costs including external direct costs utilized in developing or obtaining the software and compensation for personnel directly associated with the development of the software. Capitalization of such costs begins when the preliminary project stage is complete and ceases when the project is substantially complete and ready for its intended purpose. The net book value of capitalized internal use software is $34.9 million and $27.5 million at December 31, 2020 and 2019, respectively.
Business Combinations
The purchase price of each acquisition is attributed to the assets acquired and liabilities assumed based on their fair values at the date of acquisition, including identifiable intangible assets that either arise from a contractual or legal right or are separable from goodwill. The Company typically engages outside valuation experts to assist in the allocation of purchase price to the identifiable intangible assets acquired, but management has ultimate responsibility for the valuation methods, models, and inputs used and the resulting purchase price allocation. The excess purchase price over the net tangible and identifiable intangible assets is recorded as goodwill and assigned to the reporting unit that is expected to benefit from the combination as of the acquisition date.
MATCH GROUP, INC. AND SUBSIDIARIES
NOTES TO CONSOLIDATED FINANCIAL STATEMENTS (Continued)
Goodwill and Indefinite-Lived Intangible Assets
The Company assesses goodwill on its one reporting unit and indefinite-lived intangible assets for impairment annually as of October 1, or more frequently if an event occurs or circumstances change that would more likely than not reduce the fair value of a reporting unit or the fair value of an indefinite-lived intangible asset below its carrying value.
When the Company elects to perform a qualitative assessment and concludes it is not more likely than not that the fair value of the reporting unit is less than its carrying value, no further assessment of that reporting unit’s goodwill is necessary; otherwise, a quantitative assessment is performed and the fair value of the reporting unit is determined. If the carrying value of the reporting unit exceeds its fair value, an impairment loss equal to the excess is recorded.
As a result of the Separation, the Company had a negative carrying value for the Company’s annual goodwill test at October 1, 2020. Additionally, an impairment test of goodwill was not necessary because there were no factors identified that would indicate an impairment loss. The Company continued to have a negative carrying value at December 31, 2020.
The Company foregoes a qualitative assessment and tests goodwill for impairment when it concludes that it is more likely than not that there may be an impairment. If needed, the annual or interim quantitative test of the recovery of goodwill involves a comparison of the estimated fair value of the Company’s reporting unit to its carrying value, including goodwill. If the estimated fair value of the reporting unit exceeds its carrying value, goodwill of the reporting unit is not impaired. If the carrying value of the reporting unit exceeds its estimated fair value, an impairment loss equal to the excess is recorded.
While the Company has the option to qualitatively assess whether it is more likely than not that the fair values of its indefinite-lived intangible assets are less than their carrying values, the Company’s policy is to determine the fair value of each of its indefinite-lived intangible assets annually as of October 1, in part, because the level of effort required to perform the quantitative and qualitative assessments is essentially equivalent. The Company determines the fair value of its indefinite-lived intangible assets using an avoided royalty discounted cash flow (“DCF”) valuation analysis. Significant judgments inherent in this analysis include the selection of appropriate royalty and discount rates and estimating the amount and timing of expected future cash flows. The discount rates used in the DCF analyses are intended to reflect the risks inherent in the expected future cash flows generated by the respective intangible assets. The royalty rates used in the DCF analyses are based upon an estimate of the royalty rates that a market participant would pay to license the Company’s trade names and trademarks. The future cash flows are based on the Company’s most recent forecast and budget and, for years beyond the budget, the Company’s estimates, which are based, in part, on forecasted growth rates. Assumptions used in the avoided royalty DCF analyses, including the discount rate and royalty rate, are assessed annually based on the actual and projected cash flows related to the asset, as well as macroeconomic and industry specific factors. The discount rates used in the Company’s annual indefinite-lived impairment assessment ranged from 10% to 23% in 2020 and 11% to 26% in 2019, and the royalty rates used ranged from 5% to 8% in 2020 and 3% to 8% in 2019. During the year ended December 31, 2020, the Company recognized an impairment charge related to the Match brand in the UK and the Meetic brand in Europe of $4.6 million, which is included within amortization. During the year ended December 31, 2019, the Company recognized an impairment charge on the Match brand in the UK of $6.6 million, which is included within amortization. At December 31, 2019, the aggregate indefinite-lived intangible asset balance for which the estimate of fair value at that time was less than 110% of their carrying values was approximately $92.3 million. At December 31, 2020, no indefinite-lived intangible asset balance had an estimated fair value less than 110% of carrying value.
Long-Lived Assets and Intangible Assets with Definite Lives
Long-lived assets, which consist of ROU assets, property and equipment, and intangible assets with definite lives, are reviewed for impairment whenever events or changes in circumstances indicate that the carrying value of an asset may not be recoverable. The carrying value of a long-lived asset is not recoverable if it exceeds the sum of the undiscounted cash flows expected to result from the use and eventual disposition of the asset. If the carrying value is deemed not to be recoverable, an impairment loss is recorded equal to the amount by which the carrying value of the long-lived asset exceeds its fair value. Amortization of definite-lived intangible assets is
MATCH GROUP, INC. AND SUBSIDIARIES
NOTES TO CONSOLIDATED FINANCIAL STATEMENTS (Continued)
computed either on a straight-line basis or based on the pattern in which the economic benefits of the asset will be realized.
Fair Value Measurements
The Company categorizes its financial instruments measured at fair value into a fair value hierarchy that prioritizes the inputs used in pricing the asset or liability. The three levels of the fair value hierarchy are:
•Level 1: Observable inputs obtained from independent sources, such as quoted market prices for identical assets and liabilities in active markets.
•Level 2: Other inputs, which are observable directly or indirectly, such as quoted market prices for similar assets or liabilities in active markets, quoted market prices for identical or similar assets or liabilities in markets that are not active, and inputs that are derived principally from or corroborated by observable market data. The fair values of the Company’s Level 2 financial assets are primarily obtained from observable market prices for identical underlying securities that may not be actively traded. Certain of these securities may have different market prices from multiple market data sources, in which case an average market price is used.
•Level 3: Unobservable inputs for which there is little or no market data and require the Company to develop its own assumptions, based on the best information available in the circumstances, about the assumptions market participants would use in pricing the assets or liabilities.
The Company’s non-financial assets, such as goodwill, intangible assets, ROU assets, and property and equipment, are adjusted to fair value only when an impairment is recognized. The Company’s financial assets, comprising of equity securities without readily determinable fair values, are adjusted to fair value when observable price changes are identified or an impairment is recognized. Such fair value measurements are based predominantly on Level 3 inputs.
Advertising Costs
Advertising costs are expensed in the period incurred (when the advertisement first runs for production costs that are initially capitalized) and represent online marketing, including fees paid to search engines and social media sites; offline marketing, which is primarily television advertising; and payments to partners who direct traffic to our websites. Advertising expense is $438.7 million, $388.6 million and $386.0 million for the years ended December 31, 2020, 2019 and 2018, respectively.
Legal Costs
Legal costs are expensed as incurred.
Income Taxes
We are subject to income taxes in the United States and numerous foreign jurisdictions. Significant judgement is required in determining our provision for income taxes and income tax assets and liabilities, including evaluating uncertainties in the application of accounting principles and complex tax laws.
The Company accounts for income taxes under the liability method, and deferred tax assets and liabilities are recognized for the future tax consequences attributable to differences between the financial reporting amounts of existing assets and liabilities and their respective tax bases. Deferred tax assets and liabilities are measured using enacted tax rates in effect for the year in which those temporary differences are expected to be realized or settled. A valuation allowance is provided if it is determined that it is more likely than not that the deferred tax asset will not be realized.
We recognize tax benefits from uncertain tax positions only if we believe that it is more likely than not that the tax position will be sustained based on the technical merits of the position. Such tax benefits are measured based on the largest benefit that has a greater than 50% likelihood of being realized upon settlement. The Company records interest and penalties related to uncertain tax positions as a component of income tax expense.
MATCH GROUP, INC. AND SUBSIDIARIES
NOTES TO CONSOLIDATED FINANCIAL STATEMENTS (Continued)
Earnings Per Share
Basic earnings per share is computed by dividing net earnings attributable to Match Group shareholders by the weighted average number of common shares outstanding during the period. Diluted earnings per share reflects the potential dilution that could occur if stock options and other commitments to issue common stock were exercised or equity awards vested resulting in the issuance of common stock that could share in the earnings of the Company. See “Note 10—Earnings per Share” for additional information on dilutive securities.
Foreign Currency Translation and Transaction Gains and Losses
The financial position and operating results of foreign entities whose primary economic environment is based on their local currency are consolidated using the local currency as the functional currency. These local currency assets and liabilities are translated at the rates of exchange as of the balance sheet date, and local currency revenue and expenses of these operations are translated at average rates of exchange during the period. Translation gains and losses are included in accumulated other comprehensive income as a component of shareholders’ equity. Transaction gains and losses resulting from assets and liabilities denominated in a currency other than the functional currency are included in the consolidated statement of operations as a component of Other income (expense), net. See “Note 17—Consolidated Financial Statement Details” for additional information regarding foreign currency exchange gains and losses.
Translation gains and losses relating to foreign entities that are liquidated or substantially liquidated are reclassified out of accumulated other comprehensive loss into earnings. Losses of $0.2 million and $0.1 million during the years ended December 31, 2020 and 2018 are included in “Other income (expense), net” in the accompanying consolidated statement of operations. There were no such gains or losses for the year ended December 31, 2019.
Stock-Based Compensation
Stock-based compensation is measured at the grant date based on the fair value of the award and is generally expensed over the requisite service period. See “Note 11—Stock-based Compensation” for a discussion of the Company’s stock-based compensation plans.
Redeemable Noncontrolling Interests
Noncontrolling interests in the consolidated subsidiaries of the Company are ordinarily reported on the consolidated balance sheet within shareholders’ equity, separately from the Company’s equity. However, securities that are redeemable at the option of the holder and not solely within the control of the issuer must be classified outside of shareholders’ equity. Accordingly, all noncontrolling interests that are redeemable at the option of the holder are presented outside of shareholders’ equity in the accompanying consolidated balance sheet.
In connection with the acquisition of certain subsidiaries, management of these businesses has retained an ownership interest. The Company is party to fair value put and call arrangements with respect to these interests. These put and call arrangements allow management of these businesses to require the Company to purchase their interests, or allow the Company to acquire such interests, at fair value. These put and call arrangements do not meet the definition of a derivative instrument as the put agreements do not provide for net settlement. These put and call arrangements become exercisable by the Company and the counterparty at various future dates. One of these arrangements was exercised during each of the years ended December 31, 2020 and 2019, and two of these arrangements were exercised during the year ended December 31, 2018. These put arrangements are exercisable by the counter-party outside the control of the Company. Accordingly, to the extent that the fair value of these interests exceeds the value determined by normal noncontrolling interest accounting, the value of such interests is adjusted to fair value with a corresponding adjustment to additional paid-in capital. During the years ended December 31, 2020, 2019, and 2018, the Company recorded adjustments of $6.7 million, $11.6 million, and $4.1 million, respectively, to increase these interests to fair value. Fair value determinations require high levels of judgment and are based on various valuation techniques, including market comparables and discounted cash flow projections.
MATCH GROUP, INC. AND SUBSIDIARIES
NOTES TO CONSOLIDATED FINANCIAL STATEMENTS (Continued)
Certain Risks and Concentrations
The Company’s business is subject to certain risks and concentrations, including dependence on third-party technology providers, exposure to risks associated with online commerce security and credit card fraud.
Financial instruments, which potentially subject the Company to concentration of credit risk, consist primarily of cash and cash equivalents. Cash and cash equivalents are principally maintained with financial institutions that are not covered by deposit insurance.
Recent Accounting Pronouncements
Accounting pronouncements adopted by the Company
The Company adopted ASU No. 2016-13 effective January 1, 2020. ASU No. 2016-13 replaces the “incurred loss” approach with an “expected loss” model, under which companies will recognize allowances based on expected rather than incurred losses. The Company adopted ASU No. 2016-13 using the modified retrospective approach and there was no cumulative effect arising from the adoption. The adoption of ASU No. 2016-13 did not have a material impact on the Company's financial statements.
The Company adopted ASU No. 2019-12 effective January 1, 2020. ASU No. 2019-12 simplifies the accounting for income taxes, eliminates certain exceptions within ASC 740, Income Taxes, and clarifies certain aspects of the current guidance to promote consistency among reporting entities. Most amendments within ASU No. 2019-12 are required to be applied on a prospective basis, while certain amendments must be applied on a retrospective or modified retrospective basis. The Company adopted ASU No. 2019-12 on January 1, 2020 using the modified retrospective basis for those amendments that are not applied on a prospective basis. The adoption of ASU No. 2019-12 did not have a material impact on the Company’s consolidated financial statements.
Accounting pronouncements not yet adopted by the Company
In August 2020, the FASB issued ASU No. 2020-06, which simplifies the accounting for certain financial instruments with characteristics of liabilities and equity, including convertible instruments and contracts in an entity’s own equity. Among other changes, ASU 2020-06 removes from U.S. GAAP the liability and equity separation model for convertible instruments with a cash conversion feature, and as a result, after adoption, entities will no longer separately present in equity an embedded conversion feature for such debt. Similarly, the discount resulting from the embedded conversion feature will no longer be amortized into income as interest expense over the life of the instrument. Instead, entities will account for a convertible debt instrument wholly as debt unless (1) a convertible instrument contains features that require bifurcation as a derivative under ASC Topic 815, Derivatives and Hedging, or (2) a convertible debt instrument was issued at a substantial premium. Among other potential impacts, this change is expected to reduce reported interest expense, increase reported net income, and result in a reclassification of certain conversion feature balance sheet amounts from stockholders’ equity to liabilities as it relates to the Company’s exchangeable senior notes. Additionally, ASU 2020-06 requires the application of the if-converted method to calculate the impact of convertible instruments on diluted earnings per share, which will result in increased dilutive securities as the assumption of cash settlement of the notes will not be available for the purpose of calculating earnings per share. The provisions of ASU 2020-06 are effective for reporting periods beginning after December 15, 2021, with early adoption permitted for reporting periods beginning after December 15, 2020, and can be adopted on either a fully retrospective or modified retrospective basis.
The Company anticipates adopting ASU No. 2020-06 as of January 1, 2021 on a fully retrospective basis. For the year ended December 31, 2020 after adoption of ASU No. 2020-16, we expect interest expense will decrease by approximately $44 million and the income tax provision will increase approximately $10 million resulting in an increase in net earnings from continuing operations of approximately $34 million. Basic earnings per share from continuing operations would increase approximately $0.16 and dilutive earnings per share from continuing operations would increase approximately $0.09 with an increase of weighted average dilutive shares outstanding of approximately 14 million shares. As of December 31, 2020 after adoption of ASU No. 2020-06, we expect long-term debt, net to increase approximately $300 million, with a similar reduction in additional paid-in capital.
MATCH GROUP, INC. AND SUBSIDIARIES
NOTES TO CONSOLIDATED FINANCIAL STATEMENTS (Continued)
Reclassifications
Certain prior year amounts have been reclassified to conform to the current year presentation.
NOTE 3—INCOME TAXES
U.S. and foreign earnings before income taxes are as follows:
| | | | | | | | | | | | | | | | | |
| | Years Ended December 31, |
| | 2020 | | 2019 | | 2018 |
| | | | | |
| | (In thousands) |
| U.S. | $ | 503,802 | | | $ | 424,474 | | | $ | 367,567 | |
| Foreign | 82,983 | | | 78,384 | | | 94,844 | |
| Total | $ | 586,785 | | | $ | 502,858 | | | $ | 462,411 | |
The components of the provision (benefit) for income taxes are as follows:
| | | | | | | | | | | | | | | | | |
| | Years Ended December 31, |
| | 2020 | | 2019 | | 2018 |
| | | | | |
| | (In thousands) |
| Current income tax provision (benefit): | | | | | |
| Federal | $ | (2,044) | | | $ | 964 | | | $ | (688) | |
| State | 1,640 | | | 342 | | | 341 | |
| Foreign | 28,293 | | | 26,527 | | | 34,659 | |
| Current income tax provision | 27,889 | | | 27,833 | | | 34,312 | |
| Deferred income tax provision (benefit): | | | | | |
| Federal | 21,750 | | | (8,367) | | | (14,027) | |
| State | (11,575) | | | (10,345) | | | (2,343) | |
| Foreign | (5,190) | | | (896) | | | (6,635) | |
| Deferred income tax provision (benefit) | 4,985 | | | (19,608) | | | (23,005) | |
| Income tax provision | $ | 32,874 | | | $ | 8,225 | | | $ | 11,307 | |
MATCH GROUP, INC. AND SUBSIDIARIES
NOTES TO CONSOLIDATED FINANCIAL STATEMENTS (Continued)
The tax effects of cumulative temporary differences that give rise to significant portions of the deferred tax assets and deferred tax liabilities are presented below. The valuation allowance is primarily related to deferred tax assets for foreign tax credits and net operating losses.
| | | | | | | | | | | |
| | December 31, |
| | 2020 | | 2019 |
| | | |
| | (In thousands) |
| Deferred tax assets: | | | |
| | | |
| Net operating loss carryforwards | $ | 152,012 | | | $ | 152,469 | |
| Tax credit carryforwards | 102,012 | | | 68,787 | |
| Disallowed interest carryforwards | 56,630 | | | 28,673 | |
| Stock-based compensation | 16,073 | | | 14,274 | |
| Other | 34,815 | | | 20,711 | |
| Total deferred tax assets | 361,542 | | | 284,914 | |
| Less valuation allowance | (71,090) | | | (52,913) | |
| Net deferred tax assets | 290,452 | | | 232,001 | |
| Deferred tax liabilities: | | | |
| Intangible assets | (44,200) | | | (43,568) | |
| Right-of-use assets | (17,306) | | | (10,056) | |
| Property and equipment | (17,218) | | | (3,275) | |
| Other | (4,928) | | | (891) | |
| Total deferred tax liabilities | (83,652) | | | (57,790) | |
| Net deferred tax assets | $ | 206,800 | | | $ | 174,211 | |
The Company’s tax group for federal and consolidated state income tax purposes includes Former IAC up to and including the Separation date. As a result of the Separation, a portion of the Company’s temporary differences and tax attributes from our federal and consolidated state income tax filings were allocated between the Company and IAC. The allocation attributable to IAC resulted in an increase to the Company’s deferred tax asset and additional paid-in capital. The allocation attributable to the Company was recorded in 2020 and is preliminary and subject to adjustment. Any subsequent adjustment to allocated tax attributes will be recognized as an adjustment to deferred taxes and additional paid-in capital.
At December 31, 2020, the Company has federal and state net operating losses (“NOLs”) of $499.6 million and $344.7 million, respectively. If not utilized, $13.8 million of the federal NOLs can be carried forward indefinitely, and $485.8 million will expire at various times, primarily between 2034 and 2037. Of the state NOLs, $168.4 million can be carried forward indefinitely and $176.3 million will expire at various times, primarily between 2022 and 2037. Federal and state NOLs of $385.3 million and $300.9 million, respectively, can be used against future taxable income without restriction and the remaining NOLs will be subject to limitations under Section 382 of the Internal Revenue Code, separate return limitations, federal taxable income limitations, and applicable state law. At December 31, 2020, the Company has foreign NOLs of $116.8 million available to offset future income. Of these foreign NOLs, $99.3 million can be carried forward indefinitely and $17.5 million will expire at various times between 2021 and 2037. During 2020, the Company recognized tax benefits related to NOLs of $2.7 million. At December 31, 2020, the Company has federal and foreign disallowed interest carryforwards of $206.5 million and $57.1 million, respectively, that can be carried forward indefinitely and can be used against future taxable income.
At December 31, 2020, the Company has tax credit carryforwards of $131.0 million. Of this amount, $92.8 million relates to federal and state tax credits for research activities, of which $59.9 million will expire at various times between 2033 and 2040. Our credit carryforwards also include $38.2 million of foreign tax credits, of which $36.2 million will expire between 2021 and 2027.
MATCH GROUP, INC. AND SUBSIDIARIES
NOTES TO CONSOLIDATED FINANCIAL STATEMENTS (Continued)
The Company regularly assesses the realizability of deferred tax assets considering all available evidence, including, to the extent applicable, the nature, frequency and severity of prior cumulative losses, forecasts of future taxable income, tax filing status, the duration of statutory carryforward periods, available tax planning and historical experience.
During the year ended December 31, 2020, we recorded a valuation allowance of $29.8 million related to U.S. foreign tax credits for which we do not believe a tax benefit is more likely than not to be realized within the carryforward period. At December 31, 2020, the Company has a valuation allowance of $71.1 million related to the portion of credits, NOLs, and other items for which it is more likely than not that the tax benefit will not be realized.
A reconciliation of the income tax provision to the amounts computed by applying the statutory federal income tax rate to earnings before income taxes is shown as follows:
| | | | | | | | | | | | | | | | | |
| | Years Ended December 31, |
| | 2020 | | 2019 | | 2018 |
| | | | | |
| | (In thousands) |
Income tax provision at the federal statutory rate of 21% | $ | 123,225 | | | $ | 105,600 | | | $ | 97,106 | |
| | | | | |
| State income taxes, net of effect of federal tax benefit | 7,679 | | | 9,627 | | | 7,246 | |
| Stock-based compensation | (112,203) | | | (90,374) | | | (92,140) | |
| Research credits | (21,306) | | | (27,248) | | | (6,701) | |
| Change in valuation allowance for foreign tax credits | 29,787 | | | — | | | — | |
| Foreign income taxed at a different statutory rate | 4,884 | | | 3,526 | | | 13,129 | |
| Withholding taxes | 2,933 | | | 5,023 | | | 3,566 | |
| Change in uncertain tax positions | (5,770) | | | (637) | | | (1,780) | |
| | | | | |
| Non-taxable foreign currency exchange gains and losses | 688 | | | (557) | | | (2,086) | |
| Transition tax | — | | | — | | | (3,178) | |
| | | | | |
| | | | | |
| Other, net | 2,957 | | | 3,265 | | | (3,855) | |
| Income tax provision | $ | 32,874 | | | $ | 8,225 | | | $ | 11,307 | |
A reconciliation of the beginning and ending amount of unrecognized tax benefits, including penalties but excluding interest, is as follows:
| | | | | | | | | | | | | | | | | |
| | December 31, |
| | 2020 | | 2019 | | 2018 |
| | | | | |
| | (In thousands) |
| Balance at January 1 | $ | 53,324 | | | $ | 35,679 | | | $ | 25,063 | |
| Additions based on tax positions related to the current year | 7,818 | | | 11,221 | | | 8,589 | |
| Additions for tax positions of prior years | 1,772 | | | 7,599 | | | 3,901 | |
| Reductions for tax positions of prior years | (16,512) | | | (283) | | | (134) | |
| | | | | |
| Expiration of applicable statute of limitations | (778) | | | (892) | | | (1,740) | |
| Balance at December 31 | $ | 45,624 | | | $ | 53,324 | | | $ | 35,679 | |
The Company recognizes interest and, if applicable, penalties related to unrecognized tax benefits in the income tax provision. Our income tax provision, for the years ended December 31, 2020, 2019, and 2018, includes a (decrease) or increase of interest and penalties of $(1.7) million, $0.1 million, and $(0.1) million, respectively. At December 31, 2020 and 2019, noncurrent income taxes payable include accrued interest and penalties of $1.9 million and $3.1 million, respectively.
Match Group is routinely under audit by federal, state, local and foreign authorities in the area of income tax. These audits include questioning the timing and the amount of income and deductions and the allocation of
MATCH GROUP, INC. AND SUBSIDIARIES
NOTES TO CONSOLIDATED FINANCIAL STATEMENTS (Continued)
income and deductions among various tax jurisdictions. The Internal Revenue Service (“IRS”) has substantially completed its audit of the Company’s federal income tax returns for the years ended December 31, 2010 through 2016 resulting in reductions to the manufacturing deduction and research credits claimed. The IRS began an audit of the year ended December 31, 2017 in the second quarter of 2020. The statute of limitations for years 2010 through 2012 has been extended to May 31, 2021, and the statute of limitations for years 2013 through 2017 has been extended to June 30, 2022. Various other jurisdictions are open to examination for tax years beginning with 2009. Income taxes payable include reserves considered sufficient to pay assessments that may result from examination of prior year tax returns. We consider many factors when evaluating and estimating our tax positions and tax benefits, which may require periodic adjustment, and which may not accurately anticipate actual outcomes. Although we believe that we have adequately reserved for our uncertain tax positions, the final tax outcome of these matters may vary significantly from our estimates. To the extent that the final tax outcome of these matters is different from the amounts recorded, such differences will affect the income tax provision in the period in which such determination is made, and could have a material impact on our financial condition and operating results.
At December 31, 2020 and 2019, unrecognized tax benefits, including interest, were $46.7 million and $55.5 million, respectively. If unrecognized tax benefits at December 31, 2020 are subsequently recognized, $41.8 million, net of related deferred tax assets and interest, would reduce income tax expense. The comparable amount as of December 31, 2019 was $51.9 million. The Company believes that it is reasonably possible that its unrecognized tax benefits could decrease by approximately $4.5 million by December 31, 2021, primarily due to settlements and expirations of statutes of limitations.
On December 22, 2017, the U.S. enacted the Tax Cuts and Jobs Act (the “TCJA”), which, among other things, reduced the U.S. federal corporate income tax rate from 35% to 21%, subjected to U.S. taxation certain previously deferred earnings of foreign subsidiaries as of December 31, 2017 (“Transition Tax”) and generally eliminated U.S. taxes on foreign subsidiary distributions. The Company was able to make a reasonable estimate of the Transition Tax and recorded a provisional transition tax expense in 2017. During 2018, the Company finalized this calculation, which resulted in a $3.2 million reduction in the Transition Tax. The net reduction in the Transition Tax was due primarily to the utilization of additional foreign tax credits, partially offset by additional taxable earnings and profits of our foreign subsidiaries based on guidance issued by the IRS subsequent to December 21, 2017.
Generally, our ability to distribute the $158.1 million cash and cash equivalents held by our foreign subsidiaries at December 31, 2020 is limited to that subsidiary’s distributable reserves and after considering other corporate legal restrictions. As a result of the TCJA, our earnings in foreign jurisdictions are generally available for distribution to the U.S. without significant tax consequences.
MATCH GROUP, INC. AND SUBSIDIARIES
NOTES TO CONSOLIDATED FINANCIAL STATEMENTS (Continued)
NOTE 4—DISCONTINUED OPERATIONS
On June 30, 2020, as part of the Separation described in “Note 1—Organization,” the operations of Former IAC businesses other than Match Group are presented as discontinued operations.
The components of assets and liabilities of discontinued operations in the accompanying consolidated balance sheet at December 31, 2019 consisted of the following:
| | | | | |
| December 31, 2019 |
| (In thousands) |
| Cash and cash equivalents | $ | 2,673,619 | |
| Marketable securities | 19,993 | |
| Accounts receivable, net | 181,875 | |
| Other current assets | 152,592 | |
| Total current assets in discontinued operations | $ | 3,028,079 | |
| |
| Property and equipment, net | $ | 270,288 | |
| Goodwill | 1,614,623 | |
| Intangible assets, net | 350,150 | |
| Long-term investments | 347,976 | |
| Other non-current assets | 247,746 | |
| Total non-current assets in discontinued operations | $ | 2,830,783 | |
| |
| Current portion of long-term debt | $ | 13,750 | |
| Accounts payable, trade | 74,166 | |
| Deferred revenue | 178,647 | |
| Accrued expenses and other current liabilities | 322,333 | |
| Total current liabilities in discontinued operations | $ | 588,896 | |
| |
| Long-term debt, net | $ | 231,946 | |
| Income taxes payable | 6,410 | |
| Deferred income taxes | 28,751 | |
| Other long-term liabilities | 180,307 | |
| Total long-term liabilities in discontinued operations | $ | 447,414 | |
MATCH GROUP, INC. AND SUBSIDIARIES
NOTES TO CONSOLIDATED FINANCIAL STATEMENTS (Continued)
The key components of (loss) earnings from discontinued operations for the years ended December 31, 2020, 2019, and 2018 consist of the following:
| | | | | | | | | | | | | | | | | |
| Years Ended December 31, |
| 2020 | | 2019 | | 2018 |
| | | | | |
| (In thousands) |
| Revenue | $ | 1,410,485 | | | $ | 2,705,797 | | | $ | 2,533,042 | |
| Operating costs and expenses | (1,840,178) | | | (2,769,918) | | | (2,517,372) | |
| Operating (loss) income | (429,693) | | | (64,121) | | | 15,670 | |
| Interest expense | (3,772) | | | (12,993) | | | (14,759) | |
| Other (expense) income | (2,503) | | | 68,767 | | | 298,236 | |
| Income tax benefit | 69,898 | | | 57,534 | | | 7,496 | |
| (Loss) earnings from discontinued operations | $ | (366,070) | | | $ | 49,187 | | | $ | 306,643 | |
NOTE 5—GOODWILL AND INTANGIBLE ASSETS
Goodwill and intangible assets, net, are as follows:
| | | | | | | | | | | |
| | December 31, |
| | 2020 | | 2019 |
| | | |
| | (In thousands) |
| Goodwill | $ | 1,270,532 | | | $ | 1,239,839 | |
| Intangible assets with indefinite lives | 226,605 | | | 221,199 | |
| Intangible assets with definite lives, net | 4,295 | | | 7,125 | |
| Total goodwill and intangible assets, net | $ | 1,501,432 | | | $ | 1,468,163 | |
For the year ended December 31, 2019, the Company recognized an impairment charge on the Match brand in the UK of $6.6 million. During the year ended December 31, 2020, the Company recognized additional impairment charges totaling $4.6 million related to the Match brand in the UK and the Meetic brand in Europe as the outbreak of COVID-19 placed additional pressure on projected 2020 revenues at these brands. These charges are included within amortization expense in the consolidated statement of operations for the years then ended.
The following table presents the balance of goodwill, including the changes in the carrying value of goodwill, for the years ended December 31, 2020 and 2019:
| | | | | | | | | | | |
| December 31, |
| 2020 | | 2019 |
| | | |
| (In thousands) |
| Balance at January 1 | $ | 1,239,839 | | | $ | 1,245,012 | |
| Additions | — | | | 3,553 | |
| | | |
| Foreign Exchange Translation | 30,948 | | | (8,726) | |
| Other | (255) | | | — | |
| Balance at December 31 | $ | 1,270,532 | | | $ | 1,239,839 | |
MATCH GROUP, INC. AND SUBSIDIARIES
NOTES TO CONSOLIDATED FINANCIAL STATEMENTS (Continued)
Intangible assets with indefinite lives are trade names and trademarks acquired in various acquisitions. At December 31, 2020 and 2019, intangible assets with definite lives are as follows:
| | | | | | | | | | | | | | | | | | | | | | | |
| December 31, 2020 |
| Gross
Carrying
Amount | | Accumulated
Amortization | | Net | | Weighted-Average
Useful Life
(Years) |
| | | | | | | |
| | (In thousands) | | |
| Patent and technology | $ | 11,044 | | | $ | (6,943) | | | $ | 4,101 | | | 9.3 |
| Trade names | 5,114 | | | (5,114) | | | — | | | — |
| | | | | | | |
| | | | | | | |
| Other | 3,688 | | | (3,494) | | | 194 | | | 3.0 |
| Total | $ | 19,846 | | | $ | (15,551) | | | $ | 4,295 | | | 9.0 |
| | | | | | | | | | | | | | | | | | | | | | | |
| December 31, 2019 |
| Gross
Carrying
Amount | | Accumulated
Amortization | | Net | | Weighted-Average
Useful Life
(Years) |
| | | | | | | |
| | (In thousands) | | |
| Patent and technology | $ | 10,797 | | | $ | (5,876) | | | $ | 4,921 | | | 8.9 |
| Trade names | 6,297 | | | (4,986) | | | 1,311 | | | 3.0 |
| | | | | | | |
| | | | | | | |
| Other | 3,775 | | | (2,882) | | | 893 | | | 4.0 |
| Total | $ | 20,869 | | | $ | (13,744) | | | $ | 7,125 | | | 7.2 |
At December 31, 2020, amortization of intangible assets with definite lives is estimated to be as follows:
| | | | | |
| (In thousands) |
| 2021 | $ | 813 | |
| 2022 | 706 | |
| 2023 | 596 | |
| 2024 | 450 | |
| 2025 and thereafter | 1,730 | |
| Total | $ | 4,295 | |
NOTE 6—FINANCIAL INSTRUMENTS
Equity securities without readily determinable fair values
At December 31, 2020 and 2019, the carrying value of the Company’s investments in equity securities without readily determinable fair values totaled $14.2 million and $5.1 million, respectively, and is included in “Other non-current assets” in the accompanying consolidated balance sheet. The cumulative downward adjustments (including impairments) to the carrying value of equity securities without readily determinable fair values held as of December 31, 2020, since the adoption of ASU 2016-01 on January 1, 2018 through December 31, 2020, were $2.1 million. For the year ended December 31, 2020, there were no adjustments to the carrying value of equity securities without readily determinable fair values. For the years ended December 31, 2019 and 2018, we recognized impairments of $4.0 million and $2.1 million, respectively, which are included in “Other income (expense), net” in the accompanying consolidated statement of operations.
MATCH GROUP, INC. AND SUBSIDIARIES
NOTES TO CONSOLIDATED FINANCIAL STATEMENTS (Continued)
Fair Value Measurements
The following tables present the Company’s financial instruments that are measured at fair value on a recurring basis:
| | | | | | | | | | | | | | | | | | | |
| | December 31, 2020 |
| | Quoted Market
Prices in Active
Markets for
Identical Assets
(Level 1) | | Significant Other Observable Inputs
(Level 2) | | | | Total
Fair Value
Measurements |
| | | | | | | |
| | (In thousands) |
| Assets: | | | | | | | |
| Cash equivalents: | | | | | | | |
| Money market funds | $ | 147,615 | | | $ | — | | | | | $ | 147,615 | |
| Time deposits | — | | | 50,000 | | | | | 50,000 | |
| Total | $ | 147,615 | | | $ | 50,000 | | | | | $ | 197,615 | |
| | | | | | | |
| | | | | | | |
| | | | | | | |
| | | | | | | | | | | | | | | | | | | |
| | December 31, 2019 |
| | Quoted Market
Prices in Active
Markets for
Identical Assets
(Level 1) | | Significant Other Observable Inputs
(Level 2) | | | | Total
Fair Value
Measurements |
| | | | | | | |
| | (In thousands) |
| Assets: | | | | | | | |
| Cash equivalents: | | | | | | | |
| Money market funds | $ | 150,865 | | | $ | — | | | | | $ | 150,865 | |
| Time deposits | — | | | 30,000 | | | | | 30,000 | |
| | | | | | | |
| | | | | | | |
| Total | $ | 150,865 | | | $ | 30,000 | | | | | $ | 180,865 | |
| | | | | | | |
| | | | | | | |
| | | | | | | |
Financial instruments measured at fair value only for disclosure purposes
The following table presents the carrying value and the fair value of financial instruments measured at fair value only for disclosure purposes.
| | | | | | | | | | | | | | | | | | | | | | | |
| December 31, 2020 | | December 31, 2019 |
| Carrying Value | | Fair Value | | Carrying Value | | Fair Value |
| | | | | | | |
| (In thousands) |
| | | | | | | |
Long-term debt, net (a) | $ | (3,534,706) | | | $ | (6,267,976) | | | $ | (2,889,626) | | | $ | (3,904,406) | |
______________________
(a)At December 31, 2020 and 2019, the carrying value of long-term debt, net includes unamortized original issue discount and debt issuance costs of $357.8 million and $402.9 million, respectively.
At December 31, 2020 and 2019, the fair value of long-term debt, net is estimated using observable market prices or indices for similar liabilities, which are Level 2 inputs.
MATCH GROUP, INC. AND SUBSIDIARIES
NOTES TO CONSOLIDATED FINANCIAL STATEMENTS (Continued)
NOTE 7—LONG-TERM DEBT, NET
Long-term debt, net consists of:
| | | | | | | | | | | |
| December 31, |
| 2020 | | 2019 |
| | | |
| (In thousands) |
| Credit Facility due February 13, 2025 | $ | — | | | $ | — | |
Term Loan due February 13, 2027 | 425,000 | | | 425,000 | |
| | | |
6.375% Senior Notes (the “6.375% Senior Notes”) | — | | | 400,000 | |
5.00% Senior Notes due December 15, 2027 (the “5.00% Senior Notes”); interest payable each June 15 and December 15 | 450,000 | | | 450,000 | |
4.625% Senior Notes due June 1, 2028 (the “4.625% Senior Notes”); interest payable each June 1 and December 1 | 500,000 | | | — | |
5.625% Senior Notes due February 15, 2029 (the “5.625% Senior Notes”); interest payable each February 15 and August 15 | 350,000 | | | 350,000 | |
4.125% Senior Notes due August 1, 2030 (the “4.125% Senior Notes”); interest payable each February 1 and August 1 | 500,000 | | | — | |
0.875% Exchangeable Senior Notes due October 1, 2022 (the “2022 Exchangeable Notes”); interest payable each April 1 and October 1 | 517,500 | | | 517,500 | |
0.875% Exchangeable Senior Notes due June 15, 2026 (the “2026 Exchangeable Notes”); interest payable each June 15 and December 15 | 575,000 | | | 575,000 | |
2.00% Exchangeable Senior Notes due January 15, 2030 (the “2030 Exchangeable Notes”); interest payable each January 15 and July 15 | 575,000 | | | 575,000 | |
| Total long-term debt | 3,892,500 | | | 3,292,500 | |
| | | |
| Less: Unamortized original issue discount | 312,891 | | | 357,887 | |
| Less: Unamortized debt issuance costs | 44,903 | | | 44,987 | |
| Total long-term debt, net | $ | 3,534,706 | | | $ | 2,889,626 | |
Term Loan and Credit Facility
In connection with the Separation, Former Match Group was merged into and with MG Holdings II. MG Holdings II replaced Former Match Group as borrower under the Credit Agreement and assumed its obligations thereunder and under the Term Loan and Credit Facility, as successor to Former Match Group.
MG Holdings II, an indirect wholly-owned subsidiary of the Company, entered into the Term Loan under a credit agreement (the “Credit Agreement”) on November 16, 2015. On February 13, 2020, the Term Loan was amended to reprice the outstanding balance to LIBOR plus 1.75% and extend its maturity from November 16, 2022 to February 13, 2027. Additionally, the amendment provided for a benchmark replacement should the LIBOR rate not be available in the future. The rate used would be agreed to between the administrative agent and the Company and may be based upon a secured overnight financing rate at the Federal Reserve Bank of New York. Additional information about the benchmark replacement can be found in Amendment No. 6 to the Credit Agreement. At both December 31, 2020 and December 31, 2019, the outstanding balance on the Term Loan was $425 million and the interest rate of the Term Loan was 1.96% and 4.44% as of those dates, respectively. Interest payments are due at least quarterly through the term of the loan. The Term Loan provides for annual principal payments as part of an excess cash flow sweep provision, the amount of which, if any, is governed by the secured net leverage ratio contained in the Credit Agreement.
On February 13, 2020, the Credit Facility was amended to, among other things, increase the available borrowing capacity from $500 million to $750 million, reduce interest rate margins by 0.125%, and extend its maturity to February 13, 2025. At December 31, 2020 and December 31, 2019, there were no outstanding borrowings under the Credit Facility. At December 31, 2020, there were letters of credit of $0.2 million outstanding. At December 31, 2020, we had $749.8 million available under the Credit Facility. No letters of credit
MATCH GROUP, INC. AND SUBSIDIARIES
NOTES TO CONSOLIDATED FINANCIAL STATEMENTS (Continued)
were outstanding at December 31, 2019. The annual commitment fee on undrawn funds, which was 25 basis points as of December 31, 2020, is based on the current leverage ratio. Borrowings under the Credit Facility bear interest, at MG Holdings II’s option, at a base rate or LIBOR, in each case plus an applicable margin, based on MG Holdings II’s consolidated net leverage ratio. The terms of the Credit Facility require MG Holdings II to maintain a consolidated net leverage ratio of not more than 5.0 to 1.0.
The Credit Facility and Term Loan contain covenants that would limit the ability of MG Holdings II to pay dividends, make distributions, or repurchase MG Holdings II’s stock in the event MG Holdings II’s secured net leverage ratio exceeds 2.0 to 1.0, while the Term Loan remains outstanding and, thereafter, if MG Holdings II’s consolidated net leverage ratio exceeds 4.0 to 1.0, or in the event a default has occurred. There are additional covenants under these debt agreements that limit the ability of MG Holdings II and its subsidiaries to, among other things, incur indebtedness, pay dividends or make distributions. Obligations under the Credit Facility and Term Loan are unconditionally guaranteed by certain MG Holdings II wholly-owned domestic subsidiaries and are also secured by the stock of certain MG Holdings II domestic and foreign subsidiaries. The Term Loan and outstanding borrowings, if any, under the Credit Facility rank equally with each other, and have priority over the Senior Notes to the extent of the value of the assets securing the borrowings under the Credit Agreement.
Senior Notes
In connection with the Separation on June 30, 2020, MG Holdings II replaced the Former Match Group as issuer of each of the Senior Notes and assumed its obligations thereunder and under the indentures governing each of the Senior Notes, respectively, as successor to Former Match Group.
The 4.625% Senior Notes were issued on May 19, 2020. The proceeds from these notes were used to redeem the outstanding 6.375% Senior Notes, to pay expenses associated with the offering, and for general corporate purposes. At any time prior to June 1, 2023, these notes may be redeemed at a redemption price equal to the sum of the principal amount, plus accrued and unpaid interest and a make-whole premium set forth in the indenture governing the notes. Thereafter, these notes may be redeemed at redemption prices set forth in the indenture governing the notes, together with accrued and unpaid interest to the applicable redemption date, if redeemed during the twelve-month period beginning on June 1 of the years indicated below:
| | | | | |
| Beginning June 1, | Percentage |
| 2023 | 102.313% |
| 2024 | 101.156% |
| 2025 and thereafter | 100.000% |
The 4.125% Senior Notes were issued on February 11, 2020. The proceeds from these notes were used to fund a portion of the $3.00 per common share of Former Match Group that was payable in connection with the Separation. At any time prior to May 1, 2025, these notes may be redeemed at a redemption price equal to the sum of the principal amount, plus accrued and unpaid interest and a make-whole premium set forth in the indenture governing the notes. Thereafter, these notes may be redeemed at redemption prices set forth in the indenture governing the notes, together with accrued and unpaid interest to the applicable redemption date, if redeemed during the twelve-month period beginning on May 1 of the years indicated below:
| | | | | |
| Beginning May 1, | Percentage |
| 2025 | 102.063% |
| 2026 | 101.375% |
| 2027 | 100.688% |
| 2028 and thereafter | 100.000% |
MATCH GROUP, INC. AND SUBSIDIARIES
NOTES TO CONSOLIDATED FINANCIAL STATEMENTS (Continued)
The 5.625% Senior Notes were issued on February 15, 2019. The proceeds from these notes were used to repay outstanding borrowings under the Credit Facility, to pay expenses associated with the offering, and for general corporate purposes. At any time prior to February 15, 2024, these notes may be redeemed at a redemption price equal to the sum of the principal amount, plus accrued and unpaid interest and a make-whole premium set forth in the indenture governing the notes. Thereafter, these notes may be redeemed at redemption prices set forth below, together with accrued and unpaid interest to the applicable redemption date, if redeemed during the twelve-month period beginning on February 15 of the years indicated below:
| | | | | |
| Beginning February 15, | Percentage |
| 2024 | 102.813% |
| 2025 | 101.875% |
| 2026 | 100.938% |
| 2027 and thereafter | 100.000% |
The 5.00% Senior Notes were issued on December 4, 2017. The proceeds, along with cash on hand, were used to redeem then outstanding senior notes and pay the related call premium. At any time prior to December 15, 2022, these notes may be redeemed at a redemption price equal to the sum of the principal amount, plus accrued and unpaid interest and a make-whole premium set forth in the indenture governing the notes. Thereafter, these notes may be redeemed at the redemption prices set forth below, together with accrued and unpaid interest thereon to the applicable redemption date, if redeemed during the twelve-month period beginning on December 15 of the years indicated below:
| | | | | |
| Beginning December 15, | Percentage |
| 2022 | 102.500% |
| 2023 | 101.667% |
| 2024 | 100.833% |
| 2025 and thereafter | 100.000% |
The 6.375% Senior Notes were redeemed on June 11, 2020 with proceeds from the 4.625% Senior Notes. The related call premium of $12.8 million and $2.9 million of unamortized original issue discount and debt issuance costs related to the 6.375% Senior Notes are included in “Other (expense) income, net” in the consolidated statement of operations for the year ended December 31, 2020.
The indentures governing the 5.00% Senior Note contain covenants that would limit MG Holdings II’s ability to pay dividends or to make distributions and repurchase or redeem MG Holdings II’s stock in the event a default has occurred or MG Holdings II’s consolidated leverage ratio (as defined in the indentures) exceeds 5.0 to 1.0. At December 31, 2020, there were no limitations pursuant thereto. There are additional covenants in those indentures that limit the ability of MG Holdings II and its subsidiaries to, among other things, (i) incur indebtedness, make investments, or sell assets in the event MG Holdings II is not in compliance with certain financial ratios set forth therein, and (ii) incur liens, enter into agreements restricting the ability of MG Holdings II’s subsidiaries to pay dividends, enter into transactions with affiliates and consolidate, merge or sell substantially all of their assets. The indentures governing the 4.125%, 4.625%, and 5.625% Senior Notes are less restrictive than the indentures governing the 5.00% Senior Notes and generally only limit MG Holdings II’s and its subsidiaries’ ability to, among other things, create liens on assets, and our ability to consolidate, merge, sell or otherwise dispose of all or substantially all of our assets.
The Senior Notes all rank equally in right of payment.
Exchangeable Notes
During 2017, Match Group FinanceCo, Inc., a direct, wholly-owned subsidiary of the Company, issued $517.5 million aggregate principal amount of its 2022 Exchangeable Notes. During 2019, Match Group FinanceCo 2, Inc. and Match Group FinanceCo 3, Inc., direct, wholly-owned subsidiaries of the Company, issued $575.0 million aggregate principal amount of its 2026 Exchangeable Notes and $575.0 million aggregate principal amount of its 2030 Exchangeable Notes, respectively.
MATCH GROUP, INC. AND SUBSIDIARIES
NOTES TO CONSOLIDATED FINANCIAL STATEMENTS (Continued)
The 2022, 2026, and 2030 Exchangeable Notes (collectively the “Exchangeable Notes”) are guaranteed by the Company but are not guaranteed by MG Holdings II or any of its subsidiaries.
Following the Separation, the number of shares of the Company’s common stock into which each $1,000 of principal of the Exchangeable Notes is exchangeable and the approximate equivalent exchange price per share were adjusted under the terms of each of the respective Exchangeable Notes to reflect the conversion of each from Former IAC amounts to Match Group amounts. The following table presents details of the exchangeable features under the amended Match Group terms:
| | | | | | | | | | | | | | | | | |
| Number of shares of the Company’s Common Stock into which each $1,000 of Principal of the Exchangeable Notes is Exchangeable(a) | | Approximate Equivalent Exchange Price per Share(a) | | Exchangeable Date |
| 2022 Exchangeable Notes | 22.7331 | | $ | 43.99 | | | July 1, 2022 |
| 2026 Exchangeable Notes | 11.4259 | | $ | 87.52 | | | March 15, 2026 |
| 2030 Exchangeable Notes | 11.8739 | | $ | 84.22 | | | October 15, 2029 |
______________________
(a)Subject to adjustment upon the occurrence of specified events.
The Exchangeable Notes are exchangeable under the following circumstances:
(1) during any calendar quarter (and only during such calendar quarter), if the last reported sale price of the Company's common stock for at least 20 trading days during the period of 30 consecutive trading days during the immediately preceding calendar quarter is greater than or equal to 130% of the exchange price on each applicable trading day;
(2) during the five-business day period after any five-consecutive trading day period in which the trading price per $1,000 principal amount of notes for each trading day of the measurement period was less than 98% of the product of the last reported sale price of the Company's common stock and the exchange rate on each such trading day;
(3) if the issuer calls the notes for redemption, at any time prior to the close of business on the scheduled trading day immediately preceding the redemption date; or
(4) upon the occurrence of specified corporate events as further described under the indentures governing the respective Exchangeable Notes.
On or after the respective exchangeable dates noted in the table above, until the close of business on the second scheduled trading day immediately preceding the maturity date, holders may exchange all or any portion of their Exchangeable Notes regardless of the foregoing conditions. Upon exchange, the Company, in its sole discretion, has the option to settle the Exchangeable Notes with any of the three following alternatives: (1) shares of the Company’s common stock, (2) cash or (3) a combination of cash and shares of the Company's common stock. It is the Company’s intention to settle the Exchangeable Notes with cash equal to the face amount of the notes upon exchange. Any dilution arising from the 2022, 2026, and 2030 Exchangeable Notes would be mitigated by the 2022, 2026, and 2030 Exchangeable Notes Hedges, respectively.
The Company’s 2022, 2026, and 2030 Exchangeable Notes were exchangeable as of December 31, 2020; during the three and twelve months ended December 31, 2020, no notes were exchanged.
The following table presents the if-converted value that exceeded the principal of each note based on the Company’s stock price December 31, 2020 and December 31, 2019, respectively. The amounts for December 31, 2020 represent the exchange occurring under the Match Group terms and for December 31, 2019 represent the exchange occurring under Former IAC terms.
MATCH GROUP, INC. AND SUBSIDIARIES
NOTES TO CONSOLIDATED FINANCIAL STATEMENTS (Continued)
| | | | | | | | | | | |
| December 31, 2020 | | December 31, 2019 |
| | | |
| (In millions) |
| 2022 Exchangeable Notes | $ | 1,261.2 | | | $ | 329.6 | |
| 2026 Exchangeable Notes | $ | 418.3 | | | N/A |
| 2030 Exchangeable Notes | $ | 457.2 | | | N/A |
Additionally, each of Match Group FinanceCo 2, Inc. and Match Group FinanceCo 3, Inc. may redeem for cash all or any portion of its applicable notes, at its option, on or after June 20, 2023 and July 20, 2026, respectively, if the last reported sale price of the common stock underlying the respective notes has been at least 130% of the exchange price then in effect for at least 20 trading days (whether or not consecutive), including at least one of the five trading days immediately preceding the date on which the notice of redemption is provided, during any 30 consecutive trading day period ending on, and including, the trading day immediately preceding the date on which the applicable issuer provides notice of redemption, at a redemption price equal to 100% of the principal amount to be redeemed, plus accrued and unpaid interest to, but excluding, the redemption date.
The Company separately accounts for the debt and equity components of the Exchangeable Notes, and therefore, the Company recorded an original issue discount and corresponding increase to additional paid-in capital, which is the fair value attributed to the exchange feature of each series of debt at issuance. The Company is amortizing the original issue discount and debt issuance costs utilizing the effective interest method over the life of the Exchangeable Notes. The effective interest rates for the 2022, 2026, and 2030 Exchangeable Notes are 4.73%, 5.35%, and 6.59%, respectively.
The following tables sets forth the components of the Exchangeable Notes:
| | | | | | | | | | | | | | | | | |
| December 31, 2020 |
| 2022 Exchangeable Notes | | 2026 Exchangeable Notes | | 2030 Exchangeable Notes |
| | | | | |
| (In thousands) |
| Liability component: | | | | | |
| Principal | $ | 517,500 | | | $ | 575,000 | | | $ | 575,000 | |
| Less: unamortized original issue discount | 26,525 | | | 111,806 | | | 168,531 | |
| Net carrying value of the liability component | $ | 490,975 | | | $ | 463,194 | | | $ | 406,469 | |
| | | | | |
| Equity component | $ | 70,363 | | | $ | 138,796 | | | $ | 189,213 | |
| | | | | | | | | | | | | | | | | |
| December 31, 2019 |
| 2022 Exchangeable Notes | | 2026 Exchangeable Notes | | 2030 Exchangeable Notes |
| | | | | |
| (In thousands) |
| Liability component: | | | | | |
| Principal | $ | 517,500 | | | $ | 575,000 | | | $ | 575,000 | |
| Less: unamortized original issue discount | 40,768 | | | 129,037 | | | 181,800 | |
| Net carrying value of the liability component | $ | 476,732 | | | $ | 445,963 | | | $ | 393,200 | |
| | | | | |
| Equity component | $ | 70,363 | | | $ | 138,796 | | | $ | 189,213 | |
MATCH GROUP, INC. AND SUBSIDIARIES
NOTES TO CONSOLIDATED FINANCIAL STATEMENTS (Continued)
The following table sets forth interest expense recognized related to the Exchangeable Notes:
| | | | | | | | | | | | | | | | | |
| Year Ended December 31, 2020 |
| 2022 Exchangeable Notes | | 2026 Exchangeable Notes | | 2030 Exchangeable Notes |
| | | | | |
| (In thousands) |
| Contractual interest expense | $ | 4,528 | | | $ | 5,031 | | | $ | 11,500 | |
| Amortization of original issue discount | 14,243 | | | 17,231 | | | 13,269 | |
| Amortization of debt issuance costs | 3,525 | | | 1,305 | | | 721 | |
| Total interest expense recognized | $ | 22,296 | | | $ | 23,567 | | | $ | 25,490 | |
| | | | | | | | | | | | | | | | | |
| Year Ended December 31, 2019 |
| 2022 Exchangeable Notes | | 2026 Exchangeable Notes | | 2030 Exchangeable Notes |
| | | | | |
| (In thousands) |
| Contractual interest expense | $ | 4,528 | | | $ | 2,963 | | | $ | 6,772 | |
| Amortization of original issue discount | 13,256 | | | 9,759 | | | 7,413 | |
| Amortization of debt issuance costs | 2,981 | | | 758 | | | 420 | |
| Total interest expense recognized | $ | 20,765 | | | $ | 13,480 | | | $ | 14,605 | |
| | | | | | | | | |
| Year Ended December 31, 2018 |
| 2022 Exchangeable Notes | | | | |
| | | | | |
| (In thousands) |
| Contractual interest expense | $ | 4,528 | | | | | |
| Amortization of original issue discount | 13,134 | | | | | |
| Amortization of debt issuance costs | 3,489 | | | | | |
| Total interest expense recognized | $ | 21,151 | | | | | |
Exchangeable Notes Hedge and Warrants
In connection with the Exchangeable Notes offerings, the Company purchased call options allowing the Company to purchase initially (subject to adjustment upon the occurrence of specified events) the same number of shares that would be issuable upon the exchange of the applicable Exchangeable Notes at the price per share set forth below (the “Exchangeable Notes Hedge”), and sold warrants allowing the counterparty to purchase (subject to adjustment upon the occurrence of specified events) shares at the per share price set forth below (the “Exchangeable Notes Warrants”).
The Exchangeable Notes Hedges are expected to reduce the potential dilutive effect on the Company’s common stock upon any exchange of notes and/or offset any cash payment Match Group FinanceCo, Inc., Match Group FinanceCo 2, Inc. or Match Group FinanceCo 3, Inc. is required to make in excess of the principal amount of the exchanged notes. The Exchangeable Notes Warrants have a dilutive effect on the Company’s common stock to the extent that the market price per share of the Company common stock exceeds their respective strike prices.
Following the Separation, the number of shares and the approximate equivalent exchange price per share for the related Exchangeable Notes Hedge were adjusted to reflect the conversion from Former IAC to Match Group. The Exchangeable Notes Warrants also had adjustments in the number of shares and strike price per
MATCH GROUP, INC. AND SUBSIDIARIES
NOTES TO CONSOLIDATED FINANCIAL STATEMENTS (Continued)
share to reflect the conversion from Former IAC to Match Group. The following tables present details of the Exchangeable Notes Hedges and Warrants under the amended Match Group terms:
| | | | | | | | | | | |
| Number of Shares(a) | | Approximate Equivalent Exchange Price per Share(a) |
| | | |
| (Shares in millions) |
| 2022 Exchangeable Notes Hedge | 11.8 | | $ | 43.99 | |
| 2026 Exchangeable Notes Hedge | 6.6 | | $ | 87.52 | |
| 2030 Exchangeable Notes Hedge | 6.8 | | $ | 84.22 | |
| | | | | | | | | | | |
| Number of Shares(a) | | Weighted Average Strike Price per Share(a) |
| | | |
| (Shares in millions) |
| 2022 Exchangeable Notes Warrants | 11.8 | | $ | 68.22 | |
| 2026 Exchangeable Notes Warrants | 6.6 | | $ | 134.76 | |
| 2030 Exchangeable Notes Warrants | 6.8 | | $ | 134.82 | |
______________________
(a)Subject to adjustment upon the occurrence of specified events.
Long-term debt maturities
| | | | | |
| Years Ending December 31, | (In thousands) |
| 2022 | $ | 517,500 | |
| |
| |
| |
| 2026 | 575,000 | |
| 2027 | 875,000 | |
| 2028 | 500,000 | |
| 2029 | 350,000 | |
| 2030 | 1,075,000 | |
| Total | 3,892,500 | |
| Less: Unamortized original issue discount | 312,891 | |
| Less: Unamortized debt issuance costs | 44,903 | |
| Total long-term debt, net | $ | 3,534,706 | |
NOTE 8—SHAREHOLDERS’ EQUITY
Description of Common Stock
Holders of Match Group common stock are entitled to one vote per share on all matters to be voted upon by the stockholders. Holders of Match Group common stock are entitled to receive, share for share, such dividends as may be declared by Match Group’s Board of Directors out of funds legally available therefor. In the event of a liquidation, dissolution, or winding up, holders of the Company’s common stock are entitled to receive ratably the assets available for distribution to stockholders after payment of all liabilities.
Reserved Common Shares
In connection with equity compensation plans, the Exchangeable Notes, and warrants, 95.9 million shares of Match Group common stock are reserved at December 31, 2020.
MATCH GROUP, INC. AND SUBSIDIARIES
NOTES TO CONSOLIDATED FINANCIAL STATEMENTS (Continued)
Retirement of Treasury Stock
On June 30, 2020, prior to the Separation, Former IAC retired all Former IAC common stock and Class B common stock then held in treasury. There are no shares of common stock held in treasury at December 31, 2020.
Preferred Stock
The Company has authorized 100,000,000 shares, $0.01 par value per share, of preferred stock. No shares have been issued under this authorization.
Series of equity transactions related to the Separation of Former IAC
Upon the consummation of the Separation, holders of Former IAC common stock exchanged each share of common stock for (i) one share of Series 1 Mandatorily Exchangeable Preferred Stock, which was immediately exchanged for one share of IAC common stock and then retired; and (ii) 2.1584 shares of Match Group common stock, par value $0.001 per share.
Upon the consummation of the Separation, holders of Former IAC Class B common stock exchanged each share of Class B common stock for (i) one share of Series 2 Mandatorily Exchangeable Preferred Stock, which was immediately exchanged for one share of IAC Class B common stock and then retired; and (ii) 2.1584 shares of Match Group common stock, par value $0.001 per share.
Issuance of Common Stock
In July 2020, in connection with the Separation, Former IAC closed the sale of an additional 17.3 million newly issued Match Group common shares. The proceeds of $1.4 billion, net of associated fees, were transferred directly to IAC.
MATCH GROUP, INC. AND SUBSIDIARIES
NOTES TO CONSOLIDATED FINANCIAL STATEMENTS (Continued)
NOTE 9—ACCUMULATED OTHER COMPREHENSIVE LOSS
The following tables present the components of accumulated other comprehensive (loss) income and items reclassified out of accumulated other comprehensive loss into earnings.
| | | | | | | | | | | | | | | | | |
| Year Ended December 31, 2020 |
| Foreign Currency Translation Adjustment | | Unrealized (Loss) Gain on Available-For-Sale Security | | Accumulated Other Comprehensive (Loss) Income |
| | | | | |
| | (In thousands) |
| Balance at January 1 | $ | (136,349) | | | $ | — | | | $ | (136,349) | |
| Other comprehensive income (loss) before reclassifications | 40,655 | | | (1) | | | 40,654 | |
Amounts reclassified into earnings | (168) | | | — | | | (168) | |
Net current period other comprehensive income (loss) | 40,487 | | | (1) | | | 40,486 | |
Allocation of accumulated other comprehensive loss related to the noncontrolling interests | 628 | | | — | | | 628 | |
| Separation of IAC | 13,780 | | | 1 | | | 13,781 | |
| Balance at December 31 | $ | (81,454) | | | $ | — | | | $ | (81,454) | |
| | | | | | | | | | | | | | | | | |
| Year Ended December 31, 2019 |
| Foreign Currency Translation Adjustment | | Unrealized Gain (Loss) on Available-For-Sale Security | | Accumulated Other Comprehensive (Loss) Income |
| | | | | |
| | (In thousands) |
| Balance at January 1 | $ | (128,726) | | | $ | 4 | | | $ | (128,722) | |
| Other comprehensive loss | (7,938) | | | (4) | | | (7,942) | |
| Net period other comprehensive loss | (7,938) | | | (4) | | | (7,942) | |
| Allocation of accumulated other comprehensive loss related to the noncontrolling interests | 315 | | | — | | | 315 | |
| Balance at December 31 | $ | (136,349) | | | $ | — | | | $ | (136,349) | |
| | | | | | | | | | | | | | | | | |
| Year Ended December 31, 2018 |
| Foreign Currency Translation Adjustment | | Unrealized Gain (Loss) on Available-For-Sale Security | | Accumulated Other Comprehensive (Loss) Income |
| | | | | |
| | (In thousands) |
| Balance at January 1 | $ | (103,568) | | | $ | — | | | $ | (103,568) | |
| Other comprehensive (loss) income before reclassifications | (25,230) | | | 4 | | | (25,226) | |
| Amounts reclassified into earnings | (52) | | | — | | | (52) | |
| Net period other comprehensive (loss) income | (25,282) | | | 4 | | | (25,278) | |
| Allocation of accumulated other comprehensive loss related to the noncontrolling interests | 124 | | | — | | | 124 | |
| Balance at December 31 | $ | (128,726) | | | $ | 4 | | | $ | (128,722) | |
At December 31, 2020, 2019 and 2018, there was no tax benefit or provision on the accumulated other comprehensive loss.
MATCH GROUP, INC. AND SUBSIDIARIES
NOTES TO CONSOLIDATED FINANCIAL STATEMENTS (Continued)
NOTE 10—EARNINGS PER SHARE
As a result of the Separation, weighted average basic and dilutive shares outstanding for all periods prior to the Separation reflect the share position of Former IAC multiplied by the Separation exchange ratio of 2.1584. The following table sets forth the computation of the basic and diluted earnings per share attributable to Match Group shareholders:
| | | | | | | | | | | | | | | | | | | | | | | | | | | | | | | | | | | |
| Years Ended December 31, |
| 2020 | | 2019 | | 2018 |
| Basic | | Diluted | | Basic | | Diluted | | Basic | | Diluted |
| | | | | | | | | | | |
| (In thousands, except per share data) |
| Numerator | | | | | | | | | | | |
Net earnings from continuing operations | $ | 553,911 | | | $ | 553,911 | | | $ | 494,633 | | | $ | 494,633 | | | $ | 451,104 | | | $ | 451,104 | |
Net earnings attributable to noncontrolling interests | (59,599) | | | (59,599) | | | (103,401) | | | (103,401) | | | (85,187) | | | (85,187) | |
Impact from subsidiaries' dilutive securities of continuing operations(a) | — | | | (9,999) | | | — | | | (25,997) | | | — | | | (24,783) | |
Net earnings from continuing operations attributable to Match Group, Inc. shareholders | $ | 494,312 | | | $ | 484,313 | | | $ | 391,232 | | | $ | 365,235 | | | $ | 365,917 | | | $ | 341,134 | |
| | | | | | | | | | | |
(Loss) earnings from discontinued operations, net of tax | $ | (366,070) | | | $ | (366,070) | | | $ | 49,187 | | | $ | 49,187 | | | $ | 306,643 | | | $ | 306,643 | |
Net loss (earnings) attributable to noncontrolling interests of discontinued operations | 319 | | | 319 | | | (9,288) | | | (9,288) | | | (45,599) | | | (45,599) | |
Impact from subsidiaries’ dilutive securities of discontinued operations(a) | — | | | (240) | | | — | | | (67) | | | — | | | (445) | |
Net (loss) earnings from discontinued operations attributable to shareholders | (365,751) | | | (365,991) | | | 39,899 | | | 39,832 | | | 261,044 | | | 260,599 | |
Net earnings attributable to Match Group, Inc. shareholders | $ | 128,561 | | | $ | 118,322 | | | $ | 431,131 | | | $ | 405,067 | | | $ | 626,961 | | | $ | 601,733 | |
| | | | | | | | | | | |
| Denominator | | | | | | | | | | | |
Weighted average basic shares outstanding | 223,433 | | | 223,433 | | | 181,869 | | | 181,869 | | | 180,025 | | | 180,025 | |
Dilutive securities(a)(b)(c)(d) | — | | | 19,031 | | | — | | | 12,480 | | | — | | | 17,085 | |
Denominator for earnings per share—weighted average shares(a)(b)(c)(d) | 223,433 | | | 242,464 | | | 181,869 | | | 194,349 | | | 180,025 | | | 197,110 | |
| | | | | | | | | | | |
Earnings (loss) per share: | | | | | | | | | | | |
Earnings per share from continuing operations | $ | 2.21 | | | $ | 2.00 | | | $ | 2.15 | | | $ | 1.88 | | | $ | 2.03 | | | $ | 1.73 | |
(Loss) earnings per share from discontinued operations, net of tax | $ | (1.64) | | | $ | (1.51) | | | $ | 0.22 | | | $ | 0.20 | | | $ | 1.45 | | | $ | 1.32 | |
Earnings per share attributable to Match Group, Inc. shareholders | $ | 0.58 | | | $ | 0.49 | | | $ | 2.37 | | | $ | 2.08 | | | $ | 3.48 | | | $ | 3.05 | |
MATCH GROUP, INC. AND SUBSIDIARIES
NOTES TO CONSOLIDATED FINANCIAL STATEMENTS (Continued)
______________________
(a)Prior to the Separation, Former IAC had the option to settle certain Former Match Group and ANGI Homeservices (“ANGI”) stock-based awards with Former IAC shares. For the period prior to the Separation in the year ended December 31, 2020, for continuing operations it was more dilutive for Former Match Group to settle certain Former Match Group equity awards; and for discontinued operations it was more dilutive for ANGI to settle certain ANGI equity awards. For the year ended December 31, 2019, for continuing operations it was more dilutive for Former Match Group to settle certain Former Match Group equity awards; and for discontinued operations, it was more dilutive for Former IAC to settle certain ANGI equity awards. For the year ended December 31, 2018, for continuing operations it was more dilutive for Former IAC to settle certain Former Match Group equity awards; and for discontinued operations it was more dilutive for Former IAC to settle certain ANGI equity awards.
(b)If the effect is dilutive, weighted average common shares outstanding include the incremental shares that would be issued upon the assumed exercise of stock options, warrants, and subsidiary denominated equity; exchange of the Company’s Exchangeable Notes; and vesting of restricted stock units. For the years ended December 31, 2020, 2019, and 2018, 13.4 million, 24.1 million and 7.5 million potentially dilutive securities, respectively, are excluded from the calculation of diluted earnings per share because their inclusion would have been anti-dilutive.
(c)Market-based awards and performance-based stock units (“PSUs”) are considered contingently issuable shares. Shares issuable upon exercise or vesting of market-based awards and PSUs are included in the denominator for earnings per share if (i) the applicable market or performance condition(s) has been met and (ii) the inclusion of the market-based awards and PSUs is dilutive for the respective reporting periods. For the years ended December 31, 2020, 2019, and 2018, 0.4 million, 0.4 million, and 0.2 million market-based awards and PSUs, respectively, were excluded from the calculation of diluted earnings per share because the market or performance conditions had not been met.
(d)It is the Company's intention to settle the Exchangeable Notes through a combination of cash, equal to the face amount of the notes, and shares. As a result of the Separation, the dilutive impact for the year ended December 31, 2020 was determined by calculating the dilutive impact for the period after the Separation using the Match Group average price and for the period prior to the Separation using the Former IAC average price. The resulting dilutive impact for each period was then weighted proportionally. The Exchangeable Notes are only dilutive for periods after the Separation during which the average price of Match Group’s common stock exceeded the approximate per share exchange price per $1,000 principal amount of $43.99, $87.52 and $84.22 for the 2022 Exchangeable Notes, the 2026 Exchangeable Notes, and the 2030 Exchangeable Notes, respectively. The average price of Match Group’s common stock was $119.08 for the six months ended December 31, 2020. For periods prior to the Separation, the Company determined the dilutive impact of the Exchangeable Notes when the average price of Former IAC common stock exceeded the approximately per share exchange price per $1,000 principal amount of $152.18, $302.77 and $291.35 for the 2022 Exchangeable Notes, the 2026 Exchangeable Notes, and the 2030 Exchangeable Notes, respectively. The average price of Former IAC’s common stock was $235.09 for the six months ended June 30, 2020. For the year ended December 31, 2020, the dilutive impact for the 2022 Exchangeable Notes, 2026 Exchangeable Notes, and 2030 Exchangeable Notes was 5.0 million, 0.9 million, and 1.0 million shares, respectively, after weighting the respective periods of 2020 as described above.
For the years ended December 31, 2019 and 2018, the average price of Former IAC’s common stock was $223.89 and $167.61, respectively, and the dilutive impact of the 2022 Exchangeable Notes, which was the only series of Exchangeable Notes that was dilutive for those periods, was 2.4 million and 0.7 million shares, respectively.
MATCH GROUP, INC. AND SUBSIDIARIES
NOTES TO CONSOLIDATED FINANCIAL STATEMENTS (Continued)
NOTE 11—STOCK-BASED COMPENSATION
The Company currently has three active stock and annual incentive plans; two Former Match Group plans were assumed as part of the Separation (the 2015 and 2017 plans) and another plan was approved by shareholders on June 25, 2020 (the 2020 plan). The 2015 and 2017 plans cover stock options to acquire shares of Match Group common stock, RSUs, and stock settled stock appreciation rights denominated in the equity of certain of our subsidiaries, in each case with respect to awards previously granted by Former Match Group prior to the Separation, as well as provide for the future grant of equity awards by the Company. The 2015 and 2017 plans authorize the Company to grant awards to its employees, officers, directors and consultants. At December 31, 2020, there were 33.6 million shares available for the future grant of equity awards under the 2015 and 2017 plans collectively. The 2020 plan covers options previously granted by Former IAC that converted into Match Group options as a result of the Separation; no additional grants can be made from this plan.
The 2015 and 2017 plans have a stated term of ten years and provide that the exercise price of stock options granted will not be less than the market price of the Company’s common stock on the grant date. Neither plan specifies grant dates or vesting schedules of awards as those determinations have been delegated to the Compensation and Human Resources Committee of Match Group’s Board of Directors (the “Committee”). Each grant agreement reflects the vesting schedule for that particular grant as determined by the Committee. Stock options outstanding will generally vest in four equal annual installments over a four-year period. RSUs outstanding generally vest over a three- or four-year period. Market-based awards outstanding generally vest over a two- to four-year period.
Stock-based compensation expense recognized in the consolidated statement of operations includes expense related to the Company’s stock options and RSUs, market-based RSUs and PSUs for which vesting is considered probable, equity instruments denominated in shares of subsidiaries, and instruments previously issued by Former IAC denominated in stock options, RSUs, and market-based awards of IAC held by Match Group employees. The amount of stock-based compensation expense recognized is net of estimated forfeitures, as the expense recorded is based on awards that are ultimately expected to vest. The forfeiture rate is estimated at the grant date based on historical experience and revised, if necessary, in subsequent periods if actual forfeitures differ from the estimated rate. At December 31, 2020, there is $142.5 million of unrecognized compensation cost, net of estimated forfeitures, related to all outstanding equity-based awards, which is expected to be recognized over a weighted average period of approximately 2.3 years.
The total income tax benefit recognized in the accompanying consolidated statement of operations for the years ended December 31, 2020, 2019 and 2018 related to all stock-based compensation is $136.6 million, $110.4 million and $107.2 million, respectively.
The aggregate income tax benefit recognized related to the exercise of stock options for the years ended December 31, 2020, 2019, and 2018 is $105.5 million, $73.4 million, and $103.3 million, respectively. As the Company is currently in a NOL position there will be some delay in the timing of the realization of cash benefit of income tax deductions related to stock-based compensation because it will be dependent upon the amount and timing of future taxable income and the timing of estimated income tax payments.
MATCH GROUP, INC. AND SUBSIDIARIES
NOTES TO CONSOLIDATED FINANCIAL STATEMENTS (Continued)
Stock Options
Stock options outstanding at December 31, 2020 and changes during the year ended December 31, 2020 are as follows:
| | | | | | | | | | | | | | | | | | | | | | | |
| | December 31, 2020 |
| | Shares | | Weighted
Average
Exercise
Price | | Weighted
Average
Remaining
Contractual
Term (In Years) | | Aggregate
Intrinsic
Value |
| | | | | | | |
| | (Shares and intrinsic value in thousands) |
Former IAC options outstanding at January 1, 2020 | 4,887 | | | $ | 64.63 | | | | | |
| Activity between January 1, 2020 and June 30, 2020 | | | | | | | |
| Exercised | (380) | | | 51.73 | | | | | |
| Forfeited | (10) | | | 65.22 | | | | | |
Former IAC options outstanding at June 30, 2020 prior to the Separation adjustment | 4,497 | | | 65.72 | | | | | |
Options outstanding as of June 30, 2020 representing Former IAC options converted into Match Group options in conjunction with the Separation(a) | 9,707 | | | 21.14 | | | | | |
Assumption of the 2015 and 2017 plans of the Former Match Group | 5,744 | | | 16.77 | | | | | |
| Outstanding at June 30, 2020 after Separation adjustment and adoption of the 2015 and 2017 plans of Former Match Group | 15,451 | | | 19.52 | | | | | |
| | | | | | | |
| | | | | | | |
| Activity between July 1, 2020 and December 31, 2020 | | | | | | | |
| Exercised | (7,955) | | | 19.53 | | | | | |
| Forfeited | (67) | | | 22.43 | | | | | |
| Expired | (4) | | | 14.79 | | | | | |
| Outstanding at December 31, 2020 | 7,425 | | | $ | 19.48 | | | 5.7 | | $ | 977,957 | |
| Options exercisable | 5,411 | | | $ | 19.03 | | | 5.4 | | $ | 715,083 | |
______________________
(a)Immediately prior to the Separation, the vesting of all outstanding, unvested Former IAC stock options was accelerated, and all Former IAC options outstanding were converted into IAC options and Match Group options pursuant to the Employee Matters Agreement entered into on June 30, 2020 between Match Group and IAC. Each Former IAC option outstanding converted into (i) one IAC stock option; and (ii) 2.1584 Match Group stock options, which are reflected here. The exercise price of each Former IAC option was allocated between the newly created options of IAC and Match Group based on the relative value of IAC and Match Group, respectively, to the Former IAC value at the close of business on the day of Separation.
The aggregate intrinsic value in the table above represents the difference between Match Group’s closing stock price on the last trading day of 2020 and the exercise price, multiplied by the number of in-the-money options that would have been exercised had option holders exercised their options on December 31, 2020. The total intrinsic value of stock options exercised during the period from July 1, 2020 to December 31, 2020 is $737.9 million.
MATCH GROUP, INC. AND SUBSIDIARIES
NOTES TO CONSOLIDATED FINANCIAL STATEMENTS (Continued)
In connection with the Separation, Match Group assumed all outstanding Former Match Group stock options on the same terms and conditions (including applicable vesting requirements). Each assumed option was adjusted to reflect the $3.00 per share merger consideration paid to Former Match Group stockholders in connection with the Separation.
The following table summarizes the information about stock options outstanding and exercisable at December 31, 2020:
| | | | | | | | | | | | | | | | | | | | | | | | | | | | | | | | | | | |
| Options Outstanding | | Options Exercisable |
| Range of Exercise Prices | Outstanding at December 31, 2020 | | Weighted-
Average
Remaining
Contractual
Life in Years | | Weighted-Average
Exercise
Price | | Exercisable at December 31, 2020 | | Weighted-
Average
Remaining
Contractual
Life in Years | | Weighted-Average
Exercise
Price |
| | | | | | | | | | | |
| (Shares in thousands) |
$0.01 to $10.00 | 1,105 | | | 5.3 | | $ | 8.57 | | | 1,079 | | | 5.3 | | $ | 8.56 | |
$10.01 to $20.00 | 2,633 | | | 5.7 | | 15.12 | | | 1,559 | | | 5.4 | | 14.35 | |
$20.01 to $30.00 | 3,345 | | | 5.7 | | 24.20 | | | 2,570 | | | 5.4 | | 24.11 | |
$30.01 to $50.00 | 342 | | | 7.1 | | 42.18 | | | 203 | | | 7.2 | | 46.30 | |
| | | | | | | | | | | |
| | | | | | | | | | | |
| | | | | | | | | | | |
| | | | | | | | | | | |
| 7,425 | | | 5.7 | | $ | 19.48 | | | 5,411 | | | 5.4 | | $ | 19.03 | |
There were no stock options granted by the Company during the years ended December 31, 2020 and 2019.
Cash received from Match Group stock option exercises for the period between July 1, 2020 and December 31, 2020 was $155.4 million. No cash was received from stock option exercises for the year ended December 31, 2019 and the period from January 1, 2020 to June 30, 2020. The Company discontinued the practice of net settling options as of July 1, 2020.
Restricted Stock Units, Performance-Based Stock Units, and Market-Based Awards
RSUs, PSUs, and market-based awards are awards in the form of phantom shares or units denominated in a hypothetical equivalent number of shares of Match Group common stock and with the value of each RSU and PSU equal to the fair value of Match Group common stock at the date of grant. For market-based awards, the grant date fair value was estimated using a lattice model that incorporates a Monte Carlo simulation of the valuation of a wholly-owned business. Each RSU, PSU, and market-based award grant is subject to service-based vesting, where a specific period of continued employment must pass before an award vests. PSUs also include performance-based vesting conditions, where certain performance targets set at the time of grant must be achieved before an award vests. The number of market-based awards that ultimately vest is based on a valuation of a wholly-owned business. For RSU grants, the expense is measured at the grant date as the fair value of Match Group common stock and expensed as stock-based compensation over the vesting term. For PSU grants, the expense is measured at the grant date as the fair value of Match Group common stock and expensed as stock-based compensation over the vesting term if the performance targets are considered probable of being achieved.
MATCH GROUP, INC. AND SUBSIDIARIES
NOTES TO CONSOLIDATED FINANCIAL STATEMENTS (Continued)
Unvested RSUs, PSUs, and market-based awards outstanding at December 31, 2020 and changes during the year ended December 31, 2020 are as follows:
| | | | | | | | | | | | | | | | | | | | | | | | | | | | | | | | | | | |
| | RSUs | | PSUs | | Market-based awards |
| | Number of shares | | Weighted Average Grant Date Fair Value | | Number of shares(a) | | Weighted Average Grant Date Fair Value | | Number of shares(a) | | Weighted Average Grant Date Fair Value |
| | | | | | | | | | | |
| | (Shares in thousands) |
| Unvested at January 1, 2020 | 202 | | | $ | 132.37 | | | — | | | $ | — | | | 159 | | | $ | 153.43 | |
| Activity between January 1, 2020 and June 30, 2020 | | | | | | | | | | | |
| Granted | 8 | | | 295.37 | | | — | | | — | | | — | | | — | |
| Vested | (78) | | | 104.62 | | | — | | | — | | | (53) | | | 167.32 | |
| Forfeited | (3) | | | 222.34 | | | — | | | — | | | — | | | — | |
| Converted to IAC awards, no longer outstanding at Match Group due to Separation | (129) | | | 158.27 | | | — | | | — | | | (106) | | | 146.49 | |
Assumption of the 2015 and 2017 plans of the Former Match Group | 3,464 | | | 58.52 | | | 355 | | | 53.00 | | | 912 | | | 21.11 | |
| | | | | | | | | | | |
| Activity between July 1, 2020 and December 31, 2020 | | | | | | | | | | | |
| Granted | 277 | | | 106.17 | | | 195 | | | 102.70 | | | — | | | — | |
| Vested | (304) | | | 48.80 | | | — | | | — | | | (111) | | | 22.56 | |
| Forfeited | (138) | | | 67.99 | | | — | | | — | | | (65) | | | 23.84 | |
| Expired | — | | | — | | | — | | | — | | | (22) | | | 23.35 | |
| Unvested at December 31, 2020 | 3,299 | | | $ | 63.02 | | | 550 | | | $ | 74.59 | | | 714 | | | $ | 19.34 | |
______________________
(a)Represents the maximum shares issuable.
All RSUs, PSUs, and market-based awards outstanding immediately prior to the Separation were converted to IAC awards. All expense, income tax benefits, and cash flow activity related to these awards is included in discontinued operations.
The weighted average fair value of RSUs and PSUs granted during the period between July 1, 2020 and December 31, 2020, based on market prices of Match Group’s common stock on the grant date, was $104.74. The total fair value of RSUs that vested during the period between July 1, 2020 and December 31, 2020 was $14.8 million. No PSUs vested during the period between July, 1, 2020 and December 31, 2020.
There were no market-based awards granted during the period between July 1, 2020 and December 31, 2020. The total fair value of market-based awards that vested during the period between July 1, 2020 and December 31, 2020 was $2.5 million.
In connection with the Separation, Match Group assumed the Former Match Group outstanding RSUs, PSUs, and Market-based awards on the same terms and conditions (including applicable vesting requirements). Each assumed RSU, PSU, and Market-based award was adjusted to reflect the same adjustment Former Match Group stockholders received if they elected a fractional stock election instead of the $3.00 cash election in conjunction with the Separation.
Equity Instruments Denominated in Shares of Certain Subsidiaries
The Company has granted stock settled stock appreciation rights denominated in the equity of certain non-publicly traded subsidiaries to employees and management of those subsidiaries. These equity awards vest over a specified period of time or upon the occurrence of certain specified events. The value of the stock settled stock
MATCH GROUP, INC. AND SUBSIDIARIES
NOTES TO CONSOLIDATED FINANCIAL STATEMENTS (Continued)
appreciation rights is based on the equity value of these subsidiaries. Accordingly, these awards only have value to the extent the relevant business appreciates in value above the initial value utilized to determine the exercise price. These awards can have significant value in the event of significant appreciation. The fair value of the common stock of these subsidiaries is generally determined through a third-party valuation pursuant to the terms of the respective subsidiary equity plan. These equity awards are settled on a net basis, with the award holder entitled to receive a payment in shares of Match Group common stock with a total value equal to the intrinsic value of the award at exercise. The number of shares of Match Group common stock ultimately needed to settle these awards may vary significantly from the estimated number below as a result of movements in our stock price and/or a determination of fair value of the relevant subsidiary that differs from our estimate. The expense associated with these equity awards is initially measured at fair value at the grant date and is expensed as stock-based compensation over the vesting term. At December 31, 2020, the number of shares of Match Group common stock that would be required to settle these awards at current estimated fair values, including vested and unvested awards is 0.5 million shares.
Capitalization of Stock-Based Compensation
For the year ended December 31, 2020, $5.1 million of stock-based compensation was capitalized related to internal use software development. No amounts were capitalized for the years ended December 31, 2019 and 2018.
Modifications of awards
During the years ended December 31, 2020, 2019 and 2018, the Company modified certain equity awards and recognized modification charges in continuing operations of $21.2 million, $7.1 million and $3.2 million, respectively.
NOTE 12—GEOGRAPHIC INFORMATION
Revenue by geography is based on where the customer is located. Geographic information about revenue and long-lived assets is presented below:
| | | | | | | | | | | | | | | | | |
| | Years Ended December 31, |
| | 2020 | | 2019 | | 2018 |
| | | | | |
| | (In thousands) |
| Revenue | | | | | |
| United States | $ | 1,121,957 | | | $ | 972,747 | | | $ | 872,977 | |
| All other countries | 1,269,312 | | | 1,078,511 | | | 856,873 | |
| Total | $ | 2,391,269 | | | $ | 2,051,258 | | | $ | 1,729,850 | |
The United States is the only country from which revenue is greater than 10 percent of total revenue.
| | | | | | | | | | | |
| | December 31, |
| | 2020 | | 2019 |
| | | |
| | (In thousands) |
| Long-lived assets (excluding goodwill and intangible assets) | | | |
| United States | $ | 91,683 | | | $ | 83,630 | |
| All other countries | 16,116 | | | 17,435 | |
| Total | $ | 107,799 | | | $ | 101,065 | |
The United States is the only country from which long-lived assets (excluding goodwill and intangible assets) is greater than 10 percent of total long-lived assets (excluding goodwill and intangible assets).
MATCH GROUP, INC. AND SUBSIDIARIES
NOTES TO CONSOLIDATED FINANCIAL STATEMENTS (Continued)
NOTE 13—LEASES
The Company leases office space, data center facilities, and equipment used in connection with its operations under various operating leases, many of which contain escalation clauses. One of these lease agreements relates to a property owned by IAC. See “Note 15—Related Party Transactions” for additional information on the intercompany lease agreement.
ROU assets represent the Company’s right to use the underlying assets for the lease term and lease liabilities represent the present value of the Company’s obligation to make payments arising from leases. ROU assets and related lease liabilities are based on the present value of fixed lease payments over the lease term using the Company’s incremental borrowing rates on the lease commencement date or January 1, 2019 for leases that commenced prior to that date. The Company combines the lease and non-lease components of lease payments in determining ROU assets and related lease liabilities. If the lease includes one or more options to extend the term of the lease, the renewal option is considered in the lease term if it is reasonably certain the Company will exercise the options. Lease expense is recognized on a straight-line basis over the term of the lease. As permitted by ASC 842, leases with an initial term of twelve months or less (“short-term leases”) are not recorded on the accompanying consolidated balance sheet.
Variable lease payments consist primarily of common area maintenance, utilities, and taxes, which are not included in the recognition of ROU assets and related lease liabilities. The Company’s lease agreements do not contain any material residual value guarantees or material restrictive covenants.
| | | | | | | | | | | | | | | | | | | | |
| Leases | | Balance Sheet Classification | | December 31, 2020 | | December 31, 2019 |
| | | | (In thousands) |
| Assets: | | | | | | |
| Right-of-use assets | | Right-of-use assets | | $ | 85,009 | | | $ | 34,448 | |
| | | | | | |
| | | | | | |
| Liabilities: | | | | | | |
| Current lease liabilities | | Accrued expenses and other current liabilities | | $ | 7,143 | | | $ | 9,674 | |
| Long-term lease liabilities | | Other long-term liabilities | | 83,489 | | | 25,985 | |
| Total lease liabilities | | | | $ | 90,632 | | | $ | 35,659 | |
| | | | | | | | | | | | | | | | | | | | |
| Lease Cost | | Income Statement Classification | | Year Ended December 31, 2020 | | Year Ended December 31, 2019 |
| | | | | | |
| | | | (In thousands) |
| Fixed lease cost | | Cost of revenue | | $ | 3,215 | | | $ | 3,560 | |
| | | | | | |
| Fixed lease cost | | General and administrative expense | | 15,548 | | | 12,638 | |
| | | | | | |
Total fixed lease cost(a) | | | | 18,763 | | | 16,198 | |
| | | | | | |
| Variable lease cost | | Cost of revenue | | 312 | | | 358 | |
| Variable lease cost | | General and administrative expense | | 2,882 | | | 2,248 | |
| Total variable lease cost | | | | 3,194 | | | 2,606 | |
| | | | | | |
| | | | | | |
| Net lease cost | | | | $ | 21,957 | | | $ | 18,804 | |
______________________
(a)Includes approximately $2.7 million and $3.0 million of short-term lease cost, and $1.2 million and $0.8 million of sublease income, for the years ended December 31, 2020 and December 31, 2019, respectively.
MATCH GROUP, INC. AND SUBSIDIARIES
NOTES TO CONSOLIDATED FINANCIAL STATEMENTS (Continued)
Maturities of lease liabilities as of December 31, 2020:
| | | | | | | | |
| | (In thousands) |
| 2021 | | $ | 14,806 | |
| 2022 | | 12,776 | |
| 2023 | | 10,037 | |
| 2024 | | 9,054 | |
| 2025 | | 9,118 | |
| After 2024 | | 62,458 | |
| Total | | 118,249 | |
| Less: Interest | | (21,882) | |
| Less: Tenant improvement receivables | | (5,735) | |
| Present value of lease liabilities | | $ | 90,632 | |
The following are the weighted average assumptions used for lease term and discount rate:
| | | | | | | | | | | | | | | |
| | | December 31, 2020 | | December 31, 2019 |
| Remaining lease term | | | 10.6 years | | 4.0 years |
| Discount rate | | | 3.80 | % | | 5.05 | % |
| | | | | | | | | | | | | | |
| | Year Ended December 31, 2020 | | Year Ended December 31, 2019 |
| | | | |
| | (In thousands) |
| Other information: | | | | |
| Right-of-use assets obtained in exchange for lease liabilities | | $ | 69,886 | | | $ | 4,720 | |
| Cash paid for amounts included in the measurement of lease liabilities | | $ | 14,809 | | | $ | 15,725 | |
NOTE 14—COMMITMENTS AND CONTINGENCIES
Commitments
The Company has funding commitments in the form of purchase obligations and surety bonds. The purchase obligations due in less than one year are $54.0 million, the purchase obligations due between one and three years are $9.0 million, and purchase obligations due between three and five years are $12.0 million, for a total of $75.0 million in purchase obligations. The purchase obligations primarily relate to web hosting services. Letters of credit and surety bonds totaling $0.2 million are currently outstanding as of December 31, 2020.
Contingencies
In the ordinary course of business, the Company is a party to various lawsuits. The Company establishes reserves for specific legal matters when it determines that the likelihood of an unfavorable outcome is probable and the loss is reasonably estimable. Management has also identified certain other legal matters where we believe an unfavorable outcome is not probable and, therefore, no reserve is established. Although management currently believes that resolving claims against us, including claims where an unfavorable outcome is reasonably possible, will not have a material impact on the liquidity, results of operations, or financial condition of the Company, these matters are subject to inherent uncertainties and management’s view of these matters may change in the future. The Company also evaluates other contingent matters, including income and non-income tax contingencies, to assess the likelihood of an unfavorable outcome and estimated extent of potential loss. It is possible that an unfavorable outcome of one or more of these lawsuits or other contingencies could have a
MATCH GROUP, INC. AND SUBSIDIARIES
NOTES TO CONSOLIDATED FINANCIAL STATEMENTS (Continued)
material impact on the liquidity, results of operations, or financial condition of the Company. See “Note 3—Income Taxes” for additional information related to income tax contingencies.
Pursuant to the Transaction Agreement, we have agreed to indemnify IAC for matters relating to any business of Former Match Group, including indemnifying IAC for costs related to the matters described below.
The official names of legal proceedings in the descriptions below (shown in italics) reflect the original names of the parties when the proceedings were filed as opposed to the current names of the parties following the separation of Match Group and IAC.
Tinder Optionholder Litigation Against Former Match Group and Match Group
On August 14, 2018, ten then-current and former employees of Match Group, LLC or Tinder, Inc. (“Tinder”), a former subsidiary of Former Match Group, filed a lawsuit in New York state court against Former Match Group and Match Group. See Sean Rad et al. v. IAC/InterActiveCorp and Match Group, Inc., No. 654038/2018 (Supreme Court, New York County). The complaint alleges that in 2017, the defendants: (i) wrongfully interfered with a contractually established process for the independent valuation of Tinder by certain investment banks, resulting in a substantial undervaluation of Tinder and a consequent underpayment to the plaintiffs upon exercise of their Tinder stock options, and (ii) then wrongfully merged Tinder into Former Match Group, thereby depriving certain of the plaintiffs of their contractual right to later valuations of Tinder on a stand-alone basis. The complaint asserts claims for breach of contract, breach of the implied covenant of good faith and fair dealing, unjust enrichment, interference with contractual relations (as against Former Match Group only), and interference with prospective economic advantage, and seeks compensatory damages in the amount of at least $2 billion, as well as punitive damages. On August 31, 2018, four plaintiffs who were still employed by Former Match Group filed a notice of discontinuance of their claims without prejudice, leaving the six former employees as the remaining plaintiffs. On June 13, 2019, the court issued a decision and order granting defendants’ motion to dismiss the claims for breach of the implied covenant of good faith and fair dealing and for unjust enrichments, as well as the merger-related claim for breach of contract as to two of the remaining six plaintiffs, and otherwise denying defendants’ motion to dismiss. On July 13, 2020, the four former plaintiffs filed arbitration demands with the American Arbitration Association asserting the same valuation claims and on September 3, 2020, the four arbitrations were consolidated. The four former plaintiffs’ request to stay the arbitration was denied on January 28, 2021, and arbitration is scheduled to begin on February 7, 2022. On November 17, 2020, the defendants’ motion to stay the trial in Rad was denied. Trial has been scheduled for November 2021. We believe that the allegations against Former Match Group and Match Group in this lawsuit are without merit and will continue to defend vigorously against them.
FTC Lawsuit Against Former Match Group
On September 25, 2019, the FTC filed a lawsuit in federal district court in Texas against Former Match Group. See FTC v. Match Group, Inc., No. 3:19:cv-02281-K (Northern District of Texas). The complaint alleges that, prior to mid-2018, for marketing purposes Match.com notified non-paying users that other users were attempting to communicate with them, even though Match.com had identified those subscriber accounts as potentially fraudulent, thereby inducing non-paying users to subscribe and exposing them to the risk of fraud should they subscribe. The complaint also challenges the adequacy of Match.com’s disclosure of the terms of its six-month guarantee, the efficacy of its cancellation process, and its handling of chargeback disputes. The complaint seeks among other things permanent injunctive relief, civil penalties, restitution, disgorgement, and costs of suit. On October 9, 2020, the court granted the Company’s motion to stay the case until the United States Supreme Court issues a decision in the consolidated appeal of Federal Trade Commission v. Credit Bureau Center, LLC and AMG Capital Management, LLC v. FTC. We believe that the FTC’s claims regarding Match.com’s practices, policies, and procedures are without merit and will defend vigorously against them.
NOTE 15—RELATED PARTY TRANSACTIONS
Relationship with IAC following the Separation
In connection with the Separation, the Company entered into certain agreements with IAC to govern the relationship between the Company and IAC following the Separation. These agreements, in certain cases, supersede the agreements entered into between Former Match Group and Former IAC in connection with
MATCH GROUP, INC. AND SUBSIDIARIES
NOTES TO CONSOLIDATED FINANCIAL STATEMENTS (Continued)
Former Match Group’s IPO in November 2015 (the “IPO Agreements”) and include: a tax matters agreement; a transition services agreement; and an employee matters agreement. The IPO Agreements that were not superseded were terminated at closing of the Separation.
In addition to the agreements entered into at the time of the Separation, Match Group leases office space to IAC in a building owned by the Company in Los Angeles. Match Group also leases office space from IAC in New York City on a month-to-month basis, which the Company expects to vacate in the first half of 2021. For the year ended December 31, 2020, the Company received less than $0.1 million from IAC pursuant to the Los Angeles lease and the Company paid $1.1 million to IAC pursuant to the New York City lease.
Match Group has a payable to IAC of $3.4 million as of December 31, 2020, excluding items discussed in the “Tax Matters Agreement” section below.
In July 2020, in connection with the Separation, the sale of 17.3 million newly issued shares of Match Group common stock was completed by IAC. The proceeds of $1.4 billion, net of associated fees, were transferred directly to IAC pursuant to the terms of the Transaction Agreement.
Tax Matters Agreement
Pursuant to the tax matters agreement, each of Match Group and IAC is responsible for certain tax liabilities and obligations following the transfer by Former IAC (i) to Match Group of certain assets and liabilities of, or related to, the businesses of Former IAC (other than Former Match Group), and (ii) to holders of Former IAC common stock and Former IAC Class B common stock, as a result of the reclassification and mandatory exchange of certain series of Former IAC exchangeable preferred stock (collectively, the “IAC Distribution”). Under the tax matters agreement, IAC generally is responsible for, and has agreed to indemnify Match Group against, any liabilities incurred as a result of the failure of the IAC Distribution to qualify for the intended tax-free treatment unless, subject to certain exceptions, the failure to so qualify is attributable to Match Group's or Former Match Group’s actions or failure to act, Match Group's or Former Match Group’s breach of certain representations or covenants or certain acquisitions of equity securities of Match Group, in each case, described in the tax matters agreement (a "Match Group fault-based action"). If the failure to so qualify is attributable to a Match Group fault-based action, Match Group is responsible for liabilities incurred as a result of such failure and will indemnify IAC against such liabilities so incurred by IAC or its affiliates.
Under the tax matters agreement, as of December 31, 2020, Match Group is obligated to remit to IAC $1.6 million of expected state tax refunds relating to tax years prior to the Separation. This obligation is included in “Accrued expenses and other current liabilities” in the accompanying consolidated balance sheet. Additionally, IAC is obligated to indemnify Match Group for IAC’s share of tax liabilities related to various periods prior to the Separation. At December 31, 2020, a receivable of $1.9 million is included in “Other current assets” in the accompanying consolidated balance sheet representing an estimate of the amount that Match Group is expected to be indemnified under this arrangement. At December 31, 2020, Match Group has an indemnification asset of $0.6 million included in “Other non-current assets” in the accompanying consolidated balance sheet for uncertain tax positions that related to Former IAC prior to the Separation.
For the year ended December 31, 2020, the Company paid IAC $20.9 million pursuant to the tax matters agreement related to income tax refunds received by the Company. Additionally, the Company received $4.3 million from IAC under the tax matters agreement.
Transition Services Agreement
Pursuant to the transition services agreement, IAC continues to provide certain services to Match Group that Former IAC had historically provided to Former Match Group. Match Group also provides certain services to IAC that Former Match Group previously provided to Former IAC. The transition services agreement also provides that Match Group and IAC will make efforts to replace, amend, or divide certain joint contracts with third-parties relating to services or products used by both Match Group and IAC. Match Group and IAC also agreed to continue sharing certain services provided pursuant to certain third-party vendor contracts that were not replaced, amended, or divided prior to closing of the Separation.
MATCH GROUP, INC. AND SUBSIDIARIES
NOTES TO CONSOLIDATED FINANCIAL STATEMENTS (Continued)
For the year ended December 31, 2020, the Company paid IAC $0.3 million related to services provided by IAC under the transitions services agreement. Additionally, the Company received $2.4 million from IAC for services provided under the transitions services agreement.
Employee Matters Agreement
Pursuant to the amended and restated employee matters agreement, Match Group will reimburse IAC for the cost of any IAC equity awards held by the Company’s employees and former employees upon exercise or vesting. In addition, Match Group employees continued to participate in IAC’s U.S. health and welfare plans, 401(k) plan and flexible benefits plan through December 31, 2020. Match Group reimbursed IAC for the costs of such participation pursuant to the amended and restated employee matters agreement. Match Group established its own employee benefit plans effective January 1, 2021.
For the year ended December 31, 2020, the Company paid IAC $2.0 million for the cost of IAC equity awards held by the Company’s employees upon vesting. At December 31, 2020, the Company has accrued $1.6 million as the estimated cost due to IAC for IAC equity awards held by Match Group employees. Additionally, the Company paid IAC $18.3 million for health and welfare plans and 401(k) plan, inclusive of employee contributions to both.
Other Agreements
The Transaction Agreement provides that each of Match Group and IAC has agreed to indemnify, defend and hold harmless the other party from and against any liabilities arising out of: (i) any asset or liability allocated to such party or the other members of such party's group under the Transaction Agreement or the businesses of such party's group after the closing of the Separation; (ii) any breach of, or failure to perform or comply with, any covenant, undertaking or obligation of a member of such party's group contained in the Transaction Agreement that survives the closing of the Separation or is contained in any ancillary agreement; and (iii) any untrue or misleading statement or alleged untrue or misleading statement of a material fact or omission, with respect to information contained in or incorporated into the Form S-4 Registration Statement (the “Form S-4”) filed with the Securities and Exchange Commission (the “SEC”) by IAC and Former IAC in connection with the Separation or the joint proxy statement/prospectus filed by Former IAC and Former Match Group with the SEC pursuant to the Form S-4.
NOTE 16—BENEFIT PLANS
Pursuant to the Employee Matters Agreement with IAC, Match Group employees are eligible to participate in a retirement savings plan sponsored by IAC in the United States, which is qualified under Section 401(k) of the Internal Revenue Code. Under the IAC Retirement Savings Plan (the “IAC Plan”), participating employees may contribute up to 50% of their pre-tax earnings, but not more than statutory limits. The employer match under the IAC Plan is 100% of the first 10% of a participant’s eligible earnings, subject to IRS limits on the Company’s matching contribution that a participant contributes to the IAC Plan. Prior to July 2019, the employer match under the Plan was fifty cents for each dollar a participant contributed in the Plan, with a maximum contribution of 3% of a participant’s eligible earnings. Matching contributions under the Plan for the years ended December 31, 2020, 2019 and 2018 were $8.6 million, $5.8 million and $2.8 million, respectively. Matching contributions are invested in the same manner as each participant’s voluntary contributions in the investment options provided under the IAC Plan. Under the IAC Plan and prior to the Separation, an available investment option was IAC common stock, but neither participant nor matching contributions were required to be invested in IAC common stock. The increase in matching contributions in 2020 and 2019 is primarily due to the aforementioned change of the Company’s matching contribution in the second half of 2019.
Beginning January 1, 2021, all investments in the IAC Plan were transferred to the Match Group Retirement Savings Plan (the “Match Group Plan”). The employer match under the Match Group Plan will continue to be 100% of the first 10% of a participant’s eligible earnings, subject to IRS limits on the Company’s matching contribution that a participant contributes to the Match Group Plan. Under the Match Group Plan, the Company’s common stock is not an available investment option.
MATCH GROUP, INC. AND SUBSIDIARIES
NOTES TO CONSOLIDATED FINANCIAL STATEMENTS (Continued)
Internationally, Match Group also has or participates in various benefit plans, primarily defined contribution plans. The Company’s contributions for these plans for the years ended December 31, 2020, 2019 and 2018 were $3.8 million, $3.1 million and $2.8 million, respectively.
NOTE 17—CONSOLIDATED FINANCIAL STATEMENT DETAILS
| | | | | | | | | | | |
| | December 31, |
| | 2020 | | 2019 |
| | | |
| | (In thousands) |
| Other current assets: | | | |
| Prepaid expenses | $ | 71,793 | | | $ | 55,698 | |
| Capitalized mobile app fees | 33,539 | | | 28,478 | |
| Other | 38,693 | | | 13,674 | |
| Other current assets | $ | 144,025 | | | $ | 97,850 | |
| | | | | | | | | | | |
| | December 31, |
| | 2020 | | 2019 |
| | | |
| | (In thousands) |
| Property and equipment, net: | | | |
| Computer equipment and capitalized software | $ | 167,863 | | | $ | 145,353 | |
| Buildings and building improvements | 74,187 | | | 73,614 | |
| Land | 11,565 | | | 11,590 | |
| Furniture and other equipment | 9,031 | | | 10,152 | |
| Projects in progress | 14,474 | | | 8,025 | |
| 277,120 | | | 248,734 | |
| Accumulated depreciation and amortization | (169,321) | | | (147,669) | |
| Property and equipment, net | $ | 107,799 | | | $ | 101,065 | |
| | | | | | | | | | | |
| | December 31, |
| | 2020 | | 2019 |
| | | |
| | (In thousands) |
| Accrued expenses and other current liabilities: | | | |
| Accrued advertising expense | $ | 46,788 | | | $ | 32,201 | |
| Accrued employee compensation and benefits | 65,239 | | | 47,745 | |
| Accrued interest expense | 26,922 | | | 22,236 | |
| Accrued non-income taxes | 29,600 | | | 18,179 | |
| Accrued professional fees | 15,616 | | | 22,728 | |
| Other | 47,583 | | | 39,161 | |
| Accrued expenses and other current liabilities | $ | 231,748 | | | $ | 182,250 | |
MATCH GROUP, INC. AND SUBSIDIARIES
NOTES TO CONSOLIDATED FINANCIAL STATEMENTS (Continued)
| | | | | | | | | | | | | | | | | |
| | Years Ended December 31, |
| | 2020 | | 2019 | | 2018 |
| | | | | |
| | (In thousands) |
| Other income (expense), net | $ | 15,861 | | | $ | (2,026) | | | $ | 7,510 | |
| | | | | |
| | | | | |
| | | | | |
| | | | | |
| | | | | |
Other income, net in 2020 includes a legal settlement of $35.0 million and interest income of $2.7 million, partially offset by a loss on redemption of bonds of $16.5 million, expense of $3.4 million related to a mark-to-market adjustment pertaining to a liability classified equity instrument, and $0.6 million in net foreign currency losses in the period.
Other expense, net, in 2019 includes a $4.0 million impairment of an equity investment, expense of $1.7 million related to a mark-to-market adjustment pertaining to a liability classified equity instrument, and $0.9 million in net foreign currency losses in the period, partially offset by interest income of $4.4 million.
Other income, net in 2018 includes $5.3 million in net foreign currency exchange gains due primarily to a strengthening of the U.S. dollar relative to the British Pound in the period and $4.9 million of interest income, partially offset by $2.1 million related to impairments of certain equity investments and $0.7 million related to a mark-to-market adjustment pertaining to a subsidiary denominated equity instrument.
Cash and Cash Equivalents and Restricted Cash
The following table provides a reconciliation of cash and cash equivalents and restricted cash reported within the consolidated balance sheet to the total amounts shown in the consolidated statement of cash flows:
| | | | | | | | | | | | | | | | | | | | | | | |
| December 31, |
| 2020 | | 2019 | | 2018 | | 2017 |
| | | | | | | |
| (In thousands) |
| Cash and cash equivalents | $ | 739,164 | | | $ | 465,676 | | | $ | 186,947 | | | $ | 272,624 | |
Restricted cash included in other current assets | 138 | | | 127 | | | 193 | | | 137 | |
| | | | | | | |
Cash, cash equivalents, and restricted cash included in current assets of discontinued operations | — | | | 2,674,146 | | | 1,946,125 | | | 1,360,921 | |
Restricted cash included in non-current assets of discontinued operations | — | | | 409 | | | 420 | | | — | |
Total cash, cash equivalents and restricted cash as shown on the consolidated statement of cash flow | $ | 739,302 | | | $ | 3,140,358 | | | $ | 2,133,685 | | | $ | 1,633,682 | |
Supplemental Disclosures of Cash Flow Information
| | | | | | | | | | | | | | | | | |
| | Years Ended December 31, |
| | 2020 | | 2019 | | 2018 |
| | | | | |
| | (In thousands) |
| Cash paid (received) during the year for: | | | | | |
| Interest | $ | 115,957 | | | $ | 85,559 | | | $ | 75,824 | |
Income tax payments | 41,024 | | | 34,583 | | | 40,703 | |
| Income tax refunds | (30,048) | | | (2,589) | | | (33,289) | |
MATCH GROUP, INC. AND SUBSIDIARIES
NOTES TO CONSOLIDATED FINANCIAL STATEMENTS (Continued)
NOTE 18—QUARTERLY RESULTS (UNAUDITED)
| | | | | | | | | | | | | | | | | | | | | | | |
| Quarter Ended
March 31 | | Quarter Ended
June 30 | | Quarter Ended September 30 | | Quarter Ended December 31 |
| | | | | | | |
| | (In thousands, except per share data) |
| Year Ended December 31, 2020 | | | | | | | |
| Revenue | $ | 544,642 | | | $ | 555,450 | | | $ | 639,770 | | | $ | 651,407 | |
| Cost of revenue | 143,894 | | | 148,853 | | | 169,823 | | | 173,263 | |
| Operating income | 137,372 | | | 195,594 | | | 200,167 | | | 212,582 | |
| Earnings from continuing operations | 149,324 | | | 132,921 | | | 131,487 | | | 140,179 | |
| (Loss) earnings from discontinued operations | (331,967) | | | (34,611) | | | 508 | | | — | |
| Net (loss) earnings attributable to Match Group, Inc. shareholders | (211,040) | | | 66,441 | | | 132,581 | | | 140,579 | |
| Per share information from continuing operations attributable to the Match Group, Inc. shareholders: |
Basic (a) | $ | 0.65 | | | $ | 0.56 | | | $ | 0.51 | | | $ | 0.53 | |
Diluted (a) | $ | 0.59 | | | $ | 0.51 | | | $ | 0.45 | | | $ | 0.48 | |
| Per share information attributable to the Match Group, Inc. shareholders: |
Basic (a) | $ | (1.15) | | | $ | 0.36 | | | $ | 0.51 | | | $ | 0.53 | |
Diluted (a) | $ | (1.13) | | | $ | 0.32 | | | $ | 0.46 | | | $ | 0.48 | |
| | | | | | | |
| Year Ended December 31, 2019 | | | | | | | |
| Revenue | $ | 464,625 | | | $ | 497,973 | | | $ | 541,493 | | | $ | 547,167 | |
| Cost of revenue | 120,224 | | | 126,665 | | | 138,225 | | | 142,070 | |
| Operating income | 117,560 | | | 171,309 | | | 175,236 | | | 181,349 | |
| Earnings from continuing operations | 117,682 | | | 119,226 | | | 137,791 | | | 119,934 | |
| (Loss) earnings from discontinued operations | (4,697) | | | 27,565 | | | 21,981 | | | 4,338 | |
| Net earnings attributable to Match Group, Inc. shareholders | 88,695 | | | 113,467 | | | 128,544 | | | 100,425 | |
| Per share information from continuing operations attributable to the Match Group, Inc. shareholders: |
Basic (a) | $ | 0.52 | | | $ | 0.52 | | | $ | 0.60 | | | $ | 0.52 | |
Diluted (a) | $ | 0.45 | | | $ | 0.45 | | | $ | 0.52 | | | $ | 0.46 | |
| Per share information attributable to the Match Group, Inc. shareholders: |
Basic (a) | $ | 0.49 | | | $ | 0.62 | | | $ | 0.71 | | | $ | 0.55 | |
Diluted (a) | $ | 0.42 | | | $ | 0.55 | | | $ | 0.63 | | | $ | 0.48 | |
______________________
(a)Quarterly per share amounts may not add to the related annual per share amount because of differences in the average common shares outstanding during each period.
NOTE 19—SUBSEQUENT EVENT
In February 2021, the Company entered into a definitive agreement to acquire Hyperconnect, Inc. (“Hyperconnect”), a leading social discovery and video technology company based in Seoul, South Korea. The acquisition is valued at approximately $1.725 billion, subject to customary adjustments for cash, debt-like items, and net working capital at the closing of the acquisition. The Company has the option to pay up to 50% of the consideration in common stock of the Company, with the remaining balance of the consideration paid in cash. The Company expects to fund the cash portion of the consideration with cash on hand and its existing revolving credit facility. The Company may also opt to use additional third-party financing. The acquisition is anticipated to close in the second quarter of 2021, subject to customary closing conditions and receipt of certain regulatory approvals.
Item 9. Changes in and Disagreements with Accountants on Accounting and Financial Disclosure
Not applicable.
Item 9A. Controls and Procedures
Conclusion Regarding the Effectiveness of the Company’s Disclosure Controls and Procedures
The Company monitors and evaluates on an ongoing basis its disclosure controls and procedures in order to improve their overall effectiveness. In the course of these evaluations, the Company modifies and refines its internal processes as conditions warrant.
As required by Rule 13a-15(b) of the Exchange Act, Match Group management, including the Chief Executive Officer (“CEO”) and the Chief Financial Officer (“CFO”), conducted an evaluation, as of the end of the period covered by this report, of the effectiveness of the Company’s disclosure controls and procedures as defined in Exchange Act Rule 13a-15(e). Based on this evaluation, the CEO and the CFO concluded that the Company’s disclosure controls and procedures were effective as of the end of the period covered by this report.
Management’s Report on Internal Control Over Financial Reporting
Management of the Company is responsible for establishing and maintaining adequate internal control over financial reporting (as defined in Rule 13a-15(f) under the Exchange Act) for the Company. The Company’s internal control over financial reporting is a process designed to provide reasonable assurance regarding the reliability of financial reporting and the preparation of financial statements for external purposes in accordance with accounting principles generally accepted in the United States. Management assessed the effectiveness of the Company’s internal control over financial reporting as of December 31, 2020. In making this assessment, our management used the criteria for effective internal control over financial reporting described in “Internal Control—Integrated Framework” issued by the Committee of Sponsoring Organizations of the Treadway Commission in 2013. Based on this assessment, management has determined that, as of December 31, 2020, the Company’s internal control over financial reporting is effective. The effectiveness of our internal control over financial reporting as of December 31, 2020 has been audited by Ernst & Young LLP, an independent registered public accounting firm, as stated in their attestation report, included herein.
Because of its inherent limitations, internal control over financial reporting may not prevent or detect misstatements. Also, projections of any evaluation of effectiveness to future periods are subject to the risk that controls may become inadequate because of changes in conditions, or that the degree of compliance with the policies or procedures may deteriorate.
Changes in Internal Control Over Financial Reporting
The Company monitors and evaluates on an ongoing basis its internal control over financial reporting in order to improve its overall effectiveness. In the course of these evaluations, the Company modifies and refines its internal processes as conditions warrant. As required by Rule 13a-15(d), Match Group management, including the CEO and the CFO, also conducted an evaluation of the Company’s internal control over financial reporting to determine whether any changes occurred during the quarter ended December 31, 2020 that have materially affected, or are reasonably likely to materially affect, the Company’s internal control over financial reporting. Based on that evaluation, there has been no such change during the quarter ended December 31, 2020.
Report of Independent Registered Public Accounting Firm
To the Shareholders and the Board of Directors of Match Group, Inc.
Opinion on Internal Control Over Financial Reporting
We have audited Match Group, Inc. and subsidiaries’ internal control over financial reporting as of December 31, 2020, based on criteria established in Internal Control—Integrated Framework issued by the Committee of Sponsoring Organizations of the Treadway Commission (2013 framework) (the COSO criteria). In our opinion, Match Group, Inc. and subsidiaries (the Company) maintained, in all material respects, effective internal control over financial reporting as of December 31, 2020, based on the COSO criteria.
We also have audited, in accordance with the standards of the Public Company Accounting Oversight Board (United States) (PCAOB), the consolidated balance sheet of the Company as of December 31, 2020 and 2019, and the related consolidated statements of operations, comprehensive operations, shareholders’ equity, and cash flows for each of the three years in the period ended December 31, 2020, and the related notes and the financial statement schedule listed in the Index at Item 15(a), and our report dated February 25, 2021 expressed an unqualified opinion thereon.
Basis for Opinion
The Company’s management is responsible for maintaining effective internal control over financial reporting and for its assessment of the effectiveness of internal control over financial reporting included in the accompanying Management’s Report on Internal Control Over Financial Reporting. Our responsibility is to express an opinion on the Company’s internal control over financial reporting based on our audit. We are a public accounting firm registered with the PCAOB and are required to be independent with respect to the Company in accordance with the U.S. federal securities laws and the applicable rules and regulations of the Securities and Exchange Commission and the PCAOB.
We conducted our audit in accordance with the standards of the PCAOB. Those standards require that we plan and perform the audit to obtain reasonable assurance about whether effective internal control over financial reporting was maintained in all material respects.
Our audit included obtaining an understanding of internal control over financial reporting, assessing the risk that a material weakness exists, testing and evaluating the design and operating effectiveness of internal control based on the assessed risk, and performing such other procedures as we considered necessary in the circumstances. We believe that our audit provides a reasonable basis for our opinion.
Definition and Limitations of Internal Control Over Financial Reporting
A company’s internal control over financial reporting is a process designed to provide reasonable assurance regarding the reliability of financial reporting and the preparation of financial statements for external purposes in accordance with generally accepted accounting principles. A company’s internal control over financial reporting includes those policies and procedures that (1) pertain to the maintenance of records that, in reasonable detail, accurately and fairly reflect the transactions and dispositions of the assets of the company; (2) provide reasonable assurance that transactions are recorded as necessary to permit preparation of financial statements in accordance with generally accepted accounting principles, and that receipts and expenditures of the company are being made only in accordance with authorizations of management and directors of the company; and (3) provide reasonable assurance regarding prevention or timely detection of unauthorized acquisition, use, or disposition of the company’s assets that could have a material effect on the financial statements.
Because of its inherent limitations, internal control over financial reporting may not prevent or detect misstatements. Also, projections of any evaluation of effectiveness to future periods are subject to the risk that controls may become inadequate because of changes in conditions, or that the degree of compliance with the policies or procedures may deteriorate.
New York, New York
February 25, 2021
Item 9B. Other Information
Not applicable.
PART III
The information required by Part III (Items 10, 11, 12, 13 and 14) has been incorporated by reference to Match Group’s definitive Proxy Statement to be used in connection with its 2021 Annual Meeting of Stockholders (the “2021 Proxy Statement”), as set forth below in accordance with General Instruction G(3) of Form 10-K.
Item 10. Directors, Executive Officers and Corporate Governance
The information required by Item 401 of Regulation S-K relating to directors and executive officers of Match Group is set forth in the sections entitled “Information Concerning Director Nominees” and “Information Concerning Match Group Executive Officers Who Are Not Directors,” respectively, in the 2021 Proxy Statement. The information required by Item 406 of Regulation S-K relating to Match Group’s Code of Ethics is set forth under the caption “Part I-Item 1-Business-Additional Information-Code of ethics” of this annual report and is incorporated herein by reference. The information required by subsections (c)(3), (d)(4) and (d)(5) of Item 407 of Regulation S-K is set forth in the sections entitled “Corporate Governance” and “The Board and Board Committees” in the 2021 Proxy Statement and is incorporated herein by reference.
Item 11. Executive Compensation
The information required by Item 402 of Regulation S-K relating to executive and director compensation is set forth in the sections entitled “Executive Compensation” and “Director Compensation” in the 2021 Proxy Statement and is incorporated herein by reference. The information required by subsections (e)(4) and (e)(5) of Item 407 of Regulation S-K relating to certain compensation committee matters is set forth in the sections entitled “The Board and Board Committees,” “Compensation Committee Report” and “Compensation Committee Interlocks and Insider Participation” in the 2021 Proxy Statement and is incorporated herein by reference; provided, that the information set forth in the section entitled “Compensation Committee Report” shall be deemed furnished herein and shall not be deemed incorporated by reference into any filing under the Securities Act or the Exchange Act.
Item 12. Security Ownership of Certain Beneficial Owners and Management and Related Stockholder Matters
The information regarding ownership of Match Group common stock required by Item 403 of Regulation S-K and securities authorized for issuance under Match Group’s various equity compensation plans required by Item 201(d) of Regulation S-K is set forth in the sections entitled “Security Ownership of Certain Beneficial Owners and Management” and “Equity Compensation Plan Information,” respectively, in the 2021 Proxy Statement and is incorporated herein by reference.
Item 13. Certain Relationships and Related Transactions, and Director Independence
Information regarding certain relationships and related transactions involving Match Group required by Item 404 of Regulation S-K and director independence determinations required by Item 407(a) of Regulation S-K is set forth in the sections entitled “Certain Relationships and Related Person Transactions” and “Corporate Governance,” respectively, in the 2021 Proxy Statement and is incorporated herein by reference.
Item 14. Principal Accounting Fees and Services
Information required by Item 9(e) of Schedule 14A regarding the fees and services of Match Group’s independent registered public accounting firm and the pre-approval policies and procedures applicable to services provided to Match Group by such firm is set forth in the sections entitled “Fees Paid to Our Independent Registered Public Accounting Firm” and “Audit and Non-Audit Services Pre-Approval Policy,” respectively, in the 2021 Proxy Statement and is incorporated herein by reference.
PART IV
Item 15. Exhibits and Financial Statement Schedules
(a) List of documents filed as part of this Report:
(1) Consolidated Financial Statements of Match Group, Inc.
Report of Independent Registered Public Accounting Firm: Ernst & Young LLP.
Consolidated Balance Sheet as of December 31, 2020 and 2019.
Consolidated Statement of Operations for the Years Ended December 31, 2020, 2019, and 2018.
Consolidated Statement of Comprehensive Operations for the Years Ended December 31, 2020, 2019, and 2018.
Consolidated Statement of Shareholders’ Equity for the Years Ended December 31, 2020, 2019, and 2018.
Consolidated Statement of Cash Flows for the Years Ended December 31, 2020, 2019, and 2018.
Notes to Consolidated Financial Statements.
(2) Consolidated Financial Statement Schedule of Match Group, Inc.
| | | | | | | | |
| | |
Schedule
Number | | |
| II | | Valuation and Qualifying Accounts. |
All other financial statements and schedules not listed have been omitted since the required information is either included in the Consolidated Financial Statements or the notes thereto, is not applicable or is not required.
(3) Exhibits
See Exhibit Index below for a complete list of Exhibits to this report.
Item 16. Form 10-K Summary
None.
EXHIBIT INDEX
The documents set forth below, numbered in accordance with Item 601 of Regulation S-K, are filed herewith, incorporated by reference herein by reference to the location indicated, or furnished herewith.
| | | | | | | | | | | | | | | | | | | | | | | | | | | | | | | | | | | | | | |
| | | | | Incorporated by Reference | | Filed (†) or
Furnished (‡)
Herewith
(as indicated) |
Exhibit
No. | | Exhibit Description | | Form | | SEC
File No. | | Exhibit | | Filing
Date | |
| | | | | | | | | | | | |
| | | | 8-K | | 000-20570 | | 2.1 | | 12/20/2019 | | |
| | Amendment, dated as of April 28, 2020, to the Transaction Agreement, dated as of December 19, 2019, by and among IAC/InterActiveCorp (Former IAC), Match Group, Inc. (Former Match Group), IAC Holdings, Inc. and Valentine Merger Sub LLC. | | 8-K | | 000-20570 | | 2.1 | | 4/28/2020 | | |
| | | | 8-K | | 000-20570 | | 2.1 | | 6/22/2020 | | |
| | | | 8-A/A | | 000-20570 | | 3.1 | | 8/12/2005 | | |
| | | | 8-K | | 000-20570 | | 3.1 | | 8/22/2008 | | |
| | | | 8-A/A | | 001-34148 | | 3.4 | | 7/1/2020 | | |
| | | | 8-A/A | | 001-34148 | | 3.5 | | 7/1/2020 | | |
| | | | 8-A/A | | 001-34148 | | 3.6 | | 7/1/2020 | | |
| | | | 8-A/A | | 001-34148 | | 3.7 | | 7/1/2020 | | |
| | | | 8-K | | 001-34148 | | 3.5 | | 7/2/2020 | | |
| | | | 8-K | | 001-34148 | | 3.6 | | 7/2/2020 | | |
| | | | 8-K | | 001-34148 | | 3.7 | | 7/2/2020 | | |
| | | | 8-K | | 001-34148 | | 3.8 | | 7/2/2020 | | |
| | | | 8-K | | 001-34148 | | 3.9 | | 7/2/2020 | | |
| | | | 8-K | | 001-34148 | | 3.10 | | 7/2/2020 | | |
| | | | 8-A/A | | 001-34148 | | 3.3 | | 7/1/2020 | | |
| | | | | | | | | | | | † |
| | | | S-4/A | | 333-236420 | | 4.3 | | 4/28/2020 | | |
| | | | 8-K | | 001-37636 | | 4.1 | | 5/20/2020 | | |
| | | | 8-K | | 001-34148 | | 4.1 | | 7/2/2020 | | |
| | | | 8-K | | 000-20570 | | 4.1 | | 10/6/2017 | | |
| | | | 8-K | | 001-34148 | | 4.3 | | 7/2/2020 | | |
| | | | | | | | | | | | | | | | | | | | | | | | | | | | | | | | | | | | | | |
| | | | | Incorporated by Reference | | Filed (†) or
Furnished (‡)
Herewith
(as indicated) |
Exhibit
No. | | Exhibit Description | | Form | | SEC
File No. | | Exhibit | | Filing
Date | |
| | | | | | | | | | | | |
| | | | 8-K | | 000-20570 | | 4.1 | | 5/28/2019 | | |
| | | | 8-K | | 001-34148 | | 4.5 | | 7/2/2020 | | |
| | | | 8-K | | 000-20570 | | 4.2 | | 5/28/2019 | | |
| | | | 8-K | | 001-34148 | | 4.7 | | 7/2/2020 | | |
| | | | 8-K | | 001-37636 | | 4.1 | | 12/4/2017 | | |
| | | | 8-K | | 001-34148 | | 4.9 | | 7/2/2020 | | |
| | | | 8-K | | 001-37636 | | 4.1 | | 5/20/2020 | | |
| | | | 8-K | | 001-34148 | | 4.11 | | 7/2/2020 | | |
| | | | 8-K | | 001-37636 | | 4.1 | | 2/15/2019 | | |
| | | | 8-K | | 001-34148 | | 4.13 | | 7/2/2020 | | |
| | | | 8-K | | 001-37636 | | 4.1 | | 2/11/2020 | | |
| | | | 8-K | | 001-34148 | | 4.15 | | 7/2/2020 | | |
| | | | 8-K | | 000-20570 | | 10.1 | | 6/12/2020 | | |
| | | | 8-K | | 001-34148 | | 10.1 | | 7/2/2020 | | |
| | | | 8-K | | 001-34148 | | 10.2 | | 7/2/2020 | | |
| | | | 8-K | | 001-34148 | | 10.3 | | 7/2/2020 | | |
| | | | S-4/A | | 333-236420 | | Annex F | | 4/28/2020 | | |
| | | | | | | | | | | | | | | | | | | | | | | | | | | | | | | | | | | | | | |
| | | | | Incorporated by Reference | | Filed (†) or
Furnished (‡)
Herewith
(as indicated) |
Exhibit
No. | | Exhibit Description | | Form | | SEC
File No. | | Exhibit | | Filing
Date | |
| | | | | | | | | | | | |
| | | | 8-K | | 001-37636 | | 10.1 | | 6/21/2018 | | |
| | | | 8-K | | 001-34148 | | 10.5 | | 7/2/2020 | | |
| | | | 10-Q | | 001-37636 | | 10.1 | | 11/9/2017 | | |
| | | | 10-Q | | 001-37636 | | 10.2 | | 11/9/2017 | | |
| | | | 8-K | | 001-37636 | | 10.5 | | 11/24/2015 | | |
| | | | 8-K | | 001-37636 | | 10.1 | | 8/4/2017 | | |
| | | | 8-K | | 001-34148 | | 10.10 | | 7/2/2020 | | |
| | | | 8-K | | 001-37636 | | 10.7 | | 2/28/2017 | | |
| | | | 8-K | | 001-37636 | | 10.8 | | 2/28/2017 | | |
| | | | 8-K/A | | 001-37636 | | 10.1 | | 2/20/2020 | | |
| | | | 8-K | | 001-34148 | | 10.14 | | 7/2/2020 | | |
| | | | 8-K | | 001-37636 | | 10.1 | | 8/14/2018 | | |
| | | | 8-K/A | | 001-37636 | | 10.2 | | 2/20/2020 | | |
| | | | 8-K | | 001-34148 | | 10.17 | | 7/2/2020 | | |
| | | | 8-K | | 001-37636 | | 10.2 | | 8/14/2018 | | |
| | | | 8-K | | 001-34148 | | 10.19 | | 7/2/2020 | | |
| | Amended and Restated Credit Agreement, dated as of November 16, 2015, among Match Group, Inc. (Former Match Group), as borrower, the lenders party thereto, JPMorgan Chase Bank, N.A., as administrative agent, and the other parties thereto. | | 10-K | | 001-37636 | | 10.11 | | 3/28/2016 | | |
| | | | | | | | | | | | | | | | | | | | | | | | | | | | | | | | | | | | | | |
| | | | | Incorporated by Reference | | Filed (†) or
Furnished (‡)
Herewith
(as indicated) |
Exhibit
No. | | Exhibit Description | | Form | | SEC
File No. | | Exhibit | | Filing
Date | |
| | | | | | | | | | | | |
| | Amendment No. 3, dated as of December 8, 2016, to the Credit Agreement dated as of October 7, 2015, as amended and restated as of November 16, 2015, as further amended as of December 16, 2015, among Match Group, Inc. (Former Match Group), as borrower, the lenders party thereto, JPMorgan Chase Bank, N.A., as administrative agent, and the other parties thereto. | | 8-K | | 001-37636 | | 10.1 | | 12/8/2016 | | |
| | Amendment No. 4, dated as of August 14, 2017, to the Credit Agreement dated as of October 7, 2015, as amended and restated as of November 16, 2015, as further amended as of December 16, 2015, as further amended as of December 8, 2016, among Match Group, Inc. (Former Match Group), as borrower, the lenders party thereto, JPMorgan Chase Bank, N.A., as administrative agent, and the other parties thereto. | | 8-K | | 001-37636 | | 10.1 | | 8/17/2017 | | |
| | Amendment No. 5 dated as of December 7, 2018 to the Credit Agreement dated as of October 7, 2015, as amended and restated as of November 16, 2015, as further amended as of December 16, 2015, as further amended as of December 8, 2016, and as further amended as of August 14, 2017, among Match Group, Inc. (Former Match Group), as borrower, the lenders party thereto, JPMorgan Chase Bank, N.A., as administrative agent and the other parties thereto. | | 8-K | | 001-37636 | | 10.1 | | 12/13/2018 | | |
| | Amendment No. 6 dated as of February 13, 2020 to the Credit Agreement dated as of October 7, 2015, as amended and restated as of November 16, 2015, as further amended as of December 16, 2015, as further amended as of December 8, 2016, as further amended as of August 14, 2017 and as further amended as of December 7, 2018, among Match Group, Inc. (Former Match Group), as borrower, the lenders party thereto, JPMorgan Chase Bank, N.A., as administrative agent and the other parties thereto. | | 8-K | | 001-37636 | | 10.1 | | 2/20/2020 | | |
| | Joinder and Reaffirmation Agreement, dated as June 30, 2020, by and among Match Group, Inc. (Former Match Group), Match Group Holdings II, LLC, JPMorgan Chase Bank, N.A., as administrative agent, and the other parties thereto, to the Credit Agreement, dated as of November 16, 2015, among Match Group, Inc. (Former Match Group), as borrower, the lenders party thereto, JPMorgan Chase Bank, N.A., as administrative agent, and the other parties thereto, as amended. | | 8-K | | 001-34148 | | 10.25 | | 7/2/2020 | | |
| | | | | | | | | | | | † |
| | | | | | | | | | | | † |
| | | | | | | | | | | | † |
| | | | | | | | | | | | † |
| | | | | | | | | | | | ‡ |
| | | | | | | | | | | | ‡ |
| 101.INS | | XBRL Instance Document - the instance document does not appear in the Interactive Data File because its XBRL tags are embedded within the Inline XBRL document. | | | | | | | | | | |
| 101.SCH | | XBRL Taxonomy Extension Schema Document | | | | | | | | | | † |
| | | | | | | | | | | | | | | | | | | | | | | | | | | | | | | | | | | | | | |
| | | | | Incorporated by Reference | | Filed (†) or
Furnished (‡)
Herewith
(as indicated) |
Exhibit
No. | | Exhibit Description | | Form | | SEC
File No. | | Exhibit | | Filing
Date | |
| | | | | | | | | | | | |
| 101.CAL | | XBRL Taxonomy Extension Calculation Linkbase Document | | | | | | | | | | † |
| 101.DEF | | XBRL Taxonomy Extension Definition Linkbase Document | | | | | | | | | | † |
| 101.LAB | | XBRL Taxonomy Extension Label Linkbase Document | | | | | | | | | | † |
| 101.PRE | | XBRL Taxonomy Extension Presentation Linkbase Document | | | | | | | | | | † |
| 104 | | Cover Page Interactive Data File (formatted as Inline XBRL and contained in Exhibit 101) | | | | | | | | | | |
______________________
(1)Reflects management contracts and management and director compensatory plans.
* Certain schedules and exhibits to the Transaction Agreement have been omitted pursuant to Item 601(b)(2) of Regulation S-K. The Company hereby agrees to furnish supplementally a copy of any omitted schedule and/or exhibit to the SEC upon request.
SIGNATURES
Pursuant to the requirements of Section 13 or 15(d) of the Securities Exchange Act of 1934, the Registrant has duly caused this report to be signed on its behalf by the undersigned, thereunto duly authorized.
| | | | | | | | | | | | | | |
| February 25, 2021 | | MATCH GROUP, INC. |
| | | By: | | /s/ GARY SWIDLER |
| | | | Gary Swidler |
| | | | Chief Operating Officer and Chief Financial Officer |
Pursuant to the requirements of the Securities Exchange Act of 1934, this report has been signed below by the following persons on behalf of the Registrant and in the capacities indicated on February 25, 2021:
| | | | | | | | |
| Signature | | Title |
| | | |
| /s/ JOSEPH LEVIN | | Executive Chairman of the Board |
| Joseph Levin | | |
| | |
| /s/ SHARMISTHA DUBEY | | Chief Executive Officer and Director
(Principal Executive Officer) |
| Sharmistha Dubey | | |
| | |
| /s/ GARY SWIDLER | | Chief Operating Officer and Chief Financial Officer
(Principal Financial Officer) |
| Gary Swidler | | |
| | |
| /s/ PHILIP D. EIGENMANN | | Chief Accounting Officer
(Principal Accounting Officer) |
| Philip D. Eigenmann | | |
| | |
| /s/ STEPHEN BAILEY | | Director |
| Stephen Bailey | | |
| | |
| /s/ MELISSA BRENNER | | Director |
| Melissa Brenner | | |
| | |
| /s/ ANN L. McDANIEL | | Director |
| Ann L. McDaniel | | |
| | |
| /s/ THOMAS J. McINERNEY | | Director |
| Thomas J. McInerney | | |
| | |
| /s/ WENDI MURDOCH | | Director |
| Wendi Murdoch | | |
| | |
| /s/ RYAN REYNOLDS | | Director |
| Ryan Reynolds | | |
| | |
| /s/ GLENN H. SCHIFFMAN | | Director |
| Glenn H. Schiffman | | |
| | |
| /s/ PAMELA S. SEYMON | | Director |
| Pamela S. Seymon | | |
| | |
| /s/ ALAN G. SPOON | | Director |
| Alan G. Spoon | | |
Schedule II
MATCH GROUP, INC. AND SUBSIDIARIES
VALUATION AND QUALIFYING ACCOUNTS
| | | | | | | | | | | | | | | | | | | | | | | | | | | | | |
| Description | Balance at
Beginning of Period | | Charges to
Earnings | | Charges to
Other Accounts | | Deductions | | Balance at
End of Period |
| | | | | | | | | |
| | (In thousands) |
| 2020 | | | | | | | | | |
| Allowance for credit losses | $ | 578 | | | $ | (22) | | (a) | $ | (234) | | | $ | (36) | | (d) | $ | 286 | |
| Deferred tax valuation allowance | 52,913 | | | 35,261 | | (b) | (17,084) | | (c) | — | | | 71,090 | |
| Other reserves | 2,901 | | | | | | | | | 3,380 | |
| 2019 | | | | | | | | | |
| Allowance for doubtful accounts | $ | 724 | | | $ | 79 | | (a) | $ | (8) | | | $ | (217) | | (d) | $ | 578 | |
| Deferred tax valuation allowance | 45,483 | | | 7,472 | | (e) | (42) | | (f) | — | | | 52,913 | |
| Other reserves | 3,008 | | | | | | | | | 2,901 | |
| 2018 | | | | | | | | | |
| Allowance for doubtful accounts | $ | 778 | | | $ | 83 | | (a) | $ | (15) | | | $ | (122) | | (d) | $ | 724 | |
| Deferred tax valuation allowance | 22,830 | | | 22,675 | | (g) | (22) | | (f) | — | | | 45,483 | |
| Other reserves | 2,544 | | | | | | | | | 3,008 | |
______________________
(a)Additions to the allowance for credit losses and doubtful accounts are charged to expense, net of the recovery of previous year expenses.
(b)Amount is primarily related to foreign tax credits, foreign net operating losses, and foreign interest deductions.
(c)Amount is primarily related to a reduction in the valuation allowance as a result of the preliminary allocation of tax attributes between Match Group and IAC in conjunction with the Separation.
(d)Write-off of fully reserved accounts receivable.
(e)Amount is primarily related to foreign and state net operating losses and foreign interest deduction carryforwards.
(f)Amount is related to currency translation adjustments on foreign net operating losses.
(g)Amount is primarily related to foreign tax credits and foreign interest deduction carryforwards.