RADIAN GROUP INC000089092612/3110-K2021FYFALSE175,525,5914,164,813,673http://fasb.org/us-gaap/2021-01-31#OtherAssetshttp://fasb.org/us-gaap/2021-01-31#OtherAssetshttp://fasb.org/us-gaap/2021-01-31#OtherAssetshttp://fasb.org/us-gaap/2021-01-31#OtherLiabilitiesP6M0.001485,000485,000194,408210,130175,421191,60618,98718,52400008909262021-01-012021-12-3100008909262021-06-30iso4217:USD00008909262022-02-23xbrli:shares0000890926rdn:PrimaryCaseReservesMemberrdn:MortgageInsuranceSegmentMemberrdn:FirstLienMortgageInsuranceProductsMember2021-12-3100008909262021-12-3100008909262020-12-3100008909262020-01-012020-12-3100008909262019-01-012019-12-31iso4217:USDxbrli:shares0000890926us-gaap:CommonStockMember2020-12-310000890926us-gaap:CommonStockMember2019-12-310000890926us-gaap:CommonStockMember2018-12-310000890926us-gaap:CommonStockMember2021-01-012021-12-310000890926us-gaap:CommonStockMember2020-01-012020-12-310000890926us-gaap:CommonStockMember2019-01-012019-12-310000890926us-gaap:CommonStockMember2021-12-310000890926us-gaap:TreasuryStockMember2020-12-310000890926us-gaap:TreasuryStockMember2019-12-310000890926us-gaap:TreasuryStockMember2018-12-310000890926us-gaap:TreasuryStockMember2021-01-012021-12-310000890926us-gaap:TreasuryStockMember2020-01-012020-12-310000890926us-gaap:TreasuryStockMember2019-01-012019-12-310000890926us-gaap:TreasuryStockMember2021-12-310000890926us-gaap:AdditionalPaidInCapitalMember2020-12-310000890926us-gaap:AdditionalPaidInCapitalMember2019-12-310000890926us-gaap:AdditionalPaidInCapitalMember2018-12-310000890926us-gaap:AdditionalPaidInCapitalMember2021-01-012021-12-310000890926us-gaap:AdditionalPaidInCapitalMember2020-01-012020-12-310000890926us-gaap:AdditionalPaidInCapitalMember2019-01-012019-12-310000890926us-gaap:AdditionalPaidInCapitalMember2021-12-310000890926us-gaap:RetainedEarningsMember2020-12-310000890926us-gaap:RetainedEarningsMember2019-12-310000890926us-gaap:RetainedEarningsMember2018-12-310000890926us-gaap:RetainedEarningsMember2021-01-012021-12-310000890926us-gaap:RetainedEarningsMember2020-01-012020-12-310000890926us-gaap:RetainedEarningsMember2019-01-012019-12-310000890926us-gaap:RetainedEarningsMember2021-12-310000890926us-gaap:AccumulatedOtherComprehensiveIncomeMember2020-12-310000890926us-gaap:AccumulatedOtherComprehensiveIncomeMember2019-12-310000890926us-gaap:AccumulatedOtherComprehensiveIncomeMember2018-12-310000890926us-gaap:AccumulatedOtherComprehensiveIncomeMember2021-01-012021-12-310000890926us-gaap:AccumulatedOtherComprehensiveIncomeMember2020-01-012020-12-310000890926us-gaap:AccumulatedOtherComprehensiveIncomeMember2019-01-012019-12-310000890926us-gaap:AccumulatedOtherComprehensiveIncomeMember2021-12-3100008909262019-12-3100008909262018-12-31rdn:segment0000890926rdn:MortgageInsuranceSegmentMember2021-12-31xbrli:pure0000890926rdn:MortgageInsuranceSegmentMember2020-12-310000890926rdn:MortgageInsuranceSegmentMemberrdn:CreditRiskTransferTransactionsMember2021-12-310000890926rdn:MortgageInsuranceSegmentMemberrdn:CreditRiskTransferTransactionsMember2020-12-310000890926srt:MinimumMember2021-12-31rdn:payment0000890926rdn:MortgageInsuranceSegmentMember2021-01-012021-12-31rdn:group0000890926rdn:MortgageInsuranceSegmentMember2019-01-012019-12-310000890926srt:MaximumMember2021-12-310000890926rdn:RealEstateSegmentMember2021-01-012021-12-310000890926srt:MaximumMember2021-01-012021-12-310000890926srt:MinimumMember2021-01-012021-12-310000890926us-gaap:SoftwareAndSoftwareDevelopmentCostsMember2021-12-310000890926us-gaap:SoftwareAndSoftwareDevelopmentCostsMember2020-12-310000890926us-gaap:LeaseholdImprovementsMember2021-12-310000890926us-gaap:LeaseholdImprovementsMember2020-12-310000890926us-gaap:FurnitureAndFixturesMember2021-12-310000890926us-gaap:FurnitureAndFixturesMember2020-12-310000890926us-gaap:StockCompensationPlanMember2021-01-012021-12-310000890926us-gaap:StockCompensationPlanMember2020-01-012020-12-310000890926us-gaap:StockCompensationPlanMember2019-01-012019-12-310000890926rdn:MortgageInsuranceSegmentMember2020-01-012020-12-310000890926rdn:RealEstateSegmentMember2021-01-012021-12-310000890926rdn:RealEstateSegmentMember2020-01-012020-12-310000890926rdn:RealEstateSegmentMember2019-01-012019-12-310000890926rdn:MortgageAndHomegeniusSegmentMember2021-01-012021-12-310000890926rdn:MortgageAndHomegeniusSegmentMember2020-01-012020-12-310000890926rdn:MortgageAndHomegeniusSegmentMember2019-01-012019-12-310000890926us-gaap:CorporateNonSegmentMember2021-01-012021-12-310000890926us-gaap:CorporateNonSegmentMember2020-01-012020-12-310000890926us-gaap:CorporateNonSegmentMember2019-01-012019-12-310000890926us-gaap:MaterialReconcilingItemsMember2021-01-012021-12-310000890926us-gaap:MaterialReconcilingItemsMember2020-01-012020-12-310000890926us-gaap:MaterialReconcilingItemsMember2019-01-012019-12-310000890926us-gaap:OperatingSegmentsMemberrdn:MortgageandRealEstateServicesSegmentMember2021-01-012021-12-310000890926rdn:AllOtheractivitiessegmentMember2021-01-012021-12-310000890926us-gaap:IntersegmentEliminationMember2021-01-012021-12-310000890926rdn:MortgageInsuranceSegmentMemberrdn:DepreciationExpenseMember2021-01-012021-12-310000890926rdn:RealEstateSegmentMemberrdn:DepreciationExpenseMember2021-01-012021-12-310000890926us-gaap:OperatingSegmentsMemberrdn:MortgageandRealEstateServicesSegmentMemberrdn:DepreciationExpenseMember2021-01-012021-12-310000890926us-gaap:OperatingSegmentsMemberrdn:MortgageandRealEstateServicesSegmentMember2020-01-012020-12-310000890926rdn:AllOtheractivitiessegmentMember2020-01-012020-12-310000890926us-gaap:IntersegmentEliminationMember2020-01-012020-12-310000890926rdn:MortgageInsuranceSegmentMemberrdn:DepreciationExpenseMember2020-01-012020-12-310000890926rdn:RealEstateSegmentMemberrdn:DepreciationExpenseMember2020-01-012020-12-310000890926us-gaap:OperatingSegmentsMemberrdn:MortgageandRealEstateServicesSegmentMemberrdn:DepreciationExpenseMember2020-01-012020-12-310000890926us-gaap:OperatingSegmentsMemberrdn:MortgageandRealEstateServicesSegmentMember2019-01-012019-12-310000890926rdn:AllOtheractivitiessegmentMember2019-01-012019-12-310000890926us-gaap:IntersegmentEliminationMember2019-01-012019-12-310000890926rdn:MortgageInsuranceSegmentMemberrdn:DepreciationExpenseMember2019-01-012019-12-310000890926rdn:RealEstateSegmentMemberrdn:DepreciationExpenseMember2019-01-012019-12-310000890926us-gaap:OperatingSegmentsMemberrdn:MortgageandRealEstateServicesSegmentMemberrdn:DepreciationExpenseMember2019-01-012019-12-310000890926rdn:ConsolidatedRevenuesMemberus-gaap:CustomerConcentrationRiskMember2020-12-31rdn:customer0000890926rdn:ConsolidatedRevenuesMemberus-gaap:CustomerConcentrationRiskMember2019-12-310000890926rdn:ConsolidatedRevenuesMemberus-gaap:CustomerConcentrationRiskMember2021-12-310000890926rdn:ConsolidatedRevenuesMemberus-gaap:CustomerConcentrationRiskMember2020-01-012020-12-310000890926rdn:ConsolidatedRevenuesMemberus-gaap:CustomerConcentrationRiskMember2021-01-012021-12-310000890926rdn:ConsolidatedRevenuesMemberus-gaap:CustomerConcentrationRiskMember2019-01-012019-12-310000890926rdn:NewInsuranceWrittenMemberus-gaap:CustomerConcentrationRiskMember2021-12-310000890926rdn:NewInsuranceWrittenMemberus-gaap:CustomerConcentrationRiskMember2019-01-012019-12-310000890926rdn:NewInsuranceWrittenMemberus-gaap:CustomerConcentrationRiskMember2021-01-012021-12-310000890926rdn:NewInsuranceWrittenMemberus-gaap:CustomerConcentrationRiskMember2020-01-012020-12-310000890926rdn:NewInsuranceWrittenMemberus-gaap:CustomerConcentrationRiskMember2020-12-310000890926rdn:NewInsuranceWrittenMemberus-gaap:CustomerConcentrationRiskMember2019-12-310000890926rdn:TitleServicesMember2021-01-012021-12-310000890926rdn:TitleServicesMember2020-01-012020-12-310000890926rdn:TitleServicesMember2019-01-012019-12-310000890926rdn:ValuationServicesMember2021-01-012021-12-310000890926rdn:ValuationServicesMember2020-01-012020-12-310000890926rdn:ValuationServicesMember2019-01-012019-12-310000890926rdn:SingleFamilyRentalMember2021-01-012021-12-310000890926rdn:SingleFamilyRentalMember2020-01-012020-12-310000890926rdn:SingleFamilyRentalMember2019-01-012019-12-310000890926rdn:AssetmanagementservicesMember2021-01-012021-12-310000890926rdn:AssetmanagementservicesMember2020-01-012020-12-310000890926rdn:AssetmanagementservicesMember2019-01-012019-12-310000890926rdn:RealEstateOwnedREOAssetManagementMember2021-01-012021-12-310000890926rdn:RealEstateOwnedREOAssetManagementMember2020-01-012020-12-310000890926rdn:RealEstateOwnedREOAssetManagementMember2019-01-012019-12-310000890926rdn:RealEstateAgentServicesMember2021-01-012021-12-310000890926rdn:RealEstateAgentServicesMember2020-01-012020-12-310000890926rdn:RealEstateAgentServicesMember2019-01-012019-12-310000890926rdn:MortgageServicesMember2021-01-012021-12-310000890926rdn:MortgageServicesMember2020-01-012020-12-310000890926rdn:MortgageServicesMember2019-01-012019-12-310000890926rdn:AllOtherServicesMember2021-01-012021-12-310000890926rdn:AllOtherServicesMember2020-01-012020-12-310000890926rdn:AllOtherServicesMember2019-01-012019-12-310000890926rdn:RealEstateSegmentMember2021-12-310000890926rdn:RealEstateSegmentMember2020-12-310000890926rdn:MortgageandRealEstateServicesSegmentMember2021-01-012021-12-310000890926rdn:MortgageandRealEstateServicesSegmentMember2019-01-012019-12-310000890926rdn:MortgageandRealEstateServicesSegmentMember2020-01-012020-12-310000890926us-gaap:USTreasuryAndGovernmentMemberus-gaap:FixedMaturitiesMemberus-gaap:FairValueMeasurementsRecurringMemberus-gaap:FairValueInputsLevel1Member2021-12-310000890926us-gaap:USTreasuryAndGovernmentMemberus-gaap:FixedMaturitiesMemberus-gaap:FairValueMeasurementsRecurringMemberus-gaap:FairValueInputsLevel2Member2021-12-310000890926us-gaap:USTreasuryAndGovernmentMemberus-gaap:FixedMaturitiesMemberus-gaap:FairValueMeasurementsRecurringMemberus-gaap:FairValueInputsLevel3Member2021-12-310000890926us-gaap:USTreasuryAndGovernmentMemberus-gaap:FixedMaturitiesMemberus-gaap:FairValueMeasurementsRecurringMember2021-12-310000890926us-gaap:FixedMaturitiesMemberus-gaap:FairValueMeasurementsRecurringMemberus-gaap:FairValueInputsLevel1Memberus-gaap:USStatesAndPoliticalSubdivisionsMember2021-12-310000890926us-gaap:FixedMaturitiesMemberus-gaap:FairValueMeasurementsRecurringMemberus-gaap:FairValueInputsLevel2Memberus-gaap:USStatesAndPoliticalSubdivisionsMember2021-12-310000890926us-gaap:FixedMaturitiesMemberus-gaap:FairValueMeasurementsRecurringMemberus-gaap:FairValueInputsLevel3Memberus-gaap:USStatesAndPoliticalSubdivisionsMember2021-12-310000890926us-gaap:FixedMaturitiesMemberus-gaap:FairValueMeasurementsRecurringMemberus-gaap:USStatesAndPoliticalSubdivisionsMember2021-12-310000890926us-gaap:FixedMaturitiesMemberus-gaap:CorporateDebtSecuritiesMemberus-gaap:FairValueMeasurementsRecurringMemberus-gaap:FairValueInputsLevel1Member2021-12-310000890926us-gaap:FixedMaturitiesMemberus-gaap:CorporateDebtSecuritiesMemberus-gaap:FairValueMeasurementsRecurringMemberus-gaap:FairValueInputsLevel2Member2021-12-310000890926us-gaap:FixedMaturitiesMemberus-gaap:CorporateDebtSecuritiesMemberus-gaap:FairValueMeasurementsRecurringMemberus-gaap:FairValueInputsLevel3Member2021-12-310000890926us-gaap:FixedMaturitiesMemberus-gaap:CorporateDebtSecuritiesMemberus-gaap:FairValueMeasurementsRecurringMember2021-12-310000890926us-gaap:FixedMaturitiesMemberus-gaap:ResidentialMortgageBackedSecuritiesMemberus-gaap:FairValueMeasurementsRecurringMemberus-gaap:FairValueInputsLevel1Member2021-12-310000890926us-gaap:FixedMaturitiesMemberus-gaap:ResidentialMortgageBackedSecuritiesMemberus-gaap:FairValueMeasurementsRecurringMemberus-gaap:FairValueInputsLevel2Member2021-12-310000890926us-gaap:FixedMaturitiesMemberus-gaap:ResidentialMortgageBackedSecuritiesMemberus-gaap:FairValueMeasurementsRecurringMemberus-gaap:FairValueInputsLevel3Member2021-12-310000890926us-gaap:FixedMaturitiesMemberus-gaap:ResidentialMortgageBackedSecuritiesMemberus-gaap:FairValueMeasurementsRecurringMember2021-12-310000890926us-gaap:FixedMaturitiesMemberus-gaap:CommercialMortgageBackedSecuritiesMemberus-gaap:FairValueMeasurementsRecurringMemberus-gaap:FairValueInputsLevel1Member2021-12-310000890926us-gaap:FixedMaturitiesMemberus-gaap:CommercialMortgageBackedSecuritiesMemberus-gaap:FairValueMeasurementsRecurringMemberus-gaap:FairValueInputsLevel2Member2021-12-310000890926us-gaap:FixedMaturitiesMemberus-gaap:CommercialMortgageBackedSecuritiesMemberus-gaap:FairValueMeasurementsRecurringMemberus-gaap:FairValueInputsLevel3Member2021-12-310000890926us-gaap:FixedMaturitiesMemberus-gaap:CommercialMortgageBackedSecuritiesMemberus-gaap:FairValueMeasurementsRecurringMember2021-12-310000890926us-gaap:FixedMaturitiesMemberus-gaap:FairValueMeasurementsRecurringMemberus-gaap:CollateralizedLoanObligationsMemberus-gaap:FairValueInputsLevel1Member2021-12-310000890926us-gaap:FixedMaturitiesMemberus-gaap:FairValueMeasurementsRecurringMemberus-gaap:CollateralizedLoanObligationsMemberus-gaap:FairValueInputsLevel2Member2021-12-310000890926us-gaap:FixedMaturitiesMemberus-gaap:FairValueMeasurementsRecurringMemberus-gaap:FairValueInputsLevel3Memberus-gaap:CollateralizedLoanObligationsMember2021-12-310000890926us-gaap:FixedMaturitiesMemberus-gaap:FairValueMeasurementsRecurringMemberus-gaap:CollateralizedLoanObligationsMember2021-12-310000890926us-gaap:AssetBackedSecuritiesMemberus-gaap:FixedMaturitiesMemberus-gaap:FairValueMeasurementsRecurringMemberus-gaap:FairValueInputsLevel1Member2021-12-310000890926us-gaap:AssetBackedSecuritiesMemberus-gaap:FixedMaturitiesMemberus-gaap:FairValueMeasurementsRecurringMemberus-gaap:FairValueInputsLevel2Member2021-12-310000890926us-gaap:AssetBackedSecuritiesMemberus-gaap:FixedMaturitiesMemberus-gaap:FairValueMeasurementsRecurringMemberus-gaap:FairValueInputsLevel3Member2021-12-310000890926us-gaap:AssetBackedSecuritiesMemberus-gaap:FixedMaturitiesMemberus-gaap:FairValueMeasurementsRecurringMember2021-12-310000890926us-gaap:FixedMaturitiesMemberus-gaap:ForeignGovernmentDebtSecuritiesMemberus-gaap:FairValueMeasurementsRecurringMemberus-gaap:FairValueInputsLevel1Member2021-12-310000890926us-gaap:FixedMaturitiesMemberus-gaap:ForeignGovernmentDebtSecuritiesMemberus-gaap:FairValueMeasurementsRecurringMemberus-gaap:FairValueInputsLevel2Member2021-12-310000890926us-gaap:FixedMaturitiesMemberus-gaap:ForeignGovernmentDebtSecuritiesMemberus-gaap:FairValueMeasurementsRecurringMemberus-gaap:FairValueInputsLevel3Member2021-12-310000890926us-gaap:FixedMaturitiesMemberus-gaap:ForeignGovernmentDebtSecuritiesMemberus-gaap:FairValueMeasurementsRecurringMember2021-12-310000890926us-gaap:FixedMaturitiesMemberrdn:MortgageInsuranceLinkedNotesMemberus-gaap:FairValueMeasurementsRecurringMemberus-gaap:FairValueInputsLevel1Member2021-12-310000890926us-gaap:FixedMaturitiesMemberrdn:MortgageInsuranceLinkedNotesMemberus-gaap:FairValueMeasurementsRecurringMemberus-gaap:FairValueInputsLevel2Member2021-12-310000890926us-gaap:FixedMaturitiesMemberrdn:MortgageInsuranceLinkedNotesMemberus-gaap:FairValueMeasurementsRecurringMemberus-gaap:FairValueInputsLevel3Member2021-12-310000890926us-gaap:FixedMaturitiesMemberrdn:MortgageInsuranceLinkedNotesMemberus-gaap:FairValueMeasurementsRecurringMember2021-12-310000890926us-gaap:FixedMaturitiesMemberus-gaap:FairValueMeasurementsRecurringMemberus-gaap:FairValueInputsLevel1Member2021-12-310000890926us-gaap:FixedMaturitiesMemberus-gaap:FairValueMeasurementsRecurringMemberus-gaap:FairValueInputsLevel2Member2021-12-310000890926us-gaap:FixedMaturitiesMemberus-gaap:FairValueMeasurementsRecurringMemberus-gaap:FairValueInputsLevel3Member2021-12-310000890926us-gaap:FixedMaturitiesMemberus-gaap:FairValueMeasurementsRecurringMember2021-12-310000890926rdn:TradingSecuritiesMemberus-gaap:FairValueMeasurementsRecurringMemberus-gaap:FairValueInputsLevel1Memberus-gaap:USStatesAndPoliticalSubdivisionsMember2021-12-310000890926rdn:TradingSecuritiesMemberus-gaap:FairValueMeasurementsRecurringMemberus-gaap:FairValueInputsLevel2Memberus-gaap:USStatesAndPoliticalSubdivisionsMember2021-12-310000890926rdn:TradingSecuritiesMemberus-gaap:FairValueMeasurementsRecurringMemberus-gaap:FairValueInputsLevel3Memberus-gaap:USStatesAndPoliticalSubdivisionsMember2021-12-310000890926rdn:TradingSecuritiesMemberus-gaap:FairValueMeasurementsRecurringMemberus-gaap:USStatesAndPoliticalSubdivisionsMember2021-12-310000890926rdn:TradingSecuritiesMemberus-gaap:CorporateDebtSecuritiesMemberus-gaap:FairValueMeasurementsRecurringMemberus-gaap:FairValueInputsLevel1Member2021-12-310000890926rdn:TradingSecuritiesMemberus-gaap:CorporateDebtSecuritiesMemberus-gaap:FairValueMeasurementsRecurringMemberus-gaap:FairValueInputsLevel2Member2021-12-310000890926rdn:TradingSecuritiesMemberus-gaap:CorporateDebtSecuritiesMemberus-gaap:FairValueMeasurementsRecurringMemberus-gaap:FairValueInputsLevel3Member2021-12-310000890926rdn:TradingSecuritiesMemberus-gaap:CorporateDebtSecuritiesMemberus-gaap:FairValueMeasurementsRecurringMember2021-12-310000890926rdn:TradingSecuritiesMemberus-gaap:ResidentialMortgageBackedSecuritiesMemberus-gaap:FairValueMeasurementsRecurringMemberus-gaap:FairValueInputsLevel1Member2021-12-310000890926rdn:TradingSecuritiesMemberus-gaap:ResidentialMortgageBackedSecuritiesMemberus-gaap:FairValueMeasurementsRecurringMemberus-gaap:FairValueInputsLevel2Member2021-12-310000890926rdn:TradingSecuritiesMemberus-gaap:ResidentialMortgageBackedSecuritiesMemberus-gaap:FairValueMeasurementsRecurringMemberus-gaap:FairValueInputsLevel3Member2021-12-310000890926rdn:TradingSecuritiesMemberus-gaap:ResidentialMortgageBackedSecuritiesMemberus-gaap:FairValueMeasurementsRecurringMember2021-12-310000890926rdn:TradingSecuritiesMemberus-gaap:CommercialMortgageBackedSecuritiesMemberus-gaap:FairValueMeasurementsRecurringMemberus-gaap:FairValueInputsLevel1Member2021-12-310000890926rdn:TradingSecuritiesMemberus-gaap:CommercialMortgageBackedSecuritiesMemberus-gaap:FairValueMeasurementsRecurringMemberus-gaap:FairValueInputsLevel2Member2021-12-310000890926rdn:TradingSecuritiesMemberus-gaap:CommercialMortgageBackedSecuritiesMemberus-gaap:FairValueMeasurementsRecurringMemberus-gaap:FairValueInputsLevel3Member2021-12-310000890926rdn:TradingSecuritiesMemberus-gaap:CommercialMortgageBackedSecuritiesMemberus-gaap:FairValueMeasurementsRecurringMember2021-12-310000890926rdn:TradingSecuritiesMemberus-gaap:FairValueMeasurementsRecurringMemberus-gaap:FairValueInputsLevel1Member2021-12-310000890926rdn:TradingSecuritiesMemberus-gaap:FairValueMeasurementsRecurringMemberus-gaap:FairValueInputsLevel2Member2021-12-310000890926rdn:TradingSecuritiesMemberus-gaap:FairValueMeasurementsRecurringMemberus-gaap:FairValueInputsLevel3Member2021-12-310000890926rdn:TradingSecuritiesMemberus-gaap:FairValueMeasurementsRecurringMember2021-12-310000890926us-gaap:FairValueMeasurementsRecurringMemberus-gaap:EquitySecuritiesMemberus-gaap:FairValueInputsLevel1Member2021-12-310000890926us-gaap:FairValueMeasurementsRecurringMemberus-gaap:EquitySecuritiesMemberus-gaap:FairValueInputsLevel2Member2021-12-310000890926us-gaap:FairValueMeasurementsRecurringMemberus-gaap:FairValueInputsLevel3Memberus-gaap:EquitySecuritiesMember2021-12-310000890926us-gaap:FairValueMeasurementsRecurringMemberus-gaap:EquitySecuritiesMember2021-12-310000890926us-gaap:USTreasuryAndGovernmentMemberus-gaap:FairValueMeasurementsRecurringMemberus-gaap:ShortTermInvestmentsMemberus-gaap:FairValueInputsLevel1Member2021-12-310000890926us-gaap:USTreasuryAndGovernmentMemberus-gaap:FairValueMeasurementsRecurringMemberus-gaap:ShortTermInvestmentsMemberus-gaap:FairValueInputsLevel2Member2021-12-310000890926us-gaap:USTreasuryAndGovernmentMemberus-gaap:FairValueMeasurementsRecurringMemberus-gaap:FairValueInputsLevel3Memberus-gaap:ShortTermInvestmentsMember2021-12-310000890926us-gaap:USTreasuryAndGovernmentMemberus-gaap:FairValueMeasurementsRecurringMemberus-gaap:ShortTermInvestmentsMember2021-12-310000890926us-gaap:FairValueMeasurementsRecurringMemberus-gaap:ShortTermInvestmentsMemberus-gaap:FairValueInputsLevel1Memberus-gaap:USStatesAndPoliticalSubdivisionsMember2021-12-310000890926us-gaap:FairValueMeasurementsRecurringMemberus-gaap:ShortTermInvestmentsMemberus-gaap:FairValueInputsLevel2Memberus-gaap:USStatesAndPoliticalSubdivisionsMember2021-12-310000890926us-gaap:FairValueMeasurementsRecurringMemberus-gaap:FairValueInputsLevel3Memberus-gaap:ShortTermInvestmentsMemberus-gaap:USStatesAndPoliticalSubdivisionsMember2021-12-310000890926us-gaap:FairValueMeasurementsRecurringMemberus-gaap:ShortTermInvestmentsMemberus-gaap:USStatesAndPoliticalSubdivisionsMember2021-12-310000890926us-gaap:MoneyMarketFundsMemberus-gaap:FairValueMeasurementsRecurringMemberus-gaap:ShortTermInvestmentsMemberus-gaap:FairValueInputsLevel1Member2021-12-310000890926us-gaap:MoneyMarketFundsMemberus-gaap:FairValueMeasurementsRecurringMemberus-gaap:ShortTermInvestmentsMemberus-gaap:FairValueInputsLevel2Member2021-12-310000890926us-gaap:MoneyMarketFundsMemberus-gaap:FairValueMeasurementsRecurringMemberus-gaap:FairValueInputsLevel3Memberus-gaap:ShortTermInvestmentsMember2021-12-310000890926us-gaap:MoneyMarketFundsMemberus-gaap:FairValueMeasurementsRecurringMemberus-gaap:ShortTermInvestmentsMember2021-12-310000890926us-gaap:CorporateDebtSecuritiesMemberus-gaap:FairValueMeasurementsRecurringMemberus-gaap:ShortTermInvestmentsMemberus-gaap:FairValueInputsLevel1Member2021-12-310000890926us-gaap:CorporateDebtSecuritiesMemberus-gaap:FairValueMeasurementsRecurringMemberus-gaap:ShortTermInvestmentsMemberus-gaap:FairValueInputsLevel2Member2021-12-310000890926us-gaap:CorporateDebtSecuritiesMemberus-gaap:FairValueMeasurementsRecurringMemberus-gaap:FairValueInputsLevel3Memberus-gaap:ShortTermInvestmentsMember2021-12-310000890926us-gaap:CorporateDebtSecuritiesMemberus-gaap:FairValueMeasurementsRecurringMemberus-gaap:ShortTermInvestmentsMember2021-12-310000890926us-gaap:CommercialMortgageBackedSecuritiesMemberus-gaap:FairValueMeasurementsRecurringMemberus-gaap:ShortTermInvestmentsMemberus-gaap:FairValueInputsLevel1Member2021-12-310000890926us-gaap:CommercialMortgageBackedSecuritiesMemberus-gaap:FairValueMeasurementsRecurringMemberus-gaap:ShortTermInvestmentsMemberus-gaap:FairValueInputsLevel2Member2021-12-310000890926us-gaap:CommercialMortgageBackedSecuritiesMemberus-gaap:FairValueMeasurementsRecurringMemberus-gaap:FairValueInputsLevel3Memberus-gaap:ShortTermInvestmentsMember2021-12-310000890926us-gaap:CommercialMortgageBackedSecuritiesMemberus-gaap:FairValueMeasurementsRecurringMemberus-gaap:ShortTermInvestmentsMember2021-12-310000890926us-gaap:OtherInvestmentsMemberus-gaap:FairValueMeasurementsRecurringMemberus-gaap:ShortTermInvestmentsMemberus-gaap:FairValueInputsLevel1Member2021-12-310000890926us-gaap:OtherInvestmentsMemberus-gaap:FairValueMeasurementsRecurringMemberus-gaap:ShortTermInvestmentsMemberus-gaap:FairValueInputsLevel2Member2021-12-310000890926us-gaap:OtherInvestmentsMemberus-gaap:FairValueMeasurementsRecurringMemberus-gaap:FairValueInputsLevel3Memberus-gaap:ShortTermInvestmentsMember2021-12-310000890926us-gaap:OtherInvestmentsMemberus-gaap:FairValueMeasurementsRecurringMemberus-gaap:ShortTermInvestmentsMember2021-12-310000890926us-gaap:FairValueMeasurementsRecurringMemberus-gaap:ShortTermInvestmentsMemberus-gaap:FairValueInputsLevel1Member2021-12-310000890926us-gaap:FairValueMeasurementsRecurringMemberus-gaap:ShortTermInvestmentsMemberus-gaap:FairValueInputsLevel2Member2021-12-310000890926us-gaap:FairValueMeasurementsRecurringMemberus-gaap:FairValueInputsLevel3Memberus-gaap:ShortTermInvestmentsMember2021-12-310000890926us-gaap:FairValueMeasurementsRecurringMemberus-gaap:ShortTermInvestmentsMember2021-12-310000890926us-gaap:OtherInvestmentsMemberus-gaap:FairValueMeasurementsRecurringMemberus-gaap:FairValueInputsLevel1Member2021-12-310000890926us-gaap:OtherInvestmentsMemberus-gaap:FairValueMeasurementsRecurringMemberus-gaap:FairValueInputsLevel2Member2021-12-310000890926us-gaap:OtherInvestmentsMemberus-gaap:FairValueMeasurementsRecurringMemberus-gaap:FairValueInputsLevel3Member2021-12-310000890926us-gaap:OtherInvestmentsMemberus-gaap:FairValueMeasurementsRecurringMember2021-12-310000890926us-gaap:FairValueMeasurementsRecurringMemberus-gaap:FairValueInputsLevel1Member2021-12-310000890926us-gaap:FairValueMeasurementsRecurringMemberus-gaap:FairValueInputsLevel2Member2021-12-310000890926us-gaap:FairValueMeasurementsRecurringMemberus-gaap:FairValueInputsLevel3Member2021-12-310000890926us-gaap:FairValueMeasurementsRecurringMember2021-12-310000890926us-gaap:CorporateDebtSecuritiesMemberus-gaap:FairValueMeasurementsRecurringMemberus-gaap:SecuritiesFinancingTransactionFairValueMemberus-gaap:FairValueInputsLevel1Member2021-12-310000890926us-gaap:CorporateDebtSecuritiesMemberus-gaap:FairValueMeasurementsRecurringMemberus-gaap:SecuritiesFinancingTransactionFairValueMemberus-gaap:FairValueInputsLevel2Member2021-12-310000890926us-gaap:CorporateDebtSecuritiesMemberus-gaap:FairValueMeasurementsRecurringMemberus-gaap:SecuritiesFinancingTransactionFairValueMemberus-gaap:FairValueInputsLevel3Member2021-12-310000890926us-gaap:CorporateDebtSecuritiesMemberus-gaap:FairValueMeasurementsRecurringMemberus-gaap:SecuritiesFinancingTransactionFairValueMember2021-12-310000890926us-gaap:FairValueMeasurementsRecurringMemberus-gaap:SecuritiesFinancingTransactionFairValueMemberus-gaap:FairValueInputsLevel1Memberus-gaap:EquitySecuritiesMember2021-12-310000890926us-gaap:FairValueMeasurementsRecurringMemberus-gaap:SecuritiesFinancingTransactionFairValueMemberus-gaap:EquitySecuritiesMemberus-gaap:FairValueInputsLevel2Member2021-12-310000890926us-gaap:FairValueMeasurementsRecurringMemberus-gaap:SecuritiesFinancingTransactionFairValueMemberus-gaap:FairValueInputsLevel3Memberus-gaap:EquitySecuritiesMember2021-12-310000890926us-gaap:FairValueMeasurementsRecurringMemberus-gaap:SecuritiesFinancingTransactionFairValueMemberus-gaap:EquitySecuritiesMember2021-12-310000890926us-gaap:CarryingReportedAmountFairValueDisclosureMembersrt:PartnershipInterestMember2021-12-310000890926us-gaap:USTreasuryAndGovernmentMemberus-gaap:FixedMaturitiesMemberus-gaap:FairValueMeasurementsRecurringMemberus-gaap:FairValueInputsLevel1Member2020-12-310000890926us-gaap:USTreasuryAndGovernmentMemberus-gaap:FixedMaturitiesMemberus-gaap:FairValueMeasurementsRecurringMemberus-gaap:FairValueInputsLevel2Member2020-12-310000890926us-gaap:USTreasuryAndGovernmentMemberus-gaap:FixedMaturitiesMemberus-gaap:FairValueMeasurementsRecurringMemberus-gaap:FairValueInputsLevel3Member2020-12-310000890926us-gaap:USTreasuryAndGovernmentMemberus-gaap:FixedMaturitiesMemberus-gaap:FairValueMeasurementsRecurringMember2020-12-310000890926us-gaap:FixedMaturitiesMemberus-gaap:FairValueMeasurementsRecurringMemberus-gaap:FairValueInputsLevel1Memberus-gaap:USStatesAndPoliticalSubdivisionsMember2020-12-310000890926us-gaap:FixedMaturitiesMemberus-gaap:FairValueMeasurementsRecurringMemberus-gaap:FairValueInputsLevel2Memberus-gaap:USStatesAndPoliticalSubdivisionsMember2020-12-310000890926us-gaap:FixedMaturitiesMemberus-gaap:FairValueMeasurementsRecurringMemberus-gaap:FairValueInputsLevel3Memberus-gaap:USStatesAndPoliticalSubdivisionsMember2020-12-310000890926us-gaap:FixedMaturitiesMemberus-gaap:FairValueMeasurementsRecurringMemberus-gaap:USStatesAndPoliticalSubdivisionsMember2020-12-310000890926us-gaap:FixedMaturitiesMemberus-gaap:CorporateDebtSecuritiesMemberus-gaap:FairValueMeasurementsRecurringMemberus-gaap:FairValueInputsLevel1Member2020-12-310000890926us-gaap:FixedMaturitiesMemberus-gaap:CorporateDebtSecuritiesMemberus-gaap:FairValueMeasurementsRecurringMemberus-gaap:FairValueInputsLevel2Member2020-12-310000890926us-gaap:FixedMaturitiesMemberus-gaap:CorporateDebtSecuritiesMemberus-gaap:FairValueMeasurementsRecurringMemberus-gaap:FairValueInputsLevel3Member2020-12-310000890926us-gaap:FixedMaturitiesMemberus-gaap:CorporateDebtSecuritiesMemberus-gaap:FairValueMeasurementsRecurringMember2020-12-310000890926us-gaap:FixedMaturitiesMemberus-gaap:ResidentialMortgageBackedSecuritiesMemberus-gaap:FairValueMeasurementsRecurringMemberus-gaap:FairValueInputsLevel1Member2020-12-310000890926us-gaap:FixedMaturitiesMemberus-gaap:ResidentialMortgageBackedSecuritiesMemberus-gaap:FairValueMeasurementsRecurringMemberus-gaap:FairValueInputsLevel2Member2020-12-310000890926us-gaap:FixedMaturitiesMemberus-gaap:ResidentialMortgageBackedSecuritiesMemberus-gaap:FairValueMeasurementsRecurringMemberus-gaap:FairValueInputsLevel3Member2020-12-310000890926us-gaap:FixedMaturitiesMemberus-gaap:ResidentialMortgageBackedSecuritiesMemberus-gaap:FairValueMeasurementsRecurringMember2020-12-310000890926us-gaap:FixedMaturitiesMemberus-gaap:CommercialMortgageBackedSecuritiesMemberus-gaap:FairValueMeasurementsRecurringMemberus-gaap:FairValueInputsLevel1Member2020-12-310000890926us-gaap:FixedMaturitiesMemberus-gaap:CommercialMortgageBackedSecuritiesMemberus-gaap:FairValueMeasurementsRecurringMemberus-gaap:FairValueInputsLevel2Member2020-12-310000890926us-gaap:FixedMaturitiesMemberus-gaap:CommercialMortgageBackedSecuritiesMemberus-gaap:FairValueMeasurementsRecurringMemberus-gaap:FairValueInputsLevel3Member2020-12-310000890926us-gaap:FixedMaturitiesMemberus-gaap:CommercialMortgageBackedSecuritiesMemberus-gaap:FairValueMeasurementsRecurringMember2020-12-310000890926us-gaap:FixedMaturitiesMemberus-gaap:FairValueMeasurementsRecurringMemberus-gaap:CollateralizedLoanObligationsMemberus-gaap:FairValueInputsLevel1Member2020-12-310000890926us-gaap:FixedMaturitiesMemberus-gaap:FairValueMeasurementsRecurringMemberus-gaap:CollateralizedLoanObligationsMemberus-gaap:FairValueInputsLevel2Member2020-12-310000890926us-gaap:FixedMaturitiesMemberus-gaap:FairValueMeasurementsRecurringMemberus-gaap:FairValueInputsLevel3Memberus-gaap:CollateralizedLoanObligationsMember2020-12-310000890926us-gaap:FixedMaturitiesMemberus-gaap:FairValueMeasurementsRecurringMemberus-gaap:CollateralizedLoanObligationsMember2020-12-310000890926us-gaap:AssetBackedSecuritiesMemberus-gaap:FixedMaturitiesMemberus-gaap:FairValueMeasurementsRecurringMemberus-gaap:FairValueInputsLevel1Member2020-12-310000890926us-gaap:AssetBackedSecuritiesMemberus-gaap:FixedMaturitiesMemberus-gaap:FairValueMeasurementsRecurringMemberus-gaap:FairValueInputsLevel2Member2020-12-310000890926us-gaap:AssetBackedSecuritiesMemberus-gaap:FixedMaturitiesMemberus-gaap:FairValueMeasurementsRecurringMemberus-gaap:FairValueInputsLevel3Member2020-12-310000890926us-gaap:AssetBackedSecuritiesMemberus-gaap:FixedMaturitiesMemberus-gaap:FairValueMeasurementsRecurringMember2020-12-310000890926us-gaap:FixedMaturitiesMemberus-gaap:ForeignGovernmentDebtSecuritiesMemberus-gaap:FairValueMeasurementsRecurringMemberus-gaap:FairValueInputsLevel1Member2020-12-310000890926us-gaap:FixedMaturitiesMemberus-gaap:ForeignGovernmentDebtSecuritiesMemberus-gaap:FairValueMeasurementsRecurringMemberus-gaap:FairValueInputsLevel2Member2020-12-310000890926us-gaap:FixedMaturitiesMemberus-gaap:ForeignGovernmentDebtSecuritiesMemberus-gaap:FairValueMeasurementsRecurringMemberus-gaap:FairValueInputsLevel3Member2020-12-310000890926us-gaap:FixedMaturitiesMemberus-gaap:ForeignGovernmentDebtSecuritiesMemberus-gaap:FairValueMeasurementsRecurringMember2020-12-310000890926us-gaap:FixedMaturitiesMemberus-gaap:FairValueMeasurementsRecurringMemberus-gaap:FairValueInputsLevel1Member2020-12-310000890926us-gaap:FixedMaturitiesMemberus-gaap:FairValueMeasurementsRecurringMemberus-gaap:FairValueInputsLevel2Member2020-12-310000890926us-gaap:FixedMaturitiesMemberus-gaap:FairValueMeasurementsRecurringMemberus-gaap:FairValueInputsLevel3Member2020-12-310000890926us-gaap:FixedMaturitiesMemberus-gaap:FairValueMeasurementsRecurringMember2020-12-310000890926rdn:TradingSecuritiesMemberus-gaap:FairValueMeasurementsRecurringMemberus-gaap:FairValueInputsLevel1Memberus-gaap:USStatesAndPoliticalSubdivisionsMember2020-12-310000890926rdn:TradingSecuritiesMemberus-gaap:FairValueMeasurementsRecurringMemberus-gaap:FairValueInputsLevel2Memberus-gaap:USStatesAndPoliticalSubdivisionsMember2020-12-310000890926rdn:TradingSecuritiesMemberus-gaap:FairValueMeasurementsRecurringMemberus-gaap:FairValueInputsLevel3Memberus-gaap:USStatesAndPoliticalSubdivisionsMember2020-12-310000890926rdn:TradingSecuritiesMemberus-gaap:FairValueMeasurementsRecurringMemberus-gaap:USStatesAndPoliticalSubdivisionsMember2020-12-310000890926rdn:TradingSecuritiesMemberus-gaap:CorporateDebtSecuritiesMemberus-gaap:FairValueMeasurementsRecurringMemberus-gaap:FairValueInputsLevel1Member2020-12-310000890926rdn:TradingSecuritiesMemberus-gaap:CorporateDebtSecuritiesMemberus-gaap:FairValueMeasurementsRecurringMemberus-gaap:FairValueInputsLevel2Member2020-12-310000890926rdn:TradingSecuritiesMemberus-gaap:CorporateDebtSecuritiesMemberus-gaap:FairValueMeasurementsRecurringMemberus-gaap:FairValueInputsLevel3Member2020-12-310000890926rdn:TradingSecuritiesMemberus-gaap:CorporateDebtSecuritiesMemberus-gaap:FairValueMeasurementsRecurringMember2020-12-310000890926rdn:TradingSecuritiesMemberus-gaap:ResidentialMortgageBackedSecuritiesMemberus-gaap:FairValueMeasurementsRecurringMemberus-gaap:FairValueInputsLevel1Member2020-12-310000890926rdn:TradingSecuritiesMemberus-gaap:ResidentialMortgageBackedSecuritiesMemberus-gaap:FairValueMeasurementsRecurringMemberus-gaap:FairValueInputsLevel2Member2020-12-310000890926rdn:TradingSecuritiesMemberus-gaap:ResidentialMortgageBackedSecuritiesMemberus-gaap:FairValueMeasurementsRecurringMemberus-gaap:FairValueInputsLevel3Member2020-12-310000890926rdn:TradingSecuritiesMemberus-gaap:ResidentialMortgageBackedSecuritiesMemberus-gaap:FairValueMeasurementsRecurringMember2020-12-310000890926rdn:TradingSecuritiesMemberus-gaap:CommercialMortgageBackedSecuritiesMemberus-gaap:FairValueMeasurementsRecurringMemberus-gaap:FairValueInputsLevel1Member2020-12-310000890926rdn:TradingSecuritiesMemberus-gaap:CommercialMortgageBackedSecuritiesMemberus-gaap:FairValueMeasurementsRecurringMemberus-gaap:FairValueInputsLevel2Member2020-12-310000890926rdn:TradingSecuritiesMemberus-gaap:CommercialMortgageBackedSecuritiesMemberus-gaap:FairValueMeasurementsRecurringMemberus-gaap:FairValueInputsLevel3Member2020-12-310000890926rdn:TradingSecuritiesMemberus-gaap:CommercialMortgageBackedSecuritiesMemberus-gaap:FairValueMeasurementsRecurringMember2020-12-310000890926rdn:TradingSecuritiesMemberus-gaap:FairValueMeasurementsRecurringMemberus-gaap:FairValueInputsLevel1Member2020-12-310000890926rdn:TradingSecuritiesMemberus-gaap:FairValueMeasurementsRecurringMemberus-gaap:FairValueInputsLevel2Member2020-12-310000890926rdn:TradingSecuritiesMemberus-gaap:FairValueMeasurementsRecurringMemberus-gaap:FairValueInputsLevel3Member2020-12-310000890926rdn:TradingSecuritiesMemberus-gaap:FairValueMeasurementsRecurringMember2020-12-310000890926us-gaap:FairValueMeasurementsRecurringMemberus-gaap:EquitySecuritiesMemberus-gaap:FairValueInputsLevel1Member2020-12-310000890926us-gaap:FairValueMeasurementsRecurringMemberus-gaap:EquitySecuritiesMemberus-gaap:FairValueInputsLevel2Member2020-12-310000890926us-gaap:FairValueMeasurementsRecurringMemberus-gaap:FairValueInputsLevel3Memberus-gaap:EquitySecuritiesMember2020-12-310000890926us-gaap:FairValueMeasurementsRecurringMemberus-gaap:EquitySecuritiesMember2020-12-310000890926us-gaap:FairValueMeasurementsRecurringMemberus-gaap:ShortTermInvestmentsMemberus-gaap:FairValueInputsLevel1Memberus-gaap:USStatesAndPoliticalSubdivisionsMember2020-12-310000890926us-gaap:FairValueMeasurementsRecurringMemberus-gaap:ShortTermInvestmentsMemberus-gaap:FairValueInputsLevel2Memberus-gaap:USStatesAndPoliticalSubdivisionsMember2020-12-310000890926us-gaap:FairValueMeasurementsRecurringMemberus-gaap:FairValueInputsLevel3Memberus-gaap:ShortTermInvestmentsMemberus-gaap:USStatesAndPoliticalSubdivisionsMember2020-12-310000890926us-gaap:FairValueMeasurementsRecurringMemberus-gaap:ShortTermInvestmentsMemberus-gaap:USStatesAndPoliticalSubdivisionsMember2020-12-310000890926us-gaap:MoneyMarketFundsMemberus-gaap:FairValueMeasurementsRecurringMemberus-gaap:ShortTermInvestmentsMemberus-gaap:FairValueInputsLevel1Member2020-12-310000890926us-gaap:MoneyMarketFundsMemberus-gaap:FairValueMeasurementsRecurringMemberus-gaap:ShortTermInvestmentsMemberus-gaap:FairValueInputsLevel2Member2020-12-310000890926us-gaap:MoneyMarketFundsMemberus-gaap:FairValueMeasurementsRecurringMemberus-gaap:FairValueInputsLevel3Memberus-gaap:ShortTermInvestmentsMember2020-12-310000890926us-gaap:MoneyMarketFundsMemberus-gaap:FairValueMeasurementsRecurringMemberus-gaap:ShortTermInvestmentsMember2020-12-310000890926us-gaap:CorporateDebtSecuritiesMemberus-gaap:FairValueMeasurementsRecurringMemberus-gaap:ShortTermInvestmentsMemberus-gaap:FairValueInputsLevel1Member2020-12-310000890926us-gaap:CorporateDebtSecuritiesMemberus-gaap:FairValueMeasurementsRecurringMemberus-gaap:ShortTermInvestmentsMemberus-gaap:FairValueInputsLevel2Member2020-12-310000890926us-gaap:CorporateDebtSecuritiesMemberus-gaap:FairValueMeasurementsRecurringMemberus-gaap:FairValueInputsLevel3Memberus-gaap:ShortTermInvestmentsMember2020-12-310000890926us-gaap:CorporateDebtSecuritiesMemberus-gaap:FairValueMeasurementsRecurringMemberus-gaap:ShortTermInvestmentsMember2020-12-310000890926us-gaap:AssetBackedSecuritiesMemberus-gaap:FairValueMeasurementsRecurringMemberus-gaap:ShortTermInvestmentsMemberus-gaap:FairValueInputsLevel1Member2020-12-310000890926us-gaap:AssetBackedSecuritiesMemberus-gaap:FairValueMeasurementsRecurringMemberus-gaap:ShortTermInvestmentsMemberus-gaap:FairValueInputsLevel2Member2020-12-310000890926us-gaap:AssetBackedSecuritiesMemberus-gaap:FairValueMeasurementsRecurringMemberus-gaap:FairValueInputsLevel3Memberus-gaap:ShortTermInvestmentsMember2020-12-310000890926us-gaap:AssetBackedSecuritiesMemberus-gaap:FairValueMeasurementsRecurringMemberus-gaap:ShortTermInvestmentsMember2020-12-310000890926us-gaap:OtherInvestmentsMemberus-gaap:FairValueMeasurementsRecurringMemberus-gaap:ShortTermInvestmentsMemberus-gaap:FairValueInputsLevel1Member2020-12-310000890926us-gaap:OtherInvestmentsMemberus-gaap:FairValueMeasurementsRecurringMemberus-gaap:ShortTermInvestmentsMemberus-gaap:FairValueInputsLevel2Member2020-12-310000890926us-gaap:OtherInvestmentsMemberus-gaap:FairValueMeasurementsRecurringMemberus-gaap:FairValueInputsLevel3Memberus-gaap:ShortTermInvestmentsMember2020-12-310000890926us-gaap:OtherInvestmentsMemberus-gaap:FairValueMeasurementsRecurringMemberus-gaap:ShortTermInvestmentsMember2020-12-310000890926us-gaap:FairValueMeasurementsRecurringMemberus-gaap:ShortTermInvestmentsMemberus-gaap:FairValueInputsLevel1Member2020-12-310000890926us-gaap:FairValueMeasurementsRecurringMemberus-gaap:ShortTermInvestmentsMemberus-gaap:FairValueInputsLevel2Member2020-12-310000890926us-gaap:FairValueMeasurementsRecurringMemberus-gaap:FairValueInputsLevel3Memberus-gaap:ShortTermInvestmentsMember2020-12-310000890926us-gaap:FairValueMeasurementsRecurringMemberus-gaap:ShortTermInvestmentsMember2020-12-310000890926us-gaap:OtherInvestmentsMemberus-gaap:FairValueMeasurementsRecurringMemberus-gaap:FairValueInputsLevel1Member2020-12-310000890926us-gaap:OtherInvestmentsMemberus-gaap:FairValueMeasurementsRecurringMemberus-gaap:FairValueInputsLevel2Member2020-12-310000890926us-gaap:OtherInvestmentsMemberus-gaap:FairValueMeasurementsRecurringMemberus-gaap:FairValueInputsLevel3Member2020-12-310000890926us-gaap:OtherInvestmentsMemberus-gaap:FairValueMeasurementsRecurringMember2020-12-310000890926us-gaap:FairValueMeasurementsRecurringMemberus-gaap:FairValueInputsLevel1Member2020-12-310000890926us-gaap:FairValueMeasurementsRecurringMemberus-gaap:FairValueInputsLevel2Member2020-12-310000890926us-gaap:FairValueMeasurementsRecurringMemberus-gaap:FairValueInputsLevel3Member2020-12-310000890926us-gaap:FairValueMeasurementsRecurringMember2020-12-310000890926us-gaap:USTreasuryAndGovernmentMemberus-gaap:FairValueMeasurementsRecurringMemberus-gaap:SecuritiesFinancingTransactionFairValueMemberus-gaap:FairValueInputsLevel1Member2020-12-310000890926us-gaap:USTreasuryAndGovernmentMemberus-gaap:FairValueMeasurementsRecurringMemberus-gaap:SecuritiesFinancingTransactionFairValueMemberus-gaap:FairValueInputsLevel2Member2020-12-310000890926us-gaap:USTreasuryAndGovernmentMemberus-gaap:FairValueMeasurementsRecurringMemberus-gaap:SecuritiesFinancingTransactionFairValueMemberus-gaap:FairValueInputsLevel3Member2020-12-310000890926us-gaap:USTreasuryAndGovernmentMemberus-gaap:FairValueMeasurementsRecurringMemberus-gaap:SecuritiesFinancingTransactionFairValueMember2020-12-310000890926us-gaap:CorporateDebtSecuritiesMemberus-gaap:FairValueMeasurementsRecurringMemberus-gaap:SecuritiesFinancingTransactionFairValueMemberus-gaap:FairValueInputsLevel1Member2020-12-310000890926us-gaap:CorporateDebtSecuritiesMemberus-gaap:FairValueMeasurementsRecurringMemberus-gaap:SecuritiesFinancingTransactionFairValueMemberus-gaap:FairValueInputsLevel2Member2020-12-310000890926us-gaap:CorporateDebtSecuritiesMemberus-gaap:FairValueMeasurementsRecurringMemberus-gaap:SecuritiesFinancingTransactionFairValueMemberus-gaap:FairValueInputsLevel3Member2020-12-310000890926us-gaap:CorporateDebtSecuritiesMemberus-gaap:FairValueMeasurementsRecurringMemberus-gaap:SecuritiesFinancingTransactionFairValueMember2020-12-310000890926us-gaap:FairValueMeasurementsRecurringMemberus-gaap:SecuritiesFinancingTransactionFairValueMemberus-gaap:FairValueInputsLevel1Memberus-gaap:EquitySecuritiesMember2020-12-310000890926us-gaap:FairValueMeasurementsRecurringMemberus-gaap:SecuritiesFinancingTransactionFairValueMemberus-gaap:EquitySecuritiesMemberus-gaap:FairValueInputsLevel2Member2020-12-310000890926us-gaap:FairValueMeasurementsRecurringMemberus-gaap:SecuritiesFinancingTransactionFairValueMemberus-gaap:FairValueInputsLevel3Memberus-gaap:EquitySecuritiesMember2020-12-310000890926us-gaap:FairValueMeasurementsRecurringMemberus-gaap:SecuritiesFinancingTransactionFairValueMemberus-gaap:EquitySecuritiesMember2020-12-310000890926us-gaap:CarryingReportedAmountFairValueDisclosureMembersrt:PartnershipInterestMember2020-12-310000890926us-gaap:FairValueMeasurementsRecurringMemberus-gaap:FairValueInputsLevel3Member2020-01-012020-12-310000890926us-gaap:FairValueMeasurementsRecurringMemberus-gaap:FairValueInputsLevel3Member2021-01-012021-12-310000890926us-gaap:CarryingReportedAmountFairValueDisclosureMember2021-12-310000890926us-gaap:EstimateOfFairValueFairValueDisclosureMember2021-12-310000890926us-gaap:CarryingReportedAmountFairValueDisclosureMember2020-12-310000890926us-gaap:EstimateOfFairValueFairValueDisclosureMember2020-12-310000890926us-gaap:FixedMaturitiesMemberus-gaap:USGovernmentAgenciesDebtSecuritiesMember2021-12-310000890926us-gaap:FixedMaturitiesMemberus-gaap:USStatesAndPoliticalSubdivisionsMember2021-12-310000890926us-gaap:FixedMaturitiesMemberus-gaap:CorporateDebtSecuritiesMember2021-12-310000890926us-gaap:FixedMaturitiesMemberus-gaap:ResidentialMortgageBackedSecuritiesMember2021-12-310000890926us-gaap:FixedMaturitiesMemberus-gaap:CommercialMortgageBackedSecuritiesMember2021-12-310000890926us-gaap:FixedMaturitiesMemberus-gaap:CollateralizedLoanObligationsMember2021-12-310000890926us-gaap:AssetBackedSecuritiesMemberus-gaap:FixedMaturitiesMember2021-12-310000890926us-gaap:FixedMaturitiesMemberus-gaap:ForeignGovernmentDebtSecuritiesMember2021-12-310000890926us-gaap:FixedMaturitiesMemberrdn:MortgageInsuranceLinkedNotesMember2021-12-310000890926us-gaap:DebtSecuritiesMemberus-gaap:FixedMaturitiesMember2021-12-310000890926us-gaap:DebtSecuritiesMemberus-gaap:FixedMaturitiesMemberus-gaap:SecuritiesFinancingTransactionCostMember2021-12-310000890926us-gaap:DebtSecuritiesMemberus-gaap:FixedMaturitiesMemberus-gaap:SecuritiesFinancingTransactionFairValueMember2021-12-310000890926us-gaap:FixedMaturitiesMemberus-gaap:USGovernmentAgenciesDebtSecuritiesMember2020-12-310000890926us-gaap:FixedMaturitiesMemberus-gaap:USStatesAndPoliticalSubdivisionsMember2020-12-310000890926us-gaap:FixedMaturitiesMemberus-gaap:CorporateDebtSecuritiesMember2020-12-310000890926us-gaap:FixedMaturitiesMemberus-gaap:ResidentialMortgageBackedSecuritiesMember2020-12-310000890926us-gaap:FixedMaturitiesMemberus-gaap:CommercialMortgageBackedSecuritiesMember2020-12-310000890926us-gaap:FixedMaturitiesMemberus-gaap:CollateralizedLoanObligationsMember2020-12-310000890926us-gaap:AssetBackedSecuritiesMemberus-gaap:FixedMaturitiesMember2020-12-310000890926us-gaap:FixedMaturitiesMemberus-gaap:ForeignGovernmentDebtSecuritiesMember2020-12-310000890926us-gaap:DebtSecuritiesMemberus-gaap:FixedMaturitiesMember2020-12-310000890926us-gaap:DebtSecuritiesMemberus-gaap:FixedMaturitiesMemberus-gaap:SecuritiesFinancingTransactionCostMember2020-12-310000890926us-gaap:DebtSecuritiesMemberus-gaap:FixedMaturitiesMemberus-gaap:SecuritiesFinancingTransactionFairValueMember2020-12-310000890926us-gaap:FixedMaturitiesMemberus-gaap:CorporateDebtSecuritiesMember2019-12-310000890926us-gaap:FixedMaturitiesMemberus-gaap:CorporateDebtSecuritiesMember2021-01-012021-12-310000890926us-gaap:FixedMaturitiesMemberus-gaap:CorporateDebtSecuritiesMember2020-01-012020-12-310000890926us-gaap:USGovernmentAgenciesDebtSecuritiesMember2021-12-31rdn:security0000890926us-gaap:USStatesAndPoliticalSubdivisionsMember2021-12-310000890926us-gaap:CorporateDebtSecuritiesMember2021-12-310000890926us-gaap:ResidentialMortgageBackedSecuritiesMember2021-12-310000890926us-gaap:CommercialMortgageBackedSecuritiesMember2021-12-310000890926us-gaap:CollateralizedLoanObligationsMember2021-12-310000890926us-gaap:AssetBackedSecuritiesMember2021-12-310000890926us-gaap:USGovernmentAgenciesDebtSecuritiesMember2020-12-310000890926us-gaap:USStatesAndPoliticalSubdivisionsMember2020-12-310000890926us-gaap:CorporateDebtSecuritiesMember2020-12-310000890926us-gaap:ResidentialMortgageBackedSecuritiesMember2020-12-310000890926us-gaap:CommercialMortgageBackedSecuritiesMember2020-12-310000890926us-gaap:CollateralizedLoanObligationsMember2020-12-310000890926us-gaap:AssetBackedSecuritiesMember2020-12-310000890926us-gaap:ForeignGovernmentDebtSecuritiesMember2021-01-012021-12-310000890926us-gaap:SecuritiesFinancingTransactionFairValueMember2021-01-012021-12-310000890926us-gaap:SecuritiesFinancingTransactionFairValueMember2021-12-310000890926us-gaap:SecuritiesFinancingTransactionFairValueMember2020-12-310000890926us-gaap:FixedMaturitiesMember2021-01-012021-12-310000890926us-gaap:FixedMaturitiesMember2020-01-012020-12-310000890926us-gaap:FixedMaturitiesMember2019-01-012019-12-310000890926us-gaap:EquitySecuritiesMember2021-01-012021-12-310000890926us-gaap:EquitySecuritiesMember2020-01-012020-12-310000890926us-gaap:EquitySecuritiesMember2019-01-012019-12-310000890926us-gaap:ShortTermInvestmentsMember2021-01-012021-12-310000890926us-gaap:ShortTermInvestmentsMember2020-01-012020-12-310000890926us-gaap:ShortTermInvestmentsMember2019-01-012019-12-310000890926us-gaap:OtherAggregatedInvestmentsMember2021-01-012021-12-310000890926us-gaap:OtherAggregatedInvestmentsMember2020-01-012020-12-310000890926us-gaap:OtherAggregatedInvestmentsMember2019-01-012019-12-310000890926rdn:TradingSecuritiesMember2021-01-012021-12-310000890926rdn:TradingSecuritiesMember2020-01-012020-12-310000890926rdn:TradingSecuritiesMember2019-01-012019-12-310000890926us-gaap:OtherInvestmentsMember2021-01-012021-12-310000890926us-gaap:OtherInvestmentsMember2020-01-012020-12-310000890926us-gaap:OtherInvestmentsMember2019-01-012019-12-310000890926us-gaap:FixedMaturitiesMemberrdn:NonAssetBackedSecurityInvestmentsContractualMaturitiesMember2021-12-310000890926us-gaap:FixedMaturitiesMemberrdn:AssetBackedAndOtherMortgageBackedSecuritiesMember2021-12-310000890926us-gaap:CustomerRelationshipsMemberrdn:RealEstateSegmentMember2021-12-310000890926us-gaap:CustomerRelationshipsMemberrdn:RealEstateSegmentMember2020-12-310000890926us-gaap:TechnologyBasedIntangibleAssetsMemberrdn:RealEstateSegmentMember2021-12-310000890926us-gaap:TechnologyBasedIntangibleAssetsMemberrdn:RealEstateSegmentMember2020-12-310000890926rdn:RealEstateSegmentMemberus-gaap:LicensingAgreementsMember2021-12-310000890926rdn:RealEstateSegmentMemberus-gaap:LicensingAgreementsMember2020-12-310000890926us-gaap:OtherIntangibleAssetsMember2021-01-012021-12-310000890926us-gaap:CustomerRelationshipsMember2020-01-012020-12-310000890926us-gaap:TechnologyBasedIntangibleAssetsMember2020-01-012020-12-310000890926rdn:HomegeniusSegmentMember2021-01-012021-12-310000890926rdn:HomegeniusSegmentMember2020-01-012020-12-310000890926rdn:HomegeniusSegmentMember2019-01-012019-12-310000890926rdn:RadianGuarantyMemberrdn:A2020SinglePremiumQSRMemberus-gaap:SalesRevenueNetMemberus-gaap:ProductConcentrationRiskMember2020-01-012020-01-310000890926rdn:RadianGuarantyMemberus-gaap:SalesRevenueNetMemberus-gaap:ProductConcentrationRiskMemberrdn:A2018SinglePremiumQSRMember2017-10-012017-10-310000890926rdn:RadianGuarantyMemberrdn:A2016SinglePremiumQSRTransactionMemberus-gaap:SalesRevenueNetMemberus-gaap:ProductConcentrationRiskMember2012-01-012013-03-310000890926rdn:RadianGuarantyMemberrdn:A2016SinglePremiumQSRTransactionMemberus-gaap:SalesRevenueNetMemberus-gaap:ProductConcentrationRiskMember2017-12-312017-12-310000890926rdn:RadianGuarantyMemberrdn:A2020SinglePremiumQSRMember2020-01-012020-01-310000890926rdn:RadianGuarantyMemberrdn:A2018SinglePremiumQSRMember2017-10-012017-10-310000890926rdn:RadianGuarantyMemberrdn:A2016SinglePremiumQSRTransactionMember2020-01-012020-12-310000890926rdn:RadianGuarantyMembersrt:MaximumMemberrdn:A2020SinglePremiumQSRMember2020-01-012020-01-310000890926rdn:RadianGuarantyMembersrt:MaximumMemberrdn:A2018SinglePremiumQSRMember2017-10-012017-10-310000890926rdn:RadianGuarantyMembersrt:MaximumMemberrdn:A2016SinglePremiumQSRTransactionMember2020-01-012020-12-310000890926rdn:RadianGuarantyMemberrdn:A2020SinglePremiumQSRMember2021-12-310000890926rdn:RadianGuarantyMemberrdn:A2018SinglePremiumQSRMember2021-12-310000890926rdn:RadianGuarantyMemberrdn:A2016SinglePremiumQSRTransactionMember2021-12-310000890926rdn:RadianGuarantyMemberrdn:A2020SinglePremiumQSRMember2020-12-310000890926rdn:RadianGuarantyMemberrdn:A2018SinglePremiumQSRMember2020-12-310000890926rdn:RadianGuarantyMemberrdn:A2016SinglePremiumQSRTransactionMember2020-12-310000890926rdn:RadianGuarantyMemberrdn:A2016SinglePremiumQSRTransactionMemberus-gaap:SalesRevenueNetMemberus-gaap:ProductConcentrationRiskMember2015-01-012017-12-310000890926rdn:RadianGuarantyMemberrdn:A2016SinglePremiumQSRTransactionMemberus-gaap:SalesRevenueNetMemberus-gaap:ProductConcentrationRiskMember2013-04-012015-12-310000890926rdn:RadianGuarantyMemberrdn:MortgageInsuranceSegmentMember2021-12-31rdn:reinsuranceArrangement0000890926rdn:RadianGuarantyMemberrdn:MortgageInsuranceSegmentMembersrt:MinimumMember2021-01-012021-12-310000890926rdn:RadianGuarantyMemberrdn:MortgageInsuranceSegmentMembersrt:MaximumMember2021-01-012021-12-310000890926rdn:RadianGuarantyMemberrdn:MortgageInsuranceSegmentMemberrdn:EagleRe20212PrimaryMemberrdn:ExcessofLossProgramMember2021-11-300000890926rdn:RadianGuarantyMemberrdn:MortgageInsuranceSegmentMemberrdn:EagleRe20211PrimaryMemberrdn:ExcessofLossProgramMember2021-04-300000890926rdn:RadianGuarantyMemberrdn:MortgageInsuranceSegmentMemberrdn:EagleRe20202PrimaryMemberrdn:ExcessofLossProgramMember2020-10-310000890926rdn:RadianGuarantyMemberrdn:MortgageInsuranceSegmentMemberrdn:EagleRe20201PrimaryMemberrdn:ExcessofLossProgramMember2020-02-290000890926rdn:RadianGuarantyMemberrdn:EagleRe20191PrimaryMemberrdn:MortgageInsuranceSegmentMemberrdn:ExcessofLossProgramMember2019-04-300000890926rdn:RadianGuarantyMemberrdn:MortgageInsuranceSegmentMemberrdn:EagleRe20181PrimaryMemberrdn:ExcessofLossProgramMember2018-11-300000890926rdn:RadianGuarantyMemberrdn:MortgageInsuranceSegmentMemberrdn:EagleRe20212PrimaryMemberrdn:ExcessofLossProgramMember2021-11-012021-11-300000890926rdn:RadianGuarantyMemberrdn:MortgageInsuranceSegmentMemberrdn:EagleRe20211PrimaryMemberrdn:ExcessofLossProgramMember2021-04-012021-04-300000890926rdn:RadianGuarantyMemberrdn:MortgageInsuranceSegmentMemberrdn:EagleRe20202PrimaryMemberrdn:ExcessofLossProgramMember2020-10-012020-10-310000890926rdn:RadianGuarantyMemberrdn:MortgageInsuranceSegmentMemberrdn:EagleRe20201PrimaryMemberrdn:ExcessofLossProgramMember2020-02-012020-02-290000890926rdn:RadianGuarantyMemberrdn:EagleRe20191PrimaryMemberrdn:MortgageInsuranceSegmentMemberrdn:ExcessofLossProgramMember2019-04-012019-04-300000890926rdn:RadianGuarantyMemberrdn:MortgageInsuranceSegmentMemberrdn:EagleRe20181PrimaryMemberrdn:ExcessofLossProgramMember2018-11-012018-11-300000890926rdn:RadianGuarantyMemberrdn:MortgageInsuranceSegmentMemberrdn:EagleRe20212PrimaryMemberrdn:XOLFirstLayerMemberrdn:ExcessofLossProgramMember2021-11-012021-11-300000890926rdn:RadianGuarantyMemberrdn:MortgageInsuranceSegmentMemberrdn:XOLFirstLayerMemberrdn:EagleRe20211PrimaryMemberrdn:ExcessofLossProgramMember2021-04-012021-04-300000890926rdn:RadianGuarantyMemberrdn:MortgageInsuranceSegmentMemberrdn:XOLFirstLayerMemberrdn:ExcessofLossProgramMemberrdn:EagleRe20202PrimaryMember2020-10-012020-10-310000890926rdn:RadianGuarantyMemberrdn:MortgageInsuranceSegmentMemberrdn:EagleRe20201PrimaryMemberrdn:XOLFirstLayerMemberrdn:ExcessofLossProgramMember2020-02-012020-02-290000890926rdn:RadianGuarantyMemberrdn:EagleRe20191PrimaryMemberrdn:MortgageInsuranceSegmentMemberrdn:XOLFirstLayerMemberrdn:ExcessofLossProgramMember2019-04-012019-04-300000890926rdn:RadianGuarantyMemberrdn:MortgageInsuranceSegmentMemberrdn:XOLFirstLayerMemberrdn:EagleRe20181PrimaryMemberrdn:ExcessofLossProgramMember2018-11-012018-11-300000890926rdn:RadianGuarantyMemberrdn:MortgageInsuranceSegmentMemberrdn:EagleRe20212PrimaryMemberrdn:ExcessofLossProgramMember2021-12-310000890926rdn:RadianGuarantyMemberrdn:MortgageInsuranceSegmentMemberrdn:EagleRe20211PrimaryMemberrdn:ExcessofLossProgramMember2021-12-310000890926rdn:RadianGuarantyMemberrdn:MortgageInsuranceSegmentMemberrdn:EagleRe20202PrimaryMemberrdn:ExcessofLossProgramMember2021-12-310000890926rdn:RadianGuarantyMemberrdn:MortgageInsuranceSegmentMemberrdn:EagleRe20201PrimaryMemberrdn:ExcessofLossProgramMember2021-12-310000890926rdn:RadianGuarantyMemberrdn:EagleRe20191PrimaryMemberrdn:MortgageInsuranceSegmentMemberrdn:ExcessofLossProgramMember2021-12-310000890926rdn:RadianGuarantyMemberrdn:MortgageInsuranceSegmentMemberrdn:EagleRe20181PrimaryMemberrdn:ExcessofLossProgramMember2021-12-310000890926rdn:RadianGuarantyMemberrdn:MortgageInsuranceSegmentMemberrdn:EagleRe20212PrimaryMemberrdn:ExcessofLossProgramMember2021-01-012021-12-310000890926rdn:RadianGuarantyMemberrdn:MortgageInsuranceSegmentMemberrdn:EagleRe20211PrimaryMemberrdn:ExcessofLossProgramMember2021-01-012021-12-310000890926rdn:RadianGuarantyMemberrdn:MortgageInsuranceSegmentMemberrdn:EagleRe20202PrimaryMemberrdn:ExcessofLossProgramMember2021-01-012021-12-310000890926rdn:RadianGuarantyMemberrdn:MortgageInsuranceSegmentMemberrdn:EagleRe20201PrimaryMemberrdn:ExcessofLossProgramMember2021-01-012021-12-310000890926rdn:RadianGuarantyMemberrdn:EagleRe20191PrimaryMemberrdn:MortgageInsuranceSegmentMemberrdn:ExcessofLossProgramMember2021-01-012021-12-310000890926rdn:RadianGuarantyMemberrdn:MortgageInsuranceSegmentMemberrdn:EagleRe20181PrimaryMemberrdn:ExcessofLossProgramMember2021-01-012021-12-310000890926rdn:RadianGuarantyMemberrdn:MortgageInsuranceSegmentMemberrdn:EagleRe20212PrimaryMemberrdn:XOLFirstLayerMemberrdn:ExcessofLossProgramMember2021-01-012021-12-310000890926rdn:RadianGuarantyMemberrdn:MortgageInsuranceSegmentMemberrdn:XOLFirstLayerMemberrdn:EagleRe20211PrimaryMemberrdn:ExcessofLossProgramMember2021-01-012021-12-310000890926rdn:RadianGuarantyMemberrdn:MortgageInsuranceSegmentMemberrdn:XOLFirstLayerMemberrdn:ExcessofLossProgramMemberrdn:EagleRe20202PrimaryMember2021-01-012021-12-310000890926rdn:RadianGuarantyMemberrdn:MortgageInsuranceSegmentMemberrdn:EagleRe20201PrimaryMemberrdn:XOLFirstLayerMemberrdn:ExcessofLossProgramMember2021-01-012021-12-310000890926rdn:RadianGuarantyMemberrdn:EagleRe20191PrimaryMemberrdn:MortgageInsuranceSegmentMemberrdn:XOLFirstLayerMemberrdn:ExcessofLossProgramMember2021-01-012021-12-310000890926rdn:RadianGuarantyMemberrdn:MortgageInsuranceSegmentMemberrdn:XOLFirstLayerMemberrdn:EagleRe20181PrimaryMemberrdn:ExcessofLossProgramMember2021-01-012021-12-310000890926rdn:RadianGuarantyMemberrdn:MortgageInsuranceSegmentMemberrdn:EagleRe20212PrimaryMemberrdn:ExcessofLossProgramMember2020-12-310000890926rdn:RadianGuarantyMemberrdn:MortgageInsuranceSegmentMemberrdn:EagleRe20211PrimaryMemberrdn:ExcessofLossProgramMember2020-12-310000890926rdn:RadianGuarantyMemberrdn:MortgageInsuranceSegmentMemberrdn:EagleRe20202PrimaryMemberrdn:ExcessofLossProgramMember2020-12-310000890926rdn:RadianGuarantyMemberrdn:MortgageInsuranceSegmentMemberrdn:EagleRe20201PrimaryMemberrdn:ExcessofLossProgramMember2020-12-310000890926rdn:RadianGuarantyMemberrdn:EagleRe20191PrimaryMemberrdn:MortgageInsuranceSegmentMemberrdn:ExcessofLossProgramMember2020-12-310000890926rdn:RadianGuarantyMemberrdn:MortgageInsuranceSegmentMemberrdn:EagleRe20181PrimaryMemberrdn:ExcessofLossProgramMember2020-12-310000890926rdn:RadianGuarantyMemberrdn:MortgageInsuranceSegmentMemberrdn:EagleRe20212PrimaryMemberrdn:ExcessofLossProgramMember2020-01-012020-12-310000890926rdn:RadianGuarantyMemberrdn:MortgageInsuranceSegmentMemberrdn:EagleRe20211PrimaryMemberrdn:ExcessofLossProgramMember2020-01-012020-12-310000890926rdn:RadianGuarantyMemberrdn:MortgageInsuranceSegmentMemberrdn:EagleRe20202PrimaryMemberrdn:ExcessofLossProgramMember2020-01-012020-12-310000890926rdn:RadianGuarantyMemberrdn:MortgageInsuranceSegmentMemberrdn:EagleRe20201PrimaryMemberrdn:ExcessofLossProgramMember2020-01-012020-12-310000890926rdn:RadianGuarantyMemberrdn:EagleRe20191PrimaryMemberrdn:MortgageInsuranceSegmentMemberrdn:ExcessofLossProgramMember2020-01-012020-12-310000890926rdn:RadianGuarantyMemberrdn:MortgageInsuranceSegmentMemberrdn:EagleRe20181PrimaryMemberrdn:ExcessofLossProgramMember2020-01-012020-12-310000890926rdn:RadianGuarantyMemberrdn:MortgageInsuranceSegmentMemberrdn:EagleRe20212PrimaryMemberrdn:XOLFirstLayerMemberrdn:ExcessofLossProgramMember2020-01-012020-12-310000890926rdn:RadianGuarantyMemberrdn:MortgageInsuranceSegmentMemberrdn:XOLFirstLayerMemberrdn:EagleRe20211PrimaryMemberrdn:ExcessofLossProgramMember2020-01-012020-12-310000890926rdn:RadianGuarantyMemberrdn:MortgageInsuranceSegmentMemberrdn:XOLFirstLayerMemberrdn:ExcessofLossProgramMemberrdn:EagleRe20202PrimaryMember2020-01-012020-12-310000890926rdn:RadianGuarantyMemberrdn:MortgageInsuranceSegmentMemberrdn:EagleRe20201PrimaryMemberrdn:XOLFirstLayerMemberrdn:ExcessofLossProgramMember2020-01-012020-12-310000890926rdn:RadianGuarantyMemberrdn:EagleRe20191PrimaryMemberrdn:MortgageInsuranceSegmentMemberrdn:XOLFirstLayerMemberrdn:ExcessofLossProgramMember2020-01-012020-12-310000890926rdn:RadianGuarantyMemberrdn:MortgageInsuranceSegmentMemberrdn:XOLFirstLayerMemberrdn:EagleRe20181PrimaryMemberrdn:ExcessofLossProgramMember2020-01-012020-12-310000890926rdn:RadianGuarantyMemberrdn:RadianGroupInc.Memberrdn:EagleRe20211PrimaryMemberrdn:ExcessofLossProgramMember2021-04-012021-04-300000890926rdn:RadianGuarantyMemberrdn:MortgageInsuranceSegmentMemberrdn:SeparateThirdPartyReinsurerMemberrdn:ExcessofLossProgramMember2018-11-012018-11-300000890926us-gaap:VariableInterestEntityPrimaryBeneficiaryMemberrdn:RadianGuarantyMemberrdn:MortgageInsuranceSegmentMemberrdn:EagleRe20212PrimaryMemberrdn:ExcessofLossProgramMember2021-12-310000890926us-gaap:VariableInterestEntityPrimaryBeneficiaryMemberrdn:RadianGuarantyMemberrdn:MortgageInsuranceSegmentMemberrdn:EagleRe20212PrimaryMemberrdn:ExcessofLossProgramMember2020-12-310000890926us-gaap:VariableInterestEntityPrimaryBeneficiaryMemberrdn:RadianGuarantyMemberrdn:MortgageInsuranceSegmentMemberrdn:EagleRe20211PrimaryMemberrdn:ExcessofLossProgramMember2021-12-310000890926us-gaap:VariableInterestEntityPrimaryBeneficiaryMemberrdn:RadianGuarantyMemberrdn:MortgageInsuranceSegmentMemberrdn:EagleRe20211PrimaryMemberrdn:ExcessofLossProgramMember2020-12-310000890926us-gaap:VariableInterestEntityPrimaryBeneficiaryMemberrdn:RadianGuarantyMemberrdn:MortgageInsuranceSegmentMemberrdn:ExcessofLossProgramMemberrdn:EagleRe20202PrimaryMember2021-12-310000890926us-gaap:VariableInterestEntityPrimaryBeneficiaryMemberrdn:RadianGuarantyMemberrdn:MortgageInsuranceSegmentMemberrdn:ExcessofLossProgramMemberrdn:EagleRe20202PrimaryMember2020-12-310000890926us-gaap:VariableInterestEntityPrimaryBeneficiaryMemberrdn:RadianGuarantyMemberrdn:MortgageInsuranceSegmentMemberrdn:EagleRe20201PrimaryMemberrdn:ExcessofLossProgramMember2021-12-310000890926us-gaap:VariableInterestEntityPrimaryBeneficiaryMemberrdn:RadianGuarantyMemberrdn:MortgageInsuranceSegmentMemberrdn:EagleRe20201PrimaryMemberrdn:ExcessofLossProgramMember2020-12-310000890926us-gaap:VariableInterestEntityPrimaryBeneficiaryMemberrdn:RadianGuarantyMemberrdn:EagleRe20191PrimaryMemberrdn:MortgageInsuranceSegmentMemberrdn:ExcessofLossProgramMember2021-12-310000890926us-gaap:VariableInterestEntityPrimaryBeneficiaryMemberrdn:RadianGuarantyMemberrdn:EagleRe20191PrimaryMemberrdn:MortgageInsuranceSegmentMemberrdn:ExcessofLossProgramMember2020-12-310000890926us-gaap:VariableInterestEntityPrimaryBeneficiaryMemberrdn:RadianGuarantyMemberrdn:MortgageInsuranceSegmentMemberrdn:EagleRe20181PrimaryMemberrdn:ExcessofLossProgramMember2021-12-310000890926us-gaap:VariableInterestEntityPrimaryBeneficiaryMemberrdn:RadianGuarantyMemberrdn:MortgageInsuranceSegmentMemberrdn:EagleRe20181PrimaryMemberrdn:ExcessofLossProgramMember2020-12-310000890926us-gaap:VariableInterestEntityPrimaryBeneficiaryMember2021-12-310000890926us-gaap:VariableInterestEntityPrimaryBeneficiaryMember2020-12-310000890926rdn:RadianGuarantyMemberrdn:QuotaShareReinsuranceTransactionsMember2021-12-310000890926rdn:RadianGuarantyMemberrdn:QuotaShareReinsuranceTransactionsMember2020-12-3100008909262021-04-012021-06-30rdn:default0000890926rdn:CorporateHeadquartersMember2021-12-310000890926us-gaap:USTreasurySecuritiesMember2021-12-310000890926rdn:InterestAndPenaltiesMember2021-12-310000890926rdn:MortgageandRealEstateServicesSegmentMember2021-12-310000890926rdn:MortgageandRealEstateServicesSegmentMember2020-12-310000890926rdn:PrimaryCaseReservesMemberrdn:MortgageInsuranceSegmentMemberrdn:FirstLienMortgageInsuranceProductsMember2020-12-310000890926rdn:MortgageInsuranceSegmentMember2019-12-310000890926rdn:MortgageInsuranceSegmentMember2018-12-310000890926rdn:PrimaryMortgageProductMemberrdn:MortgageInsuranceSegmentMember2021-01-012021-12-310000890926rdn:PrimaryMortgageProductMemberrdn:MortgageInsuranceSegmentMember2020-01-012020-12-310000890926rdn:PrimaryMortgageProductMemberrdn:MortgageInsuranceSegmentMember2019-01-012019-12-310000890926rdn:PrimaryMortgageProductMemberrdn:MortgageInsuranceSegmentMember2021-12-310000890926rdn:PrimaryMortgageProductMemberrdn:MortgageInsuranceSegmentMember2020-12-310000890926rdn:PrimaryMortgageProductMemberrdn:MortgageInsuranceSegmentMember2019-12-310000890926rdn:PrimaryMortgageProductMemberrdn:MortgageInsuranceSegmentMemberrdn:AgedLessThan2YearsMember2021-12-310000890926rdn:PrimaryMortgageProductMemberrdn:MortgageInsuranceSegmentMemberrdn:AgedLessThan2YearsMember2020-12-310000890926rdn:PrimaryMortgageProductMemberrdn:MortgageInsuranceSegmentMemberrdn:AgedLessThan2YearsMember2019-12-310000890926rdn:PrimaryMortgageProductMemberrdn:Aged2To5YearsMemberrdn:MortgageInsuranceSegmentMember2021-12-310000890926rdn:PrimaryMortgageProductMemberrdn:Aged2To5YearsMemberrdn:MortgageInsuranceSegmentMember2020-12-310000890926rdn:PrimaryMortgageProductMemberrdn:Aged2To5YearsMemberrdn:MortgageInsuranceSegmentMember2019-12-310000890926rdn:PrimaryMortgageProductMemberrdn:MortgageInsuranceSegmentMemberrdn:AgedGreaterThan5YearsMember2021-12-310000890926rdn:PrimaryMortgageProductMemberrdn:MortgageInsuranceSegmentMemberrdn:AgedGreaterThan5YearsMember2020-12-310000890926rdn:PrimaryMortgageProductMemberrdn:MortgageInsuranceSegmentMemberrdn:AgedGreaterThan5YearsMember2019-12-310000890926rdn:PrimaryMortgageProductMemberrdn:MortgageInsuranceSegmentMembersrt:MaximumMemberrdn:AgedLessThan2YearsMember2021-12-310000890926rdn:PrimaryMortgageProductMemberrdn:MortgageInsuranceSegmentMembersrt:MaximumMemberrdn:AgedLessThan2YearsMember2020-12-310000890926rdn:PrimaryMortgageProductMemberrdn:MortgageInsuranceSegmentMembersrt:MaximumMemberrdn:AgedLessThan2YearsMember2019-12-31rdn:state0000890926rdn:MortgageInsuranceSegmentMembersrt:MinimumMemberstpr:CArdn:PrimaryRiskInForceMemberus-gaap:GeographicConcentrationRiskMember2021-01-012021-12-310000890926rdn:MortgageInsuranceSegmentMembersrt:MinimumMemberstpr:CArdn:PrimaryRiskInForceMemberus-gaap:GeographicConcentrationRiskMember2020-01-012020-12-310000890926rdn:NewInsuranceWrittenMemberrdn:MortgageInsuranceSegmentMemberstpr:CAus-gaap:GeographicConcentrationRiskMember2021-01-012021-12-310000890926rdn:NewInsuranceWrittenMemberrdn:MortgageInsuranceSegmentMemberstpr:CAus-gaap:GeographicConcentrationRiskMember2020-01-012020-12-310000890926rdn:NewInsuranceWrittenMemberrdn:MortgageInsuranceSegmentMemberstpr:CAus-gaap:GeographicConcentrationRiskMember2019-01-012019-12-310000890926us-gaap:ShortdurationInsuranceContractsAccidentYear2012Memberus-gaap:PropertyLiabilityAndCasualtyInsuranceSegmentMember2012-12-310000890926us-gaap:ShortdurationInsuranceContractsAccidentYear2012Memberus-gaap:PropertyLiabilityAndCasualtyInsuranceSegmentMember2013-12-310000890926us-gaap:ShortdurationInsuranceContractsAccidentYear2012Memberus-gaap:PropertyLiabilityAndCasualtyInsuranceSegmentMember2014-12-310000890926us-gaap:ShortdurationInsuranceContractsAccidentYear2012Memberus-gaap:PropertyLiabilityAndCasualtyInsuranceSegmentMember2015-12-310000890926us-gaap:ShortdurationInsuranceContractsAccidentYear2012Memberus-gaap:PropertyLiabilityAndCasualtyInsuranceSegmentMember2016-12-310000890926us-gaap:ShortdurationInsuranceContractsAccidentYear2012Memberus-gaap:PropertyLiabilityAndCasualtyInsuranceSegmentMember2017-12-310000890926us-gaap:ShortdurationInsuranceContractsAccidentYear2012Memberus-gaap:PropertyLiabilityAndCasualtyInsuranceSegmentMember2018-12-310000890926us-gaap:ShortdurationInsuranceContractsAccidentYear2012Memberus-gaap:PropertyLiabilityAndCasualtyInsuranceSegmentMember2019-12-310000890926us-gaap:ShortdurationInsuranceContractsAccidentYear2012Memberus-gaap:PropertyLiabilityAndCasualtyInsuranceSegmentMember2020-12-310000890926us-gaap:ShortdurationInsuranceContractsAccidentYear2012Memberus-gaap:PropertyLiabilityAndCasualtyInsuranceSegmentMember2021-12-310000890926us-gaap:PropertyLiabilityAndCasualtyInsuranceSegmentMemberus-gaap:ShortdurationInsuranceContractsAccidentYear2013Member2013-12-310000890926us-gaap:PropertyLiabilityAndCasualtyInsuranceSegmentMemberus-gaap:ShortdurationInsuranceContractsAccidentYear2013Member2014-12-310000890926us-gaap:PropertyLiabilityAndCasualtyInsuranceSegmentMemberus-gaap:ShortdurationInsuranceContractsAccidentYear2013Member2015-12-310000890926us-gaap:PropertyLiabilityAndCasualtyInsuranceSegmentMemberus-gaap:ShortdurationInsuranceContractsAccidentYear2013Member2016-12-310000890926us-gaap:PropertyLiabilityAndCasualtyInsuranceSegmentMemberus-gaap:ShortdurationInsuranceContractsAccidentYear2013Member2017-12-310000890926us-gaap:PropertyLiabilityAndCasualtyInsuranceSegmentMemberus-gaap:ShortdurationInsuranceContractsAccidentYear2013Member2018-12-310000890926us-gaap:PropertyLiabilityAndCasualtyInsuranceSegmentMemberus-gaap:ShortdurationInsuranceContractsAccidentYear2013Member2019-12-310000890926us-gaap:PropertyLiabilityAndCasualtyInsuranceSegmentMemberus-gaap:ShortdurationInsuranceContractsAccidentYear2013Member2020-12-310000890926us-gaap:PropertyLiabilityAndCasualtyInsuranceSegmentMemberus-gaap:ShortdurationInsuranceContractsAccidentYear2013Member2021-12-310000890926us-gaap:PropertyLiabilityAndCasualtyInsuranceSegmentMemberus-gaap:ShortdurationInsuranceContractsAccidentYear2014Member2014-12-310000890926us-gaap:PropertyLiabilityAndCasualtyInsuranceSegmentMemberus-gaap:ShortdurationInsuranceContractsAccidentYear2014Member2015-12-310000890926us-gaap:PropertyLiabilityAndCasualtyInsuranceSegmentMemberus-gaap:ShortdurationInsuranceContractsAccidentYear2014Member2016-12-310000890926us-gaap:PropertyLiabilityAndCasualtyInsuranceSegmentMemberus-gaap:ShortdurationInsuranceContractsAccidentYear2014Member2017-12-310000890926us-gaap:PropertyLiabilityAndCasualtyInsuranceSegmentMemberus-gaap:ShortdurationInsuranceContractsAccidentYear2014Member2018-12-310000890926us-gaap:PropertyLiabilityAndCasualtyInsuranceSegmentMemberus-gaap:ShortdurationInsuranceContractsAccidentYear2014Member2019-12-310000890926us-gaap:PropertyLiabilityAndCasualtyInsuranceSegmentMemberus-gaap:ShortdurationInsuranceContractsAccidentYear2014Member2020-12-310000890926us-gaap:PropertyLiabilityAndCasualtyInsuranceSegmentMemberus-gaap:ShortdurationInsuranceContractsAccidentYear2014Member2021-12-310000890926us-gaap:PropertyLiabilityAndCasualtyInsuranceSegmentMemberus-gaap:ShortdurationInsuranceContractsAccidentYear2015Member2015-12-310000890926us-gaap:PropertyLiabilityAndCasualtyInsuranceSegmentMemberus-gaap:ShortdurationInsuranceContractsAccidentYear2015Member2016-12-310000890926us-gaap:PropertyLiabilityAndCasualtyInsuranceSegmentMemberus-gaap:ShortdurationInsuranceContractsAccidentYear2015Member2017-12-310000890926us-gaap:PropertyLiabilityAndCasualtyInsuranceSegmentMemberus-gaap:ShortdurationInsuranceContractsAccidentYear2015Member2018-12-310000890926us-gaap:PropertyLiabilityAndCasualtyInsuranceSegmentMemberus-gaap:ShortdurationInsuranceContractsAccidentYear2015Member2019-12-310000890926us-gaap:PropertyLiabilityAndCasualtyInsuranceSegmentMemberus-gaap:ShortdurationInsuranceContractsAccidentYear2015Member2020-12-310000890926us-gaap:PropertyLiabilityAndCasualtyInsuranceSegmentMemberus-gaap:ShortdurationInsuranceContractsAccidentYear2015Member2021-12-310000890926us-gaap:PropertyLiabilityAndCasualtyInsuranceSegmentMemberus-gaap:ShortdurationInsuranceContractsAccidentYear2016Member2016-12-310000890926us-gaap:PropertyLiabilityAndCasualtyInsuranceSegmentMemberus-gaap:ShortdurationInsuranceContractsAccidentYear2016Member2017-12-310000890926us-gaap:PropertyLiabilityAndCasualtyInsuranceSegmentMemberus-gaap:ShortdurationInsuranceContractsAccidentYear2016Member2018-12-310000890926us-gaap:PropertyLiabilityAndCasualtyInsuranceSegmentMemberus-gaap:ShortdurationInsuranceContractsAccidentYear2016Member2019-12-310000890926us-gaap:PropertyLiabilityAndCasualtyInsuranceSegmentMemberus-gaap:ShortdurationInsuranceContractsAccidentYear2016Member2020-12-310000890926us-gaap:PropertyLiabilityAndCasualtyInsuranceSegmentMemberus-gaap:ShortdurationInsuranceContractsAccidentYear2016Member2021-12-310000890926us-gaap:ShortDurationInsuranceContractsAccidentYear2017Memberus-gaap:PropertyLiabilityAndCasualtyInsuranceSegmentMember2017-12-310000890926us-gaap:ShortDurationInsuranceContractsAccidentYear2017Memberus-gaap:PropertyLiabilityAndCasualtyInsuranceSegmentMember2018-12-310000890926us-gaap:ShortDurationInsuranceContractsAccidentYear2017Memberus-gaap:PropertyLiabilityAndCasualtyInsuranceSegmentMember2019-12-310000890926us-gaap:ShortDurationInsuranceContractsAccidentYear2017Memberus-gaap:PropertyLiabilityAndCasualtyInsuranceSegmentMember2020-12-310000890926us-gaap:ShortDurationInsuranceContractsAccidentYear2017Memberus-gaap:PropertyLiabilityAndCasualtyInsuranceSegmentMember2021-12-310000890926us-gaap:ShortDurationInsuranceContractsAccidentYear2018Memberus-gaap:PropertyLiabilityAndCasualtyInsuranceSegmentMember2018-12-310000890926us-gaap:ShortDurationInsuranceContractsAccidentYear2018Memberus-gaap:PropertyLiabilityAndCasualtyInsuranceSegmentMember2019-12-310000890926us-gaap:ShortDurationInsuranceContractsAccidentYear2018Memberus-gaap:PropertyLiabilityAndCasualtyInsuranceSegmentMember2020-12-310000890926us-gaap:ShortDurationInsuranceContractsAccidentYear2018Memberus-gaap:PropertyLiabilityAndCasualtyInsuranceSegmentMember2021-12-310000890926us-gaap:PropertyLiabilityAndCasualtyInsuranceSegmentMemberus-gaap:ShortDurationInsuranceContractAccidentYear2019Member2019-12-310000890926us-gaap:PropertyLiabilityAndCasualtyInsuranceSegmentMemberus-gaap:ShortDurationInsuranceContractAccidentYear2019Member2020-12-310000890926us-gaap:PropertyLiabilityAndCasualtyInsuranceSegmentMemberus-gaap:ShortDurationInsuranceContractAccidentYear2019Member2021-12-310000890926us-gaap:PropertyLiabilityAndCasualtyInsuranceSegmentMemberus-gaap:ShortDurationInsuranceContractAccidentYear2020Member2020-12-310000890926us-gaap:PropertyLiabilityAndCasualtyInsuranceSegmentMemberus-gaap:ShortDurationInsuranceContractAccidentYear2020Member2021-12-310000890926us-gaap:PropertyLiabilityAndCasualtyInsuranceSegmentMemberus-gaap:ShortDurationInsuranceContractAccidentYear2021Member2021-12-310000890926us-gaap:PropertyLiabilityAndCasualtyInsuranceSegmentMember2021-12-310000890926rdn:ShortDurationInsuranceContractsAccidentYearPriorTo2011Memberus-gaap:PropertyLiabilityAndCasualtyInsuranceSegmentMember2021-12-310000890926rdn:MortgageInsuranceSegmentMemberus-gaap:PropertyLiabilityAndCasualtyInsuranceSegmentMember2021-12-310000890926us-gaap:SeniorNotesMemberrdn:SeniorNotesDue2024Member2021-12-310000890926us-gaap:SeniorNotesMemberrdn:SeniorNotesDue2024Member2020-12-310000890926rdn:SeniorNotesDue2025Memberus-gaap:SeniorNotesMember2021-12-310000890926rdn:SeniorNotesDue2025Memberus-gaap:SeniorNotesMember2020-12-310000890926rdn:SeniorNotesDue2027Memberus-gaap:SeniorNotesMember2021-12-310000890926rdn:SeniorNotesDue2027Memberus-gaap:SeniorNotesMember2020-12-310000890926us-gaap:SeniorNotesMember2021-12-310000890926us-gaap:SeniorNotesMember2020-12-310000890926us-gaap:FederalHomeLoanBankAdvancesMember2020-12-310000890926us-gaap:FederalHomeLoanBankAdvancesMember2021-12-310000890926us-gaap:SeniorNotesMemberrdn:SeniorNotesDue2024Member2017-09-300000890926us-gaap:SeniorNotesMemberrdn:SeniorNotesDue2024Member2017-09-012017-09-300000890926rdn:SeniorNotesDue2025Memberus-gaap:SeniorNotesMember2020-05-310000890926rdn:SeniorNotesDue2025Memberus-gaap:SeniorNotesMember2020-05-012020-05-310000890926rdn:SeniorNotesDue2027Memberus-gaap:SeniorNotesMember2019-06-300000890926rdn:SeniorNotesDue2027Memberus-gaap:SeniorNotesMember2019-06-012019-06-300000890926us-gaap:SeniorNotesMemberrdn:SeniorNotesDue20242025And2027Member2021-01-012021-12-310000890926us-gaap:SeniorNotesMemberrdn:SeniorNotesDue20242025And2027Member2021-12-310000890926us-gaap:FederalHomeLoanBankAdvancesMember2021-01-012021-12-310000890926us-gaap:FederalHomeLoanBankCertificatesAndObligationsFHLBMembersrt:MinimumMember2021-01-012021-12-310000890926us-gaap:FederalHomeLoanBankCertificatesAndObligationsFHLBMembersrt:MaximumMember2021-01-012021-12-310000890926us-gaap:RevolvingCreditFacilityMemberrdn:UnsecuredRevolvingCreditFacilityExpirationDate2026Member2021-12-310000890926us-gaap:RevolvingCreditFacilityMemberrdn:UnsecuredRevolvingCreditFacilityExpirationDate2026Member2021-12-012021-12-310000890926rdn:UnsecuredRevolvingCreditFacilityExpirationDate2022Memberus-gaap:RevolvingCreditFacilityMember2021-12-310000890926us-gaap:RevolvingCreditFacilityMember2021-12-310000890926srt:MaximumMemberus-gaap:InsuranceClaimsMemberrdn:TotalPrimaryInsuranceMortgageInsuranceProductsMember2021-01-012021-12-310000890926rdn:PoolInsuranceMortgageInsuranceProductMembersrt:MaximumMemberus-gaap:InsuranceClaimsMember2021-01-012021-12-310000890926us-gaap:OtherLiabilitiesMember2021-12-310000890926us-gaap:OtherLiabilitiesMember2020-12-310000890926us-gaap:SubsequentEventMember2022-01-010000890926rdn:A3Q19RepurchaseProgramMember2019-08-140000890926rdn:A3Q21RepurchaseProgramMember2021-08-310000890926rdn:TotalOf3Q191Q20And3Q21RepurchaseProgramsMember2021-08-310000890926rdn:TotalOf3Q191Q20And3Q21RepurchaseProgramsMember2021-01-012021-12-310000890926rdn:TotalOf3Q191Q20And3Q21RepurchaseProgramsMember2021-12-310000890926us-gaap:SubsequentEventMember2022-02-092022-02-0900008909262020-10-012020-12-3100008909262021-01-012021-03-3100008909262020-04-012020-06-3000008909262020-07-012020-09-3000008909262020-01-012020-03-310000890926us-gaap:OtherComprehensiveIncomeMember2020-12-310000890926us-gaap:OtherComprehensiveIncomeMember2021-01-012021-12-310000890926us-gaap:OtherComprehensiveIncomeMember2021-12-310000890926us-gaap:OtherComprehensiveIncomeMember2019-12-310000890926us-gaap:OtherComprehensiveIncomeMember2020-01-012020-12-310000890926us-gaap:OtherComprehensiveIncomeMember2018-12-310000890926us-gaap:OtherComprehensiveIncomeMember2019-01-012019-12-310000890926rdn:DifferencesBetweenGaapBasisAndStatBasisMember2021-01-012021-12-310000890926rdn:RadianGuarantyMember2021-01-012021-12-310000890926stpr:PA2021-12-31rdn:subsidiary0000890926rdn:RadianGuarantyMember2021-12-310000890926rdn:RadianTitleInsuranceMember2021-12-310000890926rdn:RadianGuarantyMember2020-01-012020-12-310000890926rdn:RadianGuarantyMember2019-01-012019-12-310000890926rdn:RadianReinsuranceMember2021-01-012021-12-310000890926rdn:RadianReinsuranceMember2020-01-012020-12-310000890926rdn:RadianReinsuranceMember2019-01-012019-12-310000890926rdn:OtherMICompaniesMember2021-01-012021-12-310000890926rdn:OtherMICompaniesMember2020-01-012020-12-310000890926rdn:OtherMICompaniesMember2019-01-012019-12-310000890926rdn:RadianTitleInsuranceMember2021-01-012021-12-310000890926rdn:RadianTitleInsuranceMember2020-01-012020-12-310000890926rdn:RadianTitleInsuranceMember2019-01-012019-12-310000890926rdn:RadianGuarantyMember2020-12-310000890926rdn:RadianGuarantyMember2019-12-310000890926rdn:RadianReinsuranceMember2021-12-310000890926rdn:RadianReinsuranceMember2020-12-310000890926rdn:RadianReinsuranceMember2019-12-310000890926rdn:OtherMICompaniesMember2021-12-310000890926rdn:OtherMICompaniesMember2020-12-310000890926rdn:OtherMICompaniesMember2019-12-310000890926rdn:RadianTitleInsuranceMember2020-12-310000890926rdn:RadianTitleInsuranceMember2019-12-31rdn:insuranceSubsidiary0000890926rdn:StateInsuranceRegulationsMember2021-12-310000890926srt:MinimumMemberrdn:NonRBCStatesMember2021-12-310000890926srt:MaximumMemberrdn:NonRBCStatesMember2021-12-310000890926rdn:RadianGuarantyMembersrt:ScenarioForecastMember2022-12-310000890926rdn:RadianReinsuranceMember2021-09-222021-09-220000890926rdn:RadianReinsuranceMembersrt:ScenarioForecastMember2022-12-310000890926us-gaap:SubsequentEventMemberrdn:RadianGuarantyMember2022-02-012022-02-110000890926rdn:EquityCompensationPlansMember2021-01-012021-12-310000890926rdn:A2021EquityPlanMember2021-12-310000890926srt:MinimumMemberrdn:EquityCompensationPlansMember2021-01-012021-12-310000890926srt:MaximumMemberrdn:EquityCompensationPlansMember2021-01-012021-12-310000890926us-gaap:RestrictedStockUnitsRSUMember2021-01-012021-12-310000890926us-gaap:RestrictedStockUnitsRSUMember2020-01-012020-12-310000890926us-gaap:RestrictedStockUnitsRSUMember2019-01-012019-12-310000890926us-gaap:EmployeeStockMember2021-01-012021-12-310000890926us-gaap:EmployeeStockMember2020-01-012020-12-310000890926us-gaap:EmployeeStockMember2019-01-012019-12-310000890926us-gaap:EmployeeStockOptionMember2021-01-012021-12-310000890926us-gaap:EmployeeStockOptionMember2020-01-012020-12-310000890926us-gaap:EmployeeStockOptionMember2019-01-012019-12-310000890926rdn:EquityCompensationPlansMember2021-12-310000890926rdn:PerformanceBasedRSUsEquitySettledMember2020-12-310000890926rdn:TimedVestedRSUsEquitySettledMember2020-12-310000890926rdn:PerformanceBasedRSUsEquitySettledMember2021-01-012021-12-310000890926rdn:TimedVestedRSUsEquitySettledMember2021-01-012021-12-310000890926rdn:PerformanceBasedRSUsEquitySettledMember2021-12-310000890926rdn:TimedVestedRSUsEquitySettledMember2021-12-310000890926rdn:A2019AwardYearMemberrdn:PerformanceBasedRSUsEquitySettledMember2019-01-012019-12-310000890926rdn:PerformanceBasedRSUsEquitySettledMemberrdn:A2020AwardYearMember2020-01-012020-12-310000890926rdn:PerformanceBasedRSUsEquitySettledMemberrdn:A2021AwardYearMember2021-01-012021-12-310000890926rdn:A2019AwardYearMemberrdn:PerformanceBasedRSUsEquitySettledMembersrt:MinimumMember2021-01-012021-12-310000890926rdn:PerformanceBasedRSUsEquitySettledMembersrt:MinimumMemberrdn:A2020AwardYearMember2021-01-012021-12-310000890926rdn:PerformanceBasedRSUsEquitySettledMembersrt:MinimumMemberrdn:A2021AwardYearMember2021-01-012021-12-310000890926rdn:PerformanceBasedRSUsEquitySettledMembersrt:MaximumMemberrdn:A2021AwardYearMember2021-01-012021-12-310000890926rdn:PerformanceBasedRSUsEquitySettledMembersrt:MaximumMemberrdn:A2020AwardYearMember2020-01-012020-12-310000890926rdn:A2019AwardYearMemberrdn:PerformanceBasedRSUsEquitySettledMembersrt:MaximumMember2019-01-012019-12-310000890926rdn:TimedVestedRSUsEquitySettledMemberrdn:A2020AwardYearMember2020-01-012020-12-310000890926rdn:A2019AwardYearMemberrdn:TimedVestedRSUsEquitySettledMember2019-01-012019-12-310000890926rdn:TimedVestedRSUsEquitySettledMemberrdn:A2021AwardYearMember2021-01-012021-12-310000890926rdn:PerformanceBasedRSUsEquitySettledMembersrt:MinimumMemberrdn:A2020AwardYearMember2020-01-012020-12-310000890926rdn:A2019AwardYearMemberrdn:PerformanceBasedRSUsEquitySettledMembersrt:MinimumMember2019-01-012019-12-310000890926rdn:TimedVestedRSUsEquitySettledMemberrdn:A2020AwardYearMember2020-12-31rdn:anniversary0000890926rdn:A2019AwardYearMemberrdn:TimedVestedRSUsEquitySettledMember2019-12-310000890926rdn:TimedVestedRSUsEquitySettledMemberrdn:A2021AwardYearMember2021-12-310000890926rdn:TimedVestedRSUsEquitySettledMembersrt:MinimumMemberrdn:A2020AwardYearMember2020-01-012020-12-310000890926rdn:TimedVestedRSUsEquitySettledMembersrt:MinimumMemberrdn:A2021AwardYearMember2021-01-012021-12-310000890926rdn:A2019AwardYearMemberrdn:TimedVestedRSUsEquitySettledMembersrt:MinimumMember2019-01-012019-12-310000890926us-gaap:EmployeeStockOptionMember2020-12-310000890926us-gaap:EmployeeStockOptionMemberrdn:A2021AwardYearMember2021-01-012021-12-310000890926us-gaap:EmployeeStockOptionMember2021-12-310000890926us-gaap:EmployeeStockOptionMemberus-gaap:ShareBasedCompensationAwardTrancheOneMember2021-01-012021-12-310000890926us-gaap:EmployeeStockOptionMemberus-gaap:ShareBasedCompensationAwardTrancheTwoMember2021-01-012021-12-310000890926us-gaap:EmployeeStockOptionMemberrdn:A2020AwardYearMember2020-01-012020-12-310000890926rdn:A2019AwardYearMemberus-gaap:EmployeeStockOptionMember2019-01-012019-12-310000890926rdn:AmendedandRestatedRadianGroupInc.EmployeeStockPurchasePlanMemberus-gaap:EmployeeStockMember2021-01-012021-12-310000890926rdn:AmendedandRestatedRadianGroupInc.EmployeeStockPurchasePlanMemberus-gaap:EmployeeStockMember2020-01-012020-12-310000890926rdn:AmendedandRestatedRadianGroupInc.EmployeeStockPurchasePlanMemberus-gaap:EmployeeStockMember2019-01-012019-12-310000890926us-gaap:SubsequentEventMemberrdn:AmendedandRestatedRadianGroupInc.EmployeeStockPurchasePlanMemberus-gaap:EmployeeStockMember2022-02-010000890926us-gaap:USTreasuryAndGovernmentMember2021-12-310000890926us-gaap:USStatesAndPoliticalSubdivisionsMember2021-12-310000890926us-gaap:AllOtherCorporateBondsMember2021-12-310000890926us-gaap:ResidentialMortgageBackedSecuritiesMember2021-12-310000890926us-gaap:CommercialMortgageBackedSecuritiesMember2021-12-310000890926us-gaap:CollateralizedLoanObligationsMember2021-12-310000890926us-gaap:AssetBackedSecuritiesMember2021-12-310000890926us-gaap:ForeignGovernmentDebtSecuritiesMember2021-12-310000890926rdn:MortgageInsuranceLinkedNotesMember2021-12-310000890926us-gaap:FixedMaturitiesMember2021-12-310000890926rdn:TradingSecuritiesMember2021-12-310000890926us-gaap:CommonStocksByIndustryMember2021-12-310000890926us-gaap:EquitySecuritiesInvestmentSummaryMember2021-12-310000890926us-gaap:ShortTermInvestmentsMember2021-12-310000890926us-gaap:OtherLongTermInvestmentsMember2021-12-310000890926us-gaap:FixedMaturitiesMemberus-gaap:SecuritiesFinancingTransactionFairValueMember2021-12-310000890926us-gaap:SecuritiesFinancingTransactionFairValueMemberus-gaap:ShortTermInvestmentsMember2021-12-310000890926us-gaap:SecuritiesFinancingTransactionFairValueMemberus-gaap:EquitySecuritiesMember2021-12-310000890926srt:ParentCompanyMember2021-12-310000890926srt:ParentCompanyMember2020-12-310000890926srt:ParentCompanyMember2021-01-012021-12-310000890926srt:ParentCompanyMember2020-01-012020-12-310000890926srt:ParentCompanyMember2019-01-012019-12-310000890926srt:ParentCompanyMember2019-12-310000890926srt:ParentCompanyMember2018-12-310000890926rdn:RadianMortgageAssuranceMember2021-12-310000890926rdn:RadianGuarantyMemberus-gaap:IndirectGuaranteeOfIndebtednessMember2021-12-31rdn:transaction0000890926rdn:MortgageInsuranceMember2021-01-012021-12-310000890926rdn:TitleInsuranceMember2021-01-012021-12-310000890926rdn:MortgageInsuranceMember2020-01-012020-12-310000890926rdn:TitleInsuranceMember2020-01-012020-12-310000890926rdn:MortgageInsuranceMember2019-01-012019-12-310000890926rdn:TitleInsuranceMember2019-01-012019-12-31
UNITED STATES
SECURITIES AND EXCHANGE COMMISSION
Washington, D.C. 20549
_______________________________
FORM 10-K
(Mark One)
☒ ANNUAL REPORT PURSUANT TO SECTION 13 OR 15(d) OF THE SECURITIES EXCHANGE ACT OF 1934
For the fiscal year ended December 31, 2021
OR
☐ TRANSITION REPORT PURSUANT TO SECTION 13 OR 15(d) OF THE SECURITIES EXCHANGE ACT OF 1934
For the transition period from to
Commission file number 1-11356
____________________________
RADIAN GROUP INC.
(Exact name of registrant as specified in its charter)
____________________________
| | | | | | | | | | | | | | | | | |
| Delaware | 23-2691170 |
| (State or other jurisdiction of incorporation or organization) | (I.R.S. Employer Identification No.) |
550 East Swedesford Road, Suite 350, Wayne, PA 19087
(Address of principal executive offices) (Zip Code)
(215) 231-1000
(Registrant’s telephone number, including area code)
Securities registered pursuant to Section 12(b) of the Act:
| | | | | | | | |
| Title of each class | Trading Symbol(s) | Name of each exchange on which registered |
| Common Stock, $.001 par value per share | RDN | New York Stock Exchange |
| | |
Securities registered pursuant to Section 12(g) of the Act: None
____________________________________________________________________________________
Indicate by check mark if the registrant is a well-known seasoned issuer, as defined in Rule 405 of the Securities Act. Yes x No o
Indicate by check mark if the registrant is not required to file reports pursuant to Section 13 or Section 15(d) of the Act. Yes o No x
Indicate by check mark whether the registrant (1) has filed all reports required to be filed by Section 13 or 15(d) of the Securities Exchange Act of 1934 during the preceding 12 months (or for such shorter period that the registrant was required to file such reports), and (2) has been subject to such filing requirements for the past 90 days. Yes ☒ No ☐
Indicate by check mark whether the registrant has submitted electronically every Interactive Data File required to be submitted pursuant to Rule 405 of Regulation S-T (§ 232.405 of this chapter) during the preceding 12 months (or for such shorter period that the registrant was required to submit such files). Yes x No o
Indicate by check mark whether the registrant is a large accelerated filer, an accelerated filer, a non-accelerated filer, a smaller reporting company, or an emerging growth company. See definitions of “large accelerated filer,” “accelerated filer,” “smaller reporting company” and “emerging growth company” in Rule 12b-2 of the Exchange Act. (Check One):
| | | | | | | | | | | | | | | | | | | | | | | | | | | | | | | | |
| Large Accelerated Filer | ☒ | | Accelerated Filer o | | Non-Accelerated Filer o | | Smaller Reporting Company | ☐ | Emerging Growth Company | ☐ |
If an emerging growth company, indicate by check mark if the registrant has elected not to use the extended transition period for complying with any new or revised financial accounting standards provided pursuant to Section 13(a) of the Exchange Act. o
Indicate by check mark whether the registrant has filed a report on and attestation to its management’s assessment of the effectiveness of its internal control over financial reporting under Section 404(b) of the Sarbanes-Oxley Act (15 U.S.C. 7262(b)) by the registered public accounting firm that prepared or issued its audit report. x
Indicate by check mark whether the registrant is a shell company (as defined in Rule 12b-2 of the Exchange Act). Yes ☐ No x
As of June 30, 2021, the aggregate market value of the registrant’s common stock held by non-affiliates of the registrant was $4,164,813,673 based on the closing sale price as reported on the New York Stock Exchange. Excluded from this amount is the value of all shares beneficially owned by executive officers and directors of the registrant. These exclusions should not be deemed to constitute a representation or acknowledgment that any such individual is, in fact, an affiliate of the registrant or that there are not other persons or entities who may be deemed to be affiliates of the registrant.
The number of shares of common stock, $0.001 par value per share, of the registrant outstanding on February 23, 2022 was 175,525,591 shares.
_______________________________
DOCUMENTS INCORPORATED BY REFERENCE | | | | | |
| | Form 10-K Reference Document |
| Definitive Proxy Statement for the Registrant’s 2022 Annual Meeting of Stockholders | Part III
(Items 10 through 14) |
Table of Contents
| | | | | | | | |
| | Page |
| |
| |
| |
| | |
| PART I | | |
| Item 1 | | |
| Item 1A | | |
| Item 1B | | |
| Item 2 | | |
| Item 3 | | |
| Item 4 | | |
| | |
| PART II | | |
| Item 5 | | |
| Item 6 | | |
| Item 7 | | |
| Item 7A | | |
| Item 8 | | |
| Item 9 | | |
| Item 9A | | |
| Item 9B | | |
| Item 9C | | |
| | |
| PART III | | |
| Item 10 | | |
| Item 11 | | |
| Item 12 | | |
| Item 13 | | |
| Item 14 | | |
| | |
| PART IV | | |
| Item 15 | | |
| Item 16 | | |
| | |
| |
| |
Glossary of Abbreviations and Acronyms
The following list defines various abbreviations and acronyms used throughout this report, including the Business Section, the Management’s Discussion and Analysis of Financial Condition and Results of Operations, the Consolidated Financial Statements, the Notes to Consolidated Financial Statements and the Financial Statement Schedules.
| | | | | |
| Term | Definition |
| |
| 1995 Equity Plan | The Radian Group Inc. 1995 Equity Compensation Plan, as amended |
| 2008 Equity Plan | The Radian Group Inc. 2008 Equity Compensation Plan, as amended |
| 2014 Equity Plan | The Radian Group Inc. 2014 Equity Compensation Plan |
| 2017 Equity Plan | The Radian Group Inc. Equity Compensation Plan, which amended and restated the 2014 Equity Plan and was approved by our stockholders on May 10, 2017, as further amended on May 13, 2020 |
| 2021 Equity Plan | The Radian Group Inc. 2021 Equity Compensation Plan, as approved by our stockholders on May 12, 2021 |
| 2014 Master Policy | Radian Guaranty’s master insurance policy, setting forth the terms and conditions of our mortgage insurance coverage, which became effective October 1, 2014 |
| 2020 Master Policy | Radian Guaranty’s master insurance policy, setting forth the terms and conditions of our mortgage insurance coverage, which became effective March 1, 2020 |
| 2016 Single Premium QSR Agreement | Quota share reinsurance agreement entered into with a panel of third-party reinsurance providers in the first quarter of 2016 and subsequently amended in the fourth quarter of 2017 |
| 2018 Single Premium QSR Agreement | Quota share reinsurance agreement entered into with a panel of third-party reinsurance providers in October 2017 to cede a portion of Single Premium NIW beginning January 1, 2018 |
| 2020 Single Premium QSR Agreement | Quota share reinsurance agreement entered into with a panel of third-party reinsurance providers in January 2020 to cede a portion of Single Premium NIW beginning January 1, 2020 |
| ABS | Asset-backed securities |
| All Other | Radian’s non-reportable operating segments and other business activities, including: (i) income (losses) from assets held by Radian Group, our holding company; (ii) related general corporate operating expenses not attributable or allocated to our reportable segments; (iii) income and expenses related to Clayton for all periods prior to our sale of this business in the first quarter of 2020; (iv) the income and expenses related to our traditional appraisal services, which we wound down beginning in the fourth quarter of 2020; and (v) certain other immaterial activities, including investments in new business opportunities |
| ASU | Accounting Standards Update, issued by the FASB to communicate changes to GAAP |
| Available Assets | As defined in the PMIERs, assets primarily including the most liquid assets of a mortgage insurer, and reduced by, among other items, premiums received but not yet earned and reinsurance funds withheld |
| CARES Act | Coronavirus Aid, Relief, and Economic Security Act signed into law on March 27, 2020 |
| CFPB | Consumer Financial Protection Bureau |
| Claim Curtailment | Our legal right, under certain conditions, to reduce the amount of a claim, including due to servicer negligence |
| Claim Denial | Our legal right, under certain conditions, to deny a claim |
| Claim Severity | The total claim amount paid divided by the original coverage amount |
| Clayton | Clayton Services LLC, a former indirect subsidiary of Radian Group that was sold on January 21, 2020, through which we provided services related to loan acquisition, RMBS securitization and distressed asset reviews and servicer and loan surveillance |
| CLO | Collateralized loan obligations |
| CMBS | Commercial mortgage-backed securities |
| COVID-19 | The novel coronavirus disease declared a pandemic by the World Health Organization and the Centers for Disease Control and Prevention in March 2020 |
| | | | | |
| Term | Definition |
| |
| COVID-19 Amendment | Amendment to the PMIERs effective June 30, 2020, primarily to recognize the COVID-19 pandemic as a nationwide “FEMA Declared Major Disaster” and to set forth guidelines on the application of the Disaster Related Capital Charge to COVID-19 Defaulted Loans |
| COVID-19 Crisis Period | Time period extending from March 1, 2020 to March 31, 2021 |
| COVID-19 Defaulted Loans | All non-performing loans that either: (i) have an Initial Missed Payment occurring during the COVID-19 Crisis Period or (ii) are subject to a forbearance plan granted in response to a financial hardship related to COVID-19 (which is assumed under the COVID-19 Amendment to be the case for any loan that has an Initial Missed Payment occurring during the COVID-19 Crisis Period and is subject to a forbearance plan), the terms of which are materially consistent with the terms of forbearance plans offered by the GSEs |
| Cures | Loans that were in default as of the beginning of a period and are no longer in default because payments were received such that the loan is no longer 60 or more days past due |
| Default to Claim Rate | The percentage of defaulted loans that are assumed to result in a claim |
| Demotech | Demotech, Inc. |
| Disaster Related Capital Charge | Under the PMIERs, multiplier of 0.30 applied to the required asset amount factor for each non-performing loan: (i) backed by a property located in a FEMA Designated Area and (ii) either subject to a certain forbearance plan or with an initial default date occurring within a certain timeframe |
| Dodd-Frank Act | Dodd-Frank Wall Street Reform and Consumer Protection Act, as amended |
| Eagle Re Issuer(s) | A group of unaffiliated special purpose insurers (VIEs) domiciled in Bermuda, comprising Eagle Re 2018-1 Ltd., Eagle Re 2019-1 Ltd., Eagle Re 2020-1 Ltd., Eagle Re 2020-2 Ltd., Eagle Re 2021-1 Ltd. and/or Eagle Re 2021-2 Ltd., which provide reinsurance coverage under Radian Guaranty’s Excess-of-Loss Program |
| ECF | Enterprise Capital Framework, which establishes a new regulatory capital framework for the GSEs |
| Equity Plans | The 1995 Equity Plan, the 2008 Equity Plan, the 2017 Equity Plan and the 2021 Equity Plan, together |
| ERM | Enterprise Risk Management |
| ESPP | The Radian Group Inc. Employee Stock Purchase Plan, as amended and restated, which was approved by our stockholders on May 9, 2018 |
| Excess-of-Loss Program | The credit risk protection obtained by Radian Guaranty in the form of excess-of-loss reinsurance, which indemnifies the ceding company against loss in excess of a specific agreed limit, up to a specified sum. The program includes reinsurance agreements with the Eagle Re Issuers in connection with various issuances of mortgage insurance-linked notes. The program also included a separate agreement with a third-party reinsurer, representing a pro rata share of the credit risk alongside the risk assumed by Eagle Re 2018-1 Ltd., an Eagle Re Issuer. |
| Exchange Act | Securities Exchange Act of 1934, as amended |
| Extraordinary Distribution | A dividend or distribution of capital that is required to be approved by an insurance company’s primary regulator that is greater than would be permitted as an ordinary distribution (which does not require regulatory approval) |
| Fannie Mae | Federal National Mortgage Association |
| FASB | Financial Accounting Standards Board |
| FEMA | Federal Emergency Management Agency, an agency of the U.S. Department of Homeland Security |
| FEMA Designated Area | Generally, an area that has been subject to a disaster, designated by FEMA as an individual assistance disaster area for the purpose of determining eligibility for various forms of federal assistance |
| FHA | Federal Housing Administration |
| FHFA | Federal Housing Finance Agency |
| FHLB | Federal Home Loan Bank of Pittsburgh |
| | | | | |
| Term | Definition |
| |
| FICO | Fair Isaac Corporation (“FICO”) credit scores, for Radian’s portfolio statistics, represent the borrower’s credit score at origination and, in circumstances where there are multiple borrowers, the lowest of the borrowers’ FICO scores is utilized |
| Fitch | Fitch Ratings, Inc. |
| Flow Basis | With respect to mortgage insurance, includes mortgage insurance policies that are written on an individual loan basis as each loan is originated or on an aggregated basis (in which each individual loan in a group of loans is insured in a single transaction, typically shortly after the loans have been originated). Among other items, Flow Basis business excludes Pool Mortgage Insurance, which we originated prior to 2009. |
| Foreclosure Stage Default | The stage of default of a loan in which a foreclosure sale has been scheduled or held |
| Freddie Mac | Federal Home Loan Mortgage Corporation |
| GAAP | Generally accepted accounting principles in the U.S., as amended from time to time |
| GSE(s) | Government-Sponsored Enterprises (Fannie Mae and Freddie Mac) |
| HARP | Home Affordable Refinance Program |
| homegenius | Radian’s business segment that offers an array of title, real estate and technology products and services to consumers, mortgage lenders, mortgage and real estate investors, GSEs, real estate brokers and agents |
| HPA | Homeowners Protection Act of 1998 |
| HUD | U.S. Department of Housing and Urban Development |
| IBNR | Losses incurred but not reported |
| IIF | Insurance in force, equal to the aggregate unpaid principal balances of the underlying loans |
| Initial Missed Payment | The first missed monthly payment, which would be reported to us as delinquent as of the last day of the month for which it was due. (For example, for a loan first reported to the approved insurer in May as having missed its payments due on April 1 and May 1, the Initial Missed Payment shall be deemed to have occurred on April 30.) |
| LAE | Loss adjustment expenses, which include the cost of investigating and adjusting losses and paying claims |
| LIBOR | London Inter-bank Offered Rate |
| Loss Mitigation Activity/Activities | Activities such as Rescissions, Claim Denials, Claim Curtailments and cancellations |
| LTV | Loan-to-value ratio, calculated as the ratio of the original loan amount to the original value of the property, expressed as a percentage |
| Master Policies | The Prior Master Policy, the 2014 Master Policy and the 2020 Master Policy, together |
| Minimum Required Asset(s) | A risk-based minimum required asset amount, as defined in the PMIERs, calculated based on net RIF (RIF, net of credits permitted for reinsurance) and a variety of measures related to expected credit performance and other factors, including the impact of the Disaster Related Capital Charge |
| Model Act | Mortgage Guaranty Insurance Model Act, as issued by the NAIC to establish minimum capital and surplus requirements for mortgage insurers |
| Monthly and Other Recurring Premiums (or Recurring Premium Policies) | Insurance premiums or policies, respectively, where premiums are paid on a monthly or other installment basis, in contrast to Single Premium Policies |
| Monthly Premium Policies | Insurance policies where premiums are paid on a monthly installment basis |
| Moody’s | Moody’s Investors Service |
| Mortgage | Radian’s mortgage insurance and risk services business segment, which provides credit-related insurance coverage, principally through private mortgage insurance on residential first-lien mortgage loans, as well as other credit risk management, contract underwriting and fulfillment solutions, to mortgage lending institutions and mortgage credit investors |
| MPP Requirement | Certain states’ statutory or regulatory risk-based capital requirement that the mortgage insurer must maintain a minimum policyholder position, which is calculated based on both risk and surplus levels |
| NAIC | National Association of Insurance Commissioners |
| | | | | |
| Term | Definition |
| |
| NIW | New insurance written, representing the aggregate original principal amount of the mortgages underlying the Primary Mortgage Insurance |
| NOL | Net operating loss; for tax purposes, accumulated during years a company reported more tax deductions than taxable income. NOLs may be carried back or carried forward a certain number of years, depending on various factors which can reduce a company’s tax liability. |
| PDR | Premium deficiency reserve |
| Persistency Rate | The percentage of IIF that remains in force over a period of time |
| PMIERs | Private Mortgage Insurer Eligibility Requirements issued by the GSEs under oversight of the FHFA to set forth requirements an approved insurer must meet and maintain to provide mortgage guaranty insurance on loans acquired by the GSEs. The current PMIERs requirements, sometimes referred to as PMIERs 2.0, incorporate the most recent revisions to the PMIERs that became effective on March 31, 2019, as amended. |
| PMIERs Cushion | Under PMIERs, Radian Guaranty’s excess of Available Assets over Minimum Required Assets |
| Pool Mortgage Insurance | Insurance that provides a lender or investor protection against default on a group or “pool” of mortgages, rather than on an individual mortgage loan basis, generally subject to an aggregate exposure limit, or “stop loss,” and/or deductible applied to the initial aggregate loan balance of the entire pool, pursuant to the terms of the applicable insurance agreement |
| Primary Mortgage Insurance | Insurance that provides a lender or investor protection against default on an individual mortgage loan basis, at a specified coverage percentage for each loan, pursuant to the terms of the applicable Master Policy |
| Prior Master Policy | Radian Guaranty’s master insurance policy, setting forth the terms and conditions of our mortgage insurance coverage, which was in effect prior to the effective date of the 2014 Master Policy |
| PSPAs | Senior preferred stock purchase agreements, pursuant to which the U.S. Department of the Treasury owns the preferred stock of the GSEs |
| QM | Qualified mortgage; a mortgage that possesses certain low-risk characteristics that enable it to qualify for lender protection under the ability to repay rule instituted by the Dodd-Frank Act |
| QSR Program | The quota share reinsurance agreements entered into with a third-party reinsurance provider in the second and fourth quarters of 2012, collectively |
| Radian | Radian Group Inc. together with its consolidated subsidiaries |
| Radian Group | Radian Group Inc., our insurance holding company |
| Radian Guaranty | Radian Guaranty Inc., a Pennsylvania domiciled insurance subsidiary of Radian Group and our approved insurer under the PMIERs, through which we provide mortgage insurance products and services |
| Radian Reinsurance | Radian Reinsurance Inc., a Pennsylvania domiciled insurance subsidiary of Radian Group, through which we provide mortgage credit risk insurance and reinsurance, including through participation in credit risk transactions issued by the GSEs |
| Radian Settlement Services | Radian Settlement Services Inc., an indirect subsidiary of Radian Group, through which we provide title services |
| Radian Title Insurance | Radian Title Insurance Inc., an Ohio domiciled insurance company and an indirect subsidiary of Radian Group, through which we offer title insurance |
| RBC States | Risk-based capital states, which are those states that currently impose a statutory or regulatory risk-based capital requirement |
| Red Bell | Red Bell Real Estate, LLC, an indirect subsidiary of Radian Group, through which we provide real estate brokerage services and other related products and services |
| Reinstatements | Reversals of previous Rescissions, Claim Denials and Claim Curtailments |
| REO | Real estate owned |
| Rescission | Our legal right, under certain conditions, to unilaterally rescind coverage on our mortgage insurance policies if we determine that a loan did not qualify for insurance |
| RESPA | Real Estate Settlement Procedures Act of 1974, as amended |
| | | | | |
| Term | Definition |
| |
| RIF | Risk in force; for Primary Mortgage Insurance, RIF is equal to the underlying loan unpaid principal balance multiplied by the insurance coverage percentage, whereas for Pool Mortgage Insurance, it represents the remaining exposure under the agreements |
| Risk-to-capital | Under certain state regulations, a maximum ratio of net RIF calculated relative to the level of statutory capital |
| RMBS | Residential mortgage-backed securities |
| RSU | Restricted stock unit |
| S&P | Standard & Poor’s Financial Services LLC |
| SaaS | Software-as-a-Service |
| SAFE Act | Secure and Fair Enforcement for Mortgage Licensing Act, as amended |
| SAP | Statutory accounting principles and practices, including those required or permitted, if applicable, by the insurance departments of the respective states of domicile of our insurance subsidiaries |
| SEC | United States Securities and Exchange Commission |
| Securities Act | Securities Act of 1933, as amended |
| Senior Notes due 2024 | Our 4.500% unsecured senior notes due October 2024 ($450 million original principal amount) |
| Senior Notes due 2025 | Our 6.625% unsecured senior notes due March 2025 ($525 million original principal amount) |
| Senior Notes due 2027 | Our 4.875% unsecured senior notes due March 2027 ($450 million original principal amount) |
| Single Premium NIW / IIF | NIW or IIF, respectively, on Single Premium Policies |
| Single Premium Policy / Policies | Insurance policies where premiums are paid in a single payment, which includes policies written on an individual basis (as each loan is originated) and on an aggregated basis (in which each individual loan in a group of loans is insured in a single transaction, typically shortly after the loans have been originated) |
| Single Premium QSR Program | The 2016 Single Premium QSR Agreement, the 2018 Single Premium QSR Agreement and the 2020 Single Premium QSR Agreement, collectively |
| SOFR | Secured Overnight Financing Rate |
| Stage of Default | The stage a loan is in relative to the foreclosure process, based on whether a foreclosure sale has been scheduled or held |
| Statutory RBC Requirement | Risk-based capital requirement imposed by the RBC States, requiring a minimum surplus level and, in certain states, a minimum ratio of statutory capital relative to the level of risk |
Surplus Note due 2027 | The $100 million 0.0% intercompany surplus note issued by Radian Guaranty to Radian Group, due December 31, 2027 |
| Time in Default | The time period from the point a loan reaches default status (based on the month the default occurred) to the current reporting date |
| VA | U.S. Department of Veterans Affairs |
| VIE | Variable interest entity |
Cautionary Note Regarding Forward-Looking Statements
—Safe Harbor Provisions
All statements in this report that address events, developments or results that we expect or anticipate may occur in the future are “forward-looking statements” within the meaning of Section 27A of the Securities Act, Section 21E of the Exchange Act and the Private Securities Litigation Reform Act of 1995. In most cases, forward-looking statements may be identified by words such as “anticipate,” “may,” “will,” “could,” “should,” “would,” “expect,” “intend,” “plan,” “goal,” “contemplate,” “believe,” “estimate,” “predict,” “project,” “potential,” “continue,” “seek,” “strategy,” “future,” “likely” or the negative or other variations on these words and other similar expressions. These statements, which may include, without limitation, projections regarding our future performance and financial condition, are made on the basis of management’s current views and assumptions with respect to future events. These statements speak only as of the date they were made, and we undertake no obligation to update or revise any forward-looking statements, whether as a result of new information, future events or otherwise. We operate in a changing environment where new risks emerge from time to time and it is not possible for us to predict all risks that may affect us. The forward-looking statements are not guarantees of future performance, and the forward-looking statements, as well as our prospects as a whole, are subject to risks and uncertainties that could cause actual results to differ materially from those set forth in the forward-looking statements. These risks and uncertainties include, without limitation:
■the COVID-19 pandemic, which has created periods of significant economic disruption, high unemployment, volatility and disruption in financial markets and required adjustments in the housing finance system and real estate markets. The COVID-19 pandemic has adversely impacted our businesses, and could further impact our business and subject us to certain risks, including those discussed in “Item 1A. Risk Factors—The COVID-19 pandemic adversely impacted us and, in the future, could again adversely affect our business, results of operations or financial condition;”
■changes in economic conditions that impact the size of the insurable mortgage market, the credit performance of our insured mortgage portfolio and our business prospects;
■changes in the way customers, investors, ratings agencies, regulators or legislators perceive our performance, financial strength and future prospects;
■Radian Guaranty’s ability to remain eligible under the PMIERs and other applicable requirements imposed by the FHFA and by the GSEs to insure loans purchased by the GSEs;
■our ability to maintain an adequate level of capital in our insurance subsidiaries to satisfy existing and future regulatory requirements, including the PMIERs and any changes thereto and potential changes to the Model Act;
■changes in the charters or business practices of, or rules or regulations imposed by or applicable to, the GSEs or loans purchased by the GSEs, which may include further changes in response to the COVID-19 pandemic, changes in furtherance of housing policy objectives such as the current FHFA focus on increasing the accessibility and affordability of homeownership for low- and moderate-income borrowers and minority communities, or changes in the requirements for Radian Guaranty to remain an approved insurer to the GSEs such as changes in the PMIERs or the GSEs’ interpretation and application of the PMIERs;
■the effects of the ECF which, in the form finalized in December 2020, increases the capital requirements for the GSEs and reduces the credit they receive for risk transfer, and among other things, could impact the GSEs’ operations and pricing as well as the size of the insurable mortgage market, and which may form the basis for future changes to the PMIERs;
■changes in the current housing finance system in the United States, including the roles of the FHA, the GSEs and private mortgage insurers in this system;
■our ability to successfully execute and implement our capital plans, including our risk distribution strategy through the capital markets and traditional reinsurance markets, and to maintain sufficient holding company liquidity to meet our liquidity needs;
■our ability to successfully execute and implement our business plans and strategies, including plans and strategies that require GSE and/or regulatory approvals and licenses, are subject to complex compliance requirements that we may be unable to satisfy, or may expose us to new risks including those that could impact our capital and liquidity positions;
■uncertainty from the upcoming discontinuance of LIBOR and transition to one or more alternative benchmarks that could cause interest rate volatility and, among other things, impact our investment portfolio, cost of debt and cost of reinsurance through mortgage insurance-linked notes transactions;
■any disruption in the servicing of mortgages covered by our insurance policies, as well as poor servicer performance, which could be impacted by the burdens placed on many servicers due to the COVID-19 pandemic;
■a decrease in the Persistency Rates of our mortgage insurance on Monthly Premium Policies;
■competition in the private mortgage insurance industry generally, and more specifically: price competition in our mortgage insurance business, including as a result of formulaic, granular risk-based pricing methodologies that are less transparent than historical rate-card-based pricing practices; and competition from the FHA and VA as well as from other forms of credit enhancement, such as GSE-sponsored alternatives to traditional mortgage insurance;
■legislative and regulatory activity (or inactivity), including the adoption of (or failure to adopt) new laws and regulations, or changes in existing laws and regulations, or the way they are interpreted or applied, including potential changes in tax law and other matters currently under consideration in the U.S. Congress;
■legal and regulatory claims, assertions, actions, reviews, audits, inquiries and investigations that could result in adverse judgments, settlements, fines, injunctions, restitutions or other relief that could require significant expenditures, new or increased reserves or have other effects on our business;
■the amount and timing of potential payments or adjustments associated with federal or other tax examinations;
■the possibility that we may fail to estimate accurately, especially in the event of an extended economic downturn or a period of extreme market volatility and economic uncertainty, the likelihood, magnitude and timing of losses in establishing loss reserves for our mortgage insurance business or to accurately calculate and/or project our Available Assets and Minimum Required Assets under the PMIERs, which will be impacted by, among other things, the size and mix of our IIF, the level of defaults in our portfolio, the reported status of defaults in our portfolio, including whether they are subject to mortgage forbearance, a repayment plan or a loan modification trial period granted in response to a financial hardship related to COVID-19, the level of cash flow generated by our insurance operations and our risk distribution strategies;
■volatility in our financial results caused by changes in the fair value of our assets and liabilities, including with respect to our use of derivatives and within our investment portfolio;
■changes in GAAP or SAP rules and guidance, or their interpretation;
■risks associated with investments to grow our existing businesses, or to pursue new lines of business or new products and services, including our ability and related costs to develop, launch and implement new and innovative technologies and digital products and services, and whether these products and services will receive broad customer acceptance;
■the effectiveness and security of our information technology systems and digital products and services, including the risk that these systems, products or services fail to operate as expected or planned or expose us to cybersecurity or third party risks, including due to malware, unauthorized access, cyber-attack, natural disasters or other similar events;
■our ability to attract and retain key employees; and
■legal and other limitations on amounts we may receive from our subsidiaries, including dividends or ordinary course distributions under our internal tax- and expense-sharing arrangements.
For more information regarding these risks and uncertainties as well as certain additional risks that we face, you should refer to the Summary of Risk Factors, to the more detailed discussion of our Risk Factors included in Item 1A, and to subsequent reports and registration statements filed from time to time with the SEC. We caution you not to place undue reliance on these forward-looking statements, which are current only as of the date on which we issued this report. We do not intend to, and we disclaim any duty or obligation to, update or revise any forward-looking statements to reflect new information or future events or for any other reason.
Summary of Risk Factors
Our business is subject to a number of risks, including risks that may prevent us from achieving our business objectives or may adversely affect our business, financial condition, results of operations, cash flows, and prospects. These risks are discussed more fully under “Item 1A. Risk Factors” of this Annual Report on Form 10-K and include, but are not limited to, the following material risks and uncertainties:
■The COVID-19 pandemic adversely impacted us and, in the future, could again adversely affect our business, results of operations or financial condition.
■Radian Guaranty may fail to maintain its eligibility status with the GSEs, and the additional capital required to support Radian Guaranty’s eligibility could reduce our available liquidity.
■Our insurance subsidiaries are subject to comprehensive state insurance regulations and other requirements, which we may fail to satisfy.
■Changes in the charters, business practices or role of the GSEs in the U.S. housing market generally, could significantly impact our businesses.
■Legislation and administrative and regulatory changes and interpretations could impact our businesses.
■Our success depends on our ability to assess and manage our underwriting risks; the premiums we charge may not be adequate to compensate us for our liability for losses and the amount of capital we are required to hold against our insured risks. We expect to incur losses for future defaults beyond what we have reserved for in our financial statements.
■If the estimates we use in establishing loss reserves are incorrect, we may be required to take unexpected charges to income, which could adversely affect our results of operations.
■Our Loss Mitigation Activity is not expected to mitigate mortgage insurance losses to the same extent as in prior years; Loss Mitigation Activity could continue to negatively impact our customer relationships.
■Reinsurance may not be available, affordable or adequate to protect us against losses.
■An extension in the period of time that a loan remains in our defaulted loan inventory may increase the severity of claims that we ultimately are required to pay.
■If the length of time that our mortgage insurance policies remain in force declines, it could result in a decrease in our future revenues.
■Our delegated underwriting program may subject our mortgage insurance business to unanticipated claims.
■Our mortgage insurance business faces intense competition.
■Our NIW and franchise value could decline if we lose business from significant customers.
■The current financial strength ratings assigned to our mortgage insurance subsidiaries could weaken our competitive position and potential downgrades by rating agencies to these ratings and the ratings assigned to Radian Group could adversely affect the Company.
■Our business depends, in part, on effective and reliable loan servicing.
■We face risks associated with our contract underwriting business.
■A decrease in the volume of mortgage originations could result in fewer opportunities for us to write new mortgage insurance business and conduct our homegenius business.
■We are exposed to risks associated with our homegenius business that could negatively affect our results of operations and financial condition.
■We rely upon proprietary technology and information, and if we are unable to protect our intellectual property rights, it could have a material adverse effect on us.
■The credit performance of our mortgage insurance portfolio is impacted by macroeconomic conditions and specific events that affect the ability of borrowers to pay their mortgages.
■Our success depends, in part, on our ability to manage risks in our investment portfolio.
■Climate change and extreme weather events could adversely affect our businesses, results of operations and financial condition.
■Our reported earnings, stockholders’ equity and book value per share are subject to fluctuations based on changes in our investments that require us to adjust their fair market value.
■The discontinuance of LIBOR may adversely affect us.
■Radian Group’s sources of liquidity may be insufficient to fund its obligations.
■Our revolving credit facility contains restrictive covenants that could limit our operating flexibility. A default under our credit facility could trigger an event of default under the terms of our senior notes. We may not have access to funding under our credit facility when we require it.
■Our information technology systems may fail or become outmoded, be temporarily interrupted or otherwise cause us to be unable to meet our customers’ demands.
■We could incur significant liability or reputational harm if the security of our information technology systems is breached, including as result of a cyberattack, or we otherwise fail to protect confidential information, including personally identifiable information that we maintain.
■We may not continue to pay dividends at the same rate we are currently paying them, or at all, and any decrease in or suspension of payment of a dividend could cause our stock price to decline.
■We are subject to litigation and regulatory proceedings.
■We rely on our management team and our business could be harmed if we are unable to retain qualified personnel or successfully develop and/or recruit their replacements.
■Investments to grow our existing businesses, pursue new lines of business or new products and services within existing lines of business subject us to additional risks and uncertainties.
PART I
Item 1. Business
Index to Item 1
General
Overview
We are a diversified mortgage and real estate services business. We provide mortgage insurance and other products and services to the real estate and mortgage finance industries through our two business segments—Mortgage and homegenius. While we manage and report on these two segments separately, we take an enterprise approach under our “One Radian” strategy, which leverages the value of our employees across our diversified businesses to better serve our customers.
Our Mortgage segment aggregates, manages and distributes U.S. mortgage credit risk on behalf of mortgage lending institutions and mortgage credit investors, principally through private mortgage insurance on residential first-lien mortgage loans, and also provides other credit risk management, contract underwriting and fulfillment solutions to our customers. Our homegenius segment offers an array of title, real estate and technology products and services to consumers, mortgage lenders, mortgage and real estate investors, GSEs and real estate brokers and agents. See Notes 1 and 4 of Notes to Consolidated Financial Statements for further details of our businesses, including the renaming of the homegenius segment in 2021 to align with updates to our brand strategy.
Radian Group serves as the holding company for our insurance and other subsidiaries, through which we offer our products and services, and does not have any operations of its own. Our principal executive offices are located at 550 East Swedesford Road, Suite 350, Wayne, PA 19087, and our telephone number is (215) 231-1000.
Available Information
Our website address is www.radian.com. Copies of our Annual Reports on Form 10-K, Quarterly Reports on Form 10-Q, Current Reports on Form 8-K, as well as any amendments to those reports, are available free of charge through our website as soon as reasonably practicable after they are electronically filed with, or furnished to, the SEC.
In addition, our guidelines of corporate governance, code of business conduct and ethics (which includes the code of ethics applicable to our chief executive officer, principal financial officer and principal accounting officer) and the governing charters for each standing committee of Radian Group’s board of directors are available free of charge on our website, as well as in print, to any stockholder upon request.
The public may read materials we file with the SEC, including reports, proxy and information statements, and other information, on the Internet site maintained by the SEC. The address of that site is www.sec.gov.
The above references to our website and the SEC’s website do not constitute incorporation by reference of the information contained on the websites and such information should not be considered part of this document.
Business Strategy
We are strategically focused on supporting the American dream of affordable and sustainable homeownership by delivering innovative solutions combined with superior levels of service to our customers across the residential mortgage and real estate spectrum through our two business segments. In pursuing these objectives, we expect to increase value creation for our stakeholders.
Consistent with these objectives, our business strategy, as highlighted below, is focused on growing our businesses, diversifying our revenue sources and seeking to optimize our capital and liquidity, while maintaining an emphasis on risk management, human capital management and long-term profitability. To help achieve these objectives, we seek to continuously improve and leverage our operational excellence and the strength of our “One Radian” brand.
A key element of our business strategy is to complement and diversify our business and revenue streams by increasing our participation in multiple facets of the residential real estate and mortgage finance markets while also building competitive differentiation within our Mortgage business. Under our homegenius brand, we are focused on growing our homegenius businesses to meet increased market demand for digital products and services across our title, real estate and technology business platforms. See “homegenius—homegenius Business Overview” for additional information about our homegenius business. With respect to our Mortgage business, we continue to seek and develop new and innovative opportunities to build upon our core mortgage credit risk competencies by expanding our mortgage market presence and further diversifying our revenue streams.
| | |
| Radian’s Long-Term Strategic Objectives |
■Grow and diversify our Mortgage and homegenius businesses through innovative business models that leverage the strength of our One Radian brand and the value of operating excellence to: ▪Continue to grow the economic value of our insured mortgage portfolio by writing profitable NIW ▪Leverage our industry knowledge, core competencies and strong market position to develop opportunities to expand our mortgage market presence ▪Build the homegenius brand and continue to position our title, real estate and technology products and services for long-term growth in revenues and value contribution ▪Continue to expand our Mortgage and homegenius market presence by leveraging the value of our One Radian enterprise sales relationships and our multi-channel marketing model ▪Further utilize the quality, performance and scale of our operations and delivery of products and services as a strategic and competitive differentiator ■Maintain strong comprehensive enterprise risk management and risk/return discipline based on sound data and analytics ■Optimize our capital and liquidity position to ensure ongoing compliance with PMIERs, build strategic financial flexibility to support our growth and diversification plans and increase stockholder value ■Strengthen our One Radian team by building upon our inclusiveness and diversity, developing our talent for future success, fostering a culture based on our values and mission and utilizing data and analytics to adapt for the future |
In our mortgage insurance business, we evaluate the projected long-term economic value of our insured portfolio by using a measure that incorporates expected lifetime returns for our insurance policies, taking into consideration projected premiums, credit losses, investment income, operating expenses, taxes and an assumed cost of capital. This projected economic value is then discounted to arrive at an estimated present value of the long-term economic value of our insured portfolio. We use this economic value to assist us in evaluating various portfolio strategies and identify opportunities to create stockholder value. See “Item 7. Management’s Discussion and Analysis of Financial Condition and Results of Operations—Mortgage Insurance Portfolio” for more information about our insured portfolio.
2021 Highlights
Below are highlights of key accomplishments that contributed to our financial and operating results during 2021 in support of our long-term strategic objectives.
| | |
| Key Accomplishments for 2021 |
■Delivered strong financial results, driven by improved credit performance in our Mortgage segment and accelerating revenue growth in our homegenius segment ▪Earned consolidated pretax income of $764.8 million and net income of $600.7 million, or $3.16 net income per diluted share, in 2021, compared to consolidated pretax income of $479.4 million and net income of $393.6 million, or $2.00 net income per diluted share, in 2020, aided by significant improvement in our provision for losses from $485.1 million in 2020 to $20.9 million in 2021 ▪Adjusted pretax operating income(1) was $757.7 million, or $3.15 per diluted share, in 2021 compared to $432.1 million, or $1.74 per diluted share, in 2020 ▪Wrote $91.8 billion of NIW, the second highest annual volume in our 45-year history, contributing to our IIF of $246.0 billion at December 31, 2021 ▪Increased homegenius revenues by 45.5%, from $102.4 million in 2020 to $149.1 million in 2021 ▪Book value per share at December 31, 2021 was $24.28, an increase of 8.6% compared to $22.36 at December 31, 2020 |
■Executed on our strategic plan to grow and diversify our businesses by leveraging our One Radian model and strengthening our operations ▪Rebranded our suite of title, real estate and technology products and services as homegenius ▪Grew our title revenues in 2021 by 72.6%, closing 58 thousand title orders in 2021 ▪Increased our revenue from real estate services, which include asset management and valuation products and services, 26.1% from 2020 ▪Developed several new technology products, including a property intelligence platform and a smart workflow system for real estate brokers, agents and lenders |
■Maintained a strong risk culture, as demonstrated by ongoing risk distribution strategies, disciplined and granular risk-based pricing and expanded use of data and analytics to inform decision making ▪Executed two insurance-linked note reinsurance transactions in 2021, providing Radian Guaranty with approximately $1 billion of additional credit-risk protection, enhancing our PMIERs Cushion and improving our risk profile ▪Continued to monitor and grow the economic value of our insured mortgage portfolio by leveraging granular, risk-adjusted pricing and new technologies to identify strategies to maximize the economic value of projected NIW ▪Expanded our risk informed underwriting program to cover a majority of mortgage insurance applications, leveraging analytics to identify efficiency opportunities ▪Continued to enhance our risk analytics, including customer and servicer segmentation, loss mitigation reporting, servicer dashboards and underwriting surveillance |
■Further strengthened our capital and liquidity profile, while enhancing financial flexibility and returning value to stockholders ▪Resumed our share repurchase program, repurchasing 17.8 million shares in 2021 for a total of $399.1 million, at an average share price of $22.48, including commissions ▪Increased our quarterly cash dividend by 12% from $0.125 to $0.14 per share, beginning with the dividend declared in the second quarter of 2021 ▪Increased the excess of Available Assets over Minimum Required Assets under PMIERs by $738.6 million to $2.1 billion at December 31, 2021, or 62% more than the Minimum Required Assets under PMIERs ▪Maintained available holding company liquidity of $604.9 million at December 31, 2021 ▪Entered into a new, five-year $275 million unsecured revolving credit facility in December 2021 |
■Continued to prioritize the well-being and development of our people, by fostering and promoting initiatives to employ diverse talent and ensure an inclusive workforce that can work safely and flexibly ▪Developed and deployed a new people plan, including the creation of employee and leader profiles to serve as guideposts for capabilities to build throughout our workforce ▪Completed talent reviews and succession planning for leaders throughout the Company ▪Supported an organizational effectiveness assessment and internal realignment to ensure our businesses are well positioned to focus and deliver on key priorities ▪Implemented a diversity, equity and inclusion (“DEI”) roadmap, including DEI training for all employees, expansion of our employee resource group program and completion of a pay equity analysis ▪Ensured thoughtful business resiliency and safety controls for our employees through our COVID crisis management team, with active communications and strong support for remote working arrangements |
(1)Adjusted pretax operating income is a non-GAAP measure. See “Item 7. Management’s Discussion and Analysis of Financial Condition and Results of Operations—Results of Operations—Consolidated—Use of Non-GAAP Financial Measures” for the definition and reconciliation of this measure to the most comparable GAAP measure, consolidated pretax income.
See “Item 7. Management’s Discussion and Analysis of Financial Condition and Results of Operations” for further information on our results of operations and other details related to our Mortgage and homegenius businesses.
Mortgage
Mortgage Business Overview
Private mortgage insurance plays an important role in the U.S. housing finance system because it promotes affordable home-ownership and helps protect mortgage lenders and investors, as well as other beneficiaries such as the GSEs, by mitigating default-related losses on residential mortgage loans. Generally, these loans are made to home buyers who make down payments of less than 20% of the purchase price for their home or, in the case of refinancings, have less than 20% equity in their home. Private mortgage insurance also facilitates the sale of these loans in the secondary mortgage market, most of which are currently sold to the GSEs.
The performance of our Mortgage business is particularly influenced by macroeconomic conditions and specific events that impact the housing finance and real estate markets, including events that impact mortgage originations and the credit performance of our mortgage insurance portfolio, most of which are beyond our control, including housing prices, inflationary pressures, unemployment levels, interest rate changes, the availability of credit and other national and regional economic conditions. In Item 7. Management’s Discussion and Analysis of Financial Condition and Results of Operations, see “Results of Operations—Mortgage” and “Key Factors Affecting Our Results—Mortgage.”
Our Mortgage business is subject to comprehensive regulation by federal and state regulatory authorities and the GSEs. As the largest purchasers of conventional mortgage loans, and therefore, the main beneficiaries of private mortgage insurance, the GSEs impose eligibility requirements, known as PMIERs, that private mortgage insurers must satisfy in order to be approved to insure loans purchased by the GSEs. These requirements and practices, as well as those of the federal regulators that oversee the GSEs and lenders, impact the operating results and financial performance of private mortgage insurers. See “Regulation” for a comprehensive description of the significant state and federal regulations and other requirements of the GSEs that are applicable to our businesses.
Mortgage Insurance Products
Primary Mortgage Insurance
We generally provide Primary Mortgage Insurance on an individual loan basis as each mortgage is originated, but we also can provide Primary Mortgage Insurance on individual loans in an aggregate group of mortgages after they have been originated. We primarily write insurance in a “first loss” position, where we are responsible for the first losses incurred on an insured loan subject to a policy limit. See “—Mortgage Insurance Portfolio Characteristics—Mortgage Loan Characteristics.”
The terms of our Primary Mortgage Insurance coverage are set forth in a Master Policy that we enter into with each of our customers. Among other things, our Master Policies set forth the applicable terms and conditions of our mortgage insurance coverage, including among others: loan eligibility requirements; premium payment requirements; coverage terms, including cancellation of coverage; provisions for policy administration; mortgage servicing standards and requirements; exclusions or reductions in coverage under certain circumstances; insurance rescission and rescission relief provisions; claims payment and settlement procedures; and dispute resolution procedures. Our Master Policy forms, which are updated periodically, including in response to requirements issued by the GSEs, are filed in each of the jurisdictions in which we conduct business. Our Master Policy form was last updated on a broad basis in 2020, when most private mortgage insurers adopted a uniform master policy. See “—Defaults and Claims—Claims Management—Rescissions.”
Primary Mortgage Insurance provides protection against mortgage defaults at a specified coverage percentage. When there is a valid claim under Primary Mortgage Insurance, the maximum liability is determined by multiplying the claim amount, which consists of the unpaid loan principal, plus past due interest and certain expenses associated with the default, by the coverage percentage. Claims may be settled for the maximum liability or for other amounts. See “—Defaults and Claims—Claims Management” below. Although the Primary Mortgage Insurance we write protects lenders from a portion of losses resulting from mortgage defaults, it generally does not provide protection against property loss or physical damage, including damage caused by hurricanes or other severe weather events or natural disasters.
We wrote $91.8 billion and $105.0 billion of first-lien Primary Mortgage Insurance in 2021 and 2020, respectively. Substantially all of our Primary Mortgage Insurance written during 2021 and 2020 was written on a Flow Basis. After taking into consideration insurance cancellations and other adjustments within our existing portfolio, our 2021 NIW resulted in IIF of $246.0 billion at December 31, 2021, compared to $246.1 billion at December 31, 2020. Our total direct Primary Mortgage Insurance RIF was $60.9 billion at December 31, 2021, compared to $60.7 billion at December 31, 2020.
Other Mortgage Insurance Products
GSE Credit Risk Transfer. Part of our business strategy includes leveraging our core expertise in credit risk management to expand our presence in the mortgage finance industry, including by pursuing alternatives to traditional mortgage insurance execution to expand our insured portfolio of mortgage credit. We have in the past and may in the future participate in credit risk transfer programs developed by the GSEs as part of their programs to further distribute mortgage credit risk and increase the role of private capital in the mortgage market. These programs transfer additional credit risk, on an excess of loss basis, to insurance and reinsurance providers on pools of mortgage loans, which may contain loans that are already covered by private mortgage insurance. Our total RIF under these credit risk transfer transactions was $417.7 million as of December 31, 2021, compared to $392.0 million as of December 31, 2020.
Given the remote nature of this risk, we will not experience claims under these credit risk transfer transactions unless the borrower’s equity in the home, any existing private mortgage insurance (if applicable and which could be provided by us) and the GSEs’ retained risk are first depleted. Through our participation in these GSE transactions, we assume additional types of risk (beyond that which we typically cover in our traditional mortgage insurance business) associated with the risk of defaults caused by physical damage, including natural disasters such as hurricanes and wildfires, which generally are not covered by the underlying private mortgage insurance. In addition to the projected returns we may achieve on this business, we regularly evaluate this exposure, including the geographic diversity of the loans included in these transactions and the protection provided by the GSEs’ first-loss risk position, in assessing our participation in these transactions. Based on our view of the projected returns on this business, including consideration of the collateral and capital required by the GSEs to support this RIF, we discontinued our participation in the GSEs’ credit risk transfer transactions in 2021, but we could resume our participation in these transactions in the future.
Pool Mortgage Insurance. Prior to 2008, we wrote Pool Mortgage Insurance on a limited basis. At December 31, 2021, our total direct first-lien Pool Mortgage Insurance RIF was $245.5 million, as compared to $281.0 million at December 31, 2020, and represented less than 1% of our total direct first-lien insurance RIF. With respect to our Pool Mortgage Insurance, an aggregate exposure limit, or “stop loss” (usually between 1% and 10%), is generally applied to the initial aggregate loan balance on a group or “pool” of mortgages. In addition, an insured pool of mortgages may contain mortgages that are already covered by Primary Mortgage Insurance. In these transactions, Pool Mortgage Insurance is secondary to any Primary Mortgage Insurance that exists on mortgages within the pool. Our Pool Mortgage Insurance policies are privately negotiated and are separate from the Master Policies that we use for our Primary Mortgage Insurance.
Pricing
Primary Mortgage Insurance Premiums
We apply premium rates to our insurance coverage at the time coverage is requested by our lender customers, which is generally near the time of loan origination. Premiums for our mortgage insurance products are generally established based on performance models that consider a broad range of borrower, loan and property characteristics as well as current and projected market and economic conditions. Our premium rates are subject to regulation, and in most states where our insurance subsidiaries are licensed, the formulations by which we derive our premiums must be filed, and in some cases approved, before their use. See “Regulation—State Regulation.”
We have developed our pricing strategy to manage the risk/return profile and maximize the long-term economic value of our insured portfolio by balancing credit risk, profitability and volume considerations in light of the current and projected competitive environment. Consistent with this strategy, our premium rates are based on a broad range of factors including our expectations about competitive and economic conditions and cost of capital, as well as other factors and risk attributes that we consider in developing our assumptions about loan and policy performance.
Premiums on our mortgage insurance products generally are written on either: (i) a recurring basis, which can be monthly or annual premiums, pursuant to our Monthly and Other Recurring Premium Policies or (ii) as a single premium generally paid at the time of loan origination pursuant to our Single Premium Policies. We also offer products where premiums are paid as a combination of an up-front premium at origination, plus a monthly installment. In addition, premiums may include a refundable component. While the majority of our policies terminate when certain criteria, such as prescribed LTV levels, are met, some of our products provide coverage for the life of the loan, subject to certain conditions. There are many factors that influence the types of premiums we receive, including, among others: (i) the preference of customers with whom we do business; (ii) the relative premium levels we and our competitors set for the various forms of premiums offered; and (iii) the percentage of mortgage originations derived from new home purchases versus refinancing transactions, as refinances have historically been more likely to be written as Single Premium Policies.
Mortgage insurance premiums can be funded through a number of methods, and while the coverage remains for the benefit of the insured lender or third-party beneficiary, the premiums may be paid by the borrower or by the lender. Borrower-paid Monthly and Other Recurring Premiums are generally paid to us as part of the borrower’s monthly mortgage payment, while borrower-paid premiums under our Single Premium Policies are paid to us at the time of closing on the home purchase.
Lender-paid mortgage insurance premiums are paid by the lender and are typically passed through to the borrower in the form of additional origination fees or a higher interest rate on the mortgage note.
The premium rates on a majority of our Monthly and Other Recurring Premium Policies were established as a fixed percentage of the initial loan balance for a set period of time (typically 10 years), after which the premium generally declines to a lower fixed percentage for the remaining life of the policy. The premium rates on the remaining Monthly and Other Recurring Premium Policies within our insured portfolio were established as a fixed percentage of the loan’s amortizing balance over the life of the policy.
Historically, premiums in the mortgage insurance industry were primarily established through filed rate-cards. Beginning on a broad basis in 2019, the mortgage insurance industry began to widely use various pricing methodologies with differing degrees of risk-based granularity. Although these more recent pricing frameworks are based upon the same general risk attributes that historically have been a part of mortgage insurance pricing, they are incorporating into the underlying pricing tools more granular risk-based pricing factors based on multiple loan, borrower and property attributes.
The shift away from a predominantly rate-card based pricing model and the increase in “black box” pricing frameworks throughout the mortgage insurance industry provides a more dynamic pricing capability that allows for more frequent pricing changes that can be implemented quickly and has contributed to a reduction in overall pricing transparency. Further, in addition to the growing proliferation of black box pricing, industry pricing practices in recent years have also included an increased use of customized rate plans for certain customers, pursuant to which rates may be awarded to customers for only a limited period of time. With the increased prevalence of granular, “black box” pricing and the greater uniformity of master policy terms throughout the industry, pricing has become the predominant competitive market factor for private mortgage insurance and an increasing number of customers are making their choice of mortgage insurance providers primarily based on the lowest price available for any particular loan.
Overall, our approach to pricing is customer-centric and flexible; therefore, we offer a spectrum of risk-based pricing solutions for our customers. This approach represents a continuation of our strategy to pursue multiple pricing delivery options that are best suited to a lender’s loan origination process and balanced with our own objectives for managing our volume of NIW and the economic value derived from our mortgage insurance portfolio. See “Item 1A. Risk Factors—Our mortgage insurance business faces intense competition.”
GSE Credit Risk Transfer Premiums
Premium rates for credit risk transfer transactions are established through a sealed-bid auction process in which we and other potential insurers/reinsurers provide their desired allocation of the offering(s) at a specified premium rate to the GSE. We evaluate each transaction, and if we choose to participate, we develop our bid based on performance models that consider a broad range of borrower, loan and property characteristics as well as market and forecasted future economic conditions. After completion of the auction process, the GSEs set a uniform premium based on an assessment of the bids received and, based on their desired counterparty exposure, assign allocations to insurers/reinsurers up to their requested bid amounts, if the pricing is at or above their specified premium rate. As noted above, we discontinued our participation in these transactions in 2021, but we could resume our participation in these transactions in the future.
Underwriting
Mortgage loan applications are underwritten to determine whether they are eligible for our mortgage insurance. We perform this function directly or, alternatively, we delegate to our insured lenders the ability to underwrite the mortgage loans based on compliance with our underwriting guidelines.
Delegated Underwriting. Through our delegated underwriting program, we approve insured lenders to underwrite mortgage loan insurance applications based on our mortgage insurance underwriting guidelines. Each lender participating in the delegated underwriting program must be approved by our risk management group. Utilization of our delegated underwriting program enables us to meet lenders’ demands for immediate mortgage insurance coverage and increases the efficiency of the underwriting process. We use quality control sampling and performance monitoring to manage the risks associated with delegated underwriting. Under the terms of the program, we have certain rights to rescind coverage if there has been a deviation from our underwriting guidelines. For a discussion of these limited Rescission rights, see “—Defaults and Claims—Claims Management—Rescissions.” As of December 31, 2021 and 2020, 69% and 67% of our total first-lien IIF had been originated on a delegated basis, respectively.
Non-Delegated Underwriting. Approved insured lenders may submit mortgage loan applications to us so that we may perform the mortgage insurance underwriting. Some customers prefer our non-delegated underwriting program because we assume responsibility for underwriting the mortgage insurance and, subject to the terms of our Master Policies, generally have less ability to rescind coverage if there is an underwriting error. We leverage loan application data and analytics to categorize mortgage insurance applications based on credit risk and underwriting complexity to improve efficiency in our process and to ensure a heightened focus on the higher risk, complex applications. We use quality control sampling, loan performance monitoring and training to manage the risks associated with our non-delegated underwriting program. As of December 31, 2021 and 2020, 26% and 28% of our total first-lien IIF had been originated on a non-delegated basis, respectively.
Contract Underwriting. We also provide third-party contract underwriting services to our mortgage insurance customers pursuant to which we underwrite the mortgage loan for compliance with investor guidelines, which if necessary, may be separate from or in addition to underwriting for our mortgage insurance eligibility. Generally, we offer limited indemnification to our contract underwriting customers. To manage the risks associated with contract underwriting, we train our underwriters, require them to complete continuing education and routinely audit performance to monitor the accuracy and consistency of underwriting practices. As of both December 31, 2021 and 2020, 5% of our total first-lien IIF had been underwritten through contract underwriting.
Mortgage Insurance Portfolio Characteristics
Direct Risk in Force
Exposure in our mortgage insurance business is measured by RIF, which for Primary Mortgage Insurance is equal to the unpaid principal balance of the loan multiplied by our insurance coverage percentage. See “Item 7. Management’s Discussion and Analysis of Financial Condition and Results of Operations—Mortgage Insurance Portfolio—Insurance and Risk in Force” for additional information about the composition of our Primary RIF.
We analyze our mortgage insurance portfolio in a number of ways to identify any concentrations or imbalances in risk dispersion. We believe that, among other factors, the credit performance of our mortgage insurance portfolio is affected significantly by:
■general economic conditions (in particular, interest rates, home prices and unemployment);
■the age and performance history of the loans insured;
■the geographic dispersion and other characteristics of the properties securing the insured loans, such as the primary purpose of the properties, and the condition of local housing markets, including whether the properties are increasing or decreasing in value over time;
■the quality of loan underwriting and servicing; and
■the number of borrowers and credit characteristics of the borrower(s) and the characteristics of the loans insured, including the amount of the loan compared to the value of the home.
Persistency Rate
The Persistency Rate is the measure that assesses the amount of time that our insurance is remaining in force. The amount of time that our insurance certificates remain in force has a significant impact on our revenues and our results of operations. Because premiums on our Recurring Premium Policies are earned over time, higher Persistency Rates on these policies increase the premiums we receive and generally result in increased profitability and returns. Conversely, assuming all other factors remain constant, higher Persistency Rates on Single Premium business lower the overall returns from our insured portfolio, as the premium revenue for our Single Premium Policies is the same regardless of the actual life of the insurance policy.
The Persistency Rate reflects the impact that certificate cancellations have on our IIF and the future premiums that we expect to earn over time. Provided that all required premiums are paid, coverage for a loan under our Master Policy generally will be cancelled on the first of the following to occur: (i) the loan insured under the certificate is paid in full; (ii) we settle a claim with respect to the certificate; (iii) we act upon the insured’s or its servicer’s instruction to cancel coverage under the certificate, including as may be required by the HPA or pursuant to GSE guidelines; (iv) the term of coverage expires under the premium plan or upon the terms specified in the certificate; or (v) we cancel, rescind or deny coverage under the certificate.
Loan payoff following a refinance will result in cancellation of coverage and, as a result, historically there is a close correlation between interest rates and Persistency Rates, with lower interest rate environments generally increasing refinancings that increase the cancellation rate of our insurance and therefore lower our Persistency Rate. See “Regulation— Federal Regulation—Mortgage Insurance Cancellation” for more information regarding cancellation and termination requirements for borrower-paid private mortgage insurance meeting certain criteria under the HPA. Additionally, in Item 7. Management’s Discussion and Analysis of Financial Condition and Results of Operations, see “Key Factors Affecting Our Results—Mortgage—IIF and Related Drivers” and “Mortgage Insurance Portfolio—Insurance and Risk in Force” for more information.
Geographic Dispersion
Radian Guaranty is authorized to write mortgage insurance in all 50 states, the District of Columbia and Guam. We have a geographically diversified mortgage insurance portfolio and we proactively monitor the portfolio for concentration risks at both the state level and metropolitan area level known as Core Based Statistical Areas (“CBSAs”). As of December 31, 2021, three states with the highest amounts of RIF accounted for 24.7% of our RIF, with the highest state concentration being 9.3% in California.
See “Item 7. Management’s Discussion and Analysis of Financial Condition and Results of Operations—Mortgage Insurance Portfolio—Insurance and Risk in Force—Geographic Dispersion” for additional information about the geographic dispersion of our direct Primary Mortgage Insurance. Also, in Item 1A. Risk Factors, see “The credit performance of our mortgage insurance portfolio is impacted by macroeconomic conditions and specific events that affect the ability of borrowers to pay their mortgages” and “Climate change and extreme weather events could adversely affect our businesses, results of operations and financial condition.”
Mortgage Loan Characteristics
Factors that contribute significantly to our overall risk diversification and the credit quality of our RIF include, among others, geographic dispersion, as discussed above, as well as our mix of mortgage insurance products, underwriting and our risk management practices. In evaluating the credit quality of our portfolio and developing our pricing and risk management strategies, we consider a number of borrower, loan and property characteristics in assessing our risk of loss, including LTV and FICO score, as well as a number of other loan and property characteristics, including, without limitation, debt-to-income ratio, average loan size, property type, occupancy type, loan purpose and number of borrowers. See “Item 7. Management’s Discussion and Analysis of Financial Condition and Results of Operations—Mortgage Insurance Portfolio” for additional information about the credit quality and characteristics of our direct Primary Mortgage Insurance.
Defaults and Claims
Defaults
In our Mortgage segment, the default and claim cycle begins with the receipt of a default notice from the loan servicer. We consider a loan to be in default for financial statement and internal tracking purposes upon receipt of notification by servicers that a borrower has missed two monthly payments. Defaults can occur due to a variety of specific events affecting borrowers, including death or illness, divorce or other family problems, unemployment, factors impacting economic conditions (e.g., regional economic disruptions or disaster related events such as epidemics/pandemics, hurricanes, floods, tornados and wildfires) or other events. Regional economic disruptions derived from natural disasters may be exacerbated by climate change and related environmental factors, which could increase the frequency, scope and intensity of such disasters.
The default rate in our mortgage insurance business is subject to seasonality. Historically, our mortgage insurance business experiences a fourth quarter seasonal increase in the number of defaults and a first quarter seasonal decline in the number of defaults and increase in the number of Cures. While historically this has been the case, macroeconomic factors in any given period may influence the default rate in our mortgage insurance business more than seasonality.
Currently, a segment of U.S. residential mortgage loans may be subject to, or eligible for, certain types of relief as a result of the legislative response to COVID-19, including the CARES Act. Upon request by borrowers of federally or GSE-backed mortgage loans who attest to financial hardship related to the pandemic, the CARES Act requires mortgage servicers to provide these borrowers with up to 180 days forbearance on their mortgage payments, which may be extended for an additional 180 days upon request. The permissible forbearance period of 12 months under the CARES Act has been lengthened by various federal agencies and the length of the period varies depending on the agency, type of mortgage at issue and the date when the borrower initially requested the forbearance. The CARES Act does not provide a defined end date for when the 180-day forbearance must initially be offered. It is possible that the ability to request an initial forbearance may cease when the COVID-19 National Emergency ends. COVID-19 was most recently declared a continuing national emergency on February 24, 2021.
As COVID-19 forbearances end, federal law requires servicers to discuss forbearance and loss mitigation options with their borrowers and afford additional protections to borrowers before their loans are referred to foreclosure. Additionally, the CARES Act provided a temporary foreclosure and eviction moratorium for residential mortgagors with certain federally or GSE-backed mortgages. After being extended multiple times, these moratoriums have expired; however, the existence of these moratoriums significantly impacted the claims process in 2020 and 2021 by preventing the procedural steps necessary for a claim under our insurance policies to be filed, as discussed below under “—Claims.” See “Regulation—Federal Regulation—CARES Act.” While the CARES Act and related federally mandated borrower relief has provided critical support to the housing finance system throughout the pandemic, the ultimate performance of loans that remain in forbearance is not yet known. See “Item 1A. Risk Factors—An extension in the period of time that a loan remains in our defaulted loan inventory may increase the severity of claims that we ultimately are required to pay.”
Claims
Defaulted loans that fail to become current, or “cure,” may result in a claim under our mortgage insurance policies. Mortgage insurance claim volume is determined by the circumstances surrounding the default. The rate at which defaults cure, or do not go to claim, depends in large part on a borrower’s financial resources and circumstances (including whether the borrower is eligible for a loan modification), local housing prices (i.e., whether borrowers are able to cure defaults by selling the property in full satisfaction of all amounts due under the mortgage), interest rates, unemployment, inflationary pressures and other factors impacting economic conditions.
In our first-lien Primary Mortgage Insurance business, in order to submit a claim, the insured must first either acquire title to the property (typically through a foreclosure proceeding) or we must approve a third-party sale of the property. The time for a lender to acquire title to a property through foreclosure varies depending on the state, and in particular whether a state requires a lender to proceed through the judicial system to complete the foreclosure. Claim activity is not spread evenly throughout the coverage period of a book of business. Historically, except for periods of economic distress, we have experienced relatively few claims during the first two years following issuance of a policy.
In recent years, the average time for us to receive a claim has increased as a result of COVID-19-related relief programs discussed above. For example, payment and foreclosure forbearance programs instituted at the federal and state levels in response to the COVID pandemic have caused defaulted loans to remain in our defaulted loan inventory for a protracted period of time. See “Item 1A. Risk Factors—An extension in the period of time that a loan remains in our defaulted loan inventory may increase the severity of claims that we ultimately are required to pay.”
For Pool Mortgage Insurance, which represents less than 1% of our RIF at December 31, 2021, our policies typically require the insured to not only acquire title but also to actively market and ultimately liquidate the real estate asset before filing a claim, which generally lengthens the time between a default and a claim submission.
In addition to claim volume, Claim Severity is another significant factor affecting losses. We calculate the Claim Severity by dividing the claim paid amount by the original coverage amount. Factors that impact the severity of a claim include, but are not limited to, the size of the loan, the amount of mortgage insurance coverage placed on the loan, the amount of time between default and claim during which we are expected to cover certain interest (capped at two years under our Prior Master Policy and capped at three years under our 2014 and 2020 Master Policies) and expenses, and the impact of our Loss Mitigation and other loss management activities with respect to the loan.
Home price appreciation as well as pre-foreclosure sales, acquisitions and other early workout efforts help to reduce overall Claim Severity, as do actions we may take to reduce a claim payment due to servicer negligence, as discussed below in “—Claims Management.” See “Item 7. Management’s Discussion and Analysis of Financial Condition and Results of Operations—Results of Operations—Mortgage—Year Ended December 31, 2021 Compared to Year Ended December 31, 2020—Provision for Losses.”
Claims Management
Our claims management process is focused on analyzing and processing claims to ensure that we pay valid claims in accordance with our policies. Our mortgage insurance claims management department pursues opportunities to mitigate losses both before and after claims are received.
In our mortgage insurance business, upon receipt of a valid claim, we have a range of settlement options for calculating the claim amount (also referred to as calculated loss), as set forth in our Master Policies. Most frequently, we settle a valid claim with the “Percentage Option” by paying the maximum liability and allowing the insured lender to keep title to the property. For this purpose, the maximum liability is determined by multiplying (x) the claim amount (which consists of the unpaid loan principal, plus past due interest for a period of time specified in our Master Policies, plus certain expenses associated with the default, and minus certain deductions) by (y) the applicable coverage percentage. We also have the following alternative settlement options:
(i)Approved Sale Option: Subject to any reduction provided for elsewhere in our policy, we may pay the claim amount (not to exceed the lender’s entire loss or our maximum liability under the Percentage Option) by taking into account the net proceeds received by the lender following an approved sale such as a “short sale” or “deed-in-lieu” transaction;
(ii)Acquisition Option: Subject to any reduction provided for elsewhere in our policy, we may pay the entire claim amount (as described above but without application of the coverage percentage) upon the conveyance to us of good and marketable title to the property; or
(iii)Anticipated Loss Option: In certain circumstances, as outlined in our Master Policies, the settlement is primarily based on the claim amount minus the net proceeds we reasonably anticipate would be generated if the property, in its original condition on the effective insurance commitment date, reasonable wear and tear excepted, were sold to a third party for fair market value.
Approved sales in which the underlying property has been sold for less than the outstanding loan amount are commonly referred to as “short sales.” Although short sales may have the effect of reducing our ultimate claim obligation, in many cases, a short sale will result in the payment of a claim in an amount that is equal to the maximum liability amount under the Percentage Option.
Under our Master Policies, we retain the right to consent prior to consummation of any short sale. We have entered into agreements with each of the GSEs pursuant to which we delegate to the GSEs our prior consent rights with respect to short sales on loans owned by the GSEs, as long as the short sales meet applicable GSE guidelines and processes for short sales and subject to certain other factors set forth in these agreements.
We also provide for limited delegation authority to certain loan servicers for short sales under specific circumstances. For loans that are not owned by the GSEs and for which we have not granted specific delegation authority to the loan servicer, we perform an individual analysis of each proposed short sale and provide our consent to these sales when appropriate. Historically, we have consented to a short sale only after reviewing various factors, including among other items, the sale price relative to market and the ability of the borrower to contribute to any shortfall in the sale proceeds as compared to the outstanding loan amount.
After a claim is received, our loss management specialists may focus on:
■a review to determine compliance with applicable loan origination programs and our mortgage insurance policy requirements, including: (i) whether the loan qualified for insurance at the time the certificate of coverage was issued; (ii) whether the insured has satisfied its obligation in meeting all necessary conditions in order for us to pay a claim, including submitting all necessary documentation in connection with the claim (commonly referred to as “claim perfection”); and (iii) whether the loan was appropriately serviced in accordance with the standards set forth in our Master Policies;
■analysis and prompt processing to ensure that valid claims are paid in an accurate and timely manner;
■responses to loss mitigation opportunities presented by the insured; and
■management and disposal of acquired real estate.
Radian Guaranty has entered into a Factored Claim Administration Agreement with Fannie Mae that applies to certain loans owned by Fannie Mae that were insured under our Master Policies for which a claim is submitted on or after October 1, 2018. Pursuant to the agreement, for the loans subject to the agreement, Radian Guaranty will determine the amount of covered expenses forming part of a loss (other than unpaid principal balance and delinquent interest) using prenegotiated expense factors. The expense factors are based on certain characteristics of each covered loan, including the unpaid principal balance at the time of default, property type and location, and property disposition.
Claim Denials
We have the legal right under our Master Policies to deny a claim under certain conditions, such as when the loan servicer does not produce documents necessary to perfect a claim (e.g., evidence that the insured has acquired title to the property) within the time period specified in our Master Policies. Most often, a Claim Denial is the result of a servicer’s failure to provide the loan origination file or other critical servicing documents for review.
If, after requests by us, the loan origination file or other servicing documents are not provided to us, we generally deny the claim. If we deny a claim, we may continue to allow the insured the ability to perfect the claim for a limited period of time, as specified in our Master Policies. If the insured successfully perfects the claim on a timely basis, we will process the claim, including, as appropriate, by conducting a review of the loan file to ensure that underwriting and loan servicing were conducted properly.
If, after completion of this process, we determine that the claim was not perfected, other conditions precedent to coverage have not been met, or any exclusions apply, the insurance claim is denied and we consider the Claim Denial to be final and resolved. Although we may make a final determination with respect to a Claim Denial, it is possible that after we have denied coverage a legal challenge to our decision may be brought within a period of time specified under the terms of our Master Policies.
Rescissions
Mortgage insurance master policies generally protect mortgage insurers from the risk of material misrepresentations and fraud in the origination of an insured loan by establishing the right, under certain conditions, to unilaterally rescind coverage. Under the terms of our Master Policies, typical events that may give rise to our right to rescind coverage include: (i) we insured a loan in reliance upon an application for insurance that contains a material misstatement, misrepresentation or omission, whether intentional or otherwise, or that was issued as a result of an act of fraud or (ii) we find that there was negligence in the origination of a loan that we insured. We also have rights of Rescission arising from a breach of the insured’s representations and warranties that are contained in our Master Policies or endorsements thereto and are required with our delegated underwriting program.
If we rescind coverage based on a determination that a loan did not qualify for insurance, we provide the insured with a period of time to challenge, or rebut, our decision. If a rebuttal to our Rescission is received and the insured provides additional information supporting the continuation (i.e., non-rescission) of coverage, we have the claim re-examined internally by a separate, independent investigator. If the additional information supports the continuation of coverage, the insurance is reinstated and if there is a claim, it proceeds to the next step in our claims review process. Otherwise, if we determine that the loan did not qualify for coverage, the insurance certificate is rescinded (and we issue a premium refund under the terms of our Master Policies), and we consider the Rescission to be final and resolved. Although we may make a final determination internally with respect to a Rescission, it is possible that a legal challenge to our decision to rescind coverage may be brought after we have rescinded coverage during a period of time that is specified under the terms of our Master Policies.
Following the financial crisis, the FHFA and the GSEs identified minimum standards and specific requirements for private mortgage insurer master policies, including rescission relief principles that limit the right to rescind coverage when certain conditions are met. These rescission relief principles have limited the potential for Loss Mitigation Activity throughout the private mortgage insurance industry.
In accordance with these rescission relief principles, we have incorporated provisions into our 2014 Master Policy and 2020 Master Policy that generally provide rescission relief based on the number of months that borrowers remain current on their mortgage loans. As a consequence, our rights to conduct Loss Mitigation Activity involving rescission as a remedy generally are more limited under these more recent Master Policies as compared to our Prior Master Policy, but our more recent Master Policies continue to include certain life-of-loan reservation of rescission rights specified in the Master Policy, including fraud and certain patterns of fraud. See “Item 1A. Risk Factors—Changes in the charters, business practices or role of the GSEs in the U.S. housing market generally, could significantly impact our businesses.”
Claim Curtailments
We depend on third-party servicing of the loans that we insure. Servicers are responsible for being the primary contact with borrowers regarding their loans, and we generally do not have first-party contact with borrowers. Dependable loan servicing is necessary for, among other things, timely billing and premium payments to us and effective loss mitigation opportunities for delinquent or near-delinquent loans. As such, proper loan servicing is critical to the performance of our insured mortgage portfolio, especially when borrowers experience difficulty paying their mortgages.
Our Master Policies require servicers to service our insured loans in a reasonable, prudent manner consistent with the highest standards of servicing in use in the residential mortgage industry, and we have rights under our Master Policies to curtail, and in some circumstances, deny claims due to servicer negligence. Examples of servicer negligence may include, without limitation:
■a failure to report information to us on a timely basis as required under our Master Policies;
■a failure to pursue loss mitigation opportunities presented by borrowers, realtors and/or any other interested parties;
■a failure to pursue loan modifications and/or refinancings through programs available to borrowers or an undue delay in presenting claims to us (including as a result of improper handling of foreclosure proceedings), which increases the interest or other components of a claim we are required to pay; and
■a failure to initiate and diligently pursue foreclosure or other appropriate proceedings within the timeframe specified in our Master Policies.
Although we could seek post-claim recoveries from the beneficiaries of our policies if we later determine that a claim was not valid, because our loss mitigation process is designed to ensure compliance with our policies prior to payment of a claim, historically we have not sought recoveries from the beneficiaries of our mortgage insurance policies once a claim payment has been made.
From time to time, claims management may result in disputes with our customers that ultimately produce litigation or other legal proceedings. See Note 13 of Notes to Consolidated Financial Statements.
homegenius
homegenius Business Overview
A key element of our overall business strategy is to use our homegenius segment to diversify our business and revenue streams by increasing our participation in multiple facets of the residential real estate and mortgage finance markets. Our homegenius businesses are comprised of title, real estate and technology products and services. Through this business segment, we offer an array of products and services to market participants across the real estate value chain, including consumers, mortgage lenders, mortgage and real estate investors, GSEs and real estate brokers and agents. We believe that the combination of our mortgage insurance business with our unique set of diversified homegenius products and services provides us with an opportunity to become more relevant to our customers and is a competitive differentiator for us compared to other private mortgage insurance companies.
The macroeconomic conditions and other events that impact the housing, mortgage finance and related real estate markets affect the demand for the products and services we offer through our homegenius business. Sales volume in our homegenius business varies based on the overall activity in the housing and mortgage finance markets and the health of related industries. See “Item 7. Management’s Discussion and Analysis of Financial Condition and Results of Operations—Key Factors Affecting Our Results—homegenius” for additional information.
Services Offered
Title Services
We provide a comprehensive suite of insurance and non-insurance title, closing and settlement services for purchase, refinance and home equity transactions to mortgage lenders, mortgage investors and GSEs as well as directly to consumers for residential mortgage loans.
Title insurance is a contract of indemnity for losses stemming from a covered defect in title to real property, such as adverse ownership interests, liens, or other encumbrances, that predates the policy and is not otherwise excluded or excepted from coverage. Our title policies are issued following a determination of insurability, which is based on a title search that may include review of the public land records, court filings, maps, surveys, previously issued title policies, and any other documentation that may contain information concerning interests in real property.
There are two types of title insurance policies. Lenders’ policies insure the validity and priority of the insured mortgage and typically provide coverage up to the outstanding mortgage loan balance, until the loan is paid off. Owners’ policies are issued directly to the real estate purchaser and provide coverage to the owner in an amount equal to the purchase price of the property. Both types of policies are issued for a one-time premium paid at closing of the home purchase. Premium amounts vary across jurisdictions and also depend on the amount of coverage given and the type of policy being issued.
Losses on policies occur in the form of claims payouts and/or the cost of defending or establishing title. Title claims may arise from a number of factors, such as title search and examination errors, fraud, forgery, incorrect legal descriptions, and failure to pay off existing liens. Title insurers are also responsible for the cost of defending the insured in litigation alleging covered title defects, regardless of the merits of the allegations.
In addition to title insurance, we offer a full complement of title services that include tax reports; recording services; document retrieval; default title services; deed reports and property reports. Our closing and settlement services include electronic execution of some or all mortgage loan closing documents (eClosing), as well as traditional signing services.
Real Estate Services
We provide real estate services, including real estate asset management and real estate valuation services, to our customers. Our asset management solutions help real estate investors and lenders improve execution on their real estate properties. Through these asset management services, we manage properties owned primarily by financial institutions and mortgage investors by overseeing the REO disposition process. We conduct this work primarily by engaging third-party independent contractors to perform the eviction and redemption process, as well as property preservation and repairs on behalf of our customers. In addition, we offer a web-based asset management workflow solution to assist in managing REO assets, rental properties, due diligence for bulk acquisitions of multiple properties, loss mitigation efforts and short sales.
We also offer a full range of services that serve the single-family rental asset class. This asset class primarily involves the securitization of a single loan backed by multiple rental properties owned primarily by large institutional investors. Our comprehensive single family rental services provide a centralized, single point of contact for facilitating the property valuation and diligence services needed to support single family rental warehouse lending and securitization activity. Our warehouse lending valuation and diligence reviews also serve institutional iBuyers, who use technology to value, purchase and thereafter securitize, rent or sell homes.
Through our licensed real estate broker subsidiary, Red Bell, we also provide a suite of real estate valuation products and services to lenders, servicers, investors and GSEs, including broker price opinions (i.e., price estimates provided by real estate brokers familiar with the particular market) and various valuations that utilize technology, including hybrid appraisals (where licensed appraisers complement their efforts by accessing technology enabled valuation services), automated valuation services (enabling a qualified user to obtain an estimated value based on a technology driven analysis of data and information about comparable transactions) and interactive valuation services (where a qualified user can utilize their knowledge and preferences as inputs to technology tools to obtain a valuation estimate).
Technology Services
In addition to the services described above, we are developing a growing suite of real estate technology products and services that are designed to facilitate real estate transactions and are provided as proprietary SaaS solutions.
These digital services and solutions, which will be offered primarily through our licensed real estate broker subsidiary, Red Bell, include:
■geneuity, a SaaS smart workflow system that integrates features such as task management, pipeline tracking, contacts, document storage, e-signature and communication into a single platform enabling real estate brokers and agents to manage real estate transactions more efficiently;
■geniusprice technology, a SaaS property intelligence platform that combines predictive modeling, artificial intelligence, automation and imaging review capabilities with a real estate broker’s access to local data to create price estimates and property condition reports; and
■homegenius connect, a service that helps match interested homebuyers with local real estate agents.
Revenue Drivers
Our homegenius segment is dependent upon overall activity in the mortgage, real estate and mortgage finance markets, as well as the overall health of the related industries. Due, in part, to the transactional nature of the business, revenues for our homegenius segment are subject to fluctuations from period to period, including seasonal fluctuations that reflect the activities in these markets. Sales volume is also affected by the number of competing companies and alternative products offered in the market.
We earn net premiums on title insurance written by Radian Title Insurance. For our other homegenius offerings, we primarily use fixed-price contracts, pursuant to which we agree to perform the specified services and deliverables for a pre-determined per-unit price. To a lesser extent, for a portion of our REO management services and our real estate brokerage services, we utilize percentage-of-sale contracts, under which we are paid a contractual percentage of the sale proceeds upon the sale of each property.
In most cases, our contracts with our clients do not include minimum volume commitments and can be terminated at any time by our clients. Although some of our contracts and assignments are recurring in nature, and include repetitive monthly assignments, a significant portion of our current homegenius revenues are transactional in nature and may be performed in connection with securitizations, real estate purchases and sales or other transactions.
We expect our revenue from our technology products and services to grow in future periods, which would result in a higher percentage of total revenues being recurring in nature. Due to the transactional nature of our current business, our homegenius segment revenues may fluctuate from period to period as transactions are commenced or completed. In addition, our segment revenues are impacted by the volume of real estate transactions in the marketplace, which may fluctuate from period to period. See “Item 1A. Risk Factors—We face risks associated with our homegenius business.”
For additional information on the most significant factors affecting our homegenius business, see “Item 7. Management’s Discussion and Analysis of Financial Condition and Results of Operations—Key Factors Affecting Our Results—homegenius.”
All Other
All Other Overview
All Other activities include: (i) income (losses) from assets held by Radian Group, our holding company; (ii) related general corporate operating expenses not attributable or allocated to our reportable segments; (iii) income and expenses related to Clayton for all periods prior to our sale of this business in the first quarter of 2020; (iv) the income and expenses related to our traditional appraisal services, which we wound down beginning in the fourth quarter of 2020; and (v) certain other immaterial activities, including investments in new business opportunities.
See Note 4 of Notes to Consolidated Financial Statements for additional information regarding the basis of our segment reporting, including the related allocations and the impacts of the sale of Clayton and subsequent organizational changes made in the first quarter of 2020, as well as the wind down of our traditional appraisal business, announced in the fourth quarter of 2020. See Note 7 of Notes to Consolidated Financial Statements for additional information on the Clayton sale and the related financial impacts.
Competition
Mortgage
We operate in the highly competitive U.S. mortgage insurance industry. Our competitors primarily include other private mortgage insurers and federal and state governmental agencies, principally the FHA and VA.
Including us, there are currently six active participants in the private mortgage industry that are approved and eligible to write business for the GSEs. The other participants are:
■Arch Capital Group Ltd. (includes both Arch Mortgage Insurance Company and United Guaranty Residential Insurance Company);
■Enact Holdings, Inc. (formerly Genworth Mortgage Holdings, Inc.);
■Essent Group Ltd.;
■MGIC Investment Corporation; and
■NMI Holdings, Inc.
We compete directly with other private mortgage insurers primarily on the basis of price, underwriting guidelines, overall service, customer relationships, perceived financial strength (including comparative credit ratings) and reputation. Overall customer service competition in our mortgage insurance business is based on, among other things, effective and timely delivery of products, timeliness of claims payments, customer service, timely and accurate administration of policies, training, loss mitigation efforts and management and field service expertise.
For Radian, customer service also includes our ability to offer products and services through our homegenius business that are relevant to our mortgage insurance customers and complement our mortgage insurance products.
Pricing has always been competitive in the mortgage insurance industry, but as discussed above under “Mortgage—Pricing,” with the increased prevalence of granular, “black box” pricing and custom rate cards throughout the industry and the greater uniformity of master policy terms throughout the industry, pricing has become the predominant competitive market factor for private mortgage insurance. We monitor various competitive and economic factors while seeking to enhance the long-term value of our portfolio by balancing credit risk, profitability, and volume and capital considerations in developing our pricing strategies.
We take a disciplined approach to establishing our premium rates and seek to write a mix of business that we expect to produce our desired level of NIW while managing the risk/return profile and maximizing the long-term economic value of our insured mortgage portfolio, taking into consideration the competitive environment. See “Item 7. Management’s Discussion and Analysis of Financial Condition and Results of Operations—Key Factors Affecting Our Results—Mortgage—Premiums.” Based on publicly available information, we estimate that our share of NIW within the private mortgage insurance market was approximately 16% for 2021.
Certain of our private mortgage insurance competitors currently have better financial strength ratings than we have and/or are subsidiaries of larger corporations, which may give them a competitive advantage.
Private mortgage insurance competes for a share of the insurable mortgage market with the single-family mortgage insurance programs of the FHA and VA. Private mortgage insurance execution competes with the programs offered by the FHA on the basis of loan limits, pricing, credit guidelines, terms of our insurance policies and loss mitigation practices.
Since the 2007-2008 financial crisis, the private mortgage insurance industry has improved its share of the insurable, low down payment market, primarily due to: (i) improvements in the financial strength of private mortgage insurers; (ii) the development of new products, pricing delivery tools and marketing efforts directed at competing with FHA programs and execution; (iii) increases in the FHA’s pricing; (iv) the U.S. government’s pursuit of legal remedies against FHA-approved lenders related to loans insured by the FHA; and (v) various policy changes at the FHA, including the general elimination of the premium cancellation provision that exists for borrower-paid private mortgage insurance.
We believe that better execution for borrowers with higher FICO scores, lender preference and the inability to cancel FHA insurance for certain loans have provided a competitive advantage for private mortgage insurers. The FHA’s share of the total insured mortgage market (which includes FHA, VA and private mortgage insurers) was reported to be 25% in 2021, compared to 24% in 2020. See “Item 7. Management’s Discussion and Analysis of Financial Condition and Results of Operations—Key Factors Affecting Our Results—Mortgage—NIW and Related Drivers.”
If the competitive position of the FHA is enhanced, it could have a negative effect on our ability to compete with the FHA. See “Regulation—Federal Regulation—Housing Finance Reform and the GSEs’ Business Practices” for a discussion of several recent developments that could enhance the FHA’s competitive position relative to private mortgage insurance.
We also have faced increasing competition from the VA. Based on publicly available information, the VA’s share of the total insured mortgage market was 31% in 2021, compared to 32% in 2020. We believe that the VA remains a strong participant in the overall market because the VA offers 100% LTV loans and charges a one-time funding fee that can be included in the loan amount with no separate monthly expense, and because of an increase in the number of borrowers that are eligible for the VA’s program.
In addition, as market conditions change, alternatives to traditional private mortgage insurance may become more prevalent, which could reduce the demand for private mortgage insurance. These alternatives have included structures commonly referred to as “investor paid mortgage insurance” in which affiliates of traditional mortgage insurers that are not subject to the PMIERs directly insure the GSEs against loss. For additional information about these structures, see “Regulation—Federal Regulation—Housing Finance Reform and the GSEs’ Business Practices.”
It is difficult to predict what other types of credit risk transfer transactions and structures or other forms of credit enhancement, including GSE-sponsored alternatives to traditional mortgage insurance, might be used in the future. If any of these alternatives were to displace standard primary loan level private mortgage insurance, the amount of insurance we write may be reduced and our future prospects could be negatively impacted.
See “Item 1A. Risk Factors—Our mortgage insurance business faces intense competition.”
homegenius
We believe our homegenius business is uniquely positioned as a provider of an array of products and services to participants across the real estate value chain. While we are not aware of any other single company that provides a comparable range of services to the residential mortgage and real estate industries, our homegenius business has multiple strong competitors within each of its individual lines of business.
Significant competitors for our homegenius business include:
Title Services – Blend Labs, Inc.; Fidelity National Title Insurance Company; First American Financial Corporation; First National Title Insurance Company; Mortgage Connect, LP; National Title Insurance Company; North American Title Insurance Company; Old Republic Title Insurance Group, Inc.; OS National LLC; Selene Title LLC; ServiceLink IP Holding Company, LLC; Spruce Title Company; Stewart Title Guaranty Company; Summit Title Services, LLC; Westcor Land Title Insurance Company; and WFG National Title Insurance Company.
Real Estate Services – Black Knight, Inc.; ClearCapital.com, Inc.; CoreLogic, Inc.; Covius Holdings, Inc.; Equator, an Altisource Business Unit; First American Financial Corporation; First American Mortgage Solutions, LLC.; HouseCanary, Inc.; Keystone Asset Management; Pro Teck Valuation Intelligence; Res.Net; ServiceLink IP Holding Company, LLC; SingleSource Property Solutions, LLC (Resolute Diligence Solutions); VRM Mortgage Services; and Xome Inc.
In addition, we believe that our technology services and products currently under development will compete with offerings from various real estate SaaS companies. Across all business lines in our homegenius segment, we compete on the basis of industry expertise, price, technology, data access, service levels and relationships.
Customers
Mortgage
The principal customers of our mortgage insurance business are mortgage originators such as mortgage banks, commercial banks, savings institutions, credit unions and community banks.
We actively monitor our customer concentration and regularly engage in efforts to diversify our customer base. Our largest single mortgage insurance customer (including branches and affiliates) measured by NIW, accounted for 13.9% of NIW during 2021, compared to 13.3% and 7.2% in 2020 and 2019, respectively. The percentage of NIW generated by our top 10 customers was 38.3% in 2021. No single customer contributed earned premiums that accounted for more than 10% of our consolidated revenues in 2021, 2020 or 2019. See “Item 1A. Risk Factors—Our NIW and franchise value could decline if we lose business from significant customers.”
homegenius
We have a broad range of customers in our homegenius segment, including many of our Mortgage customers, due to the products and services we offer across the mortgage and real estate value chain. Our principal customers (non-affiliated) are:
■Mortgage originators such as mortgage banks, commercial banks, savings institutions, credit unions and community banks;
■Aggregators, issuers and investors in RMBS, whole loans and other mortgage-related debt instruments, including the GSEs, private equity, hedge funds, real estate investment trusts and investment banks;
■Single family rental warehouse lenders, owner/operators, builders, capital markets institutional investors and securitization issuers;
■Mortgage servicers;
■Real estate brokers and agents; and
■Consumers.
Our customers include many of the largest financial institutions and participants in the mortgage sector and, as such, our services revenue is concentrated among our largest customers. For the year ended December 31, 2021, the top 10 homegenius customers generated approximately 57.9% of the homegenius segment’s services revenue.
Sales and Marketing
Our sales and marketing efforts are focused on establishing, building and maintaining valuable customer relationships. Given the range of solutions we offer across mortgage and real estate, we believe we have significant opportunity to expand our sales to our existing customer base as well as to new customers. We have a core team of account managers who sell all
products and solutions across our businesses, as well as sales teams with subject matter expertise in particular services and the related needs of the customers we serve.
Marketing and communications activities include direct marketing; print and digital advertising; digital marketing including email, web, content and social media; public relations and thought leadership; brand strategy and expression; event marketing including customer meetings, conferences and trade shows and other targeted initiatives designed to generate new sales opportunities, drive customer adoption of our services and retain our existing customers. We continue to adapt our sales and marketing efforts based on the current environment to offer tools and techniques to connect virtually and engage with current and potential customers.
All sales and marketing efforts are supported by functional areas that provide additional touch points for our customers. For example, our Inside Sales Team is responsible for managing and growing customer relationships and promoting increased customer adoption and our Client Success, Customer Service and Training Teams provide customized service as well as educational sessions to our customers.
We expect that our approach to selling our products across our mortgage and real estate services businesses will strengthen our relationships with customers, attract new customers and enhance our ability to compete.
Investment Policy and Portfolio
Our investment portfolio is our primary source of claims paying resources and also contributes to our earnings. We seek to manage our investment portfolio within our targeted risk and return tolerances based on our current liability projections and business and economic outlook to maintain sufficient liquidity levels to satisfy our current and future operating requirements and other financial needs.
Our investment strategy uses an asset allocation methodology that takes into consideration regulatory constraints, our business environment and consolidated risks as well as current investment conditions. With respect to our fixed income investments, the following internal investment policy guidelines, among others, are applied at the time of investment and continually monitored.
| | | | | | | | |
| Internal investment policy guidelines |
| | |
| NAIC Designation | Ratings Equivalent | Internal Policy |
| 1 | “A-” and above | At least 75% of the portfolio Fair Value |
| 2 | “BBB+” to “BBB-” | Not more than 25% of portfolio Fair Value |
| 3 to 6 | “BB+” and below | Not more than 10% of portfolio Fair Value |
Our portfolio has been constructed to maximize long-term expected returns while maintaining an acceptable risk level. Our investment objectives are to utilize appropriate risk management oversight to optimize after-tax returns, while preserving capital. We calibrate the level of our short-term investments based on our overall investment portfolio duration, risk appetite and expected short-term cash requirements.
Our investment policies and strategies are subject to change, depending on regulatory, economic and market conditions and our then-existing or anticipated financial condition and operating requirements, including our current and future tax positions. The investments held at our insurance subsidiaries are also subject to insurance regulatory requirements applicable to such insurance subsidiaries.
Oversight responsibility of our investment portfolio rests with management, and allocations are set by periodic asset allocation studies, calibrated by risk and after-tax return considerations. The risks we consider include, among others, duration, convexity, liquidity, market, sector, structural, interest rate and credit risks. As of December 31, 2021, we internally managed 8.0% of the investment portfolio (the portion of the portfolio largely consisting of U.S. Treasury securities, money market funds, equities and certain exchange-traded funds), with the remainder primarily managed by three external managers. External managers are selected by management based primarily upon their ability to meet our investment goals and objectives, based upon factors such as historical returns and the stability of their management teams. Management’s selections of external managers are presented to, approved and monitored by the Finance and Investment Committee of our board of directors.
At December 31, 2021, our investment portfolio had a cost basis of $6.3 billion and a carrying value of $6.6 billion. At December 31, 2021, 95.5% of our investment portfolio was rated investment grade. The weighted-average duration of the assets in our investment portfolio as of December 31, 2021 was 4.5 years. For additional information about our investment portfolio, see “Item 7. Management’s Discussion and Analysis of Financial Condition and Results of Operations—Liquidity and Capital Resources—Investment Portfolio,” as well as Notes 5 and 6 of Notes to Consolidated Financial Statements.
Enterprise Risk Management
Risk Philosophy, Vision and Appetite
As a financial services organization, risk management is a critical part of our business. The following goals guide our strategy and actions as a risk management organization:
■Embed and continually reinforce a disciplined, corporate-wide risk culture that utilizes an understanding of risk/return trade-offs to drive quality decisions and achieve long-term, through-the-cycle profitability;
■Maintain credit, underwriting, pricing and risk/return disciplines based on sound data and analytics and continuous feedback throughout the organization;
■Proactively monitor business, counterparty, economic, housing and regulatory trends to identify and mitigate emerging risks;
■Continually refine analytical and technological capabilities, processes and systems to effectively identify, assess and manage risks; and
■Develop and leverage tools and capabilities to inform and optimize capital allocation within our risk appetite in support of our corporate strategy.
Risk Categories
Our risk appetite, or the amount of risk we are willing to take on in pursuit of value, is driven by our business strategy, which is established by executive management and overseen by our board of directors. We define our risk appetite qualitatively through the following key risk categories where strategic execution occurs: credit; financial; strategic; operational and regulatory and compliance. We do not treat reputational risk as a distinct category of risk; rather, we view reputational risk as pervasive throughout our entire risk portfolio, as each risk on its own can impact our reputation if not mitigated or managed properly.
Risk Governance
Board of Directors
Our board of directors is responsible for the general oversight of risks. Our board of directors seeks to understand and oversee the most critical risks relating to our business, allocates responsibilities for the oversight of risks among the full board and its committees, and reviews the systems and processes that management has in place to manage current risks, as well as those that could arise in the future.
The board regularly meets with management to receive reports derived from: (i) our ERM function regarding the most significant risks we are facing, and the steps being taken to assess, manage and mitigate those risks; (ii) our information security function regarding cybersecurity risks and our efforts to mitigate such risks; and (iii) our compliance programs and our efforts to embed a culture of compliance throughout the organization to encourage ethical behavior and mitigate risks of regulatory non-compliance. The full board further considers current and potential future strategic risks as part of its annual strategic planning session with management.
Executive Management
Our senior executive management team regularly monitors and discusses risks related to our businesses through various management committees. Our Pricing and Risk Committee, Capital and Liquidity Review Committee and Model Governance Committee (these committees collectively comprise our Asset Liability Committee) focus on identifying risks and decision-making related to pricing, credit, capital, liquidity and model management, including risk/return analysis associated with different business opportunities. Other management committees focused on risk management include, but are not limited to, our ERM Council, Executive Information Security Committee, Regulatory Compliance Council and Enterprise Information Governance Committee.
Integrated ERM Framework
We have adopted an integrated approach to risk management, which includes, among other things: (i) a centralized ERM function that resides within the office of our General Counsel and is responsible for overseeing the process for risk identification, assessment, management and mitigation across the organization and (ii) an internal audit function that performs periodic, independent reviews and tests compliance with risk management policies, procedures and standards across the Company.
Our ERM framework is designed to provide executive management with the ability to identify and evaluate the most significant risks we face and to calibrate risk mitigation strategies to account for challenges in the current business environment, as well as external factors that may negatively impact our operations. In practice, our ERM function represents a cross-functional and enterprise-wide effort, consisting of subject matter experts and experienced managers, that utilizes a
systematic method to identify, evaluate and monitor both known and emerging risks. Risk assessments and mitigation plans are developed to address these risks. Risk scoring and validation of the effectiveness of risk management plans through management reporting facilitate program sustainability and promote accountability for risk management activities throughout the Company.
As part of our ERM program, our mortgage insurance and title insurance businesses employ comprehensive risk management functions, which, in conjunction with the oversight of the Risk Committee of our board of directors, are responsible for monitoring compliance with our risk-related policies, managing our insured portfolios and communicating credit related issues to management, our board of directors and our customers.
Mortgage Insurance Risk Management
Risk Origination and Servicing. We believe that understanding our business partners and customers is a key component of managing risk. Accordingly, we have a Counterparty Risk Management team that leverages our Customer and Servicer Segmentation Framework so that we can more effectively perform ongoing monitoring of loan performance, underwriting quality and the risk profile and mix of business of a customer’s mortgage insurance applications. The Counterparty Risk Management team monitors trends at the customer level, identifies customers who may exceed certain risk tolerances and shares meaningful performance data with our customers to help them improve. The team is also responsible for lender corrective action in the event we discover credit performance issues, such as high early payment default levels.
Portfolio Management. We have developed risk and capital allocation models to support our mortgage insurance business. These models provide comprehensive analytics that help us establish portfolio limits for product type, loan attributes, geographic concentrations and counterparties. We proactively monitor market concentrations across these and other attributes. We also identify, evaluate and negotiate potential transactions for terminating insurance risk and for distributing risk to third parties, including through reinsurance arrangements. See “—Risk Distribution” below for more information about the use of reinsurance as a risk management tool in our mortgage insurance business. As part of our portfolio management function, we monitor and analyze the performance of various risks in our mortgage insurance portfolio. We use this information to develop our mortgage credit risk and counterparty risk policies, and as a component of our default and prepayment analytics.
Credit Policy. We maintain mortgage-related credit risk policies that reflect our tolerance levels regarding counterparty, portfolio and operational risks involving mortgage collateral. Based on our policies and risk tolerances, our credit policy function develops and updates our mortgage insurance eligibility requirements and guidelines through regular monitoring of competitor offerings, customer input regarding lending needs, analysis of historical performance and portfolio trends, quality assurance results and underwriter experience and observations. The credit policy function works closely with our mortgage insurance underwriters to ensure that underwriting decisions align with risk tolerances and principles.
Quality Assurance. Our Quality Assurance function supports our credit analytics function by auditing individual loan files to examine underwriting decisions for compliance with agreed-upon underwriting guidelines. These audits are conducted across loans submitted through our delegated and non-delegated underwriting channels. Our quality assurance team also audits our customers and our underwriters to monitor quality in our NIW.
Loss Mitigation. We have a dedicated loss mitigation group that works with servicers to identify and pursue loss mitigation opportunities for loans in both our performing and non-performing (defaulted) portfolios. This includes regular surveillance and benchmarking of servicer performance with respect to default reporting, borrower retention efforts, foreclosure alternatives and foreclosure processing. Through this process, we seek to hold servicers accountable for their performance and communicate to servicers identified best practices for servicer performance. See “Mortgage—Defaults and Claims—Claims Management” above for more information.
Risk Modeling. Our risk modeling team uses analytical techniques to develop and maintain economic scenario generation models and loan level default and prepayment models for a wide range of risk management applications, including portfolio analysis, credit decision making, forecasting and loss reserving.
Risk Distribution. In our mortgage insurance business, we use reinsurance as a capital and risk management tool to lower the risk profile and financial volatility of our mortgage insurance portfolio through economic cycles. We have distributed risk through third-party quota share and excess-of-loss reinsurance arrangements, including through the capital markets using mortgage insurance-linked notes transactions. In recent years, we have expanded our risk distribution strategy in an effort to optimize the amounts and types of capital and risk distribution deployed against insured risk. The objectives of our risk distribution strategy include: (i) supporting our overall capital plan by reducing our cost of capital, increasing capital efficiency and enhancing our projected returns on capital and (ii) reducing portfolio risk and financial volatility through economic cycles. For additional information regarding our reinsurance programs, see Note 8 of Notes to Consolidated Financial Statements.
Title Insurance Risk Management
We take a prudent approach to assessing and managing risk in our title insurance business through the use of well-trained underwriters, stringent underwriting guidelines and the imposition of per file risk limits and third-party reinsurance on a per policy basis, over certain policy limits.
Underwriting and Quality Assurance. Our agents, underwriters and title examiners receive training and feedback in the examining and underwriting of residential and commercial title insurance for both refinance and purchase transactions. Specific title commitments are selected for further review to ensure that underwriting decisions comply with agreed-upon underwriting guidelines and that the policies are within single risk limits.
Credit Policy. We have developed and maintain policies for our title insurance business, which reflect our risk tolerance levels. Risk limits are imposed on selected loan types and reinsurance is currently required on all policies with loan amounts above a specified amount.
Ceded Reinsurance. In our title insurance business, we use reinsurance as part of our capital and risk management activities, including a loss portfolio transfer reinsurance agreement that transfers a portion of the risk associated with the legacy title insurance in our portfolio (insurance written prior to the acquisition of our title insurance subsidiary) to a third party up to a specified dollar limit. We also currently maintain an excess of loss policy with a third-party reinsurer that covers losses on our entire title insurance legacy portfolio above a specified limit.
Cybersecurity Risk Management
Information security is a significant operational risk for financial institutions such as Radian and includes the risk of loss resulting from cyber-attacks. In an effort to mitigate this risk, we have an Information Security Program that is dedicated to protecting our corporate data as well as data entrusted to us by our customers and partners. At the core of our program is a defense-in-depth strategy, which utilizes multiple layers of security controls to protect data and solutions.
We use the National Institute of Standards and Technology Cybersecurity Framework (the “NIST CSF”), as a guideline to manage our cybersecurity-related risk. The NIST CSF outlines information security measures and controls over five functions: Identify, Protect, Detect, Respond and Recover. We have developed key security services, including Enterprise Data Protection, Vulnerability Management and Application Security, Managed Threat Detection and Incident Response. We test our incident response readiness and reporting through tabletop exercises, external and internal penetration testing and continuous internal security testing in our efforts to ensure that risks and incidents are identified, escalated and communicated for appropriate remediation activities to reduce risk to an acceptable level.
Our commitment to growing and maintaining our Information Security Program extends across all business lines. We have an Information Security Committee comprised of Company executives, cross-functional Incident Response teams and strong governance mechanisms designed to ensure compliance with our security policies and protocols. See “Item 1A. Risk Factors—We could incur significant liability or reputational harm if the security of our information technology systems is breached, including as result of a cyberattack, or we otherwise fail to protect confidential information, including personally identifiable information that we maintain.”
Human Capital Management
For nearly 45 years at Radian, our products and services have responsibly helped millions of families achieve their dream of homeownership. This company-wide commitment to affordable and sustainable homeownership, along with our support of our customers and the communities where we live and work, defines who we are as an enterprise and aligns with our core organizational values: Deliver the Brand Promise, Innovate for the Future, Create Shareholder Value, Our People are the Difference, Do What’s Right and Partner to Win.
We value our employees by supporting a healthy work-life balance and a team-oriented, One Radian environment. We strive to offer competitive compensation and benefits programs as well as development opportunities, while fostering a community where everyone feels included and empowered to do their best work and is encouraged to give back to their communities to make a social impact. As of December 31, 2021, we had approximately 1,800 employees of Radian Group and its subsidiaries.
COVID-19 Response
In response to the COVID-19 pandemic, we took a number of actions to focus on protecting and supporting our workforce. We seamlessly transitioned to a work-from-home virtual workforce model and throughout 2021 continued to offer the flexibility of remote work options for most employees and safe in-office opportunities for those employees with a desire to work outside their homes. Those activities requiring in-office work were supported by limited staff in office environments that comply with CDC guidelines and applicable state and local requirements. These efforts were further supported through regular COVID-19 testing regimes. In order to promote our company culture and encourage frequent communication and camaraderie, we established frequent virtual connections through weekly CEO messages, CEO and senior management roundtables and employee surveys to encourage feedback.
We continue to reinforce our employee health and wellness benefits and mental health program resources by implementing benefit program changes to accommodate COVID-19-related leaves and hardships, amending our savings and retirement plans to comply with legislation that allows for greater flexibility in response to the pandemic and providing access to third-party caregiver and household support services.
During the second quarter of 2021, in response to Radian’s transition to a mainly virtual work environment and employees voicing their preference for increased flexibility and opportunities to work remotely, we made the decision to exit, and to actively market for sublease, all office space in our former corporate headquarters in downtown Philadelphia. As part of this change, we entered into two new leases with overall reduced square footage, including our new corporate headquarters in Wayne, Pennsylvania and a Cherry Hill, New Jersey location.
Compensation and Benefits Program
Our compensation programs are designed to attract, retain and reward talented individuals who possess the skills and qualities necessary to support our business objectives, demonstrate our values, assist in the achievement of our strategic goals and create long-term value for our stockholders. Our compensation programs include base salary, annual incentive bonuses and for certain employees, other performance-related cash-incentives such as commissions and long-term equity incentive awards.
Our annual short-term incentive or bonus program is designed and approved by the Compensation and Human Capital Management Committee of our board of directors to incent achievement of our financial objectives and execution of our strategic plan in alignment with our organizational values. Compliance with our values and efforts to advance our human capital management efforts are considered as part of our employees’ performance evaluations and are taken into consideration in determining each employee’s annual short-term incentive award.
In addition to our cash and equity compensation programs, we offer employees a comprehensive benefits package, including, among others, life and health (medical, dental and vision) insurance, paid time off, paid parental leave and caregiver leave, a 401(k) plan with an employer matching contribution and tuition reimbursement. In addition, in order to support our employees and advance our mission to promote affordable, sustainable homeownership, we offer all eligible employees the opportunity to save on Radian mortgage insurance with partial reimbursement of their mortgage insurance expense. We are exploring alternatives to expand upon this employee affinity program in 2022.
Diversity, Equity and Inclusion
At Radian, we are committed to an inclusive and diverse workplace, as represented by our theme We Are Many, We Are One Radian. We believe that an equitable and inclusive environment with diverse teams produces more creative solutions, results in better, more innovative products and services and is crucial to our efforts to attract and retain key talent.
In 2019, we established a Diversity, Equity and Inclusion (“DEI”) Council that is sponsored by our CEO, led by senior management and consists of leaders and employees from across the Company to advance the program and its efforts. In 2020, we created a framework for and launched Radian’s Employee Resource Group (“ERG”) program, which is an important aspect of Radian’s DEI efforts because it not only creates inclusive communities where employees feel support, but it enriches our overall company culture. These ERGs have taken root throughout 2021, and Radian currently has three active ERGs: TrueColors, which brings together our LGBTQIA+ employees and allies; Women Heard as our Women’s group; and Vibrant Crossroads, which highlights intersectionality and multiculturalism.
We are committed to providing equal employment opportunities and promoting inclusive hiring practices, developing targeted recruitment strategies and improving internal reporting capabilities. In 2020, we trained all managers on unconscious bias and, in 2021, we hired a recruiter dedicated to DEI and deployed mandatory DEI training for all employees. We also completed a pay equity analysis in partnership with an external expert to ensure an objective review of our pay practices. We are committed to enhancing our DEI maturity, and have developed our DEI Roadmap to execute our multi-year DEI strategy. Our roadmap commits us to progress, and we report on this progress to our workforce on a quarterly basis.
In terms of gender equality, Radian has been making strides in advancing women in the workplace and in December 2021 was recognized by the Bloomberg Gender Equality Index for the fourth consecutive year. At December 31, 2021, women represented 59.9% of our workforce, 44.4% of the direct reports to our Chief Executive Officer and 40.5% of our senior management team comprising officers at the Assistant Vice President level and above. In addition, based on the number of women on Radian Group’s board of directors, Radian was awarded a ‘W’ by 2020 Women on Boards for being a ‘winning company’ and was named one of the Forum of Executive Women’s 2021 Champions of Board Diversity.
Finally, we know that advancing a culture of inclusion takes every single employee. For 2022 goal setting, all employees have been asked to include a DEI goal in their goal plan. By focusing all employees on the importance of our DEI efforts, we can continue to advance a culture of inclusion and respect.
Talent Development and Employee Engagement
We invest in our people to provide opportunities for career growth. Talent development, annual performance reviews that are focused in part on living our company values and succession planning are all important aspects of this investment. These processes help management identify and nurture top talent for leadership opportunities and support the growth and development of knowledge and skills of Radian employees, managers and leaders.
In order to measure engagement and culture across the organization, we use employee experience surveys. Our most recent employee experience survey was conducted in 2021 with a 70% employee participation rate (versus a benchmark of 65%) and responses revealed an Engaged-to-Disengaged Ratio of 21.5 to 1 (versus a benchmark of 2.1 to 1). In addition to our experience surveys, we frequently use employee pulse surveys to gather employee feedback.
Community Involvement
Radian’s financial strength and growth depend on the well-being of our employees, and therefore, the communities in which they live and we operate. Our Corporate Citizenship Program was developed to encourage and support the generosity and community involvement of our employees. Since its inception, the program – through both company and employee contributions – has provided significant financial support to charities across the country. The program consists of three pillars: charitable contributions, matching gifts and community connection.
Following the onset of the COVID-19 pandemic, we implemented a number of initiatives to help alleviate the impact of the COVID-19 pandemic, including doubling our matching gift program for employees and passing on some of our savings from reduced travel and entertainment expenses to organizations supporting essential workers. Our community-based program, Radian Connected, provides opportunities for employee engagement and community involvement, including volunteerism and opportunities for learning and skill development, as well as social opportunities to network and build stronger working relationships. We believe that this commitment to our communities helps in our efforts to attract and retain employees.
Regulation
We are subject to comprehensive regulation by both federal and state regulatory authorities. Set forth below is a description of significant state and federal regulations and other requirements of the GSEs that are applicable to our businesses. The descriptions below are qualified in their entirety by reference to the full text of the laws and regulations discussed. In Item 1A. Risk Factors, see “—Our insurance subsidiaries are subject to comprehensive state insurance regulations and other requirements, which we may fail to satisfy” and “—Legislation and administrative and regulatory changes and interpretations could impact our businesses.”
State Regulation
Overview of State Insurance Regulation and Our Insurance Subsidiaries
We and our insurance subsidiaries are subject to comprehensive regulation by the insurance departments in the various states where they are licensed to transact business. Insurance laws vary from state to state, but generally grant broad supervisory powers to agencies or officials to examine insurance companies and enforce rules or exercise discretion affecting almost every significant aspect of the insurance business. These regulations principally are designed for the protection of policyholders, rather than for the benefit of investors.
Insurance regulations address, among other things, the licensing of companies to transact business, claims handling, reinsurance requirements, premium rates and policy forms offered to customers, financial statements, periodic reporting, permissible investments and adherence to financial standards relating to surplus, dividends and other measures of solvency intended to assure the satisfaction of obligations to policyholders.
Our insurance subsidiaries’ premium rates and policy forms are generally subject to regulation in every state in which they are licensed to transact business. These regulations are intended to protect policyholders against excessive, inadequate or unfairly discriminatory rates and to encourage competition in the insurance marketplace. In most states where our insurance subsidiaries are licensed, premium rates and policy forms must be filed with the state insurance regulatory authority and, in some states, must also be approved before their use.
With respect to mortgage insurance, premium rates may be subject to actuarial justification, generally on the basis of the mortgage insurer’s loss experience, expenses and future projections. In addition, states may assess how rates are being charged to various customers based on whether they are “similarly situated” and also may evaluate general default experience in the mortgage insurance industry in assessing the premium rates charged by mortgage insurers. In many states, the filed forms allow for a deviation from the filed rates within a certain range to take into consideration various factors linked to the credit being insured.
As to title insurance, premium rates and policy forms must be filed with state insurance regulatory authorities and, in some states, must also be approved before their use. Policy forms require approval to ensure that the coverage and exceptions conform to state insurance regulations. Premium rates subject to approval often must be supported by actuarial data or a study of financial impact of the premium rate on the Company. In September of 2017, the New York State Department of Financial Services (“DFS”) issued 11 NYCRR 228 (“Regulation 208”) which regulates title insurance marketing practices, expenses and transaction related charges in the state of New York. Regulation 208 limits or bans title underwriters and agents from charging consumers certain title- and closing-related fees, and Regulation 208 contains strict rules around marketing expenses aimed at restricting or stopping certain marketing practices in the title industry. While Regulation 208
currently is one of the most strict title marketing regulations, a number of other states impose similar restrictions on such activity, either through regulations that are specific to title marketing or through broader state insurance anti-inducement and anti-rebating laws. Radian Settlement Services and Radian Title Insurance have adjusted their transaction fees and marketing practices and expenses to comply with Regulation 208 and other similar state laws.
Each insurance subsidiary is required by the insurance regulatory authority of its state of domicile, and the insurance regulatory authority of each other jurisdiction in which it is licensed to transact business, to make various filings with those insurance regulatory authorities and with the NAIC, including quarterly and annual financial statements prepared in accordance with SAP. In addition, our insurance subsidiaries are subject to examination by the insurance regulatory authority of their state of domicile, as well as each of the states in which they are licensed to transact business.
Radian Group is an insurance holding company and our mortgage insurance subsidiaries and title insurance company belong to an insurance holding company system. We are subject to the insurance holding company laws of Pennsylvania and Ohio because all of our mortgage insurance subsidiaries are domiciled in Pennsylvania and Radian Title Insurance is domiciled in Ohio. These insurance holding company laws regulate, among other things, certain transactions between Radian Group, our insurance subsidiaries and affiliates. The holding company laws of Pennsylvania and Ohio also govern certain transactions involving Radian Group’s common stock, including transactions that constitute a “change of control” of Radian Group and, consequently, a “change of control” of its insurance subsidiaries. Specifically, no person may, directly or indirectly, seek to acquire “control” of Radian Group or any of its mortgage insurance subsidiaries unless that person received prior approval after filing a statement and other documents with the Pennsylvania Insurance Department and, in the case of a change of control involving Radian Group or Radian Title Insurance, the Ohio Department of Insurance. Under Pennsylvania’s and Ohio’s insurance statutes, “control” is defined broadly and is “presumed to exist if any person, directly or indirectly, owns, controls, holds with power to vote or holds proxies representing 10% or more of the voting securities” of a holding company of a Pennsylvania or Ohio domiciled insurer. The statute further defines “control” as the “possession, direct or indirect, of the power to direct or cause the direction of the management and policies of” an insurer.
In addition, material transactions between us or our affiliates and our insurance subsidiaries or among our insurance subsidiaries are subject to certain conditions, including that they be “fair and reasonable.” These conditions generally apply to all persons controlling, or who are under common control with, us or our insurance subsidiaries. Certain transactions between us or our affiliates and our insurance subsidiaries may not be entered into unless the Pennsylvania Insurance Department or Ohio Department of Insurance, as applicable, is given 30 days’ prior notice and does not disapprove the transaction during that 30-day period.
Our two principal mortgage insurance companies as of December 31, 2021 are:
Radian Guaranty – Radian Guaranty is our primary mortgage insurance company, and is a direct wholly-owned subsidiary of Radian Group. Radian Guaranty is our only mortgage insurance company that is currently eligible to provide first-loss mortgage insurance on GSE loans. It is a monoline insurer, restricted by the laws of certain states to writing first-lien residential mortgage guaranty insurance. Radian Guaranty is authorized to write mortgage guaranty insurance (or in states where there is no specific authorization for mortgage guaranty insurance, the applicable line of insurance under which mortgage guaranty insurance is regulated) in all 50 states, the District of Columbia and Guam.
Radian Reinsurance – Radian Reinsurance is a direct wholly-owned subsidiary of Radian Group and is a licensed credit insurer in Pennsylvania. We have used Radian Reinsurance to participate in the credit risk transfer programs developed by Fannie Mae and Freddie Mac, and therefore, Radian Reinsurance currently provides mortgage credit risk insurance on GSE loans through these programs. See “Mortgage—Mortgage Insurance Products—Other Mortgage Insurance Products—GSE Credit Risk Transfer” for more information about these programs.
We also have the following mortgage insurance subsidiaries: Radian Insurance, a direct wholly-owned subsidiary of Radian Group that insures a small amount of second-lien mortgage loan risk written prior to the financial crisis; and Radian Mortgage Assurance, a direct wholly-owned subsidiary of Radian Group which had no RIF as of December 31, 2021.
As part of our title services business, we offer title insurance through Radian Title Insurance, which we acquired in March 2018. Radian Title Insurance is an Ohio domiciled title insurance underwriter and settlement services company that is licensed to issue title insurance policies in 41 states and the District of Columbia. Radian Title Insurance is an indirect subsidiary of Radian Group and is wholly owned by Radian Title Services Inc.
Mortgage Insurance Capital Requirements and Dividends
Under state insurance regulations, Radian Guaranty is required to maintain minimum surplus levels and, in certain states, a Statutory RBC Requirement that is based on maximum ratio of net RIF relative to statutory capital, or Risk-to-capital. The most common Statutory RBC Requirement is that a mortgage insurer’s Risk-to-capital may not exceed 25 to 1, while in certain other RBC States, Radian Guaranty must satisfy a MPP Requirement. As of December 31, 2021, Radian Guaranty’s Risk-to-capital was 11.1 to 1, and Radian Guaranty was in compliance with all applicable Statutory RBC Requirements. See Note 16 of Notes to Consolidated Financial Statements for more information on statutory capital requirements, including potential changes under consideration by the NAIC to the minimum capital and surplus requirements for mortgage insurers included in the Model Act. The ultimate outcome of the Model Act and new capital framework remains uncertain, including the
form of requirements and how they may be implemented and potentially enforced. See “Item 1A. Risk Factors—Our insurance subsidiaries are subject to comprehensive state insurance regulations and other requirements, which we may fail to satisfy.”
Under Pennsylvania’s insurance laws, dividends and other ordinary distributions may only be paid out of an insurer’s positive unassigned surplus unless the Pennsylvania Insurance Department approves the payment of dividends or other distributions from another source. At December 31, 2021, Radian Guaranty had a negative unassigned surplus balance of $562.8 million, primarily due to the need for mortgage guaranty insurers to establish and maintain contingency reserves, as further discussed below. Therefore, no dividends or other ordinary distributions can be paid by Radian Guaranty without prior approval from the Pennsylvania Insurance Department.
For statutory reporting, mortgage insurance companies are required annually to set aside contingency reserves in an amount equal to 50% of earned premiums. The contingency reserve, which is designed to be a reserve against catastrophic losses, essentially restricts dividends and other ordinary distributions by mortgage insurance companies as such amounts cannot be released into surplus for a period of 10 years, except when loss ratios exceed 35%, in which case the amount above 35% can be released under certain circumstances.
In light of Radian Guaranty’s negative unassigned surplus and the ongoing need to set aside contingency reserves, we do not anticipate that Radian Guaranty will be permitted under applicable insurance laws to pay ordinary dividends to Radian Group for the next several years. However, under Pennsylvania’s insurance laws, an insurer may request to pay an Extraordinary Distribution, subject to the approval of the Pennsylvania Insurance Department. See Note 16 of Notes to Consolidated Financial Statements for more information on contingency reserve requirements and statutory dividend restrictions, as well as additional information about distributions of capital paid from our insurance subsidiaries in recent years and the approval in February 2022 of a $500 million return of capital from Radian Guaranty to Radian Group.
Title Insurance Capital Requirements and Dividends
Radian Title Insurance is required to maintain Statutory Premium Reserves (“SPR”), calculated as a percentage of gross premiums collected. The SPR requirements are set by each state, with the most common being 7%. The SPR is then recovered based on a release schedule, amortized over 20 years. In addition to the SPR, Radian Title Insurance is subject to periodic reviews of certain financial performance ratios, and the states in which it is licensed can impose capital requirements on Radian Title Insurance based on the results of those ratios.
Under Ohio’s insurance laws, dividends and other ordinary distributions may only be paid out of an insurer’s positive unassigned surplus unless the Ohio Department of Insurance approves the payment of dividends or other ordinary distributions from another source. While all proposed dividends and distributions to stockholders must be filed with the Ohio Department of Insurance prior to payment, if an Ohio domiciled insurer had positive unassigned surplus, such insurer can pay dividends or other distributions during any 12-month period in an aggregate amount less than or equal to the greater of: (i) 10% of the preceding year-end statutory policyholders’ surplus or (ii) the preceding year’s statutory net income, in each case without the prior approval of the Ohio Department of Insurance. Radian Title Insurance had negative unassigned surplus at December 31, 2021 of $13.8 million, therefore it is unable to pay dividends or other ordinary distributions without prior approval from the Ohio Department of Insurance.
Other Services
In addition to our insurance subsidiaries, certain of our other subsidiaries are subject to regulation and oversight by the states where they conduct their businesses, including requirements to be licensed and/or registered in the states in which they conduct operations.
Our real estate brokerage business conducted through Red Bell provides services in all 50 states and the District of Columbia, and Red Bell and its designated broker in each state are required to hold licenses and conduct their brokerage business in conformity with the applicable license laws and administrative regulations of the states in which they are conducting their business. As a licensed real estate brokerage, Red Bell receives residential real estate information from various multiple listing services (“MLS”) through agreements with these MLS providers, which it uses to broker real estate transactions and provide valuation products and services, pursuant to the terms of these agreements. These MLS agreements include restrictions on the permitted use of the MLS information obtained through these agreements and impose requirements on the business of real estate brokerages in order to maintain eligibility to continue to receive the MLS information. If these agreements were to terminate or Red Bell otherwise were to lose access to this information, it could negatively impact Red Bell’s ability to conduct its business.
Radian Mortgage Capital LLC (“RMC”) is an indirect wholly-owned subsidiary of Radian Group that has been formed as a vehicle for exploring opportunities to leverage our industry knowledge and customer relationships to opportunistically expand our channels for aggregating, managing and distributing mortgage credit risk, including potentially purchasing residential mortgage loans and issuing residential mortgage-backed securities. RMC is not yet conducting business, but is licensed in 14 states and positioned to purchase and hold residential mortgages on a nationwide basis. See “Item 1A. Risk Factors—Investments to grow our existing businesses, pursue new lines of business or new products and services within existing lines of business subject us to additional risks and uncertainties.”
Radian Lender Services LLC provides third-party underwriting and loan processing services to lenders. This entity and its employees that provide our contract underwriting and loan processing services are eligible to provide these services in compliance with the SAFE Act for underwriting in all 50 states and the District of Columbia and in compliance with loan processing requirements in 45 states and the District of Columbia. See “—Federal Regulation—The SAFE Act.”
Radian Settlement Services and its subsidiaries provide title and escrow services and these entities are required to hold licenses in the jurisdictions where they operate their business. Title insurance agency and escrow licensing is primarily regulated by states in which the services are being offered, with licensing and registration typically within the jurisdiction of each state’s department of insurance. Radian Settlement Services is domiciled and licensed in Pennsylvania as a resident title insurance agency and, together with its subsidiaries, is licensed in 43 additional states.
Radian Valuation Services LLC is an appraisal management company, licensed in all 50 states and the District of Columbia, that supports certain valuation services provided by Red Bell. Real estate appraisal management statutes and regulations vary from state to state, but generally grant broad supervisory powers to agencies or officials to examine companies and enforce rules. While these businesses are generally state regulated, the Dodd-Frank Act established minimum requirements to be implemented by states regarding the registration and supervision of appraisal management companies. Most states have based their legislation on model legislation developed by the Appraisal Institute for the registration and oversight of appraisal management companies.
Information Security
The DFS issued cybersecurity regulations known as “Part 500” that became effective March 1, 2017 and apply to all financial institutions and insurance companies licensed under the New York Banking, Insurance, and Financial Services Laws, including Radian Guaranty and certain of our other subsidiaries. The regulations require covered entities to, among other things: establish a cybersecurity program; adopt a written cybersecurity policy; designate a Chief Information Security Officer responsible for implementing, overseeing and enforcing the cybersecurity program and policy; and have policies and procedures designed to ensure the security of information systems and nonpublic information accessible to, or held by, third-parties, along with a variety of other requirements to protect the confidentiality, integrity and availability of information systems. Also in 2017, the NAIC issued an Insurance Data Security Model Law, which was modelled after Part 500, and which several states have adopted. The stated intention of that Model Law is that if a covered insurance company is compliant with Part 500, it also would be in compliance with the NAIC Insurance Data Security Model Law.
Privacy
The State of California enacted the California Consumer Privacy Act (“CCPA”), which became effective in 2020 and applies to any company that does business in California and meets certain threshold requirements. We believe Radian Group and certain of its affiliates may be deemed covered businesses under the CCPA.
The CCPA creates a new privacy framework for covered businesses that collect, sell or disclose personal information of California consumers. Companies subject to the CCPA are required to establish procedures to enable them to comply with a California consumer’s data privacy rights, including by disclosing the privacy practices of the entity and responding to consumer requests within prescribed timeframes. The CCPA provides a private right of action for data breaches, including statutory or actual damages, and public enforcement by the California Attorney General for other violations.
On November 3, 2020, California voters approved a ballot initiative known as Proposition 24, which created a new privacy law known as the California Privacy Rights Act (“CPRA”). The CPRA is designed to enhance certain of the privacy protections for California consumers that were created by the CCPA. Although most of the CPRA’s provisions will not go into effect until January 1, 2023, the CPRA is an expansive privacy law which will create additional compliance obligations for covered entities.
We have put policies and procedures in place to comply with the CCPA. In addition to California, other states have started to move forward with new privacy regulations and federal regulators have proposed draft federal privacy legislation, all of which, to the extent they are adopted, could impose additional compliance obligations on covered entities beyond those currently in effect and could impact our businesses or those of our customers. The earliest that these other laws are scheduled to go into effect is January 2023.
Federal Regulation
CARES Act
Since the outbreak of the pandemic, there have been a number of governmental efforts to implement programs designed to assist individuals and businesses impacted by the COVID-19 virus, including the CARES Act that was enacted on March 27, 2020. The CARES Act provided a temporary foreclosure and eviction moratorium for residential mortgagors with certain federally- or GSE-backed mortgages. After being extended multiple times, the GSEs’ moratorium on single-family real estate owned (REO) evictions expired on September 30, 2021. The GSEs’ moratoriums on most single-family foreclosures also were
extended multiple times before expiring December 31, 2021, which was the expiration date of the foreclosure moratorium imposed by the CFPB.
In addition, under the CARES Act, upon request by borrowers of federally-backed mortgage loans who attest to financial hardship related to the pandemic, mortgage servicers are required to provide these borrowers with up to 180 days forbearance on their mortgage payments, which may be extended for an additional 180 days upon request, without requiring validation by the borrowers of their hardship. The CARES Act provides no end date for when the 180 days forbearance must initially be offered. The permissible forbearance period of 12 months under the CARES Act has been lengthened by various federal agencies and the length of the period varies depending on the agency and type of mortgage at issue. For example, the GSEs extended the allowable forbearance period from 12 months to 18 months for those borrowers who were in an active COVID-19-related forbearance program as of February 28, 2021.
The GSEs have announced that, at the end of a forbearance plan, the homeowner may not be required to pay back their reduced or suspended mortgage payments in one lump sum, but may be eligible for a number of different options offered by their mortgage servicer, including repayment plans, resuming normal payments or lowering the monthly loan payment through a modification. For additional information on the potential impacts of the CARES Act on the GSEs, loan servicers and our PMIERs financial requirements, in Item 1A. Risk Factors, see “—Radian Guaranty may fail to maintain its eligibility status with the GSEs, and the additional capital required to support Radian Guaranty’s eligibility could reduce our available liquidity,” “—Changes in the charters, business practices or role of the GSEs in the U.S. housing market generally, could significantly impact our businesses,” and “—Our business depends, in part, on effective and reliable loan servicing.”
GSE Requirements for Mortgage Insurance Eligibility
As the largest purchasers of conventional mortgage loans, and therefore, the main beneficiaries of private mortgage insurance, the GSEs impose eligibility requirements that private mortgage insurers must satisfy in order to be approved to insure loans purchased by the GSEs. The PMIERs initially became effective December 31, 2015 and aim to ensure that approved insurers will possess the financial and operational capacity to serve as strong counterparties to the GSEs throughout various market conditions. The PMIERs are comprehensive, covering virtually all aspects of the business and operations of a private mortgage insurer of GSE loans, including internal risk management and quality controls, the relationship between the GSEs and the approved insurer and the approved insurer’s financial condition. The PMIERs contain extensive requirements related to the conduct and operations of our mortgage insurance business, including operational requirements in areas such as claim processing, loss mitigation, document retention, underwriting, quality control, reporting and monitoring, among others. Radian Guaranty currently is an approved mortgage insurer under the PMIERs.
The PMIERs’ financial requirements require that a mortgage insurer’s Available Assets meet or exceed its Minimum Required Assets. The PMIERs’ financial requirements include increased financial requirements for defaulted loans, as well as for performing loans with a higher likelihood of default and/or certain credit characteristics, such as higher LTVs and lower FICO credit scores. With respect to defaulted loans, the PMIERs recognize that loans that have become non-performing as a result of a FEMA Declared Major Disaster generally have a higher likelihood of curing following the conclusion of the event and therefore applies a Disaster Related Capital Charge to reduce the Minimum Required Asset factor for these loans.
In 2020, in response to the COVID-19 pandemic, the GSEs issued guidelines (“National Emergency Guidelines”) that became effective June 30, 2020 and, among other things, adopted the COVID-19 Amendment to the PMIERs to apply the Disaster Related Capital Charge nationwide to certain non-performing loans that we refer to as COVID-19 Defaulted Loans, which comprise non-performing loans that either: (i) have an Initial Missed Payment occurring during the COVID-19 Crisis Period or (ii) are subject to a forbearance plan granted in response to a financial hardship related to COVID-19 (which is assumed under the COVID-19 Amendment to be the case for any loan that has an Initial Missed Payment occurring during the COVID-19 Crisis Period and is subject to a forbearance plan), the terms of which are materially consistent with the terms of forbearance plans offered by the GSEs.
Under the COVID-19 Amendment, the Disaster Related Capital Charge applies for three calendar months beginning with the month the loan becomes non-performing (i.e., missed two monthly payments), or if greater, the period of time that the loan is subject to a forbearance plan, repayment plan or loan modification trial period granted in response to a financial hardship related to COVID-19. After being extended once in December 2020, the COVID-19 Crisis Period expired as of March 31, 2021. As a result, as of April 1, 2021, the Disaster Related Capital Charge is no longer applied to all new defaults, and instead is applied only to new defaults if they are subject to a COVID-19 forbearance plan, regardless of whether the forbearance plan was entered into before or after the expiration of the COVID-19 Crisis Period.
The Disaster Related Capital Charge will continue to be applied to these COVID-19 Defaulted Loans for as long as they remain in the COVID-19 forbearance plan, repayment plan or loan modification trial period. Further, if the National Emergency Guidelines and the COVID-19 Amendment are terminated, the Disaster Related Capital Charge would then be applied to defaulted loans in accordance with the PMIERs’ provision pertaining to loans that have become non-performing as a result of a FEMA Declared Major Disaster, to the extent these provisions are still applicable in the state where the property is located. See “Item 7. Management’s Discussion and Analysis of Financial Condition and Results of Operations—Liquidity and Capital Resources—Mortgage.”
In addition to the increased financial requirements for defaulted loans and certain performing loans, the PMIERs financial requirements also impose limitations on the credit that is granted for certain Available Assets. For example, the PMIERs limit the amount of credit given to surplus notes issued by a mortgage insurer to 9% of Minimum Required Assets. In addition, the PMIERs prohibit Radian Guaranty from engaging in certain activities such as insuring loans originated or serviced by an affiliate (except under certain circumstances) and require Radian Guaranty to obtain the prior consent of the GSEs before taking many actions, which may include, among other things, entering into various intercompany agreements, settling loss mitigation disputes with customers and commuting risk.
The GSEs have significant discretion under the PMIERs and may amend the PMIERs at any time, although the GSEs have communicated that for material changes, including large-scale material changes affecting Minimum Required Assets, they will generally provide written notice 180 days prior to the effective date and engage in a discussion and comment process with the private mortgage insurers regarding the proposed changes prior to finalizing them. The most recent large-scale revisions to PMIERs, or PMIERs 2.0, became effective on March 31, 2019, and the PMIERs were further updated in June 2020 to specifically address the COVID-19 pandemic.
It is possible that the GSEs may seek to amend PMIERs 2.0 in the future to align the financial requirements of the PMIERs with the capital requirements for the GSEs set forth in the ECF. The ECF was finalized in December 2020, but further potential changes have since been publicly proposed and are under evaluation by the FHFA. See “—Housing Finance Reform and the GSEs’ Business Practices” below for additional information on the ECF.
As part of our capital and risk management activities, including to manage Radian Guaranty’s capital position under the PMIERs financial requirements, we have distributed risk through third party quota share and excess-of-loss reinsurance arrangements, including through the capital markets using insurance-linked-notes transactions. The initial and ongoing credit that we receive under the PMIERs financial requirements for these risk distribution transactions is subject to the periodic review of the GSEs and could be influenced by the ECF which, as finalized in December 2020, provides the GSEs with a reduced amount of credit for their own credit risk transfer activities.
See “Item 1A. Risk Factors—Radian Guaranty may fail to maintain its eligibility status with the GSEs, and the additional capital required to support Radian Guaranty’s eligibility could reduce our available liquidity.”
Housing Finance Reform and the GSEs’ Business Practices
Legislative Reform
The federal government plays a significant role in the U.S. housing finance system through, among other things, the involvement of the FHFA and GSEs, the FHA and the VA. The GSEs’ charters, which cannot be altered outside of federal legislation, generally prohibit them from buying low down payment mortgage loans without certain forms of credit enhancement, the most common form of which has been private mortgage insurance.
Since FHFA was appointed as conservator of the GSEs in September 2008, there has been a wide range of legislative proposals to reform the U.S. housing finance market, including proposals for GSE reform ranging from some that advocate nearly complete privatization and elimination of the role of the GSEs to others that support a system that combines a federal role with private capital. While many legislative proposals have been debated and occasionally advanced through various legislative procedures, no reform proposal has reached an advanced legislative stage. As a consequence, most reform related actions with respect to the housing finance system have occurred administratively through regulatory actions.
Administrative Reform
The executive branch of the government (the “Administration”), typically through its Departments and regulatory agencies, offers perspectives on the future of housing finance in the U.S., including objectives for future strategic direction and areas of focus. As a result, a change in Administrations can significantly alter the strategic direction of housing finance in the U.S.
Although many Departments or agencies impact housing finance in some manner, the most prominent and directly impactful are the FHFA, HUD, the U.S. Department of the Treasury (“Treasury”) and the CFPB. In June 2021, following a Supreme Court decision that determined that the FHFA director may be removed by the President other than for cause, President Biden removed the FHFA director appointed by President Trump and appointed Sandra Thompson as acting director of the FHFA. Since assuming the role of acting director of the FHFA, Ms. Thompson has taken a number of actions that represent a reversal of the previous FHFA leadership’s primary focus on preparing the GSEs to exit from conservatorship by increasing the GSEs’ overall capital levels and reducing their credit risk profile. In contrast, the FHFA under acting director Thompson has been focused on increasing the accessibility and affordability of mortgage credit, in particular to low- and moderate-income borrowers and underserved communities, in addition to ensuring the safety and soundness of the GSEs. The Supreme Court’s decision providing that the FHFA director may be removed by the President without cause creates a higher likelihood that the direction of the FHFA and its oversight over the GSEs may be impacted by elections and the then political leanings of the Administrations in power than previously was the case.
Senior Preferred Stock Purchase Agreements. The Treasury currently owns the preferred stock of the GSEs pursuant to the terms of PSPAs, and therefore, has significant influence over the fate and direction of the GSEs. Prior to a December
2017 amendment to the PSPAs, which allowed each GSE to retain a $3 billion capital reserve, the GSEs were required under the PSPAs to sweep all profits to Treasury. In September 2019, Treasury and the FHFA further amended the PSPAs to suspend the quarterly “net worth sweep” and allow the GSEs to build a capital reserve of up to $45 billion collectively, and in January 2021, prior to the change in Administration, the PSPAs were amended again to allow the GSEs to continue to retain capital up to the amounts prescribed in newly revised GSE capital requirements, pursuant to the ECF and as discussed below.
As part of the January 2021 amendment to the PSPAs, the Trump appointed leadership in Treasury and FHFA also agreed that the GSEs must restrict their acquisition of higher-risk single-family mortgage loans, including in particular the acquisition of investor loans and single-family mortgage loans with two or more higher risk characteristics (i.e., LTVs greater than 90%, debt-to-income ratios greater than 45% and FICO credit scores less than 680), to their then current levels. The January 2021 PSPA amendment further restricted the quality of loans that may be purchased by the GSEs by limiting the GSEs’ purchases to, among other enumerated types, loans that meet the QM definition. In September 2021, the Biden appointed leadership in Treasury and the FHFA suspended the limitations on GSE purchases of loans deemed higher risk, set forth in the January 2021 amendments to the PSPAs.
Enterprise Capital Framework. Throughout 2020, under the Trump appointed leadership, the FHFA advanced certain initiatives to develop new capital and liquidity requirements for the GSEs, which were viewed as critical to any future release of the GSEs from conservatorship. In December 2020, the FHFA finalized a new ECF for the GSEs and also proposed new liquidity requirements.
Among other things, as compared to the prior version of the ECF, the ECF finalized in 2020: (i) significantly increased the capital requirements of the GSEs; (ii) decreased the capital credit provided to the GSEs for credit risk transfer transactions, which have been a significant component of the GSEs capital and risk management strategy for the past several years; and (iii) reduced the overall capital relief extended to the GSEs for loans with private mortgage insurance.
In December 2020, the FHFA also proposed new liquidity requirements for the GSEs, which impose a mix of new cash-flow based requirements and long-term liquidity and funding requirements. The liquidity requirements were proposed to be effective in September 2021, but to date have not been adopted. Under acting director Thompson, the FHFA evaluated the ECF that was finalized in 2020 for further changes, and in September 2021 proposed changes that would have the effect of reducing the GSEs’ total capital requirements from those finalized, including by giving greater credit to credit risk transfer. In December 2021, the FHFA also issued a proposed rule that would require the GSEs to submit annual capital plans to the FHFA and to provide the agency with advance notification of certain capital activities.
The ECF and proposed new liquidity requirements could significantly alter the business practices and operations of the GSEs. There are many considerations related to financial, underwriting, risk management, counterparty and operational areas that likely will need to be addressed by the GSEs in order to come into compliance with the ECF new capital requirements and the proposed liquidity requirements, regardless of the form ultimately adopted, which could have a material effect on the conventional mortgage market and potentially our business with the GSEs.
Access and Affordability. The Biden Administration has proposed a housing plan focused on: (i) increasing access to sustainable homeownership and making housing more affordable for low- and moderate-income borrowers; (ii) ensuring the housing finance system is equitable, by identifying and eliminating discriminatory or unfair practices in the housing system; (iii) increasing the supply, lowering the cost and improving the quality of housing, including through investments in resilience, energy efficiency, and accessibility of homes; and (iv) providing financial assistance to help Americans buy or rent safe, quality housing, including down payment assistance.
Since assuming leadership over the FHFA in June 2021, in addition to amending the PSPAs and proposing revisions to the ECF, the Biden appointed FHFA leadership team has instituted changes to further advance mortgage access and affordability, including the following actions:
■In August 2021, entered into a memorandum of understanding with HUD to collaborate in addressing fair housing and fair lending;
■In August 2021, cancelled a 50-basis point adverse market fee on refinance transactions;
■In October 2021, raised the area median income limitations from 80% to 100% for the GSEs’ special refinance programs aimed at supporting low- and moderate-income borrowers’ ability to take advantage of the low interest rate environment; and
■In October 2021, announced that “desktop appraisals,” which represent an alternative to traditional home appraisals, would be incorporated into the GSEs’ guidelines for many new purchases beginning in early 2022.
In addition to these actions, the FHFA has requested the GSEs to produce three-year plans focused on equitable housing.
Radian Guaranty and other private mortgage insurance companies have been engaged in discussions with the GSEs regarding how the industry may support the GSEs to advance these objectives. Depending on the outcome of such dialogue, one or both of the GSEs, together or in conjunction with one or more private mortgage insurers, could implement further initiatives in pursuit of housing policy objectives that could require changes to the GSEs’ business practices and impact our
businesses. See “Item 1A. Risk Factors—Changes in the charters, business practices, or role of the GSEs in the U.S. housing market generally, could significantly impact our businesses.”
New Products. In October 2020, the FHFA leadership released for comment a proposed rule regarding the process for how it will consider and approve new GSE activities and products. Among other things, the proposed rule would redefine criteria for determining what constitutes a new activity that requires prior notice to the FHFA and for determining whether the activity constitutes a “new product” that requires public notice and comment, describing a new product as “any new activity that FHFA determines merits public notice and comment on matters of compliance with the applicable sections of [a GSE’s] authorizing statute, safety and soundness, or public interest.” Given the size and market influence of the GSEs, this new proposed rule is generally viewed as important to ensure that the GSEs are not otherwise encroaching on areas that may be more appropriately served by private capital.
It is difficult to predict what types of new products and activities may be proposed in the future and, if applicable, whether they may be approved by the FHFA. For example, if any existing or future credit risk transfer transactions and structures were to displace primary loan level or standard levels of mortgage insurance, the amount of mortgage insurance we write may be reduced, which could negatively impact our franchise value, results of operations and financial condition.
In 2018, Freddie Mac and Fannie Mae announced the launch of pilot programs, IMAGIN and EPMI, respectively, as alternative ways for lenders to obtain credit enhancement and sell loans with LTVs greater than 80% to the GSEs. These investor-paid mortgage insurance programs, in which insurance was acquired directly by each GSE through entities that were not subject to compliance with the PMIERs, have many of the same features as private mortgage insurance and represent an alternative to traditional private mortgage insurance products that are provided to individual lenders. These programs experienced limited volumes and in June 2021 were discontinued for new business, although they could be relaunched in the future. Further, the proposed rule regarding new products states that it is intended to apply to any future pilot programs, so it is unclear whether the same standards and procedures proposed in the new rule also would apply to existing pilots such as IMAGIN and EPMI if they are relaunched.
COVID-19. In addition to the matters discussed above, the future of the GSEs is likely to continue to be impacted by the ongoing COVID-19 pandemic. In light of the COVID-19 pandemic, the FHFA has adjusted its oversight over the GSEs to ensure the GSEs are able to support borrowers impacted by the pandemic and protect the ongoing functioning of the housing finance system.
In response to the pandemic, the FHFA and the GSEs temporarily suspended all foreclosures and evictions; temporarily instituted mortgage forbearance; temporarily streamlined the appraisal, employment verification and loan closing processes to address frictions in the mortgage origination process created by social distancing and stay-at-home orders; implemented a four-month limit on servicer advance obligations for loans in forbearance; adopted the COVID-19 Amendment to the PMIERs effective June 30, 2020; and provided that loans in COVID-19 forbearance will remain in mortgage-backed securities pools for at least the duration of the forbearance. To assist borrowers exiting COVID-19 forbearance plans, the GSEs have also provided options to address forborne payments, which include payment deferral, borrower repayment plans and loan modifications. The GSEs have updated servicer guidelines regarding options specific to COVID-19-related forbearance, including borrower eligibility for these programs.
In June 2021, the CFPB issued a final rule amending Regulation X, which provides servicers with the option to provide certain streamlined loan modification options to borrowers based on the evaluation of an incomplete loss mitigation application for those with COVID-19-related hardships. This rule also addresses temporary servicer communication requirements for borrowers approaching the end of a COVID-19 forbearance plan.
As the situation continues to evolve, the actions or potential inactions of the FHFA and GSEs in response to COVID-19 are likely to continue to have a significant impact on the overall functioning of the housing finance system. In Item 1A. Risk Factors, see “—Changes in the charters, business practices or role of the GSEs in the U.S. housing market generally, could significantly impact our businesses” and “—Our mortgage insurance business faces intense competition.”
HUD/FHA
Private mortgage insurance competes for a share of the insurable mortgage market with the single-family mortgage insurance programs of the FHA, including on the basis of loan limits, pricing, credit guidelines, terms of our insurance policies and loss mitigation practices.
Since the financial crisis, the private mortgage insurance industry has improved its share of the insurable, low down payment market, primarily due to: (i) improvements in the financial strength of private mortgage insurers; (ii) the development of new products, pricing delivery tools and marketing efforts directed at competing with FHA programs and execution; (iii) increases in the FHA’s pricing; (iv) the U.S. government’s pursuit of legal remedies against FHA-approved lenders related to loans insured by the FHA; and (v) various policy changes at the FHA, including the general elimination of the premium cancellation provision that still exists for borrower-paid private mortgage insurance.
As discussed above, the Biden Administration has been pursuing actions that will further its stated objective of increasing access to affordable mortgages for low- and moderate-income borrowers. In this regard, the Biden Administration may choose to reduce the FHA’s annual or upfront premiums and/or eliminate the life-of-loan premium requirement for FHA
insured loans. It is uncertain if and when the FHA may change its pricing and what form this price reduction could take; however, any change in the FHA’s pricing that would improve FHA execution compared to execution through the GSEs with private mortgage insurance could negatively impact our NIW volume.
As last reported in November 2021, the FHA’s Mutual Mortgage Insurance (MMI) Fund had a combined capital ratio for fiscal year 2021 of 8.03%, above the 2% ratio that the FHA is required to maintain. While this would suggest that it may be more likely that the FHA will lower pricing, the pandemic has had a significant negative impact on the FHA’s insured portfolio, including a significant increase in the total percentage of severely delinquent loans, making it more difficult to predict any future pricing actions the FHA may pursue.
In addition, in 2019, HUD issued a Memorandum of Understanding (“MOU”) with the Department of Justice (“DOJ”) that provides guidance on the process for enforcing the False Claims Act (“FCA”), and revisions of annual and loan-level certifications which became effective January 1, 2020. The MOU provides that alleged violations of the FCA will be primarily addressed through HUD administrative proceedings and only referred to the DOJ under certain circumstances. While we do not believe the MOU has had a significant impact on the pool of lenders doing business with the FHA, it could make the FHA more attractive to lenders who previously reduced their business with the FHA because of concerns regarding the DOJ’s pursuit of legal remedies against FHA lenders.
The Dodd-Frank Act
The Dodd-Frank Act mandates significant rulemaking by several regulatory agencies to implement its provisions. The Dodd-Frank Act established the CFPB to regulate the offering and provision of consumer financial products and services under federal law, including residential mortgages, and transferred authority to the CFPB to enforce many existing consumer related federal laws, including the Truth in Lending Act and RESPA.
Among the most significant provisions for private mortgage insurers under the Dodd-Frank Act are the ability to repay mortgage provisions (“Ability to Repay Rule”), including a related safe harbor set forth in the QM Rule (defined below), the securitization risk retention provisions and the expanded mortgage servicing requirements under the Truth in Lending Act and RESPA.
Qualified Mortgage Requirements—Ability to Repay Requirements
The Ability to Repay Rule requires mortgage lenders to make a reasonable and good faith determination that, at the time the loan is consummated, the consumer has a reasonable ability to repay the loan. The Dodd-Frank Act provides that a creditor may presume that a borrower will be able to repay a loan if the loan has certain low-risk characteristics that meet the definition of a qualified mortgage (“QM Rule”). This QM presumption is generally rebuttable, however, loans that are deemed to have the lowest risk profiles are granted a safe harbor from liability (“QM Safe Harbor”) related to the borrower’s ability to repay the loan.
In implementing the QM Rule, the CFPB established rigorous underwriting and product feature requirements for loans to be deemed qualified mortgages (“Original QM Definition”), including that the borrower does not exceed a 43% debt-to-income ratio after giving effect to the loan. As part of the Original QM Definition, the CFPB also created a special exemption for the GSEs, which is generally referred to as the “QM Patch,” that allows any loan that meets the GSE underwriting and product feature requirements to be deemed to be a qualified mortgage, or QM, regardless of whether the loan exceeds the 43% debt-to-income ratio.
In December 2020, the CFPB finalized two new definitions of QM. One of these new QM definitions (the “New General QM Definition”) is intended to replace the underwriting focused approach of the Original QM Definition, including the 43% debt-to-income ratio limitation, with a new pricing-based approach to QM. Under the New General QM Definition, certain underwriting considerations are retained, but QM status generally is achieved if the loan is priced at no greater than 2.25% above the Average Prime Offer Rate (“APOR”). Loans priced at or less than 1.5% above APOR are subject to the QM Safe Harbor, while all other QM loans would receive the general rebuttable presumption that the loans met the ability to repay standard.
Separately, the CFPB created another new QM definition (“Seasoned QM”) for first-lien, fixed-rate loans that meet certain performance requirements over a 36-month seasoning period and are held in the lender’s portfolio until the end of the seasoning period. Both new QM definitions became effective on March 1, 2021. The New General QM Definition originally had a mandatory compliance date of July 1, 2021, after which the Original QM Definition and QM Patch would no longer apply. In April 2021, the CFPB issued a new rule delaying the mandatory compliance deadline for the New General QM Definition until October 1, 2022, thereby preserving the Original QM Definition and QM Patch until such date.
On April 8, 2021, the GSEs announced that for loan applications received on or after July 1, 2021, they will only purchase loans satisfying the New General QM Definition. As a result, even though the CFPB has delayed the mandatory compliance date for the New General QM Definition until October 1, 2022, for GSE-acquired loans with applications received on or after July 1, 2021, the QM Patch is effectively limited to loans that satisfy the New General QM Definition. This decision by the GSEs reduced the number of loans that otherwise would have been designated QM compared to those receiving QM designation under the QM Patch, although not materially.
The QM Rule requires that points and fees paid at or prior to closing cannot exceed 3% of the total loan amount, with higher points and fees thresholds provided for loan amounts below $114,847. Any mortgage insurance premiums paid by the borrower at or before the time of loan closing must be applied toward the 3% points and fee calculation, unless such premiums are in excess of the FHA upfront premium amount and are automatically refundable on a pro-rata basis. There are no similar restrictions on the points and fees associated with FHA premiums, and thus FHA has a market advantage for smaller balance loans where the 3% cap is more easily reached.
The Dodd-Frank Act also granted the FHA, VA and the USDA flexibility to establish their own definitions of qualified mortgages for their insurance guaranty programs. Both the FHA and VA have created their own definition of qualified mortgages that differ from both the CFPB’s Original QM Definition and New General QM Definition. For example, the FHA’s QM Safe Harbor definition currently applies to loans priced at or less than APOR plus the sum of 115 basis points and the FHA’s annual mortgage insurance premium rate, which is effectively broader than the QM Safe Harbor adopted under the New General QM Definition. These alternate definitions of qualified mortgages are more favorable to lenders and mortgage holders than the CFPB’s Original QM Definition and the New General QM Definition that apply to loans purchased by the GSEs, which could drive business to these agencies and have a negative impact on our mortgage insurance business.
For more information regarding the CFPB’s proposed New General QM Definition and the risks it may present for us, see “Item 1A. Risk Factors—A decrease in the volume of mortgage originations could result in fewer opportunities for us to write new mortgage insurance business and conduct our homegenius business.”
Qualified Residential Mortgage Regulations—Securitization Risk Retention Requirements
The Dodd-Frank Act requires securitizers to retain at least 5% of the credit risk associated with mortgage loans that they transfer, sell or convey, unless the mortgage loans are qualified residential mortgages (“QRMs”) or are insured by the FHA or another federal agency (the “QRM Rule”). Under applicable federal regulations, a QRM is generally defined as a mortgage meeting the requirements of a qualified mortgage under the CFPB’s QM Rule described above. Because of the capital support provided by the U.S. government to the GSEs, the GSEs currently satisfy the proposed risk retention requirements of the Dodd-Frank Act while they are in conservatorship, so sellers of loans to the GSEs currently are not subject to the risk retention requirements referenced above. This means that securitizers would not be required to retain risk under the QRM Rule on loans that are guaranteed by the GSEs while in conservatorship.
The QRM Rule requires the agencies that implemented the rule to review the QRM definition no later than four years after its effective date (i.e., December 2018) and every five years thereafter, and allows each agency to request a review of the definition at any time. On December 20, 2019, the Office of the Comptroller of the Currency, the Board of Governors of the Federal Reserve System, the Federal Deposit Insurance Corporation, the SEC, the FHFA and HUD announced the commencement of a review of the QRM Rule. In December 2021, following completion of this review, the agencies released the findings of this review and determined not to propose any changes to the definition of qualified residential mortgage at this time.
Other
The Dodd-Frank Act establishes a Federal Insurance Office within the U.S. Department of the Treasury (the “FIO”). While the FIO does not have a general supervisory or regulatory authority over the business of insurance, the director of this office performs various functions with respect to insurance, such as serving as a non-voting member of the Financial Stability Oversight Council. It is difficult to predict whether legislators or other executive agencies will pursue the development and implementation of federal standards for the mortgage insurance industry outside of the FHFA. Any divergence from the current system of state regulation could significantly change compliance burdens and possibly impact our financial condition.
In addition, Section 1473 of the Dodd-Frank Act establishes minimum requirements to be implemented by states regarding the registration and supervision of appraisal management companies (“AMCs”), including Radian Valuation Services. In 2015, six federal regulatory agencies (the Office of the Comptroller of the Currency, Federal Reserve Board, Federal Deposit Insurance Corporation, National Credit Union Administration, CFPB and the FHFA) approved final rules creating federal minimum requirements for state registration and supervision of AMCs.
All AMCs subject to state registration, including Radian Valuation Services, must satisfy certain minimum standards, including requirements to: (i) establish and comply with processes and controls designed to ensure that an AMC only engages an appraiser who has the appropriate education, expertise and experience necessary to competently complete a particular appraisal assignment and (ii) establish and comply with processes and controls reasonably designed to ensure that the AMC conducts its appraisal management services in accordance with applicable appraisal independence standards and regulations.
RESPA
Settlement service providers in connection with the origination or refinance of a federally regulated mortgage loan are subject to RESPA and Regulation X. Under the Dodd-Frank Act, the authority to implement and enforce RESPA was transferred to the CFPB. RESPA authorizes the CFPB, the U.S. Department of Justice, state attorneys general and state insurance commissioners to bring civil enforcement actions, and also provides for criminal penalties and private rights of action.
Mortgage insurance, title insurance and other products and services provided by Radian’s affiliates are considered settlement services for purposes of RESPA. The anti-referral fee and anti-kickback provisions of Section 8 of RESPA generally provide, among other things, that settlement service providers are prohibited from paying or accepting anything of value in connection with the referral of a settlement service or sharing in fees for those services. RESPA also prohibits requiring the use of an affiliate for settlement services and requires certain information to be disclosed if an affiliate is used to provide the settlement services. In addition to mortgage insurance, through our homegenius business, we offer an array of services to our customers, including real estate, valuation, hybrid appraisal, title and closing services, many of which are considered settlement services for purposes of RESPA, and therefore, are subject to the anti-referral fee, anti-kickback and required use provisions of RESPA.
In the past, we and other mortgage insurers have faced lawsuits alleging, among other things, that our captive reinsurance arrangements constituted unlawful payments to mortgage lenders under RESPA. We also have been subject to lawsuits alleging that our Pool Mortgage Insurance and contract underwriting services violated RESPA. In addition, we and other mortgage insurers have been subject to inquiries and investigative demands from state and federal governmental agencies, including the CFPB, requesting information relating to captive reinsurance.
In April 2013, we reached a settlement with the CFPB that concluded its investigation with respect to Radian Guaranty without any findings of wrongdoing. As part of the settlement, Radian Guaranty paid a civil penalty and agreed that it would not enter into any new captive reinsurance agreement or reinsure any new loans under any existing captive reinsurance agreement for a period of 10 years ending in 2023. In June 2015, Radian Guaranty executed a Consent Order with the Minnesota Department of Commerce that resolved the Minnesota Department of Commerce’s outstanding inquiries related to captive reinsurance arrangements involving mortgage insurance in Minnesota without any findings of wrongdoing. As part of the Consent Order, Radian Guaranty paid a civil penalty and agreed not to enter into new captive reinsurance arrangements until June 2025. We have not entered into any new captive reinsurance arrangements since 2007. In addition, under the PMIERs, the GSEs prohibit private mortgage insurers from entering into captive insurance arrangements.
Homeowner Assistance Programs
The American Rescue Plan Act of 2021 authorizes approximately $9.9 billion to fund a Homeowner Assistance Fund for “the purpose of preventing homeowner mortgage delinquencies, defaults, foreclosures, loss of utilities or home energy services, and displacements of homeowners experiencing financial hardship after January 21, 2020.” Since the enactment of this legislation, Treasury has issued guidance on this program and announced expected allocations by state, with a statutory minimum requirement of $50 million for each state, the District of Columbia and Puerto Rico. According to the guidance issued by Treasury, eligible use of these funds may include mortgage payment assistance, assistance for housing-related costs related to a period of forbearance, delinquency, or default, facilitating mortgage interest reductions, assistance with insurance payments, including mortgage insurance, utility and tax payments, among others. See “—Housing Finance Reform and the GSEs’ Business Practices—Administrative Reform—COVID-19” above for additional information on efforts to support borrowers impacted by the pandemic.
The SAFE Act
The SAFE Act and its state law equivalents require mortgage loan originators to be licensed with state agencies in the states in which they operate and/or registered with the Nationwide Mortgage Licensing System and Registry (the “Registry”). The Registry is a database established by the Conference of State Bank Supervisors and the American Association of Residential Mortgage Regulators that tracks the licensing and eligibility requirements of loan originators. Among other things, the database was established to support the licensing of mortgage loan originators by each state.
As part of this licensing and registration process, loan originators who are employees of institutions other than depository institutions or certain of their subsidiaries that, in each case, are regulated by a federal banking agency, must generally be licensed under the SAFE Act guidelines enacted by each state in which they engage in loan origination activities and registered with the Registry. Additionally, most states define underwriting and loan processing as a clerical and administrative duty, performed under the supervision of a licensed mortgage loan originator. The entity and its employees that provide our contract underwriting and loan processing services are compliant with the SAFE Act for underwriting in all 50 states and the District of Columbia and compliant for loan processing in 45 states and the District of Columbia.
Mortgage Insurance Cancellation
The HPA imposes certain cancellation and termination requirements for borrower-paid private mortgage insurance with respect to “residential mortgage transactions” as defined in the HPA, and requires certain disclosures to borrowers regarding their rights under the law. Specifically, provided that certain conditions are satisfied, the HPA provides that private mortgage insurance on most loans may be cancelled at the request of the borrower once the principal balance of the mortgage is first scheduled to reach 80% of the home’s original value based on the loan’s initial amortization schedule, or reaches 80% of the home’s original value based on actual payments.
In addition, provided that certain conditions are satisfied, the HPA provides that private mortgage insurance on most loans is subject to servicer-initiated automatic termination once the principal balance of the mortgage is first scheduled to
reach 78% of the home’s original value based on the loan’s initial amortization schedule (or, if the loan is not current on that date, on the date that the loan becomes current). The HPA further provides that private mortgage insurance on most loans is subject to final termination following the date that is the midpoint of the loan’s amortization period (or, if the loan is not current on that date, on the date that the loan becomes current).
The HPA also establishes special rules for the termination of private mortgage insurance in connection with loans that are “high risk.” The HPA does not define “high risk” loans, but leaves that determination to the GSEs for loans up to the GSE conforming loan limits and to lenders for any other loan. For “high risk” loans originated in excess of conforming loan limits, provided that certain conditions are satisfied, the servicer is required to initiate termination once the principal balance of the mortgage is first scheduled to reach 77% of the home’s original value based on the loan’s initial amortization schedule. It is the servicer’s obligation to verify the date when a loan meets all HPA requirements for termination of borrower-paid private mortgage insurance and to promptly instruct the private mortgage insurer to terminate coverage.
Although not provided in the HPA, the GSEs’ guidelines also currently provide that when certain conditions are satisfied, borrowers can request cancellation of borrower-paid mortgage insurance for most loans when the LTV, based upon the current value of the home, is: either 75% or less or 80% or less, depending on the seasoning of the loan and other factors. The GSEs may change these guidelines in the future, including by expanding their mortgage insurance cancellation requirements, which could negatively impact our businesses. In Item 1A. Risk Factors, see “—Changes in the charters, business practices or role of the GSEs in the U.S. housing market generally, could significantly impact our businesses.” and “—Our mortgage insurance business faces intense competition.”
The Fair Credit Reporting Act (the “FCRA”)
The FCRA imposes restrictions on the permissible use of credit report information and disclosures that must be made to consumers when information from their credit reports is used. The FCRA has been interpreted by some Federal Trade Commission staff to require mortgage insurance companies to provide “adverse action” notices to consumers in the event an application for mortgage insurance is declined or a higher premium is charged based on the use, wholly or partly, of information contained in the consumer’s credit report.
Privacy and Information Security - Gramm-Leach-Bliley Act of 1999 (the “GLBA”) and Other Regulatory Requirements
As part of our business, we, and certain of our subsidiaries, maintain large amounts of confidential information, including non-public personal information on consumers and our employees. We and our customers are subject to a variety of privacy and information security laws and regulations. The GLBA imposes privacy requirements on financial institutions, including obligations to protect and safeguard consumers’ nonpublic personal information and records, and limitations on the re-use of such information. The GLBA is enforced by state insurance regulators and by federal regulatory agencies.
In addition, many states have enacted privacy and data security laws that impose compliance obligations beyond the GLBA, such as: requiring notification in the event that a security breach results in a reasonable belief that unauthorized persons may have obtained access to consumer nonpublic personal information; imposing additional restrictions on the sale and use of consumers’ personal information; affording consumers new rights of both access and deletion of their personal information; and creating new private rights of action for data breaches. See “—State Regulation—Privacy.”
Federal and state agencies have increased their focus on compliance obligations related to privacy, data security and cybersecurity. The CFPB, Office of the Comptroller of the Currency and non-governmental regulatory agencies, such as the Financial Industry Regulatory Authority (“FINRA”), have announced new compliance measures and enforcement efforts designed to monitor and regulate the protection of personal consumer data, including with respect to: the development and delivery of financial products and services; underwriting; mortgage servicing; credit reporting; digital payment systems; and vendor management. For information regarding the DFS’ cybersecurity regulations and the California Consumer Privacy Act, under “—State Regulation” above, see “—Information Security” and “—Privacy.”
Fair Lending and Fair Servicing
The federal Fair Housing Act, part of the Civil Rights Act of 1968, makes it unlawful for any person whose business includes engaging in residential real estate related transactions to: (i) discriminate in housing-related lending activities against any person on a prohibited basis, or (ii) for any person to discriminate in the sale or rental of housing “or in the provision of services or facilities in connection therewith,” to any person because of a prohibited basis.
Similarly, the Equal Credit Opportunity Act and Regulation B make it unlawful for a creditor to discriminate in any aspect of a credit transaction against an applicant on a prohibited basis during any aspect of a consumer or business credit transaction or make any oral or written statement to applicants or prospective applicants that would discourage on a prohibited basis a reasonable person from making or pursuing an application.
These laws seek to address discrimination in lending and other housing related activity by prohibiting discrimination that is intentional or where a facially neutral policy or practice has a “disparate impact;” that is, that it disproportionately excludes or burdens persons on a prohibited basis without a need to demonstrate intentional discrimination.
In September 2020, HUD issued a Final Rule (2020 Rule) which modified the requirements for demonstrating disparate impact claims. In June 2021, HUD published a notice of proposed rulemaking (“NPRM”) proposing to rescind its 2020 Rule, which was criticized as making it more difficult to bring disparate impact claims, and restore HUD’s prior interpretation of the disparate impact rule. To this end, the Biden Administration has indicated that it intends to focus heavily on discriminatory and unfair housing practices.
As a provider of products and services that support residential real estate transactions and the mortgage production and financing process, fair lending and servicing laws may impact the way we deliver or conduct our products and services, including in response to customer requirements.
Mortgage Insurance Tax Deduction
In 2006, Congress enacted the private mortgage insurance tax deduction in order to foster homeownership. The deduction was enacted on a temporary basis and it expired at the end of 2011. Since 2011, the private mortgage insurance tax deduction has been extended six times, most recently for insurance premiums paid through December 31, 2021. It is difficult to predict whether the deduction will be extended in the future.
Federal Consumer Protection Laws
As certain of our current and potential future business activities are directed at consumers or affect the provision of real estate and mortgage related services provided to consumers by others, we may be subject to a number of federal consumer protection laws, including, laws that could apply to us more directly. In addition to the laws and regulations discussed elsewhere in this Regulation section, these laws may include:
■The Truth in Lending Act and Regulation Z, requiring disclosures of mortgage loan costs and other notices to consumers;
■The Equal Credit Opportunity Act and Regulation B, prohibiting discrimination based on age, race and other characteristics in the extension of credit;
■The Fair Housing Act, prohibiting discrimination based on race, sex, national origin and other characteristics in connection with purchasing a home, obtaining a mortgage or other housing-related activities;
■The Fair Debt Collection Practices Act, regulating debt collection communications and other activities;
■Prohibition on Unfair, Deceptive or Abusive Acts or Practices, prohibiting unfair, deceptive or abusive acts or practices in connection with any transaction with a consumer for a consumer financial product or service, or the offering of a consumer financial product or service;
■CAN-SPAM Act, regulating commercial and marketing email including the right of recipients to have the sender stop sending emails; and
■The Telephone Consumer Protection Act, regulating and restricts certain marketing related phone calls, text messages and facsimiles.
We may also be required to comply with state laws similar to these federal consumer protection laws which, to the extent applicable to our businesses.
Basel III
Over the past few decades, the Basel Committee on Banking Supervision (the “Basel Committee”) has established international benchmarks for assessing banks’ capital adequacy requirements (“Basel III”). Included within those benchmarks are capital standards related to residential lending and securitization activity and, importantly for private mortgage insurers, the capital treatment of mortgage insurance on those loans. These benchmarks are then interpreted and implemented via rulemaking by U.S. banking regulators.
In July 2013, the U.S. banking regulators promulgated regulations, referred to as the “U.S. Basel III Rules,” to implement significant elements of the Basel framework. The U.S. Basel III Rules, among other things, revise and enhance the U.S. banking agencies’ general risk-based capital rules. Today, the U.S. Basel III Rules assign a risk weight to loans secured by one-to-four-family residential properties. Generally, under the U.S. Basel III Rules in place today, the explicit government guarantees (FHA/VA/USDA) receive a 0% risk weight, and Fannie Mae and Freddie Mac related loans receive a 20% risk weight. Non-government related mortgage exposures secured by a first lien on a one-to-four family residential property that are prudently underwritten and that are performing according to their original terms receive a 50% risk weighting. All other one-to-four family residential mortgage loans are assigned a 100% risk weight.
In December 2014, the Basel Committee issued a proposal for further revisions to Basel III. It proposed adjustments to the risk weights for residential mortgage exposures that take into account LTV ratio and the borrower’s ability to service a mortgage, which were not previously addressed by Basel III. The proposed LTV ratio did not take into consideration any credit enhancement, including private mortgage insurance, but in March 2015, the U.S. banking regulators clarified that for purposes of the U.S. Basel III Rules, calculation of LTV ratios can account for credit enhancement such as private mortgage insurance in
determining whether a loan is made in accordance with prudent underwriting standards for purposes of receiving the preferred 50% risk weight. The comment period for this proposal closed in March 2015, and in December 2015, the Basel Committee released a second proposal which retained the LTV provisions of the initial draft, but not the provisions pertaining to a borrower’s ability to service a mortgage (the “2015 Basel Committee Proposal”). The comment period for the 2015 Basel Committee Proposal closed in March 2016. To date, federal regulators have not adopted or implemented any new regulations, including based on these proposals, that update or modify the U.S. Basel III Rules.
The revised and final recommendations from the Basel Committee with respect to Basel III were published in December 2017 (the “2017 Basel Committee III Recommendations”), and included finalized risk weighting guidelines for residential mortgage exposures. These rules recognize guarantees provided by sovereign governments (such as FHA, VA, USDA and Ginnie Mae) as off-setting the capital requirements, resulting in a 0% risk weight. While the 2017 Basel Committee III Recommendations include consideration of LTV ratios, including the impact of credit enhancement provided by third-party private mortgage insurance and the GSEs on LTV ratios, the credit enhancement provided by third-party private mortgage insurance and the GSEs would have higher risk weightings than the explicitly government guaranteed products, putting loans insured by private mortgage insurance at a disadvantage. It remains unclear whether new guidelines will be proposed or finalized in the U.S. in response to the most recent 2017 Basel III Committee Recommendations.
Item 1A. Risk Factors
Index to Risk Factors
Risks Related to the COVID-19 Pandemic
The COVID-19 pandemic adversely impacted us and, in the future, could again adversely affect our business, results of operations or financial condition.
The onset of the COVID-19 pandemic created periods of significant economic disruption, high unemployment, volatility and disruption in financial markets and required adjustments in the housing finance system and real estate markets. Uncertainty regarding the pandemic’s scope, severity and duration, and its resulting impact on the economy, continues to persist as the pandemic evolves, and it is difficult to predict the ultimate impact of the COVID-19 pandemic on our business.
In 2020, in response to the pandemic, among other things, we raised additional capital, aligned our business with the temporary origination and servicing guidelines announced by the GSEs, and activated our business continuity program by transitioning to a work-from-home virtual workforce model with the exception of certain essential activities. Further, as a result of the COVID-19 pandemic and its impact on the economy, including the significant increase in unemployment and the implementation of mortgage forbearance programs by the GSEs, we experienced a material increase in new defaults in 2020 which resulted in a significant increase in our loss reserves and had a negative effect on our results of operations. If we experience another period of increased defaults stemming from the pandemic in future periods, our loss reserves may again increase which would negatively impact our results of operations and financial condition.
The COVID-19 pandemic may again impact our business in various ways, including the following, which are further described in the remainder of our risk factors in this report:
■We may be required to maintain more capital against COVID-19-related defaults under the PMIERs, in which case Radian Group may choose or be required to contribute additional capital to Radian Guaranty to remain in compliance with the PMIERs financial requirements;
■As a result of COVID-19-related relief programs, we anticipate that defaults related to the pandemic, if not cured, could remain in our defaulted loan inventory for a protracted period of time, potentially resulting in higher levels of claims and Claim Severity for those loans that ultimately result in a claim;
| | |
Part I. Item 1A. Risk Factors |
■Our access to the reinsurance and capital markets may be limited and the terms on which we are able to access such markets may be negatively impacted;
■The GSEs’ business practices have changed in response to the COVID-19 pandemic, with the primary objectives of supporting borrowers impacted by the pandemic and protecting the ongoing functioning of the housing finance system. In response to the ongoing pandemic, the FHFA and GSEs are likely to continue to take actions that impact the housing finance system. Because traditional mortgage insurance is an important component of this system, these actions have had, and may continue to have, a significant impact on our mortgage insurance operations and performance; and
■Volatility in the financial markets may impact the performance of our investment portfolio and could increase the risk that we will not achieve our investment objectives.
Although we are uncertain of the ultimate magnitude or duration of the business and economic impacts of the COVID-19 pandemic, their long-term effect on our businesses will depend on, among other things: the extent, evolution and duration of the pandemic; the severity of and the number of people infected with the virus and the widespread availability of anti-viral treatments and vaccines, especially as new strains of COVID-19 have been discovered; the wider economic effects of the pandemic and the scope and duration of governmental and other third-party measures restricting day-to-day life and business operations; the impact of economic stimulus efforts to support the economy through the pandemic; and governmental and GSE programs implemented to assist borrowers experiencing a COVID-19-related hardship, including forbearance programs. Due to the unprecedented and continually evolving social and economic impacts associated with the COVID-19 pandemic on the U.S. and global economies generally, and in particular on the U.S. housing, real estate and housing finance markets, there is significant uncertainty regarding the ultimate impact on our business, business prospects, operating results and financial condition and our estimates or predictions regarding such impact may be materially wrong.
Risks Related to Regulatory Matters
Radian Guaranty may fail to maintain its eligibility status with the GSEs, and the additional capital required to support Radian Guaranty’s eligibility could reduce our available liquidity.
In order to be eligible to insure loans purchased by the GSEs, mortgage insurers such as Radian Guaranty must meet the GSEs’ eligibility requirements, or PMIERs. The PMIERs are comprehensive, covering virtually all aspects of the business of a private mortgage insurer, including internal risk management and quality controls, the relationship between the GSEs and the approved insurer and the approved insurer’s financial condition. In addition, the PMIERs contain requirements related to the operations of our mortgage insurance business, including extensive operational requirements in areas such as claim processing, loss mitigation, document retention, underwriting, quality control, reporting and monitoring, among others. These extensive operational requirements have resulted in additional expenses and require substantial time and effort from management and our employees. If Radian Guaranty is unable to satisfy the requirements set forth in the PMIERs, including the financial requirements discussed below, the GSEs could restrict it from conducting certain types of business with them or take actions that may include not purchasing loans insured by Radian Guaranty.
The PMIERs include financial requirements incorporating a risk-based framework that requires a mortgage insurer’s Available Assets to meet or exceed its Minimum Required Assets. The PMIERs financial requirements include increased financial requirements for defaulted loans, as well as for performing loans with a higher likelihood of default and/or certain credit characteristics, such as higher LTVs and lower FICO credit scores. Radian Guaranty’s ability to continue to comply with the PMIERs financial requirements could be impacted by, among other factors: (i) the volume and product mix of our NIW; (ii) factors affecting the performance of our mortgage insurance portfolio, including the level of new defaults and prepayments; (iii) for existing defaults, the aging of these existing defaults and whether they are subject to, and remain in, mortgage forbearance programs, and the ultimate losses we incur on new or existing defaults; (iv) the application of the Disaster Related Capital Charge (as discussed below) under the PMIERs; (v) the amount of credit that we receive under the PMIERs financial requirements for our third-party reinsurance transactions (which is subject to initial and ongoing review by the GSEs); and (vi) potential amendments or updates to the PMIERs. If our mix of business includes more loans that are subject to the increased financial requirements under the PMIERs, we may limit the type and volume of business we are willing to write for certain of our products based on the increased financial requirements associated with certain loans. This could reduce the amount of NIW we write, which could reduce our future revenues.
As a result of the COVID-19 pandemic and its impact on the economy beginning in March 2020, we experienced a material increase in new defaults in 2020, substantially all of which related to defaults of loans subject to mortgage forbearance programs implemented in response to the COVID-19 pandemic. The overall volume of pandemic-related new defaults resulted in a corresponding significant increase in Radian Guaranty’s Minimum Required Assets, which negatively impacted Radian Guaranty’s PMIERs Cushion beginning in 2020. Since then, Radian Guaranty’s Minimum Required Assets have been decreasing as the economy has been recovering, the rate of new defaults has largely returned to pre-pandemic levels and many pandemic-related defaulted loans have cured. However, Radian’s Minimum Required Assets remain elevated compared to pre-pandemic levels and the amount of Minimum Required Assets that Radian Guaranty is and will be required to maintain, will depend on the number, timing and duration of defaults, including those defaulted loans participating in mortgage forbearance programs. This, in turn, will depend on the scope, severity, evolution and duration of the pandemic, its resulting impact on the economy, including unemployment and housing prices, and the effectiveness of current and any future
| | |
Part I. Item 1A. Risk Factors |
government and GSE programs to provide economic and individual relief and long-term assistance to homeowners, all of which will likely have an impact on the ability of borrowers to remain current on their mortgage payments and, if they have entered into forbearance or other relief programs, to resume making payments upon the expiration of the forbearance period. See “Item 1. Business—Regulation—Federal Regulation—CARES Act” and “Item 1. Business—Regulation—Federal Regulation—GSE Requirements for Mortgage Insurance Eligibility” for information regarding forbearance programs for borrowers experiencing financial hardship related to the pandemic.
The PMIERs apply a 0.30 multiplier to the Minimum Required Asset factor for loans that have become non-performing as a result of a “FEMA Declared Major Disaster” event, including as a result of participation in a mortgage forbearance program. This effectively reduces the Minimum Required Asset amount for these loans by 70%. Under National Emergency Guidelines issued by the GSEs, the PMIERs were amended so that the Disaster Related Capital Charge applies nationwide to all non-performing loans that are subject to a COVID-19 forbearance plan. For more information about the application of the Disaster Related Capital Charge see “Item 1. Business—Regulation—Federal Regulation—GSE Requirements for Mortgage Insurance Eligibility.”
The application of the Disaster Related Capital Charge has materially reduced the total amount of Minimum Required Assets that Radian Guaranty is required to hold against COVID-19 Defaulted Loans. While we expect that application of the Disaster Related Capital Charge will continue to materially reduce Radian Guaranty’s Minimum Required Assets for loans subject to a COVID-19 forbearance plan, the benefit that Radian Guaranty currently is receiving from the Disaster Related Capital Charge is expected to diminish over time. The reduction of this benefit could be accelerated if the GSEs were to terminate the COVID-19 Amendment to the PMIERs issued under their National Emergency Guidelines.
As the benefits of the Disaster Related Capital Charge diminish, or if existing and future new defaults materially increase Radian Guaranty’s Minimum Required Assets, we may be required or otherwise choose to: (i) contribute capital to Radian Guaranty; (ii) alter our strategy with respect to our NIW; or (iii) seek additional capital relief through reinsurance or otherwise, which may not be available on acceptable terms or on terms that would be approved by the GSEs.
The GSEs may amend the PMIERs at any time and also have broad discretion to interpret the PMIERs, which could impact the calculation of Radian Guaranty’s Available Assets and/or Minimum Required Assets. The most recent large-scale revisions to PMIERs, or PMIERs 2.0, became effective on March 31, 2019 and the PMIERs were further updated as part of the COVID-19 Amendment under the National Emergency Guidelines. We expect the GSEs to continue to update the PMIERs in the future, including potentially to align the PMIERs 2.0 financial requirements with the increased capital requirements for the GSEs under the ECF and/or the proposed new liquidity requirements for the GSEs. See “Item 1. Business—Regulation—Federal Regulation—GSE Requirements for Mortgage Insurance Eligibility” and “Item 1. Business—Regulation—Federal Regulation—Housing Finance Reform and the GSEs’ Business Practices” for additional information on the ECF and proposed GSE liquidity requirements.
Compliance with the PMIERs financial requirements could impact our holding company liquidity if additional capital support for Radian Guaranty is required for it to maintain this compliance. The amount of capital that Radian Group could be required to contribute to Radian Guaranty for this purpose is uncertain, but could be significant and, under extreme economic scenarios, could exhaust Radian Group’s available liquidity. See “—Radian Group’s sources of liquidity may be insufficient to fund its obligations.” Further, if Radian Guaranty becomes capital constrained, it may be more difficult for Radian Guaranty to return capital to Radian Group, which would compound the negative liquidity impact to Radian Group of the contributions it may be required to make to Radian Guaranty and leave less liquidity to satisfy Radian Group’s other obligations. Depending on the amount of liquidity that is utilized from Radian Group, we may be required (or may decide) to seek additional capital by incurring additional debt, issuing additional equity or selling assets, which we may not be able to do on favorable terms, if at all.
The PMIERs prohibit Radian Guaranty from engaging in certain activities such as insuring loans originated or serviced by an affiliate (except under certain circumstances) and require Radian Guaranty to obtain the prior consent of the GSEs before taking many actions, which may include, among other things, entering into certain intercompany agreements, settling loss mitigation disputes with customers and commuting risk. These restrictions could prohibit or delay Radian Guaranty from taking certain actions that would be advantageous to it or to Radian Group.
Although we expect Radian Guaranty to retain its eligibility status with the GSEs and to continue to comply with the PMIERs financial requirements, including as potentially updated in the future, we cannot provide assurance that this will occur. Loss of Radian Guaranty’s eligibility status with the GSEs would have an immediate and material adverse impact on the franchise value of our Mortgage business and our future prospects, as well as a material negative impact on our future results of operations and financial condition.
Our insurance subsidiaries are subject to comprehensive state insurance regulations and other requirements, which we may fail to satisfy.
We and our insurance subsidiaries are subject to comprehensive, detailed regulation by the insurance regulators in the states where they are domiciled or licensed to transact business. These regulations are principally designed for the protection of our insurance policyholders rather than for the benefit of our investors. Insurance laws vary from state to state, but generally grant broad supervisory powers to examine insurance companies and enforce rules or exercise discretion affecting almost
| | |
Part I. Item 1A. Risk Factors |
every significant aspect of the insurance business, including the power to revoke or restrict an insurance company’s ability to write new business.
Among other matters, the state insurance regulators impose various capital requirements on our insurance subsidiaries. State insurance capital requirements for our mortgage insurance subsidiaries include Risk-to-capital ratios, other risk-based capital measures and surplus requirements that may limit the amount of insurance that our mortgage insurance subsidiaries write or the ability of our insurance subsidiaries to distribute capital to Radian Group. Similarly, our title insurance subsidiary is required to maintain statutory premium reserves that vary by state and are subject to periodic reviews of certain financial performance ratios, the results of which could result in additional capital requirements in states where it is licensed. See “Item 1. Business—Regulation—State Regulation” for more information on existing regulatory requirements and potential changes to the capital and surplus requirements under the Model Act that the NAIC has been reviewing for many years.
Among other things, our failure to maintain adequate levels of capital in our mortgage insurance and title insurance subsidiaries could lead to intervention by the various insurance regulatory authorities, which could materially and adversely affect our business, business prospects and financial condition. In addition, the GSEs and our mortgage lending customers may decide not to conduct new business with Radian Guaranty (or may reduce current business levels) or impose restrictions on Radian Guaranty if it is not in compliance with applicable state insurance requirements. The franchise value of our mortgage insurance business likely would be significantly diminished if we were prohibited from writing new business or restricted in the amount of new business we could write in one or more states. For additional information about statutory surplus and other state insurance requirements, see “Item 7. Management’s Discussion and Analysis of Financial Condition and Results of Operations—Liquidity and Capital Resources—Mortgage,” as well as Note 16 of Notes to Consolidated Financial Statements.
The mortgage insurance industry has always been highly competitive with respect to pricing. Our mortgage insurance subsidiaries’ premium rates and policy forms are generally subject to regulation in every state in which they are licensed to transact business. These regulations are intended to protect policyholders against the adverse effects of excessive, inadequate or unfairly discriminatory rates and to encourage fair competition in the insurance marketplace. We may be subject to regulatory inquiries or examinations with respect to our mortgage insurance premium rates and policy forms. Similarly, our title insurance business is subject to extensive rate regulation by the applicable state agencies in the states in which it operates. Given that the premium rates for our insurance subsidiaries are highly regulated, we could lose business opportunities and fail to successfully implement our business strategies if our rates are deemed non-compliant or are subject to investigation, if new rates and policy forms are not approved as may be required, or if we are otherwise unable to respond to competitor pricing actions and our customers’ demands in a timely and compliant manner.
Changes in the charters, business practices or role of the GSEs in the U.S. housing market generally, could significantly impact our businesses.
Our current business structure is highly dependent on the GSEs, as the GSEs are the primary beneficiaries of most of our mortgage insurance policies. Changes in the business practices of the GSEs, which can be implemented by the GSEs acting independently or through their conservator, the FHFA, could negatively impact our businesses and financial performance. Examples of potential changes that could impact our business, may include, without limitation:
■eligibility requirements for a mortgage insurer to become and remain an approved eligible insurer for the GSEs;
■underwriting standards on mortgages they purchase;
■policies or requirements that may result in a reduction in the number of mortgages they acquire;
■the national conforming loan limit for mortgages they acquire;
■the level of mortgage insurance they require;
■the terms on which mortgage insurance coverage may be canceled before reaching the cancellation thresholds established by law;
■the terms required to be included in master policies for the mortgage insurance policies that cover the loans they acquire, including limitations on our ability to mitigate losses on insured mortgages that are in default;
■the amount of loan level price adjustments or guarantee fees, which often result in a higher cost to borrowers, that the GSEs charge on loans that require mortgage insurance; and
■the degree of influence that the GSEs have over a mortgage lender’s selection of the mortgage insurer providing coverage.
In addition, the GSEs’ business practices have changed in response to the COVID-19 pandemic, primarily to support borrowers impacted by the pandemic and protect the ongoing functioning of the housing finance system. As the COVID-19 pandemic continues to evolve, the actions or potential inactions of the FHFA and GSEs in response to COVID-19 may continue to have a significant impact on the overall functioning of the housing finance system. Because traditional mortgage insurance is an important component of this system and because our businesses depend on the health of the housing finance
| | |
Part I. Item 1A. Risk Factors |
system and housing markets in particular, these actions have impacted, and may continue to impact, our business operations and performance.
The structure of the residential housing finance system could be altered in the future, including as a result of comprehensive housing reform legislation. Since the FHFA was appointed as conservator of the GSEs, there has been a wide range of legislative proposals to reform the U.S. housing finance market. In conjunction with these proposals, there has been ongoing debate about the roles that the federal government and private capital should play in the housing finance system. To the extent new legislative action alters the existing GSE charters without explicit preservation of the role of private mortgage insurance for high-LTV loans, our business could be adversely affected. See “Item 1. Business—Regulation—Federal Regulation—Housing Finance Reform and the GSEs’ Business Practices” for a discussion of the future of housing finance in the U.S., including potential objectives for future reform.
In December 2020, the FHFA finalized the ECF, which establishes new increased capital requirements for the GSEs, and the FHFA also has proposed new liquidity requirements for the GSEs. In September 2021, the FHFA proposed further amendments to the ECF, and it is uncertain if and when these proposed amendments may be incorporated into the ECF and the form that they may take. See “Item 1. Business—Regulation—Federal Regulation—Housing Finance Reform and the GSEs’ Business Practices” for further information about the requirements established by the ECF, the September 2021 proposed amendments to the ECF and the proposed new liquidity requirements for the GSEs. Taken together, compliance with the increased capital requirements imposed by the ECF and the proposed new GSE liquidity requirements could significantly alter the business practices and operations of the GSEs, including potentially resulting in an increase in GSE pricing and a decrease in their use of credit risk transfer. An increase in GSE pricing could make alternatives to the GSEs such as FHA insured loans or the private securitization market more attractive, which could reduce the GSEs’ market position and reduce the number of loans available for private mortgage insurance. Further, the GSEs may seek to amend the PMIERs financial requirements in the future, including potentially to align with the ECF and the GSE liquidity requirements, once finalized. It remains uncertain if, when and how the PMIERs ultimately may be amended; however, changes to the PMIERs to align with the ECF could include: (i) an increase in the level of Radian Guaranty’s required capital and (ii) a decrease in the amount of PMIERs’ capital relief that Radian Guaranty receives for existing or future reinsurance or insurance-linked notes transactions.
The GSEs have in the past and may in the future pursue new products and activities in pursuit of their business strategies, including credit risk transfer transactions and structures that compete with private mortgage insurance. In 2018, Freddie Mac and Fannie Mae launched pilot programs, IMAGIN and EPMI, respectively, as alternative ways for lenders to obtain credit enhancement and sell loans with LTVs greater than 80% to the GSEs. These programs were discontinued in 2021, but could be relaunched in the future. If these programs or any future credit risk transfer transactions and structures were to materially displace primary loan level or standard levels of mortgage insurance, the amount of mortgage insurance we write may be reduced, which could negatively impact our franchise value, results of operations and financial condition. The FHFA previously released for comment a proposed rule regarding the process for how it will consider and approve new GSE activities and products; however, this proposed rule has not been finalized. In addition, the proposed rule is intended to apply to any future pilot programs, and therefore, it is not certain whether the same standards and procedures proposed in the new rule also would apply to pilots such as IMAGIN and EPMI if they are relaunched in the future. See “Item 1. Business—Regulation—Federal Regulation—Housing Finance Reform and the GSEs’ Business Practices” for further discussion of IMAGIN and EPMI and additional information about the proposed rule discussed above.
Since assuming leadership over the FHFA in June 2021, the Biden Administration appointed FHFA leadership has taken actions that represent a reversal of the previous FHFA leadership’s primary focus on preparing the GSEs to exit from conservatorship by increasing the GSEs’ overall capital levels and reducing their credit risk profile. In contrast, the current FHFA leadership has been focused on increasing the accessibility and affordability of mortgage credit, in particular to low- and moderate-income borrowers and underserved communities. Radian Guaranty and other private mortgage insurance companies have been engaged in discussions with the GSEs regarding how the industry may support the GSEs to advance these objectives. In addition, in furtherance of these policy objectives, Radian Guaranty and/or one or more of the mortgage insurers may pursue initiatives outside of their customary business activities, the success of which may be measured based on how well the initiative was able to advance accessibility and affordability of mortgage credit rather than by traditional profitability and return measures. In addition, the FHFA has required the GSEs to prepare and file three-year Equitable Housing Finance Plans that describe each GSE’s planned efforts to advance equity in housing finance. The action plans, when finalized, may include methods to reduce mortgage costs for historically underserved borrowers, including mortgage insurance costs. To implement these plans or to otherwise support the FHFA’s mandate regarding increasing the accessibility and affordability of mortgage credit, the GSEs may pursue new products and activities, or alter existing policies and practices in ways that could require changes to the GSEs’ business practices, including in ways that could negatively impact Radian Guaranty’s IIF, results of operations or financial condition.
Although we believe that traditional private mortgage insurance will continue to play an important role in any future housing finance structure, developments in the practices of the GSEs, including potentially new federal legislation, changes to existing statutes, rules or regulations, or changes in the GSEs’ business practices that reduce the level of private mortgage insurance coverage used by the GSEs as credit enhancement, or even eliminate the requirement, may diminish the franchise value of our mortgage insurance business and materially and adversely affect our business prospects, results of operations and financial condition.
| | |
Part I. Item 1A. Risk Factors |
Legislation and administrative and regulatory changes and interpretations could impact our businesses.
Our businesses are subject to and may be impacted by many federal and state lending, insurance and consumer laws and regulations. See “Item 1. Business—Regulation” for a discussion of significant state and federal regulations and other requirements of the GSEs that are applicable to our businesses. Changes in these laws and regulations or the way they are interpreted or applied, as well as changes in other laws and regulations that may affect corporations more generally, could adversely affect our results of operations, financial condition and business prospects. In addition, our businesses could be impacted by new legislation or regulations, including changes that are not currently contemplated and which could occur at any time. While we have established policies and procedures to comply with applicable laws and regulations, many such laws and regulations are complex, and it is not possible to predict the eventual scope, duration or outcome of any reviews or investigations nor is it possible to predict their effect on us or the industries in which we participate.
Risks Related to our Mortgage and homegenius Business Operations
Our success depends on our ability to assess and manage our underwriting risks; the premiums we charge may not be adequate to compensate us for our liability for losses and the amount of capital we are required to hold against our insured risks. We expect to incur losses for future defaults beyond what we have reserved for in our financial statements.
The estimates and expectations we use to establish premium rates in our mortgage insurance business are based on assumptions made at the time our insurance is written. Our mortgage insurance premium rates are based on, among other items, our expectations about competitive and economic conditions and our cost of capital, as well as a broad range of other factors and risk attributes that we consider in developing our assumptions about the credit performance of the loans we insure and the economic benefits we expect to receive from our insurance policies. Our assumptions may ultimately prove to be inaccurate, especially in a period of high market volatility and economic uncertainty, or if there is a change in law or the GSEs’ business practices that alter the performance of the loans we have insured in ways that are inconsistent with our assumptions, including the amount of premium we expect to receive from such insurance. The risk of inaccurate or unreliable data may have an adverse impact on our ability to effectively perform critical business operations, such as servicing, loss management, external reporting or data-driven internal analysis. The premium structure we apply is subject to approval by state regulatory agencies, which can delay or limit our ability to increase our premiums if further filings or approvals are necessary to institute pricing adjustments.
If the risk underlying a mortgage loan that we have insured develops more adversely than we anticipated, we generally cannot increase the premium rates on this in-force business, or cancel coverage or elect not to renew coverage, to mitigate the effects of such adverse developments. Similarly, we cannot adjust our premiums if the amount of capital we are required to hold against our insured risks increases from the amount we were required to hold at the time a policy was written or if the premiums we expected to receive from such insurance are less than anticipated due to a change in the GSEs’ business practices or otherwise. As a result, if we are unable to compensate for or offset the increased capital requirements in other ways, the returns on our business may be lower than we assumed or expected. Our premiums earned and the associated investment income on those premiums may ultimately prove to be inadequate to compensate for the losses that we may incur and may not provide an adequate return on increased capital that may be required. As a result, our results of operations and financial condition could be negatively impacted.
Additionally, in accordance with industry practice, we do not establish reserves in our mortgage insurance business until we are notified that a borrower has failed to make at least two monthly payments when due. Because our mortgage insurance reserving does not account for the impact of future losses that we expect to incur with respect to performing (non-defaulted) loans, our obligation for ultimate losses that we expect to incur at any period end is not reflected in our financial statements, except if a premium deficiency exists. A premium deficiency reserve would be recorded if the present value of expected future losses and expenses exceeds the present value of expected future premiums and already established loss reserves on the applicable loans. As future defaults are not currently reflected in our mortgage insurance loss reserves, our loss reserves could increase significantly in future periods if we experience a high volume of new defaults in future periods, which would negatively impact our results of operations and financial condition.
If the estimates we use in establishing loss reserves are incorrect, we may be required to take unexpected charges to income, which could adversely affect our results of operations.
We establish loss reserves in our mortgage insurance business to provide for the estimated cost of future claims on defaulted loans. Setting our loss reserves requires significant judgment by management with respect to the likelihood, magnitude and timing of each potential loss, including an estimate of the impact of our Loss Mitigation Activities with respect to defaulted loans. The models, assumptions and estimates we use to establish loss reserves may not prove to be accurate, especially in the event of an extended economic downturn or a period of market volatility and economic uncertainty, such as we have experienced due to the COVID-19 pandemic. Because of this, claims paid may be substantially different than our loss reserves and these reserves may be insufficient to satisfy the full amount of claims that we ultimately have to pay. Changes to our loss reserve estimates could adversely impact our results of operations and financial condition. In addition, although the rate of new defaults has largely returned to pre-pandemic levels and many pandemic-related defaulted loans have cured,
| | |
Part I. Item 1A. Risk Factors |
many defaulted loans in our insured portfolio remain in COVID-19 mortgage forbearance programs that are expected to expire in the near future. Forbearance for federally-insured mortgages (including those delivered to or purchased by the GSEs) allows for mortgage payments to be suspended for up to 18 months, subject to certain limitations such as when the forbearance plan was initiated. Historically, forbearance plans have reduced the frequency of our losses on affected loans. However, given the uncertainty regarding the long-term economic impact of COVID-19, it is difficult to predict the likelihood of default on loans that remain in COVID-19 related forbearance. Whether a defaulted loan will cure, including through modification, when forbearance ends will depend on the economic circumstances of the borrower at that time. The GSEs have introduced specific loan workout options for borrowers whose COVID-19 forbearance plans end. If a servicer is unable to contact a borrower to determine a loan workout option, the forbearance plan will end and the loan may remain in default. If a greater number of defaulted loans in COVID-19 forbearance programs ultimately result in claims than we anticipate, we may be required to increase our loss reserves.
We anticipate that defaults related to the pandemic, if not cured, could remain in our defaulted loan inventory for a protracted period of time, resulting in a higher likelihood of claim and higher levels of Claim Severity for those loans that ultimately result in a claim. See “—An extension in the period of time that a loan remains in our defaulted loan inventory may increase the severity of claims that we ultimately are required to pay.”
A portion of the defaulted loans in our portfolio originated in the years prior to and including 2008 have been in default for an extended period of time. While these loans are generally assigned a higher loss reserve based on our belief that they are more likely to result in a claim, we also assume, based on historical trends, that a significant portion of these loans will cure or otherwise not result in a claim. Given the significant period of time that these loans have been in default, it is possible that the ultimate cure rate for these defaulted loans will be less than our current estimates of Cures for this inventory of defaults.
If our loss reserve estimates are inadequate, we may be required to increase our reserves, which could have a material adverse effect on our results of operations and financial condition.
Our Loss Mitigation Activity is not expected to mitigate mortgage insurance losses to the same extent as in prior years; Loss Mitigation Activity could continue to negatively impact our customer relationships.
As part of our claims management process we pursue opportunities to mitigate losses both before and after we receive claims, including processes to ensure claims are valid. Following the financial crisis, our Loss Mitigation Activities, such as Rescissions, Claim Denials and Claim Curtailments, increased significantly in response to the poor underwriting, servicer negligence and other instances of non-compliance with our insurance policies that was prevalent in the period leading up to the financial crisis. These Loss Mitigation Activities materially mitigated our paid losses for loans originated and serviced during this period and resulted in a significant reduction in our loss reserves. Following the financial crisis, mortgage underwriting and servicing have generally improved, and the amount of Loss Mitigation Activity required with respect to the claims on loans originated and serviced in more recent periods has significantly decreased. As a result, our future Loss Mitigation Activity is not expected to mitigate our paid losses to the same extent as it did in the years following the financial crisis. In addition, we have incorporated provisions into our 2014 Master Policy and 2020 Master Policy that generally provide rescission relief based on the number of months that borrowers remain current on their mortgage loans, and Radian Guaranty has entered into a Factored Claim Administration Agreement with Fannie Mae for certain loans that predetermines the amount of covered expenses forming part of a loss using prenegotiated expense factors. As a consequence, our rights to conduct Loss Mitigation Activity generally are more limited for loans covered by more recent Master Policies and for more recent defaults as compared to the past.
Our Loss Mitigation Activities and claims paying practices have resulted in disputes with certain of our customers and in some cases, damaged our relationships with customers, resulting in a loss of business. While we have resolved all material disputes, a risk remains that our Loss Mitigation Activities or claims paying practices could continue to have a negative impact on our relationships with customers or potential customers. Further, disputes with our customers that are not resolved could result in additional arbitration or judicial proceedings, requiring significant legal expenses. To the extent that past or future Loss Mitigation Activities or claims paying practices impact our customer relationships, our competitive position could be adversely affected, resulting in the potential loss of business and impacting our results of operations.
Reinsurance may not be available, affordable or adequate to protect us against losses.
We use reinsurance as a capital and risk management tool. We have distributed risk through third-party quota share and excess-of-loss reinsurance arrangements, as well as through the capital markets using mortgage insurance-linked notes transactions.
The availability and cost of reinsurance are subject to market conditions beyond our control, including factors that impact the demand of investors for mortgage credit. No assurance can be given that reinsurance will remain available to us in amounts that we consider sufficient and at rates and upon terms that we consider acceptable. Accordingly, we may be forced to incur additional expenses for reinsurance or may not be able to obtain sufficient reinsurance on acceptable terms, which could cause us to increase the amount of risk we retain, negatively affect the returns we are able to achieve on the business we write and adversely affect our ability to write future business. Further, reinsurance does not relieve us of our direct liability to policyholders, therefore, if the reinsurer is unable or unwilling to meet its obligations to us, we remain liable to make claims
| | |
Part I. Item 1A. Risk Factors |
payments to our policyholders. As a result, our reinsurance arrangements do not fully eliminate our obligation to pay claims, and we have assumed counterparty credit risk with respect to our inability to recover amounts due from reinsurers.
We use reinsurance to manage Radian Guaranty’s capital position under the PMIERs financial requirements. Among other benefits, our risk distribution transactions reduce our required capital, including by significantly reducing our Required Minimum Assets under the PMIERs. The initial and ongoing credit that we receive under the PMIERs financial requirements for these risk distribution transactions is subject to the periodic review of the GSEs and could be influenced by the ECF, which, in the form finalized in December 2020, significantly increases the capital requirements for the GSEs and provides the GSEs with a reduced amount of credit for their own credit risk transfer activities. Although the FHFA has since proposed further amendments to the ECF in September 2021, including to provide more credit for risk transfer transactions, it is uncertain if and when these proposed amendments may be incorporated into the ECF and the form that they may ultimately take. See “—Changes in the charters, business practices or role of the GSEs in the U.S. housing market generally, could significantly impact our businesses.” If the GSEs revise the PMIERs in the future to align with a form of the ECF that provides less capital relief for credit risk transfer transactions, such alignment could reduce the credit that Radian Guaranty receives for reinsurance under the PMIERs, which could negatively impact our strategic approach to risk management and risk distribution.
If we are unable to obtain sufficient reinsurance on acceptable terms or to collect amounts due from our reinsurers, or if we receive less PMIERs capital relief for our reinsurance transactions, it could have a material adverse effect on our business, financial condition and results of operations.
An extension in the period of time that a loan remains in our defaulted loan inventory may increase the severity of claims that we ultimately are required to pay.
High levels of defaults and corresponding delays in foreclosures could delay our receipt of claims, resulting in an increase in the period of time that a loan remains in our defaulted loan inventory, and as a result, the Claim Severity. Generally, foreclosure delays do not stop the accrual of interest or affect other expenses on a loan, and unless a loan is cured during such delay, once title to the property ultimately is obtained and a claim is filed, our paid claim amount may include additional interest and expenses, increasing the Claim Severity.
In response to the COVID-19 pandemic, numerous federal and state regulatory agencies have instituted borrower relief programs, including mortgage payment forbearance and foreclosure and eviction moratoriums, with the objective of supporting borrowers through the economic hardship resulting from the pandemic and allowing borrowers to remain in their homes. After being extended multiple times, the foreclosure and eviction moratoriums have now expired; however, the existence of these moratoriums significantly impacted the claims process in 2020 and 2021 by preventing the procedural steps necessary for the filing of a claim under our insurance policies. Further, when loans subject to COVID-19 mortgage forbearance programs reach the end of their forbearance period, federal law requires servicers to discuss forbearance and loss mitigation options with their borrowers and afford additional protections to borrowers before their loans are referred to foreclosure, which further extends the period in which these loans remain in defaulted status. As a result of COVID-19-related relief programs, defaults related to the pandemic, if not cured, may remain in our defaulted loan inventory for a protracted period of time, which could result in higher levels of Claim Severity for those loans that ultimately result in a claim. Higher levels of Claim Severity would increase our incurred losses and could negatively impact our results of operations and financial condition.
If the length of time that our mortgage insurance policies remain in force declines, it could result in a decrease in our future revenues.
Most of our primary IIF consists of policies for which we expect to receive premiums in the future, typically through Monthly Premium Policies, and as a result, a significant portion of our earned premiums are derived from insurance that was written in prior years, often with premium rates that are greater than those prevailing in the market today. The length of time that this insurance remains in force, which we refer to as the Persistency Rate, is a significant driver of our future revenues, with a lower overall Persistency Rate generally reducing our future revenues. As a result, the ultimate profitability of our mortgage insurance business is affected by the impact of mortgage prepayment speeds on the mix of business we write.
Prevailing mortgage interest rates compared to the mortgage rates on our IIF and the level of home price appreciation occurring since origination of the loan affect the incentive for borrowers to refinance and therefore our Persistency Rate, with lower current interest rates and a greater level of home price appreciation making it more attractive for borrowers to refinance. Borrowers with significant equity may be able to refinance their loans without requiring mortgage insurance. The impact of the COVID-19 pandemic, including the government stimulus efforts in response to the pandemic, has resulted in a historically low interest rate environment, which in combination with the significant level of home price appreciation that has occurred over recent years, has led to elevated policy cancellations associated with a high level of refinance activity. The increase in policy cancellations associated with this high level of refinance activity has reduced our Persistency Rate compared to historic levels, and in turn, limited the growth of our IIF, which is one of the primary drivers of future premiums that we expect to earn over time. If the length of time that our mortgage insurance policies remain in force continues to remain low for a protracted period of time or further declines, and such decline is not offset by a sufficient level of NIW, it could result in a further decrease in our future revenues, particularly from our Recurring Premium Policies.
| | |
Part I. Item 1A. Risk Factors |
Other factors affecting the length of time that our insurance remains in force include:
■the HPA requirement that servicers cancel mortgage insurance when a borrower’s LTV ratio meets or is scheduled to meet certain levels, generally based on the original value of the home and subject to various conditions;
■the GSEs’ mortgage insurance cancellation guidelines, which apply more broadly than the HPA, and also consider a home’s current value. For example, borrowers may request cancellation of mortgage insurance based on the home’s current value if certain LTV and seasoning requirements are met and the borrowers have an acceptable payment history. For loans seasoned between two and five years, the LTV ratio must be 75% or less, and for loans seasoned more than five years, the LTV ratio must be 80% or less. For more information about the GSEs’ guidelines and business practices and how they may change, see “—Changes in the charters, business practices or role of the GSEs in the U.S. housing market generally, could significantly impact our businesses.”
■the credit policies of certain lenders, which may make it more difficult for homeowners to refinance loans; and
■economic conditions that can affect a borrower’s decision to pay off a mortgage earlier than required, including the strength of the housing market, which impacts a borrower’s prospects for selling their existing home and finding a suitable and affordable new home.
If these or other factors cause a decrease in the length of time that our Recurring Premium Policies, for which we expect to receive premiums in the future, remain in force, our future revenues could be negatively impacted, which could negatively impact our results of operations and financial condition.
Our delegated underwriting program may subject our mortgage insurance business to unanticipated claims.
In our mortgage insurance business, we permit lenders to obtain mortgage insurance for residential mortgage loans originated and underwritten by them using Radian’s pre-established underwriting guidelines. Once we accept a lender into our delegated underwriting program, we generally insure a mortgage loan originated by that lender based on our expectation that the lender has followed our specified underwriting guidelines. Under this program, a lender could commit us to insure a material number of loans with unacceptable risk profiles before we discover the problem and are able to terminate that lender’s delegated underwriting authority or pursue other rights that may be available to us, such as our rights to rescind coverage or deny claims.
Our mortgage insurance business faces intense competition.
The U.S. mortgage insurance industry is highly competitive. Our competitors primarily include other private mortgage insurers and governmental agencies, principally the FHA and VA.
We currently compete with other private mortgage insurers that are eligible to write business for the GSEs primarily on the basis of price, underwriting guidelines, overall service, customer relationships, perceived financial strength (including comparative credit ratings) and reputation. Overall service competition is based on, among other things, effective and timely delivery of products, responsiveness to compliance audits, timeliness of claims payments, customer service, timely and accurate administration of policies, training, loss mitigation efforts and management and field service expertise. We also believe that our service proposition to customers includes our ability to offer services to customers through our homegenius business that are relevant to our mortgage insurance customers and complement our mortgage insurance products. For more information about our competitive environment, including pricing competition, see “Item 1. Business—Competition.”
Pricing strategies continue to evolve in the mortgage insurance industry. In recent years, mortgage insurers generally have migrated away from a predominantly rate-card-based pricing model and toward the use of proprietary, “black box” pricing frameworks that use a spectrum of filed rates to allow for formulaic, risk-based pricing based on multiple loan, borrower and property attributes that may be quickly adjusted within certain parameters. The shift toward the use of these granular risk-based pricing methodologies has contributed to a pricing environment that is more dynamic with more frequent pricing changes that can be implemented quickly, as well as an overall reduction in pricing transparency. As a result, we may not be aware of rate changes in the industry until we observe that our volume of NIW has changed. Further, in addition to the growing proliferation of black box pricing, industry pricing practices in recent years have also included an increased use of customized rate plans for certain customers, pursuant to which rates may be awarded to customers for only a limited period of time. The evolution of pricing strategies throughout the industry has resulted in greater volatility in our NIW and a reduction in industry pricing, including our pricing, due to the heightened competition inherent in the use of these pricing tools as compared to prior periods when standard rate cards were most prevalent.
With the increased prevalence of granular, “black box” pricing and the greater uniformity of master policy terms throughout the industry, pricing has become the predominant competitive market factor for private mortgage insurance and an increasing number of customers are making their choice of mortgage insurance providers primarily based on the lowest price available for any particular loan. Our approach to pricing is customer-centric and flexible, as we offer a spectrum of risk-based pricing solutions for our customers that are designed to be balanced with our objectives for managing our volume of NIW and the risk/return profile of our insured portfolio. Although we believe we are well-positioned to compete effectively, our pricing strategy may not be successful and we may lose business to other competitors.
| | |
Part I. Item 1A. Risk Factors |
The reduction in our premium rates due to heightened competition is expected to decrease the premium yield of our insured portfolio over time as older vintage insured loans with higher premium rates run-off and are replaced with insured loans with premium rates that are generally lower. It is possible that pricing competition could further intensify, which could result in a decrease in our projected returns. Despite our pricing actions, we may experience returns below our targeted returns. Our increased use of reinsurance over the past several years has helped to mitigate the negative effect of declining premium rates on our expected returns. However, reinsurance may not always be available or available on terms attractive to us. See “—Reinsurance may not be available, affordable or adequate to protect us against losses.”
Certain of our private mortgage insurance competitors may have access to greater amounts of capital and financial resources than we do at a lower cost of capital (including through affiliated off-shore reinsurance vehicles) and some competitors currently have better financial strength ratings than we have. As a result, they may be better positioned to compete outside of traditional mortgage insurance, including by participating in alternative forms of credit enhancement that the GSEs may pursue outside of private mortgage insurance in its traditional form. In addition, because of tax advantages associated with being off-shore, which may become more pronounced if tax laws change in the future, certain of our competitors have been able to reinsure to their offshore affiliates and achieve higher after-tax rates of return on the NIW they write compared to mortgage insurers such as Radian Guaranty that do not have access to offshore affiliates. This tax structuring benefit could allow these off-shore competitors to leverage reduced pricing to gain market share, while continuing to achieve acceptable returns on NIW.
We also compete with governmental entities, such as the FHA and VA, primarily on the basis of loan limits, pricing, credit guidelines, terms of our insurance policies and loss mitigation practices. These governmental entities typically do not have the same capital requirements or business objectives that we and other private mortgage insurance companies have, and therefore, may have greater financial flexibility in their pricing guidelines and capacity that could put us at a competitive disadvantage. If these entities lower their pricing or alter the terms and conditions of their mortgage insurance or other credit enhancement products in furtherance of political, social or other goals rather than a profit motive, we may be unable to compete in that market effectively, which could have an adverse effect on our business, financial condition and operating results. See “Item 1. Business—Regulation—Federal Regulation—Housing Finance Reform and the GSEs’ Business Practices” for further discussion of factors that could impact the FHA’s competitive position relative to private mortgage insurance.
In addition, as market conditions change, alternatives to private mortgage insurance may become more prevalent, which could reduce the demand for private mortgage insurance in its traditional form. For example, alternatives to private mortgage insurance could include: investors using risk mitigation and credit risk transfer techniques other than private mortgage insurance (or accepting credit risk without credit enhancement); lenders and other investors holding mortgages in portfolio and self-insuring; and/or lenders originating mortgages using “piggyback” structures to avoid private mortgage insurance. See “—Changes in the charters, business practices or role of the GSEs in the U.S. housing market generally, could significantly impact our businesses” for risks related to changes in the GSEs’ business practices that could impact our competitive position, including the use of alternatives to traditional mortgage insurance to satisfy their charter requirements related to credit risk.
The competitive environment is extremely challenging given the multitude of factors discussed above. This environment, as well as potential further changes to this evolving environment, could negatively impact our franchise value, business prospects, results of operations and financial condition.
Our NIW and franchise value could decline if we lose business from significant customers.
Our mortgage insurance business depends on our relationships with our customers. Our customers place insurance with us directly on loans they originate and they also do business with us indirectly through purchases of loans that already have our mortgage insurance coverage. Our relationships with our customers may influence both the amount of business they conduct with us directly and their willingness to continue to approve us as a mortgage insurance provider for loans that they purchase. The loss of business from significant customers could have an adverse effect on the amount of new business we are able to write, and consequently, our franchise value.
If we were to lose a significant customer, including as a result of customer consolidation, it is unlikely that the loss could be completely offset by other customers in the near-term, if at all. Lending customers may decide to write business only with a limited number of mortgage insurers or only with certain mortgage insurers, based on their views with respect to an insurer’s information security and other compliance programs, pricing levels and pricing delivery methods, service levels, underwriting guidelines, loss mitigation practices, financial strength or other factors. With respect to pricing, industry pricing practices in recent years have also included an increased use of customized rate plans for many customers, pursuant to which rates may be awarded to customers for only a limited period of time. This has led to greater volatility in our customer relationships as we may retain, gain or lose customers based on the competitiveness of our proposed pricing levels over the proposed period, regardless of the other factors cited above that may influence a lender’s decision whether to continue or commence doing business with us. See “—Our mortgage insurance business faces intense competition.”
Our lending customers also may choose for risk management purposes to diversify the mortgage insurers with which they do business. Given that many of our customers currently give us a significant portion of their total mortgage insurance business, it is possible that further diversification could have a negative impact on our NIW if we are unable to mitigate the
| | |
Part I. Item 1A. Risk Factors |
market share loss through new customers or increases in business with other customers. Further, we actively engage with our customers to ensure that we are receiving an appropriate mix of business at acceptable projected returns, and depending on the circumstances, we could take action with respect to customers (e.g., limiting the type of business we accept from them or instituting pricing changes that impact them) that could result in customers reducing the amount of business they do with us or deciding not to do business with us altogether. Finally, although we develop our product offerings and strategies to be complementary to our customers, we currently offer and may offer in the future, products that could be viewed as competitive to products offered by certain of our customers, which could influence a customer’s decision as to whether to do business with us. Any significant loss in our market share could negatively impact our mortgage insurance franchise, results of operations and financial condition.
The current financial strength ratings assigned to our mortgage insurance subsidiaries could weaken our competitive position and potential downgrades by rating agencies to these ratings and the ratings assigned to Radian Group could adversely affect the Company.
Radian Guaranty has been assigned a rating of Baa1 by Moody’s, a rating of BBB+ by S&P and a rating of A- by Fitch. While Radian Guaranty’s financial strength ratings currently are investment grade, certain of these ratings are below the ratings assigned to some of our competitors. We do not believe our ratings have had a material adverse effect on our relationships with existing customers. However, if financial strength ratings become a more prominent consideration for lenders, we may be competitively disadvantaged by customers choosing to do business with private mortgage insurers that have higher financial strength ratings. In addition, while the current PMIERs do not include a specific ratings requirement with respect to eligibility, if this were to change in the future, we may become subject to a ratings requirement in order to retain our eligibility status under the PMIERs. The ECF, in the form finalized in December 2020, generally provides more capital credit for transactions with more highly rated counterparties, which if translated to the PMIERs in the future, could potentially become a competitive disadvantage for us.
The GSEs currently consider financial strength ratings, among other items, to determine the amount of collateral that an insurer must post when participating in their credit risk transfer transactions. As a result, the returns that we are able to achieve if and when we participate in these transactions are dependent, in part, on our financial strength ratings. Further, a downgrade in our financial strength ratings could result in increased scrutiny of our financial condition by the GSEs and/or our customers, potentially resulting in a decrease in the amount of our NIW. Market participants with higher ratings than us are assigned lower collateral requirements by the GSEs for these transactions and generally have a lower cost of capital, which may give them a competitive advantage, including the ability to price more aggressively for these transactions.
We believe that financial strength ratings remain a significant consideration for participants seeking to secure credit enhancement in the non-GSE mortgage market, which includes most non-QM loans. While this market has remained limited since the financial crisis, we view this market as an area of potential long-term future growth, and our ability to successfully insure loans in this market could depend on our ability to secure higher ratings for our mortgage insurance subsidiaries. In addition, if legislative or regulatory changes were to alter the current state of the housing finance industry such that the GSEs no longer operate in their current capacity, we may be forced to compete in a new marketplace in which financial strength ratings may play a greater role.
The rating agencies continually review the financial strength ratings assigned to Radian Group and its mortgage insurance subsidiaries, and the ratings are subject to change. Downgrades to the ratings of our mortgage insurance subsidiaries and Radian Group could adversely affect our cost of funds, liquidity, access to capital markets and competitive position. In December 2021, S&P announced a proposed change to its rating methodologies for insurers, including mortgage insurers. It is uncertain whether it will be adopted in its current form, whether it will prompt similar moves at other rating agencies, or what impact the proposed change would have on us and on the way external parties evaluate the different rating levels. If we are unable to compete effectively in the current or any future markets as a result of the financial strength ratings assigned to our mortgage insurance subsidiaries, the franchise value and future prospects for our mortgage insurance business could be negatively affected.
Our business depends, in part, on effective and reliable loan servicing.
We depend on third-party servicing of the loans that we insure. Dependable servicing is necessary for timely billing and premium payments to us and effective loss mitigation opportunities for delinquent or near-delinquent loans. Servicers are required to comply with a multitude of legal and regulatory requirements, procedures and standards for servicing residential mortgages, such as the CFPB’s mortgage servicing rules. While these requirements are intended to ensure a high level of servicing performance, they also impose a high cost of compliance on servicers that may impact their financial condition and their operating effectiveness. The COVID-19 pandemic has placed additional burdens on many servicers. Challenging economic and market conditions or periods of economic stress and high mortgage defaults such as we have experienced due to the COVID-19 pandemic make it more difficult for servicers to effectively service the loans that we insure. Further, the various servicing-related requirements imposed by the CARES Act, the GSEs, the FHA, CFPB and other federal and state governmental and regulatory bodies and agencies to address the impact of the COVID-19 pandemic on mortgage borrowers heighten the burdens placed on servicers in the current environment and the potential scrutiny they face for their actions, which could influence their approach to the loans they are servicing.
| | |
Part I. Item 1A. Risk Factors |
Information with respect to the mortgage loans we insure is based in large part on information reported to us by third parties, including the servicers and originators of the mortgage loans, and information provided may be subject to lapses or inaccuracies in reporting from such third parties. In many cases, we may not be aware that information reported to us is incorrect until such time as a claim is made against us under the relevant insurance policy. We do not receive monthly information from servicers for single premium policies, and may not be aware that the mortgage loans insured by such policies have been repaid. We periodically attempt to determine if coverage is still in force on such policies by asking the last servicer of record or through the periodic reconciliation of loan information with certain servicers. It may be possible that our reports continue to reflect, as active, policies on mortgage loans that have been repaid.
Our policies allow us to cancel coverage on loans that are not delinquent if the premiums are not paid within a grace period. However, in response to the COVID-19 pandemic, many states have enacted moratoriums on the cancellation of insurance due to non-payment. The specific provisions of the moratoriums vary from state to state. In the event a borrower fails to make mortgage payments, including as the result of a forbearance program, servicers often are required to advance such amounts, including principal and interest on the mortgage and amounts to cover taxes and insurance, for a period of time, including with respect to loans purchased by the GSEs. These required “advances” may increase the financial strain on servicers, which could negatively impact their financial condition or otherwise disrupt their operations; although currently, in response to the pandemic, the FHFA and GSEs have implemented a four-month limit on servicer advance obligations for loans in forbearance which has reduced this financial burden. If we experience a disruption in the servicing of mortgage loans covered by our insurance policies or a failure by servicers to appropriately report the status of a loan, including whether the loan is subject to a COVID-19-related forbearance program, this, in turn, could impact the amount of assets Radian Guaranty is required to hold under the PMIERs or ultimately contribute to a rise in claims among those loans, which could have a material adverse effect on our business, financial condition and operating results.
Under the terms of our 2014 Master Policy and 2020 Master Policy, mortgage insurance premiums are not required to be paid following an event of default. However, if a defaulted loan then cures, all mortgage insurance premiums must be brought current for our insurance coverage to continue, including all premiums that were not paid during the period following the event of default and through the date of cure. Because premiums must be brought current upon a cure, mortgage servicers typically continue to pay mortgage insurance premiums while loans remain in default, understanding that Radian Guaranty will refund these premiums if the loans fail to cure and ultimately go to claim. If we fail to receive mortgage insurance premiums following mortgage defaults, Radian Guaranty’s cash flow could be materially reduced, potentially requiring Radian Guaranty to liquidate investments at a loss to pay future claims or otherwise requiring us to alter our investment strategy.
We face risks associated with our contract underwriting business.
We provide third-party contract underwriting services for our mortgage insurance customers. Generally, we offer limited indemnification to our contract underwriting customers. In addition to indemnification, we typically have limited loss mitigation defenses available to us for loans that we have underwritten through our contract underwriting services. As a consequence, our results of operations could be negatively impacted if we are required to indemnify our customers for material underwriting errors in our contract underwriting services.
A decrease in the volume of mortgage originations could result in fewer opportunities for us to write new mortgage insurance business and conduct our homegenius business.
The amount of new mortgage insurance business we write and real estate transactions we support through our homegenius title, real estate and technology products and services depends, among other things, on a steady flow of low down payment mortgages that benefit from our mortgage insurance and the volume of real estate transactions that require our services or products. The volume of mortgage originations is impacted by a number of factors, including:
■restrictions on mortgage credit due to changes in lender underwriting standards, capital requirements affecting lenders, regulatory requirements such as the QM designation for mortgage loans and the health of the private securitization market;
■mortgage interest rates;
■the level of consumer confidence and the health of the domestic economy generally, as well as specific conditions in regional and local economies;
■housing supply and affordability;
■tax laws and policies and their impact on, among other things, deductions for mortgage insurance premiums, mortgage interest payments and real estate taxes;
■demographic trends, including the rate of household formation;
■the rate of home price appreciation;
■government housing policy encouraging loans to first-time homebuyers; and
| | |
Part I. Item 1A. Risk Factors |
■the practices of the GSEs, including the extent to which the guaranty fees, loan level price adjustments, credit underwriting guidelines and other business terms provided by the GSEs affect the cost of mortgages and lenders’ willingness to extend credit for low down payment mortgages.
The U.S. housing and real estate markets generally have been strong in recent years, with markets supported by low interest rates, favorable demographics supporting growth in the population of first-time homebuyers and a relatively constrained supply of homes available for sale. While we expect demographic trends to continue to be favorable to housing and real estate, rising interest rates and the potential for economic uncertainty, as well as the persistent effects of the COVID-19 pandemic, could affect the number of new mortgages available for us to insure and real estate transactions available for our services.
If the overall volume of new mortgage originations declines, we would likely be subject to increased competition and we could experience a reduced opportunity to write new insurance business and provide our homegenius products and services, which could negatively affect our business prospects, results of operations and financial condition.
We are exposed to risks associated with our homegenius business that could negatively affect our results of operations and financial condition.
Our homegenius business exposes us to certain risks that may negatively affect our results of operations and financial condition, including, among others, the following:
■Our homegenius business is driven primarily by digital products and services, including software as a service solutions and proprietary technology platforms that depend on our ability to develop, launch and implement new and innovative technologies and digital solutions. As a result, this business is particularly exposed to challenges associated with new and rapidly evolving technologies and business environments, customer acceptance of our digital product and service offerings, the costs associated with the development and launch of these technologies and products, our failure to successfully integrate new technologies into our existing systems and the risk that our digital product and services offerings fail to operate as expected or planned or that expose us to additional cybersecurity or third party risks;
■Our homegenius business depends on our relationships with our customers. Our homegenius revenue is dependent on a limited number of large customers that represent a significant proportion of our homegenius total revenues. The loss or reduction of business from one or more of these significant customers could adversely affect the level of our homegenius revenues. In addition, Radian Guaranty does business with many of these significant customers. In the event of a dispute between a significant customer and either of our business segments, the overall customer relationship for Radian could be negatively impacted;
■Due to the transactional nature of our business, our homegenius segment revenues are subject to fluctuation from period to period and are difficult to predict;
■The services we offer through our homegenius business are influenced by the level of overall activity in the mortgage, real estate and mortgage finance markets generally. If real estate transaction volumes decline, we could experience less demand for our real estate and title services;
■Red Bell is a licensed real estate brokerage and provides real estate brokerage services in all 50 states and the District of Columbia. As a licensed real estate brokerage, Red Bell receives residential real estate information from various multiple listing services. Red Bell receives this information, which it uses in its business to broker real estate transactions and provide valuation products and services that comprise many of our homegenius product offerings, pursuant to the terms of agreements with the MLS providers. If these agreements were to terminate or Red Bell otherwise were to lose access to this information, it could negatively impact Red Bell’s ability to conduct its business and our future real estate strategies. In addition to MLS data, we depend on access to data from a variety of other external sources to maintain our databases and grow our businesses. If we were to lose access to one or more of these data sources, the quality, pricing and availability of our homegenius products and services may be negatively impacted;
■By their nature, title claims are often complex, vary greatly in dollar amounts and are affected by economic and market conditions and the legal environment existing at the time of settlement of the claims. Estimating future title loss payments is difficult because of the complex nature of title claims, the long periods of time over which claims are administered and paid, significantly varying dollar amounts of individual claims and other factors. From time to time, we could experience large losses or an overall worsening of our loss payment experience in regard to the frequency or severity of claims that require us to record additional charges to our claims loss reserve. These loss events are unpredictable and may require us to increase our title loss reserves and could adversely affect the financial performance of our homegenius business; and
■Our homegenius business operates in a highly competitive environment. Our competitors vary in size and in the scope and breadth of the services they offer, and many have substantial resources. We expect that the markets in which we compete will continue to attract new competitors and technologies. There can be no assurance that our homegenius business will be able to compete successfully.
| | |
Part I. Item 1A. Risk Factors |
Any of these factors could negatively effect on our homegenius business and could have a material adverse effect on our results of operations and financial condition.
We rely upon proprietary technology and information, and if we are unable to protect our intellectual property rights, it could have a material adverse effect on us.
Our success depends, in part, upon our intellectual property rights. We rely primarily on a combination of patents, copyrights, trade secrets, trademarks, nondisclosure and other contractual restrictions on copying, distribution and creation of derivative products to protect our proprietary technology and information. This protection is limited, and our intellectual property could be used by others without our consent. In addition, patents may not be issued with respect to our pending or future patent applications, and our patents may not be upheld as valid or may not prevent the development of competitive products. Any infringement, disclosure, loss, invalidity of or failure to protect our intellectual property could have a material adverse effect on our business, financial condition and results of operations. Moreover, litigation may be necessary to enforce or protect our intellectual property rights, to protect our trade secrets or to determine the validity and scope of the proprietary rights of others. Such litigation could be time-consuming, result in substantial costs and diversion of resources and could have a material adverse effect on our business, financial condition and results of operations.
Risks Related to the Economic Environment
The credit performance of our mortgage insurance portfolio is impacted by macroeconomic conditions and specific events that affect the ability of borrowers to pay their mortgages.
Mortgage defaults occur due to a variety of specific events affecting individual borrowers, including death or illness, divorce or other family related factors, and unemployment, among other events. While mortgage defaults can and do occur in any economic environment, there is a high correlation between the overall health of the economy and the performance of our mortgage insurance portfolio. As a result, our results are particularly influenced by macroeconomic conditions and specific events that impact the housing finance and real estate markets, including events that impact mortgage originations and the credit performance of our mortgage insurance portfolio, most of which are beyond our control, including housing prices, inflationary pressures, unemployment levels, interest rate changes, the availability of credit and other national and regional economic conditions. These conditions may be created or exacerbated by acts of terrorism, war or other conflicts, event-specific economic depressions, severe weather events and natural disasters, which may continue to increase in severity and frequency due to climate change, and other catastrophic events such as the COVID-19 pandemic or other future epidemics or pandemics. In general, challenging economic conditions increase the likelihood that borrowers will not have sufficient income to satisfy their mortgage obligations.
In addition, a deteriorating economy also can adversely affect housing values, which in turn can influence the willingness of borrowers to continue to make mortgage payments despite having the financial resources to do so. In addition, a decline in home values typically makes it more difficult for borrowers to sell or refinance their homes, increasing the likelihood that a default will result in a claim. Declining housing values may impact the effectiveness of our loss mitigation actions. The amount of the loss we could suffer depends in part on whether the home of a borrower who defaults on a mortgage can be sold for an amount that will cover the unpaid principal balance, interest and the expenses of the sale. Any of these events may have a material adverse effect on our business, results of operations and financial condition.
As discussed above under “—Radian Guaranty may fail to maintain its eligibility status with the GSEs, and the additional capital required to support Radian Guaranty’s eligibility could reduce our available liquidity,” the COVID-19 pandemic produced periods of significant economic disruption, including high unemployment, and volatility and disruption in financial markets, that resulted in an elevated number of mortgage defaults, including defaults derived from mortgage forbearance programs that were instituted to support borrowers experiencing COVID-19 related hardships. Uncertainty regarding the pandemic’s scope, severity and duration, and its resulting impact on the economy, continues to persist as the pandemic evolves, and it is difficult to predict the ultimate impact that the COVID-19 pandemic may have on the credit performance of our mortgage insurance portfolio.
Unfavorable macroeconomic developments, including the ongoing economic uncertainty related to the COVID-19 pandemic and the other factors cited above, may again have a material negative impact on our results of operations and financial condition.
Our success depends, in part, on our ability to manage risks in our investment portfolio.
Our investment portfolio is an important source of revenue and is our primary source of claims paying resources. Although our investment portfolio consists primarily of highly-rated fixed income investments, our investment strategy is affected by general economic conditions, which may adversely affect the markets for credit and interest-rate-sensitive securities, including the extent and timing of investor participation in these markets, the level and volatility of interest rates and credit spreads and, consequently, the value of our fixed income securities, and as such, we may not achieve our investment objectives. Volatility or lack of liquidity in the markets in which we invest has at times reduced the market value of some of our investments, including most recently as a result of the disruption in the financial markets due to the COVID-19 pandemic. The value of our investment portfolio may also be adversely affected by ratings downgrades, bankruptcies and credit spreads
| | |
Part I. Item 1A. Risk Factors |
widening in distressed industries. In addition, when the credit environment deteriorates, the risk of impairments of our investments increases. If the financial markets experience disruption and volatility, it could have a material adverse effect on our liquidity, financial condition and results of operations.
Interest rates and investment yields on our investments continue to be low compared to historical averages, which has reduced the investment yield on our investment portfolio. For the significant portion of our investment portfolio held by our insurance subsidiaries, to receive favorable treatment under insurance regulatory requirements and full credit as Available Assets under the PMIERs, we generally are limited to investing in investment grade fixed income investments that are unlikely to increase our overall investment yields. Because we depend on our investments as a source of revenue, a prolonged period of lower than expected investment yields would have an adverse impact on our revenues and could adversely affect our results of operations. Further, future updates to the Model Act or PMIERs, including potentially to align with the ECF or proposed liquidity requirements for the GSEs, could restrict our investment choices, which could negatively impact our investment strategy.
In addition, we structure our investment portfolio to satisfy our expected liabilities, including claim payments in our mortgage insurance business. If we underestimate our future claim payments or other liabilities or improperly structure our investments to meet these liabilities, we could have unexpected losses resulting from the forced liquidation of investments before their maturity, which could adversely affect our results of operations.
Climate change and extreme weather events could adversely affect our businesses, results of operations and financial condition.
Our businesses, results of operations and financial performance could be adversely impacted by climate change and extreme weather events, especially if these occurrences negatively impact the overall real estate market and the broader economy. Climate change may increase the frequency and severity of natural disasters such as hurricanes, tornadoes, floods and forest fires and drive other ecologically related changes such as rising sea waters, which in turn could negatively affect regional economies in ways that impact home values or unemployment, and therefore, the credit performance of the mortgages we insure in affected areas. Further, climate change and natural disasters may impact the value of and cause volatility in our investment portfolio, and we might not achieve our investment objectives. Climate change and the frequency, severity, duration, and geography of severe weather events and other ecological related changes are inherently uncertain, and we cannot predict the ultimate impact these events may have on our business and financial condition.
Our reported earnings, stockholders’ equity and book value per share are subject to fluctuations based on changes in our investments that require us to adjust their fair market value.
We have significant holdings of trading securities, equity securities and short-term investments that we carry at fair value. Because the changes in fair value of these financial instruments are reflected on our statements of operations each period, they affect our reported earnings and can create earnings volatility. In addition, we increase or decrease our stockholders’ equity by the amount of change in the unrealized gain or loss (the difference between the fair value and the amortized cost) of our available for sale securities portfolio, net of related tax, under the category of accumulated other comprehensive income (loss). As a result, a decline in the fair value of our available for sale portfolio may result in a decline in reported stockholders’ equity, as well as book value per common share. Among other factors, interest rate changes, market volatility and declines in the value of underlying collateral will impact the value of our investments, potentially resulting in unrealized losses that could negatively impact our results of operations and stockholders’ equity. These negative impacts will occur even though the securities are not sold. Also, in the event there are credit loss related impairments, the credit loss component and subsequent recoveries, if any, are recognized in earnings.
The discontinuance of LIBOR may adversely affect us.
In 2017, the United Kingdom’s Financial Conduct Authority (the “FCA”), which regulates LIBOR, announced that after 2021, it would no longer compel banks to submit rate quotations required to calculate LIBOR. The FCA no longer publishes one-week and two-month U.S. dollar LIBOR rates and plans to cease publishing all other LIBOR tenors (overnight, one-month, three-month, six-month and 12-month) on June 30, 2023. In addition, the U.S. Federal Reserve, in conjunction with the Alternative Reference Rates Committee, a committee consisting of representatives of large U.S. financial institutions, has recommended replacing U.S. dollar LIBOR with a rate based on the Secured Overnight Financing Rate, or SOFR. SOFR is the rate charged on overnight repurchase obligations collateralized by Treasury securities, and is compiled by the New York Federal Reserve Bank. It is not presently known whether SOFR or any other alternative reference rates will attain broad market acceptance as replacements of LIBOR. There remains uncertainty as to how the financial services industry will address the discontinuance of LIBOR in financial instruments that are indexed to LIBOR. Further, various financial instruments indexed to LIBOR could experience different outcomes based on their contractual terms, ability to amend those terms, market or product type, legal or regulatory jurisdiction, and other factors. Alternative reference rates that replace LIBOR may not yield the same or similar economic results over the lives of the financial instruments, which could adversely affect the value of and return on these instruments.
The discontinuation of LIBOR may have an adverse effect on the premium rates we are required to pay in connection with certain of our excess-of-loss reinsurance agreements associated with our existing insurance-linked notes transactions,
| | |
Part I. Item 1A. Risk Factors |
which are tied to LIBOR, or may negatively impact the value of other assets or liabilities whose value is tied to LIBOR or to a LIBOR alternative, including floating rate bonds that we hold in our investment portfolio. The discontinuation of LIBOR also could increase the cost of borrowings under our credit facility, which currently uses LIBOR as a benchmark for establishing the interest rate. Although our insurance-linked notes transactions and our credit facility provides for a transition from LIBOR upon the occurrence of specified events, there is substantial uncertainty as to the effect of such replacement. Furthermore, in addition to potential impacts on our investment portfolio and our cost of debt, the discontinuation of LIBOR may impact other aspects of our business, such as our insurance products, the pricing we charge and the models we use to support our business decisions. It is possible that the discontinuance of LIBOR, including the implementation of alternative benchmark rates to LIBOR, could have an adverse effect on our business, results of operations or financial condition.
Risks Related to Liquidity and Financing
Radian Group’s sources of liquidity may be insufficient to fund its obligations.
Radian Group serves as the holding company for our operating subsidiaries and does not have any operations of its own. See “Item 7. Management’s Discussion and Analysis of Financial Condition and Results of Operations—Liquidity and Capital Resources—Liquidity Analysis—Holding Company” for more information on our available liquidity and short-term and long-term liquidity demands.
As discussed above under “—Radian Guaranty may fail to maintain its eligibility status with the GSEs, and the additional capital required to support Radian Guaranty’s eligibility could reduce our available liquidity,” the COVID-19 pandemic produced periods of significant economic disruption that resulted in an elevated number of mortgage defaults, including defaults derived from mortgage forbearance programs that were instituted to support borrowers experiencing COVID-19 related hardships. Uncertainty regarding the pandemic’s scope, severity and duration, and its resulting impact on the economy, continues to persist as the pandemic evolves, and it is difficult to predict the ultimate impact that the COVID-19 pandemic may have on the credit performance of our mortgage insurance portfolio. If additional capital support for Radian Guaranty is required to maintain compliance with the PMIERs financial requirements, we may be required or otherwise choose to contribute capital to Radian Guaranty. The amount that Radian Group could be required to contribute to Radian Guaranty could be significant and, under extreme economic scenarios, exhaust Radian Group’s available liquidity. See “—Radian Guaranty may fail to maintain its eligibility status with the GSEs, and the additional capital required to support Radian Guaranty’s eligibility could reduce our available liquidity” above for additional information.
In addition to available cash and marketable securities, Radian Group’s most significant near-term sources of cash to fund future liquidity needs include: (i) payments made to Radian Group by its subsidiaries under expense- and tax-sharing arrangements; and (ii) net investment income earned on its cash and marketable securities. Radian Group’s expense-sharing arrangements with its principal operating subsidiaries require those subsidiaries to pay their allocated share of certain holding-company-level expenses, including interest payments on Radian Group’s outstanding senior notes. The expense-sharing arrangements between Radian Group and our mortgage insurance subsidiaries, as amended, have been approved by the Pennsylvania Insurance Department, but such approval may be modified or revoked at any time.
In light of Radian Guaranty’s negative unassigned surplus related to operating losses in prior periods, the ongoing need to set aside contingency reserves, and the current ongoing economic uncertainty related to the COVID-19 pandemic, which could increase losses in future periods, we do not anticipate that Radian Guaranty will be permitted under applicable insurance laws to pay ordinary dividends to Radian Group for the next several years. See Note 16 of Notes to Consolidated Financial Statements for additional information on contingency reserve requirements.
In light of Radian Group’s short- and long-term needs, it is possible that our sources of liquidity could be insufficient to fund our obligations. If this were to occur, we may choose not to pursue certain actions, such as issuing dividends or repurchasing shares of our common stock, or we may elect to reduce the levels of these activities to preserve our available liquidity. In addition, we may seek to increase our available liquidity, which we may be unable to do on favorable terms, if at all.
Our revolving credit facility contains restrictive covenants that could limit our operating flexibility. A default under our credit facility could trigger an event of default under the terms of our senior notes. We may not have access to funding under our credit facility when we require it.
Radian Group is a party to a $275.0 million unsecured revolving credit facility with a syndicate of bank lenders. As of December 31, 2021, no borrowings were outstanding under the credit facility.
The credit facility contains customary representations, warranties, covenants, terms and conditions. Our ability to borrow under the credit facility is conditioned on the satisfaction of certain financial and other restrictive covenants, including covenants related to minimum net worth and statutory capital, a maximum debt-to-capitalization level, repayment or refinancing of a portion of our senior debt maturities prior to their maturity, and limitations on our ability to incur additional indebtedness, make investments, create liens, transfer or dispose of assets and merge with or acquire other companies. The credit facility also requires that Radian Guaranty remain eligible under the PMIERs to insure loans purchased by the GSEs. A failure to comply with these covenants or the other terms of the credit facility could result in an event of default, which could: (i) result in the termination of the commitments by the lenders to make loans to Radian Group under the credit facility and (ii)
| | |
Part I. Item 1A. Risk Factors |
enable the lenders to declare, subject to the terms and conditions of the credit facility, any outstanding obligations under the credit facility to be immediately due and payable.
Further, the occurrence of an event of default under the terms of our credit facility may trigger an event of default under the terms of our senior notes. An event of default would occur under the terms of our senior notes if a default: (i) in any scheduled payment of principal of other indebtedness by Radian Group or its subsidiaries of more than $100 million principal amount occurs, after giving effect to any applicable grace period or (ii) in the performance of any term or provision of any indebtedness of Radian Group or its subsidiaries in excess of $100 million principal amount occurs that results in the acceleration of the date such indebtedness is due and payable, subject to certain limited exceptions. See Note 12 of Notes to Consolidated Financial Statements for more information on the carrying value of our senior notes.
If the commitments of the lenders under the credit facility are terminated or we are unable to satisfy certain covenants or representations, we may not have access to funding in a timely manner, or at all, when we require it. If funding is not available under the credit facility when we require it, our ability to continue our business practices or pursue our current strategy could be limited. If the indebtedness under the credit facility or our senior notes is accelerated, we may not be able to repay our debt or borrow sufficient funds to refinance it.
Risks Related to Information Technology and Cybersecurity
Our information technology systems may fail or become outmoded, be temporarily interrupted or otherwise cause us to be unable to meet our customers’ demands.
Our business is highly dependent on the effective operation of our information technology systems, which are vulnerable to damage or interruption from power outages, computer and telecommunications failures, computer viruses, cyber-attacks and security incidents or breaches, catastrophic events and errors in usage. Although we have disaster recovery and business continuity plans in place, we may not be able to adequately execute these plans in a timely fashion.
Additionally, our ability to meet the needs of our customers depends on our ability to keep pace with technological advances and to invest in new technology as it becomes available or to otherwise upgrade our technological capabilities. We rely on e-commerce and other technologies to provide our products and services to our customers, and they generally require that we provide an increasing number of our products and services electronically. Accordingly, we may not satisfy our customers’ requirements if we fail to invest sufficient resources or are otherwise unable to maintain and upgrade our technological capabilities. Further, customers may choose to do business only with business partners with which they are technologically compatible and may choose to retain existing relationships with mortgage insurance or mortgage and real estate services providers rather than invest the time and resources to on-board new providers. As a result, technology can represent a potential barrier to signing new customers.
Because we rely on our information technology systems for many critical functions, including connecting with our customers, if such systems were to fail, experience a prolonged interruption or become outmoded, we may experience a significant disruption in our operations and in the business we receive, which could have a material adverse effect on our business, financial condition and operating results.
We could incur significant liability or reputational harm if the security of our information technology systems is breached, including as result of a cyberattack, or we otherwise fail to protect confidential information, including personally identifiable information that we maintain.
We rely on information technology systems to process, transmit, store and protect the electronic information, financial data and proprietary models that are critical to our business. Furthermore, a significant portion of the communications between us and our employees, customers, business partners and service providers depends on information technology and electronic information exchange.
Our reliance on information technology has been further accelerated by the widespread transition to work-from-home measures following the outbreak of COVID-19. In response to the COVID-19 pandemic, in order to protect our employees and in response to governmental and other third-party measures restricting interpersonal contact, travel and business operations, we activated our business continuity program by transitioning to a work-from-home virtual workforce model. Remote working arrangements may increase the risk of cyber-security attacks or data security incidents.
Our information technology systems may be vulnerable to physical or electronic intrusions, malware or other attacks, including cyberattacks. In recent years, cyberattacks such as distributed denial of service attacks, hacking, malware, ransomware, phishing or other forms of social engineering and insider threats designed to obtain confidential information, destroy data, disrupt or degrade service, sabotage systems or to cause other damage have grown in volume and level of sophistication. Security incidents have from time to time occurred and may occur in the future. Although to date security incidents have not had a material impact on us, the risks of cyberattacks and information security incidents and breaches continue to increase in businesses such as ours due to, among other things, the proliferation of new technologies and the use of digital channels to conduct our business, including connectivity with customer devices that are beyond our security control systems and the use of portable computers or mobile devices which can be stolen, lost or damaged. Globally, attacks are
| | |
Part I. Item 1A. Risk Factors |
expected to continue accelerating in both frequency and sophistication with increasing use by actors of tools and techniques that could hinder our ability to identify, investigate and recover from incidents.
As part of our business, we, and certain of our subsidiaries, affiliates and third-party vendors, maintain large amounts of confidential information, including personally identifiable information on borrowers, consumers and our employees. If the security of our information technology or the technology of our third-party vendors is breached, including as a result of a cyberattack, it could result in the loss or misuse of this information, which could, in turn, result in potential regulatory actions or litigation, including material claims for damages, as well as interruption to our operations and damage to our customer relationships and reputation. While we have information security policies, controls and systems in place in order to attempt to prevent, detect and respond to unauthorized use or disclosure of confidential information, including personally identifiable information, there can be no assurance that such use or disclosure will not occur. Any cybersecurity event or other compromise of the security of our information technology systems, or unauthorized use or disclosure of confidential information, could subject us to liability, regulatory scrutiny and action, damage our reputation and negatively affect our ability to attract and maintain customers, and could have a material adverse effect on our business prospects, financial condition and results of operations.
Risks Related to Us and Our Subsidiaries Generally
We may not continue to pay dividends at the same rate we are currently paying them, or at all, and any decrease in or suspension of payment of a dividend could cause our stock price to decline.
Effective February 9, 2022, Radian Group’s board of directors authorized an increase in the Company’s quarterly dividend from $0.14 per share to $0.20 per share, effective for the quarterly dividend payable on March 3, 2022. The payment of future cash dividends is subject to the determination each quarter by our board of directors that the dividend remains in the best interests of the Company and our stockholders, which determination will be based on a number of factors, including, among others, economic conditions, our earnings, financial condition, actual and forecasted cash flows, capital resources, capital requirements and alternative uses of capital, including potential investments to support our business strategy and possible acquisitions or investments in new businesses. Any decrease in the amount of the dividend, or suspension or discontinuance of payment of a dividend, could cause our stock price to decline.
We are subject to litigation and regulatory proceedings.
We operate in highly regulated industries that are subject to a heightened risk of litigation and regulatory proceedings. From time to time we are a party to material litigation and also are subject to legal and regulatory claims, assertions, actions, reviews, audits, inquiries and investigations. Additional lawsuits, legal and regulatory proceedings and inquiries and other matters may arise in the future. The outcome of existing and future legal and regulatory proceedings and inquiries and other matters could result in adverse judgments, settlements, fines, injunctions, restitutions or other relief which could require significant expenditures or have a material adverse effect on our business prospects, results of operations and financial condition. See “Item 3. Legal Proceedings” and Note 13 of Notes to Consolidated Financial Statements.
We rely on our management team and our business could be harmed if we are unable to retain qualified personnel or successfully develop and/or recruit their replacements.
Our success depends, in part, on the skills, working relationships and continued services of our management team and other key personnel, any of whom could terminate his or her relationship with us at any time. Competition for personnel is intense and has increased in light of evolving labor and employment trends, including but not limited to the increase in employee resignations throughout the United States, as well as the increase in remote, hybrid or other alternative flexible work arrangements. The COVID-19 pandemic and the resulting increase in work from home arrangements within many industries, including ours, has increased the likelihood that highly skilled individuals may seek to change employers in pursuit of greater opportunities or greater benefits. In this environment, it may be more difficult to retain key personnel or to attract new resources who now may have greater optionality among potential employers given the ability to work from home. The unexpected departure of key personnel could adversely affect the conduct of our business. In such event, we would be required to obtain other personnel to manage and operate our business. In addition, we will be required to replace the knowledge and expertise of our workforce as our workers retire. In either case, there can be no assurance that we will be able to develop or recruit suitable replacements for the departing individuals, that replacements could be hired, if necessary, on terms that are favorable to us, or that we can successfully transition such replacements in a timely manner. Failure to effectively implement our succession planning efforts and to ensure effective transfers of knowledge and smooth transitions involving members of our management team and other key personnel could adversely affect our business and results of operations. Without a properly skilled and experienced workforce, our costs, including costs associated with a loss of productivity and costs to replace employees, may increase, and this could negatively impact our earnings.
Investments to grow our existing businesses, pursue new lines of business or new products and services within existing lines of business subject us to additional risks and uncertainties.
In support of our growth and diversification strategy, we may make investments to grow our existing businesses, pursue new lines of business or new products and services within existing lines of business. We may do this through strategic
| | |
Part I. Item 1A. Risk Factors |
transactions, including investments and acquisitions, or pursue other transformative actions and initiatives. These activities expose us to additional risks and uncertainties that include, without limitation:
■the use of capital and potential diversion of other resources, such as the diversion of management’s attention from our core businesses and potential disruption of those businesses;
■the assumption of liabilities in connection with any strategic transaction, including any acquired business;
■our ability to comply with additional regulatory requirements associated with new products, services, lines of business or other business or strategic initiatives;
■our ability to successfully integrate or develop the operations of any new business initiative or acquisition;
■new business initiatives may be disruptive to, or competitive with, our existing customers;
■we may fail to realize the anticipated benefits of a strategic transaction or initiative, including expected synergies, cost savings or sales or growth opportunities, within the anticipated timeframe or at all;
■new business initiatives may expose us to liquidity risk, risks associated with the use of financial leverage, and market risks, including risk resulting from changes in the fair values of assets in which we invest. Further, new business initiatives may increase our exposure to interest rate risk and may involve changes in our investment, financing and hedging strategies;
■we may fail to achieve forecasted results for a strategic transaction or initiative that could result in lower or negative earnings contribution and/or impairment charges associated with intangible assets acquired; and
■the risk of reputational harm if the strategic transaction or initiative fails to increase our market value.
Item 1B. Unresolved Staff Comments
None.
Item 2. Properties
In addition to leases of other properties and facilities to support our business operations, the Company currently leases approximately 65,000 square feet of office and storage space at our corporate headquarters, located at 550 East Swedesford Road, Suite 350, in Wayne, Pennsylvania. This property is used by both our reportable segments and our corporate functions.
We believe our existing properties are suitable and adequate for their intended use. Despite nearly all of our employees currently working remotely during the COVID-19 pandemic, the longer-term strategy is for our current sites and offices to be re-occupied with more flexible work arrangements for our employees.
Item 3. Legal Proceedings
We are routinely involved in a number of legal actions and proceedings, including reviews, audits and inquiries by various regulatory entities, as well as litigation and other disputes arising in the ordinary course of our business. These legal proceedings and regulatory matters could result in adverse judgments, settlements, fines, injunctions, restitutions or other relief that could require significant expenditures or have other effects on our business. Management believes, based on current knowledge and after consultation with counsel, that the outcome of such actions will not have a material adverse effect on our consolidated financial condition. The outcome of litigation and other legal and regulatory matters and proceedings is inherently uncertain, and it is possible that any one or more of these matters currently pending or threatened could have an adverse effect on our liquidity, financial condition or results of operations for any particular period. See Note 13 of Notes to Consolidated Financial Statements for additional information regarding legal proceedings and regulatory matters.
Item 4. Mine Safety Disclosures
Not applicable.
PART II
Item 5. Market for Registrant’s Common Equity, Related Stockholder Matters and Issuer Purchases of Equity Securities
Our common stock is listed on the New York Stock Exchange (“NYSE”) under the symbol “RDN.” At February 23, 2022, there were 175,525,591 shares of our common stock outstanding and 59 holders of record.
During the first quarter of 2021 and each quarter of 2020, we declared quarterly cash dividends on our common stock equal to $0.125 per share. On May 4, 2021, Radian Group’s board of directors authorized an increase to our quarterly dividend from $0.125 to $0.14 per share, beginning with the dividend declared in the second quarter of 2021. On February 9, 2022, Radian Group’s board of directors authorized an increase to our quarterly cash dividend from $0.14 to $0.20 per share. We presently expect to continue to declare a regular quarterly dividend on our common stock. For information on Radian Group’s ability to pay dividends, see “Item 7. Management’s Discussion and Analysis of Financial Condition and Results of Operations—Liquidity and Capital Resources.”
Reference is made to the information in Item 12 of this report under the caption “Equity Compensation Plans,” which is incorporated herein by reference.
Issuance of Unregistered Securities
During the last three years, no equity securities of the Company were sold that were not registered under the Securities Act.
Issuer Purchases of Equity Securities
The following table provides information about purchases of Radian Group common stock by us (and our affiliated purchasers) during the three months ended December 31, 2021.
| | | | | | | | | | | | | | | | | | | | | | | | | | |
| Share repurchase program | | | | | | | | |
| | | | | | | | |
| ($ in thousands, except per-share amounts) | | Total Number of Shares Purchased (1) | | Average Price
Paid per Share | | Total Number of Shares Purchased as Part of Publicly Announced Plans or Programs (2) | | Approximate Dollar Value of Shares That May Yet Be Purchased Under the Plans or Programs (2) |
| Period: | | | | | | | | |
10/1/2021 to 10/31/2021 | | 1,966,569 | | | $ | 23.72 | | | 1,964,061 | | | $ | 95,484 | |
11/1/2021 to 11/30/2021 | | 3,790,848 | | | 21.68 | | | 3,788,714 | | | 13,401 | |
12/1/2021 to 12/31/2021 | | 655,036 | | | 20.96 | | | 639,560 | | | — | |
| Total | | 6,412,453 | | | | | 6,392,335 | | | |
(1)Includes 20,118 shares tendered by employees as payment of taxes withheld on the vesting of certain RSUs granted under the Company’s equity compensation plans.
(2)On August 14, 2019, Radian Group’s board of directors approved a share repurchase program authorizing the Company to spend up to $200 million, excluding commissions, to repurchase Radian Group common stock. Since then, Radian Group’s board of directors has authorized several increases to the program along with extensions of the program’s expiration date. Most recently, in August 2021, Radian Group’s board of directors approved a $200 million increase to this program, bringing the cumulative authorization to repurchase shares up to $675 million, excluding commissions, and extended the expiration of this program to August 31, 2022. During the three months ended December 31, 2021, the Company purchased 6.4 million shares at an average price of $22.23, including commissions. No purchase authority remains available under this program. See Note 14 of Notes to Consolidated Financial Statements for additional information.
Item 6. [Reserved]
Item 7. Management’s Discussion and Analysis of Financial Condition and Results of Operations
The following analysis of our financial condition and results of operations should be read in conjunction with our Consolidated Financial Statements and Notes thereto included in Item 8 of this Annual Report on Form 10-K. Certain terms and acronyms used throughout this report are defined in the Glossary of Abbreviations and Acronyms included as part of this report.
Some of the information in this discussion and analysis or included elsewhere in this report, including information with respect to our projections, plans and strategy for our business, are forward-looking statements that involve risks, uncertainties and assumptions. Our actual results and the timing of events could differ materially from those anticipated by these forward-looking statements as a result of many factors, including those discussed under “Cautionary Note Regarding Forward-Looking Statements—Safe Harbor Provisions” and in the Risk Factors detailed in Item 1A of this Annual Report on Form 10-K.
Index to Item 7
Overview
We are a diversified mortgage and real estate business with two reportable business segments—Mortgage and homegenius.
Our Mortgage segment aggregates, manages and distributes U.S. mortgage credit risk on behalf of mortgage lending institutions and mortgage credit investors, principally through private mortgage insurance on residential first-lien mortgage loans, and also provides other credit risk management, contract underwriting and fulfillment solutions to our customers. Our homegenius segment offers an array of title, real estate and technology products and services to consumers, mortgage lenders, mortgage and real estate investors, GSEs and real estate brokers and agents.
See Note 4 of Notes to Consolidated Financial Statements for additional information about our reportable segments, including the renaming of the homegenius segment in 2021 to align with updates to our brand strategy. See “Key Factors Affecting Our Results” for information about current business conditions and other factors that affect the performance of our Mortgage and homegenius businesses.
COVID-19 Impacts
The onset of the COVID-19 pandemic created periods of significant economic disruption, high unemployment, volatility and disruption in financial markets and required adjustments in the housing finance system and real estate markets. In addition, the pandemic has resulted in travel restrictions, temporary business shutdowns, and stay-at-home, quarantine, and similar orders, all of which contributed to a rapid and significant rise in unemployment that peaked in the second quarter of 2020.
Many of these restrictions have been lifted and businesses have been reopening, but numerous limitations, such as extensive health and safety measures and overall supply constraints and labor shortages, continue to limit operations. Further, while unemployment levels have declined from their peak, they continue to remain elevated compared to pre-pandemic levels, and may remain elevated or may rise depending on the pandemic’s scope, severity and duration, and its resulting impact on the economy. See Note 1 of Notes to Consolidated Financial Statements and “Item 1A. Risk Factors—The COVID-19
| | |
Part II. Item 7. Management’s Discussion and Analysis of Financial Condition and Results of Operations |
pandemic adversely impacted us and, in the future, could again adversely affect our business, results of operations or financial condition.”
As a result of the COVID-19 pandemic and its impact on the economy, including the significant increase in unemployment, we experienced a material increase in new defaults in 2020, substantially all of which related to defaults of loans subject to forbearance programs implemented in response to the COVID-19 pandemic. Beginning in the second quarter of 2020, the increase in the number of new mortgage defaults resulting from the COVID-19 pandemic had a negative effect on our results of operations and our reserve for losses. However, more recent trends in Cures have been more favorable than original expectations, resulting in favorable loss reserve development in 2021. See Note 11 for details on reserve development trends.
Our primary default rate was 2.9% at December 31, 2021, down from a peak of 6.5% at June 30, 2020 reflecting the material increase in new defaults in the three months ended June 30, 2020. Favorable trends in the number of new defaults and Cures were the primary drivers of the decline in our default inventory and default rate, compared to their peaks at June 30, 2020.
The number, timing and duration of new defaults and, in turn, the number of defaults that ultimately result in claims will depend on a variety of factors, including the scope, severity and duration of the COVID-19 pandemic, the resulting impact on the economy, including with respect to unemployment and housing prices, and the effectiveness of forbearance and other government efforts such as financial stimulus programs, to provide long-term economic and individual relief to assist homeowners. Consequently, the number and rate of total defaults is difficult to predict and will depend on the foregoing and other factors, including the number and timing of Cures and claims paid and the net impact on IIF from our Persistency Rate and future NIW. See “Item 1A. Risk Factors” for additional discussion of these factors and other risks and uncertainties.
Increases in new defaults may affect our ability to remain compliant with the PMIERs financial requirements. Once two missed payments have occurred on an insured loan, the PMIERs characterize the loan as “non-performing” and require us to establish an increased Minimum Required Asset factor for that loan regardless of the reason for the missed payments. During the COVID-19 Crisis Period, pursuant to the COVID-19 Amendment to the PMIERs, a Disaster Related Capital Charge that effectively reduces the Minimum Required Asset factor by 70% has been applied nationwide to all COVID-19 Defaulted Loans. For more information about the application of the Disaster Related Capital Charge see “Item 1. Business—Regulation—Federal Regulation—GSE Requirements for Mortgage Insurance Eligibility” for more information. The reduction in Radian Guaranty’s Minimum Required Assets from this Disaster Related Capital Charge was approximately $300 million as of December 31, 2021, compared to approximately $650 million at December 31, 2020. Inclusive of this benefit in both periods, Radian Guaranty’s PMIERs Cushion increased to $2.1 billion as of December 31, 2021, from $1.3 billion as of December 31, 2020. While we expect Radian Guaranty to continue to maintain its eligibility status with the GSEs, there are possible scenarios in which the number of new defaults could impact Radian Guaranty’s ability to comply with the PMIERs financial requirements. See “Item 1A. Risk Factors—Radian Guaranty may fail to maintain its eligibility status with the GSEs, and the additional capital required to support Radian Guaranty’s eligibility could reduce our available liquidity.”
In response to the COVID-19 pandemic, we raised additional capital, temporarily suspended purchases under our share repurchase program, aligned our business with the temporary origination and servicing guidelines announced by the GSEs, and made adjustments to our pricing and our underwriting guidelines to account for the increased risk and uncertainty associated with the COVID-19 pandemic. In addition, we took a number of actions to focus on protecting and supporting our workforce, while continuing to serve our customers effectively and support our communities. We activated our business continuity program by transitioning to a work-from-home virtual workforce model with certain essential activities supported by limited staff in office environments that comply with CDC guidelines and applicable state and local requirements. Based on our successful transition to a virtual work environment, we made the decision to reduce our office space and exit our former corporate headquarters in Philadelphia. See Note 9 of Notes to Consolidated Financial Statements for additional information on our lease right-of-use assets.
In order to support our communities during this unprecedented time, we have, among other things, pledged financial support to certain charitable organizations focused on assisting first responders, health care workers and their families. Further actions to respond to the COVID-19 pandemic and comply with governmental regulations and government and GSE programs adopted in response to the pandemic may be necessary as conditions continue to evolve.
Despite the risks and uncertainties posed by COVID-19, we believe that the steps we have taken in recent years, such as improving our debt maturity profile, enhancing our financial flexibility, implementing greater risk-based granularity into our pricing methodologies and increasing our use of risk distribution strategies to lower the risk profile and financial volatility of our mortgage insurance portfolio, has helped position the Company to better withstand the negative effects from macroeconomic stresses such as those that resulted from the COVID-19 pandemic.
Key Factors Affecting Our Results
The following sections discuss certain key drivers affecting our Mortgage and homegenius businesses, as well as other key factors affecting our results.
| | |
Part II. Item 7. Management’s Discussion and Analysis of Financial Condition and Results of Operations |
Mortgage
IIF and Related Drivers
Our IIF is one of the primary drivers of our future premiums that we expect to earn over time. Although not reflected in the current period financial statements, nor in our reported book value, we expect our IIF to generate substantial earnings in future periods, due to the high credit quality of our current mortgage insurance portfolio and expected Persistency Rate over multiple years.
Based on the current composition of our mortgage insurance portfolio, with Monthly Premium Policies comprising a larger proportion of our total portfolio than Single Premium Policies, an increase or decrease in IIF generally has a corresponding impact on premiums earned. Cancellations of our insurance policies as a result of prepayments and other reductions of IIF, such as Rescissions of coverage and claims paid, generally have a negative effect on premiums earned over time. See “Mortgage Insurance Portfolio—Insurance and Risk in Force” for more information about the levels and characteristics of our IIF.
The ultimate profitability of our mortgage insurance business is affected by the impact of mortgage prepayment speeds on the mix of business we write. The measure for assessing the impact of policy cancellations on our IIF is our Persistency Rate, defined as the percentage of IIF that remains in force over a period of time. Assuming all other factors remain constant, over the life of the policies, prepayment speeds have an inverse impact on IIF and the expected revenue from our Monthly Premium Policies. Slower loan prepayment speeds, demonstrated by a higher Persistency Rate, result in more IIF remaining in place, providing increased revenue from Monthly Premium Policies over time as premium payments continue. Earlier than anticipated loan prepayments, demonstrated by a lower Persistency Rate, reduce IIF and the revenue from our Monthly Premium Policies. Among other factors, prepayment speeds may be affected by changes in interest rates and other macroeconomic factors. A rising interest rate environment generally will reduce refinancing activity and result in lower prepayments, whereas a declining interest rate environment generally will increase the level of refinancing activity and therefore increase prepayments.
In contrast to Monthly Premium Policies, when Single Premium Policies are cancelled by the insured because the loan has been paid off or otherwise, we accelerate the recognition of any remaining unearned premiums, net of any refunds that may be owed to the borrower. Although these cancellations reduce IIF, assuming all other factors remain constant, the profitability of our Single Premium business increases when Persistency Rates are lower. As a result, we believe that writing a mix of Single Premium Policies and Monthly Premium Policies has the potential to moderate the overall impact on our results if actual prepayment speeds are significantly different from expectations. However, the impact of this moderating effect may be affected by the amount of reinsurance we obtain on portions of our portfolio, with the Single Premium QSR Program currently reducing the proportion of retained Single Premium Policies in our portfolio.
NIW and Related Drivers
NIW increases our IIF and our premiums written and earned. NIW is affected by the overall size of the mortgage origination market, the penetration percentage of private mortgage insurance into the overall mortgage origination market and our market share of the private mortgage insurance market. The overall mortgage origination market is influenced by macroeconomic factors such as household formation, household composition, home affordability, interest rates, housing markets in general, credit availability and the impact of various legislative and regulatory actions that may influence the housing and mortgage finance industries. The penetration percentage of private mortgage insurance is mainly influenced by: (i) the competitiveness of private mortgage insurance for GSE conforming loans compared to FHA and VA insured loans and (ii) the relative percentage of mortgage originations that are for purchased homes versus refinances. We believe, for example, that better execution for borrowers with higher FICO scores, lender preference and the inability to cancel FHA insurance for certain loans are factors that currently provide a competitive advantage for private mortgage insurers. See “Mortgage Insurance Portfolio—New Insurance Written.”
Private mortgage insurance penetration in the insurable market has generally been significantly higher on new mortgages for purchased homes than on the refinance of existing mortgages, because average LTVs are typically higher on home purchases and therefore these lower down payment loans are more likely to require mortgage insurance. Radian Guaranty’s share of the private mortgage insurance market is influenced by competition in that market. See “Item 1. Business—Competition.”
The following charts provide a historical perspective on certain key market drivers, including:
■the mortgage origination volume from home purchases and refinancings; and
■private mortgage insurance penetration as a percentage of the mortgage origination market.
| | |
Part II. Item 7. Management’s Discussion and Analysis of Financial Condition and Results of Operations |
| | |
Mortgage origination market (1) |
| | | | | | | | | | | | | | | | | | | | | | | | | | | | | | | | | | | | | | | | | |
| Origination Market ($ in billions) | Q1 2019 | Q2 2019 | Q3 2019 | Q4 2019 | Q1 2020 | Q2 2020 | Q3 2020 | Q4 2020 | Q1 2021 | Q2 2021 | Q3 2021 | Q4 2021 |
| ¢ | Refinance | $120 | $193 | $350 | $435 | $412 | $699 | $773 | $876 | $858 | $645 | $579 | $472 |
| ¢ | Purchase | $230 | $365 | $371 | $319 | $284 | $353 | $466 | $444 | $354 | $492 | $505 | $454 |
| Total | $350 | $558 | $721 | $754 | $696 | $1,052 | $1,239 | $1,320 | $1,212 | $1,137 | $1,084 | $926 |
| | |
Private mortgage insurance penetration of mortgage origination market (1) |
| | | | | | | | | | | | | | | | | | | | | | | | | | | | | | | | | | | | | | | | | |
| Market
Penetration (%) | Q1 2019 | Q2 2019 | Q3 2019 | Q4 2019 | Q1 2020 | Q2 2020 | Q3 2020 | Q4 2020 | Q1 2021 | Q2 2021 | Q3 2021 | Q4 2021 |
| ò | Purchase (2) | 23.5% | 23.2% | 25.1% | 24.1% | 22.7% | 24.3% | 26.9% | 27.0% | 27.2% | 26.2% | 26.6% | 26.3% |
| ò | Overall (2) | 17.0% | 17.3% | 16.4% | 14.5% | 13.5% | 14.0% | 14.6% | 13.4% | 12.2% | 13.9% | 13.7% | 14.0% |
| ò | Refinance (2) | 4.6% | 6.1% | 7.1% | 7.5% | 7.2% | 8.9% | 7.1% | 6.5% | 6.1% | 4.5% | 2.5% | 2.1% |
(1)Based on actual dollars generated in the credit enhanced market as reported by HUD and publicly reported industry information. Mortgage originations are based upon the average of originations reported by the Mortgage Bankers Association, Freddie Mac and Fannie Mae in their most recent published industry reports.
(2)Excluding originations under HARP.
Premiums
The premium rates we charge for our insurance are based on a number of borrower, loan and property characteristics. The mortgage insurance industry is highly competitive and private mortgage insurers compete with each other and with the FHA and VA with respect to price and other factors. We expect price competition to continue throughout the mortgage insurance industry and future price changes from private mortgage insurers or the FHA could impact our future premium rates or our ability to compete.
Our pricing is risk-based and is intended to generally align with the capital requirements under the PMIERs, while also considering pricing trends within the private mortgage insurance industry. As a result, our pricing is expected to generate relatively consistent returns across the credit spectrum and to provide stable expected loss ratios regardless of further credit expansion or contraction. In developing our pricing strategies, we monitor various competitive and economic factors while seeking to maximize the long-term economic value of our portfolio by balancing credit risk, profitability and volume
| | |
Part II. Item 7. Management’s Discussion and Analysis of Financial Condition and Results of Operations |
considerations, and aim to achieve an overall risk-adjusted rate of return on capital given our modeled performance expectations. Our actual portfolio returns will depend on a number of factors, including economic conditions, the mix of NIW that we are able to write, our pricing, the amount of reinsurance we use and the level of capital required under the PMIERs financial requirements.
Our pricing actions gradually affect our results over time, as existing IIF cancels and is replaced with NIW at current pricing. See “Liquidity and Capital Resources—Mortgage” and “Mortgage Insurance Portfolio—New Insurance Written” for additional information.
As described above, premiums on our mortgage insurance products are generally paid either on an installment basis, pursuant to Monthly Premium Policies, or in a single payment at the time of loan origination, pursuant to Single Premium Policies. See “Item 1. Business—Mortgage—Pricing—Primary Mortgage Insurance Premiums.” Our expected premium yield on our Single Premium Policies is lower than on our Monthly Premium Policies because our premium rates for the life of the policy are generally lower for our Single Premium Policies. However, as discussed above, the ultimate profitability of Single Premium Policies may be higher or lower than expected due to the impact of prepayment speeds. See “—IIF and Related Drivers” above.
Approximately 78.6% of the loans in our total Primary Mortgage Insurance portfolio at December 31, 2021 are Monthly Premium Policies that provide a level monthly premium for the first 10 years of the policy, followed by a lower level monthly premium thereafter. For loans that have been refinanced under HARP, the initial 10-year period is reset. Generally, a borrower is able to cancel the policy when the LTV reaches 80% of the original value, and the policy automatically cancels on the date the LTV is scheduled to reach 78% of the original value. As a result, the volume of loans that remain insured after 10 years and would be subject to the premium reset is generally not material in relation to the total loans originated. However, to the extent the volume of loans resetting from year to year varies significantly, the trend in earned premiums may also vary.
Losses
Incurred losses represent the estimated future claim payments on newly defaulted insured loans as well as any change in our claim estimates for existing defaults, including changes in the estimates we use to determine our expected losses, and estimates with respect to the frequency, magnitude and timing of anticipated losses on defaulted loans. Other factors influencing incurred losses include:
■The mix of credit characteristics in our total direct RIF (e.g., loans with higher risk characteristics, or loans with layered risk that combine multiple higher-risk attributes within the same loan, generally result in more delinquencies and claims). See “Mortgage Insurance Portfolio—Insurance and Risk in Force;”
■The average loan size (relatively higher priced properties with larger average loan amounts may result in higher incurred losses);
■The percentage of coverage on insured loans (higher percentages of insurance coverage generally correlate with higher incurred losses) and the presence of structural mitigants such as deductibles or stop losses;
■Changes in housing values (declines in housing values generally make it more difficult for borrowers to sell a home to avoid default or for the property to be sold to mitigate a claim, and also may negatively affect a borrower’s willingness to continue to make mortgage payments when the home value is less than the mortgage balance; conversely, increases in housing values tend to reduce the level of defaults as well as make it more likely that foreclosures will result in the loan being satisfied);
■The distribution of claims over the life cycle of a portfolio (historically, claims are relatively low during the first two years after a loan is originated and then increase over a period of several years before declining; however, several factors can impact and change this cycle, including the economic environment, the quality of the underwriting of the loan, characteristics of the mortgage loan, the credit profile of the borrower, housing prices and unemployment rates); and
■Our ability to mitigate potential losses through Rescissions, Claim Denials, cancellations and Claim Curtailments on claims submitted to us. These actions all reduce our incurred losses. However, if these Loss Mitigation Activities are successfully challenged at rates that are higher than expected or we agree to settle disputes related to our Loss Mitigation Activities, our incurred losses will increase. We may enter into specific agreements that govern activities such as claims decisions, claim payments, Loss Mitigation Activities and insurance coverage. As our portfolio originated through 2008 has become a smaller percentage of our overall insured portfolio, there has been a decrease in the amount of Loss Mitigation Activity with respect to the claims we receive, and we expect this trend to continue, particularly given the limitations on our Loss Mitigation Activities imposed in both the 2014 Master Policy and 2020 Master Policy. See Note 2 of Notes to Consolidated Financial Statements for additional information on Loss Mitigation Activities and “Item 1A. Risk Factors—Our Loss Mitigation Activity is not expected to mitigate mortgage insurance losses to the same extent as in prior years; Loss Mitigation Activity could continue to negatively impact our customer relationships.”
| | |
Part II. Item 7. Management’s Discussion and Analysis of Financial Condition and Results of Operations |
Risk Distribution
We use third-party reinsurance in our mortgage insurance business to manage capital and risk in an effort to optimize the amounts and types of capital and risk distribution deployed against insured risk. See “—IIF and Related Drivers” above. Currently, we distribute risk in our mortgage insurance portfolio through quota share and excess-of-loss reinsurance programs.
When we enter into a quota share reinsurance agreement, the reinsurer receives a premium and, in exchange, agrees to insure an agreed upon portion of incurred losses. These arrangements reduce our earned premiums but also reduce our net RIF, which provides capital relief, including under the PMIERs financial requirements. Our incurred losses are reduced by any incurred losses ceded in accordance with the reinsurance agreement, and we often receive ceding commissions from the reinsurer as part of the transaction, which, in turn, reduce our reported operating expenses and policy acquisition costs.
Our Excess-of-Loss Program primarily accesses the capital markets (through the Eagle Re Issuers’ issuance of mortgage insurance-linked notes). Our Excess-of-Loss Program reduces our earned premiums, but also reduces our net RIF, PMIERs financial requirements and incurred losses, which are allocated in accordance with the structure of the transaction. The Eagle Re Issuers are special purpose VIEs that are not consolidated in our consolidated financial statements because we do not have the unilateral power to direct those activities that are significant to their economic performance.
Our use of risk distribution structures has reduced our required capital and enhanced our projected return on capital, and we expect these structures to provide a level of credit protection in periods of economic stress. As of December 31, 2021, 73% of our primary RIF is subject to a form of risk distribution and our estimated reinsurance recoverables related to our mortgage insurance portfolio was $66.7 million. See Note 8 of Notes to Consolidated Financial Statements for more information about our reinsurance arrangements, including the total assets and liabilities of the Eagle Re Issuers.
Investment Income
Investment income is determined primarily by the investment balances held and the average yield on our overall investment portfolio.
Other Operating Expenses
Our other operating expenses are affected by the amount of our NIW, as well as the amount of IIF. Our other operating expenses may also be affected by the impact of performance on our incentive compensation programs, as a result of our pay-for-performance approach to compensation that is based on the level of achievement of both short-term and long-term goals.
homegenius
Premiums
We earn net premiums on title insurance through Radian Title Insurance. Demand for title insurance may be impacted by general marketplace competition in the real estate title industry, coupled with housing market related conditions such as new home sales, the sizes of the real estate purchase and refinance markets and interest rate fluctuations.
Services Revenue
Our homegenius segment is dependent upon overall activity in the mortgage, real estate and mortgage finance markets, as well as the overall health of the related industries. Due, in part, to the transactional nature of the business, revenues for our homegenius segment are subject to fluctuations from period to period, including seasonal fluctuations that reflect the activities in these markets. Sales volume is also affected by the number of competing companies and alternative products offered in the market. We believe the diversity of services we offer has the potential to produce fee income from the homegenius segment throughout various mortgage finance environments and economic cycles, although market conditions can significantly impact the mix and amount of fee income we generate in any particular period. See “Item 1. Business—homegenius—homegenius Business Overview” for more information on our homegenius services.
The homegenius segment is dependent on a limited number of large customers that represent a significant portion of its revenues. Generally, our contracts do not contain volume commitments and may be terminated by clients at any time. While access to Radian Guaranty’s mortgage insurance customer base provides additional opportunities to expand the homegenius segment’s existing customers, an unexpected loss of a major customer could significantly impact the level of homegenius revenue. Access to Radian Guaranty’s mortgage insurance customer base provides additional opportunities to expand the homegenius segment’s existing customers.
Our homegenius revenue is primarily generated under fixed-price contracts. Under fixed-price contracts, we agree to perform the specified services and deliverables for a predetermined per-unit price. To the extent our actual direct and allocated indirect costs decrease or increase from the estimates upon which the price was negotiated, we will generate more or less profit, respectively, or could incur a loss. See Note 2 of Notes to Consolidated Financial Statements for more information on revenue recognition policies for our homegenius segment.
| | |
Part II. Item 7. Management’s Discussion and Analysis of Financial Condition and Results of Operations |
Cost of Services
Our cost of services is primarily affected by our level of services revenue and the number of employees providing products and services for our homegenius businesses. Our cost of services primarily consists of employee compensation and related payroll benefits, and to a lesser extent, other costs of providing services such as travel and related expenses incurred in providing client services, costs paid to outside vendors, data acquisition costs and other compensation-related expenses to maintain software application platforms that directly support our businesses. The level of these costs may fluctuate as market rates of compensation change, or if there is decreased availability or a loss of qualified employees.
Operating Expenses
Our operating expenses primarily consist of salaries and benefits not classified as cost of services because they are related to employees, such as sales and corporate employees, who are not directly involved in providing client services. Operating expenses also include other selling, general and administrative expenses, depreciation and allocations of corporate general and administrative expenses.
See “Item 1. Business—homegenius—homegenius Business Overview” and Note 1 of Notes to Consolidated Financial Statements for additional information regarding the homegenius segment.
Other Factors Affecting Consolidated Results
In addition, the following items also may impact our consolidated results in the ordinary course. The items listed are not representative of all potential items impacting our consolidated results. See “Item 1A. Risk Factors” for additional information on the risks affecting our business.
Net Gains (Losses) on Investments and Other Financial Instruments. The recognition of realized investment gains or losses can vary significantly across periods, as the activity is highly discretionary based on the timing of individual securities sales due to such factors as market opportunities, our tax and capital profile and overall market cycles. Unrealized gains and losses arise primarily from changes in the market value of our investments that are classified as trading or equity securities. These valuation adjustments may not necessarily result in realized economic gains or losses.
Loss on Extinguishment of Debt. Gains or losses on early extinguishment of debt and losses incurred to purchase our debt prior to maturity are discretionary activities that are undertaken in order to take advantage of market opportunities to strengthen our financial and capital positions.
Impairment of Goodwill or Other Acquired Intangible Assets. The periodic review of goodwill and other acquired intangible assets for potential impairment may impact consolidated results. Our goodwill and other acquired intangible assets analysis is based on management’s assumptions, which are inherently subject to risks and uncertainties. See Note 7 of Notes to Consolidated Financial Statements for additional information.
Mortgage Insurance Portfolio
| | |
IIF by origination vintage (1) |
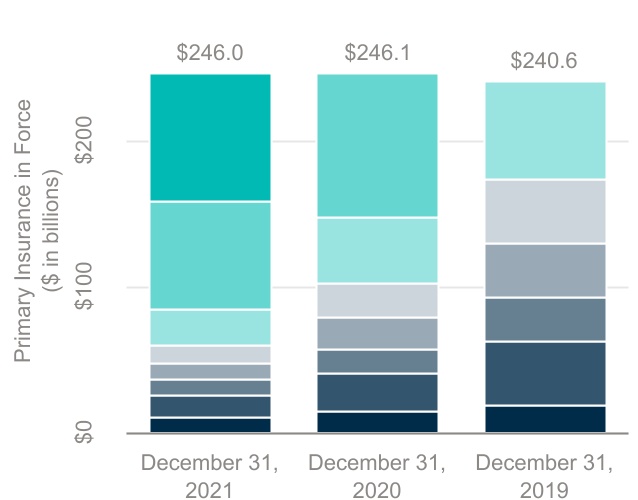
| | | | | | | | | | | | | | | | | | | | | | | |
| | Insurance in Force as of: |
| Vintage written in:
($ in billions) | December 31, 2021 | December 31, 2020 | December 31, 2019 |
¢ | 2021 | $87.4 | 35.5 | % | $— | — | % | $— | — | % |
¢ | 2020 | 74.3 | 30.2 | | 98.8 | 40.2 | | — | — | |
¢ | 2019 | 24.0 | 9.8 | | 44.6 | 18.1 | | 67.3 | 28.0 | |
¢ | 2018 | 12.4 | 5.0 | | 23.5 | 9.5 | | 42.9 | 17.8 | |
¢ | 2017 | 11.5 | 4.7 | | 21.2 | 8.6 | | 37.9 | 15.8 | |
¢ | 2016 | 10.1 | 4.1 | | 17.5 | 7.1 | | 29.5 | 12.2 | |
¢ | 2009 - 2015 | 14.9 | 6.1 | | 25.7 | 10.5 | | 44.0 | 18.3 | |
¢ | 2008 & Prior (2) | 11.4 | 4.6 | | 14.8 | 6.0 | | 19.0 | 7.9 | |
| Total | $246.0 | 100.0 | % | $246.1 | 100.0 | % | $240.6 | 100.0 | % |
| | | | | | | |
(1)Policy years represent the original policy years and have not been adjusted to reflect subsequent refinancing activity under HARP.
| | |
Part II. Item 7. Management’s Discussion and Analysis of Financial Condition and Results of Operations |
(2)Adjusted to reflect subsequent refinancing activity under HARP, this percentage would decrease to 3.0%, 3.7%, and 4.7% as of December 31, 2021, December 31, 2020 and December 31, 2019, respectively.
New Insurance Written
A key component of our current business strategy is to write NIW that we believe will generate future earnings and economic value while effectively maintaining the portfolio’s health, balance and profitability. Consistent with this objective, we wrote $91.8 billion of primary new mortgage insurance in 2021, compared to $105.0 billion of NIW in 2020. The NIW written in 2021 was Radian’s second highest volume in its history.
Our 2021 NIW, offset by cancellations and amortization within our existing portfolio, resulted in IIF of $246.0 billion at December 31, 2021, compared to $246.1 billion at December 31, 2020, as shown in the chart above. Our NIW decreased by 12.6% in 2021 as compared to 2020, due to lower refinance activity and lower private mortgage insurance penetration on refinances as well as lower market share, partially offset by increased purchase originations.
Among other factors, private mortgage insurance industry volumes are impacted by total mortgage origination volumes and the mix between mortgage originations that are for home purchases versus refinancings of existing mortgages. Historically, the penetration rate for private mortgage insurance was generally three to five times higher for purchase transactions than for refinancings. However, with significant home price appreciation in the past year, penetration on purchase transactions has increased while penetration on refinancings has decreased, and the penetration rate for private mortgage insurance has shifted to six to ten times higher for purchase transactions than for refinancings.
According to industry estimates, total mortgage origination volume was slightly lower in 2021 as compared to 2020 due to lower refinance activity, partially offset by a strong purchase market. Although it is difficult to project future volumes, recent market projections for 2022 estimate total mortgage originations of approximately $3.0 trillion, which would represent a decline in the total annual mortgage origination market of approximately 31% as compared to 2021, with a private mortgage insurance market of $500 to $550 billion. This outlook anticipates a decrease in refinance originations in 2022 resulting from expected increases in interest rates. While expectations for refinance volume vary, there is consensus around a large purchase market driven by increased home sales, which is a positive for mortgage insurers given the higher likelihood that purchase loans will utilize private mortgage insurance as compared to refinance loans. If refinance volume declines, we would expect the Persistency Rate for our portfolio to increase, benefiting the size of our IIF portfolio. See “Item 1A. Risk Factors” for more information.
Our total mix of Single Premium Policies decreased to 7.2% of our NIW for 2021, compared to 12.3% for 2020. Borrower-paid Single Premium Policies were 96.3% of our total direct Single Premium NIW for 2021 compared to 90.2% for 2020. We expect our production level for Single Premium Policies to fluctuate over time based on various factors, which include risk/return considerations and market conditions.
The following table provides selected information as of and for the periods indicated related to our mortgage insurance NIW. For direct Single Premium Policies, NIW includes policies written on an individual basis (as each loan is originated) and on an aggregated basis (in which each individual loan in a group of loans is insured in a single transaction, typically after the loans have been originated).
| | |
Part II. Item 7. Management’s Discussion and Analysis of Financial Condition and Results of Operations |
| | | | | | | | | | | | | | | | | | | | |
| NIW | | | | | | |
| | | | | | |
| | Years Ended December 31, |
| ($ in millions) | | 2021 | | 2020 | | 2019 |
| NIW | | $ | 91,830 | | | $ | 105,024 | | | $ | 71,327 | |
| Primary risk written | | $ | 22,591 | | | $ | 24,540 | | | $ | 17,163 | |
| Average coverage percentage | | 24.6 | % | | 23.4 | % | | 24.1 | % |
| | | | | | | |
NIW by loan purpose | | | | | | |
| Purchases | | 80.5 | % | | 64.8 | % | | 81.1 | % |
| Refinances | | 19.5 | % | | 35.2 | % | | 18.9 | % |
| | | | | | |
| Total borrower-paid | | 99.2 | % | | 98.2 | % | | 96.7 | % |
| | | | | | |
NIW by premium type | | | | | | |
| Direct Monthly and Other Recurring Premiums | | 92.8 | % | | 87.7 | % | | 83.5 | % |
Direct single premiums (1) | | 7.2 | % | | 12.3 | % | | 16.5 | % |
| | | | | | |
NIW by FICO score (2) | | | | | | |
| >=740 | | 58.6 | % | | 66.0 | % | | 63.3 | % |
| 680-739 | | 34.2 | % | | 30.8 | % | | 31.9 | % |
| 620-679 | | 7.2 | % | | 3.2 | % | | 4.8 | % |
| | | | | | |
| | | | | | |
NIW by LTV | | | | | | |
| 95.01% and above | | 12.0 | % | | 9.2 | % | | 16.7 | % |
| 90.01% to 95.00% | | 40.7 | % | | 37.1 | % | | 37.7 | % |
| 85.01% to 90.00% | | 28.3 | % | | 29.4 | % | | 28.0 | % |
| 85.00% and below | | 19.0 | % | | 24.3 | % | | 17.6 | % |
| | | | | | |
(1)Borrower-paid Single Premium Policies were 6.9%, 11.1% and 14.2% of NIW for the periods indicated, respectively. See “Item 1. Business—Regulation—Federal Regulation—GSE Requirements for Mortgage Insurance Eligibility” for additional information.
(2)For loans with multiple borrowers, the percentage of NIW by FICO score represents the lowest of the borrowers’ FICO scores.
Insurance and Risk in Force
Our IIF is the primary driver of the future premiums that we expect to earn over time. IIF at December 31, 2021 was flat as compared to the same period last year, as the positive impact from our NIW in 2021 was offset primarily by cancellations of existing policies associated with refinancings, as reflected in our Persistency Rates and further discussed below.
Historically, there is a close correlation between interest rates and Persistency Rates. Lower interest rate environments generally increase refinancings, which increase the cancellation rate of our insurance and negatively affect our Persistency Rates. As shown in the table further below, our 12-month Persistency Rate at December 31, 2021 increased as compared to the same period in 2020 but remains lower than Persistency Rates experienced prior to the pandemic. The increase in our Persistency Rate in 2021 was primarily attributable to the decline in refinance activity as compared to the prior year. As refinance activity began to moderate in the second half of 2021, those trends contributed to the increase in our Persistency Rate at December 31, 2021 as compared to the same period in 2020, as well as growth in our IIF in the second half of 2021.
The net change in our IIF during 2021 reflects a 5.8% increase in Monthly Premium Policies in force, offset by a 21.1% decline in Single Premium Policies in force. Single Premium Policy cancellations were the primary driver of the decrease in unearned premiums on our consolidated balance sheet at December 31, 2021 as compared to December 31, 2020.
We continue to believe that the long-term housing market fundamentals and outlook remain positive, including low interest rates, demographics supporting growth in the population of first-time homebuyers and a relatively constrained supply of homes available for sale. However, our earnings in future periods are subject to elevated risks and uncertainties related to macroeconomic conditions and specific events that impact the housing finance and real estate markets, including housing prices, inflationary pressures, unemployment levels, interest rate changes and the availability of credit, as well as the potential impact of the unprecedented and continually evolving social and economic impacts associated with the COVID-19 pandemic.
| | |
Part II. Item 7. Management’s Discussion and Analysis of Financial Condition and Results of Operations |
For additional information about the COVID-19 pandemic, see “Overview—COVID-19 Impacts,” Note 1 of Notes to Consolidated Financial Statements and “Item 1A. Risk Factors—The credit performance of our mortgage insurance portfolio is impacted by macroeconomic conditions and specific events that affect the ability of borrowers to pay their mortgages.”
Historical loan performance data indicates that credit scores and underwriting quality are key drivers of credit performance. As of December 31, 2021, our portfolio of business written subsequent to 2008, including refinancings under HARP, represented approximately 97.0% of our total primary RIF. Loan originations after 2008 have consisted primarily of high credit quality loans with significantly better credit performance than loans originated during 2008 and prior periods. However, the impact to our future losses from, among other things, the COVID-19 pandemic remains uncertain, although trends in 2021 have been positive.
The following table illustrates the trends of our cumulative incurred loss ratios by year of origination and development year.
| | | | | | | | | | | | | | | | | | | | | | | | | | | | | | | | |
Cumulative incurred loss ratio by vintage (1) |
| | | | | | | | | | |
| Vintage | Dec
2012 | Dec
2013 | Dec
2014 | Dec
2015 | Dec
2016 | Dec
2017 | Dec
2018 | Dec
2019 | Dec 2020 (2) | Dec 2021 (2) |
| 2012 | 2.0% | 3.2% | 3.6% | 2.7% | 2.9% | 2.8% | 2.8% | 2.8% | 3.2% | 3.0% |
| 2013 | | 2.5% | 4.0% | 3.4% | 3.7% | 3.5% | 3.4% | 3.3% | 4.2% | 4.1% |
| 2014 | | | 2.7% | 4.1% | 4.9% | 5.0% | 5.1% | 5.2% | 6.9% | 6.8% |
| 2015 | | | | 2.1% | 4.8% | 5.2% | 5.0% | 4.7% | 7.4% | 6.8% |
| 2016 | | | | | 2.9% | 5.0% | 4.8% | 4.7% | 9.7% | 8.0% |
| 2017 | | | | | | 4.7% | 5.1% | 6.1% | 14.3% | 11.9% |
| 2018 | | | | | | | 3.0% | 6.4% | 22.8% | 19.0% |
| 2019 | | | | | | | | 2.8% | 35.6% | 23.5% |
| 2020 | | | | | | | | | 25.6% | 14.9% |
| 2021 | | | | | | | | | | 7.9% |
(1)Represents inception-to-date losses incurred as a percentage of net premiums earned.
(2)Losses incurred in 2020 and 2021 across all vintages were elevated due to the impact of the COVID-19 pandemic.
Throughout this report, unless otherwise noted, RIF is presented on a gross basis and includes the amount ceded under reinsurance. RIF and IIF for direct Single Premium Policies include policies written on an individual basis (as each loan is originated) and on an aggregated basis (in which each individual loan in a group of loans is insured in a single transaction, typically after the loans have been originated).
| | |
Part II. Item 7. Management’s Discussion and Analysis of Financial Condition and Results of Operations |
The following tables provide selected information as of and for the periods indicated related to mortgage insurance IIF and RIF.
| | | | | | | | | | | | | | | | | | | | |
| IIF and RIF | | | | | | |
| | | | | | |
| | Years Ended December 31, |
| ($ in millions) | | 2021 | | 2020 | | 2019 |
| Primary IIF | | $ | 245,972 | | | $ | 246,144 | | | $ | 240,558 | |
| Primary RIF | | $ | 60,913 | | | $ | 60,656 | | | $ | 60,921 | |
| Average coverage percentage | | 24.8 | % | | 24.6 | % | | 25.3 | % |
| | | | | | |
| | | | | | |
| Persistency Rate (12 months ended) | | 64.3 | % | | 61.2 | % | | 78.2 | % |
Persistency Rate (quarterly, annualized) (1) | | 71.7 | % | | 60.4 | % | | 75.0 | % |
| | | | | | | |
| Total borrower-paid RIF | | 90.6 | % | | 86.3 | % | | 78.9 | % |
| | | | | | |
| Primary RIF by Premium Type | | | | | | |
| Direct Monthly and Other Recurring Premiums | | 83.9 | % | | 79.1 | % | | 72.4 | % |
Direct single premiums (2) | | 16.1 | % | | 20.9 | % | | 27.6 | % |
| | | | | | | |
Primary RIF by FICO score (3) | | | | | | |
| >=740 | | 56.9 | % | | 57.5 | % | | 56.9 | % |
| 680-739 | | 35.0 | % | | 34.6 | % | | 34.2 | % |
| 620-679 | | 7.6 | % | | 7.3 | % | | 8.2 | % |
| <=619 | | 0.5 | % | | 0.6 | % | | 0.7 | % |
| | | | | | | |
Primary RIF by LTV | | | | | | |
| 95.01% and above | | 15.1 | % | | 14.4 | % | | 14.2 | % |
| 90.01% to 95.00% | | 48.9 | % | | 49.3 | % | | 51.3 | % |
| 85.01% to 90.00% | | 27.7 | % | | 28.0 | % | | 27.9 | % |
| 85.00% and below | | 8.3 | % | | 8.3 | % | | 6.6 | % |
| | | | | | |
| | | | | | |
| | | | | | |
| | | | | | |
| | | | | | |
| | | | | | |
| | | | | | |
| | | | | | |
| | | | | | |
| | | | | | |
| | | | | | |
(1)The Persistency Rate on a quarterly, annualized basis is calculated based on loan-level detail for the quarter ending as of the date shown. It may be impacted by seasonality or other factors, including the level of refinance activity during the applicable periods and may not be indicative of full-year trends.
(2)Borrower-paid Single Premium Policies were 8.5%, 9.4% and 9.1% of primary RIF for the periods indicated, respectively.
(3)For loans with multiple borrowers, the percentage of primary RIF by FICO score represents the lowest of the borrowers’ FICO scores.
| | |
Part II. Item 7. Management’s Discussion and Analysis of Financial Condition and Results of Operations |
The following table shows our direct Primary Mortgage Insurance RIF by year of origination and selected information related to that risk as of December 31, 2021 and 2020.
| | | | | | | | | | | | | | | | | | | | | | | | | | | | | | | | | | | | | | | | | | | | | | | | | | | | | | |
Year of origination - RIF | | | | |
| | | | | | | | | | | | | | | | | | | | |
| | December 31, | | | | |
| | | 2021 | | 2020 | | | | |
| ($ in millions) | | RIF | | Number of Defaults | | Delinquency Rate | | Percentage of Reserve for Losses | | RIF | | Number of Defaults | | Delinquency Rate | | Percentage of Reserve for Losses | | | | |
| 2008 and prior | | $ | 2,865 | | | 7,385 | | | 9.3 | % | | 24.5 | % | | $ | 3,733 | | | 12,046 | | | 12.1 | % | | 26.2 | % | | | | |
| 2009-2015 | | 3,904 | | | 3,719 | | | 4.4 | | | 13.7 | | | 6,840 | | | 7,948 | | | 5.7 | | | 14.3 | | | | | |
| 2016 | | 2,684 | | | 2,255 | | | 4.3 | | | 8.5 | | | 4,616 | | | 5,243 | | | 6.2 | | | 9.6 | | | | | |
| 2017 | | 2,998 | | | 3,399 | | | 5.7 | | | 12.2 | | | 5,495 | | | 7,652 | | | 7.5 | | | 13.1 | | | | | |
| 2018 | | 3,158 | | | 4,342 | | | 6.8 | | | 16.4 | | | 5,973 | | | 9,974 | | | 9.0 | | | 16.7 | | | | | |
| 2019 | | 5,892 | | | 4,078 | | | 3.7 | | | 15.0 | | | 10,832 | | | 9,741 | | | 5.3 | | | 15.5 | | | | | |
| 2020 | | 17,789 | | | 2,938 | | | 1.1 | | | 8.3 | | | 23,167 | | | 2,933 | | | 0.9 | | | 4.6 | | | | | |
| 2021 | | 21,623 | | | 945 | | | 0.3 | | | 1.4 | | | — | | | — | | | — | | | — | | | | | |
| Total | | $ | 60,913 | | | 29,061 | | | | | 100.0 | % | | $ | 60,656 | | | 55,537 | | | | | 100.0 | % | | | | |
Geographic Dispersion
The following table shows, as of December 31, 2021 and 2020, the percentage of our direct Primary Mortgage Insurance RIF and the associated percentage of our mortgage insurance reserve for losses (by location of property) for the top 10 states in the U.S. (as measured by our direct Primary Mortgage Insurance RIF as of December 31, 2021).
| | | | | | | | | | | | | | | | | | | | | | | | | | | | | | |
| Top 10 U.S. states - RIF | | | | | | | | | | |
| | | | | | | | | | |
| | | December 31, |
| | 2021 | | 2020 | | |
| Top 10 States | | RIF | | Reserve for Losses | | RIF | | Reserve for Losses | | |
| California | | 9.3 | % | | 11.0 | % | | 9.9 | % | | 11.2 | % | | |
| Texas | | 8.5 | | | 9.7 | | | 8.7 | | | 10.0 | | | |
| Florida | | 6.9 | | | 10.8 | | | 7.5 | | | 11.4 | | | |
| Illinois | | 4.6 | | | 5.3 | | | 4.4 | | | 4.9 | | | |
| New York | | 4.4 | | | 7.7 | | | 3.8 | | | 7.0 | | | |
| Virginia | | 3.8 | | | 2.7 | | | 3.8 | | | 2.6 | | | |
| New Jersey | | 3.8 | | | 5.1 | | | 3.4 | | | 4.9 | | | |
| Pennsylvania | | 3.6 | | | 2.6 | | | 3.3 | | | 2.5 | | | |
| Washington | | 3.5 | | | 2.0 | | | 3.3 | | | 1.9 | | | |
| Maryland | | 3.3 | | | 3.9 | | | 3.4 | | | 3.4 | | | |
| Total | | 51.7 | % | | 60.8 | % | | 51.5 | % | | 59.8 | % | | |
The following table shows, as of December 31, 2021 and 2020, the percentage of our direct Primary Mortgage Insurance RIF and the associated percentage of our mortgage insurance reserve for losses (by location of property) for the top 10 Core Based Statistical Areas, referred to as “CBSAs,” in the U.S. (as measured by our direct Primary Mortgage Insurance RIF as of December 31, 2021).
| | |
Part II. Item 7. Management’s Discussion and Analysis of Financial Condition and Results of Operations |
| | | | | | | | | | | | | | | | | | | | | | | | | | |
| Top 10 Core Based Statistical Areas - RIF | | | | | | | | |
| | | | | | | | |
| | | December 31, |
| | | 2021 | | 2020 |
Top 10 CBSAs (1) | | RIF | | Reserve for Losses | | RIF | | Reserve for Losses |
| New York-Newark-Jersey City, NY-NJ-PA | | 5.4 | % | | 10.0 | % | | 4.7 | % | | 9.1 | % |
| Chicago-Naperville-Elgin, IL-IN-WI | | 4.2 | | | 5.2 | | | 4.1 | | | 4.7 | |
| Washington-Arlington-Alexandria, DC-VA-MD-WV | | 4.0 | | | 4.1 | | | 4.0 | | | 3.7 | |
| Dallas-Fort Worth-Arlington, TX | | 2.9 | | | 3.4 | | | 3.2 | | | 3.5 | |
| Los Angeles-Long Beach-Anaheim, CA | | 2.6 | | | 3.3 | | | 2.6 | | | 3.4 | |
| Philadelphia-Camden-Wilmington, PA-NJ-DE-MD | | 2.6 | | | 2.3 | | | 2.5 | | | 2.1 | |
| Houston-The Woodlands-Sugar Land, TX | | 2.5 | | | 3.3 | | | 2.3 | | | 3.3 | |
| Minneapolis-St. Paul-Bloomington, MN-WI | | 2.3 | | | 1.3 | | | 2.1 | | | 1.2 | |
| Miami-Fort Lauderdale-Pompano Beach, FL | | 2.2 | | | 4.4 | | | 2.2 | | | 4.8 | |
| Atlanta-Sandy Springs-Alpharetta, GA | | 2.1 | | | 3.3 | | | 2.5 | | | 3.6 | |
| Total | | 30.8 | % | | 40.6 | % | | 30.2 | % | | 39.4 | % |
(1)CBSAs are metropolitan areas and include a portion of adjoining states as noted above.
Risk Distribution
We use third-party reinsurance in our mortgage insurance business as part of our risk distribution strategy, including to manage our capital position and risk profile. When we enter into a reinsurance agreement, the reinsurer receives a premium and, in exchange, insures an agreed upon portion of incurred losses. While these arrangements have the impact of reducing our earned premiums, they also reduce our required capital and are expected to increase our return on required capital for the related policies.
The impact of these programs on our financial results will vary depending on the level of ceded RIF, as well as the levels of prepayments and incurred losses on the reinsured portfolios, among other factors. See “Key Factors Affecting Our Results—Mortgage—Risk Distribution” and Note 8 of Notes to Consolidated Financial Statements for more information about our reinsurance transactions.
The table below provides information about the amounts by which Radian Guaranty’s reinsurance programs reduced its Minimum Required Assets as of the dates indicated.
| | | | | | | | | | | | | | | | | | | | | | | | | | |
PMIERs benefit from risk distribution | | |
| | | | | | | | |
| | December 31, | | |
| ($ in thousands) | | 2021 | | 2020 | | 2019 | | |
PMIERs impact - reduction in Minimum Required Assets (1) | | | | | | | | |
| Excess-of-Loss Program | | $ | 995,171 | | | $ | 912,734 | | | $ | 738,386 | | | |
| Single Premium QSR Program | | 314,183 | | | 423,712 | | | 511,695 | | | |
| QSR Program | | 12,541 | | | 22,712 | | | 35,382 | | | |
| Total PMIERs impact | | $ | 1,321,895 | | | $ | 1,359,158 | | | $ | 1,285,463 | | | |
| Percentage of gross Minimum Required Assets | | 28.4 | % | | 28.8 | % | | 27.4 | % | | |
(1)Excludes the impact of intercompany reinsurance agreement with Radian Reinsurance, which was terminated in January 2020.
Results of Operations—Consolidated
Radian Group serves as the holding company for our operating subsidiaries and does not have any operations of its own. Our consolidated operating results for 2021 primarily reflect the financial results and performance of our two business segments—Mortgage and homegenius. See “Results of Operations—Mortgage,” and “Results of Operations—homegenius” for the operating results of these business segments.
In addition to the results of our operating segments, pretax income (loss) is also affected by other factors. See “Key Factors Affecting Our Results—Other Factors Affecting Consolidated Results” and “—Use of Non-GAAP Financial Measures” below for more information regarding items that are excluded from the operating results of our operating segments.
| | |
Part II. Item 7. Management’s Discussion and Analysis of Financial Condition and Results of Operations |
The following table highlights selected information related to our consolidated results of operations for the years ended December 31, 2021, 2020 and 2019.
| | | | | | | | | | | | | | | | | | | | | | | | | | | | | | | | |
| Summary results of operations - Consolidated |
| | | | | | | | | | |
| | | | | | | | $ Change |
| | Years Ended December 31, | | Favorable (Unfavorable) |
| ($ in millions, except per-share amounts) | | 2021 | | 2020 | | 2019 | | 2021 vs. 2020 | | 2020 vs. 2019 |
| Pretax income | | $ | 764.8 | | | $ | 479.4 | | | $ | 849.0 | | | $ | 285.4 | | | $ | (369.6) | |
| Net income | | 600.7 | | | 393.6 | | | 672.3 | | | 207.1 | | | (278.7) | |
| | | | | | | | | | |
| Diluted net income per share | | 3.16 | | | 2.00 | | | 3.20 | | | 1.16 | | | (1.20) | |
| Book value per share at December 31 | | 24.28 | | | 22.36 | | | 20.13 | | | 1.92 | | | 2.23 | |
Net premiums earned (1) | | 1,037.2 | | | 1,115.3 | | | 1,145.3 | | | (78.1) | | | (30.0) | |
Services revenue (2) | | 125.8 | | | 105.4 | | | 154.6 | | | 20.4 | | | (49.2) | |
Net investment income (1) | | 147.9 | | | 154.0 | | | 171.8 | | | (6.1) | | | (17.8) | |
| Net gains on investments and other financial instruments | | 15.6 | | | 60.3 | | | 51.7 | | | (44.7) | | | 8.6 | |
| | | | | | | | | | |
| | | | | | | | | | |
| | | | | | | | | | |
Provision for losses (1) | | 20.9 | | | 485.1 | | | 132.0 | | | 464.2 | | | (353.1) | |
| | | | | | | | | | |
Cost of services (2) | | 103.7 | | | 86.1 | | | 108.3 | | | (17.6) | | | 22.2 | |
Other operating expenses (3) | | 323.7 | | | 280.7 | | | 306.1 | | | (43.0) | | | 25.4 | |
| | | | | | | | | | |
Interest expense (1) | | 84.3 | | | 71.2 | | | 56.3 | | | (13.1) | | | (14.9) | |
| | | | | | | | | | |
| | | | | | | | | | |
| Loss on extinguishment of debt | | — | | | — | | | 22.7 | | | — | | | 22.7 | |
| Impairment of goodwill | | — | | | — | | | 4.8 | | | — | | | 4.8 | |
| Amortization and impairment of other acquired intangible assets | | 3.5 | | | 5.1 | | | 22.3 | | | 1.6 | | | 17.2 | |
| Income tax provision | | 164.2 | | | 85.8 | | | 176.7 | | | (78.4) | | | 90.9 | |
Adjusted pretax operating income (4) | | 757.7 | | | 432.1 | | | 854.6 | | | 325.6 | | | (422.5) | |
Adjusted diluted net operating income per share (4) | | 3.15 | | | 1.74 | | | 3.21 | | | 1.41 | | | (1.47) | |
| Return on equity | | 14.1 | % | | 9.4 | % | | 17.8 | % | | 4.7 | % | | (8.4) | % |
Adjusted net operating return on equity (4) | | 14.0 | % | | 8.2 | % | | 17.9 | % | | 5.8 | % | | (9.7) | % |
(1)Relates primarily to the Mortgage segment. See “Results of Operations—Mortgage” for more information.
(2)Relates primarily to our homegenius segment. See “Results of Operations—homegenius” and “Results of Operations—All Other” for more information.
(3)See “Results of Operations—Mortgage,” “Results of Operations—homegenius” and “Results of Operations—All Other” for more information on both direct and allocated operating expenses.
(4)See “—Use of Non-GAAP Financial Measures” below.
This section of our Annual Report on Form 10-K generally discusses our consolidated results of operations for the years ended December 31, 2021 and 2020 and a year-over-year comparison between 2021 and 2020. Detailed discussions of our consolidated results of operations for the year ended December 31, 2019, including the year-over-year comparisons between 2020 and 2019, that are not included in this Annual Report on Form 10-K can be found in “Item 7. Management’s Discussion and Analysis of Financial Condition and Results of Operations” in our Annual Report on Form 10-K for the year ended December 31, 2020 filed with the SEC on February 26, 2021.
Net Income. As discussed in more detail below, our net income increased for 2021 compared to 2020, primarily reflecting a decrease in provision for losses related to our Mortgage segment. Partially offsetting this item was: (i) an increase in our income tax provision; (ii) a decrease in our Mortgage segment net premiums earned; (iii) a decrease in net gains on investments and other financial instruments; and (iv) an increase in other operating expenses.
Diluted Net Income Per Share. The increase in diluted net income per share for 2021 compared to 2020 is primarily due to the change in net income, as discussed above.
Adjusted Diluted Net Operating Income Per Share. The increase in adjusted diluted net operating income per share for 2021 compared to 2020 is primarily due to the increase in our Mortgage segment’s adjusted pretax operating income, which increased to $781.5 million in 2021, from $453.3 million in 2020. See “Results of Operations—Mortgage—Year Ended December 31, 2021 Compared to Year Ended December 31, 2020—Adjusted Pretax Operating Income” for more information on our Mortgage segment’s results.
| | |
Part II. Item 7. Management’s Discussion and Analysis of Financial Condition and Results of Operations |
Book Value Per Share. The increase in book value per share from $22.36 at December 31, 2020 to $24.28 at December 31, 2021, is primarily due to our net income for the year ended December 31, 2021. Partially offsetting this item is: (i) a decrease of $0.75 per share due to unrealized losses in our available for sale securities, recorded in accumulated other comprehensive income and (ii) a decrease of $0.54 per share from the impact of dividends and dividend equivalents.
Return on Equity. The changes in return on equity across all periods presented are primarily due to the changes in net income and, to a lesser extent, changes in stockholders’ equity. See “—Net Income” above for more information on the changes in net income.
Adjusted Net Operating Return on Equity. The changes in adjusted net operating return on equity across all periods presented are primarily due to the changes in our adjusted pretax operating income.
Net Gains on Investments and Other Financial Instruments. Net gains on investments and other financial instruments for 2021 decreased as compared to 2020 primarily due to: (i) a decrease in net realized gains on our fixed-maturities available for sale; (ii) a decrease in net unrealized gains on our trading securities; (iii) a decrease in gains on other financial instruments; and (iv) a decrease in the fair value of our embedded derivatives. These decreases were partially offset by: (i) an increase in net realized gains on equity securities and (ii) a decrease in impairments recorded in earnings. The primary driver of the decreased gains on our fixed-income securities in 2021 was the impact of the rising interest rate environment experienced during the year, as compared to the positive effects of a declining interest rate environment in 2020. See Note 6 of Notes to Consolidated Financial Statements for additional information about our net gains on investments.
Income Tax Provision. Variations in our effective tax rates, combined with differences in pretax income, were the drivers of the changes in our income tax provision between periods. Our 2021 effective tax rate was 21.5%, which approximated the federal statutory rate of 21%, as compared to 17.9% for 2020. Our effective tax rate in 2020 was lower than the federal statutory tax rate of 21% primarily due to decreases in our liability for uncertain tax positions.
Use of Non-GAAP Financial Measures. In addition to the traditional GAAP financial measures, we have presented “adjusted pretax operating income (loss),” “adjusted diluted net operating income (loss) per share” and “adjusted net operating return on equity,” which are non-GAAP financial measures for the consolidated company, among our key performance indicators to evaluate our fundamental financial performance. These non-GAAP financial measures align with the way our business performance is evaluated by both management and by our board of directors. These measures have been established in order to increase transparency for the purposes of evaluating our operating trends and enabling more meaningful comparisons with our peers. Although on a consolidated basis “adjusted pretax operating income (loss),” “adjusted diluted net operating income (loss) per share” and “adjusted net operating return on equity” are non-GAAP financial measures, for the reasons discussed above we believe these measures aid in understanding the underlying performance of our operations.
Total adjusted pretax operating income (loss), adjusted diluted net operating income (loss) per share and adjusted net operating return on equity are not measures of overall profitability, and therefore should not be considered in isolation or viewed as substitutes for GAAP pretax income (loss), diluted net income (loss) per share or return on equity. Our definitions of adjusted pretax operating income (loss), adjusted diluted net operating income (loss) per share and adjusted net operating return on equity, as discussed and reconciled below to the most comparable respective GAAP measures, may not be comparable to similarly-named measures reported by other companies.
Our senior management, including our Chief Executive Officer (Radian’s chief operating decision maker), uses adjusted pretax operating income (loss) as our primary measure to evaluate the fundamental financial performance of the Company’s business segments and to allocate resources to the segments.
Adjusted pretax operating income (loss) is defined as GAAP consolidated pretax income (loss) excluding the effects of: (i) net gains (losses) on investments and other financial instruments, except for certain investments attributable to our reportable segments; (ii) loss on extinguishment of debt; (iii) amortization and impairment of goodwill and other acquired intangible assets; and (iv) impairment of other long-lived assets and other non-operating items, such as impairment of internal-use software, gains (losses) from the sale of lines of business and acquisition-related income and expenses.
Although adjusted pretax operating income (loss) excludes certain items that have occurred in the past and are expected to occur in the future, the excluded items represent those that are: (i) not viewed as part of the operating performance of our primary activities or (ii) not expected to result in an economic impact equal to the amount reflected in pretax income (loss). These adjustments, along with the reasons for their treatment, are described in Note 4 of Notes to Consolidated Financial Statements.
The following table provides a reconciliation of consolidated pretax income to our non-GAAP financial measure for the consolidated Company of adjusted pretax operating income.
| | |
Part II. Item 7. Management’s Discussion and Analysis of Financial Condition and Results of Operations |
| | | | | | | | | | | | | | | | | | | | |
| Reconciliation of consolidated pretax income to adjusted pretax operating income |
| | Years Ended December 31, |
| (In thousands) | | 2021 | | 2020 | | 2019 |
| Consolidated pretax income | | $ | 764,832 | | | $ | 479,441 | | | $ | 848,993 | |
| Less income (expense) items: | | | | | | |
| Net gains on investments and other financial instruments | | 14,094 | | | 60,277 | | | 51,719 | |
| Loss on extinguishment of debt | | — | | | — | | | (22,738) | |
| | | | | | |
| Impairment of goodwill | | — | | | — | | | (4,828) | |
| Amortization and impairment of other acquired intangible assets | | (3,450) | | | (5,144) | | | (22,288) | |
| Impairment of other long-lived assets and other non-operating items | | (3,561) | | | (7,759) | | | (7,507) | |
Total adjusted pretax operating income (1) | | $ | 757,749 | | | $ | 432,067 | | | $ | 854,635 | |
(1)Total adjusted pretax operating income on a consolidated basis consists of adjusted pretax operating income (loss) for our Mortgage segment, homegenius segment and All Other activities, as further detailed in Note 4 of Notes to Consolidated Financial Statements.
Adjusted diluted net operating income (loss) per share is calculated by dividing (i) adjusted pretax operating income (loss) attributable to common stockholders, net of taxes computed using the Company’s statutory tax rate, by (ii) the sum of the weighted average number of common shares outstanding and all dilutive potential common shares outstanding. The following table provides a reconciliation of diluted net income (loss) per share to our non-GAAP financial measure for the consolidated Company of adjusted diluted net operating income (loss) per share.
| | | | | | | | | | | | | | | | | | | | |
| Reconciliation of diluted net income per share to adjusted diluted net operating income per share |
| | | | | | |
| | Years Ended December 31, |
| | 2021 | | 2020 | | 2019 |
| Diluted net income per share | | $ | 3.16 | | | $ | 2.00 | | | $ | 3.20 | |
| Less per-share impact of reconciling income (expense) items: | | | | | | |
| Net gains on investments and other financial instruments | | 0.08 | | | 0.31 | | | 0.25 | |
| Loss on extinguishment of debt | | — | | | — | | | (0.11) | |
| Impairment of goodwill | | — | | | — | | | (0.02) | |
| Amortization and impairment of other acquired intangible assets | | (0.02) | | | (0.03) | | | (0.11) | |
| Impairment of other long-lived assets and other non-operating items | | (0.02) | | | (0.04) | | | (0.04) | |
Income tax (provision) benefit on other income (expense) items (1) | | (0.01) | | | (0.05) | | | 0.01 | |
| Difference between statutory and effective tax rate | | (0.02) | | | 0.07 | | | 0.01 | |
| Per-share impact of other income (expense) items | | 0.01 | | | 0.26 | | | (0.01) | |
Adjusted diluted net operating income per share (1) | | $ | 3.15 | | | $ | 1.74 | | | $ | 3.21 | |
(1)Calculated using the Company’s federal statutory tax rate of 21%. Any permanent tax adjustments and state income taxes on these items have been deemed immaterial and are not included.
Adjusted net operating return on equity is calculated by dividing annualized adjusted pretax operating income (loss), net of taxes computed using the Company’s statutory tax rate, by average stockholders’ equity, based on the average of the beginning and ending balances for each period presented. The following table provides a reconciliation of return on equity to our non-GAAP financial measure for the consolidated Company of adjusted net operating return on equity.
| | |
Part II. Item 7. Management’s Discussion and Analysis of Financial Condition and Results of Operations |
| | | | | | | | | | | | | | | | | | | | |
| | | | | | |
| Reconciliation of return on equity to adjusted net operating return on equity |
| | | | | | |
| | Years Ended December 31, |
| | 2021 | | 2020 | | 2019 |
Return on equity (1) | | 14.1 | % | | 9.4 | % | | 17.8 | % |
Less impact of reconciling income (expense) items: (2) | | | | | | |
| Net gains on investments and other financial instruments | | 0.4 | | | 1.4 | | | 1.4 | |
| Loss on extinguishment of debt | | — | | | — | | | (0.6) | |
| Impairment of goodwill | | — | | | — | | | (0.1) | |
| Amortization and impairment of other acquired intangible assets | | (0.1) | | | (0.1) | | | (0.6) | |
| Impairment of other long-lived assets and other non-operating items | | (0.1) | | | (0.2) | | | (0.2) | |
Income tax (provision) benefit on reconciling income (expense) items (3) | | — | | | (0.2) | | | — | |
Difference between statutory and effective tax rate (3) | | (0.1) | | | 0.3 | | | — | |
| Impact of reconciling income (expense) items | | 0.1 | | | 1.2 | | | (0.1) | |
| Adjusted net operating return on equity | | 14.0 | % | | 8.2 | % | | 17.9 | % |
(1)Calculated by dividing net income by average stockholders’ equity.
(2)As a percentage of average stockholders’ equity.
(3)Calculated using the Company’s federal statutory tax rates of 21%. Any permanent tax adjustments and state income taxes on these items have been deemed immaterial and are not included.
Results of Operations—Mortgage
The following table summarizes our Mortgage segment’s results of operations for the years ended December 31, 2021, 2020 and 2019.
| | | | | | | | | | | | | | | | | | | | | | | | | | | | | | | | |
| Summary results of operations - Mortgage |
| | | | | | | | | | |
| | | | | | | | $ Change |
| | Years Ended December 31, | | Favorable (Unfavorable) |
| (In millions) | | 2021 | | 2020 | | 2019 | | 2021 vs. 2020 | | 2020 vs. 2019 |
Adjusted pretax operating income (1) | | $ | 781.5 | | | $ | 453.3 | | | $ | 852.9 | | | $ | 328.2 | | | $ | (399.6) | |
| Net premiums written | | 944.5 | | | 1,011.0 | | | 1,075.5 | | | (66.5) | | | (64.5) | |
| Decrease in unearned premiums | | 53.7 | | | 81.8 | | | 58.8 | | | (28.1) | | | 23.0 | |
| Net premiums earned | | 998.3 | | | 1,092.8 | | | 1,134.2 | | | (94.5) | | | (41.4) | |
| Services revenue | | 17.7 | | | 14.8 | | | 8.1 | | | 2.9 | | | 6.7 | |
| Net investment income | | 132.9 | | | 137.2 | | | 151.5 | | | (4.3) | | | (14.3) | |
| | | | | | | | | | |
| Provision for losses | | 19.4 | | | 483.3 | | | 131.5 | | | 463.9 | | | (351.8) | |
| Policy acquisition costs | | 29.0 | | | 31.0 | | | 25.3 | | | 2.0 | | | (5.7) | |
| Cost of services | | 13.9 | | | 10.0 | | | 5.0 | | | (3.9) | | | (5.0) | |
| Other operating expenses | | 223.3 | | | 198.7 | | | 225.7 | | | (24.6) | | | 27.0 | |
| Interest expense | | 84.3 | | | 71.2 | | | 56.3 | | | (13.1) | | | (14.9) | |
(1)Our senior management uses adjusted pretax operating income as our primary measure to evaluate the fundamental financial performance of our business segments. See Note 4 of Notes to Consolidated Financial Statements for more information.
Year Ended December 31, 2021 Compared to Year Ended December 31, 2020
Adjusted Pretax Operating Income. The increase in our Mortgage segment’s adjusted pretax operating income for 2021, compared to 2020, primarily reflects a decrease in provision for losses. Partially offsetting this item is: (i) a decrease in net premiums earned; (ii) an increase in other operating expenses and (iii) an increase in interest expense.
Net Premiums Written and Earned. Net premiums written for 2021 decreased compared to 2020. This decrease primarily reflects lower direct premium rates on our IIF portfolio compared to 2020, as well as a lower proportion of Single Premium Policies, partially offset by improvement in accrued profit commissions in 2021. For 2020, higher recorded ceded
| | |
Part II. Item 7. Management’s Discussion and Analysis of Financial Condition and Results of Operations |
losses resulted in elevated ceded premiums due to a reduction in accrued profit commissions, which lowered net premiums written in that period.
Net premiums earned decreased for 2021 compared to 2020, primarily due to: (i) a decrease in premiums earned on our in-force Single Premium Policies and Monthly Premium Policies and (ii) a decrease in the impact, net of reinsurance, from Single Premium Policy cancellations, due to decreased refinance activity as compared to 2020. These decreases were partially offset by a decrease in ceded premiums, which were elevated in 2020 due to reduced profit commissions as a result of higher ceded losses in 2020.
The table below provides additional information about the components of mortgage insurance net premiums earned for the periods indicated, including the effects of our reinsurance programs.
| | | | | | | | | | | | | | | | | | | | | | | |
| Net premiums earned | | | | | | | |
| | | | | | | |
| | Years Ended December 31, | |
| ($ in thousands, except as otherwise indicated) | | 2021 | | 2020 | | 2019 | |
| Direct | | | | | | | |
| Premiums earned, excluding revenue from cancellations | | $ | 988,472 | | | $ | 1,070,335 | | | $ | 1,154,045 | | (1) |
| Single Premium Policy cancellations | | 116,224 | | | 193,349 | | | 79,483 | | |
| Direct | | 1,104,696 | | | 1,263,684 | | | 1,233,528 | | (1) |
Assumed (2) | | 7,066 | | | 12,214 | | | 10,382 | | |
| Ceded | | | | | | | |
| Premiums earned, excluding revenue from cancellations | | (108,692) | | | (107,451) | | | (134,946) | | (1) |
Single Premium Policy cancellations (3) | | (33,388) | | | (55,483) | | | (23,766) | | |
Profit commission—other (4) | | 28,600 | | | (20,197) | | | 49,016 | | (1) |
| Ceded premiums, net of profit commission | | (113,480) | | | (183,131) | | | (109,696) | | (1) |
| Total net premiums earned | | $ | 998,282 | | | $ | 1,092,767 | | | $ | 1,134,214 | | (1) |
| | | | | | | | |
In force portfolio premium yield (in basis points) (5) | | 40.5 | | 44.5 | | 50.4 | (1) |
Direct premium yield (in basis points) (6) | | 45.2 | | 52.4 | | 53.8 | (1) |
Net premium yield (in basis points) (7) | | 40.6 | | 44.9 | | 49.1 | (1) |
| Average primary IIF (in billions) | | $ | 246.1 | | | $ | 243.4 | | | $ | 231.0 | | |
(1)Includes a cumulative adjustment to unearned premiums recorded in the second quarter of 2019 related to an update to the amortization rates used to recognize revenue for Single Premium Policies. This adjustment increased the 2019 direct premium yield and net premium yield by 1.9 and 1.4 basis points, respectively. See Note 2 of Notes to Consolidated Financial Statements for further information.
(2)Primarily includes premiums from our participation in certain credit risk transfer programs.
(3)Includes the impact of related profit commissions.
(4)Represents the profit commission on the Single Premium QSR Program, excluding the impact of Single Premium Policy cancellations.
(5)Calculated by dividing direct premiums earned, including assumed revenue and excluding revenue from cancellations, by average primary IIF.
(6)Calculated by dividing direct premiums earned, including assumed revenue, by average primary IIF.
(7)Calculated by dividing net premiums earned by average primary IIF. The calculation for all periods presented incorporates the impact of profit commission adjustments related to our Single Premium QSR Program. For the year ended December 31, 2020, these profit commission adjustments were significantly impacted by the increased ceded losses in 2020. See Note 8 of Notes to Consolidated Financial Statements for further information.
Over the past several years, we have experienced a decline in our in force portfolio premium yield due to a number of factors, including the pricing and credit mix of recent NIW compared to the policies that have cancelled. Based on the characteristics of more recent vintages in our portfolio coupled with expectations for higher interest rates that we believe will increase Persistency Rates, we currently expect a decline in our in force portfolio premium yield in 2022 of approximately two basis points, which is a slower rate of decline than we have experienced in recent years. Assuming current pricing levels and our current expectations for future NIW, Persistency Rates and other assumptions, which could change over time, we expect the rate of any future declines in the in force portfolio premium yield after 2022 to further diminish. Due to the impacts of Single Premium Policy cancellations and reinsurance, among other things, the net premium yield may continue to fluctuate from period to period.
The level of mortgage prepayments affects the revenue ultimately produced by our mortgage insurance business and is influenced by the mix of business we write. We believe that writing a mix of Single Premium Policies and Monthly Premium Policies has the potential to moderate the overall impact on our results if actual prepayments are significantly different from expectations. However, the impact of this moderating effect is affected by the amount of reinsurance we obtain on portions of
| | |
Part II. Item 7. Management’s Discussion and Analysis of Financial Condition and Results of Operations |
our portfolio, with the Single Premium QSR Program currently reducing the proportion of retained Single Premium Policies in our portfolio. See “Key Factors Affecting Our Results—Mortgage—IIF and Related Drivers” for more information.
The following table provides information related to the impact of our reinsurance transactions on premiums earned. See Note 8 of Notes to Consolidated Financial Statements for more information about our reinsurance programs.
| | | | | | | | | | | | | | | | | | | | |
| Ceded premiums earned | | | | | | |
| | | | | | |
| | Years Ended December 31, |
| ($ in thousands) | | 2021 | | 2020 | | 2019 |
| Excess-of-Loss Program | | $ | 62,153 | | | $ | 37,053 | | | $ | 25,483 | |
| Single Premium QSR Program | | 47,226 | | | 137,198 | | | 69,632 | |
| QSR Program | | 3,675 | | | 8,418 | | | 13,979 | |
| Other | | 426 | | | 462 | | | 602 | |
Total ceded premiums earned (1) | | $ | 113,480 | | | $ | 183,131 | | | $ | 109,696 | |
| | | | | | |
| | | | | | |
| | | | | | |
| Percentage of total direct and assumed premiums earned | | 9.9 | % | | 14.2 | % | | 8.8 | % |
(1)Does not include the benefit from ceding commissions on our Single Premium QSR Programs, which are included in other operating expenses on the consolidated statements of operations. See Note 8 of Notes to Consolidated Financial Statements for additional information.
Net Investment Income. Lower investment yields, partially offset by higher average investment balances, resulted in decreases in net investment income for 2021 compared to 2020. Our higher investment balances were a result of investing our positive cash flows from operations.
Provision for Losses. The following table details the financial impact of the significant components of our provision for losses for the periods indicated.
| | | | | | | | | | | | | | | | | | | | |
| Provision for losses | | | | | | |
| | | | | | |
| | Years Ended December 31, |
| ($ in millions, except reserve per new default) | | 2021 | | 2020 | | 2019 |
Current year defaults (1) | | $ | 160.5 | | | $ | 517.8 | | | $ | 146.7 | |
Prior year defaults (2) | | (141.1) | | | (34.5) | | | (14.7) | |
| Second-lien mortgage loan PDR and other | | — | | | — | | | (0.5) | |
| Provision for losses | | $ | 19.4 | | | $ | 483.3 | | | $ | 131.5 | |
Loss ratio (3) | | 1.9 | % | | 44.2 | % | | 11.6 | % |
Reserve per new default (4) | | $ | 4,283 | | | $ | 4,793 | | | $ | 3,579 | |
(1)Related to defaulted loans with a most recent default notice dated in the year indicated. For example, if a loan had defaulted in a prior year, but then subsequently cured and later re-defaulted in the current year, that default would be considered a current year default.
(2)Related to defaulted loans with a default notice dated in a year earlier than the year indicated, which have been continuously in default since that time.
(3)Provision for losses as a percentage of net premiums earned. See below and “—Net Premiums Written and Earned” for further discussion of the components of this ratio.
(4)Calculated by dividing provision for losses for new defaults, net of reinsurance, by new primary defaults for each period.
Our mortgage insurance provision for losses for 2021 decreased by $463.9 million as compared to 2020. Reserves established for new default notices were the primary driver of our total incurred losses for 2021 and 2020. Current year new primary defaults decreased significantly for 2021, compared to 2020, as shown below. The decreases primarily relate to a decrease in the number of new default notices related to the effects of the COVID-19 pandemic, as compared to last year. Our gross Default to Claim Rate assumption for new primary defaults was 8.0% at December 31, 2021, compared to 8.5% as of December 31, 2020.
Our provision for losses during 2021, most notably in the fourth quarter, benefited from favorable reserve development on prior period defaults, primarily as a result of more favorable trends in Cures than originally estimated, due to favorable outcomes resulting from forbearance programs implemented in response to the COVID-19 pandemic as well as positive trends in home price appreciation. Among other assumption changes, these favorable observed trends resulted in reductions in our Default to Claim Rate assumptions for prior year default notices, particularly for those defaults first reported in 2020 following the start of the COVID-19 pandemic. See Notes 1 and 11 of Notes to Consolidated Financial Statements and “Item 1A. Risk Factors” for additional information.
To a lesser extent, our provision for losses during 2020 also benefited from favorable reserve development on prior period defaults, primarily due to favorable cure activity.
| | |
Part II. Item 7. Management’s Discussion and Analysis of Financial Condition and Results of Operations |
Our primary default rate at December 31, 2021 was 2.9% compared to 5.2% at December 31, 2020. The following table shows a rollforward of the number of our primary loans in default.
| | | | | | | | | | | | | | | | | | | | |
| Rollforward of primary loans in default | | | | | | |
| | | | | | |
| | Years Ended December 31, |
| | 2021 | | 2020 | | 2019 |
| Beginning default inventory | | 55,537 | | | 21,266 | | | 21,093 | |
| New defaults | | 37,470 | | | 108,025 | | | 40,985 | |
| Cures | | (62,970) | | | (72,404) | | | (38,005) | |
Claims paid (1) | | (937) | | | (1,330) | | | (2,747) | |
Rescissions and Claim Denials, net of (Reinstatements) (2) | | (39) | | | (20) | | | (60) | |
| | | | | | |
| Ending default inventory | | 29,061 | | | 55,537 | | | 21,266 | |
(1)Includes those charged to a deductible under Pool Mortgage Insurance arrangements as well as commutations. Excludes the impact of claims settled related to certain previously disclosed legal proceedings.
(2)Net of any previous Rescission and Claim Denials that were reinstated during the period. Such reinstated Rescissions and Claim Denials may ultimately result in a paid claim.
We develop our Default to Claim Rate estimates on defaulted loans based on models that use a variety of loan characteristics to determine the likelihood that a default will reach claim status. Our gross Default to Claim Rate estimates on defaulted loans are mainly developed based on the Stage of Default and Time in Default of the underlying defaulted loans, as measured by the progress toward foreclosure sale and the number of months in default. See Note 11 of Notes to Consolidated Financial Statements for the table detailing our Default to Claim Rate assumptions.
| | |
Part II. Item 7. Management’s Discussion and Analysis of Financial Condition and Results of Operations |
The following tables show additional information about our primary loans in default as of the dates indicated.
| | | | | | | | | | | | | | | | | | | | | | | | | | | | | | | | | | | | | | |
| Primary loans in default - additional information |
| | | | | | | | | | | | |
| | December 31, 2021 |
| | Total | | Foreclosure Stage Defaulted Loans | | Cure % During the 4th Quarter | | Reserve for Losses | | % of Reserve |
| ($ in thousands) | | # | | % | | # | | % | | $ | | % |
| Missed payments | | | | | | | | | | | | |
| Three payments or less | | 7,267 | | | 25.0 | % | | 47 | | | 39.4 | % | | $ | 62,103 | | | 7.9 | % |
| Four to eleven payments | | 8,088 | | | 27.8 | | | 84 | | | 27.6 | | | 146,872 | | | 18.6 | |
| Twelve payments or more | | 13,389 | | | 46.1 | | | 784 | | | 29.0 | | | 565,192 | | | 71.5 | |
| Pending claims | | 317 | | | 1.1 | | | N/A | | 10.4 | | | 16,213 | | | 2.0 | |
| Total | | 29,061 | | | 100.0 | % | | 915 | | | | | 790,380 | | | 100.0 | % |
| IBNR and other | | | | | | | | | | 2,886 | | | |
| LAE | | | | | | | | | | 19,859 | | | |
| Total primary reserves | | | | | | | | | | $ | 813,125 | | | |
| | | | | | | | | | | | | | | | | | | | | | | | | | | | | | | | | | | | | | |
| | December 31, 2020 |
| | Total | | Foreclosure Stage Defaulted Loans | | Cure % During the 4th Quarter | | Reserve for Losses | | % of Reserve |
| ($ in thousands) | | # | | % | | # | | % | | $ | | % |
| Missed payments | | | | | | | | | | | | |
| Three payments or less | | 12,504 | | | 22.5 | % | | 64 | | | 36.5 | % | | $ | 99,491 | | | 12.4 | % |
| Four to eleven payments | | 37,691 | | | 67.9 | | | 190 | | | 26.3 | | | 512,248 | | | 64.1 | |
| Twelve payments or more | | 5,067 | | | 9.1 | | | 861 | | | 5.4 | | | 172,161 | | | 21.5 | |
| Pending claims | | 275 | | | 0.5 | | | N/A | | 8.2 | | | 15,614 | | | 2.0 | |
| Total | | 55,537 | | | 100.0 | % | | 1,115 | | | | | 799,514 | | | 100.0 | % |
| IBNR and other | | | | | | | | | | 9,966 | | | |
| LAE | | | | | | | | | | 20,172 | | | |
| Total primary reserves | | | | | | | | | | $ | 829,652 | | | |
N/A – Not applicable
Our aggregate weighted-average net Default to Claim Rate assumption for our primary loans used in estimating our reserve for losses, which is net of estimated Claim Denials and Rescissions, was approximately 46% and 24%, at December 31, 2021 and 2020, respectively. This increase was primarily due to a shift in the mix of defaults as of December 31, 2021, given the larger proportion of loans with more missed payments.
Our net Default to Claim Rate and loss reserve estimate incorporate our expectations with respect to future Rescissions, Claim Denials and Claim Curtailments. Our estimate of such net future Loss Mitigation Activities, inclusive of claim withdrawals, reduced our loss reserve as of December 31, 2021 and 2020 by $27.3 million and $29.1 million, respectively. These expectations are based primarily on recent claim withdrawal activity and our recent experience with respect to the number of claims that have been denied due to the policyholder’s failure to submit sufficient documentation to perfect a claim within the time period permitted under our Master Policies, as well as our recent experience with respect to the number of insurance certificates that have been rescinded due to fraud, underwriter negligence or other factors.
Our reported Rescission, Claim Denial and Claim Curtailments activity in any given period is subject to challenge by our lender and servicer customers through our claims rebuttal process. In addition, we are at times engaged in discussions with our lender and servicer customers regarding our Loss Mitigation Activities. Unless a liability associated with such activities or discussions becomes probable and can be reasonably estimated, we consider our claim payments and our Rescissions, Claim Denials and Claim Curtailments to be resolved for financial reporting purposes. In accordance with the accounting standard regarding contingencies, we accrue for an estimated loss when we determine that the loss is probable and can be reasonably estimated.
We expect that a portion of previously rescinded policies will be reinstated and previously denied claims will be resubmitted with the required documentation and ultimately paid; therefore, we have incorporated this expectation into our
| | |
Part II. Item 7. Management’s Discussion and Analysis of Financial Condition and Results of Operations |
IBNR reserve estimate. Our IBNR reserve estimate was $2.9 million and $10.0 million at December 31, 2021 and 2020, respectively. See Note 11 of Notes to Consolidated Financial Statements for additional information.
Factors that impact the severity of a claim include, but are not limited to: (i) the size of the loan; (ii) the amount of mortgage insurance coverage placed on the loan; (iii) the amount of time between default and claim during which we are expected to cover interest (capped at two years under our Prior Master Policy and capped at three years under our 2014 Master Policy and 2020 Master Policy) and certain expenses; and (iv) the impact of certain loss management activities with respect to the loan. The average Claim Severity experienced for loans covered by our primary insurance was 83.2% for 2021, compared to 101.4% in 2020. Given the low volume of claims paid in 2021 due to the ongoing effects of foreclosure moratoriums, our average Claim Severity for claims paid in 2021 may not be indicative of future results.
Our mortgage insurance total loss reserve as a percentage of our mortgage insurance total RIF was 1.4% at both December 31, 2021 and 2020, respectively. See Note 11 of Notes to Consolidated Financial Statements for information regarding our reserves for losses and a reconciliation of our Mortgage segment’s beginning and ending reserves for losses and LAE.
Total mortgage insurance claims paid in 2021 of $35.3 million have decreased from claims paid of $97.6 million in 2020. The decrease in claims paid is primarily attributable to COVID-19-related forbearance plans and moratoriums suspending foreclosures and evictions. Claims paid in both periods also include the impact of commutations and settlements, including for payments made in 2021 and 2020 to settle certain previously disclosed legal proceedings. Although expected claims are included in our reserve for losses, the timing of claims paid is subject to fluctuation from quarter to quarter, based on the rate that defaults cure and other factors, including the impact of foreclosure moratoriums (as further described in “Item 1. Business—Mortgage—Defaults and Claims”), that make the timing of paid claims difficult to predict.
The following table shows net claims paid by product and the average claim paid by product for the periods indicated.
| | | | | | | | | | | | | | | | | | | | |
| Claims paid | | | | | | |
| | | | | | |
| | Years Ended December 31, |
| (In thousands) | | 2021 | | 2020 | | 2019 |
Net claims paid (1) | | | | | | |
| | | | | | |
| | | | | | |
| | | | | | |
| Total primary claims paid | | $ | 21,111 | | | $ | 66,186 | | | $ | 118,548 | |
| Total pool and other | | (258) | | | (432) | | | 3,162 | |
| | | | | | |
| | | | | | |
| Subtotal | | 20,853 | | | 65,754 | | | 121,710 | |
Impact of commutations and settlements (2) | | 14,464 | | | 31,847 | | | 10,517 | |
| Total net claims paid | | $ | 35,317 | | | $ | 97,601 | | | $ | 132,227 | |
| | | | | | |
| | | | | | |
| | | | | | |
| | | | | | |
| | | | | | |
Total average net primary claim paid (1) (3) | | $ | 44.8 | | | $ | 46.7 | | | $ | 49.0 | |
Average direct primary claim paid (3) (4) | | $ | 46.3 | | | $ | 49.4 | | | $ | 50.0 | |
(1)Net of reinsurance recoveries.
(2)Includes payments to commute mortgage insurance coverage on certain performing and non-performing loans. For the year ended December 31, 2020, primarily includes payments made to settle certain previously disclosed legal proceedings.
(3)Calculated without giving effect to the impact of commutations and settlements.
(4)Before reinsurance recoveries.
Other Operating Expenses. The increase in other operating expenses for 2021, as compared to 2020, is primarily due to: (i) an increase in variable and share-based compensation expense in 2021, including as part of allocated corporate operating expenses and (ii) a decrease in ceding commissions.
Our expense ratio on a net premiums earned basis represents our Mortgage segment’s operating expenses (which include policy acquisition costs and other operating expenses, as well as allocated corporate operating expenses), expressed as a percentage of net premiums earned. Our expense ratio on this basis was 25.3% for 2021, compared to 21.0% for 2020. The increase in the expense ratio for 2021 as compared to 2020 was driven by: (i) an increase in total other operating expenses and (ii) a decrease in net premiums earned during 2021, both as compared to 2020.
| | |
Part II. Item 7. Management’s Discussion and Analysis of Financial Condition and Results of Operations |
The following tables show additional information about Mortgage other operating expenses.
| | | | | | | | | | | | | | | | | | | | |
| Other operating expenses | | | | | | |
| | | | | | |
| | Years Ended December 31, |
| (In millions) | | 2021 | | 2020 | | 2019 |
| Direct | | | | | | |
| Salaries and other base employee expenses | | $ | 52.5 | | | $ | 57.6 | | | $ | 60.3 | |
| Variable and share-based incentive compensation | | 17.2 | | | 13.7 | | | 21.5 | |
| Other general operating expenses | | 50.8 | | | 53.7 | | | 74.0 | |
| Ceding commissions | | (24.7) | | | (41.1) | | | (34.2) | |
| Total direct | | 95.8 | | | 83.9 | | | 121.6 | |
| | | | | | |
Allocated (1) | | | | | | |
| Salaries and other base employee expenses | | $ | 42.5 | | | $ | 37.5 | | | $ | 31.0 | |
| Variable and share-based incentive compensation | | 33.9 | | | 23.7 | | | 26.5 | |
| Other general operating expenses | | 51.1 | | | 53.6 | | | 46.6 | |
| Total allocated | | 127.5 | | | 114.8 | | | 104.1 | |
| Total Mortgage | | $ | 223.3 | | | $ | 198.7 | | | $ | 225.7 | |
(1)See Note 4 of Notes to Consolidated Financial Statements for more information about our allocation of corporate operating expenses.
Interest Expense. The increase in interest expense for 2021, as compared to 2020, primarily reflects an increase in our average senior notes outstanding for the full year in 2021 compared to 2020. See Note 12 of Notes to Consolidated Financial Statements for additional information on our senior notes.
Results of Operations—homegenius
The following table summarizes our homegenius segment’s results of operations for the years ended December 31, 2021, 2020 and 2019.
| | | | | | | | | | | | | | | | | | | | | | | | | | | | | | | | |
| Summary results of operations - homegenius |
| | | | | | | | | | |
| | | | | | | | $ Change |
| | Years Ended December 31, | | Favorable (Unfavorable) |
| (In millions) | | 2021 | | 2020 | | 2019 | | 2021 vs. 2020 | | 2020 vs. 2019 |
Adjusted pretax operating income (loss) (1) | | $ | (27.3) | | | $ | (23.2) | | | $ | (18.0) | | | $ | (4.1) | | | $ | (5.2) | |
| Net premiums earned | | 38.9 | | | 22.6 | | | 12.0 | | | 16.3 | | | 10.6 | |
| Services revenue | | 108.3 | | | 79.5 | | | 76.9 | | | 28.8 | | | 2.6 | |
| Cost of services | | 89.7 | | | 61.5 | | | 56.6 | | | (28.2) | | | (4.9) | |
| | | | | | | | | | |
| | | | | | | | | | |
| Other operating expenses | | 85.1 | | | 62.3 | | | 50.2 | | | (22.8) | | | (12.1) | |
| | | | | | | | | | |
| | | | | | | | | | |
| | | | | | | | | | |
(1)Our senior management uses adjusted pretax operating income (loss) as our primary measure to evaluate the fundamental financial performance of each of our business segments. See Note 4 of Notes to Consolidated Financial Statements.
Year Ended December 31, 2021 Compared to Year Ended December 31, 2020
Adjusted Pretax Operating Loss. As described in more detail below, the increase in our homegenius segment’s adjusted pretax operating loss for 2021, compared to 2020, primarily reflects increases in: (i) cost of services and (ii) other operating expenses. Partially offsetting these items were increases in: (i) services revenue and (ii) net premiums earned.
Net Premiums Earned. Net premiums earned for 2021 increased compared to 2020. This increase reflects an increase in new title policies written and closed orders in our title insurance business.
Services Revenue. Services revenue for 2021 increased compared to 2020, primarily due to the increase in closed orders in our title services business. In addition, we increased revenue in our real estate services, including increases from valuation and single family rental products and services, as compared to 2020.
| | |
Part II. Item 7. Management’s Discussion and Analysis of Financial Condition and Results of Operations |
Cost of Services. Cost of services for 2021 increased compared to 2020, primarily due to the increase in services revenue and a corresponding increase in staffing levels to help build capacity to accommodate the growing demand for our homegenius products and services. Our cost of services is primarily affected by our level of services revenue and the number of employees providing those services.
Other Operating Expenses. The increase in other operating expenses for 2021, as compared to 2020, primarily reflects: (i) an increase in variable and share-based incentive compensation expense in 2021, including as part of allocated corporate operating expenses; (ii) continued strategic investments focused on our title and digital real estate businesses, including an increase in staffing levels; and (iii) an increase in title agent commissions.
The following tables show additional information about homegenius other operating expenses.
| | | | | | | | | | | | | | | | | | | | |
| Other operating expenses | | | | | | |
| | | | | | |
| | Years Ended December 31, |
| (In millions) | | 2021 | | 2020 | | 2019 |
| Direct | | | | | | |
| Salaries and other base employee expenses | | $ | 24.0 | | | $ | 21.1 | | | $ | 14.9 | |
| Variable and share-based incentive compensation | | 14.6 | | | 7.2 | | | 6.6 | |
| Other general operating expenses | | 21.3 | | | 16.0 | | | 14.4 | |
| Title agent commissions | | 6.7 | | | 5.2 | | | 4.1 | |
| Total direct | | 66.6 | | | 49.5 | | | 40.0 | |
| | | | | | |
Allocated (1) | | | | | | |
| Salaries and other base employee expenses | | $ | 6.3 | | | $ | 3.8 | | | $ | 1.5 | |
| Variable and share-based incentive compensation | | 4.9 | | | 3.1 | | | 4.1 | |
| Other general operating expenses | | 7.3 | | | 5.9 | | | 4.6 | |
| Total allocated | | 18.5 | | | 12.8 | | | 10.2 | |
| Total homegenius | | $ | 85.1 | | | $ | 62.3 | | | $ | 50.2 | |
(1)See Note 4 of Notes to Consolidated Financial Statements for more information about our allocation of corporate operating expenses.
Results of Operations—All Other
The following table summarizes our All Other results of operations for the years ended December 31, 2021, 2020 and 2019.
| | | | | | | | | | | | | | | | | | | | | | | | | | | | | | | | |
| Summary results of operations - All Other | | | | | | | | | | |
| | | | | | | | | | |
| | | | | | | | $ Change |
| | Years Ended December 31, | | Favorable (Unfavorable) |
| (In millions) | | 2021 | | 2020 | | 2019 | | 2021 vs. 2020 | | 2020 vs. 2019 |
Adjusted pretax operating income (1) | | $ | 3.5 | | | $ | 2.0 | | | $ | 19.8 | | | $ | 1.5 | | | $ | (17.8) | |
| Services revenue | | 0.2 | | | 12.5 | | | 71.0 | | | (12.3) | | | (58.5) | |
| Net investment income | | 14.6 | | | 16.5 | | | 19.6 | | | (1.9) | | | (3.1) | |
| Cost of services | | 0.1 | | | 15.6 | | | 47.6 | | | 15.5 | | | 32.0 | |
| Other operating expenses | | 11.9 | | | 11.9 | | | 23.0 | | | — | | | 11.1 | |
(1)Our senior management uses adjusted pretax operating income (loss) as our primary measure to evaluate the fundamental financial performance of each of the Company’s business segments. See Note 4 of Notes to Consolidated Financial Statements.
Year Ended December 31, 2021 Compared to Year Ended December 31, 2020
Adjusted pretax operating income increased in 2021 as compared to 2020 primarily as a result of the net changes in services revenue and cost of services due to the sale of Clayton in 2020 as well as the wind down of the traditional appraisal business starting in the fourth quarter of 2020, among other adjustments that impacted services revenue. Partially offsetting these items was a decrease in net investment income, resulting from lower investment yields in 2021 compared to 2020.
| | |
Part II. Item 7. Management’s Discussion and Analysis of Financial Condition and Results of Operations |
Liquidity and Capital Resources
Consolidated Cash Flows
The following table summarizes our consolidated cash flows from operating, investing and financing activities.
| | | | | | | | | | | | | | | | | | | | |
| Summary cash flows - Consolidated | | | | | | |
| | | | | | |
| | Years Ended December 31, |
| (In thousands) | | 2021 | | 2020 | | 2019 |
| Net cash provided by (used in): | | | | | | |
| Operating activities | | $ | 557,112 | | | $ | 658,434 | | | $ | 694,431 | |
| Investing activities | | (1,862) | | | (883,180) | | | (302,049) | |
| Financing activities | | (496,776) | | | 222,618 | | | (403,106) | |
| Effect of exchange rate changes on cash and restricted cash | | — | | | — | | | (4) | |
| | | | | | |
| Increase (decrease) in cash and restricted cash | | $ | 58,474 | | | $ | (2,128) | | | $ | (10,728) | |
Operating Activities. Our most significant source of operating cash flows is from premiums received from our mortgage insurance policies, while our most significant uses of operating cash flows are for our operating expenses and claims paid on our mortgage insurance policies. Net cash provided by operating activities totaled $557.1 million for 2021, compared to $658.4 million in 2020. This decrease was principally due to lower direct premiums written, partially offset by a reduction in claims paid. See Notes 8 and 11 of Notes to Consolidated Financial Statements for additional information on direct premiums written and claims paid, respectively.
Investing Activities. Net cash used in investing activities decreased in 2021, compared to 2020, primarily as a result of: (i) a decrease in purchases of fixed-maturity investments available for sale and (ii) an increase in sales and redemptions, net of purchases, of short-term investments.
Financing Activities. Net cash used in financing activities for 2021 was $496.8 million, as compared to net cash provided by financing activities for 2020 of $222.6 million. For 2021, our primary financing activities included: (i) repurchases of our common shares; (ii) payment of dividends; and (iii) net changes in secured borrowings. For 2020, cash provided by financing activities included the issuance of Senior Notes due 2025, partially offset by: (i) repurchases of our common shares and (ii) payments of dividends. See Notes 12 and 14 of Notes to Consolidated Financial Statements for additional information regarding our borrowings and share repurchases, respectively.
See “Item 8. Financial Statements and Supplementary Data—Consolidated Statements of Cash Flows” for additional information.
Investment Portfolio
At December 31, 2021 and December 31, 2020, the following tables include $104.0 million and $57.5 million, respectively, of securities loaned to third-party borrowers under securities lending agreements, which are classified as other assets in our consolidated balance sheets. See Note 6 of Notes to Consolidated Financial Statements for more information about our investment portfolio, including our securities lending agreements.
| | |
Part II. Item 7. Management’s Discussion and Analysis of Financial Condition and Results of Operations |
The composition of our investment portfolio, presented as a percentage of overall fair value at December 31, 2021 and December 31, 2020, was as follows.
| | | | | | | | | | | | | | | | | | | | | | | | | | |
| Investment portfolio diversification | | | | | | | | |
| | | | | | | | |
| | December 31, |
| | 2021 | | 2020 |
| ($ in millions) | | Fair
Value | | Percent | | Fair
Value | | Percent |
| Corporate bonds and commercial paper | | $ | 3,261.4 | | | 49.3 | % | | $ | 3,527.7 | | | 51.5 | % |
| RMBS | | 714.5 | | | 10.8 | | | 846.9 | | | 12.4 | |
| CMBS | | 745.5 | | | 11.3 | | | 715.5 | | | 10.5 | |
| CLO | | 530.0 | | | 8.0 | | | 568.6 | | | 8.3 | |
State and municipal obligations (1) | | 284.2 | | | 4.3 | | | 307.5 | | | 4.5 | |
| Money market instruments and certificates of deposit | | 275.6 | | | 4.2 | | | 270.0 | | | 3.9 | |
| Other ABS | | 211.2 | | | 3.2 | | | 252.7 | | | 3.7 | |
| U.S. government and agency securities | | 316.4 | | | 4.8 | | | 174.1 | | | 2.5 | |
| Equity securities | | 222.2 | | | 3.3 | | | 172.5 | | | 2.5 | |
Mortgage insurance-linked notes (2) | | 47.0 | | | 0.7 | | | — | | | — | |
| Other investments | | 9.5 | | | 0.1 | | | 10.4 | | | 0.2 | |
| Total | | $ | 6,617.5 | | | 100.0 | % | | $ | 6,845.9 | | | 100.0 | % |
(1)Primarily consists of taxable state and municipal investments.
(2)Comprises the notes purchased by Radian Group in connection with the Excess-of-Loss Program. See Note 8 for more information about our reinsurance programs.
The following table shows the scheduled maturities of the securities held in our investment portfolio at December 31, 2021 and December 31, 2020.
| | | | | | | | | | | | | | | | | | | | | | | | | | |
| Investment portfolio scheduled maturity | | | | | | | | |
| | | | | | | | |
| | December 31, |
| | 2021 | | 2020 |
| ($ in millions) | | Fair
Value | | Percent | | Fair
Value | | Percent |
| Short-term investments | | $ | 551.5 | | | 8.3 | % | | $ | 618.0 | | | 9.0 | % |
Due in one year or less (1) | | 254.3 | | | 3.8 | | | 132.5 | | | 1.9 | |
Due after one year through five years (1) | | 1,176.9 | | | 17.8 | | | 1,165.0 | | | 17.0 | |
Due after five years through 10 years (1) | | 1,246.6 | | | 18.8 | | | 1,357.5 | | | 19.8 | |
Due after 10 years (1) | | 916.5 | | | 13.9 | | | 1,014.9 | | | 14.8 | |
Asset-backed and mortgage-backed securities (2) | | 2,245.3 | | | 33.9 | | | 2,383.5 | | | 34.9 | |
Equity securities (3) | | 222.2 | | | 3.4 | | | 172.5 | | | 2.5 | |
Other investments (3) | | 4.2 | | | 0.1 | | | 2.0 | | | 0.1 | |
| Total | | $ | 6,617.5 | | | 100.0 | % | | $ | 6,845.9 | | | 100.0 | % |
(1)Actual maturities may differ as a result of calls before scheduled maturity.
(2)Includes RMBS, CMBS, CLO, Other ABS and mortgage insurance-linked notes, which are not due at a single maturity date.
(3)No stated maturity date.
| | |
Part II. Item 7. Management’s Discussion and Analysis of Financial Condition and Results of Operations |
The following table provides the ratings of our investment portfolio, from a nationally recognized statistical ratings organization, presented as a percentage of overall fair value, as of December 31, 2021 and December 31, 2020.
| | | | | | | | | | | | | | | | | | | | | | | | | | |
| Investment portfolio by rating | | | | | | | | |
| | | | | | | | |
| | December 31, |
| | 2021 | | 2020 |
| ($ in millions) | | Fair
Value | | Percent | | Fair
Value | | Percent |
| U.S. government / AAA | | $ | 2,476.4 | | | 37.4 | % | | $ | 2,420.6 | | | 35.4 | % |
| AA | | 1,016.0 | | | 15.3 | | | 1,095.5 | | | 16.0 | |
| A | | 1,940.2 | | | 29.3 | | | 2,128.6 | | | 31.1 | |
| BBB | | 894.6 | | | 13.5 | | | 999.7 | | | 14.6 | |
| BB and below | | 63.9 | | | 1.0 | | | 24.0 | | | 0.3 | |
| Equity securities | | 222.2 | | | 3.4 | | | 172.5 | | | 2.5 | |
| Other invested assets | | 4.2 | | | 0.1 | | | 5.0 | | | 0.1 | |
| Total | | $ | 6,617.5 | | | 100.0 | % | | $ | 6,845.9 | | | 100.0 | % |
Liquidity Analysis—Holding Company
Radian Group serves as the holding company for our operating subsidiaries and does not have any operations of its own. At December 31, 2021, Radian Group had available, either directly or through unregulated subsidiaries, unrestricted cash and liquid investments of $604.9 million. Available liquidity at December 31, 2021 excludes certain additional cash and liquid investments that have been advanced to Radian Group from our subsidiaries to pay for corporate expenses and interest payments. In addition, available liquidity at December 31, 2021 does not take into consideration transactions subsequent to December 31, 2021, including a $500 million return of capital from Radian Guaranty to Radian Group paid in February 2022. Total liquidity, which includes our undrawn $275.0 million unsecured revolving credit facility, as described below, was $879.9 million as of December 31, 2021.
During 2021, Radian Group’s available liquidity decreased by $497.8 million, due primarily to payments for share repurchases and dividends, as described below.
In addition to available cash and marketable securities, Radian Group’s principal sources of cash to fund future liquidity needs include: (i) payments made to Radian Group by its subsidiaries under expense- and tax-sharing arrangements; (ii) net investment income earned on its cash and marketable securities; (iii) to the extent available, dividends or other distributions from its subsidiaries; and (iv) amounts, if any, that Radian Guaranty is able to repay under the Surplus Note due 2027.
In December 2021, Radian Group entered into a new $275.0 million unsecured revolving credit facility with a syndicate of bank lenders. The revolving credit facility has a five year term, provided that under certain conditions Radian Group is required to offer to terminate the facility earlier than the maturity date. This facility replaced Radian Group’s $267.5 million unsecured revolving credit facility with a syndicate of bank lenders, which had a maturity date of January 2022. Subject to certain limitations, borrowings under the credit facility may be used for working capital and general corporate purposes, including, without limitation, capital contributions to our insurance subsidiaries as well as growth initiatives. At December 31, 2021, the full $275.0 million remains undrawn and available under the facility. See Note 12 of Notes to Consolidated Financial Statements for additional information on the unsecured revolving credit facility.
We expect Radian Group’s principal liquidity demands for the next 12 months to be: (i) the payment of corporate expenses, including taxes; (ii) interest payments on our outstanding debt obligations; (iii) subject to approval by our board of directors and our ongoing assessment of our financial condition and potential needs related to the execution and implementation of our business plans and strategies, the payment of quarterly dividends on our common stock, which we increased in May 2021 from $0.125 to $0.14 per share and in February 2022 to $0.20 per share; and (iv) the potential continued repurchases of shares of our common stock pursuant to share repurchase authorizations, as described below.
In addition to our ongoing short-term liquidity needs discussed above, our most significant need for liquidity beyond the next 12 months is the repayment of $1.4 billion aggregate principal amount of our senior debt due in future years. See “—Capitalization—Holding Company” below for details of our debt maturity profile. Radian Group’s liquidity demands for the next 12 months or in future periods could also include: (i) early repurchases or redemptions of portions of our debt obligations; (ii) additional investments to support our business strategy; and (iii) additional capital contributions to its subsidiaries. See “Item 1A. Risk Factors,” including “—Radian Group’s sources of liquidity may be insufficient to fund its obligations.” and “—Radian Guaranty may fail to maintain its eligibility status with the GSEs, and the additional capital required to support Radian Guaranty’s eligibility could reduce our available liquidity.” See also Note 1 of Notes to Consolidated Financial Statements and “Overview—COVID-19 Impacts” for further information.
| | |
Part II. Item 7. Management’s Discussion and Analysis of Financial Condition and Results of Operations |
We believe that Radian Group has sufficient current sources of liquidity to fund its obligations. If we otherwise decide to increase our liquidity position, Radian Group may seek additional capital, including by incurring additional debt, issuing additional equity, or selling assets, which we may not be able to do on favorable terms, if at all.
Share Repurchases. During 2021 and 2020, the Company repurchased 17.8 million shares and 11.0 million shares of Radian Group common stock, respectively, under programs authorized by Radian Group’s board of directors, at a total cost of $399.1 million and $226.3 million, respectively, including commissions. No purchase authority remains available under these programs. On February 9, 2022, Radian Group’s board of directors approved a new share repurchase program authorizing the company to spend up to $400 million, excluding commissions, to repurchase Radian Group common stock. See Note 14 of Notes to Consolidated Financial Statements for additional details on our share repurchase programs.
Dividends and Dividend Equivalents. Throughout 2020, and for the first quarter of 2021, our quarterly common stock dividend was $0.125 per share. Effective May 4, 2021, Radian Group’s board of directors authorized an increase in the Company’s quarterly dividend to $0.14 per share. On February 9, 2022, Radian Group’s board of directors authorized an increase to the Company’s quarterly dividend from $0.14 to $0.20 per share. Based on our current outstanding shares of common stock and RSUs, we expect to require approximately $140 million in the aggregate to pay dividends and dividend equivalents for the next 12 months. Radian Group is not subject to any limitations on its ability to pay dividends except those generally applicable to corporations that are incorporated in Delaware. Delaware corporation law provides that dividends are only payable out of a corporation’s capital surplus or (subject to certain limitations) recent net profits. As of December 31, 2021, our capital surplus was $4.2 billion, representing our dividend limitation under Delaware law. The declaration and payment of future quarterly dividends remains subject to the board of directors’ determination.
Corporate Expenses and Interest Expense. Radian Group has expense-sharing arrangements in place with its principal operating subsidiaries that require those subsidiaries to pay their allocated share of certain holding-company-level expenses, including interest payments on Radian Group’s outstanding debt obligations. Corporate expenses and interest expense on Radian Group’s debt obligations allocated under these arrangements during 2021 of $147.4 million and $82.8 million, respectively, were substantially all reimbursed by its subsidiaries. We expect substantially all of our holding company expenses to continue to be reimbursed by our subsidiaries under our expense-sharing arrangements. The expense-sharing arrangements between Radian Group and its mortgage insurance subsidiaries, as amended, have been approved by the Pennsylvania Insurance Department, but such approval may be modified or revoked at any time.
Taxes. Pursuant to our tax-sharing agreements, our operating subsidiaries pay Radian Group an amount equal to any federal income tax the subsidiary would have paid on a standalone basis if they were not part of our consolidated tax return. As a result, from time to time, under the provisions of our tax-sharing agreements, Radian Group may pay to or receive from its operating subsidiaries amounts that differ from Radian Group’s consolidated federal tax payment obligation. During 2021, Radian Group received $11.7 million of tax-sharing agreement payments from its operating subsidiaries.
Capitalization—Holding Company
The following table presents our holding company capital structure.
| | | | | | | | | | | | | | |
| Capital structure | | | | |
| | | | |
| | December 31, |
| ($ in thousands) | | 2021 | | 2020 |
| Debt | | | | |
| Senior Notes due 2024 | | $ | 450,000 | | | $ | 450,000 | |
| Senior Notes due 2025 | | 525,000 | | | 525,000 | |
| Senior Notes due 2027 | | 450,000 | | | 450,000 | |
| Deferred debt costs on senior notes | | (15,527) | | | (19,326) | |
| Revolving credit facility | | — | | | — | |
| Total | | 1,409,473 | | | 1,405,674 | |
| Stockholders’ equity | | 4,258,796 | | | 4,284,353 | |
| Total capitalization | | $ | 5,668,269 | | | $ | 5,690,027 | |
| Debt-to-capital ratio | | 24.9 | % | | 24.7 | % |
Stockholders’ equity decreased by $25.6 million from December 31, 2020 to December 31, 2021. The net decrease in stockholders’ equity resulted primarily from share repurchases of $399.1 million, net unrealized losses on investments of $143.6 million primarily as a result of an increase in market interest rates during the year, and dividends of $104.4 million, partially offset by our net income of $600.7 million.
| | |
Part II. Item 7. Management’s Discussion and Analysis of Financial Condition and Results of Operations |
We regularly evaluate opportunities, based on market conditions, to finance our operations by accessing the capital markets or entering into other types of financing arrangements with institutional and other lenders and financing sources, and consider various measures to improve our capital and liquidity positions, as well as to strengthen our balance sheet, improve Radian Group’s debt maturity profile and maintain adequate liquidity for our operations. In the past we have repurchased and exchanged, prior to maturity, some of our outstanding debt, and in the future, we may from time to time seek to redeem, repurchase or exchange for other securities, or otherwise restructure or refinance some or all of our outstanding debt prior to maturity in the open market through other public or private transactions, including pursuant to one or more tender offers or through any combination of the foregoing, as circumstances may allow. The timing or amount of any potential transactions will depend on a number of factors, including market opportunities and our views regarding our capital and liquidity positions and potential future needs. There can be no assurance that any such transactions will be completed on favorable terms, or at all.
Mortgage
The principal demands for liquidity in our Mortgage business currently include: (i) the payment of claims and potential claim settlement transactions, net of reinsurance; (ii) expenses (including those allocated from Radian Group); (iii) repayments of FHLB advances; (iv) repayments, if any, associated with the Surplus Note due 2027; and (v) taxes, including potential additional purchases of U.S. Mortgage Guaranty Tax and Loss Bonds. See Notes 10 and 16 of Notes to Consolidated Financial Statements for additional information related to these non-interest bearing instruments. In addition to the foregoing liquidity demands, other payments have included and, in the future could include, returns of capital from Radian Guaranty to Radian Group, subject to approval by the Pennsylvania Insurance Department, as discussed below.
The principal sources of liquidity in our mortgage insurance business currently include insurance premiums, net investment income and cash flows from: (i) investment sales and maturities; (ii) FHLB advances; and (iii) capital contributions from Radian Group. We believe that the operating cash flows generated by each of our mortgage insurance subsidiaries will provide these subsidiaries with a substantial portion of the funds necessary to satisfy their needs for the foreseeable future. However, see “Overview—COVID-19 Impacts” and Note 1 of Notes to Consolidated Financial Statements for discussion about the elevated risks and uncertainties associated with the COVID-19 pandemic, including the impact on our PMIERs Cushion.
As of December 31, 2021, our mortgage insurance subsidiaries maintained claims paying resources of $5.9 billion on a statutory basis, which consist of contingency reserves, statutory policyholders’ surplus, premiums received but not yet earned and loss reserves. In addition, our reinsurance programs are designed to provide additional claims-paying resources during times of economic stress and elevated losses. See Note 8 of Notes to Consolidated Financial Statements for additional information.
Radian Guaranty’s Risk-to-capital as of December 31, 2021 was 11.1 to 1. Radian Guaranty is not expected to need additional capital to satisfy state insurance regulatory requirements in their current form. At December 31, 2021, Radian Guaranty had statutory policyholders’ surplus of $778.1 million. This balance includes a $354.1 million benefit from U.S. Mortgage Guaranty Tax and Loss Bonds issued by the U.S. Department of the Treasury, which mortgage guaranty insurers such as Radian Guaranty may purchase in order to be eligible for a tax deduction, subject to certain limitations, related to amounts required to be set aside in statutory contingency reserves. See Note 16 of Notes to Consolidated Financial Statements and “Item 1A. Risk Factors” for more information.
Radian Guaranty currently is an approved mortgage insurer under the PMIERs. Private mortgage insurers, including Radian Guaranty, are required to comply with the PMIERs to remain approved insurers of loans purchased by the GSEs. At December 31, 2021, Radian Guaranty’s Available Assets under the PMIERs financial requirements totaled approximately $5.4 billion, resulting in a PMIERs Cushion of $2.1 billion, or 62%, over its Minimum Required Assets. Those amounts compare to Available Assets and a PMIERs cushion of $4.7 billion and $1.3 billion, respectively, at December 31, 2020.
The primary driver of the increase in Radian Guaranty’s PMIERs Cushion during 2021 is the increase in Available Assets, reflecting positive cash flows from operating activities, combined with a decrease in Minimum Required Assets. During 2021, Radian Guaranty’s Minimum Required Assets decreased primarily as a result of a decrease in the number of primary loans in default. Radian Guaranty’s Minimum Required Assets include a benefit as a result of reinsurance agreements, including the addition of the Eagle Re 2021-1 Ltd. and Eagle Re 2021-2 Ltd. reinsurance agreements in April 2021 and November 2021, respectively. See Note 8 of Notes to Consolidated Financial Statements for additional information on our reinsurance agreements.
Our PMIERs Cushion at December 31, 2021 also includes a benefit from the current broad-based application of the Disaster Related Capital Charge that has reduced the total amount of Minimum Required Assets that Radian Guaranty otherwise would have been required to hold against pandemic-related defaults by approximately $300 million and $650 million as of December 31, 2021 and 2020, respectively, taking into consideration our risk distribution structures in effect as of those dates. We expect that application of the Disaster Related Capital Charge will continue to reduce Radian Guaranty’s PMIERs Minimum Required Assets, but this impact will diminish over time.
Notwithstanding the continued application of the Disaster Related Capital Charge, the total amount of Minimum Required Assets we may be required to hold against defaulted loans will increase over time, because the 0.30 multiplier is applied to a higher base factor for the defaulting loans (including those in forbearance) as they age, with increases taking place upon four,
| | |
Part II. Item 7. Management’s Discussion and Analysis of Financial Condition and Results of Operations |
six and 12 missed monthly payments. Additionally, given the lack of an expiration date under the CARES Act, it is difficult to estimate how long the GSEs may continue to offer COVID-19 forbearance programs for new defaults. It is also difficult to assess how long the GSEs may continue to apply the COVID-19 Amendment to loans in a COVID-19-related forbearance program. The COVID-19 Crisis Period expired March 31, 2021.
See “Item 1. Business—Regulation—Federal Regulation—GSE Requirements for Mortgage Insurance Eligibility.” for more information about the Disaster Related Capital Charge, and for further information, including on the expiration of the COVID-19 Crisis Period.
Even though they hold assets in excess of the minimum statutory capital thresholds and PMIERs financial requirements, the ability of Radian’s mortgage insurance subsidiaries to pay dividends on their common stock is restricted by certain provisions of the insurance laws of Pennsylvania, their state of domicile. Under Pennsylvania’s insurance laws, ordinary dividends and other distributions may only be paid out of an insurer’s positive unassigned surplus unless the Pennsylvania Insurance Department approves the payment of dividends or other distributions from another source.
In light of Radian Guaranty’s negative unassigned surplus related to operating losses in prior periods, the ongoing need to set aside contingency reserves, and the current ongoing economic uncertainty related to the COVID-19 pandemic, which increased losses in 2020 and could cause losses in future periods, we do not anticipate that Radian Guaranty will be permitted under applicable insurance laws to pay dividends or other distributions for the next several years without prior approval from the Pennsylvania Insurance Department. Under Pennsylvania’s insurance laws, an insurer must obtain the Pennsylvania Insurance Department’s approval to pay an Extraordinary Distribution. Radian Guaranty has sought and received such approval to return capital by paying Extraordinary Distributions to Radian Group, most recently in February 2022. See Note 16 of Notes to Consolidated Financial Statements for additional information on our Extraordinary Distributions, statutory dividend restrictions and contingency reserve requirements.
Radian Guaranty and Radian Reinsurance are both members of the FHLB. As members, they may borrow from the FHLB, subject to certain conditions, which include requirements to post collateral and to maintain a minimum investment in FHLB stock. Advances from the FHLB may be used to provide low-cost, supplemental liquidity for various purposes, including to fund incremental investments. Radian’s current strategy includes using FHLB advances as financing for general cash management purposes and for purchases of additional investment securities that have similar durations, for the purpose of generating additional earnings from our investment securities portfolio with limited incremental risk. As of December 31, 2021, there were $151.0 million of FHLB advances outstanding. See Note 12 of Notes to Consolidated Financial Statements for additional information.
homegenius
As of December 31, 2021, our homegenius segment maintained cash and liquid investments totaling $79.3 million, primarily held by Radian Title Insurance.
Title insurance companies, including Radian Title Insurance, are subject to comprehensive state regulations, including minimum net worth requirements. Radian Title Insurance was in compliance with all of its minimum net worth requirements at December 31, 2021. In the event the cash flows from operations of the homegenius segment are not adequate to fund all of its needs, including the regulatory capital needs of Radian Title Insurance, Radian Group may provide additional funds to the homegenius segment in the form of an intercompany note or other capital contribution, and if needed for Radian Title Insurance, subject to the approval of the Ohio Department of Insurance. Additional capital support may also be required for potential investments in new business initiatives to support our strategy of growing our businesses.
Liquidity levels may fluctuate depending on the levels and contractual timing of our invoicing and the payment practices of our homegenius clients, in combination with the timing of our homegenius segment’s payments for employee compensation and to external vendors. The amount, if any, and timing of the homegenius segment’s dividend paying capacity will depend primarily on the amount of excess cash flow generated by the segment.
Ratings
Radian Group, Radian Guaranty, Radian Reinsurance and Radian Title Insurance have been assigned the financial strength ratings set forth in the chart below. We believe that ratings often are considered by others in assessing our credit strength and the financial strength of our primary insurance subsidiaries. The following ratings have been independently assigned by third-party statistical rating organizations, are for informational purposes only and are subject to change. See “Item 1A. Risk Factors—The current financial strength ratings assigned to our mortgage insurance subsidiaries could weaken our competitive position and potential downgrades by rating agencies to these ratings and the ratings assigned to Radian Group could adversely affect the Company.”
| | |
Part II. Item 7. Management’s Discussion and Analysis of Financial Condition and Results of Operations |
| | | | | | | | | | | | | | | | | | | | | | | | | | | |
| Ratings | | | | | | | | | |
| | | | | | | | | |
| Subsidiary | | Moody’s (1) | | S&P (2) | | Fitch (3) | | Demotech (4) | |
| Radian Group | | Ba1 | | BB+ | | BBB- | | N/A | |
| Radian Guaranty | | Baa1 | | BBB+ | | A- | | N/A | |
| Radian Reinsurance | | N/A | | BBB+ | | N/A | | N/A | |
| Radian Title Insurance | | N/A | | N/A | | N/A | | A | |
(1)Based on the August 27, 2021 update, Moody’s outlook for Radian Group and Radian Guaranty currently is Stable.
(2)Based on the April 28, 2021 update, S&P’s outlook for Radian Group, Radian Guaranty and Radian Reinsurance is currently Stable.
(3)Based on the May 3, 2021 release, Fitch’s outlook for Radian Group and Radian Guaranty is currently Stable.
(4)Based on the December 1, 2021 release.
Critical Accounting Estimates
SEC guidance defines Critical Accounting Estimates as those estimates made in accordance with GAAP that involve a significant level of estimation uncertainty and have had or are reasonably likely to have a material impact on the financial condition or results of operation of the registrant. These items require the application of management’s most difficult, subjective or complex judgments, often because of the need to make estimates about the effect of matters that are inherently uncertain and that may change in subsequent periods. In preparing our consolidated financial statements in accordance with GAAP, management has made estimates, assumptions and judgments that affect the reported amounts of assets and liabilities at the date of the financial statements and the reported amounts of revenues and expenses during the reporting periods.
In preparing these financial statements, management has utilized available information, including our past history, industry standards and the current and projected economic and housing environments, among other factors, in forming its estimates, assumptions and judgments, giving due consideration to materiality. Because the use of estimates is inherent in GAAP, actual results could differ from those estimates. In addition, other companies may utilize different estimates, which may impact comparability of our results of operations to those of companies in similar businesses. A summary of the accounting estimates that management believes are critical to the preparation of our consolidated financial statements is set forth below. See Note 2 of Notes to Consolidated Financial Statements for additional disclosures regarding our significant accounting policies.
Mortgage Insurance Portfolio
Reserve for Losses and LAE
We establish reserves to provide for losses and LAE, which include the estimated costs of settling claims in our mortgage insurance portfolio, in accordance with the accounting standard regarding accounting and reporting by insurance enterprises. In our mortgage insurance business, the default and claim cycle begins with the receipt of a default notice from the loan servicer. We maintain an extensive database of default and claim payment history, and use models based on a variety of loan characteristics to determine the likelihood that a default will reach claim status.
With respect to loans that are in default, considerable judgment is exercised as to the adequacy of reserve levels. We use an actuarial projection methodology referred to as a “roll rate” analysis that uses historical claim frequency information to determine the projected ultimate Default to Claim Rates based on the Stage of Default and Time in Default as well as the date that a loan goes into default. The Default to Claim Rate also includes our estimates with respect to expected Rescissions and Claim Denials, which have the effect of reducing our Default to Claim Rates. See Note 11 of Notes to Consolidated Financial Statements for the table detailing our Default to Claim Rate assumptions.
After estimating the Default to Claim Rate, we estimate Claim Severity based on recently observed severity rates within product type, type of insurance and Time in Default cohorts, as adjusted to account for anticipated differences in future results compared to recent trends. These severity estimates are then applied to individual loan coverage amounts to determine reserves. Similar to the Default to Claim Rate, Claim Severity also is impacted by the length of time that loans are in default and by our Loss Mitigation Activity. For claims under our Primary Mortgage Insurance, the coverage percentage is applied to the claim amount, which consists of the unpaid loan principal, plus past due interest (for which our liability is contractually capped in accordance with the terms of our Master Policies) and certain expenses associated with the default, to determine our maximum liability. Therefore, Claim Severity generally increases the longer that a loan is in default.
We considered the sensitivity of first-lien loss reserve estimates at December 31, 2021 by assessing the potential changes resulting from a parallel shift in Claim Severity and Default to Claim Rate estimates for primary loans, excluding any potential benefits from reinsurance. For example, assuming all other factors remain constant, for every one percentage point change in primary Claim Severity (which we estimate to be 98.7% of defaulted risk exposure at December 31, 2021), we estimated that our loss reserves would change by approximately $8.0 million at December 31, 2021. Assuming all other factors remain constant, for every one percentage point change in our overall primary net Default to Claim Rate (which we estimate to
| | |
Part II. Item 7. Management’s Discussion and Analysis of Financial Condition and Results of Operations |
be 46% at December 31, 2021, including our assumptions related to Loss Mitigation Activities), we estimated a $17.1 million change in our loss reserves at December 31, 2021.
Senior management regularly reviews the modeled frequency, Claim Severity and Loss Mitigation Activity estimates, which are based on historical trends, as described above. If recent emerging or projected trends differ significantly from the historical trends used to develop the modeled estimates, management evaluates these trends and determines how they should be considered in its reserve estimates.
Estimating our case reserve for losses involves significant reliance upon assumptions and estimates with regard to the likelihood, magnitude and timing of each potential loss. The models, assumptions and estimates we use to establish loss reserves may prove to be inaccurate, especially during an extended economic downturn or a period of market volatility and economic uncertainty such as we have experienced due to the COVID-19 pandemic. These assumptions require management to use considerable judgment in estimating the rate at which these loans will result in claims. As such, given the current environment, there is significant uncertainty around our reserve estimate.
Premium Revenue Recognition
Premiums on mortgage insurance products are written on a recurring basis, either as monthly or annual premiums, or on a multi-year basis as a single premium. Monthly premiums written are earned as coverage is provided each month. For certain monthly policies where the billing is deferred for the first month’s coverage period, currently to the end of the policy, we record a net premium receivable representing the present value of such deferred premiums that we estimate will be collected at that future date. We recognize changes in this receivable based on changes in the estimated amount and timing of such collections, including as a result of changes in observed trends as well as our periodic review of our servicing guide and our operations and collections practices.
Key assumptions supporting our estimate include a collection rate and average life. During 2021 and 2020, we adjusted our assumptions for collectability and average life, which had an impact of increasing the net premium receivable and net premiums earned by $2.3 million and $11.3 million, respectively. If the collection rate assumption increased or decreased by 500 basis points, it would result in a $2.5 million increase or decrease, respectively, in the net premium receivable and net premiums earned. If the average life assumption increased or decreased by one year, it would result in an approximate $2.5 million decrease or increase, respectively, in the net premium receivable and net premiums earned. Additionally, given the difference between the present value of the net premium receivable recorded and the contractual premiums due, changes in our servicing guide, operations or collection practices could have up to a $43.7 million pre-tax benefit to our results of operations in periods when any changes are implemented.
Single premiums written are initially recorded as unearned premiums and earned over time based on the anticipated loss pattern and the estimated period of risk exposure, which is primarily derived from historical experience and other factors such as projected losses, premium type and projected contractual periods of risk based on original LTV. Our estimate for the single premium earnings pattern is updated periodically and subject to change given uncertainty as to the underlying loss development and duration of risk.
During 2019, we updated our estimated period of risk exposure due to the continuing increase in the significance of borrower-paid Single Premium Policies as well as our estimated anticipated loss pattern due to changes in observed and projected losses. During 2019, this change in estimate resulted in a $32.9 million increase in net premiums earned. There were no changes to our single premium earnings pattern estimate in 2020 or 2021.
Actual future experience that is different than expected loss development or policy cancellations could result in further material increases or decreases in the recognition of net premiums earned. Based on historical experience, losses are relatively low during the first two years after a loan is originated and then increase over a period of several years before declining; however, several factors can impact and change this cycle, including the economic environment, the quality of the underwriting of the loan, characteristics of the mortgage loan, the credit profile of the borrower, housing prices and unemployment rates. If the timing of losses were to shift, it could accelerate or decelerate our recognition of net premiums earned and could have a material impact on our results of operations.
Credit Losses and Other Impairments
Investments
We perform an evaluation of fixed-maturity securities available for sale each quarter to assess whether any decline in their fair value below cost is deemed to be a credit impairment recognized in earnings. Factors considered in our assessment for impairment include the extent to which the amortized cost basis is greater than fair value and the reasons for the decline in value. As of December 31, 2021, our gross unrealized losses on available for sale securities was $38.0 million, which can fluctuate materially over time based on changes in market conditions. During 2021 and 2020, we recognized a $0.7 million credit recovery and a $1.0 million credit loss, respectively, related to our fixed-maturity securities available for sale. See Note 6 of Notes to Consolidated Financial Statements for additional information regarding impairments related to investments.
| | |
Part II. Item 7. Management’s Discussion and Analysis of Financial Condition and Results of Operations |
Fair Value of Financial Instruments
Our estimated fair value measurements are intended to reflect the assumptions market participants would use in pricing an asset or liability based on the best information available. Assumptions include the risks inherent in a particular valuation technique (such as a pricing model) and the risks inherent in the inputs to the model. Changes in economic conditions and capital market conditions, including but not limited to, benchmark interest rate changes, credit spread changes, market volatility and changes in the value of underlying collateral, could cause actual results to differ materially from our estimated fair value measurements.
Nearly all of our financial instruments recorded at fair value relate to our investment portfolio, which totaled $6.5 billion as of December 31, 2021. The primary risks in our investment portfolio are interest-rate risk and credit-spread risk, namely the fair value sensitivity of our fixed income securities to changes in interest rates and credit spreads, respectively. We regularly analyze our exposure to interest-rate risk and credit-spread risk and have determined that the fair value of our investments is materially exposed to changes in both interest rates and credit spreads. For additional information regarding the sensitivity of our investment portfolio to these inputs, see “Item 7A. Quantitative and Qualitative Disclosures About Market Risk.”
See also Note 5 of Notes to Consolidated Financial Statements for additional information pertaining to financial instruments at fair value and our valuation methodologies.
Liability for Legal Contingencies
As discussed in Note 13 of Notes to Consolidated Financial Statements, we are subject to various legal proceedings and claims that arise in the ordinary course of business. We establish accruals only when we determine both that it is probable that a loss has been incurred and the amount of the loss is reasonably estimable, which requires significant judgment.
As described in Note 13 of Notes to Consolidated Financial Statements, we believe there was not at least a reasonable possibility we may have incurred a material loss, or a material loss greater than a recorded accrual, concerning loss contingencies for asserted legal and other claims. Due to the inherently subjective nature of these estimates and the uncertainty and unpredictability surrounding the outcome of legal and other proceedings, actual results may differ materially from any amounts that have been accrued. If one or more legal matters were resolved against the Company in a reporting period for amounts above management’s expectations, actual results could differ materially from any amounts that have been accrued.
Income Taxes
We are required to establish a valuation allowance against our deferred tax assets when it is more likely than not that all or some portion of our deferred tax assets will not be realized. At each balance sheet date, we assess our need for a valuation allowance and this assessment is based on all available evidence, both positive and negative, and requires management to exercise judgment and make assumptions regarding whether such deferred tax assets will be realized in future periods. Future realization of our deferred tax assets will ultimately depend on the existence of sufficient taxable income of the appropriate character (ordinary income or capital gains) within the applicable carryback and carryforward periods provided under the tax law. In making our assessment of the more likely than not standard, the weight assigned to the effect of both positive and negative evidence is commensurate with the extent to which such evidence can be objectively verified.
We have determined that certain non-insurance entities within Radian may continue to generate taxable losses on a separate company basis in the near term and may not be able to fully utilize certain state and local NOLs on their state and local tax returns. Therefore, with respect to deferred tax assets relating to these state and local NOLs and other state timing adjustments, we retained a valuation allowance of $83.4 million at December 31, 2021 and $77.7 million at December 31, 2020.
Estimated factors in this assessment include, but are not limited to, forecasts of future income and actual and planned business and operational changes. An amount up to the total valuation allowance currently recorded could be recognized if our assessment of realizability changes. Our assumptions around these items and the weight assigned to them have remained consistent in recent periods. See Note 10 of Notes to Consolidated Financial Statements for additional information.
Item 7A. Quantitative and Qualitative Disclosures About Market Risk
Market risk represents the potential for loss due to adverse changes in the value of financial instruments as a result of changes in market conditions. Examples of market risk include changes in interest rates, credit spreads, foreign currency exchange rates and equity prices. We perform sensitivity analyses to determine the effects of market risk exposures on our investment securities by determining the potential loss in future earnings, fair values or cash flows of market-risk-sensitive instruments resulting from one or more selected hypothetical changes in the above mentioned market risks.
Interest-Rate Risk and Credit-Spread Risk
The primary market risks in our investment portfolio are interest-rate risk and credit-spread risk, namely the fair value sensitivity of our fixed income securities to changes in interest rates and credit spreads, respectively. We regularly analyze our exposure to interest-rate risk and credit-spread risk and have determined that the fair value of our investments is materially exposed to changes in both interest rates and credit spreads. As of December 31, 2021, we held $257 million of investment securities for trading purposes, representing less than 5% of our total investment portfolio. Accordingly, in presenting this discussion, we have not distinguished between trading and non-trading instruments.
We calculate the duration of our fixed income securities, expressed in years, in order to estimate the interest-rate sensitivity of these securities. The average duration of our total fixed income portfolio was 4.5 years at December 31, 2021 and 4.7 years at December 31, 2020. To assist us in setting duration targets for the investment portfolio, we analyze: (i) the interest-rate sensitivities of our liabilities, including prepayment risk associated with premium cash flows and credit losses; (ii) entity specific cash flows under various economic scenarios; (iii) return, volatility and correlation of specific asset classes and the interconnection with our liabilities; and (iv) our current risk appetite.
Our stress analysis for interest rates is based on the change in fair value of our fixed income securities, assuming a hypothetical instantaneous and parallel 100-basis point increase in the U.S. Treasury yield curve, with all other factors remaining constant. The carrying value of our fixed income securities has a balance of $6.5 billion and $6.8 billion as of December 31, 2021 and 2020, respectively. If interest rates experienced an increase of 100 basis points, our fixed income portfolio would decrease by $281.7 million and $300.4 million of the market value of the related fixed income portfolio for 2021 and 2020, respectively.
Credit spread represents the additional yield on a fixed income security, above the risk-free rate, that is paid by an issuer to compensate investors for assuming the credit risk of the issuer and market liquidity of the fixed income security. We manage credit-spread risk on both an entity and group level, across issuer, maturity, sector and asset class. Our stress analysis for credit-spread risk is based on the change in fair value of our fixed income securities, assuming a hypothetical 100-basis point increase in all credit spreads, with the exception of U.S. Treasury and agency RMBS obligations for which we have assumed no change in credit spreads, and assuming all other factors remain constant. If credit spreads experienced an increase of 100 basis points, our fixed income portfolio would decrease by $262.8 million and $285.4 million of the market value of the related fixed income portfolio for 2021 and 2020, respectively.
Actual shifts in credit spreads generally vary by issuer and security, based on issuer-specific and security-specific factors such as credit quality, maturity, sector and asset class. Within a given asset class, investment grade securities generally exhibit less credit-spread volatility than securities with lower credit ratings. At December 31, 2021, 95.5% of our investment portfolio was rated investment grade.
Our sensitivity analyses for interest-rate risk and credit-spread risk provide an indication of our investment portfolio’s sensitivity to shifts in interest rates and credit spreads. However, the timing and magnitude of actual market changes may differ from the hypothetical assumptions used in our sensitivity calculations.
See “Item 1. Business—Investment Policy and Portfolio” for a discussion of portfolio strategy and risk exposure.
Securities Lending Agreements. Radian Group, Radian Guaranty and Radian Reinsurance from time to time enter into short-term securities lending agreements with third-party borrowers for the purpose of increasing the income on our investment securities portfolio with limited incremental risk. Market factors, including changes in interest rates, credit spreads and equity prices, may impact the timing or magnitude of cash outflows for the return of cash collateral. As of December 31, 2021 and 2020, the carrying value of these securities included in the sensitivity analyses above was $86.0 million and $53.7 million, respectively.
We also have the right to request the return of the loaned securities at any time. For additional information on our securities lending agreements, see Note 6 of Notes to Consolidated Financial Statements.
Item 8. Financial Statements and Supplementary Data
Index to Consolidated Financial Statements
| | | | | |
| Page |
| Annual Financial Statements | |
| |
| |
| Financial Statements as of December 2021 and 2020 and for the years ended December 31, 2021, 2020 and 2019 | |
| |
| |
| |
| |
| |
| |
| Notes to Consolidated Financial Statements | |
| |
| |
| |
| |
| |
| |
| |
| |
| |
| |
| |
| |
| |
| |
| |
| |
| |
Report of Independent Registered Public Accounting Firm
To the Board of Directors and Stockholders of Radian Group Inc.
Opinions on the Financial Statements and Internal Control over Financial Reporting
We have audited the accompanying consolidated balance sheets of Radian Group Inc. and its subsidiaries (the “Company”) as of December 31, 2021 and 2020, and the related consolidated statements of operations, comprehensive income, changes in common stockholders’ equity and cash flows for each of the three years in the period ended December 31, 2021, including the related notes and financial statement schedules listed in the index appearing under Item 15(a)3 (collectively referred to as the “consolidated financial statements”). We also have audited the Company's internal control over financial reporting as of December 31, 2021, based on criteria established in Internal Control - Integrated Framework (2013) issued by the Committee of Sponsoring Organizations of the Treadway Commission (“COSO”).
In our opinion, the consolidated financial statements referred to above present fairly, in all material respects, the financial position of the Company as of December 31, 2021 and 2020, and the results of its operations and its cash flows for each of the three years in the period ended December 31, 2021 in conformity with accounting principles generally accepted in the United States of America. Also in our opinion, the Company maintained, in all material respects, effective internal control over financial reporting as of December 31, 2021, based on criteria established in Internal Control - Integrated Framework (2013) issued by the COSO.
Basis for Opinions
The Company's management is responsible for these consolidated financial statements, for maintaining effective internal control over financial reporting, and for its assessment of the effectiveness of internal control over financial reporting, included in Management’s Report on Internal Control over Financial Reporting appearing under Item 9A. Our responsibility is to express opinions on the Company’s consolidated financial statements and on the Company's internal control over financial reporting based on our audits. We are a public accounting firm registered with the Public Company Accounting Oversight Board (United States) (“PCAOB”) and are required to be independent with respect to the Company in accordance with the U.S. federal securities laws and the applicable rules and regulations of the Securities and Exchange Commission and the PCAOB.
We conducted our audits in accordance with the standards of the PCAOB. Those standards require that we plan and perform the audits to obtain reasonable assurance about whether the consolidated financial statements are free of material misstatement, whether due to error or fraud, and whether effective internal control over financial reporting was maintained in all material respects.
Our audits of the consolidated financial statements included performing procedures to assess the risks of material misstatement of the consolidated financial statements, whether due to error or fraud, and performing procedures that respond to those risks. Such procedures included examining, on a test basis, evidence regarding the amounts and disclosures in the consolidated financial statements. Our audits also included evaluating the accounting principles used and significant estimates made by management, as well as evaluating the overall presentation of the consolidated financial statements. Our audit of internal control over financial reporting included obtaining an understanding of internal control over financial reporting, assessing the risk that a material weakness exists, and testing and evaluating the design and operating effectiveness of internal control based on the assessed risk. Our audits also included performing such other procedures as we considered necessary in the circumstances. We believe that our audits provide a reasonable basis for our opinions.
Definition and Limitations of Internal Control over Financial Reporting
A company’s internal control over financial reporting is a process designed to provide reasonable assurance regarding the reliability of financial reporting and the preparation of financial statements for external purposes in accordance with generally accepted accounting principles. A company’s internal control over financial reporting includes those policies and procedures that (i) pertain to the maintenance of records that, in reasonable detail, accurately and fairly reflect the transactions and dispositions of the assets of the company; (ii) provide reasonable assurance that transactions are recorded as necessary to permit preparation of financial statements in accordance with generally accepted accounting principles, and that receipts and expenditures of the company are being made only in accordance with authorizations of management and directors of the company; and (iii) provide reasonable assurance regarding prevention or timely detection of unauthorized acquisition, use, or disposition of the company’s assets that could have a material effect on the financial statements.
Because of its inherent limitations, internal control over financial reporting may not prevent or detect misstatements. Also, projections of any evaluation of effectiveness to future periods are subject to the risk that controls may become inadequate because of changes in conditions, or that the degree of compliance with the policies or procedures may deteriorate.
Critical Audit Matters
The critical audit matter communicated below is a matter arising from the current period audit of the consolidated financial statements that was communicated or required to be communicated to the audit committee and that (i) relates to accounts or disclosures that are material to the consolidated financial statements and (ii) involved our especially challenging, subjective, or complex judgments. The communication of critical audit matters does not alter in any way our opinion on the consolidated financial statements, taken as a whole, and we are not, by communicating the critical audit matter below, providing a separate opinion on the critical audit matter or on the accounts or disclosures to which it relates.
Valuation of First-Lien Primary Case Reserves for Mortgage Insurance Policies
As described in Notes 2 and 11 to the consolidated financial statements, the Company establishes case reserves for losses on mortgage insurance policies for loans that are considered to be in default, as well as reserves for loss adjustment expenses, losses incurred but not reported (“IBNR”) and other reserves. As of December 31, 2021, first-lien primary case reserves were $790.4 million of the total $823.1 million of mortgage insurance loss reserves. Management’s estimate of the case reserves for losses involves significant reliance upon assumptions and estimates with regard to the likelihood, magnitude and timing of each potential loss. Management uses an actuarial projection methodology referred to as a “roll rate” analysis that uses historical claim frequency information to determine the projected ultimate Default to Claim Rates based on the Stage of Default and Time in Default as well as the date that a loan goes into default. After estimating the Default to Claim Rate, management estimates Claim Severity based on the average of recently observed severity rates within product type, type of insurance, and Time in Default cohorts.
The principal considerations for our determination that performing procedures relating to the valuation of first-lien primary case reserves for mortgage insurance policies is a critical audit matter are (i) the significant judgment by management when developing their estimates of the Default to Claim Rates and Claim Severity, which in turn led to a high degree of auditor subjectivity and judgment in performing procedures relating to such estimates; (ii) the significant audit effort and subjectivity in evaluating the audit evidence related to the Default to Claim Rates and Claim Severity; and (iii) the audit effort involved the use of professionals with specialized skill and knowledge.
Addressing the matter involved performing procedures and evaluating audit evidence in connection with forming our overall opinion on the consolidated financial statements. These procedures included testing the effectiveness of controls relating to management’s valuation of first-lien primary case reserves for mortgage insurance policies, including controls over the development of the Default to Claim Rates and Claim Severity. These procedures also included, among others, the involvement of professionals with specialized skill and knowledge to assist in developing an independent estimate of the case reserves for first-lien primary mortgage insurance policies using actual historical data, comparing this independent estimate to management’s determined case reserves, and evaluating the reasonableness of management’s assumptions related to the Default to Claim Rates and Claim Severity. Performing these procedures involved testing the completeness and accuracy of data provided by management and independently developing Default to Claim Rates and Claim Severity assumptions based on data provided by management.
/s/ PricewaterhouseCoopers LLP
Philadelphia, Pennsylvania
February 25, 2022
We have served as the Company’s auditor since 2007.
Radian Group Inc. and Subsidiaries
Consolidated Balance Sheets
| | | | | | | | | | | | | | |
| | December 31, |
| (In thousands, except per-share amounts) | | 2021 | | 2020 |
| Assets | | | | |
Investments (Notes 5 and 6) | | | | |
Fixed-maturities available for sale—at fair value, net of allowance for credit losses of $0 and $948 (amortized cost of $5,367,729 and $5,393,623) | | $ | 5,517,078 | | | $ | 5,723,340 | |
Trading securities—at fair value (amortized cost of $234,382 and $260,773) | | 256,546 | | | 290,885 | |
Equity securities—at fair value (cost of $176,229 and $145,501) | | 184,245 | | | 151,240 | |
Short-term investments—at fair value (includes $48,652 and $15,587 of reinvested cash collateral held under securities lending agreements) | | 551,508 | | | 618,004 | |
| Other invested assets—at fair value | | 4,165 | | | 4,973 | |
| Total investments | | 6,513,542 | | | 6,788,442 | |
| Cash | | 151,145 | | | 87,915 | |
| Restricted cash | | 1,475 | | | 6,231 | |
| Accrued investment income | | 32,812 | | | 34,047 | |
| Accounts and notes receivable | | 124,016 | | | 121,294 | |
Reinsurance recoverables (includes $51 and $32 for paid losses) | | 67,896 | | | 73,202 | |
| Deferred policy acquisition costs | | 16,317 | | | 18,305 | |
Property and equipment, net (Note 2) | | 75,086 | | | 80,457 | |
Goodwill and other acquired intangible assets, net (Note 7) | | 19,593 | | | 23,043 | |
Other assets (Note 9) | | 837,303 | | | 715,085 | |
| | | | |
| Total assets | | $ | 7,839,185 | | | $ | 7,948,021 | |
| | | | |
| Liabilities and Stockholders’ Equity | | | | |
| Liabilities | | | | |
| Unearned premiums | | $ | 329,090 | | | $ | 448,791 | |
Reserve for losses and LAE (Note 11) | | 828,642 | | | 848,413 | |
Senior notes (Note 12) | | 1,409,473 | | | 1,405,674 | |
FHLB advances (Note 12) | | 150,983 | | | 176,483 | |
| Reinsurance funds withheld | | 228,078 | | | 278,555 | |
| Net deferred tax liability (Note 10) | | 337,509 | | | 213,897 | |
| Other liabilities | | 296,614 | | | 291,855 | |
| Total liabilities | | 3,580,389 | | | 3,663,668 | |
Commitments and Contingencies (Note 13) | | | | |
| Stockholders’ equity | | | | |
Common stock: par value $0.001 per share; 485,000 shares authorized at December 31, 2021 and 2020; 194,408 and 210,130 shares issued at December 31, 2021 and 2020, respectively; 175,421 and 191,606 shares outstanding at December 31, 2021 and 2020, respectively | | 194 | | | 210 | |
Treasury stock, at cost: 18,987 and 18,524 shares at December 31, 2021 and 2020, respectively | | (920,798) | | | (910,115) | |
| Additional paid-in capital | | 1,878,372 | | | 2,245,897 | |
| Retained earnings | | 3,180,935 | | | 2,684,636 | |
Accumulated other comprehensive income (loss) (Note 15) | | 120,093 | | | 263,725 | |
| Total stockholders’ equity | | 4,258,796 | | | 4,284,353 | |
| Total liabilities and stockholders’ equity | | $ | 7,839,185 | | | $ | 7,948,021 | |
See Notes to Consolidated Financial Statements.
102
Radian Group Inc. and Subsidiaries
Consolidated Statements of Operations
| | | | | | | | | | | | | | | | | | | | | | |
| | Years Ended December 31, | | |
| (In thousands, except per-share amounts) | | 2021 | | 2020 | | 2019 | | |
| Revenues | | | | | | | | |
Net premiums earned (Note 8) | | $ | 1,037,183 | | | $ | 1,115,321 | | | $ | 1,145,349 | | | |
Services revenue (Note 4) | | 125,825 | | | 105,385 | | | 154,596 | | | |
Net investment income (Note 6) | | 147,909 | | | 154,037 | | | 171,796 | | | |
Net gains on investments and other financial instruments (includes net realized gains on investments of $20,842, $35,826 and $10,843) | | 15,603 | | | 60,277 | | | 51,719 | | | |
| Other income | | 3,412 | | | 3,597 | | | 3,495 | | | |
| Total revenues | | 1,329,932 | | | 1,438,617 | | | 1,526,955 | | | |
| | | | | | | | |
| Expenses | | | | | | | | |
| Provision for losses | | 20,877 | | | 485,117 | | | 132,031 | | | |
| Policy acquisition costs | | 29,029 | | | 30,989 | | | 25,314 | | | |
| Cost of services | | 103,714 | | | 86,066 | | | 108,324 | | | |
| Other operating expenses | | 323,686 | | | 280,710 | | | 306,129 | | | |
| | | | | | | | |
| Interest expense | | 84,344 | | | 71,150 | | | 56,310 | | | |
Loss on extinguishment of debt (Note 12) | | — | | | — | | | 22,738 | | | |
Impairment of goodwill (Note 7) | | — | | | — | | | 4,828 | | | |
| Amortization and impairment of other acquired intangible assets | | 3,450 | | | 5,144 | | | 22,288 | | | |
| Total expenses | | 565,100 | | | 959,176 | | | 677,962 | | | |
| | | | | | | | |
| Pretax income | | 764,832 | | | 479,441 | | | 848,993 | | | |
Income tax provision (Note 10) | | 164,161 | | | 85,815 | | | 176,684 | | | |
| Net income | | $ | 600,671 | | | $ | 393,626 | | | $ | 672,309 | | | |
| | | | | | | | |
| Net Income Per Share | | | | | | | | |
| Basic | | $ | 3.19 | | | $ | 2.01 | | | $ | 3.22 | | | |
| Diluted | | $ | 3.16 | | | $ | 2.00 | | | $ | 3.20 | | | |
| | | | | | | | |
| Weighted-average number of common shares outstanding—basic | | 188,370 | | | 195,443 | | | 208,773 | | | |
| Weighted-average number of common and common equivalent shares outstanding—diluted | | 190,263 | | | 196,642 | | | 210,340 | | | |
See Notes to Consolidated Financial Statements.
103
Radian Group Inc. and Subsidiaries
Consolidated Statements of Comprehensive Income
| | | | | | | | | | | | | | | | | | | | |
| | Years Ended December 31, |
| (In thousands) | | 2021 | | 2020 | | 2019 |
| | | | | | |
| Net income | | $ | 600,671 | | | $ | 393,626 | | | $ | 672,309 | |
Other comprehensive income (loss), net of tax (Note 15) | | | | | | |
| | | | | | |
| Unrealized holding gains (losses) on investments arising during the period for which an allowance for expected losses has not been recognized | | (138,435) | | | 178,761 | | | 180,441 | |
| Less: Reclassification adjustment for net gains (losses) on investments included in net income | | | | | | |
| Net realized gains on disposals and non-credit related impairment losses | | 4,472 | | | 26,440 | | | 8,897 | |
| Net decrease (increase) in expected credit losses | | 725 | | | (991) | | | — | |
| Net unrealized gains (losses) on investments | | (143,632) | | | 153,312 | | | 171,544 | |
| Other adjustments to comprehensive income, net | | — | | | (75) | | | (136) | |
| Other comprehensive income (loss), net of tax | | (143,632) | | | 153,237 | | | 171,408 | |
| Comprehensive income | | $ | 457,039 | | | $ | 546,863 | | | $ | 843,717 | |
See Notes to Consolidated Financial Statements.
104
Radian Group Inc. and Subsidiaries
Consolidated Statements of Changes in Common Stockholders’ Equity
| | | | | | | | | | | | | | | | | | | | |
| | Years Ended December 31, |
| (In thousands) | | 2021 | | 2020 | | 2019 |
| Common Stock | | | | | | |
| Balance, beginning of period | | $ | 210 | | | $ | 219 | | | $ | 231 | |
| Issuance of common stock under incentive and benefit plans | | 2 | | | 2 | | | 1 | |
Shares repurchased under share repurchase program (Note 14) | | (18) | | | (11) | | | (13) | |
| Balance, end of period | | 194 | | | 210 | | | 219 | |
| | | | | | |
| Treasury Stock | | | | | | |
| Balance, beginning of period | | (910,115) | | | (901,657) | | | (894,870) | |
| Repurchases of common stock under incentive plans | | (10,683) | | | (8,458) | | | (6,787) | |
| Balance, end of period | | (920,798) | | | (910,115) | | | (901,657) | |
| | | | | | |
| Additional Paid-in Capital | | | | | | |
| Balance, beginning of period | | 2,245,897 | | | 2,449,884 | | | 2,724,733 | |
| Issuance of common stock under incentive and benefit plans | | 3,114 | | | 3,143 | | | 3,925 | |
| Share-based compensation | | 28,443 | | | 19,164 | | | 21,414 | |
Shares repurchased under share repurchase program (Note 14) | | (399,082) | | | (226,294) | | | (300,188) | |
| Balance, end of period | | 1,878,372 | | | 2,245,897 | | | 2,449,884 | |
| | | | | | |
| Retained Earnings | | | | | | |
| Balance, beginning of period | | 2,684,636 | | | 2,389,789 | | | 1,719,541 | |
| Net income | | 600,671 | | | 393,626 | | | 672,309 | |
| Dividends and dividend equivalents declared | | (104,372) | | | (98,779) | | | (2,061) | |
| Balance, end of period | | 3,180,935 | | | 2,684,636 | | | 2,389,789 | |
| | | | | | |
| Accumulated Other Comprehensive Income (Loss) | | | | | | |
| Balance, beginning of period | | 263,725 | | | 110,488 | | | (60,920) | |
| Net unrealized gains (losses) on investments, net of tax | | (143,632) | | | 153,312 | | | 171,544 | |
| Other adjustments to other comprehensive income (loss) | | — | | | (75) | | | (136) | |
| Balance, end of period | | 120,093 | | | 263,725 | | | 110,488 | |
| | | | | | |
| Total Stockholders’ Equity | | $ | 4,258,796 | | | $ | 4,284,353 | | | $ | 4,048,723 | |
See Notes to Consolidated Financial Statements.
105
Radian Group Inc. and Subsidiaries
Consolidated Statements of Cash Flows
| | | | | | | | | | | | | | | | | | | | |
| | Years Ended December 31, |
| (In thousands) | | 2021 | | 2020 | | 2019 |
| Cash flows from operating activities | | | | | | |
| Net income | | $ | 600,671 | | | $ | 393,626 | | | $ | 672,309 | |
| Adjustments to reconcile net income to net cash provided by (used in) operating activities: | | | | | | |
| Net (gains) losses on investments and other financial instruments | | (15,603) | | | (60,277) | | | (51,719) | |
| Loss on extinguishment of debt | | — | | | — | | | 22,738 | |
| | | | | | |
| | | | | | |
| | | | | | |
| | | | | | |
| | | | | | |
| Impairment of goodwill | | — | | | — | | | 4,828 | |
| Amortization and impairment of other acquired intangible assets | | 3,450 | | | 5,144 | | | 22,288 | |
| Depreciation, other amortization, and other impairments, net | | 72,020 | | | 66,585 | | | 50,439 | |
| Deferred income tax provision | | 161,793 | | | 102,079 | | | 157,162 | |
| Change in: | | | | | | |
| Accrued investment income | | 1,235 | | | (1,714) | | | 2,545 | |
| Accounts and notes receivable | | (2,722) | | | (29,280) | | | (25,504) | |
| Reinsurance recoverables | | 5,306 | | | (56,226) | | | (2,574) | |
| Deferred policy acquisition costs | | 1,988 | | | 2,454 | | | (3,448) | |
| Other assets | | (78,163) | | | 38,680 | | | (77,181) | |
| Unearned premiums | | (119,701) | | | (178,031) | | | (112,535) | |
| Reserve for losses and LAE | | (19,771) | | | 443,648 | | | 3,404 | |
| Reinsurance funds withheld | | (50,477) | | | (13,274) | | | (29,383) | |
| Other liabilities | | (2,914) | | | (54,980) | | | 61,062 | |
| Net cash provided by (used in) operating activities | | 557,112 | | | 658,434 | | | 694,431 | |
| | | | | | |
| Cash flows from investing activities | | | | | | |
| Proceeds from sales of: | | | | | | |
| Fixed-maturities available for sale | | 735,340 | | | 963,589 | | | 986,647 | |
| Trading securities | | 7,952 | | | 11,602 | | | 130,537 | |
| Equity securities | | 36,748 | | | 90,450 | | | 69,779 | |
| Proceeds from redemptions of: | | | | | | |
| Fixed-maturities available for sale | | 1,225,626 | | | 645,068 | | | 464,777 | |
| Trading securities | | 16,668 | | | 22,913 | | | 37,684 | |
| Purchases of: | | | | | | |
| Fixed-maturities available for sale | | (1,980,155) | | | (2,449,762) | | | (1,913,703) | |
| Equity securities | | (105,649) | | | (85,014) | | | (57,422) | |
| | | | | | |
| Sales, redemptions and (purchases) of: | | | | | | |
| Short-term investments, net | | 68,083 | | | (82,925) | | | 8,017 | |
| Other assets and other invested assets, net | | 6,126 | | | 1,434 | | | (739) | |
| Proceeds from sale of subsidiary, net of cash sold | | — | | | 16,481 | | | — | |
| Purchases of property and equipment | | (12,601) | | | (17,016) | | | (27,626) | |
| | | | | | |
| Net cash provided by (used in) investing activities | | (1,862) | | | (883,180) | | | (302,049) | |
| | | | | | |
See Notes to Consolidated Financial Statements.
106
| | | | | | | | | | | | | | | | | | | | |
| | Years Ended December 31, |
| (In thousands) | | 2021 | | 2020 | | 2019 |
| Cash flows from financing activities | | | | | | |
| Dividends and dividend equivalents paid | | (103,298) | | | (97,458) | | | (2,061) | |
| Issuance of common stock | | 1,382 | | | 1,553 | | | 2,416 | |
| Repurchases of common stock | | (399,100) | | | (226,305) | | | (300,201) | |
| Issuance of senior notes, net | | — | | | 515,567 | | | 442,439 | |
| Repayments and repurchases of senior notes | | — | | | — | | | (610,763) | |
| Credit facility commitment fees paid | | (3,325) | | | (2,292) | | | (989) | |
| Change in secured borrowings, net (with terms three months or less) | | 13,565 | | | (37,475) | | | 13,862 | |
| Proceeds from secured borrowings (with terms greater than three months) | | 42,000 | | | 207,034 | | | 115,275 | |
| Repayments of secured borrowings (with terms greater than three months) | | (48,000) | | | (137,927) | | | (62,932) | |
| Repayments of other borrowings | | — | | | (79) | | | (152) | |
| Net cash provided by (used in) financing activities | | (496,776) | | | 222,618 | | | (403,106) | |
| | | | | | |
| Effect of exchange rate changes on cash and restricted cash | | — | | | — | | | (4) | |
| Increase (decrease) in cash and restricted cash | | 58,474 | | | (2,128) | | | (10,728) | |
| Cash and restricted cash, beginning of period | | 94,146 | | | 96,274 | | | 107,002 | |
| Cash and restricted cash, end of period | | $ | 152,620 | | | $ | 94,146 | | | $ | 96,274 | |
| | | | | | |
| Supplemental disclosures of cash flow information | | | | | | |
Income taxes paid (Note 10) | | $ | 143,973 | | | $ | 81,404 | | | $ | 71,469 | |
| Interest paid | | 78,704 | | | 60,564 | | | 45,762 | |
See Notes to Consolidated Financial Statements.
107
| | | | | |
|
Radian Group Inc. and Subsidiaries Notes to Consolidated Financial Statements |
1. Description of Business
We are a diversified mortgage and real estate business, providing both credit-related mortgage insurance coverage and an array of other mortgage, risk, title, real estate and technology products and services. We have two reportable business segments—Mortgage and homegenius. Our homegenius segment was previously named “Real Estate,” and during the second quarter of 2021, we renamed it “homegenius” to align with updates to our brand strategy for the segment’s products and services.
Mortgage
Our Mortgage segment provides credit-related insurance coverage, principally through private mortgage insurance on residential first-lien mortgage loans, as well as other credit risk management, contract underwriting and fulfillment solutions, to mortgage lending institutions and mortgage credit investors. We provide our mortgage insurance products and services mainly through our wholly-owned subsidiary, Radian Guaranty.
Private mortgage insurance plays an important role in the U.S. housing finance system because it promotes affordable home ownership and helps protect mortgage lenders and investors, as well as other beneficiaries, by mitigating default-related losses on residential mortgage loans. Generally, these loans are made to homebuyers who make down payments of less than 20% of the purchase price for their home or, in the case of refinancings, have less than 20% equity in their home. Private mortgage insurance also facilitates the sale of these low down payment loans in the secondary mortgage market, most of which are currently sold to the GSEs.
Our total direct primary mortgage IIF and RIF were $246.0 billion and $60.9 billion, respectively, as of December 31, 2021, compared to $246.1 billion and $60.7 billion, respectively, as of December 31, 2020. In addition to providing private mortgage insurance, we have participated in credit risk transfer programs developed by the GSEs as part of their initiative to distribute mortgage credit risk and increase the role of private capital in the mortgage market. Our additional RIF under credit risk transfer transactions, resulting from our participation in these programs with the GSEs, totaled $417.7 million as of December 31, 2021, compared to $392.0 million as of December 31, 2020.
The GSEs and state insurance regulators impose various capital and financial requirements on our mortgage insurance subsidiaries. These include Risk-to-capital, other risk-based capital measures and surplus requirements, as well as the PMIERs financial requirements. Failure to comply with these capital and financial requirements may limit the amount of insurance that our mortgage insurance subsidiaries write or may prohibit them from writing insurance altogether. The GSEs and state insurance regulators possess significant discretion with respect to our mortgage insurance subsidiaries and all aspects of their business. See Note 16 for additional information on PMIERs and other regulatory information, and “—Recent Developments” below for a discussion of the elevated risks posed by the COVID-19 pandemic, which has led to an increase in mortgage defaults in our insured portfolio and a resulting increase in our Minimum Required Assets.
homegenius
Our homegenius segment is primarily a fee-for-service business that offers an array of products and services to market participants across the real estate value chain. Our homegenius products and services include title, real estate and technology products and services offered primarily to consumers, mortgage lenders, mortgage and real estate investors, GSEs, real estate brokers and agents. These products and services help lenders, investors, consumers and real estate agents evaluate, manage, monitor, acquire and sell properties, and include SaaS solutions and platforms, as well as managed services, such as real estate owned asset management, single family rental services and real estate valuation services. In addition, we provide title insurance and non-insurance title, closing and settlement services to mortgage lenders, GSEs and mortgage investors, as well as directly to consumers for residential mortgage loans.
See Note 4 for additional information about our reportable segments and All Other business activities, including the sale of Clayton, as well as other changes impacting our reportable segments in 2021 and 2020.
COVID-19 Developments
As a seller of mortgage credit protection, our results are subject to macroeconomic conditions and specific events that impact the housing finance and real estate markets, including events that impact mortgage originations and the credit performance of our RIF. Many of these conditions are beyond our control, including housing prices, unemployment, interest rate changes, the availability of credit and other national and regional economic conditions.
In general, a deterioration in economic conditions increases the likelihood that borrowers will be unable to satisfy their mortgage obligations. A deteriorating economy can adversely affect housing values, which in turn can influence the willingness of borrowers to continue to make mortgage payments regardless of whether they have the financial resources to do so. Mortgage defaults can also occur due to a variety of specific events affecting borrowers, including death or illness, divorce or
| | | | | |
|
Radian Group Inc. and Subsidiaries Notes to Consolidated Financial Statements |
other family problems, unemployment or other events. In addition, factors impacting regional economic conditions, acts of terrorism, war or other severe conflicts, event-specific economic depressions or other catastrophic events, such as natural disasters and pandemics, could result in increased defaults due to the impact of such events on the ability of borrowers to satisfy their mortgage obligations and on the value of affected homes.
The unprecedented and continually evolving social and economic impacts associated with the COVID-19 pandemic on the U.S. and global economies that began in early 2020 had a negative effect on our business and our financial results for the second quarter of 2020, and since then to a lesser extent. Specifically, and primarily as a result of a sharp increase in the number of new defaults during the second quarter of 2020, our financial results in 2020 included: (i) an increase in both provision for losses and reserve for losses and (ii) an increase in our Minimum Required Assets under the PMIERs. However, beginning in the third quarter of 2020 and continuing throughout 2021, the number of new defaults has decreased significantly and has now returned to levels experienced prior to the start of the pandemic. These trends, combined with strong home price appreciation and favorable outcomes from mortgage forbearance programs implemented during the pandemic to assist homeowners, have led to favorable reserve development during 2021 on prior year defaults. See Note 11 for additional information on our reserve for losses.
In addition, in response to the threat posed to the economy from the COVID-19 pandemic, in early 2020 the Federal Reserve enacted certain protective measures to support the economy that resulted in a drop in interest rates generally, and in mortgage rates specifically, resulting in increased mortgage refinance activity. While these developments have benefited our NIW volumes, the low interest rate environment also resulted in a high level of refinance activity and associated increase in policy cancellations, which has reduced our Persistency Rate and in turn contributed to a reduction in our IIF, particularly as a result of a decline in our Single Premium Policies. In the second quarter of 2021 this refinance activity began to moderate, and this trend continued in the second half of 2021.
While recent trends have been favorable, the long-term impact of the COVID-19 pandemic on our businesses will depend on, among other things: the extent and duration of the pandemic, the severity of illness and number of people infected with the virus and the acceptance and long-term effectiveness of anti-viral treatments and vaccines, especially as new strains of COVID-19 have emerged; the wider economic effects of the pandemic and the scope and duration of governmental and other third-party measures restricting day-to-day life and business operations; the impact of economic stimulus efforts to support the economy through the pandemic; and governmental and GSE programs implemented to assist borrowers experiencing a COVID-19-related hardship, including forbearance programs, as well as suspensions of foreclosures and evictions.
2. Significant Accounting Policies
Basis of Presentation
Our consolidated financial statements are prepared in accordance with GAAP and include the accounts of Radian Group Inc. and its subsidiaries. All intercompany accounts and transactions, and intercompany profits and losses, have been eliminated. Certain prior period amounts have been reclassified to conform to current period presentation.
We refer to Radian Group Inc. together with its consolidated subsidiaries as “Radian,” the “Company,” “we,” “us” or “our,” unless the context requires otherwise. We generally refer to Radian Group Inc. alone, without its consolidated subsidiaries, as “Radian Group.” Unless otherwise defined in this report, certain terms and acronyms used throughout this report are defined in the Glossary of Abbreviations and Acronyms included as part of this report.
Use of Estimates
The preparation of financial statements in conformity with GAAP requires us to make estimates and assumptions that affect the reported amounts of assets and liabilities and disclosure of our contingent assets and liabilities at the dates of the financial statements, as well as the reported amounts of revenues and expenses during the reporting periods. While the amounts included in our consolidated financial statements include our best estimates and assumptions, actual results may vary materially.
Investments
We group fixed-maturity securities in our investment portfolio into trading or available for sale securities. Trading securities are reported at fair value, with unrealized gains and losses reported as a separate component of income. Investments in fixed-maturity securities classified as available for sale are reported at fair value, with unrealized gains and losses (net of tax) reported as a separate component of stockholders’ equity as accumulated other comprehensive income (loss). Equity securities primarily consist of our interests in a variety of broadly-diversified exchange traded funds, which are recorded at fair value with unrealized gains and losses reported in income. Short-term investments consist of money market instruments, certificates of deposit and highly liquid, interest-bearing instruments with an original maturity of 12 months or less at the time of purchase. Amortization of premium and accretion of discount are calculated principally using the interest method
| | | | | |
|
Radian Group Inc. and Subsidiaries Notes to Consolidated Financial Statements |
over the term of the investment. Realized gains and losses on investments are recognized using the specific identification method. See Notes 5 and 6 for further discussion on investments.
We recognize an impairment as a loss for fixed-maturities available for sale on the statement of operations if: (i) we intend to sell the impaired security; (ii) it is more likely than not that we will be required to sell the impaired security prior to recovery of its amortized cost basis; or (iii) the present value of cash flows we expect to collect is less than the amortized cost basis of a security. In those instances, we record an impairment loss through earnings that varies depending on specific circumstances. If a sale is likely, the full amount of the impairment is recognized as a loss in the statement of operations. Otherwise, unrealized losses on securities are separated into: (i) the portion of loss that represents the credit loss and (ii) the portion that is due to other factors. In evaluating whether a decline in value for other securities relates to an existing credit loss, we consider several factors, including, but not limited to, the following:
■the extent to which the amortized cost basis is greater than fair value;
■reasons for the decline in value (e.g., adverse conditions related to industry or geographic area, changes in financial condition to the issuers or underlying loan obligors);
■any changes to the rating of the security by a rating agency;
■the failure of the issuer to make a scheduled payment;
■the financial position, access to capital and near-term prospects of the issuer, including the current and future impact of any specific events; and
■our best estimate of the present value of cash flows expected to be collected.
If a credit loss is determined to exist, the impairment amount is calculated as the difference between the amortized cost and the present value of future expected cash flows, limited to the difference between the carrying amount (i.e., fair value) and amortized cost. This credit loss impairment is included in net gains (losses) on investments and other financial instruments in the statement of operations, with an offset to an allowance for credit losses. Subsequent changes (favorable and unfavorable) in expected credit losses are recognized immediately in net income as a credit loss impairment or a reversal of credit loss impairment.
Prior to the adoption of ASU 2016-13, Financial Instruments—Credit Losses, effective January 1, 2020, subsequent increases in the fair value of any other-than-temporarily impaired securities were recognized as a component of other comprehensive income until such gains were realized through cash collection or sale, rather than through net income.
Fair Value of Financial Instruments
Our estimated fair value measurements are intended to reflect the assumptions market participants would use in pricing an asset or liability based on the best information available. Assumptions include the risks inherent in a particular valuation technique (such as a pricing model) and the risks inherent in the inputs to the model. Changes in economic conditions and capital market conditions, including but not limited to, credit spread changes, benchmark interest rate changes, market volatility and changes in the value of underlying collateral, could cause actual results to differ materially from our estimated fair value measurements. We define fair value as the current amount that would be received to sell an asset or paid to transfer a liability in an orderly transaction between market participants at the measurement date.
In accordance with GAAP, which establishes a three-level valuation hierarchy, we disclose fair value measurements based on the transparency of inputs to the valuation of an asset or liability as of the measurement date. The hierarchy gives the highest priority to unadjusted quoted prices in active markets for identical assets or liabilities (Level I measurements) and the lowest priority to unobservable inputs (Level III measurements). The level in the fair value hierarchy within which the fair value measurement falls is determined based on the lowest level input that is significant to the measurement in its entirety. The three levels of the fair value hierarchy are defined below:
Level I — Unadjusted quoted prices for identical assets or liabilities in active markets that are accessible at the measurement date for identical, unrestricted assets or liabilities;
Level II — Prices or valuations based on observable inputs other than quoted prices in active markets for identical assets and liabilities; and
Level III — Prices or valuations that require inputs that are both significant to the fair value measurement and unobservable. Level III inputs are used to measure fair value only to the extent that observable inputs are not available.
For markets in which inputs are not observable or are limited, we use significant judgment and assumptions that a typical market participant would use to evaluate the market price of an asset or liability. Given the level of judgment necessary, another market participant may derive a materially different estimate of fair value. These assets and liabilities are classified in Level III of our fair value hierarchy.
| | | | | |
|
Radian Group Inc. and Subsidiaries Notes to Consolidated Financial Statements |
Available for sale securities, trading securities, equity securities and certain other assets are recorded at fair value as described in Note 5. All changes in fair value of trading securities, equity securities and certain other assets are included in our consolidated statements of operations.
Restricted Cash
Included in our restricted cash balances as of December 31, 2021 were cash funds held in trusts for the benefit of certain policyholders.
Accounts and Notes Receivable
Accounts and notes receivable primarily consist of accrued premiums receivable, amounts billed and due from our customers for services performed, and certain receivables related to our reinsurance transactions. Accounts and notes receivable are carried at their estimated collectible amounts, net of any allowance for doubtful accounts, and are periodically evaluated for collectability based on past payment history and current economic conditions. See “—Revenue Recognition—Mortgage Insurance” below for information on our deferred premiums and Note 8 for details on our reinsurance agreements.
Income Taxes
We provide for income taxes in accordance with the provisions of the accounting standard regarding accounting for income taxes. As required under this standard, our deferred tax assets and deferred tax liabilities are recognized under the balance sheet method, which recognizes the future tax effect of temporary differences between the amounts recorded in our consolidated financial statements and the tax bases of these amounts. Deferred tax assets and deferred tax liabilities are measured using the enacted tax rates that are expected to apply to taxable income in the periods in which the deferred tax asset or deferred tax liability is expected to be realized or settled. In regard to accumulated other comprehensive income, the Company’s policy for releasing disproportionate income tax effects is to release the effects as individual items are sold.
We are required to establish a valuation allowance against our deferred tax assets when it is more likely than not that all or some portion of our deferred tax assets will not be realized. At each balance sheet date, we assess our need for a valuation allowance. Our assessment is based on all available evidence, both positive and negative. This requires management to exercise judgment and make assumptions regarding whether our deferred tax assets will be realized in future periods.
See Note 10 for further discussion on income taxes.
Reserve for Losses and LAE
Mortgage Insurance
We establish reserves to provide for losses and LAE on our mortgage insurance policies, which include the estimated costs of settling claims, in accordance with the accounting standard regarding accounting and reporting by insurance enterprises (ASC 944). Although this standard specifically excludes mortgage insurance from its guidance relating to the reserve for losses, because there is no specific guidance for mortgage insurance, we establish reserves for mortgage insurance as described below, using the guidance contained in this standard supplemented with other accounting guidance.
In our mortgage insurance business, the default and claim cycle begins with the receipt of a default notice from the loan servicer. Case reserves for losses are established upon receipt of notification from servicers that a borrower has missed two monthly payments, which is when we consider a loan to be in default for financial statement and internal tracking purposes. We also establish reserves for associated LAE, consisting of the estimated cost of the claims administration process, including legal and other fees and expenses associated with administering the claims process.
We do not establish reserves for loans that are in default if we believe that we will not be liable for the payment of a claim with respect to that default. We generally do not establish loss reserves for expected future claims on insured mortgages that are not in default. See “—Reserve for Premium Deficiency” below for an exception to these general principles.
With respect to loans that are in default, considerable judgment is exercised as to the adequacy of reserve levels. We use an actuarial projection methodology referred to as a “roll rate” analysis that uses historical claim frequency information to determine the projected ultimate Default to Claim Rates based on the Stage of Default and Time in Default as well as the date that a loan goes into default. The Default to Claim Rate also includes our estimates with respect to expected Loss Mitigation Activities, which have the effect of reducing our Default to Claim Rates.
After estimating the Default to Claim Rate, we estimate Claim Severity based on observed severity rates within product type, type of insurance and Time in Default cohorts. These severity estimates are then applied to individual loan coverage amounts to determine reserves.
The impact to our reserve due to estimated future Loss Mitigation Activities incorporates our expectations regarding the number of policies that we expect to be reinstated as a result of our claims rebuttal process. Rescissions, Claim Denials and
| | | | | |
|
Radian Group Inc. and Subsidiaries Notes to Consolidated Financial Statements |
Claim Curtailments may occur for various reasons, including, without limitation, underwriting negligence, fraudulent applications and appraisals, breach of representations and warranties and inadequate documentation, primarily related to our insurance written in years prior to and including 2008.
Unless a liability associated with such activities or discussions becomes probable and can be reasonably estimated, we consider our claim payments and our Rescissions, Claim Denials and Claim Curtailments to be resolved for financial reporting purposes. An estimated loss is accrued only if we determine that the loss is probable and can be reasonably estimated. For populations of disputed Rescissions, Claim Denials and Claim Curtailments where we determine that a settlement is probable and that a loss can be reasonably estimated, we reflect our best estimate of the expected loss related to the populations under discussion in our financial statements, primarily as a component of our IBNR reserve. While our reserves include our best estimate of such losses, the outcome of the discussions or potential legal proceedings that could ensue is uncertain, and it is reasonably possible that a loss exists in excess of the amount accrued.
Estimating our case reserve for losses involves significant reliance upon assumptions and estimates with regard to the likelihood, magnitude and timing of each potential loss. The models, assumptions and estimates we use to establish loss reserves may not prove to be accurate, especially in the event of an extended economic downturn or a period of market volatility and economic uncertainty such as we have experienced due to the COVID-19 pandemic. For example, the ultimate cure rate for loan defaults resulting from the pandemic may be lower or higher than our expectations. These assumptions require management to use considerable judgment in estimating the rate at which these loans will result in claims. As such, given the current environment, there is significant uncertainty around our reserve estimate.
Title Insurance
We establish reserves for estimated future claims payments on our title insurance policies at the time the related policy revenue is recorded. Our title insurance reserve for losses and LAE comprises estimates of both known claims and incurred but unreported claims expected to be paid in the future for policies issued as of the balance sheet date. Title insurance policies typically insure against prior events affecting the quality of real estate titles, rather than against unforeseen, and therefore less avoidable, future events. As such, claims payments often result from either judgment errors or mistakes made in the title search and examination process or the escrow process.
We provide for losses associated with these policies based upon our historical experience and other factors. However, by their nature, title claims can often be complex, vary greatly in dollar amounts, vary in number due to economic and market conditions such as an increase in mortgage foreclosures, and involve uncertainties as to ultimate exposure. Due to the length of time over which claim payments are made and regularly occurring changes in underlying economic and market conditions, these estimates are subject to variability.
Reserve for Premium Deficiency
Insurance enterprises are required to establish a PDR if the net present value of the expected future losses and expenses for a particular product line exceeds the net present value of expected future premiums and existing reserves for that product line. We reassess our expectations for premiums, losses and expenses for our mortgage insurance business at least quarterly and update our premium deficiency analyses accordingly. For our mortgage insurance business, we group our mortgage insurance products into two categories: first-lien and second-lien mortgage loans.
As of December 31, 2021 and 2020, the combination of the net present value of our expected future premiums and existing reserves (net of reinsurance recoverables) significantly exceeded the net present value of our future expected losses and expenses associated with our first-lien mortgage insurance portfolio. Our remaining second-lien mortgage insurance exposure is immaterial. We had a second-lien PDR of $0.1 million as of December 31, 2020, and did not require a second-lien PDR as of December 31, 2021.
Revenue Recognition
Mortgage Insurance
Premiums on mortgage insurance products are written on a recurring basis, either as monthly or annual premiums, or on a multi-year basis as a single premium. Monthly premiums written are earned as coverage is provided each month. For certain monthly policies where the billing is deferred for the first month’s coverage period, currently to the end of the policy, we record a net premium receivable representing the present value of such deferred premiums that we estimate will be collected at that future date. As of December 31, 2021 and 2020, this net premium receivable was $30.3 million and $29.7 million, respectively, representing the present values of $74.0 million and $77.0 million, respectively, in contractual deferred monthly premiums, after adjustments for the estimated collectability and timing of future billing. We recognize changes in this receivable based on changes in the estimated amount and timing of such collections, including as a result of changes in observed trends as well as our periodic review of our servicing guide and our operations and collections practices. Given the difference between the present value of the net premium receivable recorded and the contractual premiums due, such changes to the preceding factors could have a material effect on our results of operations in future periods if any changes are implemented.
| | | | | |
|
Radian Group Inc. and Subsidiaries Notes to Consolidated Financial Statements |
Annual premiums written are initially recorded as unearned premiums and amortized on a monthly, straight-line basis. Single premiums written are initially recorded as unearned premiums and earned over time based on the anticipated claim payment pattern, which includes historical industry experience and is updated periodically. During 2019, we updated the amortization rates due to the continuing increase in the significance of borrower-paid Single Premium Policies in our portfolio following our rate reductions on borrower-paid Single Premium Policies in 2018. Under HPA, most borrower-paid policies must be canceled automatically on the date the LTV is scheduled to reach 78% of the original value (or, if the loan is not current on that date, on the subsequent date that the loan becomes current). As a result, given the shift in our mix of Single Premium Policies toward more borrower-paid Single Premium Policies than lender-paid, the average anticipated term of our Single Premium IIF is declining compared to historical levels. We updated our analysis to reflect not only this anticipated effect of HPA cancellations on borrower-paid policies, but also changes in observed and projected loss patterns for both borrower-paid and lender-paid policies. Our results for 2019 include a $32.9 million increase in net premiums earned and a $0.12 increase in net income per share, resulting from a cumulative adjustment related to the updated amortization rates used to recognize revenue for Single Premium Policies.
When we rescind insurance coverage on a loan, we refund all premiums received in connection with such coverage. When insurance coverage on a loan is canceled due to claim payment, we refund all premiums received since the date of delinquency. When insurance coverage is cancelled for a reason other than Rescission or claim payment, all premium that is nonrefundable is immediately earned. Premium revenue is recognized net of our accrual for estimated premium refunds due to Rescissions or other factors.
With respect to our reinsurance transactions, ceded premiums written on an annual or multi-year basis are initially set up as prepaid reinsurance and are amortized in a manner consistent with the recognition of income on direct premiums.
Title Insurance and Related Services
Title insurance premiums are recognized as revenue upon closing and completion of the real estate transaction. Premiums generally are calculated with reference to the policy amount. Premiums are charged to customers based on rates predetermined in coordination with each state’s respective Department of Insurance. Such regulations vary from state to state. Premium revenues from agency title operations are primarily comprised of premiums recognized upon title order and completion of real estate transaction closing.
Other title-related fees and income are closely related to title insurance premiums and are primarily associated with managing the closing of real estate transactions. As such, revenue is primarily recognized upon closing of the real estate transaction or completion and billing of services. We offer title services that include tax and title data services; centralized recording services; document retrieval; default curative title services; deed reports; property reports and other real estate or title-related activities. Expenses typically associated with premiums include third-party agent commissions and premium taxes.
Other Services
We recognize revenue representing the transfer of services to customers in an amount that reflects the consideration that we expect to be entitled to receive in exchange for those services, which are recognized as the performance obligations are satisfied. Due to the transactional nature of our business, our services revenue may fluctuate from period to period as transactions are commenced or completed.
Prior to our January 2020 sale of Clayton, our services included transaction management services related to loan acquisition, RMBS securitization and distressed asset reviews and servicer and loan surveillance services. Also, through December 2020, we offered residential real estate appraisal services through a panel of independent contractor appraisers; however, consistent with increased market demand for technology-driven solutions, in October 2020 we announced the wind down of this traditional appraisal business, in order to focus on our digital valuation services that are expected to produce higher growth. Our remaining services and related revenue recognition considerations are as follows:
Real Estate Services. We provide real estate services, including asset management and valuation services. Asset management services include management of the entire REO disposition process, services such as diligence and underwriting that serve the single family rental asset class, and a web-based asset management workflow solution for task driven asset management, including the management of REO assets, rental properties, due diligence for bulk acquisitions, loss mitigation efforts and short sales. Revenue attributable to REO services provided is based on a percentage of the sale and recognized over time, measured based on the progress to date and typically coincides with the client’s successful closing on the property. In certain instances, fees are received at the time that an asset is assigned to Radian for management. These fees are recorded as deferred revenue and are recognized over time based on progress to date and the availability to customers.
For valuation services, we leverage technology and a quality control process to deliver real estate valuation products and services to our customers, which include: appraisal review products; hybrid/ancillary appraisal products; automated valuation products; interactive valuation products; and broker price opinions. Each service qualifies as a separate performance obligation for which revenue is recognized as the service is performed and made available to the client.
| | | | | |
|
Radian Group Inc. and Subsidiaries Notes to Consolidated Financial Statements |
Mortgage Services. We provide third-party contract underwriting and fulfillment solutions to our mortgage customers. Generally, revenue is recognized when contract underwriting results are made available to the customer or fulfillment services are completed.
Cost of Services
Cost of services consists primarily of costs paid for employee compensation and related payroll benefits, as well as corresponding travel and related expenses incurred in providing such services to clients.
Leases
We determine if an arrangement includes a lease at inception, and if it does, we recognize a right-of-use asset and lease liability. Right-of-use assets represent our right to use an underlying asset for the lease term and are recognized net of any payments made or received from the lessor. Lease liabilities represent our obligation to make lease payments and are based on the present value of lease payments over the lease term. In determining the net present value of lease payments, we use our incremental borrowing rate based on the information available at the lease commencement date.
Lease expense is recognized on a straight-line basis over the expected lease term. Lease and non-lease components are generally not accounted for separately. We have elected the short-term exemption for contracts with lease terms of 12 months or less.
Our lease agreements primarily relate to operating leases for office space we use in our operations. Certain of our leases include renewal options and/or termination options that we did not consider in the determination of the right-of-use asset or the lease liability as we did not believe it was reasonably certain that we would exercise such options.
See Note 13 for additional information on our lease liabilities.
Reinsurance
We cede insurance risk through the use of reinsurance contracts and follow reinsurance accounting for those transactions where significant risk is transferred. Loss reserves and unearned premiums are established before consideration is given to amounts related to our reinsurance agreements.
In accordance with the terms of the Single Premium QSR Program, rather than making a cash payment or transferring investments for ceded premiums written, Radian Guaranty holds the related amounts to collateralize the reinsurers’ obligations and has established a corresponding funds withheld liability. Any loss recoveries and any potential profit commission to Radian Guaranty will be realized from this account. The reinsurers’ share of earned premiums is paid from this account on a quarterly basis. This liability also includes an interest credit on funds withheld, which is recorded as ceded premiums at a rate specified in the agreement and, depending on experience under the contract, may be paid to either Radian Guaranty or the reinsurers.
The ceding commission earned for premiums ceded pursuant to this transaction is attributable to other underwriting costs (including any related deferred policy acquisition costs). The unamortized portion of the ceding commission in excess of our related acquisition cost is reflected in other liabilities. Ceded premiums written are recorded on the balance sheet as prepaid reinsurance premiums and amortized to ceded premiums earned in a manner consistent with the recognition of income on direct premiums. See Note 8 for further discussion of our reinsurance transactions.
Variable Interest Entities
In connection with our reinsurance programs for our mortgage insurance business, we may enter into contracts with VIEs. VIEs include corporations, trusts or partnerships in which: (i) the entity has insufficient equity at risk to allow it to finance its activities without additional subordinated financial support or (ii) at-risk equity holders, as a group, do not have the characteristics of a controlling financial interest.
We perform an evaluation to determine whether we are required to consolidate the VIE’s assets and liabilities in our consolidated financial statements, based on whether we are deemed to be the primary beneficiary. The primary beneficiary of a VIE is the variable interest holder that is determined to have the controlling financial interest as a result of having both: (i) the power to direct the activities of a VIE that most significantly impact the economic performance of the VIE and (ii) the obligation to absorb losses or right to receive benefits from the VIE that potentially could be significant to the VIE. See Note 8 for additional information.
Goodwill and Other Acquired Intangible Assets, Net
Goodwill is an asset representing the estimated future economic benefits arising from the assets we have acquired that were not individually identified and separately recognized. We generally perform our annual goodwill impairment test during the fourth quarter of each year, using balances as of the prior quarter. Goodwill is deemed to have an indefinite useful life and is subject to review for impairment annually, or more frequently, whenever circumstances indicate potential impairment at the
| | | | | |
|
Radian Group Inc. and Subsidiaries Notes to Consolidated Financial Statements |
reporting unit level. A reporting unit represents a business for which discrete financial information is available. We have concluded that we have one reporting unit, the homegenius segment, for purposes of our goodwill impairment assessment.
Acquired intangible assets, other than goodwill, primarily consist of customer relationships and represent the value of the specifically acquired customer relationships. For financial reporting purposes, intangible assets with finite lives are amortized over their applicable estimated useful lives in a manner that approximates the pattern of expected economic benefit from each intangible asset.
The calculation of the estimated fair value of goodwill and other acquired intangibles is performed primarily using an income approach and requires the use of significant estimates and assumptions that are highly subjective in nature, such as future expected cash flows, discount rates, attrition rates and market conditions. The most significant assumptions relate to the valuation of customer relationships. For more information on our accounting for goodwill and other acquired intangibles, see Note 7.
Property and Equipment
We capitalize certain costs associated with the development of internal-use software and the purchase of property and equipment. Software, property and equipment are carried at cost, net of accumulated depreciation and amortization. Amortization and depreciation are calculated on a straight-line basis over the estimated useful life of the respective assets and commence during the month of our placement of the assets into use.
The estimated useful life used to calculate the amortization of internal-use software is generally seven years. Leasehold improvements are depreciated over the lesser of the estimated useful life of the asset improved or the remaining term of the lease. The estimated useful life used to calculate the depreciation of furniture and equipment is generally three years. Depreciation and amortization expense associated with property and equipment for the years ended December 31, 2021, 2020 and 2019 was $15.9 million, $18.3 million and $20.8 million, respectively.
The following is a summary of the gross and net carrying amounts and accumulated amortization / depreciation (including impairment) of our property and equipment as of the periods indicated.
| | | | | | | | | | | | | | | | | | | | | | | | | | | | | | | | | | | | | | |
| Property and equipment |
| | | | | | | | | | | | |
| | December 31, 2021 | | December 31, 2020 |
| (In thousands) | | Gross Carrying Amount | | Accumulated Amortization /
Depreciation | | Net Carrying Amount | | Gross Carrying Amount | | Accumulated Amortization /
Depreciation | | Net Carrying Amount |
| Internal-use software | | $ | 145,248 | | | $ | (91,542) | | | $ | 53,706 | | | $ | 136,033 | | | $ | (81,724) | | | $ | 54,309 | |
| Leasehold improvements | | 34,805 | | | (18,108) | | | 16,697 | | | 32,975 | | | (15,608) | | | 17,367 | |
| Furniture and equipment | | 67,322 | | | (62,639) | | | 4,683 | | | 65,478 | | | (56,697) | | | 8,781 | |
| Total | | $ | 247,375 | | | $ | (172,289) | | | $ | 75,086 | | | $ | 234,486 | | | $ | (154,029) | | | $ | 80,457 | |
Deferred Policy Acquisition Costs
Incremental, direct costs associated with the successful acquisition of mortgage insurance policies, consisting of compensation, premium tax and other policy issuance and underwriting expenses, are initially deferred and reported as deferred policy acquisition costs. Consistent with industry accounting practice, amortization of these costs for each underwriting year book of business is recognized in proportion to estimated gross profits over the estimated life of the policies.
Estimated gross profits are composed of earned premium, interest income, losses and LAE. Estimates of expected gross profit, including the Persistency Rate and loss development assumptions for each underwriting year used as a basis for amortization, are evaluated quarterly and the total amortization recorded to date is adjusted by a charge or credit to our consolidated statements of operations if actual experience or other evidence suggests that previous estimates should be revised. Considerable judgment is used in evaluating these estimates and the assumptions on which they are based. The use of different assumptions may have a significant effect on the amortization of deferred policy acquisition costs. Ceding commissions received under our reinsurance arrangements related to these costs are also deferred and accounted for using similar assumptions. See Note 8 for additional information.
Earnings per Share
Basic net income per share is computed by dividing net income by the weighted-average number of common shares outstanding, while diluted net income per share is computed by dividing net income attributable to common stockholders by
| | | | | |
|
Radian Group Inc. and Subsidiaries Notes to Consolidated Financial Statements |
the sum of the weighted-average number of common shares outstanding and the weighted-average number of dilutive potential common shares.
Dilutive potential common shares relate primarily to our share-based compensation arrangements. In computing diluted net income per share, we use the treasury stock method, which is computed by assuming the issuance of common stock for the potential dilution of our unvested RSUs. For all calculations, the determination of whether potential common shares are dilutive or anti-dilutive is based on net income.
Share-Based Compensation
The cost related to share-based equity instruments is measured based on the grant-date fair value at the date of issuance, which for RSU awards is primarily determined by our common stock price on the date of grant. For share-based awards with performance conditions related to our own operations, the expense recognized is dependent on the probability of the performance measure being achieved. Compensation cost is generally recognized over the periods that an employee provides service in exchange for the award. Any forfeitures of awards are recognized as they occur. See Note 17 for further information.
Recent Accounting Pronouncements
Accounting Standards Adopted During 2021
In December 2019, the FASB issued ASU 2019-12, Income Taxes—Simplifying the Accounting for Income Taxes. This update simplifies the accounting for income taxes by removing certain exceptions to the general principles of ASC Topic 740 in GAAP and clarifies certain aspects to promote consistency among reporting entities. We adopted this update effective January 1, 2021. The adoption of this update did not have an impact on our financial statements and disclosures.
In October 2020, the FASB issued ASU 2020-08, Codification Improvements to Subtopic 310-20, Receivables—Nonrefundable Fees and Other Costs. This update clarifies that, for each reporting period, to the extent the amortized cost basis of an individual callable debt security exceeds the amount repayable by the issuer at the next call date, the excess (i.e., the premium) should be amortized to the next call date. We adopted ASU 2020-08 on January 1, 2021 on a prospective basis. The adoption of this update did not have a material impact on our financial statements and disclosures.
Accounting Standards Not Yet Adopted
In August 2018, the FASB issued ASU 2018-12, Financial Services—Insurance—Targeted Improvements to the Accounting for Long-Duration Contracts. The new standard: (i) requires that assumptions used to measure the liability for future policy benefits be reviewed at least annually; (ii) defines and simplifies the measurement of market risk benefits; (iii) simplifies the amortization of deferred acquisition costs; and (iv) enhances the required disclosures about long-duration contracts. This update is effective for fiscal years beginning after December 15, 2022, including interim periods within those fiscal years. Early adoption is permitted. We continue to evaluate the impact the new accounting guidance will have on our financial statements and disclosures.
In March 2020, the FASB issued ASU 2020-04, Reference Rate Reform—Facilitation of the Effects of Reference Reform on Financial Reporting. This new guidance provides optional practical expedients and exceptions for applying GAAP requirements to investments, derivatives or other transactions affected by reference rate reform such as those that impact the assessment of contract modifications. The amendments in this update are optional and may be elected from the date of issuance through December 31, 2022, as reference rate reform activities occur. We continue to evaluate the impact the discontinuance of LIBOR and the new accounting guidance will have on our financial statements and disclosures.
| | | | | |
|
Radian Group Inc. and Subsidiaries Notes to Consolidated Financial Statements |
3. Net Income Per Share
The calculation of basic and diluted net income per share is as follows.
| | | | | | | | | | | | | | | | | | | | |
| Net income per share | | | | | | |
| | | | | | |
| | Years Ended December 31, |
| (In thousands, except per-share amounts) | | 2021 | | 2020 | | 2019 |
| Net income—basic and diluted | | $ | 600,671 | | | $ | 393,626 | | | $ | 672,309 | |
| | | | | | | |
| Average common shares outstanding—basic | | 188,370 | | | 195,443 | | | 208,773 | |
Dilutive effect of stock-based compensation arrangements (1) | | 1,893 | | | 1,199 | | | 1,567 | |
| Adjusted average common shares outstanding—diluted | | 190,263 | | | 196,642 | | | 210,340 | |
| | | | | | |
| Net income per share: | | | | | | |
| Basic | | $ | 3.19 | | | $ | 2.01 | | | $ | 3.22 | |
| Diluted | | $ | 3.16 | | | $ | 2.00 | | | $ | 3.20 | |
(1)The following number of shares of our common stock equivalents issued under our share-based compensation arrangements are not included in the calculation of diluted net income per share because they are anti-dilutive.
| | | | | | | | | | | | | | | | | | | | |
| | Years Ended December 31, |
| (In thousands) | | 2021 | | 2020 | | 2019 |
| Shares of common stock equivalents | | 28 | | | 865 | | | 221 | |
4. Segment Reporting
We have two strategic business units that we manage separately—Mortgage and homegenius. Our Mortgage segment derives its revenue from mortgage insurance and other mortgage and risk services, including contract underwriting and fulfillment solutions provided to mortgage lending institutions and mortgage credit investors. Our homegenius segment offers an array of title, real estate and technology products and services to consumers, mortgage lenders, mortgage and real estate investors, GSEs, real estate brokers and agents.
In addition, we report as All Other activities that include: (i) income (losses) from assets held by Radian Group, our holding company; (ii) related general corporate operating expenses not attributable or allocated to our reportable segments; (iii) income and expenses related to Clayton for all periods prior to our sale of this business in the first quarter of 2020; (iv) the income and expenses related to our traditional appraisal services, which we wound down beginning in the fourth quarter of 2020; and (v) certain other immaterial activities, including investments in new business opportunities.
During the second quarter of 2021, our Real Estate segment was renamed “homegenius” to align with updates to our brand strategy for the segment’s products and services. The homegenius segment name change had no impact on the composition of our segments or on our previously reported historical financial position, results of operations, cash flow or segment level results.
We allocate corporate operating expenses to both reportable segments based on each segment’s forecasted annual percentage of total revenue, which approximates the estimated percentage of management time spent on each segment. In addition, we allocate all corporate interest expense to our Mortgage segment, due to the capital-intensive nature of our mortgage insurance business.
With the primary exception of goodwill and other acquired intangible assets, which all relate to our homegenius segment and are reviewed as part of our annual goodwill impairment assessment, we do not manage assets by segment.
See Note 1 for additional details about our Mortgage and homegenius businesses.
Adjusted Pretax Operating Income (Loss)
Our senior management, including our Chief Executive Officer (Radian’s chief operating decision maker), uses adjusted pretax operating income (loss) as our primary measure to evaluate the fundamental financial performance of each of Radian’s business segments and to allocate resources to the segments.
Adjusted pretax operating income (loss) is defined as pretax income (loss) excluding the effects of: (i) net gains (losses) on investments and other financial instruments, except for certain investments attributable to our reportable segments; (ii) loss on extinguishment of debt; (iii) amortization and impairment of goodwill and other acquired intangible assets; and (iv)
| | | | | |
|
Radian Group Inc. and Subsidiaries Notes to Consolidated Financial Statements |
impairment of other long-lived assets and other non-operating items, such as impairment of internal-use software, gains (losses) from the sale of lines of business and acquisition-related income and expenses.
Although adjusted pretax operating income (loss) excludes certain items that have occurred in the past and are expected to occur in the future, the excluded items represent those that are: (i) not viewed as part of the operating performance of our primary activities or (ii) not expected to result in an economic impact equal to the amount reflected in pretax income (loss). These adjustments, along with the reasons for their treatment, are described below.
(1) Net gains (losses) on investments and other financial instruments. The recognition of realized investment gains or losses can vary significantly across periods as the activity is highly discretionary based on the timing of individual securities sales due to such factors as market opportunities, our tax and capital profile and overall market cycles. Unrealized gains and losses arise primarily from changes in the market value of our investments that are classified as trading or equity securities. These valuation adjustments may not necessarily result in realized economic gains or losses.
Trends in the profitability of our fundamental operating activities can be more clearly identified without the fluctuations of these realized and unrealized gains or losses and changes in fair value of other financial instruments. Except for certain investments attributable to our reportable segments, we do not view them to be indicative of our fundamental operating activities.
(2)Loss on extinguishment of debt. Gains or losses on early extinguishment of debt and losses incurred to purchase our debt prior to maturity are discretionary activities that are undertaken in order to take advantage of market opportunities to strengthen our financial and capital positions; therefore, we do not view these activities as part of our operating performance. Such transactions do not reflect expected future operations and do not provide meaningful insight regarding our current or past operating trends.
(3)Amortization and impairment of goodwill and other acquired intangible assets. Amortization of acquired intangible assets represents the periodic expense required to amortize the cost of acquired intangible assets over their estimated useful lives. Acquired intangible assets are also periodically reviewed for potential impairment, and impairment adjustments are made whenever appropriate. We do not view these charges as part of the operating performance of our primary activities.
(4)Impairment of other long-lived assets and other non-operating items. Includes activities that we do not view to be indicative of our fundamental operating activities, such as: (i) impairment of internal-use software and other long-lived assets; (ii) gains (losses) from the sale of lines of business: and (iii) acquisition-related income and expenses.
The reconciliation of adjusted pretax operating income (loss) for our reportable segments to consolidated pretax income is as follows.
| | | | | | | | | | | | | | | | | | | | |
| Reconciliation of adjusted pretax operating income (loss) by segment |
| | | | | | |
| | December 31, |
| (In thousands) | | 2021 | | 2020 | | 2019 |
| Adjusted pretax operating income (loss) | | | | | | |
| Mortgage | | $ | 781,546 | | | $ | 453,294 | | | $ | 852,854 | |
| homegenius | | (27,324) | | | (23,240) | | | (17,987) | |
Total adjusted pretax operating income for reportable
segments | | 754,222 | | | 430,054 | | | 834,867 | |
| All Other adjusted pretax operating income | | 3,527 | | | 2,013 | | | 19,768 | |
Net gains on investments and other financial instruments (1) | | 14,094 | | | 60,277 | | | 51,719 | |
| Loss on extinguishment of debt | | — | | | — | | | (22,738) | |
| Impairment of goodwill | | — | | | — | | | (4,828) | |
| Amortization and impairment of other acquired intangible assets | | (3,450) | | | (5,144) | | | (22,288) | |
| Impairment of other long-lived assets and other non-operating items | | (3,561) | | | (7,759) | | | (7,507) | |
| Consolidated pretax income | | $ | 764,832 | | | $ | 479,441 | | | $ | 848,993 | |
(1)For 2021, excludes $1.5 million in net gains on investments attributable to our homegenius segment and included in adjusted pretax operating income (loss) for that reportable segment.
| | | | | |
|
Radian Group Inc. and Subsidiaries Notes to Consolidated Financial Statements |
Revenue and Other Segment Information
The following tables reconcile reportable segment revenues to consolidated revenues and summarize interest expense, depreciation expense, allocation of corporate operating expenses and adjusted pretax operating income for our reportable segments as follows.
| | | | | | | | | | | | | | | | | | | | | | | | | | | | | | | | | | | | | | | | | | | | |
| Reportable segment revenue and other segment information |
| | | | | | | | | | | | | | |
| | December 31, 2021 |
| (In thousands) | | Mortgage | | homegenius | | Reportable Segment Total | | All Other | | Inter-segment | | Adjustments | | Consolidated Total |
| Net premiums earned | | $ | 998,282 | | | $ | 38,901 | | | $ | 1,037,183 | | | $ | — | | | $ | — | | | $ | — | | | $ | 1,037,183 | |
| Services revenue | | 17,670 | | | 108,282 | | | 125,952 | | | 154 | | | (281) | | | — | | | 125,825 | |
| Net investment income | | 132,929 | | | 358 | | | 133,287 | | | 14,622 | | | — | | | — | | | 147,909 | |
| Net gains on investments and other financial instruments | | — | | | 1,509 | | | 1,509 | | | — | | | — | | | 14,094 | | | 15,603 | |
| Other income | | 2,678 | | | — | | | 2,678 | | | 734 | | | — | | | — | | | 3,412 | |
| Total revenues | | $ | 1,151,559 | | | $ | 149,050 | | | $ | 1,300,609 | | | $ | 15,510 | | | $ | (281) | | | $ | 14,094 | | | $ | 1,329,932 | |
| Other segment information: | | | | | | | | | | | | | | |
| Interest expense | | $ | 84,344 | | | $ | — | | | $ | 84,344 | | | | | | | | | |
| Direct depreciation expense | | 9,580 | | | 2,452 | | | 12,032 | | | | | | | | | |
Allocation of corporate operating expenses (1) | | 127,482 | | | 18,482 | | | 145,964 | | | | | | | | | |
(1)Includes allocated depreciation expense of $3.2 million, $0.5 million and $3.7 million allocated to Mortgage, homegenius and Reportable Segment Total, respectively.
| | | | | | | | | | | | | | | | | | | | | | | | | | | | | | | | | | | | | | | | | | | | |
| | December 31, 2020 |
| (In thousands) | | Mortgage | | homegenius | | Reportable Segment Total | | All Other | | Inter-segment | | Adjustments | | Consolidated Total |
| Net premiums earned | | $ | 1,092,767 | | | $ | 22,554 | | | $ | 1,115,321 | | | $ | — | | | $ | — | | | $ | — | | | $ | 1,115,321 | |
| Services revenue | | 14,765 | | | 79,524 | | | 94,289 | | | 12,535 | | | (1,439) | | | — | | | 105,385 | |
| Net investment income | | 137,195 | | | 361 | | | 137,556 | | | 16,481 | | | — | | | — | | | 154,037 | |
| Net gains on investments and other financial instruments | | — | | | — | | | — | | | — | | | — | | | 60,277 | | | 60,277 | |
| Other income | | 2,816 | | | — | | | 2,816 | | | 534 | | | — | | | 247 | | | 3,597 | |
| Total revenues | | $ | 1,247,543 | | | $ | 102,439 | | | $ | 1,349,982 | | | $ | 29,550 | | | $ | (1,439) | | | $ | 60,524 | | | $ | 1,438,617 | |
| Other segment information: | | | | | | | | | | | | | | |
| Interest expense | | $ | 71,150 | | | $ | — | | | $ | 71,150 | | | | | | | | | |
| Direct depreciation expense | | 12,387 | | | 2,857 | | | 15,244 | | | | | | | | | |
Allocation of corporate operating expenses (1) | | 114,802 | | | 12,807 | | | 127,609 | | | | | | | | | |
(1)Includes allocated depreciation expense of $2.6 million, $0.3 million and $2.9 million allocated to Mortgage, homegenius and Reportable Segment Total, respectively.
| | | | | |
|
Radian Group Inc. and Subsidiaries Notes to Consolidated Financial Statements |
| | | | | | | | | | | | | | | | | | | | | | | | | | | | | | | | | | | | | | | | | | | | |
| | December 31, 2019 |
| (In thousands) | | Mortgage | | homegenius | | Reportable Segment Total | | All Other | | Inter-segment | | Adjustments | | Consolidated Total |
| Net premiums earned | | $1,134,214 | | $ | 11,976 | | | $ | 1,146,190 | | | $ | (841) | | | $ | — | | | $ | — | | | $ | 1,145,349 | |
| Services revenue | | 8,134 | | | 76,941 | | | 85,075 | | | 70,961 | | | (1,440) | | | — | | | 154,596 | |
| Net investment income | | 151,491 | | | 680 | | | 152,171 | | | 19,625 | | | — | | | — | | | 171,796 | |
| Net gains on investments and other financial instruments | | — | | | — | | | — | | | — | | | — | | | 51,719 | | | 51,719 | |
| Other income | | 2,798 | | | — | | | 2,798 | | | 697 | | | — | | | — | | | 3,495 | |
| Total revenues | | $ | 1,296,637 | | | $ | 89,597 | | | $ | 1,386,234 | | | $ | 90,442 | | | $ | (1,440) | | | $ | 51,719 | | | $ | 1,526,955 | |
| Other segment information: | | | | | | | | | | | | | | |
| Interest expense | | $ | 56,310 | | | $ | — | | | $ | 56,310 | | | | | | | | | |
| Direct depreciation expense | | 15,323 | | | 2,321 | | | 17,644 | | | | | | | | | |
Allocation of corporate operating expenses (1) | | 104,078 | | | 10,165 | | | 114,243 | | | | | | | | | |
(1)Includes allocated depreciation expense of $1.6 million, $0.1 million and $1.7 million allocated to Mortgage, homegenius and Reportable Segment Total, respectively.
There was no single customer that accounted for more than 10% of our consolidated revenues (excluding net gains on investments and other financial instruments) in 2021, 2020 or 2019. There was one customer that accounted for more than 10% of NIW in 2021, as compared to one in 2020 and none in 2019.
The table below represents the disaggregation of services revenues by revenue type.
| | | | | | | | | | | | | | | | | | | | |
| Services revenue | | | | | | |
| | | | | | |
| | Years Ended December 31, |
| (In thousands) | | 2021 | | 2020 | | 2019 |
| homegenius | | | | | | |
| Title | | $ | 40,202 | | | $ | 23,265 | | | $ | 14,185 | |
| Real estate | | | | | | |
| Valuation | | 32,459 | | | 21,749 | | | 27,549 | |
| Single family rental | | 27,291 | | | 17,159 | | | 16,011 | |
| Asset management workflow platform | | 5,348 | | | 7,707 | | | 9,951 | |
| REO asset management | | 2,381 | | | 5,518 | | | 5,930 | |
| Other real estate services | | 320 | | | 2,770 | | | 2,862 | |
| Mortgage | | 17,670 | | | 14,682 | | | 7,632 | |
All Other (1) | | 154 | | | 12,535 | | | 70,476 | |
| Total services revenue | | $ | 125,825 | | | $ | 105,385 | | | $ | 154,596 | |
(1)Includes services revenue from Clayton prior to its sale in January 2020 and amounts related to our traditional appraisal business, which we wound down beginning in the fourth quarter of 2020.
Revenue recognized related to services made available to customers and billed is reflected in accounts and notes receivable. Accounts and notes receivable includes $20.0 million and $18.8 million as of December 31, 2021 and 2020, respectively, related to services revenue contracts. Revenue recognized related to services performed and not yet billed is recorded in unbilled receivables and reflected in other assets. Deferred revenue, which represents advance payments received from customers in advance of revenue recognition, is immaterial for all periods presented. We have no material bad-debt expense.
| | | | | |
|
Radian Group Inc. and Subsidiaries Notes to Consolidated Financial Statements |
5. Fair Value of Financial Instruments
The following tables include a list of assets that are measured at fair value by hierarchy level as of December 31, 2021 and 2020.
| | | | | | | | | | | | | | | | | | | | | | | | | | | |
Assets carried at fair value by hierarchy level | |
| | | | | | | | | |
| | December 31, 2021 | |
| (In thousands) | | Level I | | Level II | | Level III | | Total | |
| Investments | | | | | | | | | |
| Fixed-maturities available for sale | | | | | | | | | |
| U.S. government and agency securities | | $ | 192,452 | | | $ | 29,278 | | | $ | — | | | $ | 221,730 | | |
| State and municipal obligations | | — | | | 177,257 | | | — | | | 177,257 | | |
| Corporate bonds and notes | | — | | | 2,910,231 | | | — | | | 2,910,231 | | |
| RMBS | | — | | | 705,117 | | | — | | | 705,117 | | |
| CMBS | | — | | | 709,203 | | | — | | | 709,203 | | |
| CLO | | — | | | 530,040 | | | — | | | 530,040 | | |
| Other ABS | | — | | | 211,187 | | | — | | | 211,187 | | |
| Foreign government and agency securities | | — | | | 5,296 | | | — | | | 5,296 | | |
Mortgage insurance-linked notes (1) | | — | | | 47,017 | | | — | | | 47,017 | | |
| | | | | | | | | |
| Total fixed-maturities available for sale | | 192,452 | | | 5,324,626 | | | — | | | 5,517,078 | | |
| | | | | | | | | |
| Trading securities | | | | | | | | | |
| | | | | | | | | |
| State and municipal obligations | | — | | | 94,637 | | | — | | | 94,637 | | |
| Corporate bonds and notes | | — | | | 119,186 | | | — | | | 119,186 | | |
| RMBS | | — | | | 9,438 | | | — | | | 9,438 | | |
| CMBS | | — | | | 33,285 | | | — | | | 33,285 | | |
| | | | | | | | | |
| | | | | | | | | |
| | | | | | | | | |
| Total trading securities | | — | | | 256,546 | | | — | | | 256,546 | | |
| | | | | | | | | |
| Equity securities | | 176,828 | | | 7,417 | | | — | | | 184,245 | | |
| | | | | | | | | |
| Short-term investments | | | | | | | | | |
| U.S. government and agency securities | | 94,665 | | | — | | | — | | | 94,665 | | |
| State and municipal obligations | | — | | | 12,270 | | | — | | | 12,270 | | |
| Money market instruments | | 274,535 | | | — | | | — | | | 274,535 | | |
| Corporate bonds and notes | | — | | | 65,191 | | | — | | | 65,191 | | |
| | | | | | | | | |
| CMBS | | — | | | 3,023 | | | — | | | 3,023 | | |
| | | | | | | | | |
| | | | | | | | | |
| | | | | | | | | |
Other investments (2) | | — | | | 101,824 | | | — | | | 101,824 | | |
| Total short-term investments | | 369,200 | | | 182,308 | | | — | | | 551,508 | | |
| | | | | | | | | |
Other invested assets (3) | | — | | | — | | | 3,000 | | | 3,000 | | |
| | | | | | | | | |
Total investments at fair value (3) | | 738,480 | | | 5,770,897 | | | 3,000 | | | 6,512,377 | | |
| | | | | | | | | |
| | | | | |
|
Radian Group Inc. and Subsidiaries Notes to Consolidated Financial Statements |
| | | | | | | | | | | | | | | | | | | | | | | | | | | |
Assets carried at fair value by hierarchy level | |
| | | | | | | | | |
| | December 31, 2021 | |
| (In thousands) | | Level I | | Level II | | Level III | | Total | |
| Other | | | | | | | | | |
Embedded derivatives (4) | | — | | | — | | | 4,200 | | | 4,200 | | |
Loaned securities (5) | | | | | | | | | |
| | | | | | | | | |
| Corporate bonds and notes | | — | | | 65,994 | | | — | | | 65,994 | | |
| | | | | | | | | |
| Equity securities | | 38,002 | | | — | | | — | | | 38,002 | | |
Total assets at fair value (3) | | $ | 776,482 | | | $ | 5,836,891 | | | $ | 7,200 | | | $ | 6,620,573 | | |
| | | | | | | | | |
| | | | | | | | | |
| | | | | | | | | |
| | | | | | | | | |
(1)Comprises the notes purchased by Radian Group in connection with the Excess-of-Loss Program. See Note 8 for more information about our reinsurance programs.
(2)Comprising short-term certificates of deposit and commercial paper.
(3)Does not include other invested assets of $1.2 million that are primarily invested in limited partnership investments valued using the net asset value as a practical expedient.
(4)Embedded derivatives related to our Excess-of-Loss Program are classified as other assets in our consolidated balance sheets. See Note 8 for more information about our reinsurance programs.
(5)Securities loaned to third-party borrowers under securities lending agreements are classified as other assets in our consolidated balance sheets. See Note 6 for more information.
| | | | | | | | | | | | | | | | | | | | | | | | | | | |
| Assets carried at fair value by hierarchy level | |
| | | | | | | | | |
| | December 31, 2020 | |
| (In thousands) | | Level I | | Level II | | Level III | | Total | |
| | | | | | | | | |
| Investments | | | | | | | | | |
| Fixed-maturities available for sale | | | | | | | | | |
| U.S. government and agency securities | | $ | 140,034 | | | $ | 29,189 | | | $ | — | | | $ | 169,223 | | |
| State and municipal obligations | | — | | | 165,271 | | | — | | | 165,271 | | |
| Corporate bonds and notes | | — | | | 3,047,189 | | | — | | | 3,047,189 | | |
| RMBS | | — | | | 833,939 | | | — | | | 833,939 | | |
| CMBS | | — | | | 681,265 | | | — | | | 681,265 | | |
| CLO | | — | | | 568,558 | | | — | | | 568,558 | | |
| Other ABS | | — | | | 252,457 | | | — | | | 252,457 | | |
| Foreign government and agency securities | | — | | | 5,438 | | | — | | | 5,438 | | |
| | | | | | | | | |
| Total fixed-maturities available for sale | | 140,034 | | | 5,583,306 | | | — | | | 5,723,340 | | |
| | | | | | | | | |
| Trading securities | | | | | | | | | |
| | | | | | | | | |
| State and municipal obligations | | — | | | 120,449 | | | — | | | 120,449 | | |
| | | | | | | | | |
| Corporate bonds and notes | | — | | | 123,142 | | | — | | | 123,142 | | |
| RMBS | | — | | | 13,000 | | | — | | | 13,000 | | |
| CMBS | | — | | | 34,294 | | | — | | | 34,294 | | |
| | | | | | | | | |
| | | | | | | | | |
| | | | | | | | | |
| Total trading securities | | — | | | 290,885 | | | — | | | 290,885 | | |
| | | | | | | | | |
| Equity securities | | 142,761 | | | 8,479 | | | — | | | 151,240 | | |
| | | | | | | | | | |
| | | | | |
|
Radian Group Inc. and Subsidiaries Notes to Consolidated Financial Statements |
| | | | | | | | | | | | | | | | | | | | | | | | | | | |
| Assets carried at fair value by hierarchy level | |
| | | | | | | | | |
| | December 31, 2020 | |
| (In thousands) | | Level I | | Level II | | Level III | | Total | |
| | | | | | | | | |
| Short-term investments | | | | | | | | | |
| | | | | | | | | |
| State and municipal obligations | | — | | | 21,819 | | | — | | | 21,819 | | |
| Money market instruments | | 268,900 | | | — | | | — | | | 268,900 | | |
| Corporate bonds and notes | | — | | | 30,495 | | | — | | | 30,495 | | |
| | | | | | | | | |
| | | | | | | | | |
| Other ABS | | — | | | 219 | | | — | | | 219 | | |
| | | | | | | | | |
Other investments (1) | | — | | | 296,571 | | | — | | | 296,571 | | |
| Total short-term investments | | 268,900 | | | 349,104 | | | — | | | 618,004 | | |
| | | | | | | | | | |
Other invested assets (2) | | — | | | — | | | 3,000 | | | 3,000 | | |
| | | | | | | | | | |
Total investments at fair value (2) | | 551,695 | | | 6,231,774 | | | 3,000 | | | 6,786,469 | | |
| | | | | | | | | | |
| Other | | | | | | | | | |
Embedded derivatives (3) | | — | | | — | | | 5,513 | | | 5,513 | | |
Loaned securities (4) | | | | | | | | | |
| U.S. government and agency securities | | 4,876 | | | — | | | — | | | 4,876 | | |
| Corporate bonds and notes | | — | | | 31,324 | | | — | | | 31,324 | | |
| | | | | | | | | |
| Equity securities | | 21,299 | | | — | | | — | | | 21,299 | | |
Total assets at fair value (2) | | $ | 577,870 | | | $ | 6,263,098 | | | $ | 8,513 | | | $ | 6,849,481 | | |
| | | | | | | | | |
| | | | | | | | | |
| | | | | | | | | |
| | | | | | | | | |
(1)Comprising short-term certificates of deposit and commercial paper.
(2)Does not include other invested assets of $2.0 million that are primarily invested in limited partnership investments valued using the net asset value as a practical expedient.
(3)Embedded derivatives related to our Excess-of-Loss Program are classified as other assets in our consolidated balance sheets. See Note 8 for more information about our reinsurance programs.
(4)Securities loaned to third-party borrowers under securities lending agreements are classified as other assets in our consolidated balance sheets. See Note 6 for more information.
There were no transfers to or from Level III for the years ended December 31, 2021 and 2020. Activity related to Level III assets and liabilities (including realized and unrealized gains and losses, purchases, sales, issuances, settlements and transfers) was immaterial for the years ended December 31, 2021 and 2020.
Valuation Methodologies for Assets Measured at Fair Value
We are responsible for the determination of the value of all investments carried at fair value and the supporting methodologies and assumptions. To assist us in this responsibility, we utilize independent third-party valuation service providers to gather, analyze and interpret market information and estimate fair values based upon relevant methodologies and assumptions for various asset classes and individual securities.
We perform monthly quantitative and qualitative analyses on the prices received from third parties to determine whether the prices are reasonable estimates of fair value. Our analysis includes: (i) a review of the methodology used by third-party pricing services; (ii) a comparison of pricing services’ valuations to other independent sources; (iii) a review of month-to-month price fluctuations; and (iv) a comparison of actual purchase and sale transactions with valuations received from third parties. These processes are designed to ensure that our investment values are accurately recorded, that the data inputs and valuation techniques utilized are appropriate and consistently applied and that the assumptions are reasonable and consistent with the objective of determining fair value.
The following are descriptions of our valuation methodologies for financial assets measured at fair value.
U.S. Government and Agency Securities. The fair value of U.S. government and agency securities is estimated using observed market transactions, including broker-dealer quotes and actual trade activity as a basis for valuation. U.S. government and agency securities are categorized in either Level I or Level II of the fair value hierarchy.
State and Municipal Obligations. The fair value of state and municipal obligations is estimated using recent transaction activity, including market observations. Valuation models are used, which incorporate bond structure, yield curve, credit spreads and other factors. These securities are generally categorized in Level II of the fair value hierarchy or in Level III when market-based transaction activity is unavailable.
| | | | | |
|
Radian Group Inc. and Subsidiaries Notes to Consolidated Financial Statements |
Money Market Instruments. The fair value of money market instruments is based on daily prices, which are published and available to all potential investors and market participants. As such, these securities are categorized in Level I of the fair value hierarchy.
Corporate Bonds and Notes. The fair value of corporate bonds and notes is estimated using recent transaction activity, including market observations. Spread models are used that incorporate issuer and structure characteristics, such as credit risk and early redemption features, where applicable. These securities are generally categorized in Level II of the fair value hierarchy or in Level III when market-based transaction activity is unavailable.
Asset-backed and Mortgage-backed Securities. The fair value of these instruments, which include RMBS, CMBS, CLO, Other ABS and mortgage insurance-linked notes, is estimated based on prices of comparable securities and spreads and observable prepayment speeds. These securities are generally categorized in Level II of the fair value hierarchy or in Level III when market-based transaction activity is unavailable. The fair value of any Level III securities is generally estimated by discounting estimated future cash flows.
Foreign Government and Agency Securities. The fair value of foreign government and agency securities is estimated using observed market yields used to create a maturity curve and observed credit spreads from market makers and broker-dealers. These securities are categorized in Level II of the fair value hierarchy.
Equity Securities. The fair value of these securities is generally estimated using observable market data in active markets or bid prices from market makers and broker-dealers. Generally, these securities are categorized in Level I or II of the fair value hierarchy, as observable market data are readily available. From time to time, certain equity securities may be categorized in Level III of the fair value hierarchy due to a lack of market-based transaction data or the use of model-based valuations.
Other Investments. These securities primarily consist of commercial paper and short-term certificates of deposit, which are categorized in Level II of the fair value hierarchy. The fair value of these investments is estimated using market data for comparable instruments of similar maturity and average yield.
Other Invested Assets. These assets consist of interests in private debt or equity investments. The estimated fair value of these other invested assets is primarily based on the private company’s performance, as well as the terms of the instrument and general market benchmarks. As such, these investments are categorized in Level III of the fair value hierarchy.
Embedded Derivatives. The estimated fair value related to our embedded derivatives generally reflects the present value impact of the variation in investment income on the assets held by the reinsurance trusts and the contractual reference rate used to calculate the reinsurance premiums we will pay. These assets are categorized in Level III of the fair value hierarchy.
Other Fair Value Disclosure
The carrying value and estimated fair value of other selected liabilities not carried at fair value in our consolidated balance sheets were as follows as of the dates indicated.
| | | | | | | | | | | | | | | | | | | | | | | | | | |
| Financial liabilities not carried at fair value | | | | | | | | |
| | | | | | | | |
| | December 31, 2021 | | December 31, 2020 |
| (In thousands) | | Carrying
Amount | | Estimated
Fair Value | | Carrying
Amount | | Estimated
Fair Value |
| Senior notes | | $ | 1,409,473 | | | $ | 1,534,378 | | | $ | 1,405,674 | | | $ | 1,563,503 | |
| FHLB advances | | 150,983 | | | 152,117 | | | 176,483 | | | 179,578 | |
The fair value of our senior notes is estimated based on quoted market prices. The fair value of our FHLB advances is estimated based on expected cash flows for similar borrowings. These liabilities are categorized in Level II of the fair value hierarchy. See Note 12 for further information about these borrowings.
| | | | | |
|
Radian Group Inc. and Subsidiaries Notes to Consolidated Financial Statements |
6. Investments
Available for Sale Securities
Our available for sale securities within our investment portfolio consisted of the following as of the dates indicated.
| | | | | | | | | | | | | | | | | | | | | | | | | | | | | | | | |
| Available for sale securities | | | | | | | | | | |
| | | | | | | | | | |
| | December 31, 2021 |
| (In thousands) | | Amortized
Cost | | Allowance for Credit Losses | | Gross
Unrealized
Gains | | Gross
Unrealized
Losses | | Fair Value |
| Fixed-maturities available for sale | | | | | | | | | | |
| U.S. government and agency securities | | $ | 221,407 | | | $ | — | | | $ | 1,719 | | | $ | (1,396) | | | $ | 221,730 | |
| State and municipal obligations | | 162,964 | | | — | | | 14,694 | | | (401) | | | 177,257 | |
| Corporate bonds and notes | | 2,867,063 | | | — | | | 133,665 | | | (24,886) | | | 2,975,842 | |
| RMBS | | 697,581 | | | — | | | 14,313 | | | (6,777) | | | 705,117 | |
| CMBS | | 690,827 | | | — | | | 21,444 | | | (3,068) | | | 709,203 | |
| CLO | | 529,906 | | | — | | | 1,032 | | | (898) | | | 530,040 | |
| Other ABS | | 210,657 | | | — | | | 1,142 | | | (612) | | | 211,187 | |
| Foreign government and agency securities | | 5,109 | | | — | | | 187 | | | — | | | 5,296 | |
Mortgage insurance-linked notes (1) | | 45,384 | | | — | | | 1,633 | | | — | | | 47,017 | |
| Total securities available for sale, including loaned securities | | 5,430,898 | | | $ | — | | | $ | 189,829 | | | $ | (38,038) | | | 5,582,689 | |
Less: loaned securities (2) | | 63,169 | | | | | | | | | 65,611 | |
| Total fixed-maturities available for sale | | $ | 5,367,729 | | | | | | | | | $ | 5,517,078 | |
(1)Comprises the notes purchased by Radian Group in connection with the Excess-of-Loss Program. See Note 8 for more information about our reinsurance programs. (2)Included in other assets in our consolidated balance sheets as further described below. See below for a discussion of our securities lending agreements. |
| | December 31, 2020 |
| (In thousands) | | Amortized
Cost | | Allowance for Credit Losses | | Gross
Unrealized
Gains | | Gross
Unrealized
Losses | | Fair Value |
Fixed-maturities available for sale | | | | | | | | | | |
| U.S. government and agency securities | | $ | 176,033 | | | $ | — | | | $ | 1,677 | | | $ | (3,611) | | | $ | 174,099 | |
| State and municipal obligations | | 149,258 | | | — | | | 16,113 | | | (100) | | | 165,271 | |
| Corporate bonds and notes | | 2,832,350 | | | (948) | | | 250,771 | | | (3,758) | | | 3,078,415 | |
| RMBS | | 799,814 | | | — | | | 34,439 | | | (314) | | | 833,939 | |
| CMBS | | 645,071 | | | — | | | 39,495 | | | (3,301) | | | 681,265 | |
| CLO | | 569,173 | | | — | | | 2,026 | | | (2,641) | | | 568,558 | |
| Other ABS | | 249,988 | | | — | | | 2,901 | | | (432) | | | 252,457 | |
| Foreign government and agency securities | | 5,100 | | | — | | | 338 | | | — | | | 5,438 | |
| Total securities available for sale, including loaned securities | | 5,426,787 | | | $ | (948) | | | $ | 347,760 | | | $ | (14,157) | | | 5,759,442 | |
Less: loaned securities (1) | | 33,164 | | | | | | | | | 36,102 | |
| Total fixed-maturities available for sale | | $ | 5,393,623 | | | | | | | | | $ | 5,723,340 | |
(1)Included in other assets in our consolidated balance sheets as further described below. See below for a discussion of our securities lending agreements. |
The following table provides a rollforward of the allowance for credit losses on fixed-maturities available for sale, which relates entirely to corporate bonds and notes for the periods indicated.
| | | | | |
|
Radian Group Inc. and Subsidiaries Notes to Consolidated Financial Statements |
| | | | | | | | | | | | | | |
| Rollforward of allowance for credit losses on fixed-maturities available for sale |
| | | | |
| | Years Ended December 31, |
| (In thousands) | | 2021 | | 2020 |
| Beginning balance | | $ | 948 | | | $ | — | |
| Current provision for securities without prior allowance | | — | | | 1,254 | |
| Net increases (decreases) in allowance on previously impaired securities | | (918) | | | — | |
| Reduction for securities sold | | (30) | | | (306) | |
| Ending balance | | $ | — | | | $ | 948 | |
Gross Unrealized Losses and Related Fair Value of Available for Sale Securities
For securities deemed “available for sale” that are in an unrealized loss position and for which an allowance for credit loss has not been established, the following tables show the gross unrealized losses and fair value, aggregated by investment category and length of time that individual securities have been in a continuous unrealized loss position, as of the dates indicated. Included in the amounts as of December 31, 2021 and 2020, are loaned securities under securities lending agreements that are classified as other assets in our consolidated balance sheets, as further described below.
| | | | | | | | | | | | | | | | | | | | | | | | | | | | | | | | | | | | | | | | | | | | | | | | | | | | | | | | |
| Unrealized losses on fixed-maturities available for sale by category and length of time |
| | | | | | | | | | | | | | | | | | |
| | December 31, 2021 |
| ($ in thousands) | Less Than 12 Months | | 12 Months or Greater | | Total |
Description of
Securities | | # of
securities | | Fair
Value | | Unrealized
Losses | | # of
securities | | Fair
Value | | Unrealized
Losses | | # of
securities | | Fair
Value | | Unrealized
Losses |
| U.S. government and agency securities | | 14 | | | $ | 101,602 | | | $ | (1,165) | | | 2 | | | $ | 6,937 | | | $ | (231) | | | 16 | | | $ | 108,539 | | | $ | (1,396) | |
| State and municipal obligations | | 20 | | | 32,721 | | | (401) | | | — | | | — | | | — | | | 20 | | | 32,721 | | | (401) | |
| Corporate bonds and notes | | 209 | | | 864,355 | | | (16,799) | | | 34 | | | 99,475 | | | (8,087) | | | 243 | | | 963,830 | | | (24,886) | |
| RMBS | | 57 | | | 365,476 | | | (6,749) | | | 3 | | | 1,543 | | | (28) | | | 60 | | | 367,019 | | | (6,777) | |
| CMBS | | 81 | | | 188,457 | | | (2,053) | | | 9 | | | 22,050 | | | (1,015) | | | 90 | | | 210,507 | | | (3,068) | |
| CLO | | 84 | | | 313,380 | | | (675) | | | 11 | | | 35,612 | | | (223) | | | 95 | | | 348,992 | | | (898) | |
| Other ABS | | 54 | | | 138,851 | | | (603) | | | 1 | | | 631 | | | (9) | | | 55 | | | 139,482 | | | (612) | |
| | | | | | | | | | | | | | | | | | |
| Total | | 519 | | | $ | 2,004,842 | | | $ | (28,445) | | | 60 | | | $ | 166,248 | | | $ | (9,593) | | | 579 | | | $ | 2,171,090 | | | $ | (38,038) | |
| | | | | |
|
Radian Group Inc. and Subsidiaries Notes to Consolidated Financial Statements |
| | | | | | | | | | | | | | | | | | | | | | | | | | | | | | | | | | | | | | | | | | | | | | | | | | | | | | | | |
| | December 31, 2020 |
| ($ in thousands) | Less Than 12 Months | | 12 Months or Greater | | Total |
Description of
Securities | | # of
securities | | Fair
Value | | Unrealized
Losses | | # of
securities | | Fair
Value | | Unrealized
Losses | | # of
securities | | Fair
Value | | Unrealized
Losses |
| U.S. government and agency securities | | 4 | | | $ | 90,591 | | | $ | (3,611) | | | — | | | $ | — | | | $ | — | | | 4 | | | $ | 90,591 | | | $ | (3,611) | |
| State and municipal obligations | | 4 | | | 9,626 | | | (100) | | | — | | | — | | | — | | | 4 | | | 9,626 | | | (100) | |
| Corporate bonds and notes | | 60 | | | 174,848 | | | (3,758) | | | — | | | — | | | — | | | 60 | | | 174,848 | | | (3,758) | |
| RMBS | | 5 | | | 42,003 | | | (305) | | | 2 | | | 915 | | | (9) | | | 7 | | | 42,918 | | | (314) | |
| CMBS | | 43 | | | 118,345 | | | (3,035) | | | 6 | | | 8,312 | | | (266) | | | 49 | | | 126,657 | | | (3,301) | |
| CLO | | 52 | | | 173,459 | | | (970) | | | 25 | | | 137,506 | | | (1,671) | | | 77 | | | 310,965 | | | (2,641) | |
| Other ABS | | 26 | | | 70,759 | | | (322) | | | 3 | | | 12,119 | | | (110) | | | 29 | | | 82,878 | | | (432) | |
| | | | | | | | | | | | | | | | | | |
| | | | | | | | | | | | | | | | | | |
| Total | | 194 | | | $ | 679,631 | | | $ | (12,101) | | | 36 | | | $ | 158,852 | | | $ | (2,056) | | | 230 | | | $ | 838,483 | | | $ | (14,157) | |
See “—Net Gains on Investments” below for additional details on our net gains (losses) on investments, including the changes in the allowance for credit losses on fixed-maturities available for sale and other impairments due to our intent to sell securities in an unrealized loss position. See Note 2 for a discussion of our accounting policy for impairments.
Securities Lending Agreements
We participate in a securities lending program whereby we loan certain securities in our investment portfolio to third-party borrowers for short periods of time. These securities lending agreements are collateralized financing arrangements whereby we transfer securities to third parties through an intermediary in exchange for cash or other securities. However, pursuant to the terms of these agreements, we maintain effective control over all loaned securities. Although we report such securities at fair value within other assets in our consolidated balance sheets, rather than in investments, the detailed information provided in this Note includes these securities. See Note 9 for additional information.
Under our securities lending agreements, the borrower is required to provide to us collateral, consisting of cash or securities, in amounts generally equal to or exceeding: (i) 102% of the value of the loaned securities (105% in the case of foreign securities) or (ii) another agreed-upon percentage not less than 100% of the market value of the loaned securities. Any cash collateral we receive may be invested in liquid assets. Cash collateral, which is reinvested for our benefit by the intermediary in accordance with the investment guidelines contained in the securities lending and collateral agreements, is reflected in short-term investments, with an offsetting liability recognized in other liabilities for the obligation to return the cash collateral. Securities collateral we receive is held on deposit for the borrower’s benefit and we may not transfer or loan such securities collateral unless the borrower is in default. Therefore, such securities collateral is not reflected in our consolidated financial statements given that the risks and rewards of ownership are not transferred to us from the borrowers.
Fees received and paid in connection with securities lending agreements are recorded in net investment income and interest expense, respectively, on the consolidated statements of operations.
All of our securities lending agreements are classified as overnight and revolving. Securities collateral on deposit with us from third-party borrowers totaling $57.8 million and $43.3 million as of December 31, 2021 and December 31, 2020, respectively, may not be transferred or re-pledged unless the third-party borrower is in default, and is therefore not reflected in our consolidated financial statements.
| | | | | |
|
Radian Group Inc. and Subsidiaries Notes to Consolidated Financial Statements |
Net Investment Income
Net investment income consisted of the following.
| | | | | | | | | | | | | | | | | | | | |
| Net investment income | | | | | | |
| | | | | | |
| | Years Ended December 31, |
| (In thousands) | | 2021 | | 2020 | | 2019 |
| Investment income | | | | | | |
| Fixed-maturities | | $ | 145,613 | | | $ | 148,127 | | | $ | 155,104 | |
| Equity securities | | 8,158 | | | 6,378 | | | 7,028 | |
| Short-term investments | | 817 | | | 5,774 | | | 17,255 | |
| Other | | 368 | | | 354 | | | 545 | |
| Gross investment income | | 154,956 | | | 160,633 | | | 179,932 | |
| Investment expenses | | (7,047) | | | (6,596) | | | (8,136) | |
| Net investment income | | $ | 147,909 | | | $ | 154,037 | | | $ | 171,796 | |
Net Gains on Investments
Net gains on investments consisted of the following.
| | | | | | | | | | | | | | | | | | | | | |
| Net gains on investments | | | | | | | |
| | | | | | | |
| | Years Ended December 31, | |
| (In thousands) | | 2021 |
| 2020 |
| 2019 | |
| Net realized gains (losses) | | | | | | | |
Fixed-maturities available for sale (1) | | $ | 5,661 | | | $ | 34,869 | | | $ | 11,262 | | |
| Trading securities | | 390 | | | 4 | | | (303) | | |
| Equity securities | | 10,820 | | | 353 | | | (719) | | |
| Other investments | | 3,971 | | | 600 | | | 603 | | |
| Net realized gains on investments | | 20,842 | | | 35,826 | | | 10,843 | | |
| Impairment losses due to intent to sell | | — | | | (1,401) | | | — | | |
| Net decrease (increase) in expected credit losses | | 918 | | | (1,254) | | | — | | |
| Net unrealized gains (losses) on investments | | (4,661) | | | 10,960 | | | 33,220 | | |
| Total net gains on investments | | $ | 17,099 | | | $ | 44,131 | | | $ | 44,063 | | |
(1)Components of net realized gains (losses) on fixed-maturities available for sale include the following.
| | | | | | | | | | | | | | | | | | | | |
| | Years Ended December 31, |
| (In thousands) | | 2021 | | 2020 | | 2019 |
| Gross investment gains from sales and redemptions | | $ | 22,766 | | | $ | 37,431 | | | $ | 17,663 | |
| Gross investment losses from sales and redemptions | | (17,105) | | | (2,562) | | | (6,401) | |
| | | | | |
|
Radian Group Inc. and Subsidiaries Notes to Consolidated Financial Statements |
The net changes in unrealized gains (losses) recognized in earnings on investments that were still held at each period-end were as follows.
| | | | | | | | | | | | | | | | | | | | |
| Net changes in unrealized gains (losses) on investments still held | | | | | | |
| | | | | | |
| | Years Ended December 31, |
| (In thousands) | | 2021 | | 2020 | | 2019 |
| Net unrealized gains (losses) on investments still held | | | | | | |
| Trading securities | | $ | (7,330) | | | $ | 10,583 | | | $ | 16,346 | |
| Equity securities | | 10,210 | | | 1,759 | | | 11,906 | |
| Other investments | | 1,173 | | | 248 | | | (174) | |
| Net unrealized gains (losses) on investments still held | | $ | 4,053 | | | $ | 12,590 | | | $ | 28,078 | |
Contractual Maturities
The contractual maturities of fixed-maturities available for sale were as follows.
| | | | | | | | | | | | | | |
| Contractual maturities of fixed-maturities available for sale | | | | |
| | | | |
| | December 31, 2021 |
| (In thousands) | | Amortized Cost | | Fair Value |
| Due in one year or less | | $ | 182,884 | | | $ | 183,770 | |
Due after one year through five years (1) | | 1,116,102 | | | 1,150,676 | |
Due after five years through 10 years (1) | | 1,191,992 | | | 1,228,959 | |
Due after 10 years (1) | | 765,565 | | | 816,720 | |
Asset-backed and mortgage-backed securities (2) | | 2,174,355 | | | 2,202,564 | |
| Total | | 5,430,898 | | | 5,582,689 | |
| Less: loaned securities | | 63,169 | | | 65,611 | |
| Total fixed-maturities available for sale | | $ | 5,367,729 | | | $ | 5,517,078 | |
(1)Actual maturities may differ as a result of calls before scheduled maturity.
(2)Includes RMBS, CMBS, CLO, Other ABS and mortgage insurance-linked notes, which are not due at a single maturity date.
Other
For the years ended December 31, 2021, 2020 and 2019, we did not transfer any securities to or from the available for sale or trading categories.
Our fixed-maturities available for sale include securities totaling $14.3 million and $16.9 million at December 31, 2021 and 2020, respectively, on deposit and serving as collateral with various state regulatory authorities. Our fixed-maturities available for sale and trading securities also include securities serving as collateral for our FHLB advances. See Note 12 for additional information about our FHLB advances.
7. Goodwill and Other Acquired Intangible Assets, Net
All of our goodwill and other acquired intangible assets relate to our homegenius segment. There was no change to our goodwill balance of $9.8 million during the years ended December 31, 2021 and 2020.
The following is a summary of the gross and net carrying amounts and accumulated amortization (including impairment) of our other acquired intangible assets as of the periods indicated.
| | | | | |
|
Radian Group Inc. and Subsidiaries Notes to Consolidated Financial Statements |
| | | | | | | | | | | | | | | | | | | | | | | | | | | | | | | | | | | | | | |
| Other acquired intangible assets |
| | | | | | | | | | | | |
| | December 31, 2021 | | December 31, 2020 |
| (In thousands) | | Gross Carrying Amount | | Accumulated Amortization | | Net Carrying Amount | | Gross Carrying Amount | | Accumulated Amortization | | Net Carrying Amount |
| Client relationships | | $ | 43,550 | | | $ | (34,620) | | | $ | 8,930 | | | $ | 43,550 | | | $ | (31,559) | | | $ | 11,991 | |
| Technology | | 8,285 | | | (7,675) | | | 610 | | | 8,285 | | | (7,370) | | | 915 | |
| Licenses | | 463 | | | (212) | | | 251 | | | 463 | | | (128) | | | 335 | |
| | | | | | | | | | | | |
| | | | | | | | | | | | |
| | | | | | | | | | | | |
| Total | | $ | 52,298 | | | $ | (42,507) | | | $ | 9,791 | | | $ | 52,298 | | | $ | (39,057) | | | $ | 13,241 | |
For the years ended December 31, 2021, 2020 and 2019, amortization expense (including impairment) was $3.4 million, $5.1 million and $8.6 million, respectively. The estimated amortization expense for 2022 and thereafter is as follows.
| | | | | | | | |
| Estimated amortization expense | | |
| | |
| (In thousands) | | Estimated Amortization Expense |
| 2022 | | $ | 3,397 | |
| 2023 | | 3,361 | |
| 2024 | | 3,033 | |
| | |
| | |
| Thereafter | | — | |
| Total | | $ | 9,791 | |
Impairment Analysis
As part of our 2021 annual goodwill impairment assessment performed during the fourth quarter, we estimated the fair value of the reporting unit using primarily an income approach. The key factor in our fair value analysis was forecasted future cash flows. We considered both positive and negative factors and concluded that, after considering all of the factors and evidence available, there was no impairment of goodwill indicated as of the measurement date because the estimated fair value of the reporting unit exceeded our carrying amount. Additionally, there was no impairment indicated for the remaining other acquired intangible assets as of December 31, 2021.
Based primarily on the wind down of our traditional appraisal business in the fourth quarter of 2020, we recognized impairments of $1.0 million and $0.3 million related to client relationships and technology, respectively, as of December 31, 2020.
In January 2020, we completed the sale of Clayton, through which we provided mortgage services related to loan acquisition, RMBS securitization and distressed asset reviews and servicer and loan surveillance services. We recognized an impairment charge of $4.8 million for goodwill allocated to the Clayton asset group and an impairment of other acquired intangible assets for $13.7 million as of December 31, 2019.
8. Reinsurance
In our mortgage insurance and title insurance businesses, we use reinsurance as part of our risk distribution strategy, including to manage our capital position and risk profile. The reinsurance arrangements for our mortgage insurance business include premiums ceded under the QSR Program, the Single Premium QSR Program and the Excess-of-Loss Program. The amount of credit that we receive under the PMIERs financial requirements for our third-party reinsurance transactions is subject to ongoing review and approval by the GSEs.
| | | | | |
|
Radian Group Inc. and Subsidiaries Notes to Consolidated Financial Statements |
The effect of all of our reinsurance programs on our net income is as follows.
| | | | | | | | | | | | | | | | | | | | | | | | | | | | | | | | | | | | | | | | | |
Reinsurance impacts on net premiums written and earned | |
| | | | | | | | | | | | | |
| | Net Premiums Written | | Net Premiums Earned | |
| | Years Ended December 31, | | Years Ended December 31, | |
| (In thousands) | | 2021 | | 2020 | | 2019 | | 2021 | | 2020 | | 2019 | |
| Direct | | | | | | | | | | | | | |
| Mortgage insurance | | $ | 984,995 | | | $ | 1,085,670 | | | $ | 1,120,996 | | | $ | 1,104,696 | | | $ | 1,263,684 | | | $ | 1,233,528 | | (1) |
| Title insurance | | 39,665 | | | 22,843 | | | 11,342 | | | 39,665 | | | 22,843 | | | 11,342 | | |
| Total direct | | 1,024,660 | | | 1,108,513 | | | 1,132,338 | | | 1,144,361 | | | 1,286,527 | | | 1,244,870 | | (1) |
Assumed (2) | | | | | | | | | | | | | |
| Mortgage insurance | | 7,066 | | | 12,197 | | | 10,379 | | | 7,066 | | | 12,214 | | | 10,382 | | |
| | | | | | | | | | | | | |
| | | | | | | | | | | | | |
| Ceded | | | | | | | | | | | | | |
Mortgage insurance (3) | | (47,515) | | | (86,912) | | | (55,925) | | | (113,480) | | | (183,131) | | | (109,696) | | (1) |
| Title insurance | | (764) | | | (289) | | | (207) | | | (764) | | | (289) | | | (207) | | |
Total ceded (3) | | (48,279) | | | (87,201) | | | (56,132) | | | (114,244) | | | (183,420) | | | (109,903) | | (1) |
| Total net premiums | | $ | 983,447 | | | $ | 1,033,509 | | | $ | 1,086,585 | | | $ | 1,037,183 | | | 1,115,321 | | | $ | 1,145,349 | | (1) |
(1)Includes a cumulative adjustment to unearned premiums related to an update to the amortization rates used to recognize revenue for Single Premium Policies. See Note 2 for further information.
(2)Primarily includes premiums from our participation in certain credit risk transfer programs.
(3)Net of profit commission, which is impacted by the level of ceded losses recoverable, if any, on reinsurance transactions. See Note 11 for additional information on our reserve for losses and reinsurance recoverables.
| | | | | | | | | | | | | | | | | | | | |
| Other reinsurance impacts | | | | | | |
| | | | | | |
| | Years Ended December 31, |
| (In thousands) | | 2021 | | 2020 | | 2019 |
Ceding commissions earned (1) | | $ | 31,745 | | | $ | 53,654 | | | $ | 48,659 | |
Ceded losses (2) | | (4,570) | | | 58,266 | | | 5,859 | |
(1)Ceding commissions earned are primarily related to mortgage insurance and are included as an offset to expenses primarily in other operating expenses on our consolidated statements of operations. Deferred ceding commissions of $38.6 million and $52.5 million are included in other liabilities on our consolidated balance sheets at December 31, 2021 and 2020, respectively.
(2)Primarily all related to mortgage insurance.
Single Premium QSR Program
Radian Guaranty entered into each of the 2016 Single Premium QSR Agreement, 2018 Single Premium QSR Agreement and 2020 Single Premium QSR Agreement with panels of third-party reinsurers to cede a contractual quota share percent of our Single Premium NIW as of the effective date of each agreement (as set forth in the table below), subject to certain conditions. Radian Guaranty receives a ceding commission for ceded premiums written pursuant to these transactions. Radian Guaranty also receives a profit commission annually, provided that the loss ratio on the loans covered under the agreement generally remains below the applicable prescribed thresholds. Losses on the ceded risk up to this level reduce Radian Guaranty’s profit commission on a dollar-for-dollar basis.
Each of the agreements is subject to a scheduled termination date as set forth in the table below; however, Radian Guaranty has the option, based on certain conditions and subject to a termination fee, to terminate any of the agreements at the end of any calendar quarter on or after the applicable optional termination date. If Radian Guaranty exercises this option in the future, it would result in Radian Guaranty reassuming the related RIF in exchange for a net payment to the reinsurer calculated in accordance with the terms of the applicable agreement. Radian Guaranty also may terminate any of the agreements prior to the applicable scheduled termination date under certain circumstances, including if one or both of the GSEs no longer grant full PMIERs capital relief for the reinsurance.
As of January 1, 2022, Radian Guaranty is no longer ceding NIW under the Single Premium QSR Program.
| | | | | |
|
Radian Group Inc. and Subsidiaries Notes to Consolidated Financial Statements |
The following table sets forth additional details regarding the Single Premium QSR Program.
| | | | | | | | | | | | | | | | | | | | |
| Single Premium QSR Program | | | | | | |
| | | | | | |
| | 2020 Single Premium QSR Agreement | | 2018 Single Premium QSR Agreement | | 2016 Single Premium QSR Agreement |
| | | | | | |
| NIW policy dates | | Jan 1, 2020-Dec 31, 2021 | | Jan 1, 2018-Dec 31, 2019 | | Jan 1, 2012-Dec 31, 2017 |
| Effective date | | January 1, 2020 | | January 1, 2018 | | January 1, 2016 |
| Scheduled termination date | | December 31, 2031 | | December 31, 2029 | | December 31, 2027 |
| Optional termination date | | January 1, 2024 | | January 1, 2022 | | January 1, 2020 |
| Quota share % | | 65% | | 65% | | 20% - 65% (1) |
| Ceding commission % | | 25% | | 25% | | 25% |
| Profit commission % | | Up to 56% | | Up to 56% | | Up to 55% |
| | | | | | | |
| (In millions) | | As of December 31, 2021 |
| RIF ceded | | $ | 2,198 | | | $ | 1,117 | | | $ | 1,913 | |
| | | | | | | |
| (In millions) | | As of December 31, 2020 |
| RIF ceded | | $ | 1,597 | | | $ | 1,979 | | | $ | 3,071 | |
(1)Effective December 31, 2017, we amended the 2016 Single Premium QSR Agreement to increase the amount of ceded risk on performing loans under the agreement from 35% to 65% for the 2015 through 2017 vintages. Loans included in the 2012 through 2014 vintages, and any other loans subject to the agreement that were delinquent at the time of the amendment, were unaffected by the change and therefore the amount of ceded risk for those loans continues to range from 20% to 35%.
Excess-of-Loss Program
Radian Guaranty has entered into six fully collateralized reinsurance arrangements with the Eagle Re Issuers. For the respective coverage periods, Radian Guaranty retains the first-loss layer of aggregate losses, as well as any losses in excess of the outstanding reinsurance coverage amounts. The Eagle Re Issuers provide second layer coverage up to the outstanding coverage amounts. For each of these six reinsurance arrangements, the Eagle Re Issuers financed their coverage by issuing mortgage insurance-linked notes to eligible capital markets investors in unregistered private offerings. The aggregate excess-of-loss reinsurance coverage for these arrangements decreases over the maturity period of the mortgage insurance-linked notes (either a 10-year or 12.5-year period depending on the transaction) as the principal balances of the underlying covered mortgages decrease and as any claims are paid by the applicable Eagle Re Issuer or the mortgage insurance is canceled. Radian Guaranty has rights to terminate the reinsurance agreements upon the occurrence of certain events.
Under each of the reinsurance agreements, the outstanding reinsurance coverage amount will begin amortizing after an initial period in which a target level of credit enhancement is obtained and will stop amortizing if certain thresholds, or triggers, are reached, including a delinquency trigger event based on an elevated level of delinquencies as defined in the related insurance-linked notes transaction agreements. With the exception of insurance-linked notes issued by Eagle Re 2020-2 Ltd., Eagle Re 2021-1 Ltd. and Eagle Re 2021-2 Ltd., the insurance-linked notes issued by the Eagle Re Issuers in connection with our Excess-of-Loss Program are currently subject to a delinquency trigger event, which was first reported to the insurance-linked note investors on June 25, 2020. For the insurance-linked notes that are subject to a delinquency trigger event, both the amortization of the outstanding reinsurance coverage amount pursuant to our reinsurance arrangements with the Eagle Re Issuers and the amortization of the principal amount of the related insurance-linked notes issued by the Eagle Re Issuers have been suspended and will continue to be suspended during the pendency of the trigger event.
| | | | | |
|
Radian Group Inc. and Subsidiaries Notes to Consolidated Financial Statements |
The following tables set forth additional details regarding the Excess-of-Loss Program as of December 31, 2021 and December 31, 2020.
| | | | | | | | | | | | | | | | | | | | | | | | | | | | | | | | | | | | | | | | | | | | | | | | | | | | | | | | |
| Excess-of-Loss Program |
| | | | | | | | | | | | | | | | | | |
| (In millions) | | Eagle Re 2021-2 Ltd. | | Eagle Re 2021-1 Ltd. | | Eagle Re 2020-2 Ltd. | | Eagle Re 2020-1 Ltd. | | Eagle Re 2019-1 Ltd. | | Eagle Re 2018-1 Ltd. |
| Issued | | November
2021 | | April
2021 | | October
2020 | | February
2020 | | April
2019 | | November
2018 |
| NIW policy dates | | Jan 1, 2021-
Jul 31, 2021 | | Aug 1, 2020-
Dec 31, 2020 | | Oct 1, 2019-
Jul 31, 2020 | | Jan 1, 2019-
Sep 30, 2019 | | Jan 1, 2018-
Dec 31, 2018 | | Jan 1, 2017-
Dec 31, 2017 |
| Initial RIF | | $ | 10,758 | | | | $ | 11,061 | | | | $ | 13,011 | | | | $ | 9,866 | | | | $ | 10,705 | | | | $ | 9,109 | | |
| Initial coverage | | 484 | | | | 498 | | (1) | | 390 | | | | 488 | | | | 562 | | | | 434 | | (2) |
| Initial first layer retention | | 242 | | | | 221 | | | | 423 | | | | 202 | | | | 268 | | | | 205 | | |
| | | | | | | | | | | | | | | | | | |
| (In millions) | | As of December 31, 2021 |
| RIF | | $ | 10,379 | | | | $ | 9,496 | | | | $ | 7,623 | | | | $ | 3,241 | | | | $ | 2,429 | | | | $ | 2,117 | | |
| Remaining coverage | | 484 | | | | 498 | | | | 144 | | | | 488 | | | | 385 | | | | 276 | | |
| First layer retention | | 242 | | | | 221 | | | | 423 | | | | 202 | | | | 264 | | | | 201 | | |
| | | | | | | | | | | | | | | | | | |
| (In millions) | | As of December 31, 2020 |
| RIF | | $ | — | | | | $ | — | | | | $ | 11,748 | | | | $ | 6,121 | | | | $ | 4,657 | | | | $ | 3,986 | | |
| Remaining coverage | | — | | | | — | | | | 390 | | | | 488 | | | | 385 | | | | 276 | | (2) |
| First layer retention | | — | | | | — | | | | 423 | | | | 202 | | | | 265 | | | | 201 | | |
(1)Radian Group purchased $45.4 million original principal amount of these mortgage insurance-linked notes, which are included in fixed-maturities available for sale on our consolidated balance sheet at December 31, 2021. See Notes 5 and 6 for additional information.
(2)Excludes a separate excess-of-loss reinsurance agreement entered into by Radian Guaranty with coverage of $21.4 million. This agreement was terminated in December 2021.
The Eagle Re Issuers are not subsidiaries or affiliates of Radian Guaranty. Based on the accounting guidance that addresses VIEs, we have not consolidated any of the assets and liabilities of the Eagle Re Issuers in our financial statements, because Radian does not have: (i) the power to direct the activities that most significantly affect the Eagle Re Issuers’ economic performances or (ii) the obligation to absorb losses or the right to receive benefits from the Eagle Re Issuers that potentially could be significant to the Eagle Re Issuers. See Note 2 for more information on our accounting treatment of VIEs.
The reinsurance premium due to the Eagle Re Issuers is calculated by multiplying the outstanding reinsurance coverage amount at the beginning of a period by a coupon rate, which is the sum of one-month LIBOR (or an acceptable alternative to LIBOR) or SOFR, as applicable, plus a contractual risk margin, and then subtracting actual investment income collected on the assets in the reinsurance trust during the preceding month. As a result, the premiums we pay will vary based on: (i) the spread between LIBOR (or an acceptable alternative to LIBOR) or SOFR, as provided in each applicable reinsurance agreement, and the rates on the investments held by the reinsurance trust and (ii) the outstanding amount of reinsurance coverage.
As the reinsurance premium will vary based on changes in these rates, we concluded that the reinsurance agreements contain embedded derivatives, which we have accounted for separately as freestanding derivatives and recorded in other assets or other liabilities on our consolidated balance sheets. Changes in the fair value of these embedded derivatives are recorded in net gains (losses) on investments and other financial instruments in our consolidated statements of operations. See Note 5 for more information on our fair value measurements of financial instruments, including our embedded derivatives.
In the event an Eagle Re Issuer is unable to meet its future obligations to us, if any, our insurance subsidiaries would be liable to make claims payments to our policyholders. In the event that all of the assets in the reinsurance trust (consisting of U.S. government money market funds, cash or U.S. Treasury securities) become worthless and the Eagle Re Issuer is unable to make its payments to us, our maximum potential loss would be the amount of mortgage insurance claim payments for losses on the insured policies, net of the aggregate reinsurance payments already received, up to the full aggregate excess-of-loss reinsurance coverage amount. In the same scenario, the related embedded derivative would no longer have value.
| | | | | |
|
Radian Group Inc. and Subsidiaries Notes to Consolidated Financial Statements |
The Eagle Re Issuers represent our only VIEs as of December 31, 2021 and December 31, 2020. The following table presents the total assets and liabilities of the Eagle Re Issuers as of the dates indicated.
| | | | | | | | | | | | | | |
Total VIE assets and liabilities of Eagle Re Issuers (1) | | | | |
| | | | |
| | December 31, |
| (In thousands) | | 2021 | | 2020 |
| Eagle Re 2021-2 Ltd. | | $ | 484,122 | | | $ | — | |
| Eagle Re 2021-1 Ltd. | | 497,735 | | | — | |
| Eagle Re 2020-2 Ltd. | | 143,986 | | | 390,324 | |
| Eagle Re 2020-1 Ltd. | | 488,385 | | | 488,385 | |
| Eagle Re 2019-1 Ltd. | | 384,602 | | | 384,602 | |
| Eagle Re 2018-1 Ltd. | | 275,718 | | | 275,718 | |
| Total | | $ | 2,274,548 | | | $ | 1,539,029 | |
(1)Assets held by the Eagle Re Issuers are required to be invested in U.S. government money market funds, cash or U.S. Treasury securities. Liabilities of the Eagle Re Issuers consist of their mortgage insurance-linked notes described above. Assets and liabilities are equal to each other for each of the Eagle Re Issuers.
QSR Program
In 2012, Radian Guaranty entered into the QSR Program with a third-party reinsurance provider. Radian Guaranty has ceded the maximum amount permitted under the QSR Program and is no longer ceding NIW under this program. RIF ceded under the QSR Program was $207.1 million and $381.8 million as of December 31, 2021 and 2020, respectively.
Other Collateral
Although we use reinsurance as one of our risk management tools, reinsurance does not relieve us of our obligations to our policyholders. In the event the reinsurers are unable to meet their obligations to us, our insurance subsidiaries would be liable for any defaulted amounts. However, consistent with the PMIERs reinsurer counterparty collateral requirements, Radian Guaranty’s reinsurers have established trusts to help secure our potential cash recoveries. In addition to the total VIE assets of the Eagle Re Issuers discussed above, the amount held in reinsurance trusts was $167.9 million as of December 31, 2021, compared to $228.6 million as of December 31, 2020. In addition, for the Single Premium QSR Program, Radian Guaranty holds amounts related to ceded premiums written to collateralize the reinsurers’ obligations, which is reported in reinsurance funds withheld on our consolidated balance sheets. Any loss recoveries and profit commissions paid to Radian Guaranty related to the Single Premium QSR Program are expected to be realized from this account.
9. Other Assets
The following table shows the components of other assets as of the dates indicated.
| | | | | | | | | | | | | | |
| Other assets | | | | |
| | | | |
| | December 31, |
| (In thousands) | | 2021 | | 2020 |
Prepaid federal income taxes (Note 10) | | $ | 354,123 | | | $ | 210,889 | |
Prepaid reinsurance premiums (1) | | 201,674 | | | 267,638 | |
Company-owned life insurance (2) | | 113,386 | | | 115,586 | |
Loaned securities (Notes 5 and 6) | | 103,996 | | | 57,499 | |
Right-of-use assets (Note 13) | | 31,878 | | | 32,985 | |
| Other | | 32,246 | | | 30,488 | |
| Total other assets | | $ | 837,303 | | | $ | 715,085 | |
(1)Relates primarily to our Single Premium QSR Program.
(2)We are the beneficiary of insurance policies on the lives of certain of our current and past officers and employees. The balances reported in other assets reflect the amounts that could be realized upon surrender of the insurance policies as of each respective date.
| | | | | |
|
Radian Group Inc. and Subsidiaries Notes to Consolidated Financial Statements |
Right-of-Use Assets
We assess our various asset groups, which include right-of-use assets, for changes in grouping and for potential impairment when certain events occur or when there are changes in circumstances, including potential alternative uses. If circumstances require a change in asset groupings or a right-of-use asset to be tested for possible impairment, and the carrying value of the right-of-use asset is not recoverable on an undiscounted cash flow basis, an impairment is recognized to the extent that the carrying value exceeds its fair value.
During the second quarter of 2021, in response to the COVID-19 pandemic and our successful transition to a virtual work environment, we made the decision to exit, and to actively market for sublease, all office space in our former corporate headquarters in downtown Philadelphia. As part of this change, we entered into two new leases with overall reduced square footage, including our new corporate headquarters, effective September 2021, in Wayne, Pennsylvania and a Cherry Hill, New Jersey location.
As a result, during the three months ended June 30, 2021, we recognized an impairment of $3.5 million related to our former corporate headquarters leases, reducing the carrying value of certain lease assets and the related property and equipment to its estimated fair value. The right-of-use asset fair value was estimated using an income approach based on forecasted future cash flows expected to be derived from the property based on current sublease market rent, which could differ from actual results and require us to revise our initial estimates. Following this impairment, which was recorded within other operating expenses in our consolidated statements of operations, the aggregate carrying value of the right-of-use assets and leasehold improvements related to the former corporate headquarters leases that we plan to sublease was $26.4 million as of December 31, 2021.
10. Income Taxes
Income Tax Provision
The components of our consolidated income tax provision from continuing operations are as follows.
| | | | | | | | | | | | | | | | | | | | |
| Income tax provision | | | | | | |
| | | | | | |
| | Years Ended December 31, |
| (In thousands) | | 2021 | | 2020 | | 2019 |
| Current provision (benefit) | | $ | 2,368 | | | $ | (16,264) | | | $ | 19,522 | |
| Deferred provision | | 161,793 | | | 102,079 | | | 157,162 | |
| Total income tax provision | | $ | 164,161 | | | $ | 85,815 | | | $ | 176,684 | |
The reconciliation of taxes computed at the statutory tax rate of 21% in 2021, 2020 and 2019 to the provision for income taxes is as follows.
| | | | | | | | | | | | | | | | | | | | |
| Reconciliation of provision for income taxes | | | | | | |
| | | | | | |
| | Years Ended December 31, |
| (In thousands) | | 2021 | | 2020 | | 2019 |
| Provision for income taxes computed at the statutory tax rate | | $ | 160,615 | | | $ | 100,683 | | | $ | 178,289 | |
| Change in tax resulting from: | | | | | | |
| | | | | | |
| Valuation allowance | | 5,700 | | | 11,290 | | | 1,941 | |
| Uncertain tax positions | | 853 | | | (14,784) | | | 1,202 | |
| State tax benefit, net of federal impact | | (1,714) | | | (9,062) | | | (293) | |
| Other, net | | (1,293) | | | (2,312) | | | (4,455) | |
| | | | | | |
| | | | | | |
| | | | | | |
| | | | | | |
| | | | | | |
| Provision for income taxes | | $ | 164,161 | | | $ | 85,815 | | | $ | 176,684 | |
| | | | | |
|
Radian Group Inc. and Subsidiaries Notes to Consolidated Financial Statements |
Deferred Tax Assets and Liabilities
The significant components of our net deferred tax assets and liabilities from continuing operations are summarized as follows.
| | | | | | | | | | | | | | |
| Deferred tax assets and liabilities | | | | |
| | | | |
| | December 31, |
| (In thousands) | | 2021 | | 2020 |
| Deferred tax assets | | | | |
| | | | |
| State income taxes, net of federal impact | | $ | 77,637 | | | $ | 75,499 | |
| Goodwill and intangibles | | 29,744 | | | 32,673 | |
| Unearned premiums | | 23,699 | | | 27,703 | |
| Accrued expenses | | 16,584 | | | 11,140 | |
| Lease liability | | 11,240 | | | 11,214 | |
| Loss reserves | | 6,286 | | | 4,578 | |
| | | | |
| | | | |
| | | | |
| | | | |
| | | | |
| | | | |
| | | | |
| | | | |
| Other | | 18,967 | | | 25,066 | |
| Total deferred tax assets | | $ | 184,157 | | | $ | 187,873 | |
| | | | |
| Deferred tax liabilities | | | | |
| | | | |
| Contingency reserve | | $ | 368,000 | | | $ | 216,122 | |
| Net unrealized gain on investments | | 31,876 | | | 70,057 | |
| Depreciation | | 12,775 | | | 13,029 | |
| Differences in fair value of financial instruments | | 7,763 | | | 9,087 | |
| | | | |
| | | | |
| | | | |
| | | | |
| Other | | 17,824 | | | 15,747 | |
| Total deferred tax liabilities | | 438,238 | | | 324,042 | |
| Less: Valuation allowance | | 83,428 | | | 77,728 | |
| Net deferred tax asset (liability) | | $ | (337,509) | | | $ | (213,897) | |
Current and Deferred Taxes
As of December 31, 2021, we recorded a net current federal income tax payable of $19.9 million, which primarily relates to applying the standards of accounting for uncertainty in income taxes.
Certain entities within our consolidated group have generated net deferred tax assets of approximately $76.1 million, relating primarily to state and local NOL carryforwards which, if unutilized, will expire during various future tax periods. We are required to establish a valuation allowance against our deferred tax assets when it is more likely than not that all or some portion of our deferred tax assets will not be realized. At each balance sheet date, we assess our need for a valuation allowance. Our assessment is based on all available evidence, both positive and negative. This requires management to exercise judgment and make assumptions regarding whether our deferred tax assets will be realized in future periods. We have determined that certain non-insurance entities within Radian may continue to generate taxable losses on a separate company basis in the near term and may not be able to fully utilize certain state and local NOLs on their state and local tax returns. Therefore, with respect to deferred tax assets relating to these state and local NOLs and other state timing adjustments, we retained a valuation allowance of $83.4 million at December 31, 2021 and $77.7 million at December 31, 2020.
As a mortgage guaranty insurer, we are eligible for a tax deduction, subject to certain limitations, under Internal Revenue Code Section 832(e) for amounts required by state law or regulation to be set aside in statutory contingency reserves. The deduction is allowed only to the extent that we purchase non-interest bearing U.S. Mortgage Guaranty Tax and Loss Bonds issued by the U.S. Department of the Treasury in an amount equal to the tax benefit derived from deducting any portion of our statutory contingency reserves. As of December 31, 2021, we held $354.1 million of these bonds, which are included as prepaid income taxes within other assets in our consolidated balance sheets. The corresponding deduction of our statutory contingency reserves resulted in the recognition of a net deferred tax liability. See Note 16 for additional information about our U.S. Mortgage Guaranty Tax and Loss Bonds.
| | | | | |
|
Radian Group Inc. and Subsidiaries Notes to Consolidated Financial Statements |
Unrecognized Tax Benefits
As of December 31, 2021, we have $3.9 million of net unrecognized tax benefits, including $2.3 million of interest and penalties, that would affect the effective tax rate, if recognized. Our policy for the recognition of interest and penalties associated with uncertain tax positions is to record such items as a component of our income tax provision, of which $0.7 million and $0.3 million were recorded for the years ended December 31, 2021 and 2020, respectively.
A reconciliation of the beginning and ending gross unrecognized tax benefits is as follows.
| | | | | | | | | | | | | | |
| Reconciliation of gross unrecognized tax benefits | | | | |
| | | | |
| | Years Ended December 31, |
| (In thousands) | | 2021 | | 2020 |
| Balance at beginning of period | | $ | 20,249 | | | $ | 37,208 | |
| Tax positions related to the current year: | | | | |
| Increases | | 267 | | | 250 | |
| Decreases | | (858) | | | (1,788) | |
| Tax positions related to prior years: | | | | |
| Increases | | 230 | | | 16,568 | |
| Decreases | | — | | | (171) | |
| | | | |
| | | | |
| Lapses of applicable statute of limitation | | — | | | (31,818) | |
| Balance at end of period | | $ | 19,888 | | | $ | 20,249 | |
Our total unrecognized tax benefits decreased by $0.4 million from December 31, 2020 to December 31, 2021, primarily due to a net decrease in unrecognized tax benefits associated with our recognition of certain premium income. Over the next 12 months, our unrecognized tax benefits may decrease by approximately $1.2 million due to the expiration of the applicable statute of limitations relating to the 2018 tax year. The statute of limitations related to our federal consolidated income tax return remains open for tax years 2018-2021. Additionally, among the entities within our consolidated group, various tax years remain open to potential examination by state and local taxing authorities.
11. Losses and LAE
Our reserve for losses and LAE, at the end of each period indicated, consisted of the following.
| | | | | | | | | | | | | | |
| Reserve for losses and LAE | | | | |
| | | | |
| | December 31, |
| (In thousands) | | 2021 | | 2020 |
Mortgage insurance loss reserves (1) | | $ | 823,136 | | | $ | 844,107 | |
| Title insurance loss reserves | | 5,506 | | | 4,306 | |
| Total reserve for losses and LAE | | $ | 828,642 | | | $ | 848,413 | |
(1)Primarily comprises first-lien primary case reserves of $790.4 million and $799.5 million at December 31, 2021 and 2020, respectively.
For the periods indicated, the following table presents information relating to our mortgage insurance reserve for losses, including our IBNR reserve and LAE.
| | | | | |
|
Radian Group Inc. and Subsidiaries Notes to Consolidated Financial Statements |
| | | | | | | | | | | | | | | | | | | | |
| Rollforward of mortgage insurance reserve for losses | | | | | | |
| | | | | | |
| | Years Ended December 31, |
| (In thousands) | | 2021 | | 2020 | | 2019 |
| Balance at January 1, | | $ | 844,107 | | | $ | 401,273 | | | $ | 397,891 | |
Less: Reinsurance recoverables (1) | | 71,769 | | | 14,594 | | | 11,009 | |
| Balance at January 1, net of reinsurance recoverables | | 772,338 | | | 386,679 | | | 386,882 | |
| Add: Losses and LAE incurred in respect of default notices reported and unreported in: | | | | | | |
Current year (2) | | 160,565 | | | 517,807 | | | 146,733 | |
| Prior years | | (141,126) | | | (34,547) | | | (14,709) | |
| Total incurred | | 19,439 | | | 483,260 | | | 132,024 | |
| Deduct: Paid claims and LAE related to: | | | | | | |
Current year (2) | | 1,112 | | | 4,148 | | | 4,220 | |
| Prior years | | 34,205 | | | 93,453 | | | 128,007 | |
| Total paid | | 35,317 | | | 97,601 | | | 132,227 | |
| Balance at end of period, net of reinsurance recoverables | | 756,460 | | | 772,338 | | | 386,679 | |
Add: reinsurance recoverables (1) | | 66,676 | | | 71,769 | | | 14,594 | |
| Balance at December 31, | | $ | 823,136 | | | $ | 844,107 | | | $ | 401,273 | |
(1)Related to ceded losses recoverable, if any, on reinsurance transactions. See Note 8 for additional information.
(2)Related to underlying defaulted loans with a most recent default notice dated in the year indicated. For example, if a loan had defaulted in a prior year, but then subsequently cured and later re-defaulted in the current year, that default would be considered a current year default.
Reserve Activity
Incurred Losses
Case reserves established for new default notices have been the primary driver of our total incurred losses in recent years, and they were primarily impacted by the number of new primary default notices received in the period and our related gross Default to Claim Rate assumption applied to those new defaults.
New primary default notices totaled 37,470 for the year ended December 31, 2021, compared to 108,025 for the year ended December 31, 2020 and 40,985 for the year ended December 31, 2019. For the year ended December 31, 2020, the significant increase in the number of new primary default notices was substantially all related to defaults of loans subject to forbearance programs implemented in response to the COVID-19 pandemic.
Our gross Default to Claim Rate assumption applied to new defaults was 8.0% as of December 31, 2021, compared to 8.5% as of December 31, 2020 and 7.5% as of December 31, 2019. The combination of fewer new default notices and a lower Default to Claim Rate assumption on new defaults was the primary driver of the decrease in losses incurred related to current year defaults for the year ended December 31, 2021, as compared to the year ended December 31, 2020.
Our provision for losses during 2021, most notably in the fourth quarter, was positively impacted by favorable reserve development on prior year defaults, primarily as a result of more favorable trends in Cures than originally estimated, due to favorable outcomes resulting from forbearance programs implemented in response to the COVID-19 pandemic as well as positive trends in home price appreciation. These favorable observed trends resulted in reductions in our Default to Claim Rate assumptions for prior year default notices, particularly for those defaults first reported in 2020 following the start of the COVID-19 pandemic.
Our provision for losses during 2020 and 2019 were also positively impacted by favorable reserve development on prior year defaults, primarily driven by a reduction in certain Default to Claim Rate assumptions for those prior year defaults based on observed trends.
See also Note 1 for additional information on the elevated risks and uncertainties resulting from the COVID-19 pandemic to our business.
Default to Claim Rate. Our Default to Claim Rate estimates on defaulted loans are mainly developed based on the Stage of Default and Time in Default of the underlying defaulted loans grouped according to the period in which the default occurred, as measured by the progress toward foreclosure sale and the number of months in default. While our estimates of ultimate losses on defaults from prior years declined in 2021 due to elevated Cures, which reduced our inventory of primary
| | | | | |
|
Radian Group Inc. and Subsidiaries Notes to Consolidated Financial Statements |
defaults, COVID-19-related hardship forbearance plans and foreclosure moratoriums resulted in delays in resolving the remaining defaults, leading to an increase in the Default to Claim Rates applied to the remaining inventory.
The following table shows our gross Default to Claim Rates on our primary portfolio based on the Time in Default and as of the dates indicated.
| | | | | | | | | | | | | | | | | | | | |
| Default to Claim Rates |
| | | | | | |
| | December 31, |
| | 2021 | | 2020 | | 2019 |
| Default to Claim Rate on: | | | | | | |
| New defaults | | 8.0 | % | | 8.5 | % | | 7.5 | % |
| Defaults not in Foreclosure Stage | | | | | | |
Time in Default: < 2 years (1) | | 41.6 | % | | 21.0 | % | | 22.0 | % |
| Time in Default: 2 - 5 years | | 75.0 | % | | 62.5 | % | | 48.0 | % |
| Time in Default: > 5 years | | 80.0 | % | | 70.0 | % | | 63.0 | % |
| Foreclosure Stage Defaults | | 85.0 | % | | 75.0 | % | | 70.0 | % |
(1)Represents the weighted average Default to Claim Rate for all defaults not in foreclosure stage that have been in default for up to two years, including new defaults. The estimated Default to Claim Rates applied to defaults within this population vary by Time in Default, and range from the Default to Claim Rates on new defaults shown above, up to 80.1%, 55.0% and 55.6% for more aged defaults in this category as of December 31, 2021, 2020 and 2019, respectively.
Our estimate of expected Rescissions and Claim Denials (net of expected Reinstatements) embedded in our estimated net Default to Claim Rate is generally based on our recent experience. Consideration is also given to differences in characteristics between those rescinded policies and denied claims and the loans remaining in our defaulted inventory.
Claims Paid
Total claims paid decreased in 2021 compared to 2020. The decrease in claims paid is primarily attributable to COVID-19-related hardship forbearance plans and suspensions of foreclosures and evictions, as well as a reduction in payments made to settle certain previously disclosed legal proceedings.
Concentration of Risk
As of December 31, 2021 and 2020, there was no state that accounted for more than 10% of our mortgage insurance business measured by primary RIF. California accounted for 10.9% of our direct NIW for the year ended December 31, 2021, compared to 10.4% and 10.6% for the years ended December 31, 2020 and 2019, respectively.
Additional Disclosures
The following tables provide information as of and for the periods indicated about: (i) incurred losses, net of reinsurance; (ii) the total of IBNR liabilities plus expected development on reported claims, included within the net incurred loss amounts; (iii) the cumulative number of reported defaults; and (iv) cumulative paid claims, net of reinsurance. The default year represents the period that a new default notice is first reported to us by loan servicers, related to borrowers who missed two monthly payments.
| | | | | |
|
Radian Group Inc. and Subsidiaries Notes to Consolidated Financial Statements |
The information about net incurred losses and paid claims development for the years ended prior to 2021 is presented as supplementary information.
| | | | | | | | | | | | | | | | | | | | | | | | | | | | | | | | | | | | | | | | | | | | | | | |
| Incurred losses, net of reinsurance |
| | | | | | | | | | | | | | | |
| | | | | | | | | | | | | Total of IBNR Liabilities Plus Expected Development on Reported Claims (1) | | Cumulative Number of Reported Defaults (2) |
($ in thousands) | Years Ended December 31, | | | |
| | Unaudited | | | |
| Default Year | | 2012 | 2013 | 2014 | 2015 | 2016 | 2017 | 2018 | 2019 | 2020 | 2021 | | As of December 31, 2021 |
| 2012 | | $ | 803,831 | | $ | 763,969 | | $ | 711,213 | | $ | 720,502 | | $ | 715,646 | | $ | 714,783 | | $ | 713,750 | | $ | 713,839 | | $ | 713,146 | | $ | 713,057 | | | $ | 7 | | | 73,517 | |
| 2013 | | | 505,732 | | 405,334 | | 401,444 | | 404,333 | | 402,259 | | 400,243 | | 399,356 | | 399,317 | | 398,820 | | | 6 | | | 58,577 | |
| 2014 | | | | 337,784 | | 247,074 | | 265,891 | | 264,620 | | 260,098 | | 261,507 | | 261,377 | | 260,254 | | | 7 | | | 47,976 | |
| 2015 | | | | | 222,555 | | 198,186 | | 178,042 | | 183,952 | | 183,546 | | 184,066 | | 182,647 | | | 12 | | | 42,607 | |
| 2016 | | | | | | 201,016 | | 165,440 | | 149,753 | | 148,811 | | 148,640 | | 148,349 | | | 18 | | | 40,503 | |
| 2017 | | | | | | | 180,851 | | 151,802 | | 133,357 | | 130,274 | | 126,989 | | | 28 | | | 42,888 | |
| 2018 | | | | | | | | 131,513 | | 116,634 | | 95,534 | | 88,252 | | | 51 | | | 37,369 | |
| 2019 | | | | | | | | | 143,475 | | 136,860 | | 109,416 | | | 150 | | | 40,985 | |
| 2020 | | | | | | | | | | 504,160 | | 408,809 | | | 786 | | | 108,025 | |
| 2021 | | | | | | | | | | | 156,328 | | | 1,771 | | | 37,470 | |
| Total | | | | | | | | | | | $ | 2,592,921 | | | | | |
(1)Represents reserves as of December 31, 2021 related to IBNR liabilities.
(2)Represents total number of new primary default notices received in each calendar year as compiled monthly based on reports received from loan servicers. As reflected in our Default to Claim Rate assumptions, a significant portion of reported defaults generally do not result in a claim. In certain instances, a defaulted loan may cure, and then re-default in a later period. Consistent with our reserving practice, each new event of default is treated as a unique occurrence and therefore certain loans that cure and re-default may be included as a reported default in multiple periods.
| | | | | |
|
Radian Group Inc. and Subsidiaries Notes to Consolidated Financial Statements |
| | | | | | | | | | | | | | | | | | | | | | | | | | | | | | | | | | | | | | | | | | | | | | | | | | | | | | | | | | | | | | |
| Cumulative paid claims, net of reinsurance |
| | | | | | | | | | | | | | | | | | | | |
| (In thousands) | | Years Ended December 31, | | |
| | Unaudited | | |
| Default Year | | 2012 | | 2013 | | 2014 | | 2015 | | 2016 | | 2017 | | 2018 | | 2019 | | 2020 | | 2021 |
| 2012 | | $ | 19,200 | | | $ | 295,332 | | | $ | 528,744 | | | $ | 631,982 | | | $ | 672,271 | | | $ | 692,291 | | | $ | 702,136 | | | $ | 704,770 | | | $ | 708,528 | | | $ | 708,929 | |
| 2013 | | | | 34,504 | | | 191,040 | | | 307,361 | | | 357,087 | | | 379,036 | | | 388,688 | | | 392,818 | | | 395,093 | | | 395,292 | |
| 2014 | | | | | | 13,108 | | | 115,852 | | | 200,422 | | | 233,607 | | | 246,611 | | | 252,619 | | | 255,742 | | | 256,107 | |
| 2015 | | | | | | | | 10,479 | | | 84,271 | | | 142,421 | | | 163,916 | | | 172,645 | | | 174,812 | | | 175,874 | |
| 2016 | | | | | | | | | | 11,061 | | | 76,616 | | | 119,357 | | | 134,115 | | | 137,306 | | | 138,525 | |
| 2017 | | | | | | | | | | | | 24,653 | | | 66,585 | | | 99,678 | | | 108,484 | | | 111,458 | |
| 2018 | | | | | | | | | | | | | | 5,584 | | | 36,066 | | | 54,625 | | | 60,926 | |
| 2019 | | | | | | | | | | | | | | | | 4,220 | | | 18,703 | | | 28,896 | |
| 2020 | | | | | | | | | | | | | | | | | | 4,148 | | | 9,867 | |
| 2021 | | | | | | | | | | | | | | | | | | | | 1,112 | |
| Total | | | | | | | | | | | | | | | | | | | | $ | 1,886,986 | |
| All outstanding liabilities before 2012, net of reinsurance | | 30,421 | |
Liabilities for claims, net of reinsurance (1) | | $ | 736,356 | |
(1)Calculated as follows:
| | | | | | | | |
| (In thousands) | | |
| Incurred losses, net of reinsurance | | $ | 2,592,921 | |
| All outstanding liabilities before 2012, net of reinsurance | | 30,421 | |
| Cumulative paid claims, net of reinsurance | | (1,886,986) | |
| Liabilities for claims, net of reinsurance | | $ | 736,356 | |
The following table provides a reconciliation of the net incurred losses and paid claims development tables above to the mortgage insurance reserve for losses and LAE at December 31, 2021.
| | | | | | | | |
| Net outstanding liabilities - mortgage insurance | | |
| | |
| (In thousands) | | December 31, 2021 |
| Reserve for losses and LAE, net of reinsurance | | $ | 736,356 | |
| Reinsurance recoverables on unpaid claims | | 66,676 | |
| Unallocated LAE | | 20,104 | |
Total gross reserve for losses and LAE (1) | | $ | 823,136 | |
(1)Excludes title insurance reserve for losses and LAE of $5.5 million.
The following is supplementary information about average historical claims duration as of December 31, 2021, representing the average distribution of when claims are paid relative to the year of default.
| | | | | | | | | | | | | | | | | | | | | | | | | | | | | | | | | | | | | | | | | | | | | | | | | | | | | | | | | | | | | | |
| Average annual percentage payout of incurred losses by age, net of reinsurance (unaudited) |
| | | | | | | | | | | | | | | | | | | | |
| Years | | 1 | | 2 | | 3 | | 4 | | 5 | | 6 | | 7 | | 8 | | 9 | | 10 |
| Mortgage insurance | | 6.1% | | 31.6% | | 26.4% | | 10.8% | | 4.2% | | 1.9% | | 1.0% | | 0.4% | | 0.3% | | 0.1% |
| | | | | |
|
Radian Group Inc. and Subsidiaries Notes to Consolidated Financial Statements |
12. Borrowings and Financing Activities
The carrying value of our debt at December 31, 2021 and 2020 was as follows.
| | | | | | | | | | | | | | |
| Borrowings | | | | |
| | | | |
| | December 31, |
| (In thousands) | | 2021 | | 2020 |
| Senior notes | | | | |
| Senior Notes due 2024 | | $ | 446,631 | | | $ | 445,512 | |
| Senior Notes due 2025 | | 518,405 | | | 516,634 | |
| Senior Notes due 2027 | | 444,437 | | | 443,528 | |
| Total senior notes | | $ | 1,409,473 | | | $ | 1,405,674 | |
| | | | | |
| FHLB advances | | | | |
| FHLB advances due 2021 | | $ | — | | | $ | 67,500 | |
| FHLB advances due 2022 | | 71,050 | | | 61,050 | |
| FHLB advances due 2023 | | 52,995 | | | 27,995 | |
| FHLB advances due 2024 | | 13,954 | | | 9,954 | |
| FHLB advances due 2025 | | 9,984 | | | 9,984 | |
| FHLB advances due 2027 | | 3,000 | | | — | |
| Total FHLB advances | | $ | 150,983 | | | $ | 176,483 | |
Senior Notes
Senior Notes due 2024. In September 2017, we issued $450 million aggregate principal amount of Senior Notes due 2024 and received net proceeds of $442.2 million. These notes mature on October 1, 2024 and bear interest at a rate of 4.500% per annum, payable semi-annually on April 1 and October 1 of each year, with interest payments commencing on April 1, 2018.
Senior Notes due 2025. In May 2020, we issued $525 million aggregate principal amount of Senior Notes due 2025 and received net proceeds of $515.6 million. These notes mature on March 15, 2025 and bear interest at a rate of 6.625% per annum, payable semi-annually on March 15 and September 15 of each year, with interest payments commencing on September 15, 2020.
Senior Notes due 2027. In June 2019, we issued $450 million aggregate principal amount of Senior Notes due 2027 and received net proceeds of $442.2 million. These notes mature on March 15, 2027 and bear interest at a rate of 4.875% per annum, payable semi-annually on March 15 and September 15 of each year, with interest payments commencing on March 15, 2020.
Redemption Terms in Senior Notes. We have the option to redeem the Senior Notes due 2024, 2025 and 2027, in whole or in part, at any time, or from time to time, prior to July 1, 2024 (the date that is three months prior to the maturity date of the Senior notes due 2024), September 15, 2024 (the date that is six months prior to the maturity date of the Senior notes due 2025) and September 15, 2026 (the date that is six months prior to the maturity date of the Senior notes due 2027) (in each case, the “Par Call Date”), respectively, at a redemption price equal to the greater of: (i) 100% of the aggregate principal amount of the notes to be redeemed and (ii) the make-whole amount, which is the sum of the present values of the remaining scheduled payments of principal and interest in respect of the notes to be redeemed from the redemption date to the Par Call Date discounted to the redemption date at the applicable treasury rate plus 50 basis points, plus, in each case, accrued and unpaid interest thereon to, but excluding, the redemption date. At any time on or after the Par Call Date, we may, at our option, redeem the notes in whole or in part, at a redemption price equal to 100% of the aggregate principal amount of the notes to be redeemed, plus accrued and unpaid interest thereon to, but excluding, the redemption date.
Covenants in Senior Notes. The indentures governing the Senior Notes due 2024, 2025 and 2027 contain covenants customary for securities of this nature, including covenants related to the payments of the notes, periodic reporting and certificates to be issued and covenants related to amendments to the indentures. Additionally, the indentures include covenants restricting us from encumbering the capital stock of a designated subsidiary (as defined in the indenture for the notes) or disposing of any capital stock of any designated subsidiary unless either all of the stock is disposed of or we retain more than 80% of the stock. We were in compliance with all covenants as of December 31, 2021.
| | | | | |
|
Radian Group Inc. and Subsidiaries Notes to Consolidated Financial Statements |
FHLB Advances
In August 2016, Radian Guaranty and Radian Reinsurance became members of the FHLB. As members, they may borrow from the FHLB, subject to certain conditions, which include the need to post collateral and the requirement to maintain a minimum investment in FHLB stock, in part depending on the level of their outstanding FHLB advances.
As of December 31, 2021, we had $151.0 million of fixed-rate advances outstanding with a weighted average interest rate of 0.97%. Interest on the FHLB advances is payable quarterly, or at maturity if the term of the advance is less than 90 days. Principal is due at maturity. For obligations with maturities greater than or equal to 90 days, we may prepay the debt at any time, subject to a prepayment fee.
The principal balance of the FHLB advances is required to be collateralized by eligible assets with a market value that must be maintained generally within a minimum range of 103% to 114% of the amount borrowed, depending on the type of assets pledged. Our fixed-maturities available for sale and trading securities include securities totaling $167.3 million and $188.0 million at December 31, 2021 and 2020, respectively, which serve as collateral for our FHLB advances to satisfy this requirement.
Revolving Credit Facility
In December 2021 Radian Group entered into a new $275.0 million unsecured revolving credit facility with a syndicate of bank lenders. The revolving credit facility has a five year term, provided that under certain conditions Radian Group is required to offer to terminate the facility earlier than the maturity date. This replaced Radian Group’s $267.5 million unsecured revolving credit facility with a syndicate of bank lenders, which was set to expire in January 2022. Terms of the credit facility include an accordion feature that allows Radian Group, at its option, to increase the total borrowing capacity during the term of the agreement, subject to our obtaining the necessary increased commitments from lenders (which may include then existing or other lenders), up to a total of $400.0 million.
Subject to certain limitations, borrowings under the credit facility may be used for working capital and general corporate purposes, including capital contributions to Radian Group’s insurance subsidiaries as well as growth initiatives. The credit facility contains customary representations, warranties, covenants, terms and conditions. Our ability to borrow under the credit facility is conditioned on the satisfaction of certain financial and other covenants, including covenants related to minimum net worth and statutory surplus, a maximum debt-to-capitalization level, limits on certain types of indebtedness and liens, and Radian Guaranty’s eligibility as a private mortgage insurer with the GSEs. At December 31, 2021, Radian Group was in compliance with all the covenants and there were no amounts outstanding under this revolving credit facility.
13. Commitments and Contingencies
Legal Proceedings
We are routinely involved in a number of legal actions and proceedings, including reviews, audits and inquiries by various regulatory entities, as well as litigation and other disputes arising in the ordinary course of our business. These legal proceedings and regulatory matters could result in adverse judgments, settlements, fines, injunctions, restitutions or other relief that could require significant expenditures or have other effects on our business. Management believes, based on current knowledge and after consultation with counsel, that the outcome of such actions will not have a material adverse effect on our consolidated financial condition.
The outcome of litigation and other legal and regulatory matters and proceedings is inherently uncertain, and it is possible that any one or more of these matters currently pending or threatened could have an adverse effect on our liquidity, financial condition or results of operations for any particular period. In accordance with applicable accounting standards and guidance, we establish accruals only when we determine both that it is probable that a loss has been incurred and the amount of the loss is reasonably estimable. We accrue the amount that represents our best estimate of the probable loss; however, if we can only determine a range of estimated losses, we accrue an amount within the range that, in our judgment, reflects the most likely outcome, and if none of the estimates within the range is more likely, we accrue the minimum amount of the range.
In the course of our regular review of pending legal and regulatory matters, we determine whether it is reasonably possible that a potential loss may have a material impact on our liquidity, results of operations or financial condition. If we determine such a loss is reasonably possible, we disclose information relating to such potential loss, including an estimate or range of loss or a statement that such an estimate cannot be made. On a quarterly basis, we review relevant information with respect to loss contingencies and update our accruals, disclosures and estimates of reasonably possible losses or range of losses based on such reviews. We are often unable to estimate the possible loss or range of loss until developments in such matters have provided sufficient information to support an assessment of the range of possible loss, such as quantification of a damage demand from plaintiffs, discovery from other parties and investigation of factual allegations, rulings by the court on motions or appeals, analysis by experts and the progress of settlement negotiations. In addition, we generally make no
| | | | | |
|
Radian Group Inc. and Subsidiaries Notes to Consolidated Financial Statements |
disclosures for loss contingencies that are determined to be remote. For matters for which we disclose an estimated loss, the disclosed estimate reflects the reasonably possible loss or range of loss in excess of the amount accrued, if any.
Loss estimates are inherently subjective, based on currently available information and are subject to management’s judgment and various assumptions. Due to the inherently subjective nature of these estimates and the uncertainty and unpredictability surrounding the outcome of legal and other proceedings, actual results may differ materially from any amounts that have been accrued.
We also are periodically subject to reviews and audits, as well as inquiries, information-gathering requests and investigations, by regulatory entities. In connection with these matters, from time to time we receive requests and subpoenas seeking information and documents related to aspects of our business.
Our Master Policies establish the timeline within which any suit or action arising from any right of an insured under the policy generally must be commenced. In general, any suit or action arising from any right of an insured under the policy must be commenced within two years after such right first arose for primary insurance and within three years for certain other policies, including certain Pool Mortgage Insurance policies. Although we believe that our Loss Mitigation Activities are justified under our policies, from time to time we face challenges from certain lender and servicer customers regarding our Loss Mitigation Activities. These challenges could result in additional arbitration or judicial proceedings and we may need to reassume the risk on, and increase loss reserves for, the associated policies or pay additional claims.
The legal and regulatory matters discussed above could result in adverse judgments, settlements, fines, injunctions, restitutions or other relief that could require significant expenditures or have other effects on our business in excess of amounts we have established as reserves for such matters.
Lease Liability
Our lease liability represents the present value of future lease payments over the lease term. Our leases do not provide a readily determinable implicit rate. Therefore, we must estimate our incremental borrowing rate, on a collateralized basis, to discount the lease payments based on information available at lease commencement. Our leases expire periodically through August 2032 and contain provisions for scheduled periodic rent increases. We estimate the incremental borrowing rate based on the yields of Radian Group corporate bonds, as adjusted to reflect a collateralized borrowing rate, resulting in discount rates ranging from 4.37% to 7.08%. While the majority of our lease population expires within one year of one of Radian Group’s corporate bonds, our more significant leases do not. For those leases, we adjust the corporate bond rate for both U.S. Department of the Treasury rate yields, and a corporate spread adjustment determined from recent market data.
The following tables provide additional information related to our leases, including: (i) the components of our total lease cost; (ii) the cash flows arising from our lease transactions; (iii) supplemental balance sheet information; (iv) the weighted-average remaining lease term; (v) the weighted-average discount rate used for our leases; and (vi) the remaining maturities of our lease liabilities, as of and for the periods indicated.
| | | | | | | | | | | | | | |
| Total lease cost | | | | |
| | | | |
| | Years Ended December 31, |
| (In thousands) | | 2021 | | 2020 |
| Operating lease cost | | $ | 9,333 | | | $ | 8,798 | |
| Short-term lease cost | | 384 | | | 13 | |
| Total lease cost | | $ | 9,717 | | | $ | 8,811 | |
| | | | | |
| Cash paid for amounts included in the measurement of lease liabilities | | | | |
| Operating cash flows from operating leases | | $ | (9,060) | | | $ | (9,595) | |
| | | | | |
|
Radian Group Inc. and Subsidiaries Notes to Consolidated Financial Statements |
| | | | | | | | | | | | | | |
| Operating leases | | | | |
| | | | |
| | December 31, |
| ($ in thousands) | | 2021 | | 2020 |
| Operating leases | | | | |
Operating lease right-of-use assets (1) | | $ | 31,878 | | | $ | 32,985 | |
Operating lease liabilities (2) | | 53,523 | | | 53,399 | |
| Weighted-average remaining lease term - operating leases (in years) | | 7.9 years | | 9.3 years |
| Weighted-average discount rate - operating leases | | 6.21 | % | | 6.72 | % |
| Remaining maturities of lease liabilities for future years is as follows: | | | | |
| 2022 | | $ | 12,033 | | | |
| 2023 | | 12,191 | | | |
| 2024 | | 11,952 | | | |
| 2025 | | 9,704 | | | |
| 2026 | | 7,225 | | | |
| 2027 and thereafter | | 32,646 | | | |
| Total lease payments | | 85,751 | | | |
| Less: Imputed interest | | (32,228) | | | |
Present value of lease liabilities (2) | | $ | 53,523 | | | |
(1)Classified in other assets in our consolidated balance sheets. See Note 9.
(2)Classified in other liabilities in our consolidated balance sheets.
The table above excludes approximately $5.8 million of future payment obligations related to an additional operating lease, which had not yet commenced as of December 31, 2021.
At December 31, 2021 and 2020, there were no future minimum receipts expected from sublease rental payments. We entered into a sublease agreement in January 2022 for a portion of the office space in our former corporate headquarters in Philadelphia and are actively marketing all remaining space in that location for sublease. Upon entering a sublease agreement, we do not anticipate being relieved of our primary obligation under the original lease and will act as a lessor recognizing any sublease income in other income on a straight-line basis over the remaining lease term.
Other
We provide contract underwriting to our mortgage insurance customers. Generally, under our current contract underwriting program the remedy we offer is limited indemnification. In 2021 and 2020, our provision for contract underwriting expenses and our payments for losses related to contract underwriting remedies were de minimis. We monitor this risk and negotiate our underwriting fee structure and recourse agreements on a client-by-client basis. We also routinely audit the performance of our contract underwriters.
14. Capital Stock
Share Repurchase Activity
On August 14, 2019, Radian Group’s board of directors approved a share repurchase program authorizing the Company to spend up to $200 million, excluding commissions, to repurchase Radian Group common stock in the open market or in privately negotiated transactions, based on market and business conditions, stock price and other factors. Radian generally operates its share repurchase programs pursuant to a trading plan under Rule 10b5-1 of the Exchange Act, which permits the Company to purchase shares, at predetermined price targets, when it may otherwise be precluded from doing so.
Since then, Radian Group’s board of directors has authorized several increases to the program along with extensions of the program’s expiration date. Most recently, in August 2021, Radian Group’s board of directors approved a $200 million increase to this program, bringing the cumulative authorization to repurchase shares up to $675 million, excluding commissions, and extended the expiration of this program to August 31, 2022. During the year ended December 31, 2021, the Company purchased 17.8 million shares at an average price of $22.48 per share, including commissions. As of December 31, 2021, no purchase authority remained available under this program.
On February 9, 2022, Radian Group’s board of directors approved a share repurchase program authorizing the Company to spend up to $400 million, excluding commissions, to repurchase Radian Group common stock in the open market or in
| | | | | |
|
Radian Group Inc. and Subsidiaries Notes to Consolidated Financial Statements |
privately negotiated transactions, based on market and business conditions, stock price and other factors. Radian plans to utilize a trading plan under Rule10b5-1 of the Exchange Act, which, once implemented, permits the Company to purchase shares, at predetermined price targets, when it may otherwise be precluded from doing so. The authorization will expire in February 2024.
Other Purchases
We may purchase shares on the open market to settle stock options exercised by employees and purchases under the ESPP. In addition, upon the vesting of certain RSUs under our equity compensation plans, we may withhold from such vested awards shares of our common stock to satisfy the tax liability of the award recipients.
Dividends and Dividend Equivalents
During the first quarter of 2021 and each quarter of 2020, we declared quarterly cash dividends on our common stock equal to $0.125 per share. On May 4, 2021, Radian Group’s board of directors authorized an increase to the Company’s quarterly dividend from $0.125 to $0.14 per share, beginning with the dividend declared in the second quarter of 2021.
On February 9, 2022, Radian Group’s board of directors authorized an increase to our quarterly dividend from $0.14 to $0.20 per share, beginning with dividends declared in the first quarter of 2022.
Dividend equivalents are accrued on RSUs when dividends are declared on the Company’s common stock, subject to certain exclusions. See Note 17 for information about our dividend equivalents on RSU awards.
| | | | | |
|
Radian Group Inc. and Subsidiaries Notes to Consolidated Financial Statements |
15. Accumulated Other Comprehensive Income (Loss)
The following tables show the rollforward of accumulated other comprehensive income (loss) as of the periods indicated.
| | | | | | | | | | | | | | | | | | | | |
| Rollforward of accumulated other comprehensive income | | | | | | |
| | | | | | |
| | Year Ended December 31, 2021 |
| (In thousands) | | Before Tax | | Tax Effect | | Net of Tax |
| Balance at beginning of period | | $ | 333,829 | | | $ | 70,104 | | | $ | 263,725 | |
| Other comprehensive income (loss) | | | | | | |
| Unrealized holding gains (losses) on investments arising during the period for which an allowance for expected credit losses has not been recognized | | (175,234) | | | (36,799) | | | (138,435) | |
Less: Reclassification adjustment for net gains (losses) on investments included in net income: (1) | | | | | | |
| Net realized gains on disposals and non-credit related impairment losses | | 5,661 | | | 1,189 | | | 4,472 | |
| Net decrease (increase) in expected credit losses | | 918 | | | 193 | | | 725 | |
| Net unrealized gains (losses) on investments | | (181,813) | | | (38,181) | | | (143,632) | |
| | | | | | |
| Other comprehensive income (loss) | | (181,813) | | | (38,181) | | | (143,632) | |
| Balance at end of period | | $ | 152,016 | | | $ | 31,923 | | | $ | 120,093 | |
| | | | | | |
| | Year Ended December 31, 2020 |
| (In thousands) | | Before Tax | | Tax Effect | | Net of Tax |
| Balance at beginning of period | | $ | 139,858 | | | $ | 29,370 | | | $ | 110,488 | |
| Other comprehensive income (loss) | | | | | | |
| Unrealized holding gains (losses) on investments arising during the period for which an allowance for expected credit losses has not been recognized | | 226,280 | | | 47,519 | | | 178,761 | |
Less: Reclassification adjustment for net gains (losses) included in net income (1) | | | | | | |
| Net realized gains on disposals and non-credit related impairment losses | | 33,468 | | | 7,028 | | | 26,440 | |
| Net decrease (increase) in expected credit losses | | (1,254) | | | (263) | | | (991) | |
| Net unrealized gains on investments | | 194,066 | | | 40,754 | | | 153,312 | |
| Other adjustments to comprehensive income, net | | (95) | | | (20) | | | (75) | |
| Other comprehensive income (loss) | | 193,971 | | | 40,734 | | | 153,237 | |
| Balance at end of period | | $ | 333,829 | | | $ | 70,104 | | | $ | 263,725 | |
| | | | | | |
| | Year Ended December 31, 2019 |
| (In thousands) | | Before Tax | | Tax Effect | | Net of Tax |
| Balance at beginning of period | | $ | (77,114) | | | $ | (16,194) | | | $ | (60,920) | |
| Other comprehensive income (loss) | | | | | | |
| | | | | | |
| Unrealized holding gains (losses) arising during the period | | 228,406 | | | 47,965 | | | 180,441 | |
Less: Reclassification adjustment for net gains (losses) included in net income (1) | | 11,262 | | | 2,365 | | | 8,897 | |
| Net unrealized gains on investments | | 217,144 | | | 45,600 | | | 171,544 | |
| Other adjustments to comprehensive income, net | | (172) | | | (36) | | | (136) | |
| Other comprehensive income (loss) | | 216,972 | | | 45,564 | | | 171,408 | |
| Balance at end of period | | $ | 139,858 | | | $ | 29,370 | | | $ | 110,488 | |
| | | | | | |
(1)Included in net gains on investments and other financial instruments in our consolidated statements of operations. |
| | | | | |
|
Radian Group Inc. and Subsidiaries Notes to Consolidated Financial Statements |
16. Statutory Information
Radian Group serves as the holding company for our insurance subsidiaries, through which we conduct our mortgage insurance and title insurance businesses. These insurance subsidiaries are subject to comprehensive, detailed regulation by the insurance departments in the various states where our insurance subsidiaries are domiciled or licensed to transact business. Insurance laws vary from state to state, but generally grant broad supervisory powers to state agencies or officials to examine insurance companies and enforce rules or exercise discretion affecting almost every significant aspect of the insurance business, including the power to revoke or restrict an insurance company’s ability to write new business.
In addition, in order to be eligible to insure loans purchased by the GSEs, mortgage insurers such as Radian Guaranty must meet the GSEs’ eligibility requirements, or PMIERs. The PMIERs are comprehensive, covering virtually all aspects of the business and operations of a private mortgage insurer, including internal risk management and quality controls, the relationship between the GSEs and the approved insurer, as well as the approved insurer’s financial condition.
See “—PMIERs” below for additional information.
The PMIERs and state insurance regulations include various capital requirements and dividend restrictions based on our insurance subsidiaries’ statutory financial position and results of operations, as described below. Our failure to maintain adequate levels of capital could lead to intervention by the various insurance regulatory authorities, which could materially and adversely affect our business, business prospects and financial condition.
Statutory Financial Statements
We prepare our statutory financial statements in accordance with the accounting practices required or permitted, if applicable, by the insurance departments of the respective states of domicile of our insurance subsidiaries. Required SAP are established by the NAIC, as well as state laws, regulations and general administrative rules. In addition, insurance departments have the right to permit other specific practices that may deviate from prescribed practices. As of December 31, 2021, we did not have any prescribed or permitted SAP that resulted in reported statutory surplus or risk-based capital being materially different from what would have been reported had NAIC statutory accounting practices been followed.
Reflecting the principal differences between SAP and GAAP, statutory financial statements typically do not include unrealized gains or losses on fixed-maturity securities, deferred policy acquisition costs, certain net deferred tax assets and certain other less readily marketable assets that are designated as non-admitted assets. In addition to these general differences, SAP also requires that mortgage insurance companies establish a special contingency reserve equal to 50% of premiums earned in each year, generally to be maintained for 10 years, to protect policyholders against loss during adverse economic cycles.
As a result of the requirement to establish and maintain this statutory liability, contingency reserves affect the ability of a mortgage insurer to pay dividends, as described below. With regulatory approval, a mortgage insurance company may make early withdrawals from this contingency reserve when incurred losses exceed 35% of net premiums in a calendar year. Due to elevated losses in 2020, Radian Guaranty received regulatory approval to release $93.0 million from contingency reserves for that year. Radian Guaranty did not release any amounts from their contingency reserves in 2021. Based on the typical 10-year holding requirement, Radian Guaranty is scheduled to release contingency reserves to unassigned surplus beginning in 2024. See “—Statutory Dividend Restrictions” below for additional information.
As a mortgage guaranty insurer, we are eligible for a tax deduction, subject to certain limitations, related to amounts required to be set aside in statutory contingency reserves to the extent we purchase U.S. Mortgage Guaranty Tax and Loss Bonds issued by the U.S. Department of the Treasury. Under SAP, this deduction reduces the tax provision reflected in the statutory financial statements, which in turn increases statutory net income and surplus as well as Available Assets under the PMIERs. As of December 31, 2021, Radian Guaranty held $354.1 million of these bonds, which have a 10-year original maturity but may generally be redeemed in any tax year prior to maturity.
All of our mortgage insurance subsidiaries are domiciled in Pennsylvania, and we currently write new business using two principal subsidiaries, Radian Guaranty and Radian Reinsurance. Radian Guaranty, our only approved insurer under the PMIERs, is authorized as a monoline insurer to write mortgage guaranty insurance (or in states where there is no specific authorization for mortgage guaranty insurance, the applicable line of insurance under which mortgage guaranty insurance is regulated) in all 50 states, the District of Columbia and Guam. Radian Reinsurance is licensed only in Pennsylvania as a stock casualty insurance company authorized to carry on the business of credit insurance, which includes the authority to write direct mortgage guaranty insurance. We use Radian Reinsurance to participate in the credit risk transfer programs developed by Fannie Mae and Freddie Mac.
Additionally, as part of our title services, we offer title insurance through Radian Title Insurance, an Ohio domiciled title insurance underwriter and settlement services company that is licensed to issue title insurance policies in 41 states and the District of Columbia.
| | | | | |
|
Radian Group Inc. and Subsidiaries Notes to Consolidated Financial Statements |
Our insurance subsidiaries’ statutory net income and statutory policyholders’ surplus for the years ended and as of December 31, 2021, 2020 and 2019 were as follows.
| | | | | | | | | | | | | | | | | | | | | | | |
| Statutory net income (loss) | | | | | | | |
| | | | | | | |
| | Years Ended December 31, |
| (In thousands) | | 2021 | | 2020 | | 2019 |
| Radian Guaranty | | $ | 753,506 | | | | $ | 441,947 | | | $ | 703,380 | |
| Radian Reinsurance | | 9,103 | | | | 32,484 | | | 101,591 | |
| Other mortgage subsidiaries | | 1,669 | | | | 1,086 | | | 144 | |
| Radian Title Insurance | | 6,862 | | | | 2,126 | | | 331 | |
| | | | | | | |
| Statutory policyholders’ surplus | | | | | | | |
| | | | | | | |
| | December 31, |
| (In thousands) | | 2021 | | 2020 | | 2019 |
| Radian Guaranty | | $ | 778,148 | | | | $ | 481,484 | | | $ | 637,718 | |
| Radian Reinsurance | | 327,118 | | | | 360,704 | | | 455,594 | |
| Other mortgage subsidiaries | | 14,524 | | (1) | | 41,327 | | | 45,672 | |
| Radian Title Insurance | | 36,599 | | | | 28,849 | | | 27,349 | |
(1)Two previous insurance subsidiaries, Radian Mortgage Guaranty Inc. and Radian Investor Surety Inc., were dissolved in 2021.
Statutory Capital Requirements
Under state insurance regulations, Radian Guaranty is required to maintain minimum surplus levels and, in certain states, a maximum ratio of net RIF relative to statutory capital, or Risk-to-capital. There are 16 RBC States that currently impose a Statutory RBC Requirement. The most common Statutory RBC Requirement is that a mortgage insurer’s Risk-to-capital may not exceed 25 to 1. In certain of the RBC States, a mortgage insurer must satisfy a MPP Requirement. Unless an RBC State grants a waiver or other form of relief, if a mortgage insurer, such as Radian Guaranty, is not in compliance with the Statutory RBC Requirement of that state, the mortgage insurer may be prohibited from writing new mortgage insurance business in that state.
The statutory capital requirements for the non-RBC States are de minimis (ranging from $1 million to $5 million); however, the insurance laws of these states generally grant broad supervisory powers to state agencies or officials to enforce rules or exercise discretion affecting almost every significant aspect of the insurance business, including the power to revoke or restrict an insurance company’s ability to write new business. Radian Guaranty’s domiciliary state, Pennsylvania, is not one of the RBC States.
Radian Guaranty was in compliance with all applicable Statutory RBC Requirements or MPP Requirements, as applicable, in each of the RBC States as of December 31, 2021. Radian Guaranty’s Risk-to-capital calculation was 11.1:1 and 12.7:1 as of December 31, 2021 and 2020, respectively. For purposes of the Risk-to-capital requirements imposed by certain states, statutory capital is defined as the sum of statutory policyholders’ surplus plus statutory contingency reserves.
Our other mortgage insurance and title insurance subsidiaries were also in compliance with all statutory and counterparty capital requirements as of December 31, 2021 and 2020.
For many years, the NAIC has been reviewing the minimum capital and surplus requirements for mortgage insurers and considering changes to the Model Act. In December 2019, a working group of state regulators released exposure drafts of a revised Model Act, including new proposed mortgage guaranty insurance capital requirements for mortgage insurers. Since that time, the process for developing the Model Act largely has been inactive, although work has proceeded on developing a new, legally non-binding capital monitoring framework that regulators could use as an alternative for assessing the capital adequacy of a mortgage insurer. The requirements set forth in the most recent exposure draft of the non-binding capital adequacy tool are impacted, among other things, by changes in the economic and housing environment, including changes in home prices and incomes.
PMIERs
The PMIERs financial requirements require that a mortgage insurer’s Available Assets meet or exceed its Minimum Required Assets. At December 31, 2021, Radian Guaranty is an approved mortgage insurer under the PMIERs and is in compliance with the current PMIERs financial requirements.
| | | | | |
|
Radian Group Inc. and Subsidiaries Notes to Consolidated Financial Statements |
The GSEs may amend the PMIERs at any time, and they have broad discretion to interpret the requirements, which could impact the calculation of Radian Guaranty’s Available Assets and/or Minimum Required Assets. In addition, the GSEs have a broad range of consent rights under the PMIERs and require private mortgage insurers to obtain the prior consent of the GSEs before taking certain actions. If Radian Guaranty is unable to satisfy the requirements set forth in the PMIERs, the GSEs could restrict it from conducting certain types of business with them or take actions that may include not purchasing loans insured by Radian Guaranty.
Statutory Dividend Restrictions
As of December 31, 2021, the amount of restricted net assets held by our consolidated insurance subsidiaries (which represents our equity investment in those insurance subsidiaries) totaled $4.8 billion of our consolidated net assets. Despite holding assets above the minimum statutory capital thresholds and PMIERs financial requirements, the ability of Radian’s mortgage insurance subsidiaries to pay dividends on their common stock is restricted by certain provisions of the insurance laws of Pennsylvania, their state of domicile.
Under Pennsylvania’s insurance laws, ordinary dividends and distributions may only be paid out of an insurer’s positive unassigned surplus unless the Pennsylvania Insurance Department approves the payment of extraordinary dividends or other distributions from another source. While all proposed dividends and distributions to stockholders must be filed with the Pennsylvania Insurance Department prior to payment, if a Pennsylvania domiciled insurer had positive unassigned surplus, such insurer can pay dividends or other distributions during any 12-month period in an aggregate amount less than or equal to the greater of: (i) 10% of the preceding year-end statutory policyholders’ surplus or (ii) the preceding year’s statutory net income, in each case without the prior approval of the Pennsylvania Insurance Department.
As of December 31, 2021, Radian Guaranty had negative unassigned surplus of $562.8 million. Therefore, no dividends or other ordinary distributions can be paid by Radian Guaranty. In light of Radian Guaranty’s negative unassigned surplus related to operating losses in prior periods and the ongoing need to set aside contingency reserves, we do not anticipate that Radian Guaranty will be permitted under applicable insurance laws to pay ordinary dividends to Radian Group for the next several years.
In September 2021, Radian Reinsurance paid an ordinary dividend of $36.0 million to Radian Group. As of December 31, 2021, Radian Reinsurance had positive unassigned surplus of $286.1 million. As a result, Radian Reinsurance does have the ability to pay ordinary dividends in 2022. Under Pennsylvania’s insurance laws, Radian Reinsurance can distribute up to $32.7 million in 2022 without prior approval from the Pennsylvania Insurance Department.
As of December 31, 2021 and 2020, Radian Guaranty had contingency reserves of $3.9 billion and $3.4 billion, respectively. As discussed above, absent early releases related to elevated incurred losses such as occurred in 2020, Radian Guaranty is scheduled to release contingency reserves to unassigned surplus beginning in 2024, which should accelerate the reduction of its negative unassigned surplus. Under Pennsylvania’s insurance laws, an insurer may request approval to pay an Extraordinary Distribution, subject to the approval of the Pennsylvania Insurance Department. Radian Guaranty sought and received such approval to return capital by paying Extraordinary Distributions to Radian Group in the past, most recently in February 2022, as discussed below. Radian Reinsurance sought and received approval to return capital by paying an Extraordinary Distribution to Radian Group in January 2020.
The surplus additions (distributions) between Radian Group and Radian Guaranty and our other insurance subsidiaries for the years ended December 31, 2021, 2020 and 2019 were as follows.
| | | | | | | | | | | | | | | | | | | | |
| Surplus additions (distributions) | | | | | | |
| | | | | | |
| | Years Ended December 31, |
| (In thousands) | | 2021 | | 2020 | | 2019 |
| Additions to Radian Guaranty surplus | | $ | — | | | $ | 200,000 | | | $ | — | |
| Distributions from Radian Guaranty surplus | | — | | | — | | | (375,000) | |
| Additions to other insurance subsidiaries’ surplus | | 250 | | | — | | | 65,200 | |
| Distributions from other insurance subsidiaries’ surplus | | (40,000) | | | (465,000) | | | (14,000) | |
In February 2022, the Pennsylvania Insurance Department approved a $500 million return of capital from Radian Guaranty to Radian Group, which was paid on February 11, 2022 in cash and marketable securities. This transfer was approved by the Pennsylvania Insurance Department as an Extraordinary Distribution in the form of a return of paid-in capital and will result in a $500 million decrease in Radian Guaranty’s statutory policyholders’ surplus.
| | | | | |
|
Radian Group Inc. and Subsidiaries Notes to Consolidated Financial Statements |
17. Share-Based Compensation and Other Benefit Programs
All outstanding awards granted under the Equity Plans are performance-based or time-based awards in the form of RSUs, non-qualified stock options or phantom stock. The maximum contractual term for stock options and similar instruments under the Equity Plans is 10 years, although awards of these instruments may be granted with shorter terms.
On May 12, 2021, our stockholders approved the 2021 Equity Plan. The terms of the 2021 Equity Plan apply to awards granted on or after May 12, 2021, the effective date of the plan (the “Effective Date”). In addition to the 2021 Equity Plan, we also have awards outstanding under the 1995 Equity Plan, the 2008 Equity Plan and the 2017 Equity Plan (collectively, the “Prior Equity Plans”).The last awards granted pursuant to the 2008 and 1995 Equity Plans were granted in 2014 and 2008, respectively.
The 2021 Equity Plan authorizes the issuance of up to 8.3 million new shares of our common stock, plus: (i) any shares of our common stock that remained available for awards under the 2017 Equity Plan as of the Effective Date; and (ii) any shares of our common stock subject to outstanding awards under the Prior Equity Plans as of the Effective Date that are payable in shares and that terminate, expire, or are canceled without having been exercised, vested, or settled in full (as applicable) on or after the Effective Date, subject to certain adjustments set forth in the 2021 Equity Plan (“Prior Plans Shares”). There were 10.2 million shares available for grant under the 2021 Equity Plan, including Prior Plans Shares, as of December 31, 2021.
Most awards vest at the end of the performance or service period and will vest earlier under certain circumstances. In the event of a grantee’s death or disability, awards generally vest immediately. Upon retirement, if certain conditions are met, awards generally vest immediately or at the end of the performance period, if any. Certain time-based RSU awards granted to officers under our 2021 Equity Plan and 2017 Equity Plan will vest in whole or in part in the event the grantee’s employment is terminated by us without cause or for “good reason.” Awards granted to officers will vest in connection with a change of control only in the event the grantee’s employment is terminated by us without cause or the grantee terminates employment for “good reason,” in each case within 90 days before or one year after the change of control. Awards to our non-employee directors will vest in connection with a change of control only in the event the grantee fails to be appointed to the board of directors of the surviving entity or is not nominated for reelection, or fails to be reelected after nomination, to the board of directors of the Company or the surviving entity.
The following table summarizes the compensation cost recognized and additional information regarding all share-based awards for the years indicated.
| | | | | | | | | | | | | | | | | | | | |
Share-based compensation expense | | | | | | |
| | | | | | |
| | | Years Ended December 31, |
| (In thousands) | | 2021 | | 2020 | | 2019 |
Compensation cost recognized (1) | | | | | | |
| RSUs | | $ | 27,803 | | | $ | 18,403 | | | $ | 20,694 | |
| ESPP | | 589 | | | 671 | | | 444 | |
| Non-Qualified Stock Options and Other | | (29) | | | 119 | | | 276 | |
| Total compensation cost recognized | | 28,363 | | | 19,193 | | | 21,414 | |
| Less: Costs deferred as acquisition costs | | — | | | — | | | 373 | |
| Share-based compensation expense | | 28,363 | | | 19,193 | | | 21,041 | |
| Income tax benefit related to share-based compensation expense | | 7,168 | | | 4,264 | | | 6,343 | |
| Share-based compensation expense, net | | $ | 21,195 | | | $ | 14,929 | | | $ | 14,698 | |
(1)Compensation cost is generally recognized over the periods that an employee provides service in exchange for the award. For purposes of calculating compensation cost recognized for retirement eligible grantees, we consider the service condition to be met (and recognize the full compensation costs) as of the date when a grantee becomes retirement eligible.
As of December 31, 2021, unrecognized compensation expense for all of our outstanding share-based awards was $26.4 million. Absent a change of control under the Equity Plans, this expense is expected to be recognized over a weighted-average period of approximately 1.9 years. The ultimate unrecognized expense associated with our outstanding awards could differ, depending upon whether or not the performance and service conditions are met.
| | | | | |
|
Radian Group Inc. and Subsidiaries Notes to Consolidated Financial Statements |
RSUs
Information with regard to RSUs to be settled in stock for the periods indicated is as follows.
| | | | | | | | | | | | | | | | | | | | | | | | | | |
Rollforward of RSUs | | | | | | | | |
| | | | | | | | |
| | Performance-Based | | Time-Vested |
| | Number of
Shares | | Weighted-Average
Grant Date
Fair Value | | Number of
Shares | | Weighted-Average
Grant Date
Fair Value |
Outstanding, December 31, 2020 (1) | | 2,186,244 | | | $ | 15.71 | | | 2,118,885 | | | $ | 13.16 | |
Granted (2) | | 578,790 | | | 20.39 | | | 557,216 | | | 21.71 | |
Performance adjustment (3) | | 421,357 | | | — | | | — | | | — | |
Vested (4) | | (811,598) | | | 15.98 | | | (832,351) | | | 13.59 | |
| Forfeited | | (34,120) | | | 18.14 | | | (35,199) | | | 17.99 | |
Outstanding, December 31, 2021 (1) | | 2,340,673 | | | $ | 16.76 | | | 1,808,551 | | | $ | 15.51 | |
(1)Outstanding RSUs represent shares that have not yet been issued because not all conditions necessary to earn the right to benefit from the instruments have been satisfied. For performance based awards, the final number of RSUs distributed depends on the cumulative growth in Radian’s book value over the respective three-year performance period and, with the exception of certain retirement-eligible employees, continued service through the vesting date, which could result in changes in vested RSUs.
(2)For performance-based RSUs, amount represents the number of target shares at grant date.
(3)For performance-based RSUs, represents the difference between the number of target shares at grant date and the number of shares vested at settlement, which can range from 0 to 200% of target depending on results over the applicable performance periods.
(4)Represents amounts vested during the year, including the impact of performance adjustments for performance-based awards.
The weighted-average grant date fair value of performance-based RSUs granted during 2020 and 2019 was $11.91 and $21.45, respectively. The weighted-average grant date fair value of time-vested RSUs granted during 2020 and 2019 was $13.49 and $22.76, respectively.
The fair value as of the respective vesting dates of performance-based RSUs vested during 2021, 2020 and 2019 was $18.9 million, $17.2 million and $10.6 million, respectively. The fair value as of the respective vesting dates of time-vested RSUs vested during 2021, 2020 and 2019 was $18.1 million, $7.6 million and $10.9 million, respectively.
Beginning in the first quarter of 2020, dividend equivalents are accrued on all awards when dividends are declared on the Company’s common stock and will generally be paid in cash when the awards are settled.
Performance-Based RSUs. In 2021, 2020 and 2019, the vesting of the performance-based RSUs granted to each executive officer and non-executive will be based upon the cumulative growth in Radian’s book value per share, adjusted for certain defined items, over a three-year performance period. The payout at the end of the three-year performance period can range from 0% to a maximum payout of 200% of the award’s target number of RSUs. Performance-based RSUs granted to executive officers are subject to a one-year post vesting holding period.
The grant date fair value of the performance-based RSUs that are based on the cumulative growth in Radian’s book value per share is calculated based on the stock price as of the grant date, discounted for executives for the one-year-post-vesting holding period.
Time-Vested RSUs. With the exception of certain time-vested RSUs granted in 2021, 2020 and 2019 to non-employee directors, the time-vested RSU awards granted in 2021, 2020 and 2019 are scheduled to vest in: (i) pro rata installments on each of the first three anniversaries of the grant date or (ii) generally at the end of three years. Certain time-vested RSU awards granted in 2021, 2020 and 2019 to non-employee directors generally are subject to one-year cliff vesting; however, awards granted to non-employee directors in 2019 and earlier periods remain outstanding and the shares are not issued until the non-employee director retires or certain conditions related to a change in control are met, as described above.
| | | | | |
|
Radian Group Inc. and Subsidiaries Notes to Consolidated Financial Statements |
Non-Qualified Stock Options
Information with regard to stock options for the periods indicated is as follows.
| | | | | | | | | | | | | | | | | | | | | | | | | | |
Rollforward of non-qualified stock options |
| | | | | | | | |
| ($ in thousands, except per-share amounts) | | Number of
Shares | | Weighted
Average
Exercise Price
Per Share | | Weighted
Average
Remaining Contractual Term | | Aggregate Intrinsic Value (1) |
| Outstanding, December 31, 2020 | | 773,519 | | | $ | 10.73 | | | | | |
| Granted | | — | | | — | | | | | |
| Exercised | | (209,613) | | | 6.75 | | | | | |
| Forfeited | | — | | | — | | | | | |
| Expired | | — | | | — | | | | | |
| Outstanding, December 31, 2021 | | 563,906 | | | $ | 12.21 | | | 2.4 years | | $ | 5,032 | |
| Exercisable, December 31, 2021 | | 563,906 | | | $ | 12.21 | | | 2.4 years | | $ | 5,032 | |
| | | | | | | | |
(1)Based on the market price of $21.13 at December 31, 2021.
The following table summarizes additional information concerning stock option activity for the periods indicated.
| | | | | | | | | | | | | | | | | | | | |
Additional information | | | | | | |
| | | | | | |
| | Years Ended December 31, |
| (In thousands) | | 2021 | | 2020 | | 2019 |
| Aggregate intrinsic value of options exercised | | $ | 3,354 | | | $ | 3,344 | | | $ | 4,984 | |
| Tax benefit of options exercised | | 704 | | | 702 | | | 1,047 | |
| Cash received from options exercised | | 1,382 | | | 1,553 | | | 2,416 | |
Upon the exercise of stock options, we generally issue shares from the authorized, unissued share reserves when the exercise price is less than the treasury stock repurchase price and from treasury stock when the exercise price is greater than the treasury stock repurchase price.
Generally, the stock option awards have a four-year vesting period, with 50% of the award vesting on or after the third anniversary of the grant date and the remaining 50% of the award vesting on or after the fourth anniversary of the grant date, provided the applicable stock price performance hurdle is met. There were no stock options granted in 2021, 2020 or 2019.
Employee Stock Purchase Plan
The ESPP is designed to allow eligible employees to purchase shares of our common stock at a discount of 15% off the lower of the fair market value of our common stock at the beginning or end of a six-month offering period (each period being the first and second six months in a calendar year).
Under this plan, we issued 116,024; 100,022; and 107,009 shares to employees during the years ended December 31, 2021, 2020 and 2019, respectively. As of February 2022, 1,669,317 shares remain available for issuance under the ESPP.
Benefit Plans
The Radian Group Inc. Savings Incentive Plan (“Savings Plan”) covers substantially all of our full-time and our part-time employees. Participants can contribute up to 100% of their eligible earnings as pretax and/or after-tax (“Roth IRA”) contributions up to a maximum Internal Revenue Service annual limit, which was $19,500 for 2021. The Savings Plan also includes a catch-up contribution provision whereby participants who are or will be age 50 and above during the Savings Plan year may contribute an additional contribution. The maximum catch-up contribution for the Savings Plan in 2021 was $6,500. We match up to 100% of the first 6.0% of eligible compensation contributed in any given year. Our expense for matching funds for the years ended December 31, 2021, 2020 and 2019 was $7.8 million, $7.8 million and $5.6 million, respectively.
Item 9. Changes in and Disagreements with Accountants on Accounting and Financial Disclosure
None.
Item 9A. Controls and Procedures
Disclosure Controls and Procedures
We maintain disclosure controls and procedures designed to provide reasonable assurance that information required to be disclosed in the reports we file or submit under the Exchange Act is recorded, processed, summarized and reported within the time periods specified in the SEC’s rules and forms and that such information is accumulated and communicated to our management, including our Chief Executive Officer and Chief Financial Officer, as appropriate, to allow timely decisions regarding required disclosure.
Our management, including our Chief Executive Officer and Chief Financial Officer, conducted an evaluation of the effectiveness of our disclosure controls and procedures (as defined in Rules 13a-15(e) and 15d-15(e) of the Exchange Act) as of December 31, 2021 pursuant to Rule 15d-15(b) under the Exchange Act. Management necessarily applied its judgment in assessing the costs and benefits of such controls and procedures, which by their nature, can provide only reasonable assurance regarding management’s control objectives. Management does not expect that our disclosure controls and procedures will prevent or detect all errors and fraud. A control system, irrespective of how well it is designed and operated, can only provide reasonable assurance and cannot guarantee that it will succeed in its stated objectives.
Based upon that evaluation, our Chief Executive Officer and Chief Financial Officer concluded that, as of December 31, 2021, our disclosure controls and procedures were effective to provide reasonable assurance that the information required to be disclosed by us in the reports we file or submit under the Exchange Act is recorded, processed, summarized and reported within the time periods specified in the SEC’s rules and forms.
Management’s Report on Internal Control over Financial Reporting
Our management is responsible for establishing and maintaining adequate internal control over financial reporting, as such term is defined in Exchange Act Rule 13a-15(f). Our internal control over financial reporting is a process designed to provide reasonable assurance regarding the reliability of financial reporting and the preparation of financial statements for external purposes in accordance with GAAP. Our internal control over financial reporting includes those policies and procedures that: (i) pertain to the maintenance of records that in reasonable detail accurately and fairly reflect our transactions and dispositions of our assets; (ii) provide reasonable assurance that transactions are recorded as necessary to permit preparation of financial statements in accordance with GAAP and that our receipts and expenditures are being made only in accordance with authorizations of our management and our directors; and (iii) provide reasonable assurance regarding prevention or timely detection of unauthorized acquisition, use or disposition of our assets that could have a material effect on the financial statements.
Because of its inherent limitations, internal control over financial reporting may not prevent or detect misstatements. Also, projections of any evaluation of effectiveness to future periods are subject to the risk that controls may become inadequate because of changes in conditions, or that the degree of compliance with the policies or procedures may deteriorate.
Our management, with the participation of our Chief Executive Officer and Chief Financial Officer, assessed the effectiveness of our internal control over financial reporting, as of December 31, 2021, using the criteria described in Internal Control-Integrated Framework (2013) issued by the Committee of Sponsoring Organizations of the Treadway Commission. Based on our evaluation under the updated internal control framework in Internal Control-Integrated Framework (2013), management concluded that our internal control over financial reporting was effective as of December 31, 2021. The effectiveness of our internal control over financial reporting as of December 31, 2021 has been audited by PricewaterhouseCoopers LLP, an independent registered public accounting firm, as stated in their report appearing in Item 8 of this Annual Report on Form 10-K.
Changes in Internal Control over Financial Reporting
There was no change in the internal control over financial reporting that occurred during the quarter ended December 31, 2021 that has materially affected, or is reasonably likely to materially affect, our internal control over financial reporting.
Item 9B. Other Information
None.
Item 9C. Disclosure Regarding Foreign Jurisdictions that Prevent Inspections
None.
PART III
Item 10. Directors, Executive Officers and Corporate Governance
The information required by this Item is incorporated by reference to, and will be contained in, our definitive proxy statement, which will be filed within 120 days after December 31, 2021. Accordingly, we have omitted the information from this Item pursuant to General Instruction G (3) of Form 10-K.
Item 11. Executive Compensation
The information required by this Item is incorporated by reference to, and will be contained in, our definitive proxy statement, which will be filed within 120 days after December 31, 2021. Accordingly, we have omitted the information from this Item pursuant to General Instruction G (3) of Form 10-K.
Item 12. Security Ownership of Certain Beneficial Owners and Management and Related Stockholder Matters
The information required by this Item is incorporated by reference to, and will be contained in, our definitive proxy statement, which will be filed within 120 days after December 31, 2021. Accordingly, we have omitted the information from this Item pursuant to General Instruction G (3) of Form 10-K.
Equity Compensation Plans
The following table sets forth certain information relating to the Company’s equity compensation plans as of December 31, 2021. Each number of securities reflected in the table is a reference to shares of our common stock.
| | | | | | | | | | | | | | | | | | | | | | | |
| Equity compensation plans | | | | | | | |
| | | | | | | |
Plan category (1) | | (a)
Number of securities to
be issued upon exercise
of outstanding options,
warrants and rights | (b)
Weighted-average
exercise price of
outstanding options,
warrants and rights | (c)
Number of securities
remaining available for
future issuance under
equity compensation plans
(excluding securities
reflected in column (a)) |
Equity compensation plans approved by stockholders (2) | | 4,774,947 | | (3) | $ | 1.44 | | (4) | 11,877,901 | | (5) |
| Equity compensation plans not approved by stockholders | | — | | | — | | | — | | |
| Total | | 4,774,947 | | (3) | $ | 1.44 | | (4) | 11,877,901 | | (5) |
(1)The table does not include information for equity compensation plans assumed by us in mergers, under which we do not grant additional awards.
(2)These plans consist of our Equity Plans and our ESPP.
(3)Represents 12,265 shares of phantom stock issued under our 1995 Equity Plan, 49,552 shares of phantom stock, 229,227 non-qualified stock options and 389,294 RSUs issued under our 2008 Equity Plan, 334,679 non-qualified stock options and 2,691,465 RSUs issued under our 2017 Equity Plan and 1,068,465 RSUs issued under our 2021 Equity Plan. Of the RSUs included herein, 2,340,673 are performance-based stock-settled RSUs that could potentially pay out between 0% and 200% of this represented target.
(4)The shares of phantom stock and RSUs were granted at full value, and therefore, have a weighted-average exercise price of $0. Excluding shares of phantom stock and RSUs from this calculation, the weighted-average exercise price of outstanding non-qualified stock options was $12.21 at December 31, 2021.
(5)Includes 10,152,156 shares available for issuance under our 2021 Equity Plan and Prior Equity Plans, and 1,725,745 shares available for issuance under our ESPP, in each case as of December 31, 2021. In January 2022, we issued 56,428 shares from the shares available for issuance under our ESPP. As of February 2022, 1,669,317 shares remain available for issuance under the ESPP.
Item 13. Certain Relationships and Related Transactions, and Director Independence
The information required by this Item is incorporated by reference to, and will be contained in, our definitive proxy statement, which will be filed within 120 days after December 31, 2021. Accordingly, we have omitted the information from this Item pursuant to General Instruction G (3) of Form 10-K.
Item 14. Principal Accountant Fees and Services
The information required by this Item is incorporated by reference to, and will be contained in, our definitive proxy statement, which will be filed within 120 days after December 31, 2021. Accordingly, we have omitted the information from this Item pursuant to General Instruction G (3) of Form 10-K.
PART IV
Item 15. Exhibits and Financial Statement Schedules
(a)
1.Financial Statements—See the “Index to Consolidated Financial Statements” included in Item 8 on page 99 of this report for a list of the financial statements filed as part of this report. 2.Exhibits—See “Index to Exhibits” on page 157 of this report for a list of exhibits filed as part of this report. 3.Financial Statement Schedules—The following financial statement schedules are filed as part of this Form 10-K and appear immediately following the signature page.
| | | | | |
Schedule I—Summary of investments—other than investments in related parties (December 31, 2021) | |
| Schedule II—Financial information of Radian Group Inc., Parent Company Only (Registrant) | |
Condensed Balance Sheets as of December 31, 2021 and 2020 | |
Condensed Statements of Operations for the Years Ended December 31, 2021, 2020 and 2019 | |
Condensed Statements of Cash Flows for the Years Ended December 31, 2021, 2020 and 2019 | |
| Supplemental Notes to Condensed Financial Statements | |
Schedule IV—Reinsurance (December 31, 2021, 2020 and 2019) | |
All other schedules are omitted because the required information is not present or is not present in amounts sufficient to require submission of the schedules, or because the information required is included in our Consolidated Financial Statements and notes thereto.
Item 16. Form 10-K Summary
None.
Index to Exhibits
| | | | | |
Exhibit
Number | Exhibit |
| |
| 3.1 |
|
| 3.2 |
|
| 3.3 |
|
| 3.4 |
|
| 3.5 |
|
| 3.6 |
|
| 3.7 |
|
| 3.8 |
|
| 3.9 | |
| 4.1 |
|
| 4.2 |
|
| 4.3 |
|
| 4.4 |
|
| 4.5 |
|
| | | | | |
Exhibit
Number | Exhibit |
| |
| 4.6 |
|
4.7 |
|
4.8 |
|
| 4.9 |
|
*+10.1 |
|
*+10.2 |
|
| 10.3 |
|
| +10.4 |
|
| +10.5 |
|
| +10.6 |
|
| +10.7 |
|
| +10.8 |
|
| +10.9 |
|
| +10.10 |
|
| +10.11 |
|
| | | | | |
Exhibit
Number | Exhibit |
| |
| +10.12 |
|
| 10.13 | Global Expense Allocation and Services Agreement, effective as of January 1, 2016, between the Registrant and each of its insurance subsidiaries: Radian Guaranty Inc., Radian Insurance Inc., Radian Mortgage Assurance Inc., Radian Mortgage Insurance Inc., Radian Guaranty Reinsurance Inc., Radian Reinsurance Inc., Radian Mortgage Guaranty Inc. and Radian Investor Surety Inc. (incorporated by reference to Exhibit 10.14 to the Registrant’s Annual Report on Form 10-K (file no. 1-11356) for the year ended December 31, 2019)
|
| 10.14 |
|
| +10.15 |
|
| +10.16 |
|
| +10.17 |
|
| +10.18 | Confidential Settlement Agreement and Release, dated as of September 16, 2014 by and among Radian Guaranty Inc., Countrywide Home Loans, Inc., and Bank of America, N.A., as a successor to BofA Home Loans Servicing f/k/a Countrywide Home Loans Servicing LP on its own behalf and as successor in interest by de jure merger to Countrywide Bank FSB, formerly Treasury Bank (incorporated by reference to Exhibit 10.1 to the Registrant’s Current Report on Form 8-K (file no. 1-11356) dated September 16, 2014 and filed on September 19, 2014)
|
| 10.19 |
|
| +10.20 |
|
| +10.21 |
|
| +10.22 |
|
| +10.25 |
|
| | | | | |
Exhibit
Number | Exhibit |
| |
| +10.26 |
|
| +10.27 |
|
| +10.28 |
|
| +10.29 |
|
| +10.30 |
|
| +10.31 |
|
| +10.32 |
|
| +10.33 |
|
| +10.34 |
|
| +10.35 |
|
| +10.36 |
|
| 10.37 |
|
| +10.38 |
|
| +10.39 |
|
| | | | | |
Exhibit
Number | Exhibit |
| |
| +10.40 |
|
| +10.41 |
|
+10.42 |
|
+10.43 |
|
+10.44 |
|
+10.45 |
|
+10.46 |
|
+10.47 |
|
+10.48 |
|
+10.49 | Credit Agreement by and among the Registrant, Royal Bank of Canada, as Administrative Agent, U.S. Bank National Association (“U.S. Bank”), as Syndication Agent, RBC Capital Markets and U.S. Bank as Joint Lead Arrangers and Joint Book Runners, Associated Bank, National Association, as Documentation Agent, and certain other banks and financial institutions serving as lenders (incorporated by reference to Exhibit 10.1 to the Registrant’s Current Report on Form 8-K (file no. 1-11356) dated December 7, 2021 and filed on December 8, 2021)
|
+10.50 |
|
| *21 |
|
| *23.1 |
|
| *31 |
|
| | | | | |
Exhibit
Number | Exhibit |
| |
| **32 |
|
| *101.INS | Inline XBRL Instance Document - the instance document does not appear in the Interactive Data File because its XBRL tags are embedded within the Inline XBRL document.
|
| *101.SCH | Inline XBRL Taxonomy Extension Schema Document
|
| *101.CAL | Inline XBRL Taxonomy Extension Calculation Linkbase Document
|
| *101.DEF | Inline XBRL Taxonomy Extension Definition Linkbase Document
|
| *101.LAB | Inline XBRL Taxonomy Extension Label Linkbase Document
|
| *101.PRE | Inline XBRL Taxonomy Extension Presentation Linkbase Document |
| *104 | Cover Page Interactive Data File (formatted as Inline XBRL and contained in Exhibit 101.INS)
|
* Filed herewith.
** Furnished herewith.
+ Management contract, compensatory plan or arrangement
Signatures
Pursuant to the requirements of Section 13 or 15(d) of the Securities Exchange Act of 1934, the registrant has duly caused this report to be signed on its behalf by the undersigned, thereunto duly authorized, on February 25, 2022.
| | | | | |
| Radian Group Inc. |
| |
| By: | /s/ Richard G. Thornberry |
| Richard G. Thornberry
Chief Executive Officer |
Pursuant to the requirements of the Securities Exchange Act of 1934, this report has been signed below on February 25, 2022, by the following persons on behalf of the registrant and in the capacities indicated.
| | | | | | | | |
| Name | | Title |
| /s/ RICHARD G. THORNBERRY | | Chief Executive Officer (Principal Executive Officer) and Director |
Richard G. Thornberry | | |
| | |
| /s/ J. FRANKLIN HALL | | Senior Executive Vice President, Chief Financial Officer (Principal Financial Officer) |
J. Franklin Hall | | |
| | |
| /s/ ROBERT J. QUIGLEY | | Executive Vice President, Corporate Controller (Principal Accounting Officer) |
Robert J. Quigley | | |
| | |
| /s/ HOWARD B. CULANG | | Non-Executive Chairman of the Board |
Howard B. Culang | | |
| | |
| /s/ BRAD L. CONNER | | Director |
Brad L. Conner | | |
| | |
| /s/ DEBRA HESS | | Director |
Debra Hess | | |
| | |
| /s/ LISA W. HESS | | Director |
Lisa W. Hess | | |
| | |
| /s/ BRIAN D. MONTGOMERY | | Director |
| Brian D. Montgomery | | |
| | |
| /s/ LISA MUMFORD | | Director |
| Lisa Mumford | | |
| | |
| /s/ GAETANO J. MUZIO | | Director |
| Gaetano J. Muzio | | |
| | |
| /s/ GREGORY V. SERIO | | Director |
Gregory V. Serio | | |
| | |
| /s/ NOEL J. SPIEGEL | | Director |
Noel J. Spiegel | | |
Radian Group Inc. and Its Consolidated Subsidiaries
Schedule I
Summary of Investments—Other Than Investments in Related Parties
December 31, 2021
| | | | | | | | | | | | | | | | | | | | | | | | | | |
| (In thousands) | | Amortized
Cost | | Fair Value | | Amount Reflected on the Consolidated Balance Sheet |
| Type of Investment | | | | | | | | |
| Fixed-maturities available for sale | | | | | | | | |
| Bonds | | | | | | | | |
| U.S. government and agency securities | | $ | 221,407 | | | $ | 221,730 | | | | $ | 221,730 | | |
| State and municipal obligations | | 162,964 | | | 177,257 | | | | 177,257 | | |
| Corporate bonds and notes | | 2,867,063 | | | 2,975,842 | | | | 2,975,842 | | |
| RMBS | | 697,581 | | | 705,117 | | | | 705,117 | | |
| CMBS | | 690,827 | | | 709,203 | | | | 709,203 | | |
| CLO | | 529,906 | | | 530,040 | | | | 530,040 | | |
| Other ABS | | 210,657 | | | 211,187 | | | | 211,187 | | |
| Foreign government and agency securities | | 5,109 | | | 5,296 | | | | 5,296 | | |
Mortgage insurance-linked notes (1) | | 45,384 | | | 47,017 | | | | 47,017 | | |
| | | | | | | | |
| Total securities available for sale | | 5,430,898 | | | 5,582,689 | | (2) | | 5,582,689 | | (2) |
| Trading securities | | 234,757 | | | 256,929 | | (3) | | 256,929 | | (3) |
| Equity securities | | | | | | | | |
| Common stocks | | 211,905 | | | 222,247 | | | | 222,247 | | |
| | | | | | | | |
| Total equity securities | | 211,905 | | | 222,247 | | (4) | | 222,247 | | (4) |
Short-term investments (5) | | 551,516 | | | 551,508 | | | | 551,508 | | |
| Other invested assets | | 3,575 | | | 4,165 | | | | 4,165 | | |
| Total investments other than investments in related parties | | $ | 6,432,651 | | | $ | 6,617,538 | | | | $ | 6,617,538 | | |
(1)Comprises the notes purchased by Radian Group in connection with the Excess-of-Loss Program. See Note 8 for more information about our reinsurance programs.
(2)Includes $65.6 million of fixed-maturity securities available for sale loaned under securities lending agreements that are classified as other assets in our consolidated balance sheets.
(3)Includes $0.4 million of trading securities loaned under securities lending agreements that are classified as other assets in our consolidated balance sheets.
(4)Includes $38.0 million of equity securities loaned under securities lending agreements that are classified as other assets in our consolidated balance sheets.
(5)Includes cash collateral held under securities lending agreements of $48.7 million that is reinvested in money market instruments.
Schedule II—Financial Information of Registrant
Condensed Balance Sheet
Parent Company Only
| | | | | | | | | | | | | | |
| (In thousands, except per-share amounts) | | December 31,
2021 | | December 31,
2020 |
| Assets | | | | |
| Investments | | | | |
Fixed-maturities available for sale—at fair value (amortized cost of $485,727 and $836,191) | | $ | 481,659 | | | $ | 844,393 | |
| | | | |
| | | | |
| | | | |
| Short-term investments—at fair value | | 120,601 | | | 233,569 | |
| Other invested assets—at fair value | | 3,511 | | | 3,000 | |
| Total investments | | 605,771 | | | 1,080,962 | |
| Cash | | 38,846 | | | 20,141 | |
| | | | |
| Investment in subsidiaries, at equity in net assets (Note C) | | 5,210,917 | | | 4,545,508 | |
| | | | |
| Accounts and notes receivable | | 100,002 | | | 300,656 | |
| | | | |
| | | | |
| Other assets (Note C) | | 65,923 | | | 75,305 | |
| Total assets | | $ | 6,021,459 | | | $ | 6,022,572 | |
| | | | |
| Liabilities and Stockholders’ Equity | | | | |
| | | | |
| | | | |
| | | | |
| Liabilities | | | | |
| Senior notes | | $ | 1,409,473 | | | $ | 1,405,674 | |
| | | | |
| Net deferred tax liability (Note A) | | 283,585 | | | 272,868 | |
| Other liabilities | | 69,605 | | | 59,677 | |
| Total liabilities | | 1,762,663 | | | 1,738,219 | |
| Common stockholders’ equity | | | | |
| Common stock: par value $0.001 per share; 485,000 shares authorized at December 31, 2021 and 2020; 194,408 and 210,130 shares issued at December 31, 2021 and 2020, respectively; 175,421 and 191,606 shares outstanding at December 31, 2021 and 2020, respectively | | 194 | | | 210 | |
| Treasury stock, at cost: 18,987 and 18,524 shares at December 31, 2021 and 2020, respectively | | (920,798) | | | (910,115) | |
| Additional paid-in capital | | 1,878,372 | | | 2,245,897 | |
| Retained earnings | | 3,180,935 | | | 2,684,636 | |
| Accumulated other comprehensive income (loss) | | 120,093 | | | 263,725 | |
| Total common stockholders’ equity | | 4,258,796 | | | 4,284,353 | |
| Total liabilities and stockholders’ equity | | $ | 6,021,459 | | | $ | 6,022,572 | |
See Supplemental Notes.
166
Schedule II—Financial Information of Registrant
Condensed Statements of Operations
Parent Company Only
| | | | | | | | | | | | | | | | | | | | |
| | | Years Ended December 31, |
| (In thousands) | | 2021 | | 2020 | | 2019 |
| Revenues | | | | | | |
| Net investment income | | $ | 7,540 | | | $ | 19,459 | | | $ | 19,751 | |
| Net gains on investments and other financial instruments | | 980 | | | 5,682 | | | 12,863 | |
| Other income | | 11 | | | 101 | | | 218 | |
| Total revenues | | 8,531 | | | 25,242 | | | 32,832 | |
| | | | | | |
| Expenses | | | | | | |
| Loss on extinguishment of debt | | — | | | — | | | 22,738 | |
| | | | | | |
| | | | | | |
| Other operating expenses | | 3,163 | | | 2,619 | | | — | |
| Total expenses (Note B) | | 3,163 | | | 2,619 | | | 22,738 | |
| | | | | | |
| Pretax income | | 5,368 | | | 22,623 | | | 10,094 | |
| Income tax provision (benefit) | | 1,167 | | | (3,165) | | | (19,997) | |
| Equity in net income of affiliates | | 596,470 | | | 367,838 | | | 642,218 | |
| Net income | | 600,671 | | | 393,626 | | | 672,309 | |
| Other comprehensive income (loss), net of tax | | (143,632) | | | 153,237 | | | 171,408 | |
| Comprehensive income | | $ | 457,039 | | | $ | 546,863 | | | $ | 843,717 | |
See Supplemental Notes.
167
Schedule II—Financial Information of Registrant
Condensed Statements of Cash Flows
Parent Company Only
| | | | | | | | | | | | | | | | | | | | |
| | Years Ended December 31, |
| (In thousands) | | 2021 | | 2020 | | 2019 |
| | | | | | |
| Cash flows from operating activities | | | | | | |
Net cash provided by (used in) operating activities (1) | | $ | 66,317 | | | $ | (13,741) | | | $ | 143,664 | |
| | | | | | |
| Cash flows from investing activities | | | | | | |
| Proceeds from sales of: | | | | | | |
| Fixed-maturities available for sale | | 195,452 | | | 304,737 | | | 296,171 | |
| Trading securities | | — | | | — | | | 56,787 | |
| Equity securities | | — | | | 13,401 | | | 16,916 | |
| Proceeds from redemptions of: | | | | | | |
| Fixed-maturities available for sale | | 301,788 | | | 238,161 | | | 149,767 | |
| Trading securities | | — | | | — | | | 114 | |
| | | | | | |
| Purchases of: | | | | | | |
| Fixed-maturities available for sale | | (156,344) | | | (691,874) | | | (293,284) | |
| | | | | | |
| | | | | | |
| Sales, redemptions and (purchases) of: | | | | | | |
| Short-term investments, net | | 113,939 | | | (53,024) | | | 157,045 | |
| Other assets, net | | (864) | | | (6,068) | | | (6,958) | |
| Capital distributions from subsidiaries | | 44,951 | | | 19,000 | | | 6,000 | |
| Capital contributions to subsidiaries | | (43,250) | | | (5,050) | | | (65,879) | |
| | | | | | |
| | | | | | |
| Net cash provided by (used in) investing activities | | 455,672 | | | (180,717) | | | 316,679 | |
| | | | | | |
| Cash flows from financing activities | | | | | | |
| Dividends and dividend equivalents paid | | (103,298) | | | (97,458) | | | (2,061) | |
| Issuance of common stock | | 1,382 | | | 1,553 | | | 2,416 | |
| Repurchases of common stock | | (399,100) | | | (226,305) | | | (300,201) | |
| Issuance of senior notes, net | | — | | | 515,567 | | | 442,439 | |
| Repayments and repurchases of senior notes | | — | | | — | | | (610,763) | |
| Credit facility commitment fees paid | | (3,325) | | | (2,292) | | | (989) | |
| Change in secured borrowings | | 1,057 | | | — | | | — | |
| Net cash provided by (used in) financing activities | | (503,284) | | | 191,065 | | | (469,159) | |
Effect of exchange rate changes on cash and restricted cash | | — | | | — | | | (2) | |
| Increase (decrease) in cash and restricted cash | | 18,705 | | | (3,393) | | | (8,818) | |
| Cash and restricted cash, beginning of period | | 20,141 | | | 23,534 | | | 32,352 | |
| Cash and restricted cash, end of period | | $ | 38,846 | | | $ | 20,141 | | | $ | 23,534 | |
(1)Includes cash distributions received from subsidiaries of $85.0 million, $1.7 million and $26.6 million in 2021, 2020 and 2019, respectively. Excludes non-cash distributions received from subsidiaries of $92.3 million, $484.1 million and $362.4 million in 2021, 2020 and 2019, respectively.
See Supplemental Notes.
168
Schedule II—Financial Information of Registrant
Parent Company Only
Supplemental Notes
Note A
The Radian Group Inc. (the “Parent Company,” “we” or “our”) financial statements represent the stand-alone financial statements of the Parent Company. These financial statements have been prepared on the same basis and using the same accounting policies as described in the consolidated financial statements included herein, except that the Parent Company uses the equity-method of accounting for its majority-owned subsidiaries. These financial statements should be read in conjunction with our consolidated financial statements and the accompanying notes thereto.
See Notes 12 and 14 of Notes to Consolidated Financial Statements for additional information on the Parent Company’s debt obligations and capital stock.
The Parent Company has entered into the following intercompany guarantees with certain of our subsidiaries:
■Radian Group and Radian Mortgage Assurance are parties to a guaranty agreement, which provides that Radian Group will make sufficient funds available to Radian Mortgage Assurance to ensure that Radian Mortgage Assurance has a minimum of $5.0 million of statutory policyholders’ surplus every calendar quarter. Radian Mortgage Assurance had $9.0 million of statutory policyholders’ surplus and no RIF exposure as of December 31, 2021.
■To allow our mortgage insurance customers to comply with applicable securities regulations for issuers of ABS (including mortgage-backed securities), Radian Group has guaranteed two structured transactions for Radian Guaranty with $63.3 million of aggregate remaining credit exposure as of December 31, 2021.
As of December 31, 2021, Radian Group recorded a net deferred tax liability of $283.6 million. This balance includes liabilities related to certain of our subsidiaries, which have incurred federal NOLs that could not be carried-back and utilized on a separate company tax return basis. As a result, we are not currently obligated under our tax-sharing agreement to reimburse these subsidiaries for their separate company federal NOL carryforward. However, if in a future period one of these subsidiaries utilizes its share of federal NOL carryforwards on a separate entity basis, then Radian Group may be obligated to fund such subsidiary’s share of our consolidated tax liability to the Internal Revenue Service.
Note B
The Parent Company provides certain services to its subsidiaries. The Parent Company allocates to its subsidiaries expenses it incurs in the capacity of supporting those subsidiaries, including operating expenses, which are allocated based on the forecasted annual percentage of total revenue, which approximates the estimated percentage of time spent on certain subsidiaries, and interest expense, which is allocated based on relative capital. These expenses are presented net of allocations in the Condensed Statements of Operations. Substantially all operating expenses and interest expense have been allocated to the subsidiaries for 2021, 2020 and 2019.
Amounts allocated to the subsidiaries for expenses are based on actual cost, without any mark-up. The Parent Company considers these charges to be fair and reasonable. The subsidiaries generally reimburse the Parent Company for these costs in a timely manner, which has the impact of temporarily improving the cash flows of the Parent Company, if accrued expenses are reimbursed prior to actual payment.
The following table shows the components of our Parent Company expenses that have been allocated to our subsidiaries for the periods indicated.
| | | | | | | | | | | | | | | | | | | | |
| Total allocated expenses | | | | | | |
| | | | | | |
| | Years Ended December 31, |
| (In thousands) | | 2021 | | 2020 | | 2019 |
| Allocated operating expenses | | $ | 147,386 | | | $ | 129,870 | | | $ | 124,412 | |
| Allocated interest expense | | 82,833 | | | 68,938 | | | 53,692 | |
| Total allocated expenses | | $ | 230,219 | | | $ | 198,808 | | | $ | 178,104 | |
Note C
During 2021, certain non-insurance subsidiaries had not generated sufficient cash flow to reimburse the Parent Company for its share of its direct and allocated operating expenses, and therefore the Parent Company effectively contributed a total of $48.5 million to these subsidiaries to reflect the impairment of the intercompany receivables representing unreimbursed direct and allocated costs.
See Note 16 of Notes to Consolidated Financial Statements for additional information related to capital transactions between the Parent Company and its consolidated insurance subsidiaries, including a $500 million return of capital from Radian Guaranty to Radian Group, which was paid on February 11, 2022.
Schedule IV—Reinsurance
Insurance Premiums Earned
Years Ended December 31, 2021, 2020 and 2019
| | | | | | | | | | | | | | | | | | | | | | | | | | | | | | | | |
|
| | | | | | | | | | |
| ($ in thousands) | | Gross
Amount | | Ceded
to Other
Companies | | Assumed
from Other
Companies | | Net
Amount | | Assumed Premiums
as a Percentage
of Net Premiums |
| 2021 | | | | | | | | | | |
| Mortgage insurance | | $ | 1,104,696 | | | $ | 113,480 | | | $ | 7,066 | | | $ | 998,282 | | | 0.71% |
| Title insurance | | 39,665 | | | 764 | | | — | | | 38,901 | | | 0.00% |
| Total | | $ | 1,144,361 | | | $ | 114,244 | | | $ | 7,066 | | | $ | 1,037,183 | | | 0.68% |
| | | | | | | | | | |
| 2020 | | | | | | | | | | |
| Mortgage insurance | | $ | 1,263,684 | | | $ | 183,131 | | | $ | 12,214 | | | $ | 1,092,767 | | | 1.12% |
| Title insurance | | 22,843 | | | 289 | | | — | | | 22,554 | | | 0.00% |
| Total | | $ | 1,286,527 | | | $ | 183,420 | | | $ | 12,214 | | | $ | 1,115,321 | | | 1.10% |
| | | | | | | | | | |
| 2019 | | | | | | | | | | |
| Mortgage insurance | | $ | 1,233,528 | | | $ | 109,696 | | | $ | 10,382 | | | $ | 1,134,214 | | | 0.92% |
| Title insurance | | 11,342 | | | 207 | | | — | | | 11,135 | | | 0.00% |
| Total | | $ | 1,244,870 | | | $ | 109,903 | | | $ | 10,382 | | | $ | 1,145,349 | | | 0.91% |