UNITED STATES
SECURITIES AND EXCHANGE COMMISSION
Washington, D.C. 20549
FORM 6-K
REPORT OF FOREIGN PRIVATE ISSUER
PURSUANT TO RULE 13a-16 OR 15d-16 UNDER THE
SECURITIES EXCHANGE ACT OF 1934
Long Form of Press Release
Commission File Number 1-11414
BANCO LATINOAMERICANO DE COMERCIO EXTERIOR, S.A.
(Exact name of Registrant as specified in its Charter)
FOREIGN TRADE BANK OF LATIN AMERICA, INC.
(Translation of Registrant’s name into English)
Business Park Torre V, Ave. La Rotonda, Costa del Este
P.O. Box 0819-08730
Panama City, Republic of Panama
(Address of Registrant’s Principal Executive Offices)
Indicate by check mark whether the registrant files or will file annual reports under cover of Form 20-F or Form 40-F.
Form 20-F x Form 40-F ¨
Indicate by check mark if the registrant is submitting the Form 6-K in paper as permitted by Regulation S-T Rule 101(b)(1):
Yes ¨ No x
Indicate by check mark if the registrant is submitting the Form 6-K in paper as permitted by Regulation S-T Rule 101(b)(7):
Yes ¨ No x
SIGNATURES
Pursuant to the requirements of the Securities Exchange Act of 1934, the registrant has duly caused this report to be signed on its behalf by the undersigned, thereunto duly authorized.
Date: May 10, 2021
FOREIGN TRADE BANK OF LATIN
AMERICA, INC.
(Registrant)
| By: | /s/ Ana Graciela de Méndez | |
| Name: Ana Graciela de Méndez | ||
| Title: CFO | ||

BLADEX ANNOUNCES FIRST QUARTER 2021 PROFIT OF $12.8 MILLION, OR $0.32 PER SHARE
PANAMA CITY, REPUBLIC OF PANAMA, May 5, 2021
Banco Latinoamericano de Comercio Exterior, S.A. (NYSE: BLX, “Bladex”, or “the Bank”), a Panama-based multinational bank originally established by the central banks of 23 Latin-American and Caribbean countries to promote foreign trade and economic integration in the Region, today announced its results for the First Quarter (“1Q21”) ended March 31, 2021.
The consolidated financial information in this document has been prepared in accordance with International Financial Reporting Standards (“IFRS”) as issued by the International Accounting Standards Board (“IASB”).
FINANCIAL SNAPSHOT
| (US$ million, except percentages and per share amounts) | 1Q21 | 4Q20 | 1Q20 | |||||||||
| Key Income Statement Highlights | ||||||||||||
| Net Interest Income ("NII") | $ | 18.9 | $ | 22.3 | $ | 25.8 | ||||||
| Fees and commissions, net | $ | 3.0 | $ | 2.8 | $ | 3.1 | ||||||
| Loss on financial instruments, net | $ | (0.1 | ) | $ | (0.1 | ) | $ | (0.4 | ) | |||
| Total revenues | $ | 22.0 | $ | 25.3 | $ | 28.8 | ||||||
| Reversal for credit losses | $ | 0.0 | $ | 0.3 | $ | 0.1 | ||||||
| Operating expenses | $ | (9.1 | ) | $ | (10.2 | ) | $ | (10.5 | ) | |||
| Profit for the period | $ | 12.8 | $ | 15.7 | $ | 18.3 | ||||||
| Profitability Ratios | ||||||||||||
| Earnings per Share ("EPS") (1) | $ | 0.32 | $ | 0.40 | $ | 0.46 | ||||||
| Return on Average Equity (“ROAE”) (2) | 5.0 | % | 6.1 | % | 7.2 | % | ||||||
| Return on Average Assets (“ROAA”) | 0.8 | % | 1.0 | % | 1.1 | % | ||||||
| Net Interest Margin ("NIM") (3) | 1.24 | % | 1.37 | % | 1.59 | % | ||||||
| Net Interest Spread ("NIS") (4) | 1.04 | % | 1.17 | % | 1.16 | % | ||||||
| Efficiency Ratio (5) | 41.6 | % | 40.2 | % | 36.7 | % | ||||||
| Assets, Capital, Liquidity & Credit Quality | ||||||||||||
| Credit Portfolio (6) | $ | 6,097 | $ | 5,946 | $ | 5,911 | ||||||
| Commercial Portfolio (7) | $ | 5,708 | $ | 5,551 | $ | 5,832 | ||||||
| Investment Portfolio | $ | 389 | $ | 395 | $ | 79 | ||||||
| Total assets | $ | 6,375 | $ | 6,289 | $ | 6,823 | ||||||
| Total equity | $ | 1,037 | $ | 1,038 | $ | 1,018 | ||||||
| Market capitalization (8) | $ | 601 | $ | 628 | $ | 408 | ||||||
| Tier 1 Capital to risk-weighted assets (Basel III – IRB) (9) | 26.3 | % | 26.0 | % | 21.8 | % | ||||||
| Capital Adequacy Ratio (Regulatory) (10) | 19.4 | % | 20.2 | % | 19.2 | % | ||||||
| Total assets / Total equity (times) | 6.1 | 6.1 | 6.7 | |||||||||
| Liquid Assets / Total Assets (11) | 15.6 | % | 16.7 | % | 19.0 | % | ||||||
| Credit-impaired loans to Loan Portfolio (12) | 0.21 | % | 0.22 | % | 1.16 | % | ||||||
| Total allowance for losses to Credit Portfolio (13) | 0.73 | % | 0.75 | % | 1.73 | % | ||||||
| Total allowance for losses to credit-impaired loans (times) (13) | 4.2 | 4.2 | 1.7 |
BUSINESS HIGHLIGHTS |
| · | Sequential quarterly Commercial Portfolio growth continues the trend that started last year, up 3% QoQ to reach $5.7 billion, driven by higher loan origination (+5% QoQ), with a continued focus on defensive sectors and stricter credit underwriting standards. |
| · | During 1Q21, Bladex continues to collect virtually all loan maturities (close to 100% since the onset of Covid-19), evidencing the high quality of the Bank’s borrower base and short-term nature of its business. |
| · | As of March 31, 2021, Bladex’s credit quality remains sound, with a well-diversified exposure across countries, having 57% of the Commercial Portfolio in investment grade countries, 53% with financial institutions and 18% with sovereign and state-owned corporations. As well, Bladex continues with the downsize of exposures to higher risk sectors since the onset of Covid-19, such as sugar (-46%) and airlines (-67%), now representing 1% and 0.8% of the total portfolio, respectively. |
| · | As of March 31, 2021, credit-impaired loans (“NPLs”) totaled $11 million, unchanged from the previous quarter, representing 0.2% of the total Loan Portfolio. Total allowance for expected credit losses remained stable with no credit provision charges during the quarter. |
| · | Bladex maintained a sound and diversified funding structure in 1Q21, supported by the continued growth of its deposit base (+1 QoQ; +29% YoY). In turn, the Bank’s liquidity position remained stable QoQ at $992 million (16% of Total Assets) as of March 31, 2021. |
| · | Bladex’s Profit for 1Q21 was $12.8 million (-19% QoQ, -30% YoY), mostly due to lower Net Interest Income (NII). The 15% QoQ decrease in NII was mainly driven by lower net lending spreads, returning to pre-Covid levels at 150 bps, partially offset by Credit Portfolio growth and lower liquidity levels. The 27% YoY decrease in NII was mainly impacted by lower Libor-based rates and average lending volumes, still below pre-Covid balances. |
| · | Fees and commissions income totaled $3.0 million for 1Q21, relatively stable on absolute terms, on steady fees from the Bank’s letters of credit business. Fees from loan syndication business have been impacted since the onset of the Covid-19 pandemic, but this transaction-based business is starting to pick up, as evidenced by the recent execution of a $300 million loan transaction in April of 2021, where Bladex acted as Joint Lead Arranger. |
| · | Expenses remain closely controlled, down 10% on a sequential quarter basis due to the usual seasonally lower levels of the first quarter of the year. Year-on-year, expenses were down by 13%, mainly on lower personnel expenses related to decreased performance-based variable compensation provision. Efficiency Ratio stood at 41.6%, on lower income generation. |
3
CEO’s Comments |
Mr. Jorge Salas, Bladex’s Chief Executive Officer said: “We entered 2021 with a sound credit portfolio with almost zero NPLs, a robust funding structure and a comfortable liquidity position. This is our third consecutive quarter of growth without relaxing credit underwriting standards. The level of our Commercial Portfolio as of March 2021 was close to that of a year ago, but still more than $800 million below the level of December 2019. On the other hand, despite the uncertainty generated by the delayed vaccination campaigns in some of the countries in the Region, we are starting to see clear signals of recovery for the Region. Recently, the International Monetary Fund revised its 2021 growth estimates for Latin America, from 3% to 4.6% and, what is even more relevant for Bladex, the growth estimates for trade have also been revised upwards from 8.2% to 16.2%, mainly driven by higher volumes and higher commodity prices.”
Mr. Salas added: “Bladex’s first quarter results do not yet reflect this recovery, but we are confident that this will happen as the Region’s economies continue on this upward path. The Board’s decision to carry out a Stock Repurchase for up to $60 million, under an Open Market Program, is a testament to that conviction, while, at the same time, providing us with the financial flexibility to respond to both opportunities and challenges in the Region. In addition, the Board maintained the quarterly dividend at $0.25 cents per share, which also reflects Bladex’s financial strength and earnings quality.”
Mr. Salas concluded: “A year later after I joined the Bank, we have an even cleaner balance sheet, an even more committed team and the Board’s mandate to explore different avenues to grow the Bank and return more value to shareholders remains unchanged. Although the Pandemic continues to pose significant challenges for the Region, we believe that the Bank has many opportunities to grow and to increase its products and services offerings. Bladex is well-prepared to navigate 2021 and we look forward to reporting our progress to you in future quarters.”
RESULTS BY BUSINESS SEGMENT
The Bank’s activities are managed and executed through two business segments, Commercial and Treasury. Information related to each reportable segment is set out below. Business segment results are based on the Bank’s managerial accounting process, which assigns assets, liabilities, revenue and expense items to each business segment on a systemic basis.
COMMERCIAL BUSINESS SEGMENT
The Commercial Business Segment encompasses the Bank’s core business of financial intermediation and fee generation activities developed to cater to corporations, financial institutions and investors in Latin America. These activities include the origination of bilateral short-term and medium-term loans, structured and syndicated credits, loan commitments, and financial guarantee contracts such as issued and confirmed letters of credit, stand-by letters of credit, guarantees covering commercial risk, and other assets consisting of customers’ liabilities under acceptances.
Profits from the Commercial Business Segment include (i) net interest income from loans; (ii) fees and commissions from the issuance, confirmation and negotiation of letters of credit, guarantees and loan commitments, as well as through loan structuring and syndication activities; (iii) gain on sale of loans generated through loan intermediation activities, such as sales and distribution in the primary market; (iv) gain (loss) on sale of financial instruments measured at FVTPL; (v) reversal (provision) for credit losses, (vi) gain (loss) on non-financial assets; and (vii) direct and allocated operating expenses.

Bladex’s Commercial Portfolio reached $5.7 billion at the end of 1Q21, a 3% QoQ increase compared to $5.6 billion a quarter ago, and a 2% YoY decrease compared to a year ago. The 3% QoQ increase was driven by higher loan origination (+5% QoQ), with a continued emphasis on defensive sectors and under stricter credit underwriting standards. Meanwhile, during 1Q21 the Bank continues to collect virtually all loan maturities (close to 100% during 1Q21 and since the onset of Covid-19), evidencing the high quality of the Bank’s borrower base and short-term nature of its business. On an average basis, Commercial Portfolio balances reached $5.4 billion for the 1Q21 (+3% QoQ; -13% YoY), also evidencing the continuing growth during the quarter, but still trailing pre-Covid levels.
As of March 31, 2021, 77% of the Commercial Portfolio was scheduled to mature within a year, up 2 pp compared from a quarter and 8 pp from a year ago. Trade finance transactions represented 57% of the short-term origination, stable compared to a quarter ago and up 2 pp compared to a year ago.
The following graphs illustrate the geographic distribution of the Bank’s Commercial Portfolio, highlighting the portfolio´s risk diversification by country and across industry segments:
4
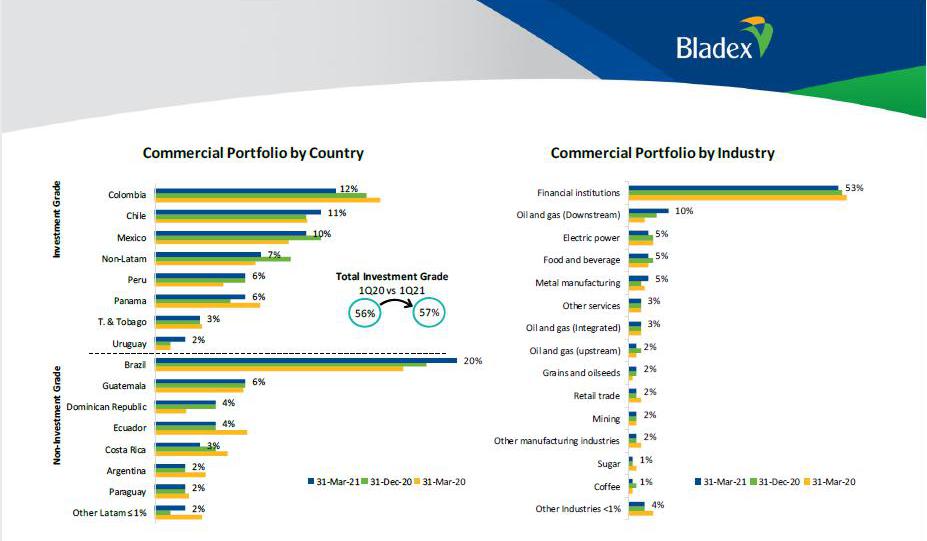
As of March 31, 2021, Bladex’s credit quality remains sound, with a well-diversifed exposure across countries, having 57% of the Commercial Portfolio geographically distributed in investment grade countries, down 2 pp from the previous quarter and up 1 pp from a year ago. On a country-risk basis, Brazil represented the largest country-risk exposure at 20% of the total Commercial Portfolio, of which 90% was with financial institutions. Other relevant country-risk exposures were to investment grade countries such as Colombia at 12%, Chile at 11% Mexico at 10%, and top-rated countries outside of Latin America (which relates to transactions carried out in Latin America) at 7% of the total portfolio. The Bank also continues adjusting its exposure towards lower-risk countries, evidenced by a $63 million, or 185% increase in Uruguay, now representing 2% of total Commercial Portfolio, while continuing to decrease exposure in Argentina, down 18% QoQ, representing 2% of the total Commercial Portfolio.
The Commercial Portfolio by industries also remained well-diversified and focused on high quality borrowers, as exposure to the Bank’s traditional client base of financial institutions increased $31 million QoQ, or 1%, now representing 53% of the total Commercial Portfolio, down 1 pp QoQ, while exposure to sovereign and state-owned corporations increased 2 pp QoQ to reach 18% of the total portfolio at the end of 1Q21. The remainder remains with top tier corporates throughout the Region. Across corporate sectors, most industries represented 5% or less of the total Commercial Portfolio, except for certain sectors that the Bank considers as defensive under the current context, such as Oil & Gas (Downstream) at 10% of the Commercial Portfolio at the end of 1Q21. In addition, Bladex continues with the downsize of exposures to higher risk sectors since the onset of Covid-19, such as sugar (-46%) and airline (-67%) industries, now representing 1% and 0.8%, respectively, of the total portfolio at the end of 1Q21.
Refer to Exhibit VII for additional information related to the Bank’s Commercial Portfolio distribution by country, and Exhibit IX for the Bank’s distribution of loan disbursements by country.
5

| (US$ million) | 1Q21 | 4Q20 | 1Q20 | QoQ (%) | YoY (%) | |||||||||||||||
| Commercial Business Segment: | ||||||||||||||||||||
| Net interest income | $ | 18.7 | $ | 21.0 | $ | 24.8 | -11 | % | -24 | % | ||||||||||
| Other income | 3.3 | 3.1 | 3.3 | 5 | % | -3 | % | |||||||||||||
| Total revenues | 22.0 | 24.1 | 28.1 | -9 | % | -22 | % | |||||||||||||
| Reversal for credit losses | 0.0 | 0.5 | 0.1 | -93 | % | -58 | % | |||||||||||||
| Gain on non-financial assets, net | 0.0 | 0.3 | 0.0 | -100 | % | n.m. | ||||||||||||||
| Operating expenses | (7.1 | ) | (7.9 | ) | (7.3 | ) | 10 | % | 3 | % | ||||||||||
| Profit for the segment | $ | 14.9 | $ | 17.1 | $ | 20.9 | -13 | % | -29 | % |
"n.m." means not meaningful.
The Commercial Business Segment’s Profit was $14.9 million for 1Q21 (-13% QoQ; -29% YoY). The QoQ 13% and the YoY 29% decrease was mostly attributable to lower Net Interest Income, as the Commercial Business Segment’s 11% NII QoQ decrease was mainly driven by lower net lending spreads, returning to pre-Covid levels at 150 bps, partially offset by higher average lending volume, and the 24% NII YoY decrease was mainly impacted by lower Libor-based rates and average lending volumes, still below pre-Covid balances.
TREASURY BUSINESS SEGMENT
The Treasury Business Segment focuses on managing the Bank’s investment portfolio and the overall structure of its assets and liabilities to achieve more efficient funding and liquidity positions for the Bank, mitigating the traditional financial risks associated with the balance sheet, such as interest rate, liquidity, price and currency risks. Interest-earning assets managed by the Treasury Business Segment include liquidity positions in cash and cash equivalents, as well as highly liquid corporate debt securities rated above ‘A-‘, and financial instruments related to the investment management activities, consisting of securities at fair value through other comprehensive income (“FVOCI”) and securities at amortized cost (the “Investment Portfolio”). The Treasury Business Segment also manages the Bank’s interest-bearing liabilities, which constitute its funding sources, mainly deposits, short- and long-term borrowings and debt.
Profits from the Treasury Business Segment include net interest income derived from the above-mentioned treasury assets and liabilities, and related net other income (net results from derivative financial instruments and foreign currency exchange, gain (loss) per financial instruments at fair value through profit or loss (“FVTPL”), gain (loss) on sale of securities at FVOCI, and other income), recovery or impairment loss on financial instruments, and direct and allocated operating expenses.
The Bank’s liquid assets, mostly consisting of cash and due from banks, as well as highly rated corporate debt securities (above ‘A-‘), totaled $992 million at the end of 1Q21, down from $1,048 million a quarter ago and $1,297 million a year ago, as the Bank gradually adjusted its liquidity position considering a more stable market environment and the Bank’s ample access to diversified funding sources. As of March 31, 2021, $685 million, or 69% of total liquid assets represented deposits placed with the Federal Reserve Bank of New York, while $201 million, or 20% of total liquid assets represented corporate debt securities classified as high quality liquid assets (“HQLA”) in accordance with the specifications of the Basel Committee. As of the end of 1Q21, 4Q20, and 1Q20, liquidity balances to total assets represented 16%, 17% and 19%, respectively, while the liquidity balances to total deposits ratio was 31%, 33% and 53%, respectively.
6
In addition, the credit investment portfolio related to the Treasury’s investment management activities remained stable at $188 million at the end of 1Q21, compared to $193 million a quarter ago and $79 million a year ago. Consequently, the total Investment Portfolio balances amounted to $389 million as of March 31, 2021, down 2% from $395 million a quarter ago, and up 392% from $79 million a year ago. Overall, the Investment Portfolio mostly consisted of readily-quoted Latin American and Multilateral securities, out of which 61% represented sovereign or state-owned risk at the end of the 1Q21, compared to 62% a quarter ago and 68% a year ago (refer to Exhibit VIII for a per-country risk distribution of the Investment Portfolio).
On the funding side, deposit balances increased to $3.2 billion at the end of 1Q21, up 1% QoQ and 29% YoY. The continued growth in the Bank’s deposit base denotes the growth of its Yankee CD program which complements the short-term funding structure, and the steady support from the Bank’s Class A shareholders (i.e.: central banks and their designees), which represented 46% of total deposits at the end of 1Q21, compared to 50% and 48% of total deposits a quarter and year ago, respectively. As of March 31, 2021, total deposits represented 61% of total funding sources, same as the previous quarter and up from 44% a year ago. Funding through securities sold under repurchase agreements (“Repos”) increased to $157 million at the end of 1Q21, compared to $11 million a quarter ago and $54 million a year ago. In turn, short- and medium-term borrowings and debt totaled $1.9 billion at the end of 1Q21 (-6% QoQ and -40% YoY). Weighted average funding costs improved to 1.10% in 1Q21 (-1 bps QoQ; -131 bps YoY), benefiting from the impact of lower market rates on its narrow, liability-sensitive interest rate gap position.
| (US$ million) | 1Q21 | 4Q20 | 1Q20 | QoQ (%) | YoY (%) | |||||||||||||||
| Treasury Business Segment: | ||||||||||||||||||||
| Net interest income | $ | 0.2 | $ | 1.3 | $ | 1.0 | -87 | % | -84 | % | ||||||||||
| Other income (expense) | (0.2 | ) | (0.1 | ) | (0.4 | ) | -59 | % | 52 | % | ||||||||||
| Total revenues | (0.0 | ) | 1.2 | 0.6 | -102 | % | -104 | % | ||||||||||||
| (Provision) reversal for credit losses | (0.0 | ) | (0.2 | ) | 0.0 | 83 | % | n.m. | ||||||||||||
| Operating expenses | (2.0 | ) | (2.3 | ) | (3.2 | ) | 12 | % | 38 | % | ||||||||||
| Loss for the segment | ($ | 2.1 | ) | ($ | 1.3 | ) | ($ | 2.6 | ) | -56 | % | 20 | % | |||||||
| "n.m." means not meaningful. |
The Treasury Business Segment’s results were a $2.1 million loss for 1Q21 mainly impacted by lower Net Interest Income driven by reduced liquidity levels, slightly offset by the Bank’s liability sensitive interest rate gap in a declining interest rate environment and the performance of the Treasury’s bond portfolio driving higher yields than liquidity; coupled with lower seasonal allocated operating expenses.
7
NET INTEREST INCOME AND MARGINS
| (US$ million, except percentages) | 1Q21 | 4Q20 | 1Q20 | QoQ (%) | YoY (%) | |||||||||||||||
| Net Interest Income | ||||||||||||||||||||
| Interest income | $ | 32.9 | $ | 37.8 | $ | 59.0 | -13 | % | -44 | % | ||||||||||
| Interest expense | (14.0 | ) | (15.5 | ) | (33.2 | ) | 9 | % | 58 | % | ||||||||||
| Net Interest Income ("NII") | $ | 18.9 | $ | 22.3 | $ | 25.8 | -15 | % | -27 | % | ||||||||||
| Net Interest Spread ("NIS") | 1.04 | % | 1.17 | % | 1.16 | % | -12 | % | -11 | % | ||||||||||
| Net Interest Margin ("NIM") | 1.24 | % | 1.37 | % | 1.59 | % | -10 | % | -22 | % |
NII and NIM were $18.9 million and 1.24% for 1Q21, respectively. Compared to the previous quarter, lower net lending spreads returning to pre-Covid levels at 150 bps, partially offset by Credit Portfolio growth and lower liquidity levels, resulted in a NII decrease of 15% QoQ. On a YoY comparison, NII and NIM were mainly impacted by lower Libor-based market rates and average lending volumes still below pre-Covid levels, partly compensated by improved average funding costs.
FEES AND COMMISSIONS
Fees and Commissions, net, includes the fee income associated with letters of credit and the fee income derived from loan structuring and syndication activities, together with loan intermediation and distribution activities in the primary market, and other commissions, mostly from other contingent credits, such as guarantees and credit commitments, net of fee expenses.
| (US$ million) | 1Q21 | 4Q20 | 1Q20 | QoQ (%) | YoY (%) | |||||||||||||||
| Letters of credit fees | 2.5 | 2.5 | 2.5 | 3 | % | 3 | % | |||||||||||||
| Loan syndication fees | 0.1 | 0.1 | 0.4 | 12 | % | -75 | % | |||||||||||||
| Other commissions, net | 0.4 | 0.2 | 0.2 | 66 | % | 87 | % | |||||||||||||
| Fees and Commissions, net | $ | 3.0 | $ | 2.8 | $ | 3.1 | 9 | % | -1 | % |
Fees and Commissions income totaled $3.0 million for 1Q21, relatively stable on absolute terms, on steady fees from the Bank’s letters of credit business. The 9% QoQ increase was mostly driven by stable fees from the Bank’s letters of credit business and higher credit commitment fees. Fees from loan syndication business have been impacted since the onset of the Covid-19 pandemic, but this transaction-based business is starting to pick up, as evidenced by the recent execution of a $300 million loan transaction in April of 2021, where Bladex acted as Joint Lead Arranger.
8
PORTFOLIO QUALITY AND TOTAL ALLOWANCE FOR CREDIT LOSSES
| (US$ million, except percentages) | 31-Mar-21 | 31-Dec-20 | 30-Sep-20 | 30-Jun-20 | 31-Mar-20 | |||||||||||||||
| Allowance for loan losses | ||||||||||||||||||||
| Balance at beginning of the period | $ | 41.2 | $ | 42.5 | $ | 45.4 | $ | 99.9 | $ | 99.3 | ||||||||||
| (Reversals) provisions | (0.1 | ) | (1.3 | ) | 1.5 | (2.4 | ) | 0.5 | ||||||||||||
| Write-offs, net of recoveries | 0.0 | 0.0 | (4.4 | ) | (52.1 | ) | 0.1 | |||||||||||||
| End of period balance | $ | 41.1 | $ | 41.2 | $ | 42.5 | $ | 45.4 | $ | 99.9 | ||||||||||
| Allowance for loan commitments and financial guarantee contract losses | ||||||||||||||||||||
| Balance at beginning of the period | $ | 2.9 | $ | 2.1 | $ | 2.1 | $ | 2.4 | $ | 3.0 | ||||||||||
| Provisions (reversals) | 0.0 | 0.8 | (0.1 | ) | (0.3 | ) | (0.6 | ) | ||||||||||||
| End of period balance | $ | 2.9 | $ | 2.9 | $ | 2.1 | $ | 2.1 | $ | 2.4 | ||||||||||
| Allowance for Investment Portfolio losses | ||||||||||||||||||||
| Balance at beginning of the period | $ | 0.5 | $ | 0.3 | $ | 0.2 | $ | 0.1 | $ | 0.1 | ||||||||||
| Provisions (reversals) | 0.1 | 0.2 | 0.1 | 0.1 | (0.0 | ) | ||||||||||||||
| End of period balance | $ | 0.6 | $ | 0.5 | $ | 0.3 | $ | 0.2 | $ | 0.1 | ||||||||||
| Total allowance for losses | $ | 44.6 | $ | 44.6 | $ | 44.9 | $ | 47.8 | $ | 102.5 | ||||||||||
| Total allowance for losses to Credit Portfolio | 0.73 | % | 0.75 | % | 0.84 | % | 0.95 | % | 1.73 | % | ||||||||||
| Credit-impaired loans to Loan Portfolio | 0.21 | % | 0.22 | % | 0.00 | % | 0.00 | % | 1.16 | % | ||||||||||
| Total allowance for losses to credit-impaired loans (times) | 4.2 | 4.2 | n.m. | n.m. | 1.7 | |||||||||||||||
| Stage 1 (low risk) to Total Credit Portfolio | 95 | % | 94 | % | 94 | % | 90 | % | 93 | % | ||||||||||
| Stage 2 (increased risk) to Total Credit Portfolio | 5 | % | 6 | % | 6 | % | 10 | % | 6 | % | ||||||||||
| Stage 3 (credit impaired) to Total Credit Portfolio | 0 | % | 0 | % | 0 | % | 0 | % | 1 | % | ||||||||||
| "n.m." means not meaningful. | ||||||||||||||||||||
As of March 31, 20201, the total allowance for credit losses totaled $44.6 million, representing a coverage ratio to the Credit Portfolio of 73 bps. The total allowance for credit losses remained stable QoQ compared to $44.6 million, or 75 bps, at the end of 4Q20. The YoY decrease compared to $102.5 million, or 173 bps, at the end of 1Q20, was mostly associated to the sale of a former credit-impaired loan and watchlist loan, totaling $56.5 million in write-offs against previously constituted reserves, coupled with the Bank’s improved mix of its Credit Portfolio exposure.
9

As of March 31, 2021, asset quality remained sound, with credit-impaired loans (“NPL”) totaling $11 million, unchanged from the previous quarter, representing 0.21% of the total Loan Portfolio at the end of 1Q21, compared to 0.22% in the previous quarter and to 1.16% of the total Loan Portfolio a year ago.
OPERATING EXPENSES
| (US$ million, except percentages) | 1Q21 | 4Q20 | 1Q20 | QoQ (%) | YoY (%) | |||||||||||||||
| Operating expenses | ||||||||||||||||||||
| Salaries and other employee expenses | 5.4 | 5.7 | 7.0 | -4 | % | -22 | % | |||||||||||||
| Depreciation of investment property, equipment and leasehold improvements | 0.8 | 0.9 | 0.7 | -7 | % | 11 | % | |||||||||||||
| Amortization of intangible assets | 0.3 | 0.2 | 0.2 | 42 | % | 42 | % | |||||||||||||
| Other expenses | 2.6 | 3.4 | 2.6 | -24 | % | 0 | % | |||||||||||||
| Total Operating Expenses | $ | 9.1 | $ | 10.2 | $ | 10.5 | -10 | % | -13 | % | ||||||||||
| Efficiency Ratio | 41.6 | % | 40.2 | % | 36.7 | % |
The Bank’s 1Q21 operating expenses totaled $9.1 million (-10% QoQ; -13% YoY). The 10% QoQ decrease was due to the usual seasonally lower levels of the first quarter of the year. Year-on-year, expenses were down by 13%, mainly on lower personnel expenses related to decreased performance-based variable compensation provision. 1Q21 Efficiency Ratio stood at 41.6%, on lower income generation.
CAPITAL RATIOS AND CAPITAL MANAGEMENT
The following table shows capital amounts and ratios as of the dates indicated:
| (US$ million, except percentages and shares outstanding) | 31-Mar-21 | 31-Dec-20 | 31-Mar-20 | QoQ (%) | YoY (%) | |||||||||||||||
| Total equity | $ | 1,037 | $ | 1,038 | $ | 1,018 | 0 | % | 2 | % | ||||||||||
| Tier 1 capital to risk weighted assets (Basel III – IRB) (9) | 26.3 | % | 26.0 | % | 21.8 | % | 1 | % | 21 | % | ||||||||||
| Risk-Weighted Assets (Basel III – IRB) (9) | $ | 3,935 | $ | 3,995 | $ | 4,681 | -2 | % | -16 | % | ||||||||||
| Capital Adequacy Ratio (Regulatory) (10) | 19.4 | % | 20.2 | % | 19.2 | % | -4 | % | 1 | % | ||||||||||
| Risk-Weighted Assets (Regulatory) (10) | $ | 5,431 | $ | 5,187 | $ | 5,373 | 5 | % | 1 | % | ||||||||||
| Total assets / Total equity (times) | 6.1 | 6.1 | 6.7 | 1 | % | -8 | % | |||||||||||||
| Shares outstanding (in thousand) | 39,703 | 39,678 | 39,614 | 0 | % | 0 | % | |||||||||||||
The Bank’s equity consists entirely of issued and fully paid ordinary common stock, with 39.7 million common shares outstanding as of March 31, 2021. At the same date, the Bank’s ratio of total assets to total equity stood at 6.1 times, and the Bank’s Tier 1 Basel III Capital Ratio stood at 26.3%, in which risk-weighted assets are calculated under the advanced internal ratings-based approach (IRB) for credit risk.
10
In addition, the Bank’s Capital Adequacy Ratio, as defined by Panama’s banking regulator, was 19.4% as of March 31, 2021, well above the required minimum of 8%. Under this methodology, credit risk-weighted assets are calculated under Basel’s standardized approach.
RECENT EVENTS
| § | Open Market Repurchase Program of up to $60 million: The Bank’s Board of Directors (the “Board”) has authorized a repurchase program of up to $60 million of the Bank’s common stock. The repurchase program is intended to comply with Rule 10b-18 promulgated under the Securities Exchange Act of 1934, as amended (“Rule 10b-18”). |
| § | Quarterly dividend payment: The Board approved a quarterly common dividend of $0.25 per share corresponding to the first quarter 2021. The cash dividend will be paid on June 2, 2021, to shareholders registered as of May 17, 2021. |
| § | Annual Shareholders’ Meeting Results: At the Annual Shareholders’ Meeting held on April 29, 2021, in Panama City, Panama, shareholders: |
| - | Elected Mr. Miguel Heras Castro as Director representing Class “E” shares of the Bank’s common stock, and Mrs. Isela Costantini and Mrs. Alexandra M. Aguirre, as Directors representing All Classes of shares of the Bank’s common stock. |
| - | Approved the Bank’s audited consolidated financial statements for the fiscal year ended December 31, 2020. |
| - | Ratified KPMG as the Bank’s independent registered public accounting firm for the fiscal year ending December 31, 2021. |
| - | Approved, on an advisory basis, the compensation of the Bank’s executive officers. |
| § | Ratings updates: On April 14, 2021, S&P Global Ratings affirmed the Bank’s global- and national-scale issuer credit ratings at “BBB/A-2” and “mxAAA”, respectively. The outlook was revised to “Stable” from “Negative” on sound asset quality metrics. According to S&P Global Ratings’ view, “Banco Latinoamericano de Comercio Exterior S.A. (Bladex) was able to cope with the COVID-19 breakout thanks to strong capitalization levels and solid risk management, which has enabled it to maintain a healthy and diversified portfolio without erosion of its capital metrics. The stable outlook reflects our expectation that Bladex will withstand the prolonged downside risks from the pandemic thanks to sound capital metrics and manageable asset quality metrics, while it maintains its most relevant credit exposures in countries with lower economic risks.” |
Notes:
| - | Numbers and percentages set forth in this earnings release have been rounded and accordingly may not total exactly. |
| - | QoQ and YoY refer to quarter-on-quarter and year-on-year variations, respectively. |
Footnotes:
| 1) | Earnings per Share (“EPS”) calculation is based on the average number of shares outstanding during each period. |
| 2) | ROAE refers to return on average stockholders’ equity which is calculated on the basis of unaudited daily average balances. |
| 3) | NIM refers to net interest margin which constitutes to Net Interest Income (“NII”) divided by the average balance of interest-earning assets. |
| 4) | NIS refers to net interest spread which constitutes the average yield earned on interest-earning assets, less the average yield paid on interest-bearing liabilities. |
11
| 5) | Efficiency Ratio refers to consolidated operating expenses as a percentage of total revenues. |
| 6) | The Bank’s “Credit Portfolio” includes gross loans at amortized cost (or the “Loan Portfolio”), securities at FVOCI and at amortized cost, gross of interest receivable and the allowance for expected credit losses, loan commitments and financial guarantee contracts, such as confirmed and stand-by letters of credit, and guarantees covering commercial risk; and other assets consisting of customers’ liabilities under acceptances. |
| 7) | The Bank’s “Commercial Portfolio” includes gross loans at amortized cost (or the “Loan Portfolio”), loan commitments and financial guarantee contracts, such as issued and confirmed letters of credit, stand-by letters of credit, guarantees covering commercial risk and other assets consisting of customers’ liabilities under acceptances. |
| 8) | Market capitalization corresponds to total outstanding common shares multiplied by market close price at the end of each corresponding period. |
| 9) | Tier 1 Capital ratio is calculated according to Basel III capital adequacy guidelines, and as a percentage of risk-weighted assets. Risk-weighted assets are estimated based on Basel III capital adequacy guidelines, utilizing internal-ratings based approach or “IRB” for credit risk and standardized approach for operational risk. |
| 10) | As defined by the Superintendency of Banks of Panama through Rules No. 01-2015 and 03-2016, based on Basel III standardized approach. The capital adequacy ratio is defined as the ratio of capital funds to risk-weighted assets, rated according to the asset’s categories for credit risk. In addition, risk-weighted assets consider calculations for market risk and operating risk. |
| 11) | Liquid assets refer to total cash and cash equivalents, consisting of cash and due from banks and interest-bearing deposits in banks, excluding pledged deposits and margin calls; as well as highly rated corporate debt securities (above ‘A-‘). Liquidity ratio refers to liquid assets as a percentage of total assets. |
| 12) | Loan Portfolio refers to gross loans at amortized cost, excluding interest receivable, the allowance for loan losses, and unearned interest and deferred fees. Credit-impaired loans are also commonly referred to as Non-Performing Loans or NPLs. |
| 13) | Total allowance for losses refers to allowance for loan losses plus allowance for loan commitments and financial guarantee contract losses and allowance for investment securities losses. |
SAFE HARBOR STATEMENT
This press release contains forward-looking statements of expected future developments within the meaning of the Private Securities Litigation Reform Act of 1995 and Section 21E of the Securities Exchange Act of 1934. Forward-looking statements can be identified by words such as: “anticipate”, “intend”, “plan”, “goal”, “seek”, “believe”, “project”, “estimate”, “expect”, “strategy”, “future”, “likely”, “may”, “should”, “will” and similar references to future periods. The forward-looking statements in this press release include the Bank’s financial position, asset quality and profitability, among others. These forward-looking statements reflect the expectations of the Bank’s management and are based on currently available data; however, actual performance and results are subject to future events and uncertainties, which could materially impact the Bank’s expectations. Among the factors that can cause actual performance and results to differ materially are as follows: the coronavirus (COVID-19) pandemic and government actions intended to limit its spread; the anticipated changes in the Bank’s credit portfolio; the continuation of the Bank’s preferred creditor status; the impact of increasing/decreasing interest rates and of the macroeconomic environment in the Region on the Bank’s financial condition; the execution of the Bank’s strategies and initiatives, including its revenue diversification strategy; the adequacy of the Bank’s allowance for expected credit losses; the need for additional allowance for expected credit losses; the Bank’s ability to achieve future growth, to reduce its liquidity levels and increase its leverage; the Bank’s ability to maintain its investment-grade credit ratings; the availability and mix of future sources of funding for the Bank’s lending operations; potential trading losses; the possibility of fraud; and the adequacy of the Bank’s sources of liquidity to replace deposit withdrawals. Factors or events that could cause our actual results to differ may emerge from time to time, and it is not possible for us to predict all of them. Readers are cautioned not to place undue reliance on these forward-looking statements, which speak only as of the date hereof. We undertake no obligation to publicly update any forward-looking statement, whether as a result of new information, future developments or otherwise, except as may be required by law.
12
ABOUT BLADEX
Bladex, a multinational bank originally established by the central banks of Latin-American and Caribbean countries, began operations in 1979 to promote foreign trade and economic integration in the Region. The Bank, headquartered in Panama, also has offices in Argentina, Brazil, Colombia, Mexico, and the United States of America, and a Representative License in Peru, supporting the regional expansion and servicing its customer base, which includes financial institutions and corporations.
Bladex is listed on the NYSE in the United States of America (NYSE: BLX), since 1992, and its shareholders include: central banks and state-owned banks and entities representing 23 Latin American countries; commercial banks and financial institutions; and institutional and retail investors through its public listing.
13
CONFERENCE CALL INFORMATION
There will be a conference call to discuss the Bank’s quarterly results on Wednesday, May 5, 2021 at 11:00 a.m. New York City time (Eastern Time). For those interested in participating, please dial 1-877-271-1828 in the United States or, if outside the United States, 1-334-323-9871. Participants should use conference passcode 68251167, and dial in five minutes before the call is set to begin. There will also be a live audio webcast of the conference at http://www.bladex.com. The webcast presentation will be available for viewing and downloads on http://www.bladex.com.
The conference call will become available for review on Conference Replay one hour after its conclusion and will remain available for 60 days. Please dial (877) 919-4059 or (334) 323-0140 and follow the instructions. The replay passcode is: 37768534.
For more information, please access http://www.bladex.com or contact:
Mrs. Ana Graciela de Méndez
Chief Financial Officer
Tel: +507 210-8563
E-mail address: amendez@bladex.com
14
| EXHIBIT I | ||||||||||||||||||||||||||||
| CONSOLIDATED STATEMENTS OF FINANCIAL POSITION | ||||||||||||||||||||||||||||
| AT THE END OF, | ||||||||||||||||||||||||||||
| (A) | (B) | (C) | (A) - (B) | (A) - (C) | ||||||||||||||||||||||||
| March 31, 2021 | December 31, 2020 | March 31, 2020 | CHANGE | % | CHANGE | % | ||||||||||||||||||||||
| (In US$ thousand) | ||||||||||||||||||||||||||||
| Assets | ||||||||||||||||||||||||||||
| Cash and due from banks | $ | 819,514 | $ | 863,812 | $ | 1,353,018 | $ | (44,298 | ) | (5 | )% | $ | (533,504 | ) | (39 | )% | ||||||||||||
| Securities and other financial assets, net | 391,401 | 398,068 | 86,326 | (6,667 | ) | (2 | ) | 305,075 | 353 | |||||||||||||||||||
| Loans | 5,068,308 | 4,916,346 | 5,337,487 | 151,962 | 3 | (269,179 | ) | (5 | ) | |||||||||||||||||||
| Interest receivable | 20,990 | 27,350 | 40,613 | (6,360 | ) | (23 | ) | (19,623 | ) | (48 | ) | |||||||||||||||||
| Allowance for loan losses | (41,096 | ) | (41,165 | ) | (99,941 | ) | 69 | 0 | 58,845 | 59 | ||||||||||||||||||
| Unearned interest and deferred fees | (5,735 | ) | (5,884 | ) | (11,095 | ) | 149 | 3 | 5,360 | 48 | ||||||||||||||||||
| Loans, net | 5,042,467 | 4,896,647 | 5,267,064 | 145,820 | 3 | (224,597 | ) | (4 | ) | |||||||||||||||||||
| Customers' liabilities under acceptances | 78,164 | 74,366 | 66,657 | 3,798 | 5 | 11,507 | 17 | |||||||||||||||||||||
| Derivative financial instruments - assets | 16,340 | 27,778 | 17,044 | (11,438 | ) | (41 | ) | (704 | ) | (4 | ) | |||||||||||||||||
| Equipment and leasehold improvements, net | 15,361 | 16,213 | 18,110 | (852 | ) | (5 | ) | (2,749 | ) | (15 | ) | |||||||||||||||||
| Intangibles, net | 1,712 | 1,984 | 1,236 | (272 | ) | (14 | ) | 476 | 39 | |||||||||||||||||||
| Investment properties | 3,145 | 3,214 | 3,494 | (69 | ) | (2 | ) | (349 | ) | (10 | ) | |||||||||||||||||
| Other assets | 6,742 | 6,816 | 9,574 | (74 | ) | (1 | ) | (2,832 | ) | (30 | ) | |||||||||||||||||
| Total assets | $ | 6,374,846 | $ | 6,288,898 | $ | 6,822,523 | $ | 85,948 | 1 | % | $ | (447,677 | ) | (7 | )% | |||||||||||||
| Liabilities | ||||||||||||||||||||||||||||
| Demand deposits | $ | 355,301 | $ | 170,660 | $ | 302,442 | $ | 184,641 | 108 | % | $ | 52,859 | 17 | % | ||||||||||||||
| Time deposits | 2,830,446 | 2,968,240 | 2,165,154 | (137,794 | ) | (5 | ) | 665,292 | 31 | |||||||||||||||||||
| 3,185,747 | 3,138,900 | 2,467,596 | 46,847 | 1 | 718,151 | 29 | ||||||||||||||||||||||
| Interest payable | 2,853 | 1,975 | 5,048 | 878 | 44 | (2,195 | ) | (43 | ) | |||||||||||||||||||
| Total deposits | 3,188,600 | 3,140,875 | 2,472,644 | 47,725 | 2 | 715,956 | 29 | |||||||||||||||||||||
| Securities sold under repurchase agreements | 156,690 | 10,663 | 53,888 | 146,027 | 1,369 | 102,802 | 191 | |||||||||||||||||||||
| Borrowings and debt, net | 1,869,304 | 1,985,070 | 3,137,018 | (115,766 | ) | (6 | ) | (1,267,714 | ) | (40 | ) | |||||||||||||||||
| Interest payable | 9,248 | 9,175 | 10,045 | 73 | 1 | (797 | ) | (8 | ) | |||||||||||||||||||
| Acceptance outstanding | 78,164 | 74,366 | 66,657 | 3,798 | 5 | 11,507 | 17 | |||||||||||||||||||||
| Derivative financial instruments - liabilities | 19,449 | 9,211 | 49,095 | 10,238 | 111 | (29,646 | ) | (60 | ) | |||||||||||||||||||
| Allowance for loan commitments and financial guarantee contract losses | 2,936 | 2,904 | 2,443 | 32 | 1 | 493 | 20 | |||||||||||||||||||||
| Other liabilities | 13,780 | 18,714 | 12,245 | (4,934 | ) | (26 | ) | 1,535 | 13 | |||||||||||||||||||
| Total liabilities | $ | 5,338,171 | $ | 5,250,978 | $ | 5,804,035 | $ | 87,193 | 2 | % | $ | (465,864 | ) | (8 | )% | |||||||||||||
| Equity | ||||||||||||||||||||||||||||
| Common stock | $ | 279,980 | $ | 279,980 | $ | 279,980 | $ | 0 | 0 | % | $ | 0 | 0 | % | ||||||||||||||
| Treasury stock | (57,452 | ) | (57,999 | ) | (59,409 | ) | 547 | 1 | 1,957 | 3 | ||||||||||||||||||
| Additional paid-in capital in excess of value assigned of common stock | 120,305 | 120,414 | 120,586 | (109 | ) | (0 | ) | (281 | ) | (0 | ) | |||||||||||||||||
| Capital reserves | 95,210 | 95,210 | 95,210 | 0 | 0 | 0 | 0 | |||||||||||||||||||||
| Regulatory reserves | 136,019 | 136,019 | 136,019 | 0 | 0 | 0 | 0 | |||||||||||||||||||||
| Retained earnings | 466,978 | 464,088 | 448,762 | 2,890 | 1 | 18,216 | 4 | |||||||||||||||||||||
| Other comprehensive income (loss) | (4,365 | ) | 208 | (2,660 | ) | (4,573 | ) | (2,199 | ) | (1,705 | ) | (64 | ) | |||||||||||||||
| Total equity | $ | 1,036,675 | $ | 1,037,920 | $ | 1,018,488 | $ | (1,245 | ) | (0 | )% | $ | 18,187 | 2 | % | |||||||||||||
| Total liabilities and equity | $ | 6,374,846 | $ | 6,288,898 | $ | 6,822,523 | $ | 85,948 | 1 | % | $ | (447,677 | ) | (7 | )% | |||||||||||||
15

| EXHIBIT II | ||||||||||||||||||||||||||||
| CONSOLIDATED STATEMENTS OF PROFIT OR LOSS | ||||||||||||||||||||||||||||
| (In US$ thousand, except per share amounts and ratios) | ||||||||||||||||||||||||||||
| FOR THE THREE MONTHS ENDED | ||||||||||||||||||||||||||||
| (A) | (B) | (C) | ||||||||||||||||||||||||||
| March 31, 2021 | December 31, 2020 | March 31, 2020 | (A) - (B) CHANGE | % | (A) - (C) CHANGE | % | ||||||||||||||||||||||
| Net Interest Income: | ||||||||||||||||||||||||||||
| Interest income | $ | 32,918 | $ | 37,782 | $ | 58,990 | $ | (4,864 | ) | (13 | )% | $ | (26,072 | ) | (44 | )% | ||||||||||||
| Interest expense | (14,023 | ) | (15,464 | ) | (33,189 | ) | 1,441 | 9 | 19,166 | 58 | ||||||||||||||||||
| Net Interest Income | 18,895 | 22,318 | 25,801 | (3,423 | ) | (15 | ) | (6,906 | ) | (27 | ) | |||||||||||||||||
| Other income (expense): | ||||||||||||||||||||||||||||
| Fees and commissions, net | 3,040 | 2,794 | 3,073 | 246 | 9 | (33 | ) | (1 | ) | |||||||||||||||||||
| Loss on financial instruments, net | (71 | ) | (50 | ) | (358 | ) | (21 | ) | (42 | ) | 287 | 80 | ||||||||||||||||
| Other income, net | 97 | 245 | 240 | (148 | ) | (60 | ) | (143 | ) | (60 | ) | |||||||||||||||||
| Total other income, net | 3,066 | 2,989 | 2,955 | 77 | 3 | 111 | 4 | |||||||||||||||||||||
| Total revenues | 21,961 | 25,307 | 28,756 | (3,346 | ) | (13 | ) | (6,795 | ) | (24 | ) | |||||||||||||||||
| Reversal for credit losses | 0 | 311 | 89 | (311 | ) | (100 | ) | (89 | ) | (100 | ) | |||||||||||||||||
| Gain on non-financial assets, net | 0 | 296 | 0 | (296 | ) | (100 | ) | 0 | n.m. (*) | |||||||||||||||||||
| Operating expenses: | ||||||||||||||||||||||||||||
| Salaries and other employee expenses | (5,448 | ) | (5,657 | ) | (7,007 | ) | 209 | 4 | 1,559 | 22 | ||||||||||||||||||
| Depreciation of investment property, equipment and improvements | (819 | ) | (882 | ) | (735 | ) | 63 | 7 | (84 | ) | (11 | ) | ||||||||||||||||
| Amortization of intangible assets | (271 | ) | (191 | ) | (191 | ) | (80 | ) | (42 | ) | (80 | ) | (42 | ) | ||||||||||||||
| Other expenses | (2,607 | ) | (3,443 | ) | (2,610 | ) | 836 | 24 | 3 | 0 | ||||||||||||||||||
| Total operating expenses | (9,145 | ) | (10,173 | ) | (10,543 | ) | 1,028 | 10 | 1,398 | 13 | ||||||||||||||||||
| Profit for the period | $ | 12,816 | $ | 15,741 | $ | 18,302 | $ | (2,925 | ) | (19 | )% | $ | (5,486 | ) | (30 | )% | ||||||||||||
| PER COMMON SHARE DATA: | ||||||||||||||||||||||||||||
| Basic earnings per share | $ | 0.32 | $ | 0.40 | $ | 0.46 | ||||||||||||||||||||||
| Diluted earnings per share | $ | 0.32 | $ | 0.40 | $ | 0.46 | ||||||||||||||||||||||
| Book value (period average) | $ | 26.26 | $ | 26.00 | $ | 25.80 | ||||||||||||||||||||||
| Book value (period end) | $ | 26.11 | $ | 26.16 | $ | 25.71 | ||||||||||||||||||||||
| Weighted average basic shares | 39,693 | 39,678 | 39,609 | |||||||||||||||||||||||||
| Weighted average diluted shares | 39,693 | 39,678 | 39,609 | |||||||||||||||||||||||||
| Basic shares period end | 39,703 | 39,678 | 39,614 | |||||||||||||||||||||||||
| PERFORMANCE RATIOS: | ||||||||||||||||||||||||||||
| Return on average assets | 0.8 | % | 1.0 | % | 1.1 | % | ||||||||||||||||||||||
| Return on average equity | 5.0 | % | 6.1 | % | 7.2 | % | ||||||||||||||||||||||
| Net interest margin | 1.24 | % | 1.37 | % | 1.59 | % | ||||||||||||||||||||||
| Net interest spread | 1.04 | % | 1.17 | % | 1.16 | % | ||||||||||||||||||||||
| Efficiency Ratio | 41.6 | % | 40.2 | % | 36.7 | % | ||||||||||||||||||||||
| Operating expenses to total average assets | 0.59 | % | 0.62 | % | 0.65 | % | ||||||||||||||||||||||
(*)"n.m." means not meaningful.
16

| EXHIBIT III | ||||||||||||||||||||||||||||||||||||
| CONSOLIDATED NET INTEREST INCOME AND AVERAGE BALANCES | ||||||||||||||||||||||||||||||||||||
| FOR THE THREE MONTHS ENDED | ||||||||||||||||||||||||||||||||||||
| March 31, 2021 | December 31, 2020 | March 31, 2020 | ||||||||||||||||||||||||||||||||||
| AVERAGE | AVG. | AVERAGE | AVG. | AVERAGE | AVG. | |||||||||||||||||||||||||||||||
| BALANCE | INTEREST | RATE | BALANCE | INTEREST | RATE | BALANCE | INTEREST | RATE | ||||||||||||||||||||||||||||
| (In US$ thousand) | ||||||||||||||||||||||||||||||||||||
| INTEREST EARNING ASSETS | ||||||||||||||||||||||||||||||||||||
| Cash and due from banks | $ | 1,005,121 | $ | 361 | 0.14 | % | $ | 1,525,717 | $ | 623 | 0.16 | % | $ | 797,722 | $ | 2,459 | 1.22 | % | ||||||||||||||||||
| Securities at fair value through OCI | 230,765 | 239 | 0.41 | 184,677 | 197 | 0.42 | 5,086 | 23 | 1.75 | |||||||||||||||||||||||||||
| Securities at amortized cost(1) | 168,756 | 1,398 | 3.31 | 152,615 | 1,106 | 2.84 | 69,661 | 617 | 3.51 | |||||||||||||||||||||||||||
| Loans, net of unearned interest | 4,755,822 | 30,921 | 2.60 | 4,611,060 | 35,858 | 3.04 | 5,647,971 | 55,890 | 3.91 | |||||||||||||||||||||||||||
| TOTAL INTEREST EARNING ASSETS | $ | 6,160,464 | $ | 32,918 | 2.14 | % | $ | 6,474,070 | $ | 37,783 | 2.28 | % | $ | 6,520,439 | $ | 58,989 | 3.58 | % | ||||||||||||||||||
| Allowance for loan losses | (40,254 | ) | (41,630 | ) | (99,600 | ) | ||||||||||||||||||||||||||||||
| Non interest earning assets | 142,182 | 116,474 | 152,148 | |||||||||||||||||||||||||||||||||
| TOTAL ASSETS | $ | 6,262,393 | $ | 6,548,914 | $ | 6,572,987 | ||||||||||||||||||||||||||||||
| INTEREST BEARING LIABILITIES | ||||||||||||||||||||||||||||||||||||
| Deposits | 3,254,281 | $ | 3,472 | 0.43 | % | 3,534,462 | $ | 4,247 | 0.47 | % | $ | 2,558,726 | $ | 11,462 | 1.77 | % | ||||||||||||||||||||
| Securities sold under repurchase agreement and short-term borrowings and debt | 368,291 | 1,785 | 1.94 | 294,881 | 2,288 | 3.04 | 1,381,248 | 8,659 | 2.48 | |||||||||||||||||||||||||||
| Long-term borrowings and debt, net (2) | 1,494,923 | 8,766 | 2.35 | 1,611,988 | 8,929 | 2.17 | 1,498,934 | 13,067 | 3.45 | |||||||||||||||||||||||||||
| TOTAL INTEREST BEARING LIABILITIES | $ | 5,117,495 | $ | 14,023 | 1.10 | % | $ | 5,441,331 | $ | 15,464 | 1.11 | % | $ | 5,438,908 | $ | 33,188 | 2.41 | % | ||||||||||||||||||
| Non interest bearing liabilities and other liabilities | $ | 102,420 | $ | 75,917 | $ | 111,987 | ||||||||||||||||||||||||||||||
| TOTAL LIABILITIES | 5,219,916 | 5,517,247 | 5,550,895 | |||||||||||||||||||||||||||||||||
| EQUITY | 1,042,477 | 1,031,667 | 1,022,092 | |||||||||||||||||||||||||||||||||
| TOTAL LIABILITIES AND EQUITY | $ | 6,262,393 | $ | 6,548,914 | $ | 6,572,987 | ||||||||||||||||||||||||||||||
| NET INTEREST SPREAD | 1.04 | % | 1.17 | % | 1.16 | % | ||||||||||||||||||||||||||||||
| NET INTEREST INCOME AND NET INTEREST MARGIN | $ | 18,895 | 1.24 | % | $ | 22,319 | 1.37 | % | $ | 25,801 | 1.59 | % | ||||||||||||||||||||||||
(1) Gross of the allowance for losses relating to securities at amortized cost.
(2) Includes lease liabilities, net of prepaid commissions. Note: Interest income and/or expense includes the effect of derivative financial instruments used for hedging.
17
| EXHIBIT IV | ||||||||||||||||||||
| CONSOLIDATED STATEMENT OF PROFIT OR LOSS | ||||||||||||||||||||
| (In US$ thousand, except per share amounts and ratios) | ||||||||||||||||||||
| FOR THE THREE MONTHS ENDED | ||||||||||||||||||||
| MAR 31/21 | DEC 31/20 | SEP 30/20 | JUN 30/20 | MAR 31/20 | ||||||||||||||||
| Net Interest Income: | ||||||||||||||||||||
| Interest income | $ | 32,918 | $ | 37,782 | $ | 39,694 | $ | 44,507 | $ | 58,990 | ||||||||||
| Interest expense | (14,023 | ) | (15,464 | ) | (17,086 | ) | (22,784 | ) | (33,189 | ) | ||||||||||
| Net Interest Income | 18,895 | 22,318 | 22,608 | 21,723 | 25,801 | |||||||||||||||
| Other income (expense): | ||||||||||||||||||||
| Fees and commissions, net | 3,040 | 2,794 | 2,611 | 1,940 | 3,073 | |||||||||||||||
| Loss on financial instruments, net | (71 | ) | (50 | ) | (437 | ) | (3,949 | ) | (358 | ) | ||||||||||
| Other income, net | 97 | 245 | 407 | 191 | 240 | |||||||||||||||
| Total other income, net | 3,066 | 2,989 | 2,581 | (1,818 | ) | 2,955 | ||||||||||||||
| Total revenues | 21,961 | 25,307 | 25,189 | 19,905 | 28,756 | |||||||||||||||
| Reversal (provision) for credit losses | 0 | 311 | (1,543 | ) | 2,607 | 89 | ||||||||||||||
| Gain (loss) on non-financial assets, net | 0 | 296 | 140 | (140 | ) | 0 | ||||||||||||||
| Total operating expenses | (9,145 | ) | (10,173 | ) | (8,342 | ) | (8,266 | ) | (10,543 | ) | ||||||||||
| Profit for the period | $ | 12,816 | $ | 15,741 | $ | 15,444 | $ | 14,106 | $ | 18,302 | ||||||||||
| SELECTED FINANCIAL DATA | ||||||||||||||||||||
| PER COMMON SHARE DATA | ||||||||||||||||||||
| Basic earnings per share | $ | 0.32 | $ | 0.40 | $ | 0.39 | $ | 0.36 | $ | 0.46 | ||||||||||
| PERFORMANCE RATIOS | ||||||||||||||||||||
| Return on average assets | 0.8 | % | 1.0 | % | 1.0 | % | 0.8 | % | 1.1 | % | ||||||||||
| Return on average equity | 5.0 | % | 6.1 | % | 6.0 | % | 5.5 | % | 7.2 | % | ||||||||||
| Net interest margin | 1.24 | % | 1.37 | % | 1.42 | % | 1.28 | % | 1.59 | % | ||||||||||
| Net interest spread | 1.04 | % | 1.17 | % | 1.19 | % | 1.01 | % | 1.16 | % | ||||||||||
| Efficiency Ratio | 41.6 | % | 40.2 | % | 33.1 | % | 41.5 | % | 36.7 | % | ||||||||||
| Operating expenses to total average assets | 0.59 | % | 0.62 | % | 0.52 | % | 0.48 | % | 0.65 | % | ||||||||||
18
| EXHIBIT V | ||||||||||||
| BUSINESS SEGMENT ANALYSIS | ||||||||||||
| (In US$ thousand) | ||||||||||||
| FOR THE THREE MONTHS ENDED | ||||||||||||
| MAR 31/21 | DEC 31/20 | MAR 31/20 | ||||||||||
| COMMERCIAL BUSINESS SEGMENT: | ||||||||||||
| Net interest income | $ | 18,732 | $ | 21,033 | $ | 24,767 | ||||||
| Other income | 3,257 | 3,109 | 3,349 | |||||||||
| Total revenues | 21,989 | 24,142 | 28,116 | |||||||||
| Reversal for credit losses | 37 | 533 | 89 | |||||||||
| Gain on non-financial assets, net | 0 | 296 | 0 | |||||||||
| Operating expenses | (7,148 | ) | (7,909 | ) | (7,341 | ) | ||||||
| Profit for the segment | $ | 14,878 | $ | 17,062 | $ | 20,864 | ||||||
| Segment assets | 5,137,623 | 4,989,009 | 5,359,398 | |||||||||
| TREASURY BUSINESS SEGMENT: | ||||||||||||
| Net interest income | $ | 163 | $ | 1,285 | $ | 1,034 | ||||||
| Other income (expense) | (191 | ) | (120 | ) | (394 | ) | ||||||
| Total revenues | (28 | ) | 1,165 | 640 | ||||||||
| (Provision) reversal for credit losses | (37 | ) | (222 | ) | 0 | |||||||
| Operating expenses | (1,997 | ) | (2,264 | ) | (3,202 | ) | ||||||
| Loss for the segment | $ | (2,062 | ) | $ | (1,321 | ) | (2,562 | ) | ||||
| Segment assets | 1,230,515 | 1,293,081 | 1,453,571 | |||||||||
| TOTAL: | ||||||||||||
| Net interest income | $ | 18,895 | $ | 22,318 | $ | 25,801 | ||||||
| Other income | 3,066 | 2,989 | 2,955 | |||||||||
| Total revenues | 21,961 | 25,307 | 28,756 | |||||||||
| Reversal for credit losses | 0 | 311 | 89 | |||||||||
| Gain on non-financial assets, net | 0 | 296 | 0 | |||||||||
| Operating expenses | (9,145 | ) | (10,173 | ) | (10,543 | ) | ||||||
| Profit for the period | $ | 12,816 | $ | 15,741 | $ | 18,302 | ||||||
| Total segment assets | 6,368,138 | 6,282,090 | 6,812,969 | |||||||||
| Unallocated assets | 6,708 | 6,808 | 9,554 | |||||||||
| Total assets | 6,374,846 | 6,288,898 | 6,822,523 | |||||||||
19
| EXHIBIT VI | ||||||||||||||||||||||||||||||||
| CREDIT PORTFOLIO | ||||||||||||||||||||||||||||||||
| DISTRIBUTION BY COUNTRY | ||||||||||||||||||||||||||||||||
| (In US$ million) | ||||||||||||||||||||||||||||||||
| AT THE END OF, | ||||||||||||||||||||||||||||||||
| (A) | (B) | (C) | ||||||||||||||||||||||||||||||
| Mar. 31, 2021 | Dec. 31, 2020 | Mar. 31, 2020 | Change in Amount | |||||||||||||||||||||||||||||
| COUNTRY | Amount | % of Total Outstanding | Amount | % of Total Outstanding | Amount | % of Total Outstanding | (A) - (B) | (A) - (C) | ||||||||||||||||||||||||
| ARGENTINA | $ | 108 | 2 | $ | 131 | 2 | $ | 195 | 3 | $ | (23 | ) | $ | (87 | ) | |||||||||||||||||
| BOLIVIA | 15 | 0 | 15 | 0 | 8 | 0 | 0 | 7 | ||||||||||||||||||||||||
| BRAZIL | 1,220 | 18 | 1,063 | 18 | 959 | 16 | 157 | 261 | ||||||||||||||||||||||||
| CHILE | 645 | 10 | 583 | 10 | 592 | 10 | 62 | 53 | ||||||||||||||||||||||||
| COLOMBIA | 719 | 13 | 795 | 13 | 886 | 15 | (76 | ) | (167 | ) | ||||||||||||||||||||||
| COSTA RICA | 191 | 3 | 203 | 3 | 281 | 5 | (12 | ) | (90 | ) | ||||||||||||||||||||||
| DOMINICAN REPUBLIC | 205 | 4 | 219 | 4 | 121 | 2 | (14 | ) | 84 | |||||||||||||||||||||||
| ECUADOR | 212 | 4 | 211 | 4 | 355 | 6 | 1 | (143 | ) | |||||||||||||||||||||||
| EL SALVADOR | 31 | 1 | 41 | 1 | 70 | 1 | (10 | ) | (39 | ) | ||||||||||||||||||||||
| GUATEMALA | 338 | 5 | 325 | 5 | 340 | 6 | 13 | (2 | ) | |||||||||||||||||||||||
| HONDURAS | 20 | 0 | 10 | 0 | 128 | 2 | 10 | (108 | ) | |||||||||||||||||||||||
| JAMAICA | 46 | 0 | 23 | 0 | 32 | 1 | 23 | 14 | ||||||||||||||||||||||||
| MEXICO | 593 | 11 | 656 | 11 | 536 | 9 | (63 | ) | 57 | |||||||||||||||||||||||
| PANAMA | 324 | 5 | 313 | 5 | 444 | 8 | 11 | (120 | ) | |||||||||||||||||||||||
| PARAGUAY | 128 | 2 | 113 | 2 | 131 | 2 | 15 | (3 | ) | |||||||||||||||||||||||
| PERU | 386 | 6 | 346 | 6 | 204 | 3 | 40 | 182 | ||||||||||||||||||||||||
| TRINIDAD & TOBAGO | 152 | 3 | 166 | 3 | 182 | 3 | (14 | ) | (30 | ) | ||||||||||||||||||||||
| URUGUAY | 97 | 1 | 34 | 1 | 58 | 1 | 63 | 39 | ||||||||||||||||||||||||
| MULTILATERAL ORGANIZATIONS | 112 | 2 | 113 | 2 | 0 | 0 | (1 | ) | 112 | |||||||||||||||||||||||
| OTHER NON-LATAM (1) | 555 | 10 | 586 | 10 | 389 | 7 | (31 | ) | 166 | |||||||||||||||||||||||
| TOTAL CREDIT PORTFOLIO (2) | $ | 6,097 | 100 | % | $ | 5,946 | 100 | % | $ | 5,911 | 100 | % | $ | 151 | $ | 186 | ||||||||||||||||
| UNEARNED INTEREST AND DEFERRED FEES | (6 | ) | (6 | ) | (11 | ) | 0 | 5 | ||||||||||||||||||||||||
| TOTAL CREDIT PORTFOLIO, NET OF UNEARNED | ||||||||||||||||||||||||||||||||
| INTEREST & DEFERRED FEES | $ | 6,091 | $ | 5,940 | $ | 5,900 | $ | 151 | $ | 191 | ||||||||||||||||||||||
| (1) | Risk in highly rated countries outside the Region, mostly in Europe and North America, related to transactions carried out in the Region. | ||||||
| (2) | Includes gross loans (or the “Loan Portfolio”), securities at FVOCI and at amortized cost, gross of interest receivable and the allowance for expected credit losses, loan commitments and financial guarantee contracts, such as confirmed and stand-by letters of credit, and guarantees covering commercial risk; and other assets consisting of customers’ liabilities under acceptances. | ||||||
20
EXHIBIT VII
| COMMERCIAL PORTFOLIO |
| DISTRIBUTION BY COUNTRY |
| (In US$ million) |
| AT THE END OF, | ||||||||||||||||||||||||||||||||
| (A) | (B) | (C) | ||||||||||||||||||||||||||||||
| Mar. 31, 2021 | Dec. 31, 2020 | Mar. 31, 2020 | Change in Amount | |||||||||||||||||||||||||||||
| COUNTRY | Amount | % of Total Outstanding | Amount | % of Total Outstanding | Amount | % of Total Outstanding | (A) - (B) | (A) - (C) | ||||||||||||||||||||||||
| ARGENTINA | $ | 108 | 2 | $ | 131 | 2 | $ | 195 | 3 | $ | (23 | ) | $ | (87 | ) | |||||||||||||||||
| BOLIVIA | 15 | 0 | 15 | 0 | 8 | 0 | 0 | 7 | ||||||||||||||||||||||||
| BRAZIL | 1,159 | 20 | 1,022 | 18 | 959 | 16 | 137 | 200 | ||||||||||||||||||||||||
| CHILE | 604 | 11 | 542 | 10 | 587 | 10 | 62 | 17 | ||||||||||||||||||||||||
| COLOMBIA | 704 | 12 | 765 | 14 | 871 | 15 | (61 | ) | (167 | ) | ||||||||||||||||||||||
| COSTA RICA | 191 | 3 | 203 | 4 | 281 | 5 | (12 | ) | (90 | ) | ||||||||||||||||||||||
| DOMINICAN REPUBLIC | 205 | 4 | 219 | 4 | 121 | 2 | (14 | ) | 84 | |||||||||||||||||||||||
| ECUADOR | 212 | 4 | 211 | 4 | 355 | 6 | 1 | (143 | ) | |||||||||||||||||||||||
| EL SALVADOR | 31 | 1 | 41 | 1 | 70 | 1 | (10 | ) | (39 | ) | ||||||||||||||||||||||
| GUATEMALA | 338 | 6 | 325 | 6 | 340 | 6 | 13 | (2 | ) | |||||||||||||||||||||||
| HONDURAS | 20 | 0 | 10 | 0 | 128 | 2 | 10 | (108 | ) | |||||||||||||||||||||||
| JAMAICA | 46 | 1 | 23 | 0 | 32 | 1 | 23 | 14 | ||||||||||||||||||||||||
| MEXICO | 549 | 10 | 612 | 11 | 515 | 9 | (63 | ) | 34 | |||||||||||||||||||||||
| PANAMA | 314 | 6 | 303 | 5 | 406 | 7 | 11 | (92 | ) | |||||||||||||||||||||||
| PARAGUAY | 128 | 2 | 113 | 2 | 131 | 2 | 15 | (3 | ) | |||||||||||||||||||||||
| PERU | 369 | 6 | 320 | 6 | 204 | 3 | 49 | 165 | ||||||||||||||||||||||||
| TRINIDAD & TOBAGO | 152 | 3 | 166 | 3 | 182 | 3 | (14 | ) | (30 | ) | ||||||||||||||||||||||
| URUGUAY | 97 | 2 | 34 | 1 | 58 | 1 | 63 | 39 | ||||||||||||||||||||||||
| OTHER NON-LATAM (1) | 466 | 8 | 496 | 9 | 389 | 7 | (30 | ) | 77 | |||||||||||||||||||||||
| TOTAL COMMERCIAL PORTFOLIO (2) | $ | 5,708 | 100 | % | $ | 5,551 | 100 | % | $ | 5,832 | 100 | % | $ | 157 | ($ | 124 | ) | |||||||||||||||
| UNEARNED INTEREST AND DEFERRED FEES | (6 | ) | (6 | ) | (11 | ) | 0 | 5 | ||||||||||||||||||||||||
| TOTAL COMMERCIAL PORTFOLIO, NET OF | ||||||||||||||||||||||||||||||||
| UNEARNED INTEREST & DEFERRED FEES | $ | 5,702 | $ | 5,545 | $ | 5,821 | $ | 157 | ($ | 119 | ) | |||||||||||||||||||||
| (1) | Risk in highly rated countries outside the Region, mostly in Europe and North America, related to transactions carried out in the Region. |
| (2) | Includes gross loans (or the “Loan Portfolio”), loan commitments and financial guarantee contracts, such as confirmed and stand-by letters of credit, and guarantees covering commercial risk; and other assets consisting of customers’ liabilities under acceptances. |
21
EXHIBIT VIII
INVESTMENT PORTFOLIO
DISTRIBUTION BY COUNTRY
(In US$ million)
| AT THE END OF, | ||||||||||||||||||||||||||||||||
| (A) | (B) | (C) | ||||||||||||||||||||||||||||||
| Mar. 31, 2021 | Dec. 31, 2020 | Mar. 31, 2020 | Change in Amount | |||||||||||||||||||||||||||||
| COUNTRY | Amount | % of Total Outstanding | Amount | % of Total Outstanding | Amount | % of Total Outstanding | (A) - (B) | (A) - (C) | ||||||||||||||||||||||||
| BRAZIL | $ | 61 | 16 | $ | 41 | 10 | $ | 0 | 0 | $ | 20 | $ | 61 | |||||||||||||||||||
| CHILE | 41 | 10 | 41 | 10 | 5 | 6 | 0 | 36 | ||||||||||||||||||||||||
| COLOMBIA | 15 | 4 | 30 | 8 | 15 | 19 | (15 | ) | 0 | |||||||||||||||||||||||
| MEXICO | 44 | 11 | 44 | 11 | 21 | 27 | 0 | 23 | ||||||||||||||||||||||||
| PANAMA | 10 | 3 | 10 | 3 | 38 | 48 | 0 | (28 | ) | |||||||||||||||||||||||
| PERU | 17 | 4 | 26 | 7 | 0 | 0 | (9 | ) | 17 | |||||||||||||||||||||||
| MULTILATERAL ORGANIZATIONS | 112 | 29 | 113 | 28 | 0 | 0 | (1 | ) | 112 | |||||||||||||||||||||||
| OTHER NON-LATAM (1) | 89 | 23 | 90 | 23 | 0 | 0 | (1 | ) | 89 | |||||||||||||||||||||||
| TOTAL INVESTMENT PORTFOLIO (2) | $ | 389 | 100 | % | $ | 395 | 100 | % | $ | 79 | 100 | % | $ | (6 | ) | $ | 310 | |||||||||||||||
(1) Risk in highly rated countries outside the Region.
(2) Includes securities at FVOCI and at amortized cost, gross of interest receivable and the allowance for losses.
22
EXHIBIT IX
LOAN DISBURSEMENTS
DISTRIBUTION BY COUNTRY
(In US$ million)
| QUARTERLY | Change in Amount | |||||||||||||||||||
| (A) | (B) | (C) | ||||||||||||||||||
| COUNTRY | 1Q21 | 4Q20 | 1Q20 | (A) - (B) | (A) - (C) | |||||||||||||||
| ARGENTINA | $ | 0 | $ | 1 | $ | 0 | $ | (1 | ) | $ | 0 | |||||||||
| BOLIVIA | 5 | 7 | 0 | (2 | ) | 5 | ||||||||||||||
| BRAZIL | 287 | 366 | 284 | (79 | ) | 3 | ||||||||||||||
| CHILE | 347 | 217 | 65 | 130 | 282 | |||||||||||||||
| COLOMBIA | 340 | 199 | 354 | 141 | (14 | ) | ||||||||||||||
| COSTA RICA | 23 | 79 | 67 | (56 | ) | (44 | ) | |||||||||||||
| DOMINICAN REPUBLIC | 183 | 97 | 120 | 86 | 63 | |||||||||||||||
| ECUADOR | 5 | 1 | 171 | 4 | (166 | ) | ||||||||||||||
| EL SALVADOR | 30 | 10 | 32 | 20 | (2 | ) | ||||||||||||||
| GUATEMALA | 99 | 84 | 43 | 15 | 56 | |||||||||||||||
| HONDURAS | 10 | 10 | 15 | 0 | (5 | ) | ||||||||||||||
| JAMAICA | 63 | 35 | 77 | 28 | (14 | ) | ||||||||||||||
| MEXICO | 508 | 534 | 982 | (26 | ) | (474 | ) | |||||||||||||
| PANAMA | 106 | 172 | 212 | (66 | ) | (106 | ) | |||||||||||||
| PARAGUAY | 63 | 40 | 28 | 23 | 35 | |||||||||||||||
| PERU | 106 | 196 | 133 | (90 | ) | (27 | ) | |||||||||||||
| TRINIDAD & TOBAGO | 0 | 0 | 5 | 0 | (5 | ) | ||||||||||||||
| UNITED STATES | 0 | 115 | 0 | (115 | ) | 0 | ||||||||||||||
| URUGUAY | 86 | 0 | 59 | 86 | 27 | |||||||||||||||
| OTHER NON-LATAM (1) | 131 | 90 | 370 | 41 | (239 | ) | ||||||||||||||
| TOTAL LOAN DISBURSED (2) | $ | 2,392 | $ | 2,253 | $ | 3,017 | $ | 139 | $ | (625 | ) | |||||||||
| (1) | Origination in highly rated countries outside the Region, mostly in Europe and North America, related to transactions carried out in the Region. | |
| (2) | Total loan disbursed does not include loan commitments and financial guarantee contracts, nor other interest-earning assets such as investment securities. |
23