0000890447false12/31Q3202300008904472023-01-012023-09-3000008904472023-11-06xbrli:shares00008904472023-09-30iso4217:USD00008904472022-12-31iso4217:USDxbrli:shares00008904472023-07-012023-09-3000008904472022-07-012022-09-3000008904472022-01-012022-09-300000890447us-gaap:CommonStockMember2022-09-300000890447us-gaap:CommonStockMember2023-09-300000890447us-gaap:SeriesAPreferredStockMember2022-09-300000890447us-gaap:SeriesAPreferredStockMember2023-09-300000890447us-gaap:CommonStockMember2022-12-310000890447us-gaap:SeriesAPreferredStockMemberus-gaap:PreferredStockMember2022-12-310000890447us-gaap:AdditionalPaidInCapitalMember2022-12-310000890447us-gaap:RetainedEarningsMember2022-12-310000890447us-gaap:NoncontrollingInterestMember2022-12-310000890447us-gaap:CommonStockMember2023-01-012023-03-310000890447us-gaap:AdditionalPaidInCapitalMember2023-01-012023-03-3100008904472023-01-012023-03-310000890447us-gaap:NoncontrollingInterestMember2023-01-012023-03-310000890447us-gaap:RetainedEarningsMember2023-01-012023-03-310000890447us-gaap:CommonStockMember2023-03-310000890447us-gaap:SeriesAPreferredStockMemberus-gaap:PreferredStockMember2023-03-310000890447us-gaap:AdditionalPaidInCapitalMember2023-03-310000890447us-gaap:RetainedEarningsMember2023-03-310000890447us-gaap:NoncontrollingInterestMember2023-03-3100008904472023-03-310000890447us-gaap:CommonStockMember2023-04-012023-06-300000890447us-gaap:AdditionalPaidInCapitalMember2023-04-012023-06-3000008904472023-04-012023-06-300000890447us-gaap:NoncontrollingInterestMember2023-04-012023-06-300000890447us-gaap:RetainedEarningsMember2023-04-012023-06-300000890447us-gaap:CommonStockMember2023-06-300000890447us-gaap:SeriesAPreferredStockMemberus-gaap:PreferredStockMember2023-06-300000890447us-gaap:AdditionalPaidInCapitalMember2023-06-300000890447us-gaap:RetainedEarningsMember2023-06-300000890447us-gaap:NoncontrollingInterestMember2023-06-3000008904472023-06-300000890447us-gaap:CommonStockMember2023-07-012023-09-300000890447us-gaap:AdditionalPaidInCapitalMember2023-07-012023-09-300000890447us-gaap:NoncontrollingInterestMember2023-07-012023-09-300000890447us-gaap:RetainedEarningsMember2023-07-012023-09-300000890447us-gaap:SeriesAPreferredStockMemberus-gaap:PreferredStockMember2023-09-300000890447us-gaap:AdditionalPaidInCapitalMember2023-09-300000890447us-gaap:RetainedEarningsMember2023-09-300000890447us-gaap:NoncontrollingInterestMember2023-09-300000890447us-gaap:CommonStockMember2021-12-310000890447us-gaap:SeriesAPreferredStockMemberus-gaap:PreferredStockMember2021-12-310000890447us-gaap:AdditionalPaidInCapitalMember2021-12-310000890447us-gaap:RetainedEarningsMember2021-12-310000890447us-gaap:NoncontrollingInterestMember2021-12-3100008904472021-12-310000890447us-gaap:CommonStockMember2022-01-012022-03-310000890447us-gaap:AdditionalPaidInCapitalMember2022-01-012022-03-3100008904472022-01-012022-03-310000890447vtnr:SeriesB1PreferredStockMemberus-gaap:CommonStockMember2022-01-012022-03-310000890447us-gaap:AdditionalPaidInCapitalMembervtnr:SeriesB1PreferredStockMember2022-01-012022-03-310000890447vtnr:SeriesB1PreferredStockMember2022-01-012022-03-310000890447us-gaap:SeriesAPreferredStockMemberus-gaap:CommonStockMember2022-01-012022-03-310000890447us-gaap:SeriesAPreferredStockMemberus-gaap:PreferredStockMember2022-01-012022-03-310000890447us-gaap:SeriesAPreferredStockMember2022-01-012022-03-310000890447us-gaap:RetainedEarningsMember2022-01-012022-03-310000890447us-gaap:NoncontrollingInterestMember2022-01-012022-03-310000890447us-gaap:CommonStockMember2022-03-310000890447us-gaap:SeriesAPreferredStockMemberus-gaap:PreferredStockMember2022-03-310000890447us-gaap:AdditionalPaidInCapitalMember2022-03-310000890447us-gaap:RetainedEarningsMember2022-03-310000890447us-gaap:NoncontrollingInterestMember2022-03-3100008904472022-03-310000890447us-gaap:CommonStockMember2022-04-012022-06-300000890447us-gaap:AdditionalPaidInCapitalMember2022-04-012022-06-3000008904472022-04-012022-06-300000890447us-gaap:NoncontrollingInterestMember2022-04-012022-06-300000890447us-gaap:RetainedEarningsMember2022-04-012022-06-300000890447us-gaap:SeriesAPreferredStockMemberus-gaap:CommonStockMember2022-04-012022-06-300000890447us-gaap:SeriesAPreferredStockMemberus-gaap:PreferredStockMember2022-04-012022-06-300000890447us-gaap:SeriesAPreferredStockMember2022-04-012022-06-300000890447us-gaap:CommonStockMember2022-06-300000890447us-gaap:SeriesAPreferredStockMemberus-gaap:PreferredStockMember2022-06-300000890447us-gaap:AdditionalPaidInCapitalMember2022-06-300000890447us-gaap:RetainedEarningsMember2022-06-300000890447us-gaap:NoncontrollingInterestMember2022-06-3000008904472022-06-300000890447us-gaap:CommonStockMember2022-07-012022-09-300000890447us-gaap:AdditionalPaidInCapitalMember2022-07-012022-09-300000890447vtnr:SeriesB1PreferredStockMemberus-gaap:CommonStockMember2022-07-012022-09-300000890447vtnr:SeriesB1PreferredStockMember2022-07-012022-09-300000890447us-gaap:RetainedEarningsMember2022-07-012022-09-300000890447us-gaap:NoncontrollingInterestMember2022-07-012022-09-300000890447us-gaap:SeriesAPreferredStockMemberus-gaap:PreferredStockMember2022-09-300000890447us-gaap:AdditionalPaidInCapitalMember2022-09-300000890447us-gaap:RetainedEarningsMember2022-09-300000890447us-gaap:NoncontrollingInterestMember2022-09-3000008904472022-09-300000890447vtnr:MobileRefineryMember2022-04-01utr:bblutr:Dutr:bbl0000890447vtnr:MobileRefineryMember2022-04-012022-04-010000890447vtnr:MobileRefineryMembervtnr:FinancingAgreementMembervtnr:HydrocarbonMember2022-04-012022-04-010000890447vtnr:HydrocarbonMember2022-04-012022-04-010000890447vtnr:UMOBusinessMemberus-gaap:DiscontinuedOperationsHeldforsaleMember2023-02-010000890447vtnr:ShortTermEquipmentLeaseDepositMember2023-09-300000890447vtnr:HeartlandBusinessMembervtnr:ShortTermEquipmentLeaseDepositMember2023-09-300000890447us-gaap:MoneyMarketFundsMember2023-09-300000890447vtnr:ShortTermEquipmentLeaseDepositMember2022-12-310000890447us-gaap:MoneyMarketFundsMember2022-12-310000890447vtnr:MobileRefineryMemberstpr:AL2022-04-01vtnr:mile0000890447vtnr:VertexAcquisitionMembervtnr:MobileRefineryMember2022-04-010000890447vtnr:FinancingAgreementMembervtnr:MobileRefineryMember2022-04-010000890447vtnr:FinancingAgreementMembervtnr:MobileRefineryMember2023-09-300000890447vtnr:VertexAcquisitionMembervtnr:MobileRefineryMember2023-09-300000890447vtnr:MobileRefineryMember2023-09-300000890447vtnr:MobileRefineryMember2022-07-012022-09-300000890447vtnr:MobileRefineryMember2022-01-012022-09-3000008904472023-02-16vtnr:lawsuit00008904472023-04-132023-04-13vtnr:defendant00008904472023-07-192023-07-190000890447us-gaap:EnvironmentalRemediationMemberus-gaap:EnvironmentalRemediationMember2023-09-300000890447us-gaap:EnvironmentalRemediationMemberus-gaap:EnvironmentalRemediationMember2022-12-310000890447us-gaap:OperatingSegmentsMembervtnr:RefiningAndMarketingMember2023-07-012023-09-300000890447us-gaap:OperatingSegmentsMembervtnr:BlackOilMember2023-07-012023-09-300000890447vtnr:CorporateAndEliminationsMember2023-07-012023-09-300000890447vtnr:GasolinesMemberus-gaap:OperatingSegmentsMembervtnr:RefiningAndMarketingMember2023-07-012023-09-300000890447vtnr:GasolinesMemberus-gaap:OperatingSegmentsMembervtnr:BlackOilMember2023-07-012023-09-300000890447vtnr:CorporateAndEliminationsMembervtnr:GasolinesMember2023-07-012023-09-300000890447vtnr:GasolinesMember2023-07-012023-09-300000890447vtnr:JetFuelsMemberus-gaap:OperatingSegmentsMembervtnr:RefiningAndMarketingMember2023-07-012023-09-300000890447vtnr:JetFuelsMemberus-gaap:OperatingSegmentsMembervtnr:BlackOilMember2023-07-012023-09-300000890447vtnr:CorporateAndEliminationsMembervtnr:JetFuelsMember2023-07-012023-09-300000890447vtnr:JetFuelsMember2023-07-012023-09-300000890447us-gaap:OperatingSegmentsMembervtnr:DieselMembervtnr:RefiningAndMarketingMember2023-07-012023-09-300000890447us-gaap:OperatingSegmentsMembervtnr:DieselMembervtnr:BlackOilMember2023-07-012023-09-300000890447vtnr:CorporateAndEliminationsMembervtnr:DieselMember2023-07-012023-09-300000890447vtnr:DieselMember2023-07-012023-09-300000890447us-gaap:OperatingSegmentsMembervtnr:RenewableMembervtnr:RefiningAndMarketingMember2023-07-012023-09-300000890447us-gaap:OperatingSegmentsMembervtnr:BlackOilMembervtnr:RenewableMember2023-07-012023-09-300000890447vtnr:CorporateAndEliminationsMembervtnr:RenewableMember2023-07-012023-09-300000890447vtnr:RenewableMember2023-07-012023-09-300000890447us-gaap:OperatingSegmentsMembervtnr:OtherRefineryProductsMembervtnr:RefiningAndMarketingMember2023-07-012023-09-300000890447us-gaap:OperatingSegmentsMembervtnr:BlackOilMembervtnr:OtherRefineryProductsMember2023-07-012023-09-300000890447vtnr:CorporateAndEliminationsMembervtnr:OtherRefineryProductsMember2023-07-012023-09-300000890447vtnr:OtherRefineryProductsMember2023-07-012023-09-300000890447us-gaap:OperatingSegmentsMembervtnr:PygasMembervtnr:RefiningAndMarketingMember2023-07-012023-09-300000890447us-gaap:OperatingSegmentsMembervtnr:BlackOilMembervtnr:PygasMember2023-07-012023-09-300000890447vtnr:CorporateAndEliminationsMembervtnr:PygasMember2023-07-012023-09-300000890447vtnr:PygasMember2023-07-012023-09-300000890447vtnr:MetalsMemberus-gaap:OperatingSegmentsMembervtnr:RefiningAndMarketingMember2023-07-012023-09-300000890447vtnr:MetalsMemberus-gaap:OperatingSegmentsMembervtnr:BlackOilMember2023-07-012023-09-300000890447vtnr:CorporateAndEliminationsMembervtnr:MetalsMember2023-07-012023-09-300000890447vtnr:MetalsMember2023-07-012023-09-300000890447us-gaap:OperatingSegmentsMembervtnr:OtherReRefineryProductsMembervtnr:RefiningAndMarketingMember2023-07-012023-09-300000890447us-gaap:OperatingSegmentsMembervtnr:BlackOilMembervtnr:OtherReRefineryProductsMember2023-07-012023-09-300000890447vtnr:CorporateAndEliminationsMembervtnr:OtherReRefineryProductsMember2023-07-012023-09-300000890447vtnr:OtherReRefineryProductsMember2023-07-012023-09-300000890447us-gaap:OperatingSegmentsMembervtnr:TerminallingMembervtnr:RefiningAndMarketingMember2023-07-012023-09-300000890447us-gaap:OperatingSegmentsMembervtnr:BlackOilMembervtnr:TerminallingMember2023-07-012023-09-300000890447vtnr:CorporateAndEliminationsMembervtnr:TerminallingMember2023-07-012023-09-300000890447vtnr:TerminallingMember2023-07-012023-09-300000890447us-gaap:OperatingSegmentsMembervtnr:OilCollectionServicesMembervtnr:RefiningAndMarketingMember2023-07-012023-09-300000890447us-gaap:OperatingSegmentsMembervtnr:OilCollectionServicesMembervtnr:BlackOilMember2023-07-012023-09-300000890447vtnr:CorporateAndEliminationsMembervtnr:OilCollectionServicesMember2023-07-012023-09-300000890447vtnr:OilCollectionServicesMember2023-07-012023-09-300000890447us-gaap:OperatingSegmentsMembervtnr:RefiningAndMarketingMember2022-07-012022-09-300000890447us-gaap:OperatingSegmentsMembervtnr:BlackOilMember2022-07-012022-09-300000890447vtnr:CorporateAndEliminationsMember2022-07-012022-09-300000890447vtnr:GasolinesMemberus-gaap:OperatingSegmentsMembervtnr:RefiningAndMarketingMember2022-07-012022-09-300000890447vtnr:GasolinesMemberus-gaap:OperatingSegmentsMembervtnr:BlackOilMember2022-07-012022-09-300000890447vtnr:CorporateAndEliminationsMembervtnr:GasolinesMember2022-07-012022-09-300000890447vtnr:GasolinesMember2022-07-012022-09-300000890447vtnr:JetFuelsMemberus-gaap:OperatingSegmentsMembervtnr:RefiningAndMarketingMember2022-07-012022-09-300000890447vtnr:JetFuelsMemberus-gaap:OperatingSegmentsMembervtnr:BlackOilMember2022-07-012022-09-300000890447vtnr:CorporateAndEliminationsMembervtnr:JetFuelsMember2022-07-012022-09-300000890447vtnr:JetFuelsMember2022-07-012022-09-300000890447us-gaap:OperatingSegmentsMembervtnr:DieselMembervtnr:RefiningAndMarketingMember2022-07-012022-09-300000890447us-gaap:OperatingSegmentsMembervtnr:DieselMembervtnr:BlackOilMember2022-07-012022-09-300000890447vtnr:CorporateAndEliminationsMembervtnr:DieselMember2022-07-012022-09-300000890447vtnr:DieselMember2022-07-012022-09-300000890447us-gaap:OperatingSegmentsMembervtnr:OtherRefineryProductsMembervtnr:RefiningAndMarketingMember2022-07-012022-09-300000890447us-gaap:OperatingSegmentsMembervtnr:BlackOilMembervtnr:OtherRefineryProductsMember2022-07-012022-09-300000890447vtnr:CorporateAndEliminationsMembervtnr:OtherRefineryProductsMember2022-07-012022-09-300000890447vtnr:OtherRefineryProductsMember2022-07-012022-09-300000890447us-gaap:OperatingSegmentsMembervtnr:PygasMembervtnr:RefiningAndMarketingMember2022-07-012022-09-300000890447us-gaap:OperatingSegmentsMembervtnr:BlackOilMembervtnr:PygasMember2022-07-012022-09-300000890447vtnr:CorporateAndEliminationsMembervtnr:PygasMember2022-07-012022-09-300000890447vtnr:PygasMember2022-07-012022-09-300000890447vtnr:MetalsMemberus-gaap:OperatingSegmentsMembervtnr:RefiningAndMarketingMember2022-07-012022-09-300000890447vtnr:MetalsMemberus-gaap:OperatingSegmentsMembervtnr:BlackOilMember2022-07-012022-09-300000890447vtnr:CorporateAndEliminationsMembervtnr:MetalsMember2022-07-012022-09-300000890447vtnr:MetalsMember2022-07-012022-09-300000890447us-gaap:OperatingSegmentsMembervtnr:OtherReRefineryProductsMembervtnr:RefiningAndMarketingMember2022-07-012022-09-300000890447us-gaap:OperatingSegmentsMembervtnr:BlackOilMembervtnr:OtherReRefineryProductsMember2022-07-012022-09-300000890447vtnr:CorporateAndEliminationsMembervtnr:OtherReRefineryProductsMember2022-07-012022-09-300000890447vtnr:OtherReRefineryProductsMember2022-07-012022-09-300000890447us-gaap:OperatingSegmentsMembervtnr:TerminallingMembervtnr:RefiningAndMarketingMember2022-07-012022-09-300000890447us-gaap:OperatingSegmentsMembervtnr:BlackOilMembervtnr:TerminallingMember2022-07-012022-09-300000890447vtnr:CorporateAndEliminationsMembervtnr:TerminallingMember2022-07-012022-09-300000890447vtnr:TerminallingMember2022-07-012022-09-300000890447us-gaap:OperatingSegmentsMembervtnr:OilCollectionServicesMembervtnr:RefiningAndMarketingMember2022-07-012022-09-300000890447us-gaap:OperatingSegmentsMembervtnr:OilCollectionServicesMembervtnr:BlackOilMember2022-07-012022-09-300000890447vtnr:CorporateAndEliminationsMembervtnr:OilCollectionServicesMember2022-07-012022-09-300000890447vtnr:OilCollectionServicesMember2022-07-012022-09-300000890447us-gaap:OperatingSegmentsMembervtnr:RefiningAndMarketingMember2023-01-012023-09-300000890447us-gaap:OperatingSegmentsMembervtnr:BlackOilMember2023-01-012023-09-300000890447vtnr:CorporateAndEliminationsMember2023-01-012023-09-300000890447vtnr:GasolinesMemberus-gaap:OperatingSegmentsMembervtnr:RefiningAndMarketingMember2023-01-012023-09-300000890447vtnr:GasolinesMemberus-gaap:OperatingSegmentsMembervtnr:BlackOilMember2023-01-012023-09-300000890447vtnr:CorporateAndEliminationsMembervtnr:GasolinesMember2023-01-012023-09-300000890447vtnr:GasolinesMember2023-01-012023-09-300000890447vtnr:JetFuelsMemberus-gaap:OperatingSegmentsMembervtnr:RefiningAndMarketingMember2023-01-012023-09-300000890447vtnr:JetFuelsMemberus-gaap:OperatingSegmentsMembervtnr:BlackOilMember2023-01-012023-09-300000890447vtnr:CorporateAndEliminationsMembervtnr:JetFuelsMember2023-01-012023-09-300000890447vtnr:JetFuelsMember2023-01-012023-09-300000890447us-gaap:OperatingSegmentsMembervtnr:DieselMembervtnr:RefiningAndMarketingMember2023-01-012023-09-300000890447us-gaap:OperatingSegmentsMembervtnr:DieselMembervtnr:BlackOilMember2023-01-012023-09-300000890447vtnr:CorporateAndEliminationsMembervtnr:DieselMember2023-01-012023-09-300000890447vtnr:DieselMember2023-01-012023-09-300000890447us-gaap:OperatingSegmentsMembervtnr:RenewableMembervtnr:RefiningAndMarketingMember2023-01-012023-09-300000890447us-gaap:OperatingSegmentsMembervtnr:BlackOilMembervtnr:RenewableMember2023-01-012023-09-300000890447vtnr:CorporateAndEliminationsMembervtnr:RenewableMember2023-01-012023-09-300000890447vtnr:RenewableMember2023-01-012023-09-300000890447us-gaap:OperatingSegmentsMembervtnr:OtherRefineryProductsMembervtnr:RefiningAndMarketingMember2023-01-012023-09-300000890447us-gaap:OperatingSegmentsMembervtnr:BlackOilMembervtnr:OtherRefineryProductsMember2023-01-012023-09-300000890447vtnr:CorporateAndEliminationsMembervtnr:OtherRefineryProductsMember2023-01-012023-09-300000890447vtnr:OtherRefineryProductsMember2023-01-012023-09-300000890447us-gaap:OperatingSegmentsMembervtnr:PygasMembervtnr:RefiningAndMarketingMember2023-01-012023-09-300000890447us-gaap:OperatingSegmentsMembervtnr:BlackOilMembervtnr:PygasMember2023-01-012023-09-300000890447vtnr:CorporateAndEliminationsMembervtnr:PygasMember2023-01-012023-09-300000890447vtnr:PygasMember2023-01-012023-09-300000890447vtnr:MetalsMemberus-gaap:OperatingSegmentsMembervtnr:RefiningAndMarketingMember2023-01-012023-09-300000890447vtnr:MetalsMemberus-gaap:OperatingSegmentsMembervtnr:BlackOilMember2023-01-012023-09-300000890447vtnr:CorporateAndEliminationsMembervtnr:MetalsMember2023-01-012023-09-300000890447vtnr:MetalsMember2023-01-012023-09-300000890447us-gaap:OperatingSegmentsMembervtnr:OtherReRefineryProductsMembervtnr:RefiningAndMarketingMember2023-01-012023-09-300000890447us-gaap:OperatingSegmentsMembervtnr:BlackOilMembervtnr:OtherReRefineryProductsMember2023-01-012023-09-300000890447vtnr:CorporateAndEliminationsMembervtnr:OtherReRefineryProductsMember2023-01-012023-09-300000890447vtnr:OtherReRefineryProductsMember2023-01-012023-09-300000890447us-gaap:OperatingSegmentsMembervtnr:TerminallingMembervtnr:RefiningAndMarketingMember2023-01-012023-09-300000890447us-gaap:OperatingSegmentsMembervtnr:BlackOilMembervtnr:TerminallingMember2023-01-012023-09-300000890447vtnr:CorporateAndEliminationsMembervtnr:TerminallingMember2023-01-012023-09-300000890447vtnr:TerminallingMember2023-01-012023-09-300000890447us-gaap:OperatingSegmentsMembervtnr:OilCollectionServicesMembervtnr:RefiningAndMarketingMember2023-01-012023-09-300000890447us-gaap:OperatingSegmentsMembervtnr:OilCollectionServicesMembervtnr:BlackOilMember2023-01-012023-09-300000890447vtnr:CorporateAndEliminationsMembervtnr:OilCollectionServicesMember2023-01-012023-09-300000890447vtnr:OilCollectionServicesMember2023-01-012023-09-300000890447us-gaap:OperatingSegmentsMembervtnr:RefiningAndMarketingMember2022-01-012022-09-300000890447us-gaap:OperatingSegmentsMembervtnr:BlackOilMember2022-01-012022-09-300000890447vtnr:CorporateAndEliminationsMember2022-01-012022-09-300000890447vtnr:GasolinesMemberus-gaap:OperatingSegmentsMembervtnr:RefiningAndMarketingMember2022-01-012022-09-300000890447vtnr:GasolinesMemberus-gaap:OperatingSegmentsMembervtnr:BlackOilMember2022-01-012022-09-300000890447vtnr:CorporateAndEliminationsMembervtnr:GasolinesMember2022-01-012022-09-300000890447vtnr:GasolinesMember2022-01-012022-09-300000890447vtnr:JetFuelsMemberus-gaap:OperatingSegmentsMembervtnr:RefiningAndMarketingMember2022-01-012022-09-300000890447vtnr:JetFuelsMemberus-gaap:OperatingSegmentsMembervtnr:BlackOilMember2022-01-012022-09-300000890447vtnr:CorporateAndEliminationsMembervtnr:JetFuelsMember2022-01-012022-09-300000890447vtnr:JetFuelsMember2022-01-012022-09-300000890447us-gaap:OperatingSegmentsMembervtnr:DieselMembervtnr:RefiningAndMarketingMember2022-01-012022-09-300000890447us-gaap:OperatingSegmentsMembervtnr:DieselMembervtnr:BlackOilMember2022-01-012022-09-300000890447vtnr:CorporateAndEliminationsMembervtnr:DieselMember2022-01-012022-09-300000890447vtnr:DieselMember2022-01-012022-09-300000890447us-gaap:OperatingSegmentsMembervtnr:OtherRefineryProductsMembervtnr:RefiningAndMarketingMember2022-01-012022-09-300000890447us-gaap:OperatingSegmentsMembervtnr:BlackOilMembervtnr:OtherRefineryProductsMember2022-01-012022-09-300000890447vtnr:CorporateAndEliminationsMembervtnr:OtherRefineryProductsMember2022-01-012022-09-300000890447vtnr:OtherRefineryProductsMember2022-01-012022-09-300000890447us-gaap:OperatingSegmentsMembervtnr:PygasMembervtnr:RefiningAndMarketingMember2022-01-012022-09-300000890447us-gaap:OperatingSegmentsMembervtnr:BlackOilMembervtnr:PygasMember2022-01-012022-09-300000890447vtnr:CorporateAndEliminationsMembervtnr:PygasMember2022-01-012022-09-300000890447vtnr:PygasMember2022-01-012022-09-300000890447vtnr:MetalsMemberus-gaap:OperatingSegmentsMembervtnr:RefiningAndMarketingMember2022-01-012022-09-300000890447vtnr:MetalsMemberus-gaap:OperatingSegmentsMembervtnr:BlackOilMember2022-01-012022-09-300000890447vtnr:CorporateAndEliminationsMembervtnr:MetalsMember2022-01-012022-09-300000890447vtnr:MetalsMember2022-01-012022-09-300000890447us-gaap:OperatingSegmentsMembervtnr:OtherReRefineryProductsMembervtnr:RefiningAndMarketingMember2022-01-012022-09-300000890447us-gaap:OperatingSegmentsMembervtnr:BlackOilMembervtnr:OtherReRefineryProductsMember2022-01-012022-09-300000890447vtnr:CorporateAndEliminationsMembervtnr:OtherReRefineryProductsMember2022-01-012022-09-300000890447vtnr:OtherReRefineryProductsMember2022-01-012022-09-300000890447us-gaap:OperatingSegmentsMembervtnr:TerminallingMembervtnr:RefiningAndMarketingMember2022-01-012022-09-300000890447us-gaap:OperatingSegmentsMembervtnr:BlackOilMembervtnr:TerminallingMember2022-01-012022-09-300000890447vtnr:CorporateAndEliminationsMembervtnr:TerminallingMember2022-01-012022-09-300000890447vtnr:TerminallingMember2022-01-012022-09-300000890447us-gaap:OperatingSegmentsMembervtnr:OilCollectionServicesMembervtnr:RefiningAndMarketingMember2022-01-012022-09-300000890447us-gaap:OperatingSegmentsMembervtnr:OilCollectionServicesMembervtnr:BlackOilMember2022-01-012022-09-300000890447vtnr:CorporateAndEliminationsMembervtnr:OilCollectionServicesMember2022-01-012022-09-300000890447vtnr:OilCollectionServicesMember2022-01-012022-09-300000890447us-gaap:OperatingSegmentsMembervtnr:RefinedProductsMembervtnr:RefiningAndMarketingMember2023-07-012023-09-300000890447us-gaap:OperatingSegmentsMembervtnr:BlackOilMembervtnr:RefinedProductsMember2023-07-012023-09-300000890447vtnr:CorporateAndEliminationsMembervtnr:RefinedProductsMember2023-07-012023-09-300000890447vtnr:RefinedProductsMember2023-07-012023-09-300000890447us-gaap:OperatingSegmentsMembervtnr:ReRefinedProductsMembervtnr:RefiningAndMarketingMember2023-07-012023-09-300000890447us-gaap:OperatingSegmentsMembervtnr:BlackOilMembervtnr:ReRefinedProductsMember2023-07-012023-09-300000890447vtnr:CorporateAndEliminationsMembervtnr:ReRefinedProductsMember2023-07-012023-09-300000890447vtnr:ReRefinedProductsMember2023-07-012023-09-300000890447vtnr:ServicesMemberus-gaap:OperatingSegmentsMembervtnr:RefiningAndMarketingMember2023-07-012023-09-300000890447vtnr:ServicesMemberus-gaap:OperatingSegmentsMembervtnr:BlackOilMember2023-07-012023-09-300000890447vtnr:ServicesMembervtnr:CorporateAndEliminationsMember2023-07-012023-09-300000890447vtnr:ServicesMember2023-07-012023-09-300000890447us-gaap:OperatingSegmentsMembervtnr:RefinedProductsMembervtnr:RefiningAndMarketingMember2022-07-012022-09-300000890447us-gaap:OperatingSegmentsMembervtnr:BlackOilMembervtnr:RefinedProductsMember2022-07-012022-09-300000890447vtnr:CorporateAndEliminationsMembervtnr:RefinedProductsMember2022-07-012022-09-300000890447vtnr:RefinedProductsMember2022-07-012022-09-300000890447us-gaap:OperatingSegmentsMembervtnr:ReRefinedProductsMembervtnr:RefiningAndMarketingMember2022-07-012022-09-300000890447us-gaap:OperatingSegmentsMembervtnr:BlackOilMembervtnr:ReRefinedProductsMember2022-07-012022-09-300000890447vtnr:CorporateAndEliminationsMembervtnr:ReRefinedProductsMember2022-07-012022-09-300000890447vtnr:ReRefinedProductsMember2022-07-012022-09-300000890447vtnr:ServicesMemberus-gaap:OperatingSegmentsMembervtnr:RefiningAndMarketingMember2022-07-012022-09-300000890447vtnr:ServicesMemberus-gaap:OperatingSegmentsMembervtnr:BlackOilMember2022-07-012022-09-300000890447vtnr:ServicesMembervtnr:CorporateAndEliminationsMember2022-07-012022-09-300000890447vtnr:ServicesMember2022-07-012022-09-300000890447us-gaap:OperatingSegmentsMembervtnr:RefinedProductsMembervtnr:RefiningAndMarketingMember2023-01-012023-09-300000890447us-gaap:OperatingSegmentsMembervtnr:BlackOilMembervtnr:RefinedProductsMember2023-01-012023-09-300000890447vtnr:CorporateAndEliminationsMembervtnr:RefinedProductsMember2023-01-012023-09-300000890447vtnr:RefinedProductsMember2023-01-012023-09-300000890447us-gaap:OperatingSegmentsMembervtnr:ReRefinedProductsMembervtnr:RefiningAndMarketingMember2023-01-012023-09-300000890447us-gaap:OperatingSegmentsMembervtnr:BlackOilMembervtnr:ReRefinedProductsMember2023-01-012023-09-300000890447vtnr:CorporateAndEliminationsMembervtnr:ReRefinedProductsMember2023-01-012023-09-300000890447vtnr:ReRefinedProductsMember2023-01-012023-09-300000890447vtnr:ServicesMemberus-gaap:OperatingSegmentsMembervtnr:RefiningAndMarketingMember2023-01-012023-09-300000890447vtnr:ServicesMemberus-gaap:OperatingSegmentsMembervtnr:BlackOilMember2023-01-012023-09-300000890447vtnr:ServicesMembervtnr:CorporateAndEliminationsMember2023-01-012023-09-300000890447vtnr:ServicesMember2023-01-012023-09-300000890447us-gaap:OperatingSegmentsMembervtnr:RefinedProductsMembervtnr:RefiningAndMarketingMember2022-01-012022-09-300000890447us-gaap:OperatingSegmentsMembervtnr:BlackOilMembervtnr:RefinedProductsMember2022-01-012022-09-300000890447vtnr:CorporateAndEliminationsMembervtnr:RefinedProductsMember2022-01-012022-09-300000890447vtnr:RefinedProductsMember2022-01-012022-09-300000890447us-gaap:OperatingSegmentsMembervtnr:ReRefinedProductsMembervtnr:RefiningAndMarketingMember2022-01-012022-09-300000890447us-gaap:OperatingSegmentsMembervtnr:BlackOilMembervtnr:ReRefinedProductsMember2022-01-012022-09-300000890447vtnr:CorporateAndEliminationsMembervtnr:ReRefinedProductsMember2022-01-012022-09-300000890447vtnr:ReRefinedProductsMember2022-01-012022-09-300000890447vtnr:ServicesMemberus-gaap:OperatingSegmentsMembervtnr:RefiningAndMarketingMember2022-01-012022-09-300000890447vtnr:ServicesMemberus-gaap:OperatingSegmentsMembervtnr:BlackOilMember2022-01-012022-09-300000890447vtnr:ServicesMembervtnr:CorporateAndEliminationsMember2022-01-012022-09-300000890447vtnr:ServicesMember2022-01-012022-09-300000890447us-gaap:OperatingSegmentsMembervtnr:RefiningAndMarketingMember2023-09-300000890447us-gaap:OperatingSegmentsMembervtnr:BlackOilMember2023-09-300000890447vtnr:CorporateAndEliminationsMember2023-09-300000890447us-gaap:OperatingSegmentsMembervtnr:RefiningAndMarketingMember2022-12-310000890447us-gaap:OperatingSegmentsMembervtnr:BlackOilMember2022-12-310000890447vtnr:CorporateAndEliminationsMember2022-12-31vtnr:bank0000890447us-gaap:SalesRevenueNetMemberus-gaap:CustomerConcentrationRiskMembervtnr:Customer1Member2023-01-012023-09-30xbrli:pure0000890447us-gaap:CustomerConcentrationRiskMemberus-gaap:AccountsReceivableMembervtnr:Customer1Member2023-01-012023-09-300000890447us-gaap:SalesRevenueNetMemberus-gaap:CustomerConcentrationRiskMembervtnr:Customer1Member2022-01-012022-09-300000890447us-gaap:CustomerConcentrationRiskMemberus-gaap:AccountsReceivableMembervtnr:Customer1Member2022-01-012022-09-300000890447us-gaap:SalesRevenueNetMembervtnr:Customer2Memberus-gaap:CustomerConcentrationRiskMember2023-01-012023-09-300000890447vtnr:Customer2Memberus-gaap:CustomerConcentrationRiskMemberus-gaap:AccountsReceivableMember2023-01-012023-09-300000890447us-gaap:SalesRevenueNetMembervtnr:Customer2Memberus-gaap:CustomerConcentrationRiskMember2022-01-012022-09-300000890447vtnr:Customer2Memberus-gaap:CustomerConcentrationRiskMemberus-gaap:AccountsReceivableMember2022-01-012022-09-300000890447us-gaap:SalesRevenueNetMemberus-gaap:CustomerConcentrationRiskMembervtnr:BlackOilMembervtnr:Customer1Member2023-07-012023-09-300000890447us-gaap:SalesRevenueNetMemberus-gaap:CustomerConcentrationRiskMembervtnr:RefiningMembervtnr:Customer1Member2023-07-012023-09-300000890447us-gaap:SalesRevenueNetMemberus-gaap:CustomerConcentrationRiskMembervtnr:BlackOilMembervtnr:Customer1Member2022-07-012022-09-300000890447us-gaap:SalesRevenueNetMemberus-gaap:CustomerConcentrationRiskMembervtnr:RefiningMembervtnr:Customer1Member2022-07-012022-09-300000890447us-gaap:SalesRevenueNetMemberus-gaap:CustomerConcentrationRiskMembervtnr:BlackOilMembervtnr:Customer1Member2023-01-012023-09-300000890447us-gaap:SalesRevenueNetMemberus-gaap:CustomerConcentrationRiskMembervtnr:RefiningMembervtnr:Customer1Member2023-01-012023-09-300000890447us-gaap:SalesRevenueNetMemberus-gaap:CustomerConcentrationRiskMembervtnr:BlackOilMembervtnr:Customer1Member2022-01-012022-09-300000890447us-gaap:SalesRevenueNetMemberus-gaap:CustomerConcentrationRiskMembervtnr:RefiningMembervtnr:Customer1Member2022-01-012022-09-300000890447us-gaap:SalesRevenueNetMembervtnr:Customer2Memberus-gaap:CustomerConcentrationRiskMembervtnr:BlackOilMember2023-07-012023-09-300000890447us-gaap:SalesRevenueNetMembervtnr:Customer2Memberus-gaap:CustomerConcentrationRiskMembervtnr:RefiningMember2023-07-012023-09-300000890447us-gaap:SalesRevenueNetMembervtnr:Customer2Memberus-gaap:CustomerConcentrationRiskMembervtnr:BlackOilMember2022-07-012022-09-300000890447us-gaap:SalesRevenueNetMembervtnr:Customer2Memberus-gaap:CustomerConcentrationRiskMembervtnr:RefiningMember2022-07-012022-09-300000890447us-gaap:SalesRevenueNetMembervtnr:Customer2Memberus-gaap:CustomerConcentrationRiskMembervtnr:BlackOilMember2023-01-012023-09-300000890447us-gaap:SalesRevenueNetMembervtnr:Customer2Memberus-gaap:CustomerConcentrationRiskMembervtnr:RefiningMember2023-01-012023-09-300000890447us-gaap:SalesRevenueNetMembervtnr:Customer2Memberus-gaap:CustomerConcentrationRiskMembervtnr:BlackOilMember2022-01-012022-09-300000890447us-gaap:SalesRevenueNetMembervtnr:Customer2Memberus-gaap:CustomerConcentrationRiskMembervtnr:RefiningMember2022-01-012022-09-300000890447vtnr:PurchasesBenchmarkMembervtnr:VendorConcentrationRiskMember2023-01-012023-09-30vtnr:vendor0000890447vtnr:PurchasesBenchmarkMembervtnr:VendorConcentrationRiskMembervtnr:VendorOneMember2023-01-012023-09-300000890447vtnr:PurchasesBenchmarkMembervtnr:VendorConcentrationRiskMembervtnr:VendorOneMember2022-01-012022-09-300000890447vtnr:AccountsPayableBenchmarkMembervtnr:VendorConcentrationRiskMembervtnr:VendorOneMember2023-01-012023-09-300000890447vtnr:AccountsPayableBenchmarkMembervtnr:VendorConcentrationRiskMembervtnr:VendorOneMember2022-01-012022-09-300000890447vtnr:CurdeOilMember2023-09-300000890447vtnr:CurdeOilMember2022-12-310000890447vtnr:RenewableFeedstocksMember2023-09-300000890447vtnr:RenewableFeedstocksMember2022-12-310000890447vtnr:RefinedProductsMember2023-09-300000890447vtnr:RefinedProductsMember2022-12-310000890447vtnr:ReRefinedProductsMember2023-09-300000890447vtnr:ReRefinedProductsMember2022-12-310000890447vtnr:TotalHydrocarbonInventoriesMember2023-09-300000890447vtnr:TotalHydrocarbonInventoriesMember2022-12-310000890447vtnr:MacquarieEnergyNorthAmericaTradingIncMembervtnr:InventoryFinancingAgreementMember2023-09-300000890447vtnr:MacquarieEnergyNorthAmericaTradingIncMembervtnr:InventoryFinancingAgreementMember2022-12-310000890447vtnr:MacquarieEnergyNorthAmericaTradingIncMembervtnr:VertexRefiningMember2022-04-012022-04-010000890447vtnr:MacquarieEnergyNorthAmericaTradingIncMembervtnr:VertexRefiningMember2023-05-262023-05-260000890447us-gaap:EquipmentMember2023-09-300000890447us-gaap:EquipmentMember2022-12-310000890447us-gaap:FurnitureAndFixturesMember2023-09-300000890447us-gaap:FurnitureAndFixturesMember2022-12-310000890447us-gaap:LeaseholdImprovementsMember2023-09-300000890447us-gaap:LeaseholdImprovementsMember2022-12-310000890447us-gaap:OfficeEquipmentMember2023-09-300000890447us-gaap:OfficeEquipmentMember2022-12-310000890447us-gaap:VehiclesMember2023-09-300000890447us-gaap:VehiclesMember2022-12-310000890447us-gaap:BuildingMember2023-09-300000890447us-gaap:BuildingMember2022-12-310000890447vtnr:TurnaroundsMember2023-09-300000890447vtnr:TurnaroundsMember2022-12-310000890447us-gaap:ConstructionInProgressMember2023-09-300000890447us-gaap:ConstructionInProgressMember2022-12-310000890447us-gaap:LandMember2023-09-300000890447us-gaap:LandMember2022-12-310000890447us-gaap:CustomerRelationshipsMember2023-09-300000890447us-gaap:CustomerRelationshipsMember2022-12-310000890447vtnr:VendorRelationsMember2023-09-300000890447vtnr:VendorRelationsMember2022-12-310000890447us-gaap:TrademarksAndTradeNamesMember2023-09-300000890447us-gaap:TrademarksAndTradeNamesMember2022-12-310000890447vtnr:TCEPTechnologyPatentMember2023-09-300000890447vtnr:TCEPTechnologyPatentMember2022-12-310000890447us-gaap:NoncompeteAgreementsMember2023-09-300000890447us-gaap:NoncompeteAgreementsMember2022-12-310000890447vtnr:PurchasedSoftwareMember2023-09-300000890447vtnr:PurchasedSoftwareMember2022-12-310000890447vtnr:LicensingFeeMember2023-09-300000890447vtnr:LicensingFeeMember2022-12-310000890447us-gaap:ConvertibleDebtMember2023-09-300000890447us-gaap:ConvertibleDebtMember2022-12-310000890447vtnr:TermLoan2025Member2023-09-300000890447vtnr:TermLoan2025Member2022-12-310000890447vtnr:SmallBusinessAdministrationLoanMembervtnr:LoanLeverageLubricantsMember2023-09-300000890447vtnr:SmallBusinessAdministrationLoanMembervtnr:LoanLeverageLubricantsMember2022-12-310000890447vtnr:JohnDeereNoteMembervtnr:VariousInstitutionsMember2023-09-300000890447vtnr:JohnDeereNoteMembervtnr:VariousInstitutionsMember2022-12-310000890447vtnr:VariousInstitutionsMembersrt:MinimumMembervtnr:InsurancePremiumFinancingMember2023-09-300000890447vtnr:VariousInstitutionsMembervtnr:InsurancePremiumFinancingMembersrt:MaximumMember2023-09-300000890447vtnr:VariousInstitutionsMembervtnr:InsurancePremiumFinancingMember2023-09-300000890447vtnr:VariousInstitutionsMembervtnr:InsurancePremiumFinancingMember2022-12-310000890447vtnr:VertexRefiningMembervtnr:FirstLienSeniorSecuredTermLoanFacilityMemberus-gaap:SecuredDebtMember2022-04-010000890447vtnr:VertexRefiningMembervtnr:FirstLienSeniorSecuredTermLoanFacilityMemberus-gaap:SecuredDebtMember2023-01-012023-09-300000890447us-gaap:WarrantMember2022-04-010000890447us-gaap:WarrantMember2022-05-260000890447vtnr:ConvertibleSeniorNotesDue2027625Memberus-gaap:SeniorNotesMember2021-11-010000890447vtnr:ConvertibleSeniorNotesDue2027625Memberus-gaap:SeniorNotesMember2023-06-120000890447vtnr:ConvertibleSeniorNotesDue2027625Memberus-gaap:SeniorNotesMember2023-06-122023-06-120000890447us-gaap:ConvertibleDebtMember2023-09-300000890447us-gaap:ConvertibleDebtMember2022-12-310000890447vtnr:MathesonTriGasMembervtnr:MathesonTriGasMember2023-09-300000890447vtnr:MathesonTriGasMembervtnr:MathesonTriGasMember2022-12-310000890447vtnr:PlaqueminesMembervtnr:PlaqueminesMember2023-09-300000890447vtnr:PlaqueminesMembervtnr:PlaqueminesMember2022-12-310000890447vtnr:HarveyFordMembervtnr:HarveyFordMember2023-09-300000890447vtnr:HarveyFordMembervtnr:HarveyFordMember2022-12-310000890447vtnr:DLLFinancialMembervtnr:DLLFinancialMember2023-09-300000890447vtnr:DLLFinancialMembervtnr:DLLFinancialMember2022-12-310000890447vtnr:CenterpointBlakelyMembervtnr:CenterpointBlakelyMember2023-09-300000890447vtnr:CenterpointBlakelyMembervtnr:CenterpointBlakelyMember2022-12-310000890447us-gaap:ManufacturingFacilityMember2023-09-300000890447us-gaap:RailroadTransportationEquipmentMember2023-09-300000890447vtnr:FiveYearExtensionOptionMemberus-gaap:ManufacturingFacilityMember2023-01-012023-09-30vtnr:lease0000890447vtnr:FiveYearExtensionOptionMemberus-gaap:ManufacturingFacilityMember2023-09-300000890447vtnr:OneYearExtensionOptionMemberus-gaap:ManufacturingFacilityMember2023-01-012023-09-300000890447vtnr:OneYearExtensionOptionMemberus-gaap:ManufacturingFacilityMember2023-09-300000890447vtnr:ThreeYearExtensionOptionMemberus-gaap:EquipmentMember2023-01-012023-09-300000890447vtnr:ThreeYearExtensionOptionMemberus-gaap:EquipmentMember2023-09-30vtnr:votexbrli:shares0000890447us-gaap:CommonStockMember2023-01-012023-09-300000890447vtnr:ConvertibleSeniorNotesDue2027625Memberus-gaap:SeniorNotesMember2023-01-012023-09-300000890447us-gaap:CommonStockMember2022-01-012022-09-300000890447us-gaap:SeriesAPreferredStockMember2022-01-012022-09-300000890447us-gaap:SeniorNotesMember2023-01-012023-09-300000890447us-gaap:CommonStockMember2022-03-242022-03-240000890447vtnr:CarrhaeCoFBOWasatchMicroCapValueFundMemberus-gaap:CommonStockMember2022-03-240000890447us-gaap:CommonStockMember2022-03-240000890447vtnr:ConvertibleSeniorNotesDue2027625Memberus-gaap:SeniorNotesMember2022-09-300000890447vtnr:ConvertibleSeniorNotesDue2027625Memberus-gaap:SeniorNotesMember2022-01-012022-09-300000890447us-gaap:EmployeeStockOptionMember2023-01-012023-09-300000890447us-gaap:EmployeeStockOptionMember2022-01-012022-09-300000890447us-gaap:WarrantMember2023-01-012023-09-300000890447us-gaap:WarrantMember2022-01-012022-09-300000890447us-gaap:ConvertibleDebtSecuritiesMember2023-01-012023-09-300000890447us-gaap:ConvertibleDebtSecuritiesMember2022-01-012022-09-300000890447us-gaap:CommodityContractMemberus-gaap:FairValueInputsLevel1Member2023-09-300000890447us-gaap:CommodityContractMemberus-gaap:FairValueInputsLevel2Member2023-09-300000890447us-gaap:CommodityContractMemberus-gaap:FairValueInputsLevel3Member2023-09-300000890447us-gaap:CommodityContractMember2023-09-300000890447us-gaap:FairValueInputsLevel1Member2023-09-300000890447us-gaap:FairValueInputsLevel2Member2023-09-300000890447us-gaap:FairValueInputsLevel3Member2023-09-300000890447us-gaap:DerivativeMemberus-gaap:FairValueInputsLevel1Member2023-09-300000890447us-gaap:FairValueInputsLevel2Memberus-gaap:DerivativeMember2023-09-300000890447us-gaap:DerivativeMemberus-gaap:FairValueInputsLevel3Member2023-09-300000890447us-gaap:DerivativeMember2023-09-300000890447us-gaap:CommodityContractMemberus-gaap:FairValueInputsLevel1Member2022-12-310000890447us-gaap:CommodityContractMemberus-gaap:FairValueInputsLevel2Member2022-12-310000890447us-gaap:CommodityContractMemberus-gaap:FairValueInputsLevel3Member2022-12-310000890447us-gaap:CommodityContractMember2022-12-310000890447us-gaap:DerivativeMemberus-gaap:FairValueInputsLevel1Member2022-12-310000890447us-gaap:FairValueInputsLevel2Memberus-gaap:DerivativeMember2022-12-310000890447us-gaap:DerivativeMemberus-gaap:FairValueInputsLevel3Member2022-12-310000890447us-gaap:DerivativeMember2022-12-310000890447us-gaap:FairValueInputsLevel1Member2022-12-310000890447us-gaap:FairValueInputsLevel2Member2022-12-310000890447us-gaap:FairValueInputsLevel3Member2022-12-310000890447us-gaap:WarrantMember2023-09-300000890447us-gaap:EmployeeStockOptionMemberus-gaap:WarrantMember2023-01-012023-09-300000890447vtnr:AdditionalWarrantsMemberus-gaap:EmployeeStockOptionMember2023-01-012023-09-300000890447us-gaap:FairValueInputsLevel3Member2021-12-310000890447us-gaap:FairValueInputsLevel3Member2023-01-012023-09-300000890447us-gaap:FairValueInputsLevel3Member2022-01-012022-12-310000890447vtnr:CrudeOilFuturesOneMember2023-09-30iso4217:USDutr:bbl0000890447vtnr:CrudeOilFuturesOneMember2023-01-012023-09-300000890447vtnr:CrudeOilFuturesTwoMember2023-09-300000890447vtnr:CrudeOilFuturesTwoMember2023-01-012023-09-300000890447vtnr:CrudeOilFuturesThreeMember2023-09-300000890447vtnr:CrudeOilFuturesThreeMember2023-01-012023-09-300000890447vtnr:CrudeOilSwapsOneMember2023-09-300000890447vtnr:CrudeOilSwapsOneMember2023-01-012023-09-300000890447vtnr:CrudeOilSwapTwoMember2023-09-300000890447vtnr:CrudeOilSwapTwoMember2023-01-012023-09-300000890447vtnr:CrudeOilSwapThreeMember2023-09-300000890447vtnr:CrudeOilSwapThreeMember2023-01-012023-09-300000890447vtnr:CrudeOilSwapFourMember2023-09-300000890447vtnr:CrudeOilSwapFourMember2023-01-012023-09-300000890447vtnr:CrudeOilSwapFiveMember2023-09-300000890447vtnr:CrudeOilSwapFiveMember2023-01-012023-09-300000890447vtnr:CrudeOilSwapSixMember2023-09-300000890447vtnr:CrudeOilSwapSixMember2023-01-012023-09-300000890447vtnr:CrudeOilSwapSevenMember2022-12-310000890447vtnr:CrudeOilSwapSevenMember2022-01-012022-12-310000890447vtnr:CrudeOilSwapEightMember2022-12-310000890447vtnr:CrudeOilSwapEightMember2022-01-012022-12-310000890447vtnr:CrudeOilFuturesFourMember2022-12-310000890447vtnr:CrudeOilFuturesFourMember2022-01-012022-12-310000890447vtnr:CrudeOilFuturesFiveMember2022-12-310000890447vtnr:CrudeOilFuturesFiveMember2022-01-012022-12-310000890447vtnr:CrudeOilFuturesSixMember2022-12-310000890447vtnr:CrudeOilFuturesSixMember2022-01-012022-12-310000890447vtnr:CrudeOilFuturesSevenMember2022-12-310000890447vtnr:CrudeOilFuturesSevenMember2022-01-012022-12-310000890447vtnr:CrudeOilFuturesEightMember2022-12-310000890447vtnr:CrudeOilFuturesEightMember2022-01-012022-12-310000890447vtnr:CrudeOilFuturesNineMember2022-12-310000890447vtnr:CrudeOilFuturesNineMember2022-01-012022-12-310000890447vtnr:CrudeOilFuturesTenMember2022-12-310000890447vtnr:CrudeOilFuturesTenMember2022-01-012022-12-310000890447vtnr:CrudeOilFuturesElevenMember2022-12-310000890447vtnr:CrudeOilFuturesElevenMember2022-01-012022-12-310000890447vtnr:CrudeOilFuturesMember2023-09-300000890447vtnr:CrudeOilFuturesMember2022-12-310000890447vtnr:SoybeanOilFuturesMember2023-09-300000890447vtnr:SoybeanOilFuturesMember2022-12-310000890447vtnr:CrudeOilFutures1Member2023-09-300000890447vtnr:CrudeOilFutures1Member2022-12-310000890447vtnr:GasSwapMember2023-09-300000890447vtnr:GasSwapMember2022-12-310000890447vtnr:CrudeOilSwapMember2023-09-300000890447vtnr:CrudeOilSwapMember2022-12-310000890447srt:SubsidiariesMembervtnr:VertexRecoveryManagementLLCMember2016-05-250000890447vtnr:VertexRecoveryManagementLALLCMembervtnr:IndustrialPipeInc.Member2016-05-250000890447vtnr:LeverageLubricantsLLCMember2023-01-012023-09-300000890447vtnr:LeverageLubricantsLLCMember2022-01-012022-09-300000890447vtnr:VertexRecoveryManagementLALLCMembersrt:SubsidiariesMember2023-07-012023-09-300000890447vtnr:VertexRecoveryManagementLALLCMembersrt:SubsidiariesMember2022-07-012022-09-300000890447vtnr:VertexRecoveryManagementLALLCMembersrt:SubsidiariesMember2023-01-012023-09-300000890447vtnr:VertexRecoveryManagementLALLCMembersrt:SubsidiariesMember2022-01-012022-09-300000890447vtnr:IndustrialPipeInc.Member2023-07-012023-09-300000890447vtnr:IndustrialPipeInc.Member2022-07-012022-09-300000890447vtnr:IndustrialPipeInc.Member2023-01-012023-09-300000890447vtnr:IndustrialPipeInc.Member2022-01-012022-09-300000890447vtnr:UMOBusinessMemberus-gaap:DiscontinuedOperationsHeldforsaleMember2023-06-092023-06-090000890447vtnr:UMOBusinessMemberus-gaap:DiscontinuedOperationsHeldforsaleMember2023-07-012023-09-300000890447vtnr:UMOBusinessMemberus-gaap:DiscontinuedOperationsHeldforsaleMember2022-07-012022-09-300000890447vtnr:UMOBusinessMemberus-gaap:DiscontinuedOperationsHeldforsaleMember2023-01-012023-09-300000890447vtnr:UMOBusinessMemberus-gaap:DiscontinuedOperationsHeldforsaleMember2022-01-012022-09-300000890447vtnr:UMOBusinessMemberus-gaap:DiscontinuedOperationsHeldforsaleMember2022-12-310000890447us-gaap:RelatedPartyMember2023-07-012023-09-300000890447us-gaap:RelatedPartyMember2022-07-012022-09-300000890447us-gaap:RelatedPartyMember2023-01-012023-09-300000890447us-gaap:RelatedPartyMember2022-01-012022-09-30
UNITED STATES
SECURITIES AND EXCHANGE COMMISSION
Washington, D.C. 20549
FORM 10-Q
(Mark One)
☑ QUARTERLY REPORT PURSUANT TO SECTION 13 OR 15(d) OF THE SECURITIES EXCHANGE ACT OF 1934
For the quarterly period ended September 30, 2023
☐ TRANSITION REPORT PURSUANT TO SECTION 13 OR 15(d) OF THE SECURITIES EXCHANGE ACT OF 1934
FOR THE TRANSITION PERIOD FROM _____________ TO _____________
Commission File Number 001-11476
———————
VERTEX ENERGY, INC.
(Exact name of registrant as specified in its charter)
———————
| | | | | |
| Nevada | 94-3439569 |
| (State or other jurisdiction of incorporation or organization) | (I.R.S. Employer Identification No.) |
1331 Gemini Street, Suite 250, Houston, Texas 77058
(Address of principal executive offices) (Zip Code)
Registrant's telephone number, including area code: 866-660-8156
Securities registered pursuant to Section 12(b) of the Act:
| | | | | | | | |
| Title of each class | Trading Symbol(s) | Name of each exchange on which registered |
Common Stock, $0.001 Par Value Per Share | VTNR | The NASDAQ Stock Market LLC |
| (Nasdaq Capital Market) |
Indicate by check mark whether the registrant (1) has filed all reports required to be filed by Section 13 or 15(d) of the Securities Exchange Act of 1934 during the preceding 12 months (or for such shorter period that the registrant was required to file such reports), and (2) has been subject to such filing requirements for the past 90 days. ☑ Yes ¨ No
Indicate by check mark whether the registrant has submitted electronically every Interactive Data File required to be submitted pursuant to Rule 405 of Regulation S-T (§232.405 of this chapter) during the preceding 12 months (or for such shorter period that the registrant was required to submit such files). ☑ Yes ¨ No
Indicate by check mark whether the registrant is a large accelerated filer, an accelerated filer, a non-accelerated filer, a smaller reporting company, or an emerging growth company. See the definitions of “large accelerated filer,” “accelerated filer” and “smaller reporting company” and "emerging growth company" in Rule 12b-2 of the Exchange Act.
| | | | | | | | | | | |
| Large accelerated filer | ☑ | Accelerated filer | ☐ |
| Non-accelerated filer | ☐ | Smaller reporting company | ☐ |
| | Emerging growth company | ☐ |
If an emerging growth company, indicate by check mark if the registrant has elected not to use the extended transition period for complying with any new or revised financial accounting standards provided pursuant to Section 13(a) of the Exchange Act. ¨
Indicate by check mark whether the registrant is a shell company (as defined in Rule 12b-2 of the Exchange Act.
¨ Yes ☑ No
As of November 6, 2023, there were 93,514,346 shares of common stock issued and outstanding.
TABLE OF CONTENTS
| | | | | | | | | | | |
| | | | Page |
| |
| | | PART I | |
| Item 1. | | | |
| | | | |
| | | | |
| | | | |
| | | | |
| | | | |
| | | |
| | | |
| | | | |
| | | | |
| | | | |
| | | | |
| Item 2 | | | |
| | | | |
| Item 3. | | | |
| | | | |
| Item 4. | | | |
| | | | |
| | | |
| | | PART II | |
| Item 1. | | | |
| | | | |
| Item 1A. | | | |
| | | | |
| Item 2. | | | |
| | | | |
| Item 3. | | | |
| | | | |
| Item 4. | | | |
| | | | |
| Item 5. | | | |
| | | | |
| Item 6. | | | |
GLOSSARY OF TERMS
Please see the “Glossary” beginning on page 6 of our Annual Report on Form 10-K for the year ended December 31, 2022, filed with the Securities and Exchange Commission on March 1, 2023 (the "Annual Report"), for a list of abbreviations and definitions used throughout this Report. In addition, unless the context otherwise requires and for the purposes of this report only:
•“No. 2 Oil” is a high sulfur diesel oil, which is used in off-road equipment and in the marine industry such as tug boats and ships. It is also used to blend fuel oil and has multiple applications to fuel furnaces (“boilers”). It is a low viscosity, flammable liquid petroleum product.
•“No. 6 Oil” is a lesser grade of oil than No. 2 oil, it is used only in certain applications.
•“Adjusted gross margin” is gross profit (loss) plus unrealized gain or losses on hedging activities and inventory adjustments.
•“Adjusted gross margin per barrel of throughput” is calculated as adjusted gross margin divided by total throughput barrels for the period presented.
•“Base oil” is a lubricant grade oil initially produced from refining crude oil or through chemical synthesis used in manufacturing lubricant products such as lubricating greases, motor oil, and metal processing fluids.
•“BBL” (also “bbl” or “Bbl”) is the abbreviated form for one barrel, 42 U.S. gallons of liquid volume.
•“BCD” (also “bcd”, “b/cd”) is the abbreviated form of barrels per calendar day; meaning the total number of barrels of actual throughput processed within 24 hours under typical operating conditions.
•“Black Oil” is a term used to describe used lubricating oils, which may be visually characterized as dark in color due to carbon and other residual elements and compounds which accumulate through use. This term can also refer to the business segment within the Company, which manages used motor oil related operations and processes such as purchase, sales, aggregation, processing, and re-refining.
•“Blendstock” is a bulk liquid component combined with other materials to produce a finished petroleum product.
•“BPD” (also “bpd”) is the abbreviated form for barrels per day. This can refer to designed or actual capacity/throughput.
•“Collectors” are typically local businesses that purchase used oil from generators and provide on-site collection services.
•“Crack” means breaking apart crude oil into its component products, including gases like propane, heating fuel, gasoline, light distillates like jet fuel, intermediate distillates like diesel fuel and heavy distillates like grease.
•“Cracking” refers to the process of breaking down larger, heavier, and more complex hydrocarbon molecules into simpler and lighter molecules through the use of heat, pressure, and sometimes a catalyst.
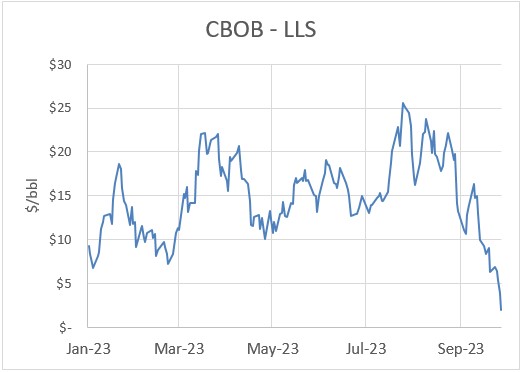
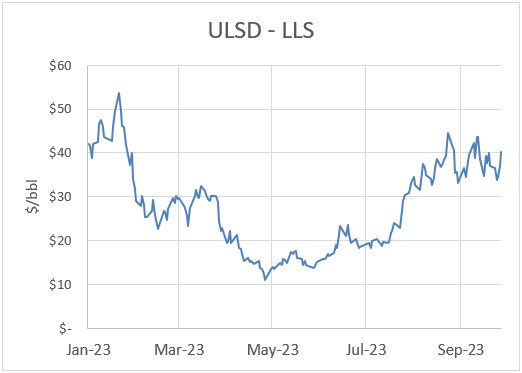
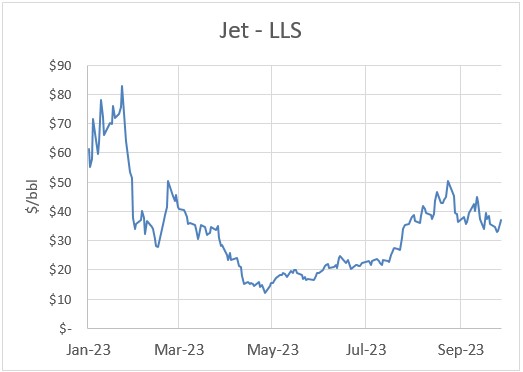
•“Crack spread” is a measure of the difference between market prices for refined products and crude oil, commonly used by the refining industry. We use crack spreads as a performance benchmark for our fuel gross margin and as a comparison with other industry participants. Crack spreads can fluctuate significantly, particularly when prices of refined products do not move in the same direction as the cost of crude oil.
•“Crack Spread USGC 2-1-1” represents the calculation of the crack spread that we believe most closely relates to the crude intakes and products at the Mobile Refinery. We use two barrels of Louisiana Light Sweet crude oil, producing one barrel of USGC CBOB gasoline and one barrel of USGC ULSD.
•“Cutterstock” also known as “cutter stock”, refers to any stream that is blended to adjust various properties of the resulting blend.
•“Distillates” are finished fuel products such as diesel fuels, jet fuel and kerosene.
•“Feedstock” is a product or a combination of products derived from crude oil and destined for further processing in the refining or re-refining industries. It is transformed into one or more components and/or finished products.
•“Fuel Gross Margin” is defined as gross profit (loss) plus operating expenses and depreciation attributable to cost of revenues and other non-fuel items included in cost of revenues including realized and unrealized gain or losses on hedging activities, Renewable Fuel Standard (RFS) costs (mainly related to Renewable Identification Numbers (RINs)), inventory adjustments, fuel financing costs and other revenues and cost of sales items.
•“Fuel Gross Margin Per Barrel of Throughput” is calculated as fuel gross margin divided by total throughput barrels for the period presented.
•“Gasoline Blendstock” is naphthas and various distillate products used for blending or compounding into finished motor gasoline. These components can include reformulated gasoline blendstock for oxygenate blending (RBOB) but exclude oxygenates (alcohols and ethers), butane, and pentanes (an organic compound with properties similar to a butane).
•“Generator” means any person, by site, whose act or process produces used oil or whose act first causes used oil to become subject to regulation. Generators can be service stations, governments or other businesses that produce or receive used oil.
•“Group III base oils” are greater than 90 percent saturates, with less than 0.03 percent sulfur and with a viscosity index above 120. Although made from crude oil, Group III base oils are sometimes described as synthesized hydrocarbons.
•“Hydrocarbons” are an organic compound consisting entirely of hydrogen and carbon. When used in the Company’s filings, the term generally refers to crude oil and its derivatives.
•“Hydrotreating” means processing feedstock with hydrogen to remove impurities such as sulfur, chlorine, and oxygen and to stabilize the end product.
•“Industrial fuel” is a distillate fuel oil, typically a blend of lower-quality fuel oils. It can include diesel fuels and fuel oils such as No. 1, No. 2, and No. 4 diesel fuels that are historically used for space heating and power generation. Industrial fuel is typically a fuel with low viscosity, as well as low sulfur, ash, and heavy metal content, making it an ideal blending agent.
•“LLS” means Louisiana Light Sweet Crude and is a grade of crude oil classified by its low sulfur content.
•“LPG” means liquefied petroleum gases.
•“Lubricant” or “lube” means a solvent-neutral paraffinic product used in commercial heavy-duty engine oils, passenger car oils, and specialty products for industrial applications such as heat transfer, metalworking, rubber, and other general process oil.
•“Lubricating Base Oil” is a crude oil derivative used for lubrication.
•“Marine Diesel Oil” is a blend of petroleum products that is used as a fuel in the marine industry.
•“MBL” means one thousand barrels.
•“Metals” consist of recoverable ferrous and non-ferrous recyclable metals from manufacturing and consumption. Scrap metal can be recovered from pipes, barges, boats, building supplies, surplus equipment, tanks, and other items consisting of metal composition. These materials are segregated, processed, cut up, and sent back to a steel mill for re-purposing.
•“Naphthas” refers to any of various volatile, highly flammable liquid hydrocarbon mixtures used chiefly as solvents and diluents and as raw materials for conversion to gasoline.
•“Oil collection services” include the collection, handling, treatment, and transacting of used motor oil and related products which contain used motor oil (such as oil filters and absorbents) acquired from customers.
•“Olefins” are hydrotreated VGO.
•“Other refinery products” include the sales of asphalt, condensate, recovered products, and other petroleum products.
•“Processors” are entities (usually re-refineries) which utilize a processing technology to convert used oil or petroleum by-products into a higher-value feedstock or end-product.
•“Pygas” or pyrolysis gasoline, is a product that can be blended with gasoline as an octane booster or distilled and separated into its components, including benzene and other hydrocarbons.
•“Re-Refined Base Oil” is the end product of used oil that is first cleansed of its contaminants, such as dirt, water, fuel, and used additives through vacuum distillation. The oil is also generally hydrotreated to remove any remaining chemicals. This process is very similar to what traditional oil refineries do to remove base oil from crude oil. Finally, the re-refined oil is combined with a fresh additive package by blenders to bring it up to industry performance levels.
•“Re-Refining” refers to the process or industry which uses refining processes and technology with used oil as a feedstock to produce high-quality base stocks and intermediate feedstocks for lubricants, fuels, and other petroleum products.
•“Refining” is the process of purification of a substance. The refining of liquids is often accomplished by distillation or fractionation. Gases can be refined in this way as well, by being cooled and/or compressed until they liquefy. Gases and liquids can also be refined by extraction with a selective solvent that dissolves away either the substance of interest, or the unwanted impurities.
•“Refining Adjusted EBITDA” represents net income (loss) from operations plus or minus unrealized gain or losses on hedging activities, RFS costs (mainly RINs), and inventory adjustments, depreciation and amortization, interest expense, acquisition costs, environmental reserves and certain other unusual or non-recurring charges included in selling, general, and administrative expenses.
•“Reformate” is a gasoline blending stock produced by catalytic reforming.
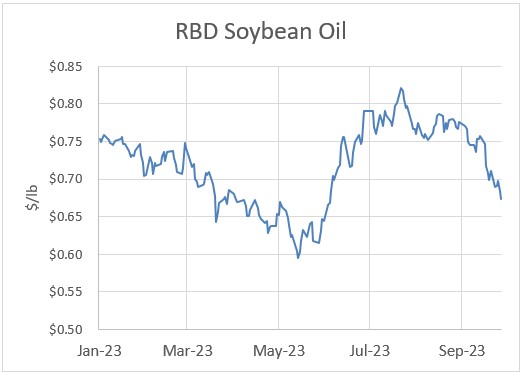
•“Renewable Diesel” or “RD” means a diesel fuel derived from vegetable oils or animal fats that is produced through various processes, most commonly through hydrotreating, reacting the feedstock with hydrogen under temperatures and pressure in the presence of a catalyst.
•“RINs” means renewable identification numbers and refers to serial numbers assigned to credits generated from renewable fuel production under the Environmental Protection Agency’s Renewable Fuel Standard (“RFS”) regulations, which require blending renewable fuels into the nation’s fuel supply. In lieu of blending, refiners may purchase these transferable credits to comply with the regulations.
•“Sour Crude Oil” refers to crude oil containing quantities of sulfur greater than 0.4 percent by weight.
•“Sweet Crude Oil” refers to crude oil containing quantities of sulfur equal to or less than 0.4 percent by weight.
•“Toll Processing/Third Party Processing” is refining or petrochemicals production done on a fee basis. A plant owner puts another party’s feedstock through his equipment and charges for this service. A portion of the product retained by the processor may constitute payment. This form of compensation occurs frequently in refining because the feedstock supplier often is interested in retaining only one part of the output slate.
•“Transmix” is a mix of transportation fuels, usually gasoline and diesel, created by mixing different specification products during pipeline transportation, stripping fuels from barges and bulk fuel terminals. Transmix processing plants distill the transmix back into specification products, such as unleaded gasoline and diesel fuel.
•“UMO” is the abbreviation for used motor oil.
•“USGC CBOB” is the abbreviation for U.S. Gulf Coast Conventional Blendstock for Oxygenate Blending, which means conventional gasoline blendstock intended for blending with oxygenates downstream of the refinery where it was produced.
•“USGC ULSD” is the abbreviation for U.S. Gulf Coast Ultra-low sulfur diesel (ULSD), which is diesel fuel containing a maximum of 15 parts per million (ppm) of sulfur.
•“Used Oil” is any oil that has been refined from crude oil, or any synthetic oil that has been used, and as a result of use or as a consequence of extended storage or spillage has been contaminated with physical or chemical impurities. Examples of used oil include used motor oil, hydraulic oil, transmission fluid, and diesel and transformer oil.
•“Vacuum Distillation” is the process of distilling vapor from liquid crudes, usually by heating and condensing the vapor below atmospheric pressure turning it back to a liquid in order to purify, fractionate or form the desired products.
•“Vacuum Gas Oil” or “VGO” is a product produced from a vacuum distillation column which is predominately used as an intermediate feedstock to produce transportation fuels and other by-products such as gasoline, diesel and marine fuels.
•“VTB” refers to vacuum tower bottoms, the leftover bottom product of distillation, which can be processed in cokers and used for upgrading into gasoline, diesel, and gas oil.
PART I – FINANCIAL INFORMATION
Item 1. Financial Statements
VERTEX ENERGY, INC.
CONSOLIDATED BALANCE SHEETS
(in thousands, except number of shares and par value)
(UNAUDITED)
| | | | | | | | | | | |
| | September 30,
2023 | | December 31,
2022 |
| ASSETS | | | |
| Current assets | | | |
| Cash and cash equivalents | $ | 75,705 | | | $ | 141,258 | |
| Restricted cash | 3,605 | | | 4,929 | |
| Accounts receivable, net | 36,816 | | | 34,548 | |
| | | |
| Inventory | 222,685 | | | 135,473 | |
| Derivative commodity asset | 4,991 | | | — | |
| Prepaid expenses and other current assets | 57,315 | | | 36,660 | |
| Assets held for sale, current | — | | | 20,560 | |
| Total current assets | 401,117 | | | 373,428 | |
| | | |
| Fixed assets, net | 321,314 | | | 201,749 | |
| Finance lease right-of-use assets | 65,317 | | | 44,081 | |
| Operating lease right-of use assets | 90,413 | | | 53,557 | |
| Intangible assets, net | 11,207 | | | 11,827 | |
| Deferred taxes assets | — | | | 2,498 | |
| Other assets | 3,310 | | | 2,245 | |
| | | |
| | | |
| TOTAL ASSETS | $ | 892,678 | | | $ | 689,385 | |
| | | |
| LIABILITIES AND STOCKHOLDERS' EQUITY | | | |
| Current liabilities | | | |
| Accounts payable | $ | 63,628 | | | $ | 20,997 | |
| Accrued expenses | 69,315 | | | 81,711 | |
| | | |
| Finance lease liability-current | 2,297 | | | 1,363 | |
| Operating lease liability-current | 26,047 | | | 9,012 | |
| Current portion of long-term debt, net | 18,321 | | | 13,911 | |
| Obligations under inventory financing agreements, net | 182,487 | | | 117,939 | |
| Derivative commodity liability | — | | | 242 | |
| Liabilities held for sale, current | — | | | 3,424 | |
Total current liabilities | 362,095 | | | 248,599 | |
| | | |
| Long-term debt, net | 125,010 | | | 170,010 | |
| Finance lease liability-long-term | 66,751 | | | 45,164 | |
| | | |
| Operating lease liability-long-term | 64,367 | | | 44,545 | |
| | | |
| Deferred tax liabilities | 1,257 | | | — | |
| Derivative warrant liability | 9,234 | | | 14,270 | |
| Other liabilities | 1,377 | | | 1,377 | |
| Total liabilities | 630,091 | | | 523,965 | |
| | | |
| COMMITMENTS AND CONTINGENCIES (Note 4) | — | | | — | |
| | | |
| | | |
| | | |
| | | | | | | | | | | |
| | September 30,
2023 | | December 31,
2022 |
| STOCKHOLDERS' EQUITY | | | |
| | | |
| | | |
| | | |
| | | |
| | | |
Common stock, $0.001 par value per share; 750,000,000 shares authorized; 93,514,346 and 75,668,826 shares issued and outstanding at September 30, 2023 and December 31, 2022, respectively. | 94 | | | 76 | |
| Additional paid-in capital | 382,849 | | | 279,552 | |
| Accumulated deficit | (123,588) | | | (115,893) | |
| Total Vertex Energy, Inc. stockholders' equity | 259,355 | | | 163,735 | |
| Non-controlling interest | 3,232 | | | 1,685 | |
| Total equity | 262,587 | | | 165,420 | |
| TOTAL LIABILITIES AND STOCKHOLDERS' EQUITY | $ | 892,678 | | | $ | 689,385 | |
See accompanying notes to the consolidated financial statements.
VERTEX ENERGY, INC.
CONSOLIDATED STATEMENTS OF OPERATIONS
(in thousands, except per share amounts)
(UNAUDITED)
| | | | | | | | | | | | | | | | | | | | | | | | | | |
| | | Three Months Ended September 30, | | Nine Months Ended September 30, |
| | | 2023 | | 2022 | | 2023 | | 2022 |
| Revenues | | $ | 1,018,407 | | | $ | 809,529 | | | $ | 2,444,442 | | | $ | 1,913,435 | |
| Cost of revenues (exclusive of depreciation and amortization shown separately below) | | 925,542 | | | 749,654 | | | 2,274,543 | | | 1,817,787 | |
| Depreciation and amortization attributable to costs of revenues | | 7,896 | | | 4,049 | | | 18,863 | | | 9,139 | |
| Gross profit | | 84,969 | | | 55,826 | | | 151,036 | | | 86,509 | |
| | | | | | | | |
| Operating expenses: | | | | | | | | |
| Selling, general and administrative expenses (exclusive of depreciation and amortization shown separately below) | | 43,137 | | | 37,142 | | | 127,715 | | | 90,039 | |
| Depreciation and amortization attributable to operating expenses | | 1,033 | | | 1,119 | | | 3,077 | | | 2,655 | |
| | | | | | | | |
| Total operating expenses | | 44,170 | | | 38,261 | | | 130,792 | | | 92,694 | |
| Income (loss) from operations | | 40,799 | | | 17,565 | | | 20,244 | | | (6,185) | |
| Other income (expense): | | | | | | | | |
| | | | | | | | |
| | | | | | | | |
| Other income (loss) | | (133) | | | 416 | | | 1,023 | | | 1,059 | |
| | | | | | | | |
| Gain on change in value of derivative warrant liability | | 4,621 | | | 12,312 | | | 5,036 | | | 7,788 | |
| | | | | | | | |
| Interest expense | | (13,523) | | | (13,028) | | | (103,536) | | | (64,961) | |
| Total other expense | | (9,035) | | | (300) | | | (97,477) | | | (56,114) | |
| Income (loss) from continuing operations before income tax | | 31,764 | | | 17,265 | | | (77,233) | | | (62,299) | |
| Income tax benefit (expense) | | (12,231) | | | — | | | 15,445 | | | — | |
| Income (loss) from continuing operations | | 19,533 | | | 17,265 | | | (61,788) | | | (62,299) | |
| Income from discontinued operations, net of tax (see note 23) | | — | | | 4,905 | | | 53,680 | | | 19,878 | |
| Net income (loss) | | 19,533 | | | 22,170 | | | (8,108) | | | (42,421) | |
| Net income (loss) attributable to non-controlling interest and redeemable non-controlling interest from continuing operations | | (310) | | | (49) | | | (413) | | | 15 | |
| Net income (loss) attributable to non-controlling interest and redeemable non-controlling interest from discontinued operations | | — | | | (15) | | | — | | | 6,847 | |
| Net income (loss) attributable to Vertex Energy, Inc. | | 19,843 | | | 22,234 | | | (7,695) | | | (49,283) | |
| | | | | | | | |
| Accretion of redeemable noncontrolling interest to redemption value from continued operations | | — | | | — | | | — | | | (428) | |
| | | | | | | | |
| Net income (loss) attributable to common stockholders from continuing operations | | 19,843 | | | 17,314 | | | (61,375) | | | (62,742) | |
| Net income attributable to common stockholders from discontinued operations, net of tax | | — | | | 4,920 | | | 53,680 | | | 13,031 | |
| Net income (loss) attributable to common shareholders | | $ | 19,843 | | | $ | 22,234 | | | $ | (7,695) | | | $ | (49,711) | |
| | | | | | | | |
| Basic loss per common share | | | | | | | | |
| Continuing operations | | $ | 0.21 | | | $ | 0.23 | | | $ | (0.74) | | | $ | (0.91) | |
| Discontinued operations, net of tax | | — | | | 0.07 | | | 0.65 | | | 0.19 | |
| Basic loss per common share | | $ | 0.21 | | | $ | 0.30 | | | $ | (0.09) | | | $ | (0.72) | |
| | | | | | | | |
| Diluted income (loss) per common share | | | | | | | | |
| Continuing operations | | $ | 0.17 | | | $ | 0.10 | | | $ | (0.74) | | | $ | (0.91) | |
| Discontinued operations, net of tax | | — | | | 0.05 | | | 0.65 | | | 0.19 | |
| Diluted income (loss) per common share | | $ | 0.17 | | | $ | 0.15 | | | $ | (0.09) | | | $ | (0.72) | |
| | | | | | | | |
| Shares used in computing earnings per share | | | | | | | | |
| Basic | | 93,381 | | | 75,591 | | | 82,928 | | | 69,007 | |
| Diluted | | 100,427 | | | 97,126 | | | 82,928 | | | 69,007 | |
See accompanying notes to the consolidated financial statements.
VERTEX ENERGY, INC.
CONSOLIDATED STATEMENTS OF STOCKHOLDERS' EQUITY
(in thousands, except par value)
(UNAUDITED)
| | | | | | | | | | | | | | | | | | | | | | | | | | | | | | | | | | | | | | | | | | | | | | | | | | | |
| Nine Months Ended September 30, 2023 |
| Common Stock | | Series A Preferred | | | | | | | | | | |
| | Shares | | $0.001 Par | | Shares | | $0.001 Par | | | | | | Additional Paid-In Capital | | Accumulated Deficit | | Non-controlling Interest | | Total Equity |
| Balance on January 1, 2023 | 75,669 | | | $ | 76 | | | — | | | $ | — | | | | | | | $ | 279,552 | | | $ | (115,893) | | | $ | 1,685 | | | $ | 165,420 | |
| Exercise of options | 166 | | | — | | | — | | | — | | | | | | | 209 | | | — | | | — | | | 209 | |
| | | | | | | | | | | | | | | | | | | |
| Stock based compensation expense | — | | | — | | | — | | | — | | | | | | | 365 | | | — | | | — | | | 365 | |
| Non controlling shareholder contribution | — | | | — | | | — | | | — | | | | | | | — | | | — | | | 980 | | | 980 | |
| Net income (loss) | — | | | — | | | — | | | — | | | | | | | — | | | 53,863 | | | (50) | | | 53,813 | |
| | | | | | | | | | | | | | | | | | | |
| Balance on March 31, 2023 | 75,835 | | | 76 | | | — | | | — | | | | | | | 280,126 | | | (62,030) | | | 2,615 | | | 220,787 | |
| Exercise of options | 195 | | | — | | | — | | | — | | | | | | | 169 | | | — | | | — | | | 169 | |
| | | | | | | | | | | | | | | | | | | |
| Stock based compensation expense | — | | | — | | | — | | | — | | | | | | | 368 | | | — | | | — | | | 368 | |
| Senior Note Converted | 17,207 | | | 17 | | | — | | | — | | | | | | | 101,113 | | | — | | | — | | | 101,130 | |
| Non-controlling shareholder contribution | — | | | — | | | — | | | — | | | | | | | — | | | — | | | 490 | | | 490 | |
| Net loss | — | | | — | | | — | | | — | | | | | | | — | | | (81,401) | | | (53) | | | (81,454) | |
| | | | | | | | | | | | | | | | | | | |
| Balance on June 30, 2023 | 93,237 | | | 93 | | | — | | | — | | | | | | | 381,776 | | | (143,431) | | | 3,052 | | | 241,490 | |
| Exercise of options | 165 | | | 1 | | | — | | | — | | | | | | | 304 | | | — | | | — | | | 305 | |
| | | | | | | | | | | | | | | | | | | |
| Stock based compensation expense | — | | | — | | | — | | | — | | | | | | | 769 | | | — | | | — | | | 769 | |
| Issue of restricted common stock | 113 | | | — | | | — | | | — | | | | | | | — | | | — | | | — | | | — | |
| Non-controlling shareholder contribution | — | | | — | | | — | | | — | | | | | | | — | | | — | | | 490 | | | 490 | |
| Net income (loss) | — | | | — | | | — | | | — | | | | | | | — | | | 19,843 | | | (310) | | | 19,533 | |
| | | | | | | | | | | | | | | | | | | |
| Balance on September 30, 2023 | 93,515 | | | $ | 94 | | | — | | | $ | — | | | | | | | $ | 382,849 | | | $ | (123,588) | | | $ | 3,232 | | | $ | 262,587 | |
See accompanying notes to the consolidated financial statements.
VERTEX ENERGY, INC.
CONSOLIDATED STATEMENTS OF STOCKHOLDERS' EQUITY
(in thousands, except par value)
(UNAUDITED)
| | | | | | | | | | | | | | | | | | | | | | | | | | | | | | | | | | | | | | | | | | | | | | | | | | | |
| Nine Months Ended September 30, 2022 |
| Common Stock | | Series A Preferred | | | | | | | | | | |
| | Shares | | $0.001 Par | | Shares | | $0.001 Par | | | | | | Additional Paid-In Capital | | Accumulated Deficit | | Non-controlling Interest | | Total Equity |
| Balance on January 1, 2022 | 63,288 | | | $ | 63 | | | 386 | | | $ | — | | | | | | | $ | 138,620 | | | $ | (110,614) | | | $ | 1,997 | | | $ | 30,066 | |
| Exercise of options | 60 | | | — | | | — | | | — | | | | | | | 76 | | | — | | | — | | | 76 | |
| Exercise of warrants | 1,113 | | | 1 | | | — | | | — | | | | | | | (1) | | | — | | | — | | | — | |
| Stock based compensation expense | — | | | — | | | — | | | — | | | | | | | 250 | | | — | | | — | | | 250 | |
| Conversion of Series A Preferred stock to common | 5 | | | — | | | (5) | | | — | | | | | | | — | | | — | | | — | | | — | |
| Reclassification of derivative liabilities | — | | | — | | | — | | | — | | | | | | | 78,789 | | | — | | | — | | | 78,789 | |
| Accretion of redeemable non-controlling interest to redemption value | — | | | — | | | — | | | — | | | | | | | — | | | (422) | | | — | | | (422) | |
| Net income (loss) | — | | | — | | | — | | | — | | | | | | | — | | | (4,547) | | | 3,739 | | | (808) | |
| Less: amount attributable to redeemable non-controlling interest | — | | | — | | | — | | | — | | | | | | | — | | | — | | | (3,769) | | | (3,769) | |
| Balance on March 31, 2022 | 64,466 | | | 64 | | | 381 | | | — | | | | | | | 217,734 | | | (115,583) | | | 1,967 | | | 104,182 | |
| Exercise of options to common | 498 | | | 1 | | | — | | | — | | | | | | | 553 | | | — | | | — | | | 554 | |
| Exercise of options to common- unissued | — | | | — | | | — | | | — | | | | | | | 3 | | | — | | | — | | | 3 | |
| Distribution to non-controlling shareholder | — | | | — | | | — | | | — | | | | | | | — | | | — | | | (380) | | | (380) | |
| Adjustment of redeemable non controlling interest | — | | | — | | | — | | | — | | | | | | | 29 | | | (29) | | | — | | | — | |
| Conversion of Convertible Senior Notes to common | 10,165 | | | 10 | | | — | | | — | | | | | | | 59,812 | | | — | | | — | | | 59,822 | |
| Share based compensation expense | — | | | — | | | — | | | — | | | | | | | 324 | | | — | | | — | | | 324 | |
| Conversion of Series A Preferred stock to common | 381 | | | 1 | | | (381) | | | — | | | | | | | — | | | — | | | — | | | 1 | |
| Accretion of redeemable non-controlling interest to redemption value | — | | | — | | | — | | | — | | | | | | | — | | | (6) | | | — | | | (6) | |
| Net income (loss) | — | | | — | | | — | | | — | | | | | | | — | | | (66,970) | | | 3,188 | | | (63,782) | |
| Less: amount attributable to redeemable non-controlling interest | — | | | — | | | — | | | — | | | | | | | — | | | — | | | (3,023) | | | (3,023) | |
| Balance on June 30, 2022 | 75,510 | | | 76 | | | — | | | — | | | | | | | 278,455 | | | (182,588) | | | 1,752 | | | 97,695 | |
| Exercise of options to common | 4 | | | — | | | — | | | — | | | | | | | — | | | — | | | — | | | — | |
| Exercise of options to common- unissued | — | | | — | | | — | | | — | | | | | | | 97 | | | — | | | — | | | 97 | |
| Exercise of warrants | 96 | | | — | | | — | | | — | | | | | | | — | | | — | | | — | | | — | |
| | | | | | | | | | | | | | | | | | | |
| | | | | | | | | | | | | | | | | | | |
| Share based compensation expense | — | | | — | | | — | | | — | | | | | | | 378 | | | — | | | — | | | 378 | |
| | | | | | | | | | | | | | | | | | | |
| | | | | | | | | | | | | | | | | | | |
| Net income (loss) | — | | | — | | | — | | | — | | | | | | | — | | | 22,234 | | | (64) | | | 22,170 | |
| | | | | | | | | | | | | | | | | | | |
| Balance on September 30, 2022 | 75,610 | | | $ | 76 | | | — | | | $ | — | | | | | | | $ | 278,930 | | | $ | (160,354) | | | $ | 1,688 | | | $ | 120,340 | |
See accompanying notes to the consolidated financial statements.
VERTEX ENERGY, INC.
CONSOLIDATED STATEMENTS OF CASH FLOWS
(in thousands)
(UNAUDITED)
| | | | | | | | | | | | |
| | Nine Months Ended September 30, |
| | 2023 | | 2022 | |
| Cash flows from operating activities | | | | |
| Net income (loss) | $ | (8,108) | | | $ | (42,421) | | |
| Income from discontinued operations, net of tax | 53,680 | | | 19,878 | | |
| Loss from continuing operations | (61,788) | | | (62,299) | | |
| Adjustments to reconcile net loss from continuing operations to cash used in operating activities | | | | |
| Stock based compensation expense | 1,502 | | | 952 | | |
| Depreciation and amortization | 21,940 | | | 11,794 | | |
| Deferred income tax benefit | (15,445) | | | — | | |
| | | | |
| Gain on sale of assets | (2) | | | (112) | | |
| Provision for environment clean up | — | | | 1,428 | | |
| | | | |
| (Decrease) increase in allowance for bad debt | (132) | | | 157 | | |
| (Decrease) increase in fair value of derivative warrant liability | (5,036) | | | (7,788) | | |
| Loss on commodity derivative contracts | 219 | | | 87,217 | | |
| Net cash settlements on commodity derivatives | (2,061) | | | (100,253) | | |
| Amortization of debt discount and deferred costs | 74,618 | | | 44,537 | | |
| Changes in operating assets and liabilities | | | | |
| Accounts receivable and other receivables | (3,819) | | | (39,202) | | |
| | | | |
| Inventory | (85,796) | | | (31,387) | | |
| Prepaid expenses and other current assets | (24,601) | | | (16,437) | | |
| Accounts payable | 42,219 | | | 58,275 | | |
| Accrued expenses | (12,500) | | | 37,404 | | |
| Other assets | (987) | | | 82 | | |
| Net cash used in operating activities from continuing operations | (71,669) | | | (15,632) | | |
| Cash flows from investing activities | | | | |
| Acquisition of business, net of cash | (7,642) | | | — | | |
| | | | |
| Purchase of intangible assets | (2,500) | | | (106) | | |
| Investment in Mobile Refinery assets | — | | | (227,525) | | |
| | | | |
| Purchase of fixed assets | (128,599) | | | (34,743) | | |
| Proceeds from sale of discontinued operation | 92,034 | | | — | | |
| | | | |
| | | | |
| Proceeds from sale of fixed assets | 5 | | | 188 | | |
| Net cash used in investing activities from continuing operations | (46,702) | | | (262,186) | | |
| Cash flows from financing activities | | | | |
| Payments on finance leases | (1,469) | | | (201) | | |
| Proceeds from exercise of options and warrants to common stock | 683 | | | 729 | | |
| Distributions to noncontrolling interest | — | | | (380) | | |
| Contributions received from noncontrolling interest | 1,960 | | | — | | |
| | | | |
| Net change on inventory financing agreements | 63,798 | | | 133,744 | | |
| | | | |
| Redemption of noncontrolling interest | — | | | (50,666) | | |
| Proceeds from note payable | 19,641 | | | 173,315 | | |
| Payments on note payable | (32,969) | | | (14,101) | | |
| Net cash provided by financing activities from continuing operations | 51,644 | | | 242,440 | | |
| | | | |
| | | | |
| Discontinued operations: | | | | |
| Net cash provided by (used in) operating activities | (150) | | | 23,021 | | |
| Net cash used in investing activities | — | | | (1,877) | | |
| | | | |
| Net cash provided by (used in) discontinued operations | (150) | | | 21,144 | | |
| | | | |
| Net decrease in cash, cash equivalents and restricted cash | (66,877) | | | (14,234) | | |
| Cash, cash equivalents, and restricted cash at beginning of the period | 146,187 | | | 136,627 | | |
| Cash, cash equivalents, and restricted cash at end of period | $ | 79,310 | | | $ | 122,393 | | |
See accompanying condensed notes to the consolidated financial statements.
VERTEX ENERGY, INC.
CONSOLIDATED STATEMENTS OF CASH FLOWS
(in thousands)
(UNAUDITED)
(Continued)
The following table provides a reconciliation of cash and cash equivalents and restricted cash reported within the consolidated balance sheets to the same amounts shown in the consolidated statements of cash flows (in thousands).
| | | | | | | | | | | | |
| Nine Months Ended | |
| September 30,
2023 | | September 30,
2022 | |
| | | | |
| Cash and cash equivalents | $ | 75,705 | | | $ | 117,464 | | |
| Restricted cash | 3,605 | | | 4,929 | | |
| Cash and cash equivalents and restricted cash as shown in the consolidated statements of cash flows | $ | 79,310 | | | $ | 122,393 | | |
| | | | |
| | |
| | | | |
| SUPPLEMENTAL INFORMATION | | | | |
| Cash paid for interest | $ | 35,553 | | | $ | 65,083 | | |
| Cash paid for taxes | $ | — | | | $ | — | | |
| | | | |
| NON-CASH INVESTING AND FINANCING TRANSACTIONS | | | | |
| Equity component of the convertible note issuance | $ | — | | | $ | 78,789 | | |
| | | | |
| | | | |
| | | | |
| | | | |
| | | | |
| | | | |
| ROU assets obtained from new finance lease obligation | $ | 23,990 | | | $ | 45,096 | | |
| Exchange of Convertible Senior Notes to common stock | $ | 79,948 | | | $ | 59,822 | | |
| ROU assets obtained from new operating lease obligation | $ | 36,856 | | | $ | 20,061 | | |
| Accretion of redeemable non-controlling interest to redemption value | $ | — | | | $ | 428 | | |
| | | | |
See accompanying notes to the consolidated financial statements.
VERTEX ENERGY, INC.
NOTES TO CONSOLIDATED FINANCIAL STATEMENTS
SEPTEMBER 30, 2023
(UNAUDITED)
NOTE 1. BASIS OF PRESENTATION AND NATURE OF OPERATIONS
Vertex Energy, Inc. (the "Company" or "Vertex Energy") is an energy transition company focused on the production and distribution of conventional and alternative fuels. We operate used motor oil processing plants in Houston, Texas, Port Arthur, Texas, and Marrero, Louisiana.
As of April 1, 2022, we own a refinery in Mobile, Alabama (the “Mobile Refinery”) with an operable refining capacity of 75,000 barrels per day (“bpd”) and more than 3.2 million barrels of storage capacity. The total purchase consideration was $75.0 million in cash plus $16.3 million in previously agreed upon capital expenditures and miscellaneous prepaid and reimbursable items. At the time of the acquisition, the Company also purchased $130.0 million in hydrocarbon inventories of which $124.0 million were financed under an inventory financing agreement. See Note 3 “Mobile Refinery Acquisition” and Note 10 “Inventory Financing Agreement” for additional information. The accompanying unaudited interim consolidated financial statements of the Company have been prepared in accordance with accounting principles generally accepted in the United States of America and the rules of the Securities and Exchange Commission ("SEC") and should be read in conjunction with the audited consolidated financial statements and notes thereto for the year ended December 31, 2022, contained in the Company's annual report, as filed with the SEC on Form 10-K on March 1, 2023 (the "Form 10-K").
The September 30, 2022 Consolidated Statement of Operations was retroactively restated from the unaudited financial statements of our Quarterly Report on Form 10-Q for the quarter ended September 30, 2022, to account for the change for our discontinued business, see Note 23 "Discontinued Operations". In the opinion of management all adjustments, consisting of normal recurring adjustments necessary for a fair presentation of financial position and the results of operations for the interim periods presented, have been reflected herein. All significant intercompany transactions have been eliminated in consolidation. The results of operations for interim periods are not necessarily indicative of the results to be expected for the full year. Notes to the consolidated financial statements which would substantially duplicate the disclosures contained in the audited consolidated financial statements for the most recent fiscal year 2022 as reported in Form 10-K have been omitted. Used Motor Oils Business ("UMO Business")
As of December 31, 2022, our UMO Business consisted of our used oil refinery in Marrero, Louisiana, our Heartland used oil refinery in Ohio, our H&H and Heartland used motor oil (UMO) collections business; our oil filters and absorbent materials recycling facility in East Texas; and the rights to a lease at the Cedar Marine terminal in Baytown, Texas. The UMO Business is presented as part of our Black Oil segment in our consolidated financial statements.
On February 1, 2023, HPRM LLC (“HPRM”), which is indirectly wholly-owned by the Company, entered into a Sale and Purchase Agreement (the “Sale Agreement”) with GFL Environmental Services USA, Inc. (“GFL”) whereby HPRM agreed to sell to GFL, and GFL agreed to purchase from HPRM, all of HPRM’s equity interest in Vertex Refining OH, LLC (“Vertex OH”), our wholly-owned subsidiary, which owns the Heartland refinery located in Columbus, Ohio (the “Heartland Refinery”). Vertex Operating, LLC, our wholly-owned subsidiary (“Vertex Operating”) and GFL Environmental Inc. (“GFL Environmental”), an affiliate of GFL, were also parties to the Sale Agreement, solely for the purpose of providing certain guarantees of the obligations of HPRM and GFL as discussed in greater detail below.
The sale also included all property and assets owned by Vertex OH, including inventory associated with the Heartland Refinery, and all real and leased property and permits owned by Vertex OH, and all used motor oil collection and recycling assets and operations owned by Vertex OH (collectively with the Heartland Refinery, the “Heartland Assets and Operations”).
The transactions contemplated by the Sale Agreement closed on February 1, 2023 with a net cash settlement of $92.0 million.
Vertex Operating guaranteed all of the obligations of HPRM pursuant to the terms of the Sale Agreement and GFL Environmental guaranteed all of the obligations of GFL pursuant to the terms of the Sale Agreement.
As a result of the above, the Company determined to present the Heartland Assets and Operations as discontinued operations as of December 31, 2022 and for the three and nine months ended September 30, 2023 and 2022.
Use of Estimates
The preparation of financial statements in conforming with generally accepted accounting principles in the United States (“GAAP”) requires management to make estimates and assumptions that affect reported amounts of assets and liabilities, disclosure of contingent assets and liabilities, and reported amounts of revenue and expenses. Actual results could differ from these estimates. Any effects on the business, financial position or results of operations from revisions to these estimates are recorded in the period in which the facts that give rise to the revision become known.
Reclassification of Prior Year Presentation
Certain prior period amounts have been reclassified to conform to current period presentation. These reclassifications had no effect on the reported results of operations as they were immaterial to the financial statements as a whole.
NOTE 2. SUMMARY OF CRITICAL ACCOUNTING POLICIES AND ESTIMATES
With the exception of the accounting policies below, there have been no new or material changes to the significant accounting policies discussed in the Company’s Annual Report on Form 10-K for the year ended December 31, 2022.
Cash, Cash Equivalents and Restricted Cash
The Company considers all highly liquid investments with an original maturity of three months or less to be cash equivalents.
Restricted cash as of September 30, 2023, consisted of a $2.0 million deposit in a bank for financing of a short-term equipment lease, a $1.5 million deposit in a bank for possible liabilities related to the Heartland Assets and Operations sale, and a $0.1 million deposit in a money market account to serve as collateral for payment of a credit card. Restricted cash as of December 31, 2022, consisted of a $4.8 million deposit in a bank for financing of a short-term equipment lease, and a $0.1 million deposit in a money market account to serve as collateral for payment of a credit card.
Convertible Instruments
In August 2020, the Financial Accounting Standards Board (FASB) issued Accounting Standards Update (ASU) 2020-06, Accounting for Convertible Instruments and Contracts in an Entity’s Own Equity to simplify the accounting for convertible debt and other equity-linked instruments. The new guidance simplifies the accounting for convertible instruments by eliminating the cash conversion and beneficial conversion feature models used to separately account for embedded conversion features as a component of equity. Instead, the entity will account for the convertible debt or convertible preferred stock securities as a single unit of account, unless the conversion feature requires bifurcation and recognition as derivatives. Additionally, the guidance requires entities to use the if-converted method for all convertible instruments in the diluted earnings per share calculation and include the effect of potential share settlement for instruments that may be settled in cash or shares.
New Accounting Pronouncements
The Company has not identified any recent accounting pronouncements that are expected to have a material impact on our financial condition, results of operations or cash flows upon adoption.
NOTE 3. MOBILE REFINERY ACQUISITION
On April 1, 2022, the Company completed the acquisition of a 75,000 bpd crude oil refinery located ten miles north of Mobile, in Saraland, Alabama (the “Mobile Refinery”) from Equilon Enterprises LLC d/b/a Shell Oil Products US, Shell Oil Company and Shell Chemical LP, subsidiaries of Shell plc (“Shell”)(the “Mobile Acquisition”), which provided the Company the opportunity to enter the crude oil refining industry. Total consideration for the acquisition was approximately $227.5 million, of which $124.3 million was paid by Macquarie Energy North America Trading, Inc (“Macquarie”) as a result of the simultaneous sale of such inventory to Macquarie pursuant to an Inventory Sales Agreement between our wholly-owned subsidiary, Vertex Refining, NV, LLC (“Vertex Refining”), and Macquarie. Refer to “Note 10. Inventory Financing Arrangement” for more detailed information. The following table summarizes the determination and recognition of assets acquired (in thousands):
| | | | | | | | | | | | | | | | | |
| Financing Agreement | | Vertex Acquisition | | Total |
| Inventory | $ | 124,311 | | | $ | 5,909 | | | $ | 130,220 | |
| Prepaid assets | — | | | 147 | | | 147 | |
| Fixed assets | — | | | 97,158 | | | 97,158 | |
| Total purchase price | $ | 124,311 | | | $ | 103,214 | | | $ | 227,525 | |
The following table presents summarized results of operations of the Mobile Refinery for the three and nine months ended September 30, 2022, which are included in the accompanying consolidated statements of operations for the periods ended September 30, 2022 (in thousands):
| | | | | | | | | | | | | | | | | | | |
| | For Three Months Ended September 30, | | | For Nine Months Ended September 30, |
| | | 2022 | | | | 2022 |
| Revenue | | | $ | 733,521 | | | | | $ | 1,655,717 | |
| Net income (loss) | | | $ | 18,370 | | | | | $ | (5,592) | |
The following table presents unaudited pro forma results of operations reflecting the acquisition of the Mobile Refinery as if the acquisition had occurred as of January 1, 2022. This information has been compiled from current and historical financial statements and is not necessarily indicative of the results that actually would have been achieved had the transaction occurred at the beginning of the periods presented or that may be achieved in the future (in thousands):
| | | | | | | | | |
| | For Nine Months Ended September 30, |
| | | 2022 |
| Revenue | | | $ | 2,406,617 | |
| Net income | | | $ | 49,509 | |
NOTE 4. COMMITMENTS AND CONTINGENCIES
Litigation
The Company, in its normal course of business, is involved in various other claims and legal action. In the opinion of management, the outcome of these claims and actions will not have a material adverse impact upon the financial position of the Company. We are currently party to the following material litigation proceedings:
Doucet litigation:
Vertex Refining LA, LLC (“Vertex Refining LA”), the wholly-owned subsidiary of Vertex Operating was named as a defendant, along with numerous other parties, in five lawsuits filed on or about February 12, 2016, in the Second Parish Court for the Parish of Jefferson, State of Louisiana, Case No. 121749, by Russell Doucet et. al., Case No. 121750, by Kendra Cannon et. al., Case No. 121751, by Lashawn Jones et. al., Case No. 121752, by Joan Strauss et. al. and Case No. 121753, by Donna Allen et. al. The suits relate to alleged noxious and harmful emissions from our facility located in Marrero, Louisiana. The suits seek damages for physical and emotional injuries, pain and suffering, medical expenses and deprivation of the use and enjoyment of plaintiffs’ homes. We intend to vigorously defend ourselves and oppose the relief sought in the complaints, provided that at this stage of the litigation, the Company has no basis for determining whether there is any likelihood of material loss associated with the claims and/or the potential and/or the outcome of the litigation.
Penthol litigation:
On November 17, 2020, Vertex Energy Operating, LLC (“Vertex”) filed a lawsuit against Penthol LLC (“Penthol”) in the 61st Judicial District Court of Harris County, Texas, Cause No. 2020-65269, for breach of contract and simultaneously sought a Temporary Restraining Order and Temporary Injunction enjoining Penthol from, among other things, circumventing Vertex in violation of the terms of that certain June 5, 2016 Sales Representative and Marketing Agreement entered into between Vertex
Operating and Penthol (the “Penthol Agreement”). Thereafter, Penthol terminated the Penthol Agreement more than a year prior to the contractual termination date. Vertex seeks damages, attorneys’ fees, costs of court, and all other relief to which it may be entitled.
On February 8, 2021, Penthol filed a complaint against Vertex in the United States District Court for the Southern District of Texas; Civil Action No. 4:21-CV-416 (the “Complaint”). Penthol sought damages from Vertex for alleged violations of the Sherman Act, breach of contract, business disparagement, fraud, and misappropriation of trade secrets under the Defend Trade Secrets Act and Texas Uniform Trade Secrets Act. On August 12, 2021, United States District Judge Andrew S. Hanen dismissed Penthol’s Sherman Act claim. Penthol is seeking a declaration that Vertex has materially breached the agreement; an injunction that prohibits Vertex from using Penthol’s alleged trade secrets and requires Vertex to return any of Penthol’s alleged trade secrets; awards of actual, consequential and exemplary damages, attorneys’ fees and costs of court; and other relief to which it may be entitled. Vertex denies Penthol’s allegations. Vertex contends Penthol’s claims are completely without merit, and that Penthol’s termination of the Penthol Agreement was wrongful and resulted in damages to Vertex. Further, Vertex contends that Penthol’s termination of the Penthol Agreement constitutes a breach by Penthol under the express terms of the Penthol Agreement, and that Vertex remains entitled to payment of the amounts due Vertex under the Penthol Agreement for unpaid commissions and unpaid performance incentives. Vertex disputes Penthol’s allegations of wrongdoing and intends to vigorously defend itself in this matter.
The parties agreed to move the pending claims and defenses in the Texas state court lawsuit into the federal court lawsuit. All pending claims between the parties are now in the federal court action.
The parties conducted numerous depositions and substantial document discovery. Vertex filed a motion for summary judgment, and Judge Hanen granted it in part, dismissing Penthol’s claims for business disparagement and fraud. Penthol’s remaining claims are pending. The case is currently on bench trial which started on October 30, 2023.
Putative Class Action Litigation:
On April 13, 2023, William C. Passmore filed a putative class action lawsuit against the Company; Benjamin P. Cowart, our Chief Executive Officer and Chairman; and Chris Carlson, our Chief Financial Officer; in the United States District Court for the Southern District of Alabama (Southern Division). In May 2023 and June 2023, additional plaintiffs filed virtually identical putative class action lawsuits against the same three defendants, the first of which was filed in the same courthouse and the second of which was filed in the United States District Court for the Southern District of Texas (Houston Division). These three putative class action lawsuits are substantially similar and allege that the Company, through Messrs. Cowart and Carlson, issued materially false and misleading statements, or omitted material information, regarding the projected future financial performance of the Mobile Refinery in 2022. The plaintiffs have asserted claims for violations of Section 10(b) of the Exchange Act, and Rule 10b-5 promulgated thereunder, and Section 20(a) of the Exchange Act, against all defendants. The Company anticipates that the three pending putative class actions will be consolidated into one putative class action following the Court’s pending resolution of the respective plaintiffs’ competing motions to become lead plaintiff and lead plaintiff’s counsel in the putative class actions.
Shareholder Derivative Lawsuits:
In June 2023, a plaintiff, derivatively on behalf of the Company, filed a shareholder derivative lawsuit against certain Directors (both current and former) and Officers. The suit alleges that the Directors and Officers of the Company breached duties owed to the Company by allowing the Company to issue materially false and misleading statements, or failing to disclose material information, regarding the projected future financial performance of the Mobile Refinery in 2022. The plaintiff has asserted claims for breach of fiduciary duty and for unjust enrichment against all defendants. Plaintiff is seeking multiple forms of relief, including high-level resolutions for amendments to the Company’s corporate governance documents. On July 19, 2023, the Court granted the plaintiff’s notice of non-suit as to two current Directors, dismissing them from the lawsuit without prejudice. On July 27, 2023, the parties filed a joint motion to stay the derivative lawsuit pending the outcome of an anticipated motion to dismiss in the putative securities class action (post-consolidation of the cases).
The Company has also been informed that a second shareholder derivative lawsuit was filed in late-June 2023. While the named defendants in the second-filed shareholder derivative lawsuit vary slightly from the first-filed shareholder derivative lawsuit, the allegations are virtually identical. Notwithstanding the fact that the Company and the defendants have not yet been served in this action, the Company anticipates potential litigation related to plaintiff’s filing of this lawsuit.
Martin Energy litigation:
On October 31, 2022, Martin Energy Services LLC (“Martin”) filed a petition against Vertex Refining Alabama LLC, Case No. 2022-71500, pending in the 234th District Court of Harris County, Texas. Martin claims breach of contract under a Sales Contract between the parties. Vertex has filed an answer and alleged various affirmative defenses. Vertex denies the allegations and is vigorously defending them. The case is in the discovery phase. Vertex has taken two depositions, and Vertex representatives will be deposed in November 2023. The case is set for trial beginning January 22, 2024.
The Company has retained counsel to respond to the putative class actions and the shareholder derivative lawsuits, and its assessment of the respective allegations is ongoing and all defendants intend to vigorously defend against the allegations.
At this stage of the lawsuits, we are unable to anticipate the ultimate impact, if any, that the legal proceedings may have on the consolidated financial position, liquidity, results of operations, or cash flows of the Company. As a result, we have not estimated a range of potential exposure for amounts, if any, that might become payable in connection with these matters and reserves have not been established. It is possible that an adverse outcome in any of the matters may have a material adverse impact on the Company.
Environmental Matters
Like other petroleum refiners, we are subject to federal, state, and local environmental laws and regulations. These laws generally provide for control of pollutants released into the environment and require responsible parties to undertake remediation of hazardous waste disposal. These governmental entities may also propose or assess fines or require corrective actions for these asserted violations. Except as disclosed below, we do not anticipate that any such matters currently known to management will have a material impact on our financial condition, results of operations, or cash flows. As of September 30, 2023 and December 31, 2022, we have $1.4 million recorded in accrued liabilities for anticipated environment clean-up costs.
NOTE 5. REVENUES
The following tables present our revenues disaggregated by geographical market and revenue source (in thousands):
| | | | | | | | | | | | | | | | | | | | | | | |
| Three Months Ended September 30, 2023 |
| Refining &
Marketing | | Black Oil & Recovery | | Corporate and Eliminations | | Consolidated |
| Primary Geographical Markets | | | | | | | |
| | | | | | | |
| | | | | | | |
| Gulf Coast | $ | 978,712 | | | $ | 44,327 | | | $ | (4,632) | | | $ | 1,018,407 | |
| Sources of Revenue | | | | | | | |
| Refined products: | | | | | | | |
| Gasolines | $ | 199,768 | | | $ | — | | | $ | — | | | $ | 199,768 | |
| Jet Fuels | 188,791 | | | — | | | — | | | 188,791 | |
| Diesel | 194,564 | | | — | | | — | | | 194,564 | |
| Renewable | 142,195 | | | — | | | — | | | 142,195 | |
Other refinery products (1) | 241,487 | | | 38,642 | | | (4,632) | | | 275,497 | |
| Re-refined products: | | | | | | | |
| Pygas | 3,898 | | | — | | | — | | | 3,898 | |
Metals (2) | — | | | 1,965 | | | — | | | 1,965 | |
Other re-refined products (3) | 611 | | | 1,001 | | | — | | | 1,612 | |
| Services and credits: | | | | | | | |
| Terminalling | 7,398 | | | — | | | — | | | 7,398 | |
| Oil collection services | — | | | 2,719 | | | — | | | 2,719 | |
| | | | | | | |
| Total revenues | $ | 978,712 | | | $ | 44,327 | | | $ | (4,632) | | | $ | 1,018,407 | |
| | | | | | | | | | | | | | | | | | | | | | | | | |
| Three Months Ended September 30, 2022 | | |
| Refining &
Marketing | | Black Oil & Recovery | | Corporate and Eliminations | | Consolidated | | |
| Primary Geographical Markets | | | | | | | | | |
| | | | | | | | | |
| | | | | | | | | |
| Gulf Coast | $ | 766,768 | | | $ | 42,761 | | | $ | — | | | $ | 809,529 | | | |
| Sources of Revenue | | | | | | | | | |
| Refined products: | | | | | | | | | |
| Gasolines | $ | 171,023 | | | $ | — | | | $ | — | | | $ | 171,023 | | | |
| Jet Fuels | 138,962 | | | — | | | — | | | 138,962 | | | |
| Diesel | 276,355 | | | — | | | — | | | 276,355 | | | |
Other refinery products (1) | 161,850 | | | 37,607 | | | — | | | 199,457 | | | |
| Re-refined products: | | | | | | | | | |
| Pygas | 15,285 | | | — | | | — | | | 15,285 | | | |
Metals (2) | — | | | 4,060 | | | — | | | 4,060 | | | |
Other re-refined products (3) | 1,149 | | | 527 | | | — | | | 1,676 | | | |
| Services: | | | | | | | | | |
| Terminalling | 2,144 | | | — | | | — | | | 2,144 | | | |
| Oil collection services | — | | | 567 | | | — | | | 567 | | | |
| | | | | | | | | |
| Total revenues | $ | 766,768 | | | $ | 42,761 | | | $ | — | | | $ | 809,529 | | | |
| | | | | | | | | | | | | | | | | | | | | | | |
| Nine Months Ended September 30, 2023 |
| Refining &
Marketing | | Black Oil & Recovery | | Corporate and Eliminations | | Consolidated |
| Primary Geographical Markets | | | | | | | |
| | | | | | | |
| | | | | | | |
| Gulf Coast | $ | 2,349,459 | | | $ | 104,758 | | | $ | (9,775) | | | $ | 2,444,442 | |
| Sources of Revenue | | | | | | | |
| Refined products: | | | | | | | |
| Gasolines | $ | 517,875 | | | $ | — | | | $ | — | | | $ | 517,875 | |
| Jet Fuels | 437,640 | | | — | | | — | | | 437,640 | |
| Diesel | 535,839 | | | — | | | — | | | 535,839 | |
| Renewable | 197,498 | | | — | | | — | | | 197,498 | |
Other refinery products (1) | 633,600 | | | 89,863 | | | (9,775) | | | 713,688 | |
| Re-refined products: | | | | | | | |
| Pygas | 12,745 | | | — | | | — | | | 12,745 | |
Metals (2) | — | | | 8,404 | | | — | | | 8,404 | |
Other re-refined products (3) | 1,129 | | | 2,508 | | | — | | | 3,637 | |
| Services and credits: | | | | | | | |
| Terminalling | 13,133 | | | — | | | — | | | 13,133 | |
| Oil collection services | — | | | 3,983 | | | — | | | 3,983 | |
| | | | | | | |
| Total revenues | $ | 2,349,459 | | | $ | 104,758 | | | $ | (9,775) | | | $ | 2,444,442 | |
| | | | | | | | | | | | | | | | | | | | | | | |
| Nine Months Ended September 30, 2022 |
| Refining &
Marketing | | Black Oil & Recovery | | Corporate and Eliminations | | Consolidated |
| Primary Geographical Markets | | | | | | | |
| | | | | | | |
| | | | | | | |
| Gulf Coast | $ | 1,767,877 | | | $ | 145,558 | | | $ | — | | | $ | 1,913,435 | |
| Sources of Revenue | | | | | | | |
| Refined products: | | | | | | | |
| Gasolines | $ | 432,173 | | | $ | — | | | $ | — | | | $ | 432,173 | |
| Jet Fuels | 282,650 | | | — | | | — | | | 282,650 | |
| Diesel | 620,580 | | | — | | | — | | | 620,580 | |
Other refinery products (1) | 385,641 | | | 129,078 | | | — | | | 514,719 | |
| Re-refined products: | | | | | | | |
| Pygas | 40,660 | | | — | | | — | | | 40,660 | |
Metals (2) | — | | | 13,080 | | | — | | | 13,080 | |
Other re-refined products (3) | 1,721 | | | 1,780 | | | — | | | 3,501 | |
| Services: | | | | | | | |
| Terminalling | 4,452 | | | — | | | — | | | 4,452 | |
| Oil collection services | — | | | 1,620 | | | — | | | 1,620 | |
| Total revenues | $ | 1,767,877 | | | $ | 145,558 | | | $ | — | | | $ | 1,913,435 | |
(1) Other refinery products include the sales of renewable diesel, base oil, cutterstock and hydrotreated VGO, LPGs, sulfur and vacuum tower bottoms (VTB).
(2) Metals consist of recoverable ferrous and non-ferrous recyclable metals from manufacturing and consumption. Scrap metal can be recovered from pipes, barges, boats, building supplies, surplus equipment, tanks, and other items consisting of metal composition. These materials are segregated, processed, cut-up and sent back to a steel mill for re-purposing.
(3) Other re-refinery products include the sales of asphalt, condensate, recovered products, and other petroleum products.
NOTE 6. SEGMENT REPORTING
The Refining and Marketing segment consists primarily of the sale of gasoline, diesel and jet fuel produced at the Mobile Refinery as well as pygas and industrial fuels, which are produced at a third-party facility.
The Black Oil and Recovery segment consists primarily of the sale of (a) petroleum products which include base oil and industrial fuels—which consist of used motor oils, cutterstock and fuel oil generated by our facilities; (b) oil collection services—which consist of used oil sales, burner fuel sales, antifreeze sales and service charges; (c) the sale of other re-refinery products including asphalt, condensate, recovered products, and used motor oil; (d) transportation revenues; (e) the sale of VGO/marine fuel; (f) the sale of ferrous and non-ferrous recyclable metal(s) products that are recovered from manufacturing and consumption; and (g) revenues generated from trading/marketing of Group III Base Oils. The Black Oil and Recovery segment excludes the Heartland Assets and Operations, which are presented herein as discontinued operations.
We also disaggregate our revenue by product category for each of our segments, as we believe such disaggregation helps depict how our revenue and cash flows are affected by economic factors.
Segment information for the three and nine months ended September 30, 2023 and 2022 is as follows (in thousands):
| | | | | | | | | | | | | | | | | | | | | | | | | | |
| Three Months Ended September 30, 2023 |
| | Refining &
Marketing | | Black Oil & Recovery | | Corporate and Eliminations | | Total |
| Revenues: | | | | | | | | |
Refined products | | $ | 966,805 | | | $ | 38,642 | | | $ | (4,632) | | | $ | 1,000,815 | |
Re-refined products | | 4,509 | | | 2,966 | | | — | | | 7,475 | |
| Services | | 7,398 | | | 2,719 | | | — | | | 10,117 | |
| Total revenues | | 978,712 | | | 44,327 | | | (4,632) | | | 1,018,407 | |
| Cost of revenues (exclusive of depreciation and amortization shown separately below) | | 893,612 | | | 36,569 | | | (4,639) | | | 925,542 | |
| Depreciation and amortization attributable to costs of revenues | | 6,527 | | | 1,369 | | | — | | | 7,896 | |
| Gross profit | | 78,573 | | | 6,389 | | | 7 | | | 84,969 | |
| Selling, general and administrative expenses | | 31,485 | | | 5,231 | | | 6,421 | | | 43,137 | |
| Depreciation and amortization attributable to operating expenses | | 829 | | | 38 | | | 166 | | | 1,033 | |
| Income (loss) from operations | | 46,259 | | | 1,120 | | | (6,580) | | | 40,799 | |
| Other income (expenses) | | | | | | | | |
| Other income (expense) | | — | | | (167) | | | 34 | | | (133) | |
| Gain on change in value of derivative warrant liabilities | | — | | | — | | | 4,621 | | | 4,621 | |
| Interest expense | | (4,394) | | | (41) | | | (9,088) | | | (13,523) | |
| Net income (loss) | | $ | 41,865 | | | $ | 912 | | | $ | (11,013) | | | $ | 31,764 | |
| | | | | | | | |
| Capital expenditures | | $ | 20,875 | | | $ | 8,449 | | | $ | — | | | $ | 29,324 | |
| | | | | | | | | | | | | | | | | | | | | | | | | | |
| Three Months Ended September 30, 2022 |
| | Refining &
Marketing | | Black Oil & Recovery | | Corporate and Eliminations | | Total |
| Revenues: | | | | | | | | |
Refined products | | $ | 748,190 | | | $ | 37,607 | | | $ | — | | | $ | 785,797 | |
Re-refined products | | 16,434 | | | 4,587 | | | — | | | 21,021 | |
| Services | | 2,144 | | | 567 | | | — | | | 2,711 | |
| Total revenues | | 766,768 | | | 42,761 | | | — | | | 809,529 | |
| Cost of revenues (exclusive of depreciation and amortization shown separately below) | | 714,976 | | | 34,678 | | | — | | | 749,654 | |
| Depreciation and amortization attributable to costs of revenues | | 3,111 | | | 938 | | | — | | | 4,049 | |
| Gross profit | | 48,681 | | | 7,145 | | | — | | | 55,826 | |
| Selling, general and administrative expenses | | 28,269 | | | 4,803 | | | 4,070 | | | 37,142 | |
| Depreciation and amortization attributable to operating expenses | | 850 | | | 38 | | | 231 | | | 1,119 | |
| Income (loss) from operations | | 19,562 | | | 2,304 | | | (4,301) | | | 17,565 | |
| Other income (expenses) | | | | | | | | |
| Other income | | — | | | 416 | | | — | | | 416 | |
| Gain on change in value of derivative warrant liabilities | | — | | | — | | | 12,312 | | | 12,312 | |
| Interest expense | | (3,444) | | | — | | | (9,584) | | | (13,028) | |
| Net income (loss) | | $ | 16,118 | | | $ | 2,720 | | | $ | (1,573) | | | $ | 17,265 | |
| | | | | | | | |
| Capital expenditures | | $ | 26,333 | | | $ | 412 | | | $ | — | | | $ | 26,745 | |
| | | | | | | | | | | | | | | | | | | | | | | | | | |
| Nine Months Ended September 30, 2023 |
| | Refining &
Marketing | | Black Oil & Recovery | | Corporate and Eliminations | | Total |
| Revenues: | | | | | | | | |
Refined products | | $ | 2,322,452 | | | $ | 89,863 | | | $ | (9,775) | | | $ | 2,402,540 | |
Re-refined products | | 13,874 | | | 10,912 | | | — | | | 24,786 | |
| Services | | 13,133 | | | 3,983 | | | — | | | 17,116 | |
| Total revenues | | 2,349,459 | | | 104,758 | | | (9,775) | | | 2,444,442 | |
| Cost of revenues (exclusive of depreciation and amortization shown separately below) | | 2,194,382 | | | 90,250 | | | (10,089) | | | 2,274,543 | |
| Depreciation and amortization attributable to costs of revenues | | 15,389 | | | 3,474 | | | — | | | 18,863 | |
| Gross profit | | 139,688 | | | 11,034 | | | 314 | | | 151,036 | |
| Selling, general and administrative expenses | | 90,940 | | | 14,535 | | | 22,240 | | | 127,715 | |
| Depreciation and amortization attributable to operating expenses | | 2,459 | | | 114 | | | 504 | | | 3,077 | |
| Income (loss) from operations | | 46,289 | | | (3,615) | | | (22,430) | | | 20,244 | |
| Other income (expenses) | | | | | | | | |
| Other income | | — | | | 989 | | | 34 | | | 1,023 | |
| Gain on change in value of derivative warrant liabilities | | — | | | — | | | 5,036 | | | 5,036 | |
| Interest expense | | (12,799) | | | (126) | | | (90,611) | | | (103,536) | |
| Net income (loss) | | $ | 33,490 | | | $ | (2,752) | | | $ | (107,971) | | | $ | (77,233) | |
| | | | | | | | |
| Capital expenditures | | $ | 118,545 | | | $ | 16,123 | | | $ | — | | | $ | 134,668 | |
| | | | | | | | | | | | | | | | | | | | | | | | | | |
| Nine Months Ended September 30, 2022 |
| | Refining &
Marketing | | Black Oil & Recovery | | Corporate and Eliminations | | Total |
| Revenues: | | | | | | | | |
Refined products | | $ | 1,721,044 | | | $ | 129,078 | | | $ | — | | | $ | 1,850,122 | |
Re-refined products | | 42,381 | | | 14,860 | | | — | | | 57,241 | |
| Services | | 4,452 | | | 1,620 | | | — | | | 6,072 | |
| Total revenues | | 1,767,877 | | | 145,558 | | | — | | | 1,913,435 | |
| Cost of revenues (exclusive of depreciation and amortization shown separately below) | | 1,707,746 | | | 110,041 | | | — | | | 1,817,787 | |
| Depreciation and amortization attributable to costs of revenues | | 6,339 | | | 2,800 | | | — | | | 9,139 | |
| Gross profit | | 53,792 | | | 32,717 | | | — | | | 86,509 | |
| Selling, general and administrative expenses | | 53,073 | | | 13,125 | | | 23,841 | | | 90,039 | |
| Depreciation and amortization attributable to operating expenses | | 1,784 | | | 142 | | | 729 | | | 2,655 | |
| Income (loss) from operations | | (1,065) | | | 19,450 | | | (24,570) | | | (6,185) | |
| Other income (expenses) | | | | | | | | |
| Other income | | 18 | | | 1,041 | | | — | | | 1,059 | |
| Gain on change in value of derivative warrant liabilities | | — | | | — | | | 7,788 | | | 7,788 | |
| Interest expense | | (6,694) | | | (51) | | | (58,216) | | | (64,961) | |
| Net income (loss) | | $ | (7,741) | | | $ | 20,440 | | | $ | (74,998) | | | $ | (62,299) | |
| | | | | | | | |
| Capital expenditures | | $ | 142,927 | | | $ | 2,830 | | | $ | — | | | $ | 145,757 | |
Total assets by segment were as follows (in thousands):
| | | | | | | | | | | | | | | | | | | | | | | | | | |
As of September 30, 2023 |
| | Refining &
Marketing | | Black Oil & Recovery | | Corporate and Eliminations | | Consolidated |
| Total assets | | $ | 697,129 | | | $ | 115,820 | | | $ | 79,729 | | | $ | 892,678 | |
| | | | | | | | |
As of December 31, 2022 |
| | Refining &
Marketing | | Black Oil & Recovery | | Corporate and Eliminations | | Consolidated |
| Total assets | | $ | 410,975 | | | $ | 105,109 | | | $ | 173,301 | | | $ | 689,385 | |
Segment assets for the Refining and Marketing and Black Oil and Recovery segments consist of property, plant, and equipment, right-of-use assets, intangible assets, accounts receivable, inventories and other assets. Assets for the corporate unallocated amounts consist of property, plant, and equipment used at the corporate headquarters, intangible assets, derivative commodity assets, assets held for sale as of December 31, 2022 and cash.
NOTE 7. ACCOUNTS RECEIVABLE
Accounts receivable, net, consists of the following at September 30, 2023 and December 31, 2022 (in thousands):
| | | | | | | | | | | |
| September 30, 2023 | | December 31, 2022 |
| Accounts receivable trade | $ | 38,220 | | | $ | 36,098 | |
| Allowance for doubtful accounts | (1,404) | | | (1,550) | |
| | | |
| | | |
| Accounts receivable, net | $ | 36,816 | | | $ | 34,548 | |
Accounts receivable trade represents amounts due from customers. Accounts receivable trade are recorded at invoiced amounts, net of reserves and allowances and do not bear interest.
Bad debt recovery was $0.2 million and $0.3 million for the three months ended September 30, 2023 and 2022, respectively, for the continued operations.
Bad debt recovery was $0.1 million for the nine months ended September 30, 2023 and bad debt expenses was $0.2 million for the nine months ended September 30, 2022, for the continued operations.
NOTE 8. CONCENTRATIONS OF RISK AND SIGNIFICANT CUSTOMERS
The Company has concentrated credit risk for cash by maintaining deposits in two banks. These balances are insured by the Federal Deposit Insurance Corporation up to $250,000. From time to time during the nine months ended September 30, 2023 and year ended December 31, 2022, the Company’s cash balances exceeded the federally insured limits. No losses have been incurred relating to this concentration.
At September 30, 2023 and 2022 and for each of the nine months then ended, the Company’s revenues and receivables were comprised of the following customer concentrations, which exceeded 10% of total revenue:
| | | | | | | | | | | | | | | | | | | | | | | |
| As of and for the Nine Months Ended |
| | September 30, 2023 | | September 30, 2022 |
| % of
Revenues | | % of
Receivables | | % of
Revenues | | % of
Receivables |
| Customer 1 | 35% | | 2% | | 40% | | 2% |
| Customer 2 | 33% | | 25% | | 22% | | 50% |
| | | | | | | |
| | | | | | | |
| | | | | | | |
| | | | | | | |
| | | | | | | |
| | | | | | | |
| | | | | | | |
| | | | | | | |
| | | | | | | |
| | | | | | | |
| | | | | | | |
| | | | | | | |
For each of the three and nine months ended September 30, 2023 and 2022, the Company’s segment revenues were comprised of the following customer concentrations:
| | | | | | | | | | | | | | | | | | | | | | | | | | | | | | | | | | | | | | | | | | | | | | | | | | | |
| | | | | |
| Three Months Ended September 30, | | Nine Months Ended September 30, | | |
| 2023 | | 2022 | | 2023 | | | | 2022 | | |
| Refining | | Black Oil and Recovery | | Refining | | Black Oil and Recovery | | Refining | | Black Oil and Recovery | | | | Refining | | Black Oil and Recovery | | |
| Customer 1 | 34% | | —% | | 19% | | —% | | 36% | | —% | | | | 43% | | —% | | |
| Customer 2 | 32% | | —% | | 14% | | —% | | 34% | | —% | | | | 24% | | —% | | |
| | | | | | | | | | | | | | | | | | | |
| | | | | | | | | | | | | | | | | | | |
| | | | | | | | | | | | | | | | | | | |
| | | | | | | | | | | | | | | | | | | |
| | | | | | | | | | | | | | | | | | | |
| | | | | | | | | | | | | | | | | | | |
| | | | | | | | | | | | | | | | | | | |
| | | | | | | | | | | | | | | | | | | |
| | | | | | | | | | | | | | | | | | | |
| | | | | | | | | | | | | | | | | | | |
| | | | | | | | | | | | | | | | | | | |
The Company had one vendor that represented 37% and 51% of total purchases for the nine months ended September 30, 2023, and 2022, respectively, and 47% and 51% of total payables at September 30, 2023, and 2022, respectively.
NOTE 9. INVENTORY
The following table describes the Company's inventory balances by category (in thousands):
| | | | | | | | | | | |
| As of September 30, 2023 | | As of December 31, 2022 |
| Crude oil | $ | 75,303 | | | $ | 59,131 | |
| Renewable feedstocks | 41,316 | | | — | |
| Refined products | 104,042 | | 74,311 |
| Re-refined products | 2,024 | | 2,031 |
| Total hydrocarbon inventories | $ | 222,685 | | | $ | 135,473 | |
| | | |
| | | |
| | | |
| | | |
| | | |
| | | |
| | | |
| | | |
| | | |
| | | |
| | | |
| | | |
| | | |
NOTE 10. INVENTORY FINANCING AGREEMENTS
The following table summarizes our outstanding obligations under our inventory financing agreements (in thousands):
| | | | | | | | | | | | | | |
| | September 30, 2023 | | December 31, 2022 |
| Obligations under inventory financing agreements | | $ | 182,987 | | | $ | 119,189 | |
| Unamortized financing cost | | (500) | | | (1,250) | |
| Obligations under inventory financing agreements, net | | $ | 182,487 | | | $ | 117,939 | |
The valuation of our obligations at the end of each reporting period requires that we make estimates of the prices and differentials for our then monthly forward purchase obligations.
Supply and Offtake Agreement
On April 1, 2022 (the “Commencement Date”), Vertex Refining entered into a Supply and Offtake Agreement (the “Supply and Offtake Agreement”) with Macquarie, pertaining to crude oil supply and offtake of finished products located at the Mobile Refinery acquired on April 1, 2022.
Under the Supply and Offtake Agreement, Macquarie purchases the majority of the crude oil utilized at the Mobile Refinery and holds legal title prior to its sale to Vertex Refining for consumption within the Mobile Refinery processing units. Also pursuant to the Supply and Offtake Agreement, Macquarie purchases from Vertex Refining substantially all of the Mobile Refinery’s output of certain refined products and owns such refined products while they are located within certain specified locations at the Mobile Refinery. Macquarie takes title to the refined products stored in our storage tanks until they are sold. We record the inventory owned by Macquarie on our behalf as inventory with a corresponding accrued liability on our balance sheet because we maintain the risk of loss until the refined products are sold to third parties and we have an obligation to repurchase it.
Pursuant to the Supply and Offtake Agreement and subject to the terms and conditions therein, Macquarie may during the term of the Supply and Offtake Agreement procure crude oil and refined products from certain third parties which may be sold to Vertex Refining or third parties (including customers of Vertex Refining) pursuant to the Supply and Offtake Agreement.
The Supply and Offtake Agreement expires March 31, 2024, subject to the performance of customary covenants, and certain events of default and termination events provided therein, for a facility of that size and type. Additionally, either party may terminate the agreement at any time, for any reason, with no less than 180 days prior notice to the other.
Amendment No. 1 to Supply and Offtake Agreement
In connection with the entry into the RD Supply and Offtake Agreement, discussed below, Macquarie, Vertex Refining and the Company, entered into Amendment Agreement No. 1 to the Supply and Offtake Agreement (“Amendment 1”). Pursuant to Amendment 1, the Supply and Offtake Agreement was amended to include certain additional documents relating to the RD Supply and Offtake Agreement as transaction documents, and to update such Supply and Offtake Agreement in connection therewith, to amend the unwind procedures associated with the Supply and Offtake Agreement, and to update or revise certain other covenants set forth in the Supply and Offtake Agreement relating to cross defaults, finance agreements, minimum liquidity, and guarantor requirements, to be conformed with changes made to analogous provisions in, or to otherwise account for, the RD Supply and Offtake Agreement terms. Amendment 1 also made conforming amendments to certain other agreements relating to the Supply and Offtake Agreement.
Renewables RD Supply and Offtake Agreement
On May 26, 2023 (the “Commencement Date”), Vertex Renewables Alabama, LLC, an affiliate indirectly wholly-owned by the Company (“Vertex Renewables”), entered into a Supply and Offtake Agreement (the “RD Supply and Offtake Agreement”) with Macquarie, pertaining to the supply and financing of renewable biomass feedstocks used for the production of renewable fuels, the offtake and financing of renewable diesel, and the provision of certain financing accommodations with respect to certain agreed environmental attributes associated with the operation of such renewable diesel unit (including Renewable Identification Numbers (RINs), tax credits, and low carbon fuel credits) at the Mobile Refinery.
The RD Supply and Offtake Agreement has a 24 month term following the Effective Date, which was May 26, 2023, subject to the performance of customary covenants, and may be terminated earlier following the occurrence of certain events of default and termination events provided therein that are customary for a facility of this size and type and subject to applicable cure periods in certain events. Additionally, either party may terminate the agreement at any time, for any reason, with not less than 180 days prior notice to the other. In the event Vertex Renewables is the terminating party, Vertex Refining must also at the same time, terminate that certain Supply and Offtake Agreement entered into with Macquarie dated April 1, 2022.
Pursuant to the Supply and Offtake Agreement, we pay or receive certain fees from Macquarie based on changes in market prices over time. The following table summarizes the inventory intermediation fees, financing costs, which are included in cost of sale, and interest expenses (in thousands):
| | | | | | | | | | | | | | | | | | | | | | | | | | |
| | Three Months Ended September 30, | | Nine Months Ended September 30, |
| | 2023 | | 2022 | | 2023 | | 2022 |
| Intermediation fee | | $ | 5,580 | | | $ | 17,972 | | | $ | 11,805 | | | $ | 41,152 | |
| Inventory financing fees (include over/under) | | $ | 1,977 | | | $ | 9,032 | | | $ | 4,243 | | | $ | 10,267 | |
| Interest expense and financing costs, net | | $ | 2,346 | | | $ | 2,071 | | | $ | 7,450 | | | $ | 3,801 | |
NOTE 11. PREPAID EXPENSES AND OTHER CURRENT ASSETS
The following table describes the Company's prepaid expenses and other current assets balances (in thousands):
| | | | | | | | | | | |
| September 30, 2023 | | December 31, 2022 |
| Prepaid insurance | $ | 14,608 | | | $ | 8,356 | |
| Commodity derivative advance | 2,081 | | | 5,472 | |
| Renewable volume obligation (RVO) assets | 2,762 | | | 2,001 | |
| Other prepaid expenses | 7,558 | | | 5,160 | |
| Inventory financing deposit | 23,644 | | | 10,329 | |
| Other current assets | 6,662 | | | 5,342 | |
| Total prepaid expenses | $ | 57,315 | | | $ | 36,660 | |
NOTE 12. FIXED ASSETS, NET
Fixed assets consist of the following (in thousands):
| | | | | | | | | | | | | | | | | |
| Useful Life
(in years) | | September 30, 2023 | | December 31, 2022 |
| Equipment | 7 | | $ | 269,640 | | | $ | 97,120 | |
| Furniture and fixtures | 7 | | 55 | | | 86 | |
| Leasehold improvements | 15 | | 2,852 | | | 2,852 | |
| Office equipment | 5 | | 1,476 | | | 1,433 | |
| Vehicles | 5 | | 15,004 | | | 9,212 | |
| Building | 20 | | 3,658 | | | 2,334 | |
| Turnarounds | 4 | | 21,170 | | | 18,964 | |
| Construction in progress | | | 48,596 | | | 96,765 | |
| Land | | | 9,768 | | | 9,168 | |
| Total fixed assets | | | 372,219 | | | 237,934 | |
| Less accumulated depreciation | | | (50,905) | | | (36,185) | |
| Net fixed assets | | | $ | 321,314 | | | $ | 201,749 | |
The increase in fixed assets is due to the investment in the Renewable Diesel unit project at the Mobile Refinery, which began April 1, 2022, and which includes construction in progress. Depreciation expense was $6.9 million and $3.3 million for the three months ended September 30, 2023 and 2022, respectively, for the continued operations. Depreciation expense was $16.1 million and $7.6 million for the nine months ended September 30, 2023 and 2022, respectively, for the continued operations.
Asset Retirement Obligations:
The Company has asset retirement obligations with respect to certain of its refinery assets due to various legal obligations to clean and/or dispose of various component parts of each refinery at the time they are retired. However, these component parts can be used for extended and indeterminate periods of time as long as they are properly maintained and/or upgraded. It is the Company’s practice and current intent to maintain its refinery assets and continue making improvements to those assets based on technological advances. As a result, the Company believes that its refinery assets have indeterminate lives for purposes of estimating asset retirement obligations because dates, or ranges of dates, upon which the Company would retire refinery assets cannot reasonably be estimated. When a date or range of dates can reasonably be estimated for the retirement of any component part of a refinery, the Company estimates the cost of performing the retirement activities and records a liability for the fair value of that cost using established present value techniques.
NOTE 13. INTANGIBLE ASSETS, NET
Components of intangible assets (subject to amortization) consist of the following items:
| | | | | | | | | | | | | | | | | | | | | | | | | | | | | | | | | | | | | | | | | | | | |
| | | | September 30, 2023 | | December 31, 2022 |
| | Useful Life
(in years) | | Gross
Carrying
Amount | | Accumulated Amortization | | Net
Carrying
Amount | | Gross
Carrying
Amount | |
Accumulated Amortization | | Net
Carrying
Amount |
| Customer relations | | 5 | | $ | 978 | | | $ | 978 | | | $ | — | | | $ | 978 | | | $ | 974 | | | $ | 4 | |
| Vendor relations | | 10 | | 4,778 | | | 4,624 | | | 154 | | | 4,778 | | | 4,575 | | | 203 | |
| Trademark/Trade name | | 15 | | 887 | | | 645 | | | 242 | | | 887 | | | 608 | | | 279 | |
| TCEP Technology/Patent | | 15 | | 13,287 | | | 9,502 | | | 3,785 | | | 13,287 | | | 8,838 | | | 4,449 | |
| Non-compete | | 3 | | 197 | | | 197 | | | — | | | 197 | | | 197 | | | — | |
| Software | | 3 | | 9,344 | | | 4,783 | | | 4,561 | | | 9,387 | | | 2,495 | | | 6,892 | |
| Licensing Fee | | 30 | | 2,500 | | | 35 | | | 2,465 | | | — | | | — | | | — | |
| | | | $ | 31,971 | | | $ | 20,764 | | | $ | 11,207 | | | $ | 29,514 | | | $ | 17,687 | | | $ | 11,827 | |
Intangible assets are amortized on a straight-line basis. We continually evaluate the amortization period and carrying basis of intangible assets to determine whether subsequent events and circumstances warrant a revised estimated useful life or reduction in value.
Total amortization expense of intangibles was $1.0 million and $1.1 million for the three months ended September 30, 2023 and 2022, respectively. Total amortization expense of intangibles was $3.1 million and $2.7 million for the nine months ended September 30, 2023 and 2022, respectively.
Estimated future amortization expense is as follows for each of the twelve months ended (in thousands):
| | | | | |
| September 30, | Balance |
| 2024 | $ | 4,125 | |
| 2025 | 2,596 | |
| 2026 | 1,034 | |
| 2027 | 1,031 | |
| 2028 | 284 | |
| Thereafter | 2,137 | |
| | $ | 11,207 | |
NOTE 14. ACCRUED EXPENSES
Accrued expenses consisted of the following (in thousands):
| | | | | | | | | | | | | | |
| | September 30, 2023 | | December 31, 2022 |
| Accrued purchases | | $ | 15,898 | | | $ | 21,185 | |
| Accrued interest | | — | | | 1,488 | |
| Accrued compensation and benefits | | 5,763 | | | 6,530 | |
| Accrued income, real estate, sales and other taxes | | 3,756 | | | 1,102 | |
| RINS liabilities | | 42,909 | | | 51,355 | |
| Unearned Revenue | | 620 | | | — | |
| Environmental liabilities - current | | 369 | | | 51 | |
| | | | |
| | $ | 69,315 | | | $ | 81,711 | |
NOTE 15. FINANCING AGREEMENTS
The Company's long-term debt consisted of the following as of September 30, 2023 and December 31, 2022 (in thousands):
| | | | | | | | | | | | | | | | | | | | | | | |
| Creditor | Loan Type | | | | | | | | September 30, 2023 | | December 31, 2022 |
| Convertible Senior Note | Convertible note | | | | | | | | $ | 15,230 | | | $ | 95,178 | |
| Term Loan 2025 | Loan | | | | | | | | 148,013 | | | 165,000 | |
| | | | | | | | | | | |
| SBA Loan | SBA Loan | | | | | | | | — | | | 59 | |
| | | | | | | | | | | |
| Various institutions | Insurance premiums financed | | | | | | | | 10,071 | | | 5,602 | |
| Principal amount of long-term debt | | | | | | | | | 173,314 | | | 265,839 | |
| Less: unamortized discount and deferred financing costs | | | | | | | | | (29,983) | | | (81,918) | |
| Total debt, net of unamortized discount and deferred financing costs | | | | | | | | | 143,331 | | | 183,921 | |
| Less: current maturities | | | | | | | | | (18,321) | | | (13,911) | |
| Long-term debt, net of current maturities | | | | | | | | | $ | 125,010 | | | $ | 170,010 | |
Future maturities of long-term debt, excluding financing lease obligations, as of September 30, 2023, are summarized as follows (in thousands):
| | | | | | | | |
Period Ended September 30, | | Amount Due |
| 2024 | | $ | 18,321 | |
| 2025 | | 139,763 | |
| 2026 | | — | |
| 2027 | | — | |
| 2028 | | 15,230 | |
| | |
| Total | | $ | 173,314 | |
Insurance Premiums
The Company financed insurance premiums through various financial institutions bearing interest at rates ranging from 3.24% to 6.25% per annum. All such premium finance agreements have maturities of less than one year and have a balance of $10.1 million at September 30, 2023 and $5.6 million at December 31, 2022.
Term Loans
Vertex Refining, the Company, as a guarantor, substantially all of the Company’s direct and indirect subsidiaries, as guarantors, certain funds as lenders (the “Lenders”), and Cantor Fitzgerald Securities, in its capacity as administrative agent and collateral agent for the Lenders (the “Agent”), entered into a Loan and Security Agreement on April 1, 2022 (as amended from time to time, the “Loan and Security Agreement”).
Pursuant to the Loan and Security Agreement, the Lenders agreed to provide a $165 million term loan to Vertex Refining (the “Term Loan”). The Company paid off $17.0 million owed under the term loan during the nine months ended September 30, 2023.
On September 30, 2022, the parties entered into a second amendment to the Loan and Security Agreement which (a) extended the date that the Company was required to begin initial commercial production of renewable diesel at the Mobile Refinery, from February 28, 2023 to April 28, 2023 (which date the Lender further agreed to extended until July 14, 2023), and provided other corresponding extensions of the milestones required to complete the Company’s capital project designed to modify the Mobile Refinery’s existing hydrocracking unit to produce renewable diesel fuel on a standalone basis, which as previously described, mechanical completion was achieved in connection with in March 2023; and (b) waived and extended certain deadlines and time periods for the Company to take other actions in connection with the Loan and Security Agreement.
Warrant Agreement and Derivative Liabilities
In connection with the April 1, 2022 Loan and Security Agreement, and as additional consideration for the Lenders agreeing to loan funds to the Company thereunder, the Company granted warrants to purchase 2.75 million shares of common stock of the Company to the Lenders (and/or their affiliates) (the “Initial Warrants”). The terms of the warrants are set forth in a Warrant Agreement entered into on April 1, 2022, between the Company and Continental Stock Transfer & Trust Company as warrant agent.
In connection with the entry into an Amendment No. One to Loan Agreement, and as a required term and condition thereof, on May 26, 2022, the Company granted warrants (the “Additional Warrants” and together with the Initial Warrants, the “Warrants”) to purchase 250 thousand shares of the Company’s common stock to certain of the Lenders and their affiliates. The terms of the Additional Warrants are set forth in a Warrant Agreement entered into on May 26, 2022, between the Company and Continental Stock Transfer & Trust Company as warrant agent.
Each Warrant holder has a put right to require the Company to repurchase any portion of the Warrants held by such holder concurrently with the consummation of a fundamental transaction, as defined in the Warrant Agreement. The fundamental transaction clause requires the Warrants to be classified as liabilities. The fair value of the Warrants is presented in “Note 19. Fair Value Measurements”, and warrant activities are presented in “Note 17. Equity”. Indenture and Convertible Senior Notes
On November 1, 2021, we issued $155 million aggregate principal amount at maturity of our 6.25% Convertible Senior Notes due 2027 (the “Convertible Senior Notes”) pursuant to an Indenture (the “Indenture”), dated November 1, 2021, between the Company and U.S. Bank National Association, as trustee (the “Trustee”), in a private offering to persons reasonably believed to be “qualified institutional buyers” and/or to “accredited investors” in reliance on the exemption from registration provided by Section 4(a)(2) of the Securities Act of 1933, as amended, pursuant to Securities Purchase Agreements. The issue price was 90% of the face amount of each note.
On June 12, 2023, pursuant to the terms of certain separate, privately negotiated exchange agreements, the holders of $79.9 million principal amount of the Convertible Senior Notes due 2027, exchanged such principal amount of notes for an aggregate of 17.2 million newly issued shares of common stock. The Company also paid an aggregate of $1.0 million in cash to satisfy accrued and unpaid interest on the converted notes to the closing date of the exchanges. Upon the exchange, the Company recognized $40.7 million unamortized deferred loan cost and discount and $21.2 million inducement cost as interest expense.
The components of the Convertible Senior Notes are presented as follows (in thousands):
| | | | | | | | | | | | | | |
| | September 30, 2023 | | December 31, 2022 |
| Principal amounts at beginning of period | | $ | 95,178 | | | $ | 155,000 | |
| Conversion of principal into common stock | | (79,948) | | | (59,822) | |
| Outstanding principal amount | | 15,230 | | | 95,178 | |
| Unamortized discount and issuance costs | | (7,437) | | | (51,005) | |
| Net carrying amount at end of period | | $ | 7,793 | | | $ | 44,173 | |
Our Convertible Senior Notes will mature on October 1, 2027, unless earlier repurchased, redeemed or converted. Interest is payable semiannually in arrears on April 1 and October 1 of each year, beginning on April 1, 2022.
NOTE 16. LEASES
Finance Leases
The Company's finance lease liabilities consisted of the following as of September 30, 2023 and December 31, 2022 (in thousands):
| | | | | | | | | | | | | | | | | | | | | | | |
| Creditor | Loan Type | | | | | | | | September 30, 2023 | | December 31, 2022 |
| Matheson Tri-Gas | Finance Lease | | | | | | | | $ | 44,440 | | | $ | 45,311 | |
| Plaquemines | Finance Lease | | | | | | | | 1,045 | | | 1,169 | |
| Harvey Ford | Finance Lease | | | | | | | | 41 | | | 47 | |
| DLL financial | Finance Lease | | | | | | | | 19 | | | — | |
| Centerpoint Blakely | Finance Lease | | | | | | | | 23,503 | | | — | |
| | | | | | | | | $ | 69,048 | | | $ | 46,527 | |
Future maturities of finance lease obligations, as of September 30, 2023, are summarized as follows (in thousands):
| | | | | | | | |
Period Ended September 30, | | Amount Due |
| 2024 | | $ | 8,409 | |
| 2025 | | 8,409 | |
| 2026 | | 8,402 | |
| 2027 | | 8,399 | |
| 2028 | | 26,868 | |
| Thereafter | | 59,514 | |
| Total lease payments | | 120,001 | |
| Less: interest | | (50,953) | |
| Present value of financing lease liabilities | | $ | 69,048 | |
The following table summarizes the lease cost recognized in our consolidated statements of operations (in thousands):
| | | | | | | | | | | | | | | | | | | | | | | | | | |
| | Three Months Ended September 30, | | Nine Months Ended September 30, |
| Lease Cost Type | | 2023 | | 2022 | | 2023 | | 2022 |
| Amortization of finance lease ROU assets | | $ | 984 | | | $ | 723 | | | $ | 2,753 | | | $ | 1,531 | |
| Interest on lease liabilities | | 1,540 | | | 1,364 | | | 4,474 | | | 2,741 | |
| Net finance lease costs | | $ | 2,524 | | | $ | 2,087 | | | $ | 7,227 | | | $ | 4,272 | |
Operating Leases
Operating leases are included in operating lease right-of-use lease assets, and operating current and long-term lease liabilities on the consolidated balance sheets. Lease expense for operating leases is recognized on a straight-line basis over the lease term. Variable lease expense is recognized in the period in which the obligation for those payments is incurred. Lease expense for equipment is included in cost of revenues and other rents are included in selling, general and administrative expense on the unaudited consolidated statements of operations and are reported net of lease income.
The following table summarizes the operating lease costs recognized (in thousands):
| | | | | | | | | | | | | | | | | | | | | | | | | | |
| | Three Months Ended September 30, | | Nine Months Ended September 30, |
| Lease Cost Type | | 2023 | | 2022 | | 2023 | | 2022 |
| Operating lease cost | | $ | 6,462 | | | $ | 3,722 | | | $ | 14,494 | | | $ | 10,141 | |
| Variable lease cost | | 831 | | | 310 | | | 1,700 | | | 661 | |
| Short-term lease cost | | 3,987 | | | 797 | | | 12,794 | | | 1,319 | |
| Net lease cost | | $ | 11,280 | | | $ | 4,829 | | | $ | 28,988 | | | $ | 12,121 | |
Cash Flows
The following table summarizes the supplemental cash flow information related to leases as follows (in thousands):
| | | | | | | | | | | | | | |
| | Nine Months Ended September 30, |
| Lease Cost Type | | 2023 | | 2022 |
| Cash paid for amounts included in the measurement of liabilities | | | | |
| Payments on financing lease | | $ | 1,469 | | | $ | 201 | |
| Payments on operating lease | | $ | 14,494 | | | $ | 6,023 | |
| Non-cash supplemental amounts | | | | |
| ROU assets obtained from new finance lease liabilities | | $ | 23,990 | | | $ | 45,096 | |
| ROU assets obtained from new operating lease liabilities | | $ | 36,856 | | | $ | 20,061 | |
| | | | |
| | | | |
Maturities of our lease liabilities for all operating leases are as follows as of September 30, 2023 (in thousands):
| | | | | | | | | | | | | | | | | | | | | | | | | | | | | |
| For the period ending September 30, | Facilities | | Equipment | | Plant | | Railcar | | Total |
| 2024 | $ | 626 | | | $ | 16,776 | | | $ | 8,007 | | | $ | 638 | | | $ | 26,047 | |
| 2025 | 535 | | | 10,637 | | | 7,667 | | | 506 | | | 19,345 | |
| 2026 | 452 | | | 5,058 | | | 7,553 | | | 389 | | | 13,452 | |
| 2027 | 448 | | | 4,859 | | | 7,586 | | | 123 | | | 13,016 | |
| 2028 | 451 | | | 1,110 | | | 7,609 | | | — | | | 9,170 | |
| Thereafter | 1,520 | | | — | | | 82,913 | | | — | | | 84,433 | |
| Total lease payments | 4,032 | | | 38,440 | | | 121,335 | | | 1,656 | | | 165,463 | |
| Less: interest | (1,257) | | | (5,025) | | | (68,654) | | | (113) | | | (75,049) | |
| Present value of operating lease liabilities | $ | 2,775 | | | $ | 33,415 | | | $ | 52,681 | | | $ | 1,543 | | | $ | 90,414 | |
The weighted average remaining lease terms and discount rates for all of our operating leases were as follows as of September 30, 2023:
| | | | | | | | |
| Remaining lease term and discount rate: | | September 30, 2023 |
| Weighted average remaining lease terms (years) | | |
| Finance lease | | 14.32 |
| Lease facilities | | 5.86 |
| Lease equipment | | 3.24 |
| Lease plant | | 16.19 |
| Lease railcar | | 1.65 |
| Weighted average discount rate | | |
| Finance lease | | 8.86 | % |
| Lease facilities | | 10.23 | % |
| Lease equipment | | 11.90 | % |
| Lease plant | | 12.28 | % |
| Lease railcar | | 10.07 | % |
There are two plant leases that have multiple 5-year extension options for a total of 20 years, three plant leases with multiple 1-year extension options for a total of 20 years and eleven equipment leases with a 3-year extension option. These extension options have been included in the lease right-of-use asset and lease obligation.
The Company will reassess the lease terms and purchase options when there is a significant change in circumstances or when the Company elects to exercise an option that had previously been determined that it was not reasonably certain to do so.
NOTE 17. EQUITY
Common Stock
The total number of authorized shares of the Company’s common stock is 750 million shares, $0.001 par value per share. As of September 30, 2023 and December 31, 2022, there were 93,514,346 and 75,668,826, respectively, shares of common stock issued and outstanding.
Each share of the Company's common stock is entitled to equal dividends and distributions per share with respect to the common stock when, as and if declared by the Company's board of directors. No holder of any shares of the Company's common stock has a preemptive right to subscribe for any of the Company's securities, nor are any shares of the Company's common stock subject to redemption or convertible into other securities. Upon liquidation, dissolution or winding-up of the Company and after payment of creditors and preferred shareholders of the Company, if any, the assets of the Company will be divided pro rata on a share-for-share basis among the holders of the Company's common stock. Each share of the Company's common stock is entitled to one vote. Shares of the Company's common stock do not possess any cumulative voting rights.
During the nine months ended September 30, 2023, the Company issued 0.5 million shares of common stock in connection with the exercise of options, issued 0.1 million shares of restricted common stock in connection with compensation of board members, and issued 17.2 million shares of the Company's common stock in exchange for $79.9 million in Convertible Senior Notes.
During the nine months ended September 30, 2022, the Company issued 0.4 million shares of common stock in connection with the conversion of Series A Convertible Preferred Stock, pursuant to the terms of such securities; issued 1.1 million shares of the Company's common stock in exchange for warrants to purchase 1.5 million shares of the Company's common stock with an exercise price of $2.25 per share (discussed in greater detail below); and issued 10.2 million shares of the Company's common stock in conversion of $59.8 million in Convertible Senior Notes. In addition, the Company issued 0.6 million shares of common stock in connection with the exercise of options.
Warrant Exchange Agreement
On March 24, 2022, the Company entered into an Exchange Agreement with Tensile Capital Partners Master Fund LP ("Tensile"). Tensile exchanged outstanding warrants to purchase 1.5 million shares of the Company’s common stock with an exercise price of $2.25 per share and an expiration date of July 25, 2029, for 1.1 million shares of the Company’s common stock, effectively resulting in a net cashless exercise of the warrants (which were cancelled in connection with the transaction), with the value of such surrendered shares based on the 5 day trailing volume weighted average price of the Company’s common stock.
Conversion of Convertible Senior Notes
On May 26, 2022, May 27, 2022, May 31, 2022, and June 1, 2022, holders of $59.8 million of the Company’s 6.25% Convertible Senior Notes due 2027, converted such notes into 10.2 million shares of common stock of the Company pursuant to the terms of the Indenture.
Exchange of Convertible Senior Notes
On June 12, 2023, holders of $79.9 million of the Company’s 6.25% Convertible Senior Notes due 2027, exchanged such principal amount of notes for an aggregate of 17.2 million newly issued shares of common stock, pursuant to the terms of certain separate, privately negotiated exchange agreements. The Company also paid an aggregate of $1.0 million in cash to satisfy accrued and unpaid interest on the converted notes to the closing date of the exchanges.
NOTE 18. EARNINGS PER SHARE
The following is a reconciliation of the numerator and denominator for basic and diluted income (loss) per share for the three months and nine months ended September 30, 2023 and 2022 (in thousands, except per share amounts):
| | | | | | | | | | | | | | | | | | | | | | | | | | |
| | Three Months Ended September 30, | | Nine Months Ended September 30, |
| | 2023 | | 2022 | | 2023 | | 2022 |
| Basic income (loss) per Share | | | | | | | | |
| Numerator: | | | | | | | | |
| Net income (loss) attributable to shareholders from continuing operations | | $ | 19,843 | | | $ | 17,314 | | | $ | (61,375) | | | $ | (62,742) | |
| Net income attributable to shareholders from discontinued operations, net of tax | | — | | | 4,920 | | | 53,680 | | | 13,031 | |
| Net income (loss) attributable to common shareholders | | $ | 19,843 | | | $ | 22,234 | | | $ | (7,695) | | | $ | (49,711) | |
| Denominator: | | | | | | | | |
| Weighted-average common shares outstanding | | 93,381 | | | 75,591 | | | 82,928 | | | 69,007 | |
| Basic income (loss) per common shares | | | | | | | | |
| Continuing operations | | $ | 0.21 | | | $ | 0.23 | | | $ | (0.74) | | | $ | (0.91) | |
| Discontinued operations, net of tax | | — | | | 0.07 | | | 0.65 | | | 0.19 | |
| Basic income (loss) per share | | $ | 0.21 | | | $ | 0.30 | | | $ | (0.09) | | | $ | (0.72) | |
| | | | | | | | |
| Diluted Income (Loss) per Share | | | | | | | | |
| Numerator: | | | | | | | | |
| Net income (loss) attributable to shareholders from continuing operations | | $ | 19,843 | | | $ | 17,314 | | | $ | (61,375) | | | $ | (62,742) | |
| Fair value change on warrant derivative, net of tax | | (3,545) | | | (12,313) | | | — | | | — | |
| Interest expense on convertible notes, net of tax | | 384 | | | 4,247 | | | — | | | — | |
| Adjusted net income (loss) attributable to shareholders from continuing operations | | 16,682 | | | 9,248 | | | (61,375) | | | (62,742) | |
| Net income available to shareholders from discontinued operations, net of tax | | — | | | 4,920 | | | 53,680 | | | 13,031 | |
| Numerator for diluted income (loss) per common share | | $ | 16,682 | | | $ | 14,168 | | | $ | (7,695) | | | $ | (49,711) | |
| Denominator: | | | | | | | | |
| Weighted-average shares outstanding | | 93,381 | | | 75,591 | | | 82,928 | | | 69,007 | |
| Effect of dilutive securities | | | | | | | | |
| Stock options | | 1,623 | | | 2,527 | | | — | | | — | |
| Warrants | | 2,835 | | | 2,835 | | | — | | | — | |
| Convertible notes | | 2,588 | | | 16,173 | | | — | | | — | |
| Diluted weighted-average shares outstanding* | | 100,427 | | | 97,126 | | | 82,928 | | | 69,007 | |
| Diluted income (loss) per common shares | | | | | | | | |
| Diluted continuing operations | | $ | 0.17 | | | $ | 0.10 | | | $ | (0.74) | | | $ | (0.91) | |
| Diluted discontinued operations, net of tax | | — | | | 0.05 | | | 0.65 | | | 0.19 | |
| Diluted income (loss) per share | | $ | 0.17 | | | $ | 0.15 | | | $ | (0.09) | | | $ | (0.72) | |
|
The following table presents the potentially dilutive shares that were excluded from the computation of diluted net income (loss) per share of common stock attributable to common stockholders, because their effect was anti-dilutive (in thousands):
| | | | | | | | | | | | | | |
| | Nine Months Ended September 30, |
| | 2023 | | 2022 |
| Stock options | | 1,853 | | | 2,516 | |
| Warrants | | 2,835 | | | 2,835 | |
| Convertible notes | | 2,588 | | | 16,173 | |
| | 7,276 | | | 21,524 | |
NOTE 19. FAIR VALUE MEASUREMENTS
The following tables present assets and liabilities accounted for at fair value on a recurring basis as of September 30, 2023 and December 31, 2022 (in thousands):
| | | | | | | | | | | | | | | | | | | | | | | |
| September 30, 2023 |
| Level 1 | | Level 2 | | Level 3 | | Total |
| Derivative instruments, assets | | | | | | | |
| | | | | | | |
| Commodity | $ | 4,991 | | | $ | — | | | $ | — | | | $ | 4,991 | |
| Derivative instruments, assets | 4,991 | | | — | | | — | | | 4,991 | |
| Derivative instruments, liabilities | | | | | | | |
| | | | | | | |
| Derivative warrants | — | | | — | | | (9,234) | | | (9,234) | |
| Derivative instruments, liabilities | — | | | — | | | (9,234) | | | (9,234) | |
| Total | $ | 4,991 | | | $ | — | | | $ | (9,234) | | | $ | (4,243) | |
| | | | | | | |
| December 31, 2022 |
| Level 1 | | Level 2 | | Level 3 | | Total |
| | | | | | | |
| | | | | | | |
| | | | | | | |
| Derivative instruments, liabilities | | | | | | | |
| Commodity | $ | (242) | | | $ | — | | | $ | — | | | $ | (242) | |
| Derivative warrants | — | | | — | | | (14,270) | | | (14,270) | |
| Derivative instruments, liabilities | (242) | | | — | | | (14,270) | | | (14,512) | |
| Total | $ | (242) | | | $ | — | | | $ | (14,270) | | | $ | (14,512) | |
Level 3 instruments include the Initial Warrants and Additional Warrants granted in connection with the Loan and Security Agreement, see Note 15 "Financing Agreements". We revalued the 2.8 million warrants granted and outstanding at September 30, 2023 using the Dynamic Black-Scholes model that computes the impact of a possible change in control transaction upon the exercise of the warrant shares. The Dynamic Black-Scholes Merton unobservable inputs used were as follows:
| | | | | | | | | | | | | | |
| Dynamic Black-Scholes Merton Unobservable Inputs | | | | |
| | Initial Warrants | | Additional Warrants |
| Expected dividend rate | | — | % | | — | % |
| Expected volatility | | 114.56 | % | | 111.92 | % |
| Risk free interest rate | | 4.80 | % | | 4.70 | % |
| Expected term | | 3.5 | | 4.2 |
The following is an analysis of changes in the derivative liability classified as level 3 in the fair value hierarchy as of September 30, 2023 and December 31, 2022 (in thousands):
| | | | | | | | | | | | | | | |
| Level Three Roll-Forward | | | | | |
| | September 30, 2023 | | December 31, 2022 | |
| Balance at beginning of period | | $ | 14,270 | | | $ | 75,211 | | |
| Warrants granted | | — | | | 25,669 | | |
| | | | | |
| Equity component of the convertible senior note | | — | | | (78,789) | | |
| Change in valuation of warrants included in net income | | (5,036) | | | (7,821) | | |
| Balance at end of period | | $ | 9,234 | | | $ | 14,270 | | |
NOTE 20. COMMODITY DERIVATIVE INSTRUMENTS
The Company utilizes derivative instruments to manage its exposure to fluctuations in the underlying commodity prices of its inventory. The Company’s management sets and implements hedging policies, including volumes, types of instruments and counterparties, to support oil prices at targeted levels and manage its exposure to fluctuating prices.
The Company’s derivative instruments consist of option and futures arrangements for oil, gas and soybean oil. For option and futures arrangements, the Company receives the difference positive or negative between an agreed-upon strike price and the market price.
The mark-to-market effects of these contracts as of September 30, 2023 and December 31, 2022, are summarized in the following table. The notional amount is equal to the total net volumetric derivative position during the period indicated. The fair value of the crude oil futures agreements is based on the difference between the strike price and the New York Mercantile Exchange and Brent Complex futures price for the applicable trading months.
| | | | | | | | | | | | | | | | |
As of September 30, 2023 |
| Contract Type | Contract Period | Weighted Average Strike Price (Barrels) | | | Remaining Volume (Barrels) | Fair Value |
| | | | | (in thousands) | (in thousands) |
| Futures | Sept 2023 - Nov 2023 | $ | 38.15 | | | | 12 | | $ | 1 | |
| Futures | Sept 2023 - Dec 2023 | $ | 38.81 | | | | 38 | | $ | 27 | |
| Futures | Sept 2023 - Dec 2023 | $ | 25.31 | | | | 267 | | $ | 709 | |
| Swap | Sept 2023 - Nov 2023 | $ | 1.59 | | | | 9 | | $ | (14) | |
| Swap | Sept 2023 - Nov 2023 | $ | 6.76 | | | | 4 | | $ | 27 | |
| Swap | Sept 2023 - Nov 2023 | $ | 10.89 | | | | 480 | | $ | 544 | |
| Swap | Aug. 2023 - Oct. 2023 | $ | 12.17 | | | | 1,470 | | $ | 1,789 | |
| Swap | Sept 2023 - Nov 2023 | $ | 7.2 | | | | 1,470 | | $ | 1,058 | |
| Swap | Sept 2023 - Dec 2023 | $ | 5.78 | | | | 1,470 | | $ | 850 | |
| | | | | | |
| | | | | | | | | | | | | | | | |
| As of December 31, 2022 |
| Contract Type | Contract Period | Weighted Average Strike Price (Barrels) | | | Remaining Volume (Barrels) | Fair Value |
| | | | | (in thousands) | (in thousands) |
| Swap | Nov. 2022 - Feb. 2023 | $ | 4.19 | | | | 5 | | $ | (42) | |
| Swap | Nov. 2022 - Feb. 2023 | $ | 5.51 | | | | 3 | | $ | (27) | |
| Futures | Sept. 2022 - Dec. 2022 | $ | 32.14 | | | | 25 | | $ | 76 | |
| Futures | Sept. 2022 - Dec. 2022 | $ | 23.57 | | | | 35 | | $ | (92) | |
| Futures | Nov. 2022 - Feb. 2023 | $ | 33.71 | | | | 10 | | $ | (23) | |
| Futures | Sept. 2022 - Dec. 2022 | $ | 23.75 | | | | 10 | | $ | 30 | |
| Futures | Dec. 2022 - Mar. 2023 | $ | 36.08 | | | | 35 | | $ | (74) | |
| Futures | Dec. 2022 - Apr. 2023 | $ | 35.97 | | | | 1,000 | | $ | (1,100) | |
| Futures | Dec. 2022 - May. 2023 | $ | 35.81 | | | | 1,000 | | $ | (1,070) | |
| Futures | Dec. 2022 - Jun. 2023 | $ | 35.60 | | | | 1,000 | | $ | 2,080 | |
| | | | | | |
The carrying values of the Company’s derivatives positions and their locations on the consolidated balance sheets as of September 30, 2023 and December 31, 2022 are presented in the table below (in thousands):
| | | | | | | | | | | | | | |
| Balance Sheet Classification | Contract Type | September 30, 2023 | | December 31, 2022 |
| | | | |
| Crude oil futures | $ | — | | | $ | 2,186 | |
| | | | |
| Soybean oil futures | 709 | | | (69) | |
| Crude oil futures | 28 | | | (2,359) | |
| Gas swap | 557 | | | — | |
| Crude oil swap | 3,697 | | | — | |
| | | | |
| Derivative commodity asset(liability) | | $ | 4,991 | | | $ | (242) | |
For the three months ended September 30, 2023 and 2022, we recognized $1.9 million and $11.0 million of loss, respectively, on commodity derivative contracts on the consolidated statements of operations as part of our cost of revenues.
For the nine months ended September 30, 2023 and 2022, we recognized $0.2 million and $87.2 million of loss, respectively, on commodity derivative contracts on the consolidated statements of operations as part of our cost of revenues.
NOTE 21. INCOME TAXES
The Company recognized income tax expense of $12.2 million and $0 on continued operations for the three months ended September 30, 2023 and 2022, respectively. The Company recognized income tax benefit of $15.4 million and $0 on continued operations for the nine months ended September 30, 2023 and 2022, respectively. At the end of each interim period, the Company estimates the effective tax rate expected to be applicable for the full fiscal year and this rate is applied to the results for the year-to-date period, and then adjusted for any discrete period items. For the nine-month period ended September 30, 2023, the variance between the Company’s effective tax rate and the U.S. statutory rate of 21% is primarily attributable to state tax, non-deductible expenses and income attributable to non-controlling interest. For the same period in 2022, the variance was also due to a full valuation allowance.
The Company also recognized income tax expense of $0 million and $19.2 million on discontinued operations for the three and nine months ended September 30, 2023, respectively. Refer to “Note 23. Discontinued Operations” for more information. The Company believes it has enough net operating loss (NOL) carryforwards and previously disallowed interest expenses to fully offset current taxable income. As such, all of the tax expense for the period ended September 30, 2023 is being recorded as deferred, to offset the reduction of the NOLs and interest expense deferred tax assets (DTAs) being utilized.
NOTE 22. NON-CONTROLLING INTERESTS
Vertex Recovery Management LA, LLC
On May 25, 2016, Vertex Recovery Management, LLC, our wholly-owned subsidiary ("VRM") and Industrial Pipe, Inc. ("Industrial Pipe"), formed a joint venture Louisiana limited liability company, Vertex Recovery Management LA, LLC ("VRMLA"). VRM owns 51% and Industrial Pipe owns 49% of VRMLA. VRMLA is currently buying and preparing ferrous and non-ferrous scrap intended for large haul barge sales. We consolidated 100% of VRMLA's net income (loss) for the three and nine months ended September 30, 2023 and 2022, and then added the loss or deducted the net income, attributable to the non-controlling interest back to the Company's "Net income attributable to Vertex Energy, Inc." in the Consolidated Statement of Operations. The below table represents the net income (loss) of VRMLA for the three and nine months ended September 30, 2023 and 2022 (in thousands).
| | | | | | | | | | | | | | | | | | | | | | | | | | |
| | Three Months Ended September 30, | | Nine Months Ended September 30, |
| | 2023 | | 2022 | | 2023 | | 2022 |
| Net income (loss) consolidated | | $ | (633) | | | $ | (100) | | | $ | (842) | | | $ | 110 | |
| Income (loss) attributed to Non-controlling entity | | $ | (310) | | | $ | (49) | | | $ | (413) | | | $ | 54 | |
NOTE 23. DISCONTINUED OPERATIONS
On February 1, 2023, the Company sold all of its equity interests in Vertex OH, which owned our Heartland refinery located in Columbus, Ohio (the “Heartland Refinery”), for $87.3 million net cash settlement. The sale also included all property and assets owned by Vertex OH, including inventory associated with the Heartland Refinery, and all real and leased property and permits owned by Vertex OH, and all used motor oil collection and recycling assets and operations owned by Vertex OH. On June 9, 2023, the Company received $4.8 million as a net working capital adjustment settlement pursuant to the sale agreement.
Accordingly, the Company has presented this division (i.e., the Heartland Assets and Operations) as discontinued operations.
The following summarized financial information has been segregated from continuing operations and reported as discontinued operations for the three and nine months ended September 30, 2023, and 2022 (in thousands):
| | | | | | | | | | | | | | | | | | | | | | | |
| Three Months Ended September 30, | | Nine Months Ended September 30, |
| 2023 | | 2022 | | 2023 | | 2022 |
| Revenues | $ | — | | | $ | 22,859 | | | $ | 7,366 | | | $ | 65,618 | |
| Cost of revenues (exclusive of depreciation shown separately below) | — | | | 14,953 | | | 4,589 | | | 37,871 | |
| Depreciation and amortization attributable to costs of revenues | — | | | 394 | | | 124 | | | 1,176 | |
| Gross profit | — | | | 7,512 | | | 2,653 | | | 26,571 | |
| Operating expenses: | | | | | | | |
| Selling, general and administrative expenses (exclusive of depreciation shown separately below) | — | | | 2,534 | | | 632 | | | 6,472 | |
| Depreciation and amortization expense attributable to operating expenses | — | | | 63 | | | 21 | | | 188 | |
| Total operating expenses | — | | | 2,597 | | | 653 | | | 6,660 | |
| Income from operations | — | | | 4,915 | | | 2,000 | | | 19,911 | |
| Other income (expense) | | | | | | | |
| | | | | | | |
| | | | | | | |
| Interest expense | — | | | (10) | | | — | | | (33) | |
| Total other expense | — | | | (10) | | | — | | | (33) | |
| Income before income tax | — | | | 4,905 | | | 2,000 | | | 19,878 | |
| Income tax expense | — | | | — | | | (528) | | | — | |
Gain on sale of discontinued operations, net of $0 and $18,671 of tax for three and nine months ended September 30, 2023 | — | | | — | | | 52,208 | | | — | |
| Income from discontinued operations, net of tax | $ | — | | | $ | 4,905 | | | $ | 53,680 | | | $ | 19,878 | |
The assets and liabilities held for sale on the Consolidated Balance Sheets as of December 31, 2022 are as follows (in thousands):
| | | | | | | | |
| | | December 31, 2022 | |
| ASSETS | | | | |
| Accounts receivable, net | | | $ | 7,490 | | |
| Inventory | | | 1,674 | | |
| Prepaid expenses | | | 183 | | |
| Total current assets | | | 9,347 | | |
| | | | |
| Fixed assets, at cost | | | 19,746 | | |
| Less accumulated depreciation | | | (9,140) | | |
| Fixed assets, net | | | 10,606 | | |
| | | | |
| Operating lease right-of use assets | | | 44 | | |
| Intangible assets, net | | | 563 | | |
| Total noncurrent assets | | | 11,213 | | |
| | | | |
| | | | |
| Assets held for sale | | | $ | 20,560 | | |
| | | | |
| LIABILITIES AND EQUITY | | | | |
| Current liabilities | | | | |
| Accounts payable | | | $ | 2,750 | | |
| Accrued expenses | | | 629 | | |
| Operating lease liability | | | 45 | | |
| | | | |
| | | | |
| | | | |
| | | | |
| | | | |
| Liabilities held for sale | | | $ | 3,424 | | |
| | | | |
| | | | |
| | | | |
| | | | |
| | | | |
| | | | |
| | | | |
| | | | |
| | | | |
| | | | |
| | | | |
| | | | |
| | | | |
| | | | |
| | | | |
| | | | |
| | | | |
| | | | |
NOTE 24. RELATED PARTY TRANSACTIONS
Related Parties
From time to time, the Company consults Ruddy Gregory, PLLC., a related party law firm of which James Gregory, a former member of the Board of Directors and the General Counsel and Secretary of the Company, serves as a partner. During the three months ended September 30, 2023 and 2022, we paid $193 thousand and $98 thousand, respectively. During the nine months ended September 30, 2023 and 2022, we paid $572 thousand and $479 thousand, respectively, to such law firm for services rendered, which services include the drafting and negotiation of, and due diligence associated with, the September 2021 Asset Purchase Agreement whereby the Company originally planned to sell its UMO Business, which was subsequently terminated in January 2023, and agreement related to the Mobile Refinery acquisition, and related transactions, including the Loan and Security Agreement and Supply and Offtake Agreements.
NOTE 25. SUBSEQUENT EVENTS
None.
Item 2. Management’s Discussion and Analysis of Financial Condition and Results of Operations
Introduction
Our Management’s Discussion and Analysis of Financial Condition and Results of Operations (“MD&A”) is provided in addition to the accompanying unaudited consolidated financial statements and notes thereto on the basis of management’s assessment to assist readers in understanding our results of operations, financial condition, and cash flows. As such, it should be read in conjunction with the interim unaudited financial statements and the notes thereto included in this Quarterly Report on Form 10-Q, and the audited financial statements and notes thereto and “Part II”, “Item 7, Management’s Discussion and Analysis of Financial Condition and Results of Operations” contained in our Annual Report on Form 10-K for the year ended December 31, 2022, filed with the Securities and Exchange Commission on March 1, 2023 (the “Annual Report”). Unless the context requires otherwise, references to the “Company,” “we,” “us,” “our,” “Vertex”, “Vertex Energy” and “Vertex Energy, Inc.” refer specifically to Vertex Energy, Inc. and its consolidated subsidiaries. Certain capitalized terms used below and otherwise defined below, have the meanings given to such terms in the footnotes to our unaudited consolidated financial statements included above under “Part I – Financial Information” – “Item 1. Financial Statements”.
Our logo and some of our trademarks and tradenames are used in this Report. This Report also includes trademarks, tradenames and service marks that are the property of others. Solely for convenience, trademarks, tradenames and service marks referred to in this Report may appear without the ®, ™ and SM symbols. References to our trademarks, tradenames and service marks are not intended to indicate in any way that we will not assert to the fullest extent under applicable law our rights or the rights of the applicable licensors if any, nor that respective owners to other intellectual property rights will not assert, to the fullest extent under applicable law, their rights thereto. We do not intend the use or display of other companies’ trademarks and trade names to imply a relationship with, or endorsement or sponsorship of us by, any other companies.
In this Quarterly Report on Form 10-Q, we may rely on and refer to information regarding the refining, re-refining, used oil and oil and gas industries in general from market research reports, analyst reports and other publicly available information, none of which we have commissioned. Although we believe that this information is reliable, we cannot guarantee the accuracy and completeness of this information, we have not independently verified any of it, and we have not commissioned any such reports or information.
The majority of the numbers presented below are rounded numbers and should be considered as approximate.
Unless the context otherwise requires and for the purposes of this report only:
● “Exchange Act” refers to the Securities Exchange Act of 1934, as amended;
● “SEC” or the “Commission” refers to the United States Securities and Exchange Commission; and
● “Securities Act” refers to the Securities Act of 1933, as amended.
Where You Can Find Other Information
We file annual, quarterly, and current reports, proxy statements and other information with the Securities and Exchange Commission (“SEC”). Our SEC filings (reports, proxy and information statements, and other information) are available to the public over the Internet at the SEC’s website at www.sec.gov and are available for download, free of charge, soon after such reports are filed with or furnished to the SEC, on the “Investor Relations,” “SEC Filings” page of our website at www.vertexenergy.com. Information on our website is not part of this Report, and we do not desire to incorporate by reference such information herein. Copies of documents filed by us with the SEC are also available from us without charge, upon oral or written request to our Secretary, who can be contacted at the address and telephone number set forth on the cover page of this Report.
CAUTIONARY STATEMENT REGARDING FORWARD-LOOKING INFORMATION
This Quarterly Report on Form 10-Q (this “Report”) contains forward-looking statements within the meaning of the federal securities laws, including the Private Securities Litigation Reform Act of 1995, regarding future events and the future results of the Company that are based on current expectations, estimates, forecasts, and projections about the industry in which the Company operates and the beliefs and assumptions of the management of the Company. In some cases, you can identify
forward-looking statements by the following words: “anticipate,” “believe,” “continue,” “could,” “estimate,” “expect,” “intend,” “may,” “ongoing,” “plan,” “potential,” “predict,” “project,” “should,” or the negative of these terms or other comparable terminology, although not all forward-looking statements contain these words. Forward-looking statements are not a guarantee of future performance or results, and will not necessarily be accurate indications of the times at, or by, which such performance or results will be achieved. Forward-looking statements are based on information available at the time the statements are made and involve known and unknown risks, uncertainties and other factors that may cause our results, levels of activity, performance or achievements to be materially different from the information expressed or implied by the forward-looking statements in this Report. Factors that might cause or contribute to such differences include, but are not limited to, those discussed elsewhere in this Report, including under "Risk Factors", and in other reports the Company files with the Securities and Exchange Commission (“SEC” or the “Commission”), including the Company’s Annual Report on Form 10-K for the year ended December 31, 2022, as filed with the SEC on March 1, 2023 (under the heading "Risk Factors" and in other parts of that report), which factors include:
•our need for additional funding, the availability of, and terms of, such funding, our ability to pay amounts due on such indebtedness, covenants of such indebtedness and security interests in connection therewith;
•risks associated with our outstanding indebtedness, including our outstanding Convertible Senior Notes and term loan, including amounts owed, restrictive covenants and security interests in connection therewith, and our ability to repay such debts and amounts due thereon (including interest) when due, and mandatory and special redemption provisions thereof, and conversion rights associated therewith, including dilution caused thereby (in connection with the Convertible Senior Notes);
•security interests, guarantees and pledges associated with our outstanding Loan and Security Agreement and Supply and Offtake Agreements, and risks associated with such agreements in general;
•risks associated with Phase 2 of the capital project currently in process at our Mobile, Alabama refinery, including costs, timing, delays and unanticipated problems associated therewith;
•health, safety, security and environment risks;
•the level of competition in our industry and our ability to compete;
•our ability to respond to changes in our industry;
•the loss of key personnel or failure to attract, integrate and retain additional personnel;
•our ability to protect our intellectual property and not infringe on others’ intellectual property;
•our ability to scale our business;
•our ability to maintain supplier relationships and obtain adequate supplies of feedstocks;
•our ability to obtain and retain customers;
•our ability to produce our products at competitive rates;
•our ability to execute our business strategy in a very competitive environment;
•trends in, and the market for, the price of oil and gas and alternative energy sources;
•our ability to maintain our relationships with Macquarie Energy North America Trading Inc., and Shell;
•the impact of competitive services and products;
•our ability to complete and integrate future acquisitions;
•our ability to maintain insurance;
•pending and future litigation, potential adverse judgments and settlements in connection therewith, and resources expended in connection therewith;
•rules and regulations making our operations more costly or restrictive;
•changes in environmental and other laws and regulations and risks associated with such laws and regulations;
•economic downturns both in the United States and globally;
•risk of increased regulation of our operations and products;
•negative publicity and public opposition to our operations;
•disruptions in the infrastructure that we and our partners rely on;
•an inability to identify attractive acquisition opportunities and successfully negotiate acquisition terms;
•liabilities associated with acquired companies, assets or businesses;
•interruptions at our facilities;
•unexpected changes in our anticipated capital expenditures resulting from unforeseen required maintenance, repairs, or upgrades;
•our ability to acquire and construct new facilities;
•prohibitions on borrowing and other covenants of our debt facilities;
•our ability to effectively manage our growth;
•decreases in global demand for, and the price of, oil;
•repayment of and covenants in our future debt facilities;
•rising inflation, rising interest rates, the effects of war, and governmental responses thereto and possible recessions caused thereby;
•risks associated with our hedging activities, or our failure to hedge production;
•the volatility in the market price of compliance credits (primarily RINs needed to comply with the RFS) under Renewable and Low-Carbon Fuel Programs and emission credits needed under other environmental emissions programs, the requirement for us to purchase RINs in the secondary market to the extent we do not generate sufficient RINs internally, and the timing of such required purchases, if any;
•the lack of capital available on acceptable terms to finance our continued growth; and
•other risk factors included under “Risk Factors” in our latest Annual Report on Form 10-K and set forth below under “Risk Factors”. In addition, any statements that refer to projections of our future financial performance, our anticipated growth and trends in our businesses, and other characterizations of future events or circumstances are forward-looking statements.
You should read the matters described in, and incorporated by reference in, “Risk Factors” and the other cautionary statements made in this Report, and incorporated by reference herein, as being applicable to all related forward-looking statements wherever they appear in this Report. We cannot assure you that the forward-looking statements in this Report will prove to be accurate and therefore prospective investors are encouraged not to place undue reliance on forward-looking statements. All forward-looking statements included herein speak only as of the date of the filing of this Report. All subsequent written and oral forward-looking statements attributable to the Company, or persons acting on its behalf, are expressly qualified
in their entirety by the cautionary statements above. Other than as required by law, we undertake no obligation to update or revise these forward-looking statements, even though our situation may change in the future.
Overview and Business Activities
We are an energy transition company specializing in refining and marketing high-value conventional and lower-carbon alternative transportation fuels. We are engaged in operations across the petroleum value chain, including refining, collection, aggregation, transportation, storage and sales of aggregated feedstock and refined products to end-users. All of these products are commodities that are subject to various degrees of product quality and performance specifications.
We currently provide our collection services in six states, primarily in the Gulf Coast region of the United States. For the rolling twelve-month period ending September 30, 2023, we aggregated approximately 86.9 million gallons of used motor oil and other petroleum by-product feedstocks and managed the re-refining of approximately 80.4 million gallons of used motor oil with our proprietary vacuum gas oil (“VGO”) and Base Oil processes.
Heartland Assets and Operations Sale. On February 1, 2023, HPRM LLC, a Delaware limited liability company (“Heartland SPV”), which is indirectly wholly-owned by the Company, entered into and closed upon a Sale and Purchase Agreement with GFL Environmental Services USA, Inc. (“GFL” and the “Sale Agreement”), whereby Heartland SPV agreed to sell to GFL, and GFL agreed to purchase from Heartland SPV, all of Heartland SPV’s equity interest in Vertex Refining OH, LLC (“Vertex OH”), our former wholly-owned subsidiary, which owns the Heartland refinery located in Columbus, Ohio. Vertex Operating, LLC, our wholly-owned subsidiary (“Vertex Operating”) and GFL Environmental Inc., an affiliate of GFL, were also parties to the Sale Agreement, solely for the purpose of providing certain guarantees of the obligations of Heartland SPV and GFL as discussed in greater detail below. The sale also includes all property and assets owned by Vertex OH, including inventory associated with the Heartland Refinery, and all real and leased property and permits owned by Vertex OH, and all used motor oil collection and recycling assets and operations owned by Vertex OH. See “Note 23. Discontinued Operations” of our Condensed Notes to Consolidated Financial Statements, included under “Item I Financial Statements”. The purchase price for the transaction was $90 million, subject to certain customary adjustments for net working capital, taxes and assumed liabilities, which amounted to $4.8 million and was paid to the Company on June 9, 2023. We also entered into a transition services agreement, restrictive covenant agreement and, through our wholly-owned subsidiary, Vertex Refining LA, LLC (“Vertex LA”), a used motor oil supply agreement with GFL in connection with the sale.
Vertex Operating guaranteed all of the obligations of HPRM pursuant to the terms of the Sale Agreement and GFL Environmental guaranteed all of the obligations of GFL pursuant to the terms of the Sale Agreement. See “Note 23. Discontinued Operations” of our Condensed Notes to Consolidated Financial Statements, included under “Item I Financial Statements”. Mobile Refinery acquisition. Effective April 1, 2022, we completed the acquisition of a 75,000 bpd crude oil refinery located ten miles north of Mobile, in Saraland, Alabama (the “Mobile Refinery”) and related logistics assets, which include a deep-water draft, bulk loading terminal facility with 600,000 Bbls of storage capacity for crude oil and associated refined petroleum products located in Mobile, Alabama (the “Blakeley Island Terminal”). The terminal includes a dock for loading and unloading vessels with a pipeline tie-in, as well as the related logistics infrastructure of a high-capacity truck rack with 3-4 loading heads per truck, each rated at 600 gallons per minute (the “Mobile Truck Rack”). The Mobile Refinery currently processes light and sweet crude to produce different grades of gasoline, diesel fuel, jet fuel, and heavy olefin feed.
The Company paid a total of $75.0 million in consideration for the acquisition of the Mobile Refinery. In addition, we paid $16.4 million for previously agreed upon capital expenditures, miscellaneous prepaids and reimbursable items and an $8.7 million technology solution comprising the ecosystem required for the Company to run the Mobile Refinery after the acquisition. The Company also purchased certain crude oil and finished products inventories for $130.2 million owned by Shell at the Mobile Refinery.
As a result of the Mobile Refinery purchase, Vertex Refining and Shell Trading (US) Company (“STUSCO”) entered into a Crude Oil & Hydrocarbon Feedstock Supply Agreement (the “Crude Supply Agreement”) pursuant to which STUSCO agreed to sell to Vertex Refining, and Vertex Refining agreed to buy from STUSCO, all of the crude oil and hydrocarbon feedstock requirements of the Mobile Refinery, subject to certain exceptions set forth therein. The agreement provides that STUSCO is the exclusive supplier for the Mobile Refinery’s requirement for crude oil and hydrocarbon feedstock.
On May 27, 2023, the Mobile Refinery began processing soybean oil into renewable diesel (“RD”).
Additionally, as a result of the Mobile Refinery purchase, we entered into several agreements with Macquarie Energy North America Trading Inc (“Macquarie”). Under these agreements (together, the “Inventory Financing Agreement”), Macquarie agreed to finance the Mobile Refinery’s crude supply and inventories, and Vertex agreed to provide storage and terminalling services to Macquarie. At the time of the acquisition, Macquarie agreed to finance $124.3 million of the $130.2 million of opening inventories. See Note 3 “Mobile Refinery Acquisition” of our Condensed Notes to Consolidated Financial Statements, included under “Item I Financial Statements”. Myrtle Grove Facility Purchase. On April 1, 2022, the Company, through Vertex Splitter acquired the 15% noncontrolling interest of Vertex Refining Myrtle Grove LLC (“MG SPV”) held by Tensile-Myrtle Grove Acquisition Corporation (“Tensile-MG”), an affiliate of Tensile Capital Partners Master Fund LP, an investment fund based in San Francisco, California (“Tensile”) from Tensile-Vertex for $7.2 million, which was based on the value of the Class B Unit preference of MG SPV held by Tensile-MG, plus capital invested by Tensile-MG in MG SPV (which had not been returned as of the date of payment), plus cash and cash equivalents held by Tensile-MG as of the closing date. As a result, the Company acquired 100% of MG SPV, which in turn owns the Company’s Belle Chasse, Louisiana, re-refining complex.
Heartland Re-refining Complex. On May 26, 2022, the Company, through Vertex Splitter acquired the 65% noncontrolling interest of HPRM LLC, a Delaware limited liability company (“Heartland SPV”) held by Tensile-Heartland Acquisition Corporation, a Delaware corporation (“Tensile-Heartland”) from Tensile-Vertex Holdings LLC (“Tensile-Vertex”), an affiliate of Tensile for $43.5 million, which was based on the value of the Class B Unit preference of Heartland SPV held by Tensile-Heartland, plus capital invested by Tensile-Heartland in Heartland SPV (which had not been returned as of the date of payment), plus cash and cash equivalents held by Tensile-Heartland as of the closing date. As a result, the Company acquired 100% of Heartland SPV, which in turn owned the Company’s Columbus, Ohio, re-refining complex.
We operate two business segments: the Refining and Marketing segment and the Black Oil and Recovery segment. For further description of the business and products of our segments, see “Results of Operations”, below. Strategy and Plan of Operations
The principal elements of our strategy include:
Completion of Renewable Diesel (RD) Conversion Project. Beginning in the second quarter of 2022, we began a conversion project designed to modify the Mobile Refinery's hydrocracking unit to produce renewable diesel fuel on a standalone basis. The renewable diesel unit was commissioned on April 28, 2023, and on May 27, 2023, the Mobile Refinery began processing soybean oil into renewable diesel. The Company closed out Phase I of the RD project as of June 30, 2023, which was funded entirely through existing cash on-hand and cash flow from operations. Beginning in the second quarter of 2023, the Company has started on Phase II of the RD project.
Increase Renewable Diesel Production. The Mobile Refinery began production of RD in May 2023 and achieved the Phase I installed capacity target of 8,000 barrels per day as anticipated. In Phase II, we expect production volumes to ramp up to approximately 14,000 bpd by the mid-year of 2024. This project seeks to capitalize on the rapidly growing demand for advanced sustainable fuels, while further expanding upon our commitment to supply lower carbon fuels solutions.
Expand Feedstock Supply Volume. We intend to expand our feedstock supply volume by growing our collection and aggregation operations. We plan to seek to increase the volume of feedstock we collect directly by developing new relationships with generators and working to displace incumbent collectors; increasing the number of collection personnel, vehicles, equipment, and geographical areas we serve; and acquiring collectors in new or existing territories. We intend to seek to increase the volume of feedstock we aggregate from third-party collectors by expanding our existing relationships and developing new vendor relationships. We believe that our ability to acquire large feedstock volumes in the future will help to cultivate new vendor relationships because collectors often prefer to work with a single, reliable customer rather than manage multiple relationships and the uncertainty of excess inventory.
Broaden Existing Customer Relationships and Secure New Large Accounts. We hope to broaden our existing customer relationships by increasing sales of used motor oil and re-refined products to these accounts. In some cases, we may also seek to serve as our customers’ primary or exclusive supplier. We also believe that if we are able to increase our supply of feedstock and re-refined products, that we will be in a position to secure larger customer accounts that require a partner who can consistently deliver high volumes.
Re-Refine Higher Value End Products. We intend to develop, lease, or acquire technologies to re-refine our feedstock supply into higher-value end products. We believe that the expansion of our facilities and our technology, and investments in
additional technologies, will enable us to upgrade feedstock into end products, such as lubricating base oil, that command higher market prices than the current re-refined products we produce.
Pursue Selective Strategic Relationships or Acquisitions. We plan to grow market share by consolidating feedstock supply through partnering with, or acquiring, collection and aggregation assets. Such acquisitions and/or partnerships could increase our revenue and provide better control over the quality and quantity of feedstock available for resale and/or upgrading as well as providing additional locations. In addition, we intend to pursue further vertical integration opportunities by acquiring complementary processing technologies where we can realize synergies by leveraging our customer and vendor relationships, infrastructure, and personnel, and by eliminating duplicative overhead costs.
Results of Operations
We are engaged in operations across the petroleum value chain, including crude oil refining, collection, aggregation, transportation, storage, and sales of refined and re-refined products and aggregated feedstock. Our margins are a function of the difference between what we are able to pay for raw materials and the market prices for the range of products produced. The various petroleum products produced are typically a function of crude oil indices and are quoted on multiple exchanges such as the New York Mercantile Exchange (“NYMEX”). These prices are determined by a global market and can be influenced by many factors, including but not limited to supply/demand, weather, politics, tax incentives, and global/regional inventory levels. As such, we cannot provide any assurances regarding results of operations for any future periods, as numerous factors outside of our control affect the prices paid for raw materials and the prices (for the most part keyed to the NYMEX) that can be charged for such products. These factors include the supply of, and demand for, crude oil, and refined products, which in turn depend on changes in domestic and foreign economies; weather conditions; domestic and foreign political affairs; production levels; the marketing of competitive fuels; and government regulation. Additionally, for the near term, results of operations will be subject to further uncertainty, as the global markets and exchanges, including the NYMEX, continue to experience volatility.
During the third quarter of 2023, average refining margins expanded compared to the second quarter of 2023, more in line with the last three quarters of 2022, and the first quarter of 2023. Global prices for refined products, especially distillates, pulled back during the second quarter of 2023, as the economy slowed, more refineries came onstream, and exports from Russia were re-routed and replaced by fuel from the Middle East. During the twelve months ended September 30, 2023, the Consumer Price Energy Index in the United States decreased 0.5% impacting our gross margins. The Consumer Price All Items Index increased 3.7% for the same period, impacting our operating expenses and slowing economic growth.
The following table sets forth the high and low spot prices during the nine months ended September 30, 2023, for our key benchmarks.
| | | | | | | | | | | | | | | | | | | | | | | | | | |
| 2023 | | | | | | | | |
| Benchmark | | High | | Date | | Low | | Date |
Crackspread 2-1-1 (dollars per barrel) (1) | | $ | 44.50 | | | January 23 | | $ | 18.29 | | | April 28 |
| U.S. Gulfcoast No. 2 Waterborne (dollars per gallon) | | $ | 3.23 | | | January 23 | | $ | 1.97 | | | May 4 |
| U.S. Gulfcoast Unleaded 87 Waterborne (dollars per gallon) | | $ | 2.91 | | | August 11 | | $ | 2.26 | | | July 5 |
| U.S. Gulfcoast Residual Fuel No. 6 3% (dollars per barrel) | | $ | 84.62 | | | September 6 | | $ | 50.48 | | | January 4 |
| NYMEX Crude oil (dollars per barrel) | | $ | 93.68 | | | September 27 | | $ | 66.74 | | | March 17 |
| Reported in Platt’s US Marketscan (Gulf Coast) | | | | | | | | |
(1) The Gulf Coast 2-1-1 crack spread is calculated using two barrels of LLS (Louisiana Light Sweet crude oil) producing one barrel of USGC CBOB gasoline and one barrel of USGC ultra-low sulfur diesel. |
The following table sets forth the high and low spot prices during the nine months ended September 30, 2022, for our key benchmarks.
| | | | | | | | | | | | | | | | | | | | | | | | | | |
| 2022 | | | | | | | | |
| Benchmark | | High | | Date | | Low | | Date |
| Crackspread 2-1-1 (dollars per barrel) (1) | | $ | 56.47 | | | June 22 | | $ | 25.50 | | | August 8 |
| U.S. Gulfcoast No. 2 Waterborne (dollars per gallon) | | $ | 4.36 | | | March 8 | | $ | 2.15 | | | January 3 |
| U.S. Gulfcoast Unleaded 87 Waterborne (dollars per gallon) | | $ | 4.35 | | | June 3 | | $ | 2.26 | | | January 3 |
| U.S. Gulfcoast Residual Fuel No. 6 3% (dollars per barrel) | | $ | 112.93 | | | March 8 | | $ | 54.30 | | | September 30 |
| NYMEX Crude oil (dollars per barrel) | | $ | 123.70 | | | March 8 | | $ | 76.08 | | | January 3 |
| Reported in Platt’s US Marketscan (Gulf Coast) | | | | | | | | |
(1) The Gulf Coast 2-1-1 crack spread is calculated using two barrels of LLS (Louisiana Light Sweet crude oil) producing one barrel of USGC CBOB gasoline and one barrel of USGC ultra-low sulfur diesel. 2022 shows data beginning on April 1, 2022. |
The following charts sets forth the price indexes for our crude purchases and main finished products, (a) USGC ULSD – U.S. Gulf Coast Ultra-low sulfur diesel (ULSD), which is diesel fuel containing a maximum of 15 parts per million (ppm) of sulfur; (b) USGC CBOB – U.S. Gulf Coast Conventional Blendstock for Oxygenate Blending, which means conventional
gasoline blendstock intended for blending with oxygenates downstream of the refinery where it was produced; and (c) Jet fuel produced at our Mobile Refinery, during the nine months ended September 30, 2023:
Source: Argus Media, daily benchmarking price
The following charts sets forth the price indexes for our renewable fuel feedstock purchases and main finished products, (a) RBD Soybean Oil per million (ppm) of sulfur; (b) NYMEX Heating Oil; and (c) D4 RIN, at our Renewable Diesel unit, during the nine months ended September 30, 2023:
Source: Argus Media, daily benchmarking price
Our production and sales of lower value products such as naphtha, VGO, LPGs and sulfur also impact our results of operations, especially when crude prices are high. Our results of operations are also significantly affected by our direct operating expenses, especially our labor costs. Safety, reliability and the environmental performance of our refineries’ operations are critical to our financial performance.
We operate two business segments: the Refining and Marketing segment and the Black Oil and Recovery segment. The table below shows our product categories by segment. For a further description of individual products, please refer to the Glossary of terms at the beginning of this document.
| | | | | | | | | |
| Refining and Marketing(1) | Black Oil and Recovery (2) | |
Gasolines | X | | |
Jet Fuel | X | | |
Distillates | X | | |
| Renewable oil | X | | |
Base oil | | X | |
VGO/Marine fuel | X | X | |
Other refined products (3) | X | X | |
Pygas | X | | |
Metals (4) | | X | |
Other re-refined products (5) | X | X | |
Terminalling | X | | |
Oil collection services | | X | |
| | | |
(1) The Refining and Marketing segment consists primarily of the sale of refined hydrocarbon products such as gasoline, distillates, jet fuel, and intermediates refined at the Mobile Refinery and pygas; and industrial fuels, which are produced at a third-party facility (Monument Chemical). During the second quarter of 2023, the Mobile Refinery began processing soybean oil into renewable diesel.
(2) The Black Oil segment continued operations consist primarily of the sale of (a) other re-refinery products, recovered products, and used motor oil; (b) specialty blending and packaging of lubricants, (c) transportation revenues; and (d) the sale of VGO (vacuum gas oil)/marine fuel; (e) petroleum products which include base oil and industrial fuels—which consist of used motor oils, cutterstock and fuel oil generated by our facilities; (f) oil collection services—which consist of used oil sales, burner fuel sales, antifreeze sales and service charges; (g) the sale of other re-refinery products including asphalt, condensate, recovered products, and used motor oil; (h) sale of ferrous and non-ferrous recyclable Metal(s) products that are recovered from manufacturing and consumption; and (i) revenues generated from trading/marketing of Group III Base Oils. On February 1, 2023, the Company sold its Heartland Assets and Operations (which formed a part of the Black Oil segment), and as such, has determined to present only the Company’s Heartland Assets and Operations as discontinued operations.
(3) Other refinery products include the sales of renewable diesel, base oil, cutterstock and hydrotreated VGO, naphtha, LPGs, sulfur and vacuum tower bottoms (VTB).
(4) Metals consist of recoverable ferrous and non-ferrous recyclable metals from manufacturing and consumption. Scrap metal can be recovered from pipes, barges, boats, building supplies, surplus equipment, tanks, and other items consisting of metal composition. These materials are segregated, processed, cut-up and sent back to a steel mill for re-purposing.
(5) Other re-refinery products include the sales of asphalt, condensate, recovered products, and other petroleum products.
Results of Operations
The following discussion includes comments and analysis relating to our results of operations. This discussion should be read in conjunction with “Item 1. Financial Statements” and is intended to provide investors with a reasonable basis for assessing our historical operations, however, it should not serve as the only criteria for predicting our future performance. Consolidated Results of Operations
Set forth below are our results of operations for the three and nine months ended September 30, 2023, as compared to the same periods in 2022 (in thousands):
| | | | | | | | | | | | | | | | | | | | | | | | | | | | | | | | | | | |
| Three Months Ended September 30, | | Nine Months Ended September 30, |
| 2023 | | 2022 | | Variance | | 2023 | | 2022 | | Variance |
| Revenues | $ | 1,018,407 | | | $ | 809,529 | | | $ | 208,878 | | | $ | 2,444,442 | | | $ | 1,913,435 | | | $ | 531,007 | |
| Cost of revenues (exclusive of depreciation and amortization shown separately below) | 925,542 | | | 749,654 | | | 175,888 | | | 2,274,543 | | | 1,817,787 | | | 456,756 | |
| Depreciation and amortization attributable to costs of revenues | 7,896 | | | 4,049 | | | 3,847 | | | 18,863 | | | 9,139 | | | 9,724 | |
| Gross profit | 84,969 | | | 55,826 | | | 29,143 | | | 151,036 | | | 86,509 | | | 64,527 | |
| | | | | | | | | | | |
| | | | | | | | | | | |
| | | | | | | | | | | |
| Operating expenses: | | | | | | | | | | | |
| Selling, general and administrative expenses | 43,137 | | | 37,142 | | | 5,995 | | | 127,715 | | | 90,039 | | | 37,676 | |
| Depreciation and amortization attributable to operating expenses | 1,033 | | | 1,119 | | | (86) | | | 3,077 | | | 2,655 | | | 422 | |
| | | | | | | | | | | |
| Total operating expenses | 44,170 | | | 38,261 | | | 5,909 | | | 130,792 | | | 92,694 | | | 38,098 | |
| | | | | | | | | | | |
| | | | | | | | | | | |
| Income (loss) from operations | 40,799 | | | 17,565 | | | 23,234 | | | 20,244 | | | (6,185) | | | 26,429 | |
| | | | | | | | | | | |
| Other income (expense): | | | | | | | | | | | |
| | | | | | | | | | | |
| | | | | | | | | | | |
| | | | | | | | | | | |
| Other income (loss) | (133) | | | 416 | | | (549) | | | 1,023 | | | 1,059 | | | (36) | |
| | | | | | | | | | | |
| Gain on change in value of derivative warrant liability | 4,621 | | | 12,312 | | | (7,691) | | | 5,036 | | | 7,788 | | | (2,752) | |
| | | | | | | | | | | |
| Interest expense | (13,523) | | | (13,028) | | | (495) | | | (103,536) | | | (64,961) | | | (38,575) | |
| Total other expense | (9,035) | | | (300) | | | (8,735) | | | (97,477) | | | (56,114) | | | (41,363) | |
| | | | | | | | | | | |
| Income (loss) from continuing operation before income tax | 31,764 | | | 17,265 | | | 14,499 | | | (77,233) | | | (62,299) | | | (14,934) | |
| | | | | | | | | | | |
| Income tax benefit (expense) | (12,231) | | | — | | | (12,231) | | | 15,445 | | | — | | | 15,445 | |
| | | | | | | | | | | |
| Income (loss) from continuing operations | 19,533 | | | 17,265 | | | 2,268 | | | (61,788) | | | (62,299) | | | 511 | |
| Income from discontinued operations, net of tax | — | | | 4,905 | | | (4,905) | | | 53,680 | | | 19,878 | | | 33,802 | |
| Net income (loss) | 19,533 | | | 22,170 | | | (2,637) | | | (8,108) | | | (42,421) | | | 34,313 | |
| Net income (loss) attributable to non-controlling interest and redeemable non-controlling interest from continuing operations | (310) | | | (49) | | | (261) | | | (413) | | | 15 | | | (428) | |
| Net income (loss) attributable to non-controlling interest and redeemable non-controlling from discontinued operations | — | | | (15) | | | 15 | | | — | | | 6,847 | | | (6,847) | |
| Net income (loss) attributable to Vertex Energy, Inc. | $ | 19,843 | | | $ | 22,234 | | | $ | (2,391) | | | $ | (7,695) | | | $ | (49,283) | | | $ | 41,588 | |
| | | | | | | | | | | |
| | | | | | | | | | | |
| | | | | | | | | | | |
Our revenues and cost of revenues are significantly impacted by the Mobile Refinery, which was acquired on April 1, 2022, the RD unit, which began commercial production of RD in May 2023, and fluctuations in commodity prices. Increases (decreases) in commodity prices typically result in increases (decreases) in revenue and cost of revenues (i.e., feedstock costs). Additionally, from time to time, we have used hedging instruments to manage our exposure to underlying commodity prices.
Third Quarter 2023 Compared to Third Quarter 2022 Discussion
During the three months ended September 30, 2023, compared to the same period in 2022, we saw a 14% increase in the volume of products we manage through our facilities, driven by the increased production rates due to the operation of the RD unit at our Mobile Refinery. We also saw an increase in operating costs (inclusive of depreciation and amortization) on a per barrel basis for the third quarter of 2023 as compared to the same period in 2022 due to increases in prices of direct materials and indirect costs. Management of operating costs is critical to our ability to remain competitive in the marketplace, we continue to experience inflationary pressures across numerous cost categories. The key areas of impact are around transportation, labor, as well as fuel and energy related expenses.
During the three months ended September 30, 2023, total revenues increased approximately $208.9 million compared to the same period in 2022, which was the result of the operation of the Renewable Diesel unit (which RD commercial production only began in May 2023), and increased finished product prices; of which the highs and lows are disclosed in the charts above.
During the three months ended September 30, 2023, total cost of revenues (exclusive of depreciation and amortization) increased approximately $175.9 million, which was mainly the result of the operation of the Renewable Diesel unit (which only began operating in April 2023), compared to the same period ended September 30, 2022. Our cost of revenues is a function of the ultimate price we pay to acquire feedstocks, principally crude oil and after May 2023, soybean oil for our Renewable Diesel unit, inventory financing costs, and RD volume obligation expenses.
For the three months ended September 30, 2023, total depreciation and amortization expense attributable to cost of revenues increased $3.8 million, compared to the three months ended September 30, 2022, and the increase is due to the Renewable Diesel unit, which was placed in service in April 2023.
Total operating expenses (excluding depreciation and amortization) increased approximately $6.0 million for the three months ended September 30, 2023, compared to the same prior year’s period, the increase is caused by the operation of the Renewable Diesel unit (which only began operating in April 2023).
Additionally, our per barrel margin increased 33% for the three months ended September 30, 2023, relative to the three months ended September 30, 2022. Our per barrel margin is calculated by dividing the total volume of product sold (in bbls) by total gross profit for the applicable period (an $85.0 million gross profit for the quarter ended September 30, 2023, versus a $55.8 million gross profit for the quarter ended September 30, 2022). This increase was largely a result of the inflation of fuel prices being higher than crude oil during the three months ended September 30, 2023, as well as improvement in product spreads and volumes compared to the same period during 2022.
The Gulf Coast 2-1-1 crack spread averaged $31.81 per barrel during the three months ended September 30, 2023. We use crack spreads as a performance benchmark for our Mobile refining gross margin and as a comparison with other industry participants. The Gulf Coast 2-1-1 crack spread is calculated using two barrels of LLS (Louisiana Light Sweet crude oil) producing one barrel of USGC CBOB gasoline and one barrel of USGC ultra-low sulfur diesel.
We had interest expense of $13.5 million for the three months ended September 30, 2023, compared to interest expense of $13.0 million for the three months ended September 30, 2022, an increase of $0.5 million. This increase was due to the inventory financing of the Renewable Diesel unit, which began commercial production of RD in May 2023, as well as the increased interest rate of Term Loan, which varies period-to-period, based on the Prime Rate.
We had an approximately $4.6 million gain on change in value of derivative liability for the three months ended September 30, 2023, in connection with the warrants granted in connection with the Term Loan issued on April 1, 2022 (warrants to purchase 2.75 million shares) and May 26, 2022 (warrants to purchase 0.25 million shares), compared to a gain of $12.3 million in the prior year’s period. This change was mainly due to the fluctuation in the market price of our common stock (and more specifically the decrease in the market price of our common stock during the current period, compared to the prior period), warrant exchanges, and non-cash accounting adjustments in connection therewith.
We had net income from continuing operations of approximately $19.5 million for the three months ended September 30, 2023, compared to net income from continuing operations of $17.3 million for the three months ended September 30, 2022, an increase in net income from continuing operations of $2.3 million. The main reason for the increase in net income from continuing operations for the three months ended September 30, 2023, compared to the three months ended September 30, 2022, was attributable to increased margins due to higher crackspreads in the refined products we sell.
Year To Date 2023 Compared to Year To Date 2022 Discussion
Comparability of consolidated results of operations between the nine months ended September 30, 2023 and 2022, are affected by the operations of the Mobile Refinery, which we owned for only six of the nine months ended September 30, 2022, and the RD unit, which started operation in May 2023. See Refining and Marketing segment tables that segregate the impact of the Mobile Refinery for this period.
During the nine months ended September 30, 2023, compared to the same period in 2022, we saw a 36% increase in the volume of products we manage through our facilities (mainly as a result of the Mobile Refinery acquisition and increased volumes processed through such facility). In addition, we saw an increase in operating costs (inclusive of depreciation and amortization) on a per barrel basis for the first nine months of 2023 as compared to the same period in 2022, due to the increased price of direct material and indirect costs, as well as the addition of the Mobile Refinery during the second quarter of 2022. Management of operating costs is critical to our ability to remain competitive in the marketplace, we continue to experience inflationary pressures across numerous cost categories. The key areas of impact are around transportation and labor, as well as fuel and energy related expenses.
During the nine months ended September 30, 2023, total revenues increased approximately $531.0 million compared to the same period in 2022, which was mainly due to the operation from the Mobile Refinery for only six months in the 2022 period.
During the nine months ended September 30, 2023, total cost of revenues (exclusive of depreciation and amortization) increased approximately $456.8 million, mainly due to the operation of the Mobile Refinery for only six months in 2022. Our cost of revenues is a function of the ultimate price we are required to pay to acquire feedstocks, principally crude oil and after May 2023, soybean oil for our Renewable diesel unit, inventory financing costs, and other maintenance as well as logistics costs at our facilities.
For the nine months ended September 30, 2023, total depreciation and amortization expense attributable to cost of revenues was $18.9 million, compared to $9.1 million for the nine months ended September 30, 2022, an increase of $9.7 million, mainly due to Mobile Refinery assets and additional investments in rolling stock and facility assets acquired during 2022, and the depreciation of the RD project which began commercial production of RD in May 2023.
Total operating expenses (excluding depreciation and amortization) increased approximately $37.7 million for the nine months ended September 30, 2023, compared to the same prior year’s period, of which $24.7 million was associated with the Q1 operation of Mobile Refinery in 2023 and $18.5 million was associated with the operation of the Renewable Diesel unit in 2023, offset by the acquisition cost related to the Mobile Refinery in 2022.
Additionally, our per barrel margin increased 28% for the nine months ended September 30, 2023, relative to the nine months ended September 30, 2022. Our per barrel margin is calculated by dividing the total volume of product sold (in bbls) by total gross profit for the applicable period ($151.0 million for the period ended September 30, 2023, versus $86.5 million for the period ended September 30, 2022). This increase was largely a result of the operation of the Mobile Refinery during the a full nine months in 2023, compared to only six months in 2022, as the Mobile Refinery was acquired on April 1, 2022.
The Gulf Coast 2-1-1 crack spread averaged $29.00 per barrel during the nine months ended September 30, 2023. We use crack spreads as a performance benchmark for our Mobile refining gross margin and as a comparison with other industry participants. The Gulf Coast 2-1-1 crack spread is calculated using two barrels of LLS (Louisiana Light Sweet crude oil) producing one barrel of USGC CBOB gasoline and one barrel of USGC ultra-low sulfur diesel.
Overall, commodity prices were lower for the nine months ended September 30, 2023, compared to the same period in 2022. For example, the average posting (U.S. Gulfcoast Residual Fuel No. 6 3%) for the nine months ended September 30, 2023, decreased 22% per barrel from a nine-month average of $84.73 for the nine months ended September 30, 2022, to $66.06 per barrel for the nine months ended September 30, 2023. The average posting (U.S. Gulfcoast Unleaded 87 Waterborne) for the nine months ended September 30, 2023, decreased $22.95 per barrel from a nine-month average of $130.88 for the nine months ended September 30, 2022 to $107.93 per barrel for the nine months ended September 30, 2023.
We had interest expense of $103.5 million for the nine months ended September 30, 2023, compared to interest expense of $65.0 million for the nine months ended September 30, 2022, an increase of $38.5 million. This increase was mainly due to the accretion of deferred loan costs and inducement value associated with the exchange of Convertible Senior Notes on June 12, 2023.
We had an approximately $5.0 million gain on change in value of warrant derivative liability for the nine months ended September 30, 2023, in connection with the warrants granted in connection with the Term Loan issued on April 1, 2022 (warrants to purchase 2.75 million shares, of which warrants to purchase 2.58 million shares remain outstanding) and May 26, 2022 (warrants to purchase 0.25 million shares), compared to a gain on change in the value of our warrant derivative liability of $7.8 million in the prior year’s period. This change was mainly due to the fluctuation in the market price of our common stock (and more specifically the increase in the market price of our common stock during the current period, compared to the prior period), warrant exchanges, and non-cash accounting adjustments in connection therewith.
We had a net loss from continuing operations of approximately $61.8 million for the nine months ended September 30, 2023, compared to a net loss from continuing operations of $62.3 million for the nine months ended September 30, 2022, a decrease in net loss from continuing operations of $0.5 million. The main reason for the decrease in net loss from continuing operations for the nine months ended September 30, 2023, compared to the nine months ended September 30, 2022, was attributable to the loss from the Renewable Diesel unit operation and low commodity prices for the nine months ended September 30, 2023, and offset by the $15.4 million tax benefit.
Refining and Marketing Segment
Since April 1, 2022, the Refining and Marketing segment has generated most of its revenues from the sales of petroleum refined products processed at the Mobile Refinery. The Mobile Refinery processes crude oils into refined finished products which include gasolines, distillates including jet fuel, LPGs, and other residual fuels such as VTBs, VGO, olefins, reformate and sulfur. On May 27, 2023, the Mobile Refinery began processing soybean oil into RD. We market these finished products across the southeastern United States through a high-capacity truck rack, together with deep and shallow water distribution points capable of supplying waterborne vessels. Most of the Mobile Refinery production is sold to Macquarie Energy North America Trading Inc (“Macquarie”), under the Inventory Financing Agreement. See “Note 10. Inventory Financing Agreement” of our Notes to Consolidated Financial Statements, included under “Item 1 Financial Statements”. The Refining and Marketing segment also includes revenues from gathering hydrocarbon streams in the form of petroleum distillates, transmix and other chemical products that have become off-specification during the transportation or refining process. These feedstock streams are purchased from pipeline operators, refineries, chemical processing facilities and third-party providers, and then processed at a third-party facility under our direction. The end products are typically three distillate petroleum streams (gasoline blendstock, pygas and fuel oil cutterstock), which are sold to major oil companies or to large petroleum trading and blending companies. The end products are delivered by barge and truck to customers. Additionally, this segment includes the wholesale distribution of gasoline, blended gasoline, and diesel for use as engine fuel to operate automobiles, trucks, locomotives, and construction equipment.
Results from operations from the Mobile Refinery have substantially changed our overall revenue, cost of revenue, net income, and earnings before interest, taxes, depreciation, and amortization. During the three months ended September 30, 2023, the Mobile Refinery generated 96% of our total consolidated revenue. Set forth below are our results of operations and certain key performance indicators disaggregated to show the Mobile Refinery on a stand-alone basis to facilitate comparability between periods (in thousands, except key performance indicators):
| | | | | | | | | | | | | | | | | | | | | | | | | | | | | | | | |
| | Three Months Ended September 30, 2023 |
| Refining and Marketing Segment (in thousands) | | Conventional | | Renewable | | Mobile Refinery Total | | Legacy Refining and Marketing | | Total Refining and Marketing |
| Revenues | | $ | 795,608 | | | $ | 142,719 | | | $ | 938,327 | | | $ | 40,385 | | | $ | 978,712 | |
| Cost of revenues (exclusive of variable production costs and depreciation and amortization shown separately below) | | 679,594 | | | 134,956 | | | 814,550 | | | 39,257 | | | 853,807 | |
| Variable production costs attributable to costs of revenues | | 26,847 | | | 12,958 | | | 39,805 | | | — | | | 39,805 | |
| Depreciation and amortization attributable to costs of revenues | | 2,982 | | | 3,320 | | | 6,302 | | | 225 | | | 6,527 | |
| Gross profit (loss) | | 86,185 | | | (8,515) | | | 77,670 | | | 903 | | | 78,573 | |
| Operating expenses | | | | | | | | | | |
| Selling general and administrative expense | | 17,720 | | | 11,445 | | | 29,165 | | | 2,320 | | | 31,485 | |
| Depreciation and amortization attributable to operating expenses | | 736 | | | 21 | | | 757 | | | 72 | | | 829 | |
| Total operating expenses | | 18,456 | | | 11,466 | | | 29,922 | | | 2,392 | | | 32,314 | |
| Income (loss) from operations | | 67,729 | | | (19,981) | | | 47,748 | | | (1,489) | | | 46,259 | |
| Other expenses | | | | | | | | | | |
| | | | | | | | | | |
| | | | | | | | | | |
| Interest expense | | (2,568) | | | (1,826) | | | (4,394) | | | — | | | (4,394) | |
| Net income (loss) | | $ | 65,161 | | | $ | (21,807) | | | $ | 43,354 | | | $ | (1,489) | | | $ | 41,865 | |
| Refining adjusted EBITDA * | | $ | 80,052 | | | $ | (24,113) | | | $ | 55,939 | | | $ | (1,232) | | | $ | 54,707 | |
| Key performance indicators: | | | | | | | | | | |
| Fuel Gross Margin * | | $ | 129,499 | | | $ | 2,372 | | | $ | 131,871 | | | n/a | | n/a |
| Adjusted Gross Margin* | | $ | 94,790 | | | $ | (15,988) | | | $ | 78,802 | | | n/a | | n/a |
Fuel Gross Margin Per Barrel of Throughput (1)* | | $ | 17.56 | | | $ | 4.78 | | | $ | 16.75 | | | n/a | | n/a |
Adjusted Gross Margin Per Barrel of Throughput (1)* | | $ | 12.85 | | | $ | (32.20) | | | $ | 10.01 | | | n/a | | n/a |
USGC 2-1-1 Crack Spread Per Barrel (2) | | $ | 31.81 | | | n/a | | n/a | | n/a | | n/a |
Variable Production Costs Per Barrel of Throughput (3) | | $ | 3.64 | | | $ | 26.10 | | | $ | 5.06 | | | n/a | | n/a |
Operating Expenses Per Barrel of Throughput (4) | | $ | 2.40 | | | $ | 23.05 | | | $ | 3.70 | | | n/a | | n/a |
| | | | | | | | | | | | | | | | | | | | | |
| |
| Three Months Ended September 30, 2022 |
| Refining and Marketing Segment (in thousands) | Mobile Refinery | | | | | | Legacy Refining and Marketing | | Total Refining and Marketing |
| Revenues | $ | 733,521 | | | | | | | $ | 33,247 | | | $ | 766,768 | |
| Cost of revenues (exclusive of variable production costs and depreciation and amortization shown separately below) | 659,295 | | | | | | | 33,483 | | | 692,778 | |
| Variable production costs attributable to costs of revenues | 22,198 | | | | | | | — | | | 22,198 | |
| Depreciation and amortization attributable to costs of revenues | 2,957 | | | | | | | 154 | | | 3,111 | |
| Gross profit (loss) | 49,071 | | | | | | | (390) | | | 48,681 | |
| Operating expenses | | | | | | | | | |
| Selling general and administrative expense | 26,522 | | | | | | | 1,747 | | | 28,269 | |
| Depreciation and amortization attributable to operating expenses | 736 | | | | | | | 114 | | | 850 | |
| Total operating expenses | 27,258 | | | | | | | 1,861 | | | 29,119 | |
| Income (loss) from operations | 21,813 | | | | | | | (2,251) | | | 19,562 | |
| Other expenses | | | | | | | | | |
| | | | | | | | | |
| | | | | | | | | |
| Interest expense | (3,444) | | | | | | | — | | | (3,444) | |
| Net income (loss) | $ | 18,369 | | | | | | | $ | (2,251) | | | $ | 16,118 | |
| Refining adjusted EBITDA * | $ | (18,881) | | | | | | | $ | (1,887) | | | $ | (20,768) | |
| Key performance indicators: | | | | | | | | | |
| Fuel Gross Margin * | $ | 92,878 | | | | | | | n/a | | n/a |
| Adjusted Gross Margin* | $ | 1,796 | | | | | | | n/a | | n/a |
Fuel Gross Margin Per Barrel of Throughput (1)* | $ | 14.86 | | | | | | | n/a | | n/a |
Adjusted Gross Margin Per Barrel of Throughput (1)* | $ | 0.29 | | | | | | | n/a | | n/a |
USGC 2-1-1 Crack Spread Per Barrel (2) | $ | 34.82 | | | | | | | n/a | | n/a |
Variable Production Costs Per Barrel of Throughput (3) | $ | 3.46 | | | | | | | n/a | | n/a |
Operating Expenses Per Barrel of Throughput (4) | $ | 4.24 | | | | | | | n/a | | n/a |
| | | | | | | | | | | | | | | | | | | | | | | | | | | | | |
| Nine Months Ended September 30, 2023 |
| Refining and Marketing Segment (in thousands) | Conventional | | Renewable | | Mobile Refinery Total | | Legacy Refining and Marketing | | Total Refining and Marketing |
| Revenues | $ | 2,056,410 | | | $ | 198,212 | | | $ | 2,254,622 | | | $ | 94,837 | | | $ | 2,349,459 | |
| Cost of revenues (exclusive of variable production costs and depreciation and amortization shown separately below) | 1,811,950 | | | 201,360 | | | 2,013,310 | | | 91,252 | | | 2,104,562 | |
| Variable production costs attributable to costs of revenues | 76,785 | | | 13,035 | | | 89,820 | | | — | | | 89,820 | |
| Depreciation and amortization attributable to costs of revenues | 9,477 | | | 5,338 | | | 14,815 | | | 574 | | | 15,389 | |
| Gross profit (loss) | 158,198 | | | (21,521) | | | 136,677 | | | 3,011 | | | 139,688 | |
| Operating expenses | | | | | | | | | |
| Selling general and administrative expense | 65,700 | | | 18,521 | | | 84,221 | | | 6,719 | | | 90,940 | |
| Depreciation and amortization attributable to operating expenses | 2,208 | | | 35 | | | 2,243 | | | 216 | | | 2,459 | |
| Total operating expenses | 67,908 | | | 18,556 | | | 86,464 | | | 6,935 | | | 93,399 | |
| Income (loss) from operations | 90,290 | | | (40,077) | | | 50,213 | | | (3,924) | | | 46,289 | |
| Other expenses | | | | | | | | | |
| | | | | | | | | |
| | | | | | | | | |
| Interest expense | (10,604) | | | (2,195) | | | (12,799) | | | — | | | (12,799) | |
| Net income (loss) | $ | 79,686 | | | $ | (42,272) | | | $ | 37,414 | | | $ | (3,924) | | | $ | 33,490 | |
| Refining adjusted EBITDA * | $ | 105,081 | | | $ | (35,519) | | | $ | 69,562 | | | $ | (3,216) | | | $ | 66,346 | |
| Key performance indicators: | | | | | | | | | |
| Fuel Gross Margin * | $ | 289,047 | | | $ | (725) | | | $ | 288,322 | | | n/a | | n/a |
| Adjusted Gross Margin* | $ | 161,304 | | | $ | (22,336) | | | $ | 138,968 | | | n/a | | n/a |
Fuel Gross Margin Per Barrel of Throughput (1)* | $ | 13.94 | | | $ | (1.00) | | | $ | 13.21 | | | n/a | | n/a |
Adjusted Gross Margin Per Barrel of Throughput (1)* | $ | 7.78 | | | $ | (30.88) | | | $ | 6.37 | | | n/a | | n/a |
USGC 2-1-1 Crack Spread Per Barrel (2) | $ | 29.00 | | | n/a | | n/a | | n/a | | n/a |
Variable Production Costs Per Barrel of Throughput (3) | $ | 3.70 | | | $ | 18.02 | | | $ | 4.12 | | | n/a | | n/a |
Operating Expenses Per Barrel of Throughput (4) | $ | 3.17 | | | $ | 25.61 | | | $ | 3.86 | | | n/a | | n/a |
| | | | | | | | | | | | | | | | | | | | | |
| Nine Months Ended September 30, 2022 |
| Refining and Marketing Segment (in thousands) | Mobile Refinery | | | | | | Legacy Refining and Marketing | | Total Refining and Marketing |
| Revenues | $ | 1,655,717 | | | | | | | $ | 112,160 | | | $ | 1,767,877 | |
| Cost of revenues (exclusive of variable production costs and depreciation and amortization shown separately below) | 1,559,989 | | | | | | | 109,093 | | | 1,669,082 | |
| Variable production costs attributable to costs of revenues | 38,664 | | | | | | | — | | | 38,664 | |
| Depreciation and amortization attributable to costs of revenues | 5,944 | | | | | | | 395 | | | 6,339 | |
| Gross profit | 51,120 | | | | | | | 2,672 | | | 53,792 | |
| Operating expenses | | | | | | | | | |
| Selling general and administrative expense | 48,565 | | | | | | | 4,508 | | | 53,073 | |
| Depreciation and amortization attributable to operating expenses | 1,472 | | | | | | | 312 | | | 1,784 | |
| Total operating expenses | 50,037 | | | | | | | 4,820 | | | 54,857 | |
| Income (loss) from operations | 1,083 | | | | | | | (2,148) | | | (1,065) | |
| Other income (expenses) | | | | | | | | | |
| | | | | | | | | |
| Other income | 18 | | | | | | | — | | | 18 | |
| Interest expense | (6,694) | | | | | | | — | | | (6,694) | |
| Net loss | $ | (5,593) | | | | | | | $ | (2,148) | | | $ | (7,741) | |
| Refining adjusted EBITDA * | $ | 58,870 | | | | | | | $ | (1,509) | | | $ | 57,361 | |
| Key performance indicators: | | | | | | | | | |
| Fuel Gross Margin * | $ | 251,359 | | | | | | | n/a | | n/a |
| Adjusted Gross Margin* | $ | 74,797 | | | | | | | n/a | | n/a |
Fuel Gross Margin Per Barrel of Throughput (1)* | $ | 19.61 | | | | | | | n/a | | n/a |
Adjusted Gross Margin Per Barrel of Throughput (1)* | $ | 5.84 | | | | | | | n/a | | n/a |
USGC 2-1-1 Crack Spread Per Barrel (2) | $ | 34.82 | | | | | | | n/a | | n/a |
Variable Production Costs Per Barrel of Throughput (3) | $ | 3.02 | | | | | | | n/a | | n/a |
Operating Expenses Per Barrel of Throughput (4) | $ | 3.79 | | | | | | | n/a | | n/a |
* See "Non-U.S. GAAP Financial Measures and Key Performance Indicators" below.
(1) Fuel gross margin per throughput barrel is calculated as fuel gross margin divided by total throughput barrels for the period presented. Adjusted gross margin per throughput barrel is calculated as adjusted gross margin divided by total throughput barrels for the periods presented. These calculations are nominal to the legacy business.
(2) The crack spread USGC 2-1-1 is a measure of the difference between market prices for refined products and crude oil, commonly used by the refining industry. We use crack spreads as a performance benchmark for our fuel gross margin and as a comparison with other industry participants. Crack spreads can fluctuate significantly, particularly when prices of refined products do not move in the same direction as the cost of crude oil. To calculate the crack spread we believe most closely relates to the crude intakes and products at the Mobile Refinery, we use two barrels of Louisiana Light Sweet crude oil, producing one barrel of USGC CBOB gasoline (U.S. Gulf Coast Conventional Blendstock for Oxygenate Blending, which means conventional gasoline blendstock intended for blending with oxygenates downstream of the refinery where it was produced) and one barrel of USGC ULSD (U.S. Gulf Coast Ultra-low sulfur diesel (ULSD), which is diesel fuel containing a maximum of 15 parts per million (ppm) of sulfur). These calculations are nominal to the legacy business.
(3) Variable production costs per barrel of throughput are calculated by dividing variable production costs attributable to cost of revenues by total throughput barrels for the period presented. Included in variable production costs attributable to cost of revenues are personnel costs, utilities, repair and maintenance costs, and other miscellaneous costs to operate the refinery. These calculations are nominal to the legacy business.
(4) Operating expenses per throughput barrel are calculated as operating expenses minus depreciation and amortization divided by total throughput barrels for the period presented. These calculations are nominal to the legacy business.
The following table shows average throughput and product yield at the Mobile Refinery for the three and nine months ended September 30, 2023 and 2022.
| | | | | | | | | | | | | | | | | | | | | | | | | | | | | | | | | | | | | | | | | | | | | | | |
| Three Months Ended September 30, | | Nine Months Ended September 30, |
| 2023 | | 2022 | | 2023 | | 2022 |
| Conventional | | Renewable | | Total | | Conventional | | Conventional | | Renewable | | Total | | Conventional |
| Refinery throughput (bpd) | | | | | | | | | | | | | | | |
| Crude oil | 80,171 | | — | | 80,171 | | 67,954 | | 75,976 | | — | | 75,976 | | 70,032 |
Renewable feedstocks (1) | — | | 5,397 | | 5,397 | | — | | — | | 3,952 | | 3,952 | | — |
| Total throughput | 80,171 | | 5,397 | | 85,568 | | 67,954 | | 75,976 | | 3,952 | | 79,928 | | 70,032 |
| | | | | | | | | | | | | | | |
| Refinery Yields (bpd) | | | | | | | | | | | | | | | |
| Gasolines | 21,287 | | — | | 21,287 | | 15,310 | | 18,295 | | — | | 18,295 | | 16,646 |
| Distillates | 16,479 | | — | | 16,479 | | 20,342 | | 15,612 | | — | | 15,612 | | 19,884 |
| Jet fuel | 15,823 | | — | | 15,823 | | 11,026 | | 14,072 | | — | | 14,072 | | 10,860 |
Other (2) | 26,419 | | — | | 26,419 | | 21,147 | | 27,456 | | — | | 27,456 | | 22,390 |
| Renewable diesel | — | | 5,276 | | 5,276 | | — | | — | | 3,750 | | 3,750 | | — |
| Total yields | 80,008 | | 5,276 | | 85,284 | | 67,825 | | 75,435 | | 3,750 | | 79,185 | | 69,780 |
(1) The renewable diesel unit became operational on May 27, 2023. Total throughput barrels from May 27 through September 30, 2023 were 723,140. Total production of soybean oil for the period was 686,257 bbls.
(2) Other includes intermediates and LPGs.
Third Quarter 2023 Compared to Third Quarter 2022 Discussion
Revenues from the Mobile Refinery were $938.3 million during the third quarter in 2023, compared to revenues of $733.5 million during the same period in 2022. The increase was the result of the operation of the Renewable Diesel unit (which RD commercial production only began in May 2023). Production volume from conventional refinery activities increased 9.98% from 6.5 million barrels in the 2022 period to 7.2 million barrels in the 2023 period. Legacy Refining and Marketing revenues increased $7.1 million, which was the result of the operation of a new Marine Fuel division, which started on April 1, 2023, during the three months ended September 30, 2023, as compared to the same period in 2022.
Gross profit for the Refining and Marketing segment increased $29.9 million for the three months ended September 30, 2023, compared to the same period in 2022, of which $28.6 million was related to the Mobile Refinery, and $1.3 million was related to Legacy Refining and Marketing business. The increase was primarily due to inflation which caused an increase in our profit margin due to our sales prices increasing at a higher rate than our feedstocks.
Operational expenses excluding depreciation and amortization expenses for the Refining and Marketing segment increased $3.2 million for the three months ended September 30, 2023, compare to the same period in 2022, which was primarily a result of the operation of the Renewable Diesel unit (which RD commercial production only began in May 2023) and the Marine Fuel division (which began on April 1, 2023).
Interest expense for the Mobile Refinery of $4.4 million for the third quarter 2023 included $2.6 million related to our inventory financing agreement and $1.5 million related to a capitalized equipment lease. Total interest expense was $3.4 million
for the same period in 2022, of which $1.8 million related to an inventory financing agreement and $1.4 million related to a capitalized equipment lease.
Renewable Diesel - The previously disclosed feed system repairs and subsequent longer-than-expected startup period for the renewable diesel unit contributed to higher operational expenses for the third quarter of 2023. This, combined with the increased soybean oil feedstock costs experienced in recent months, resulted in diminished profitability on a per-barrel basis for our renewable diesel production during the quarter ended September 30, 2023. We remain optimistic about the profitability of renewable fuels on a longer-term basis, which is expected to benefit from the receipt of all available credits for renewable diesel production, optimized steady-state operations, and implementation of a flexible, lower-cost variable feedstock strategy. Due to the transitory nature of renewable diesel operations for the third quarter of 2023, financial results derived from renewable diesel production have been incorporated with conventional production collectively under our Mobile Refinery segment. Going forward, the Company expects to report financials for renewable fuels under a separate renewables segment, beginning with the fourth quarter of 2023 and on an on-going basis.
Year To Date 2023 Compared to Year To Date 2022 Discussion
Revenues from the Mobile Refinery were $2,254.6 million for the nine months ended September 30, 2023, compared to $1,655.7 million of revenue for the same period in 2022. The increase was the result of the operation of the Renewable Diesel unit (which RD commercial production only began in May 2023), and conventional crude oil operations which only operated for six months during the 2022 period. Legacy Refining and Marketing revenues decreased $17.3 million and volumes were down 1 percent, while commodity prices decreased during the nine months ended September 30, 2023, as compared to the same period in 2022.
Gross profit for the Refining and Marketing segment increased $85.6 million for the nine months ended September 30, 2023, which was primarily the result of hedging activity. There was a $0.1 million hedging gain and an $84.8 million hedging loss from inventory hedging during the nine months ended September 30, 2023 and 2022, respectively related to the Mobile Refinery.
The conventional operations at Mobile Refinery had $65.7 million in operational expenses excluding depreciation and amortization expenses for the 2023 period, representing a $17.1 million increase compared to the same period of 2022, which was primarily due to the operating of conventional operation only for only six months of the 2022 period. The increase in operational expenses, excluding depreciation and amortization expenses of $2.2 million for the nine months ended September 30, 2023, compared to the 2022 period, from the legacy Refining and Marketing business, was primarily due to the operation of the Marine Fuel division (which began on April 1, 2023) in 2023, compared to the same period in 2022.
Interest expense for the Refining and Marketing segment of $12.8 million for the nine months ended September 30, 2023, included $7.5 million related to our inventory financing agreement and $2.9 million related to a capitalized equipment lease. Interest expense for the same period in 2022, was $6.7 million, due to the Mobile Refinery being acquired on April 1, 2022.
Non-U.S. GAAP Financial Measures and Key Performance Indicators
In addition to our results calculated under generally accepted accounting principles in the United States (“GAAP”), in this Report we also present certain non-U.S. GAAP financial measures and key performance indicators.
Non-U.S. GAAP financial measures include Adjusted Gross Margin, Fuel Gross Margin and Refining Adjusted EBITDA, for the Company’s Legacy Refining and Marketing segment, and the total Refining and Marketing segment, as a whole (collectively, the “Non-U.S. GAAP Financial Measures”).
Key performance indicators include Adjusted Gross Margin, Fuel Gross Margin and Refining Adjusted EBITDA for Conventional, Renewable and the Mobile Refinery as a whole, and Fuel Gross Margin Per Barrel of Throughput and Adjusted Gross Margin Per Barrel of Throughput for Conventional, Renewable and the Mobile Refinery as a whole (collectively, the “KPIs”).
Each of the Non-U.S. GAAP Financial Measures and KPIs are discussed in greater detail below.
The (a) Non-U.S. GAAP Financial Measures are “non-U.S. GAAP financial measures”, and (b) the KPIs are, presented as supplemental measures of the Company’s performance. They are not presented in accordance with U.S. GAAP. We use the Non-U.S. GAAP Financial Measures and KPIs as supplements to U.S. GAAP measures of performance to evaluate
the effectiveness of our business strategies, to make budgeting decisions, to allocate resources and to compare our performance relative to our peers. Additionally, these measures, when used in conjunction with related U.S. GAAP financial measures, provide investors with an additional financial analytical framework which management uses, in addition to historical operating results, as the basis for financial, operational and planning decisions and present measurements that third parties have indicated are useful in assessing the Company and its results of operations. The Non-U.S. GAAP Financial Measures and KPIs are presented because we believe they provide additional useful information to investors due to the various noncash items during the period. Non-U.S. GAAP financial information and KPIs similar to the Non-U.S. GAAP Financial Measures and KPIs are also frequently used by analysts, investors and other interested parties to evaluate companies in our industry.
The Non-U.S. GAAP Financial Measures and KPIs are unaudited, and have limitations as analytical tools, and you should not consider them in isolation, or as a substitute for analysis of our operating results as reported under U.S. GAAP. Some of these limitations are: the Non-U.S. GAAP Financial Measures and KPIs do not reflect cash expenditures, or future requirements for capital expenditures, or contractual commitments; the Non-GAAP Financial Measures and KPIs do not reflect changes in, or cash requirements for, working capital needs; the Non-GAAP Financial Measures and KPIs do not reflect the significant interest expense, or the cash requirements necessary to service interest or principal payments, on debt or cash income tax payments; although depreciation and amortization are noncash charges, the assets being depreciated and amortized will often have to be replaced in the future, the Non-U.S. GAAP Financial Measures and KPIs do not reflect any cash requirements for such replacements; the Non-U.S. GAAP Financial Measures and KPIs represent only a portion of our total operating results; and other companies in this industry may calculate the Non-U.S. GAAP Financial Measures and KPIs differently than we do, limiting their usefulness as a comparative measure.
You should not consider the Non-U.S. GAAP Financial Measures and KPIs in isolation, or as substitutes for analysis of the Company’s results as reported under U.S. GAAP. The Company’s presentation of these measures should not be construed as an inference that future results will be unaffected by unusual or nonrecurring items. We compensate for these limitations by providing a reconciliation of each of these non-U.S. GAAP Financial Measures and KPIs to the most comparable U.S. GAAP measure below. We encourage investors and others to review our business, results of operations, and financial information in their entirety, not to rely on any single financial measure, and to view these non-U.S. GAAP Financial Measures and KPIs in conjunction with the most directly comparable U.S. GAAP financial measure.
Adjusted Gross Margin.
Adjusted Gross Margin is defined as gross profit (loss) plus or minus unrealized gain or losses on hedging activities and inventory valuation adjustments.
Fuel Gross Margin
Fuel Gross Margin is defined as gross profit (loss) plus or minus operating expenses and depreciation attributable to cost of revenues and other non-fuel items included in costs of revenues including realized and unrealized gain or losses on hedging activities, Renewable Fuel Standard (RFS) costs (mainly related to Renewable Identification Numbers (RINs)), inventory valuation adjustments, fuel financing costs and other revenues and cost of sales items.
Fuel Gross Margin Per Barrel of Throughput.
Fuel Gross Margin Per Barrel of Throughput is calculated as fuel gross margin divided by total throughput barrels for the period presented.
Adjusted Gross Margin Per Barrel of Throughput.
Adjusted Gross Margin Per Barrel Throughput is calculated as adjusted gross margin divided by total throughput barrels for the period presented.
Refining Adjusted EBITDA.
Refining Adjusted EBITDA represents net income (loss) from operations plus or minus unrealized gain or losses on hedging activities, RFS costs (mainly RINs), and inventory adjustments, depreciation and amortization, interest expense, acquisition costs, environmental reserves and certain other unusual or non-recurring charges included in selling, general, and administrative expenses.
The following tables reconcile GAAP gross profit (loss) to Adjusted Gross Margin, Fuel Gross Margin, Fuel Gross Margin per Barrel of Throughput, Adjusted Gross Margin per Barrel of Throughput and Refining Adjusted EBITDA for the periods presented (in thousands):
| | | | | | | | | | | | | | | | | | | | | | | | | | | | | | | | | | | | | | | | | | | | | | | |
| Three Months Ended September 30, | | | | |
| 2023 | | 2022 |
| Conventional | | Renewable | | Mobile Refinery Total | | Legacy Refining and Marketing | | Total Refining and Marketing | | Mobile Refinery | | Legacy Refining and Marketing | | Total Refining and Marketing |
| Gross profit (loss) | $ | 86,185 | | | $ | (8,515) | | | $ | 77,670 | | | $ | 903 | | | $ | 78,573 | | | $ | 49,071 | | | $ | (390) | | | $ | 48,681 | |
| Unrealized loss (gain) on hedging activities | (4,620) | | | (3,622) | | | (8,242) | | | (40) | | | (8,282) | | | (47,848) | | | 96 | | | (47,752) | |
| Inventory valuation adjustments | 13,225 | | | (3,851) | | | 9,374 | | | — | | | 9,374 | | | 573 | | | — | | | 573 | |
| Adjusted Gross Margin | 94,790 | | | (15,988) | | | 78,802 | | | 863 | | | 79,665 | | | 1,796 | | | (294) | | | 1,502 | |
| Variable production costs included in cost of revenues | 26,847 | | | 12,958 | | | 39,805 | | | — | | | 39,805 | | | 21,621 | | | — | | | 21,621 | |
| Depreciation and amortization attributable to costs of revenues | 2,982 | | | 3,320 | | | 6,302 | | | 225 | | | 6,527 | | | 2,957 | | | 154 | | | 3,111 | |
| RFS expense (mainly RINs) | 7,058 | | | — | | | 7,058 | | | — | | | 7,058 | | | 19,973 | | | — | | | 19,973 | |
| Realized loss (gain) on hedging activities | 2,854 | | | 2,401 | | | 5,255 | | | 715 | | | 5,970 | | | 38,696 | | | (540) | | | 38,156 | |
| Financing costs (include over/under) | 1,772 | | | 205 | | | 1,977 | | | — | | | 1,977 | | | 9,980 | | | — | | | 9,980 | |
| Other revenues | (6,804) | | | (524) | | | (7,328) | | | (72) | | | (7,400) | | | (2,145) | | | — | | | (2,145) | |
| Fuel Gross Margin | $ | 129,499 | | | $ | 2,372 | | | $ | 131,871 | | | $ | 1,731 | | | $ | 133,602 | | | $ | 92,878 | | | $ | (680) | | | $ | 92,198 | |
| | | | | | | | | | | | | | | |
| Throughput (bpd) | 80,171 | | | 5,397 | | | 85,568 | | | n/a | | n/a | | 67,954 | | | n/a | | n/a |
| Fuel Gross Margin Per Barrel of Throughput | $ | 17.56 | | | $ | 4.78 | | | $ | 16.75 | | | n/a | | n/a | | $ | 14.86 | | | n/a | | n/a |
| Adjusted Gross Margin Per Barrel of Throughput | $ | 12.85 | | | $ | (32.20) | | | $ | 10.01 | | | n/a | | n/a | | $ | 0.29 | | | n/a | | n/a |
| | | | | | | | | | | | | | | |
| Net loss (income) | $ | 65,161 | | | $ | (21,807) | | | $ | 43,354 | | | $ | (1,489) | | | $ | 41,865 | | | $ | 18,369 | | | $ | (2,251) | | | $ | 16,118 | |
| Unrealized loss (gain) on hedging activities | (4,620) | | | (3,622) | | | (8,242) | | | (40) | | | (8,282) | | | (47,848) | | | 96 | | | (47,752) | |
| Depreciation and amortization | 3,718 | | | 3,341 | | | 7,059 | | | 297 | | | 7,356 | | | 3,693 | | | 268 | | | 3,961 | |
| Interest expenses | 2,568 | | | 1,826 | | | 4,394 | | | — | | | 4,394 | | | 3,443 | | | — | | | 3,443 | |
| Inventory valuation adjustment | 13,225 | | | (3,851) | | | 9,374 | | | — | | | 9,374 | | | 573 | | | — | | | 573 | |
| Acquisition costs | — | | | — | | | — | | | — | | | — | | | 2,889 | | | — | | | 2,889 | |
| | | | | | | | | | | | | | | |
| | | | | | | | | | | | | | | |
| Refining Adjusted EBITDA | $ | 80,052 | | | $ | (24,113) | | | $ | 55,939 | | | $ | (1,232) | | | $ | 54,707 | | | $ | (18,881) | | | $ | (1,887) | | | $ | (20,768) | |
| | | | | | | | | | | | | | | | | | | | | | | | | | | | | | | | | | | | | | | | | | | | | | | |
| Nine Months Ended September 30, |
| 2023 | | 2022 |
| Conventional | | Renewable | | Mobile Refinery Total | | Legacy Refining and Marketing | | Total Refining and Marketing | | Mobile Refinery | | Legacy Refining and Marketing | | Total Refining and Marketing |
| Gross profit (loss) | $ | 158,198 | | | $ | (21,521) | | | $ | 136,677 | | | $ | 3,011 | | | $ | 139,688 | | | $ | 51,120 | | | $ | 2,672 | | | $ | 53,792 | |
| Unrealized (gain) loss on hedging activities | (4,341) | | | (709) | | | (5,050) | | | (82) | | | (5,132) | | | (76) | | | (68) | | | (144) | |
| Inventory valuation adjustments | 7,447 | | | (106) | | | 7,341 | | | — | | | 7,341 | | | 23,753 | | | — | | | 23,753 | |
| Adjusted Gross Margin | 161,304 | | | (22,336) | | | 138,968 | | | 2,929 | | | 141,897 | | | 74,797 | | | 2,604 | | | 77,401 | |
| Variable production costs included in cost of revenues | 76,785 | | | 13,035 | | | 89,820 | | | — | | | 89,820 | | | 38,664 | | | — | | | 38,664 | |
| Depreciation and amortization attributable to costs of revenues | 9,477 | | | 5,338 | | | 14,815 | | | 574 | | | 15,389 | | | 5,944 | | | 395 | | | 6,339 | |
| RFS expense (mainly RINs) | 48,583 | | | — | | | 48,583 | | | — | | | 48,583 | | | 40,361 | | | — | | | 40,361 | |
| Realized loss on hedging activities | 1,265 | | | 3,689 | | | 4,954 | | | 634 | | | 5,588 | | | 84,830 | | | 91 | | | 84,921 | |
| Financing costs | 3,980 | | | 263 | | | 4,243 | | | — | | | 4,243 | | | 11,215 | | | — | | | 11,215 | |
| Other revenues | (12,347) | | | (714) | | | (13,061) | | | (72) | | | (13,133) | | | (4,452) | | | — | | | (4,452) | |
| Fuel Gross Margin | $ | 289,047 | | | $ | (725) | | | $ | 288,322 | | | $ | 4,065 | | | $ | 292,387 | | | $ | 251,359 | | | $ | 3,090 | | | $ | 254,449 | |
| | | | | | | | | | | | | | | |
| Throughput (bpd) | 75,976 | | | 3,952 | | | 79,928 | | | n/a | | n/a | | 70,032 | | | n/a | | n/a |
| Fuel Gross Margin Per Barrel of Throughput | $ | 13.94 | | | $ | (1.00) | | | $ | 13.21 | | | n/a | | n/a | | $ | 19.61 | | | n/a | | n/a |
| Adjusted Gross Margin Per Barrel of Throughput | $ | 7.78 | | | $ | (30.88) | | | $ | 6.37 | | | n/a | | n/a | | $ | 5.84 | | | n/a | | n/a |
| | | | | | | | | | | | | | | |
| Net income (loss) | $ | 79,686 | | | $ | (42,272) | | | 37,414 | | | $ | (3,924) | | | $ | 33,490 | | | $ | (5,593) | | | $ | (2,148) | | | $ | (7,741) | |
| Unrealized gain on hedging activities | (4,341) | | | (709) | | | (5,050) | | | (82) | | | (5,132) | | | (76) | | | (68) | | | (144) | |
| Depreciation and amortization | 11,685 | | | 5,373 | | | 17,058 | | | 790 | | | 17,848 | | | 7,416 | | | 707 | | | 8,123 | |
| Interest expenses | 10,604 | | | 2,195 | | | 12,799 | | | — | | | 12,799 | | | 6,693 | | | — | | | 6,693 | |
| Inventory valuation adjustment | 7,447 | | | (106) | | | 7,341 | | | — | | | 7,341 | | | 23,753 | | | — | | | 23,753 | |
| Acquisition costs | — | | | — | | | — | | | — | | | — | | | 11,967 | | | — | | | 11,967 | |
| Environmental reserve | — | | | — | | | — | | | — | | | — | | | 1,428 | | | — | | | 1,428 | |
| Loss opportunity on initial purchase of inventory | — | | | — | | | — | | | — | | | — | | | 13,282 | | | — | | | 13,282 | |
| Refining Adjusted EBITDA | $ | 105,081 | | | $ | (35,519) | | | $ | 69,562 | | | $ | (3,216) | | | $ | 66,346 | | | $ | 58,870 | | | $ | (1,509) | | | $ | 57,361 | |
Black Oil and Recovery Segment
After the acquisition of the Mobile Refinery on April 1, 2022, the revenue of our Black Oil and Recovery segments became less than 10% of consolidated revenue. As a result, beginning with the third quarter of 2022, we decided to combine our Black Oil and Recovery segment into one segment, which is engaged in operations across the entire used motor oil recycling value chain, including refinement, collection, aggregation, transportation, storage, recovery, and sales of aggregated feedstock and re-refined products to end-users. We collect and purchase used oil directly from generators such as oil change service stations, automotive repair shops, manufacturing facilities, petroleum refineries, petrochemical manufacturing operations, and a diverse network of suppliers who operate similar collection businesses to ours. We own a fleet of collection vehicles, which routinely visit generators to collect and purchase used motor oil.
We operate a refining facility in Baytown, Texas that uses our proprietary Thermal Chemical Extraction Process (“TCEP”), and we also utilize third-party processing facilities. We use TCEP to pre-treat used oil feedstock; prior to shipping to our facility in Marrero, Louisiana, where we re-refine used motor oil and produce VGO, which is then sold via barge to crude refineries to be utilized as an intermediate feedstock in the refining process, as well as to the marine fuels market. We also
operate a re-refining complex located in Belle Chasse, Louisiana (the “Myrtle Grove facility”). This facility includes ground storage tanks with over 8.6 million gallons of storage capacity. These assets are used by both the Black Oil and Refining and Marketing segments. In addition, we also utilize third parties for the transportation and storage of used oil feedstocks. In many cases, we have contractual purchase and sale agreements with our suppliers and customers, respectively. We believe these contracts are beneficial to all parties involved because it ensures that a minimum volume is purchased from collectors and generators, a minimum volume is sold to our customers, and we are able to minimize our inventory risk by a spread between the costs to acquire used oil and the revenues received from the sale and delivery of used oil.
We also operate a generator solutions company for the proper recovery and management of hydrocarbon streams and other petroleum-based products, together with the recovery, processing and sale of ferrous and non-ferrous recyclable metal(s) products that are recovered from manufacturing and consumption.
The Black Oil and Recovery Segment includes our used motor oil business (the “UMO Business”), which includes the Heartland Assets and Operations, which is presented as discontinued operations. Refer to “Note 23. Discontinued Operations” of our Condensed Notes to Consolidated Financial Statements, included under “Item 1. Financial Statements”. The table below shows the operating results of Black Oil and Recovery Segment for the three months and nine months ended September 30, 2023 and 2022, including revenues by product (in thousands):
| | | | | | | | | | | | | | | | | | | | | | | | | | | | | | | | | | | |
| Three Months Ended September 30, | Nine Months Ended September 30, |
| Black Oil and Recovery | 2023 | | 2022 | | Variance | | 2023 | | 2022 | | Variance |
| Revenues | | | | | | | | | | | |
| Refined products: | | | | | | | | | | | |
| Other refinery products (1) | $ | 38,642 | | | $ | 37,607 | | | $ | 1,035 | | | $ | 89,863 | | | $ | 129,078 | | | $ | (39,215) | |
| Re-refined products: | | | | | | | | | | | |
| Metals (2) | 1,965 | | | 4,060 | | | (2,095) | | | 8,404 | | | 13,080 | | | (4,676) | |
| Other re-refined products (3) | 1,001 | | | 527 | | | 474 | | | 2,508 | | | 1,780 | | | 728 | |
| Services: | | | | | | | | | | | |
| Oil collection services | 2,719 | | | 567 | | | 2,152 | | | 3,983 | | | 1,620 | | | 2,363 | |
| Revenues | 44,327 | | | 42,761 | | | 1,566 | | | 104,758 | | | 145,558 | | | (40,800) | |
| Cost of revenues (exclusive of depreciation and amortization shown separately below) | 36,569 | | | 34,678 | | | 1,891 | | | 90,250 | | | 110,041 | | | (19,791) | |
| Depreciation and amortization attributable to costs of revenues | 1,369 | | | 938 | | | 431 | | | 3,474 | | | 2,800 | | | 674 | |
| Gross profit | 6,389 | | | 7,145 | | | (756) | | | 11,034 | | | 32,717 | | | (21,683) | |
| Operating expenses | | | | | | | | | | | |
| Selling general and administrative expense | 5,231 | | | 4,803 | | | 428 | | | 14,535 | | | 13,125 | | | 1,410 | |
| Depreciation and amortization attributable to operating expenses | 38 | | | 38 | | | — | | | 114 | | | 142 | | | (28) | |
| Total operating expenses | 5,269 | | | 4,841 | | | 428 | | | 14,649 | | | 13,267 | | | 1,382 | |
| Income (loss) from operations | 1,120 | | | 2,304 | | | (328) | | | (3,615) | | | 19,450 | | | (20,301) | |
| Other income (expenses) | | | | | | | | | | | |
| Other income (expenses) | (167) | | | 416 | | | (583) | | | 989 | | | 1,041 | | | (52) | |
| | | | | | | | | | | |
| Interest expense | (41) | | | — | | | (41) | | | (126) | | | (51) | | | (75) | |
| Net income (loss) | $ | 912 | | | $ | 2,720 | | | $ | (952) | | | $ | (2,752) | | | $ | 20,440 | | | $ | (20,428) | |
| | | | | | | | | | | |
| | | | | | | | | | | |
| | | | | | | | | | | |
| | | | | | | | | | | |
| | | | | | | | | | | |
| | | | | | | | | | | |
| | | | | | | | | | | |
(1) Other refinery products are finished refined products such as VGO, LPGs, sulfur and vacuum tower bottoms (VTB).
(2) Metals consist of recoverable ferrous and non-ferrous recyclable metals from manufacturing and consumption. Scrap metal can be recovered from pipes, barges, boats, building supplies, surplus equipment, tanks, and other items consisting of metal composition. These materials are segregated, processed, cut-up and sent back to a steel mill for re-purposing.
(3) Other re-refinery products include the sales of asphalt, condensate, recovered products, and other petroleum products.
Third Quarter 2023 to Third Quarter 2022 Highlights:
Revenue from operations for our Black Oil and Recovery Segment increased $1.6 million for the three months ended September 30, 2023, compared to the same period in 2022, as a result of the acquisition of a small recovery company in July 2023. This contributed volumes to our UMO business.
Cost of revenues (exclusive of depreciation and amortization) for our Black Oil and Recovery Segment increased $1.9 million for the three months ended September 30, 2023, compared to the same period in 2022, primarily due to the operation of the Abbeville division, which started in July 2023.
The total income from operation from the Black Oil and Recovery Segment was $1.1 million for the three months ended September 30, 2023, compared to income from operations of $2.3 million in the same period ended September 30, 2022. The change was due to lower commodity prices which reduced our gross margins and increased operating costs which were caused by increases in inflation during 2022 and into 2023.
Year To Date 2023 to Year To Date 2022 Highlights:
Revenue from operations for our Black Oil and Recovery Segment decreased $40.8 million for the nine months ended September 30, 2023, compared to the same period in 2022, as a result of decreases in volumes sold and commodity prices which reduced our sale prices.
Cost of revenues (exclusive of depreciation and amortization) for our Black Oil and Recovery Segment decreased $19.8 million for the nine months ended September 30, 2023, compared to the same period in 2022, primarily due to the decreased volumes sold, and decreased commodity prices, as discussed above.
The total loss from operation from the Black Oil and Recovery Segment was $3.6 million for the nine months ended September 30, 2023, compared to income from operations of $19.5 million in the same period ended September 30, 2022. The change was due to the lower commodity prices and increased salary and operating costs which were caused by the increases in inflation.
Liquidity and Capital Resources
Our primary sources of liquidity have historically included cash flow from operations, proceeds from note offerings, bank borrowings, term loans, public and private equity offerings and other financial arrangements. Uses of cash have included capital expenditures, acquisitions and general working capital needs.
The success of our business operations has been dependent on our ability to manage our margins, which are a function of the difference between what we are able to pay or charge for raw materials and the market prices for the range of products produced. We also must maintain relationships with feedstock suppliers and end-product customers (including Shell, Macquarie and others), and operate with efficient management of overhead costs. Through these relationships, we have historically been able to achieve volume discounts in the procurement of our feedstock, thereby increasing the margins of our segments’ operations. The resulting operating cash flow is crucial to the viability and growth of our existing business lines.
We had total assets of approximately $892.7 million as of September 30, 2023, compared to $689.4 million at December 31, 2022. The increase was mainly due to the investment in our RD project at the Mobile Refinery, right of use assets that were acquired via operating lease and financing leases, and increases in accounts receivable and inventory levels, due to the operation of the RD unit, during the nine months ended September 30, 2023.
We had total current liabilities of approximately $362.1 million as of September 30, 2023, compared to $248.6 million at December 31, 2022. We had total liabilities of $630.1 million as of September 30, 2023, compared to total liabilities of $524.0 million as of December 31, 2022. The increase in current liabilities was mainly due to increases in accounts payable and inventory financing obligation as a result of the timing schedule of payments and the expanded RD line, and the increase in long-term liabilities was mainly due to the increased right of use liabilities related to operating and finance leases, during the three and nine months ended September 30, 2023, compared to December 31, 2022.
We had working capital of approximately $39.0 million as of September 30, 2023, compared to working capital of $124.8 million as of December 31, 2022. The decrease in working capital from December 31, 2022, to September 30, 2023, is mainly due to the decrease in cash and increase in accounts payable, accrued liabilities and obligations under the inventory
financing agreement during the nine months ended September 30, 2023, offset by the increase in accounts receivable, inventory and prepaid expenses.
During the first three quarters of 2023, average refining margins continued shrinking compared to the last three quarters of 2022. Global prices for refined products, especially distillates, are falling as the economy slows, more refineries come onstream, and exports from Russia are re-routed and replaced by fuel from the Middle East. During the twelve months ended September 30, 2023, the Consumer Price Energy Index in the United States decreased 0.5% impacting our gross margins. The Consumer Price All Items Index increased 3.7% for the same period impacting our operating expenses and slowing economic growth. Also, market conditions were unstable through the end of 2022 and into 2023, and we are still seeing extreme volatility in commodity pricing. Generally, the decrease in refined product pricing has had a negative impact on our business and overall liquidity.
Our future operating cash flows will vary based on a number of factors, many of which are beyond our control, including the effects of inflation, interest rates, commodity prices, the cost of recovered oil, and the ability to turn our inventory. Other factors that have affected and are expected to continue to affect earnings and cash flow are transportation, processing, and storage costs. Over the long term, our operating cash flows will also be impacted by our ability to effectively manage our administrative and operating costs. Additionally, we may incur more capital expenditures related to the Mobile Refinery in the future.
Cash Flows from Operating, Investing and Financing Activities
We believe that we have sufficient liquid assets, cash flow from operations, borrowing capacity and adequate access to capital markets to meet our financial commitments, debt service obligations and anticipated capital expenditures for at least the next 12 months. We expect that our short-term liquidity needs which include debt service, working capital, and capital expenditures related to currently planned growth projects (including Phase 2 of the ongoing renewable diesel conversion project designed to modify the Mobile Refinery's hydrocracking unit to produce renewable diesel fuel on a standalone basis) will be met through projected cash flow from operations, borrowings under our various facilities (if necessary) and asset sales, however, we may also sell equity in the future.
Our current near term plans include continuing to transition the majority of our assets and operations away from used motor oil and towards several important objectives, the combination of which we believe will advance our strategy of becoming a leading pure-play energy transition company of scale in connection with the acquisition of the Mobile Refinery. The refinery, which has a long track record of safe, reliable operations and consistent financial performance, has, effective on April 1, 2022, upon the closing of the acquisition, become our flagship refining asset, which we believe positions us to become a pure-play producer of renewable and conventional products. The addition of renewable fuels production associated with the refinery upon completion of the ongoing capital project at the refinery is anticipated to accelerate our strategic focus on "clean" refining.
The renewable diesel unit was commissioned on April 28, 2023, and mechanical completion was achieved in March 2023. The capital project modified the Mobile Refinery’s existing hydrocracking unit to produce renewable diesel fuel on a standalone basis. The refinery commenced production of approximately 8,000 - 10,000 barrels per day (bpd) of renewable diesel in the second quarter of 2023, with production volumes anticipated to subsequently ramp up to approximately 14,000 bpd by the first quarter of 2024. This project seeks to capitalize on the rapidly growing demand for advanced sustainable fuels, while further expanding upon our commitment to supply lower carbon fuels solutions.
Additionally, we or our affiliates may, at any time and from time to time, retire or repurchase our outstanding Convertible Senior Notes in open-market purchases, privately negotiated transactions, refinancing or otherwise, through cash purchases and/or exchanges for equity or debt. Such repurchases, refinancings or exchanges, if any, will be upon such terms and at such prices as we may determine, and will depend on prevailing market conditions, our liquidity requirements, contractual restrictions, and other factors. The amounts involved may be material.
We anticipate that the market for our common stock will be subject to wide fluctuations in response to several factors moving forward, including, but not limited to:
(1)actual or anticipated variations in our results of operations;
(2)the market for, and volatility in, the market for oil and gas;
(3)our ability or inability to generate new revenues; and
(4)the status of planned acquisitions and divestitures and ongoing capital projects at our facilities.
Furthermore, because our common stock is traded on The NASDAQ Capital Market, our stock price may be impacted by factors that are unrelated or disproportionate to our operating performance. These market fluctuations, as well as general economic, political and market conditions, such as recessions, interest rates or international currency fluctuations may adversely affect the market price of our common stock. Additionally, there could be extreme fluctuations in the price of our common stock.
Shareholders and potential investors in our common stock should exercise caution before making an investment in our common stock, and should not rely on the publicly quoted or traded stock prices in determining our common stock value, but should instead determine the value of our common stock based on the information contained in our public reports and industry information.
Cash flows for the nine months ended September 30, 2023 and 2022, were as follows (in thousands):
| | | | | | | | | | | | | | |
| | Nine Months Ended September 30, |
| | 2023 | | 2022 |
| Beginning cash, cash equivalents and restricted cash | | $ | 146,187 | | | $ | 136,627 | |
| Net cash provided by (used in): | | | | |
| Operating activities | | (71,819) | | | 7,389 | |
| Investing activities | | (46,702) | | | (264,063) | |
| Financing activities | | 51,644 | | | 242,440 | |
| Net decrease in cash, cash equivalents and restricted cash | | (66,877) | | | (14,234) | |
| Ending cash, cash equivalents and restricted cash | | $ | 79,310 | | | $ | 122,393 | |
The analysis of cash flow activities below and the table above, is combined for both continued and discontinued operations, whereas the consolidated statement of cash flows included in this report includes only cash flow information for our continued operations.
Our current primary sources of liquidity are cash generated from operations, cash generated through the sale of the Heartland Assets and Operations and cash flows from borrowing capacity.
Net cash used in operating activities was approximately $71.8 million for the nine months ended September 30, 2023 and net cash provided by operating activities was approximately $7.4 million for the nine months ended September 30, 2022. The primary reason for the decrease in cash provided by operating activities for the nine month period ended September 30, 2023, compared to the same period in 2022, was the operation of the Renewable Diesel unit and the net change of current asset and liabilities associated therewith.
Investing activities used cash of approximately $46.7 million for the nine months ended September 30, 2023, as compared to using cash of $264.1 million during the corresponding period in 2022, due mainly to the sale of the Heartland Assets and Operations, offset by fixed assets purchased for the Mobile Refinery during the current period.
Financing activities provided cash of approximately $51.6 million for the nine months ended September 30, 2023, as compared to providing cash of $242.4 million during the corresponding period in 2022. Financing activities for the nine months ended September 30, 2023, were comprised of principal payments on the Term Loan of $33.0 million, proceeds from the insurance note payable of $19.6 million, and for inventory financing of $63.8 million. Financing activities for the nine months ended September 30, 2022, were mainly comprised of the payment on insurance premium finance of $14.1 million, redemption
of non-controlling interest of $50.7 million, net proceeds from Term Loan and insurance premium finance of $173.3 million, and from inventory financing of $133.7 million.
Critical Accounting Policies and Use of Estimates
Our financial statements are prepared in accordance with U.S. GAAP. The preparation of these financial statements requires management to make estimates and judgments that affect the reported amounts of assets, liabilities, revenues and expenses. Management regularly evaluates its estimates and judgments, including those related to revenue recognition, intangible assets, long-lived assets valuation, variable interest entities, and legal matters. Actual results may differ from these estimates which may be material. “Note 2. Summary of Critical Accounting Policies and Estimates” in Part I, Item 1 of this Quarterly Report on Form 10-Q and in the Notes to Consolidated Financial Statements in Part II, Item 8 of our Annual Report on Form 10-K for the year ended December 31, 2022 (the “2022 Form 10-K”), and “Critical Accounting Policies and Estimates” in Part II, Item 7 of the 2022 Form 10-K describe the significant accounting policies and methods used in the preparation of the Company’s financial statements. There have been no material changes to the Company’s critical accounting policies and estimates since the 2022 Form 10-K.
Item 3. Quantitative and Qualitative Disclosures about Market Risk
Market Risk
Our revenues and cost of revenues are affected by fluctuations in the value of energy-related products. We attempt to mitigate much of the risk associated with the volatility of relevant commodity prices by using our knowledge of the market to obtain feedstock at attractive costs, by efficiently managing the logistics associated with our products, by turning our inventory over quickly and by selling our products into markets where we believe we can achieve the greatest value.
Interest Rate Risk
We are exposed to interest rate risks primarily through borrowings under various bank facilities. Interest on these facilities is based upon variable interest rates using Prime as the base rate.
Commodity Price Risk
We are exposed to market risks related to the volatility of crude oil and refined oil products. Our financial results can be significantly affected by changes in these prices which are driven by global economic and market conditions. We attempt to mitigate much of the risk associated with the volatility of relevant commodity prices by using our knowledge of the market to obtain feedstock at attractive costs, by efficiently managing the logistics associated with our products, by turning our inventory over quickly, and by selling our products into markets where we believe we can achieve the greatest value.
Inflation Risk
Inflationary factors such as increases in the cost of our products and overhead costs may adversely affect our results of operations. We believe that inflation has had an impact on our financial position and results of operations to date. We continue to monitor the impact of inflation in order to minimize its effects through price increases and cost reductions. A high rate of inflation in the future may have an adverse effect on our ability to maintain current levels of gross margin and selling, general, and administrative expenses as a percentage of net revenue if the selling prices of our products do not increase in proportion with these increased costs.
RFS Compliance Price Risk
As a producer of transportation fuels from crude oil, our Refining and Marketing Segment is required to blend biofuels into the products it produces or purchase RINs in the open market in lieu of blending to meet the mandates established by the EPA. The Refining and Market Segment is exposed to market risk related to volatility in the price of RINs needed to comply with the RFS that are not otherwise generated through blending of renewable fuels in our refining and marketing operations. To mitigate the impact of this risk on the Refining and Market Segment’s results of operations and cash flows, the Refining and Market Segment blends ethanol and biodiesel to the extent possible.
Compliance Program Price Risk
We are exposed to market risks related to the volatility in the price of RINs required to comply with the Renewable Fuel Standard. To the degree we are unable to blend the required amount of biofuels to satisfy our renewable volume obligation (RVO) (the volume of renewable fuels we are obligated to sell, based on a percentage of our total fuel sales), we must purchase RINs on the open market. To mitigate the impact of this risk on our results of operations and cash flows, we may purchase RINs when the price of these instruments is deemed favorable.
Item 4. Controls and Procedures
Evaluation of Disclosure Controls and Procedures
We have established and maintain a system of disclosure controls and procedures that are designed to provide reasonable assurance that information required to be disclosed in our reports filed with the SEC pursuant to the Exchange Act, is recorded, processed, summarized and reported within the time periods specified in the rules and forms of the Commission and that such information is accumulated and communicated to our management, including our Chief Executive Officer (CEO)(principal executive officer) and Chief Financial Officer (CFO) (principal accounting/financial officer), as appropriate, to allow timely decisions regarding required disclosures.
Management, with the participation of our CEO and CFO, evaluated the effectiveness of the design and operation of our disclosure controls and procedures (as defined in Rules 13a-15(e) and 15d-15(e) of the Exchange Act) as of the end of the period covered by this report. As of September 30, 2023, based on the evaluation of these disclosure controls and procedures, and in light of the material weakness we found in our internal controls over financial reporting as of December 31, 2022 (as described in greater detail in our annual report on Form 10-K for the year ended December 31, 2022), our CEO and CFO have concluded that our disclosure controls and procedures were not effective to provide reasonable assurance that information required to be disclosed in our reports filed with the Securities and Exchange Commission pursuant to the Exchange Act, is recorded properly, processed, summarized and reported within the time periods specified in the rules and forms of the Commission and that such information is accumulated and communicated to our management, including our CEO and CFO, as appropriate, to allow timely decisions regarding required disclosures.
Remediation Efforts to Address Material Weaknesses
We believe the remedial measures described in Part II, “Item 9A, Controls and Procedures” in our Annual Report on Form 10-K for the year ended December 31, 2022, and others that may be implemented, will remediate these material weaknesses. However, these material weaknesses will not be considered formally remediated until controls have operated effectively for a sufficient period of time and management has concluded, through testing, that the controls are operating effectively.
Inherent Limitations over Internal Controls
Management, including the Company’s Chief Executive Officer and Chief Financial Officer, does not expect that the Company’s internal controls will prevent or detect all errors and all fraud. A control system, no matter how well designed and operated, can provide only reasonable, not absolute, assurance that the objectives of the control system are met. Further, the design of a control system must reflect the fact that there are resource constraints, and the benefits of controls must be considered relative to their costs. Because of the inherent limitations in all control systems, no evaluation of internal controls can provide absolute assurance that all control issues and instances of fraud, if any, have been detected. Also, any evaluation of the effectiveness of controls in future periods are subject to the risk that those internal controls may become inadequate because of changes in business conditions, or that the degree of compliance with the policies or procedures may deteriorate.
Changes in Internal Control Over Financial Reporting
We regularly review our system of internal control over financial reporting to ensure we maintain an effective internal control environment. There were no changes in our internal control over financial reporting that occurred during the three months ended September 30, 2023, that have materially affected, or are reasonably likely to materially affect, our internal control over financial reporting.
PART II – OTHER INFORMATION
Item 1. Legal Proceedings
From time to time, we may become party to litigation or other legal proceedings that we consider to be a part of the ordinary course of our business.
Such current litigation or other legal proceedings are described in, and incorporated by reference in, this “Item 1. Legal Proceedings” of this Form 10-Q from, “Part I” -“Item 1. Financial Statements” in the Notes to Consolidated Financial Statements in “Note 4. Commitments and Contingencies”, under the heading “Litigation”. The Company believes that the resolution of currently pending matters will not individually or in the aggregate have a material adverse effect on our financial condition or results of operations. However, assessment of the current litigation or other legal claims could change in light of the discovery of facts not presently known to the Company or by judges, juries or other finders of fact, which are not in accord with management’s evaluation of the possible liability or outcome of such litigation or claims.
Additionally, the outcome of litigation is inherently uncertain. If one or more legal matters were resolved against the Company in a reporting period for amounts in excess of management’s expectations, the Company’s financial condition and operating results for that reporting period could be materially adversely affected.
Item 1A. Risk Factors
Summary Risk Factors
We face risks and uncertainties related to our business, many of which are beyond our control. In particular, risks associated with our business include:
• our need for additional funding, the availability of, and terms of, such funding;
•our ability to pay amounts due on outstanding indebtedness, covenants of such indebtedness, including restrictions on further borrowing, and security interests in connection therewith;
•the terms of our agreements with Macquarie, including termination rights associated therewith, and our ability to find a replacement partner, in the event such agreements were terminated;
•risks associated with unanticipated problems at, or downtime effecting, our facilities and those operated by third parties on which we rely;
•risks associated with our hedging activities, or our failure to hedge production;
•risks associated with our outstanding 6.25% Convertible Senior Notes due 2027 (the “Convertible Senior Notes”) and an outstanding term loan, including amounts owed, conversion rights associated with our Convertible Senior Notes, dilution caused thereby, dilution caused by potential private exchanges of such notes, redemption obligations associated therewith, covenants in our outstanding term loan, and our ability to repay such notes and term loan, when due;
•risks associated with the ongoing capital project associated with the Mobile Refinery, including the timing thereof and, costs associated therewith;
•the level of competition in our industry and our ability to compete;
•decreases in global demand for, and the price of, oil, the supply and demand for oil and used oil, as well as used oil feed stocks and the price of oil and the feedstocks we use in our operations, process and sell;
•the availability of crude oil and used oil feedstocks;
•the outcome of natural disasters, hurricanes, floods, war, terrorist attacks, fires and other events negatively impacting our facilities and operations;
•the loss of key personnel or failure to attract, integrate and retain additional personnel;
•our ability to protect our intellectual property and not infringe on others’ intellectual property;
•our ability to maintain supplier relationships and obtain adequate supplies of crude oil and other feedstocks;
•our ability to produce our products at competitive rates and the impact of competitive services and products;
•our ability to execute our business strategy in a very competitive environment;
•trends in, and the market for, the price of oil and gas and alternative energy sources, improvements in alternative energy sources and technologies and our ability to respond to changes in our industry;
•our ability to maintain our relationships with Shell, and Macquarie;
•our ability to complete and integrate acquisitions, joint ventures and asset sales;
•pending and future litigation, potential adverse judgments and settlements in connection therewith, and resources expended in connection therewith;
•risk of increased regulation of our operations and products and rules and regulations making our operations more costly or restrictive and changes in environmental and other laws and regulations and risks associated with such laws and regulations;
•economic downturns and recessions both in the United States and globally, increased inflation and interest rates;
•negative publicity and public opposition to our operations;
•disruptions in the infrastructure that we and our partners rely on;
•an inability to identify attractive acquisition opportunities and successfully negotiate acquisition terms, our ability to effectively integrate acquired assets, companies, employees or businesses, and liabilities associated with acquired companies, assets or businesses;
•unexpected changes in our anticipated capital expenditures resulting from unforeseen required maintenance, repairs, or upgrades;
•the volatility in the market price of compliance credits (primarily RINs needed to comply with the RFS) under Renewable and Low-Carbon Fuel Programs and emission credits needed under other environmental emissions programs, the requirement for us to purchase RINs in the secondary market to the extent we do not generate sufficient RINs internally, liabilities associated therewith and the timing of such required purchases, if any;
•our ability to effectively manage our growth and scale our operations;
•our ability to maintain insurance, the costs of required insurance, our lack of insurance, or claims not covered by our insurance;
•our lack of effective disclosure controls and procedures and internal control over financial reporting;
•accidents, equipment failures or mechanical problems which may occur; operational hazards and unforeseen interruptions for which we may not be adequately insured; the threat and impact of terrorist attacks, cyber-attacks or similar hostilities, on our facilities, any one of which may adversely impact our operations;
•risks of downturns in the U.S. and global economies and increased prices due to inflation and changing interest rates, and/or the ongoing conflict between Russia and Ukraine, and Israel and Hamas;
•our ability to meet earnings guidance and other forecasts;
•the volatile nature of the market for our common stock and our ability to maintain the listing of our common stock on The Nasdaq Capital Market; and
•dilution caused by new equity offerings, the exercise of warrants and/or the conversion of outstanding convertible notes.
Risk Factors
There have been no material changes from the risk factors previously disclosed in Part I, Item 1A of the Company’s Annual Report on Form 10-K for the year ended December 31, 2022, filed with the Commission on March 1, 2023 (the “Form 10-K”), under the heading “Risk Factors”, except as described below, and investors should review the risks provided in the Form 10-K and below which update certain of the risk factors described in the Form 10-K (to the extent marked with a “(*)” or represent new risk factors, to the extent not marked with a “(*)”), prior to making an investment in the Company. The business, financial condition and operating results of the Company can be affected by a number of factors, whether currently known or unknown, including but not limited to those described in the Form 10-K for the year ended December 31, 2022, under “Risk Factors” and below, any one or more of which could, directly or indirectly, cause the Company’s actual financial condition and operating results to vary materially from past, or from anticipated future, financial condition and operating results. Any of these factors, in whole or in part, could materially and adversely affect the Company’s business, financial condition, operating results and stock price.
Our margins have historically tightened as the national and global economies slow, and we have recently experienced decreasing margins, which may continue or become exacerbated in the future.
During the first three quarters of 2023, our average refining margins decreased compared to the last three quarters of 2022. We believe this was due to, among other things, the global prices for refined products, especially distillates, falling as the economy slows, more refineries coming onstream, and exports from Russia that are being re-routed and replaced by fuel from the Middle East. During the twelve months ended September 30, 2023, the Consumer Price Energy Index in the United States decreased 0.5% impacting our gross margins. The Consumer Price All Items Index increased 3.7% for the same period impacting our operating expenses and slowing economic growth. If we experience continued increasing or prolonged tightening of margins, it may decrease our profits and materially adversely affect our operating results, cash flows, and the value of our securities.
Currently pending or future litigation or governmental proceedings could result in material adverse consequences, including judgments or settlements.
From time to time, we are involved in lawsuits, regulatory inquiries and may be involved in governmental and other legal proceedings arising out of the ordinary course of our business. For example, we are currently involved in ongoing lawsuits seeking damages relating to alleged noxious and harmful emissions from our facility located in Marrero, Louisiana; ongoing issues in connection with Penthol LLC’s termination of a June 2016 Sales and Marketing Agreement; and a class action that was filed against us and certain of our senior executives alleging claims for violations of Section 10(b) of the Exchange Act, and Rule 10b-5 promulgated thereunder, and Section 20(a) of the Exchange Act. Each of these matters are described in greater detail under “Part I” -“Item 1. Financial Statements” in the Notes to Consolidated Financial Statements in “Note 4. Commitments and Contingencies”, under the heading “Litigation”. Many of these matters raise difficult and complicated factual and legal issues and are subject to uncertainties and complexities. Regardless of the merit of particular claims, litigation can be expensive, time-consuming, disruptive to the Company’s operations and distracting to management. In recognition of these considerations, the Company may enter into agreements or other arrangements to settle litigation and resolve such challenges. There can be no assurance such agreements can be obtained on acceptable terms or that litigation will not occur. These agreements can also significantly increase the Company’s operating expenses. While the Company maintains insurance coverage for certain types of claims, such insurance coverage may be insufficient to cover all losses or all types of claims that may arise. The timing of the final resolutions to these matters (including pending matters) is often uncertain. The possible outcomes or resolutions to pending and future matters could include adverse judgments or settlements, either of which could require substantial payments, adversely affecting our results of operations and liquidity.
The availability and cost of renewable identification numbers, Low Carbon Fuel Standard (LCFS) credits, and other credits and/or changes in laws associated therewith, our current and future RINs liability and expected requirement that we purchase RINs in the future, could have an adverse effect on our financial condition and results of operations.(*)
Pursuant to the Energy Policy Act of 2005, Congress established a Renewable Fuel Standard (“RFS”) program that requires annual volumes of renewable fuel be blended into domestic transportation fuel. A Renewable Identification Number (“RIN”) is assigned to each gallon of renewable fuel produced in, or imported into, the United States. Market prices for RINs have been volatile, marked by periods of sharp increases. We cannot predict the future prices of RINs. Purchasing RINs at elevated prices could have a material impact on our results of operations and cash flows. We are exposed to the volatility in the market price of RINs. As a producer of transportation fuels from crude oil, our Refining and Marketing segment is required to blend biofuels into the products it produces or purchase RINs in the open market in lieu of blending to meet the mandates established by the EPA. The Refining and Market Segment is exposed to market risk related to volatility in the price of RINs needed to comply with the RFS that are not otherwise generated through blending of renewable fuels in our refining and marketing operations. To mitigate the impact of this risk on the Refining and Market Segment’s results of operations and cash flows, the Refining and Market Segment blends ethanol and biodiesel to the extent possible.
We are exposed to market risks related to the volatility in the price of RINs required to comply with the Renewable Fuel Standard. To the degree we are unable to blend the required amount of biofuels to satisfy our renewable volume obligation (RVO) (the volume of renewable fuels we are obligated to sell, based on a percentage of our total fuel sales), we must purchase RINs on the open market, which is based on a percentage of domestic shipments of on-road fuels as established by the EPA.
As of September 30, 2023, our RIN liability was $42.9 million, which amount is required to be paid by March 31, 2024. This RIN liability is currently increasing by approximately $6 million to $7 million per month, and we are currently not producing sufficient volumes of renewable fuels to satisfy this liability, do not expect to produce sufficient volumes of renewable fuels to satisfy this liability in the near future, and expect to be required to purchase RINs on the open market in the future to satisfy such liability. We cannot predict the future prices of RINs. RINs prices are dependent upon a variety of factors,
including EPA regulations, the availability of RINs for purchase, and levels of transportation fuels produced, which can vary significantly from quarter to quarter. Additionally, the status of EPA RFS exemptions may impact the price of RINs. EPAs policy on granting certain RFS exemptions has changed under the Biden administration, and some previously granted exemptions have been the subject of legal proceedings that may ultimately result in the reversal of past exemptions. The occurrence of any one or more of these events may increase our operating expenses or make it more difficult for us to operate.
Existing laws or regulations could change and the minimum volumes of renewable fuels that must be blended with refined petroleum products may increase. Increases in the volume of renewable fuels that must be blended into our products could limit the production of the Mobile Refinery if sufficient numbers of RINs are not available for purchase or relief from this requirement is not obtained, which could have an adverse effect on our consolidated financial results.
In addition to the RFS, we and our partners operate in multiple jurisdictions that have issued, or are considering issuing, similar low-carbon fuel regulations, policies, and standards. The RFS and similar U.S. state and international low-carbon fuel regulations, policies, and standards are extremely complex, often have different or conflicting requirements or methodologies, and are frequently evolving, requiring us to periodically update our systems and controls to maintain compliance and monitoring, which could require significant expenditures, and presents an increased risk of administrative error. Our low-carbon fuels businesses could be materially and adversely affected if (i) these regulations, policies, and standards are adversely changed, not enforced, or discontinued, (ii) the benefits therefrom are reduced, (iii) any of the products we produce are deemed not to qualify for compliance therewith, or (iv) we are unable to satisfy or maintain any approved pathways. Such changes could also negatively impact the economic assumptions and projections with respect to many of our low-carbon projects and could have a material adverse impact on the timing of completion, project returns, and other outcomes with respect to such projects.
The requirement that we satisfy future RINs liabilities, which are increasing on a monthly basis in the future, could have a material adverse effect on our cash flows, results of operations, could force us to borrow additional funding which may not be available on favorable terms, if at all, and/or could require us to sell off assets, which may have an adverse effect on the value of our securities.
We may enter into joint ventures or sell all or portions of our facilities, assets or operations in the future.
We may enter into joint ventures with third parties or sell all or portions of our facilities, assets or operations in the future. Additionally, we previously named BofA Securities, Inc. (“BofA”) as our strategic financial advisor to assist with the Company's renewable fuels and sustainable products growth strategy. During this engagement, the Company expects to review various potential strategic transaction opportunities aimed at strengthening the balance sheet to support growth acceleration and asset development in line with the Company’s forward trajectory as an energy transition company. There can be no assurance that this process will result in any transaction. We have not set a timetable for the completion of this process and do not intend to comment further unless or until the Board of Directors has approved a definitive course of action, or it is determined that other disclosure is necessary or appropriate.
Such transactions, including any potential transaction involving our renewable fuels assets, may result in us not obtaining the full benefit of any increases in the value, production, or intellectual property of such facilities, assets or operations which we enter into joint ventures in connection with or sell rights to in the future, may affect prior projections or estimates which take into account the full benefit of such facilities, assets or operations, may make it more difficult or delay our ability to respond to changing market conditions or to undertake capital projects associated with such facilities, assets or operations, may reduce our asset base, may have adverse accounting effects, and/or may have other foreseen and unforeseen effects on the Company. Any one or more of which may have an adverse effect on our revenues, results of operations or cash flows, and which could cause a decrease in the value of our securities.
The renewable diesel refining industry is a feedstock limited industry. As more plants are developed and go into production there may not be an adequate supply of feedstock to supply the demands of the industry, which could threaten the viability of our renewable diesel operations.
The number of renewable diesel refining plants either in production or in the planning or construction phase continues to increase. As more plants are developed and go into production, and as more existing plants expand their production capacities, there may not be an adequate supply of feedstock to supply the demand of the renewable diesel industry. Consequently, the cost of feedstock may rise to the point where it threatens the viability of our renewable diesel operations. This is because there is little or no correlation between the cost of feedstock and the market price of renewable diesel and, therefore, we cannot pass along increased feedstock costs to our renewable diesel customers. We cannot pass along increased feedstock costs to our renewable diesel customers because in order to stay competitive in the renewable diesel industry,
renewable diesel must be competitively priced with petroleum-based diesel. Therefore, renewable diesel prices fluctuate more in relation to petroleum-based diesel market prices then with feedstock market prices. As a result, increased feedstock costs or decreased renewable diesel prices may result in decreased revenues.
We could be affected by higher than anticipated renewable diesel feedstock costs, including but not limited to increased prices for soybeans.
In addition to general market fluctuations and economic conditions, we could experience significant cost increases associated with the ongoing operation of our renewable diesel refining facility caused by a variety of factors, many of which are beyond our control. These cost increases could arise from an inadequate supply of soybeans and a resulting price increase which is not accompanied by an increase in the price for renewable diesel. The price of soybeans, and therefore soybean oil, which we process into renewable diesel, may increase due to alternative uses for soybeans, climate change, droughts, adverse weather, insect spoilation, or other events. Changes in price of soybeans and therefore soybean oil, may affect our ability to obtain feedstock for our renewable diesel refining facility and may adversely effect our margins, which could make it non-economical to operate our renewable diesel refining facility and/or may have a material adverse effect on our results of operations and cash flows.
Economic uncertainty may affect our access to capital and/or increase the costs of such capital.(*)
Global economic conditions continue to be volatile and uncertain due to, among other things, consumer confidence in future economic conditions, fears of recession and trade wars, global conflicts, including the ongoing conflict between Russia and Ukraine and Irael and Hamas, the price of energy, increasing interest rates, the availability and cost of consumer credit, the availability and timing of government stimulus programs, levels of unemployment, increased inflation, and tax rates. These conditions remain unpredictable and create uncertainties about our ability to raise capital in the future. In the event required capital becomes unavailable in the future, or more costly, it could have a material adverse effect on our business, results of operations, and financial condition.
The conflicts in Ukraine and Israel and related price volatility and geopolitical instability has negatively impacted and may continue to negatively impact our business.(*)
In late February 2022, Russia launched significant military action against Ukraine. In October 2023, following a series of coordinated attacks, conducted by the Palestinian Islamist militant group Hamas, from the Gaza Strip onto bordering areas in Israel, Israel began air strikes against Hamas, and may in the future begin a ground war. The Israel/Hamas conflict is threatening to spread, and may in the future spread, into other Middle Eastern countries. The conflicts have caused, and could intensify, volatility in natural gas, oil and natural gas liquid prices, and the extent and duration of the military actions, sanctions and resulting market disruptions could be significant and could potentially have a substantial negative impact on the global economy and/or our business for an unknown period of time. We believe that the late 2022 increase in crude oil prices was partially due to the impact of the conflict between Russia and Ukraine on the global commodity and financial markets, and in response to economic and trade sanctions that certain countries have imposed on Russia. Any such volatility and disruptions may also magnify the impact of other risks described herein and in our Annual Report on Form 10-K.
Our arrangement with Macquarie exposes us to Macquarie-related credit and performance risk as well as potential refinancing risks.(*)
In April 2022, we entered into several agreements with Macquarie to support the operations of the Mobile Refinery, including a Supply and Offtake Agreement. On May 26, 2023, Vertex Renewables entered into a Supply and Offtake Agreement with Macquarie, pertaining to the supply and financing of renewable biomass feedstocks used for the production of renewable fuels, the offtake and financing of renewable diesel, and the provision of certain financing accommodations with respect to certain agreed environmental attributes at the Mobile Refinery. Pursuant to the Supply and Offtake Agreements, Macquarie has agreed to intermediate crude oil supplies and refined product inventories, and renewable diesel supplies and product inventories, at the Mobile Refinery. Macquarie will own all of the crude oil and renewable diesel in our tanks and substantially all of our refined and finished product inventories prior to our sale of the inventories.
Should Macquarie terminate the Supply and Offtake Agreements with 180 days written notice, we would need to seek alternative sources of financing, including the requirement upon termination to repurchase the inventory at then current market prices. In addition, the cost of repurchasing the inventory may be at higher prices than we sold the inventory. If this is the case at the time of termination, we could suffer significant reductions in liquidity when Macquarie terminates the Supply and Offtake Agreements and we have to repurchase the inventories. We may also be unable to enter into a similar relationship with a third party which may impair our ability to operate the Mobile Refinery and purchase inventory therefore, which could have a material adverse effect on our operations and cash flows.
If we are unable to obtain crude oil supplies, soybean oil and other renewable diesel raw materials, for our Mobile Refinery without the benefit of certain intermediation agreements, the capital required to finance our crude oil supply could negatively impact our liquidity.(*)
All of the crude oil and all of the soybean oil delivered at our Mobile Refinery are subject to our Supply and Offtake Agreements with Macquarie. If we are unable to obtain our crude oil supply and/or soybean oil supply for our refinery under these agreements, our exposure to crude oil and soybean oil pricing risks may increase as the number of days between when we pay for the crude oil and soybean oil and when the crude oil and soybean oil is delivered to us increases. Such increased exposure could negatively impact our liquidity position due to the increase in working capital used to acquire crude oil and soybean oil inventories for our refineries.
The prices of crude oil, soybean oil, renewable diesel and refined and finished lubricant products materially affect our profitability, and are dependent upon many factors that are beyond our control, including general market demand and economic conditions, seasonal and weather-related factors, regional and grade differentials and governmental regulations and policies.(*)
Among these factors is the demand for crude oil, soybean oil, renewable diesel and refined and finished lubricant products, which is largely driven by the conditions of local and worldwide economies, as well as by weather patterns, changes in consumer preferences and the taxation of these products relative to other energy sources. Governmental regulations and policies, particularly in the areas of taxation, energy and the environment, and the setting of interest rates. Operating results can be affected by these industry factors, product and crude pipeline capacities, crude oil differentials (including regional and grade differentials), production of soybeans, changes in transportation costs, accidents or interruptions in transportation, competition in the particular geographic areas that we serve, global market conditions, actions by foreign nations and factors that are specific to us, such as the efficiency of our refinery operations. The demand for crude oil, soybean oil, renewable diesel and refined and finished lubricant products can also be reduced due to a local or national recession or other adverse economic condition, which results in lower spending by businesses and consumers on gasoline and diesel fuel, higher gasoline prices due to higher crude oil prices, a shift by consumers to more fuel-efficient vehicles or alternative fuel vehicles (such as ethanol or wider adoption of gas/electric hybrid vehicles), or an increase in vehicle fuel economy, whether as a result of technological advances by manufacturers, legislation mandating or encouraging higher fuel economy or the use of alternative fuel.
We do not produce crude oil or soybean oil and must purchase all of our crude oil and soybean oil, the price of which fluctuates based upon worldwide and local market conditions. Our profitability depends largely on the spread between market prices for refined petroleum products and crude oil prices and soybean oil and renewable diesel. These margins are continually changing and may fluctuate significantly from time to time. Crude oil and refined products and crude oil prices and soybean oil are commodities whose price levels are determined by market forces beyond our control. For example, the reversal of certain existing pipelines or the construction of certain new pipelines transporting additional crude oil or refined products to markets that serve competing refineries could affect the market dynamic that has allowed us to take advantage of favorable pricing. Additionally, extreme weather conditions may affect the production of soybeans which in turn may affect the price and availability of soybean oil. A deterioration of crack spreads or price differentials between domestic and foreign crude oils, or between the price of soybean oil and renewable diesel, could have a material adverse effect on our business, financial condition, results of operations and cash flows.
Additionally, due to the seasonality of refined products markets and refinery maintenance schedules, results of operations for any particular fiscal quarter are not necessarily indicative of results for the full year and can vary year to year in the event of unseasonably cool weather in the summer months and/or unseasonably warm weather in the winter months in the markets in which we sell our petroleum products. In general, prices for refined products are influenced by the price of crude oil and the prices of renewable diesel are influenced by the price of renewable diesel feedstock such as soybean oil. Although an increase or decrease in the price for crude oil and/or soybean oil may result in a similar increase or decrease in prices for refined products, there may be a time lag in the realization of the similar increase or decrease in prices for refined products. The effect of changes in crude oil and/or soybean oil prices on operating results, therefore, depends in part on how quickly refined product prices adjust to reflect these changes. A substantial or prolonged increase in crude oil and/or soybean oil prices without a corresponding increase in refined product prices, a substantial or prolonged decrease in refined product prices without a corresponding decrease in crude oil and/or soybean oil prices, or a substantial or prolonged decrease in demand for refined products could have a significant negative effect on our earnings and cash flow. Also, our crude oil, soybean oil and refined products inventories are valued at the lower of cost or market under the first-in, first-out (“FIFO”) inventory valuation methodology, excluding commodity inventories at the Mobile Refinery which use the weighted average inventory accounting method. If the market value of our inventory were to decline to an amount less than our FIFO cost, we would record a write-down of inventory and a non-cash charge to cost of products sold even when there is no underlying economic impact at that point in time. Continued volatility in crude oil and/or soybean oil and refined products prices could result in lower of cost or market inventory charges in the future, or in reversals reducing cost of products sold in subsequent periods should prices recover.
The Offtake Agreement with Idemitsu may be terminated prior to the end of the initial term thereof, and we may face termination fees in connection therewith.(*)
On February 14, 2022, Vertex Refining entered into a Master Offtake Agreement dated February 4, 2022 with Idemitsu Apollo Renewable Corp. (“Idemitsu”). Pursuant to the Offtake Agreement, Vertex Refining agreed to sell Idemitsu renewable diesel which is produced by the Mobile Refinery. The initial term of the Offtake Agreement commenced on the date that the conversion was completed (“COD”) and continues for a period of five years thereafter, subject to certain early termination provisions set forth in the agreement, including, but not limited to, the right of either party to request a review of the terms of the agreement prior to the commencement of the 4th and 5th contract years of the agreement, which, if triggered, and if the parties fail to mutually agree in writing to any such requested revisions, will result in the agreement expiring three years or four years after COD, as applicable. The parties may mutually agree to extend the term of the agreement beyond the initial term pursuant to the terms of the Offtake Agreement. The Offtake Agreement may be terminated pursuant to its terms, may be terminated prior to the end of its initial stated term, we may face termination fees in connection with such termination, and any of the above may cause a material adverse effect on our results of operations and financial condition and may cause the value of our common stock to decline in value.
We are subject to various federal, state, and local rules requiring us to control the release of pollutants into the environment, which may require us to incur material liabilities.
Like other petroleum refiners, we are subject to numerous federal, state, and local environmental laws and regulations. These laws generally provide for control of pollutants released into the environment and require responsible parties to undertake remediation of hazardous waste disposal. These governmental entities may also propose or assess fines or require corrective actions for these asserted violations. As of September 30, 2023 and December 31, 2022, we have $1.4 million recorded in accrued liabilities for anticipated environment clean-up costs. Future environmental clean-up costs, fines or other required corrective actions in the future may be material, and may have a material adverse effect on our cash flows, results of operations, and the value of our securities.
Our outstanding options and convertible securities may adversely affect the trading price of our common stock.(*)
As of the date of the filing, we had (i) outstanding stock options to purchase an aggregate of 3.4 million shares of common stock at a weighted average exercise price of $3.08 per share; (ii) outstanding warrants to purchase 2.6 million shares of common stock at an exercise price of $4.50 per share and 0.2 million shares of common stock at an exercise price of $9.25 per share; and (iii) outstanding Convertible Senior Notes which may be converted into a maximum of 3.6 million shares of common stock, based on the initial maximum conversion rate of 233.6449 shares of the Company’s common stock per $1,000 principal amount of Convertible Senior Notes, which are subject to customary and other adjustments described in the Indenture governing the Convertible Senior Notes. For the life of the options and warrants, the holders have the opportunity to profit from a rise in the market price of our common stock without assuming the risk of ownership. The issuance of shares upon the exercise of outstanding securities will also dilute the ownership interests of our existing stockholders.
The availability of these shares for public resale, as well as any actual resales of these shares, could adversely affect the trading price of our common stock. We cannot predict the size of future issuances of our common stock pursuant to the exercise of outstanding options or warrants or conversion of other securities, or the effect, if any, that future issuances and sales of shares of our common stock may have on the market price of our common stock. Sales or distributions of substantial amounts of our common stock (including shares issued in connection with an acquisition), or the perception that such sales could occur, may cause the market price of our common stock to decline.
In addition, the common stock issuable upon exercise/conversion of outstanding convertible securities may represent overhang that may also adversely affect the market price of our common stock. Overhang occurs when there is a greater supply of a company’s stock in the market than there is demand for that stock. When this happens the price of our stock will decrease, and any additional shares which stockholders attempt to sell in the market will only further decrease the share price. If the share volume of our common stock cannot absorb shares sold by holders of our outstanding convertible securities, then the value of our common stock will likely decrease.
Item 2. Recent Sales of Unregistered Securities
There have been no sales of unregistered securities during the quarter ended September 30, 2023, and for the period from October 1, 2023, to the filing date of this report that have not previously been disclosed in a Current Report on Form 8-K.
Use of Proceeds from Sale of Registered Securities
None.
Purchases of Equity Securities by the Issuer and Affiliate Purchasers
None.
Item 3. Defaults Upon Senior Securities
None.
Item 4. Mine Safety Disclosures
Not applicable.
Item 5. Other Information.
a) Clawback Policies. Effective on November 6, 2023, the Board of Directors of the Company approved the adoption of a Policy for the Recovery of Erroneously Awarded Incentive Based Compensation (the “Clawback Policy”), with an effective date of October 2, 2023, in order to comply with the final clawback rules adopted by the Securities and Exchange Commission under Section 10D and Rule 10D-1 of the Securities Exchange Act of 1934, as amended (“Rule 10D-1”), and the listing standards, as set forth in the Nasdaq Listing Rule 5608 (the “Final Clawback Rules”).
The Clawback Policy provides for the mandatory recovery of erroneously awarded incentive-based compensation from current and former executive officers as defined in Rule 10D-1 (“Covered Officers”) of the Company in the event that the Company is required to prepare an accounting restatement, in accordance with the Final Clawback Rules. The recovery of such compensation applies regardless of whether a Covered Officer engaged in misconduct or otherwise caused or contributed to the requirement of an accounting restatement. Under the Clawback Policy, the Board of Directors may recoup from the Covered Officers erroneously awarded incentive compensation received within a lookback period of the three completed fiscal years preceding the date on which the Company is required to prepare an accounting restatement.
Also effective on November 6, 2023, the Board of Directors approved a First Amendment to the Company’s prior Clawback and Forfeiture Policy, to remove prior language about that Clawback and Forfeiture Policy being the applicable plan under Rule 10D-1 (the “First Amendment to Policy”).
The foregoing summary of the Clawback Policy and First Amendment to Policy does not purport to be complete and is qualified in its entirety by reference to the full text of the Clawback Policy and First Amendment to Policy, copies of which are attached hereto as Exhibits 10.2 and 10.3, to this Report.
(b) None.
(c) Rule 10b5-1 Trading Plans. During the quarter ended September 30, 2023, none of the Company’s directors or officers (as defined in Rule 16a-1(f)) adopted or terminated any contract, instruction or written plan for the purchase or sale of Company securities that was intended to satisfy the affirmative defense conditions of Rule 10b5-1(c) or any “non-Rule 10b5-1 trading arrangement.”
Item 6. Exhibits
| | | | | | | | | | | | | | | | | | | | | | | | | | | | | | | | | | | | | | |
|
| Incorporated by Reference |
| Exhibit Number | | Description of Exhibit | | Filed or Furnished Herewith | | Form | | Exhibit | | Filing Date/Period End Date | | File No. |
|
| 10.1+ | | | | | | 8-K | | 10.1 | | 9/19/2023 | | 001-11476 |
| 10.2# | | | | X | | | | | | | | |
| 10.3 | | | | X | | | | | | | | |
| 31.1* | | | | X | | | | | | | | |
| 31.2* | | | | X | | | | | | | | |
| 32.1** | | | | X | | | | | | | | |
| 32.2** | | | | X | | | | | | | | |
| 101* | | Inline XBRL Document Set for the condensed consolidated financial statements and accompanying notes in Part I, Item 1, “Financial Statements” of this Quarterly Report on Form 10-Q | | X | | | | | | | | |
| 101.INS* | | Inline XBRL Instance Document- the instance document does not appear in the Interactive Data File because its XBRL tags are embedded within the Inline XBRL document. | | X | | | | | | | | |
| 101.SCH* | | Inline XBRL Taxonomy Extension Schema Document | | X | | | | | | | | |
| 101.CAL* | | Inline XBRL Taxonomy Extension Calculation Linkbase Document | | X | | | | | | | | |
| 101.DEF* | | Inline XBRL Taxonomy Extension Definition Linkbase Document | | X | | | | | | | | |
| 101.LAB* | | Inline XBRL Taxonomy Extension Label Linkbase Document | | X | | | | | | | | |
| 101.PRE* | | Inline XBRL Taxonomy Extension Presentation Linkbase Document | | X | | | | | | | | |
| 104* | | Inline XBRL for the cover page of this Quarterly Report on Form 10-Q, included in the Exhibit 101 Inline XBRL Document Set | | X | | | | | | | | |
* Filed herewith.
** Furnished herewith.
# Indicates management contract or compensatory plan or arrangement.
+ Certain schedules, annexes and similar attachments have been omitted pursuant to Item 601(a)(5) of Regulation S-K. A copy of any omitted schedule or exhibit will be furnished supplementally to the Securities and Exchange Commission upon request; provided, however that Vertex Energy, Inc. may request confidential treatment pursuant to Rule 24b-2 of the Securities Exchange Act of 1934, as amended, for any schedule or exhibit so furnished.
SIGNATURES
Pursuant to the requirements of the Securities Exchange Act of 1934, the registrant has duly caused this Report to be signed on its behalf by the undersigned, hereunto duly authorized.
| | | | | |
| | VERTEX ENERGY, INC. |
| |
| Date: November 6, 2023 | By: /s/ Benjamin P. Cowart |
| Benjamin P. Cowart |
| | Chief Executive Officer |
| | (Principal Executive Officer) |
| | |
| |
| Date: November 6, 2023 | By: /s/ Chris Carlson |
| Chris Carlson |
| | Chief Financial Officer |
| | (Principal Financial/Accounting Officer) |