Exhibit 99.1

|
Second Quarter 2023
Earnings Results
Media Relations: Tony Fratto 212-902-5400 Investor Relations: Carey Halio 212-902-0300
|
||
|
The Goldman Sachs Group, Inc. 200 West Street | New York, NY 10282
|
Second Quarter 2023 Earnings Results
Goldman Sachs Reports Second Quarter Earnings Per Common Share of $3.08 and Increases the Quarterly Dividend to $2.75 Per Common Share in the Third Quarter
|
“This quarter reflects continued strategic execution of our goals. Global Banking & Markets delivered solid returns in an environment with cyclically low activity levels and we remained #1 in completed M&A – a testament to our world-class client franchise. Asset & Wealth Management produced record AUS, record Management and other fees and record net revenues in Private banking and lending. I remain fully confident that continued execution will enable us to deliver on our through-the-cycle return targets and create significant value for shareholders.” |
|
- David Solomon, Chairman and Chief Executive Officer
|
|
Financial Summary
|
|
|
|
|
| |||||||||
|
Net Revenues
|
Net Earnings
|
EPS
| ||||||||||
|
2Q23 $10.90 billion
|
2Q23 $1.22 billion
|
2Q23 $3.08
| ||||||||||
|
2Q23 YTD $23.12 billion
|
2Q23 YTD $4.45 billion
|
2Q23 YTD $11.91
| ||||||||||
|
Annualized ROE1
|
Annualized ROTE1
|
Book Value Per Share
| ||||||||||
|
2Q23 4.0%
|
2Q23 4.4%
|
2Q23 $309.33
| ||||||||||
|
2Q23 YTD 7.8%
|
2Q23 YTD 8.5%
|
YTD Growth 1.9%
|
||||||||||
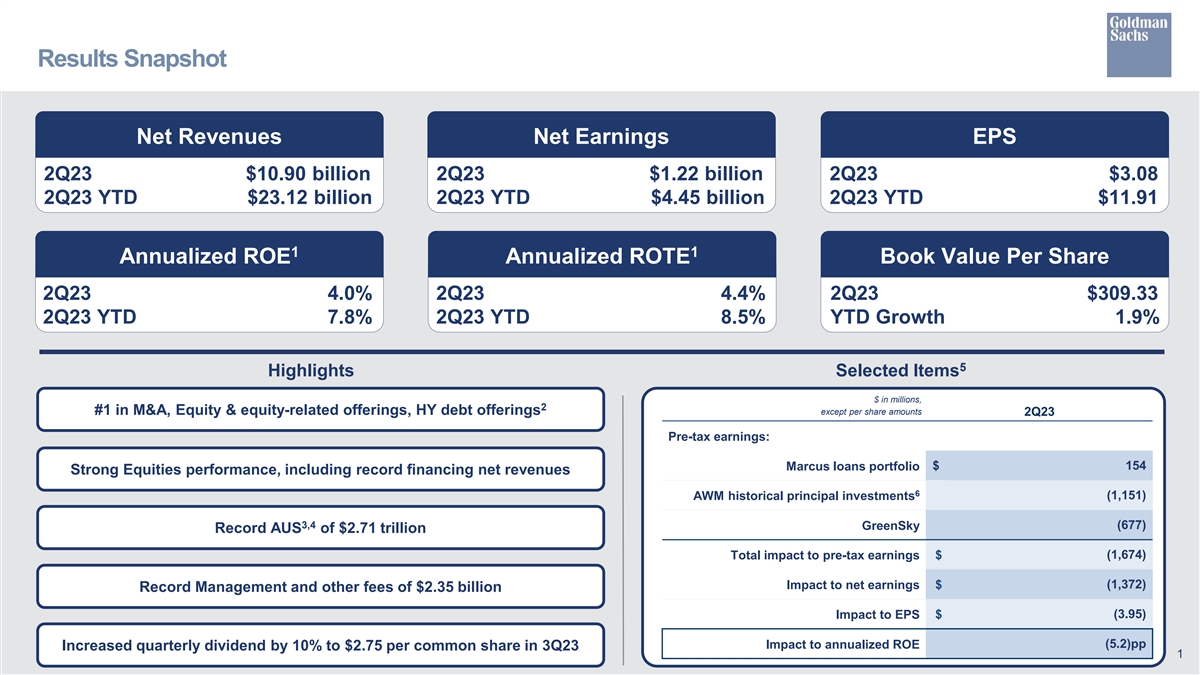
NEW YORK, July 19, 2023 – The Goldman Sachs Group, Inc. (NYSE: GS) today reported net revenues of $10.90 billion and net earnings of $1.22 billion for the second quarter ended June 30, 2023. Net revenues were $23.12 billion and net earnings were $4.45 billion for the first half of 2023.
Diluted earnings per common share (EPS) was $3.08 for the second quarter of 2023 compared with $7.73 for the second quarter of 2022 and $8.79 for the first quarter of 2023, and was $11.91 for the first half of 2023 compared with $18.47 for the first half of 2022.
Annualized return on average common shareholders’ equity (ROE)1 was 4.0% for the second quarter of 2023 and 7.8% for the first half of 2023. Annualized return on average tangible common shareholders’ equity (ROTE)1 was 4.4% for the second quarter of 2023 and 8.5% for the first half of 2023.
1
Goldman Sachs Reports
Second Quarter 2023 Earnings Results
Highlights
| ◾ | Global Banking & Markets generated quarterly net revenues of $7.19 billion, driven by strong performance in Equities, which included record quarterly net revenues in Equities financing. |
| ◾ | The firm ranked #1 in worldwide announced and completed mergers and acquisitions, equity and equity-related offerings, common stock offerings, and high-yield debt offerings for the year-to-date.2 |
| ◾ | Asset & Wealth Management generated quarterly net revenues of $3.05 billion, including record Management and other fees and record Private banking and lending net revenues. |
| ◾ | Assets under supervision3,4 increased $42 billion during the quarter to a record $2.71 trillion. |
| ◾ | Platform Solutions generated quarterly net revenues of $659 million, 92% higher than the amount in the prior year period. |
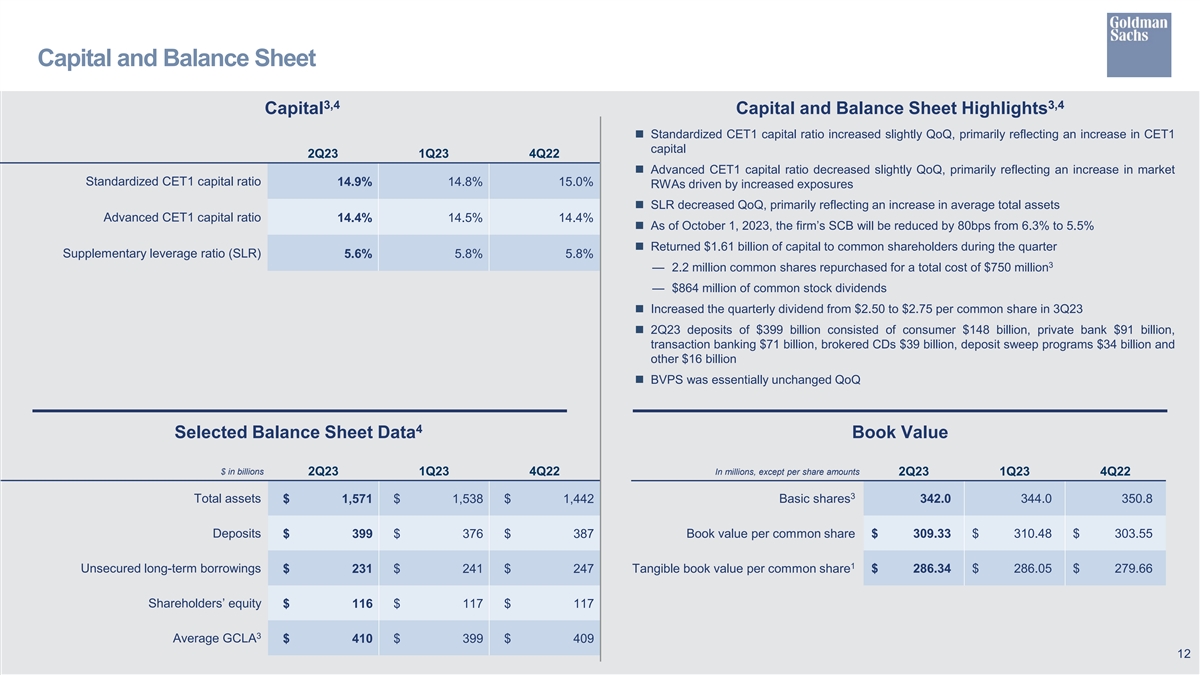
| ◾ | On June 28, 2023, the Federal Reserve notified the firm of its stress capital buffer (SCB) of 5.5%, which will become effective on October 1, 2023, a reduction of 80 basis points from the current SCB. |
| ◾ | On July 17, 2023, the Board of Directors of The Goldman Sachs Group, Inc. approved a 10% increase in the quarterly dividend to $2.75 per common share beginning in the third quarter of 2023. |
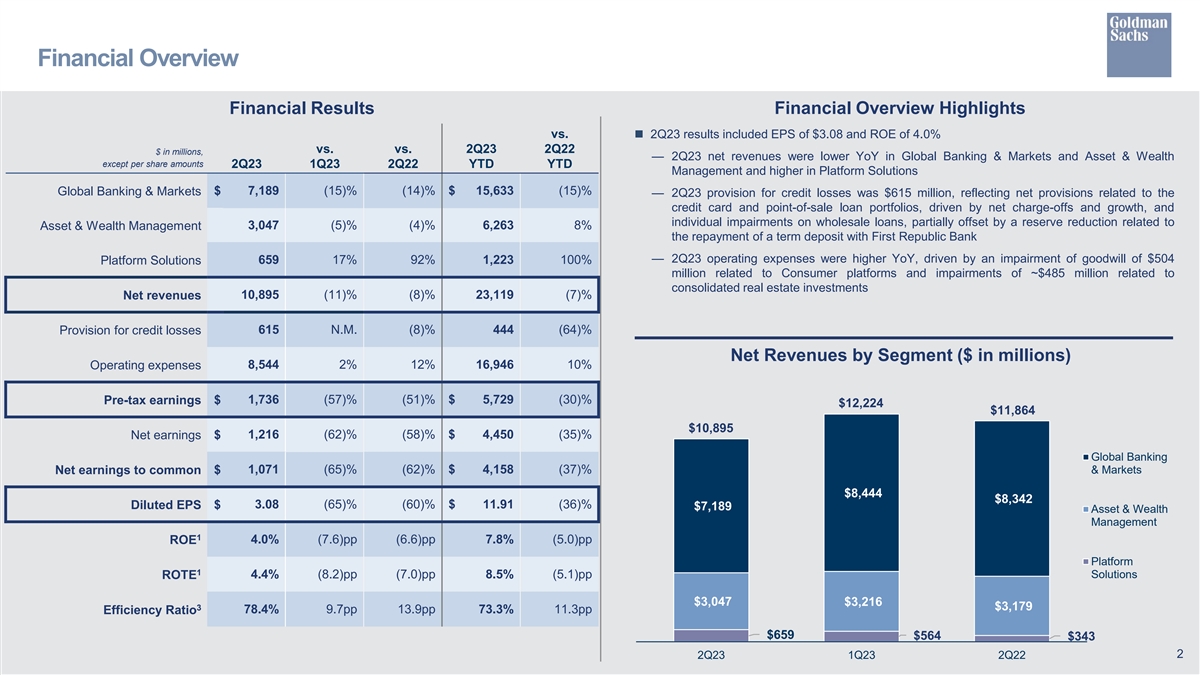
Net Revenues
| Net revenues were $10.90 billion for the second quarter of 2023, 8% lower than the second quarter of 2022 and 11% lower than the first quarter of 2023. The decrease compared with the second quarter of 2022 reflected lower net revenues in Global Banking & Markets and slightly lower net revenues in Asset & Wealth Management, partially offset by higher net revenues in Platform Solutions. |
|
Net Revenues
| ||
|
$10.90 billion
| ||||
2
Goldman Sachs Reports
Second Quarter 2023 Earnings Results
|
|
Global Banking & Markets |
|
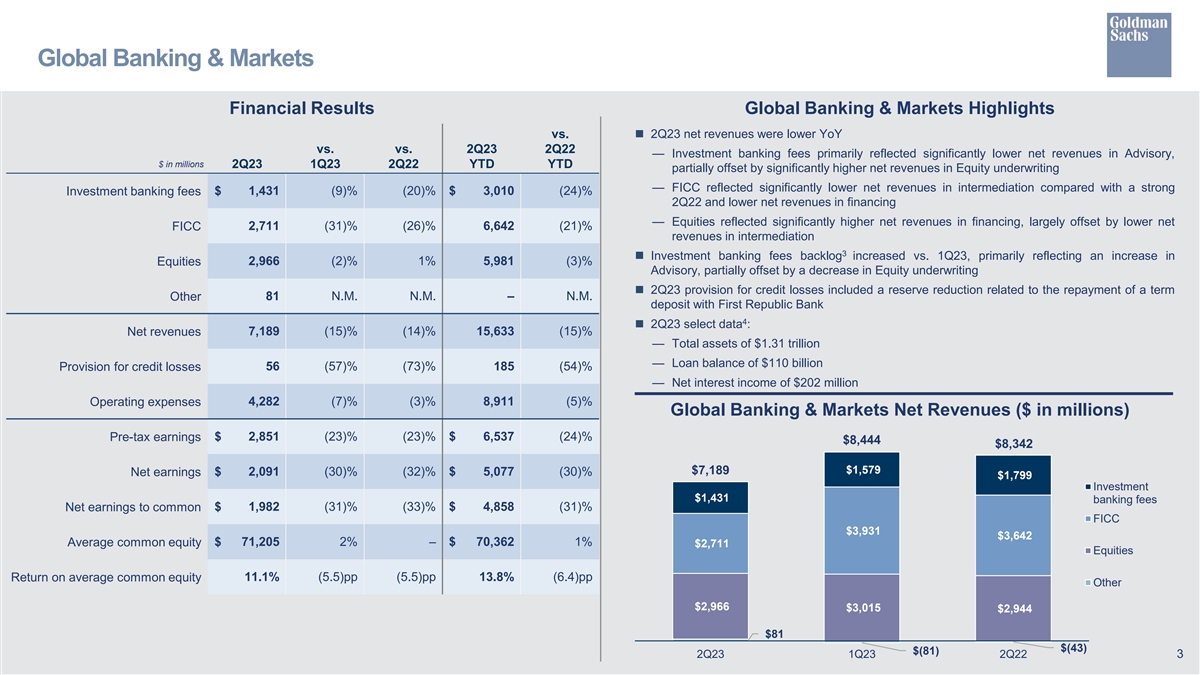
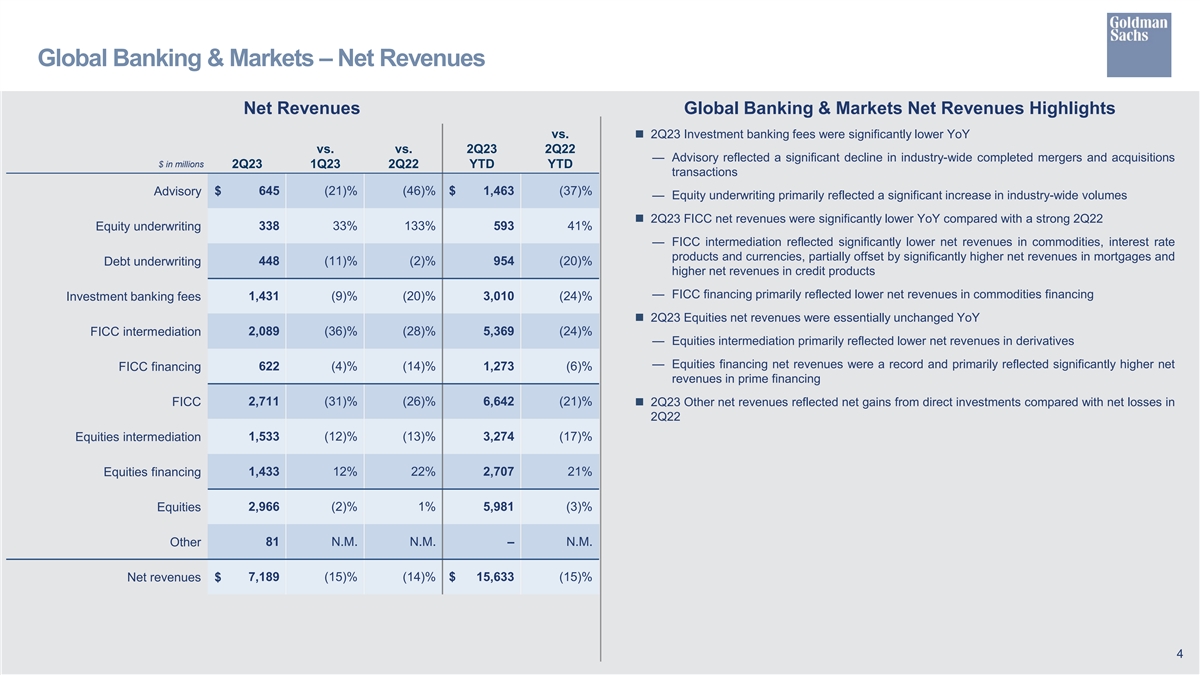
| Net revenues in Global Banking & Markets were $7.19 billion for the second quarter of 2023, 14% lower than the second quarter of 2022 and 15% lower than the first quarter of 2023.
Investment banking fees were $1.43 billion, 20% lower than the second quarter of 2022, primarily due to significantly lower net revenues in Advisory, reflecting a significant decline in industry-wide completed mergers and acquisitions transactions, partially offset by significantly higher net revenues in Equity underwriting, primarily reflecting a significant increase in industry-wide volumes. The firm’s Investment banking fees backlog3 was higher compared with the end of the first quarter of 2023, but lower compared with the end of 2022.
Net revenues in FICC were $2.71 billion, 26% lower than a strong second quarter of 2022, primarily reflecting significantly lower net revenues in FICC intermediation, driven by significantly lower net revenues in commodities, interest rate products and currencies, partially offset by significantly higher net revenues in mortgages and higher net revenues in credit products. Net revenues in FICC financing were lower, primarily in commodities financing.
Net revenues in Equities were $2.97 billion, essentially unchanged compared with the second quarter of 2022, due to significantly higher net revenues in Equities financing, primarily in prime financing, largely offset by lower net revenues in Equities intermediation, primarily in derivatives.
Net revenues in Other were $81 million compared with $(43) million for the second quarter of 2022, driven by net gains from direct investments compared with net losses in the prior year period. |
Global Banking & Markets
| |||
|
$7.19 billion
| ||||
| Advisory |
$ 645 million | |||
| Equity underwriting |
$ 338 million | |||
| Debt underwriting |
$ 448 million | |||
| Investment banking fees |
$ 1.43 billion | |||
|
FICC intermediation |
$ 2.09 billion | |||
| FICC financing |
$ 622 million | |||
| FICC |
$ 2.71 billion | |||
|
Equities intermediation |
$ 1.53 billion | |||
| Equities financing |
$ 1.43 billion | |||
| Equities |
$ 2.97 billion | |||
|
Other |
$ 81 million | |||
|
|
Asset & Wealth Management |
|
| Net revenues in Asset & Wealth Management were $3.05 billion for the second quarter of 2023, 4% lower than the second quarter of 2022 and 5% lower than the first quarter of 2023. The decrease compared with the second quarter of 2022 reflected significantly higher net losses in Equity investments, significantly lower Incentive fees and significantly lower net revenues in Debt investments, partially offset by significantly higher net revenues in Private banking and lending and slightly higher Management and other fees.
The increase in net losses in Equity investments primarily reflected net losses from real estate investments compared with net gains in the prior year period, partially offset by significantly lower net losses from investments in public equities. The decrease in Incentive fees was driven by significant harvesting in the prior year period. The decrease in Debt investments net revenues reflected net mark-downs in real estate investments. The increase in Private banking and lending net revenues primarily reflected the impact of higher deposit spreads and balances, as well as a gain of approximately $100 million related to the sale of substantially all of the remaining Marcus loans portfolio. The increase in Management and other fees primarily reflected the impact of higher average assets under supervision. |
Asset & Wealth Management
| |||
|
$3.05 billion
| ||||
|
Management and other fees |
$ 2.35 billion | |||
| Incentive fees |
$ 25 million | |||
| Private banking and lending |
$ 874 million | |||
| Equity investments |
$(403) million | |||
| Debt investments |
$ 197 million | |||
3
Goldman Sachs Reports
Second Quarter 2023 Earnings Results
|
|
Platform Solutions |
|
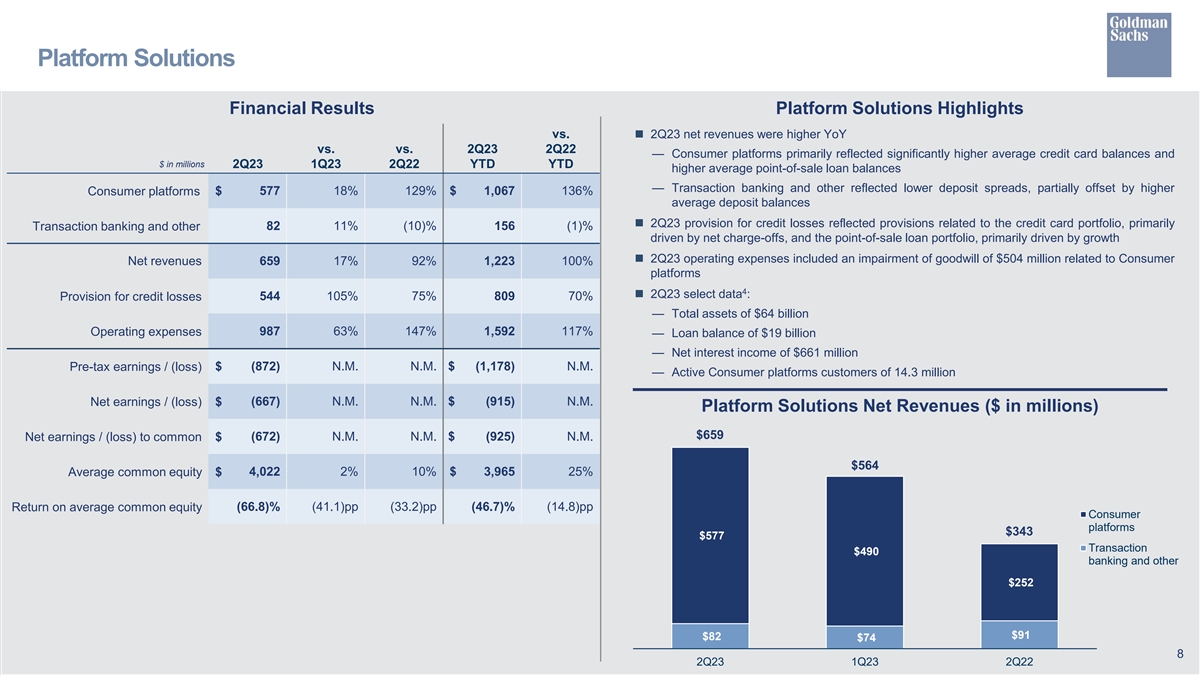
| Net revenues in Platform Solutions were $659 million for the second quarter of 2023, 92% higher than the second quarter of 2022 and 17% higher than the first quarter of 2023. The increase compared with the second quarter of 2022 reflected significantly higher net revenues in Consumer platforms.
The increase in Consumer platforms net revenues primarily reflected significantly higher average credit card balances and higher average point-of-sale loan balances. Transaction banking and other net revenues were lower, reflecting lower deposit spreads, partially offset by higher average deposit balances. |
Platform Solutions
| |||||
|
$659 million
| ||||||
|
Consumer platforms |
$577 million | |||||
| Transaction banking and other
|
$ 82 million
| |||||
Provision for Credit Losses
| Provision for credit losses was $615 million for the second quarter of 2023, compared with a provision of $667 million for the second quarter of 2022 and a net benefit of $171 million for the first quarter of 2023. Provisions for the second quarter of 2023 reflected net provisions related to the credit card and point-of-sale loan portfolios, driven by net charge-offs and growth, and individual impairments on wholesale loans, partially offset by a reserve reduction related to the repayment of a term deposit with First Republic Bank. Provisions for the second quarter of 2022 reflected portfolio growth (primarily in credit cards) and the impact of broad macroeconomic concerns. |
Provision for Credit Losses | |||||
|
$615 million
| ||||||
Operating Expenses
| Operating expenses were $8.54 billion for the second quarter of 2023, 12% higher than the second quarter of 2022 and 2% higher than the first quarter of 2023. The firm’s efficiency ratio3 was 73.3% for the first half of 2023, compared with 62.0% for the first half of 2022.
The increase in operating expenses compared with the second quarter of 2022 reflected an impairment of goodwill of $504 million related to Consumer platforms and impairments of approximately $485 million related to consolidated real estate investments (both in depreciation and amortization).
The ratio of compensation and benefits to net revenues, net of provision for credit losses, was 34.0% for the first half of 2023, compared with 33.0% for the first quarter of 2023.
Net provisions for litigation and regulatory proceedings for the second quarter of 2023 were $19 million compared with $91 million for the second quarter of 2022.
Headcount decreased 2% compared with the end of the first quarter of 2023. |
Operating Expenses | |||||
|
$8.54 billion
| ||||||
|
YTD Efficiency Ratio | ||||||
|
73.3%
| ||||||
4
Goldman Sachs Reports
Second Quarter 2023 Earnings Results
Provision for Taxes
| The effective income tax rate for the first half of 2023 was 22.3%, up from 19.0% for the first quarter of 2023, primarily due to the impact of an increase in taxes on non-U.S. earnings. |
YTD Effective Tax Rate
| |||
|
22.3%
| ||||
Other Matters
| ◾ On July 17, 2023, the Board of Directors of The Goldman Sachs Group, Inc. increased the quarterly dividend to $2.75 per common share from $2.50 per common share. The dividend will be paid on September 28, 2023 to common shareholders of record on August 31, 2023.
◾ During the quarter, the firm returned $1.61 billion of capital to common shareholders, including $750 million of common share repurchases (2.2 million shares at an average cost of $335.03) and $864 million of common stock dividends.3
◾ Global core liquid assets3 averaged $410 billion4 for the second quarter of 2023, compared with an average of $399 billion for the first quarter of 2023. |
Declared Quarterly Dividend Per Common Share
| |||
|
$2.75
| ||||
|
Common Share Repurchases
| ||||
|
2.2 million shares for $750 million
| ||||
|
Average GCLA
| ||||
|
$410 billion
| ||||
5
Goldman Sachs Reports
Second Quarter 2023 Earnings Results
The Goldman Sachs Group, Inc. is a leading global financial institution that delivers a broad range of financial services to a large and diversified client base that includes corporations, financial institutions, governments and individuals. Founded in 1869, the firm is headquartered in New York and maintains offices in all major financial centers around the world.
|
|
Cautionary Note Regarding Forward-Looking Statements |
|
This press release contains “forward-looking statements” within the meaning of the safe harbor provisions of the U.S. Private Securities Litigation Reform Act of 1995. Forward-looking statements are not historical facts or statements of current conditions, but instead represent only the firm’s beliefs regarding future events, many of which, by their nature, are inherently uncertain and outside of the firm’s control. It is possible that the firm’s actual results, financial condition and liquidity may differ, possibly materially, from the anticipated results, financial condition and liquidity in these forward-looking statements. For information about some of the risks and important factors that could affect the firm’s future results, financial condition and liquidity, see “Risk Factors” in Part I, Item 1A of the firm’s Annual Report on Form 10-K for the year ended December 31, 2022.
Information regarding the firm’s assets under supervision, capital ratios, risk-weighted assets, supplementary leverage ratio, balance sheet data, global core liquid assets and VaR consists of preliminary estimates. These estimates are forward-looking statements and are subject to change, possibly materially, as the firm completes its financial statements.
Statements about the firm’s Investment banking fees backlog and future results also may constitute forward-looking statements. Such statements are subject to the risk that transactions may be modified or may not be completed at all, and related net revenues may not be realized or may be materially less than expected. Important factors that could have such a result include, for underwriting transactions, a decline or weakness in general economic conditions, an outbreak or worsening of hostilities, including the escalation or continuation of the war between Russia and Ukraine, continuing volatility in the securities markets or an adverse development with respect to the issuer of the securities and, for financial advisory transactions, a decline in the securities markets, an inability to obtain adequate financing, an adverse development with respect to a party to the transaction or a failure to obtain a required regulatory approval. For information about other important factors that could adversely affect the firm’s Investment banking fees, see “Risk Factors” in Part I, Item 1A of the firm’s Annual Report on Form 10-K for the year ended December 31, 2022.
|
|
Conference Call |
|
A conference call to discuss the firm’s financial results, outlook and related matters will be held at 9:30 am (ET). The call will be open to the public. Members of the public who would like to listen to the conference call should dial 1-888-205-6786 (in the U.S.) or 1-323-794-2558 (outside the U.S.) passcode number 7042022. The number should be dialed at least 10 minutes prior to the start of the conference call. The conference call will also be accessible as an audio webcast through the Investor Relations section of the firm’s website, www.goldmansachs.com/investor-relations. There is no charge to access the call. For those unable to listen to the live broadcast, a replay will be available on the firm’s website beginning approximately three hours after the event. Please direct any questions regarding obtaining access to the conference call to Goldman Sachs Investor Relations, via e-mail, at gs-investor-relations@gs.com.
6
Goldman Sachs Reports
Second Quarter 2023 Earnings Results
The Goldman Sachs Group, Inc. and Subsidiaries
Segment Net Revenues (unaudited)
$ in millions
| THREE MONTHS ENDED | % CHANGE FROM | |||||||||||||||||||||
| JUNE 30, 2023 |
MARCH 31, 2023 |
JUNE 30, 2022 |
MARCH 31, 2023 |
JUNE 30, 2022 |
||||||||||||||||||
|
GLOBAL BANKING & MARKETS |
||||||||||||||||||||||
|
Advisory
|
|
$ 645
|
|
|
$ 818
|
|
|
$ 1,197
|
|
|
(21) %
|
|
|
(46) %
|
| |||||||
| Equity underwriting
|
|
338
|
|
|
255
|
|
|
145
|
|
|
33
|
|
|
133
|
| |||||||
| Debt underwriting
|
|
448
|
|
|
506
|
|
|
457
|
|
|
(11)
|
|
|
(2)
|
| |||||||
| Investment banking fees
|
|
1,431
|
|
|
1,579
|
|
|
1,799
|
|
|
(9)
|
|
|
(20)
|
| |||||||
| FICC intermediation
|
|
2,089
|
|
|
3,280
|
|
|
2,921
|
|
|
(36)
|
|
|
(28)
|
| |||||||
| FICC financing
|
|
622
|
|
|
651
|
|
|
721
|
|
|
(4)
|
|
|
(14)
|
| |||||||
| FICC
|
|
2,711
|
|
|
3,931
|
|
|
3,642
|
|
|
(31)
|
|
|
(26)
|
| |||||||
| Equities intermediation
|
|
1,533
|
|
|
1,741
|
|
|
1,767
|
|
|
(12)
|
|
|
(13)
|
| |||||||
| Equities financing
|
|
1,433
|
|
|
1,274
|
|
|
1,177
|
|
|
12
|
|
|
22
|
| |||||||
| Equities
|
|
2,966
|
|
|
3,015
|
|
|
2,944
|
|
|
(2)
|
|
|
1
|
| |||||||
| Other
|
|
81
|
|
|
(81)
|
|
|
(43)
|
|
|
N.M.
|
|
|
N.M.
|
| |||||||
|
Net revenues |
|
7,189
|
|
|
8,444 |
|
|
8,342 |
|
|
(15) |
|
|
(14) |
| |||||||
|
ASSET & WEALTH MANAGEMENT |
||||||||||||||||||||||
|
Management and other fees
|
|
2,354
|
|
|
2,282
|
|
|
2,243
|
|
|
3
|
|
|
5
|
| |||||||
| Incentive fees
|
|
25
|
|
|
53
|
|
|
185
|
|
|
(53)
|
|
|
(86)
|
| |||||||
| Private banking and lending
|
|
874
|
|
|
354
|
|
|
538
|
|
|
147
|
|
|
62
|
| |||||||
| Equity investments
|
|
(403)
|
|
|
119
|
|
|
(104)
|
|
|
N.M.
|
|
|
N.M.
|
| |||||||
| Debt investments
|
|
197
|
|
|
408
|
|
|
317
|
|
|
(52)
|
|
|
(38)
|
| |||||||
|
Net revenues |
|
3,047 |
|
|
3,216 |
|
|
3,179 |
|
|
(5) |
|
|
(4) |
| |||||||
|
PLATFORM SOLUTIONS |
||||||||||||||||||||||
|
Consumer platforms
|
|
577
|
|
|
490
|
|
|
252
|
|
|
18
|
|
|
129
|
| |||||||
| Transaction banking and other
|
|
82
|
|
|
74
|
|
|
91
|
|
|
11
|
|
|
(10)
|
| |||||||
|
Net revenues |
|
659 |
|
|
564 |
|
|
343 |
|
|
17 |
|
|
92 |
| |||||||
|
Total net revenues
|
|
$ 10,895
|
|
|
$ 12,224
|
|
|
$ 11,864
|
|
|
(11) |
|
|
(8) |
| |||||||
|
Geographic Net Revenues (unaudited)3 |
||||||||||||||||||||||
| $ in millions | ||||||||||||||||||||||
| THREE MONTHS ENDED | ||||||||||||||||||||||
| JUNE 30, 2023 |
MARCH 31, 2023 |
JUNE 30, 2022 |
||||||||||||||||||||
|
Americas
|
|
$ 6,801
|
|
|
$ 7,194
|
|
|
$ 6,980
|
|
|||||||||||||
| EMEA
|
|
2,868
|
|
|
3,584
|
|
|
3,429
|
|
|||||||||||||
| Asia
|
|
1,226
|
|
|
1,446
|
|
|
1,455
|
|
|||||||||||||
|
Total net revenues |
|
$ 10,895 |
|
|
$ 12,224 |
|
|
$ 11,864 |
|
|||||||||||||
| Americas
|
|
63%
|
|
|
59%
|
|
|
59%
|
|
|||||||||||||
| EMEA
|
|
26%
|
|
|
29%
|
|
|
29%
|
|
|||||||||||||
| Asia
|
|
11%
|
|
|
12%
|
|
|
12%
|
|
|||||||||||||
|
Total
|
|
100%
|
|
|
100%
|
|
|
100%
|
|
|||||||||||||
7
Goldman Sachs Reports
Second Quarter 2023 Earnings Results
The Goldman Sachs Group, Inc. and Subsidiaries
Segment Net Revenues (unaudited)
$ in millions
| SIX MONTHS ENDED | % CHANGE FROM | |||||||||||||||
| JUNE 30, 2023 |
JUNE 30, 2022 |
JUNE 30, 2022 |
||||||||||||||
|
GLOBAL BANKING & MARKETS |
||||||||||||||||
|
Advisory
|
|
$ 1,463
|
|
|
$ 2,324
|
|
|
(37) %
|
|
|||||||
| Equity underwriting |
593 | 421 | 41 | |||||||||||||
|
Debt underwriting |
954 | 1,198 | (20) | |||||||||||||
|
Investment banking fees |
3,010 | 3,943 | (24) | |||||||||||||
|
FICC intermediation |
5,369 | 7,020 | (24) | |||||||||||||
|
FICC financing |
1,273 | 1,352 | (6) | |||||||||||||
|
FICC |
6,642 | 8,372 | (21) | |||||||||||||
| Equities intermediation |
3,274 | 3,945 | (17) | |||||||||||||
|
Equities financing |
2,707 | 2,238 | 21 | |||||||||||||
|
Equities
|
|
5,981
|
|
|
6,183
|
|
|
(3)
|
|
|||||||
|
Other
|
|
–
|
|
|
(94)
|
|
|
N.M.
|
|
|||||||
|
Net revenues
|
|
15,633
|
|
|
18,404
|
|
|
(15)
|
|
|||||||
|
ASSET & WEALTH MANAGEMENT |
||||||||||||||||
|
Management and other fees |
4,636 | 4,278 | 8 | |||||||||||||
|
Incentive fees |
78 | 264 | (70) | |||||||||||||
|
Private banking and lending |
1,228 | 1,030 | 19 | |||||||||||||
|
Equity investments |
(284) | (398) | N.M. | |||||||||||||
|
Debt investments
|
|
605
|
|
|
608
|
|
|
–
|
|
|||||||
|
Net revenues
|
|
6,263
|
|
|
5,782
|
|
|
8
|
|
|||||||
|
PLATFORM SOLUTIONS |
||||||||||||||||
|
Consumer platforms
|
|
1,067
|
|
|
453
|
|
|
136
|
|
|||||||
| Transaction banking and other
|
|
156
|
|
|
158
|
|
|
(1)
|
|
|||||||
|
Net revenues
|
|
1,223
|
|
|
611
|
|
|
100
|
|
|||||||
|
Total net revenues
|
|
$ 23,119
|
|
|
$ 24,797
|
|
|
(7)
|
|
|||||||
|
Geographic Net Revenues (unaudited)3 $ in millions
|
|
|||||||||||||||
| SIX MONTHS ENDED | ||||||||||||||||
| JUNE 30, 2023 |
JUNE 30, 2022 |
|||||||||||||||
| Americas |
$ 13,995 | $ 14,314 | ||||||||||||||
|
EMEA |
6,452 | 7,300 | ||||||||||||||
|
Asia
|
|
2,672
|
|
|
3,183
|
|
||||||||||
|
Total net revenues |
|
$ 23,119
|
|
|
$ 24,797
|
|
||||||||||
| Americas |
60% | 58% | ||||||||||||||
|
EMEA |
28% | 29% | ||||||||||||||
|
Asia
|
|
12%
|
|
|
13%
|
|
||||||||||
|
Total
|
|
100%
|
|
|
100%
|
|
||||||||||
8
Goldman Sachs Reports
Second Quarter 2023 Earnings Results
The Goldman Sachs Group, Inc. and Subsidiaries
Consolidated Statements of Earnings (unaudited)
In millions, except per share amounts and headcount
| THREE MONTHS ENDED | % CHANGE FROM | |||||||||||||||||||||||||
| JUNE 30, 2023 |
MARCH 31, 2023 |
JUNE 30, 2022 |
MARCH 31, 2023 |
JUNE 30, 2022 |
||||||||||||||||||||||
|
REVENUES |
||||||||||||||||||||||||||
|
Investment banking |
$ 1,432 | $ 1,578 | $ 1,799 | (9) % | (20) % | |||||||||||||||||||||
|
Investment management |
2,356 | 2,289 | 2,394 | 3 | (2) | |||||||||||||||||||||
|
Commissions and fees |
893 | 1,088 | 1,071 | (18) | (17) | |||||||||||||||||||||
|
Market making |
4,351 | 5,433 | 4,913 | (20) | (11) | |||||||||||||||||||||
|
Other principal transactions
|
|
179
|
|
|
55
|
|
|
(47)
|
|
|
225
|
|
|
N.M.
|
|
|||||||||||
|
Total non-interest revenues
|
|
9,211
|
|
|
10,443
|
|
|
10,130
|
|
|
(12)
|
|
|
(9)
|
|
|||||||||||
| Interest income
|
16,836 | 14,938 | 4,851 | 13 | 247 | |||||||||||||||||||||
| Interest expense
|
|
15,152
|
|
|
13,157
|
|
|
3,117
|
|
|
15
|
|
|
386
|
|
|||||||||||
|
Net interest income
|
|
1,684
|
|
|
1,781
|
|
|
1,734
|
|
|
(5)
|
|
|
(3)
|
|
|||||||||||
|
Total net revenues
|
|
10,895
|
|
|
12,224
|
|
|
11,864
|
|
|
(11)
|
|
|
(8)
|
|
|||||||||||
|
Provision for credit losses
|
|
615
|
|
|
(171)
|
|
|
667
|
|
|
N.M.
|
|
|
(8)
|
|
|||||||||||
|
OPERATING EXPENSES
|
||||||||||||||||||||||||||
|
Compensation and benefits |
3,619 | 4,090 | 3,695 | (12) | (2) | |||||||||||||||||||||
|
Transaction based |
1,385 | 1,405 | 1,317 | (1) | 5 | |||||||||||||||||||||
|
Market development |
146 | 172 | 235 | (15) | (38) | |||||||||||||||||||||
|
Communications and technology |
482 | 466 | 444 | 3 | 9 | |||||||||||||||||||||
|
Depreciation and amortization |
1,594 | 970 | 570 | 64 | 180 | |||||||||||||||||||||
|
Occupancy |
253 | 265 | 259 | (5) | (2) | |||||||||||||||||||||
|
Professional fees |
392 | 383 | 490 | 2 | (20) | |||||||||||||||||||||
|
Other expenses
|
673 | 651 | 643 | 3 | 5 | |||||||||||||||||||||
|
Total operating expenses
|
|
8,544
|
|
|
8,402
|
|
|
7,653
|
|
|
2
|
|
|
12
|
|
|||||||||||
| Pre-tax earnings
|
1,736 | 3,993 | 3,544 | (57) | (51) | |||||||||||||||||||||
| Provision for taxes
|
520 | 759 | 617 |
|
(31)
|
|
|
(16)
|
|
|||||||||||||||||
|
Net earnings
|
1,216 | 3,234 | 2,927 |
|
(62)
|
|
|
(58)
|
|
|||||||||||||||||
| Preferred stock dividends
|
145 | 147 | 141 |
|
(1)
|
|
|
3
|
|
|||||||||||||||||
|
Net earnings applicable to common shareholders
|
|
$ 1,071
|
|
|
$ 3,087
|
|
|
$ 2,786
|
|
|
(65)
|
|
|
(62)
|
|
|||||||||||
|
EARNINGS PER COMMON SHARE
|
||||||||||||||||||||||||||
|
Basic3 |
$ 3.09 | $ 8.87 | $ 7.81 | (65) % | (60) % | |||||||||||||||||||||
|
Diluted |
$ 3.08 | $ 8.79 | $ 7.73 | (65) | (60) | |||||||||||||||||||||
|
AVERAGE COMMON SHARES
|
||||||||||||||||||||||||||
| Basic |
342.3 | 346.6 | 355.0 | (1) | (4) | |||||||||||||||||||||
|
Diluted |
347.2 | 351.3 | 360.5 | (1) | (4) | |||||||||||||||||||||
|
SELECTED DATA AT PERIOD-END
|
||||||||||||||||||||||||||
|
Common shareholders’ equity |
$ 105,790 | $ 106,806 | $ 107,168 | (1) | (1) | |||||||||||||||||||||
|
Basic shares3 |
342.0 | 344.0 | 355.0 | (1) | (4) | |||||||||||||||||||||
|
Book value per common share |
$ 309.33 | $ 310.48 | $ 301.88 | – | 2 | |||||||||||||||||||||
| Headcount
|
|
44,600
|
|
|
45,400
|
|
|
47,000
|
|
|
(2)
|
|
|
(5)
|
|
|||||||||||
9
Goldman Sachs Reports
Second Quarter 2023 Earnings Results
The Goldman Sachs Group, Inc. and Subsidiaries
Consolidated Statements of Earnings (unaudited)
In millions, except per share amounts
| SIX MONTHS ENDED | % CHANGE FROM | |||||||||||||||||||
|
JUNE 30, 2023 |
JUNE 30, 2022 |
JUNE 30, 2022 |
||||||||||||||||||
|
REVENUES |
||||||||||||||||||||
|
Investment banking |
$ 3,010 | $ 3,943 | (24) % | |||||||||||||||||
|
Investment management |
4,645 | 4,464 | 4 | |||||||||||||||||
|
Commissions and fees |
1,981 | 2,074 | (4) | |||||||||||||||||
|
Market making |
9,784 | 10,942 | (11) | |||||||||||||||||
|
Other principal transactions |
234 | (187) | N.M. | |||||||||||||||||
|
Total non-interest revenues |
|
19,654 |
|
|
21,236 |
|
|
(7) |
|
|||||||||||
| Interest income |
31,774 | 8,063 | 294 | |||||||||||||||||
|
Interest expense |
28,309 | 4,502 | 529 | |||||||||||||||||
|
Net interest income |
|
3,465 |
|
|
3,561 |
|
|
(3) |
|
|||||||||||
|
Total net revenues |
23,119 | 24,797 | (7) | |||||||||||||||||
|
|
|
|
||||||||||||||||||
|
Provision for credit losses |
444 | 1,228 | (64) | |||||||||||||||||
|
OPERATING EXPENSES |
||||||||||||||||||||
|
Compensation and benefits |
7,709 | 7,778 | (1) | |||||||||||||||||
|
Transaction based |
2,790 | 2,561 | 9 | |||||||||||||||||
|
Market development |
318 | 397 | (20) | |||||||||||||||||
|
Communications and technology |
948 | 868 | 9 | |||||||||||||||||
|
Depreciation and amortization |
2,564 | 1,062 | 141 | |||||||||||||||||
|
Occupancy |
518 | 510 | 2 | |||||||||||||||||
|
Professional fees |
775 | 927 | (16) | |||||||||||||||||
|
Other expenses |
1,324 | 1,266 | 5 | |||||||||||||||||
|
Total operating expenses |
|
16,946 |
|
|
15,369 |
|
|
10 |
|
|||||||||||
| Pre-tax earnings |
5,729 | 8,200 | (30) | |||||||||||||||||
|
Provision for taxes |
1,279 | 1,334 | (4) | |||||||||||||||||
|
Net earnings |
4,450 | 6,866 | (35) | |||||||||||||||||
|
Preferred stock dividends |
292 | 249 | 17 | |||||||||||||||||
|
Net earnings applicable to common shareholders |
$ 4,158 | $ 6,617 | (37) | |||||||||||||||||
|
EARNINGS PER COMMON SHARE |
||||||||||||||||||||
|
Basic3 |
$ 12.00 | $ 18.67 | (36) % | |||||||||||||||||
|
Diluted |
$ 11.91 | $ 18.47 | (36) | |||||||||||||||||
|
AVERAGE COMMON SHARES |
||||||||||||||||||||
|
Basic |
344.4 | 353.1 | (2) | |||||||||||||||||
|
Diluted
|
|
349.2
|
|
|
358.2
|
|
|
(3)
|
|
|||||||||||
10
Goldman Sachs Reports
Second Quarter 2023 Earnings Results
The Goldman Sachs Group, Inc. and Subsidiaries
Condensed Consolidated Balance Sheets (unaudited)4
$ in billions
| AS OF | ||||||||||||||||||||||
| JUNE 30, 2023 |
MARCH 31, 2023 |
|||||||||||||||||||||
| ASSETS
|
||||||||||||||||||||||
| Cash and cash equivalents |
$ 271 | $ 229 | ||||||||||||||||||||
|
Collateralized agreements |
388 | 405 | ||||||||||||||||||||
|
Customer and other receivables |
157 | 145 | ||||||||||||||||||||
|
Trading assets |
400 | 407 | ||||||||||||||||||||
|
Investments |
138 | 132 | ||||||||||||||||||||
|
Loans |
178 | 178 | ||||||||||||||||||||
|
Other assets |
39 | 42 | ||||||||||||||||||||
|
Total assets
|
|
$ 1,571
|
|
|
$ 1,538
|
|
||||||||||||||||
|
LIABILITIES AND SHAREHOLDERS’ EQUITY
|
||||||||||||||||||||||
| Deposits |
$ 399 | $ 376 | ||||||||||||||||||||
|
Collateralized financings |
284 | 262 | ||||||||||||||||||||
|
Customer and other payables |
258 | 266 | ||||||||||||||||||||
|
Trading liabilities |
194 | 194 | ||||||||||||||||||||
|
Unsecured short-term borrowings |
70 | 65 | ||||||||||||||||||||
|
Unsecured long-term borrowings |
231 | 241 | ||||||||||||||||||||
|
Other liabilities |
19 | 17 | ||||||||||||||||||||
|
Total liabilities
|
|
1,455
|
|
|
1,421
|
|
||||||||||||||||
| Shareholders’ equity |
116 | 117 | ||||||||||||||||||||
|
Total liabilities and shareholders’ equity |
|
$ 1,571
|
|
|
$ 1,538
|
|
||||||||||||||||
|
Capital Ratios and Supplementary Leverage Ratio (unaudited)3,4 $ in billions
|
|
|||||||||||||||||||||
| AS OF | ||||||||||||||||||||||
| JUNE 30, 2023 |
MARCH 31, 2023 |
|||||||||||||||||||||
|
Common equity tier 1 capital |
$ 98.2 | $ 98.1 | ||||||||||||||||||||
|
STANDARDIZED CAPITAL RULES
|
||||||||||||||||||||||
| Risk-weighted assets |
$ 661 | $ 661 | ||||||||||||||||||||
|
Common equity tier 1 capital ratio |
14.9% | 14.8% | ||||||||||||||||||||
|
ADVANCED CAPITAL RULES
|
||||||||||||||||||||||
| Risk-weighted assets |
$ 683 | $ 678 | ||||||||||||||||||||
|
Common equity tier 1 capital ratio |
14.4% | 14.5% | ||||||||||||||||||||
|
SUPPLEMENTARY LEVERAGE RATIO
|
||||||||||||||||||||||
| Supplementary leverage ratio
|
5.6% | 5.8% | ||||||||||||||||||||
|
Average Daily VaR (unaudited)3,4 $ in millions |
|
|||||||||||||||||||||
| THREE MONTHS ENDED | ||||||||||||||||||||||
| JUNE 30, 2023 |
MARCH 31, 2023 |
|||||||||||||||||||||
|
RISK CATEGORIES
|
||||||||||||||||||||||
|
Interest rates |
$ 118 | $ 92 | ||||||||||||||||||||
|
Equity prices |
31 | 28 | ||||||||||||||||||||
|
Currency rates |
25 | 32 | ||||||||||||||||||||
|
Commodity prices |
16 | 22 | ||||||||||||||||||||
|
Diversification effect |
(73) | (73) | ||||||||||||||||||||
|
Total
|
|
$ 117
|
|
|
$ 101
|
|
||||||||||||||||
11
Goldman Sachs Reports
Second Quarter 2023 Earnings Results
The Goldman Sachs Group, Inc. and Subsidiaries
Assets Under Supervision (unaudited)3,4
$ in billions
| AS OF | ||||||||||||||||||||||||
| JUNE 30, 2023 |
MARCH 31, 2023 |
JUNE 30, 2022 |
||||||||||||||||||||||
|
ASSET CLASS
|
||||||||||||||||||||||||
| Alternative investments
|
|
$ 267
|
|
|
$ 268
|
|
|
$ 254
|
|
|||||||||||||||
| Equity
|
|
627
|
|
|
597
|
|
|
552
|
|
|||||||||||||||
| Fixed income
|
|
1,056
|
|
|
1,047
|
|
|
1,007
|
|
|||||||||||||||
|
Total long-term AUS
|
|
1,950
|
|
|
1,912
|
|
|
1,813
|
|
|||||||||||||||
| Liquidity products
|
|
764
|
|
|
760
|
|
|
682
|
|
|||||||||||||||
|
Total AUS
|
|
$ 2,714
|
|
|
$ 2,672
|
|
|
$ 2,495
|
|
|||||||||||||||
| THREE MONTHS ENDED | ||||||||||||||||||||||||
| JUNE 30, 2023 |
MARCH 31, 2023 |
JUNE 30, 2022 |
||||||||||||||||||||||
|
Beginning balance
|
$ 2,672 | $ 2,547 | $ 2,394 | |||||||||||||||||||||
| Net inflows / (outflows):
|
||||||||||||||||||||||||
| Alternative investments
|
(1) | 1 | 4 | |||||||||||||||||||||
| Equity
|
|
(3)
|
|
|
(2)
|
|
|
1
|
|
|||||||||||||||
| Fixed income
|
|
12
|
|
|
9
|
|
|
(3)
|
|
|||||||||||||||
|
Total long-term AUS net inflows / (outflows)
|
|
8
|
|
|
8
|
|
|
2
|
|
|||||||||||||||
|
Liquidity products
|
|
4
|
|
|
49
|
|
|
(7)
|
|
|||||||||||||||
| Total AUS net inflows / (outflows)
|
|
12
|
|
|
57
|
|
|
(5)
|
|
|||||||||||||||
| Acquisitions / (dispositions)
|
|
–
|
|
|
–
|
|
|
305
|
|
|||||||||||||||
| Net market appreciation / (depreciation)
|
|
30
|
|
|
68
|
|
|
(199)
|
|
|||||||||||||||
|
Ending balance
|
|
$ 2,714
|
|
|
$ 2,672
|
|
|
$ 2,495
|
|
|||||||||||||||
12
Goldman Sachs Reports
Second Quarter 2023 Earnings Results
|
Footnotes |
|
|
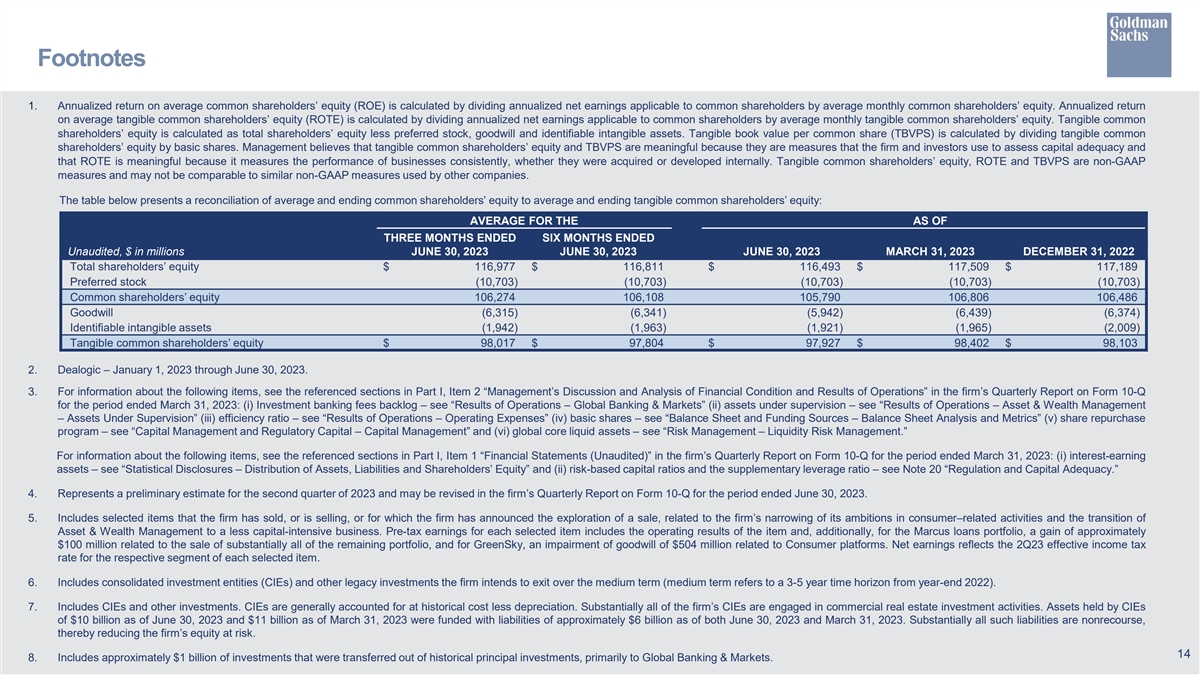
| 1. | Annualized ROE is calculated by dividing annualized net earnings applicable to common shareholders by average monthly common shareholders’ equity. Annualized ROTE is calculated by dividing annualized net earnings applicable to common shareholders by average monthly tangible common shareholders’ equity (tangible common shareholders’ equity is calculated as total shareholders’ equity less preferred stock, goodwill and identifiable intangible assets). Management believes that ROTE is meaningful because it measures the performance of businesses consistently, whether they were acquired or developed internally, and that tangible common shareholders’ equity is meaningful because it is a measure that the firm and investors use to assess capital adequacy. ROTE and tangible common shareholders’ equity are non-GAAP measures and may not be comparable to similar non-GAAP measures used by other companies. |
The table below presents a reconciliation of average common shareholders’ equity to average tangible common shareholders’ equity:
| AVERAGE FOR THE | ||||||||||||||
| Unaudited, $ in millions | THREE MONTHS ENDED JUNE 30, 2023 |
|
SIX MONTHS ENDED JUNE 30, 2023 |
|||||||||||
|
Total shareholders’ equity
|
|
$ 116,977
|
|
|
$ 116,811
|
|
||||||||
| Preferred stock
|
|
(10,703)
|
|
|
(10,703)
|
|
||||||||
|
Common shareholders’ equity
|
|
106,274
|
|
|
106,108
|
|
||||||||
|
Goodwill |
|
(6,315)
|
|
|
(6,341)
|
|
||||||||
| Identifiable intangible assets
|
|
(1,942)
|
|
|
(1,963)
|
|
||||||||
|
Tangible common shareholders’ equity
|
|
$
98,017
|
|
|
$
97,804
|
|
||||||||
| 2. | Dealogic – January 1, 2023 through June 30, 2023. |
| 3. | For information about the following items, see the referenced sections in Part I, Item 2 “Management’s Discussion and Analysis of Financial Condition and Results of Operations” in the firm’s Quarterly Report on Form 10-Q for the period ended March 31, 2023: (i) Investment banking fees backlog – see “Results of Operations – Global Banking & Markets” (ii) assets under supervision – see “Results of Operations – Asset & Wealth Management – Assets Under Supervision” (iii) efficiency ratio – see “Results of Operations – Operating Expenses” (iv) share repurchase program – see “Capital Management and Regulatory Capital – Capital Management” (v) global core liquid assets – see “Risk Management – Liquidity Risk Management” (vi) basic shares – see “Balance Sheet and Funding Sources – Balance Sheet Analysis and Metrics” and (vii) VaR – see “Risk Management – Market Risk Management.” |
For information about the following items, including changes made to the firm’s segments and reclassifications made to previously reported amounts, see the referenced sections in Part I, Item 1 “Financial Statements (Unaudited)” in the firm’s Quarterly Report on Form 10-Q for the period ended March 31, 2023: (i) risk-based capital ratios and the supplementary leverage ratio – see Note 20 “Regulation and Capital Adequacy” (ii) geographic net revenues – see Note 25 “Business Segments” and (iii) unvested share-based awards that have non-forfeitable rights to dividends or dividend equivalents in calculating basic EPS – see Note 21 “Earnings Per Common Share.”
| 4. | Represents a preliminary estimate for the second quarter of 2023 and may be revised in the firm’s Quarterly Report on Form 10-Q for the period ended June 30, 2023. |
13