| For the fiscal year ended |
Commission File Number: |
| (State or other jurisdiction of incorporation or organization) |
(I.R.S. Employer Identification No.) | |
| (Address of principal executive offices) | (Zip Code) | |
| Title of each class | Trading Symbol |
Exchange on which registered | ||
| |
||||
| Non-Cumulative Preferred Stock, Series A |
||||
| Non-Cumulative Preferred Stock, Series C |
||||
| Non-Cumulative Preferred Stock, Series D |
||||
| Fixed-to-Floating Non-Cumulative Preferred Stock, Series J |
||||
| Fixed-to-Floating Non-Cumulative Preferred Stock, Series K |
||||
| 5.793% Fixed-to-Floating |
||||
| Floating Rate |
||||
| |
||||
| Accelerated filer ☐ | Non-accelerated filer ☐ |
| Smaller reporting company |
Emerging growth company | |
Form 10-K Item Number |
Page No. | |||
| |
1 | |||
| Item 1 |
||||
| |
1 | |||
| |
1 | |||
| |
1 | |||
| |
1 | |||
| |
2 | |||
| |
4 | |||
| |
4 | |||
| |
5 | |||
| |
5 | |||
| |
8 | |||
| |
9 | |||
| |
10 | |||
| |
25 | |||
| |
26 | |||
| |
26 | |||
| Item 1A |
||||
| |
29 | |||
| Item 1B |
||||
| |
56 | |||
| Item 2 |
||||
| |
56 | |||
| Item 3 |
||||
| |
56 | |||
| Item 4 |
||||
| |
56 | |||
| |
57 | |||
| Item 5 |
||||
| |
57 | |||
Page No. | ||||
| Item 7 |
||||
| |
58 | |||
| |
58 | |||
| |
59 | |||
| |
60 | |||
| |
60 | |||
| |
63 | |||
| |
63 | |||
| |
64 | |||
| |
79 | |||
| |
82 | |||
| |
87 | |||
| |
89 | |||
| |
90 | |||
| |
90 | |||
| |
96 | |||
| |
102 | |||
| |
106 | |||
| |
114 | |||
| |
116 | |||
| Item 7A |
||||
| |
117 | |||
Goldman Sachs 2021 Form 10-K | ||
Page No. | ||||
| Item 8 |
||||
| |
117 | |||
| |
117 | |||
| |
118 | |||
| |
121 | |||
| |
121 | |||
| |
121 | |||
| |
122 | |||
| |
123 | |||
| |
124 | |||
| |
125 | |||
| |
125 | |||
| |
125 | |||
| |
126 | |||
| |
131 | |||
| |
136 | |||
| |
137 | |||
| |
139 | |||
| |
149 | |||
| |
155 | |||
| |
164 | |||
| |
169 | |||
| |
173 | |||
| |
175 | |||
| |
176 | |||
| |
179 | |||
| |
180 | |||
| |
182 | |||
| |
185 | |||
| |
189 | |||
| |
192 | |||
| |
202 | |||
| |
202 | |||
| |
203 | |||
| |
203 | |||
| |
206 | |||
| |
208 | |||
| |
209 | |||
| |
218 | |||
| |
219 | |||
| |
221 | |||
Page No. | ||||
| |
223 | |||
| |
223 | |||
| |
223 | |||
| Item 9 |
||||
| |
227 | |||
| Item 9A |
||||
| |
227 | |||
| Item 9B |
||||
| |
227 | |||
| Item 9C |
||||
| |
227 | |||
| |
227 | |||
| Item 10 |
||||
| |
227 | |||
| Item 11 |
||||
| |
227 | |||
| Item 12 |
||||
| |
228 | |||
| Item 13 |
||||
| |
228 | |||
| Item 14 |
||||
| |
228 | |||
| |
228 | |||
| Item 15 |
||||
| |
228 | |||
| |
234 | |||
Goldman Sachs 2021 Form 10-K | ||

| • | Financial advisory. |
| • | Underwriting. |
| Goldman Sachs 2021 Form 10-K | 1 |
| • | Corporate lending. |
| 2 | Goldman Sachs 2021 Form 10-K |
| • | FICC intermediation. |
| • | FICC financing. |
| • | Equities intermediation. over-the-counter |
| • | Equities financing . |
| Goldman Sachs 2021 Form 10-K | 3 |
| • | Management and other fees. |
| • | Incentive fees. |
| • | Equity investments. |
| • | Lending and debt investments. |
| • | Management and other fees. |
| • | Incentive fees. |
| • | Private banking and lending. |
| 4 | Goldman Sachs 2021 Form 10-K |
| Goldman Sachs 2021 Form 10-K | 5 |
| • | We aim for analyst and associate hiring (which accounts for over 70% of our annual hiring) to achieve representation of 50% women professionals, 11% Black professionals and 14% Hispanic/Latinx professionals in the Americas, and 9% Black professionals in the U.K. In 2021, our analyst and associate hires included 45% women professionals, 11% Black professionals and 15% Hispanic/Latinx professionals in the Americas, and 14% Black professionals in the U.K. |
| • | We aim for women professionals to represent 40% of our vice presidents globally by 2025 and 30% of senior talent (vice presidents and above) in the U.K. by 2023, while also endeavoring for women employees to comprise 50% of all of our employees globally over time. As of December 2021, women professionals represented 32% of our vice president population globally and 31% of senior talent (vice presidents and above) in the U.K., and women employees represented 41% of all of our employees globally. |
| • | We aim for Black professionals to represent 7% of our vice president population in the Americas and in the U.K., and for Hispanic/Latinx professionals to represent 9% of our vice president population in the Americas, both by 2025. As of December 2021, Black professionals represented 4% of our vice president population in the Americas and 4% in the U.K., and Hispanic/Latinx professionals represented 6% of our vice president population in the Americas. |
| • | We aim to double the number of campus hires in the U.S. recruited from Historically Black Colleges and Universities (HBCUs) by 2025 relative to 2020. |
| 6 | Goldman Sachs 2021 Form 10-K |
| Goldman Sachs 2021 Form 10-K | 7 |
| 8 | Goldman Sachs 2021 Form 10-K |
| Goldman Sachs 2021 Form 10-K | 9 |
| 10 | Goldman Sachs 2021 Form 10-K |
| Goldman Sachs 2021 Form 10-K | 11 |
| 12 | Goldman Sachs 2021 Form 10-K |
| Goldman Sachs 2021 Form 10-K | 13 |
| 14 | Goldman Sachs 2021 Form 10-K |
| Goldman Sachs 2021 Form 10-K | 15 |
| 16 | Goldman Sachs 2021 Form 10-K |
| Goldman Sachs 2021 Form 10-K | 17 |
| • | To transfer any of the IDI’s assets and liabilities to a new obligor, including a newly formed “bridge” bank, without the approval of the depository institution’s creditors; |
| • | To enforce the IDI’s contracts pursuant to their terms without regard to any provisions triggered by the appointment of the FDIC in that capacity; or |
| • | To repudiate or disaffirm any contract or lease to which the IDI is a party, the performance of which is determined by the FDIC to be burdensome and the repudiation or disaffirmance of which is determined by the FDIC to promote the orderly administration of the IDI. |
| 18 | Goldman Sachs 2021 Form 10-K |
| Goldman Sachs 2021 Form 10-K | 19 |
| 20 | Goldman Sachs 2021 Form 10-K |
| Goldman Sachs 2021 Form 10-K | 21 |
| 22 | Goldman Sachs 2021 Form 10-K |
| Goldman Sachs 2021 Form 10-K | 23 |
| 24 | Goldman Sachs 2021 Form 10-K |
| Goldman Sachs 2021 Form 10-K | 25 |
| • | Our website ( www.goldmansachs.com ); |
| • | Our Twitter account ( twitter.com/GoldmanSachs ); and |
| • | Our Instagram account ( instagram.com/GoldmanSachs ). |
| 26 | Goldman Sachs 2021 Form 10-K |
| Goldman Sachs 2021 Form 10-K | 27 |
| 28 | Goldman Sachs 2021 Form 10-K |
| • | Our businesses have been and may in the future be adversely affected by conditions in the global financial markets and broader economic conditions. |
| • | Our businesses have been and may in the future be adversely affected by declining asset values, particularly where we have net “long” positions, receive fees based on the value of assets managed, or receive or post collateral. |
| • | Our market-making activities have been and may in the future be affected by changes in the levels of market volatility. |
| • | Our investment banking, client intermediation, asset management and wealth management businesses have been adversely affected and may in the future be adversely affected by market uncertainty or lack of confidence among investors and CEOs due to declines in economic activity and other unfavorable economic, geopolitical or market conditions. |
| • | Our asset management and wealth management businesses have been and may in the future be adversely affected by the poor investment performance of our investment products or a client preference for products other than those which we offer or for products that generate lower fees. |
| • | Our liquidity, profitability and businesses may be adversely affected by an inability to access the debt capital markets or to sell assets. |
| • | Our businesses have been and may in the future be adversely affected by disruptions or lack of liquidity in the credit markets, including reduced access to credit and higher costs of obtaining credit. |
| • | Reductions in our credit ratings or an increase in our credit spreads may adversely affect our liquidity and cost of funding. |
| • | Group Inc. is a holding company and its liquidity depends on payments from its subsidiaries, many of which are subject to legal, regulatory and other restrictions on providing funds or assets to Group Inc. |
| • | Our businesses, profitability and liquidity may be adversely affected by deterioration in the credit quality of or defaults by third parties. |
| • | Concentration of risk increases the potential for significant losses in our market-making, underwriting, investing and financing activities. |
| • | Derivative transactions and delayed documentation or settlements may expose us to credit risk, unexpected risks and potential losses. |
| • | A failure in our operational systems or infrastructure, or those of third parties, as well as human error, malfeasance or other misconduct, could impair our liquidity, disrupt our businesses, result in the disclosure of confidential information, damage our reputation and cause losses. |
| • | A failure to protect our computer systems, networks and information, and our clients’ information, against cyber attacks and similar threats could impair our ability to conduct our businesses, result in the disclosure, theft or destruction of confidential information, damage our reputation and cause losses. |
| • | We may incur losses as a result of ineffective risk management processes and strategies. |
| • | We may incur losses as a result of unforeseen or catastrophic events, including pandemics, terrorist attacks, extreme weather events or other natural disasters. |
| • | Climate change could disrupt our businesses and adversely affect client activity levels and the creditworthiness of our clients and counterparties, and our efforts to address concerns relating to climate change could result in damage to our reputation. |
| • | Our businesses and those of our clients are subject to extensive and pervasive regulation around the world. |
| • | A failure to appropriately identify and address potential conflicts of interest could adversely affect our businesses. |
| • | We may be adversely affected by increased governmental and regulatory scrutiny or negative publicity. |
| • | Substantial civil or criminal liability or significant regulatory action against us could have material adverse financial effects or cause us significant reputational harm, which in turn could seriously harm our business prospects. |
| Goldman Sachs 2021 Form 10-K | 29 |
| • | In conducting our businesses around the world, we are subject to political, legal, regulatory and other risks that are inherent in operating in many countries. |
| • | The application of regulatory strategies and requirements in the U.S. and non-U.S. jurisdictions to facilitate the orderly resolution of large financial institutions could create greater risk of loss for Group Inc.’s security holders. |
| • | The application of Group Inc.’s proposed resolution strategy could result in greater losses for Group Inc.’s security holders. |
| • | Our commodities activities, particularly our physical commodities activities, subject us to extensive regulation and involve certain potential risks, including environmental, reputational and other risks that may expose us to significant liabilities and costs. |
| • | Our results have been and may in the future be adversely affected by the composition of our client base. |
| • | The financial services industry is highly competitive. |
| • | The growth of electronic trading and the introduction of new products and technologies, including trading technologies and cryptocurrencies, has increased competition. |
| • | Our businesses would be adversely affected if we are unable to hire and retain qualified employees. |
| • | Our businesses, financial condition, liquidity and results of operations have been and may in the future be adversely affected by the COVID-19 pandemic. |
| • | Certain of our businesses, our funding instruments and financial products may be adversely affected by changes in or the discontinuance of Interbank Offered Rates (IBORs), in particular LIBOR. |
| • | Certain of our businesses and our funding instruments may be adversely affected by changes in other reference rates, currencies, indexes, baskets or ETFs to which products we offer or funding that we raise are linked. |
| • | We face enhanced risks as new business initiatives and acquisitions lead us to engage in new activities, operate in new locations, transact with a broader array of clients and counterparties and expose us to new asset classes and new markets. |
| • | We may not be able to fully realize the expected benefits or synergies from acquisitions in the time frames we expect, or at all. |
| 30 | Goldman Sachs 2021 Form 10-K |
| Goldman Sachs 2021 Form 10-K | 31 |
| 32 | Goldman Sachs 2021 Form 10-K |
| Goldman Sachs 2021 Form 10-K | 33 |
| 34 | Goldman Sachs 2021 Form 10-K |
| Goldman Sachs 2021 Form 10-K | 35 |
| 36 | Goldman Sachs 2021 Form 10-K |
| Goldman Sachs 2021 Form 10-K | 37 |
| 38 | Goldman Sachs 2021 Form 10-K |
| Goldman Sachs 2021 Form 10-K | 39 |
| 40 | Goldman Sachs 2021 Form 10-K |
| Goldman Sachs 2021 Form 10-K | 41 |
| 42 | Goldman Sachs 2021 Form 10-K |
| Goldman Sachs 2021 Form 10-K | 43 |
| 44 | Goldman Sachs 2021 Form 10-K |
| Goldman Sachs 2021 Form 10-K | 45 |
| 46 | Goldman Sachs 2021 Form 10-K |
| Goldman Sachs 2021 Form 10-K | 47 |
| 48 | Goldman Sachs 2021 Form 10-K |
| Goldman Sachs 2021 Form 10-K | 49 |
| 50 | Goldman Sachs 2021 Form 10-K |
| Goldman Sachs 2021 Form 10-K | 51 |
| 52 | Goldman Sachs 2021 Form 10-K |
| Goldman Sachs 2021 Form 10-K | 53 |
| 54 | Goldman Sachs 2021 Form 10-K |
| Goldman Sachs 2021 Form 10-K | 55 |
| 56 | Goldman Sachs 2021 Form 10-K |
| Item 5. Market for Registrant’s Common Equity, Related Stockholder Matters and Issuer Purchases of Equity Securities |
Total Shares Purchased |
Average Price Paid Per Share |
Total Shares Purchased as Part of a Publicly Announced Program |
Maximum Shares That May Yet Be Purchased Under the Program |
|||||||||||||
| October |
1,214,611 |
$411.65 |
1,214,611 |
34,390,960 |
||||||||||||
| November |
– |
– |
– |
34,390,960 |
||||||||||||
| December |
– |
– |
– |
34,390,960 |
||||||||||||
| Total |
1,214,611 |
1,214,611 |
||||||||||||||
| Goldman Sachs 2021 Form 10-K | 57 |
| Item 7. Management’s Discussion and Analysis of Financial Condition and Results of Operations |
| 58 | Goldman Sachs 2021 Form 10-K |
| Goldman Sachs 2021 Form 10-K | 59 |
| • | Determining the appropriate valuation methodology and/or model for each type of level 3 financial instrument; |
| 60 | Goldman Sachs 2021 Form 10-K |
| • | Determining model inputs based on an evaluation of all relevant empirical market data, including prices evidenced by market transactions, interest rates, credit spreads, volatilities and correlations; and |
| • | Determining appropriate valuation adjustments, including those related to illiquidity or counterparty credit quality. |
| • | Trade Comparison. |
| • | External Price Comparison. |
| • | Calibration to Market Comparables. |
| • | Relative Value Analyses. |
| • | Collateral Analyses. |
| • | Execution of Trades. |
| • | Backtesting. |
| Goldman Sachs 2021 Form 10-K | 61 |
| 62 | Goldman Sachs 2021 Form 10-K |
| Goldman Sachs 2021 Form 10-K | 63 |
| Year Ended December | ||||||||||||
$ in millions, except per share amounts |
2021 |
2020 | 2019 | |||||||||
| Net revenues |
$59,339 |
$44,560 | $36,546 | |||||||||
| Pre-tax earnings |
$27,044 |
$12,479 | $10,583 | |||||||||
| Net earnings |
$21,635 |
$ 9,459 | $ 8,466 | |||||||||
| Net earnings to common |
$21,151 |
$ 8,915 | $ 7,897 | |||||||||
| Diluted EPS |
$ 59.45 |
$ 24.74 | $ 21.03 | |||||||||
| ROE |
23.0% |
11.1% | 10.0% | |||||||||
| ROTE |
24.3% |
11.8% | 10.6% | |||||||||
| Net earnings to average assets |
1.6% |
0.8% | 0.9% | |||||||||
| Return on average shareholders’ equity |
21.3% |
10.3% | 9.4% | |||||||||
| Average equity to average assets |
7.4% |
8.2% | 9.3% | |||||||||
| Dividend payout ratio |
10.9% |
20.2% | 19.7% | |||||||||
| • | Net earnings to common represents net earnings applicable to common shareholders, which is calculated as net earnings less preferred stock dividends. |
| • | Average equity to average assets is calculated by dividing average total shareholders’ equity by average total assets. |
| • | Dividend payout ratio is calculated by dividing dividends declared per common share by diluted EPS. |
| • | ROE is calculated by dividing net earnings to common by average monthly common shareholders’ equity. Tangible common shareholders’ equity is calculated as total shareholders’ equity less preferred stock, goodwill and identifiable intangible assets. ROTE is calculated by dividing net earnings to common by average monthly tangible common shareholders’ equity. We believe that tangible common shareholders’ equity is meaningful because it is a measure that we and investors use to assess capital adequacy and that ROTE is meaningful because it measures the performance of businesses consistently, whether they were acquired or developed internally. Tangible common shareholders’ equity and ROTE are non-GAAP measures and may not be comparable to similar non-GAAP measures used by other companies. Return on average shareholders’ equity is calculated by dividing net earnings by average monthly shareholders’ equity. |
| Average for the Year Ended December | ||||||||||||
$ in millions |
2021 |
2020 | 2019 | |||||||||
| Total shareholders’ equity |
$101,705 |
$ 91,779 | $ 90,297 | |||||||||
| Preferred stock |
(9,876 |
) |
(11,203 | ) | (11,203 | ) | ||||||
| Common shareholders’ equity |
91,829 |
80,576 | 79,094 | |||||||||
| Goodwill |
(4,327 |
) |
(4,238 | ) | (3,965 | ) | ||||||
| Identifiable intangible assets |
(536 |
) |
(617 | ) | (499 | ) | ||||||
| Tangible common shareholders equity |
$ 86,966 |
$ 75,721 | $ 74,630 | |||||||||
| Year Ended December | ||||||||||||
$ in millions |
2021 |
2020 | 2019 | |||||||||
| Investment banking |
$14,168 |
$ 9,141 | $ 6,798 | |||||||||
| Investment management |
8,059 |
6,923 | 6,189 | |||||||||
| Commissions and fees |
3,619 |
3,548 | 2,988 | |||||||||
| Market making |
15,352 |
15,546 | 10,157 | |||||||||
| Other principal transactions |
11,671 |
4,651 | 6,052 | |||||||||
| Total non-interest revenues |
52,869 |
39,809 | 32,184 | |||||||||
| Interest income |
12,120 |
13,689 | 21,738 | |||||||||
| Interest expense |
5,650 |
8,938 | 17,376 | |||||||||
| Net interest income |
6,470 |
4,751 | 4,362 | |||||||||
| Total net revenues |
$59,339 |
$44,560 | $36,546 | |||||||||
| • | Investment banking consists of revenues (excluding net interest) from financial advisory and underwriting assignments. These activities are included in our Investment Banking segment. |
| • | Investment management consists of revenues (excluding net interest) from providing asset management services across all major asset classes to a diverse set of asset management clients (included in our Asset Management segment), as well as asset management services, wealth advisory services and certain transaction services for wealth management clients (included in our Consumer & Wealth Management segment). |
| • | Commissions and fees consists of revenues from executing and clearing client transactions on major stock, options and futures exchanges worldwide, as well as over-the-counter |
| • | Market making consists of revenues (excluding net interest) from client execution activities related to making markets in interest rate products, credit products, mortgages, currencies, commodities and equity products. These activities are included in our Global Markets segment. |
| • | Other principal transactions consists of revenues (excluding net interest) from our equity investing activities, including revenues related to our consolidated investments (included in our Asset Management segment), and lending activities (included across our four segments). |
| 64 | Goldman Sachs 2021 Form 10-K |
| Goldman Sachs 2021 Form 10-K | 65 |
| Year Ended December | ||||||||||||
$ in millions |
2021 |
2020 | 2019 | |||||||||
| Provision for credit losses |
$357 |
$3,098 | $1,065 | |||||||||
| Year Ended December | ||||||||||||
$ in millions |
2021 |
2020 | 2019 | |||||||||
| Compensation and benefits |
$17,719 |
$13,309 | $12,353 | |||||||||
| Transaction based |
4,710 |
4,141 | 3,513 | |||||||||
| Market development |
553 |
401 | 739 | |||||||||
| Communications and technology |
1,573 |
1,347 | 1,167 | |||||||||
| Depreciation and amortization |
2,015 |
1,902 | 1,704 | |||||||||
| Occupancy |
981 |
960 | 1,029 | |||||||||
| Professional fees |
1,648 |
1,306 | 1,316 | |||||||||
| Other expenses |
2,739 |
5,617 | 3,077 | |||||||||
| Total operating expenses |
$31,938 |
$28,983 | $24,898 | |||||||||
| Headcount at period-end |
43,900 |
40,500 | 38,300 | |||||||||
| 66 | Goldman Sachs 2021 Form 10-K |
| As of December | ||||||||
$ in millions |
2021 |
2020 | ||||||
| Investment Banking |
$ |
$ |
||||||
| Global Markets |
1,082,378 |
844,606 | ||||||
| Asset Management |
91,115 |
95,751 | ||||||
| Consumer & Wealth Management |
146,338 |
106,429 | ||||||
| Total |
$1,463,988 |
$1,163,028 | ||||||
| Year Ended December | ||||||||||||
$ in millions |
2021 |
2020 | 2019 | |||||||||
| Investment Banking |
||||||||||||
| Net revenues |
$14,876 |
$ 9,423 | $ 7,599 | |||||||||
| Provision for credit losses |
(298 |
) |
1,624 | 333 | ||||||||
| Operating expenses |
6,705 |
6,134 | 4,685 | |||||||||
| Pre-tax earnings |
$ 8,469 |
$ 1,665 | $ 2,581 | |||||||||
| Net earnings to common |
$ 6,705 |
$ 1,193 | $ 1,996 | |||||||||
| Average common equity |
$10,341 |
$11,313 | $11,167 | |||||||||
| Return on average common equity |
64.8% |
10.5% | 17.9% | |||||||||
| Global Markets |
||||||||||||
| Net revenues |
$22,077 |
$21,157 | $14,779 | |||||||||
| Provision for credit losses |
45 |
274 | 35 | |||||||||
| Operating expenses |
12,969 |
12,806 | 10,851 | |||||||||
| Pre-tax earnings |
$ 9,063 |
$ 8,077 | $ 3,893 | |||||||||
| Net earnings to common |
$ 6,973 |
$ 5,766 | $ 2,729 | |||||||||
| Average common equity |
$45,497 |
$40,760 | $40,060 | |||||||||
| Return on average common equity |
15.3% |
14.1% | 6.8% | |||||||||
| Asset Management |
||||||||||||
| Net revenues |
$14,916 |
$ 7,984 | $ 8,965 | |||||||||
| Provision for credit losses |
18 |
442 | 274 | |||||||||
| Operating expenses |
5,970 |
5,142 | 4,817 | |||||||||
| Pre-tax earnings |
$ 8,928 |
$ 2,400 | $ 3,874 | |||||||||
| Net earnings to common |
$ 7,046 |
$ 1,740 | $ 3,013 | |||||||||
| Average common equity |
$25,195 |
$20,491 | $21,575 | |||||||||
| Return on average common equity |
28.0% |
8.5% | 14.0% | |||||||||
| Consumer & Wealth Management |
|
|||||||||||
| Net revenues |
$ 7,470 |
$ 5,996 | $ 5,203 | |||||||||
| Provision for credit losses |
592 |
758 | 423 | |||||||||
| Operating expenses |
6,294 |
4,901 | 4,545 | |||||||||
| Pre-tax earnings |
$ |
$ |
$ |
|||||||||
| Net earnings to common |
$ |
$ |
$ |
|||||||||
| Average common equity |
$10,796 |
$ 8,012 | $ 6,292 | |||||||||
| Return on average common equity |
4.0% |
2.7% | 2.5% | |||||||||
| Total net revenues |
$59,339 |
$44,560 | $36,546 | |||||||||
| Total provision for credit losses |
357 |
3,098 | 1,065 | |||||||||
| Total operating expenses |
31,938 |
28,983 | 24,898 | |||||||||
| Total pre-tax earnings |
$27,044 |
$12,479 | $10,583 | |||||||||
| Net earnings to common |
$21,151 |
$ 8,915 | $ 7,897 | |||||||||
| Average common equity |
$91,829 |
$80,576 | $79,094 | |||||||||
| Return on average common equity |
23.0% |
11.1% | 10.0% | |||||||||
| Goldman Sachs 2021 Form 10-K | 67 |
| • | Financial advisory. |
| • | Underwriting. |
| • | Corporate lending. |
| As of December | ||||||||
$ in millions |
2021 |
2020 | ||||||
| Cash and cash equivalents |
$ 64,437 |
$ 34,730 | ||||||
| Collateralized agreements |
21,354 |
20,242 | ||||||
| Customer and other receivables |
5,248 |
2,465 | ||||||
| Trading assets |
20,338 |
29,493 | ||||||
| Investments |
1,053 |
1,078 | ||||||
| Loans |
29,555 |
26,544 | ||||||
| Other assets |
2,172 |
1,690 | ||||||
| Total |
$144,157 |
$116,242 | ||||||
| Year Ended December | ||||||||||||
$ in millions |
2021 |
2020 | 2019 | |||||||||
| Financial advisory |
$ 5,653 |
$ 3,065 | $ 3,197 | |||||||||
| Equity underwriting |
5,011 |
3,406 | 1,482 | |||||||||
| Debt underwriting |
3,504 |
2,670 | 2,119 | |||||||||
| Underwriting |
8,515 |
6,076 | 3,601 | |||||||||
| Corporate lending |
708 |
282 | 801 | |||||||||
| Net revenues |
14,876 |
9,423 | 7,599 | |||||||||
| Provision for credit losses |
(298 |
) |
1,624 | 333 | ||||||||
| Operating expenses |
6,705 |
6,134 | 4,685 | |||||||||
| Pre-tax earnings |
8,469 |
1,665 | 2,581 | |||||||||
| Provision for taxes |
1,694 |
403 | 516 | |||||||||
| Net earnings |
6,775 |
1,262 | 2,065 | |||||||||
| Preferred stock dividends |
70 |
69 | 69 | |||||||||
| Net earnings to common |
$ 6,705 |
$ 1,193 | $ 1,996 | |||||||||
| Average common equity |
$10,341 |
$11,313 | $11,167 | |||||||||
| Return on average common equity |
64.8% |
10.5% | 17.9% | |||||||||
| Year Ended December | ||||||||||||
$ in billions |
2021 |
2020 | 2019 | |||||||||
| Announced mergers and acquisitions |
$ 1,851 |
$ |
$ 1,350 | |||||||||
| Completed mergers and acquisitions |
$ 1,581 |
$ 1,033 | $ 1,270 | |||||||||
| Equity and equity-related offerings |
$ |
$ |
$ |
|||||||||
| Debt offerings |
$ |
$ |
$ |
|||||||||
| • | Volumes are per Dealogic. |
| • | Announced and completed mergers and acquisitions volumes are based on full credit to each of the advisors in a transaction. Equity and equity-related offerings and debt offerings are based on full credit for single book managers and equal credit for joint book managers. Transaction volumes may not be indicative of net revenues in a given period. In addition, transaction volumes for prior periods may vary from amounts previously reported due to the subsequent withdrawal or a change in the value of a transaction. |
| • | Equity and equity-related offerings includes Rule 144A and public common stock offerings, convertible offerings and rights offerings. |
| • | Debt offerings includes non-convertible preferred stock, mortgage-backed securities, asset-backed securities and taxable municipal debt. Includes publicly registered and Rule 144A issues and excludes leveraged loans. |
| 68 | Goldman Sachs 2021 Form 10-K |
| • | FICC intermediation. |
| Goldman Sachs 2021 Form 10-K | 69 |
| • | FICC financing. |
| • | Equities intermediation. |
| • | Equities financing. broker-to-broker |
| 70 | Goldman Sachs 2021 Form 10-K |
| As of December | ||||||||
$ in millions |
2021 |
2020 | ||||||
| Cash and cash equivalents |
$ |
$ 86,663 | ||||||
| Collateralized agreements |
343,535 |
212,711 | ||||||
| Customer and other receivables |
142,547 |
110,473 | ||||||
| Trading assets |
337,040 |
339,349 | ||||||
| Investments |
55,285 |
52,929 | ||||||
| Loans |
60,916 |
33,214 | ||||||
| Other assets |
11,665 |
9,267 | ||||||
| Total |
$1,082,378 |
$844,606 | ||||||
| Year Ended December | ||||||||||||
$ in millions |
2021 |
2020 | 2019 | |||||||||
| FICC intermediation |
$ 8,647 |
$ 9,991 | $ 6,009 | |||||||||
| FICC financing |
1,937 |
1,593 | 1,379 | |||||||||
| FICC |
10,584 |
11,584 | 7,388 | |||||||||
| Equities intermediation |
7,574 |
6,989 | 4,374 | |||||||||
| Equities financing |
3,919 |
2,584 | 3,017 | |||||||||
| Equities |
11,493 |
9,573 | 7,391 | |||||||||
| Net revenues |
22,077 |
21,157 | 14,779 | |||||||||
| Provision for credit losses |
45 |
274 | 35 | |||||||||
| Operating expenses |
12,969 |
12,806 | 10,851 | |||||||||
| Pre-tax earnings |
9,063 |
8,077 | 3,893 | |||||||||
| Provision for taxes |
1,813 |
1,955 | 779 | |||||||||
| Net earnings |
7,250 |
6,122 | 3,114 | |||||||||
| Preferred stock dividends |
277 |
356 | 385 | |||||||||
| Net earnings to common |
$ 6,973 |
$ 5,766 | $ 2,729 | |||||||||
| Average common equity |
$45,497 |
$40,760 | $40,060 | |||||||||
| Return on average common equity |
15.3% |
14.1% | 6.8% | |||||||||
$ in millions |
FICC | Equities | |
Global Markets |
| |||||||
| Year Ended December 2021 |
||||||||||||
| Market making |
$ 7,584 |
$ 7,768 |
$15,352 |
|||||||||
| Commissions and fees |
– |
3,543 |
3,543 |
|||||||||
| Other principal transactions |
358 |
56 |
414 |
|||||||||
| Net interest income |
2,642 |
126 |
2,768 |
|||||||||
| Total |
$10,584 |
$11,493 |
$22,077 |
|||||||||
| Year Ended December 2020 |
||||||||||||
| Market making |
$ 8,972 | $ 6,574 | $15,546 | |||||||||
| Commissions and fees |
– | 3,347 | 3,347 | |||||||||
| Other principal transactions |
53 | (18 | ) | 35 | ||||||||
| Net interest income |
2,559 | (330 | ) | 2,229 | ||||||||
| Total |
$11,584 | $ 9,573 | $21,157 | |||||||||
| Year Ended December 2019 |
||||||||||||
| Market making |
$ 5,813 | $ 4,344 | $10,157 | |||||||||
| Commissions and fees |
– | 2,900 | 2,900 | |||||||||
| Other principal transactions |
1 | 51 | 52 | |||||||||
| Net interest income |
1,574 | 96 | 1,670 | |||||||||
| Total |
$ 7,388 | $ 7,391 | $14,779 | |||||||||
| • | The difference between commissions and fees and those in the consolidated statements of earnings represents commissions and fees included in our Consumer & Wealth Management segment. |
| • | See “Net Revenues” for information about market making revenues, commissions and fees, other principal transactions revenues and net interest income. See Note 25 to the consolidated financial statements for net interest income by segment. |
| • | The primary driver of net revenues for FICC intermediation was client activity. |
| • | Net revenues in interest rate products primarily reflected lower client activity. |
| • | Net revenues in credit products and currencies reflected lower client activity, partially offset by the impact of improved market-making conditions on our inventory. |
| • | Net revenues in mortgages reflected the impact of improved market-making conditions on our inventory. |
| • | Net revenues in commodities primarily reflected higher client activity. |
| Goldman Sachs 2021 Form 10-K | 71 |
| • | Management and other fees. |
| • | Incentive fees. |
| • | Equity investments. |
| • | Lending and debt investments. |
| As of December | ||||||||
$ in millions |
2021 |
2020 | ||||||
| Cash and cash equivalents |
$16,636 |
$ 8,635 | ||||||
| Collateralized agreements |
5,227 |
4,749 | ||||||
| Customer and other receivables |
946 |
1,261 | ||||||
| Trading assets |
5,000 |
6,819 | ||||||
| Investments |
32,318 |
34,386 | ||||||
| Loans |
13,698 |
16,558 | ||||||
| Other assets |
17,290 |
23,343 | ||||||
| Total |
$91,115 |
$95,751 | ||||||
| Year Ended December | ||||||||||||
$ in millions |
2021 |
2020 | 2019 | |||||||||
| Management and other fees |
$ 2,883 |
$ 2,785 | $ 2,600 | |||||||||
| Incentive fees |
438 |
287 | 130 | |||||||||
| Equity investments |
9,189 |
4,095 | 4,765 | |||||||||
| Lending and debt investments |
2,406 |
817 | 1,470 | |||||||||
| Net revenues |
14,916 |
7,984 | 8,965 | |||||||||
| Provision for credit losses |
18 |
442 | 274 | |||||||||
| Operating expenses |
5,970 |
5,142 | 4,817 | |||||||||
| Pre-tax earnings |
8,928 |
2,400 | 3,874 | |||||||||
| Provision for taxes |
1,785 |
581 | 775 | |||||||||
| Net earnings |
7,143 |
1,819 | 3,099 | |||||||||
| Preferred stock dividends |
97 |
79 | 86 | |||||||||
| Net earnings to common |
$ 7,046 |
$ 1,740 | $ 3,013 | |||||||||
| Average common equity |
$25,195 |
$20,491 | $21,575 | |||||||||
| Return on average common equity |
28.0% |
8.5% | 14.0% | |||||||||
| Year Ended December | ||||||||||||
$ in millions |
2021 |
2020 | 2019 | |||||||||
| Equity Type |
||||||||||||
| Private equity |
$ 9,266 |
$ 2,417 | $ 4,288 | |||||||||
| Public equity |
(77 |
) |
1,678 | 477 | ||||||||
| Total |
$ 9,189 |
$ 4,095 | $ 4,765 | |||||||||
| Asset Class |
||||||||||||
| Real estate |
$ 2,489 |
$ 1,621 | $ 2,384 | |||||||||
| Corporate |
6,700 |
2,474 | 2,381 | |||||||||
| Total |
$ 9,189 |
$ 4,095 | $ 4,765 | |||||||||
| 72 | Goldman Sachs 2021 Form 10-K |
| Year Ended December | ||||||||||||
$ in millions |
2021 |
2020 | 2019 | |||||||||
| Fair value net gains/(losses) |
$1,155 |
$ (228 | ) | $ |
||||||||
| Net interest income |
1,251 |
1,045 | 1,136 | |||||||||
| Total |
$2,406 |
$ |
$1,470 | |||||||||
| • | Management and other fees. |
| • | Incentive fees. |
| • | Private banking and lending. |
| Goldman Sachs 2021 Form 10-K | 73 |
| As of December | ||||||||
$ in millions |
2021 |
2020 | ||||||
| Cash and cash equivalents |
$ 48,573 |
$ 25,814 | ||||||
| Collateralized agreements |
14,358 |
12,518 | ||||||
| Customer and other receivables |
11,932 |
7,132 | ||||||
| Trading assets |
13,538 |
17,969 | ||||||
| Investments |
63 |
52 | ||||||
| Loans |
54,393 |
39,799 | ||||||
| Other assets |
3,481 |
3,145 | ||||||
| Total |
$146,338 |
$106,429 | ||||||
| Year Ended December | ||||||||||||
$ in millions |
2021 |
2020 | 2019 | |||||||||
| Management and other fees |
$ 4,691 |
$3,889 | $3,475 | |||||||||
| Incentive fees |
178 |
114 | 81 | |||||||||
| Private banking and lending |
1,109 |
780 | 783 | |||||||||
| Wealth management |
5,978 |
4,783 | 4,339 | |||||||||
| Consumer banking |
1,492 |
1,213 | 864 | |||||||||
| Net revenues |
7,470 |
5,996 | 5,203 | |||||||||
| Provision for credit losses |
592 |
758 | 423 | |||||||||
| Operating expenses |
6,294 |
4,901 | 4,545 | |||||||||
| Pre-tax earnings |
584 |
337 | 235 | |||||||||
| Provision for taxes |
117 |
81 | 47 | |||||||||
| Net earnings |
467 |
256 | 188 | |||||||||
| Preferred stock dividends |
40 |
40 | 29 | |||||||||
| Net earnings to common |
$ |
$ 216 | $ 159 | |||||||||
| Average common equity |
$10,796 |
$8,012 | $6,292 | |||||||||
| Return on average common equity |
4.0% |
2.7% | 2.5% | |||||||||
| 74 | Goldman Sachs 2021 Form 10-K |
| As of December | ||||||||||||
$ in billions |
2021 |
2020 | 2019 | |||||||||
| Segment |
||||||||||||
| Asset Management |
$1,719 |
$1,530 | $1,298 | |||||||||
| Consumer & Wealth Management |
751 |
615 | 561 | |||||||||
| Total AUS |
$2,470 |
$2,145 | $1,859 | |||||||||
| Asset Class |
||||||||||||
| Alternative investments |
$ |
$ |
$ |
|||||||||
| Equity |
613 |
475 | 423 | |||||||||
| Fixed income |
940 |
896 | 789 | |||||||||
| Total long-term AUS |
1,789 |
1,562 | 1,397 | |||||||||
| Liquidity products |
681 |
583 | 462 | |||||||||
| Total AUS |
$2,470 |
$2,145 | $1,859 | |||||||||
| Distribution Channel |
||||||||||||
| Institutional |
$ |
$ |
$ |
|||||||||
| Wealth management |
751 |
615 | 561 | |||||||||
| Third-party distributed |
895 |
769 | 614 | |||||||||
| Total AUS |
$2,470 |
$2,145 | $1,859 | |||||||||
| Region |
||||||||||||
| Americas |
$1,930 |
$1,656 | $1,408 | |||||||||
| EMEA |
354 |
318 | 279 | |||||||||
| Asia |
186 |
171 | 172 | |||||||||
| Total AUS |
$2,470 |
$2,145 | $1,859 | |||||||||
| Vehicle |
||||||||||||
| Separate accounts |
$1,347 |
$1,186 | $1,069 | |||||||||
| Public funds |
811 |
707 | 603 | |||||||||
| Private funds and other |
312 |
252 | 187 | |||||||||
| Total AUS |
$2,470 |
$2,145 | $1,859 | |||||||||
| • | Liquidity products includes money market funds and private bank deposits. |
| • | EMEA represents Europe, Middle East and Africa. |
| Year Ended December | ||||||||||||
$ in billions |
2021 |
2020 | 2019 | |||||||||
| Asset Management |
||||||||||||
| Beginning balance |
$1,530 |
$1,298 | $1,087 | |||||||||
| Net inflows/(outflows): |
||||||||||||
| Alternative investments |
15 |
(3 | ) | 2 | ||||||||
| Equity |
5 |
(12 | ) | 34 | ||||||||
| Fixed income |
54 |
53 | 35 | |||||||||
| Total long-term AUS net inflows/(outflows) |
74 |
38 | 71 | |||||||||
| Liquidity products |
76 |
107 | 52 | |||||||||
| Total AUS net inflows/(outflows) |
150 |
145 | 123 | |||||||||
| Net market appreciation/(depreciation) |
39 |
87 | 88 | |||||||||
| Ending balance |
$1,719 |
$1,530 | $1,298 | |||||||||
| Consumer & Wealth Management |
||||||||||||
| Beginning balance |
$ |
$ |
$ |
|||||||||
| Net inflows/(outflows): |
||||||||||||
| Alternative investments |
18 |
2 | 9 | |||||||||
| Equity |
36 |
8 | 11 | |||||||||
| Fixed income |
2 |
(6 | ) | 17 | ||||||||
| Total long-term AUS net inflows/(outflows) |
56 |
4 | 37 | |||||||||
| Liquidity products |
22 |
14 | 13 | |||||||||
| Total AUS net inflows/(outflows) |
78 |
18 | 50 | |||||||||
| Net market appreciation/(depreciation) |
58 |
36 | 56 | |||||||||
| Ending balance |
$ |
$ |
$ |
|||||||||
| Firmwide |
||||||||||||
| Beginning balance |
$2,145 |
$1,859 | $1,542 | |||||||||
| Net inflows/(outflows): |
||||||||||||
| Alternative investments |
33 |
(1 | ) | 11 | ||||||||
| Equity |
41 |
(4 | ) | 45 | ||||||||
| Fixed income |
56 |
47 | 52 | |||||||||
| Total long-term AUS net inflows/(outflows) |
130 |
42 | 108 | |||||||||
| Liquidity products |
98 |
121 | 65 | |||||||||
| Total AUS net inflows/(outflows) |
228 |
163 | 173 | |||||||||
| Net market appreciation/(depreciation) |
97 |
123 | 144 | |||||||||
| Ending balance |
$2,470 |
$2,145 | $1,859 | |||||||||
| Goldman Sachs 2021 Form 10-K | 75 |
| Average for the Year Ended December |
||||||||||||
$ in billions |
2021 |
2020 | 2019 | |||||||||
| Segment |
||||||||||||
| Asset Management |
$1,628 |
$1,429 | $1,182 | |||||||||
| Consumer & Wealth Management |
674 |
565 | 505 | |||||||||
| Total AUS |
$2,302 |
$1,994 | $1,687 | |||||||||
| Asset Class |
||||||||||||
| Alternative investments |
$ |
$ |
$ |
|||||||||
| Equity |
547 |
409 | 364 | |||||||||
| Fixed income |
919 |
829 | 746 | |||||||||
| Total long-term AUS |
1,677 |
1,421 | 1,286 | |||||||||
| Liquidity products |
625 |
573 | 401 | |||||||||
| Total AUS |
$2,302 |
$1,994 | $1,687 | |||||||||
| Year Ended December | ||||||||||||
Effective fees (bps) |
2021 |
2020 | 2019 | |||||||||
| Asset Class |
||||||||||||
| Alternative investments |
63 |
61 | 61 | |||||||||
| Equity |
60 |
58 | 61 | |||||||||
| Fixed income |
17 |
18 | 19 | |||||||||
| Liquidity products |
5 |
14 | 16 | |||||||||
| Total average effective fee |
29 |
29 | 32 | |||||||||
$ in billions |
|
Direct Strategies |
|
|
Fund of Funds |
|
Total | |||||
| Year Ended December 2021 |
||||||||||||
| Average AUS |
||||||||||||
| Corporate equity |
$ 20 |
$59 |
$ 79 |
|||||||||
| Credit |
19 |
1 |
20 |
|||||||||
| Real estate |
8 |
7 |
15 |
|||||||||
| Hedge funds and other |
51 |
11 |
62 |
|||||||||
| Funds and discretionary accounts |
$ 98 |
$78 |
$176 |
|||||||||
| Advisory accounts |
35 |
|||||||||||
| Total average AUS for alternative investments |
$211 |
|||||||||||
| Effective Fees (bps) |
||||||||||||
| Corporate equity |
117 |
57 |
72 |
|||||||||
| Credit |
102 |
54 |
98 |
|||||||||
| Real estate |
93 |
56 |
76 |
|||||||||
| Hedge funds and other |
61 |
66 |
62 |
|||||||||
| Funds and discretionary accounts |
83 |
58 |
72 |
|||||||||
| Advisory accounts |
17 |
|||||||||||
| Total average effective fee |
63 |
|||||||||||
| Year Ended December 2020 |
||||||||||||
| Average AUS |
||||||||||||
| Corporate equity |
$ 15 | $58 | $ 73 | |||||||||
| Credit |
13 | 2 | 15 | |||||||||
| Real estate |
7 | 6 | 13 | |||||||||
| Hedge funds and other |
44 | 10 | 54 | |||||||||
| Funds |
$ 79 | $76 | $155 | |||||||||
| Advisory accounts |
28 | |||||||||||
| Total average AUS for alternative investments |
$183 | |||||||||||
| Effective Fees (bps) |
||||||||||||
| Corporate equity |
131 | 57 | 73 | |||||||||
| Credit |
95 | 53 | 89 | |||||||||
| Real estate |
87 | 63 | 75 | |||||||||
| Hedge funds and other |
59 | 65 | 60 | |||||||||
| Funds and discretionary accounts |
81 | 59 | 70 | |||||||||
| Advisory accounts |
13 | |||||||||||
| Total average effective fee |
61 | |||||||||||
| Year Ended December 2019 |
||||||||||||
| Average AUS |
||||||||||||
| Corporate equity |
$ 16 | $51 | $ 67 | |||||||||
| Credit |
10 | 2 | 12 | |||||||||
| Real estate |
6 | 4 | 10 | |||||||||
| Hedge funds and other |
47 | 11 | 58 | |||||||||
| Funds and discretionary accounts |
$ 79 | $68 | $147 | |||||||||
| Advisory accounts |
29 | |||||||||||
| Total average AUS for alternative investments |
$176 | |||||||||||
| Effective Fees (bps) |
||||||||||||
| Corporate equity |
134 | 52 | 73 | |||||||||
| Credit |
108 | 48 | 99 | |||||||||
| Real estate |
88 | 59 | 76 | |||||||||
| Hedge funds and other |
61 | 61 | 61 | |||||||||
| Funds and discretionary accounts |
84 | 54 | 70 | |||||||||
| Advisory accounts |
13 | |||||||||||
| Total average effective fee |
61 | |||||||||||
| 76 | Goldman Sachs 2021 Form 10-K |
$ in billions |
AUS | |
Non-fee-earning alternative assets |
|
|
Total alternative assets |
| |||||
| As of December 2021 |
||||||||||||
| Corporate equity |
$ 87 |
$ 79 |
$166 |
|||||||||
| Credit |
25 |
69 |
94 |
|||||||||
| Real estate |
16 |
39 |
55 |
|||||||||
| Hedge funds and other |
70 |
2 |
72 |
|||||||||
| Funds and discretionary accounts |
198 |
189 |
387 |
|||||||||
| Advisory accounts |
38 |
1 |
39 |
|||||||||
| Total alternative investments |
$236 |
$190 |
$426 |
|||||||||
| As of December 2020 |
||||||||||||
| Corporate equity |
$ 74 | $ 51 | $125 | |||||||||
| Credit |
18 | 72 | 90 | |||||||||
| Real estate |
13 | 43 | 56 | |||||||||
| Hedge funds and other |
56 | 2 | 58 | |||||||||
| Funds and discretionary accounts |
161 | 168 | 329 | |||||||||
| Advisory accounts |
30 | 1 | 31 | |||||||||
| Total alternative investments |
$191 | $169 | $360 | |||||||||
| As of December 2019 |
||||||||||||
| Corporate equity |
$ 76 | $ 38 | $114 | |||||||||
| Credit |
14 | 51 | 65 | |||||||||
| Real estate |
8 | 43 | 51 | |||||||||
| Hedge funds and other |
58 | 2 | 60 | |||||||||
| Funds and discretionary accounts |
156 | 134 | 290 | |||||||||
| Advisory accounts |
29 | – | 29 | |||||||||
| Total alternative investments |
$185 | $134 | $319 | |||||||||
| • | Corporate equity primarily includes private equity. |
| • | Total alternative investments included uncalled capital that is available for future investing of $42 billion as of December 2021, $44 billion as of December 2020 and $32 billion as of December 2019. |
| • | Non-fee-earning non-fee-earning |
$ in billions |
As of December 2021 |
|||
| Included in AUS |
$ 64 |
|||
| Included in non-fee-earning |
43 |
|||
| Third-party commitments raised |
$107 |
|||
$ in billions |
Loans | |
Debt securities |
|
|
Equity securities |
|
|
CIE investments and other |
|
Total | |||||||||
| As of December 2021 |
||||||||||||||||||||
| Corporate equity |
$ |
$ |
$15 |
$ |
$15 |
|||||||||||||||
| Credit |
7 |
11 |
– |
– |
18 |
|||||||||||||||
| Real estate |
7 |
2 |
4 |
14 |
27 |
|||||||||||||||
| Other |
– |
– |
– |
1 |
1 |
|||||||||||||||
| Total |
$14 |
$13 |
$19 |
$15 |
$61 |
|||||||||||||||
| As of December 2020 |
||||||||||||||||||||
| Corporate equity |
$ |
$ |
$16 | $ |
$16 | |||||||||||||||
| Credit |
8 | 11 | – | – | 19 | |||||||||||||||
| Real estate |
9 | 2 | 4 | 19 | 34 | |||||||||||||||
| Other |
– | – | – | 1 | 1 | |||||||||||||||
| Total |
$17 | $13 | $20 | $20 | $70 | |||||||||||||||
| As of December 2019 |
||||||||||||||||||||
| Corporate equity |
$ |
$ |
$17 | $ |
$17 | |||||||||||||||
| Credit |
8 | 12 | – | – | 20 | |||||||||||||||
| Real estate |
9 | 2 | 5 | 17 | 33 | |||||||||||||||
| Other |
– | – | – | 1 | 1 | |||||||||||||||
| Total |
$17 | $14 | $22 | $18 | $71 | |||||||||||||||
| As of December | ||||||||
$ in billions |
2021 |
2020 | ||||||
| Loans |
$14 |
$ 17 | ||||||
| Debt securities |
13 |
13 | ||||||
| Total |
$27 |
$ 30 | ||||||
| Accounting Classification |
||||||||
| Debt securities at fair value |
48% |
44% | ||||||
| Loans at amortized cost |
40% |
43% | ||||||
| Loans at fair value |
12% |
13% | ||||||
| Total |
100% |
100% | ||||||
| Region |
||||||||
| Americas |
44% |
45% | ||||||
| EMEA |
34% |
33% | ||||||
| Asia |
22% |
22% | ||||||
| Total |
100% |
100% | ||||||
| Industry |
||||||||
| Consumers |
4% |
5% | ||||||
| Financial Institutions |
8% |
7% | ||||||
| Healthcare |
11% |
9% | ||||||
| Industrials |
14% |
15% | ||||||
| Natural Resources & Utilities |
3% |
4% | ||||||
| Real Estate |
33% |
36% | ||||||
| Technology, Media & Telecommunications |
17% |
14% | ||||||
| Other |
10% |
10% | ||||||
| Total |
100% |
100% | ||||||
| Goldman Sachs 2021 Form 10-K | 77 |
| As of December | ||||||||
$ in billions |
2021 |
2020 | ||||||
| Equity securities |
$19 |
$20 | ||||||
| Region |
||||||||
| Americas |
57% |
51% | ||||||
| EMEA |
23% |
18% | ||||||
| Asia |
20% |
31% | ||||||
| Total |
100% |
100% | ||||||
| Industry |
||||||||
| Consumers |
6% |
2% | ||||||
| Financial Institutions |
11% |
25% | ||||||
| Healthcare |
11% |
8% | ||||||
| Industrials |
7% |
5% | ||||||
| Natural Resources & Utilities |
10% |
7% | ||||||
| Real Estate |
22% |
18% | ||||||
| Technology, Media & Telecommunications |
30% |
31% | ||||||
| Other |
3% |
4% | ||||||
| Total |
100% |
100% | ||||||
| • | Equity securities included $15 billion as of December 2021 and $17 billion as of December 2020 of private equity positions, and $4 billion as of December 2021 and $3 billion as of December 2020 of public equity positions that converted from private equity upon the initial public offerings of the underlying companies. |
| • | The concentrations for real estate equity securities as of December 2021 were 5% for multifamily (3% as of December 2020), 5% for office (3% as of December 2020), 6% for mixed use (5% as of December 2020) and 6% for other real estate equity securities (7% as of December 2020). |
| Vintage | ||||
| As of December 2021 |
||||
| 2014 or earlier |
21% |
|||
| 2015 - 2017 |
31% |
|||
| 2018 - thereafter |
48% |
|||
| Total |
100% |
|||
| As of December 2020 |
||||
| 2013 or earlier |
33% | |||
| 2014 - 2016 |
34% | |||
| 2017 - thereafter |
33% | |||
| Total |
100% | |||
$ in billions |
Total Equity |
|||
| Beginning balance |
$ 22 |
|||
| Additions |
6 |
|||
| Dispositions |
(18 |
) | ||
| Mark-ups |
9 |
|||
| Ending balance |
$ 19 |
|||
| As of December | ||||||||
$ in billions |
2021 |
2020 | ||||||
| CIE assets, net of financings |
$7 |
$9 | ||||||
| Region |
||||||||
| Americas |
63% |
63% | ||||||
| EMEA |
25% |
22% | ||||||
| Asia |
12% |
15% | ||||||
| Total |
100% |
100% | ||||||
| Asset Class |
||||||||
| Hospitality |
4% |
4% | ||||||
| Industrials |
10% |
10% | ||||||
| Multifamily |
23% |
23% | ||||||
| Office |
24% |
28% | ||||||
| Retail |
5% |
6% | ||||||
| Senior Housing |
16% |
13% | ||||||
| Student Housing |
6% |
7% | ||||||
| Other |
12% |
9% | ||||||
| Total |
100% |
100% | ||||||
| Vintage | ||||
| As of December 2021 |
||||
| 2014 or earlier |
2% |
|||
| 2015 - 2017 |
29% |
|||
| 2018 - thereafter |
69% |
|||
| Total |
100% |
|||
| As of December 2020 |
||||
| 2013 or earlier |
1% | |||
| 2014 - 2016 |
17% | |||
| 2017 - thereafter |
82% | |||
| Total |
100% | |||
| 78 | Goldman Sachs 2021 Form 10-K |
| • | To develop our balance sheet projections, taking into account the general state of the financial markets and expected business activity levels, as well as regulatory requirements; |
| • | To allow Treasury and our independent risk oversight and control functions to objectively evaluate balance sheet limit requests from our revenue-producing units in the context of our overall balance sheet constraints, including our liability profile and capital levels, and key metrics; and |
| • | To inform the target amount, tenor and type of funding to raise, based on our projected assets and contractual maturities. |
| Goldman Sachs 2021 Form 10-K | 79 |
| As of December | ||||||||
$ in millions |
2021 |
2020 | ||||||
| Total assets |
$1,463,988 |
$1,163,028 | ||||||
| Unsecured long-term borrowings |
$ |
$ |
||||||
| Total shareholders’ equity |
$ |
$ |
||||||
| Leverage ratio |
13.3x |
12.1x | ||||||
| Debt-to-equity |
2.3x |
2.2x | ||||||
| • | The leverage ratio equals total assets divided by total shareholders’ equity and measures the proportion of equity and debt we use to finance assets. This ratio is different from the leverage ratios included in Note 20 to the consolidated financial statements. |
| • | The debt-to-equity |
| As of December | ||||||||
$ in millions, except per share amounts |
2021 |
2020 | ||||||
| Total shareholders’ equity |
$109,926 |
$ 95,932 | ||||||
| Preferred stock |
(10,703 |
) |
(11,203 | ) | ||||
| Common shareholders’ equity |
99,223 |
84,729 | ||||||
| Goodwill |
(4,285 |
) |
(4,332 | ) | ||||
| Identifiable intangible assets |
(418 |
) |
(630 | ) | ||||
| Tangible common shareholders’ equity |
$ 94,520 |
$ 79,767 | ||||||
| Book value per common share |
$ 284.39 |
$ 236.15 | ||||||
| Tangible book value per common share |
$ 270.91 |
$ 222.32 | ||||||
| • | Tangible common shareholders’ equity is calculated as total shareholders’ equity less preferred stock, goodwill and identifiable intangible assets. We believe that tangible common shareholders’ equity is meaningful because it is a measure that we and investors use to assess capital adequacy. Tangible common shareholders’ equity is a non-GAAP measure and may not be comparable to similar non-GAAP measures used by other companies. |
| • | Book value per common share and tangible book value per common share are based on common shares outstanding and restricted stock units granted to employees with no future service requirements and not subject to performance or market conditions (collectively, basic shares) of 348.9 million as of December 2021 and 358.8 million as of December 2020. We believe that tangible book value per common share (tangible common shareholders’ equity divided by basic shares) is meaningful because it is a measure that we and investors use to assess capital adequacy. Tangible book value per common share is a non-GAAP measure and may not be comparable to similar non-GAAP measures used by other companies. |
| 80 | Goldman Sachs 2021 Form 10-K |
| As of December | ||||||||||||||||
$ in millions |
2021 |
2020 | ||||||||||||||
| Deposits |
$ |
36% |
$259,962 | 33% | ||||||||||||
| Collateralized financings |
230,932 |
23% |
173,947 | 22% | ||||||||||||
| Unsecured short-term borrowings |
46,955 |
5% |
52,870 | 6% | ||||||||||||
| Unsecured long-term borrowings |
254,092 |
25% |
213,481 | 27% | ||||||||||||
| Total shareholders’ equity |
109,926 |
11% |
95,932 | 12% | ||||||||||||
| Total |
$1,006,132 |
100% |
$796,192 | 100% | ||||||||||||
| Goldman Sachs 2021 Form 10-K | 81 |
$ in millions |
First Quarter |
Second Quarter |
Third Quarter |
Fourth Quarter |
Total |
|||||||||||||||
| As of December 2021 |
||||||||||||||||||||
| 2023 |
$15,373 |
$7,271 |
$8,939 |
$11,628 |
$ 43,211 |
|||||||||||||||
| 2024 |
$ 8,622 |
$8,948 |
$8,869 |
$ 7,297 |
33,736 |
|||||||||||||||
| 2025 |
$ 6,855 |
$9,732 |
$5,671 |
$ 6,545 |
28,803 |
|||||||||||||||
| 2026 |
$ 6,174 |
$3,773 |
$3,485 |
$ 8,725 |
22,157 |
|||||||||||||||
| 2027 - thereafter |
126,185 |
|||||||||||||||||||
| Total |
$254,092 |
|||||||||||||||||||
| 82 | Goldman Sachs 2021 Form 10-K |
| Goldman Sachs 2021 Form 10-K | 83 |
| 84 | Goldman Sachs 2021 Form 10-K |
| As of December | ||||||||
2021 |
2020 | |||||||
| TLAC to RWAs |
21.5% |
22.0% | ||||||
| TLAC to leverage exposure |
9.5% |
9.5% | ||||||
| External long-term debt to RWAs |
8.5% |
8.5% | ||||||
| External long-term debt to leverage exposure |
4.5% |
4.5% | ||||||
| • | As of both December 2021 and December 2020, the TLAC to RWAs requirement included (i) the 18% minimum, (ii) the 2.5% buffer, (iii) the countercyclical capital buffer, which the FRB has set to zero percent and (iv) the G-SIB surcharge (Method 1). The G-SIB surcharge (Method 1) was 1.0% as of December 2021 and 1.5% as of December 2020. |
| • | The TLAC to leverage exposure requirement includes (i) the 7.5% minimum and (ii) the 2.0% leverage exposure buffer. |
| • | The external long-term debt to RWAs requirement includes (i) the 6% minimum and (ii) the 2.5% G-SIB surcharge (Method 2). |
| • | The external long-term debt to total leverage exposure is the 4.5% minimum. |
| For the Three Months Ended or as of December |
||||||||
$ in millions |
2021 |
2020 | ||||||
| TLAC |
$ |
$ |
||||||
| External long-term debt |
$ |
$ |
||||||
| RWAs |
$ |
$ |
||||||
| Leverage exposure |
$1,910,521 |
$1,332,937 | ||||||
| TLAC to RWAs |
44.0% |
39.8% | ||||||
| TLAC to leverage exposure |
15.6% |
18.2% | ||||||
| External long-term debt to RWAs |
25.8% |
22.8% | ||||||
| External long-term debt to leverage exposure |
9.1% |
10.4% | ||||||
| • | TLAC includes common and preferred stock, and eligible long-term debt issued by Group Inc. Eligible long-term debt represents unsecured debt, which has a remaining maturity of at least one year and satisfies additional requirements. |
| • | External long-term debt consists of eligible long-term debt subject to a haircut if it is due to be paid between one and two years. |
| • | RWAs represent Standardized RWAs as of December 2021 and Advanced RWAs as of December 2020. In accordance with the TLAC rules, the higher of Advanced or Standardized RWAs are used in the calculation of TLAC and external long-term debt ratios and applicable requirements. |
| • | Leverage exposure consists of average adjusted total assets and certain off-balance sheet exposures. Leverage exposure for the three months ended December 2020 excluded average holdings of U.S. Treasury securities and average deposits at the Federal Reserve |
| Goldman Sachs 2021 Form 10-K | 85 |
| As of December | ||||||||
2021 |
2020 | |||||||
| Risk-based capital requirements |
||||||||
| CET1 capital ratio |
8.1% |
8.1% | ||||||
| Tier 1 capital ratio |
9.9% |
10.0% | ||||||
| Total capital ratio |
12.4% |
12.5% | ||||||
| As of December | ||||||||
$ in millions |
2021 |
2020 | ||||||
| Risk-based capital and risk-weighted assets |
||||||||
| CET1 capital |
$ 28,810 |
$ 26,962 | ||||||
| Tier 1 capital |
$ 37,110 |
$ 35,262 | ||||||
| Tier 2 capital |
$ 5,377 |
$ 5,377 | ||||||
| Total capital |
$ 42,487 |
$ 40,639 | ||||||
| RWAs |
$269,762 |
$252,355 | ||||||
| Risk-based capital ratios |
||||||||
| CET1 capital ratio |
10.7% |
10.7% | ||||||
| Tier 1 capital ratio |
13.8% |
14.0% | ||||||
| Total capital ratio |
15.7% |
16.1% | ||||||
| 86 | Goldman Sachs 2021 Form 10-K |
| Goldman Sachs 2021 Form 10-K | 87 |
| • | Evaluating and monitoring the impacts of USD LIBOR settings across our businesses, including transactions and products; |
| • | Ensuring that legacy financial instruments and contracts that continue to be impacted by the transition already contain appropriate fallback language or are being amended, either through bilateral negotiation or using industry-wide tools, such as protocols; |
| • | Enhancements to infrastructure (for example, models and systems) to prepare for a smooth transition from USD LIBOR to alternative risk-free reference rates; |
| • | Ensuring operational readiness to offer and support various alternative risk-free reference rate products; |
| • | Active participation in central bank and sector working groups, including responding to industry consultations; and |
| • | Client education and communication. |
| 88 | Goldman Sachs 2021 Form 10-K |
| • | Purchasing or retaining residual and other interests in special purpose entities, such as mortgage-backed and other asset-backed securitization vehicles; |
| • | Holding senior and subordinated debt, interests in limited and general partnerships, and preferred and common stock in other nonconsolidated vehicles; |
| • | Entering into interest rate, foreign currency, equity, commodity and credit derivatives, including total return swaps; and |
| • | Providing guarantees, indemnifications, commitments, letters of credit and representations and warranties. |
Off-Balance Sheet Arrangement |
Disclosure in Form 10-K | |||
| Variable interests and other obligations, including contingent obligations, arising from variable interests in nonconsolidated variable interest entities (VIEs) |
See Note 17 to the consolidated financial statements. | |||
| Guarantees, and lending and other commitments |
See Note 18 to the consolidated financial statements. | |||
| Derivatives |
See “Risk Management — Credit Risk Management — Credit Exposures — OTC Derivatives” and Notes 4, 5, 7 and 18 to the consolidated financial statements. | |||
| Goldman Sachs 2021 Form 10-K | 89 |
| 90 | Goldman Sachs 2021 Form 10-K |
| • | Risk Identification and Assessment. |
| • | Risk Appetite, Limit and Threshold Setting. |
| • | Risk Reporting and Monitoring. |
| Goldman Sachs 2021 Form 10-K | 91 |
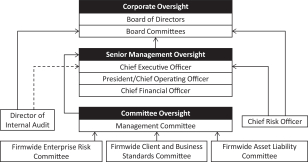
| • | Risk Decision-Making. decision-making on risk management issues and ensures implementation of those decisions. We make extensive use of risk committees that meet regularly and serve as an important means to facilitate and foster ongoing discussions to manage and mitigate risks. |

| 92 | Goldman Sachs 2021 Form 10-K |
| • | Firmwide Risk Council. co-chaired by the chairs of the Firmwide Enterprise Risk Committee. |
| • | Firmwide New Activity Committee. co-chaired by the controller and chief accounting officer, and our chief administrative officer, who are appointed as chairs by the chairs of the Firmwide Enterprise Risk Committee. |
| • | Firmwide Operational Risk and Resilience Committee. co-chaired by our chief administrative officer and the head of Operational Risk, who are appointed as chairs by the chairs of the Firmwide Enterprise Risk Committee. |
| • | Firmwide Conduct Committee. |
| • | Risk Governance Committee. |
| Goldman Sachs 2021 Form 10-K | 93 |
| • | Firmwide Reputational Risk Committee. |
| • | Firmwide Suitability Committee. co-chaired by our chief compliance officer, and a co-head of EMEA FICC sales, who are appointed as chairs by the chair of the Firmwide Client and Business Standards Committee. |
| • | Firmwide Investment Policy Committee. co-chaired by a co-head of our Asset Management Division, a co-head of our Global Markets Division and our chief risk officer, who are appointed as chairs by our president and chief operating officer and our chief financial officer. |
| • | Firmwide Capital Committee. co-chaired by the head of Credit Risk and the head of Americas Leveraged Finance, who are appointed as chairs by the chairs of the Firmwide Enterprise Risk Committee. |
| • | Firmwide Commitments Committee. co-chaired by the chief underwriting officer for EMEA, the chief equity underwriting officer for the Americas, a co-chairman of the Global Financial Institutions Group and a co-head of the Industrials Group in our Investment Banking Division, who are appointed as chairs by the chair of the Firmwide Client and Business Standards Committee. |
| 94 | Goldman Sachs 2021 Form 10-K |
| Goldman Sachs 2021 Form 10-K | 95 |
| • | The first days or weeks of a liquidity crisis are the most critical to a company’s survival; |
| • | Focus must be maintained on all potential cash and collateral outflows, not just disruptions to financing flows. Our businesses are diverse, and our liquidity needs are determined by many factors, including market movements, collateral requirements and client commitments, all of which can change dramatically in a difficult funding environment; |
| • | During a liquidity crisis, credit-sensitive funding, including unsecured debt, certain deposits and some types of secured financing agreements, may be unavailable, and the terms (e.g., interest rates, collateral provisions and tenor) or availability of other types of secured financing may change and certain deposits may be withdrawn; and |
| • | As a result of our policy to pre-fund liquidity that we estimate may be needed in a crisis, we hold more unencumbered securities and have larger funding balances than our businesses would otherwise require. We believe that our liquidity is stronger with greater balances of highly liquid unencumbered securities, even though it increases our total assets and our funding costs. |
| 96 | Goldman Sachs 2021 Form 10-K |
| • | Conservatively managing the overall characteristics of our funding book, with a focus on maintaining long-term, diversified sources of funding in excess of our current requirements. See “Balance Sheet and Funding Sources — Funding Sources” for further information; |
| • | Actively managing and monitoring our asset base, with particular focus on the liquidity, holding period and ability to fund assets on a secured basis. We assess our funding requirements and our ability to liquidate assets in a stressed environment while appropriately managing risk. This enables us to determine the most appropriate funding products and tenors. See “Balance Sheet and Funding Sources — Balance Sheet Management” for further information about our balance sheet management process and “— Funding Sources — Secured Funding” for further information about asset classes that may be harder to fund on a secured basis; and |
| • | Raising secured and unsecured financing that has a long tenor relative to the liquidity profile of our assets. This reduces the risk that our liabilities will come due in advance of our ability to generate liquidity from the sale of our assets. Because we maintain a highly liquid balance sheet, the holding period of certain of our assets may be materially shorter than their contractual maturity dates. |
| Goldman Sachs 2021 Form 10-K | 97 |
| • | Severely challenged market environments, which includes low consumer and corporate confidence, financial and political instability, and adverse changes in market values, including potential declines in equity markets and widening of credit spreads; and |
| • | A firm-specific crisis potentially triggered by material losses, reputational damage, litigation and/or a ratings downgrade. |
| • | Liquidity needs over a 30-day scenario; |
| • | A two-notch downgrade of our long-term senior unsecured credit ratings; |
| • | Changing conditions in funding markets, which limit our access to unsecured and secured funding; |
| • | No support from additional government funding facilities. Although we have access to various central bank funding programs, we do not assume reliance on additional sources of funding in a liquidity crisis; and |
| • | A combination of contractual outflows and contingent outflows arising from both our on- and off-balance sheet arrangements. Contractual outflows include, among other things, upcoming maturities of unsecured debt, term deposits and secured funding. Contingent outflows include, among other things, the withdrawal of customer credit balances in our prime brokerage business, increase in variation margin requirements due to adverse changes in the value of our exchange-traded and OTC-cleared derivatives, draws on unfunded commitments and withdrawals of deposits that have no contractual maturity. See notes to the consolidated financial statements for further information about contractual outflows, including Note 11 for collateralized financings, Note 13 for deposits, Note 14 for unsecured long-term borrowings and Note 15 for operating lease payments, and “Off-Balance Sheet Arrangements” for further information about our various types of off-balance sheet arrangements. |
| 98 | Goldman Sachs 2021 Form 10-K |
| Average for the | ||||||||||||||||||||
| Three Months Ended December |
Year Ended December |
|||||||||||||||||||
$ in millions |
2021 |
2020 | 2021 |
2020 | ||||||||||||||||
| Denomination |
||||||||||||||||||||
| U.S. dollar |
$230,720 |
$190,735 | $217,797 |
$181,949 | ||||||||||||||||
| Non-U.S. dollar |
122,401 |
107,106 | 116,723 |
101,182 | ||||||||||||||||
| Total |
$353,121 |
$297,841 | $334,520 |
$283,131 | ||||||||||||||||
| Asset Class |
||||||||||||||||||||
| Overnight cash deposits |
$188,223 |
$108,345 | $173,000 |
$100,489 | ||||||||||||||||
| U.S. government obligations |
107,898 |
125,060 | 108,260 |
113,531 | ||||||||||||||||
| U.S. agency obligations |
13,154 |
7,059 | 10,183 |
12,017 | ||||||||||||||||
| Non-U.S. government obligations |
43,846 |
57,377 | 43,077 |
57,094 | ||||||||||||||||
| Total |
$353,121 |
$297,841 | $334,520 |
$283,131 | ||||||||||||||||
| Entity Type |
||||||||||||||||||||
| Group Inc. and Funding IHC |
$ 54,489 |
$ 36,737 | $ 53,205 |
$ 41,705 | ||||||||||||||||
| Major broker-dealer subsidiaries |
107,279 |
100,891 | 104,326 |
99,798 | ||||||||||||||||
| Major bank subsidiaries |
191,353 |
160,213 | 176,989 |
141,628 | ||||||||||||||||
| Total |
$353,121 |
$297,841 | $334,520 |
$283,131 | ||||||||||||||||
| • | The U.S. dollar-denominated GCLA consists of (i) unencumbered U.S. government and agency obligations (including highly liquid U.S. agency mortgage-backed obligations), all of which are eligible as collateral in Federal Reserve open market operations and (ii) certain overnight U.S. dollar cash deposits. |
| • | The non-U.S. dollar-denominated GCLA consists of non-U.S. government obligations (only unencumbered German, French, Japanese and U.K. government obligations) and certain overnight cash deposits in highly liquid currencies. |
| Goldman Sachs 2021 Form 10-K | 99 |
| Average for the Three Months Ended |
||||||||||||
| $ in millions |
December 2021 |
|
September 2021 |
|
|
December 2020 |
| |||||
| Total HQLA |
$342,047 |
$344,351 | $291,393 | |||||||||
| Eligible HQLA |
$248,570 |
$249,915 | $212,614 | |||||||||
| Net cash outflows |
$203,623 |
$196,664 | $166,551 | |||||||||
| LCR |
122% |
127% | 128% | |||||||||
| • | GS Bank USA. |
| • | GSI and GSIB. |
| • | GSBE. |
| • | Other Subsidiaries. |
| 100 | Goldman Sachs 2021 Form 10-K |
As of December 2021 |
||||||||||||||||||||
DBRS |
Fitch |
Moody’s |
R&I |
S&P |
||||||||||||||||
| Short-term debt |
R-1 (middle) |
F1 |
P-1 |
a-1 |
A-2 |
|||||||||||||||
| Long-term debt |
A (high) |
A |
A2 |
A |
BBB+ |
|||||||||||||||
| Subordinated debt |
A |
BBB+ |
Baa2 |
A- |
BBB |
|||||||||||||||
| Trust preferred |
A |
BBB- |
Baa3 |
N/A |
BB+ |
|||||||||||||||
| Preferred stock |
BBB (high) |
BBB- |
Ba1 |
N/A |
BB+ |
|||||||||||||||
| Ratings outlook |
Stable |
Stable |
Stable |
Stable |
Stable |
|||||||||||||||
| • | The ratings and outlook are by DBRS, Inc. (DBRS), Fitch, Inc. (Fitch), Moody’s Investors Service (Moody’s), Rating and Investment Information, Inc. (R&I), and Standard & Poor’s Ratings Services (S&P). |
| • | The ratings for trust preferred relate to the guaranteed preferred beneficial interests issued by Goldman Sachs Capital I. |
| • | The DBRS, Fitch, Moody’s and S&P ratings for preferred stock include the APEX issued by Goldman Sachs Capital II and Goldman Sachs Capital III. |
As of December 2021 |
||||||||||||
Fitch |
Moody’s |
S&P |
||||||||||
| GS Bank USA |
||||||||||||
| Short-term debt |
F1 |
P-1 |
A-1 |
|||||||||
| Long-term debt |
A+ |
A1 |
A+ |
|||||||||
| Short-term bank deposits |
F1+ |
P-1 |
N/A |
|||||||||
| Long-term bank deposits |
AA- |
A1 |
N/A |
|||||||||
| Ratings outlook |
Stable |
Stable |
Stable |
|||||||||
| GSIB |
||||||||||||
| Short-term debt |
F1 |
P-1 |
A-1 |
|||||||||
| Long-term debt |
A+ |
A1 |
A+ |
|||||||||
| Short-term bank deposits |
F1 |
P-1 |
N/A |
|||||||||
| Long-term bank deposits |
A+ |
A1 |
N/A |
|||||||||
| Ratings outlook |
Stable |
Stable |
Stable |
|||||||||
| GSBE |
||||||||||||
| Short-term debt |
F1 |
P-1 |
A-1 |
|||||||||
| Long-term debt |
A |
A1 |
A+ |
|||||||||
| Short-term bank deposits |
N/A |
P-1 |
N/A |
|||||||||
| Long-term bank deposits |
N/A |
A1 |
N/A |
|||||||||
| Ratings outlook |
Stable |
Stable |
Stable |
|||||||||
| GS&Co. |
||||||||||||
| Short-term debt |
F1 |
N/A |
A-1 |
|||||||||
| Long-term debt |
A+ |
N/A |
A+ |
|||||||||
| Ratings outlook |
Stable |
N/A |
Stable |
|||||||||
| GSI |
||||||||||||
| Short-term debt |
F1 |
P-1 |
A-1 |
|||||||||
| Long-term debt |
A+ |
A1 |
A+ |
|||||||||
| Ratings outlook |
Stable |
Stable |
Stable |
|||||||||
| • | Our liquidity, market, credit and operational risk management practices; |
| • | Our level and variability of earnings; |
| • | Our capital base; |
| • | Our franchise, reputation and management; |
| • | Our corporate governance; and |
| • | The external operating and economic environment, including, in some cases, the assumed level of government support or other systemic considerations, such as potential resolution. |
| Goldman Sachs 2021 Form 10-K | 101 |
| • | Interest rate risk: results from exposures to changes in the level, slope and curvature of yield curves, the volatilities of interest rates, prepayment speeds and credit spreads; |
| • | Equity price risk: results from exposures to changes in prices and volatilities of individual equities, baskets of equities and equity indices; |
| • | Currency rate risk: results from exposures to changes in spot prices, forward prices and volatilities of currency rates; and |
| • | Commodity price risk: results from exposures to changes in spot prices, forward prices and volatilities of commodities, such as crude oil, petroleum products, natural gas, electricity, and precious and base metals. |
| • | Monitoring compliance with established market risk limits and reporting our exposures; |
| • | Diversifying exposures; |
| • | Controlling position sizes; and |
| • | Evaluating mitigants, such as economic hedges in related securities or derivatives. |
| 102 | Goldman Sachs 2021 Form 10-K |
| • | VaR does not estimate potential losses over longer time horizons where moves may be extreme; |
| • | VaR does not take account of the relative liquidity of different risk positions; and |
| • | Previous moves in market risk factors may not produce accurate predictions of all future market moves. |
| • | Positions that are best measured and monitored using sensitivity measures; and |
| • | The impact of changes in counterparty and our own credit spreads on derivatives, as well as changes in our own credit spreads on financial liabilities for which the fair value option was elected. |
| Goldman Sachs 2021 Form 10-K | 103 |
| Year Ended December | ||||||||
$ in millions |
2021 |
2020 | ||||||
| Categories |
||||||||
| Interest rates |
$ 60 |
$ 71 | ||||||
| Equity prices |
43 |
55 | ||||||
| Currency rates |
13 |
23 | ||||||
| Commodity prices |
25 |
20 | ||||||
| Diversification effect |
(55 |
) |
(75 | ) | ||||
| Total |
$ 86 |
$ 94 | ||||||
| As of December | ||||||||
$ in millions |
2021 |
2020 | ||||||
| Categories |
||||||||
| Interest rates |
$ 69 |
$ 60 | ||||||
| Equity prices |
31 |
50 | ||||||
| Currency rates |
19 |
11 | ||||||
| Commodity prices |
30 |
16 | ||||||
| Diversification effect |
(58 |
) |
(46 | ) | ||||
| Total |
$ 91 |
$ 91 | ||||||
| Year Ended December | ||||||||||||||||||
2021 |
2020 | |||||||||||||||||
$ in millions |
High |
Low |
High | Low | ||||||||||||||
| Categories |
||||||||||||||||||
| Interest rates |
$ 74 |
$49 |
$120 | $46 | ||||||||||||||
| Equity prices |
$ 71 |
$30 |
$116 | $23 | ||||||||||||||
| Currency rates |
$ 20 |
$ 8 |
$ 53 | $ 8 | ||||||||||||||
| Commodity prices |
$ 45 |
$14 |
$ 54 | $ 9 | ||||||||||||||
| Firmwide |
||||||||||||||||||
| VaR |
$105 |
$69 |
$195 | $58 | ||||||||||||||

| 104 | Goldman Sachs 2021 Form 10-K |
| Year Ended December | ||||||||
$ in millions |
2021 |
2020 | ||||||
| >$100 |
53 |
50 | ||||||
| $75 - $100 |
45 |
37 | ||||||
| $50 - $75 |
42 |
48 | ||||||
| $25 - $50 |
33 |
51 | ||||||
| $0 - $25 |
45 |
43 | ||||||
| $(25) - $0 |
24 |
11 | ||||||
| $(50) - $(25) |
6 |
8 | ||||||
| $(75) - $(50) |
2 |
3 | ||||||
| $(100) - $(75) |
1 |
2 | ||||||
| <$(100) |
1 |
– | ||||||
| Total |
252 |
253 | ||||||
| As of December | ||||||||
$ in millions |
2021 |
2020 | ||||||
| Equity |
$1,953 |
$1,854 | ||||||
| Debt |
2,244 |
2,516 | ||||||
| Total |
$4,197 |
$4,370 | ||||||
| • | The market risk of these positions is determined by estimating the potential reduction in net revenues of a 10% decline in the value of these positions. |
| • | Equity positions relate to private and restricted public equity securities, including interests in funds that invest in corporate equities and real estate and interests in hedge funds. |
| • | Debt positions include interests in funds that invest in corporate mezzanine and senior debt instruments, loans backed by commercial and residential real estate, corporate bank loans and other corporate debt, including acquired portfolios of distressed loans. |
| • | Funded equity and debt positions are included in our consolidated balance sheets in investments and loans. See Note 8 to the consolidated financial statements for further information about investments and Note 9 to the consolidated financial statements for further information about loans. |
| • | These measures do not reflect the diversification effect across asset categories or across other market risk measures. |
| Goldman Sachs 2021 Form 10-K | 105 |
| Assets or Liabilities |
Market Risk Measures | |
| Collateralized agreements, at fair value |
VaR | |
| Customer and other receivables, at fair value |
10% Sensitivity Measures | |
| Trading assets |
VaR Credit Spread Sensitivity | |
| Investments, at fair value |
VaR 10% Sensitivity Measures | |
| Loans |
VaR 10% Sensitivity Measures Interest Rate Sensitivity | |
| Deposits, at fair value |
VaR Credit Spread Sensitivity | |
| Collateralized financings, at fair value |
VaR | |
| Trading liabilities |
VaR Credit Spread Sensitivity | |
| Unsecured borrowings, at fair value |
VaR Credit Spread Sensitivity |
| • | Monitoring compliance with established credit risk limits and reporting our credit exposures and credit concentrations; |
| • | Establishing or approving underwriting standards; |
| • | Assessing the likelihood that a counterparty will default on its payment obligations; |
| • | Measuring our current and potential credit exposure and losses resulting from a counterparty default; |
| • | Using credit risk mitigants, including collateral and hedging; and |
| • | Maximizing recovery through active workout and restructuring of claims. |
| 106 | Goldman Sachs 2021 Form 10-K |
| Goldman Sachs 2021 Form 10-K | 107 |
| As of December | ||||||||
$ in millions |
2021 |
2020 | ||||||
| Cash and Cash Equivalents |
$236,168 |
$131,324 | ||||||
| Industry |
||||||||
| Financial Institutions |
5% |
11% | ||||||
| Sovereign |
95% |
89% | ||||||
| Total |
100% |
100% | ||||||
| Region |
||||||||
| Americas |
55% |
45% | ||||||
| EMEA |
36% |
41% | ||||||
| Asia |
9% |
14% | ||||||
| Total |
100% |
100% | ||||||
| Credit Quality (Credit Rating Equivalent) |
||||||||
| AAA |
64% |
44% | ||||||
| AA |
24% |
38% | ||||||
| A |
11% |
17% | ||||||
| BBB |
1% |
1% | ||||||
| Total |
100% |
100% | ||||||
| As of December | ||||||||
$ in millions |
2021 |
2020 | ||||||
| OTC derivative assets |
$ 58,637 |
$ 64,850 | ||||||
| Collateral (not netted under U.S. GAAP) |
(17,245 |
) |
(18,990 | ) | ||||
| Net credit exposure |
$ 41,392 |
$ 45,860 | ||||||
| Industry |
||||||||
| Consumer & Retail |
2% |
4% | ||||||
| Diversified Industrials |
10% |
23% | ||||||
| Financial Institutions |
15% |
12% | ||||||
| Funds |
13% |
12% | ||||||
| Healthcare |
1% |
2% | ||||||
| Municipalities & Nonprofit |
5% |
6% | ||||||
| Natural Resources & Utilities |
33% |
11% | ||||||
| Sovereign |
8% |
14% | ||||||
| Technology, Media & Telecommunications |
8% |
12% | ||||||
| Other (including Special Purpose Vehicles) |
5% |
4% | ||||||
| Total |
100% |
100% | ||||||
| Region |
||||||||
| Americas |
53% |
62% | ||||||
| EMEA |
37% |
30% | ||||||
| Asia |
10% |
8% | ||||||
| Total |
100% |
100% | ||||||
| • | OTC derivative assets, included in the consolidated balance sheets, are reported on a net-by-counterparty |
| • | Collateral represents cash collateral and the fair value of securities collateral, primarily U.S. and non-U.S. government and agency obligations, received under credit support agreements, that we consider when determining credit risk, but such collateral is not eligible for netting under U.S. GAAP. |
| 108 | Goldman Sachs 2021 Form 10-K |
$ in millions |
|
Investment- Grade |
|
|
Non-Investment- Grade / Unrated |
|
Total | |||||
| As of December 2021 |
||||||||||||
| Less than 1 year |
$ |
$ 11,203 |
$ 38,871 |
|||||||||
| 1 - 5 years |
21,746 |
9,515 |
31,261 |
|||||||||
| Greater than 5 years |
64,670 |
6,590 |
71,260 |
|||||||||
| Total |
114,084 |
27,308 |
141,392 |
|||||||||
| Netting |
(89,244 |
) |
(10,756 |
) |
(100,000 |
) | ||||||
| Net credit exposure |
$ |
$ 16,552 |
$ 41,392 |
|||||||||
| As of December 2020 |
||||||||||||
| Less than 1 year |
$ 22,332 | $ |
$ |
|||||||||
| 1 - 5 years |
23,927 | 16,486 | 40,413 | |||||||||
| Greater than 5 years |
77,653 | 8,958 | 86,611 | |||||||||
| Total |
123,912 | 37,951 | 161,863 | |||||||||
| Netting |
(101,691 | ) | (14,312 | ) | (116,003 | ) | ||||||
| Net credit exposure |
$ 22,221 | $ |
$ |
|||||||||
| • | Tenor is based on remaining contractual maturity. |
| • | Netting includes counterparty netting across tenor categories and collateral that we consider when determining credit risk (including collateral that is not eligible for netting under U.S. GAAP). Counterparty netting within the same tenor category is included within such tenor category. |
| Investment-Grade | ||||||||||||||||||||
$ in millions |
AAA | AA | A | BBB | Total | |||||||||||||||
| As of December 2021 |
|
|||||||||||||||||||
| Less than 1 year |
$ 1,017 |
$ |
$ 12,481 |
$ 9,244 |
$ |
|||||||||||||||
| 1 - 5 years |
1,150 |
3,071 |
8,298 |
9,227 |
21,746 |
|||||||||||||||
| Greater than 5 years |
13,777 |
5,421 |
23,867 |
21,605 |
64,670 |
|||||||||||||||
| Total |
15,944 |
13,418 |
44,646 |
40,076 |
114,084 |
|||||||||||||||
| Netting |
(13,535 |
) |
(9,501 |
) |
(36,005 |
) |
(30,203 |
) |
(89,244 |
) | ||||||||||
| Net credit exposure |
$ 2,409 |
$ |
$ 8,641 |
$ 9,873 |
$ |
|||||||||||||||
| As of December 2020 |
||||||||||||||||||||
| Less than 1 year |
$ |
$ 4,146 | $ |
$ |
$ 22,332 | |||||||||||||||
| 1 - 5 years |
1,069 | 4,189 | 10,976 | 7,693 | 23,927 | |||||||||||||||
| Greater than 5 years |
16,550 | 7,403 | 28,410 | 25,290 | 77,653 | |||||||||||||||
| Total |
18,151 | 15,738 | 50,826 | 39,197 | 123,912 | |||||||||||||||
| Netting |
(14,364 | ) | (11,230 | ) | (44,529 | ) | (31,568 | ) | (101,691 | ) | ||||||||||
| Net credit exposure |
$ |
$ 4,508 | $ |
$ |
$ 22,221 | |||||||||||||||
| Non-Investment-Grade / Unrated |
||||||||||||||||||||
$ in millions |
BB or lower | Unrated | Total | |||||||||||||||||
| As of December 2021 |
|
|||||||||||||||||||
| Less than 1 year |
$ 10,446 |
$ |
$ |
|||||||||||||||||
| 1 - 5 years |
9,210 |
305 |
9,515 |
|||||||||||||||||
| Greater than 5 years |
6,320 |
270 |
6,590 |
|||||||||||||||||
| Total |
25,976 |
1,332 |
27,308 |
|||||||||||||||||
| Netting |
(10,683 |
) |
(73 |
) |
(10,756 |
) | ||||||||||||||
| Net credit exposure |
$ 15,293 |
$ 1,259 |
$ |
|||||||||||||||||
| As of December 2020 |
||||||||||||||||||||
| Less than 1 year |
$ |
$ |
$ 12,507 | |||||||||||||||||
| 1 - 5 years |
16,274 | 212 | 16,486 | |||||||||||||||||
| Greater than 5 years |
8,844 | 114 | 8,958 | |||||||||||||||||
| Total |
36,659 | 1,292 | 37,951 | |||||||||||||||||
| Netting |
(14,114 | ) | (198 | ) | (14,312 | ) | ||||||||||||||
| Net credit exposure |
$ |
$ |
$ 23,639 | |||||||||||||||||
$ in millions |
Loans | |
Lending Commitments |
|
Total | |||||||
| As of December 2021 |
||||||||||||
| Corporate |
$ 55,927 |
$155,930 |
$211,857 |
|||||||||
| Wealth management |
43,998 |
4,094 |
48,092 |
|||||||||
| Commercial real estate |
25,883 |
5,813 |
31,696 |
|||||||||
| Residential real estate |
15,913 |
3,396 |
19,309 |
|||||||||
| Consumer: |
||||||||||||
| Installment |
3,672 |
9 |
3,681 |
|||||||||
| Credit cards |
8,212 |
35,932 |
44,144 |
|||||||||
| Other |
8,530 |
6,378 |
14,908 |
|||||||||
| Total |
$162,135 |
$211,552 |
$373,687 |
|||||||||
| Allowance for loan losses |
$ |
) |
$ |
) |
$ |
) | ||||||
| As of December 2020 |
||||||||||||
| Corporate |
$ 48,659 | $135,818 | $184,477 | |||||||||
| Wealth management |
33,023 | 3,103 | 36,126 | |||||||||
| Commercial real estate |
20,290 | 4,268 | 24,558 | |||||||||
| Residential real estate |
5,750 | 1,900 | 7,650 | |||||||||
| Consumer: |
||||||||||||
| Installment |
3,823 | 4 | 3,827 | |||||||||
| Credit cards |
4,270 | 21,640 | 25,910 | |||||||||
| Other |
4,174 | 4,842 | 9,016 | |||||||||
| Total |
$119,989 | $171,575 | $291,564 | |||||||||
| Allowance for loan losses |
$ |
) | $ (557 | ) | $ |
) | ||||||
| Goldman Sachs 2021 Form 10-K | 109 |
$ in millions |
Loans | |
Lending Commitments |
|
Total | |||||||
| As of December 2021 |
||||||||||||
| Corporate |
$55,927 |
$155,930 |
$211,857 |
|||||||||
| Industry |
||||||||||||
| Consumer & Retail |
8% |
13% |
12% |
|||||||||
| Diversified Industrials |
13% |
16% |
15% |
|||||||||
| Financial Institutions |
8% |
7% |
7% |
|||||||||
| Funds |
21% |
4% |
8% |
|||||||||
| Healthcare |
7% |
9% |
9% |
|||||||||
| Natural Resources & Utilities |
9% |
17% |
14% |
|||||||||
| Real Estate |
8% |
5% |
6% |
|||||||||
| Technology, Media & Telecommunications |
18% |
24% |
23% |
|||||||||
| Other (including Special Purpose Vehicles) |
8% |
5% |
6% |
|||||||||
| Total |
100% |
100% |
100% |
|||||||||
| Region |
||||||||||||
| Americas |
54% |
76% |
70% |
|||||||||
| EMEA |
38% |
21% |
26% |
|||||||||
| Asia |
8% |
3% |
4% |
|||||||||
| Total |
100% |
100% |
100% |
|||||||||
| Credit Quality (Credit Rating Equivalent) |
|
|||||||||||
| AAA |
– |
1% |
1% |
|||||||||
| AA |
1% |
5% |
3% |
|||||||||
| A |
5% |
16% |
13% |
|||||||||
| BBB |
22% |
38% |
34% |
|||||||||
| BB or lower |
72% |
40% |
49% |
|||||||||
| Total |
100% |
100% |
100% |
|||||||||
| As of December 2020 |
||||||||||||
| Corporate |
$48,659 | $135,818 | $184,477 | |||||||||
| Industry |
||||||||||||
| Consumer & Retail |
7% | 14% | 12% | |||||||||
| Diversified Industrials |
17% | 17% | 17% | |||||||||
| Financial Institutions |
10% | 6% | 7% | |||||||||
| Funds |
13% | 3% | 6% | |||||||||
| Healthcare |
7% | 12% | 11% | |||||||||
| Natural Resources & Utilities |
12% | 18% | 16% | |||||||||
| Real Estate |
8% | 6% | 6% | |||||||||
| Technology, Media & Telecommunications |
17% | 19% | 19% | |||||||||
| Other (including Special Purpose Vehicles) |
9% | 5% | 6% | |||||||||
| Total |
100% | 100% | 100% | |||||||||
| Region |
||||||||||||
| Americas |
60% | 70% | 67% | |||||||||
| EMEA |
31% | 28% | 29% | |||||||||
| Asia |
9% | 2% | 4% | |||||||||
| Total |
100% | 100% | 100% | |||||||||
| Credit Quality (Credit Rating Equivalent) |
|
|||||||||||
| AAA |
– | 1% | 1% | |||||||||
| AA |
– | 5% | 4% | |||||||||
| A |
6% | 19% | 15% | |||||||||
| BBB |
13% | 36% | 30% | |||||||||
| BB or lower |
80% | 38% | 49% | |||||||||
| Other metrics/unrated |
1% | 1% | 1% | |||||||||
| Total |
100% | 100% | 100% | |||||||||
$ in millions |
Loans | |
Lending Commitments |
|
Total | |||||||
| As of December 2021 |
||||||||||||
| Wealth Management |
$43,998 |
$4,094 |
$48,092 |
|||||||||
| Region |
||||||||||||
| Americas |
87% |
98% |
88% |
|||||||||
| EMEA |
10% |
2% |
9% |
|||||||||
| Asia |
3% |
– |
3% |
|||||||||
| Total |
100% |
100% |
100% |
|||||||||
| Credit Quality (Credit Rating Equivalent) |
|
|||||||||||
| Investment-grade |
72% |
67% |
71% |
|||||||||
| Non-investment-grade |
13% |
19% |
14% |
|||||||||
| Other metrics/unrated |
15% |
14% |
15% |
|||||||||
| Total |
100% |
100% |
100% |
|||||||||
| As of December 2020 |
||||||||||||
| Wealth Management |
$33,023 | $3,103 | $36,126 | |||||||||
| Region |
||||||||||||
| Americas |
88% | 99% | 89% | |||||||||
| EMEA |
10% | 1% | 9% | |||||||||
| Asia |
2% | – | 2% | |||||||||
| Total |
100% | 100% | 100% | |||||||||
| Credit Quality (Credit Rating Equivalent) |
|
|||||||||||
| Investment-grade |
67% | 58% | 66% | |||||||||
| Non-investment-grade |
16% | 21% | 17% | |||||||||
| Other metrics/unrated |
17% | 21% | 17% | |||||||||
| Total |
100% | 100% | 100% | |||||||||
| 110 | Goldman Sachs 2021 Form 10-K |
$ in millions |
Loans | |
Lending Commitments |
|
Total | |||||||
| As of December 2021 |
||||||||||||
| Commercial Real Estate |
$25,883 |
$5,813 |
$31,696 |
|||||||||
| Region |
||||||||||||
| Americas |
80% |
75% |
79% |
|||||||||
| EMEA |
15% |
11% |
14% |
|||||||||
| Asia |
5% |
14% |
7% |
|||||||||
| Total |
100% |
100% |
100% |
|||||||||
| Credit Quality (Credit Rating Equivalent) |
|
|||||||||||
| Investment-grade |
15% |
10% |
14% |
|||||||||
| Non-investment-grade |
83% |
90% |
85% |
|||||||||
| Other metrics/unrated |
2% |
– |
1% |
|||||||||
| Total |
100% |
100% |
100% |
|||||||||
| As of December 2020 |
||||||||||||
| Commercial Real Estate |
$20,290 | $4,268 | $24,558 | |||||||||
| Region |
||||||||||||
| Americas |
71% | 65% | 70% | |||||||||
| EMEA |
19% | 10% | 18% | |||||||||
| Asia |
10% | 25% | 12% | |||||||||
| Total |
100% | 100% | 100% | |||||||||
| Credit Quality (Credit Rating Equivalent) |
|
|||||||||||
| Investment-grade |
9% | 13% | 10% | |||||||||
| Non-investment-grade |
86% | 87% | 86% | |||||||||
| Other metrics/unrated |
5% | – | 4% | |||||||||
| Total |
100% | 100% | 100% | |||||||||
$ in millions |
Loans | |
Lending Commitments |
|
Total | |||||||
| As of December 2021 |
||||||||||||
| Residential Real Estate |
$15,913 |
$3,396 |
$19,309 |
|||||||||
| Region |
||||||||||||
| Americas |
95% |
79% |
92% |
|||||||||
| EMEA |
2% |
19% |
5% |
|||||||||
| Asia |
3% |
2% |
3% |
|||||||||
| Total |
100% |
100% |
100% |
|||||||||
| Credit Quality (Credit Rating Equivalent) |
|
|||||||||||
| Investment-grade |
7% |
24% |
10% |
|||||||||
| Non-investment-grade |
87% |
74% |
84% |
|||||||||
| Other metrics/unrated |
6% |
2% |
6% |
|||||||||
| Total |
100% |
100% |
100% |
|||||||||
| As of December 2020 |
||||||||||||
| Residential Real Estate |
$ 5,750 | $1,900 | $ 7,650 | |||||||||
| Region |
||||||||||||
| Americas |
88% | 98% | 91% | |||||||||
| EMEA |
9% | 2% | 7% | |||||||||
| Asia |
3% | – | 2% | |||||||||
| Total |
100% | 100% | 100% | |||||||||
| Credit Quality (Credit Rating Equivalent) |
|
|||||||||||
| Investment-grade |
11% | 2% | 9% | |||||||||
| Non-investment-grade |
67% | 93% | 73% | |||||||||
| Other metrics/unrated |
22% | 5% | 18% | |||||||||
| Total |
100% | 100% | 100% | |||||||||
| • | Credit exposure includes loans and lending commitments of $16.89 billion as of December 2021 and $5.71 billion as of December 2020 which are extended to clients who warehouse assets that are directly or indirectly secured by residential real estate. |
| • | Other metrics/unrated primarily includes loans purchased by us. Our risk assessment process for such loans includes reviewing certain key metrics, such as loan-to-value |
| Goldman Sachs 2021 Form 10-K | 111 |
| As of December | ||||||||
$ in millions |
2021 |
2020 | ||||||
| Installment |
$3,672 |
$3,823 | ||||||
| California |
11% |
11% | ||||||
| Texas |
9% |
9% | ||||||
| Florida |
7% |
7% | ||||||
| New York |
7% |
7% | ||||||
| Illinois |
4% |
4% | ||||||
| New Jersey |
4% |
4% | ||||||
| Pennsylvania |
4% |
4% | ||||||
| Georgia |
3% |
3% | ||||||
| Ohio |
3% |
3% | ||||||
| Virginia |
3% |
3% | ||||||
| Other |
45% |
45% | ||||||
| Total |
100% |
100% | ||||||
| Credit Cards |
$8,212 |
$4,270 | ||||||
| California |
18% |
19% | ||||||
| Texas |
9% |
9% | ||||||
| New York |
8% |
8% | ||||||
| Florida |
8% |
8% | ||||||
| New Jersey |
4% |
4% | ||||||
| Illinois |
4% |
4% | ||||||
| Pennsylvania |
3% |
3% | ||||||
| Georgia |
3% |
3% | ||||||
| Ohio |
3% |
3% | ||||||
| Virginia |
2% |
3% | ||||||
| Other |
38% |
36% | ||||||
| Total |
100% |
100% | ||||||
$ in millions |
Loans | |
Lending Commitments |
|
Total | |||||||
| As of December 2021 |
||||||||||||
| Other |
$8,530 |
$6,378 |
$14,908 |
|||||||||
| Region |
||||||||||||
| Americas |
84% |
98% |
90% |
|||||||||
| EMEA |
15% |
– |
9% |
|||||||||
| Asia |
1% |
2% |
1% |
|||||||||
| Total |
100% |
100% |
100% |
|||||||||
| Credit Quality (Credit Rating Equivalent) |
|
|||||||||||
| Investment-grade |
34% |
90% |
58% |
|||||||||
| Non-investment-grade |
37% |
9% |
25% |
|||||||||
| Other metrics/unrated |
29% |
1% |
17% |
|||||||||
| Total |
100% |
100% |
100% |
|||||||||
| As of December 2020 |
||||||||||||
| Other |
$4,174 | $4,842 | $ 9,016 | |||||||||
| Region |
||||||||||||
| Americas |
81% | 98% | 90% | |||||||||
| EMEA |
17% | – | 8% | |||||||||
| Asia |
2% | 2% | 2% | |||||||||
| Total |
100% | 100% | 100% | |||||||||
| Credit Quality (Credit Rating Equivalent) |
|
|||||||||||
| Investment-grade |
44% | 94% | 71% | |||||||||
| Non-investment-grade |
23% | 6% | 14% | |||||||||
| Other metrics/unrated |
33% | – | 15% | |||||||||
| Total |
100% | 100% | 100% | |||||||||
| • | Credit exposure includes loans and lending commitments extended to clients who warehouse assets of $11.09 billion as of December 2021 and $7.28 billion as of December 2020. |
| • | Other metrics/unrated primarily includes consumer and credit card loans purchased by us. Our risk assessment process for such loans includes reviewing certain key metrics, such as expected cash flows, delinquency status and other risk factors. |
| 112 | Goldman Sachs 2021 Form 10-K |
| As of December | ||||||||
$ in millions |
2021 |
2020 | ||||||
| Securities Financing Transactions |
$34,505 |
$30,190 | ||||||
| Industry |
||||||||
| Financial Institutions |
34% |
39% | ||||||
| Funds |
23% |
24% | ||||||
| Municipalities & Nonprofit |
5% |
5% | ||||||
| Sovereign |
35% |
30% | ||||||
| Other (including Special Purpose Vehicles) |
3% |
2% | ||||||
| Total |
100% |
100% | ||||||
| Region |
||||||||
| Americas |
36% |
33% | ||||||
| EMEA |
44% |
46% | ||||||
| Asia |
20% |
21% | ||||||
| Total |
100% |
100% | ||||||
| Credit Quality (Credit Rating Equivalent) |
||||||||
| AAA |
19% |
15% | ||||||
| AA |
28% |
28% | ||||||
| A |
33% |
40% | ||||||
| BBB |
9% |
10% | ||||||
| BB or lower |
11% |
5% | ||||||
| Unrated |
– |
2% | ||||||
| Total |
100% |
100% | ||||||
| As of December | ||||||||
$ in millions |
2021 |
2020 | ||||||
| Other Credit Exposures |
$61,187 |
$56,429 | ||||||
| Industry |
||||||||
| Financial Institutions |
86% |
85% | ||||||
| Funds |
9% |
9% | ||||||
| Other (including Special Purpose Vehicles) |
5% |
6% | ||||||
| Total |
100% |
100% | ||||||
| Region |
||||||||
| Americas |
50% |
54% | ||||||
| EMEA |
43% |
35% | ||||||
| Asia |
7% |
11% | ||||||
| Total |
100% |
100% | ||||||
| Credit Quality (Credit Rating Equivalent) |
||||||||
| AAA |
4% |
5% | ||||||
| AA |
47% |
48% | ||||||
| A |
29% |
27% | ||||||
| BBB |
6% |
8% | ||||||
| BB or lower |
13% |
11% | ||||||
| Unrated |
1% |
1% | ||||||
| Total |
100% |
100% | ||||||
| Goldman Sachs 2021 Form 10-K | 113 |
| • | Execution, delivery and process management; |
| • | Business disruption and system failures; |
| • | Employment practices and workplace safety; |
| • | Clients, products and business practices; |
| • | Damage to physical assets; |
| • | Internal fraud; and |
| • | External fraud. |
| 114 | Goldman Sachs 2021 Form 10-K |
| • | Evaluations of the complexity of our business activities; |
| • | The degree of automation in our processes; |
| • | New activity information; |
| • | The legal and regulatory environment; and |
| • | Changes in the markets for our products and services, including the diversity and sophistication of our customers and counterparties. |
| Goldman Sachs 2021 Form 10-K | 115 |
• |
The model’s conceptual soundness, including the reasonableness of model assumptions, and suitability for intended use; |
• |
The testing strategy utilized by the model developers to ensure that the models function as intended; |
• |
The suitability of the calculation techniques incorporated in the model; |
• |
The model’s accuracy in reflecting the characteristics of the related product and its significant risks; |
• |
The model’s consistency with models for similar products; and |
• |
The model’s sensitivity to input parameters and assumptions. |
116 |
Goldman Sachs 2021 Form 10-K |
117 |
Report of Independent Registered Public Accounting Firm |
118 |
Goldman Sachs 2021 Form 10-K |
Report of Independent Registered Public Accounting Firm |
Goldman Sachs 2021 Form 10-K |
119 |
Report of Independent Registered Public Accounting Firm |
120 |
Goldman Sachs 2021 Form 10-K |