Exhibit 99.1

|
Full Year and
Fourth Quarter 2021
Earnings Results
Media Relations: Andrea Williams 212-902-5400 Investor Relations: Carey Halio 212-902-0300
|
||
|
The Goldman Sachs Group, Inc. 200 West Street | New York, NY 10282
|
Full Year and Fourth Quarter 2021 Earnings Results
Goldman Sachs Reports Record Earnings Per Common Share of $59.45 for 2021
Fourth Quarter Earnings Per Common Share was $10.81
|
“2021 was a record year for Goldman Sachs. The firm’s extraordinary performance is a testament to the strength of our client franchise and people. Moving forward, our leadership team remains committed to growing Goldman Sachs, diversifying our businesses and delivering strong returns for shareholders.” |
|
- David M. Solomon, Chairman and Chief Executive Officer
|
Financial Summary
|
|
|
|||||||
|
Net Revenues
|
Net Earnings
|
EPS
| ||||||
|
2021 $59.34 billion
4Q21 $12.64 billion
|
2021 $21.64 billion
4Q21 $3.94 billion
|
2021 $59.45
4Q21 $10.81
| ||||||
|
ROE1
|
ROTE1
|
Book Value Per Share
| ||||||
|
2021 23.0%
4Q21 15.6%
|
2021 24.3%
4Q21 16.4%
|
2021 $284.39
2021 Growth 20.4%
| ||||||
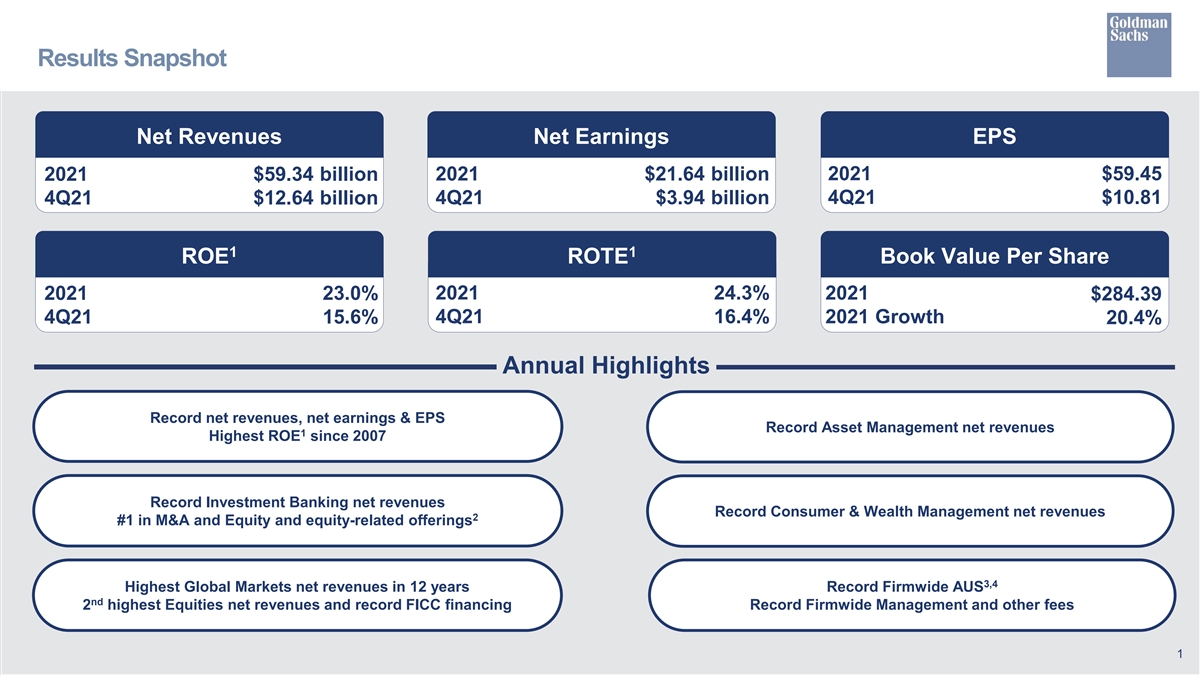
NEW YORK, January 18, 2022 – The Goldman Sachs Group, Inc. (NYSE: GS) today reported net revenues of $59.34 billion and net earnings of $21.64 billion for the year ended December 31, 2021. Net revenues were $12.64 billion and net earnings were $3.94 billion for the fourth quarter of 2021.
Diluted earnings per common share (EPS) was $59.45 for the year ended December 31, 2021 compared with $24.74 for the year ended December 31, 2020, and was $10.81 for the fourth quarter of 2021 compared with $12.08 for the fourth quarter of 2020 and $14.93 for the third quarter of 2021. For the year ended December 31, 2020, net provisions for litigation and regulatory proceedings reduced diluted EPS by $9.51.
Return on average common shareholders’ equity (ROE)1 was 23.0% for 2021 and annualized ROE was 15.6% for the fourth quarter of 2021. Return on average tangible common shareholders’ equity (ROTE)1 was 24.3% for 2021 and annualized ROTE was 16.4% for the fourth quarter of 2021
1
Goldman Sachs Reports
Full Year and Fourth Quarter 2021 Earnings Results
Annual Highlights
| ◾ | During the year, the firm generated record net revenues of $59.34 billion, record net earnings of $21.64 billion and record diluted EPS of $59.45, each significantly surpassing the previous record. In addition, ROE1 of 23.0% was the highest since 2007. |
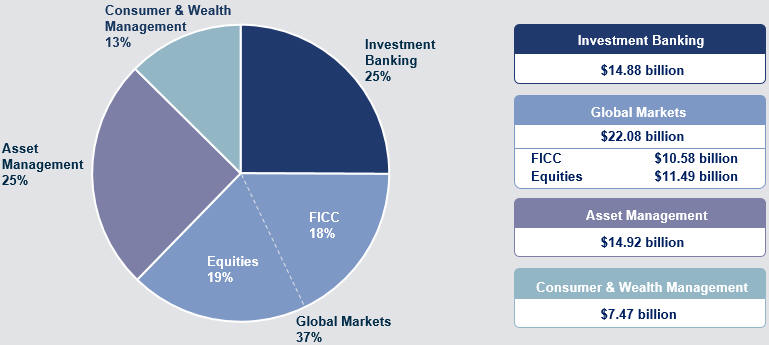
| ◾ | Investment Banking generated record net revenues of $14.88 billion, driven by record net revenues in each of Financial advisory, Equity underwriting and Debt underwriting. |
| ◾ | The firm ranked #1 in worldwide announced and completed mergers and acquisitions, and in worldwide equity and equity-related offerings, common stock offerings and initial public offerings for the year.2 |
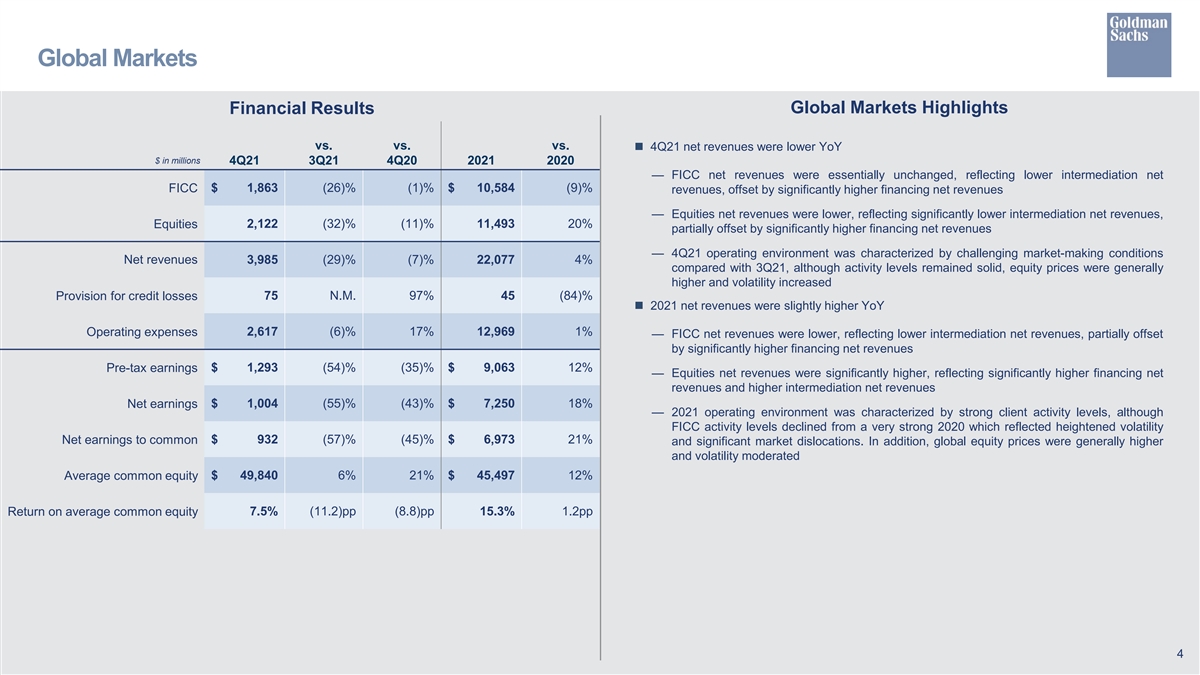
| ◾ | Global Markets generated net revenues of $22.08 billion, the highest annual net revenues in 12 years, reflecting strength in both Equities and Fixed Income, Currency and Commodities (FICC). Equities produced its second highest net revenues and FICC had record financing net revenues. |
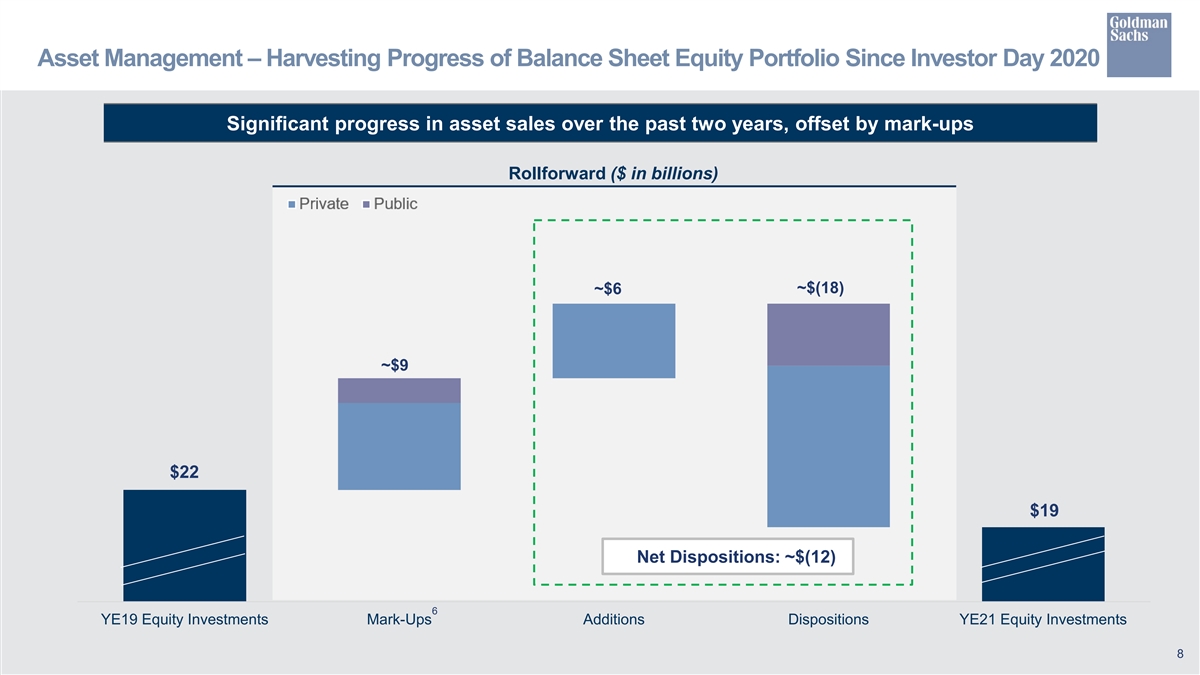
| ◾ | Asset Management generated record net revenues of $14.92 billion, including record net revenues in Equity investments and the second highest net revenues in Lending and debt investments. |
| ◾ | Consumer & Wealth Management generated record net revenues of $7.47 billion, reflecting record net revenues in both Wealth management and Consumer banking. |
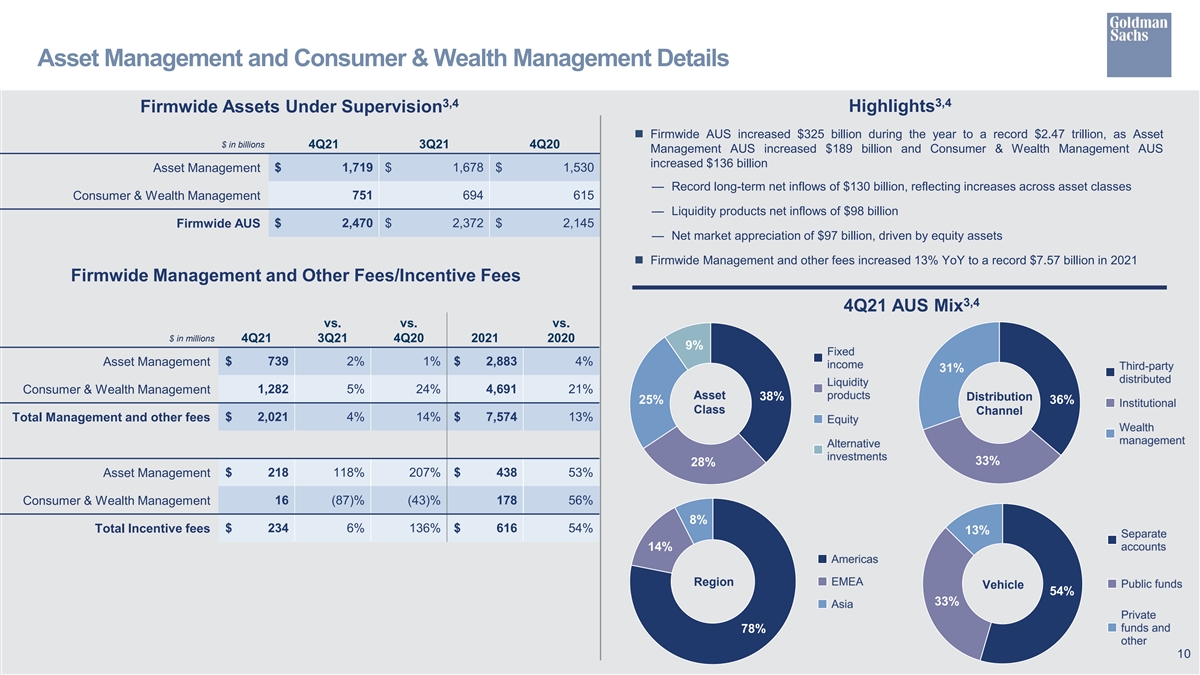
| ◾ | Firmwide assets under supervision3,4 increased $325 billion during the year, including record long-term net inflows of $130 billion, to a record $2.47 trillion. Firmwide Management and other fees were a record $7.57 billion in 2021. |
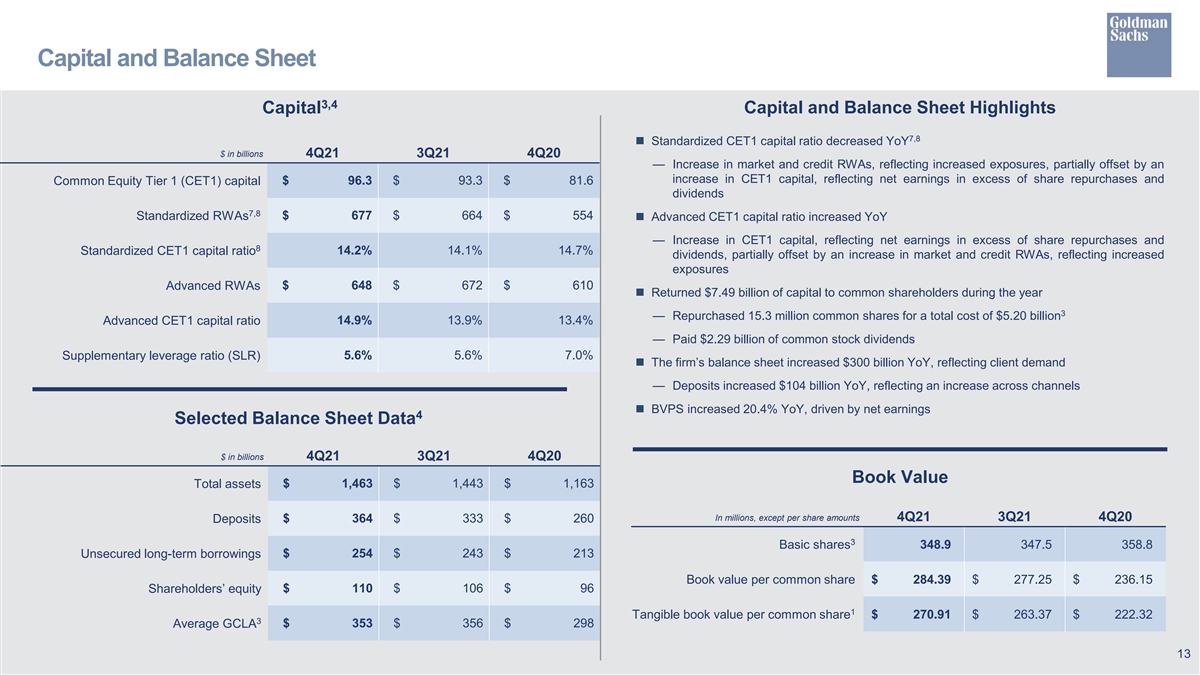
| ◾ | Book value per common share increased by 20.4% during the year to $284.39. |
Full Year Net Revenue Mix by Segment
2
Goldman Sachs Reports
Full Year and Fourth Quarter 2021 Earnings Results
Net Revenues
|
Full Year |
||||
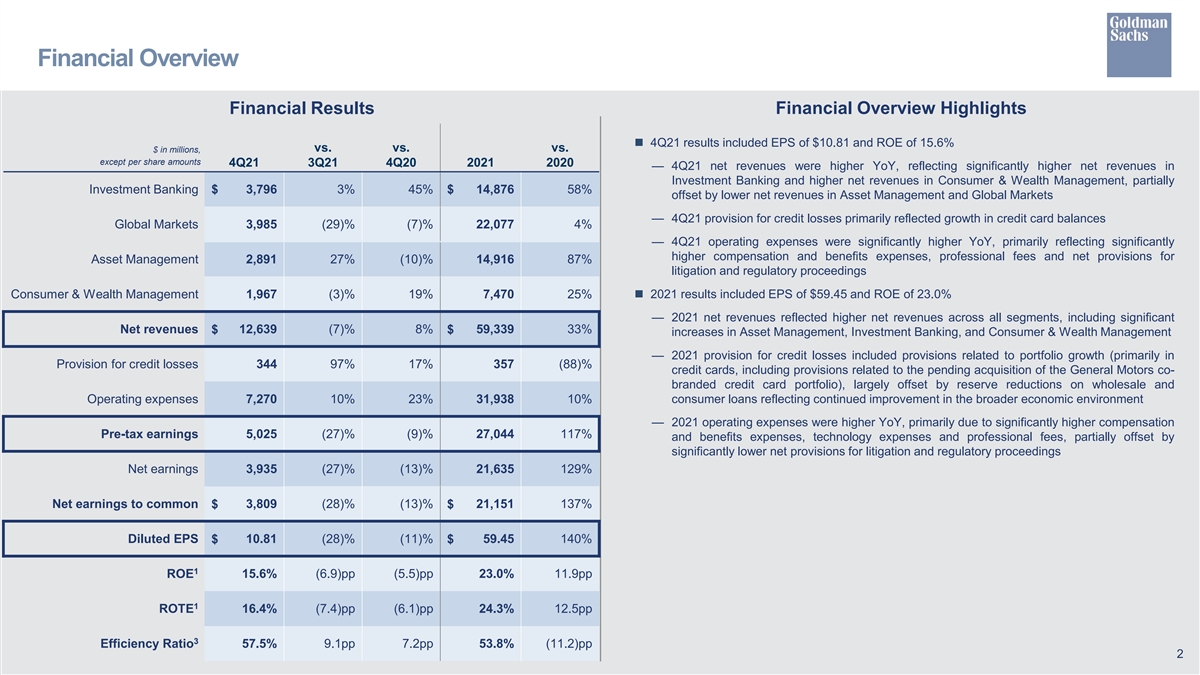
| Net revenues were $59.34 billion for 2021, 33% higher than 2020, reflecting higher net revenues across all segments, including significant increases in Asset Management, Investment Banking and Consumer & Wealth Management. |
|
2021 Net Revenues
| ||
|
$59.34 billion
| ||||
|
Fourth Quarter |
||||
| Net revenues were $12.64 billion for the fourth quarter of 2021, 8% higher than the fourth quarter of 2020 and 7% lower than the third quarter of 2021. The increase compared with the fourth quarter of 2020 reflected significantly higher net revenues in Investment Banking and higher net revenues in Consumer & Wealth Management, partially offset by lower net revenues in Asset Management and Global Markets. |
4Q21 Net Revenues
| |||
|
$12.64 billion
| ||||
|
|
|
Investment Banking |
|
|
| Full Year |
||||||
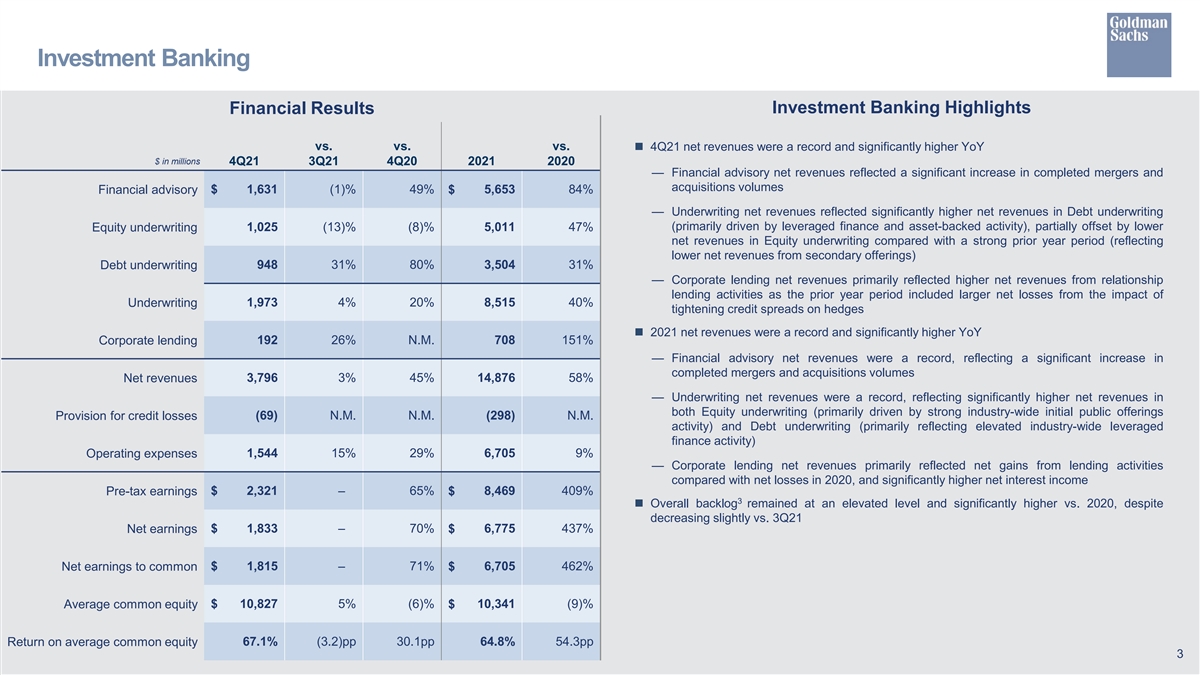
| Net revenues in Investment Banking were $14.88 billion for 2021, 58% higher than 2020, primarily reflecting significantly higher net revenues in Financial advisory and Underwriting.
The increase in Financial advisory net revenues reflected a significant increase in completed mergers and acquisitions volumes. The increase in Underwriting net revenues was due to significantly higher net revenues in both Equity underwriting, primarily driven by strong industry-wide initial public offerings activity, and Debt underwriting, primarily reflecting elevated industry-wide leveraged finance activity. Corporate lending net revenues were significantly higher, primarily reflecting net gains from lending activities compared with net losses in the prior year, and significantly higher net interest income. |
2021 Investment Banking
| |||||
|
$14.88 billion
| ||||||
|
|
Financial advisory |
$5.65 billion | ||||
| Underwriting |
$8.52 billion | |||||
|
Corporate lending
|
$708 million
| |||||
|
The firm’s backlog3 increased significantly compared with the end of 2020. |
||||||
|
Fourth Quarter |
||||||
| Net revenues in Investment Banking were $3.80 billion for the fourth quarter of 2021, 45% higher than the fourth quarter of 2020 and 3% higher than the third quarter of 2021. The increase compared with the fourth quarter of 2020 reflected significantly higher net revenues in Financial advisory, Underwriting and Corporate lending.
The increase in Financial advisory net revenues reflected a significant increase in completed mergers and acquisitions volumes. The increase in Underwriting net revenues was due to significantly higher net revenues in Debt underwriting, primarily driven by leveraged finance and asset-backed activity, partially offset by lower net revenues in Equity underwriting compared with a strong prior year period, reflecting lower net revenues from secondary offerings. The increase in Corporate lending net revenues primarily reflected higher net revenues from relationship lending activities as the prior year period included larger net losses from the impact of tightening credit spreads on hedges.
The firm’s backlog3 decreased slightly compared with the end of the third quarter of 2021. |
4Q21 Investment Banking
| |||||
|
$3.80 billion
| ||||||
| Financial advisory |
$1.63 billion | |||||
| Underwriting |
$1.97 billion | |||||
|
Corporate lending
|
$192 million
| |||||
3
Goldman Sachs Reports
Full Year and Fourth Quarter 2021 Earnings Results
|
|
Global Markets |
|
| Full Year |
||||||
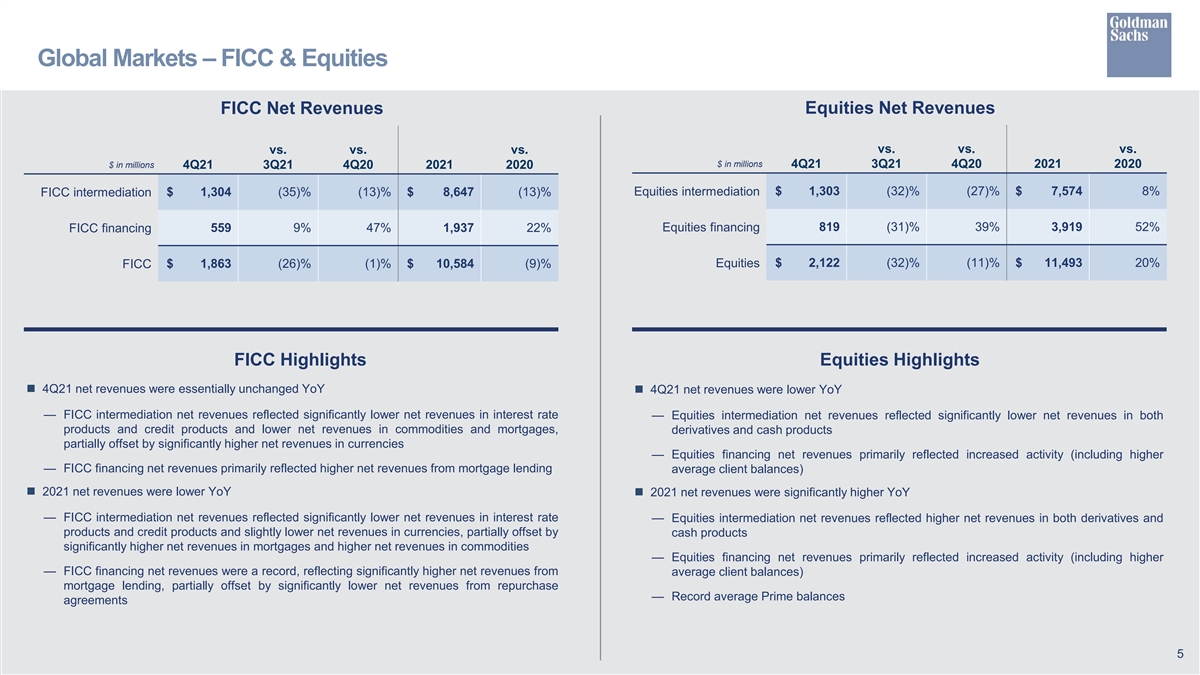
| Net revenues in Global Markets were $22.08 billion for 2021, 4% higher than 2020.
Net revenues in FICC were $10.58 billion, 9% lower than 2020, due to lower net revenues in FICC intermediation, reflecting significantly lower net revenues in interest rate products and credit products and slightly lower net revenues in currencies, partially offset by significantly higher net revenues in mortgages and higher net revenues in commodities. Net revenues in FICC financing were significantly higher, reflecting significantly higher net revenues from mortgage lending, partially offset by significantly lower net revenues from repurchase agreements.
Net revenues in Equities were $11.49 billion, 20% higher than 2020, due to significantly higher net revenues in Equities financing, primarily reflecting increased activity (including higher average client balances), and higher net revenues in Equities intermediation, across both derivatives and cash products. |
2021 Global Markets
| |||||
|
$22.08 billion
| ||||||
|
FICC intermediation |
$8.65 billion | |||||
| FICC financing |
$1.94 billion | |||||
| FICC |
$10.58 billion | |||||
| Equities intermediation |
$7.57 billion | |||||
| Equities financing |
$3.92 billion | |||||
| Equities
|
$11.49 billion
| |||||
| Fourth Quarter |
||||||
| Net revenues in Global Markets were $3.99 billion for the fourth quarter of 2021, 7% lower than the fourth quarter of 2020 and 29% lower than the third quarter of 2021.
Net revenues in FICC were $1.86 billion, essentially unchanged compared with the fourth quarter of 2020. Net revenues in FICC intermediation were lower, reflecting significantly lower net revenues in interest rate products and credit products and lower net revenues in commodities and mortgages, partially offset by significantly higher net revenues in currencies. Net revenues in FICC financing were significantly higher, primarily reflecting higher net revenues from mortgage lending.
Net revenues in Equities were $2.12 billion, 11% lower than the fourth quarter of 2020, due to significantly lower net revenues in Equities intermediation, across both derivatives and cash products. Net revenues in Equities financing were significantly higher, primarily reflecting increased activity (including higher average client balances). |
4Q21 Global Markets
| |||||
|
$3.99 billion
| ||||||
|
FICC intermediation |
$1.30 billion | |||||
| FICC financing |
$559 million | |||||
| FICC |
$1.86 billion | |||||
| Equities intermediation |
$1.30 billion | |||||
| Equities financing |
$819 million | |||||
| Equities
|
$2.12 billion
| |||||
|
|
Asset Management |
|
| Full Year |
||||||
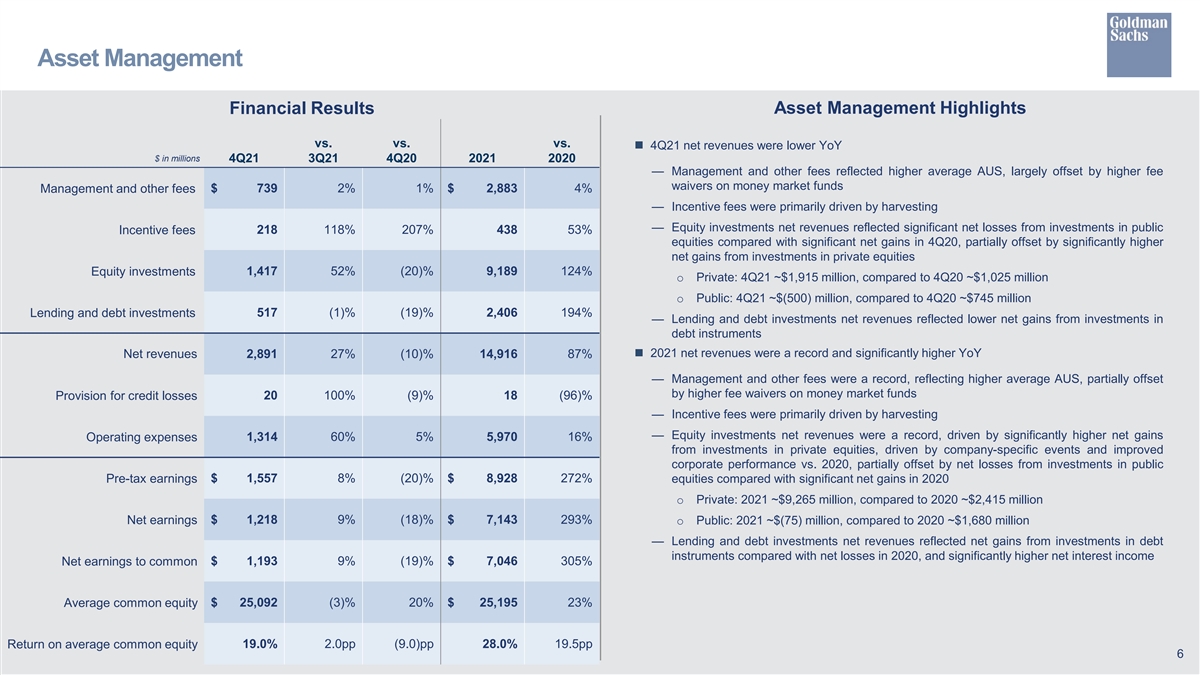
| Net revenues in Asset Management were $14.92 billion for 2021, 87% higher than 2020, primarily reflecting significantly higher net revenues in Equity investments and Lending and debt investments.
The increase in Equity investments net revenues reflected significantly higher net gains from investments in private equities, driven by company-specific events and improved corporate performance compared with 2020, partially offset by net losses from investments in public equities compared with significant net gains in the prior year. The increase in Lending and debt investments net revenues reflected net gains from investments in debt instruments compared with net losses in the prior year, and significantly higher net interest income. Incentive fees were higher, primarily driven by harvesting, and Management and other fees were slightly higher, reflecting the impact of higher average assets under supervision, partially offset by higher fee waivers on money market funds. |
2021 Asset Management
| |||||
|
$14.92 billion
| ||||||
|
Management and other fees |
$ 2.88 billion | |||||
| Incentive fees |
$438 million | |||||
| Equity investments |
$9.19 billion | |||||
| Lending and debt investments
|
$2.41 billion | |||||
4
Goldman Sachs Reports
Full Year and Fourth Quarter 2021 Earnings Results
|
|
Asset Management |
|
| Fourth Quarter |
|
|||||
| Net revenues in Asset Management were $2.89 billion for the fourth quarter of 2021, 10% lower than the fourth quarter of 2020 and 27% higher than the third quarter of 2021. The decrease compared with the fourth quarter of 2020 reflected significantly lower net revenues in Equity investments and lower net revenues in Lending and debt investments, partially offset by higher Incentive fees.
The decrease in Equity investments net revenues reflected significant net losses from investments in public equities compared with significant net gains in the prior year period, partially offset by significantly higher net gains from investments in private equities. The decrease in Lending and debt investments net revenues reflected lower net gains from investments in debt instruments. The increase in Incentive fees was primarily due to harvesting. Management and other fees were essentially unchanged, reflecting higher average assets under supervision, largely offset by higher fee waivers on money market funds. |
4Q21 Asset Management
| |||||
|
$2.89 billion
| ||||||
| Management and other fees |
$ 739 million | |||||
| Incentive fees |
$218 million | |||||
| Equity investments |
$1.42 billion | |||||
|
Lending and debt investments
|
$517 million | |||||
|
|
Consumer & Wealth Management |
|
| Full Year |
|
|||||
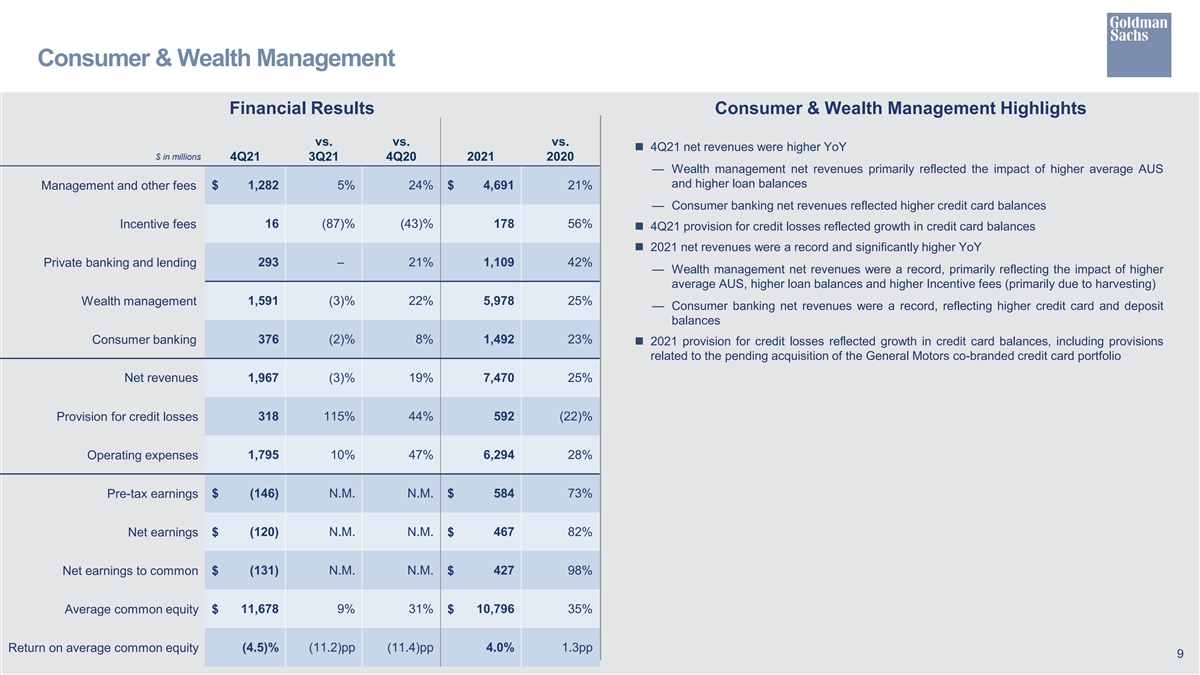
| Net revenues in Consumer & Wealth Management were $7.47 billion for 2021, 25% higher than 2020.
Net revenues in Wealth management were $5.98 billion, 25% higher than 2020, due to significantly higher Management and other fees, primarily reflecting the impact of higher average assets under supervision, and significantly higher net revenues in Private banking and lending, primarily reflecting higher loan balances. In addition, Incentive fees were higher, primarily due to harvesting.
Net revenues in Consumer banking were $1.49 billion, 23% higher than 2020, reflecting higher credit card and deposit balances. |
2021 Consumer & Wealth Management
| |||||
|
$7.47 billion
| ||||||
|
Wealth management |
$ 5.98 billion | |||||
| Consumer banking
|
$1.49 billion
| |||||
|
Fourth Quarter |
||||||
| Net revenues in Consumer & Wealth Management were $1.97 billion for the fourth quarter of 2021, 19% higher than the fourth quarter of 2020 and 3% lower than the third quarter of 2021.
Net revenues in Wealth management were $1.59 billion, 22% higher than the fourth quarter of 2020, due to significantly higher Management and other fees, primarily reflecting the impact of higher average assets under supervision, and higher net revenues in Private banking and lending, primarily reflecting higher loan balances.
Net revenues in Consumer banking were $376 million, 8% higher than the fourth quarter of 2020, reflecting higher credit card balances. |
4Q21 Consumer & Wealth Management
| |||||
|
$1.97 billion
| ||||||
|
Wealth management |
$ 1.59 billion | |||||
| Consumer banking
|
$376 million
| |||||
5
Goldman Sachs Reports
Full Year and Fourth Quarter 2021 Earnings Results
Provision for Credit Losses
| Full Year |
||||
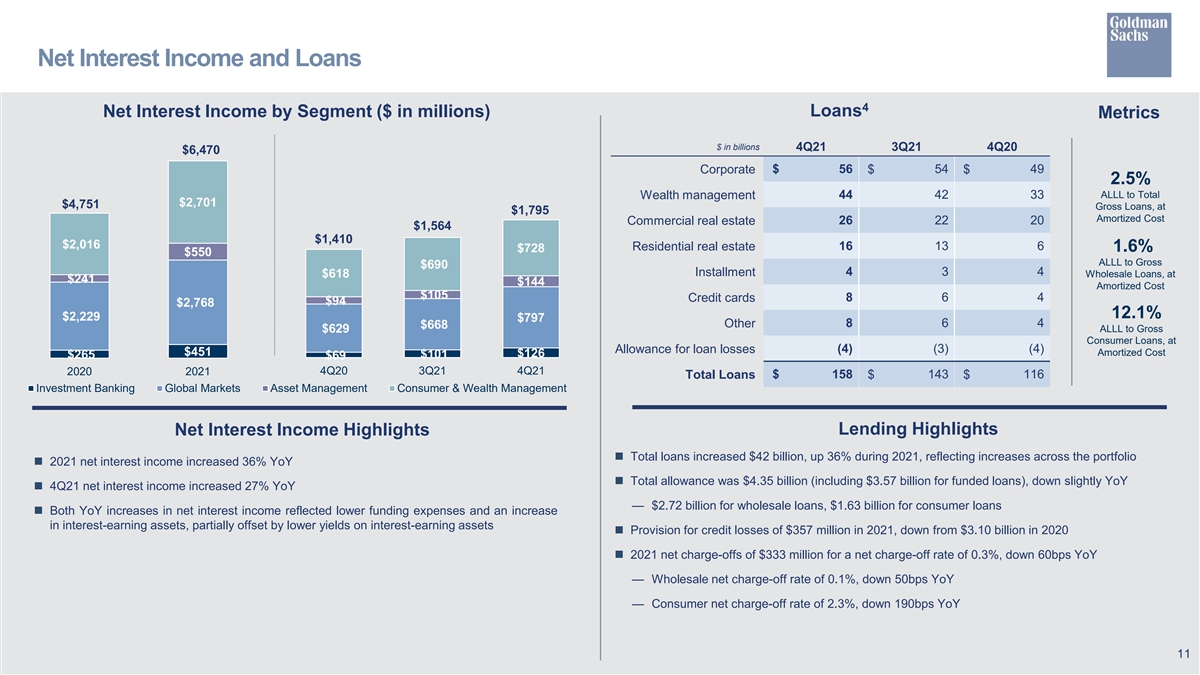
| Provision for credit losses was $357 million for 2021, compared with $3.10 billion for 2020. 2021 included provisions related to portfolio growth (primarily in credit cards, including provisions related to the pending acquisition of the General Motors co-branded credit card portfolio), largely offset by reserve reductions on wholesale and consumer loans reflecting continued improvement in the broader economic environment. This followed challenging conditions in the prior year as a result of the COVID-19 pandemic, which contributed to significant provisions in 2020. |
|
2021 Provision for Credit Losses
| ||
|
$357 million
| ||||
|
Fourth Quarter |
||||
| Provision for credit losses was $344 million for the fourth quarter of 2021, compared with $293 million for the fourth quarter of 2020 and $175 million for the third quarter of 2021. The increase compared with the fourth quarter of 2020 primarily reflected growth in credit card balances.
The firm’s allowance for credit losses was $4.35 billion as of December 31, 2021. |
4Q21 Provision for Credit Losses
| |||
|
$344 million
| ||||
Operating Expenses
| Full Year |
||||
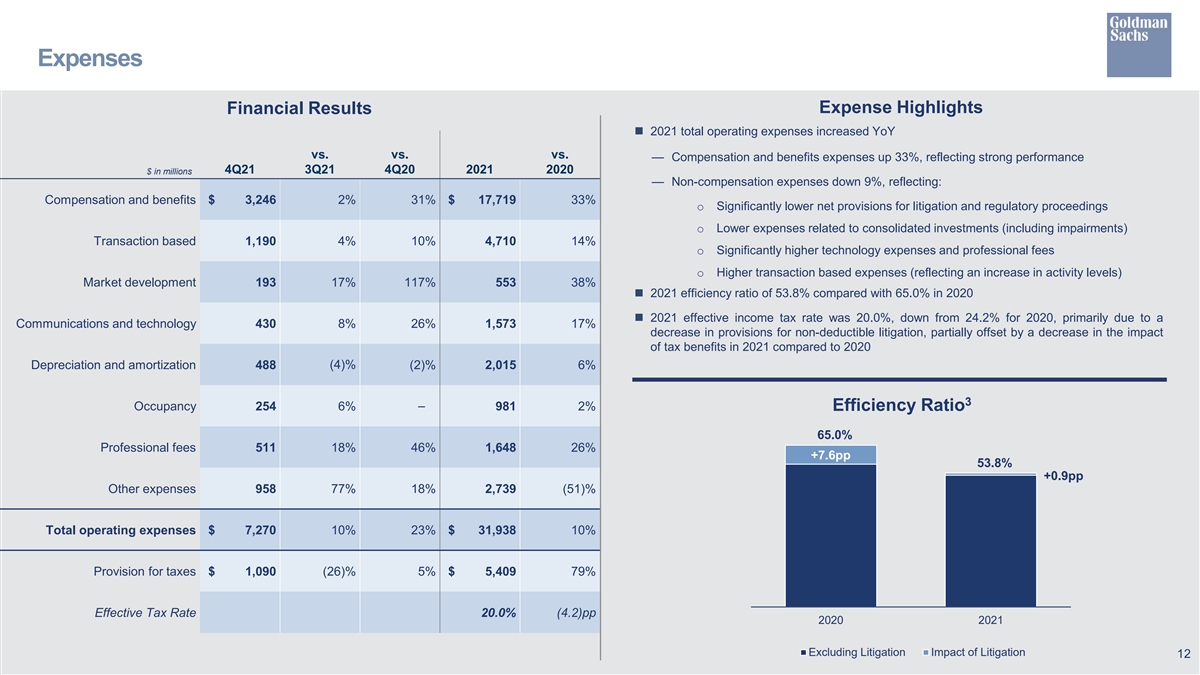
| Operating expenses were $31.94 billion for 2021, 10% higher than 2020. The firm’s efficiency ratio3 for 2021 was 53.8%, compared with 65.0% for 2020.
The increase in operating expenses compared with 2020 primarily reflected significantly higher compensation and benefits expenses (reflecting strong performance). In addition, technology expenses and professional fees were significantly higher and transaction based expenses were higher. These increases were partially offset by significantly lower net provisions for litigation and regulatory proceedings and lower expenses related to consolidated investments (including impairments).
Net provisions for litigation and regulatory proceedings for 2021 were $534 million compared with $3.42 billion for 2020.
2021 included approximately $250 million of charitable contributions to Goldman Sachs Gives.
Headcount increased 8% during 2021, reflecting investments in new business initiatives and an increase in technology professionals. |
2021 Operating Expenses
| |||
|
$31.94 billion
| ||||
|
2021 Efficiency Ratio
| ||||
|
53.8%
| ||||
6
Goldman Sachs Reports
Full Year and Fourth Quarter 2021 Earnings Results
Operating Expenses
|
Fourth Quarter |
||||
| Operating expenses were $7.27 billion for the fourth quarter of 2021, 23% higher than the fourth quarter of 2020 and 10% higher than the third quarter of 2021.
The increase in operating expenses compared with the fourth quarter of 2020 reflected significantly higher compensation and benefits expenses (reflecting strong performance), professional fees and net provisions for litigation and regulatory proceedings. In addition, technology expenses, transaction based expenses and market development expenses were each higher.
Net provisions for litigation and regulatory proceedings for the fourth quarter of 2021 were $182 million compared with $24 million for the fourth quarter of 2020. |
4Q21 Operating Expenses
| |||
|
$7.27 billion
| ||||
Provision for Taxes
| The effective income tax rate for 2021 was 20.0%, up from 19.6% for the first nine months of 2021, primarily due to a decrease in the impact of tax benefits for the full year compared with the first nine months of 2021. The 2021 effective income tax rate decreased from 24.2% for 2020, primarily due to a decrease in provisions for non-deductible litigation, partially offset by a decrease in the impact of tax benefits in 2021 compared to 2020. |
2021 Effective Tax Rate
| |||
|
20.0%
| ||||
Other Matters
| ◾ On January 14, 2022, the Board of Directors of The Goldman Sachs Group, Inc. declared a dividend of $2.00 per common share to be paid on March 30, 2022 to common shareholders of record on March 2, 2022.
◾ During the year, the firm returned $7.49 billion of capital to common shareholders, including $5.20 billion of common share repurchases (15.3 million shares at an average cost of $339.81) and $2.29 billion of common stock dividends. This included $1.20 billion of capital returned to common shareholders during the fourth quarter, including $500 million of share repurchases (1.2 million shares at an average cost of $411.65) and $698 million of common stock dividends.3
◾ Global core liquid assets3 averaged $335 billion4 for 2021, compared with an average of $283 billion for 2020. Global core liquid assets averaged $353 billion4 for the fourth quarter of 2021, compared with an average of $356 billion for the third quarter of 2021. |
Declared Quarterly Dividend Per Common Share
| |||
|
$2.00
| ||||
|
Capital Returned
| ||||
|
$7.49 billion in 2021
| ||||
|
Average GCLA
| ||||
|
$335 billion for 2021
| ||||
7
Goldman Sachs Reports
Full Year and Fourth Quarter 2021 Earnings Results
The Goldman Sachs Group, Inc. is a leading global financial institution that delivers a broad range of financial services across investment banking, securities, investment management and consumer banking to a large and diversified client base that includes corporations, financial institutions, governments and individuals. Founded in 1869, the firm is headquartered in New York and maintains offices in all major financial centers around the world.
|
|
Cautionary Note Regarding Forward-Looking Statements |
|
This press release contains “forward-looking statements” within the meaning of the safe harbor provisions of the U.S. Private Securities Litigation Reform Act of 1995. Forward-looking statements are not historical facts or statements of current conditions, but instead represent only the firm’s beliefs regarding future events, many of which, by their nature, are inherently uncertain and outside of the firm’s control. It is possible that the firm’s actual results, financial condition and liquidity may differ, possibly materially, from the anticipated results, financial condition and liquidity in these forward-looking statements. For information about some of the risks and important factors that could affect the firm’s future results, financial condition and liquidity, see “Risk Factors” in Part I, Item 1A of the firm’s Annual Report on Form 10-K for the year ended December 31, 2020.
Information regarding the firm’s assets under supervision, capital ratios, risk-weighted assets, supplementary leverage ratio, balance sheet data, global core liquid assets and VaR consists of preliminary estimates. These estimates are forward-looking statements and are subject to change, possibly materially, as the firm completes its financial statements.
Statements about the firm’s investment banking transaction backlog and future results also may constitute forward-looking statements. Such statements are subject to the risk that transactions may be modified or may not be completed at all and related net revenues may not be realized or may be materially less than expected. Important factors that could have such a result include, for underwriting transactions, a decline or weakness in general economic conditions, an outbreak of hostilities, volatility in the securities markets or an adverse development with respect to the issuer of the securities and, for financial advisory transactions, a decline in the securities markets, an inability to obtain adequate financing, an adverse development with respect to a party to the transaction or a failure to obtain a required regulatory approval. For information about other important factors that could adversely affect the firm’s investment banking transactions, see “Risk Factors” in Part I, Item 1A of the firm’s Annual Report on Form 10-K for the year ended December 31, 2020.
|
|
Conference Call |
|
A conference call to discuss the firm’s financial results,
outlook and related matters will be held at 9:30 am (ET). The call will be open to the public. Members of the public who would like to listen to the conference call should dial 1-888-281-7154 (in the U.S.) or 1-706-679-5627 (outside
the U.S.). The number should be dialed at least 10 minutes prior to the start of the conference call. The conference call will also be accessible as an audio webcast through the Investor Relations section of the firm’s website,
www.goldmansachs.com/investor-relations. There is no charge to access the call. For those unable to listen to the live broadcast, a replay will be available on the firm’s website or by dialing 1-855-859-2056 (in the U.S.) or 1-404-537-3406 (outside the U.S.) passcode number 64774224 beginning approximately three hours after the event. Please direct any questions regarding
obtaining access to the conference call to Goldman Sachs Investor Relations, via
e-mail, at gs-investor-
relations@gs.com.
8
Goldman Sachs Reports
Full Year and Fourth Quarter 2021 Earnings Results
The Goldman Sachs Group, Inc. and Subsidiaries
Segment Net Revenues (unaudited)
$ in millions
| YEAR ENDED | % CHANGE FROM | |||||||||||||||
| DECEMBER 31, 2021 |
DECEMBER 31, 2020 |
DECEMBER 31, 2020 |
||||||||||||||
|
INVESTMENT BANKING
|
||||||||||||||||
|
Financial advisory |
$ 5,653 | $ 3,065 | 84 % | |||||||||||||
| Equity underwriting |
5,011 | 3,406 | 47 | |||||||||||||
|
Debt underwriting
|
|
3,504
|
|
|
2,670
|
|
|
31
|
|
|||||||
|
Underwriting |
8,515 | 6,076 | 40 | |||||||||||||
| Corporate lending |
|
708
|
|
|
282
|
|
|
151
|
|
|||||||
|
Net revenues
|
|
14,876
|
|
|
9,423
|
|
|
58
|
|
|||||||
|
GLOBAL MARKETS
|
||||||||||||||||
| FICC intermediation |
8,647 | 9,991 | (13) | |||||||||||||
| FICC financing |
|
1,937
|
|
|
1,593
|
|
|
22
|
|
|||||||
|
FICC
|
10,584 | 11,584 | (9) | |||||||||||||
| Equities intermediation |
7,574 | 6,989 | 8 | |||||||||||||
|
Equities financing
|
|
3,919
|
|
|
2,584
|
|
|
52
|
|
|||||||
| Equities
|
|
11,493
|
|
|
9,573
|
|
|
20
|
|
|||||||
|
Net revenues
|
|
22,077
|
|
|
21,157
|
|
|
4
|
|
|||||||
|
ASSET MANAGEMENT
|
||||||||||||||||
|
Management and other fees |
2,883 | 2,785 | 4 | |||||||||||||
|
Incentive fees |
438 | 287 | 53 | |||||||||||||
|
Equity investments |
9,189 | 4,095 | 124 | |||||||||||||
|
Lending and debt investments
|
|
2,406
|
|
|
817
|
|
|
194
|
|
|||||||
|
Net revenues
|
|
14,916
|
|
|
7,984
|
|
|
87
|
|
|||||||
|
CONSUMER & WEALTH MANAGEMENT
|
||||||||||||||||
|
Management and other fees |
4,691 | 3,889 | 21 | |||||||||||||
|
Incentive fees |
178 | 114 | 56 | |||||||||||||
|
Private banking and lending
|
|
1,109
|
|
|
780
|
|
|
42
|
|
|||||||
|
Wealth management |
5,978 | 4,783 | 25 | |||||||||||||
| Consumer banking |
|
1,492
|
|
|
1,213
|
|
|
23
|
|
|||||||
|
Net revenues
|
|
7,470
|
|
|
5,996
|
|
|
25
|
|
|||||||
|
Total net revenues
|
|
$ 59,339
|
|
|
$ 44,560
|
|
|
33
|
|
|||||||
|
Geographic Net Revenues (unaudited)3 $ in millions
|
|
|||||||||||||||
| YEAR ENDED | ||||||||||||||||
| DECEMBER 31, 2021 |
DECEMBER 31, 2020 |
|||||||||||||||
| Americas |
$ 37,379 | $ 27,508 | ||||||||||||||
|
EMEA |
14,372 | 10,868 | ||||||||||||||
|
Asia
|
|
7,588
|
|
|
6,184
|
|
||||||||||
|
Total net revenues
|
|
$ 59,339
|
|
|
$ 44,560
|
|
||||||||||
| Americas |
63% | 62% | ||||||||||||||
|
EMEA |
24% | 24% | ||||||||||||||
|
Asia
|
|
13%
|
|
|
14%
|
|
||||||||||
|
Total
|
|
100%
|
|
|
100%
|
|
||||||||||
9
Goldman Sachs Reports
Full Year and Fourth Quarter 2021 Earnings Results
The Goldman Sachs Group, Inc. and Subsidiaries
Segment Net Revenues (unaudited)
$ in millions
| THREE MONTHS ENDED | % CHANGE FROM | |||||||||||||||||||||||
| DECEMBER 31, 2021 |
SEPTEMBER 30, 2021 |
DECEMBER 31, 2020 |
SEPTEMBER 30, 2021 |
DECEMBER 31, 2020 |
||||||||||||||||||||
|
INVESTMENT BANKING
|
||||||||||||||||||||||||
|
Financial advisory |
$ 1,631 | $ 1,648 | $ 1,091 | (1) % | 49 % | |||||||||||||||||||
| Equity underwriting |
1,025 | 1,174 | 1,115 | (13) | (8) | |||||||||||||||||||
|
Debt underwriting
|
|
948
|
|
|
726
|
|
|
526
|
|
|
31
|
|
|
80
|
| |||||||||
|
Underwriting |
1,973 | 1,900 | 1,641 | 4 | 20 | |||||||||||||||||||
| Corporate lending
|
|
192
|
|
|
152
|
|
|
(119)
|
|
|
26
|
|
|
N.M.
|
| |||||||||
|
Net revenues
|
|
3,796
|
|
|
3,700
|
|
|
2,613
|
|
|
3
|
|
|
45
|
| |||||||||
|
GLOBAL MARKETS
|
||||||||||||||||||||||||
|
FICC intermediation |
1,304 | 1,995 | 1,498 | (35) | (13) | |||||||||||||||||||
| FICC financing
|
|
559
|
|
|
513
|
|
|
380
|
|
|
9
|
|
|
47
|
| |||||||||
|
FICC |
1,863 | 2,508 | 1,878 | (26) | (1) | |||||||||||||||||||
| Equities intermediation |
1,303 | 1,920 | 1,796 | (32) | (27) | |||||||||||||||||||
|
Equities financing
|
|
819
|
|
|
1,183
|
|
|
591
|
|
|
(31)
|
|
|
39
|
| |||||||||
|
Equities
|
|
2,122
|
|
|
3,103
|
|
|
2,387
|
|
|
(32)
|
|
|
(11)
|
| |||||||||
|
Net revenues
|
|
3,985
|
|
|
5,611
|
|
|
4,265
|
|
|
(29)
|
|
|
(7)
|
| |||||||||
|
ASSET MANAGEMENT
|
||||||||||||||||||||||||
|
Management and other fees |
739 | 724 | 733 | 2 | 1 | |||||||||||||||||||
|
Incentive fees |
218 | 100 | 71 | 118 | 207 | |||||||||||||||||||
|
Equity investments |
1,417 | 935 | 1,770 | 52 | (20) | |||||||||||||||||||
|
Lending and debt investments
|
|
517
|
|
|
520
|
|
|
637
|
|
|
(1)
|
|
|
(19)
|
| |||||||||
|
Net revenues
|
|
2,891
|
|
|
2,279
|
|
|
3,211
|
|
|
27
|
|
|
(10)
|
| |||||||||
|
CONSUMER & WEALTH MANAGEMENT
|
||||||||||||||||||||||||
|
Management and other fees |
1,282 | 1,223 | 1,035 | 5 | 24 | |||||||||||||||||||
|
Incentive fees |
16 | 121 | 28 | (87) | (43) | |||||||||||||||||||
|
Private banking and lending
|
|
293
|
|
|
292
|
|
|
242
|
|
|
–
|
|
|
21
|
| |||||||||
|
Wealth management |
1,591 | 1,636 | 1,305 | (3) | 22 | |||||||||||||||||||
| Consumer banking
|
|
376
|
|
|
382
|
|
|
347
|
|
|
(2)
|
|
|
8
|
| |||||||||
|
Net revenues
|
|
1,967
|
|
|
2,018
|
|
|
1,652
|
|
|
(3)
|
|
|
19
|
| |||||||||
|
Total net revenues
|
|
$ 12,639
|
|
|
$ 13,608
|
|
|
$ 11,741
|
|
|
(7)
|
|
|
8
|
| |||||||||
|
Geographic Net Revenues (unaudited)3 |
|
|||||||||||||||||||||||
| $ in millions
|
||||||||||||||||||||||||
| THREE MONTHS ENDED | ||||||||||||||||||||||||
| DECEMBER 31, 2021 |
SEPTEMBER 30, 2021 |
DECEMBER 31, 2020 |
||||||||||||||||||||||
|
Americas |
$ 8,428 | $ 8,169 | $ 7,175 | |||||||||||||||||||||
|
EMEA |
2,787 | 3,394 | 2,837 | |||||||||||||||||||||
|
Asia
|
|
1,424
|
|
|
2,045
|
|
|
1,729
|
|
|||||||||||||||
|
Total net revenues
|
|
$ 12,639
|
|
|
$ 13,608
|
|
|
$ 11,741
|
|
|||||||||||||||
| Americas |
67% | 60% | 61% | |||||||||||||||||||||
|
EMEA |
22% | 25% | 24% | |||||||||||||||||||||
|
Asia
|
|
11%
|
|
|
15%
|
|
|
15%
|
|
|||||||||||||||
|
Total
|
|
100%
|
|
|
100%
|
|
|
100%
|
|
|||||||||||||||
10
Goldman Sachs Reports
Full Year and Fourth Quarter 2021 Earnings Results
The Goldman Sachs Group, Inc. and Subsidiaries
Consolidated Statements of Earnings (unaudited)
In millions, except per share amounts
| YEAR ENDED | % CHANGE FROM | |||||||||||||||||
| DECEMBER 31, 2021 |
DECEMBER 31, 2020 |
DECEMBER 31, 2020 |
||||||||||||||||
|
REVENUES
|
||||||||||||||||||
|
Investment banking |
$ 14,168 | $ 9,141 | 55 % | |||||||||||||||
|
Investment management |
8,059 | 6,923 | 16 | |||||||||||||||
|
Commissions and fees |
3,619 | 3,548 | 2 | |||||||||||||||
|
Market making |
15,352 | 15,546 | (1) | |||||||||||||||
|
Other principal transactions
|
|
11,671
|
|
|
4,651
|
|
|
151
|
|
|||||||||
|
Total non-interest revenues
|
|
52,869
|
|
|
39,809
|
|
|
33
|
|
|||||||||
| Interest income |
12,120 | 13,689 | (11) | |||||||||||||||
|
Interest expense
|
|
5,650
|
|
|
8,938
|
|
|
(37)
|
|
|||||||||
|
Net interest income
|
|
6,470
|
|
|
4,751
|
|
|
36
|
|
|||||||||
|
Total net revenues
|
|
59,339
|
|
|
44,560
|
|
|
33
|
|
|||||||||
|
Provision for credit losses
|
|
357
|
|
|
3,098
|
|
|
(88)
|
|
|||||||||
|
OPERATING EXPENSES
|
||||||||||||||||||
|
Compensation and benefits |
17,719 | 13,309 | 33 | |||||||||||||||
|
Transaction based |
4,710 | 4,141 | 14 | |||||||||||||||
|
Market development |
553 | 401 | 38 | |||||||||||||||
|
Communications and technology |
1,573 | 1,347 | 17 | |||||||||||||||
|
Depreciation and amortization |
2,015 | 1,902 | 6 | |||||||||||||||
|
Occupancy |
981 | 960 | 2 | |||||||||||||||
|
Professional fees |
1,648 | 1,306 | 26 | |||||||||||||||
|
Other expenses
|
2,739 |
|
5,617
|
|
|
(51)
|
|
|||||||||||
|
Total operating expenses
|
|
31,938
|
|
|
28,983
|
|
|
10
|
|
|||||||||
| Pre-tax earnings |
27,044 | 12,479 | 117 | |||||||||||||||
|
Provision for taxes
|
|
5,409
|
|
|
3,020
|
|
|
79
|
|
|||||||||
|
Net earnings
|
|
21,635
|
|
|
9,459
|
|
|
129
|
|
|||||||||
|
Preferred stock dividends
|
|
484
|
|
|
544
|
|
|
(11)
|
|
|||||||||
|
Net earnings applicable to common shareholders
|
|
$ 21,151
|
|
|
$ 8,915
|
|
|
137
|
|
|||||||||
|
EARNINGS PER COMMON SHARE
|
||||||||||||||||||
|
Basic3 |
$ 60.25 | $ 24.94 | 142 % | |||||||||||||||
|
Diluted |
$ 59.45 | $ 24.74 | 140 | |||||||||||||||
|
AVERAGE COMMON SHARES
|
||||||||||||||||||
|
Basic |
350.5 | 356.4 | (2) | |||||||||||||||
|
Diluted
|
|
355.8
|
|
|
360.3
|
|
|
(1)
|
|
|||||||||
11
Goldman Sachs Reports
Full Year and Fourth Quarter 2021 Earnings Results
The Goldman Sachs Group, Inc. and Subsidiaries
Consolidated Statements of Earnings (unaudited)
In millions, except per share amounts and headcount
| THREE MONTHS ENDED | % CHANGE FROM | |||||||||||||||||||||
| DECEMBER 31, 2021 |
SEPTEMBER 30, 2021 |
DECEMBER 31, 2020 |
SEPTEMBER 30, 2021 |
DECEMBER 31, 2020 |
||||||||||||||||||
|
REVENUES
|
||||||||||||||||||||||
|
Investment banking |
$ 3,604 | $ 3,548 | $ 2,732 | 2 % | 32 % | |||||||||||||||||
|
Investment management |
2,219 | 2,139 | 1,831 | 4 | 21 | |||||||||||||||||
|
Commissions and fees |
853 | 860 | 849 | (1) | – | |||||||||||||||||
|
Market making |
2,256 | 3,929 | 2,750 | (43) | (18) | |||||||||||||||||
|
Other principal transactions
|
|
1,912
|
|
|
1,568
|
|
|
2,169
|
|
|
22
|
|
|
(12)
|
| |||||||
|
Total non-interest revenues
|
|
10,844
|
|
|
12,044
|
|
|
10,331
|
|
|
(10)
|
|
|
5
|
| |||||||
| Interest income |
3,010 | 3,117 | 2,973 | (3) | 1 | |||||||||||||||||
|
Interest expense
|
|
1,215
|
|
|
1,553
|
|
|
1,563
|
|
|
(22)
|
|
(22) | |||||||||
|
Net interest income
|
|
1,795
|
|
|
1,564
|
|
|
1,410
|
|
|
15
|
|
|
27
|
| |||||||
|
Total net revenues
|
|
12,639
|
|
|
13,608
|
|
|
11,741
|
|
|
(7)
|
|
|
8
|
| |||||||
|
Provision for credit losses
|
|
344
|
|
|
175
|
|
|
293
|
|
|
97
|
|
|
17
|
| |||||||
|
OPERATING EXPENSES
|
||||||||||||||||||||||
|
Compensation and benefits |
3,246 | 3,167 | 2,479 | 2 | 31 | |||||||||||||||||
|
Transaction based |
1,190 | 1,139 | 1,086 | 4 | 10 | |||||||||||||||||
|
Market development |
193 | 165 | 89 | 17 | 117 | |||||||||||||||||
|
Communications and technology |
430 | 397 | 341 | 8 | 26 | |||||||||||||||||
|
Depreciation and amortization |
488 | 509 | 498 | (4) | (2) | |||||||||||||||||
|
Occupancy |
254 | 239 | 254 | 6 | – | |||||||||||||||||
|
Professional fees |
511 | 433 | 350 | 18 | 46 | |||||||||||||||||
|
Other expenses
|
|
958
|
|
|
542
|
|
|
810
|
|
|
77
|
|
|
18
|
| |||||||
|
Total operating expenses
|
|
7,270
|
|
|
6,591
|
|
|
5,907
|
|
|
10
|
|
|
23
|
| |||||||
| Pre-tax earnings |
5,025 | 6,842 | 5,541 | (27) | (9) | |||||||||||||||||
|
Provision for taxes
|
|
1,090
|
|
|
1,464
|
|
|
1,035
|
|
|
(26)
|
|
|
5
|
| |||||||
|
Net earnings
|
|
3,935
|
|
|
5,378
|
|
|
4,506
|
|
|
(27)
|
|
|
(13)
|
| |||||||
|
Preferred stock dividends
|
|
126
|
|
|
94
|
|
|
144
|
|
|
34
|
|
|
(13)
|
| |||||||
|
Net earnings applicable to common shareholders
|
|
$ 3,809
|
|
|
$ 5,284
|
|
|
$ 4,362
|
|
|
(28)
|
|
|
(13)
|
| |||||||
|
EARNINGS PER COMMON SHARE
|
||||||||||||||||||||||
|
Basic3 |
$ 10.96 | $ 15.14 | $ 12.23 | (28) % | (10) % | |||||||||||||||||
|
Diluted |
$ 10.81 | $ 14.93 | $ 12.08 | (28) | (11) | |||||||||||||||||
|
AVERAGE COMMON SHARES
|
||||||||||||||||||||||
|
Basic |
346.6 | 348.3 | 356.0 | – | (3) | |||||||||||||||||
|
Diluted |
352.3 | 353.9 | 361.0 | – | (2) | |||||||||||||||||
|
SELECTED DATA AT PERIOD-END
|
||||||||||||||||||||||
|
Common shareholders’ equity |
$ 99,223 | $ 96,344 | $ 84,729 | 3 | 17 | |||||||||||||||||
|
Basic shares3 |
348.9 | 347.5 | 358.8 | – | (3) | |||||||||||||||||
|
Book value per common share |
$ 284.39 | $ 277.25 | $ 236.15 | 3 | 20 | |||||||||||||||||
| Headcount
|
|
43,900
|
|
|
43,000
|
|
|
40,500
|
|
|
2
|
|
|
8
|
| |||||||
12
Goldman Sachs Reports
Full Year and Fourth Quarter 2021 Earnings Results
The Goldman Sachs Group, Inc. and Subsidiaries
Condensed Consolidated Balance Sheets (unaudited)4
$ in billions
| AS OF | ||||||||||||||||||||||
| DECEMBER 31, 2021 |
SEPTEMBER 30, 2021 |
DECEMBER 31, 2020 |
||||||||||||||||||||
|
ASSETS
|
||||||||||||||||||||||
|
Cash and cash equivalents
|
$ 261 | $ 212 | $ 156 | |||||||||||||||||||
| Collateralized agreements
|
384 | 400 | 250 | |||||||||||||||||||
| Customer and other receivables
|
161 | 172 | 121 | |||||||||||||||||||
| Trading assets
|
375 | 393 | 394 | |||||||||||||||||||
| Investments
|
89 | 87 | 89 | |||||||||||||||||||
| Loans
|
158 | 143 | 116 | |||||||||||||||||||
| Other assets |
|
35
|
|
|
36
|
|
|
37
|
|
|||||||||||||
|
Total assets
|
|
$ 1,463
|
|
|
$
1,443
|
|
|
$ 1,163
|
|
|||||||||||||
|
LIABILITIES AND SHAREHOLDERS’ EQUITY
|
||||||||||||||||||||||
|
Deposits
|
$ 364 | $ 333 | $ 260 | |||||||||||||||||||
| Collateralized financings
|
230 | 229 | 174 | |||||||||||||||||||
| Customer and other payables
|
252 | 252 | 191 | |||||||||||||||||||
| Trading liabilities
|
181 | 204 | 154 | |||||||||||||||||||
| Unsecured short-term borrowings
|
47 | 49 | 53 | |||||||||||||||||||
| Unsecured long-term borrowings
|
254 | 243 | 213 | |||||||||||||||||||
| Other liabilities |
|
25
|
|
|
27
|
|
|
22
|
|
|||||||||||||
|
Total liabilities
|
|
1,353
|
|
|
1,337
|
|
|
1,067
|
|
|||||||||||||
|
Shareholders’ equity |
|
110
|
|
|
106
|
|
|
96
|
|
|||||||||||||
|
Total liabilities and shareholders’ equity
|
|
$ 1,463
|
|
|
$ 1,443
|
|
|
$ 1,163
|
|
|||||||||||||
|
Capital Ratios and Supplementary Leverage Ratio (unaudited)3,4 $ in billions
|
|
|||||||||||||||||||||
| AS OF | ||||||||||||||||||||||
| DECEMBER 31, 2021 |
SEPTEMBER 30, 2021 |
DECEMBER 31, 2020 |
||||||||||||||||||||
| Common equity tier 1 capital |
$ 96.3 | $ 93.3 | $ 81.6 | |||||||||||||||||||
|
STANDARDIZED CAPITAL RULES |
||||||||||||||||||||||
| Risk-weighted assets5,6
|
|
$ 677
|
|
|
$ 664
|
|
|
$ 554
|
|
|||||||||||||
| Common equity tier 1 capital ratio6 |
|
14.2%
|
|
|
14.1%
|
|
|
14.7%
|
|
|||||||||||||
|
ADVANCED CAPITAL RULES |
||||||||||||||||||||||
| Risk-weighted assets
|
|
$ 648
|
|
|
$ 672
|
|
|
$ 610
|
|
|||||||||||||
| Common equity tier 1 capital ratio |
|
14.9%
|
|
|
13.9%
|
|
|
13.4%
|
|
|||||||||||||
|
SUPPLEMENTARY LEVERAGE RATIO |
||||||||||||||||||||||
|
Supplementary leverage ratio
|
|
5.6%
|
|
|
5.6%
|
|
|
7.0%
|
|
|||||||||||||
|
Average Daily VaR (unaudited)3,4 |
|
|||||||||||||||||||||
| $ in millions
|
||||||||||||||||||||||
| THREE MONTHS ENDED | YEAR ENDED | |||||||||||||||||||||
| DECEMBER 31, 2021 |
SEPTEMBER 30, 2021 |
DECEMBER 31, 2020 |
DECEMBER 31, 2021 |
DECEMBER 31, 2020 |
||||||||||||||||||
|
RISK CATEGORIES
|
||||||||||||||||||||||
| Interest rates |
$ 58 | $ 58 | $ 57 | $ 60 | $ 71 | |||||||||||||||||
|
Equity prices
|
34 | 40 | 50 | 43 | 55 | |||||||||||||||||
| Currency rates |
15 | 12 | 14 | 13 | 23 | |||||||||||||||||
|
Commodity prices |
32 | 22 | 20 | 25 | 20 | |||||||||||||||||
|
Diversification effect |
|
(56)
|
|
|
(52)
|
|
|
(57)
|
|
|
(55)
|
|
|
(75)
|
| |||||||
|
Total
|
|
$ 83
|
|
|
$ 80
|
|
|
$ 84
|
|
|
$ 86
|
|
$ 94 | |||||||||
13
Goldman Sachs Reports
Full Year and Fourth Quarter 2021 Earnings Results
The Goldman Sachs Group, Inc. and Subsidiaries
Assets Under Supervision (unaudited)3,4
$ in billions
| AS OF | ||||||||||||||||||||||
| DECEMBER 31, 2021 |
SEPTEMBER 30, 2021 |
DECEMBER 31, 2020 |
||||||||||||||||||||
|
SEGMENT
|
||||||||||||||||||||||
|
Asset Management |
$ 1,719 | $ 1,678 | $ 1,530 | |||||||||||||||||||
|
Consumer & Wealth Management
|
|
751
|
|
|
694
|
|
|
615
|
|
|||||||||||||
|
Total AUS
|
|
$ 2,470
|
|
|
$ 2,372
|
|
|
$ 2,145
|
|
|||||||||||||
|
ASSET CLASS
|
||||||||||||||||||||||
| Alternative investments |
$ 236 | $ 224 | $ 191 | |||||||||||||||||||
|
Equity |
613 | 569 | 475 | |||||||||||||||||||
|
Fixed income
|
|
940
|
|
|
940
|
|
|
896
|
|
|||||||||||||
|
Total long-term AUS
|
|
1,789
|
|
|
1,733
|
|
|
1,562
|
|
|||||||||||||
|
Liquidity products
|
|
681
|
|
|
639
|
|
|
583
|
|
|||||||||||||
|
Total AUS
|
|
$ 2,470
|
|
|
$ 2,372
|
|
|
$ 2,145
|
|
|||||||||||||
| THREE MONTHS ENDED | YEAR ENDED | |||||||||||||||||||||
| DECEMBER 31, 2021 |
SEPTEMBER 30, 2021 |
DECEMBER 31, 2020 |
DECEMBER 31, 2021 |
DECEMBER 31, 2020 |
||||||||||||||||||
|
ASSET MANAGEMENT |
||||||||||||||||||||||
|
Beginning balance |
$ 1,678 | $ 1,633 | $ 1,461 | $ 1,530 | $ 1,298 | |||||||||||||||||
|
Net inflows / (outflows): |
||||||||||||||||||||||
|
Alternative investments |
6 | 3 | 3 | 15 | (3) | |||||||||||||||||
|
Equity |
4 | 3 | (12) | 5 | (12) | |||||||||||||||||
|
Fixed income |
|
(1)
|
|
|
27
|
|
|
18
|
|
|
54
|
|
|
53
|
| |||||||
|
Total long-term AUS net inflows / (outflows) |
|
9
|
|
|
33
|
|
|
9
|
|
|
74
|
|
|
38
|
| |||||||
|
Liquidity products
|
|
20
|
|
|
11
|
|
|
6
|
|
|
76
|
|
|
107
|
| |||||||
|
Total AUS net inflows / (outflows)
|
|
29
|
|
|
44
|
|
|
15
|
|
|
150
|
|
|
145
|
| |||||||
|
Net market appreciation / (depreciation) |
|
12
|
|
|
1
|
|
|
54
|
|
|
39
|
|
|
87
|
| |||||||
|
Ending balance
|
|
$ 1,719
|
|
|
$ 1,678
|
|
|
$ 1,530
|
|
|
$ 1,719
|
|
|
$ 1,530
|
| |||||||
|
CONSUMER & WEALTH MANAGEMENT |
||||||||||||||||||||||
|
Beginning balance |
$ 694 | $ 672 | $ 575 | $ 615 | $ 561 | |||||||||||||||||
|
Net inflows / (outflows): |
||||||||||||||||||||||
|
Alternative investments |
5 | 6 | – | 18 | 2 | |||||||||||||||||
|
Equity |
8 | 9 | 8 | 36 | 8 | |||||||||||||||||
|
Fixed income |
|
–
|
|
|
1
|
|
|
–
|
|
|
2
|
|
|
(6)
|
| |||||||
|
Total long-term AUS net inflows / (outflows)
|
|
13
|
|
|
16
|
|
|
8
|
|
|
56
|
|
|
4
|
| |||||||
|
Liquidity products |
|
22
|
|
|
6
|
|
|
–
|
|
|
22
|
|
|
14
|
| |||||||
|
Total AUS net inflows / (outflows)
|
|
35
|
|
|
22
|
|
|
8
|
|
|
78
|
|
|
18
|
| |||||||
|
Net market appreciation / (depreciation) |
|
22
|
|
|
–
|
|
|
32
|
|
|
58
|
|
|
36
|
| |||||||
|
Ending balance
|
|
$
751
|
|
|
$ 694
|
|
|
$ 615
|
|
|
$ 751
|
|
|
$ 615
|
| |||||||
|
FIRMWIDE |
||||||||||||||||||||||
|
Beginning balance |
$ 2,372 | $ 2,305 | $ 2,036 | $ 2,145 | $ 1,859 | |||||||||||||||||
|
Net inflows / (outflows): |
||||||||||||||||||||||
|
Alternative investments |
11 | 9 | 3 | 33 | (1) | |||||||||||||||||
|
Equity |
12 | 12 | (4) | 41 | (4) | |||||||||||||||||
|
Fixed income |
|
(1)
|
|
|
28
|
|
|
18
|
|
|
56
|
|
|
47
|
| |||||||
|
Total long-term AUS net inflows / (outflows)
|
|
22
|
|
|
49
|
|
|
17
|
|
|
130
|
|
|
42
|
| |||||||
|
Liquidity products |
|
42
|
|
|
17
|
|
|
6
|
|
|
98
|
|
|
121
|
| |||||||
|
Total AUS net inflows / (outflows)
|
|
64
|
|
|
66
|
|
|
23
|
|
|
228
|
|
|
163
|
| |||||||
|
Net market appreciation / (depreciation)
|
|
34
|
|
|
1
|
|
|
86
|
|
|
97
|
|
|
123
|
| |||||||
|
Ending balance
|
|
$ 2,470
|
|
|
$ 2,372
|
|
|
$ 2,145
|
|
|
$ 2,470
|
|
|
$ 2,145
|
| |||||||
14
Goldman Sachs Reports
Full Year and Fourth Quarter 2021 Earnings Results
|
Footnotes |
|
|
| 1. | ROE is calculated by dividing net earnings (or annualized net earnings for annualized ROE) applicable to common shareholders by average monthly common shareholders’ equity. ROTE is calculated by dividing net earnings (or annualized net earnings for annualized ROTE) applicable to common shareholders by average monthly tangible common shareholders’ equity (tangible common shareholders’ equity is calculated as total shareholders’ equity less preferred stock, goodwill and identifiable intangible assets). Management believes that ROTE is meaningful because it measures the performance of businesses consistently, whether they were acquired or developed internally, and that tangible common shareholders’ equity is meaningful because it is a measure that the firm and investors use to assess capital adequacy. ROTE and tangible common shareholders’ equity are non-GAAP measures and may not be comparable to similar non-GAAP measures used by other companies. |
The table below presents a reconciliation of average common shareholders’ equity to average tangible common shareholders’ equity:
| AVERAGE FOR THE | ||||||||||||
| Unaudited, $ in millions | THREE MONTHS ENDED DECEMBER 31, 2021 |
YEAR ENDED DECEMBER 31, 2021 |
||||||||||
|
Total shareholders’ equity
|
|
$ 107,953
|
|
|
$ 101,705
|
|
||||||
| Preferred stock
|
|
(10,516)
|
|
|
(9,876)
|
|
||||||
|
Common shareholders’ equity
|
|
97,437
|
|
|
91,829
|
|
||||||
|
Goodwill Identifiable intangible assets
|
|
(4,316) (470)
|
|
|
(4,327) (536)
|
|
||||||
|
Tangible common shareholders’ equity
|
|
$
92,651
|
|
|
$
86,966
|
|
||||||
| 2. | Dealogic – January 1, 2021 through December 31, 2021. |
| 3. | For information about the following items, see the referenced sections in Part I, Item 2 “Management’s Discussion and Analysis of Financial Condition and Results of Operations” in the firm’s Quarterly Report on Form 10-Q for the period ended September 30, 2021: (i) investment banking transaction backlog – see “Results of Operations – Investment Banking” (ii) assets under supervision – see “Results of Operations – Assets Under Supervision” (iii) efficiency ratio – see “Results of Operations – Operating Expenses” (iv) share repurchase program – see “Capital Management and Regulatory Capital – Capital Management” (v) global core liquid assets – see “Risk Management – Liquidity Risk Management” (vi) basic shares – see “Balance Sheet and Funding Sources – Balance Sheet Analysis and Metrics” and (vii) VaR – see “Risk Management – Market Risk Management.” |
For information about the following items, see the referenced sections in Part I, Item 1 “Financial Statements (Unaudited)” in the firm’s Quarterly Report on Form 10-Q for the period ended September 30, 2021: (i) risk-based capital ratios and the supplementary leverage ratio – see Note 20 “Regulation and Capital Adequacy” (ii) geographic net revenues – see Note 25 “Business Segments” and (iii) unvested share-based awards that have non-forfeitable rights to dividends or dividend equivalents in calculating basic EPS – see Note 21 “Earnings Per Common Share.”
| 4. | Represents a preliminary estimate for the fourth quarter of 2021 and may be revised in the firm’s Annual Report on Form 10-K for the year ended December 31, 2021. |
| 5. | During the fourth quarter of 2021, the firm early adopted the Standardized approach for counterparty credit risk (SA-CCR). As of December 31, 2021, the impact of this was an increase of approximately $15 billion to risk-weighted assets. |
| 6. | In the third quarter of 2021, based on regulatory feedback, the firm revised certain interpretations of the Capital Rules underlying the calculation of Standardized risk-weighted assets. As of December 31, 2020, this change would have increased risk-weighted assets by approximately $23 billion to $577 billion, which would have reduced the firm’s Standardized Common equity tier 1 capital ratio of 14.7% by 0.6 percentage points. |
15