Management's Discussion and Analysis for the Year Ended December 31, 2010
Exhibit 99.2
Management’s Discussion & Analysis
|
|
|
| INDEX |
|
|
| 8 Overview of the
Business 10 Our Strategy
12 How We Analyze Our Business
13 Financial Highlights
13 Production Summary
15 Results of Operations
21 Liquidity and Capital Resources
27 Risk Factors and Risk Management |
|
35 Critical Accounting
Estimates 37 Anticipated Changes to Canadian Generally Accepted Accounting
Principles 45 Supplemental Non-GAAP Measures
46 Quarterly Financial Data (Unaudited)
46 Selected Annual Information
46 Controls and Procedures
47 Forward-Looking Statements |
This Management’s Discussion and Analysis is dated March 24, 2011 and should be read in conjunction with our consolidated financial statements and the
accompanying notes for the year ended December 31, 2010. Our consolidated financial statements are prepared in accordance with Canadian generally accepted accounting principles (Canadian GAAP). We use the United States dollar as our reporting
currency. Except where otherwise noted, all dollar amounts are stated in United States dollars.
Canadian GAAP differs in some respects from
accounting principles generally accepted in the United States (US GAAP). Significant differences between Canadian GAAP and US GAAP are described in note 20 to our consolidated financial statements. The Canadian Accounting Standards Board
confirmed January 1, 2011 as the changeover date for Canadian publicly accountable enterprises to start using International Financial Reporting Standards (IFRS) as issued by the International Accounting Standards Board (IASB). Accordingly, we
will issue our first interim consolidated financial statements in accordance with IFRS beginning with the first quarter ending March 31, 2011 with comparative financial results for 2010 (refer to the Anticipated Changes to Canadian Generally Accepted Accounting Principles section on page 37 for more information).
At March 18, 2011 we had 92,715,072 common shares issued and outstanding and stock options exercisable for 3,987,749 additional common shares.
Additional information relating to Methanex, including our Annual Information Form, is available on the Canadian Securities Administrators’ SEDAR website at
www.sedar.com and on the United States Securities and Exchange Commission’s EDGAR website at www.sec.gov.
OVERVIEW OF THE
BUSINESS
Methanol is a clear liquid commodity chemical that is predominantly produced from natural gas and also, particularly in China, from coal.
Approximately two-thirds of all methanol demand is used to produce traditional chemical derivatives including formaldehyde, acetic acid and a variety of other chemicals that form the basis of a large number of chemical derivatives for which demand
is influenced by levels of global economic activity. The remaining one-third of methanol demand comes from the energy sector. There has been strong demand growth for methanol in energy-related applications such as direct methanol blending into
gasoline and dimethyl ether (DME), which can be blended with liquefied petroleum gas for use in household cooking and heating, and also as a substitute for diesel. Methanol is also used to produce biodiesel and methyl tertiary butyl ether (MTBE), a
gasoline component.
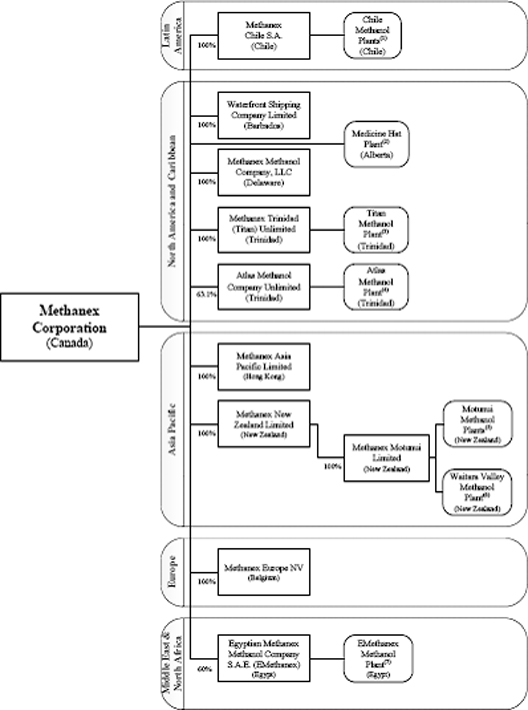
We are the world’s largest supplier of methanol to the major international markets of Asia Pacific, North America, Europe and
Latin America. Our total annual production capacity, including equity interests in jointly owned plants, is approximately 7.93 million tonnes and is located in Chile, Trinidad, New Zealand, Egypt and Canada (refer to the Production Summary section on page 13 for more information). We have marketing rights for 100% of the production from our jointly owned plants in Trinidad
and Egypt and this provides us with an additional 1.17 million tonnes per year of methanol offtake supply. In addition to the methanol produced at our sites, we purchase methanol produced by others under methanol
|
|
|
| |
|
| |
|
8 METHANEX
Annual Report 2010 Management’s Discussion & Analysis |
offtake contracts and on the spot market. This gives us flexibility in managing our supply chain while continuing to meet customer needs and support our marketing efforts.
2010 Industry Overview & Outlook
Methanol is a global commodity and our earnings are significantly affected by fluctuations in the price of methanol, which is directly impacted by the balance of
methanol supply and demand. Demand for methanol is driven primarily by levels of industrial production, energy prices and the strength of the global economy.
During 2010, the methanol industry experienced strong demand growth with total demand of approximately 45 million tonnes, representing a 13% increase over 2009. The increase in demand was driven primarily by
demand for both traditional and energy-related derivatives in Asia, particularly China. There were also increases in demand for traditional methanol derivatives in other regions, including Europe, Latin America and North America.
Energy-related derivatives currently represent approximately one-third of global methanol demand, and over the last few years high energy prices have driven strong
demand growth for methanol into energy applications such as gasoline blending and DME in China. During 2010, methanol blending into gasoline in China was particularly strong and continues to be supported by standards introduced by national and
provincial governments. There are a number of provincially sponsored programs for methanol fuel blending and more are under development. In 2009, national standards were introduced for the use of M85 and M100 (85 percent and 100 percent methanol
blends) and we expect the Government of China to introduce an M15 national standard in 2011, which should be a further catalyst to grow methanol fuel blending in China. China is currently the largest energy and automobile market in the world and, as
a developing country, the per capita use of automobiles and the demand for transportation fuels is expected to grow significantly over time. DME demand in China in 2010 was also strong and ended the year at record levels.
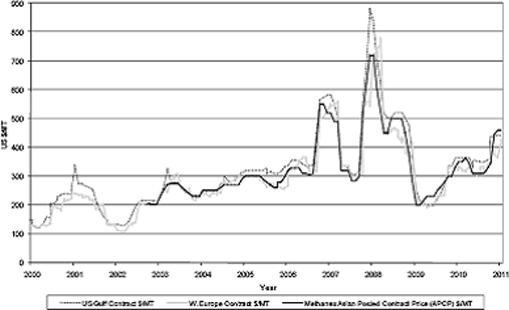
The methanol industry conditions were balanced to tight in 2010, underpinned by strong global methanol demand growth and supply constraints. While three new
world-scale plants (in Brunei, Oman and Venezuela) with combined capacity totalling 2.8 million tonnes per year started up in 2010, there were also some shut-ins of higher cost capacity and a number of planned and unplanned plant outages across
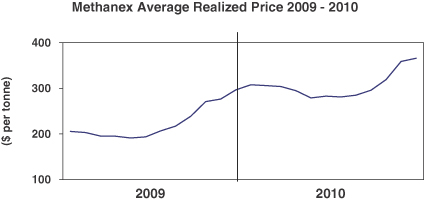
the industry. These factors, combined with the continuing higher energy price environment, led to balanced to tight market conditions and a strong methanol pricing environment throughout 2010. Our average non-discounted price in 2010 was $356 per
tonne compared with $252 per tonne in 2009, and our average realized price for 2010 was $306 per tonne compared with $225 per tonne in 2009.
Going
forward, with China continuing to demonstrate the success of methanol for use in energy, other countries are also considering the use of methanol in energy applications. Australia, Iran, Pakistan and Malaysia are currently studying the use of
methanol in gasoline, and we are involved in a project to test methanol fuel blending in Trinidad. We are also working with several producers of renewable methanol to help develop markets that recognize the unique characteristics of methanol
produced from renewable feedstock. Finally, there is also potential for growth in the DME industry outside China, with Indonesia, Japan, Sweden, Iran, Egypt and India all studying or developing DME projects.
Another recent development that is also being led by China is the use of methanol to produce olefins, with the first commercial methanol-to-olefins plant starting
up in Baotou in 2010. Historically, we have viewed these projects as fully integrated and therefore having little impact on the merchant methanol market. However, some projects are now being considered that require the purchase of merchant methanol.
These methanol-to-olefin projects consume a significant amount of methanol and there are a number of projects under development in several countries. This industry could therefore have a significant impact on future demand for merchant methanol.
We anticipate a significant increase in our production capacity in 2011 from the 1.26 million tonne per year Egypt plant and the restart of our
0.47 million tonne per year Medicine Hat facility. We also are focused on accessing natural gas to increase production at our existing sites in Chile and New Zealand over the next few years (refer to the Production Summary section on page 13 for more information). Beyond our own capacity additions, there are few global methanol capacity additions outside
China expected over the next few years. There is a 0.85 million tonne plant in Beaumont, Texas and a 0.7 million tonne plant in Azerbaijan and we anticipate that product from both of these plants will enter the market over the 2012-2013
period.
|
|
|
| |
|
| Management’s Discussion & Analysis Annual Report 2010 METHANEX 9
|
|
|
Global methanol demand continues to be strong, supported by continuing growth of methanol into energy applications,
and further recovery of global economies should lead to increased demand for traditional methanol derivatives. With few capacity additions expected to enter the market over the next few years, we believe we are well positioned with anticipated
production increases from our existing sites. As production from these sites comes on line, we believe our leadership position in the industry will be strengthened, the overall cost position of our assets will be improved and we will have
significant upside potential to our cash flows and earnings.
The methanol price will ultimately depend on the strength of the economic recovery,
industry operating rates, global energy prices, the rate of industry restructuring and the strength of global demand. We believe that our financial position and financial flexibility, outstanding global supply network and competitive cost position
will provide a sound basis for Methanex to continue to be the leader in the methanol industry and to invest to grow the Company.
OUR
STRATEGY
Our primary objective is to create value by maintaining and enhancing our leadership in the global production, marketing and delivery of
methanol to our customers. Our simple, clearly defined strategy – global leadership, low cost and operational excellence – has helped us achieve this objective.
Global Leadership
Global Leadership is a key element of our strategy, with a focus on
maintaining and enhancing our position as the major supplier to the global methanol industry, enhancing our ability to cost-effectively deliver methanol supply to our customers and supporting global methanol demand growth for both traditional and
energy-related methanol derivatives.
We are the leading supplier of methanol to the major international markets of North America, Asia Pacific, Europe
and Latin America. Our sales volumes in 2010 represented approximately 15% of total global methanol demand and we grew sales volumes by 16% from 5.95 million tonnes in 2009 to 6.93 million tonnes in 2010. Our leadership position has
enabled us to play an important role in the industry, which includes publishing Methanex reference prices that are generally used in each major market as the basis of pricing for most of our customer contracts and which we believe enhances market
transparency.
The geographically diverse location of our production sites allows us to deliver methanol cost-effectively to customers in all major
global markets, while our global distribution and supply infrastructure, which includes a dedicated fleet of ocean-going vessels and terminal capacity within all major international markets, enables us to enhance value to customers by providing
reliable and secure supply.
A key component of our Global Leadership strategy is a focus on strengthening our asset position and increasing production
at our sites. We expect increased production in 2011 with the start-up of production from the 1.26 million tonne per year methanol plant in Egypt and the restart of our 0.47 million tonne per year Medicine Hat, Alberta plant. Both of these
sites are well located and will provide additional security of supply for our customers. Our methanol facilities in Chile represent 3.8 million tonnes of annual production capacity and since mid-2007 we have operated the site significantly
below capacity. This is primarily due to curtailments of natural gas supply from Argentina (refer to the Production Summary – Chile section
on page 14). Our goal is to progressively increase production at our Chile site with natural gas from suppliers in Chile by supporting the acceleration of natural gas development in southern Chile. We are also focused on accessing additional
natural gas supply to increase production in New Zealand, where we currently have approximately 1.35 million tonnes of annual idled production capacity.
Another key component of our Global Leadership strategy is our ability to supplement our methanol production with methanol purchases from others to give us flexibility in our supply chain and continue to meet
customer commitments. We purchase through a combination of methanol offtake contracts and spot purchases. We manage the cost of purchased methanol by taking advantage of our global supply chain infrastructure, which allows us to purchase methanol in
the most cost-effective region while still maintaining overall security of supply. We grew our sales and purchasing levels in 2010 in anticipation of increased production from the Egypt plant. However, we expect purchased methanol will represent a
lower proportion of our overall sales volumes with increased production in Egypt and Canada in 2011.
|
|
|
| |
|
| |
|
10 METHANEX
Annual Report 2010 Management’s Discussion & Analysis |
The Asia Pacific region continues to lead global methanol demand growth and we have invested in and developed our
presence in this important region. We have storage capacity in China and Korea that allows us to cost-effectively manage supply to customers in this region. We have offices in Hong Kong, Shanghai, Beijing, Korea and Japan to enhance customer service
and industry positioning in the region. This also enables us to participate in and improve our knowledge of the rapidly evolving and high growth methanol market in China and other Asian countries. Our expanding presence in Asia has also helped us
identify several opportunities to support the development of applications for methanol in the energy sector.
With China continuing to demonstrate the
success of methanol for use in energy markets, other countries are also considering the use of methanol in energy applications and we are involved in a project to test methanol fuel blending in Trinidad. We are also working with several producers of
renewable methanol to help develop markets that recognize the unique characteristics of methanol produced from renewable feedstock. We also continued to advance our joint venture DME project in Egypt.
Low Cost
A low cost structure is an
important element of competitive advantage in a commodity industry and is a key element of our strategy. Our approach to major business decisions is guided by our drive to improve our cost structure, expand margins and return value to shareholders.
The most significant components of our costs are natural gas for feedstock and distribution costs associated with delivering methanol to customers.
Our
production facilities in Trinidad represent 2.05 million tonnes per year of competitive cost production capacity. These facilities are well located to supply markets in North America and Europe and are underpinned by take-or-pay natural gas
purchase agreements where the gas price varies with methanol prices.
As described above, we expect an increase in our production capability in 2011 from
the new methanol plant in Egypt and the restart of our Medicine Hat, Alberta plant. We also are focused on accessing natural gas to increase production at our existing sites in Chile and New Zealand. We believe these initiatives will further enhance
our competitive cost structure and our ability to cost-effectively deliver methanol to customers (refer to the Production Summary section on
page 13 for more information on all of our production sites).
The cost to distribute methanol from production facilities to customers is also a
significant component of our operating costs. These include costs for ocean shipping, in-market storage facilities and in-market distribution. We are focused on identifying initiatives to reduce these costs, including optimizing the use of our
shipping fleet to reduce costs and taking advantage of prevailing conditions in the shipping market by varying the type and length of term of ocean vessel contracts. We are continuously investigating opportunities to further improve the efficiency
and cost-effectiveness of distributing methanol from our production facilities to customers. We also look for opportunities to leverage our global asset position by entering into product exchanges with other methanol producers to reduce distribution
costs.
Operational Excellence
We maintain a focus on operational excellence in all aspects of our business. This includes excellence in our manufacturing and supply chain processes, marketing
and sales, human resources, corporate governance practices and financial management.
To differentiate ourselves from our competitors, we strive to be
the best operator in all aspects of our business and to be the preferred supplier to customers. We believe that reliability of supply is critical to the success of our customers’ businesses and our goal is to deliver methanol reliably and
cost-effectively. We have a commitment to Responsible Care (a risk-minimization approach developed by the Chemistry Industry Association of Canada) and we use it as the umbrella under which we manage issues related to health, safety, the
environment, community involvement, social responsibility, security and emergency preparedness at each of our facilities and locations. We believe our commitment to Responsible Care helps us reduce the likelihood of unplanned shutdowns and safety
incidents and achieve an excellent overall environmental record. In 2010 we experienced no employee recordable injuries across the organization as well as improvement in contractor safety performance, resulting in overall safety performance that
exceeds the Canadian industry average for comparable companies.
|
|
|
| |
|
| Management’s Discussion & Analysis Annual Report 2010 METHANEX 11
|
|
|
Product stewardship is a vital component of our Responsible Care culture and guides our actions through the complete
life cycle of our product. We aim for the highest safety standards to minimize risk to our employees, customers and suppliers as well as to the environment and the communities in which we do business. We promote the proper use and safe handling of
methanol at all times through a variety of internal and external health, safety and environmental initiatives, and we work with industry colleagues to improve safety standards and regulatory compliance. We readily share our technical and safety
expertise with key stakeholders, including customers, end-users, suppliers, logistics providers and industry associations in the methanol and methanol applications marketplace through active participation in local and international industry seminars
and conferences, and online education initiatives.
As a natural extension of our Responsible Care ethic, we have a Social Responsibility policy that
aligns our corporate governance, employee engagement and development, community involvement and social investment strategies with our core values and corporate strategy.
Our strategy of operational excellence includes the financial management of the Company. We operate in a highly competitive commodity industry. Accordingly, we believe it is important to maintain financial
flexibility and we have adopted a prudent approach to financial management. At December 31, 2010, we had a strong balance sheet with a cash balance of $194 million, a $200 million undrawn credit facility and no re-financing requirements until
mid-2012. We believe we are well positioned to meet our financial commitments and continue investing to grow our business.
HOW WE
ANALYZE OUR BUSINESS
Our operations consist of a single operating segment – the production and sale of methanol. We review our results of
operations by analyzing changes in the components of our adjusted earnings before interest, taxes, depreciation and amortization (Adjusted EBITDA) (refer to the Supplemental Non-GAAP
Measures section on page 45 for a reconciliation to the most comparable GAAP measure), depreciation and amortization, interest expense, interest and other income, and income taxes. In addition
to the methanol that we produce at our facilities (“Methanex-produced methanol”), we also purchase and re-sell methanol produced by others (“purchased methanol”) and we sell methanol on a commission basis. We analyze the results
of all methanol sales together. The key drivers of change in our Adjusted EBITDA are average realized price, cash costs and sales volume.
The price,
cash cost and volume variances included in our Adjusted EBITDA analysis are defined and calculated as follows:
|
|
|
| PRICE |
|
The change in Adjusted EBITDA as a result of changes in average realized price is calculated as the difference from
period to period in the selling price of methanol multiplied by the current period total methanol sales volume excluding commission sales volume plus the difference from period to period in commission revenue. |
| CASH COST |
|
The change in our Adjusted EBITDA as a result of changes in cash costs is calculated as the difference from period to period in cash costs per tonne
multiplied by the current period total methanol sales volume excluding commission sales volume in the current period. The cash costs per tonne is the weighted average of the cash cost per tonne of Methanex-produced methanol and the cash cost per
tonne of purchased methanol. The cash cost per tonne of Methanex-produced methanol includes absorbed fixed cash costs per tonne and variable cash costs per tonne. The cash cost per tonne of purchased methanol consists principally of the cost of
methanol itself. In addition, the change in our Adjusted EBITDA as a result of changes in cash costs includes the changes from period to period in unabsorbed fixed production costs, consolidated selling, general and administrative expenses and fixed
storage and handling costs. |
| VOLUME |
|
The change in Adjusted EBITDA as a result of changes in sales volume is calculated as the difference from period to period in total methanol sales
volume excluding commission sales volumes multiplied by the margin per tonne for the prior period. The margin per tonne for the prior period is the weighted average margin per tonne of Methanex-produced methanol and margin per tonne of purchased
methanol. The margin per tonne for Methanex-produced methanol is calculated as the selling price per tonne of methanol less absorbed fixed cash costs per tonne and variable cash costs per tonne. The margin per tonne for purchased methanol is
calculated as the selling price per tonne of methanol less the cost of purchased methanol per tonne. |
|
|
|
| |
|
| |
|
12 METHANEX
Annual Report 2010 Management’s Discussion & Analysis |
We also sell methanol on a commission basis. Commission sales represent volumes marketed on a commission basis related
to the 36.9% of the Atlas methanol facility in Trinidad that we do not own.
FINANCIAL HIGHLIGHTS
|
|
|
|
|
|
|
|
|
| ($ MILLIONS, EXCEPT WHERE NOTED) |
|
2010 |
|
|
2009 |
|
| Production (thousands of tonnes): |
|
|
3,540 |
|
|
|
3,543 |
|
| Sales volumes (thousands of tonnes): |
|
|
|
|
|
|
|
|
| Produced methanol |
|
|
3,540 |
|
|
|
3,764 |
|
| Purchased methanol |
|
|
2,880 |
|
|
|
1,546 |
|
| Commission
sales1 |
|
|
509 |
|
|
|
638 |
|
| Total sale volumes |
|
|
6,929 |
|
|
|
5,948 |
|
| Methanex average non-discounted posted price ($ per
tonne)2 |
|
|
356 |
|
|
|
252 |
|
| Average realized price ($ per tonne)3 |
|
|
306 |
|
|
|
225 |
|
| Revenue |
|
|
1,967 |
|
|
|
1,198 |
|
| Adjusted EBITDA4 |
|
|
267 |
|
|
|
142 |
|
| Cash flows from operating activities |
|
|
153 |
|
|
|
110 |
|
| Cash flows from operating activities before changes in non-cash working capital |
|
|
252 |
|
|
|
129 |
|
| Net income |
|
|
102 |
|
|
|
1 |
|
| Net income before unusual items4 |
|
|
80 |
|
|
|
1 |
|
| Basic net income per common share ($ per share) |
|
|
1.10 |
|
|
|
0.01 |
|
| Diluted net income per common share ($ per share) |
|
|
1.09 |
|
|
|
0.01 |
|
| Diluted net income per common share before unusual item ($ per
share)4 |
|
|
0.85 |
|
|
|
0.01 |
|
| Common share information (millions of shares): |
|
|
|
|
|
|
|
|
| Weighted average number of common shares outstanding |
|
|
92 |
|
|
|
92 |
|
| Diluted weighted average number of common shares outstanding |
|
|
94 |
|
|
|
93 |
|
| Number of common shares outstanding |
|
|
93 |
|
|
|
92 |
|
| 1 |
Commission sales represent volumes marketed on a commission basis. Commission income is included in revenue when earned. |
| 2 |
Methanex average non-discounted posted price represents the average of our non-discounted posted prices in North America, Europe and Asia Pacific weighted by
sales volume. Current and historical pricing information is available on our website at www.methanex.com. |
| 3 |
Average realized price is calculated as revenue, net of commission income, divided by total sales volumes of produced and purchased methanol.
|
| 4 |
These items are non-GAAP measures that do not have any standardized meaning prescribed by Canadian Generally Accepted Accounting Principles (GAAP) and therefore
are unlikely to be comparable to similar measures presented by other companies. Refer to the Supplemental Non-GAAP Measures section on page 45 for a description of each non-GAAP measure and a reconciliation to the most comparable GAAP measure.
|
PRODUCTION SUMMARY
The following table details the annual production capacity and actual production of our facilities that operated in 2010 and 2009:
|
|
|
|
|
|
|
|
|
|
|
|
|
| (THOUSANDS OF TONNES) |
|
ANNUAL
PRODUCTION
CAPACITY1 |
|
|
2010 |
|
|
2009 |
|
| Chile I, II, III and IV |
|
|
3,800 |
|
|
|
935 |
|
|
|
942 |
|
| Atlas (Trinidad) (63.1% interest) |
|
|
1,150 |
|
|
|
884 |
|
|
|
1,015 |
|
| Titan (Trinidad) |
|
|
900 |
|
|
|
891 |
|
|
|
764 |
|
| New Zealand2 |
|
|
850 |
|
|
|
830 |
|
|
|
822 |
|
| Egypt (60% interest)3 |
|
|
760 |
|
|
|
– |
|
|
|
– |
|
| Medicine
Hat3 |
|
|
470 |
|
|
|
– |
|
|
|
– |
|
| |
|
|
7,930 |
|
|
|
3,540 |
|
|
|
3,543 |
|
| 1 |
The annual production capacity of our production facilities may be higher than original nameplate capacity as, over time, these figures have been adjusted to
reflect ongoing operating efficiencies at these facilities. |
| 2 |
The annual production capacity of New Zealand represents only our 0.85 million tonne per year Motunui facility that we restarted in late 2008. Practical
operating capacity will depend partially on the composition of natural gas feedstock and may differ from the stated capacity above. We also have additional potential production capacity that is currently idled in New Zealand (refer to the New Zealand section on page 14 for more information). |
| 3 |
These two plants are anticipated to commence production in 2011. The Egypt methanol facility produced first methanol in January 2011 and we are nearing
completion of the restart of our Medicine Hat, Alberta facility (refer to the Egypt and
Medicine Hat sections on page 15 for more information). |
|
|
|
| |
|
| Management’s Discussion & Analysis Annual Report 2010 METHANEX 13
|
|
|
Chile
Our methanol facilities in Chile produced 0.94 million tonnes of methanol in 2010 and 2009. Since 2007, we have operated our methanol facilities in Chile significantly below site capacity primarily due to
curtailments of natural gas supply from Argentina. In June 2007, our natural gas suppliers from Argentina curtailed all gas supply to our plants in Chile in response to various actions by the Argentinean government, including imposing a large
increase to the duty on natural gas exports. Under the current circumstances, we do not expect to receive any further natural gas supply from Argentina. As a result of the Argentinean natural gas supply issues, all of the methanol production at our
Chile facilities since June 2007 has been produced with natural gas from Chile.
Our goal is to progressively increase production at our Chile site with
natural gas from suppliers in Chile. We are pursuing investment opportunities with the state-owned energy company Empresa Nacional del Petroleo (ENAP), GeoPark Chile Limited (GeoPark) and others to help accelerate natural gas exploration and
development in southern Chile. We are working with ENAP to develop natural gas in the Dorado Riquelme block in southern Chile. Under the arrangement, we fund a 50% participation in the block and, as at December 31, 2010, we had contributed
approximately $86 million. Over the past few years, we have also provided $57 million in financing to GeoPark (of which approximately $32 million had been repaid at December 31, 2010) to support and accelerate GeoPark’s natural gas
exploration and development activities in southern Chile. GeoPark has agreed to supply us with all natural gas sourced from the Fell block in southern Chile under a ten-year exclusive supply arrangement that commenced in 2008. Approximately 60% of
total production at our Chilean facilities is currently being produced with natural gas supplied from the Fell and Dorado Riquelme blocks.
Other
investment activities are also supporting the acceleration of natural gas exploration and development in areas of southern Chile. In late 2007, the Government of Chile completed an international bidding round to assign oil and natural gas
exploration areas that lie close to our production facilities and announced the participation of several international oil and gas companies. The terms of the agreements from the bidding round require minimum investment commitments. To date, two
companies that participated in the bidding round have advised of gas discoveries and we expect first deliveries of gas from these new finds in 2011. We are participating in a consortium for two exploration blocks under this bidding round – the
Tranquilo and Otway blocks. The consortium includes Wintershall, GeoPark and Pluspetrol each having 25% participation and International Finance Corporation, member of the World Bank Group, and Methanex each having 12.5% participation. GeoPark is the
operator of both blocks.
Our methanol facilities in Chile produced 0.94 million tonnes of methanol in both 2010 and 2009. During 2010, natural gas
deliveries from ENAP were lower than 2009 primarily as a result of declines in deliverability from existing wells and this was offset by increased natural gas deliveries from the Dorado Riquelme block in 2010 compared with 2009. As we entered 2011,
we were operating one plant at approximately 65% capacity at our Chile site and the short-term outlook for gas supply in Chile continues to be challenging. While significant investments have been made in the last few years for natural gas
exploration and development in southern Chile, the timelines for a significant increase in gas deliveries to our plants are much longer than we originally anticipated. As a result, we expect there to be short-term pressure on gas supply in southern
Chile that could impact the operating rate of our Chile site, particularly in the southern hemisphere winter months when residential energy demand is at its peak.
Refer to the Risk Factors and Risk Management – Chile section on page 27 for more information.
Trinidad
Our equity ownership
of methanol facilities in Trinidad represents approximately 2.05 million tonnes of competitive cost annual capacity. The Titan and Atlas facilities in Trinidad are well located to supply markets in North America and Europe and are underpinned
by take-or-pay natural gas purchase agreements that expire in 2014 and 2024, respectively, where the gas price varies with methanol prices. These facilities produced a total of 1.78 million tonnes in both 2010 and 2009. For both 2010 and 2009,
we operated these facilities at below operating capacity due to planned and unplanned maintenance activities. During 2010, we experienced an outage at our Atlas facility that lasted approximately 60 days.
New Zealand
Our New Zealand facilities
provide competitive cost capacity and are underpinned by shorter term natural gas supply contracts. For both 2010 and 2009, we produced 0.83 million tonnes from one 0.85 million tonne per year plant at our Motunui facility in New Zealand.
We have natural gas contracts with a number of gas suppliers that will allow us to
|
|
|
| |
|
| |
|
14 METHANEX
Annual Report 2010 Management’s Discussion & Analysis |
continue to operate the 0.85 million tonne per year Motunui plant through 2012. We also have an additional 1.38 million tonnes per year of idled capacity in New Zealand, including a second
0.85 million tonne per year Motunui plant and a 0.53 million tonne per year plant at our nearby site in Waitara Valley. These facilities provide the potential to increase production in New Zealand depending on the methanol supply and demand
dynamics and the availability of economically priced natural gas feedstock.
We believe there has been continued improvement in the natural gas supply
outlook in New Zealand and we are focused on accessing additional natural gas supply to increase production in New Zealand. We continue to pursue opportunities to obtain economically priced natural gas with suppliers in New Zealand to underpin a
restart of a second plant. We are also pursuing natural gas exploration and development opportunities in the area close to our plants with the objective of obtaining long-term competitively priced supply. During 2010, we entered into an agreement
with Kea Exploration (Kea), an oil and gas exploration and development company, to explore areas of the Taranaki basin in New Zealand close to our plants. Under the agreement, funding will be shared 50% by both parties, and we will be entitled to
all natural gas deliveries from our participation at a price that is competitive to our other locations in Trinidad, Chile and Egypt. During 2010, we spent approximately $10 million on exploration activities with Kea. Under the agreement, there are
no minimum investment commitments and future contributions will be agreed by the parties on an ongoing basis.
Egypt
The new 1.26 million tonne per year methanol plant in Egypt is in the commissioning phase and produced first methanol in January 2011. The start-up coincided
with widespread anti-government protests and civil unrest in Egypt. For the safety and security of our employees, we took the decision to temporarily close our Cairo office and curtail the commissioning activities at the plant in Damietta, Egypt. As
conditions stabilized, we reopened our Cairo office and our plant in Damietta resumed operations to continue the start-up and commissioning process.
We
have a 60% interest in the facility and have marketing rights for 100% of the production. This facility is underpinned by a 25-year take-or-pay natural gas purchase agreement where the gas price varies with methanol prices. We believe this methanol
facility will further enhance our cost structure and our market position and it is well located to supply the European market.
Medicine Hat
In September 2010, we made the
decision to restart the 0.47 million tonne per year idled facility in Medicine Hat, Alberta, Canada. In support of the restart, we commenced a program to purchase natural gas on the Alberta gas market, and by the end of 2010 we had contracted
sufficient volumes of natural gas to meet approximately 80% of our requirements when operating at capacity for the period from start-up to October 2012. We are nearing completion of this restart project with production expected to commence in the
second quarter of 2011.
RESULTS OF OPERATIONS
|
|
|
|
|
|
|
|
|
| ($ MILLIONS) |
|
2010 |
|
|
2009 |
|
| Consolidated statements of income: |
|
|
|
|
|
|
|
|
| Revenue |
|
$ |
1,967 |
|
|
$ |
1,198 |
|
| Cost of sales and operating expenses |
|
|
(1,700 |
) |
|
|
(1,056 |
) |
| Adjusted EBITDA1 |
|
|
267 |
|
|
|
142 |
|
| Gain on sale of Kitimat assets |
|
|
22 |
|
|
|
– |
|
| Depreciation and amortization |
|
|
(131 |
) |
|
|
(118 |
) |
| Operating income1 |
|
|
158 |
|
|
|
24 |
|
| Interest expense |
|
|
(24 |
) |
|
|
(27 |
) |
| Interest and other income |
|
|
2 |
|
|
|
– |
|
| Income tax recovery (expense) |
|
|
(34 |
) |
|
|
4 |
|
| Net income |
|
$ |
102 |
|
|
$ |
1 |
|
| 1 |
These items are non-GAAP measures that do not have any standardized meaning prescribed by Canadian GAAP and therefore are unlikely to be comparable to similar
measures presented by other companies. Refer to the Supplemental Non-GAAP Measures section on page 45 for a description of each non-GAAP
measure and a reconciliation to the most comparable GAAP measure. |
|
|
|
| |
|
| Management’s Discussion & Analysis Annual Report 2010 METHANEX 15
|
|
|
For the year ended December 31, 2010, we recorded Adjusted EBITDA of $267 million and net income of $102 million
($1.09 per share on a diluted basis) and net income of $80 million ($0.85 per share on a diluted basis) before an after-tax gain of $22 million related to the sale of land and terminal facilities in Kitimat, Canada. This compares with Adjusted
EBITDA of $142 million and net income of $1 million ($0.01 per share on a diluted basis) for the year ended December 31, 2009.
The following
discussion on pages 16 – 20 provides a description of changes in revenue, Adjusted EBITDA, depreciation and amortization, interest expense, interest and other income, and income taxes for 2010 compared with 2009.
Revenue
There are many factors that impact
our global and regional revenue levels. The methanol business is a global commodity industry affected by supply and demand fundamentals. Due to the diversity of the end products in which methanol is used, demand for methanol largely depends upon
levels of industrial production, the value of energy and changes in general economic conditions, which can vary across the major international methanol markets.
Revenue for 2010 was $2.0 billion compared with $1.2 billion in 2009. The increase in revenue was primarily due to higher methanol
pricing and increased sales volumes in 2010 compared with 2009.
Entering 2010, global methanol demand had recovered to pre-recession levels. During
2010, global methanol demand was 45 million tonnes, a 13% increase over 2009. This was primarily driven by demand growth for both traditional and energy-related derivatives in Asia (particularly China). There were also increases in demand for
traditional methanol derivatives in other regions, including Europe, Latin America and North America. In anticipation of the start-up of the new methanol plant in Egypt, we grew our total sales volumes by approximately 16%, from 5.95 million
tonnes in 2009 to 6.93 million tonnes in 2010, and this increased our revenues by approximately $0.2 billion.
Methanol industry conditions were
balanced to tight in 2010, underpinned by strong global demand growth and supply constraints. While three new world-scale plants (in Brunei, Oman and Venezuela) with combined capacity totalling 2.8 million tonnes per year started up in 2010,
there were also some shut-ins of higher cost capacity and a number of planned and unplanned plant outages across the industry. These factors, combined with the continuing higher energy price environment, led to tight market conditions and a strong
methanol pricing environment throughout 2010. Our average realized price in 2010 was $306 per tonne compared with $225 per tonne in 2009, and this increased our revenues by approximately $0.6 billion.
The methanol industry is highly competitive and prices are affected by supply and demand fundamentals. We publish non-discounted reference prices for each major
methanol market and offer discounts to customers based on various factors. Our average non-discounted published reference price for 2010 was $356 per tonne compared with $252 per tonne in 2009. Our average realized price was approximately 14% and
11% lower than our average non-discounted published reference price for 2010 and 2009, respectively.
We have entered into long-term contracts for a
portion of our production volume with certain global customers where prices are either fixed or linked to costs plus a margin. Sales under these contracts represented approximately 8% of our total sales volumes in 2010 compared with 19% of our total
sales volumes in 2009. The difference between our average non-discounted published reference price and our average realized price is expected to narrow during periods of lower pricing.
|
|
|
| |
|
| |
|
16 METHANEX
Annual Report 2010 Management’s Discussion & Analysis |
Distribution of Revenue
The distribution of revenue for 2010 and 2009 is as follows:
|
|
|
|
|
|
|
|
|
|
|
|
|
|
|
|
|
| ($ MILLIONS, EXCEPT WHERE NOTED) |
|
2010 |
|
|
2009 |
|
| Canada |
|
$ |
142 |
|
|
|
7 |
% |
|
$ |
106 |
|
|
|
9 |
% |
| United States |
|
|
470 |
|
|
|
24 |
% |
|
|
355 |
|
|
|
30 |
% |
| Europe |
|
|
454 |
|
|
|
23 |
% |
|
|
198 |
|
|
|
17 |
% |
| China |
|
|
351 |
|
|
|
18 |
% |
|
|
195 |
|
|
|
16 |
% |
| Korea |
|
|
216 |
|
|
|
11 |
% |
|
|
136 |
|
|
|
11 |
% |
| Other Asia |
|
|
127 |
|
|
|
6 |
% |
|
|
83 |
|
|
|
7 |
% |
| Latin America |
|
|
207 |
|
|
|
11 |
% |
|
|
125 |
|
|
|
10 |
% |
| |
|
$ |
1,967 |
|
|
|
100 |
% |
|
$ |
1,198 |
|
|
|
100 |
% |
The primary changes in
the distribution of our revenue in 2010 compared with 2009 were an increase in the proportion of revenues earned in Europe and Asia and a decrease in the proportion of revenues earned in North America. This is primarily due to growth in sales
volumes in Europe and China, with sales volumes remaining relatively flat in North America in 2010 compared with 2009. Revenue in Europe increased as a proportion of our total revenue in 2010 compared with 2009 by 6%, primarily as a result of our
initiative to grow sales in this region in anticipation of the start-up of the 1.26 million tonne per year methanol facility in Egypt. We also grew sales volumes in China, resulting in a 2% increase in the proportion of total revenue earned in
China in 2010 compared with 2009. China continues to play an important role in the methanol industry as a substantial producer and consumer. A key part of our global leadership strategy is to increase our presence in China and the Asia Pacific
region.
Adjusted EBITDA
We
review our results of operations by analyzing changes in the components of Adjusted EBITDA. In addition to the methanol that we produce at our facilities, we also purchase and re-sell methanol produced by others and we sell methanol on a commission
basis. We analyze the results of all methanol sales together. The key drivers of change in our Adjusted EBITDA are average realized price, sales volume and cash costs (refer to the How We Analyze
Our Business section on page 12 for more information).
2010 Adjusted EBITDA was $267 million
compared with $142 million in 2009. The increase in Adjusted EBITDA of $125 million resulted from changes in the following:
|
|
|
|
|
| ($ MILLIONS) |
|
2010 VS. 2009 |
|
| Average realized price |
|
$ |
520 |
|
| Sales volume |
|
|
62 |
|
| Total cash
costs1 |
|
|
(457 |
) |
| Increase in Adjusted EBITDA |
|
$ |
125 |
|
| 1 |
Includes cash costs related to both Methanex-produced methanol and purchased methanol, as well as consolidated selling, general and administrative expenses and
fixed storage and handling costs. |
Average Realized Price
Our average realized price for the year ended December 31, 2010 was $306 per tonne compared with $225 per tonne for 2009, and this increased our revenues by
$520 million (refer to the Revenue section on page 16 for more information).
Sales Volumes
Total methanol sales volumes, excluding commission sales volumes, for the year
ended December 31, 2010 were 1.11 million tonnes higher than in 2009, which resulted in higher Adjusted EBITDA of $62 million.
Total Cash Costs
The primary driver of
changes in our total cash costs are changes in the cost of methanol we produce at our facilities and changes in the cost of methanol we purchase from others. Our production facilities are underpinned by natural gas purchase agreements with pricing
terms that include base and variable price components. We supplement our production with methanol produced by others through methanol offtake contracts and purchases on the spot market to meet
|
|
|
| |
|
| Management’s Discussion & Analysis Annual Report 2010 METHANEX 17
|
|
|
customer needs and support our marketing efforts within the major global markets. We have adopted the first-in, first-out method of accounting for inventories and it generally takes between 30
and 60 days to sell the methanol we produce or purchase. Accordingly, the changes in Adjusted EBITDA as a result of changes in natural gas costs and purchased methanol costs will depend on changes in methanol pricing and the timing of inventory
flows.
Cash costs for produced methanol and purchased methanol were $457 million higher in 2010 than in 2009. The primary changes in cash costs were as
follows:
|
|
|
|
|
| ($ MILLIONS) |
|
2010 VS. 2009 |
|
| Natural gas costs on sales of produced methanol |
|
$ |
98 |
|
| Purchased methanol costs |
|
|
223 |
|
| Proportion of purchased methanol sales |
|
|
90 |
|
| Stock-based compensation |
|
|
19 |
|
| Other, net |
|
|
27 |
|
| Increase in total cash costs |
|
$ |
457 |
|
Natural gas costs on sales of produced methanol
Natural gas is the primary feedstock at our
methanol production facilities and is the most significant component of our cost structure. The natural gas supply contracts for our production facilities in Chile, Trinidad and New Zealand include base and variable price components to reduce our
commodity price risk exposure. The variable price component of each gas contract is adjusted by a formula related to methanol prices above a certain level. We believe this pricing relationship enables these facilities to be competitive throughout
the methanol price cycle. The higher average methanol prices in 2010 increased our natural gas costs per tonne for produced methanol and this increased cash costs by approximately $98 million compared with 2009. For additional information regarding
our natural gas agreements refer to the Summary of Contractual Obligations and Commercial Commitments section on page 24.
Purchased methanol costs
A key element of
our corporate strategy is global leadership, and as such we have built a leading market position in each of the major global markets where methanol is sold. We supplement our production with purchased methanol through methanol offtake contracts and
on the spot market to meet customer needs and support our marketing efforts within the major global markets. In structuring offtake agreements, we look for opportunities that provide synergies with our existing supply chain and market position. Our
strong global supply chain allows us to take advantage of unique opportunities to add value through logistics cost savings and purchase methanol in the lowest-cost region. The cost of purchased methanol consists principally of the cost of the
methanol itself, which is directly related to the price of methanol at the time of purchase. The higher average methanol prices in 2010 increased the cost of purchased methanol per tonne and this increased cash costs by approximately $223 million
compared with 2009.
Proportion of purchased methanol sales
The cost of purchased methanol is directly linked to the selling price for methanol at the time of purchase and the cost of purchased methanol is generally higher than the cost of produced methanol. Accordingly, an
increase in the proportion of purchased methanol sales results in an increase in our overall cost structure for a given period. The proportion of purchased methanol sales for the year ended December 31, 2010 was higher compared with 2009 and
this increased cash costs by $89 million. The increase in the proportion of purchased methanol sales in 2010 compared with 2009 was primarily due to the increase in sales volumes in anticipation of the start-up of the Egypt methanol facility. When
the Egypt and Medicine Hat methanol facilities commence production in 2011, we expect the proportion of purchased methanol to decrease.
Stock-based compensation
We grant
stock-based awards as an element of compensation. Stock-based awards granted include stock options, share appreciation rights or tandem share appreciation rights, deferred share units, restricted share units and performance share units.
|
|
|
| |
|
| |
|
18 METHANEX
Annual Report 2010 Management’s Discussion & Analysis |
For stock options, the cost is measured based on an estimate of the fair value at the date of grant and this
grant-date fair value is recognized as compensation expense over the related service period. Accordingly, stock-based compensation expense associated with stock options will not vary significantly from period to period. Commencing in 2010, we
granted share appreciation rights (SARs) and tandem share appreciation rights (TSARs) to replace grants of stock options as a result of our initiative to reduce dilution to shareholders. SARs and TSARs are units that grant the holder the right to
receive a cash payment upon exercise for the difference between the market price of the Company’s common shares and the exercise price, which is determined at the date of grant. SARs and TSARs are measured based on the intrinsic value, which is
defined as the amount by which the market value of common shares exceeds the exercise price.
Deferred, restricted and performance share units are grants
of notional common shares that are redeemable for cash upon vesting based on the market value of the Company’s common shares and are non-dilutive to shareholders. Performance share units have an additional feature where the ultimate number of
units that vest will be determined by the Company’s total shareholder return in relation to a predetermined target over the period to vesting. The number of units that will ultimately vest will be in the range of 50% to 120% of the original
grant. For deferred, restricted and performance share units, the fair value is initially measured at the grant date and subsequently remeasured based on the market value of common shares.
For all the stock-based awards with the exception of stock options, the initial value and any subsequent change in value due to changes in the market value of
common shares is recognized in earnings over the related service period for the proportion of the service that has been rendered at each reporting date. Accordingly, stock-based compensation associated with these stock-based awards may vary
significantly from period to period as a result of changes in the share price.
Stock-based compensation expense for the year ended December 31,
2010 was $31 million compared with $12 million for 2009. The increase in stock-based compensation of $19 million during 2010 was primarily due to the impact of the increase in the share price during the year from $19.49 per share to $30.40 per
share. This resulted in a higher charge of approximately $13 million from an increase in the fair value of deferred, restricted and performance share units and a higher charge of approximately $3 million related to the value of SARs and TSARs.
Additionally, the increase in share price resulted in a higher charge of approximately $3 million due to an increase in the estimated number of performance share units that will ultimately vest.
Other, net
Our investment in global
distribution and supply infrastructure includes a dedicated fleet of ocean-going vessels. We utilize these vessels to enhance value to customers by providing reliable and secure supply and to optimize supply chain costs overall. Due to the
significant reduction of production levels in Chile since mid-2007, we have had excess shipping capacity that is subject to fixed time charter costs. We have been successful in mitigating some of these costs by entering into sub-charters and
third-party backhaul arrangements. However, excess capacity in the global tanker market over the last two years has made it more difficult to mitigate these costs. For the year ended December 31, 2010 compared with 2009, ocean freight and other
logistics costs were higher by $16 million primarily as a result of lower backhaul cost recoveries and higher bunker fuel costs.
Selling, general and
administrative expenses were higher by $11 million in 2010 compared with 2009 as a result of higher costs associated with employee training, travel and other initiatives combined with the negative impact of the weakening US dollar in 2010 on costs
incurred in other currencies. Selling, general and administrative costs returned to more normalized levels in 2010 following spending deferrals and reductions in 2009 as a result of economic recession.
Depreciation and Amortization
Depreciation
and amortization was $131 million for the year ended December 31, 2010 compared with $118 million for 2009. The increase in depreciation and amortization expense for 2010 compared with 2009 was primarily due to the inclusion of depletion
charges associated with our oil and gas investment in Chile. Upon receipt of final approval from the Government of Chile in late 2009, we adopted the full cost methodology for accounting for oil and gas exploration costs associated with our 50%
participation in the Dorado Riquelme block in southern Chile (refer to the Production Summary section on page 13 for more information). Under
these accounting standards, cash investments in the block are initially capitalized and are recorded to earnings through non-cash depletion charges as natural gas is produced from the block.
|
|
|
| |
|
| Management’s Discussion & Analysis Annual Report 2010 METHANEX 19
|
|
|
Interest Expense
|
|
|
|
|
|
|
|
|
| ($ MILLIONS) |
|
2010 |
|
|
2009 |
|
| Interest expense before capitalized interest |
|
$ |
62 |
|
|
$ |
60 |
|
| Less capitalized interest related to Egypt plant under construction |
|
|
(38 |
) |
|
|
(33 |
) |
| Interest expense |
|
$ |
24 |
|
|
$ |
27 |
|
Interest expense
before capitalized interest in 2010 was $62 million compared with $60 million in 2009. Interest expense before capitalized interest was higher in 2010 primarily as a result of higher debt balances related to our methanol project in Egypt. We have
limited recourse debt facilities of $530 million for this 1.26 million tonne per year methanol facility that we are developing with partners. Interest costs related to the project are capitalized.
Interest and Other Income
Interest and
other income for the year ended December 31, 2010 was $2 million compared with nil for 2009. The increase in interest and other income during 2010 compared with 2009 was primarily due to the impact of changes in foreign exchange rates.
Income Taxes
We recorded an
income tax expense of $34 million for the year ended December 31, 2010 compared with an income tax recovery of $4 million for 2009. The effective tax rate for the year ended December 31, 2010 was approximately 25%. Included in income
before tax for 2010 was a before and after-tax gain of $22.2 million on the sale of our land and terminal assets in Kitimat, Canada. Excluding this item, the effective tax rate for 2010 was approximately 30%.
The statutory tax rate in Chile and Trinidad, where we earn a substantial portion of pre-tax earnings, is 35%. Our Atlas facility in Trinidad has partial relief
from corporate income tax until 2014. In Chile, the tax rate consists of a first tier tax that is payable when income is earned and a second tier tax that is due when earnings are distributed from Chile. The second category tax is initially recorded
as future income tax expense and is subsequently reclassified to current income tax expense when earnings are distributed. Accordingly, the ratio of current income tax expense to total income tax expense is highly dependent on the level of cash
distributed from Chile.
For additional information regarding income taxes, refer to note 13 of our 2010 consolidated financial statements.
|
|
|
| |
|
| |
|
20 METHANEX
Annual Report 2010 Management’s Discussion & Analysis |
LIQUIDITY AND CAPITAL RESOURCES
|
|
|
|
|
|
|
|
|
| ($ MILLIONS) |
|
2010 |
|
|
2009 |
|
| Cash flows from operating activities: |
|
|
|
|
|
|
|
|
| Cash flows from operating activities1 |
|
$ |
252 |
|
|
$ |
128 |
|
| Changes in non-cash working capital |
|
|
(99 |
) |
|
|
(18 |
) |
|
|
|
153 |
|
|
|
110 |
|
| Cash flows from investing activities: |
|
|
|
|
|
|
|
|
| Property, plant and equipment |
|
|
(58 |
) |
|
|
(61 |
) |
| Egypt plant under construction |
|
|
(86 |
) |
|
|
(262 |
) |
| Oil and gas assets |
|
|
(24 |
) |
|
|
(23 |
) |
| GeoPark financing, net |
|
|
20 |
|
|
|
(9 |
) |
| Proceeds on sale of assets |
|
|
32 |
|
|
|
– |
|
| Other, net |
|
|
(1 |
) |
|
|
3 |
|
| Changes in non-cash working capital |
|
|
(2 |
) |
|
|
(28 |
) |
|
|
|
(119 |
) |
|
|
(380 |
) |
| Cash flows from financing activities: |
|
|
|
|
|
|
|
|
| Dividend payments |
|
|
(57 |
) |
|
|
(57 |
) |
| Proceeds from limited recourse debt |
|
|
68 |
|
|
|
151 |
|
| Equity contributions by non-controlling interest |
|
|
23 |
|
|
|
45 |
|
| Repayment of limited recourse debt |
|
|
(31 |
) |
|
|
(15 |
) |
| Settlements on interest rate swap contracts |
|
|
(16 |
) |
|
|
(6 |
) |
| Proceeds on issue of shares on exercise of stock options |
|
|
9 |
|
|
|
– |
|
| Other, net |
|
|
(6 |
) |
|
|
(6 |
) |
| |
|
|
(10 |
) |
|
|
112 |
|
| Increase (decrease) in cash and cash equivalents |
|
|
24 |
|
|
|
(158 |
) |
| Cash and cash equivalents, end of year |
|
$ |
194 |
|
|
$ |
170 |
|
| 1 |
Before changes in non-cash working capital. |
Cash Flow Highlights
Cash Flows from Operating Activities
Cash flows from operating activities for the year ended December 31, 2010 were $153 million compared with $110 million for 2009. The change in cash flows from
operating activities is explained by changes in Adjusted EBITDA after excluding non-cash expenses such as stock-based compensation expense and other items (net of any related cash payments), and changes in interest expense, interest and other
income, current taxes and non-cash working capital. The following table provides a summary of these items for 2010 and 2009.
|
|
|
|
|
|
|
|
|
| ($ MILLIONS) |
|
2010 |
|
|
2009 |
|
| Adjusted EBITDA |
|
$ |
267 |
|
|
$ |
142 |
|
| Stock-based compensation expense |
|
|
31 |
|
|
|
12 |
|
| Other non-cash items (net of cash payments) |
|
|
2 |
|
|
|
(4 |
) |
| Interest expense |
|
|
(24 |
) |
|
|
(27 |
) |
| Interest and other income |
|
|
3 |
|
|
|
– |
|
| Current taxes |
|
|
(27 |
) |
|
|
6 |
|
|
|
|
252 |
|
|
|
129 |
|
| Changes in non-cash working capital: |
|
|
|
|
|
|
|
|
| Receivables |
|
|
(62 |
) |
|
|
(43 |
) |
| Inventories |
|
|
(55 |
) |
|
|
5 |
|
| Prepaid expenses |
|
|
(3 |
) |
|
|
(7 |
) |
| Accounts payable and accrued liabilities |
|
|
21 |
|
|
|
26 |
|
| |
|
|
(99 |
) |
|
|
(19 |
) |
| Cash flows from operating activities |
|
$ |
153 |
|
|
$ |
110 |
|
Cash flows from
operating activities before changes in non-cash working capital for the year ended December 31, 2010 were $252 million compared with $129 million for 2009. Adjusted EBITDA was higher by $125 million for the year ended
|
|
|
| |
|
| Management’s Discussion & Analysis Annual Report 2010 METHANEX 21
|
|
|
December 31, 2010 compared with 2009 and this was the primary driver of the increase in cash flows from operating activities before changes in non-cash working capital (refer to the Adjusted EBITDA section on page 17 for a discussion of changes in Adjusted EBITDA). Non-cash stock-based compensation expense included in Adjusted EBITDA for
the year ended December 31, 2010 was higher compared with 2009 by $19 million primarily due to the impact of the increase in our share price during 2010 (refer to the Stock-based
Compensation section on page 18 for more information). Cash flows from operating activities were lower by $33 million for the year ended December 31, 2010 compared with 2009 due to higher
current taxes as a result of higher income levels in 2010.
For the year ended December 31, 2010, non-cash working capital increased by $99 million,
resulting in a decrease in cash flows from operating activities. The primary changes in non-cash working capital for 2010 were increases in receivables and inventories of $62 million and $55 million, respectively, offset by an increase in accounts
payable and accrued liabilities of $21 million. The increase in receivables was primarily due to the impact of higher methanol pricing and higher sales volumes on trade receivables at December 31, 2010 compared with December 31, 2009. The
increase in inventories was also primarily due to the impact of higher methanol pricing on both produced and purchased ending inventory as well as higher ending inventory volumes at December 31, 2010 compared with December 31, 2009. During
2010, we grew total sales volumes by approximately 16% from 5.95 million tonnes in 2009 to 6.93 million tonnes in 2010, and as a result we had a higher volume of trade receivables and higher ending inventory at December 31, 2010
compared with December 31, 2009 to support these sales. The increase in accounts payable and accrued liabilities at December 31, 2010 compared with December 31, 2009 was primarily as a result of the impact of higher methanol pricing
on natural gas payables and the timing of other payments.
Cash Flows from Investing Activities
In 2010, our priorities for allocating capital were funding the completion of the methanol project in Egypt, supporting natural gas development in Chile and
investing to maintain the reliability of our existing plants.
During 2010, additions to property, plant and equipment, which include turnarounds,
catalyst and other capital expenditures, were $58 million. This includes approximately $12 million associated with major maintenance activities at our Trinidad facilities with the remaining capital expenditure of approximately $27 million relating
primarily to maintenance costs at our plants in Chile and New Zealand. In 2010, approximately $10 million was also incurred for the restart of our Medicine Hat, Alberta plant. Included in additions to property, plant and equipment for 2010 is $9
million for the acquisition of an ocean-going vessel that we acquired through a 50% interest in a joint venture.
During 2010, total capital expenditures
were $86 million for the development and construction of the 1.26 million tonne per year methanol plant in Egypt.
We have an agreement with ENAP to
invest in natural gas exploration and development in the Dorado Riquelme exploration block in southern Chile. Under the arrangement, we fund a 50% participation in the block and receive 100% of the natural gas produced in the block. In 2010, we
contributed $24 million and to December 31, 2010, we had made total contributions of approximately $86 million.
We also have agreements with
GeoPark under which we have provided $57 million in financing to support and accelerate GeoPark’s natural gas exploration and development activities in southern Chile. During 2010, GeoPark repaid approximately $20 million of this
financing, $15 million of which was funded through proceeds of a debt financing, bringing cumulative repayments for this financing to $32 million as at December 31, 2010. We have no further obligations to provide funding to GeoPark.
During 2010, we sold our land and terminal facilities at the Kitimat, Canada site and received proceeds from this sale of $32 million.
We are pursuing natural gas exploration and development opportunities in New Zealand. During 2010, we entered into an agreement with Kea to explore areas of the
Taranaki basin in New Zealand close to our plants. Under the agreement, funding will be shared 50% by both parties, and we will be entitled to all natural gas deliveries from our participation at a price that is competitive to our other locations in
Trinidad, Chile and Egypt. During 2010, we spent approximately $10 million on exploration activities with Kea.
|
|
|
| |
|
| |
|
22 METHANEX
Annual Report 2010 Management’s Discussion & Analysis |
During 2010, we sold our 20% equity interest in Xinneng (Zhangjiagang) Energy Co. Ltd, a company that owns a DME
production facility in China, for approximately $10 million to the ENN Group with no gain or loss on sale. Under the arrangement, we continue to supply all of the methanol requirements for the DME facility under an exclusive supply arrangement.
Cash Flows from Financing Activities
During 2010, we paid our regular quarterly dividend of $0.155 per share and made total dividend payments of $57 million, the same amount as in 2009.
We own 60% of the 1.26 million tonne per year Egypt methanol facility and we account for this investment using consolidation accounting, which results in 100% of the assets and liabilities being included in
our financial statements with the other investors’ interest in the project being presented as “non-controlling interest”. We have limited recourse debt facilities totalling $530 million for the methanol facility in Egypt. During 2010,
a total of $58 million of this limited recourse debt was drawn for construction activities and a total of $23 million was funded by equity contributions from our partners in the project. At December 31, 2010, the full amount of $530 million had
been drawn under these facilities. The remaining proceeds on limited recourse debt of $10 million relates to debt facilities obtained on the acquisition of an ocean-going vessel during 2010.
We repaid $15 million in principal on our Atlas and other limited recourse debt facilities in each of 2010 and 2009. On September 30, 2010, we also made the first debt principal payment of $16 million on the
Egypt limited recourse debt facilities.
The Egypt limited recourse debt facilities bear interest at LIBOR plus a spread. We have entered into interest
rate swap contracts to swap the LIBOR-based interest payments for an average aggregated fixed rate of 4.8% plus a spread on approximately 75% of the Egypt limited recourse debt facilities for the period to March 31, 2015 (refer to the Financial Instruments section on page 26 for more information). The cash settlements associated with these interest rate swap contracts during 2010 and 2009
were approximately $16 million and $6 million, respectively.
During 2010, we received proceeds of $9 million on the issue of 0.5 million common
shares on the exercise of stock options.
Liquidity and Capitalization
We maintain conservative financial policies and focus on maintaining our financial strength and flexibility through prudent financial management. Our objectives in managing liquidity and capital are to provide
financial capacity and flexibility to meet our strategic objectives, to provide an adequate return to shareholders commensurate with the level of risk and to return excess cash through a combination of dividends and share repurchases.
The following table provides information on our liquidity and capitalization position as at December 31, 2010 and December 31, 2009, respectively:
|
|
|
|
|
|
|
|
|
| ($ MILLIONS, EXCEPT WHERE NOTED) |
|
2010 |
|
|
2009 |
|
| Liquidity: |
|
|
|
|
|
|
|
|
| Cash and cash equivalents |
|
$ |
194 |
|
|
$ |
170 |
|
| Undrawn Egypt limited recourse debt facilities |
|
|
– |
|
|
|
58 |
|
| Undrawn credit facilities |
|
|
200 |
|
|
|
200 |
|
| Total liquidity |
|
$ |
394 |
|
|
$ |
428 |
|
| Capitalization: |
|
|
|
|
|
|
|
|
| Unsecured notes |
|
$ |
348 |
|
|
$ |
347 |
|
| Limited recourse debt facilities, including current portion |
|
|
599 |
|
|
|
567 |
|
| Total debt |
|
|
947 |
|
|
|
914 |
|
| Non-controlling interest |
|
|
146 |
|
|
|
133 |
|
| Shareholders’ equity |
|
|
1,277 |
|
|
|
1,236 |
|
| Total capitalization |
|
$ |
2,370 |
|
|
$ |
2,283 |
|
| Total debt to capitalization1 |
|
|
40 |
% |
|
|
40 |
% |
| Net debt to
capitalization2 |
|
|
35 |
% |
|
|
35 |
% |
| 1 |
Defined as total debt divided by total capitalization. |
| 2 |
Defined as total debt less cash and cash equivalents divided by total capitalization less cash and cash equivalents. |
|
|
|
| |
|
| Management’s Discussion & Analysis Annual Report 2010 METHANEX 23
|
|
|
We manage our liquidity and capital structure and make adjustments to it in light of changes to economic conditions,
the underlying risks inherent in our operations and the capital requirements to maintain and grow our business. The strategies we employ include the issue or repayment of general corporate debt, the issue of project debt, the issue of equity, the
payment of dividends and the repurchase of shares.
We are not subject to any statutory capital requirements and have no commitments to sell or otherwise
issue common shares except pursuant to outstanding employee stock options.
We operate in a highly competitive commodity industry and believe that it is
appropriate to maintain a conservative balance sheet and retain financial flexibility. At December 31, 2010, we had a strong balance sheet with a cash balance of $194 million, a $200 million undrawn credit facility and no re-financing
requirements until mid-2012. We invest cash only in highly rated instruments that have maturities of three months or less to ensure preservation of capital and appropriate liquidity.
At December 31, 2010, our long-term debt obligations included $350 million in unsecured notes ($200 million that matures in 2012 and $150 million that matures in 2015), $514 million related to the Egypt
limited recourse debt facilities and $81 million related to our Atlas limited recourse debt facilities.
We have covenant and default provisions on
our long-term debt obligations, including certain conditions of the Egypt limited recourse debt facilities associated with completion of plant construction and commissioning. We also have certain covenants that could restrict access to the credit
facility. For additional information regarding long-term debt, refer to note 8 of our consolidated financial statements.
Our planned capital
maintenance expenditures directed towards major maintenance, turnarounds and catalyst changes for current operations are estimated to be approximately $80 million for the period to the end of 2012.
The estimated capital cost to restart the Medicine Hat plant is approximately $40 million, of which $10 million was incurred in 2010 and the remaining $30 million
is expected to be incurred in the first half of 2011.
As previously discussed, we are focused on accessing natural gas to increase production at our
existing sites in Chile and New Zealand. We are working with ENAP in the Dorado Riquelme block in southern Chile and with Kea in the Taranaki basin in New Zealand. For 2011, we expect our share of total contributions for oil and gas exploration
and development in Chile and New Zealand to be approximately $60-70 million.
We believe we are well positioned to meet our financial
commitments and continue to invest to grow our business.
Summary of Contractual Obligations and Commercial Commitments
A summary of the estimated amount and estimated timing of cash flows related to our contractual obligations and commercial commitments as at
December 31, 2010 is as follows:
|
|
|
|
|
|
|
|
|
|
|
|
|
|
|
|
|
|
|
|
|
| ($ MILLIONS) |
|
2011 |
|
|
2012-2013 |
|
|
2014-2015 |
|
|
AFTER 2015 |
|
|
TOTAL |
|
| Long-term debt repayments |
|
$ |
50 |
|
|
|
309 |
|
|
|
254 |
|
|
|
352 |
|
|
$ |
965 |
|
| Long-term debt interest obligations |
|
|
57 |
|
|
|
81 |
|
|
|
48 |
|
|
|
54 |
|
|
|
240 |
|
| Repayment of other long-term liabilities |
|
|
21 |
|
|
|
34 |
|
|
|
4 |
|
|
|
46 |
|
|
|
105 |
|
| Natural gas and other |
|
|
237 |
|
|
|
390 |
|
|
|
262 |
|
|
|
1,424 |
|
|
|
2,313 |
|
| Operating lease commitments |
|
|
142 |
|
|
|
241 |
|
|
|
162 |
|
|
|
409 |
|
|
|
954 |
|
| |
|
$ |
507 |
|
|
|
1,055 |
|
|
|
730 |
|
|
|
2,285 |
|
|
$ |
4,577 |
|
The above table
does not include costs for planned capital maintenance expenditures, costs for purchased methanol under offtake contracts or any obligations with original maturities of less than one year. We have supply contracts with Argentinean suppliers for
natural gas sourced from Argentina for a significant portion of the capacity of our facilities in Chile. These contracts have expiration dates between 2017 and 2025 and represent a total potential future commitment of approximately $1 billion at
December 31, 2010. We have excluded these potential purchase obligations from the table above. Since June 2007, our natural gas suppliers from Argentina have curtailed all gas supply to our plants in Chile in response to various actions by the
Argentinean government, including imposing a large increase to the duty on natural gas exports. Under the current circumstances, we do not expect to receive any further natural gas supply from Argentina.
Long-Term Debt Repayments and Interest Obligations
We have $200 million of unsecured notes that mature in 2012 and $150 million of unsecured notes that mature in 2015. The remaining debt repayments represent the total expected principal repayments relating to the
Egypt project debt, our
|
|
|
| |
|
| |
|
24 METHANEX
Annual Report 2010 Management’s Discussion & Analysis |
proportionate share of total expected principal repayments related to the Atlas limited recourse debt facilities. Interest obligations related to variable interest rate long-term debt were
estimated using current interest rates in effect at December 31, 2010. For additional information, refer to note 8 of our 2010 consolidated financial statements.
Repayments of Other Long-Term Liabilities
Repayments of other long-term liabilities represent
contractual payment dates or, if the timing is not known, we have estimated the timing of repayment based on management’s expectations.
Natural Gas and Other
We have commitments under take-or-pay contracts to purchase annual
quantities of natural gas and to pay for transportation capacity related to this natural gas. We also have take-or-pay contracts to purchase oxygen and other feedstock requirements. Take-or-pay means that we are obliged to pay for the supplies
regardless of whether we take delivery. Such commitments are in the methanol industry. These contracts generally provide a quantity that is subject to take-or-pay terms that is lower than the maximum quantity that we are entitled to purchase. The
amounts disclosed in the table represent only the minimum take-or-pay quantity.
Most of the natural gas supply contracts for our facilities in Chile,
Trinidad, New Zealand and the natural gas supply contract for the new methanol plant in Egypt are take-or-pay contracts denominated in United States dollars and include base and variable price components to reduce our commodity price risk exposure.
The variable price component of each natural gas contract is adjusted by a formula related to methanol prices above a certain level. We believe this pricing relationship enables these facilities to be competitive at all points in the methanol price
cycle and provides gas suppliers with attractive returns. The amounts disclosed in the table for these contracts represent only the base price component.
In support of the restart of the Medicine Hat plant, we commenced a program to purchase natural gas on the Alberta gas market and have contracted sufficient volumes
of natural gas to meet 80% of our requirements when operating at capacity for the period from start-up to October 2012. In the above table, we have included these natural gas commitments at the contractual volumes and prices.
The natural gas commitments for our Chile facilities included in the above table relate to our natural gas contracts with ENAP, the Chilean state-owned energy
company. These contracts represent approximately 20% of the natural gas requirements for our Chile facilities operating at capacity. These contracts have a base component and variable price component determined with reference to 12-month
trailing average published industry methanol prices and have expiration dates that range from 2017 to 2025. Under these contracts with ENAP, we have rights to receive quantities of “make-up gas” if ENAP fails to deliver quantities of
gas that it is obligated to deliver to us. Over the past few years, ENAP has delivered less than the full amount of natural gas that it was required to deliver under these contracts.
We have an agreement with ENAP to accelerate natural gas exploration and development in the Dorado Riquelme exploration block in southern Chile. Under the arrangement, we fund a 50% participation in the block and
take all natural gas produced from the block. We also have an arrangement with GeoPark to purchase all natural gas produced by GeoPark from the Fell block in southern Chile for a 10-year period. The pricing under this arrangement has a base
component and a variable component determined with reference to a three-month trailing average of methanol prices. We cannot determine the amount of natural gas that will be purchased under these agreements in the future, and accordingly, no amounts
have been included in the above table.
In Trinidad, we also have take-or-pay supply contracts for natural gas, oxygen and other feedstock requirements
and these are included in the above table. The variable component of our natural gas contracts in Trinidad is determined with reference to average published industry methanol prices each quarter and the base prices increase over time. The natural
gas and oxygen supply contracts for Titan and Atlas expire in 2014 and 2024, respectively.
In New Zealand, we have take-or-pay supply contracts that
have a variable pricing component and these are included in the above table. These contracts are with a number of suppliers, which, together with some spot purchases of natural gas, will enable us to continue operating our 0.85 million tonne per
year Motunui plant until the end of 2012.
We have a 25 year, take-or-pay natural gas supply agreement for a 1.26 million tonne per year methanol plant
that we have constructed in Egypt. The plant is in the commissioning phase and produced first methanol in January 2011. In March 2011, EGAS (the gas supplier to EMethanex) requested us to enter into discussions concerning the gas supply agreement
based
|
|
|
| |
|
| Management’s Discussion & Analysis Annual Report 2010 METHANEX 25
|
|
|
on a 2008 government declaration concerning natural gas pricing. The Company met with EGAS concerning this issue and based on these discussions, we do not believe that this issue will result in a
material adverse impact on the anticipated results of operations from the Egypt plant or on our financial position. Any ultimate outcome of this issue would be subject to ratification by various parties.
We have marketing rights for 100% of the production from our jointly owned plants (the Atlas plant in Trinidad in which we have a 63.1% interest and the new plant
in Egypt in which we have a 60% interest), which results in purchase commitments of an additional 1.17 million tonnes per year of methanol offtake supply when these plants operate at capacity. At December 31, 2010, we also have annual
methanol purchase commitments with other suppliers under offtake contracts for approximately 0.38 million tonnes for 2011 and approximately 0.27 million tonnes for 2012. The pricing under the purchase commitments related to our 100% marketing rights
from our jointly owned plants and the purchase commitments with other suppliers is referenced to pricing at the time of purchase or sale, and accordingly, no amounts have been included in the above table.
Operating Lease Commitments
The majority of
these commitments relate to time charter vessel agreements with terms of up to 15 years. Time charter vessels typically meet most of our ocean shipping requirements.
Off-Balance Sheet Arrangements
At December 31, 2010, we did not have any off-balance
sheet arrangements, as defined by applicable securities regulators in Canada and the United States, that have, or are reasonably likely to have, a current or future material effect on our results of operations or financial condition.
Financial Instruments
A financial
instrument is any contract that gives rise to a financial asset of one party and a financial liability or equity instrument of another party. Financial instruments are either measured at amortized cost or fair value. Held-to-maturity investments,
loans and receivables and other financial liabilities are measured at amortized cost. Held for trading financial assets and liabilities and available-for-sale financial assets are measured on the balance sheet at fair value. From time to time we
enter into derivative financial instruments to limit our exposure to foreign exchange volatility and to variable interest rate volatility and to contribute towards achieving cost structure and revenue targets. Until settled, the fair value of
derivative financial instruments will fluctuate based on changes in foreign exchange rates and variable interest rates. Derivative financial instruments are classified as held for trading and are recorded on the balance sheet at fair value unless
exempted. Changes in fair value of derivative financial instruments are recorded in earnings unless the instruments are designated as cash flow hedges.
The following table shows the carrying value of each of our categories of financial assets and liabilities and the related balance sheet item as at
December 31, 2010 and December 31, 2009, respectively:
|
|
|
|
|
|
|
|
|
| ($ MILLIONS) |
|
2010 |
|
|
2009 |
|
| Financial assets: |
|
|
|
|
|
|
|
|
| Held for trading financial assets: |
|
|
|
|
|
|
|
|
| Cash and cash equivalents |
|
$ |
194 |
|
|
$ |
170 |
|
| Debt service reserve accounts included in other assets |
|
|
12 |
|
|
|
13 |
|
|
|
|
| Loans and receivables: |
|
|
|
|
|
|
|
|
| Receivables, excluding current portion of GeoPark financing |
|
|
316 |
|
|
|
249 |
|
| GeoPark financing, including current portion |
|
|
26 |
|
|
|
46 |
|
| |
|
$ |
548 |
|
|
$ |
478 |
|
| Financial liabilities: |
|
|
|
|
|
|
|
|
| Other financial liabilities: |
|
|
|
|
|
|
|
|
| Accounts payable and accrued liabilities |
|
$ |
251 |
|
|
$ |
233 |
|
| Long-term debt, including current portion |
|
|
947 |
|
|
|
914 |
|
|
|
|
| Held for trading financial liabilities: |
|
|
|
|
|
|
|
|
| Derivative instruments designated as cash flow hedges |
|
|
43 |
|
|
|
33 |
|
| |
|
$ |
1,241 |
|
|
$ |
1,180 |
|
|
|
|
| |
|
| |
|
26 METHANEX
Annual Report 2010 Management’s Discussion & Analysis |
At December 31, 2010, all of the financial instruments were recorded on the balance sheet at amortized cost with
the exception of cash and cash equivalents, derivative financial instruments and debt service reserve accounts included in other assets, which were recorded at fair value.
The Egypt limited recourse debt facilities bear interest at LIBOR plus a spread. We have entered into interest rate swap contracts to swap the LIBOR-based interest payments for an average aggregated fixed rate of
4.8% plus a spread on approximately 75% of the Egypt limited recourse debt facilities for the period to March 31, 2015.
These interest rate swaps
had outstanding notional amounts of $368 million as at December 31, 2010. The notional amount decreases over the expected repayment of the Egypt limited recourse debt facilities. At December 31, 2010, these interest rate swap contracts had
a negative fair value of $43 million (December 31, 2009 – $33 million) recorded in other long-term liabilities. The fair value of these interest rate swap contracts will fluctuate until maturity. Changes in the fair value of derivative
financial instruments designated as cash flow hedges have been recorded in other comprehensive income.
RISK FACTORS AND RISK
MANAGEMENT
We are subject to risks that require prudent risk management. We believe the following risks, in addition to those described in the
Critical Accounting Estimates section on page 35, to be among the most important for understanding the issues that face our business and our
approach to risk management.
Security of Natural Gas Supply and Price
We use natural gas as the principal feedstock for producing methanol and it accounts for a significant portion of our operating costs. Accordingly, our results from operations depend in large part on the
availability and security of supply and the price of natural gas. If, for any reason, we are unable to obtain sufficient natural gas for any of our plants on commercially acceptable terms or we experience interruptions in the supply of contracted
natural gas, we could be forced to curtail production or close such plants, which could have an adverse effect on our results of operations and financial condition.
Chile
We have four methanol plants in Chile with a total production capacity of
3.8 million tonnes per year. Although we have long-term natural gas supply contracts in place that entitle us to receive a significant quantity of our total natural gas requirements in Chile from suppliers in Argentina, these suppliers have
curtailed all gas supply to our plants in Chile since June 2007 in response to various actions by the Argentinean government that include imposing a large increase to the duty on natural gas exports from Argentina. Since then we have been operating
our Chile facilities significantly below site capacity. We are not aware of any plans by the Government of Argentina to decrease or remove this duty. Under the current circumstances, we do not expect to receive any further natural gas supply from
Argentina.
Over the past few years, ENAP, our primary supplier in Chile, has delivered less than the full amount of natural gas that it was obligated to
deliver to us primarily due to declines in the production rates of existing wells. The shortfalls in natural gas deliveries from ENAP are generally greater in the southern hemisphere winter due to the need to satisfy increased demand for residential
uses in the region. We are focused on sourcing additional gas supply for our Chile facilities from suppliers in Chile as discussed in more detail in the Production Summary – Chile section on page 14 of this document. We are pursuing investment opportunities with ENAP, GeoPark
and others to help accelerate natural gas exploration and development in southern Chile. In addition, the Government of Chile completed an international bidding round in 2007 to assign natural gas exploration areas that lie close to our production
facilities and announced the participation of several international oil and gas companies.
As we entered 2011, we were operating one plant at
approximately 65% capacity at our Chile site. The future operating rate of our Chile site is primarily dependent on demand for natural gas for residential purposes, which is higher in the southern hemisphere winter, production rates from existing
natural gas fields, and the level of natural gas deliveries from future exploration and development activities in southern Chile. We cannot provide assurance regarding the production rates from existing natural gas fields or that we, ENAP, GeoPark
or others will be successful in the exploration and development of natural gas or that we will obtain any additional natural gas from suppliers in Chile on commercially acceptable terms. As a result, we cannot provide assurance over changes in the
level of natural gas supply or that we will be able to source sufficient natural gas to operate any capacity in Chile and that this will not have an adverse impact on our results of operations and financial condition.
|
|
|
| |
|
| Management’s Discussion & Analysis Annual Report 2010 METHANEX 27
|
|
|
Trinidad
Natural gas for our two methanol production facilities in Trinidad, with a total production capacity of 2.05 million tonnes per year, is supplied under long-term contracts with The National Gas Company of
Trinidad and Tobago Limited. The contracts for Titan and Atlas expire in 2014 and 2024, respectively. Although Titan and Atlas are located close to other natural gas reserves in Trinidad, which we believe we could access after the expiration of
these natural gas supply contracts, we cannot provide assurance that we would be able to secure access to such natural gas under long-term contracts on commercially acceptable terms.
New Zealand
We have three plants in New Zealand with a total production capacity of up to
2.23 million tonnes per year. Two plants are located at Motunui and the third is located at nearby Waitara Valley. In 2004, we idled our two Motunui plants and continued to operate the Waitara Valley plant. As a result of improvements to
natural gas availability and deliverability, in 2008 we restarted one 0.85 million tonne per year plant in Motunui and idled the 0.53 million tonne per year Waitara Valley plant. Currently, our second Motunui plant and our Waitara Valley
plant provide the potential to increase production in New Zealand depending on methanol supply and demand dynamics and the availability of natural gas on commercially acceptable terms.
During the past few years, increased natural gas exploration and development activity in New Zealand has resulted in improved gas availability and deliverability. We have a range of gas suppliers with short-term
contracts and currently have sufficient quantities of natural gas to operate one Motunui plant through 2011 and 2012. We continue to pursue opportunities to obtain economically priced natural gas with suppliers in New Zealand to underpin a restart
of a second plant. We are also pursuing natural gas exploration and development opportunities in the area close to our plants and have entered into an agreement with Kea, an oil and gas exploration and development company, to explore areas of the
Taranaki basin in New Zealand. Based on the improved outlook for natural gas in New Zealand, we are optimistic that we can secure additional gas supply in New Zealand and restart more capacity there in the future.
The future operation of our New Zealand facilities depends on methanol industry supply and demand and the availability of natural gas on commercially acceptable
terms, and the success of ongoing exploration and development activities. We cannot provide assurance that we will be able to secure additional gas for our facilities on commercially acceptable terms or that the ongoing exploration and development
activities in New Zealand will be successful.
Egypt
Natural gas for the 1.26 million tonne per year production facility in Egypt, which produced first methanol in January 2011, is supplied under a single long-term contract with the government-owned Egyptian
Natural Gas Holding Company (EGAS). Gas will be supplied to this facility from the same gas delivery grid infrastructure that supplies other industrial users in Egypt, as well as the general Egyptian population and,
accordingly, the natural gas supplied under this long-term contract could be impacted by the supply and demand balance of natural gas in Egypt. There can be no assurance that we will not experience curtailments of natural gas supply, which could
have an adverse impact on our results of operations and financial condition.
Refer also to the
Foreign Operations section on page 31.
Canada
We are nearing completion of the project to restart our 0.47 million tonne per year
idled facility in Medicine Hat, Alberta, Canada. In support of the restart, which is expected in the second quarter of 2011, we commenced a program to purchase natural gas on the Alberta gas market and have contracted sufficient volumes of natural
gas to meet 80% of our requirements when operating at capacity for the period from start-up to October 2012. The Alberta gas market offers substantial volumes of natural gas in a competitive market where prices can fluctuate widely.
The future operation of our Medicine Hat facility depends on our ability to secure sufficient natural gas on commercially acceptable terms. There can be no
assurance that we will be able to continue to secure sufficient natural gas for our Medicine Hat facilities on commercially acceptable terms.
|
|
|
| |
|
| |
|
28 METHANEX
Annual Report 2010 Management’s Discussion & Analysis |
Methanol Price Cyclicality and Methanol Supply and Demand
The methanol business is a highly competitive commodity industry and prices are affected by supply and demand fundamentals and global energy prices. Methanol prices
have historically been, and are expected to continue to be, characterized by significant cyclicality. New methanol plants are expected to be built and this will increase overall production capacity. Additional methanol supply can also become
available in the future by restarting idle methanol plants, carrying out major expansions of existing plants or debottlenecking existing plants to increase their production capacity. Historically, higher-cost plants have been shut down or idled when
methanol prices are low but there can be no assurance that this practice will occur in the future. Demand for methanol largely depends upon levels of global industrial production, changes in general economic conditions and energy prices.
We are not able to predict future methanol supply and demand balances, market conditions, global economic activity, methanol prices or energy prices, all of which
are affected by numerous factors beyond our control. Since methanol is the only product we produce and market, a decline in the price of methanol would have an adverse effect on our results of operations and financial condition.
Global Economic Conditions
The global
economic recession that began in late 2008 added significant risks and uncertainties to our business, including risks and uncertainties related to the impact on global supply and demand for methanol, its impact on methanol prices, changes in capital
markets and corresponding effects on our investments, our ability to access existing or future credit and increased risk of defaults by customers, suppliers and insurers. While the global economy has improved and demand for methanol and methanol
prices have recovered, there can be no assurance that this recovery will be sustained.
Liquidity Risk
We have an undrawn $200 million credit facility that expires in mid-2012. This facility is provided by highly rated financial institutions and our ability to access
the facility is subject to certain financial covenants, including an EBITDA to interest coverage ratio and a debt to capitalization ratio, as defined.
At December 31, 2010, our long-term debt obligations include $350 million in unsecured notes ($200 million which matures in 2012 and $150 million which matures
in 2015), $514 million related to the Egypt limited recourse debt facilities and $81 million related to our Atlas limited recourse debt facilities. The covenants governing the unsecured notes apply to the Company and its subsidiaries excluding
the Atlas joint venture and Egypt entity (“limited recourse subsidiaries”) and include restrictions on liens and sale and lease-back transactions, or merger or consolidation with another corporation or sale of all or substantially all of
the Company’s assets. The indenture also contains customary default provisions. The Atlas and Egypt limited recourse debt facilities are described as limited recourse as they are secured only by the assets of the Atlas joint venture and the
Egypt entity, respectively. Accordingly, the lenders to the limited recourse debt facilities have no recourse to the Company or its other subsidiaries. The Atlas and Egypt limited recourse debt facilities have customary covenants and default
provisions that apply only to these entities, including restrictions on the incurrence of additional indebtedness and a requirement to fulfill certain conditions before the payment of cash or other distributions. The Egypt limited recourse debt
facilities also require that certain conditions associated with completion of plant construction and commissioning be met by no later than September 30, 2011. These conditions include a 90-day plant reliability test and finalization of certain land
title registrations and related mortgages which require actions by governmental entities.
For additional information regarding long-term debt, refer to
note 8 of our 2010 consolidated financial statements.
We cannot provide assurance that we will be able to access new financing in the future or that the
financial institutions providing the credit facility will have the ability to honour future draws. Additionally, failure to comply with any of the covenants or default provisions could restrict our access to the credit facility or result in
acceleration of payment of outstanding principal and accrued interest on our long-term debt. Any of these factors could have a material adverse effect on our results of operations, our ability to pursue and complete strategic initiatives or on our
financial condition.
Customer Credit Risk
Most of our customers are large global or regional petrochemical manufacturers or distributors and a number are highly leveraged. We monitor our customers’ financial status closely; however, some customers may
not have the financial ability
|
|
|
| |
|
| Management’s Discussion & Analysis Annual Report 2010 METHANEX 29
|
|
|
to pay for methanol in the future and this could have an adverse effect on our results of operations and financial condition. Although credit losses have not been significant in the past, this
risk still exists.
Methanol Demand
Demand for Methanol – General
Methanol is a global commodity and customers base their
purchasing decisions principally on the delivered price of methanol and reliability of supply. Some of our competitors are not dependent on revenues from a single product and some have greater financial resources than we do. Our competitors also
include state-owned enterprises. These competitors may be better able than we are to withstand price competition and volatile market conditions.
Changes
in environmental, health and safety laws, regulations or requirements could impact methanol demand. The U.S. Environmental Protection Agency (EPA) is currently evaluating the carcinogenicity classification for methanol as part of a standard review
of chemicals under its Integrated Risk Information System (IRIS). Methanol is currently unclassified under IRIS. A draft assessment for methanol was released by the EPA in January 2010 classifying methanol as “Likely to Be Carcinogenic to
Humans”. As of June 2010, the EPA’s methanol assessment has been placed “on hold”. Although the EPA maintains a public target for the second quarter of 2011, we are unable to determine at this time if and when the methanol
assessment will resume, whether the current draft classification will be maintained in the final assessment or if this will lead other government agencies to reclassify methanol. Any reclassification could reduce future methanol demand, which could
have an adverse effect on our results of operations, financial condition or our stock price.
Demand for Methanol in the Production
of Formaldehyde
In 2010, methanol demand for the production of formaldehyde represented approximately 34% of global demand. The largest use for
formaldehyde is as a component of urea-formaldehyde and phenol-formaldehyde resins, which are used as wood adhesives for plywood, particleboard, oriented strand board, medium-density fibreboard and other reconstituted or engineered wood products.
There is also demand for formaldehyde as a raw material for engineering plastics and in the manufacture of a variety of other products, including elastomers, paints, building products, foams, polyurethane and automotive products.
The current EPA IRIS carcinogenicity classification for formaldehyde is “Likely to Be Carcinogenic to Humans.” However, the EPA is reviewing this
classification for formaldehyde as part of a standard review of chemicals. The final assessment of formaldehyde is currently set for release in the third quarter of 2011.
In May 2009, the U.S. National Cancer Institute (NCI) published a report on the health effects of occupational exposure to formaldehyde and a possible link to leukemia, multiple myeloma and Hodgkin’s disease.
The NCI report concluded that there may be an increased risk of cancers of the blood and bone marrow related to a measure of peak formaldehyde exposure. The NCI report is the first part of an update of the 2004 NCI study that indicated possible
links between formaldehyde exposure and nasopharyngeal cancer and leukemia. The second portion of the study, which focuses on nasopharyngeal cancer and other cancers, should appear in peer reviewed literature in 2011. The International Agency for
Research on Cancer also recently concluded that there is sufficient evidence in humans of a causal association of formaldehyde with leukemia.
The U.S. Department of Health and Human Services’ (HHS) National Toxicology Program (NTP) Report on Carcinogens (RoC) currently lists formaldehyde as “reasonably anticipated to be a human
carcinogen.” This classification is currently under review. In April 2010, the NTP released its draft substance profile for formaldehyde with the classification “Known to be a Human Carcinogen”. Final classification will be confirmed
when the NTP releases its 12th RoC. At this time, the release date, which was originally expected in December 2010, is uncertain.
In 2010, the U.S. Formaldehyde Standards for Composite Wood Products Act became effective. The legislation sets new national emissions standards for formaldehyde in various wood products. These standards require a reduction in the emissions standards for formaldehyde used in hardwood
plywood, particleboard and medium-density fibreboard sold in the United States However, most United States producers are believed to have the technology in place to meet the new emissions requirements and we do not expect a significant impact on the
demand for methanol for formaldehyde in the United States.
|
|
|
| |
|
| |
|
30 METHANEX
Annual Report 2010 Management’s Discussion & Analysis |
We are unable to determine at this time if the EPA, the HHS or other governments or government agencies will
reclassify formaldehyde or what limits could be imposed related to formaldehyde emissions in the United States or elsewhere. Any such actions could reduce future methanol demand for use in producing formaldehyde, which could have an adverse effect
on our results of operations and financial condition.
Demand for Methanol in the Production of MTBE
In 2010, methanol demand for the production of MTBE represented approximately 13% of global methanol demand. MTBE is used primarily as a source of octane and as an
oxygenate for gasoline to reduce the amount of harmful exhaust emissions from motor vehicles.
Several years ago, environmental concerns and legislative
action related to gasoline leaking into water supplies from underground gasoline storage tanks in the United States resulted in the phase-out of MTBE as a gasoline additive in the United States. We believe that methanol has not been used in the
United States to make MTBE for use in domestic fuel blending since 2007. However, approximately 0.65 million tonnes of methanol was used in the United States in 2010 to produce MTBE for export markets, where demand for MTBE has continued at strong
levels. While we currently expect demand for methanol for MTBE production in the United States for 2011 to remain steady or to decline slightly, it could decline materially if export demand was impacted by legislation or policy changes.
Additionally, the EPA in the United States is preparing an IRIS review of the human health effects of MTBE, including its potential carcinogenicity, and its final
report is expected to be released in the third quarter of 2011.
The European Union issued a final risk assessment report on MTBE in 2002 that permitted
the continued use of MTBE, although several risk reduction measures relating to the storage and handling of fuels were recommended. Governmental efforts in recent years in some countries, primarily in the European Union and Latin America, to promote
biofuels and alternative fuels through legislation or tax policy are putting competitive pressures on the use of MTBE in gasoline in these countries. However, due to strong MTBE demand in other countries, we have observed methanol demand growth for
MTBE production. We cannot provide assurance that this will continue.
Although MTBE demand has remained strong outside of the United States, we cannot
provide assurance that further legislation banning or restricting the use of MTBE or promoting alternatives to MTBE will not be passed or that negative public perceptions will not develop outside of the United States, either of which would lead to a
decrease in the global demand for methanol for use in MTBE. Declines in demand for methanol for use in MTBE could have an adverse effect on our results of operations and financial condition.
Foreign Operations
The majority of our operations and investments are located outside of North
America, including Chile, Trinidad, New Zealand, Egypt, Europe and Asia. We are subject to risks inherent in foreign operations such as loss of revenue, property and equipment as a result of expropriation; import or export restrictions, anti-dumping
measures; nationalization, war, insurrection, civil unrest, terrorism and other political risks; increases in duties, taxes and governmental royalties; renegotiation of contracts with governmental entities; as well as changes in laws or policies or
other actions by governments that may adversely affect our operations. Many of the foregoing risks related to foreign operations may also exist for our domestic operations in North America.
In late January 2011, there were widespread anti-government protests and civil unrest in Egypt. For the safety and security of our employees, we took the decision to temporarily close our Cairo office and curtail
the commissioning activities at the plant in Damietta, Egypt. As conditions stabilized, we reopened our Cairo office and our plant in Damietta resumed operations to continue the start-up and commissioning process. We cannot provide assurance that
future developments in Egypt, including changes in government or further civil unrest or other disturbances, would not have an adverse impact on the plant start-up and commissioning or ongoing operations or on the terms or enforceability of our
natural gas or other contracts with governmental entities.
Because we derive substantially all of our revenues from production and sales by subsidiaries
outside of Canada, the payment of dividends or the making of other cash payments or advances by these subsidiaries may be subject to restrictions or exchange controls on the transfer of funds in or out of the respective countries or result in the
imposition of taxes on such payments or advances.
|
|
|
| |
|
| Management’s Discussion & Analysis Annual Report 2010 METHANEX 31
|
|
|
We have organized our foreign operations in part based on certain assumptions about various tax laws (including
capital gains and withholding taxes), foreign currency exchange and capital repatriation laws and other relevant laws of a variety of foreign jurisdictions. While we believe that such assumptions are reasonable, we cannot provide assurance that
foreign taxation or other authorities will reach the same conclusion. Further, if such foreign jurisdictions were to change or modify such laws, we could suffer adverse tax and financial consequences.
The dominant currency in which we conduct business is the United States dollar, which is also our reporting currency. The most significant components of our costs
are natural gas feedstock and ocean-shipping costs and substantially all of these costs are incurred in United States dollars. Some of our underlying operating costs and capital expenditures, however, are incurred in currencies other than the United
States dollar, principally the Canadian dollar, the Chilean peso, the Trinidad and Tobago dollar, the New Zealand dollar, the euro and the Egyptian pound. We are exposed to increases in the value of these currencies that could have the effect of
increasing the United States dollar equivalent of cost of sales and operating expenses and capital expenditures. A portion of our revenue is earned in euros and British pounds. We are exposed to declines in the value of these currencies compared to
the United States dollar, which could have the effect of decreasing the United States dollar equivalent of our revenue.
In June 2009, the Chinese
Ministry of Commerce (MOFCOM) began an investigation into domestic methanol producer allegations of the dumping of methanol from New Zealand, Saudi Arabia, Indonesia and Malaysia. In late December 2010, MOFCOM issued its Final Determination and
recommended that duties of approximately 9% be imposed on imports from existing producers in New Zealand, Malaysia and Indonesia. However, citing special circumstances, the Customs Tariff Commission of the Chinese State Council decided to suspend
enforcement of the anti-dumping measures, which will allow methanol from all three countries to enter into China without the imposition of additional duties. In the event that the suspension is lifted, we do not expect there would be any significant
impact on industry supply/demand fundamentals and we would realign our supply chain. We cannot provide assurance that the suspension will not be lifted or that the Chinese government will not impose duties or other measures in the future that could
have an adverse effect on our results of operations and financial condition.
Methanol is a globally traded commodity that is produced by many producers
at facilities located in many countries around the world. Some producers and marketers may have direct or indirect contacts with countries that may, from time to time, be subject to international trade sanctions or other similar prohibitions
(“Sanctioned Countries”). In addition to the methanol we produce, we purchase methanol from third parties under purchase contracts or on the spot market in order to meet our commitments to customers, and we also engage in product exchanges
with other producers and marketers. We believe that we are in compliance with all applicable laws with respect to sales and purchases of methanol and product exchanges. However, as a result of the participation of Sanctioned Countries in our
industry, we cannot provide assurance that we will not be exposed to reputational or other risks that could have an adverse impact on our results of operations, our financial condition or our stock price.
Operational Risks
Production Risks
Most of our earnings are
derived from the sale of methanol produced at our plants. Our business is subject to the risks of operating methanol production facilities, such as unforeseen equipment breakdowns, interruptions in the supply of natural gas and other feedstocks,
power failures, longer-than-anticipated planned maintenance activities, loss of port facilities, natural disasters or any other event, including unanticipated events beyond our control, that could result in a prolonged shutdown of any of our plants
or impede our ability to deliver methanol to our customers. A prolonged plant shutdown at any of our major facilities could have an adverse effect on our results of operations and financial condition.
Purchased Product Price Risk
In addition to
the sale of methanol produced at our plants, we also purchase methanol produced by others on the spot market and through purchase contracts to meet our customer commitments and support our marketing efforts. We have adopted the first-in, first-out
method of accounting for inventories and it generally takes between 30 and 60 days to sell the methanol we purchase. Consequently, we have the risk of holding losses on the resale of this product to the extent that methanol prices decrease from the
date of purchase to the date of sale. We grew our sales levels in 2010 in anticipation of increased production from the Egypt plant and we have continued to meet our commitments to customers
|
|
|
| |
|
| |
|
32 METHANEX
Annual Report 2010 Management’s Discussion & Analysis |
by increasing the amount of methanol we purchase. Holding losses, if any, on the resale of purchased methanol could have an adverse effect on our results of operations and financial condition.
Distribution Risks
Excess
capacity within our fleet of ocean vessels resulting from a prolonged plant shutdown or other event could also have an adverse effect on our results of operations and financial condition. Due to the significant reduction of production levels at our
Chilean facilities since mid-2007, we have had excess shipping capacity that is subject to fixed time charter costs. We have been successful in mitigating some of these costs by entering into sub-charters and third-party backhaul arrangements,
although there has been significant excess global shipping capacity over the last few years which has made it more difficult to mitigate these costs. If we are unable to mitigate these costs in the future, or if we suffer any other disruptions in
our distribution system, this could have an adverse effect on our results of operations and financial condition.
Insurance Risks
Although we maintain operational and construction insurances, including business interruption insurance and delayed start-up insurance, we cannot
provide assurance that we will not incur losses beyond the limits of, or outside the coverage of, such insurance or that insurers will be financially capable of honouring future claims. From time to time, various types of insurance for companies in
the chemical and petrochemical industries have not been available on commercially acceptable terms or, in some cases, have been unavailable. We cannot provide assurance that in the future we will be able to maintain existing coverage or that
premiums will not increase substantially.
Egypt Plant Start-up
The 1.26 million tonne per year methanol facility in Egypt is in the commissioning phase and produced first methanol in January 2011. We cannot provide any assurance that the facility will begin
commercial production within the anticipated schedule, if at all, or that the facility will operate at its designed capacity or on a sustained basis. This could have an adverse impact on our financial condition and anticipated results of operations.
Medicine Hat Plant Restart
We
believe that our estimates of project costs and anticipated completion for the restart of our 0.47 million tonne per year methanol plant in Medicine Hat are reasonable. However, we cannot provide any assurance that the cost estimates will not
be exceeded or that the facility will begin commercial production within the anticipated schedule, if at all, or that the facility will operate at its designed capacity or on a sustained basis. This could have an adverse impact on our financial
condition and anticipated results of operations.
New Capital Projects
As part of our strategy to strengthen our position as the global leader in the production and marketing of methanol, we intend to continue pursuing new opportunities to enhance our strategic position in the
methanol industry. Our ability to successfully identify, develop and complete new capital projects is subject to a number of risks, including finding and selecting favourable locations for new facilities where sufficient natural gas and other
feedstock is available through long-term contracts with acceptable commercial terms, obtaining project or other financing on satisfactory terms, developing and not exceeding acceptable project cost estimates, constructing and completing the projects
within the contemplated schedules and other risks commonly associated with the design, construction and start-up of large complex industrial projects. We cannot provide assurance that we will be able to identify or develop new methanol projects.
Environmental Regulation
The
countries in which we operate all have laws and regulations to which we are subject governing the environment and the management of natural resources, as well as the handling, storage, transportation and disposal of hazardous or waste materials. We
are also subject to laws and regulations governing emissions and the import, export, use, discharge, storage, disposal and transportation of toxic substances. The products we use and produce are subject to regulation under various health, safety and
environmental laws. Non-compliance with these laws and regulations may give rise to work orders, fines, injunctions, civil liability and criminal sanctions.
|
|
|
| |
|
| Management’s Discussion & Analysis Annual Report 2010 METHANEX 33
|
|
|
As a result of frequently scheduled external and internal audits, we believe that we materially comply with all
existing environmental, health and safety laws and regulations to which our operations are subject. Laws and regulations protecting the environment have become more stringent in recent years and may, in certain circumstances, impose absolute
liability rendering a person liable for environmental damage without regard to negligence or fault on the part of such person. Such laws and regulations may also expose us to liability for the conduct of, or conditions caused by, others, or for our
own acts even if we complied with applicable laws at the time such acts were performed. To date, environmental laws and regulations have not had a significant adverse effect on our capital expenditures, earnings or competitive position. However,
operating petrochemical manufacturing plants and distributing methanol exposes us to risks in connection with compliance with such laws and we cannot provide assurance that we will not incur significant costs or liabilities in the future.
We believe that minimizing emissions and waste from our business activities is good business practice. Carbon dioxide (CO2) is a significant by-product
of the methanol production process. The amount of CO2 generated by the methanol production process depends on the production technology (and hence often the plant age), the feedstock and any export of by-product hydrogen. We continually strive to
increase the energy efficiency of our plants, which not only reduces the use of energy but also minimizes CO2 emissions. We have reduced CO2 emission intensity in our manufacturing operations by 33% between 1994 and 2010 through asset turnover,
improved plant reliability, and energy efficiency and emissions management. Plant efficiency, and thus CO2 emission, is highly dependent on a particular design of the methanol plant, so our level of CO2 emissions may vary from year to year depending
on the asset mix that is operating. We also recognize that CO2 is generated from our marine operations, and in that regard we measure the consumption of fuels by our ocean vessels based on the volume of product transported. Between 2002 and 2010, we
reduced our CO2 intensity (tonnes of CO2 from fuel burned per tonne of product moved) from marine operations by 17%. We also actively support global industry efforts to voluntarily reduce both energy consumption and CO2 emissions.
We manufacture methanol in Chile, Trinidad and New Zealand and we have constructed a new facility in Egypt. Also, we are currently working on restarting our
manufacturing facility at Medicine Hat, Canada, with the intended start of production in the second quarter of 2011. All of these countries have signed and ratified the Kyoto Protocol. Under the Kyoto Protocol, the developing nations of Chile,
Trinidad and Egypt are not currently required to reduce greenhouse gases (GHGs), whereas Canada and New Zealand are listed as industrialized Annex 1 countries and have committed to GHG reductions under the Kyoto Protocol during the first commitment
period (2008-2012).
Medicine Hat is located in the province of Alberta, which has an established GHG reduction regulation that is expected to apply to
the plant in 2011. The regulation requires established facilities to reduce emissions intensities by up to 12% of their established emissions intensity baseline. “Emissions intensity” means the quantity of specified GHGs released by a
facility per unit of production from that facility. In order to meet the reduction obligation, a facility can choose to make emissions reduction improvements or it can opt to purchase either offset credits or “Technology Fund” credits for
CDN$15 per tonne of CO2 equivalent. Based on the expected emissions intensity baseline for the Medicine Hat plant, we do not believe that, when applied, the cost will be significant.
New Zealand also passed legislation to establish an Emission Trading Scheme (ETS) that came into force on July 1, 2010. The ETS imposes a carbon price on producers of fossil fuels, including natural gas, which
is passed on as a liability to Methanex, increasing the cost of gas that Methanex purchases in New Zealand. However, as a trade-exposed company, Methanex is entitled to a free allocation of emissions units to partially offset those increased costs,
and the legislation provides further moderation of any residual cost exposure until the end of 2012. Consequently, we do not believe that these costs will be significant to the end of 2012. However, after this date the moderating features are
expected to be removed and our eligibility for free allocation of emissions units will be progressively reduced. We cannot accurately quantify the impact on our business after 2012 and therefore we cannot provide assurance that the ETS will not have
a significant adverse impact on our results of operation or financial condition after 2012.
We cannot provide assurance over ongoing compliance with
existing legislation or that future laws and regulations to which we are subject governing the environment and the management of natural resources as well as the handling, storage, transportation and disposal of hazardous or waste materials will not
have an adverse effect on our results of operations or financial condition.
|
|
|
| |
|
| |
|
34 METHANEX
Annual Report 2010 Management’s Discussion & Analysis |
Legal Proceedings
The Board of Inland Revenue of Trinidad and Tobago has issued assessments against our wholly owned subsidiary, Methanex Trinidad (Titan) Unlimited, in respect of the 2003 and 2004 financial years. The assessments
relate to the deferral of tax depreciation deductions during the five-year tax holiday that ended in 2005. The impact of the amount in dispute as at December 31, 2010 is approximately $26 million in current taxes and $23 million in future
taxes, exclusive of any interest charges.
We have appealed the assessments and based on the merits of the case and legal interpretation, we believe our
position should be sustained. However, we cannot provide assurance that the final assessment will not have an adverse effect on our results of operations or financial condition.
CRITICAL ACCOUNTING ESTIMATES
We believe the following selected accounting policies and issues
are critical to understanding the estimates, assumptions and uncertainties that affect the amounts reported and disclosed in our consolidated financial statements and related notes. See note 1 to our 2010 consolidated financial statements for our
significant accounting policies.
Property, Plant and Equipment
Our business is capital intensive and has required, and will continue to require, significant investments in property, plant and equipment. At December 31, 2010, the net book value of our property, plant and
equipment was $2,214 million. We estimate the useful lives of property, plant and equipment and this is used as the basis for recording depreciation and amortization. Recoverability of property, plant and equipment is measured by comparing the net
book value of an asset to the undiscounted future net cash flows expected to be generated from the asset over its estimated useful life. An impairment charge is recognized in cases where the undiscounted expected future cash flows from an asset are
less than the net book value of the asset. The impairment charge is equal to the amount by which the net book value of the asset exceeds its fair value. Fair value is based on quoted market values, if available, or alternatively using discounted
expected future cash flows.
We test our long-lived assets for recoverability whenever events or changes in circumstances indicate that the carrying
amount may not be recoverable. Examples of such events or changes in circumstances related to our long-lived assets include, but are not restricted to: a significant adverse change in the extent or manner in which the asset is being used or in its
physical condition; a significant change in the price or availability of natural gas feedstock required to manufacture methanol; a significant adverse change in legal factors or in the business climate that could affect the asset’s value,
including an adverse action or assessment by a foreign government that impacts the use of the asset; or a current-period operating or cash flow loss combined with a history of operating or cash flow losses, or a projection or forecast that
demonstrates continuing losses associated with the asset’s use. For purposes of recognition and measurement of an impairment loss, we group our long-lived assets with other assets and liabilities to form an “asset group,” at the
lowest level for which identifiable cash flows are largely independent of the cash flows of other assets and liabilities. To the extent that our methanol facilities in a particular location are interdependent as a result of common infrastructure
and/or feedstock from shared sources that can be shared within a facility location, we group our assets based on site locations for the purpose of determining impairment.
There are two key variables that impact our estimate of future cash flows: (1) the methanol price and (2) the price and availability of natural gas feedstock. Short-term methanol price estimates are based
on current supply and demand fundamentals and current methanol prices. Long-term methanol price estimates are based on our view of long-term supply and demand, and consideration is given to many factors, including, but not limited to, estimates
of global industrial production rates, energy prices, changes in general economic conditions, future global methanol production capacity, industry operating rates and the global industry cost structure. Our estimate of the price and availability of
natural gas takes into consideration the current contracted terms, as well as factors that we believe are relevant to supply under these contracts and supplemental natural gas sources. Other assumptions included in our estimate of future cash
flows include the estimated cost incurred to maintain the facilities, estimates of transportation costs and other variable costs incurred in producing methanol in each period. Changes in these assumptions will impact our estimates of future cash
flows and could impact our estimates of the useful lives of property, plant and equipment. Consequently, it is possible that our future operating results could be adversely affected by asset impairment charges or by changes in depreciation and
amortization rates related to property, plant and equipment.
|
|
|
| |
|
| Management’s Discussion & Analysis Annual Report 2010 METHANEX 35
|
|
|
Asset Retirement Obligations
We record asset retirement obligations at fair value when incurred for those sites where a reasonable estimate of the fair value can be determined. At December 31, 2010, we have accrued $16 million for asset
retirement obligations. Inherent uncertainties exist because the restoration activities will take place in the future and there may be changes in governmental and environmental regulations and changes in removal technology and costs. It is difficult
to estimate the future costs of these activities as our estimate of fair value is based on today’s regulations and technology. Because of uncertainties related to estimating the cost and timing of future site restoration activities, future
costs could differ materially from the amounts estimated.
Income Taxes
Future income tax assets and liabilities are determined using enacted tax rates for the effects of net operating losses and temporary differences between the book and tax bases of assets and liabilities. We record
a valuation allowance on future tax assets, when appropriate, to reflect the uncertainty of realizing future tax benefits. In determining the appropriate valuation allowance, certain judgments are made relating to the level of expected future
taxable income and to available tax-planning strategies and their impact on the use of existing loss carryforwards and other income tax deductions. In making this analysis, we consider historical profitability and volatility to assess whether we
believe it to be more likely than not that the existing loss carryforwards and other income tax deductions will be used to offset future taxable income otherwise calculated. Our management routinely reviews these judgments. At December 31,
2010, we had future income tax assets of $205 million that are substantially offset by a valuation allowance of $143 million. The determination of income taxes requires the use of judgment and estimates. If certain judgments or estimates prove to be
inaccurate, or if certain tax rates or laws change, our results of operations and financial position could be materially impacted.
Inventories
Inventories are valued at the
lower of cost, determined on a first-in, first-out basis, and estimated net realizable value. The cost of our inventory, for both produced methanol as well as methanol we purchase from others, is impacted by methanol prices at the time of production
or purchase. The net realizable value of inventories will depend on methanol prices when sold. Inherent uncertainties exist in estimating future methanol prices and therefore the net realizable value of our inventory. Methanol prices are influenced
by supply and demand fundamentals, industrial production, energy prices and the strength of the global economy.
Oil and Gas
Accounting
We apply the full cost method of accounting for our investment in the Dorado Riquelme block. Under this method, all costs, including
internal costs and asset retirement costs, directly associated with the acquisition of, the exploration for, and the development of natural gas reserves are capitalized. Costs are then depleted and amortized using the unit-of-production method based
on estimated proved reserves. Capitalized costs subject to depletion include estimated future costs to be incurred in developing proved reserves. Costs of major development projects and costs of acquiring and evaluating significant unproved
properties are excluded from the costs subject to depletion until it is determined whether or not proved reserves are attributable to the properties or impairment has occurred. Costs that have been impaired are included in the costs subject to
depletion and amortization.
Under full cost accounting, an impairment assessment (“ceiling test”) is performed on an annual basis for all oil
and gas assets. An impairment loss is recognized in earnings when the carrying amount is not recoverable and the carrying amount exceeds its fair value. The carrying amount is not recoverable if the carrying amount exceeds the sum of the
undiscounted cash flows from proved reserves. If the sum of the cash flows is less than the carrying amount, the impairment loss is measured as the amount by which the carrying amount exceeds the sum of the discounted cash flows of proved and
probable reserves.
Derivative Financial Instruments
From time to time we enter into derivative financial instruments to limit our exposure to foreign exchange volatility and variable interest rate volatility and to contribute towards managing our cost structure. The
valuation of derivative financial instruments is a critical accounting estimate due to the complex nature of these products, the degree of judgment required to appropriately value these products and the potential impact of such valuation on our
financial statements.
|
|
|
| |
|
| |
|
36 METHANEX
Annual Report 2010 Management’s Discussion & Analysis |
Derivative financial instruments are classified as held-for-trading and are recorded on the balance sheet at fair value. Changes in the fair value of derivative financial instruments are recorded
in earnings unless the instruments are designated as cash flow hedges, in which case the effective portion of any changes in fair value are recorded in other comprehensive income. At December 31, 2010, the fair value of our derivative financial
instruments used to limit our exposure to variable interest rate volatility which have been designated as cash flow hedges approximated their carrying value of negative $43 million. Until settled, the fair value of the derivative financial
instruments will fluctuate based on changes in variable interest rates.
ANTICIPATED CHANGES TO CANADIAN GENERALLY ACCEPTED
ACCOUNTING PRINCIPLES
International Financial Reporting Standards
The Canadian Accounting Standards Board confirmed January 1, 2011 as the changeover date for Canadian publicly accountable enterprises to start using International Financial Reporting Standards (IFRS) as
issued by the International Accounting Standards Board (IASB). IFRS uses a conceptual framework similar to Canadian GAAP, but there are significant differences in recognition, measurement and disclosures.
As a result of the IFRS transition, changes in accounting policies are likely and may materially impact our consolidated financial statements. The IASB will also
continue to issue new accounting standards throughout 2011, and as a result, the final impact of IFRS on our consolidated financial statements will only be measured once all the IFRS applicable at the conversion date are known.
We have established a working team to manage the transition to IFRS. Additionally, we have established a formal project governance structure that includes the
Audit, Finance and Risk Committee, senior management, and an IFRS steering committee to monitor progress and review and approve recommendations from the working team for the transition to IFRS. The working team provides regular updates to the IFRS
steering committee and to the Audit, Finance and Risk Committee of the Board.
In 2008, we commenced our plan to convert our consolidated financial
statements to IFRS at the changeover date of January 1, 2011, with comparative financial results for 2010. The IFRS transition plan addresses the impact of IFRS on accounting policies and implementation decisions, infrastructure, business
activities and control activities. We are progressing according to schedule and continue to be on track toward project completion and will issue our first interim consolidated financial statements in accordance with IFRS as issued by the IASB
beginning with the first quarter ending March 31, 2011, with comparative financial results for 2010. A summary status of the key elements of the changeover plan is as follows:
Accounting policies and implementation decisions
| |
– |
|
Identification of differences in Canadian GAAP and IFRS accounting policies |
| |
– |
|
Selection of ongoing IFRS policies |
| |
– |
|
Selection of IFRS 1, First-time Adoption of International Financial Reporting Standards (“IFRS 1”) choices |
| |
– |
|
Development of financial statement format |
| |
– |
|
Quantification of effects of change in initial IFRS 1 disclosures and 2010 financial statements |
| |
– |
|
We have identified differences between our accounting policies under Canadian GAAP and accounting policy choices under IFRS, both on an ongoing basis and with
respect to certain choices available on conversion, in accordance with IFRS 1 |
| |
– |
|
We have engaged the Company’s external auditors, KPMG LLP, to discuss our proposed IFRS accounting policies to ensure consistent interpretation of IFRS
guidance in all areas |
| |
– |
|
We continue to monitor changes in accounting policies issued by the IASB and the impact of those changes on our accounting policies under IFRS
|
| |
– |
|
We have a process for compiling parallel 2010 IFRS results for comparative reporting purposes in 2011 |
|
|
|
| |
|
| Management’s Discussion & Analysis Annual Report 2010 METHANEX 37
|
|
|
| |
– |
|
See the corresponding sections below for discussion of optional exemptions under IFRS 1 that the Company expects to elect on transition to IFRS, accounting
policy changes that management considers most significant to the Company, and an overview of the adjustments to the financial statements on transition to IFRS as at January 1, 2010 and for the year ended December 31, 2010
|
Infrastructure: Financial reporting expertise and communications
| |
– |
|
Development of IFRS expertise |
| |
– |
|
We have provided training for key employees and senior management |
| |
– |
|
In 2009, we held an IFRS information session with the Audit, Risk and Finance Committee that included an in-depth review of differences between Canadian GAAP and
IFRS, a review of the implementation timeline, an overview of the project activities to date and a preliminary discussion of the significant impact areas of IFRS |
| |
– |
|
In 2010, we held IFRS information sessions with the IFRS steering committee, the Audit, Finance and Risk Committee, and the Board that included an in-depth
review of accounting policy changes on transition to IFRS, a discussion of optional exemptions under IFRS 1 that the Company expects to elect on transition to IFRS, and an overview of the expected adjustments to the financial statements on
transition to IFRS |
| |
– |
|
In 2010, we held an external Investor Day Conference, which included a presentation to shareholders, research analysts and other members of the investment
community on the expected significant impacts of the IFRS transition |
Infrastructure: Information technology and
data systems
| |
– |
|
Identification of system requirements for the conversion and post-conversion periods |
| |
– |
|
We have assessed the impact on system requirements for the conversion and post-conversion periods and expect there will be no significant impact to applications
arising from the transition to IFRS |
Business activities: Financial covenants
| |
– |
|
Identification of impact on financial covenants and financing relationships |
| |
– |
|
Completion of any required renegotiations/changes |
| |
– |
|
The financial covenant requirements in our financing relationships are measured on the basis of Canadian GAAP in effect at the commencement of the various
agreements, and the transition to IFRS will therefore have no impact on our current financial covenant requirements |
| |
– |
|
We will maintain a process to compile our financial results on a historical Canadian GAAP basis and to monitor financial covenant requirements through to the
conclusion of our current financing relationships |
Business activities: Compensation arrangements
| |
– |
|
Identification of impact on compensation arrangements |
| |
– |
|
Assessment and implementation of required changes |
| |
– |
|
We have identified compensation policies that rely on indicators derived from the financial statements |
|
|
|
| |
|
| |
|
38 METHANEX
Annual Report 2010 Management’s Discussion & Analysis |
| |
– |
|
As part of the transition project, we will ensure that compensation arrangements incorporate IFRS results in accordance with the Company’s overall
compensation principles |
| |
– |
|
We held an information session to educate the Human Resources Committee of the Board about the impacts of the IFRS transition on compensation arrangements
|
Control activities: Internal control over financial reporting
| |
– |
|
For all accounting policy changes identified, assessment of the design and effectiveness of respective changes to internal controls over financial reporting
|
| |
– |
|
Implementation of appropriate changes |
| |
– |
|
We have identified the required accounting process changes that result from the application of IFRS accounting policies; these changes are not considered
significant |
| |
– |
|
We are completing the design, implementation and documentation of the accounting process changes that result from the application of IFRS accounting policies
|
Control activities: Disclosure controls and procedures
| |
– |
|
For all accounting policy changes identified, assessment of the design and effectiveness of respective changes to disclosure controls and procedures
|
| |
– |
|
Implementation of appropriate changes |
| |
– |
|
Throughout the transition period, we have continued to provide IFRS project updates in quarterly and annual disclosure documents |
IFRS 1 First-Time Adoption of International Financial Reporting Standards
Adoption of IFRS requires the application of IFRS 1, First-time Adoption of International Financial Reporting Standards, which provides guidance for an entity’s initial adoption of IFRS. IFRS 1 gives entities
adopting IFRS for the first time a number of optional exemptions and mandatory exceptions, in certain areas, to the general requirement for full retrospective application of IFRS. The following are the optional exemptions available under IFRS 1 that
the Company will elect on transition to IFRS. The list below and comments should not be regarded as a complete list of IFRS 1 that are available to the Company as a result of the transition to IFRS.
Business Combinations
Under IFRS 1 an
entity has the option to retroactively apply IFRS 3, Business Combinations, to all business combinations or may elect to apply the standard prospectively only to those business combinations that occur after the date of transition. The Company has
elected this exemption under IFRS 1, which removes the requirement to retrospectively restate all business combinations prior to the date of transition to IFRS.
Employee Benefits
We have defined benefit pension plans in Canada and Chile. IFRS 1 provides
an option to recognize all cumulative actuarial gains and losses on defined benefit pension plans existing at the date of transition immediately in retained earnings, rather than continuing to defer and amortize into the results of operations. The
Company currently has elected this exemption under IFRS 1. As at January 1, 2010 this results in a decrease to retained earnings of approximately $16 million, a decrease to other assets of $10 million and an increase to other long-term
liabilities of $6 million.
In comparison to Canadian GAAP for the year ended December 31, 2010, this has resulted in an increase in net earnings by
approximately $1 million as a result of lower pension expense due to this immediate recognition to retained earnings of
|
|
|
| |
|
| Management’s Discussion & Analysis Annual Report 2010 METHANEX 39
|
|
|
these actuarial losses on transition to IFRS. As at December 31, 2010, this resulted in a decrease to shareholders’ equity of approximately $16 million, a decrease to other assets of
$11 million and an increase to other long-term liabilities of $6 million.
Fair Value or Revaluation as Deemed Cost
IFRS 1 provides an option to allow a first-time IFRS adopter to elect to use the amount determined under a previous GAAP revaluation as the deemed
cost of an item of property, plant and equipment so long as the revaluation was broadly comparable to either fair value or cost or depreciated cost under IFRS. We consider our Canadian GAAP writedown of certain assets as a “revaluation broadly
comparable to fair value” and will elect the written down amount to be deemed IFRS cost. The IFRS carrying value of those assets on transition to IFRS is therefore consistent with the Canadian GAAP carrying value on the transition date.
Share-based Payment Transactions
IFRS 1 permits an exemption for the application of IFRS 2, Share-based Payments, to equity instruments granted before November 7, 2002 and those granted but
fully vested before the date of transition to IFRS. Accordingly, we have elected this exemption and will apply IFRS 2 for stock options granted after November 7, 2002 that are not fully vested at January 1, 2010.
Changes in Asset Retirement Obligations
Under IFRS, we are required to determine a best estimate of asset retirement obligations for all sites, whereas under Canadian GAAP, asset retirement obligations
were not recognized with respect to assets with indefinite or indeterminate lives. In addition, under IFRS a change in the market-based discount rate will result in a change in the measurement of the provision. We have elected to apply the IFRS 1
exemption whereby we have measured the asset retirement obligations at January 1, 2010 in accordance with the requirements in IAS 37 Provisions, estimated the amount that would have been in property, plant and equipment when the liabilities
first arose and discounted the transition date liability to that date using our best estimate of the historical risk-free discount rate. As at January 1, 2010, adjustments to the financial statements to recognize asset retirement obligations on
transition to IFRS are recognized as an increase to other long-term liabilities of approximately $5 million and an increase to property, plant and equipment of approximately $1 million, with the balancing amount recorded as a decrease to retained
earnings to reflect the depreciation expense and interest accretion since the date the liabilities first arose.
In comparison to Canadian GAAP at
December 31, 2010, recognition of asset retirement obligations resulted in an increase to other long-term liabilities of approximately $8 million and an increase to property, plant and equipment of approximately $4 million, with a corresponding
decrease to shareholders’ equity and no significant impact to net earnings.
Oil & Gas Assets
For a first-time adopter that has previously employed the full cost method in accounting for oil and natural gas exploration and development expenditures, IFRS 1
provides an exemption that allows entities to measure those assets at the transition date at amounts determined under the entity’s previous GAAP. We have elected under IFRS 1 to carry forward the Canadian GAAP oil and gas asset carrying value
as of January 1, 2010 as our balance on transition to IFRS.
Significant Impacts on Transition to IFRS
The Company has completed its initial assessment of the impacts of the transition to IFRS. Based on an analysis of Canadian GAAP and IFRS in effect at
December 31, 2010, we have identified several significant differences between our current accounting policies and those expected to apply in preparing IFRS consolidated financial statements. In the determination of what constitutes a
significant impact to our consolidated financial statements, we have identified the following:
| § |
|
Areas of difference between IFRS and Canadian GAAP that have a significant opening day transition financial statement impact.
|
| § |
|
Areas of difference between IFRS and Canadian GAAP that present greater risk of potential future financial statement impact.
|
| § |
|
Areas of potential future changes to IFRS that could have a significant financial statement impact. |
|
|
|
| |
|
| |
|
40 METHANEX
Annual Report 2010 Management’s Discussion & Analysis |
Information on those changes that management considers most significant to the Company is presented below.
Interest in Joint Ventures
Under Canadian
GAAP, our 63.1% interest in Atlas Methanol Company (Atlas) is accounted for using proportionate consolidation in the accounting for joint ventures. Current IFRS allows a choice between proportionate consolidation and equity accounting in the
accounting for joint ventures. On transition to IFRS, we have chosen to continue to apply proportionate consolidation in accounting for our interest in Atlas.
The IASB is currently proceeding on projects related to consolidation and joint venture accounting. The IASB is revising the definition of “control,” which is a criterion for consolidation accounting. In
addition, future changes to IFRS in the accounting for joint ventures are expected and these changes may remove the option for proportionate consolidation and allow only the equity method of accounting for such interests. The impact of applying
consolidation accounting or the equity method of accounting does not result in any change to net earnings or shareholders’ equity, but would result in a significant presentation impact.
The impact these projects may have on the conclusions related to the accounting treatment of our interest in joint ventures is currently unknown. We continue to monitor changes in accounting policies issued by the
IASB in this area.
Leases
Canadian GAAP requires an arrangement that at its inception can be fulfilled only through the use of a specific asset or assets, and which conveys a right to use
that asset, may be a lease or contain a lease, and therefore should be accounted for as a lease, regardless of whether it takes the legal form of a lease, and therefore should be recorded as an asset with a corresponding liability. However, Canadian
GAAP has grandfathering provisions that exempts contracts entered into before 2004 from these requirements.
IFRS has similar accounting requirements as
Canadian GAAP for lease-like arrangements, with IFRS requiring full retrospective application. We have long-term oxygen supply contracts for our Atlas and Titan methanol plants in Trinidad, executed prior to 2004, which are regarded as finance
leases under these standards. Accordingly, the oxygen supply contracts are required to be accounted for as finance leases from original inception of the lease. We measured the value of these finance leases and applied finance lease accounting
retrospectively from inception to January 1, 2010 to determine the opening day IFRS impact. As at January 1, 2010, this results in an increase to property, plant and equipment of $61 million and other long-term liabilities of $74 million,
with a corresponding decrease to retained earnings of $13 million.
In comparison to Canadian GAAP, for the year ended December 31, 2010, this
accounting treatment resulted in lower operating costs and higher interest and depreciation charges with no significant impact to net earnings. As at December 31, 2010, this resulted in an increase to property, plant and equipment of $55
million and other long-term liabilities of $69 million, with a corresponding decrease to shareholders’ equity of $14 million.
As part of their
global conversion project, the IASB and the U.S. Financial Accounting Standards Board (“FASB”) issued in August 2010 a joint Exposure Draft proposing that all leases would be required to be recognized on-balance sheet. We have a fleet of
ocean-going vessels under time charter agreements with terms up to 15 years. The proposed rules would require these time charter agreements to be recorded on-balance sheet resulting in a material increase to our assets and liabilities. The boards
expect to issue a final standard in mid-2011 with a likely effective date for the standard no earlier than 2014. We continue to monitor changes in accounting policies issued by the IASB in this area.
Impairment of Assets
If there is an
indication that an asset may be impaired, an impairment test must be performed. Under Canadian GAAP, this is a two-step impairment test in which (1) undiscounted future cash flows are compared to the carrying value; and (2) if those
undiscounted cash flows are less than the carrying value, the asset is written down to fair value. Under IFRS, an entity is required to assess, at the end of each reporting period, whether there is any indication that an asset may be impaired. If
such an indication exists, the entity shall estimate the recoverable amount of the asset by performing a one-step impairment test, which requires a comparison of the carrying value of the asset to the higher of value in use and fair value less costs
to sell. Value in use is defined as the present value of future cash flows expected to be derived from the asset in its current state.
|
|
|
| |
|
| Management’s Discussion & Analysis Annual Report 2010 METHANEX 41
|
|
|
As a result of this difference, in principle, impairment writedowns may be more likely under IFRS than are currently
identified and recorded under Canadian GAAP. The extent of any new writedowns, however, may be partially offset by the requirement under IAS 36, Impairment of Assets, to reverse any previous impairment losses where circumstances have changed such
that the impairments have been reduced. Canadian GAAP prohibits reversal of impairment losses. We have concluded that the adoption of these standards will not result in a change to the carrying value of our assets on transition to IFRS and for the
year ended December 31, 2010.
Provisions
Under Canadian GAAP, a provision is required to be recorded in the financial statements when required payment is considered “likely” and can be reasonably estimated. The threshold for recognition of
provisions under IFRS is lower than that under Canadian GAAP as provisions must be recognized if required payment is “probable.” Therefore, in principle, it is possible that there may be some provisions that would meet the recognition
criteria under IFRS that were not recognized under Canadian GAAP.
Other differences between IFRS and Canadian GAAP exist in relation to the measurement
of provisions, such as the methodology for determining the best estimate where there is a range of equally possible outcomes (IFRS uses the mid-point of the range, whereas Canadian GAAP uses the low end of the range), and the requirement under IFRS
for provisions to be discounted where material.
We have reviewed our positions and concluded that there is no adjustment to our financial statements on
transition to IFRS and for the year ended December 31, 2010 arising from the application of IFRS provisions recognition and measurement guidance.
Share-based Payments
During 2010, we granted share appreciation rights (SARs) and tandem share
appreciation rights (TSARs) in connection with our employee long-term incentive compensation plan. A SAR gives the holder a right to receive a cash payment equal to the amount by which the market price of the Company’s common shares exceeds the
exercise price of a unit. A TSAR gives the holder the choice between exercising a regular stock option or surrendering the option for a cash payment equal to the amount by which the market price of the Company’s common share exceeds the
exercise price of a unit. All SARs and TSARs have a maximum term of seven years with one-third vesting each year after the date of grant.
Under Canadian
GAAP, both SARs and TSARs are accounted for using the intrinsic value method. The intrinsic value related to SARs and TSARs is measured by the amount the market price of the Company’s common shares exceeds the exercise price of a unit.
Changes in intrinsic value each period are recognized in earnings for the proportion of the service that has been rendered at each reporting date. Under IFRS, SARs and TSARs are required to be accounted for using a fair value method. The fair value
related to SARs and TSARs is measured using an option pricing model. Changes in fair value determined using an option pricing model each period are recognized in earnings for the proportion of the service that has been rendered at each reporting
date.
The fair value determined using an option pricing model will be higher than the intrinsic value due to the time value included in the fair value.
Accordingly, it is expected that the difference between the accounting expense under IFRS compared with Canadian GAAP would be higher in the beginning life of a SAR or TSAR with this difference narrowing as time passes and the total accounting
expense ultimately being the same on the date of exercise.
The SARs and TSARs were granted in March 2010, and therefore, there is no adjustment required
to our financial statements on January 1, 2010. The difference in fair value method under IFRS compared with the intrinsic value method under Canadian GAAP, is the primary reason for the decrease to net earnings of approximately $5 million,
increase to other long-term liabilities of approximately $6 million and corresponding decrease to shareholders’ equity for the year ended December 31, 2010, respectively.
|
|
|
| |
|
| |
|
42 METHANEX
Annual Report 2010 Management’s Discussion & Analysis |
Summary of Adjustments to Financial Statements
The table below provides a summary of the adjustments to our balance sheet on transition to IFRS at January 1, 2010 and at December 31, 2010:
|
|
|
|
|
|
|
|
|
| ($ MILLIONS) |
|
January 1, 2010 |
|
|
DECEMBER 31, 2010 |
|
| Total assets per Canadian GAAP |
|
$ |
2,923 |
|
|
$ |
3,070 |
|
| Leases (a) |
|
|
61 |
|
|
|
55 |
|
| Employee benefits (b) |
|
|
(10 |
) |
|
|
(11 |
) |
| Asset retirement obligations (c) |
|
|
1 |
|
|
|
4 |
|
| Borrowing costs (d) |
|
|
8 |
|
|
|
24 |
|
| Total assets per IFRS |
|
$ |
2,984 |
|
|
$ |
3,142 |
|
| Total liabilities per Canadian GAAP |
|
$ |
1,687 |
|
|
$ |
1,794 |
|
| Leases (a) |
|
|
74 |
|
|
|
69 |
|
| Employee benefits (b) |
|
|
6 |
|
|
|
6 |
|
| Asset retirement obligations (c) |
|
|
5 |
|
|
|
8 |
|
| Borrowing costs (d) |
|
|
3 |
|
|
|
10 |
|
| Uncertain tax positions (e) |
|
|
5 |
|
|
|
7 |
|
| Share-based payments (f) |
|
|
– |
|
|
|
6 |
|
| Deferred tax impact of adjustments (g) |
|
|
(8 |
) |
|
|
(9 |
) |
| Reclassification of non-controlling interest (h) |
|
|
(136 |
) |
|
|
(156 |
) |
| Total liabilities per IFRS |
|
$ |
1,637 |
|
|
$ |
1,733 |
|
| Total shareholders’ equity per Canadian GAAP |
|
$ |
1,236 |
|
|
$ |
1,277 |
|
| Leases (a) |
|
|
(13 |
) |
|
|
(14 |
) |
| Employee benefits (b) |
|
|
(16 |
) |
|
|
(16 |
) |
| Asset retirement obligations (c) |
|
|
(4 |
) |
|
|
(4 |
) |
| Borrowing costs (d) |
|
|
5 |
|
|
|
14 |
|
| Uncertain tax positions (e) |
|
|
(5 |
) |
|
|
(7 |
) |
| Share-based payments (f) |
|
|
– |
|
|
|
(6 |
) |
| Deferred tax impact of adjustments (g) |
|
|
8 |
|
|
|
9 |
|
| Reclassification of non-controlling interest (h) |
|
|
136 |
|
|
|
156 |
|
| Total shareholders’ equity per IFRS |
|
$ |
1,347 |
|
|
$ |
1,409 |
|
| |
|
|
|
|
|
|
|
|
| Total liabilities and shareholders’ equity per IFRS |
|
$ |
2,984 |
|
|
$ |
3,142 |
|
The table
below provides a summary of the adjustments to our income statement for the year ended December 31, 2010:
|
|
|
|
|
| ($ MILLIONS) |
|
2010 |
|
| Net income per Canadian GAAP |
|
$ |
102 |
|
| Employee benefits (b) |
|
|
1 |
|
| Uncertain tax positions (e) |
|
|
(2 |
) |
| Share-based payments (f) |
|
|
(5 |
) |
| Deferred tax impact of adjustments (g) |
|
|
1 |
|
| Net income per IFRS |
|
$ |
98 |
|
The items noted above in the reconciliations of the balance sheet and income statement from Canadian GAAP to IFRS are described below:
(a) Leases
For a description of this reconciling item, see discussion under Significant
Impacts on Transition to IFRS above.
(b) Employee Benefits
For a description of this reconciling item, see discussion under IFRS 1 First-time Adoption of International Financial Reporting Standards above.
|
|
|
| |
|
| Management’s Discussion & Analysis Annual Report 2010 METHANEX 43
|
|
|
(c) Asset Retirement Obligations
For a description of this reconciling item, see discussion under IFRS 1 First-time Adoption of International Financial Reporting Standards above.
(d) Borrowing Costs
IAS 23 prescribes the accounting treatment and eligibility of borrowing
costs. We have entered into interest rate swap contracts to hedge the variability in LIBOR-based interest payments on our Egypt limited recourse debt facilities. Under Canadian GAAP, cash settlements for these swaps during construction are recorded
in accumulated other comprehensive income (AOCI). Under IFRS, the cash settlements during construction are recorded to property, plant and equipment (PP&E). Accordingly, there is an increase to PP&E of approximately $8 million and $24
million, an increase to AOCI of approximately $5 million and $14 million (our 60% portion) and an increase in non-controlling interest of approximately $3 million and $10 million as of January 1, 2010 and December 31, 2010, respectively,
with no net impact on earnings.
(e) Uncertain Tax Positions
IAS 12 prescribes recognition and measurement criteria of a tax position taken or expected to be taken in a tax return. As at January 1, 2010, this resulted in an increase to income tax liabilities and a
decrease to retained earnings of approximately $5 million in comparison to Canadian GAAP. For the year ended December 31, 2010, this has resulted in a decrease in net earnings by $2 million with a corresponding increase to income tax
liabilities.
(f) Share-Based Payments
For a description of this reconciling item, see discussion under Significant Impacts on Transition to IFRS above.
(g) Deferred Tax Impact of Adjustments
This adjustment represents the income tax effect of the
adjustments related to accounting differences between Canadian GAAP and IFRS. As at January 1, 2010, this has resulted in a decrease to future income tax liabilities and an increase to retained earnings of approximately $8 million. For the year
ended December 31, 2010, this has resulted in an increase in net earnings by $1 million with a corresponding decrease to future income tax liabilities.
(h) Reclassification of Non-Controlling Interest from Liabilities
We have a 60% interest in
EMethanex, the Egyptian company through which we have developed the Egyptian methanol project. We account for this investment using consolidation accounting, which results in 100% of the assets and liabilities of EMethanex being included in our
financial statements. The other investors’ interest in the project is presented as “non-controlling interest”. Under Canadian GAAP, the non-controlling interest is classified as a liability, whereas under IFRS the non-controlling
interest is classified as equity, but presented separately from the parent’s shareholders’ equity. This reclassification results in a decrease to liabilities and an increase in equity of approximately $136 million and $156 million as of
January 1, 2010 and December 31, 2010, respectively.
The discussion above on IFRS 1 elections, significant accounting policy changes and
adjustments to the financial statements on transition to IFRS is provided to allow readers to obtain a better understanding of our IFRS changeover plan and the resulting potential effects on our consolidated financial statements. Readers are
cautioned, however, that it may not be appropriate to use such information for any other purpose. IFRS employs a conceptual framework that is similar to Canadian GAAP; however, significant differences exist in certain matters of recognition,
measurement and disclosure. In order to allow the users of the financial statements to better understand these differences and the resulting changes to our financial statements, we have provided a description of the significant IFRS 1 exemptions we
intend to elect, a description of significant impacts related to the IFRS transition project as well as the above reconciliations between Canadian GAAP and IFRS for total assets, total liabilities, shareholders’ equity and net earnings. While
this information does not represent the official adoption of IFRS, it provides an indication of the major differences identified to date based on the current IFRS guidance, relative to our Canadian GAAP accounting policies at transition and for the
year ended December 31, 2010. This discussion reflects our most recent assumptions and expectations; circumstances may arise, such as changes in IFRS, regulations or economic conditions, which could change these assumptions or expectations. Any
further changes to the election of IFRS 1 exemptions, the selection of IFRS accounting policies and any related adjustments
|
|
|
| |
|
| |
|
44 METHANEX
Annual Report 2010 Management’s Discussion & Analysis |
to the financial statements would be subject to approval by the Audit, Finance and Risk Committee prior to being finalized. Accordingly, the discussion above is subject to change.
SUPPLEMENTAL NON-GAAP MEASURES
In addition
to providing measures prepared in accordance with Canadian GAAP, we present certain supplemental non-GAAP measures. These are Adjusted EBITDA, operating income and cash flows from operating activities before changes in non-cash working capital.
These measures do not have any standardized meaning prescribed by Canadian GAAP and therefore are unlikely to be comparable to similar measures presented by other companies. We believe these measures are useful in evaluating the operating
performance and liquidity of our ongoing business. These measures should be considered in addition to, and not as a substitute for, net income, cash flows and other measures of financial performance and liquidity reported in accordance with Canadian
GAAP.
Net Income before Unusual Item and Diluted Net Income before Unusual Item per Share
These supplemental non-GAAP measures are provided to assist readers in comparing earnings from one period to another without the impact of unusual items that are
considered by management to be non-operational and/or non-recurring. Diluted income before unusual items per share has been calculated by dividing net income before unusual item by the diluted weighted average number of common shares outstanding.
The following table shows a reconciliation of net income to net income before unusual item and the calculation of diluted net income before unusual item
per share:
|
|
|
|
|
|
|
|
|
| ($ MILLIONS, EXCEPT SHARES OR PER SHARE AMOUNTS) |
|
2010 |
|
|
2009 |
|
|
|
|
|
|
|
|
|
|
| Net income |
|
$ |
101.7 |
|
|
$ |
0.7 |
|
| Gain on sale of Kitimat assets |
|
|
(22.2 |
) |
|
|
– |
|
| Net income before unusual item |
|
$ |
79.5 |
|
|
$ |
0.7 |
|
| Diluted weighted average number of common shares (millions) |
|
|
93.5 |
|
|
|
92.7 |
|
| Diluted net income per share before unusual item |
|
$ |
0.85 |
|
|
$ |
0.01 |
|
Adjusted EBITDA
This supplemental non-GAAP measure is provided to help readers determine our ability to generate cash from operations. We believe this measure is useful in
assessing performance and highlighting trends on an overall basis. We also believe Adjusted EBITDA is frequently used by securities analysts and investors when comparing our results with those of other companies. Adjusted EBITDA differs from the
most comparable GAAP measure, cash flows from operating activities, primarily because it does not include changes in non-cash working capital, stock-based compensation expense and other non-cash items net of cash payments, interest expense, interest
and other income, and current income taxes.
The following table shows a reconciliation of cash flows from operating activities to Adjusted EBITDA:
|
|
|
|
|
|
|
|
|
| ($ MILLIONS) |
|
2010 |
|
|
2009 |
|
| Cash flows from operating activities |
|
$ |
153 |
|
|
$ |
110 |
|
| Add (deduct): |
|
|
|
|
|
|
|
|
| Changes in non-cash working capital |
|
|
99 |
|
|
|
19 |
|
| Other cash payments |
|
|
6 |
|
|
|
11 |
|
| Stock-based compensation expense |
|
|
(31 |
) |
|
|
(12 |
) |
| Other non-cash items |
|
|
(8 |
) |
|
|
(8 |
) |
| Interest expense |
|
|
24 |
|
|
|
27 |
|
| Interest and other income |
|
|
(3 |
) |
|
|
– |
|
| Income taxes – current |
|
|
27 |
|
|
|
(5 |
) |
| Adjusted EBITDA |
|
$ |
267 |
|
|
$ |
142 |
|
|
|
|
| |
|
| Management’s Discussion & Analysis Annual Report 2010 METHANEX 45
|
|
|
Operating Income and Cash Flows from Operating Activities before Changes in Non-Cash Working
Capital
Operating income and cash flows from operating activities before changes in non-cash working capital are reconciled to Canadian GAAP
measures in our consolidated statement of income and consolidated statement of cash flows, respectively.
QUARTERLY FINANCIAL DATA
(UNAUDITED)
|
|
|
|
|
|
|
|
|
|
|
|
|
|
|
|
|
| ($ MILLIONS, EXCEPT WHERE NOTED) |
|
THREE MONTHS ENDED |
|
| |
DEC 31 |
|
|
SEP 30 |
|
|
JUN 30 |
|
|
MAR 31 |
|
| 2010 |
|
|
|
|
|
|
|
|
|
|
|
|
|
|
|
|
| Revenue |
|
$ |
570 |
|
|
$ |
481 |
|
|
$ |
449 |
|
|
$ |
467 |
|
| Net income |
|
|
28 |
|
|
|
33 |
|
|
|
12 |
|
|
|
29 |
|
| Net income before unusual item |
|
|
28 |
|
|
|
11 |
|
|
|
12 |
|
|
|
29 |
|
| Basic net income per share |
|
|
0.30 |
|
|
|
0.36 |
|
|
|
0.13 |
|
|
|
0.32 |
|
| Basic net income per share before unusual item |
|
|
0.30 |
|
|
|
0.11 |
|
|
|
0.13 |
|
|
|
0.32 |
|
| Diluted net income per share |
|
|
0.30 |
|
|
|
0.35 |
|
|
|
0.13 |
|
|
|
0.31 |
|
| Diluted net income per share before unusual item |
|
|
0.30 |
|
|
|
0.11 |
|
|
|
0.13 |
|
|
|
0.31 |
|
|
|
|
|
|
| 2009 |
|
|
|
|
|
|
|
|
|
|
|
|
|
|
|
|
| Revenue |
|
$ |
382 |
|
|
$ |
317 |
|
|
$ |
246 |
|
|
$ |
254 |
|
| Net income (loss) |
|
|
26 |
|
|
|
(1 |
) |
|
|
(6 |
) |
|
|
(18 |
) |
| Basic net income (loss) per share |
|
|
0.28 |
|
|
|
(0.01 |
) |
|
|
(0.06 |
) |
|
|
(0.20 |
) |
| Diluted net income (loss) per share |
|
|
0.28 |
|
|
|
(0.01 |
) |
|
|
(0.06 |
) |
|
|
(0.20 |
) |
A discussion and
analysis of our results for the fourth quarter of 2010 is set out in our fourth quarter of 2010 Management’s Discussion and Analysis filed with Canadian Securities Administrators and the U.S. Securities and Exchange Commission and incorporated
herein by reference.
SELECTED ANNUAL INFORMATION
|
|
|
|
|
|
|
|
|
|
|
|
|
| ($ MILLIONS, EXCEPT WHERE NOTED) |
|
2010 |
|
|
2009 |
|
|
2008 |
|
| Revenue |
|
$ |
1,967 |
|
|
$ |
1,198 |
|
|
$ |
2,314 |
|
| Net income |
|
|
102 |
|
|
|
1 |
|
|
|
169 |
|
| Basic net income per share |
|
|
1.10 |
|
|
|
0.01 |
|
|
|
1.79 |
|
| Diluted net income per share |
|
|
1.09 |
|
|
|
0.01 |
|
|
|
1.78 |
|
| Diluted net income per share before unusual item |
|
|
0.85 |
|
|
|
0.01 |
|
|
|
1.78 |
|
| Cash dividends declared per share |
|
|
0.620 |
|
|
|
0.620 |
|
|
|
0.605 |
|
| Total assets |
|
|
3,070 |
|
|
|
2,923 |
|
|
|
2,799 |
|
| Total long-term financial liabilities |
|
|
1,025 |
|
|
|
982 |
|
|
|
864 |
|
CONTROLS AND PROCEDURES
Disclosure Controls and Procedures
Disclosure controls and procedures are those controls and procedures that are designed to ensure that the information required to be disclosed in the filings under
applicable securities regulations is recorded, processed, summarized and reported within the time periods specified. As at December 31, 2010, under the supervision and with the participation of our management, including our Chief Executive
Officer and Chief Financial Officer, we conducted an evaluation of the effectiveness of the design and operation of the Company’s disclosure controls and procedures. Based on this evaluation, the Chief Executive Officer and Chief Financial
Officer have concluded our disclosure controls and procedures are effective.
Management’s Annual Report on Internal Control
over Financial Reporting
Management is responsible for establishing and maintaining adequate internal control over financial reporting. Internal
control over financial reporting includes those policies and procedures that: (1) pertain to the maintenance of records that, in reasonable detail, accurately and fairly reflect the transactions and dispositions of our assets; (2) provide
reasonable assurance that transactions are recorded as necessary to permit preparation of financial statements in accordance with generally accepted accounting principles, and that our receipts and expenditures are being made only in accordance with
authorizations of our management and directors; and (3) provide reasonable assurance regarding prevention or timely detection of unauthorized acquisition, use or disposition of our assets that could have a material effect on the financial
statements.
|
|
|
| |
|
| |
|
46 METHANEX
Annual Report 2010 Management’s Discussion & Analysis |
The design of any system of controls and procedures is based in part upon certain assumptions about the likelihood of
future events. There can be no assurance that any design will succeed in achieving its stated goals under all potential future conditions, regardless of how remote.
Under the supervision and with the participation of our Chief Executive Officer and our Chief Financial Officer, management conducted an evaluation of the effectiveness of our internal control over financial
reporting, as of December 31, 2010, based on the framework set forth in Internal Control – Integrated Framework issued by the Committee
of Sponsoring Organizations of the Treadway Commission (COSO). Based on its evaluation under this framework, management concluded that our internal control over financial reporting was effective as of that date.
KPMG LLP an independent registered public accounting firm that audited and reported on our consolidated financial statements, has issued an attestation report on
the effectiveness of our internal control over financial reporting as of December 31, 2010. The attestation report is included on the second page of our consolidated financial statements.
Changes in Internal Control over Financial Reporting
There have been no changes during the year ended December 31, 2010 to internal control over financial reporting that have materially affected, or are reasonably likely to materially affect, internal control
over financial reporting.
FORWARD-LOOKING STATEMENTS
This 2010 Annual Report contains forward-looking statements with respect to us and the chemical industry. Statements that include the words “believes,” “expects,” “may,”
“will,” “should,” “seeks,” “intends,” “plans,” “estimates,” “anticipates,” or the negative version of those words or other comparable terminology and similar statements of a
future or forward-looking nature identify forward-looking statements.
More particularly and without limitation, any statements regarding the following
are forward-looking statements:
| § |
|
expected demand for methanol and its derivatives, |
| § |
|
expected new methanol supply and timing for start-up of the same, |
| § |
|
expected shut downs (either temporary or permanent) or re-starts of existing methanol supply (including our own facilities), including,
without limitation, timing of planned maintenance outages, |
| § |
|
expected methanol and energy prices, |
| § |
|
expected levels and timing of natural gas supply to our plants, including without limitation, levels of natural gas supply from investments in
natural gas exploration and development in Chile and New Zealand and availability of economically priced natural gas in Chile, New Zealand and Canada, |
| § |
|
capital committed by third parties towards future natural gas exploration in Chile and New Zealand, |
| § |
|
expected capital expenditures, including without limitation, those to support natural gas exploration and development in Chile and New Zealand
and the restart of our idled methanol facilities, |
| § |
|
anticipated production rates of our plants, including without limitation, our Chilean facilities, the new methanol plant in Egypt which is
currently in the
|
| |
|
commissioning phase and the restart of our Medicine Hat facility expected in the second quarter of 2011, |
| § |
|
expected operating costs, including natural gas feedstock costs and logistics costs, |
| § |
|
expected tax rates or resolutions to tax disputes, |
| § |
|
expected cash flows and earnings capability, |
| § |
|
anticipated completion date of, and cost to complete, our methanol project in Egypt and the Medicine Hat restart project,
|
| § |
|
ability to meet covenants associated with our long-term debt obligations, including without limitation, the Egypt limited recourse debt
facilities which have conditions associated with operational completion of the plant and related mortgages which require actions by governmental entities, |
| § |
|
availability of committed credit facilities and other financing, |
| § |
|
shareholder distribution strategy and anticipated distributions to shareholders, |
| § |
|
commercial viability of, or ability to execute, future projects or capacity expansions,
|
|
|
|
| |
|
| Management’s Discussion & Analysis Annual Report 2010 METHANEX 47
|
|
|
| § |
|
financial strength and ability to meet future financial commitments, |
| § |
|
expected impact of regulatory actions, including assessments of carcinogenicity of methanol, formaldehyde and MTBE, the imposition of
formaldehyde emission limits and legislation related to CO2 emissions in New Zealand and Canada,
|
| § |
|
expected global or regional economic activity (including industrial production levels), |
| § |
|
expected actions of governments, gas suppliers, courts, tribunals or other third parties, and |
| § |
|
expected impact on our results of operations in Egypt and our financial condition as a consequence of actions taken by the Government of Egypt
and its agencies. |
We believe that we have a reasonable basis for
making such forward-looking statements. The forward-looking statements in this document are based on our experience, our perception of trends, current conditions and expected future developments as well as other factors. Certain material factors or
assumptions were applied in drawing the conclusions or making the forecasts or projections that are included in these forward-looking statements, including, without limitation, future expectations and assumptions concerning the following:
| § |
|
supply of, demand for, and price of, methanol, methanol derivatives, natural gas, oil and oil derivatives, |
| § |
|
success of natural gas exploration in Chile and New Zealand and our ability to procure economically priced natural gas in Chile, New Zealand
and Canada, |
| § |
|
production rates of our facilities, including without limitation, our Chilean facilities, the new methanol plant in Egypt which is currently
in the commissioning phase and the restart of our Medicine Hat facility expected in the second quarter of 2011, |
| § |
|
receipt or issuance of third party consents or approvals, including without limitation, governmental registrations of land title and related
mortgages in Egypt, governmental approvals related to natural gas exploration rights, rights to purchase natural gas or the establishment of new fuel standards, |
| § |
|
operating costs including natural gas feedstock and logistics costs, capital costs, tax rates, cash flows, foreign exchange rates and interest
rates, |
| § |
|
timing of completion and cost of our methanol project in Egypt and the Medicine Hat restart project, |
| § |
|
ability to meet covenants associated with our long-term debt obligations, including without limitation, the Egypt limited recourse debt
facilities which have conditions associated with operational completion of the plant and completion of certain land title registrations and related mortgages which require actions by governmental entities, |
| § |
|
availability of committed credit facilities and other financing, |
| § |
|
global and regional economic activity (including industrial production levels), |
| § |
|
absence of a material negative impact from major natural disasters or global pandemics, |
| § |
|
absence of a material negative impact from changes in laws or regulations, and |
| § |
|
enforcement of contractual arrangements and ability to perform contractual obligations by customers, suppliers and other third parties.
|
However, forward-looking statements, by their
nature, involve risks and uncertainties that could cause actual results to differ materially from those contemplated by the forward-looking statements. The risks and uncertainties primarily include those attendant with producing and marketing
methanol and successfully carrying out major capital expenditure projects in various jurisdictions, including without limitation:
| § |
|
conditions in the methanol and other industries, including fluctuations in the supply, demand and price for methanol and its derivatives,
including demand for methanol for energy uses, |
| § |
|
the price of natural gas, oil and oil derivatives,
|
| § |
|
the success of natural gas exploration and development activities in southern Chile and New Zealand and our ability to obtain any additional
gas in Chile, New Zealand and Canada on commercially acceptable terms, |
| § |
|
the timing of start-up and cost to complete our new methanol joint venture project in Egypt,
|
|
|
|
| |
|
| |
|
48 METHANEX
Annual Report 2010 Management’s Discussion & Analysis |
| § |
|
the ability to successfully carry out corporate initiatives and strategies, |
| § |
|
actions of competitors and suppliers, |
| § |
|
actions of governments and governmental authorities, including without limitation, implementation of policies or other measures that could
impact the supply or demand for methanol or its derivatives, |
| § |
|
changes in laws or regulations,
|
| § |
|
import or export restrictions, anti-dumping measures, increases in duties, taxes and government royalties, and other actions by governments
that may adversely affect our operations or existing contractual arrangements, |
| § |
|
world-wide economic conditions and conditions, and |
| § |
|
other risks described in our 2010 Management’s Discussion and Analysis.
|
Having in mind these and other factors, investors and other readers are cautioned not to place undue reliance on
forward-looking statements. They are not a substitute for the exercise of one’s own due diligence and judgment. The outcomes anticipated in forward-looking statements may not occur and we do not undertake to update forward-looking statements
except as required by applicable securities laws.
|
|
|
| |
|
| Management’s Discussion & Analysis Annual Report 2010 METHANEX 49
|
|
|