UNITED STATES
SECURITIES AND EXCHANGE COMMISSION
Washington, D.C. 20549
Form 10-K
|
☑
|
ANNUAL REPORT PURSUANT TO SECTION 13 OR 15(d) OF THE SECURITIES EXCHANGE ACT OF 1934 FOR THE FISCAL YEAR ENDED AUGUST 31, 2018
|
|
OR
|
|
|
☐
|
TRANSITION REPORT PURSUANT TO SECTION 13 OR 15(d) OF THE SECURITIES EXCHANGE ACT OF 1934 FOR THE TRANSITION PERIOD FROM ___ TO ___
|

Franklin Covey Co.
(Exact name of registrant as specified in its charter)
|
Utah
|
|
1-11107
|
|
87-0401551
|
|
(State or other jurisdiction of incorporation or organization)
|
|
(Commission File No.)
|
|
(IRS Employer Identification No.)
|
2200 West Parkway Boulevard
Salt Lake City, Utah 84119-2331
(Address of principal executive offices, including zip code)
Registrant's telephone number, including area code: (801) 817-1776
Securities registered pursuant to Section 12(b) of the Act:
|
Title of Each Class
|
Name of Each Exchange on Which Registered
|
|
|
Common Stock, $.05 Par Value
|
|
New York Stock Exchange
|
Securities registered pursuant to Section 12(g) of the Act:
None
Indicate by check mark if the registrant is a well-known seasoned issuer, as defined in Rule 405 of the Securities Act. Yes o No ☑
Indicate by check mark if the registrant is not required to file reports pursuant to Section 13 or Section 15(d) of the Act. Yes ☐ No ☑
Indicate by check mark whether the Registrant (1) has filed all reports required to be filed by Section 13 or 15(d) of the Securities Exchange Act of 1934 during the preceding 12 months (or for such shorter period that the Registrant was required to file such reports), and (2) has been subject to such filing requirements for the past 90 days. Yes ☑ No ☐
Indicate by check mark whether the registrant has submitted electronically and posted on its corporate Website, if any, every Interactive Data File required to be submitted and posted pursuant to Rule 405 of Regulation S-T (§232.405 of this chapter) during the preceding 12 months (or for such shorter period that the registrant was required to submit and post such files). Yes ☑ No ☐
Indicate by check mark if disclosure of delinquent filers pursuant to Item 405 of Regulation S-K (§229.405 of this chapter) is not contained herein, and will not be contained, to the best of Registrant's knowledge, in definitive proxy or information statements incorporated by reference in Part III of this Form 10-K or any amendment to this Form 10-K. ☐
Indicate by check mark whether the registrant is a large accelerated filer, an accelerated filer, a non-accelerated filer, a smaller reporting company, or an emerging growth company. See definitions of "large accelerated filer," "accelerated filer," "smaller reporting company," and "emerging growth company" in Rule 12b-2 of the Exchange Act:
|
Large accelerated filer
|
£
|
Accelerated filer
|
☑
|
|
Non-accelerated filer
|
£
|
Smaller reporting company
|
☑
|
|
Emerging growth company
|
£
|
If an emerging growth company, indicate by check mark if the registrant has elected not to use the extended transition period for complying with any new or revised financial accounting standards provided pursuant to Section 13(a) of the Exchange Act. ☐
Indicate by check mark whether the registrant is a shell company (as defined in Rule 12b-2 of the Exchange Act).
Yes ☐ No ☑
As of February 28, 2018, the aggregate market value of the Registrant's Common Stock held by non-affiliates of the Registrant was approximately $172.6 million, which was based upon the closing price of $25.90 per share as reported by the New York Stock Exchange.
As of October 31, 2018, the Registrant had 13,918,219 shares of Common Stock outstanding.
DOCUMENTS INCORPORATED BY REFERENCE
Parts of the Registrant's Definitive Proxy Statement for the Annual Meeting of Shareholders, which is scheduled to be held on January 25, 2019, are incorporated by reference in Part III of this Form 10-K.
|
FranklinCovey Co.
|
||||
|
|
||||
| 2 | ||||
|
Business
|
2 | |||
|
Risk Factors
|
9 | |||
|
Unresolved Staff Comments
|
19 | |||
|
Properties
|
20 | |||
|
Legal Proceedings
|
20 | |||
|
Mine Safety Disclosures
|
20 | |||
| 21 | ||||
|
Market for the Registrant's Common Equity, Related Shareholder Matters, and Issuer Purchases of Equity Securities
|
21 | |||
|
Selected Financial Data
|
24 | |||
|
Management's Discussion and Analysis of Financial Condition and Results of Operations
|
25 | |||
|
Quantitative and Qualitative Disclosures About Market Risk
|
49 | |||
|
Financial Statements and Supplementary Data
|
50 | |||
|
Changes in and Disagreements With Accountants on Accounting and Financial Disclosure
|
95 | |||
|
Controls and Procedures
|
95 | |||
|
Other Information
|
96 | |||
| 96 | ||||
|
Directors, Executive Officers and Corporate Governance
|
96 | |||
|
Executive Compensation
|
97 | |||
|
Security Ownership of Certain Beneficial Owners and Management and Related Stockholder Matters
|
97 | |||
|
Certain Relationships and Related Transactions, and Director Independence
|
98 | |||
|
Principal Accountant Fees and Services
|
98 | |||
| 99 | ||||
|
Exhibits and Financial Statement Schedules
|
99 | |||
|
Form 10-K Summary
|
103 | |||
| 104 | ||||
Disclosure Regarding Forward-Looking Statements
This Annual Report on Form 10-K contains "forward-looking statements" within the meaning of Section 27A of the Securities Act of 1933, as amended (the Securities Act), and Section 21E of the Securities Exchange Act of 1934, as amended (the Exchange Act), and such forward-looking statements involve risks and uncertainties. Statements about future sales, costs, margins, cost savings, foreign currency exchange rates, earnings, earnings per share, cash flows, plans, objectives, expectations, growth, or profitability are forward-looking statements based on management's estimates, assumptions, and projections. Words such as "could," "may," "will," "should," "likely," "anticipates," "expects," "intends," "plans," "projects," "believes," "estimates," and variations on such words, including similar expressions, are used to identify these forward-looking statements. These forward-looking statements are only predictions, subject to risks and uncertainties, and actual results could differ materially from those discussed in this, and other reports, filed with the Securities and Exchange Commission (SEC) and elsewhere. Forward-looking statements are not guarantees of future performance and involve risks, uncertainties, and assumptions that are difficult to predict. Risks, uncertainties, and other factors that might cause such differences, some of which could be material, include, but are not limited to, the factors discussed under the section of this report entitled "Risk Factors."
Forward-looking statements in this report are based on management's current views and assumptions regarding future events and speak only as of the date when made. Franklin Covey Co. undertakes no obligation to publicly update or revise any forward-looking statements, whether as a result of new information, future events or otherwise, except as required by the federal securities laws.
In this Annual Report on Form 10-K, unless the context requires otherwise, the terms "the Company," "Franklin Covey," "us," we," and "our" refer to Franklin Covey Co. and its subsidiaries.
General Information
Franklin Covey is a global company focused on organizational performance improvement. Our mission is to "enable greatness in people and organizations everywhere," and our global structure is designed to help individuals and organizations achieve sustained superior performance through changes in human behavior. From the foundational work of Dr. Stephen R. Covey in leadership and personal effectiveness, and Hyrum W. Smith in productivity and time management, we have developed deep expertise that extends to helping organizations and individuals achieve lasting behavioral change in seven crucial areas: Leadership, Execution, Productivity, Trust, Sales Performance, Customer Loyalty, and Educational Improvement. We believe that our clients are able to utilize our content and offerings to create cultures whose hallmarks are high-performing, collaborative individuals, led by effective, trust building leaders who execute with excellence and deliver measurably improved results for all of their key stakeholders.
The Company was incorporated in 1983 under the laws of the state of Utah, and we merged with the Covey Leadership Center in 1997 to form Franklin Covey Co. Our consolidated net sales for the fiscal year ended August 31, 2018 totaled $209.8 million and our shares of common stock are traded on the New York Stock Exchange (NYSE) under the ticker symbol "FC."
Our fiscal year ends on August 31 of each year. Unless otherwise noted, references to fiscal years apply to the 12 months ended August 31 of the specified year.
The Company's principal executive offices are located at 2200 West Parkway Boulevard, Salt Lake City, Utah 84119-2331, and our telephone number is (801) 817‑1776.
Business Development
During fiscal 2018, we made significant investments in people and content to sell and support the All Access Pass (AAP), sought to innovate and improve the client experience and technology associated with the AAP and Leader in Me online, and worked to integrate the capabilities and content obtained in fiscal 2017 business acquisitions into our mix of available services and products. During fiscal 2016, we introduced the All Access Pass, which we believe is a ground-breaking service that allows our clients unlimited access to our content through an electronic portal. We believe the All Access Pass is a revolutionary and innovative way to deliver our content to clients of various sizes, including large, multinational organizations in a flexible and cost-effective manner. Clients may utilize complete offerings such as The 7 Habits of Highly Effective People and The 5 Choices to Extraordinary Productivity, or use individual concepts from any of our well-known offerings to create a custom solution to fit their organizational or individual training needs. During fiscal 2018, we invested in additional implementation specialists to provide our clients with the direction necessary to create meaningful impact journeys using our tools and content. An impact journey is a customized plan to utilize the content and offerings on the AAP to achieve a client's specific goals and to provide them with the keys to obtain maximum value from the pass. We also completed the translation of AAP materials into 15 additional languages, which allows the AAP to be used effectively by multinational entities and provides for greater international sales opportunities.
We also used additional capital during fiscal 2018 to complete significant upgrades of the AAP portal. Since the AAP platform is relatively new, we are constantly seeking to improve our clients' experience with the portal through new and innovative technology, content, and impact journeys. We believe that continued investments in personnel, content, and technological innovation are key to subscription service renewals and the overall growth of our offerings, especially through the All Access Pass.
In addition to opening three new sales offices in China in fiscal 2017, during the third and fourth quarter of fiscal 2017, we acquired the following businesses:
|
·
|
Robert Gregory Partners – In May 2017, we acquired the assets of Robert Gregory Partners, LLC (RGP), a corporate coaching firm with expertise in executive coaching, transition acceleration coaching, leadership development coaching, implementation coaching, and consulting.
|
|
·
|
Jhana Education – In July 2017, we acquired the stock of Jhana Education (Jhana), a company that specializes in the creation and dissemination of relevant, bite-sized content and learning tools for leaders and managers.
|
During fiscal 2018 we integrated the coaching expertise of RGP into our broad variety of available services and integrated the bite-sized content and tools from Jhana into our All Access Pass and other offerings. We anticipate that these business acquisitions will continue to provide additional sales opportunities and benefits to our clients.
For further information on the impacts of these activities on our operations, refer to the Management's Discussion and Analysis of Financial Condition and Results of Operations as found in Item 7 of this report, and our consolidated financial statements and related footnotes located in Item 8.
Services Overview
We operate globally with one common brand and a business model designed to enable us to provide clients around the world with the same high level of service. To achieve this high level of service we have sales and support associates in various locations around the United States and Canada, and operate wholly owned subsidiaries in Australia, China, Japan, and the United Kingdom. In foreign locations where we do not have a directly owned office, we may contract with independent licensee partners who deliver our content and provide services in over 150 other countries and territories around the world.
Our mission is to "enable greatness in people and organizations everywhere," and we believe that we are experts at solving certain pervasive, intractable problems, each of which requires a change in human behavior. We seek to consistently deliver world-class content with the broadest and deepest
distribution capabilities through the most flexible content delivery modalities. We believe these characteristics distinguish us from our competitors as follows:
|
1.
|
World Class Content – Rather than rely on "flavor of the month" training fads, our content is principle-centered and based on natural laws of human behavior and effectiveness. Our content is designed to build new skillsets, establish new mindsets, and provide enabling toolsets. When our content is applied consistently in an organization, we believe the culture of that organization will change to enable the organization to achieve its own great purposes. Our content is well researched, subjected to numerous field beta tests, and improved through a proven development process.
|
|
2.
|
Breadth and Scalability of Delivery Options – We have a wide range of content delivery options, including: The All Access Pass and Leader in Me online, other intellectual property licensing arrangements, on-site training, training led through certified facilitators, on-line learning, blended learning, and organization-wide transformational processes, including consulting and coaching services.
|
|
3.
|
Global Capability – We not only operate domestically with sales personnel in the United States and Canada, but we also deliver content through our directly owned international offices and independently owned international licensees who deliver our content in over 150 other countries and territories around the world. This capability allows us to deliver content to a wide range of customers, from large, multinational corporations to smaller, local entities.
|
We hold ourselves responsible for and measure ourselves by our clients' achievement of transformational results.
Our content and offerings are designed to help our clients achieve their own great purposes through a variety of resources, including best-selling books and audio, innovative and widely recognized thought leadership, and multiple delivery and teaching methods. These elements allow us to offer our clients training and consulting solutions that are designed to improve individual and organizational behaviors, deliver content that adapts to an organization's unique needs, and provide meaningful improvements in our clients' business performance. Further information about our content and services can be found on our website at www.franklincovey.com. However, the information contained in, or that can be accessed through, our website does not constitute any part of this Annual Report.
Segment Information
Our sales are primarily comprised of training and content sales and related products. During fiscal 2018, we reorganized our internal structure into two divisions. The Enterprise Division consists of our Direct Office and International Licensee segments. The former Strategic Markets segment was absorbed by the Direct Office segment since its target customers and sales methodologies were essentially identical. The Education Division is comprised of our Education practice, which is designed to provide services and products to educational institutions both domestically and internationally. Our internal structure is now comprised of three segments and a corporate services group. The following is a brief description of our reportable segments:
|
·
|
Direct Offices – Our Direct Office segment has a depth of expertise in helping organizations solve problems that require changes in human behavior, including leadership, productivity, execution, trust, and sales performance. We have a variety of principle-based offerings that help build winning and profitable cultures. This segment includes our sales personnel that serve the United States and Canada; our international sales offices located in Japan, China, the United Kingdom, and Australia; our governmental sales channel; and our public program operations.
|
|
·
|
Education Practice – Centered around the principles found in The Leader in Me, the Education practice is dedicated to helping educational institutions build a culture that will produce great results. We believe these results are manifested by increases in student performance, improved school culture, decreased disciplinary issues, and increased teacher
|
engagement and parental involvement. This segment includes our domestic and international Education practice operations, which are focused on sales to educational institutions such as elementary schools, high schools, and colleges and universities.
|
·
|
International Licensees – Our independently owned international licensees provide our offerings and services in countries where we do not have a directly owned office. These licensee partners allow us to expand the reach of our services to large multinational organizations as well as smaller organizations in their countries. This segment's results are primarily comprised of royalty revenues received from these licensees.
|
For financial and other information regarding our segments, refer to the notes to our consolidated financial statements (Note 16). For risks inherent in our operations, refer to the risk factors identified in Item 1A and elsewhere in this Annual Report.
Industry Information
According to the Training magazine 2018 Training Industry Survey, the total size of the U.S. training industry is estimated to be $87.6 billion. The training industry is highly fragmented and includes a wide variety of training and service providers. We believe our competitive advantages in this industry stem from our fully integrated principle-centered training offerings, our wide variety of delivery options, and various implementation tools to help organizations and individuals measurably improve their effectiveness. These advantages allow us to deliver not only training to corporations, educational institutions, and individuals, but also to implement the training through powerful behavior-changing tools with the capability to then measure the impact of the delivered content and solutions.
Clients
We have a relatively broad base of clients, which includes thousands of organizational, governmental, educational, and individual clients in both the United States and in other countries that are served through our directly owned operations. We have thousands of additional organizational clients throughout the world which are served through our global licensee partner network, and we believe that our content, in all its forms, delivers results that encourage strong client loyalty. Our clients are in a broad array of industries and we are not dependent on a single client or industry group. During the periods presented in this report, none of our clients were responsible for more than ten percent of our consolidated revenues.
Over our history, we have provided content, services, and products to 97 of the Fortune 100 companies and more than 75 percent of the Fortune 500 companies. We also provide content and services to a number of U.S. and foreign governmental agencies, as well as numerous educational institutions. Due to the nature of our business, we do not have a significant backlog of orders. Nearly all of our deferred revenue is attributable to subscription services for which we recognize revenue over the lives of the corresponding agreements.
Competition
We operate in a highly competitive and rapidly changing global marketplace and compete with a variety of organizations that offer services comparable with those that we offer. The nature of the competition in the performance improvement industry, however, is highly fragmented with few large competitors. Based upon our fiscal 2018 consolidated sales of $209.8 million, we believe that we are a significant competitor in the performance skills and education market. Other significant comparative companies in the performance improvement market are Development Dimensions International, CRA International, Inc., Learning Tree International Inc., GP Strategies Corp., FTI Consulting, Inc., American Management Association, Wilson Learning, Forum Corporation, The Hackett Group, and the Center for Creative Leadership.
We believe that the principal competitive factors in the industry in which we compete include the following:
|
·
|
Quality of offerings, services, and solutions
|
|
·
|
Skills and capabilities of people
|
|
·
|
Innovative training and consulting services combined with effective products
|
|
·
|
Ability to add value to client operations
|
|
·
|
Reputation and client references
|
|
·
|
Price
|
|
·
|
Availability of appropriate resources
|
|
·
|
Global reach and scale
|
|
·
|
Branding and name recognition in our marketplace
|
Given the relative ease of entry into the training market, the number of our competitors could increase, many of whom may imitate existing methods of distribution, or could offer similar content and programs at lower prices. However, we believe that we have several areas of competitive differentiation in our industry. We believe that our competitive advantages include: (1) the quality of our content, as indicated by our strong gross margins, branded content, and best-selling books; (2) the breadth of delivery options we are able to offer to customers for utilizing our content, including the All Access Pass and Leader in Me online, live presentations by our own training consultants, live presentations though Company certified client-employed facilitators, intellectual property licensing, web-based presentations, and film-based presentations; (3) our global reach, which allows truly multinational clients to scale our content uniformly across the globe, through our mix of direct offices and our global licensee network; and (4) the significant impact which our offerings can have on our clients' results. Moreover, we believe that we are a market leader in the U.S. in leadership, execution, productivity, and individual effectiveness content.
Seasonality
Our fourth quarter of each fiscal year typically has higher sales and operating income than other fiscal quarters primarily due to increased revenues in our Education Division (when school administrators and faculty have professional development days) and to increased sales that typically occur during that quarter from year-end incentive programs. Overall, training sales are moderately seasonal because of the timing of corporate training, which is not typically scheduled as heavily during holiday and certain vacation periods.
Manufacturing and Distribution
We do not manufacture any of our products. We purchase our training materials and related products from various vendors and suppliers located both domestically and internationally, and we are not dependent upon any one vendor for the production of our training and related materials as the raw materials for these products are readily available. We currently believe that we have good relationships with our suppliers and contractors. Our materials are primarily warehoused and distributed from an independent warehouse facility located in Des Moines, Iowa.
Trademarks, Copyrights, and Intellectual Property
Our success has resulted in part from our proprietary content, methodologies, and other intellectual property rights. We seek to protect our intellectual property through a combination of trademarks, copyrights, and confidentiality agreements. We claim rights for nearly 600 trademarks in the United States and foreign countries, and we have obtained registration in the United States and numerous foreign countries for many of our trademarks including FranklinCovey, The 7 Habits of Highly Effective People, The 4 Disciplines of Execution, and The 7 Habits. We consider our trademarks and other proprietary rights to be important and material to our business.
We claim over 220 registered copyrights, and own sole or joint copyrights on our books, manuals, text and other printed information provided in our training programs, and other electronic media products, including audio and video media. We may license, rather than sell, facilitator workbooks and other seminar and training materials in order to protect our intellectual property rights therein. We place trademark and copyright notices on our instructional, marketing, and advertising materials. In order to maintain the proprietary nature of our product information, we enter into written confidentiality agreements with certain executives, product developers, sales professionals, training consultants, other employees, and licensees.
Employees
One of our most important assets is our people. The diverse and global makeup of our workforce allows us to serve a variety of clients on a worldwide basis. We are committed to attracting, developing, and retaining quality personnel and actively strive to reinforce our employees' commitment to our clients, and to our mission, vision, culture, and values through the creation of a motivational and rewarding work environment. We currently have approximately 890 associates and none of our associates are represented by a union or other collective bargaining group. Management believes that its relations with its associates are good and we do not currently foresee a shortage in qualified personnel needed to operate and grow our business.
Our benefit programs are designed to be both comprehensive and tailored to the needs of our employee population, such as a paid time off policy that allows for flexibility to meet our associates' needs. Our wellness benefits are aimed at encouraging employees to be aware of their current state of health and provides various tools and resources to assist them in maintaining their health given the demanding nature of the work. Through our offered benefits, including health plans, retirement benefits, stock purchase plan, and other benefit programs, we seek to provide a core sense of security to our employees.
Executive Officers
The executive officers of Franklin Covey Co. at August 31, 2018, were as follows:
M. Sean Covey, 54, currently serves as President of Franklin Covey Education, and has led the growth of this Division from its infancy to its status today. The Education Division works with thousands of education entities throughout the world in Higher Education and the K-12 market. Mr. Covey was previously the Executive Vice President of Global Solutions and Partnerships and Education Practice Leader and has been an Executive Officer since September 2008. Sean also served as the Senior Vice President of Innovations and Product Development from April 2006 to September 2009, where he led the development of nearly all of the Company's current organizational offerings, including: The 7 Habits curriculum; The 4 Disciplines of Execution; The Leader in Me; and Leadership Greatness. Prior to 2006, Sean ran the Franklin Covey retail chain of stores, growing it to $152 million in sales. Before joining Franklin Covey, Sean worked for the Walt Disney Company, Trammel Crow Ventures, and Deloitte & Touche Consulting. Mr. Covey is also a New York Times best-selling author and has written several books, including The 4 Disciplines of Execution, The 6 Most Important Decisions You'll Ever Make, The Leader in Me, and the international bestseller The 7 Habits of Highly Effective Teens. Sean graduated with honors from Brigham Young University with a Bachelor's degree in English and later earned his MBA from the Harvard Business School. Sean is the son of the late Dr. Stephen Covey.
Colleen Dom, 56, was appointed to be the Executive Vice-President of Operations in September 2013. Ms. Dom began her career with the Company in 1985 and served as the first "Client Service Coordinator," providing service and seminar support for some of the Company's very first clients. Prior to her appointment as an Executive Vice President, Ms. Dom served as Vice President of Domestic Operations since 1997 where she had responsibility for the Company's North American operations, including client support, supply chain, and feedback operations. During her time at Franklin Covey Co., Colleen has been instrumental in creating and implementing systems and processes that have supported the Company's strategic objectives and has more than 30 years of experience in client services, sales support, operations, management, and supply chain. Due to her valuable understanding of the Company's global operations, Ms. Dom has been responsible for numerous key assignments that have enhanced client support, optimized operations, and built capabilities for future growth. Prior to joining the Company, Colleen worked in retail management and in the financial investment industry.
C. Todd Davis, 61, is an Executive Vice President and Chief People Officer, and has been an Executive Officer since September 2008. Todd has over 30 years of experience in training, training development, sales and marketing, human resources, coaching, and executive recruiting. He has been with Franklin Covey for more than the past 20 years. Previously, Mr. Davis was a Director of our Innovations Group where he led the development of core offerings including The 7 Habits of Highly Effective People – Signature Program. Todd also worked for several years as our Director of
Recruitment and was responsible for attracting, hiring, and retaining top talent for the organization. Prior to joining Franklin Covey, Mr. Davis worked in the medical industry for 9 years where he recruited physicians and medical executives along with marketing physician services to hospitals and clinics throughout the country. Todd is the author of Get Better: 15 Proven Practices to Build Effective Relationships at Work.
Scott J. Miller, 50, is the Executive Vice-President of Thought Leadership at Franklin Covey. Mr. Miller, who has been with the Company for 22 years, was previously the Executive Vice-President of Business Development and Marketing and has served as an executive of the Company since March 2012. Scott's role as Executive Vice-President caps 12 years on our front line, working with thousands of client facilitators across many markets and countries. Prior to his appointment as Vice-President of Business Development and Marketing, Mr. Miller served as the general manager of our central regional sales office for six years. Scott originally joined the Covey Leadership Center in 1996 as a client partner with the Education Division. Mr. Miller started his professional career with the Disney Development Company, the real estate development division of the Walt Disney Company, in 1992. During his time with the Disney Development Company, Scott identified trends and industry best practices in community development, education, healthcare, architectural design, and technology. Mr. Miller received a Bachelor of Arts in Organizational Communication from Rollins College in 1996.
Paul S. Walker, 43, is an 18-year veteran of Franklin Covey Co. Mr. Walker currently serves as the President of the Enterprise Division, which includes the operations of the Direct Office and International Licensee segments. Mr. Walker was previously the Executive Vice-President of Global Sales and Delivery and began his service as an executive officer on September 1, 2015. Paul began his career with Franklin Covey in 2000 in the role of business developer, was promoted to a Client Partner, and then to an Area Director. In 2007, Mr. Walker became General Manager of the Company's central sales region, an 11-state area that also included Ontario, Canada. Prior to working for Franklin Covey, Mr. Walker was a senior sales partner for Alexander's Digital Printing and a middle-market pilot coordinator with New York Life. Mr. Walker graduated from Brigham Young University with a Bachelor of Arts in Communications.
Robert A. Whitman, 65, has served as Chairman of the Board of Directors since June 1999 and as President and Chief Executive Officer of the Company since January 2000. Mr. Whitman previously served as a director of the Covey Leadership Center from 1994 to 1997. Prior to joining us, Mr. Whitman served as President and Co‑Chief Executive Officer of The Hampstead Group from 1992 to 2000 and is a founding partner at Whitman Peterson. Mr. Whitman received his Bachelor of Arts degree in Finance from the University of Utah and his MBA from the Harvard Business School.
Stephen D. Young, 65, joined FranklinCovey as Executive Vice President of Finance, was appointed Chief Accounting Officer and Controller in January 2001, Chief Financial Officer in November 2002, and Corporate Secretary in March 2005. Prior to joining us, he served as Senior Vice-President of Finance, Chief Financial Officer, and director of international operations for Weider Nutrition for seven years; as Vice-President of Finance at First Health for ten years; and as an auditor at Fox and Company, a public accounting firm, for four years. Mr. Young has more than 35 years of accounting and management experience and is a Certified Public Accountant. Mr. Young was awarded a Bachelor of Science in Accounting from Brigham Young University.
Available Information
We regularly file reports with the SEC. These reports include, but are not limited to, Annual Reports on Form 10-K, Quarterly Reports on Form 10-Q, Current Reports on Form 8-K, and security transaction reports on Forms 3, 4, or 5. The SEC also maintains electronic versions of the Company's reports, proxy and information statements, and other information that the Company files with the SEC on its website at www.sec.gov.
The Company makes our Annual Report on Form 10-K, Quarterly Reports on Form 10-Q, current reports on Form 8-K, and other reports filed or furnished with the SEC available to the public, free of charge, through our website at www.franklincovey.com. These reports are provided through our website as soon as is reasonably practicable after we file or furnish these reports with the SEC.
Our business environment, current domestic and international economic conditions, geopolitical circumstances, and other specific risks may affect our future business decisions and financial performance. The matters discussed below may cause our future results to differ from past results or those described in forward-looking statements and could have a material adverse effect on our business, financial condition, liquidity, results of operations, and stock price, and should be considered in evaluating our Company.
The risks included here are not exhaustive. Other sections of this report may include additional risk factors which could adversely affect our business and financial performance. Moreover, we operate in a very competitive and rapidly changing global environment. New risk factors emerge from time to time and it is not possible for management to predict all such risk factors, nor can we assess the impact of all such risk factors on our business or the extent to which any factor, or combination of factors, may cause actual results to differ materially from those contained in any forward-looking statements. Given these risks and uncertainties, investors should not place undue reliance on forward-looking statements as a prediction of actual results.
We operate in an intensely competitive industry and our competitors may develop programs, services, or courses that adversely affect our ability to sell our offerings.
The training and consulting services industry is intensely competitive with relatively easy entry. Competitors continually introduce new programs and services that may compete directly with our offerings, or that may make our offerings uncompetitive or obsolete. Larger competitors may have superior abilities to compete for clients and skilled professionals, reducing our ability to deliver quality work to our clients. Some of our competitors may have greater financial and other resources than we do. In addition, one or more of our competitors may develop and implement training courses or methodologies that may adversely affect our ability to sell our offerings and products to new clients. Any one of these circumstances could have an adverse effect on our ability to obtain new business and successfully deliver our services.
The introduction of the All Access Pass has been disruptive to our business and may continue to create both operational and financial challenges during the transition to a subscription services-focused business model.
In fiscal 2016, we introduced the All Access Pass, which is an internet-based platform that allows our clients to purchase unlimited access to our intellectual property for a specified period. Clients may utilize entire training offerings or use individual portions of numerous programs to customize a training or personnel program that fits their needs. As expected, the change to a subscription services-focused business model has been disruptive as we transition our legacy business to this new delivery model, but we believe the benefits of the AAP and Leader in Me online service to our clients and to our business will ultimately prove beneficial as we continue to emphasize and grow sales of subscription services.
The change to a subscription-focused business model has required a transition both operationally, as our sales force adapts its structure and strategy to sell these services, and from an accounting and reporting point of view. Operationally, we have reorganized our Direct Office sales force to focus on and support AAP sales and renewals. During the first quarter of fiscal 2017, we decided to allow new AAP intellectual property agreements to receive updated content throughout the contract period. Applicable accounting standards required us to defer substantially all AAP revenues at the inception of the contracts and then recognize the revenue over the life of the corresponding arrangement. This determination had a significant impact on both our fiscal 2018 and fiscal 2017 financial results.
If we are unable to effectively adapt our sales force and sales strategy to sell subscription services, or if technological development of these services becomes too costly or is not accepted by the market, the transition period to a subscription-focused business model may be lengthened and our ability to achieve previous levels of profitability may be adversely affected.
The All Access Pass and Leader in Me online service are internet-based platforms, and as such we are subject to increased risks of cyber-attacks and other security breaches that could have a material adverse effect on our business.
As part of selling the AAP and Leader in Me online service, we collect, process, and retain a limited amount of sensitive and confidential information regarding our customers. Because these services are internet-based platforms, our facilities and systems may be vulnerable to external or internal security breaches, acts of vandalism, computer viruses, misplaced or lost data, stolen intellectual property, programming or human errors, or other similar events.
The access by unauthorized persons to, or the improper disclosure by us of, confidential information regarding our customers or our own proprietary information, software, methodologies, and business secrets could result in significant legal and financial exposure, damage to our reputation, or a loss of confidence in the security of our systems, products, and services, which could have a material adverse effect on our business, financial condition, or results of operations. To the extent we are involved in any future cyber-attacks or other breaches, our brand and reputation could be affected, and these conditions could also have a material adverse effect on our business, financial condition, or results of operations.
Our business is becoming increasingly dependent on information technology and will require additional cash investments in order to grow and meet the demands of our clients.
Since the introduction of the AAP and Leader in Me online service, our dependence on the use of sophisticated technologies and systems has increased. Moreover, our technology platforms will require continuing cash investments by us to expand existing offerings, improve the client experience, and develop complementary offerings. Our future success depends in part on our ability to adapt our services and infrastructure while continuing to improve the performance, features, and reliability of our services in response to the evolving demands of the marketplace. Failure to adapt and improve these areas could have an adverse effect on our business, including our results of operations, financial position, and cash flows.
We could incur additional liabilities or our reputation could be damaged if we do not protect client data or if our information systems are breached.
We are dependent on information technology networks and systems to process, transmit, and store electronic information and to communicate between our locations around the world and with our clients. Security breaches of this infrastructure could lead to shutdowns or disruptions of our systems and potential unauthorized disclosure of confidential information. We are also required at times to manage, utilize, and store sensitive or confidential client or employee data. As a result, we are subject to numerous U.S. and foreign jurisdiction laws and regulations designed to protect this information, such as the various U.S. federal and state laws governing the protection of individually identifiable information. If any person, including any of our associates, negligently disregards or intentionally breaches our established controls with respect to such data or otherwise
mismanages or misappropriates that data, we could be subject to monetary damages, fines, and/or criminal prosecution. Unauthorized disclosure of sensitive or confidential client or employee data, whether through systems failure, employee negligence, fraud, or misappropriation could damage our reputation and cause us to lose clients.
Legal requirements relating to the collection, storage, handling, and transfer of personal data continue to evolve. For example, the European Union and the U.S. formally entered into a new framework in July 2016 that provides a mechanism for companies to transfer data from European Union member states to the U.S. This new framework, called the E.U.-U.S. Privacy Shield Framework, is intended to address shortcomings identified by the European Court of Justice in a predecessor mechanism. The Privacy Shield and other data protection mechanisms face a number of legal challenges by both private parties and regulators, which may lead to uncertainty about the legal basis for data transfers across the Atlantic. Ongoing legal reviews may result in burdensome or inconsistent requirements affecting the location and movement of our customer and internal employee data as well as the management of that data. Compliance may require changes in services, business practices, or internal systems that may result in increased costs, lower revenue, reduced efficiency, or greater difficulty in competing with foreign-based firms. Failure to comply with existing or new rules may result in significant penalties or orders to stop the alleged noncompliant activity.
In addition, in May 2018 the new General Data Protection Regulation (GDPR) became effective in the European Union. The GDPR imposes strict requirements on the collection, use, security, and transfer of personal information in and from European Union member states. The GDPR is designed to unify data protection within the European Union under a single law, which may result in significantly greater compliance burdens and costs related to our European Union operations and customers. Under GDPR, fines of up to 20 million Euros or up to four percent of the annual global revenues of the infringer, whichever is greater, could be imposed. Although GDPR applies across the European Union, local data protection authorities still have the ability to interpret GDPR, which may create inconsistencies in application on a country-by-country basis. Furthermore, as the United Kingdom transitions out of the European Union, we may encounter additional complexity with respect to data privacy and data transfers from the United Kingdom. During fiscal 2018, we implemented new controls and procedures, including a team dedicated to data protection, to comply with the Privacy Shield and the requirements of GDPR, which were effective for us in May 2018. However, these new procedures and controls may not be completely effective in preventing unauthorized breaches of personal data.
Other governmental authorities throughout the U.S. and around the world are considering similar types of legislative and regulatory proposals concerning data protection. For example, in June 2018, the State of California enacted the California Consumer Privacy Act of 2018 (the CCPA), which will come into effect on January 1, 2020. The CCPA requires companies that process information on California residents to make new disclosures to consumers about their data collection, use and sharing practices, and allows consumers to opt out of certain data sharing with third parties and provides a new cause of action for data breaches. However, legislators have stated that they intend to propose amendments to the CCPA, and it remains unclear what, if any, modifications will be made to the CCPA or how it will be interpreted. Additionally, the Federal Trade Commission and many state attorneys general are interpreting federal and state consumer protection laws to impose standards for the online collection, use, dissemination and security of data. Each of these privacy, security, and data protection laws and regulations could impose significant limitations, require changes to our business, or restrict our use or storage of personal information, which may increase our compliance expenses and make our business more costly or less efficient to conduct.
Our results of operations could be adversely affected by economic and political conditions and the effects of these conditions on our clients' businesses and their levels of business activity.
Global economic and political conditions affect our clients' businesses and the markets in which they operate. Our financial results are somewhat dependent on the amount that current and prospective clients budget for training. A serious and/or prolonged economic downturn combined with a negative or uncertain political climate could adversely affect our clients' financial condition and the amount budgeted for training by our clients. These conditions may reduce the demand for our services or depress the pricing of those services and have an adverse impact on our results of operations. Changes in global economic
conditions may also shift demand to services for which we do not have competitive advantages, and this could negatively affect the amount of business that we are able to obtain. Such economic, political, and client spending conditions are influenced by a wide range of factors that are beyond our control and that we have no comparative advantage in forecasting. If we are unable to successfully anticipate these changing conditions, we may be unable to effectively plan for and respond to those changes, and our business could be adversely affected.
Our business success also depends in part upon continued growth in the use of training and consulting services and the renewal of existing contracts by our clients. In challenging economic environments, our clients may reduce or defer their spending on new services and consulting solutions in order to focus on other priorities. At the same time, many companies have already invested substantial resources in their current means of conducting their business and they may be reluctant or slow to adopt new approaches that could disrupt existing personnel and/or processes. If growth in the general use of training and consulting services in business or our clients' spending on these items declines, or if we cannot convince our clients or potential clients to embrace new services and solutions, our results of operations could be adversely affected.
In addition, our business tends to lag behind economic cycles and, consequently, the benefits of an economic recovery following a period of economic downturn may take longer for us to realize than other segments of the economy.
We have only a limited ability to protect our intellectual property rights, which are important to our success.
Our financial success is partially dependent on our ability to protect our proprietary offerings and other intellectual property. The existing laws of some countries in which we provide services might offer only limited protection of our intellectual property rights. To protect our intellectual property, we rely upon a combination of confidentiality policies, nondisclosure and other contractual arrangements, as well as copyright and trademark laws. The steps we take in this regard may not be adequate to prevent or deter infringement or other misappropriation of our intellectual property, and we might not be able to detect unauthorized use of, or take appropriate and timely steps to enforce, our intellectual property rights, especially in foreign jurisdictions.
The loss of proprietary content or the unauthorized use of our intellectual property may create greater competition, loss of revenue, adverse publicity, and may limit our ability to reuse that intellectual property for other clients. Any limitation on our ability to provide a service or solution could cause us to lose revenue-generating opportunities and require us to incur additional expenses to develop new or modified solutions for future engagements.
We depend on key personnel, the loss of whom could harm our business.
Our future success will depend, in part, on the continued service of key executive officers and personnel. The loss of the services of any key individuals could harm our business. Our future success also depends on our ability to identify, attract, and retain additional qualified senior personnel. Competition for such individuals in our industry is intense, and we may not be successful in attracting and retaining such personnel.
If we are unable to attract, retain, and motivate high-quality employees, including training consultants and other key training representatives, we may not be able to grow our business as projected or may not be able to compete effectively.
Our success and ability to grow are partially dependent on our ability to hire, retain, and motivate sufficient numbers of talented people with the increasingly diverse skills needed to serve our clients and grow our business. Competition for skilled personnel is intense at all levels of experience and seniority. There is a risk that we will find it difficult to hire and retain a sufficient number of employees with the skills or backgrounds we require, or that it will prove difficult to retain them in a competitive labor market. If we are unable to hire and retain talented sales and delivery employees with the skills, and in the locations, we require, we might not be able to grow our business at projected levels or may not be able to effectively deliver our content and services. If we need to hire additional personnel to maintain a specified number of sales personnel or are required to re-assign personnel from other geographic areas, it could increase our costs and adversely affect our profit margins. In addition, the inability of newly hired sales personnel to achieve projected sales levels may inhibit our ability to attain anticipated growth.
Our global operations pose complex management, foreign currency, legal, tax, and economic risks, which we may not adequately address.
We have sales offices in Australia, China, Japan, and the United Kingdom. We also have licensed operations in numerous other foreign countries. As a result of these foreign operations and their impact upon our financial statements, we are subject to a number of risks, including:
|
·
|
Restrictions on the movement of cash
|
|
·
|
Burdens of complying with a wide variety of national and local laws, including tax laws
|
|
·
|
The absence in some jurisdictions of effective laws to protect our intellectual property rights
|
|
·
|
Political instability
|
|
·
|
Currency exchange rate fluctuations
|
|
·
|
Longer payment cycles
|
|
·
|
Price controls or restrictions on exchange of foreign currencies
|
For instance, on June 23, 2016, the United Kingdom held a referendum in which a majority of voters chose to exit the European Union, commonly referred to as "Brexit." The outcome of this referendum produced significant currency exchange rate fluctuations and volatility in global stock markets and it is expected that the British government will commence negotiations to determine the terms of Brexit. Given the lack of comparable precedent, the implications of Brexit or how such implications might affect us are unclear. Brexit could, among other things, disrupt trade and the free movement of data, goods, services and people between the United Kingdom and the European Union or other countries as well as create legal and global economic uncertainty. These and other potential implications of Brexit could adversely affect our business and financial results.
Recent developments in international trade may have a negative effect on global economic conditions and our business, financial results, and financial condition.
The United States recently proposed and enacted certain tariffs. In addition, there have been ongoing discussions and activities regarding changes to other U.S. trade policies and treaties. In response, some countries in which we operate, including China, are threatening to implement or have already implemented tariffs on U.S. imports or otherwise imposed non-tariff barriers. These developments may have a material adverse effect on global economic conditions and the stability of global financial markets, and they may significantly reduce global trade and, in particular, trade between China and the United States. Any of these factors could depress economic activity, create anti-American consumer sentiment, restrict our access to suppliers or customers, and have a material adverse effect on our business, financial condition, and results of operations. In addition, any actions by non-U.S. markets to implement further trade policy changes, including limiting foreign investment or trade, increasing regulatory scrutiny or taking other actions which impact U.S. companies' ability to obtain necessary licenses or approvals could negatively impact our business.
We may experience foreign currency gains and losses.
Our sales outside of the United States totaled $58.7 million, or approximately 28 percent of consolidated sales, for the fiscal year ended August 31, 2018. If our international operations continue to grow and become a larger component of our overall financial results, the impacts of foreign exchange rate fluctuations may become magnified and our revenues
and operating results may be adversely affected when the dollar strengthens relative to other currencies. In order to manage a portion of our foreign currency risk, we may from time-to-time make limited use of foreign currency derivative contracts to hedge certain transactions and translation exposure. However, there can be no guarantee that our foreign currency risk management strategy will be effective in reducing the risks associated with foreign currency transactions and translation.
Our global operations expose us to numerous and sometimes conflicting legal and regulatory requirements, and violation of these regulations could harm our business.
Because we provide services to clients in many countries, we are subject to numerous, and sometimes conflicting, regulations on matters as diverse as import/export controls, content requirements, trade restrictions, tariffs, taxation, sanctions, government affairs, internal and disclosure control obligations, data privacy, and labor relations. Violations of these regulations in the conduct of our business could result in fines, criminal sanctions against us or our officers, prohibitions on doing business, and damage to our reputation. Violations of these regulations in connection with the performance of our obligations to our clients also could result in liability for monetary damages, fines, unfavorable publicity, and allegations by our clients that we have not performed our contractual obligations. Due to the varying degrees of development of the legal systems of the countries in which we operate, local laws may be insufficient to protect our rights.
In many parts of the world, including countries in which we operate, practices in the local business community might not conform to international business standards and could violate anticorruption regulations, including the United States Foreign Corrupt Practices Act, which prohibits giving anything of value intended to influence the awarding of government contracts. Although we have policies and procedures to ensure legal and regulatory compliance, our employees, licensee operators, and agents could take actions that violate these requirements. Violations of these regulations could subject us to criminal or civil enforcement actions, including fines and suspension or disqualification from United States federal procurement contracting, any of which could have an adverse effect on our business.
We may fail to meet analyst expectations, which could cause the price of our stock to decline.
Our common stock is publicly traded on the NYSE, and at any given time various securities analysts follow our financial results and issue reports on us. These periodic reports include information about our historical financial results as well as the analysts' estimates of our future performance. The analysts' estimates are based on their own opinions and are often different from our estimates or expectations. If our operating results are below the estimates or expectations of public market analysts and investors, our stock price could decline. If our stock price is volatile, we may become involved in securities litigation following a decline in price. Any litigation could result in substantial costs and a diversion of management's attention and resources that are needed to successfully run our business.
Our business performance may not be sufficient for us to meet the full-year financial guidance that we provide publicly.
We provide full-year financial guidance to the public based upon our expectations regarding our financial performance. While we believe that our annual financial guidance provides investors and analysts with insight into our view of the Company's future performance, such financial guidance is based on assumptions that may not always prove to be accurate and may vary from actual results. If we fail to meet the full-year financial guidance that we provide, or if we find it necessary to revise such guidance during the year, the market value of our common stock could be adversely affected.
Our future quarterly operating results are subject to factors that can cause fluctuations in our stock price.
Historically, our stock price has experienced significant volatility. We expect that our stock price may continue to experience volatility in the future due to a variety of potential factors that may include the following:
|
·
|
Fluctuations in our quarterly results of operations and cash flows
|
|
·
|
Increased overall market volatility
|
|
·
|
Variations between our actual financial results and market expectations
|
|
·
|
Changes in our key balances, such as cash and cash equivalents
|
|
·
|
Currency exchange rate fluctuations
|
|
·
|
Unexpected asset impairment charges
|
|
·
|
Increased or decreased analyst coverage
|
These factors may have an adverse effect upon our stock price in the future.
The sale of a large number of common shares by Knowledge Capital could depress the market price of our common stock.
Knowledge Capital Investment Group (Knowledge Capital), a related party primarily controlled by a member of our Board of Directors, holds 2.8 million shares, or approximately 20 percent, of our outstanding common shares. On January 26, 2015, the SEC declared effective a registration statement on Form S-3 to register shares held by Knowledge Capital. The sale or prospect of the sale of a substantial number of the shares held by Knowledge Capital may have an adverse effect on the market price of our common stock.
Our profitability will suffer if we are not able to maintain our pricing and utilization rates.
The profit margin on our services is largely a function of the rates we are able to recover for our services and the utilization, or chargeability, of our trainers, client partners, and consultants. Accordingly, if we are unable to maintain sufficient pricing for our services or an appropriate utilization rate for our training professionals without corresponding cost reductions, our profit margin and overall profitability will suffer. The rates that we are able to recover for our services are affected by a number of factors that we may be unable to control, including:
|
·
|
Our clients' perceptions of our ability to add value through our programs and content
|
|
·
|
Competition
|
|
·
|
General economic conditions
|
|
·
|
Introduction of new programs or services by us or our competitors
|
|
·
|
Our ability to accurately estimate, attain, and sustain engagement sales, margins, and cash flows over longer contract periods
|
There can be no assurance that we will be able to maintain favorable pricing or utilization rates in future periods. Additionally, we may not achieve pricing or utilization rates that are optimal for us. If our utilization rates are too high, it could have an adverse effect on employee engagement and attrition. If our pricing or utilization rates are too low, our profit margin and profitability may suffer.
Our work with governmental clients exposes us to additional risks that are inherent in the government contracting process.
Our clients include national, state, provincial, and local governmental entities, and our work with these governmental entities has various risks inherent in the governmental contracting process. These risks include, but are not limited to, the following:
|
·
|
Governmental entities typically fund projects through appropriated monies. While these projects are often planned and executed as multi-year projects, the governmental entities usually reserve the right to change the scope of, or terminate, these projects for lack of approved funding and other discretionary reasons. Changes in governmental priorities or other political developments, including disruptions in governmental operations, could result in changes in the scope of, or in termination of, our existing contracts.
|
|
·
|
Governmental entities often reserve the right to audit our contract costs, including allocated indirect costs, and conduct inquiries and investigations of our business practices with respect to our government contracts. If the governmental entity finds that the costs are not reimbursable, then we will not be allowed to bill for those costs or the cost must be refunded to the client if it has already been paid to us. Findings from an audit also may result in our being required to prospectively adjust previously agreed upon rates for our work, which may affect our future margins.
|
|
·
|
If a governmental client discovers improper activities in the course of audits or investigations, we may become subject to various civil and criminal penalties and administrative sanctions, which may include termination of contracts, forfeiture of profits, suspension of payments, fines and suspensions or debarment from doing business with other agencies of that government. The inherent limitations of internal controls may not prevent or detect all improper or illegal activities, regardless of their adequacy.
|
|
·
|
Political and economic factors such as pending elections, the outcome of elections, revisions to governmental tax policies, sequestration, debt ceiling negotiations, and reduced tax revenues can affect the number and terms of new governmental contracts signed.
|
The occurrences or conditions described above could affect not only our business with the particular governmental agency involved, but also our business with other agencies of the same or other governmental entities. Additionally, because of their visibility and political nature, governmental contracts may present a heightened risk to our reputation. Any of these factors could have an adverse effect on our business or our results of operations.
Changes in U.S. tax laws could have an adverse effect on our business, cash flows, results of operations, and financial condition.
We are subject to income and other taxes in the U.S. at the state and federal level, and in foreign jurisdictions. Changes in applicable U.S. state, federal, or foreign tax laws and regulations, or their interpretation and application, could materially affect our tax expense and profitability.
On December 22, 2017, the President of the United States signed into law the Tax Cuts and Jobs Act (2017 Tax Reform), a tax reform bill which contains significant changes to corporate taxation, including a reduction in the current corporate federal income tax rate from 35 percent to 21 percent, additional limitations on the deductibility of interest expense, substantial changes to the taxation of foreign earnings, and modification or repeal of many business deductions and credits. The changes included in the 2017 Tax Reform are broad and complex. The final transition impact of the 2017 Tax Reform may differ from the amounts we have recorded due to, among other things, additional regulatory and interpretive guidance, as well as any statutory technical corrections that are subsequently enacted.
The 2017 Tax Reform, or any related, similar, or amended legislation or other changes in the U.S. federal income tax laws, could adversely affect the U.S. federal taxation of our ongoing operations. Any such changes and related consequences could have a material adverse impact on our financial results.
If we are unable to collect our accounts receivable on a timely basis, our results of operations and cash flows could be adversely affected.
Our business depends on our ability to successfully obtain timely payment from our clients of the amounts they owe us for services performed. We evaluate the financial condition of our clients and usually bill and collect on relatively short cycles. However, as our sales to governmental entities, including school districts, continue to grow, our collection cycle may take longer due to procurement and payment procedures at these clients. We maintain allowances against our receivables that we believe are adequate to reserve for potentially uncollectible amounts. Actual losses on client balances could differ from those that we currently anticipate and, as a result, we may need to adjust our allowances. In addition, there is no guarantee that we will accurately assess the creditworthiness of our clients. Macroeconomic conditions could also result in financial difficulties for our clients, and as a result could cause clients to delay payments to us, request modifications to their payment arrangements that could increase our receivables balance, or not pay their obligations to us. Timely collection of client balances also depends on our ability to complete our contractual commitments and bill and collect our invoiced revenues. If we are unable to meet our contractual requirements, we might experience delays in collection of and/or be unable to collect our client balances, and if this occurs, our results of operations and cash flows may be adversely affected.
Our results of operations and cash flows may be adversely affected if FC Organizational Products LLC is unable to pay the working capital settlement, reimbursable acquisition costs, or reimbursable operating expenses.
In fiscal 2008, we sold our planning products operation to FC Organizational Products, LLC (FCOP), an entity in which we own a 19.5 percent interest. According to the agreements associated with the sale, we were entitled to receive a $1.2 million payment for working capital delivered on the closing date of the sale and to receive $2.3 million as reimbursement for specified costs necessary to complete the transaction. Payment for these costs was originally due in January 2009, but we extended the due date of the payment at FCOP's request and obtained a promissory note from FCOP for the amount owed, plus accrued interest. At the time we received the promissory note from FCOP, we believed that we could obtain payment for the amounts owed, based on prior year performance and forecasted financial performance in 2009. However, due to FCOP's deteriorating financial results, we reassessed the collectability of the promissory note and recorded a $3.6 million impaired asset charge against these receivables.
We also receive reimbursement from FCOP for certain operating costs, such as rent. At August 31, 2018, we had $1.5 million of receivables from FCOP, net of related discount, which are recorded as assets on our consolidated balance sheet. Although we believe that we will obtain payment from FCOP for these receivables, the valuation of amounts receivable from FCOP is dependent upon the estimated future earnings and cash flows of FCOP. If FCOP's estimated future earnings and cash flows decline, or if FCOP fails to pay amounts receivable and we fail to obtain payment on the previously impaired promissory note, our future cash flows and results of operations may be adversely affected.
The Company's use of accounting estimates involves judgment and could impact our financial results.
Our most critical accounting estimates are described in Management's Discussion and Analysis found in Item 7 of this report under the section entitled "Use of Estimates and Critical Accounting Policies." In addition, as discussed in various footnotes to our financial statements as found in Item 8, we make certain estimates for loss contingencies, including decisions related to legal proceedings and reserves. Because, by definition, these estimates and assumptions involve the use of judgment, our actual financial results may differ from these estimates.
Failure to comply with the terms and conditions of our credit facility may have an adverse effect upon our business and operations.
Our secured credit agreement and subsequent modifications require us to be in compliance with customary non-financial terms and conditions as well as specified financial ratios. Failure to comply with these terms and conditions or maintain adequate financial performance to comply with specific financial ratios entitles the lender to certain remedies, including the right to immediately call due any amounts outstanding on the line of credit. Such events would have an adverse effect upon our business and operations as there can be no assurance that we may be able to obtain other forms of financing or raise additional capital on terms that would be acceptable to us.
We may need additional capital in the future, and this capital may not be available to us on favorable terms or at all.
We may need to raise additional funds through public or private debt offerings or equity financings in order to:
|
·
|
Develop new services, programs, or offerings
|
|
·
|
Take advantage of opportunities, including business acquisitions
|
|
·
|
Respond to competitive pressures
|
Going forward, we will continue to incur costs necessary for the day-to-day operation and potential growth of the business and may use our available revolving line of credit facility and other financing alternatives, if necessary, for these expenditures. Our existing credit arrangement expires on March 31, 2021 and we expect to regularly renew our lending agreement to maintain the availability of this credit facility. Additional potential sources of liquidity available to us include factoring receivables, issuance of additional equity, or issuance of debt from public or private sources. If necessary, we will evaluate all of these options and select one or more of them depending on overall capital needs and the associated cost of capital.
Any additional capital raised through the sale of equity could dilute current shareholders' ownership percentage in us. Furthermore, we may be unable to obtain the necessary capital on terms or conditions that are favorable to us, or at all.
We have significant intangible assets, goodwill, and long-term asset balances that may be impaired if cash flows from related activities decline.
At August 31, 2018 we had $51.9 million of intangible assets and $24.2 million of goodwill. Our intangible assets are evaluated for impairment based on qualitative factors or upon cash flows and estimated royalties from revenue streams (indefinite-lived intangible assets) if necessary. Our goodwill is evaluated through qualitative factors and by comparing the fair value of the reporting units to the carrying value of our net assets if necessary. Although our current sales, cash flows, and market capitalization are sufficient to support the carrying basis of these long-lived assets, if our sales, cash flows, or common stock price decline, we may be faced with significant asset impairment charges that would have an adverse impact upon our results of operations.
Ineffective internal controls could impact our business and operating results.
Our internal control over financial reporting may not prevent or detect misstatements because of its inherent limitations, including the possibility of human error, the circumvention or overriding of controls, or fraud. Even effective internal controls can provide only reasonable assurance with respect to the preparation and fair presentation of financial statements. If we fail to maintain the adequacy of our internal controls, including any failure to implement required new or improved controls, or if we experience difficulties in their implementation, our business and operating results may be harmed and we could fail to meet our financial reporting obligations.
None.
As of August 31, 2018, our principal executive offices in Salt Lake City, Utah occupy approximately 88,000 square feet of leased office space that is accounted for as a financing arrangement, which expires in 2025. This facility accommodates our executive team and corporate departments, as well as other professionals. The master lease agreement on our principal executive offices contains six five-year renewal options that may be exercised at our discretion. Additionally, we occupy leased sales and administrative offices both in the United States and various countries around the world as shown below. These leased facilities are accounted for as operating leases.
We consider our existing facilities to be in good condition and suitable for our current and expected level of operations in the upcoming fiscal year and in future periods.
U.S./Canada Sales Offices
Columbus, Ohio
International Sales Offices
London, England
Tokyo, Japan
China: Beijing, Shanghai, Guangzhou, and Shenzhen
In fiscal 2017, we restructured the operations of our domestic sales regions to focus on sales and support of the All Access Pass. As part of this restructuring, we closed our three remaining sales offices in Atlanta, Georgia; Chicago, Illinois; and Irvine, California. Our remaining sales office in the United States is used by Robert Gregory Partners, which is one of the businesses that we acquired during fiscal 2017. During fiscal 2016, we restructured the operations of our Australian direct office. As part of the restructuring we closed our sales offices located in Brisbane, Sydney, and Melbourne. Sales personnel in Australia work from their home offices, similar to many of our sales personnel located in the U.S. and Canada. There were no other significant changes to the properties used for our operations during the periods presented in this report.
From time to time, we are the subject of certain legal actions, which we consider routine to our business activities. As of August 31, 2018, we are not party to any litigation or legal proceeding that, in the current opinion of management, could have a material adverse effect on our financial position, liquidity, or results of operations. However, due to the risks and uncertainties inherent in legal proceedings, actual results could differ from current expectations.
Not applicable.
| ITEM 5. |
MARKET FOR REGISTRANT'S COMMON EQUITY, RELATED STOCKHOLDER MATTERS AND ISSUER PURCHASES OF EQUITY SECURITIES
|
Our common stock is listed and traded on the New York Stock Exchange (NYSE) under the symbol "FC." The following table sets forth the high and low sale prices per share of our common stock for the fiscal years ended August 31, 2018 and 2017.
|
High
|
Low
|
|||||||
|
Fiscal Year Ended August 31, 2018:
|
||||||||
|
Fourth Quarter
|
$
|
29.60
|
$
|
24.05
|
||||
|
Third Quarter
|
29.90
|
24.10
|
||||||
|
Second Quarter
|
31.20
|
18.00
|
||||||
|
First Quarter
|
20.95
|
18.20
|
||||||
|
|
||||||||
|
Fiscal Year Ended August 31, 2017:
|
||||||||
|
Fourth Quarter
|
$
|
21.10
|
$
|
17.35
|
||||
|
Third Quarter
|
22.30
|
15.20
|
||||||
|
Second Quarter
|
21.45
|
16.95
|
||||||
|
First Quarter
|
22.45
|
15.44
|
||||||
We did not pay or declare dividends on our common stock during the fiscal years ended August 31, 2018 or 2017. Any determination to pay cash dividends will be at the discretion of our board of directors and will be dependent upon our results of operations, financial condition, terms of our financing arrangements, and such other factors as the board deems relevant. We currently anticipate that we will retain all available funds to repay our liabilities, finance future growth and business opportunities, and to repurchase outstanding shares of our common stock.
As of October 31, 2018, we had 13,918,219 shares of common stock outstanding, which were held by 544 shareholders of record. A number of our shareholders hold their shares in street name; therefore, we believe that there are substantially more beneficial owners of our common stock.
Purchases of Common Stock by the Issuer
The following table summarizes the purchases of our common stock by monthly fiscal periods during our fourth quarter of fiscal 2018:
|
Period
|
Total Number of Shares Purchased
|
Average Price Paid Per Share
|
Total Number of Shares Purchased as Part of Publicly Announced Plans or Programs
|
Maximum Dollar Value of Shares That May Yet Be Purchased Under the Plans or Programs(1)
(in thousands)
|
||||||||||||
|
June 1, 2018 to June 30, 2018
|
-
|
$
|
-
|
-
|
$
|
13,174
|
||||||||||
|
July 1, 2018 to July 31, 2018
|
-
|
- | - |
13,174
|
||||||||||||
|
August 1, 2018 to August 31, 2018
|
-
|
- | - |
13,174
|
||||||||||||
|
Total Common Shares
|
-
|
$ | - | - | ||||||||||||
|
(1)
|
On January 23, 2015, our Board of Directors approved a new plan to repurchase up to $10.0 million of the Company's outstanding common stock. All previously existing common stock repurchase plans were canceled and the new common share repurchase plan does not have an expiration date. On March 27, 2015, our Board of Directors increased the aggregate value of shares of Company common stock that may be purchased under the January 2015 plan to $40.0 million so long as we have either $10.0 million in cash and cash equivalents or have access to debt financing of at least $10.0 million. Under the terms of this expanded common stock repurchase plan, we have purchased 1,539,828 shares of our common stock for $26.8 million through August 31, 2018.
|
The actual timing, number, and value of common shares repurchased under this plan will be determined at our discretion and will depend on a number of factors, including, among others, general market and business conditions, the trading price of common shares, and applicable legal requirements. The Company has no obligation to repurchase any common shares under the authorization, and the repurchase plan may be suspended, discontinued, or modified at any time for any reason.
Performance Graph
The following graph demonstrates a five-year comparison of cumulative total returns for Franklin Covey Co. common stock, the S&P SmallCap 600 Index, and the S&P 600 Commercial & Professional Services Index. The graph assumes an investment of $100 on August 31, 2013 in each of our common stock, the stocks comprising the S&P SmallCap 600 Index, and the stocks comprising the S&P 600 Commercial & Professional Services Index. Each of the indices assumes that all dividends were reinvested.
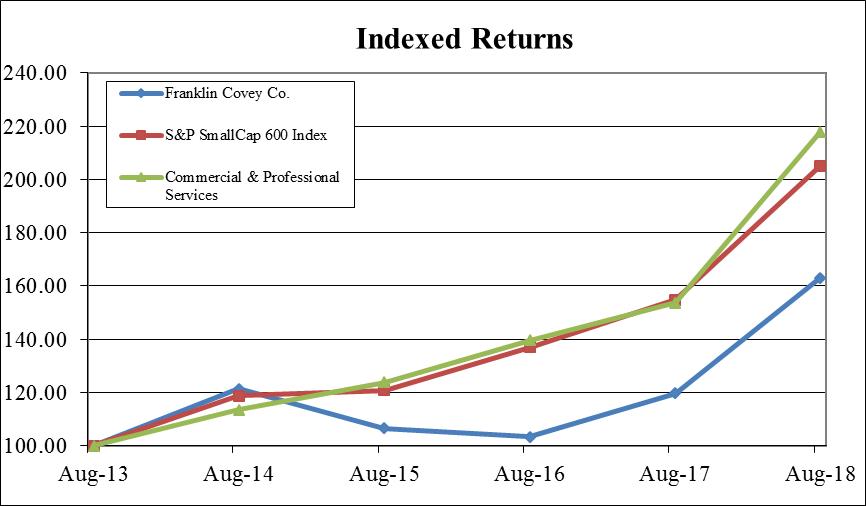
The stock performance shown on the performance graph above is not necessarily indicative of future performance. The Company will not make nor endorse any predictions as to our future stock performance.
The performance graph above is being furnished solely to accompany this Annual Report on Form 10-K pursuant to Item 201(e) of Regulation S-K, and is not being filed for purposes of Section 18 of the Exchange Act, as amended, and is not to be incorporated by reference into any filing of the Company, whether made before or after the date hereof, regardless of any general incorporation language in such filing.
The selected consolidated financial data presented below should be read in conjunction with our consolidated financial statements and related footnotes as found in Item 8 of this Annual Report on Form 10-K.
|
August 31,
|
2018
|
2017(1)
|
2016
|
2015(2)
|
2014(2)
|
|||||||||||||||
|
In thousands, except per-share data
|
||||||||||||||||||||
|
Income Statement Data:
|
||||||||||||||||||||
|
Net sales
|
$
|
209,758
|
$
|
185,256
|
$
|
200,055
|
$
|
209,941
|
$
|
205,165
|
||||||||||
|
Gross profit
|
148,289
|
122,667
|
133,154
|
138,089
|
138,266
|
|||||||||||||||
|
Income (loss) from operations
|
(3,366
|
)
|
(8,880
|
)
|
13,849
|
19,529
|
24,765
|
|||||||||||||
|
Income (loss) before income taxes
|
(5,520
|
)
|
(10,909
|
)
|
11,911
|
17,412
|
21,759
|
|||||||||||||
|
Income tax benefit (provision)
|
(367
|
)
|
3,737
|
(4,895
|
)
|
(6,296
|
)
|
(3,692
|
)
|
|||||||||||
|
Net income (loss)
|
(5,887
|
)
|
(7,172
|
)
|
7,016
|
11,116
|
18,067
|
|||||||||||||
|
Earnings (loss) per share:
|
||||||||||||||||||||
|
Basic
|
$
|
(.43
|
)
|
$
|
(.52
|
)
|
$
|
.47
|
$
|
.66
|
$
|
1.08
|
||||||||
|
Diluted
|
(.43
|
)
|
(.52
|
)
|
.47
|
.66
|
1.07
|
|||||||||||||
|
Balance Sheet Data:
|
||||||||||||||||||||
|
Total current assets
|
$
|
100,163
|
$
|
91,835
|
$
|
89,741
|
$
|
95,425
|
$
|
93,016
|
||||||||||
|
Other long-term assets
|
12,935
|
16,005
|
13,713
|
14,807
|
14,785
|
|||||||||||||||
|
Total assets
|
213,875
|
210,731
|
190,871
|
200,645
|
205,186
|
|||||||||||||||
|
Long-term obligations
|
50,936
|
53,158
|
48,511
|
36,978
|
36,885
|
|||||||||||||||
|
Total liabilities
|
133,375
|
125,666
|
97,156
|
75,139
|
78,472
|
|||||||||||||||
|
Shareholders' equity
|
80,500
|
85,065
|
93,715
|
125,506
|
126,714
|
|||||||||||||||
|
Cash flows from operating activities
|
$
|
16,861
|
$
|
17,357
|
$
|
32,665
|
$
|
26,190
|
$
|
18,124
|
||||||||||
_______________________
|
(1)
|
During fiscal 2017 we decided to allow new All Access Pass agreements to receive updated content throughout the contracted period. Accordingly, we defer substantially all AAP revenues at the inception of the agreements and recognize the revenue over the lives of the arrangements. The transition to the AAP model resulted in significantly reduced revenues and operating income during fiscal 2017.
|
|
(2)
|
We elected to amend previously filed U.S. federal income tax returns to claim foreign tax credits instead of foreign tax deductions and recognized significant income tax benefits which reduced our effective income tax rate during these years.
|
The following management's discussion and analysis is intended to provide a summary of the principal factors affecting the results of operations, liquidity and capital resources, contractual obligations, and the critical accounting policies of Franklin Covey Co. (also referred to as we, us, our, the Company, and FranklinCovey) and subsidiaries. This discussion and analysis should be read together with the accompanying consolidated financial statements and related notes contained in Item 8 of this Annual Report on Form 10-K (Form 10-K) and the Risk Factors discussed in Item 1A of this Form 10-K. Forward-looking statements in this discussion are qualified by the cautionary statement under the heading "Safe Harbor Statement Under the Private Securities Litigation Reform Act Of 1995" contained later in Item 7 of this Form 10-K.
EXECUTIVE SUMMARY
General Overview
Franklin Covey Co. is a global company focused on individual and organizational performance improvement. Our mission is to "enable greatness in people and organizations everywhere," and our worldwide resources are organized to help individuals and organizations achieve sustained superior performance through changes in human behavior. We believe that our content and services create the connection between capabilities and results. We believe that our clients are able to utilize our content to create cultures whose hallmarks are high-performing, collaborative individuals, led by effective, trust-building leaders who execute with excellence and deliver measurably improved results for all of their key stakeholders.
In the training and consulting marketplace, we believe there are four important characteristics that distinguish us from our competitors.
|
1.
|
World Class Content – Our content is principle-centered and based on natural laws of human behavior and effectiveness. When our content is applied consistently in an organization, we believe the culture of that organization will change to enable the organization to achieve their own great purposes. Our offerings are designed to build new skillsets, establish new mindsets, and provide enabling toolsets.
|
|
2.
|
Transformational Impact and Reach – We hold ourselves responsible for and measure ourselves by our clients' achievement of transformational results. Our commitment to achieving lasting impact extends to all of our clients—from CEOs to elementary school students, and from senior management to front-line workers in corporations, governmental, and educational environments.
|
|
3.
|
Breadth and Scalability of Delivery Options – We have a wide range of content delivery options, including: the All Access Pass and other intellectual property licenses, on-site training, training led through certified facilitators, on-line learning, blended learning, and organization-wide transformational processes, including consulting and coaching.
|
|
4.
|
Global Capability – We have sales professionals in the United States and Canada who serve clients in the private sector, in government, and in educational organizations; wholly owned subsidiaries in Australia, China, Japan, and the United Kingdom; and we contract with independent licensee partners who deliver our content and provide services in over 150 other countries and territories around the world.
|
We have some of the best-known offerings in the training industry, including a suite of individual-effectiveness and leadership-development training content based on the best-selling books, The 7 Habits of Highly Effective People, The Speed of Trust, and The 4 Disciplines of Execution, and proprietary content
in the areas of Execution, Sales Performance, Productivity, Customer Loyalty, and Education. We believe that our offerings help individuals, teams, and entire organizations transform their results through achieving systematic, sustainable, and measurable changes in human behavior. Our offerings are described in further detail at www.franklincovey.com. The information contained in, or that can be accessed through, our website does not constitute a part of this annual report, and the descriptions found therein should not be viewed as a warranty or guarantee of results.
Our fiscal year ends on August 31, and unless otherwise indicated, fiscal 2018, fiscal 2017, and fiscal 2016 refer to the twelve-month periods ended August 31, 2018, 2017, 2016, and so forth.
Fiscal 2018 Business Development
Development of the Subscription-Based Business
At its core, Franklin Covey Co. is a content and solutions company. During our history, we have created and developed world-class offerings designed to help our clients solve challenges which require significant and lasting changes in human behavior. Several years ago, we began moving from simply selling training courses to providing fully-integrated solutions and practices which were focused on helping organizational clients successfully execute on their strategic priorities, develop their leaders, and build winning cultures. Three years ago, we determined that we could better serve our clients and substantially expand the breadth and depth of our client impact if we moved from selling content on a course-by-course basis, to a subscription basis, such as through the All Access Pass in our Enterprise Division, which includes our direct office and international licensee segments, and The Leader in Me online service offered through our Education Division.
We believe the All Access Pass provides our clients with a compelling value proposition under which they receive: (1) unlimited access to our current and continually-expanding assemblage of world-class content and solutions; (2) the ability to assemble, integrate and deliver these solutions through an almost limitless combination of delivery options, in 16 languages worldwide; (3) the services of an implementation specialist to help curate and organize the content and solutions into "impact journeys" that exactly meet their needs; (4) at a cost per population trained which is less than or equal to that offered by other providers for just a single course through a single delivery modality; and with (5) an array of affordable add-on implementation services to help them accomplish their key "jobs-to-be-done." The Leader In Me online service provides our education clients with a portal to access content and tools as well as a coach to help schools successfully develop, implement, and effectively utilize the Leader In Me program. During fiscal 2018, we invested significant capital to expand our subscription-based business, including additional implementation specialists, new innovations in the AAP and Leader In Me membership, including the translation of AAP content into 15 new languages, and to enhance the client experience with our subscription-based business.
Business Acquisition Integration
During May 2017, we acquired the assets of Robert Gregory Partners, LLC (RGP), a corporate coaching firm with expertise in executive coaching, transition acceleration coaching, leadership development coaching, implementation coaching, and consulting. In July 2017, we acquired the stock of Jhana Education (Jhana), a company that specializes in the creation and dissemination of relevant, bite-sized content and learning tools for leaders and managers. During fiscal 2018 we sought to integrate the operations of RGP and Jhana into our various services and offerings. We believe these services and offerings provide significant benefits to our clients.
China Direct Offices
During fiscal 2017, we opened four new sales offices in China. These offices are located in Beijing, Shanghai, Guangzhou, and Shenzhen. We continue to see growth from our investment in China, and
during fiscal 2018 we recognized $12.3 million in sales from these new offices. Prior to fiscal 2017, our sales operations in China were managed by an independent licensee partner.
We believe that our significant fiscal 2018 investments and innovations to our AAP and Leader in Me portals, combined with the integration of recent business acquisitions and new China sales offices will provide continued growth opportunities in future periods.
The following is a description of the impact that these developments had on our financial results for the fiscal year ended August 31, 2018.
Financial Overview
During fiscal 2018, we continued to grow and develop our subscription-based business, which is focused on the expansion of All Access Pass and the Leader in Me online service sales. As expected, the transition from our legacy business to a subscription-based model has been disruptive, especially in fiscal 2017 as we deferred a substantial amount of revenue, which was recognized over the lives of the underlying contracts. The recognition of previously deferred revenues combined with new contracts produced increased sales during fiscal 2018. We believe that the ongoing transition to a subscription model is working very well, as our net sales in fiscal 2018 grew $24.5 million, or 13 percent, to $209.8 million compared with $185.3 million in fiscal 2017. Our fiscal 2018 fourth-quarter sales remained strong and totaled $64.8 million, compared with $59.5 million in the fourth quarter of fiscal 2017. These improvements were primarily driven by strong performance from our Enterprise Division during fiscal 2018. Our gross profit and gross margins also improved in fiscal 2018 when compared with the prior year. However, these improvements were partially offset by increased operating expenses as we are transitioning to this new business model and investing in new personnel, technology, and content to improve the client experience and drive future growth opportunities.
For fiscal 2018, our subscription and subscription-related revenue grew 36 percent compared with fiscal 2017. At August 31, 2018, we had $52.9 million of deferred revenue, compared with $41.5 million at August 31, 2017. At August 31, 2018, we had $24.5 million of unbilled deferred revenue compared with $17.5 million of unbilled deferred revenue at the end of fiscal 2017. Unbilled deferred revenue represents business that is contracted, but unbilled and therefore excluded from our balance sheet.
The following table sets forth our consolidated net sales by category and by reportable segment for the fiscal years indicated (in thousands):
|
YEAR ENDED
AUGUST 31,
|
2018
|
Percent change
|
2017
|
Percent change
|
2016
|
|||||||||||||||
|
Sales by Category:
|
||||||||||||||||||||
|
Training and consulting services
|
$
|
202,638
|
14
|
$
|
177,816
|
(6
|
)
|
$
|
189,661
|
|||||||||||
|
Products
|
3,577
|
(8
|
)
|
3,881
|
(35
|
)
|
6,009
|
|||||||||||||
|
Leasing
|
3,543
|
-
|
3,559
|
(19
|
)
|
4,385
|
||||||||||||||
|
$
|
209,758
|
13
|
$
|
185,256
|
(7
|
)
|
$
|
200,055
|
||||||||||||
|
Sales by Segment:
|
||||||||||||||||||||
|
Direct offices
|
$
|
145,890
|
19
|
$
|
122,309
|
(10
|
)
|
$
|
135,954
|
|||||||||||
|
Education practice
|
45,272
|
3
|
44,122
|
8
|
40,844
|
|||||||||||||||
|
International licensees
|
13,226
|
(3
|
)
|
13,571
|
(21
|
)
|
17,113
|
|||||||||||||
|
Corporate and other
|
5,370
|
2
|
5,254
|
(14
|
)
|
6,144
|
||||||||||||||
|
$
|
209,758
|
13
|
$
|
185,256
|
(7
|
)
|
$
|
200,055
|
||||||||||||
Consolidated cost of sales in fiscal 2018 totaled $61.5 million compared with $62.6 million in the prior year. Our gross profit for the fiscal year ended August 31, 2018 increased to $148.3 million, compared with $122.7 million in the prior year. The increase in gross profit was primarily due to sales activity as
described above, including the recognition of previously deferred subscription service revenues. Our gross margin, which is gross profit as a percent of sales, increased to 70.7 percent compared with 66.2 percent in fiscal 2017. The improvement in gross margin was primarily due to a change in the mix of revenues as higher margin subscription revenues, such as the All Access Pass, continue to grow as a percentage of our total revenues.
For the fiscal year ended August 31, 2018, our operating expenses increased $20.1 million compared with fiscal 2017. The increase was primarily due to a $20.0 million increase in selling, general, and administrative (SG&A) expenses; $1.8 million of increased amortization expense from fiscal 2017 business acquisitions; and a $1.3 million increase in depreciation expense primarily related to capital spending on our new AAP portal and ERP system. The increase in SG&A expenses was primarily related to investments in new personnel, including additional AAP implementation specialists, higher commissions on increased sales, new personnel from businesses acquired in the third and fourth quarters of fiscal 2017, and increased computer costs primarily related to our new AAP portal and ERP system. These increases were partially offset by a $1.5 million decrease in contract termination costs and a $1.5 million decrease in restructuring expenses in fiscal 2018.
Our loss from operations in fiscal 2018 was $(3.4) million, compared with a loss of $(8.9) million in fiscal 2017. Pre-tax loss for fiscal 2018 decreased to $(5.5) million compared with a $(10.9) million loss in the prior year.
For fiscal 2018, we recognized net tax expense on our pre-tax loss compared with a net benefit in fiscal 2017. Our consolidated income tax provision was unfavorably affected by a $3.0 million valuation allowance against our fiscal 2011 foreign tax credit carryforward. Sales of the All Access Pass and other subscription services have generated, and will likely to continue to generate, substantial amounts of deferred revenue for both book and tax purposes. This situation has produced taxable losses for the past two fiscal years and a more-likely-than-not presumption that insufficient taxable income will be available to realize the fiscal 2011 foreign tax carryforward, which expires at the end of fiscal 2021.
Net loss for the year ended August 31, 2018 was $(5.9) million, or $(.43) per share, compared with a loss of $(7.2) million, or $(.52) per share, in the prior year.
Further details regarding these items can be found in the comparative analysis of fiscal 2018 with fiscal 2017 as discussed within this management's discussion and analysis.
During fiscal 2018, we invested our available cash and proceeds from our secured credit facility to make substantial and significant investments in our business that we believe will drive results and provide benefits in future periods. We invested $6.5 million of cash to purchase property and equipment, which was primarily comprised of software for a significant upgrade to our AAP portal and the completion of our new ERP system, which successfully launched in fiscal 2018. We also invested $3.0 million during fiscal 2018 for curriculum development and additional new offerings.
Our liquidity position remained healthy during fiscal 2018 and we had $10.2 million of cash at August 31, 2018, with $18.7 million of available credit on our revolving credit facility, compared with $8.9 million of cash at August 31, 2017. At August 31, 2018, we had $12.8 million of term loans payable to the lender on our secured credit facility. For further information regarding our liquidity and cash flows refer to the Liquidity and Capital Resources discussion found later in this management's discussion and analysis.
Key Growth Objectives
We believe that our best-in-class offerings, combined with flexible delivery modalities and worldwide sales and distribution capabilities are the foundation for future growth at Franklin Covey. Building on this foundation, we have identified the following key drivers of growth in fiscal 2019 and beyond:
|
·
|
New Subscription Service Sales and the Renewal of Existing Client Contracts – We are focused on sales of subscription service contracts, such as the All Access Pass, and have restructured our domestic sales force and sales support functions to more effectively sell and support these services. We believe we are well positioned to expand our subscription service revenues in the United States and Canada and reach new clients. We have translated AAP content into 15 new languages and expect this new feature will attract additional clients in future years both from large multinational entities and smaller clients that are served by our international direct offices and international licensee partners.
|
|
·
|
Education Segment – Our Education segment has consistently grown over the past several years. We intend to continue to invest in new content and additional sales personnel to reach out to new educational institutions while retaining existing The Leader in Me schools. We believe there are significant growth opportunities, both domestically and internationally, for our Education segment and its well-known The Leader in Me offering.
|
|
·
|
Growth of our Direct Office and International Licensee Segments – We are actively focused on growing the size and productivity of our Direct Office segment through expansion of our sales force to reach potential clients. In addition, we believe the acquisition of Robert Gregory Partners, LLC in fiscal 2017 will open new opportunities as we seek to expand our coaching business. We are also actively seeking to expand the size and productivity of our international licensee partners through the development of additional content, such as the translated AAP offerings, and additional licensee support activities.
|
Another of our underlying strategic objectives is to consistently deliver quality results to our clients. This concept is focused on ensuring that our content and offerings are best-in-class, and that they have a measurable, lasting impact on our clients' results. We believe that measurable improvement in our clients' organizations is key to retaining current clients and to obtaining new sales opportunities.
Other key factors that influence our operating results include: the size and productivity of our sales force; the number and productivity of our international licensee operations; the number of organizations that are active customers; the number of people trained within those organizations; the continuation or renewal of existing services contracts, especially All Access Pass renewals; the availability of budgeted training spending at our clients and prospective clients, which, in certain content categories, can be significantly influenced by general economic conditions; and our ability to manage operating costs necessary to develop and provide meaningful training and related services and products to our clients.
RESULTS OF OPERATIONS
The following table sets forth, for the fiscal years indicated, the percentage of total sales represented by the line items through income or loss before income taxes in our consolidated statements of operations. This table should be read in conjunction with the accompanying discussion and analysis, the consolidated financial statements, and the related notes to the consolidated financial statements.
|
YEAR ENDED
AUGUST 31,
|
2018
|
2017
|
2016
|
|||||||||
|
Sales:
|
||||||||||||
|
Training and consulting services
|
96.6
|
%
|
96.0
|
%
|
94.8
|
%
|
||||||
|
Products
|
1.7
|
2.1
|
3.0
|
|||||||||
|
Leasing
|
1.7
|
1.9
|
2.2
|
|||||||||
|
Total sales
|
100.0
|
100.0
|
100.0
|
|||||||||
|
Cost of sales:
|
||||||||||||
|
Training and consulting services
|
27.7
|
30.5
|
29.6
|
|||||||||
|
Products
|
0.6
|
2.2
|
1.6
|
|||||||||
|
Leasing
|
1.0
|
1.1
|
1.2
|
|||||||||
|
Total cost of sales
|
29.3
|
33.8
|
32.4
|
|||||||||
|
Gross profit
|
70.7
|
66.2
|
67.6
|
|||||||||
|
Selling, general, and administrative
|
67.3
|
65.4
|
56.8
|
|||||||||
|
Contract termination costs
|
-
|
0.8
|
-
|
|||||||||
|
Restructuring costs
|
-
|
0.8
|
0.4
|
|||||||||
|
Depreciation
|
2.4
|
2.1
|
1.9
|
|||||||||
|
Amortization
|
2.6
|
1.9
|
1.6
|
|||||||||
|
Total operating expenses
|
72.3
|
71.0
|
60.7
|
|||||||||
|
Income (loss) from operations
|
(1.6
|
)
|
(4.8
|
)
|
6.9
|
|||||||
|
Interest income
|
0.0
|
0.1
|
0.1
|
|||||||||
|
Interest expense
|
(1.2
|
)
|
(1.3
|
)
|
(1.1
|
)
|
||||||
|
Accretion of discount on related party receivables
|
0.2
|
0.1
|
0.1
|
|||||||||
|
Income (loss) before income taxes
|
(2.6
|
)%
|
(5.9
|
)%
|
6.0
|
%
|
||||||
FISCAL 2018 COMPARED WITH FISCAL 2017
Sales
The following sales analysis for the fiscal year ended August 31, 2018 is based on activity through our reportable segments as shown in the preceding comparative sales table.
Direct Offices – This segment includes our sales personnel that serve clients in the United States and Canada; our directly owned international offices in Japan, China, the United Kingdom, and Australia; and other groups that were formerly included in the Strategic Markets segment, such as our government services office. During the first quarter of fiscal 2018, we dissolved the Strategic Markets segment and combined those sales groups with the Direct Offices segment since most of these groups have a common focus--selling the All Access Pass and related services. In addition to the benefit from the recognition of previously deferred revenues, during fiscal 2018 our government services sales increased $4.1 million, and we had $4.0 million of increased revenue from businesses acquired in the third and fourth quarters of fiscal 2017. These increases were partially offset by decreased facilitator sales, as many of these clients have transitioned to the AAP, and decreased onsite training revenues.
International direct office sales increased $4.9 million when compared with the prior year. Sales increased at all of our international offices compared with fiscal 2017. Our sales in the United Kingdom and Australia were favorably impacted by the recognition of previously deferred AAP revenues and new contracts. Our new China offices continue to perform well and recognized a $1.3 million increase in sales compared with the prior year. Our Japan office sales increased by $0.2
million despite our decision to exit the publishing business in the third quarter of fiscal 2017. Foreign exchange rates had a $1.0 million favorable impact on our international direct offices sales and a $0.2 million favorable impact on our international direct office results of operations during fiscal 2018. Early in the third quarter fiscal 2018 we launched the All Access Pass in 15 additional languages. We believe that our international direct offices and international licensees will be favorably impacted by the availability of our content and offerings through the AAP to our foreign clients in these additional languages.
Education Division – Our Education practice is comprised of our domestic and international Education practice operations (focused on sales to educational institutions) and includes our widely acclaimed The Leader In Me program. Our Education practice has grown consistently over the past several years, from $8.4 million of sales in fiscal 2010 to $44.1 million in sales during fiscal 2017. In fiscal 2018, however, the Education Division's revenues increased only three percent to $45.3 million. The primary reason for the slowdown in Education Division revenues was the expiration of a large six-year funding commitment from a charitable educational foundation focused on funding new The Leader in Me schools. This contract expiration reduced revenues in the Education Division by $2.8 million, and gross profit by approximately $1.6 million during fiscal 2018. However, we continued to see increased demand for The Leader in Me program in many school districts in the United States as well as in foreign countries. As of August 31, 2018, The Leader in Me program is used in over 3,700 schools and in over 50 countries. During fiscal 2018 we also made the decision to expand The Leader in Me program to high schools, and we expect this decision to contribute to increased sales in future periods. We also continue to make substantial investments in sales personnel and new materials to drive increased Education segment sales in the future. We expect the Education Division to resume its strong growth trajectory in fiscal 2019.
International Licensees – In countries or foreign locations where we do not have a directly owned office, our training and consulting services are delivered through independent licensees, which may translate and adapt our offerings to local preferences and customs, if necessary. Our international licensee revenues decreased $0.3 million compared with the prior year, which was primarily due to decreased sales of training materials during the year. Foreign exchange rates had a $0.3 million favorable impact on licensee revenues for fiscal 2018.
Corporate and Other – Our "corporate and other" sales are primarily comprised of leasing, and shipping and handling revenues. These sales increased during fiscal 2018 primarily due to increased shipping and handling revenue when compared with the prior year.
Cost of Sales and Gross Profit
Gross profit consists of net sales less the cost of services provided or the cost of goods sold. Our cost of sales includes the direct costs of delivering content onsite at client locations, including presenter costs, materials used in the production of training products and related assessments, assembly, manufacturing labor costs, and freight. Gross profit may be affected by, among other things, the mix services sold to clients, prices of materials, labor rates, changes in product discount levels, and freight costs.
Our cost of sales in fiscal 2018 totaled $61.5 million compared with $62.6 million in the prior year. Our gross profit for the fiscal year ended August 31, 2018 increased $25.6 million to $148.3 million, compared with $122.7 million in the prior year. The increase in gross profit was primarily due to increased sales as previously described. Our gross margin increased to 70.7 percent compared with 66.2 percent in fiscal 2017. The improvement in gross margin was primarily due to a change in the mix of revenues as higher margin subscription revenues, such as the All Access Pass, continue to grow as a percentage of our total revenues. Our gross margin in fiscal 2017 was unfavorably impacted by our decision to exit the publishing business in Japan. Excluding the impact of the $2.1 million charge to exit this business and write off the majority of our book inventory in Japan, our gross margin was 67.4 percent for the fiscal year ended August 31, 2017.
Operating Expenses
Our operating expenses consisted of the following for the periods indicated (in thousands):
|
YEAR ENDED AUGUST 31,
|
2018
|
2017
|
$ Change
|
% Change
|
||||||||||||
|
SG&A expenses
|
$
|
137,266
|
$
|
119,426
|
$
|
17,840
|
15
|
|||||||||
|
Increase (decrease) to contingent payment liabilities
|
1,014
|
(1,936
|
)
|
2,950
|
n/a
|
|||||||||||
|
Stock-based compensation expense
|
2,846
|
3,658
|
(812
|
)
|
(22
|
)
|
||||||||||
|
Consolidated SG&A expense
|
141,126
|
121,148
|
19,978
|
16
|
||||||||||||
|
Contract termination costs
|
-
|
1,500
|
(1,500
|
)
|
(100
|
)
|
||||||||||
|
Restructuring costs
|
-
|
1,482
|
(1,482
|
)
|
(100
|
)
|
||||||||||
|
Depreciation
|
5,161
|
3,879
|
1,282
|
33
|
||||||||||||
|
Amortization
|
5,368
|
3,538
|
1,830
|
52
|
||||||||||||
|
$
|
151,655
|
$
|
131,547
|
$
|
20,108
|
15
|
||||||||||
Selling, General and Administrative Expense – The increase in our SG&A expenses for fiscal 2018 was primarily due to 1) a $14.2 million increase in spending related to investments in new personnel, including additional implementation specialists, increased commissions on higher sales, and new personnel from businesses acquired during fiscal 2017; 2) a $3.0 million change in expense from adjusting the fair value of estimated contingent consideration liabilities from previous business acquisitions; 3) a $2.3 million increase in computer and office expenses primarily resulting from our significantly enhanced AAP portal and new ERP system; and 4) a $1.2 million increase in development and consulting costs primarily related to the development of new content and programs. During fiscal 2017, we determined that the likelihood of further contingent payments arising from the acquisition of NinetyFive 5, LLC was becoming less likely. Accordingly, we reversed the previously accrued contingent consideration expense from these potential payments, which resulted in significant credits during fiscal 2017 that did not repeat in fiscal 2018.
Contract Termination Costs – We entered into a new 10-year license agreement for Education practice content in a foreign country, with minimum required royalties payable to us that total approximately $13 million (at current exchange rates) over the life of the arrangement. Under the previously existing profit-sharing agreement, we would have been obligated to pay one-third of the royalty to an international licensee partner that owns the rights in that country. For a $1.5 million cash payment, we terminated the previously existing profit sharing arrangement and we will owe no further royalty payments to the licensee. Based on the guidance for contract termination costs, we expensed the $1.5 million payment in fiscal 2017.
Restructuring Costs – During the third quarter of fiscal 2017, we decided to exit the publishing business in Japan and we restructured our U.S./Canada direct office operations to transition to an AAP-focused business model. We expensed $3.6 million related to these changes during fiscal 2017. Due to a change in strategy designed to focus resources and efforts on sales of the All Access Pass in Japan, and declining sales and profitability of the publishing business, we decided to exit the publishing business in Japan. As a result of this determination, we wrote off the majority of our book inventory located in Japan and expensed $2.1 million, which was recorded in cost of sales, as previously described. We also restructured the operations of our U.S/Canada direct offices to create new smaller regional market teams that are focused on selling the All Access Pass. Accordingly, we determined that our three remaining regional sales offices were unnecessary since most client partners work from home-based offices, we restructured the operations of the Sales Performance and Winning Customer Loyalty Practices, and we eliminated certain functions to reduce costs in future periods. We expensed $1.5 million for these restructuring costs in fiscal 2017.
Depreciation – Depreciation expense increased due to the acquisition of assets in fiscal 2018, including our new ERP software and significantly upgraded AAP portal. Based on previous property and equipment acquisitions, and expected capital additions during fiscal 2019, we expect depreciation expense will total approximately $6.7 million in fiscal 2019.
Amortization – Our consolidated amortization expense increased compared with the prior year primarily due to the fiscal 2017 acquisitions of Robert Gregory Partners, LLC and Jhana Education, and the amortization of acquired intangible assets. Based on current carrying amounts of intangible assets and remaining estimated useful lives, we anticipate amortization expense from intangible assets will total $4.8 million in fiscal 2019.
Accretion of Discount on Related Party Receivables – We have receivables from FC Organizational Products (FCOP), an entity in which we own a 19.5 percent interest. We classify these receivables as current or long-term based on expected payment dates, and discount long-term receivables at a rate of 15 percent, which we believe approximates FCOP's incremental borrowing rate. During fiscal 2018, FCOP paid receivables sooner than expected and we have accelerated the accretion of the discount on these receivables. We expect that FCOP will continue to pay its receivables sooner than anticipated in forthcoming periods which may result in additional acceleration of the discount on these long-term receivables.
Income Taxes
Our effective income tax provision rate for the fiscal year ended August 31, 2018 was approximately 7 percent compared with a benefit rate of approximately 34 percent in the prior year.
The unfavorable change in tax rate for fiscal 2018 was primarily due to the recognition of a $3.0 million valuation allowance against our foreign tax credit carryforward from fiscal 2011. Our sales of the All Access Pass and other subscription services have generated, and will likely continue to generate, substantial amounts of deferred revenue for both book and tax purposes. This situation has produced taxable losses for the past two fiscal years and a more-likely-than-not presumption that insufficient taxable income will be available to realize the fiscal 2011 foreign tax carryforward, which expires at the end of fiscal 2021. We also recognized additional income tax expense from unrecognized tax benefits and disallowed travel and entertainment expenses in fiscal 2018. Partially offsetting these unfavorable factors were tax benefits from the Tax Cut and Jobs Act (the 2017 Tax Act), which was signed into law on December 22, 2017. The 2017 Tax Act decreased the U.S. federal statutory tax rate applicable to our net deferred tax liabilities, resulting in a $1.7 million benefit, which was partially offset by $0.5 million of reduced benefits resulting from the decrease in the U.S. federal statutory tax rate applied to our pre-tax loss.
Our effective tax rate in fiscal 2018 was also affected by $0.5 million of previously unrecognized tax benefits that were partially offset by additional valuation allowances against the deferred tax assets of a foreign subsidiary and disallowed travel and entertainment expenses.
During fiscal 2018, we paid $2.5 million in cash for income taxes, primarily to foreign jurisdictions. We expect to recover a significant portion of our 2018 tax payments as we utilize foreign tax credit carryforwards in the future. Over the next four to six years, we expect that our total cash paid for income taxes will be less than our total income tax provision as we utilize carryforwards of net operating losses and foreign tax credits.
FISCAL 2017 COMPARED WITH FISCAL 2016
Sales
The following sales analysis for the fiscal year ended August 31, 2017 is based on activity through our reportable segments as shown in the preceding comparative sales table.
Direct Offices – During fiscal 2017, our China sales offices recognized $11.0 million of sales, which was in line with our expectations for these new offices. However, the increase in sales from the new China offices was offset by decreased domestic direct office revenues and decreased revenues from our office in the United Kingdom. Our domestic direct office revenues decreased $14.2 million compared
with the prior year primarily due to the transition to the AAP business model and decreased onsite revenues. The majority of new AAP contract revenue was deferred in fiscal 2017 and will be recognized over the lives of the underlying contracts. Onsite presentation revenues during fiscal 2017 decreased $5.6 million compared to the prior year due to fewer days booked and discounted pricing available to AAP clients. Additionally, our Sales Performance practice revenues fell by $5.3 million and our Customer Loyalty practice revenues decreased by $1.4 million. These practices' revenues declined primarily due to fewer new contracts during the fiscal year. Partially offsetting these decreases was $1.2 million of coaching revenue from the acquisition of Robert Gregory Partners, LLC and a $0.2 million increase in government services sales.
International direct office sales increased $7.6 million compared with the prior year due to the new China sales offices. Partially offsetting the sales from the China was a $2.0 million decrease in sales at our office in the United Kingdom, a $0.8 million decrease in Japan, and a $0.7 million decrease in Australia. The decrease in sales at the United Kingdom office was primarily due to the growth and deferral of AAP contract sales, a large contract that did not renew during fiscal 2017, and $0.6 million of adverse currency exchange impact during the year. Our sales in Japan decreased due to reduced book publishing sales, which was primarily attributable to our decision to exit the publishing business in Japan during fiscal 2017. Partially offsetting decreased publishing sales in Japan was a $1.0 million increase in training sales. The decrease in sales in Australia was primarily due to the growth and deferral of AAP revenues during the year. During fiscal 2017, combined foreign exchange rates had a $0.4 million adverse impact on international direct office sales, which was primarily attributable to the U.S. dollar strengthening against the British Pound.
Education Practice – During fiscal 2017, we continued to see increased demand for The Leader in Me program in many school districts in the United States as well as in some international locations, which contributed to a $3.3 million, or 8 percent, increase in Education practice revenues compared with the prior year.
International Licensees – Our international licensee revenues decreased $3.5 million compared with the prior year. The decrease was primarily due to the conversion of our China licensee into a direct office ($2.5 million of royalty revenues during fiscal 2016) and by decreased sales at certain of our licensee partners during the fiscal year. Foreign exchange rates did not have a material impact on licensee sales in fiscal 2017.
Corporate and other – These sales declined primarily due to a $0.8 million decrease in leasing revenues. Under the terms of a previously existing outsourcing services agreement, we were responsible for leasing space in our former warehouse. However, the services contract expired in June 2016, and we were no longer responsible for leasing the former warehouse space. The corresponding sublease agreement also expired, resulting in reduced lease revenue compared with the prior year.
Cost of Sales and Gross Profit
Our cost of sales totaled $62.6 million in fiscal 2017 compared with $64.9 million in fiscal 2016. Our gross profit for fiscal 2017 was $122.7 million compared with $135.2 million in fiscal 2016. The decrease in gross profit during fiscal 2017 was primarily due to sales activity, as described above, and our decision to exit the publishing business in Japan and write off the majority of our book inventory. Our gross margin for fiscal 2017 was 66.2 percent of sales compared with 67.6 percent in fiscal 2016. Excluding the impact of the $2.1 million charge to exit the Japan publishing business, our gross margin was 67.4 percent for the fiscal year ended August 31, 2017.
Operating Expenses
Our operating expenses consisted of the following for the periods indicated (in thousands):
|
YEAR ENDED AUGUST 31,
|
2017
|
2016
|
$ Change
|
% Change
|
||||||||||||
|
SG&A expenses
|
$
|
114,207
|
$
|
108,930
|
$
|
5,277
|
5
|
|||||||||
|
China SG&A expenses
|
5,219
|
-
|
5,219
|
n/a
|
||||||||||||
|
Increase (decrease) to contingent payment liabilities
|
(1,936
|
)
|
1,538
|
(3,474
|
)
|
n/a
|
||||||||||
|
Stock-based compensation expense
|
3,658
|
3,121
|
537
|
17
|
||||||||||||
|
Consolidated SG&A expense
|
121,148
|
113,589
|
7,559
|
7
|
||||||||||||
|
Contract termination costs
|
1,500
|
-
|
1,500
|
n/a
|
||||||||||||
|
Restructuring costs
|
1,482
|
776
|
706
|
91
|
||||||||||||
|
Depreciation
|
3,879
|
3,677
|
202
|
5
|
||||||||||||
|
Amortization
|
3,538
|
3,263
|
275
|
8
|
||||||||||||
|
$
|
131,547
|
$
|
121,305
|
$
|
10,242
|
8
|
||||||||||
Selling, General and Administrative Expense – The increase in our SG&A expenses during fiscal 2017 was primarily due to 1) opening new sales offices in China during the fiscal year, including $0.5 million of non-repeating start-up costs; 2) a $5.5 million increase in spending related to new sales and sales-related personnel, additional bonuses for sales associates related to multi-year deferred sales contracts, and increased travel to promote our new offices in China and the AAP; 3) a $1.9 million increase in computer costs primarily resulting from the installation of our new ERP system; and 4) a $0.5 million increase in non-cash stock-based compensation. We continue to invest in new sales and sales-related personnel and had 221 client partners at August 31, 2017 compared with 204 client partners at August 31, 2016. These increases were partially offset by a $3.5 million decrease from the change in estimated earn out payments to the former owners of NinetyFive 5, reduced warehousing and distribution expense, and cost savings in various other areas of our operations.
Contract Termination Costs – Refer to the discussion related to the contract termination costs in the preceding section comparing the results of fiscal 2018 with fiscal 2017.
Restructuring Costs – Refer to the discussion related to the fiscal 2017 restructuring costs in the preceding section comparing the results of fiscal 2018 with fiscal 2017.
Depreciation – Depreciation expense increased primarily due to the acquisition of assets in fiscal 2017.
Amortization – Our consolidated amortization expense increased compared with the prior year primarily due to the fiscal 2017 acquisitions of Robert Gregory Partners, LLC and Jhana Education, and the amortization of acquired intangible assets.
Income Taxes
Our effective income tax benefit rate for the fiscal year ended August 31, 2017 was approximately 34 percent compared with an effective income tax expense rate of approximately 41 percent in fiscal 2016. Our effective benefit rate in fiscal 2017 was increased by $0.5 million in previously unrecognized tax benefits but was reduced by recording additional valuation allowance against the deferred tax assets of a foreign subsidiary, disallowed travel and entertainment expenses, and disallowed executive compensation. In fiscal 2016, our effective income tax rate was increased primarily due to a $0.3 million valuation allowance against the deferred tax assets of a foreign subsidiary with recent and substantial taxable losses combined with disallowed travel and entertainment expenses.
QUARTERLY RESULTS
The following tables set forth selected unaudited quarterly consolidated financial data for the fiscal years ended August 31, 2018 and 2017. The quarterly consolidated financial data reflects, in the opinion of management, all normal and recurring adjustments necessary to fairly present the results of operations for such periods. Results of any one or more quarters are not necessarily indicative of continuing trends (in thousands, except for per-share amounts).
|
YEAR ENDED AUGUST 31, 2018 (unaudited)
|
||||||||||||||||
|
November 30
|
February 28
|
May 31
|
August 31
|
|||||||||||||
|
Net sales
|
$
|
47,932
|
$
|
46,547
|
$
|
50,461
|
$
|
64,818
|
||||||||
|
Gross profit
|
32,868
|
32,744
|
34,916
|
47,761
|
||||||||||||
|
Selling, general, and administrative
|
33,824
|
35,097
|
34,910
|
37,294
|
||||||||||||
|
Depreciation
|
901
|
1,379
|
1,267
|
1,615
|
||||||||||||
|
Amortization
|
1,395
|
1,395
|
1,326
|
1,251
|
||||||||||||
|
Income (loss) from operations
|
(3,252
|
)
|
(5,127
|
)
|
(2,587
|
)
|
7,601
|
|||||||||
|
Income (loss) before income taxes
|
(3,740
|
)
|
(5,765
|
)
|
(3,088
|
)
|
7,074
|
|||||||||
|
Net income (loss)
|
(2,392
|
)
|
(2,740
|
)
|
(2,534
|
)
|
1,779
|
|||||||||
|
Net income (loss) per share:
|
||||||||||||||||
|
Basic and diluted
|
$
|
(.17
|
)
|
$
|
(.20
|
)
|
$
|
(.18
|
)
|
$
|
.13
|
|||||
|
YEAR ENDED AUGUST 31, 2017 (unaudited)
|
||||||||||||||||
|
November 26
|
February 28
|
May 31
|
August 31
|
|||||||||||||
|
Net sales
|
$
|
39,787
|
$
|
42,196
|
$
|
43,751
|
$
|
59,523
|
||||||||
|
Gross profit
|
25,308
|
28,031
|
27,341
|
41,988
|
||||||||||||
|
Selling, general, and administrative
|
29,095
|
29,370
|
30,713
|
31,970
|
||||||||||||
|
Contract termination costs
|
-
|
1,500
|
-
|
-
|
||||||||||||
|
Restructuring costs
|
-
|
-
|
1,335
|
147
|
||||||||||||
|
Depreciation
|
866
|
928
|
949
|
1,136
|
||||||||||||
|
Amortization
|
722
|
721
|
835
|
1,261
|
||||||||||||
|
Income (loss) from operations
|
(5,375
|
)
|
(4,488
|
)
|
(6,491
|
)
|
7,474
|
|||||||||
|
Income (loss) before income taxes
|
(5,875
|
)
|
(5,002
|
)
|
(7,023
|
)
|
6,995
|
|||||||||
|
Net income (loss)
|
(3,958
|
)
|
(3,333
|
)
|
(4,541
|
)
|
4,659
|
|||||||||
|
Net income (loss) per share:
|
||||||||||||||||
|
Basic
|
$
|
(.29
|
)
|
$
|
(.24
|
)
|
$
|
(.33
|
)
|
$
|
.34
|
|||||
|
Diluted
|
(.29
|
)
|
(.24
|
)
|
(.33
|
)
|
.33
|
|||||||||
Our fourth quarter of each fiscal year typically has higher sales and operating income than other fiscal quarters primarily due to increased revenues in our Education practice (when school administrators and faculty have professional development days) and to increased AAP and facilitator sales that typically occur during that quarter resulting from year-end incentive programs. Overall, training sales are moderately seasonal because of the timing of corporate training, which is not typically scheduled as heavily during holiday and certain vacation periods. Quarterly fluctuations may also be affected by other factors including the introduction of new offerings, business acquisitions, the addition of new organizational customers, and the elimination of underperforming offerings.
For more information on our quarterly results of operations, refer to our quarterly reports on Form 10-Q as filed with the SEC. Our quarterly reports for the periods indicated are available free of charge at www.sec.gov.
LIQUIDITY AND CAPITAL RESOURCES
Introduction
Our cash balance at August 31, 2018 totaled $10.2 million, with $18.7 million of available credit remaining on our $30.0 million revolving credit facility, compared with $8.9 million of cash at August 31, 2017. Of our $10.2 million in cash at August 31, 2018, $8.9 million was held outside the U.S. by our foreign subsidiaries. We routinely repatriate cash from our foreign subsidiaries and consider cash generated from foreign activities a key component of our overall liquidity position. Our net working capital (current assets less current liabilities) was $5.3 million at August 31, 2018 compared with $11.2 million at August 31, 2017. The reduction in our net working capital was primarily due to a $11.4 million increase in deferred revenues resulting primarily from increased subscription service sales and increased current term note payable. Our primary sources of liquidity are cash flows from the sale of services in the normal course of business and available proceeds from our secured credit facility. Our primary uses of liquidity include payments for operating activities, capital expenditures (including curriculum development), debt payments, payments resulting from the acquisition of businesses, purchases of new content, working capital expansion, and purchases of our common stock.
The following table summarizes our cash flows from operating, investing, and financing activities for the past three years (in thousands):
|
YEAR ENDED AUGUST 31,
|
2018
|
2017
|
2016
|
|||||||||
|
Total cash provided by (used for):
|
||||||||||||
|
Operating activities
|
$
|
16,861
|
$
|
17,357
|
$
|
32,665
|
||||||
|
Investing activities
|
(10,634
|
)
|
(21,675
|
)
|
(6,229
|
)
|
||||||
|
Financing activities
|
(4,679
|
)
|
3,134
|
(32,535
|
)
|
|||||||
|
Effect of exchange rates on cash
|
(319
|
)
|
(348
|
)
|
321
|
|||||||
|
Increase (decrease) in cash and cash equivalents
|
$
|
1,229
|
$
|
(1,532
|
)
|
$
|
(5,778
|
)
|
||||
Our Amended and Restated Credit Agreement
On May 24, 2016, we entered into the Fifth Modification Agreement to our existing amended and restated secured credit agreement (the Restated Credit Agreement) with our existing lender. The primary purposes of the Fifth Modification Agreement were to (i) obtain a term loan from the lender for $15.0 million (the Term Loan); (ii) increase the maximum principal amount of the revolving line of credit from $30.0 million to $40.0 million; (iii) extend the maturity date of the Restated Credit Agreement; (iv) permit us to convert balances outstanding from time to time under the revolving line of credit to term loans; and (v) adjust the fixed charge coverage ratio from 1.40 to 1.15. During fiscal 2017, we entered into the Sixth, Seventh, and Eighth Modification Agreements to the Restated Credit Agreement. The Sixth Modification and Eighth Modification agreements adjusted the definition of EBITDAR in the funded debt to EBITDAR and fixed charge coverage ratios applicable to our debt covenants to include the change in deferred revenue. The Seventh Modification Agreement extended the maturity date of the Restated Credit Agreement. In August 2018, we entered into the Ninth Modification Agreement, which extended the maturity date of the Restated Credit Agreement by one year to March 31, 2021.
The amount of available credit on our revolving credit line is reduced by amounts converted to term loans. Term loans are due three years from the inception of each new loan. Principal payments on our term loans are due quarterly and are equal to the original amount of each term loan divided by 16. Any remaining principal at the maturity date is immediately payable or may be rolled into a new term loan. Interest is charged at the same rate as the revolving line of credit and is payable monthly. At August 31, 2018, the maximum available credit on the revolving facility was $30.0 million and we owed $12.8 million on outstanding term loans. We did not convert any balances to term loans during the fiscal 2018.
The various modification agreements preserve existing debt covenants that include (i) a funded debt to EBITDAR ratio of less than 3.0 to 1.0; (ii) a fixed charge coverage ratio greater than 1.15 to 1.0; (iii) an annual limit on capital expenditures (excluding capitalized curriculum development) of $8.0 million; and (iv) consolidated accounts receivable must exceed 150 percent of the amount outstanding on the line of credit. The other key terms and conditions of the various modification agreements are substantially the same as those defined in the Restated Credit Agreement, except as described above. We believe that we were in compliance with the financial covenants and other terms applicable to the Restated Credit Agreement at August 31, 2018.
In addition to our revolving line of credit facility and term loan obligations, we have a long-term lease on our corporate campus that is accounted for as a financing obligation. For further information on our operating lease obligations, which are not currently recorded on our consolidated balance sheet, refer to the notes to our consolidated financial statements as presented in Item 8 of this report on Form 10-K.
The following discussion is a description of the primary factors affecting our cash flows and their effects upon our liquidity and capital resources during the fiscal year ended August 31, 2018.
Cash Flows from Operating Activities
Our primary source of cash from operating activities was the sale of services and products to our customers in the normal course of business. The primary uses of cash for operating activities were payments for selling, general, and administrative expenses, payments for direct costs necessary to conduct training programs, payments to suppliers for materials used in training manuals sold, and to fund working capital needs. Our cash provided by operating activities was $16.9 million for the fiscal year ended August 31, 2018 compared with $17.4 million in fiscal 2017. The decrease was primarily due to cash used to support changes in working capital when compared with the prior year, including the deferral of subscription-based revenues. Although we are required to defer AAP and other subscription-service revenues over the lives of the underlying contracts, we invoice the entire contract amount and collect the associated receivable at the inception of the agreement.
Cash Flows from Investing Activities and Capital Expenditures
Our cash used for investing activities during fiscal 2018 totaled $10.6 million. The primary uses of cash for investing activities included purchases of property and equipment in the normal course of business, additional spending on the development of our offerings, and a contingent consideration payment associated with the acquisition of Jhana Education, which was completed in the fourth quarter of fiscal 2017.
Our purchases of property and equipment, which totaled $6.5 million, consisted primarily of computer software costs related to significant upgrades in our AAP portal and the replacement of our ERP software, and $1.1 million of leasehold improvements on our corporate headquarters facility. We currently anticipate that our purchases of property and equipment will total approximately $6.0 million in fiscal 2019.
We spent $3.0 million during fiscal 2018 on the development of various offerings, including our new leadership curriculum and the continued development and expansion of our subscription offerings. We believe continued investment in our offerings is critical to our future success and anticipate that our capital spending for curriculum development will total $5.5 million during fiscal 2019.
During the first quarter of fiscal 2018, we paid $1.1 million to the former owners of Jhana Education as contingent consideration related to this acquisition. Due to the close proximity of this payment to the acquisition date, we classified the $1.1 million as a component of investing activities in our consolidated statement of cash flows. Other contingent consideration payments from this acquisition will be classified as a component of financing activities in our consolidated statements of cash flows.
Cash Flows from Financing Activities
Our net cash used for financing activities in fiscal 2018 totaled $4.7 million. Our primary uses of financing cash during fiscal 2018 included $8.1 million of cash paid on term loans and the financing obligation on our corporate campus, $2.3 million of cash paid to the former owners of Jhana and RGP for contingent acquisition consideration, and $2.0 million to purchase shares of our common stock, which consisted entirely of shares withheld for statutory taxes on stock-based compensation awards that vested during fiscal 2018. These uses of cash were partially offset by $7.0 million of proceeds from our long-term revolving credit facility and $0.8 million of cash from participants in our employee stock purchase program.
During fiscal 2017, we completed the acquisitions of RGP and Jhana as previously described. Each of these acquisitions have contingent consideration that may be earned by their former owners based on specified performance criteria. As the operations of these acquisitions reach the specified milestones for required contingent payments, our uses of cash for financing activities may increase.
On January 23, 2015, our Board of Directors approved a new plan to repurchase up to $10.0 million of the Company's outstanding common stock. All previously existing common stock repurchase plans were canceled and the new common share repurchase plan does not have an expiration date. On March 27, 2015, our Board of Directors increased the aggregate value of shares of Company common stock that may be purchased under the January 2015 plan to $40.0 million so long as we have either $10.0 million in cash and cash equivalents or have access to debt financing of at least $10.0 million. Under the terms of this expanded common stock repurchase plan, we have purchased 1,539,828 shares of our common stock for $26.8 million through August 31, 2018. Our cash used for financing activities will be impacted as we make purchases of shares under the terms of this plan in future periods.
Sources of Liquidity
We expect to meet our projected capital expenditures, service our existing financing obligation, and meet other working capital requirements during fiscal 2019 from current cash balances, future cash flows from operating activities, and available borrowings from our Restated Credit Agreement. Going forward, we will continue to incur costs necessary for the day-to-day operation and potential growth of the business and may use our available revolving line of credit and other financing alternatives, if necessary, for these expenditures. Our Restated Credit Agreement expires in March 2021 and we expect to renew the Restated Credit Agreement on a regular basis to maintain the long-term borrowing capacity of this credit facility. At August 31, 2018, we had $18.7 million of borrowing capacity on our Restated Credit Agreement. Additional potential sources of liquidity available to us include factoring receivables, issuance of additional equity, or issuance of debt from public or private sources. If necessary, we will evaluate all of these options and select one or more of them depending on overall capital needs and the associated cost of capital.
We believe that our existing cash and cash equivalents, cash generated by operating activities, and availability of external funds as described above, will be sufficient for us to maintain our operations in the foreseeable future. However, our ability to maintain adequate capital for our operations in the future is dependent upon a number of factors, including sales trends, macroeconomic activity, our ability to contain costs, levels of capital expenditures, collection of accounts receivable, and other factors. Some of the factors that influence our operations are not within our control, such as general economic conditions and the introduction of new offerings or technology by our competitors. We will continue to monitor our liquidity position and may pursue additional financing alternatives, as described above, to maintain sufficient resources for future growth and capital requirements. However, there can be no assurance such financing alternatives will be available to us on acceptable terms, or at all.
Contractual Obligations
We have not structured any special purpose entities, or participated in any commodity trading activities, which would expose us to potential undisclosed liabilities or create adverse consequences to our liquidity. Required contractual payments primarily consist of lease payments resulting from the sale of our corporate campus (financing obligation); repayment of term loans payable; expected contingent consideration payments from business acquisitions; short-term purchase obligations for inventory items and other products and services used in the ordinary course of business; minimum operating lease payments primarily for leased office space; and minimum payments for outsourced warehousing and distribution service charges. At August 31, 2018, our expected payments on these obligations over the next five fiscal years and thereafter are as follows (in thousands):
|
Fiscal
|
Fiscal
|
Fiscal
|
Fiscal
|
Fiscal
|
||||||||||||||||||||||||
|
Contractual Obligations
|
2019
|
2020
|
2021
|
2022
|
2023
|
Thereafter
|
Total
|
|||||||||||||||||||||
|
Required lease payments on corporate campus
|
$
|
3,651
|
$
|
3,724
|
$
|
3,798
|
$
|
3,874
|
$
|
3,952
|
$
|
7,331
|
$
|
26,330
|
||||||||||||||
|
Term loans payable to bank(1)
|
10,650
|
2,571
|
-
|
-
|
-
|
-
|
13,221
|
|||||||||||||||||||||
|
Revolving line of credit(2)
|
442
|
442
|
11,595
|
-
|
-
|
-
|
12,479
|
|||||||||||||||||||||
|
Jhana contingent consideration payments(3)
|
922
|
1,436
|
2,021
|
172
|
-
|
-
|
4,551
|
|||||||||||||||||||||
|
Purchase obligations
|
3,464
|
802
|
-
|
-
|
-
|
-
|
4,266
|
|||||||||||||||||||||
|
Minimum operating lease payments
|
865
|
415
|
231
|
85
|
85
|
184
|
1,865
|
|||||||||||||||||||||
|
RGP contingent consideration payments(3)
|
-
|
1,000
|
-
|
-
|
-
|
-
|
1,000
|
|||||||||||||||||||||
|
Minimum required payments for warehousing services(3)
|
189
|
-
|
-
|
-
|
-
|
-
|
189
|
|||||||||||||||||||||
|
Total expected contractual
obligation payments
|
$
|
20,183
|
$
|
10,390
|
$
|
17,645
|
$
|
4,131
|
$
|
4,037
|
$
|
7,515
|
$
|
63,901
|
||||||||||||||
|
(1)
|
Payment amounts shown include interest at 3.9 percent, which is the current rate on our Term Loan obligations.
|
|
(2)
|
The amounts presented assume that the outstanding balance at August 31, 2018, including interest at 3.9 percent, is repaid at the maturity date of the amended and Restated Credit Agreement, which is March 31, 2021. However, we may repay amounts borrowed on the revolving line of credit without premium or penalty prior to the maturity date.
|
|
(3)
|
The payment of contingent consideration resulting from prior business acquisitions is based on current estimates and projections. We reassess the fair value of estimated contingent consideration payments each quarter based on information available. The actual payment of contingent consideration amounts may differ in amount and timing from those shown in the table.
|
|
(4)
|
The warehousing services contract expires in June 2019.
|
Our contractual obligations presented above exclude uncertain tax positions totaling $2.1 million for which we cannot make a reasonably reliable estimate of the amount and period of payment. For further information regarding our uncertain tax positions, refer to the notes to our consolidated financial statements as presented in Part II, Item 8 of this report on Form 10-K.
USE OF ESTIMATES AND CRITICAL ACCOUNTING POLICIES
Our consolidated financial statements were prepared in accordance with accounting principles generally accepted in the United States of America. The significant accounting policies that we used to prepare our consolidated financial statements are outlined primarily in Note 1 to the consolidated financial
statements, which are presented in Part II, Item 8 of this Annual Report on Form 10-K. Some of those accounting policies require us to make assumptions and use judgments that may affect the amounts reported in our consolidated financial statements. Management regularly evaluates its estimates and assumptions and bases those estimates and assumptions on historical experience, factors that are believed to be reasonable under the circumstances, and requirements under accounting principles generally accepted in the United States of America. Actual results may differ from these estimates under different assumptions or conditions, including changes in economic and political conditions and other circumstances that are not in our control, but which may have an impact on these estimates and our actual financial results.
The following items require the most significant judgment and often involve complex estimates:
Revenue Recognition
We derive revenues primarily from the following sources:
|
·
|
Training and Consulting Services – We provide training and consulting services to both organizations and individuals in leadership, productivity, strategic execution, trust, sales force performance, customer loyalty, and communication effectiveness skills.
|
|
·
|
Products – We sell books, audio media, and other related products.
|
We recognize revenue when: 1) persuasive evidence of an arrangement exists, 2) delivery of product has occurred or services have been rendered, 3) the price to the customer is fixed or determinable, and 4) collectability is reasonably assured. For training and service sales, these conditions are generally met upon presentation of the training seminar or delivery of the consulting services based upon daily rates. For most of our product sales, these conditions are met upon shipment of the product to the customer. At times, our customers may request access to our intellectual property for the flexibility to print certain training materials or to have access to certain training videos and other training aids at their convenience. For intellectual property license sales, the revenue recognition conditions are generally met at the later of delivery of the content to the client or the effective date of the arrangement.
Revenue recognition for multiple-element arrangements requires judgment to determine if multiple elements exist, whether elements can be accounted for as separate units of accounting, and if so, the fair value for each of the elements. A deliverable constitutes a separate unit of accounting when it has standalone value to our clients. We routinely enter into arrangements that can include various combinations of multiple training offerings, consulting services, and intellectual property licenses. The timing of delivery and performance of the elements typically varies from contract to contract. Generally, these items qualify as separate units of accounting because they have value to the customer on a standalone basis.
When the Company's training and consulting arrangements contain multiple deliverables, consideration is allocated at the inception of the arrangement to all deliverables based on their relative selling prices at the beginning of the agreement, and revenue is recognized as each curriculum, consulting service, or intellectual property license is delivered. We use the following selling price hierarchy to determine the fair value to be used for allocating revenue to the elements: (i) vendor-specific objective evidence of fair value (VSOE), (ii) third-party evidence (TPE), and (iii) best estimate of selling price (BESP). Generally, VSOE is based on established pricing and discounting practices for the deliverables when sold separately. In determining VSOE, we require that a substantial majority of the selling prices fall within a narrow range. When VSOE cannot be established, judgment is applied with respect to whether a selling price can be established based on TPE, which is determined based on competitor prices for similar offerings when sold separately. Our products and services normally contain a significant level of differentiation such that the comparable pricing of services with similar functionality cannot be obtained. When we are unable to establish a selling price using VSOE or TPE, BESP is used in our allocation of arrangement consideration. BESPs are established as best estimates of what the selling price would be if the deliverables were sold regularly on a stand-alone basis. Our process for determining BESPs requires
judgment and considers multiple factors, such as market conditions, type of customer, geographies, stage of product lifecycle, internal costs, and gross margin objectives. These factors may vary over time depending upon the unique facts and circumstances related to each deliverable. However, we do not expect the effect of changes in the selling price or method or assumptions used to determine selling price to have a significant effect on the allocation of arrangement consideration.
Our multiple-element arrangements generally do not include performance, cancellation, termination, or refund-type provisions.
Our international strategy includes the use of independent licensees in countries where we do not have a wholly owned operation. Licensee companies are unrelated entities that have been granted a license to translate our content, adapt the content to the local culture, and sell our offerings and products in a specific country or region. Licensees are required to pay us royalties based upon a percentage of their sales to clients. We recognize royalty income each period based upon the sales information reported to us from our licensees. International royalty revenue is reported as a component of training and consulting service sales in our consolidated statements of operations.
Revenue is recognized as the net amount to be received after deducting estimated amounts for discounts and product returns.
Stock-Based Compensation
Our shareholders have approved performance-based long-term incentive plans (LTIPs) that provide for grants of stock-based performance awards to certain managerial personnel and executive management as directed by the Organization and Compensation Committee of the Board of Directors. The number of common shares that are vested and issued to LTIP participants is variable and is based upon the achievement of specified performance objectives during defined performance periods. Due to the variable number of common shares that may be issued under the LTIP, we reevaluate our LTIP grants on a quarterly basis and adjust the expected vesting dates and number of shares expected to be awarded based upon actual and estimated financial results of the Company compared with the performance goals set for the award. Adjustments to the number of shares awarded, and to the corresponding compensation expense, are made on a cumulative basis at the adjustment date based upon the estimated probable number of common shares to be awarded.
The analysis of our LTIP awards contains uncertainties because we are required to make assumptions and judgments about the timing and eventual number of shares that will vest in each LTIP grant. The assumptions and judgments that are essential to the analysis include forecasted sales and operating income levels during the LTIP service periods. These forecasted amounts may be difficult to predict over the life of the LTIP awards due to changes in our business, such as from the introduction of the All Access Pass and its impact on reported financial results. These business changes may also leave some previously approved performance measures obsolete or unattainable. The evaluation of LTIP performance awards and the corresponding use of estimated amounts may produce additional volatility in our consolidated financial statements as we record cumulative adjustments to the estimated service periods and number of common shares to be awarded under the LTIP grants as described above.
Accounts Receivable Valuation
Trade accounts receivable are recorded at the invoiced amount and do not bear interest. Our allowance for doubtful accounts calculations contain uncertainties because the calculations require us to make assumptions and judgments regarding the collectability of customer accounts, which may be influenced by a number of factors that are not within our control, such as the financial health of each customer. We regularly review the collectability assumptions of our allowance for doubtful accounts calculation and compare them against historical collections. Adjustments to the assumptions may either increase or decrease our total allowance for doubtful accounts. For example, a 10 percent increase to our allowance for doubtful accounts at August 31, 2018 would increase our reported loss from operations by approximately $0.4 million.
For further information regarding the calculation of our allowance for doubtful accounts, refer to the notes to our financial statements as presented in Item 8 of this report on Form 10-K.
Inventory Valuation
Our inventories are primarily comprised of training materials and related accessories. Inventories are reduced to their fair market value through the use of inventory valuation reserves, which are recorded during the normal course of business. Our inventory valuation calculations contain uncertainties because the calculations require us to make assumptions and judgments regarding a number of factors, including future inventory demand requirements and pricing strategies. During the evaluation process we consider historical sales patterns and current sales trends, but these may not be indicative of future inventory losses. While we have not made material changes to our inventory valuation methodology during the past three years, our inventory requirements may change based on projected customer demand, technological and product life cycle changes, longer or shorter than expected usage periods, and other factors that could affect the valuation of our inventories. If our estimates regarding consumer demand and other factors are inaccurate, we may be exposed to losses that may have an adverse impact upon our financial position and results of operations. For example, a 10 percent increase to our inventory valuation reserves at August 31, 2018, would increase our reported loss from operations by $0.1 million.
Valuation of Indefinite-Lived Intangible Assets and Goodwill
Intangible assets that are deemed to have an indefinite life and goodwill balances are not amortized, but rather are tested for impairment on an annual basis, or more often if events or circumstances indicate that a potential impairment exists. The Covey trade name intangible asset originated from the merger with the Covey Leadership Center in 1997 and has been deemed to have an indefinite life. This intangible asset is quantitatively tested for impairment using the present value of estimated royalties on trade name related revenues, which consist primarily of training seminars, and related products, and international licensee royalties.
Goodwill is recorded when the purchase price for an acquisition exceeds the estimated fair value of the net tangible and identified intangible assets acquired. During August 2017, we adopted Accounting Standards Update (ASU) 2017-04, Intangibles—Goodwill and Other: Simplifying the Test for Goodwill Impairment. This guidance simplifies the subsequent measurement of goodwill and eliminates the two-step goodwill impairment test. Under the new guidance, an annual or interim goodwill impairment test is performed by comparing the fair value of a reporting unit with its carrying amount, and an impairment charge is recognized for the amount by which the carrying amount exceeds the reporting unit's fair value. The amendments also eliminate the requirements for any reporting unit with a zero or negative carrying amount to perform a qualitative assessment and two-step goodwill impairment test.
We tested goodwill for impairment at August 31, 2018 at the reporting unit level using a quantitative approach. The goodwill impairment testing process involves determining whether the estimated fair value of the reporting unit exceeds its respective book value. If the fair value exceeds the book value, goodwill of that reporting unit is not impaired. If the book value exceeds the fair value, an impairment charge is recognized for the amount by which the carrying amount exceeds the reporting unit's fair value. The estimated fair value of each reporting unit was calculated using a combination of the income approach (discounted cash flows) and the market approach (using market multiples derived from a set of companies with comparable market characteristics). The estimated fair values of the reporting units from these approaches were weighted in the determination of the total fair value.
On an interim basis, we consider whether events or circumstances are present that may lead to the determination that goodwill may be impaired. These circumstances include, but are not limited to, the following:
|
·
|
significant underperformance relative to historical or projected future operating results;
|
|
·
|
significant change in the manner of our use of acquired assets or the strategy for the overall business;
|
|
·
|
significant change in prevailing interest rates;
|
|
·
|
significant negative industry or economic trend;
|
|
·
|
significant change in market capitalization relative to book value; and/or
|
|
·
|
significant negative change in market multiples of the comparable company set.
|
If, based on events or changing circumstances, we determine it is more likely than not that the fair value of a reporting unit does not exceed its carrying value, we would be required to test goodwill for impairment.
Determining the fair value of a reporting unit is judgmental in nature and involves the use of significant estimates and assumptions. These estimates and assumptions include revenue growth rates and operating margins used to calculate projected future cash flows, risk-adjusted discount rates, future economic and market conditions, and determination of appropriate market comparables. We base our fair value estimates on assumptions we believe to be reasonable, but that are unpredictable and inherently uncertain. Actual future results may differ from those estimates. In addition, we make certain judgments and assumptions in allocating shared assets and liabilities to determine the carrying values for each of our reporting units. The timing and frequency of our goodwill impairment tests are based on an ongoing assessment of events and circumstances that would indicate a possible impairment. Based on the results of our goodwill impairment testing during fiscal 2018, we determined that no impairment existed at August 31, 2018, as each reportable operating segment's estimated fair value exceeded its carrying value. We will continue to monitor our goodwill and intangible assets for impairment and conduct formal tests when impairment indicators are present.
Acquisitions and Contingent Consideration Liabilities
We record acquisitions resulting in the consolidation of an enterprise using the purchase method of accounting. Under this method, the acquiring company records the assets acquired, including intangible assets that can be identified and named, and liabilities assumed based on their estimated fair values at the date of acquisition. The purchase price in excess of the fair value of the assets acquired and liabilities assumed is recorded as goodwill. If the assets acquired, net of liabilities assumed, are greater than the purchase price paid, then a bargain purchase has occurred and the company will recognize the gain immediately in earnings. Among other sources of relevant information, we use independent appraisals or other valuations to assist in determining the estimated fair values of the assets and liabilities. Various assumptions are used in the determination of these estimated fair values including discount rates, market and volume growth rates, product or service selling prices, cost structures, royalty rates, and other prospective financial information.
Additionally, we are required to reassess the fair value of contingent consideration liabilities resulting from business acquisitions at each reporting period. Although subsequent changes to the contingent consideration liabilities do not affect the goodwill generated from the acquisition transaction, the valuation of expected contingent consideration often requires us to estimate future sales and profitability. These estimates require the use of numerous assumptions, many of which may change frequently and lead to increased or decreased operating income in future periods. For instance, during fiscal 2018 we recorded $1.0 million of increases to the fair value of the contingent consideration liabilities related to our fiscal 2017 business acquisitions, which resulted in a corresponding increase in selling, general, and administrative expenses.
Impairment of Long-Lived Assets
Long-lived tangible assets and finite-lived intangible assets are reviewed for possible impairment whenever events or changes in circumstances indicate that the carrying amount of such assets may not be recoverable. We use an estimate of undiscounted future net cash flows of the assets over their remaining useful lives in determining whether the carrying value of the assets is recoverable. If the
carrying values of the assets exceed the anticipated future cash flows of the assets, we calculate an impairment loss. The impairment loss calculation compares the carrying value of the asset to the asset's estimated fair value, which may be based upon discounted cash flows over the estimated remaining useful life of the asset. If we recognize an impairment loss, the adjusted carrying amount of the asset becomes its new cost basis, which is then depreciated or amortized over the remaining useful life of the asset. Impairment of long-lived assets is assessed at the lowest levels for which there are identifiable cash flows that are independent from other groups of assets.
Our impairment evaluation calculations contain uncertainties because they require us to make assumptions and apply judgment in order to estimate future cash flows, forecast the useful lives of the assets, and select a discount rate that reflects the risk inherent in future cash flows. Although we have not made any material recent changes to our long-lived assets impairment assessment methodology, if forecasts and assumptions used to support the carrying value of our long-lived tangible and finite-lived intangible assets change in the future, significant impairment charges could result that would adversely affect our results of operations and financial condition.
Income Taxes
We regularly evaluate our United States federal and various state and foreign jurisdiction income tax exposures. We account for certain aspects of our income tax provision using the provisions of FASC 740-10-05, which addresses the determination of whether tax benefits claimed or expected to be claimed on a tax return should be recorded in the financial statements. We may recognize the tax benefit from an uncertain tax position only if it is more likely than not that the tax position will be sustained upon examination by the taxing authorities, based on the technical merits of the position. The tax benefits recognized in the financial statements from such a position are measured based on the largest benefit that has a greater than 50 percent likelihood of being realized upon final settlement. The provisions of FASC 740-10-05 also provide guidance on de-recognition, classification, interest, and penalties on income taxes, accounting for income taxes in interim periods, and require increased disclosure of various income tax items. Taxes and penalties are components of our overall income tax provision.
We record previously unrecognized tax benefits in the financial statements when it becomes more likely than not (greater than a 50 percent likelihood) that the tax position will be sustained. To assess the probability of sustaining a tax position, we consider all available evidence. In many instances, sufficient positive evidence may not be available until the expiration of the statute of limitations for audits by taxing jurisdictions, at which time the entire benefit will be recognized as a discrete item in the applicable period.
Our unrecognized tax benefits result from uncertain tax positions about which we are required to make assumptions and apply judgment to estimate the exposures associated with our various tax filing positions. The calculation of our income tax provision or benefit, as applicable, requires estimates of future taxable income or losses. During the course of the fiscal year, these estimates are compared to actual financial results and adjustments may be made to our tax provision or benefit to reflect these revised estimates. Our effective income tax rate is also affected by changes in tax law and the results of tax audits by various jurisdictions. Although we believe that our judgments and estimates discussed herein are reasonable, actual results could differ, and we could be exposed to losses or gains that could be material.
We establish valuation allowances for deferred tax assets when we estimate it is more likely than not that the tax assets will not be realized. The determination of whether valuation allowances are needed on our deferred income tax assets contains uncertainties because we must project future income, including the use of tax-planning strategies, by individual tax jurisdictions. Changes in industry and economic conditions and the competitive environment may impact the accuracy of our projections. We regularly assess the likelihood that our deferred tax assets will be realized and determine if adjustments to our valuation allowance are necessary.
Related Party Receivable
At August 31, 2018, we had receivables from FCOP, an entity in which we own 19.5 percent, for reimbursement of certain operating costs and for working capital and other advances, even though we are not obligated to provide advances to or fund the losses of FCOP. We make use of estimates to account for these receivables, including estimates of the collectability of amounts receivable from FCOP in future periods and, based upon the timing of estimated collections, a portion of the FCOP receivable is classified in other long-term assets. In accordance with applicable accounting guidance, we are required to discount the long-term portion of the receivable to its net present value using an estimated effective borrowing rate for FCOP.
We estimated the effective risk-adjusted borrowing rate to discount the long-term portion of the receivable at 15 percent, which was recorded as a discount on a related party receivable in our consolidated statements of operations in certain periods. Our estimate of the effective borrowing rate required us to estimate a variety of factors, including the availability of debt financing for FCOP, projected borrowing rates for comparable debt, and the timing and realizability of projected cash flows from FCOP. These estimates were based on information known at the time of the preparation of these financial statements. A change in the assumptions and factors used, including estimated interest rates, may change the amount of discount taken.
Our assessments regarding the collectability of the FCOP receivable require us to make assumptions and judgments regarding the financial health of FCOP and are dependent on projected financial information for FCOP in future periods. Such financial information contains inherent uncertainties and is subject to factors that are not within our control. Failure to receive projected cash flows from FCOP in future periods may result in adverse consequences to our liquidity, financial position, and results of operations.
For further information regarding our investment in FCOP, refer to the notes to our financial statements as presented in Item 8 of this report on Form 10-K.
RECENTLY ADOPTED ACCOUNTING PRONOUNCEMENT
In March 2016, the Financial Accounting Standards Board (FASB) issued ASU 2016-09, Compensation - Stock Compensation (Topic 718) - Improvements to Employee Share-Based Payment Accounting. The guidance in ASU 2016-09 simplifies several aspects of the accounting for stock-based payment transactions, including the income tax consequences, classification of awards as either equity or liabilities, and classification of items on the statement of cash flows. The guidance in ASU 2016-09 is effective for public companies' annual periods, including interim periods within those fiscal years, beginning after December 15, 2016. We adopted the provisions of ASU 2016-09 on September 1, 2017 on a prospective basis and prior periods have not been restated for these amendments. The primary impact of adopting this guidance on our financial statements has been the classification of excess income tax benefits or expense in income taxes rather than as a component of additional paid-in capital. The adoption of ASU 2016-09 did not have a material impact on our financial statements in fiscal 2018.
ACCOUNTING PRONOUNCEMENTS ISSUED NOT YET ADOPTED
On May 28, 2014, the FASB issued ASU No. 2014-09, Revenue from Contracts with Customers (Topic 606). This new standard was issued in conjunction with the International Accounting Standards Board (IASB) and is designed to create a single, principles-based process by which all businesses calculate revenue. The core principle of this standard is that an entity should recognize revenue for the transfer of goods or services equal to the amount that it expects to be entitled to receive for those goods or services. The standard also requires additional disclosure about the nature, amount, timing, and uncertainty of revenue and cash flows arising from customer contracts, including significant judgments and changes in judgments, and assets recognized from costs incurred to obtain or fulfill a contract. The new standard replaces numerous individual, industry-specific revenue rules found in generally accepted accounting principles in the United States. We will adopt this standard on September 1, 2018 and apply the new guidance during interim periods within fiscal 2019. We plan to adopt ASU No. 2014-09 using the "modified retrospective" approach.
Based upon our analysis of Topic 606, we expect that revenue recognition among our products and services will remain largely unchanged except for our initial license fee associated with licensing an international location. The Company currently records the non-refundable initial license fee from licensing an international location as revenue at the time the license period begins if all other revenue requirements have been met. However, under Topic 606, we have concluded that initial upfront fees should be recognized over the course of the initial contract.
Under Topic 606, we will account for the All Access Pass as a single performance obligation and recognize the associated transaction price on a straight-line basis over the term of the underlying contract. This determination was reached after considering that our web-based functionality and content, in combination with our intellectual property, each represent inputs that transform into a combined output that represents the intended outcome of the AAP, which is to provide a continuously accessible, customized, and dynamic learning and development solution only accessible through the AAP platform.
We do not expect the accounting for fulfillment costs or costs incurred to obtain a contract to be affected materially in any period due to the adoption of Topic 606.
Although the Company is still finalizing its analysis of the adoption of Topic 606, we estimate that the initial impact upon adoption will be a reduction to the opening balance of retained earnings with offsetting amounts recorded to deferred revenue and deferred tax asset in an amount between $2 million and $4 million. We do not expect the adoption of ASU 2014-09 to have any impact on our operating cash flows.
On February 25, 2016, the FASB issued ASU No. 2016-02, Leases. The new lease accounting standard is the result of a collaborative effort with the IASB (similar to the new revenue standard described above), although some differences remain between the two standards. This new standard will affect all entities that lease assets and will require lessees to recognize a lease liability and a right-of-use asset for all leases (except for short-term leases that have a duration of less than one year) as of the date on which the lessor makes the underlying asset available to the lessee. For lessors, accounting for leases is substantially the same as in prior periods. For public companies, the new lease standard is effective for fiscal years beginning after December 15, 2018, including interim periods within those fiscal years, and early adoption is permitted for all entities. We expect to adopt the provisions of ASU 2016-02 on September 1, 2019, and we may elect to apply the new standard on a prospective basis. At August 31, 2018, our leases primarily consist of the lease on our corporate campus, which is accounted for as a financing obligation on our consolidated balance sheets and operating leases for office and warehousing space. We expect the adoption of this new standard will increase our reported assets and liabilities since we will record the lease obligation and a corresponding right of use asset on our balance sheet for leases that are currently accounted for as operating leases. However, as of August 31, 2018, we have not yet elected the transition method or determined the full impact that the adoption of ASU 2016-02 will have on our consolidated financial statements.
REGULATORY COMPLIANCE
We are registered in states in which we do business that have a sales tax and we collect and remit sales or use tax on sales made in these jurisdictions. Compliance with environmental laws and regulations has not had a material effect on our operations.
INFLATION AND CHANGING PRICES
Inflation has not had a material effect on our operations. However, future inflation may have an impact on the price of materials used in the production of training products and related accessories, including paper and related raw materials. We may not be able to pass on such increased costs to our customers.
SAFE HARBOR STATEMENT UNDER THE PRIVATE SECURITIES LITIGATION REFORM ACT OF 1995
Certain written and oral statements made by us in this report are "forward-looking statements" within the meaning of the Private Securities Litigation Reform Act of 1995 and Section 21E of the Securities Exchange Act of 1934 as amended (the Exchange Act). Forward-looking statements include, without limitation, any statement that may predict, forecast, indicate, or imply future results, performance, or achievements, and may contain words such as "believe," "anticipate," "expect," "estimate," "project," or words or phrases of similar meaning. In our reports and filings we may make forward-looking statements regarding our expectations about future reported revenues and operating results, future sales growth, the expected completion of our new ERP system and new AAP portal, the expected introduction of new or refreshed offerings, including additions to the All Access Pass and improvements to our Education segment, future training and consulting sales activity, the impact of multi-year contracts for the All Access Pass, renewal of existing contracts, the release and success of new publications, the expected growth of our business in China, anticipated expenses, the adequacy of existing capital resources, projected cost reduction and strategic initiatives, expected levels of depreciation and amortization expense, expectations regarding tangible and intangible asset valuations, the seasonality of future sales, the seasonal fluctuations in cash used for and provided by operating activities, future compliance with the terms and conditions of our Restated Credit Agreement, the ability to borrow on, and renew, our Restated Credit Agreement, expectations regarding income tax expenses as well as tax assets and credits and the amount of cash expected to be paid for income taxes, estimated capital expenditures, and cash flow estimates used to determine the fair value of long-lived assets. These, and other forward-looking statements, are subject to certain risks and uncertainties that may cause actual results to differ materially from the forward-looking statements. These risks and uncertainties are disclosed from time to time in reports filed by us with the SEC, including reports on Forms 8-K, 10-Q, and 10-K. Such risks and uncertainties include, but are not limited to, the matters discussed in Item 1A of this annual report on Form 10-K for the fiscal year ended August 31, 2018, entitled "Risk Factors." In addition, such risks and uncertainties may include unanticipated developments in any one or more of the following areas: unanticipated costs or capital expenditures; delays or unanticipated outcomes relating to our strategic plans; dependence on existing products or services; the rate and consumer acceptance of new product introductions, including the new AAP portal; foreign currency exchange rates; competition; the number and nature of customers and their product orders, including changes in the timing or mix of product or training orders; pricing of our products and services and those of competitors; adverse publicity; adverse effects on certain licensee's performance due to civil unrest in some of the countries where our licensees operate; and other factors which may adversely affect our business.
The risks included here are not exhaustive. Other sections of this report may include additional factors that could adversely affect our business and financial performance. Moreover, we operate in a very competitive and rapidly changing environment. New risk factors may emerge and it is not possible for our management to predict all such risk factors, nor can we assess the impact of all such risk factors on our business or the extent to which any single factor, or combination of factors, may cause actual results to differ materially from those contained in forward-looking statements. Given these risks and uncertainties, investors should not rely on forward-looking statements as a prediction of actual results.
The market price of our common stock has been and may remain volatile. In addition, the stock markets in general have experienced increased volatility. Factors such as quarter-to-quarter variations in revenues and earnings or losses and our failure to meet expectations could have a significant impact on the market price of our common stock. In addition, the price of our common stock can change for reasons unrelated to our performance. Due to our relatively low market capitalization, the price of our common stock may also be affected by conditions such as a lack of analyst coverage and fewer potential investors.
Forward-looking statements are based on management's expectations as of the date made, and the Company does not undertake any responsibility to update any of these statements in the future except as required by law. Actual future performance and results will differ and may differ materially from that contained in or suggested by forward-looking statements as a result of the factors set forth in this Management's Discussion and Analysis of Financial Condition and Results of Operations and elsewhere in our filings with the SEC.
Market Risk of Financial Instruments
We are exposed to financial instrument market risk primarily through fluctuations in foreign currency exchange rates and interest rates. To manage risks associated with foreign currency exchange and interest rates, we may make limited use of derivative financial instruments. Derivatives are financial instruments that derive their value from one or more underlying financial instruments. As a matter of policy, our derivative instruments are entered into for periods consistent with the related underlying exposures and do not constitute positions that are independent of those exposures. In addition, we do not enter into derivative contracts for trading or speculative purposes, nor are we party to any leveraged derivative instrument. The notional amounts of derivatives do not represent actual amounts exchanged by the parties to the instrument; and thus are not a measure of exposure to us through our use of derivatives. Additionally, we enter into derivative agreements only with highly rated counterparties and we do not expect to incur any losses resulting from non-performance by other parties.
Foreign Exchange Sensitivity
Due to the global nature of our operations, we are subject to risks associated with transactions that are denominated in currencies other than the United States dollar, as well as the effects of translating amounts denominated in foreign currencies to United States dollars as a normal part of the reporting process. The objective of our foreign currency risk management activities is to reduce foreign currency risk in the consolidated financial statements. In order to manage foreign currency risks, we may make limited use of foreign currency forward contracts and other foreign currency related derivative instruments. However, we did not utilize any foreign currency forward or related derivative contracts during fiscal 2018, fiscal 2017, or fiscal 2016.
Interest Rate Sensitivity
Our long-term liabilities primarily consist of term loans payable obtained from the lender on our Restated Credit Agreement, a long-term lease agreement (financing obligation) associated with the sale of our corporate headquarters facility, amounts borrowed on our revolving credit facility, deferred income taxes, and contingent consideration payments resulting from our business acquisitions. Our overall interest rate sensitivity is primarily influenced by any amounts borrowed on term loans or on our revolving line of credit facility, and the prevailing interest rate on these instruments. The effective interest rate on the term loans and our revolving line of credit facility was 3.9 percent at August 31, 2018, and we may incur additional expense if interest rates increase in future periods. For example, a one percent increase in the interest rate on our term loans and the amount outstanding on our revolving credit facility at August 31, 2018 would result in approximately $0.2 million of additional interest expense in fiscal 2019. Our financing obligation has a payment structure equivalent to a long-term leasing arrangement with a fixed interest rate of 7.7 percent.
During the fiscal years ended August 31, 2018, 2017, and 2016, we were not party to any interest rate swap agreements or similar derivative instruments.
REPORT OF INDEPENDENT REGISTERED PUBLIC ACCOUNTING FIRM
To the shareholders and the Board of Directors of Franklin Covey Co.
Opinion on Internal Control over Financial Reporting
We have audited the internal control over financial reporting of Franklin Covey Co. and subsidiaries (the "Company") as of August 31, 2018, based on criteria established in Internal Control — Integrated Framework (2013) issued by the Committee of Sponsoring Organizations of the Treadway Commission (COSO). In our opinion, the Company maintained, in all material respects, effective internal control over financial reporting as of August 31, 2018, based on criteria established in Internal Control — Integrated Framework (2013) issued by COSO.
We have also audited, in accordance with the standards of the Public Company Accounting Oversight Board (United States) (PCAOB), the consolidated financial statements as of and for the year ended August 31, 2018, of the Company and our report dated November 14, 2018, expressed an unqualified opinion on those financial statements.
Basis for Opinion
The Company's management is responsible for maintaining effective internal control over financial reporting and for its assessment of the effectiveness of internal control over financial reporting, included in the accompanying Management's Report on Internal Control over Financial Reporting. Our responsibility is to express an opinion on the Company's internal control over financial reporting based on our audit. We are a public accounting firm registered with the PCAOB and are required to be independent with respect to the Company in accordance with the U.S. federal securities laws and the applicable rules and regulations of the Securities and Exchange Commission and the PCAOB.
We conducted our audit in accordance with the standards of the PCAOB. Those standards require that we plan and perform the audit to obtain reasonable assurance about whether effective internal control over financial reporting was maintained in all material respects. Our audit included obtaining an understanding of internal control over financial reporting, assessing the risk that a material weakness exists, testing and evaluating the design and operating effectiveness of internal control based on the assessed risk, and performing such other procedures as we considered necessary in the circumstances. We believe that our audit provides a reasonable basis for our opinion.
Definition and Limitations of Internal Control over Financial Reporting
A company's internal control over financial reporting is a process designed to provide reasonable assurance regarding the reliability of financial reporting and the preparation of financial statements for external purposes in accordance with generally accepted accounting principles. A company's internal control over financial reporting includes those policies and procedures that (1) pertain to the maintenance of records that, in reasonable detail, accurately and fairly reflect the transactions and dispositions of the assets of the company; (2) provide reasonable assurance that transactions are recorded as necessary to permit preparation of financial statements in accordance with generally accepted accounting principles, and that receipts and expenditures of the company are being made only in accordance with authorizations of management and directors of the company; and (3) provide reasonable assurance regarding prevention or timely detection of unauthorized acquisition, use, or disposition of the company's assets that could have a material effect on the financial statements.
Because of its inherent limitations, internal control over financial reporting may not prevent or detect misstatements. Also, projections of any evaluation of effectiveness to future periods are subject to the risk that controls may become inadequate because of changes in conditions, or that the degree of compliance with the policies or procedures may deteriorate.
/s/ Deloitte & Touche LLP
Salt lake City, Utah
November 14, 2018
REPORT OF INDEPENDENT REGISTERED PUBLIC ACCOUNTING FIRM
To the shareholders and the Board of Directors of Franklin Covey Co.
Opinion on the Financial Statements
We have audited the accompanying consolidated balance sheets of Franklin Covey Co. and subsidiaries (the "Company") as of August 31, 2018 and 2017, the related consolidated statements of operations and comprehensive income (loss), shareholders' equity, and cash flows for each of the three years in the period ended August 31, 2018, and the related notes (collectively referred to as the "financial statements"). In our opinion, the financial statements present fairly, in all material respects, the financial position of the Company as of August 31, 2018 and 2017, and the results of its operations and its cash flows for each of the three years in the period ended August 31, 2018, in conformity with accounting principles generally accepted in the United States of America.
We have also audited, in accordance with the standards of the Public Company Accounting Oversight Board (United States) (PCAOB), the Company's internal control over financial reporting as of August 31, 2018, based on criteria established in Internal Control — Integrated Framework (2013) issued by the Committee of Sponsoring Organizations of the Treadway Commission and our report dated November 14, 2018, expressed an unqualified opinion on the Company's internal control over financial reporting.
Basis for Opinion
These financial statements are the responsibility of the Company's management. Our responsibility is to express an opinion on the Company's financial statements based on our audits. We are a public accounting firm registered with the PCAOB and are required to be independent with respect to the Company in accordance with the U.S. federal securities laws and the applicable rules and regulations of the Securities and Exchange Commission and the PCAOB.
We conducted our audits in accordance with the standards of the PCAOB. Those standards require that we plan and perform the audit to obtain reasonable assurance about whether the financial statements are free of material misstatement, whether due to error or fraud. Our audits included performing procedures to assess the risks of material misstatement of the financial statements, whether due to error or fraud, and performing procedures that respond to those risks. Such procedures included examining, on a test basis, evidence regarding the amounts and disclosures in the financial statements. Our audits also included evaluating the accounting principles used and significant estimates made by management, as well as evaluating the overall presentation of the financial statements. We believe that our audits provide a reasonable basis for our opinion.
/s/ Deloitte & Touche LLP
Salt Lake City, Utah
November 14, 2018
We have served as the Company's auditor since 2016.
FRANKLIN COVEY CO.
CONSOLIDATED BALANCE SHEETS
|
AUGUST 31,
|
2018
|
2017
|
||||||
|
In thousands, except per-share data
|
||||||||
|
ASSETS
|
||||||||
|
Current assets:
|
||||||||
|
Cash and cash equivalents
|
$
|
10,153
|
$
|
8,924
|
||||
|
Accounts receivable, less allowance for doubtful accounts of $3,555 and $2,310
|
71,914
|
66,343
|
||||||
|
Inventories
|
3,160
|
3,353
|
||||||
|
Income taxes receivable
|
179
|
259
|
||||||
|
Prepaid expenses
|
3,864
|
3,569
|
||||||
|
Other current assets
|
10,893
|
9,387
|
||||||
|
Total current assets
|
100,163
|
91,835
|
||||||
|
Property and equipment, net
|
21,401
|
19,730
|
||||||
|
Intangible assets, net
|
51,934
|
57,294
|
||||||
|
Goodwill
|
24,220
|
24,220
|
||||||
|
Deferred income tax assets
|
3,222
|
1,647
|
||||||
|
Other long-term assets
|
12,935
|
16,005
|
||||||
|
$
|
213,875
|
$
|
210,731
|
|||||
|
LIABILITIES AND SHAREHOLDERS' EQUITY
|
||||||||
|
Current liabilities:
|
||||||||
|
Current portion of term notes payable
|
$
|
10,313
|
$
|
6,250
|
||||
|
Current portion of financing obligation
|
2,092
|
1,868
|
||||||
|
Accounts payable
|
9,790
|
9,119
|
||||||
|
Deferred revenue
|
51,888
|
40,772
|
||||||
|
Accrued liabilities
|
20,761
|
22,617
|
||||||
|
Total current liabilities
|
94,844
|
80,626
|
||||||
|
Line of credit
|
11,337
|
4,377
|
||||||
|
Term notes payable, less current portion
|
2,500
|
12,813
|
||||||
|
Financing obligation, less current portion
|
18,983
|
21,075
|
||||||
|
Other liabilities
|
5,501
|
5,742
|
||||||
|
Deferred income tax liabilities
|
210
|
1,033
|
||||||
|
Total liabilities
|
133,375
|
125,666
|
||||||
|
Commitments and contingencies (Notes 7 and 8)
|
||||||||
|
Shareholders' equity:
|
||||||||
|
Common stock, $.05 par value; 40,000 shares authorized, 27,056 shares issued
|
1,353
|
1,353
|
||||||
|
Additional paid-in capital
|
211,280
|
212,484
|
||||||
|
Retained earnings
|
63,569
|
69,456
|
||||||
|
Accumulated other comprehensive income
|
341
|
667
|
||||||
|
Treasury stock at cost, 13,159 shares and 13,414 shares
|
(196,043
|
)
|
(198,895
|
)
|
||||
|
Total shareholders' equity
|
80,500
|
85,065
|
||||||
|
$
|
213,875
|
$
|
210,731
|
|||||
See accompanying notes to consolidated financial statements.
FRANKLIN COVEY CO.
CONSOLIDATED STATEMENTS OF OPERATIONS AND COMPREHENSIVE INCOME (LOSS)
|
YEAR ENDED AUGUST 31,
|
2018
|
2017
|
2016
|
|||||||||
|
In thousands, except per-share amounts
|
||||||||||||
|
Net sales:
|
||||||||||||
|
Training and consulting services
|
$
|
202,638
|
$
|
177,816
|
$
|
189,661
|
||||||
|
Products
|
3,577
|
3,881
|
6,009
|
|||||||||
|
Leasing
|
3,543
|
3,559
|
4,385
|
|||||||||
|
209,758
|
185,256
|
200,055
|
||||||||||
|
Cost of sales:
|
||||||||||||
|
Training and consulting services
|
58,024
|
56,557
|
59,158
|
|||||||||
|
Products
|
1,251
|
3,990
|
3,206
|
|||||||||
|
Leasing
|
2,194
|
2,042
|
2,537
|
|||||||||
|
61,469
|
62,589
|
64,901
|
||||||||||
|
Gross profit
|
148,289
|
122,667
|
135,154
|
|||||||||
|
Selling, general, and administrative
|
141,126
|
121,148
|
113,589
|
|||||||||
|
Contract termination costs
|
-
|
1,500
|
-
|
|||||||||
|
Restructuring costs
|
-
|
1,482
|
776
|
|||||||||
|
Depreciation
|
5,161
|
3,879
|
3,677
|
|||||||||
|
Amortization
|
5,368
|
3,538
|
3,263
|
|||||||||
|
Income (loss) from operations
|
(3,366
|
)
|
(8,880
|
)
|
13,849
|
|||||||
|
Interest income
|
104
|
223
|
115
|
|||||||||
|
Interest expense
|
(2,676
|
)
|
(2,408
|
)
|
(2,263
|
)
|
||||||
|
Discount accretion on related-party receivables
|
418
|
156
|
210
|
|||||||||
|
Income (loss) before income taxes
|
(5,520
|
)
|
(10,909
|
)
|
11,911
|
|||||||
|
Benefit (provision) for income taxes
|
(367
|
)
|
3,737
|
(4,895
|
)
|
|||||||
|
Net income (loss)
|
$
|
(5,887
|
)
|
$
|
(7,172
|
)
|
$
|
7,016
|
||||
|
Net income (loss) per share:
|
||||||||||||
|
Basic and diluted
|
$
|
(0.43
|
)
|
$
|
(0.52
|
)
|
$
|
0.47
|
||||
|
Weighted average number of common shares:
|
||||||||||||
|
Basic
|
13,849
|
13,819
|
14,944
|
|||||||||
|
Diluted
|
13,849
|
13,819
|
15,076
|
|||||||||
|
COMPREHENSIVE INCOME (LOSS):
|
||||||||||||
|
Net income (loss)
|
$
|
(5,887
|
)
|
$
|
(7,172
|
)
|
$
|
7,016
|
||||
|
Foreign currency translation adjustments, net of income
|
||||||||||||
|
tax benefit (provision) of $(75), $37, and $115
|
(326
|
)
|
(555
|
)
|
1,030
|
|||||||
|
Comprehensive income (loss)
|
$
|
(6,213
|
)
|
$
|
(7,727
|
)
|
$
|
8,046
|
||||
See accompanying notes to consolidated financial statements.
FRANKLIN COVEY CO.
CONSOLIDATED STATEMENTS OF CASH FLOWS
|
YEAR ENDED AUGUST 31,
|
2018
|
2017
|
2016
|
|||||||||
|
In thousands
|
||||||||||||
|
CASH FLOWS FROM OPERATING ACTIVITIES
|
||||||||||||
|
Net income (loss)
|
$
|
(5,887
|
)
|
$
|
(7,172
|
)
|
$
|
7,016
|
||||
|
Adjustments to reconcile net income (loss) to net cash provided
|
||||||||||||
|
by operating activities:
|
||||||||||||
|
Depreciation and amortization
|
10,525
|
7,443
|
6,943
|
|||||||||
|
Amortization of capitalized curriculum development costs
|
5,280
|
3,745
|
3,865
|
|||||||||
|
Deferred income taxes
|
(2,535
|
)
|
(5,594
|
)
|
1,854
|
|||||||
|
Stock-based compensation expense
|
2,846
|
3,658
|
3,121
|
|||||||||
|
Excess tax expense (benefit) from stock-based compensation
|
-
|
(168
|
)
|
52
|
||||||||
|
Increase (decrease) in contingent consideration liabilities
|
1,014
|
(1,936
|
)
|
1,538
|
||||||||
|
Changes in assets and liabilities, net of effect of acquired businesses:
|
||||||||||||
|
Decrease (increase) in accounts receivable, net
|
(5,679
|
)
|
164
|
(576
|
)
|
|||||||
|
Decrease (increase) in inventories
|
157
|
1,583
|
(908
|
)
|
||||||||
|
Decrease in receivable from related party
|
213
|
1,421
|
820
|
|||||||||
|
Increase in prepaid expenses and other assets
|
(1,335
|
)
|
(4,861
|
)
|
(1,119
|
)
|
||||||
|
Increase in accounts payable and accrued liabilities
|
1,746
|
676
|
2,264
|
|||||||||
|
Increase in deferred revenue
|
11,613
|
19,142
|
8,112
|
|||||||||
|
Increase (decrease) in income taxes payable/receivable
|
109
|
(249
|
)
|
(316
|
)
|
|||||||
|
Decrease in other liabilities
|
(1,206
|
)
|
(495
|
)
|
(1
|
)
|
||||||
|
Net cash provided by operating activities
|
16,861
|
17,357
|
32,665
|
|||||||||
|
CASH FLOWS FROM INVESTING ACTIVITIES
|
||||||||||||
|
Purchases of property and equipment
|
(6,528
|
)
|
(7,187
|
)
|
(3,993
|
)
|
||||||
|
Capitalized curriculum development costs
|
(2,998
|
)
|
(6,466
|
)
|
(2,236
|
)
|
||||||
|
Acquisition of businesses, net of cash acquired
|
(1,108
|
)
|
(7,272
|
)
|
-
|
|||||||
|
Acquisition of license rights
|
-
|
(750
|
)
|
-
|
||||||||
|
Net cash used for investing activities
|
(10,634
|
)
|
(21,675
|
)
|
(6,229
|
)
|
||||||
|
CASH FLOWS FROM FINANCING ACTIVITIES
|
||||||||||||
|
Proceeds from line of credit borrowings
|
93,391
|
34,320
|
46,454
|
|||||||||
|
Payments on line of credit borrowings
|
(86,431
|
)
|
(29,943
|
)
|
(46,454
|
)
|
||||||
|
Proceeds from term notes payable financing
|
-
|
10,000
|
15,000
|
|||||||||
|
Principal payments on term notes payable
|
(6,250
|
)
|
(5,000
|
)
|
(937
|
)
|
||||||
|
Principal payments on financing obligation
|
(1,868
|
)
|
(1,662
|
)
|
(1,472
|
)
|
||||||
|
Purchases of common stock for treasury
|
(2,006
|
)
|
(5,431
|
)
|
(43,586
|
)
|
||||||
|
Payment of contingent consideration liabilities
|
(2,323
|
)
|
-
|
(2,167
|
)
|
|||||||
|
Income tax benefit (expense) recorded in paid-in capital
|
-
|
168
|
(52
|
)
|
||||||||
|
Proceeds from sales of common stock held in treasury
|
808
|
682
|
679
|
|||||||||
|
Net cash provided by (used for) financing activities
|
(4,679
|
)
|
3,134
|
(32,535
|
)
|
|||||||
|
Effect of foreign currency exchange rates on cash and cash equivalents
|
(319
|
)
|
(348
|
)
|
321
|
|||||||
|
Net increase (decrease) in cash and cash equivalents
|
1,229
|
(1,532
|
)
|
(5,778
|
)
|
|||||||
|
Cash and cash equivalents at beginning of the year
|
8,924
|
10,456
|
16,234
|
|||||||||
|
Cash and cash equivalents at end of the year
|
$
|
10,153
|
$
|
8,924
|
$
|
10,456
|
||||||
|
Supplemental disclosure of cash flow information:
|
||||||||||||
|
Cash paid for income taxes
|
$
|
2,512
|
$
|
2,562
|
$
|
3,410
|
||||||
|
Cash paid for interest
|
2,655
|
2,314
|
2,231
|
|||||||||
|
Non-cash investing and financing activities:
|
||||||||||||
|
Purchases of property and equipment financed by accounts payable
|
$
|
1,018
|
$
|
697
|
$
|
334
|
||||||
See accompanying notes to consolidated financial statements.
FRANKLIN COVEY CO.
CONSOLIDATED STATEMENTS OF SHAREHOLDERS' EQUITY
|
Accumulated
|
||||||||||||||||||||||||||||
|
Other
|
||||||||||||||||||||||||||||
|
Common
|
Common
|
Additional
|
Retained
|
Comprehensive
|
Treasury
|
Treasury
|
||||||||||||||||||||||
|
Stock Shares
|
Stock Amount
|
Paid-In Capital
|
Earnings
|
Income
|
Stock Shares
|
Stock Amount
|
||||||||||||||||||||||
|
In thousands
|
||||||||||||||||||||||||||||
|
Balance at August 31, 2015
|
27,056
|
$
|
1,353
|
$
|
208,635
|
$
|
69,612
|
$
|
192
|
(10,909
|
)
|
$
|
(154,286
|
)
|
||||||||||||||
|
Issuance of common stock from
|
||||||||||||||||||||||||||||
|
treasury
|
(143
|
)
|
57
|
823
|
||||||||||||||||||||||||
|
Purchase of treasury shares
|
(2,505
|
)
|
(43,586
|
)
|
||||||||||||||||||||||||
|
Unvested share award
|
(356
|
)
|
25
|
356
|
||||||||||||||||||||||||
|
Stock-based compensation
|
3,121
|
|||||||||||||||||||||||||||
|
Cumulative translation
|
||||||||||||||||||||||||||||
|
adjustments
|
1,030
|
|||||||||||||||||||||||||||
|
Tax expense recorded in
|
||||||||||||||||||||||||||||
|
paid-in capital
|
(52
|
)
|
||||||||||||||||||||||||||
|
Other
|
(2
|
)
|
2
|
|||||||||||||||||||||||||
|
Net income
|
7,016
|
|||||||||||||||||||||||||||
|
Balance at August 31, 2016
|
27,056
|
1,353
|
211,203
|
76,628
|
1,222
|
(13,332
|
)
|
(196,691
|
)
|
|||||||||||||||||||
|
Issuance of common stock from
|
||||||||||||||||||||||||||||
|
treasury
|
(2,103
|
)
|
188
|
2,785
|
||||||||||||||||||||||||
|
Purchase of treasury shares
|
(300
|
)
|
(5,431
|
)
|
||||||||||||||||||||||||
|
Unvested share award
|
(442
|
)
|
30
|
442
|
||||||||||||||||||||||||
|
Stock-based compensation
|
3,658
|
|||||||||||||||||||||||||||
|
Cumulative translation
|
||||||||||||||||||||||||||||
|
adjustments
|
(555
|
)
|
||||||||||||||||||||||||||
|
Tax benefit recorded in
|
||||||||||||||||||||||||||||
|
paid-in capital
|
168
|
|||||||||||||||||||||||||||
|
Net loss
|
(7,172
|
)
|
||||||||||||||||||||||||||
|
Balance at August 31, 2017
|
27,056
|
1,353
|
212,484
|
69,456
|
667
|
(13,414
|
)
|
(198,895
|
)
|
|||||||||||||||||||
|
Issuance of common stock from
|
||||||||||||||||||||||||||||
|
treasury
|
(3,702
|
)
|
337
|
4,510
|
||||||||||||||||||||||||
|
Purchase of treasury shares
|
(105
|
)
|
(2,006
|
)
|
||||||||||||||||||||||||
|
Unvested share award
|
(348
|
)
|
23
|
348
|
||||||||||||||||||||||||
|
Stock-based compensation
|
2,846
|
|||||||||||||||||||||||||||
|
Cumulative translation
|
||||||||||||||||||||||||||||
|
adjustments
|
(326
|
)
|
||||||||||||||||||||||||||
|
Net loss
|
(5,887
|
)
|
||||||||||||||||||||||||||
|
Balance at August 31, 2018
|
27,056
|
$
|
1,353
|
$
|
211,280
|
$
|
63,569
|
$
|
341
|
(13,159
|
)
|
$
|
(196,043
|
)
|
||||||||||||||
See accompanying notes to consolidated financial statements.
FRANKLIN COVEY CO.
NOTES TO CONSOLIDATED FINANCIAL STATEMENTS
|
1.
|
NATURE OF OPERATIONS AND SUMMARY OF SIGNIFICANT ACCOUNTING POLICIES
|
Franklin Covey Co. (hereafter referred to as we, us, our, or the Company) is a global company specializing in organizational performance improvement. We help individuals and organizations achieve results that require a change in human behavior and our mission is to "enable greatness in people and organizations everywhere." We have some of the best-known offerings in the training industry, including a suite of individual-effectiveness and leadership-development training and products based on the best-selling books, The 7 Habits of Highly Effective People, The Speed of Trust, The Leader In Me, and The Four Disciplines of Execution, and proprietary content in the areas of Execution, Sales Performance, Productivity, Customer Loyalty, and Educational improvement. Our offerings are described in further detail at www.franklincovey.com and elsewhere in this report. Through our organizational research and curriculum development efforts, we seek to consistently create, develop, and introduce new services and products that help individuals and organizations achieve their own great purposes.
Fiscal Year
Our fiscal year ends on August 31 of each year. During fiscal 2017, our Board of Directors approved a change to our fiscal quarter ending dates from a modified 52/53-week calendar in which quarterly periods ended on different dates from year to year, to the last day of the calendar month in each quarter. Beginning with the second quarter of fiscal 2017, our fiscal quarters now end on the last day of November, February, and May. Unless otherwise noted, references to fiscal years apply to the 12 months ended August 31 of the specified year.
Basis of Presentation
The accompanying consolidated financial statements include the accounts of the Company and our wholly-owned subsidiaries, which consist of Franklin Development Corp., and our offices in Japan, China, the United Kingdom, and Australia. Intercompany balances and transactions are eliminated in consolidation.
Pervasiveness of Estimates
The preparation of financial statements in conformity with accounting principles generally accepted in the United States of America requires us to make estimates and assumptions that affect the reported amounts of assets and liabilities and the disclosure of contingent assets and liabilities at the dates of the financial statements, and the reported amounts of revenues and expenses during the reporting periods. Actual results could differ from those estimates.
Reclassifications
Certain reclassifications have been made to our prior period financial statements to conform with the current period presentation. On our consolidated balance sheet, we have separately classified deferred income tax assets and combined amounts receivable from FC Organizational Products (FCOP) with other current and other long-term assets (Note 17). On our consolidated statements of operations, we reclassified $0.2 million in each of the fiscal years ended August 31, 2017 and 2016 from interest income to the accretion of discount on related party receivables.
Cash and Cash Equivalents
Some of our cash is deposited with financial institutions located throughout the United States of America and at banks in foreign countries where we operate subsidiary offices, and at times may exceed insured limits. We consider all highly liquid debt instruments with a maturity date of three months or less to be cash equivalents. We did not hold a significant amount of investments that would be considered cash equivalent instruments at August 31, 2018 or 2017. Of our $10.2 million in cash at August 31, 2018, $8.9 million of it was held outside the U.S. by our foreign subsidiaries. We routinely repatriate cash from our foreign subsidiaries and consider cash generated from foreign activities a key component of our overall liquidity position.
Inventories
Inventories are stated at the lower of cost or net realizable value, cost being determined using the first-in, first-out method. Elements of cost in inventories generally include raw materials and direct labor. Cash flows from the sale of inventory are included in cash flows provided by operating activities in our consolidated statements of cash flows. Our inventories are comprised primarily of training materials, books, and training-related accessories, and consisted of the following (in thousands):
|
AUGUST 31,
|
2018
|
2017
|
||||||
|
Finished goods
|
$
|
3,130
|
$
|
3,306
|
||||
|
Raw materials
|
30
|
47
|
||||||
|
$
|
3,160
|
$
|
3,353
|
|||||
Provision is made to reduce excess and obsolete inventories to their estimated net realizable value. In assessing the valuation of inventories, we make judgments regarding future demand requirements and compare these estimates with current and committed inventory levels. Inventory requirements may change based on projected customer demand, training curriculum life-cycle changes, and other factors that could affect the valuation of our inventories.
During fiscal 2017, we exited the publishing business in Japan (Note 12) and wrote off the majority of our book inventory located in Japan, which totaled $2.1 million. The cost of the books written off was recorded in cost of sales during fiscal 2017.
Other Current Assets
Significant components of our other current assets were as follows (in thousands):
|
AUGUST 31,
|
2018
|
2017
|
||||||
|
Deferred commissions
|
$
|
6,958
|
$
|
6,150
|
||||
|
Other current assets
|
3,935
|
3,237
|
||||||
|
$
|
10,893
|
$
|
9,387
|
|||||
We defer commission expense on subscription-based sales and recognize the commission expense with the recognition of the corresponding revenue.
Property and Equipment
Property and equipment are recorded at cost. Depreciation expense, which includes depreciation on our corporate campus that is accounted for as a financing obligation (Note 6), and the amortization of assets recorded under capital lease obligations, is calculated using the straight-line method over the lesser of the expected useful life of the asset or the contracted lease period. We generally use the following depreciable lives for our major classifications of property and equipment:
|
Description
|
Useful Lives
|
|
Buildings
|
20 years
|
|
Machinery and equipment
|
5–7 years
|
|
Computer hardware and software
|
3–5 years
|
|
Furniture, fixtures, and leasehold improvements
|
5–7 years
|
Our property and equipment were comprised of the following (in thousands):
|
AUGUST 31,
|
2018
|
2017
|
||||||
|
Land and improvements
|
$
|
1,312
|
$
|
1,312
|
||||
|
Buildings
|
30,038
|
30,044
|
||||||
|
Machinery and equipment
|
1,723
|
2,119
|
||||||
|
Computer hardware and software
|
27,066
|
22,647
|
||||||
|
Furniture, fixtures, and leasehold
|
||||||||
|
improvements
|
8,272
|
8,319
|
||||||
|
68,411
|
64,441
|
|||||||
|
Less accumulated depreciation
|
(47,010
|
)
|
(44,711
|
)
|
||||
|
$
|
21,401
|
$
|
19,730
|
|||||
We expense costs for repairs and maintenance as incurred. Gains and losses resulting from the sale of property and equipment are recorded in operating income (loss). Depreciation of capitalized portal costs is included in depreciation expense in the accompanying consolidated statements of operations. During each of the fiscal years ended August 31, 2018 and 2017, we capitalized $0.1 million of interest expense in connection with the installation of our new enterprise resource planning system and the development of our new All Access Pass portal.
Impairment of Long-Lived Assets
Long-lived tangible assets and finite-lived intangible assets are reviewed for possible impairment whenever events or changes in circumstances indicate that the carrying amount of such assets may not be recoverable. We use an estimate of undiscounted future net cash flows of the assets over the remaining useful lives in determining whether the carrying value of the assets is recoverable. If the carrying values of the assets exceed the anticipated future cash flows of the assets, we recognize an impairment loss equal to the difference between the carrying values of the assets and their estimated fair values. Impairment of long-lived assets is assessed at the lowest levels for which there are identifiable cash flows that are independent from other groups of assets. The evaluation of long-lived assets requires us to use estimates of future cash flows. If forecasts and assumptions used to support the realizability of our long-lived tangible and finite-lived intangible assets change in the future, significant impairment charges could result that would adversely affect our results of operations and financial condition.
Indefinite-Lived Intangible Assets and Goodwill Impairment Testing
Intangible assets that are deemed to have an indefinite life and acquired goodwill are not amortized, but rather are tested for impairment on an annual basis or more often if events or circumstances indicate that a potential impairment exists. The Covey trade name intangible asset has been deemed to have an indefinite life. This intangible asset is tested for impairment using qualitative factors or the present value of estimated royalties on trade name related revenues, which consist primarily of training seminars and work sessions, international licensee sales, and related products. Based on the fiscal 2018 evaluation of the Covey trade name, we believe the fair value of the Covey trade name substantially exceeds its carrying value. No impairment charges were recorded against the Covey trade name during the fiscal years ended August 31, 2018, 2017, or 2016.
Goodwill is recorded when the purchase price for an acquisition exceeds the estimated fair value of the net tangible and identified intangible assets acquired. During August 2017, we adopted Accounting Standards Update (ASU) 2017-04, Intangibles—Goodwill and Other: Simplifying the Test for Goodwill Impairment. This guidance simplifies the subsequent measurement of goodwill and eliminates the two-step goodwill impairment test. Under the new guidance, an annual or interim goodwill impairment test is performed by comparing the fair value of a reporting unit with its carrying amount, and an impairment charge is recognized for the amount by which the carrying amount exceeds the reporting unit's fair value. The amendments also eliminate the requirements for any reporting unit with a zero or negative carrying amount to perform a qualitative assessment and two-step goodwill impairment test.
We tested goodwill for impairment at August 31, 2018 at the reporting unit level using a quantitative approach. The goodwill impairment testing process involves determining whether the estimated fair value of the reporting unit exceeds its respective book value. If the fair value exceeds the book value, goodwill of that reporting unit is not impaired. If the book value exceeds the fair value, an impairment charge is recognized for the amount by which the carrying amount exceeds the reporting unit's fair value. The estimated fair value of each reporting unit was calculated using a combination of the income approach (discounted cash flows) and the market approach (using market multiples derived from a set of companies with comparable market characteristics).
On an interim basis, we consider whether events or circumstances are present that may lead to the determination that goodwill may be impaired. If, based on events or changing circumstances, we determine it is more likely than not that the fair value of a reporting unit does not exceed its carrying value, we would be required to test goodwill for impairment.
Determining the fair value of a reporting unit is judgmental in nature and involves the use of significant estimates and assumptions. These estimates and assumptions include revenue growth rates and operating margins used to calculate projected future cash flows, risk-adjusted discount rates, future economic and market conditions, and determination of appropriate market comparables. We base our fair value estimates on assumptions we believe to be reasonable, but that are unpredictable and inherently uncertain. Actual future results may differ from those estimates. In addition, we make certain judgments and assumptions in allocating shared assets and liabilities to determine the carrying values for each of our reporting units. The timing and frequency of our goodwill impairment tests are based on an ongoing assessment of events and circumstances that would indicate a possible impairment. Based on the results of our goodwill impairment testing, we determined that no impairment existed at either of August 31, 2018 or 2017 as each reporting unit's estimated fair value exceeded its carrying value. We will continue to monitor our goodwill and intangible assets for impairment and conduct formal tests when impairment indicators are present. For more information regarding our intangible assets and goodwill, refer to Note 4.
Capitalized Curriculum Development Costs
During the normal course of business, we develop training courses and related materials that we sell to our clients. Capitalized curriculum development costs include certain expenditures to develop course materials such as video segments, course manuals, and other related materials. Our capitalized curriculum development spending in fiscal 2018, which totaled $3.0 million, was primarily for offerings related to the All Access Pass, including The Four Essential Roles of Leadership, and for various other offerings in our Education practice. Curriculum costs are capitalized when there is a major revision to an existing course that requires a significant re-write of the course materials. Costs incurred to maintain existing offerings are expensed when incurred. In addition, development costs incurred in the research and development of new offerings and software products to be sold, leased, or otherwise marketed are expensed as incurred until economic and technological feasibility has been established.
Capitalized development costs are amortized over three- to five-year useful lives, which are based on numerous factors, including expected cycles of major changes to our content. Capitalized curriculum development costs are reported as a component of other long-term assets in our consolidated balance sheets and totaled $9.3 million and $11.6 million at August 31, 2018 and 2017. Amortization of capitalized curriculum development costs is reported as a component of cost of sales in the accompanying consolidated statements of operations.
Accrued Liabilities
Significant components of our accrued liabilities were as follows (in thousands):
|
AUGUST 31,
|
2018
|
2017
|
||||||
|
Accrued compensation
|
$
|
11,858
|
$
|
10,611
|
||||
|
Other accrued liabilities
|
8,903
|
12,006
|
||||||
|
$
|
20,761
|
$
|
22,617
|
|||||
Contingent Consideration Payments from Business Acquisitions
Business acquisitions may include contingent consideration payments based on various future financial measures related to the acquired entity. Contingent consideration is required to be recognized at fair value as of the acquisition date. We estimate the fair value of these liabilities based on financial projections of the acquired company and estimated probabilities of achievement. Based on updated estimates and projections, the contingent consideration liabilities are adjusted at each reporting date to their estimated fair value. Changes in fair value subsequent to the acquisition date are reported in selling, general, and administrative expense in our consolidated statements of operations, and may have a material impact on our operating results. Variations in the fair value of contingent consideration liabilities may result from changes in discount periods or rates, changes in the timing and amount of earnings estimates, and changes in probability assumptions with respect to the likelihood of achieving various payment criteria.
Foreign Currency Translation and Transactions
The functional currencies of our foreign operations are the reported local currencies. Translation adjustments result from translating our foreign subsidiaries' financial statements into United States dollars. The balance sheet accounts of our foreign subsidiaries are translated into United States dollars using the exchange rate in effect at the balance sheet dates. Revenues and expenses are translated using average exchange rates for each month during the fiscal year. The resulting translation differences are recorded as a component of accumulated other comprehensive income in shareholders' equity. Foreign currency transaction losses totaled $0.5 million, $0.2 million, and $0.3 million for the fiscal years ended August 31, 2018, 2017, and 2016, respectively, and are included as a component of selling, general, and administrative expenses in our consolidated statements of operations.
Sales Taxes
We collect sales tax on qualifying transactions with customers based upon applicable sales tax rates in various jurisdictions. We account for sales taxes collected using the net method; accordingly, we do not include sales taxes in net sales reported in our consolidated statements of operations.
Revenue Recognition
We recognize revenue when: 1) persuasive evidence of an arrangement exists, 2) delivery of the product has occurred or services have been rendered, 3) the price to the customer is fixed or determinable, and 4) collectability is reasonably assured. For training and service sales, these conditions are generally met upon presentation of the training seminar or delivery of the consulting services based upon daily rates. For most of our product sales, these conditions are met upon shipment of the product to the customer. At times, our customers may request access to our intellectual property for the flexibility to print certain training materials or to have access to certain training videos and other training aids at their convenience. For intellectual property license sales, the revenue recognition conditions are generally met at the later of delivery of the content to the client or the effective date of the arrangement.
Revenue recognition for multiple-element arrangements requires judgment to determine if multiple elements exist, whether elements can be accounted for as separate units of accounting, and if so, the fair value for each of the elements. A deliverable constitutes a separate unit of accounting when it has standalone value to our clients. We routinely enter into arrangements that can include various combinations of multiple training offerings, consulting services, and intellectual property licenses. The timing of delivery and performance of the elements typically varies from contract to contract. Generally, these items qualify as separate units of accounting because they have value to the customer on a standalone basis.
When the Company's training and consulting arrangements contain multiple deliverables, consideration is allocated at the inception of the arrangement to all deliverables based on their relative selling prices at the beginning of the agreement, and revenue is recognized as each offering, consulting service, or intellectual property license is delivered. We use the following selling price hierarchy to determine the fair value to be used for allocating revenue to the elements: (i) vendor-specific objective evidence of fair value (VSOE), (ii) third-party evidence (TPE), and (iii) best estimate of selling price (BESP). Generally, VSOE is based on established pricing and discounting practices for the deliverables when sold separately. In determining VSOE, we require that a substantial majority of the selling prices fall within a narrow range. When VSOE cannot be established, judgment is applied with respect to whether a selling price can be established based on TPE, which is determined based on competitor prices for similar offerings when sold separately. Our products and services normally contain a significant level of differentiation such that the comparable pricing of services with similar functionality cannot be obtained. When we are unable to establish a selling price using VSOE or TPE, BESP is used in our allocation of arrangement consideration. BESPs are established as best estimates of what the selling price would be if the deliverables were sold regularly on a stand-alone basis. Our process for determining BESPs requires judgment and considers multiple factors, such as market conditions, type of customer, geographies, stage of product lifecycle, internal costs, and gross margin objectives. These factors may vary over time depending upon the unique facts and circumstances related to each deliverable. However, we do not expect the effect of changes in the selling price or method or assumptions used to determine selling price to have a significant effect on the allocation of arrangement consideration.
Our multiple-element arrangements generally do not include performance, cancellation, termination, or refund-type provisions.
Our international strategy includes the use of licensees in countries where we do not have a wholly-owned direct office. Licensee companies are unrelated entities that have been granted a license to translate our content and offerings, adapt the content to the local culture, and sell our content in a specific country or region. Licensees are required to pay us royalties based upon a percentage of their sales to clients. We recognize royalty income each period based upon the sales information reported to us from our licensees. Licensee royalty revenues are included as a component of training sales and totaled $10.7 million, $10.6 million, and $14.4 million for the fiscal years ended August 31, 2018, 2017, and 2016. The decrease in international licensee royalties in fiscal 2017 was primarily due to the conversion of our licensee operations in China into directly-owned offices.
Revenue is recognized as the net amount to be received after deducting estimated amounts for discounts and product returns.
Stock-Based Compensation
We record the compensation expense for all stock-based payments, including grants of stock options and the compensatory elements of our employee stock purchase plan, in our consolidated statements of operations based upon their fair values over the requisite service period. For more information on our stock-based compensation plans, refer to Note 11.
Shipping and Handling Fees and Costs
All shipping and handling fees billed to customers are recorded as a component of net sales. All costs incurred related to the shipping and handling of products are recorded in cost of sales.
Advertising Costs
Costs for advertising are expensed as incurred. Advertising costs included in selling, general, and administrative expenses totaled $6.9 million, $6.4 million, and $6.6 million for the fiscal years ended August 31, 2018, 2017, and 2016.
Income Taxes
Our income tax provision has been determined using the asset and liability approach of accounting for income taxes. Under this approach, deferred income taxes represent the future tax consequences expected to occur when the reported amounts of assets and liabilities are recovered or paid. The income tax provision represents income taxes paid or payable for the current year plus the change in deferred taxes during the year. Deferred income taxes result from differences between the financial and tax bases of our assets and liabilities and are adjusted for tax rates and tax laws when changes are enacted. A valuation allowance is provided against deferred income tax assets when it is more likely than not that all or some portion of the deferred income tax assets will not be realized. Interest and penalties related to uncertain tax positions are recognized as components of income tax benefit or expense in our consolidated statements of operations.
We may recognize the tax benefit from an uncertain tax position only if it is more likely than not that the tax position will be sustained on examination by the taxing authorities based on the technical merits of the position. The tax benefits recognized in the financial statements from such a position are measured based on the largest benefit that has a greater than 50 percent likelihood of being realized upon ultimate settlement.
We provide for income taxes, net of applicable foreign tax credits, on temporary differences in our investment in foreign subsidiaries, which consist primarily of unrepatriated earnings.
Comprehensive Income
Comprehensive income includes changes to equity accounts that were not the result of transactions with shareholders. Comprehensive income is comprised of net income or loss and other comprehensive income and loss items. Our other comprehensive income and losses generally consist of changes in the cumulative foreign currency translation adjustment, net of tax.
Accounting Pronouncements Issued and Adopted
In March 2016, the Financial Accounting Standards Board (FASB) issued ASU 2016-09, Compensation - Stock Compensation (Topic 718) - Improvements to Employee Share-Based Payment Accounting. The guidance in ASU 2016-09 simplifies several aspects of the accounting for stock-based payment transactions, including the income tax consequences, classification of awards as either equity or liabilities, and classification of items on the statement of cash flows. The guidance in ASU 2016-09 is effective for public companies' annual periods, including interim periods within those fiscal years, beginning after December 15, 2016. We adopted the provisions of ASU 2016-09 on September 1, 2017 on a prospective basis and prior periods have not been restated for these amendments. The primary impact of adopting this guidance on our financial statements has been the classification of excess income tax benefits or expense in income taxes rather than as a component of additional paid-in capital. The adoption of ASU 2016-09 did not have a material impact on our financial statements in fiscal 2018.
Accounting Pronouncements Issued Not Yet Adopted
On May 28, 2014, the FASB issued ASU No. 2014-09, Revenue from Contracts with Customers (Topic 606). This new standard was issued in conjunction with the International Accounting Standards Board (IASB) and is designed to create a single, principles-based process by which all businesses calculate revenue. The core principle of this standard is that an entity should recognize revenue for the transfer of goods or services equal to the amount that it expects to be entitled to receive for those goods or services. The standard also requires additional disclosure about the nature, amount, timing, and uncertainty of revenue and cash flows arising from customer contracts, including significant judgments and changes in judgments, and assets recognized from costs incurred to obtain or fulfill a contract. The new standard replaces numerous individual, industry-specific revenue rules found in generally accepted accounting principles in the United States. We will adopt this standard on September 1, 2018 and apply the new guidance during interim periods within fiscal 2019. We plan to adopt ASU No. 2014-09 using the "modified retrospective" approach.
Based upon our analysis of Topic 606, we expect that revenue recognition among our products and services will remain largely unchanged except for our initial license fee associated with licensing an international location. The Company currently records the non-refundable initial license fee from licensing an international location as revenue at the time the license period begins if all other revenue requirements have been met. However, under Topic 606, we have concluded that initial upfront fees should be recognized over the course of the initial contract.
Under Topic 606, we will account for the All Access Pass (AAP) as a single performance obligation and recognize the associated transaction price on a straight-line basis over the term of the underlying contract. This determination was reached after considering that our web-based functionality and content, in combination with our intellectual property, each represent inputs that transform into a combined output that represents the intended outcome of the AAP, which is to provide a continuously accessible, customized, and dynamic learning and development solution only accessible through the AAP platform.
We do not expect the accounting for fulfillment costs or costs incurred to obtain a contract to be affected materially in any period due to the adoption of Topic 606.
Although the Company is still finalizing its analysis of the adoption of Topic 606, we estimate that the initial impact upon adoption will be a reduction to the opening balance of retained earnings with offsetting amounts recorded to deferred revenue and deferred tax asset in an amount between $2 million and $4 million. We do not expect the adoption of ASU 2014-09 to have any impact on our operating cash flows.
On February 25, 2016, the FASB issued ASU No. 2016-02, Leases. The new lease accounting standard is the result of a collaborative effort with the IASB (similar to the new revenue standard described above), although some differences remain between the two standards. This new standard will affect all entities that lease assets and will require lessees to recognize a lease liability and a right-of-use asset for all leases (except for short-term leases that have a duration of less than one year) as of the date on which the lessor makes the underlying asset available to the lessee. For lessors, accounting for leases is substantially the same as in prior periods. For public companies, the new lease standard is effective for fiscal years beginning after December 15, 2018, including interim periods within those fiscal years, and early adoption is permitted for all entities. We expect to adopt the provisions of ASU 2016-02 on September 1, 2019, and we may elect to apply the new standard on a prospective basis. At August 31, 2018, our leases primarily consist of the lease on our corporate campus, which is accounted for as a financing obligation (Note 6) on our consolidated balance sheets and operating leases for office and warehousing space. We expect the adoption of this new standard will increase our reported assets and liabilities since we will record the lease obligation and a corresponding right of use asset on our balance sheet for leases that are currently accounted for as operating leases (Note 7). However, as of August 31, 2018, we have not yet elected the transition method or determined the full impact that the adoption of ASU 2016-02 will have on our consolidated financial statements.
| 2. |
BUSINESS ACQUISITIONS
|
Robert Gregory Partners, LLC
On May 15, 2017, we acquired the assets of Robert Gregory Partners, LLC (RGP), a Dublin, Ohio based corporate coaching firm, for $3.5 million in cash plus potential contingent consideration totaling $4.5 million. Robert Gregory Partners is a corporate coaching firm with expertise in executive coaching, transition acceleration coaching, leadership development coaching, implementation coaching, and consulting. We believe that the acquired RGP services and methodologies have become important offerings in our training and consulting business. The financial results of RGP have been included in our consolidated financial statements since the date of the acquisition.
The total purchase price consisted of the following (in thousands):
|
Cash paid to RGP at closing
|
$
|
3,500
|
||
|
Fair value of contingent consideration
|
1,413
|
|||
|
Total purchase price
|
$
|
4,913
|
||
The major classes of assets and liabilities to which we have allocated the purchase price were as follows (in thousands):
|
Accounts receivable
|
$
|
458
|
||
|
Prepaid expenses
|
136
|
|||
|
Intangible assets
|
3,811
|
|||
|
Goodwill
|
1,232
|
|||
|
Assets acquired
|
5,637
|
|||
|
Accounts payable
|
(51
|
)
|
||
|
Accrued liabilities
|
(80
|
)
|
||
|
Deferred revenues
|
(593
|
)
|
||
|
Liabilities assumed
|
(724
|
)
|
||
|
$
|
4,913
|
|||
The goodwill generated from the RGP acquisition was allocated to each of our operating segments. The goodwill was primarily attributed to increased synergies that are expected to be achieved from the integration of RGP's coaching methodologies into our services and offerings. All of the goodwill from the RGP acquisition is expected to be deductible for income tax purposes.
The payment of contingent consideration is based on the achievement of specified financial results and the delivery of "add-on coaching services" content that is included in our All Access Pass offering. We paid the former owners of RGP $1.0 million during fiscal 2018 as contingent consideration for achieving specified financial results. During the fourth quarter of fiscal 2017, we paid the former owners of RGP $0.5 million of contingent consideration for delivery of the content that was integrated into our AAP offering. Due to the timing of the $0.5 million payment for add-on coaching services, this amount was included in the investing activities section of the accompanying consolidated statement of cash flows for fiscal 2017. Refer to Note 10 for further information regarding the fair value of the contingent consideration liability resulting from the RGP acquisition.
The details of the purchase price allocated to the intangible assets acquired were as follows (in thousands):
|
Weighted Average
|
|||||
|
Description
|
Amount
|
Life
|
|||
|
Customer list
|
$
|
2,249
|
10 years
|
||
|
Content
|
461
|
5 years
|
|||
|
Trade name
|
341
|
5 years
|
|||
|
Non-compete agreements
|
328
|
2 years
|
|||
|
Deferred contract revenue
|
237
|
2 years
|
|||
|
Coach relationships
|
150
|
10 years
|
|||
|
Acquired technology
|
45
|
3 years
|
|||
|
$
|
3,811
|
8 years
|
|||
Our fiscal 2017 consolidated statement of operations include $1.2 million of revenue and $0.4 million of income from operations, excluding amortization of intangible assets, attributable to RGP since the date of the acquisition. For the twelve months ended December 31, 2016, RGP had revenues of $3.3 million (unaudited) and operating income of $1.1 million (unaudited). The costs to acquire RGP totaled approximately $0.1 million and were expensed as components of selling, general, and administrative expense in our consolidated financial statements.
Jhana Education
On July 11, 2017, we acquired all of the outstanding stock of Jhana Education (Jhana), a San Francisco based company that specializes in the creation and dissemination of relevant, bite-sized content and learning tools for leaders and managers. The acquired Jhana content and delivery methodologies have become key features of our current AAP offering. The purchase price was $3.5 million in cash plus up to $7.2 million of contingent consideration. The financial results of Jhana have been included in our consolidated financial statements since the date of the acquisition.
The total purchase price consisted of the following (in thousands):
|
Cash paid to Jhana at closing
|
$
|
3,525
|
||
|
Fair value of contingent consideration
|
6,052
|
|||
|
Total purchase price
|
$
|
9,577
|
||
The major classes of assets and liabilities to which we have allocated the purchase price were as follows (in thousands):
|
Cash
|
$
|
253
|
||
|
Accounts receivable
|
195
|
|||
|
Prepaid expenses and other current assets
|
86
|
|||
|
Deferred tax asset
|
3,138
|
|||
|
Intangible assets
|
6,076
|
|||
|
Goodwill
|
3,085
|
|||
|
Assets acquired
|
12,833
|
|||
|
Accounts payable
|
(185
|
)
|
||
|
Accrued liabilities
|
(19
|
)
|
||
|
Deferred tax liability
|
(2,257
|
)
|
||
|
Deferred revenues
|
(795
|
)
|
||
|
Liabilities assumed
|
(3,256
|
)
|
||
|
$
|
9,577
|
|||
The details of the purchase price allocated to the intangible assets acquired consisted of the following (in thousands):
|
Weighted Average
|
|||||
|
Description
|
Amount
|
Life
|
|||
|
Content
|
$
|
3,097
|
5 years
|
||
|
Acquired technology
|
1,474
|
3 years
|
|||
|
Customer list
|
1,016
|
5 years
|
|||
|
Trade name
|
445
|
5 years
|
|||
|
Non-compete agreements
|
44
|
3 years
|
|||
|
$
|
6,076
|
5 years
|
|||
The goodwill from the Jhana acquisition was assigned to the Direct Offices, Strategic Markets, and International Licensee segments (Note 4). The goodwill was primarily attributed to increased synergies that are expected to be achieved from the integration of Jhana's content and delivery methodologies into our services and offerings, especially in the All Access Pass. None of the goodwill from the Jhana acquisition is expected to be deductible for income tax purposes.
During fiscal 2018, we paid $2.4 million to the former owners of Jhana as contingent consideration based on the acquisition agreement. The first $1.1 million was paid within 90 days of the acquisition date and was classified as a component of cash flows from investing activities in our fiscal 2018 consolidated statement of cash flows. The payment of the remaining contingent consideration is based on certain revenue streams over the measurement period, which ends in July 2026. Refer to Note 10 for further information regarding the fair value of contingent consideration resulting from the Jhana acquisition.
The acquisition of Jhana had an immaterial impact on our consolidated financial statements for the fiscal year ended August 31, 2017. For the year ending December 31, 2016, Jhana had revenues of $1.6 million (unaudited) and a loss before income taxes of $3.1 million (unaudited). The costs to acquire Jhana totaled approximately $0.1 million and were expensed as incurred. The acquisition costs were included in our selling, general, and administrative expenses.
Unaudited Pro Forma Information
The following are supplemental consolidated financial results of Franklin Covey Co. on an unaudited pro forma basis as if the acquisitions of RGP and Jhana had been completed on September 1, 2015 (in thousands, except per share amounts):
|
YEAR ENDED
|
||||||||
|
AUGUST 31,
|
2017
|
2016
|
||||||
|
Revenue
|
$
|
187,745
|
$
|
204,505
|
||||
|
Net income (loss)
|
(7,976
|
)
|
4,863
|
|||||
|
Diluted earnings (loss) per share
|
(0.58
|
)
|
0.32
|
|||||
These pro forma results were based on estimates and assumptions, which we believe are reasonable. They are not the results that would have been realized had we been a combined company during the periods presented, and are not necessarily indicative of our consolidated results of operations in future periods. The pro forma results include adjustments related to purchase accounting, primarily the amortization of intangible assets, interest expense, and inclusion of acquisition costs.
| 3. |
ACCOUNTS RECEIVABLE
|
Accounts receivable are recorded at the invoiced amount and do not bear interest. The allowance for doubtful accounts represents our best estimate of the amount of probable credit losses in the existing accounts receivable balance, and we review the adequacy of the allowance for doubtful accounts on a regular basis. We determine the allowance for doubtful accounts using historical write-off experience based on the age of the receivable balances and current general economic conditions. Receivable balances past due over 90 days, which exceed a specified dollar amount, are reviewed individually for collectability. As we increase sales to governmental organizations, including school districts, and offer longer payment terms on certain contracts (which are still within our normal payment terms), our collection cycle may increase in future periods. If the risk of non-collection increases for such receivable balances, there may be additional charges to expense to increase the allowance for doubtful accounts.
Account balances are charged off against the allowance after all means of collection have been exhausted and the potential for recovery is considered remote. We do not have any off-balance sheet credit exposure related to our customers nor do we generally require collateral or other security agreements from our customers. Activity in our allowance for doubtful accounts was comprised of the following for the periods indicated (in thousands):
|
YEAR ENDED
|
||||||||||||
|
AUGUST 31,
|
2018
|
2017
|
2016
|
|||||||||
|
Beginning balance
|
$
|
2,310
|
$
|
1,579
|
$
|
1,333
|
||||||
|
Charged to costs and expenses
|
2,029
|
1,747
|
2,022
|
|||||||||
|
Deductions
|
(784
|
)
|
(1,016
|
)
|
(1,776
|
)
|
||||||
|
Ending balance
|
$
|
3,555
|
$
|
2,310
|
$
|
1,579
|
||||||
Deductions on the foregoing table represent the write-off of amounts deemed uncollectible during the fiscal year presented. Recoveries of amounts previously written off were insignificant for the periods presented.
| 4. |
INTANGIBLE ASSETS AND GOODWILL
|
Intangible Assets
Our intangible assets were comprised of the following (in thousands):
|
Gross Carrying
|
Accumulated
|
Net Carrying
|
||||||||||
|
AUGUST 31, 2018
|
Amount
|
Amortization
|
Amount
|
|||||||||
|
Finite-lived intangible assets:
|
||||||||||||
|
License rights
|
$
|
27,750
|
$
|
(18,889
|
)
|
$
|
8,861
|
|||||
|
Acquired content
|
62,102
|
(46,147
|
)
|
15,955
|
||||||||
|
Customer lists
|
20,092
|
(17,835
|
)
|
2,257
|
||||||||
|
Acquired technology
|
3,568
|
(2,642
|
)
|
926
|
||||||||
|
Trade names
|
2,036
|
(1,441
|
)
|
595
|
||||||||
|
Non-compete agreements and other
|
758
|
(418
|
)
|
340
|
||||||||
|
116,306
|
(87,372
|
)
|
28,934
|
|||||||||
|
Indefinite-lived intangible asset:
|
||||||||||||
|
Covey trade name
|
23,000
|
-
|
23,000
|
|||||||||
|
$
|
139,306
|
$
|
(87,372
|
)
|
$
|
51,934
|
||||||
|
AUGUST 31, 2017
|
||||||||||||
|
Finite-lived intangible assets:
|
||||||||||||
|
License rights
|
$
|
27,750
|
$
|
(17,802
|
)
|
$
|
9,948
|
|||||
|
Acquired content
|
62,094
|
(43,864
|
)
|
18,230
|
||||||||
|
Customer lists
|
20,092
|
(16,935
|
)
|
3,157
|
||||||||
|
Acquired technology
|
3,568
|
(2,136
|
)
|
1,432
|
||||||||
|
Trade names
|
2,036
|
(1,163
|
)
|
873
|
||||||||
|
Non-compete agreements and other
|
758
|
(104
|
)
|
654
|
||||||||
|
116,298
|
(82,004
|
)
|
34,294
|
|||||||||
|
Indefinite-lived intangible asset:
|
||||||||||||
|
Covey trade name
|
23,000
|
-
|
23,000
|
|||||||||
|
$
|
139,298
|
$
|
(82,004
|
)
|
$
|
57,294
|
||||||
Our intangible assets are amortized over the estimated useful life of the asset. The range of remaining estimated useful lives and weighted-average amortization period over which we are amortizing the major categories of finite-lived intangible assets at August 31, 2018 were as follows:
|
Category of Intangible Asset
|
Range of Remaining Estimated Useful Lives
|
Weighted Average Original Amortization Period
|
||
|
License rights
|
4 to 8 years
|
30 years
|
||
|
Acquired content
|
1 to 8 years
|
25 years
|
||
|
Customer lists
|
1 to 9 years
|
12 years
|
||
|
Acquired technology
|
2 years
|
3 years
|
||
|
Trade names
|
1 to 4 years
|
5 years
|
||
|
Non-compete agreements and other
|
1 to 9 years
|
4 years
|
Our aggregate amortization expense from finite-lived intangible assets totaled $5.4 million, $3.5 million, and $3.3 million for the fiscal years ended August 31, 2018, 2017, and 2016. Amortization expense from our intangible assets over the next five years is expected to be as follows (in thousands):
|
YEAR ENDING
|
||||
|
AUGUST 31,
|
||||
|
2019
|
$
|
4,790
|
||
|
2020
|
4,324
|
|||
|
2021
|
3,809
|
|||
|
2022
|
3,498
|
|||
|
2023
|
2,612
|
|||
Goodwill
Activity in our consolidated goodwill consisted of the following during fiscal 2018 and 2017 (in thousands):
|
Balance at August 31, 2016
|
$
|
19,903
|
||
|
Acquisition of RGP (Note 2)
|
1,232
|
|||
|
Acquisition of Jhanna (Note 2)
|
3,085
|
|||
|
Accumulated impairments
|
-
|
|||
|
Balance at August 31, 2017
|
24,220
|
|||
|
Accumulated impairments
|
-
|
|||
|
Balance at August 31, 2018
|
$
|
24,220
|
||
We allocated the goodwill generated from our fiscal 2017 business acquisitions to our operating segments based on their relative fair values as shown below (in thousands):
|
Direct offices
|
$
|
2,592
|
||
|
Strategic markets
|
513
|
|||
|
Education practice
|
154
|
|||
|
International licensees
|
1,058
|
|||
|
$
|
4,317
|
|||
During fiscal 2018, we dissolved the Strategic Markets segment and combined its operations with the Direct Office segment (Note 16). We reclassified the goodwill from the Strategic Market segment to the Direct Office segment as shown below (in thousands):
|
Adjusted
|
||||||||||||
|
AUGUST 31,
|
2017
|
Goodwill
|
2018
|
|||||||||
|
Direct offices
|
$
|
13,382
|
$
|
3,443
|
$
|
16,825
|
||||||
|
Strategic markets
|
3,443
|
(3,443
|
)
|
-
|
||||||||
|
Education practice
|
2,330
|
-
|
2,330
|
|||||||||
|
International licensees
|
5,065
|
-
|
5,065
|
|||||||||
|
$
|
24,220
|
$
|
-
|
$
|
24,220
|
|||||||
| 5. |
TERM LOANS PAYABLE AND REVOLVING LINE OF CREDIT
|
We have entered into an amended and restated secured credit agreement (the Restated Credit Agreement) with our existing lender. The Restated Credit Agreement provides us with a revolving line of credit facility and the ability to borrow on other instruments, such as term loans. We generally renew the Restated Credit Agreement on a regular basis to maintain the long-term availability of this credit facility.
During fiscal 2017, we entered into the Sixth, Seventh, and Eighth Modification Agreements to the Restated Credit Agreement. The Sixth Modification and Eighth Modification agreements adjusted the definition of EBITDAR in the funded debt to EBITDAR and fixed charge coverage ratios applicable to
our debt covenants to include the change in deferred revenue from subscription sales. The Seventh Modification Agreement extended the maturity date of the Restated Credit Agreement. On August 17, 2018, we entered into the Ninth Modification Agreement, which extended the maturity date of the Restated Credit Agreement by one year to March 31, 2021.
In connection with the modification agreements to the Restated Credit Agreement, we have entered into a security agreement, repayment guaranty agreements, and a pledge and security agreement. These agreements pledge substantially all of our assets located in the United States to the lender as collateral for borrowings under the Restated Credit Agreement and subsequent amendments.
The effective interest rate on our term loans and revolving line of credit was 3.9 percent at August 31, 2018 and 3.1 percent at August 31, 2017.
Term Loans Payable
In connection with the terms of our modified Restated Credit Agreement, we obtained a $15.0 million term loan and have the ability to obtain additional term loans in increments of $5.0 million up to a maximum of $40.0 million. Each additional term loan reduces the amount available to borrow on the revolving line of credit facility on a dollar-for-dollar basis. We obtained additional $5.0 million term loans during each of September 2016 and August 2017. Interest on the term loans is payable monthly at LIBOR plus 1.85 percent per year and each term loan matures three years from the date of borrowing. Interest is payable monthly and principal payments are due and payable on the first day of each January, April, July, and October. Principal payments are equal to the original amount of each term loan divided by 16 and any remaining principal at the maturity date is immediately payable or may be rolled into a new term loan. The proceeds from each term loan may be used for general corporate purposes and each term loan may be repaid sooner than the maturity date at our discretion. The following information applies to our term loans payable at August 31, 2018 (in thousands):
|
Original Principal
|
Quarterly Principal
|
Outstanding
|
||||||||||
|
Maturity Date
|
Amount
|
Payment Amount
|
Principal
|
|||||||||
|
May 24, 2019
|
$
|
15,000
|
$
|
938
|
$
|
6,563
|
||||||
|
August 29, 2019
|
5,000
|
313
|
2,500
|
|||||||||
|
August 29, 2020
|
5,000
|
313
|
3,750
|
|||||||||
|
$
|
12,813
|
|||||||||||
Principal payments by fiscal year through the maturity dates of the term loans are as follows (in thousands):
|
YEAR ENDING
|
||||
|
AUGUST 31,
|
||||
|
2019
|
$
|
10,313
|
||
|
2020
|
2,500
|
|||
|
$
|
12,813
|
|||
Revolving Line of Credit
The key terms and conditions of our revolving line of credit are as follows:
|
·
|
Available Credit – $30.0 million as of August 31, 2018.
|
|
·
|
Maturity Date – March 31, 2021.
|
|
·
|
Interest Rate – The effective interest rate is LIBOR plus 1.85 percent per annum and the unused credit fee on the line of credit is 0.25 percent per annum.
|
|
·
|
Financial Covenants – The Restated Credit Agreement requires us to be in compliance with specified financial covenants, including (a) a funded debt to EBITDAR (earnings before interest, taxes, depreciation, amortization, and rental expense) ratio of less than 3.00 to 1.00; (b) a fixed charge coverage ratio greater than 1.15 to 1.0; (c) an annual limit on capital expenditures (not including capitalized curriculum development) of $8.0 million; and (d) consolidated accounts receivable must exceed 150 percent of the amount outstanding on the line of credit.
|
In the event of noncompliance with these financial covenants and other defined events of default, the lender is entitled to certain remedies, including acceleration of the repayment of any amounts outstanding on the Restated Credit Agreement. At August 31, 2018, we believe that we were in compliance with the terms and covenants applicable to our Restated Credit Agreement and its modifications. We had $11.3 million outstanding on our revolving line of credit at August 31, 2018, and $4.4 million outstanding on August 31, 2017.
| 6. |
FINANCING OBLIGATION
|
In connection with the sale and leaseback of our corporate headquarters facility located in Salt Lake City, Utah, we entered into a 20-year master lease agreement with the purchaser, an unrelated private investment group. The 20-year master lease agreement also contains six five-year renewal options that allow us to maintain our operations at the current location for up to 50 years. Although the corporate headquarters facility was sold and the Company has no legal ownership of the property, under applicable accounting guidance we were prohibited from recording the transaction as a sale since we have subleased a significant portion of the property that was sold. Accordingly, we account for the sale as a financing transaction, which requires us to continue reporting the corporate headquarters facility as an asset and to record a financing obligation for the sale price.
The financing obligation on our corporate campus was comprised of the following (in thousands):
|
AUGUST 31,
|
2018
|
2017
|
||||||
|
Financing obligation payable in
|
||||||||
|
monthly installments of $303 at
|
||||||||
|
August 31, 2018, including
|
||||||||
|
principal and interest, with two
|
||||||||
|
percent annual increases
|
||||||||
|
(imputed interest at 7.7%),
|
||||||||
|
through June 2025
|
$
|
21,075
|
$
|
22,943
|
||||
|
Less current portion
|
(2,092
|
)
|
(1,868
|
)
|
||||
|
Total financing obligation,
|
||||||||
|
less current portion
|
$
|
18,983
|
$
|
21,075
|
||||
Future principal maturities of our financing obligation were as follows at August 31, 2018 (in thousands):
|
YEAR ENDING
|
||||
|
AUGUST 31,
|
||||
|
2019
|
$
|
2,092
|
||
|
2020
|
2,335
|
|||
|
2021
|
2,600
|
|||
|
2022
|
2,887
|
|||
|
2023
|
3,199
|
|||
|
Thereafter
|
7,962
|
|||
|
$
|
21,075
|
|||
Our remaining future minimum payments under the financing obligation in the initial 20-year lease term are as follows (in thousands):
|
YEAR ENDING
|
||||
|
AUGUST 31,
|
||||
|
2019
|
$
|
3,651
|
||
|
2020
|
3,724
|
|||
|
2021
|
3,798
|
|||
|
2022
|
3,874
|
|||
|
2023
|
3,952
|
|||
|
Thereafter
|
7,331
|
|||
|
Total future minimum financing
|
||||
|
obligation payments
|
26,330
|
|||
|
Less interest
|
(6,567
|
)
|
||
|
Present value of future minimum
|
||||
|
financing obligation payments
|
$
|
19,763
|
||
The $1.3 million difference between the carrying value of the financing obligation and the present value of the future minimum financing obligation payments represents the carrying value of the land sold in the financing transaction, which is not depreciated. At the conclusion of the master lease agreement, the remaining financing obligation and carrying value of the land will be offset and written off of our consolidated financial statements.
| 7. |
OPERATING LEASES
|
Lease Expense
In the normal course of business, we lease office space and warehouse and distribution facilities under non-cancelable operating lease agreements. We rent office space, primarily for international and domestic regional sales administration offices, in commercial office complexes that are conducive to sales and administrative operations. We also rent warehousing and distribution facilities that are designed to provide secure storage and efficient distribution of our training products, books, and accessories. These operating lease agreements often contain renewal options that may be exercised at our discretion after the completion of the base rental term. In addition, many of the rental agreements provide for regular increases to the base rental rate at specified intervals, which usually occur on an annual basis. At August 31, 2018, we had operating leases with remaining terms ranging from less than one year to approximately seven years. The following table summarizes our future minimum lease payments under operating lease agreements at August 31, 2018 (in thousands):
|
YEAR ENDING
|
||||
|
AUGUST 31,
|
||||
|
2019
|
$
|
865
|
||
|
2020
|
415
|
|||
|
2021
|
231
|
|||
|
2022
|
85
|
|||
|
2023
|
85
|
|||
|
Thereafter
|
184
|
|||
|
$
|
1,865
|
|||
We recognize lease expense on a straight-line basis over the life of the lease agreement. Contingent rent expense is recognized as it is incurred and was insignificant for the periods presented. Total rent expense recorded in selling, general, and administrative expense from operating lease agreements was $1.6 million, $1.8 million, and $2.2 million for the fiscal years ended August 31, 2018, 2017, and 2016.
Lease Income
We have subleased the majority of our corporate headquarters campus located in Salt Lake City, Utah to multiple, unrelated tenants as well as to FC Organizational Products (Note 17). We recognize sublease income on a straight-line basis over the life of the sublease agreement. The cost basis of our corporate campus was $34.8 million, which had a carrying value of $7.6 million at August 31, 2018. The following future minimum lease payments due to us from our sublease agreements at August 31, 2018 include lease income of approximately $0.6 million per year from FCOP (in thousands):
|
YEAR ENDING
|
||||
|
AUGUST 31,
|
||||
|
2019
|
$
|
3,789
|
||
|
2020
|
3,888
|
|||
|
2021
|
2,340
|
|||
|
2022
|
1,514
|
|||
|
2023
|
1,514
|
|||
|
Thereafter
|
2,802
|
|||
|
$
|
15,847
|
|||
Sublease revenue totaled $3.5 million, $3.6 million, and $4.4 million during the fiscal years ended August 31, 2018, 2017, and 2016.
| 8. |
COMMITMENTS AND CONTINGENCIES
|
Warehouse Outsourcing Contract
Effective July 1, 2016, we entered into a warehousing services agreement with an independent warehouse and distribution company to provide product kitting, warehousing, and order fulfillment services at a facility in Des Moines, Iowa. Under the terms of this contract, we pay a fixed charge of approximately $19,000 per month for account management services and variable charges for other warehousing services based on specified activities, including shipping charges. The warehouse charges may be increased each year of the contract based upon changes in the Employment Cost Index. The warehousing and distribution contract expires on June 30, 2019.
During fiscal years 2018, 2017, and 2016, we expensed $2.9 million, $2.6 million, and $3.8 million for services provided under the terms of our warehouse and distribution outsourcing contract. The total amount expensed each year under these contracts include freight charges, which are billed to the Company based upon activity. Freight charges included in the warehouse and distribution outsourcing costs totaled $1.9 million, $1.5 million, and $1.8 million during the fiscal years ended August 31, 2018, 2017, and 2016. Because of the variable component of the agreement, our payments for warehouse and distribution services may fluctuate in future periods based upon sales and levels of specified activities.
Purchase Commitments
During the normal course of business, we issue purchase orders to various vendors for products and services. At August 31, 2018, we had open purchase commitments totaling $4.3 million for products and services to be delivered primarily in fiscal 2019.
Letters of Credit
At August 31, 2018 and 2017, we had standby letters of credit totaling $0.1 million. These letters of credit were primarily required to secure commitments for certain insurance policies and expire in January 2019. No amounts were drawn on the letters of credit at either August 31, 2018 or August 31, 2017.
Legal Matters and Loss Contingencies
We are the subject of certain legal actions, which we consider routine to our business activities. At August 31, 2018, we believe that, after consultation with legal counsel, any potential liability to us under these other actions will not materially affect our financial position, liquidity, or results of operations.
| 9. |
SHAREHOLDERS' EQUITY
|
Preferred Stock
We have 14.0 million shares of preferred stock authorized for issuance. At August 31, 2018 and 2017, no shares of preferred stock were issued or outstanding.
Treasury Stock
Open Market Purchases
On January 23, 2015, our Board of Directors approved a new plan to repurchase up to $10.0 million of the Company's outstanding common stock. All previously existing common stock repurchase plans were canceled and the new common share repurchase plan does not have an expiration date. On March 27, 2015, our Board of Directors increased the aggregate value of shares of Company common stock that may be purchased under the January 2015 plan to $40.0 million so long as we have either $10.0 million in cash and cash equivalents or have access to debt financing of at least $10.0 million. Through August 31, 2018, we have purchased 1,539,828 shares of our common stock for $26.8 million under the terms of this expanded common stock repurchase plan. The actual timing, number, and value of common shares repurchased under this plan will be determined at our discretion and will depend on a number of factors, including, among others, general market and business conditions, the trading price of our common shares, and applicable legal requirements. The Company has no obligation to repurchase any common shares under the authorization, and the repurchase plan may be suspended, discontinued, or modified at any time for any reason.
The cost of common stock purchased for treasury as shown on our consolidated statement of cash flows for the year ending August 31, 2018 is comprised of the cost of 104,699 shares that were withheld for statutory income taxes on stock-based compensation awards issued to participants during the fiscal 2018. The withheld shares were valued at the market price on the date the shares were distributed to participants, which totaled $2.0 million. For the fiscal years ended August 31, 2017 and 2016, we withheld 51,156 shares and 2,260 shares for minimum statutory taxes on stock-based compensation awards, which had a total value of $0.9 million and $38,000, respectively.
Fiscal 2016 Tender Offer
On December 8, 2015, we announced that our Board of Directors approved a modified Dutch auction tender offer for up to $35.0 million in value of shares of our common stock at a price within (and including) the range of $15.50 to $17.75 per share. The tender offer commenced on December 14, 2015, and expired at 11:59 p.m. Eastern time, on January 12, 2016. The tender offer was fully subscribed and we acquired 1,971,832 shares of our common stock at $17.75 per share. Including fees to complete the tender offer, the total cost of the tendered shares was $35.3 million, which was financed by existing cash and proceeds from our revolving line of credit facility. For further information regarding the terms and conditions of this completed tender offer, refer to information in the Tender Offer Statement on Schedule TO filed with Securities and Exchange Commission on December 14, 2015 and subsequent amendments thereto.
| 10. |
FAIR VALUE OF FINANCIAL INSTRUMENTS
|
Fair value is defined as the price that would be received to sell an asset or paid to transfer a liability (an exit price) in an orderly transaction between market participants at the measurement date. The accounting standards related to fair value measurements include a hierarchy for information and valuations used in measuring fair value that is broken down into the following three levels based on reliability:
|
·
|
Level 1 valuations are based on quoted prices in active markets for identical instruments that the Company can access at the measurement date.
|
|
·
|
Level 2 valuations are based on inputs other than quoted prices included in Level 1 that are observable for the instrument, either directly or indirectly, for substantially the full term of the asset or liability including the following:
|
|
a.
|
quoted prices for similar, but not identical, instruments in active markets;
|
|
b.
|
quoted prices for identical or similar instruments in markets that are not active;
|
|
c.
|
inputs other than quoted prices that are observable for the instrument; or
|
|
d.
|
inputs that are derived principally from or corroborated by observable market data by correlation or other means.
|
|
·
|
Level 3 valuations are based on information that is unobservable and significant to the overall fair value measurement.
|
The book values of our financial instruments at August 31, 2018 and 2017 approximated their fair values. The assessment of the fair values of our financial instruments is based on a variety of factors and assumptions. Accordingly, the fair values may not represent the actual values of the financial instruments that could have been realized at August 31, 2018 or 2017, or that will be realized in the future, and do not include expenses that could be incurred in an actual sale or settlement. The following methods and assumptions were used to determine the fair values of our financial instruments, none of which were held for trading or speculative purposes:
Cash, Cash Equivalents, and Accounts Receivable – The carrying amounts of cash, cash equivalents, and accounts receivable approximate their fair values due to the liquidity and short-term maturity of these instruments.
Other Assets – Our other assets, including notes receivable, were recorded at the net realizable value of estimated future cash flows from these instruments.
Debt Obligations – At August 31, 2018, our debt obligations consisted of variable-rate term notes payable and borrowings on our variable-rate revolving line of credit. The term notes payable and revolving line of credit (Note 5) are negotiated components of our Restated Credit Agreement, which is renewed on a regular basis to maintain the long-term borrowing capability of the agreement. Accordingly, the applicable interest rates on the term loans and revolving line of credit are reflective of current market conditions, and the carrying value of term loan and revolving line of credit obligations therefore approximate their fair value.
Contingent Consideration Liabilities from Business Acquisitions
We have contingent consideration liabilities resulting from our fiscal 2017 business acquisitions (Note 2). We measure the fair values of our contingent consideration liabilities at each reporting date based on various valuation models as described below. Changes to the fair value of the contingent consideration liabilities are recorded as components of our selling, general, and administrative expenses in the accompanying consolidated statements of operations in the period of adjustment. The fair value of the contingent consideration liabilities from the acquisition of RGP and Jhana changed as follows during fiscal 2018 (in thousands):
|
Increase in
|
||||||||||||||||
|
AUGUST 31,
|
2017
|
Fair Value
|
Payments
|
2018
|
||||||||||||
|
RGP Acquisition
|
$
|
913
|
$
|
693
|
$
|
(1,000
|
)
|
$
|
606
|
|||||||
|
Jhana Acquisition
|
6,052
|
321
|
(2,431
|
)
|
3,942
|
|||||||||||
|
$
|
6,965
|
$
|
1,014
|
$
|
(3,431
|
)
|
$
|
4,548
|
||||||||
The fair values of contingent consideration liabilities are recorded as components of accrued liabilities and other long-term liabilities based on expected payment dates.
Robert Gregory Partners – On May 15, 2017, we acquired the assets of RGP. The purchase price included contingent consideration payments to the former owners of RGP of up to $4.5 million, based on the achievement of specified levels of earnings before interest, income taxes, depreciation, and amortization expense (EBITDA) and the delivery of "add-on coaching services content" for our AAP as set forth in the purchase agreement. The specified levels of EBITDA include measures for RGP coaching services plus earnings from add-on coaching services sold through the AAP. The fair value of the RGP contingent liability is estimated using a Monte Carlo simulation method, which considers numerous potential financial outcomes using estimated variables such as expected revenues, growth rates, and a discount rate. This fair value measurement is considered a Level 3 measurement because we estimate revenues and corresponding expected growth rates each period. The following range of growth rates were used to calculate the initial fair value of the contingent consideration:
|
Likely
|
Minimum
|
Maximum
|
|||||||
|
RGP growth rate - Year 1
|
14.8
|
%
|
(12.0)
|
%
|
35.0
|
%
|
|||
|
RGP growth rate - Year 2
|
10.0
|
%
|
(12.0)
|
%
|
35.0
|
%
|
|||
|
RGP growth rate - Year 3
|
10.0
|
%
|
(12.0)
|
%
|
35.0
|
%
|
|||
|
Add-on services growth rate - Year 1
|
60.0
|
%
|
(20.0)
|
%
|
130.0
|
%
|
|||
|
Add-on services growth rate - Year 2
|
50.0
|
%
|
(20.0)
|
%
|
130.0
|
%
|
|||
|
Add-on services growth rate - Year 3
|
40.0
|
%
|
(20.0)
|
%
|
130.0
|
%
|
|||
Jhana Education – On July 11, 2017, we acquired the stock of Jhana Education. The purchase price included potential contingent consideration of $7.2 million through the measurement period, which ends in July 2026. The fair value of the contingent consideration was calculated using a probability weighted expected return methodology, which is a Level 3 measurement because we estimate projected consolidated Company and AAP sales over the measurement period. Probabilities were applied to each potential sales outcome and the resulting values were discounted using a rate that considered Jhana's weighted average cost of capital and specific risk premiums associated with the potential contingent consideration.
11. STOCK-BASED COMPENSATION PLANS
Overview
We utilize various stock-based compensation plans as integral components of our overall compensation and associate retention strategy. Our shareholders have approved various stock incentive plans that permit us to grant performance awards, unvested share awards, stock options, and employee stock purchase plan (ESPP) shares. In addition, our Board of Directors and shareholders may, from time to time, approve fully vested stock awards. The Organization and Compensation Committee of the Board of Directors (the Compensation Committee) has responsibility for the approval and oversight of our stock-based compensation plans.
On January 23, 2015, our shareholders approved the 2015 Omnibus Incentive Plan (the 2015 Plan), which authorized 1.0 million shares of common stock for issuance to employees and members of the Board of
Directors as stock-based payments. A more detailed description of the 2015 Plan is set forth in our Definitive Proxy Statement filed with the SEC on December 22, 2014. At August 31, 2018, the 2015 Plan had approximately 254,000 shares available for future grants.
At the annual meeting of shareholders held on January 26, 2018, our shareholders approved the Franklin Covey Co. 2017 Employee Stock Purchase Plan (the 2017 ESPP). The 2017 ESPP replaced the Franklin Covey Co. 2004 Employee Stock Purchase Plan, which previously expired. The 2017 ESPP authorized an additional 1.0 million shares, subject to certain adjustments, of our common stock for issuance to ESPP participants. For further information regarding the 2017 ESPP, including the full text of the 2017 ESPP, please refer to our definitive Proxy Statement as filed with the SEC on December 22, 2017. At August 31, 2018, the 2017 ESPP had approximately 946,000 shares remaining for purchase by plan participants.
The total compensation expense of our stock-based compensation plans was as follows (in thousands):
|
YEAR ENDED
|
||||||||||||
|
AUGUST 31,
|
2018
|
2017
|
2016
|
|||||||||
|
Performance awards
|
$
|
2,034
|
$
|
2,902
|
$
|
2,492
|
||||||
|
Unvested stock awards
|
642
|
500
|
450
|
|||||||||
|
Fully vested stock awards
|
15
|
135
|
60
|
|||||||||
|
Compensation cost of the ESPP
|
155
|
121
|
119
|
|||||||||
|
$
|
2,846
|
$
|
3,658
|
$
|
3,121
|
|||||||
The compensation expense of our stock-based compensation plans was included in selling, general, and administrative expenses in the accompanying consolidated statements of operations, and no stock-based compensation was capitalized during fiscal years 2018, 2017, or 2016. We recognize forfeitures of stock-based compensation instruments as they occur. During fiscal 2018, we issued 311,898 shares of our common stock from shares held in treasury for various stock-based compensation plans. Our stock-based compensation plans allow shares to be withheld from the award to pay statutory income tax liabilities. We withheld 104,699 shares of our common stock (Note 9) for statutory income taxes during fiscal 2018.
The following is a description of our stock-based compensation plans.
Performance Awards
The Compensation Committee has awarded various performance-based stock compensation awards to members of our senior management as long-term incentive plan (LTIP) compensation. These awards vest to the participants based upon the achievement of specified performance criteria. Compensation expense is recognized as we determine it is probable that the shares will vest. Adjustments to compensation expense to reflect the timing of and the number of shares expected to be awarded are made on a cumulative basis at the date of the adjustment. We reevaluate the likelihood of shares vesting under performance awards at each reporting date.
Due to the significant change in our business resulting from sales of the All Access Pass, on October 18, 2016, the Compensation Committee approved a modification to the fiscal 2012 through fiscal 2016 performance awards to include the change in deferred revenue, less certain costs, in adjusted earnings before interest, taxes, depreciation, and amortization (Adjusted EBITDA) in the vesting calculations. Our share price on October 18, 2016 was less than the share prices used to recognize stock-based compensation expense on the fiscal 2012 through fiscal 2015 performance awards and no incremental stock-based compensation expense was recognized from this modification for those awards. The incremental compensation expense recorded in fiscal 2017 as a result of this modification for the fiscal 2016 LTIP award was approximately $0.6 million.
The following is a description of our performance-based LTIP awards as of August 31, 2018.
Fiscal 2018 LTIP Award – On November 14, 2017, the Compensation Committee granted a new performance-based LTIP award to our executive officers and members of senior management. The fiscal 2018 LTIP award has three tranches, which consist of the following: 1) shares that vest after three years of service; 2) the achievement of certain levels of fiscal 2020 qualified Adjusted EBITDA; and 3) fiscal 2020 subscription service sales. Twenty-five percent of a participant's award vests after three years of service, and the number of shares awarded in this tranche will not fluctuate based on the described financial measures. The number of shares granted in this tranche totals 42,883 shares. The remaining two tranches of the award are divided between the achievement of certain levels of Adjusted EBITDA and subscription sales recognized in fiscal 2020. The number of shares that will vest to participants for these two tranches is variable and may be 50 percent of the award (minimum award threshold) up to 200 percent of the participant's award (maximum threshold). The maximum number of shares that may be awarded in connection with these tranches totals 257,300 shares. The fiscal 2018 LTIP has a three-year life and expires on August 31, 2020.
Fiscal 2017 LTIP Award – On October 18, 2016, the Compensation Committee granted performance-based awards for our executive officers and members of senior management. A total of 183,381 shares may be earned by the participants based on six individual vesting conditions that are divided into two performance measures, trailing four-quarter Adjusted EBITDA and trailing four-quarter gross All Access Pass sales. As of August 31, 2018, four tranches of this award have vested, totaling 97,803 shares. The 2017 LTIP has a six-year life and expires on August 31, 2022.
Fiscal 2016 LTIP Award – The fiscal 2016 LTIP was granted on November 12, 2015, to our executive officers and members of senior management. A total of 231,276 shares may be awarded to the participants based on six individual vesting conditions that are divided into two performance measures, trailing four-quarter Adjusted EBITDA and increased sales of Organizational Development Suite (OD Suite) offerings. The OD Suite is defined as Leadership, Productivity, and Trust practice sales. As of August 31, 2018, four tranches of the fiscal 2016 LTIP have vested to participants, totaling 123,348 shares. The 2016 LTIP has a six-year life and expires on August 31, 2021.
Fiscal 2015 LTIP Award – During fiscal 2015, the Compensation Committee granted a performance-based award for our executive officers and certain members of senior management. A total of 112,464 shares may be awarded to the participants based on six individual vesting conditions that are divided into two performance measures, trailing four-quarter Adjusted EBITDA and increased sales of OD Suite sales as described above. As of August 31, 2018, a total of 59,980 shares, or four tranches, of the fiscal 2015 LTIP have vested to participants. The 2015 LTIP has a six-year life and expires on August 31, 2020.
Fiscal 2014 LTIP Award – During the first quarter of fiscal 2014, the Compensation Committee granted performance-based equity awards to our executive officers. A total of 89,418 shares may be awarded to the participants based on six individual vesting conditions that are divided into two performance measures, trailing four-quarter Adjusted EBITDA and trailing four-quarter increased sales of courses related to The 7 Habits of Highly Effective People. As of August 31, 2018, four tranches of the fiscal 2014 LTIP, totaling 47,690 shares, have vested to participants. The fiscal 2014 LTIP has a six-year life and expires on August 31, 2019.
Fiscal 2013 LTIP Award – During fiscal 2013, the Compensation Committee granted a performance-based equity award for the Chief Executive Officer (CEO), Chief Financial Officer, and the Chief People Officer. A total of 68,085 shares may be issued to the participants based on six individual vesting conditions that are divided into two performance measures, trailing four-quarter Adjusted EBITDA and Productivity Practice sales. As of August 31, 2018, three tranches of the fiscal 2013 LTIP award, or 38,582 shares, have vested to participants. The fiscal 2013 LTIP award had a six-year life that ended on August 31, 2018, and the remaining award tranches totaling 29,503 shares expired unvested to the participants.
Unvested Stock Awards
The annual Board of Director unvested stock award, which is administered under the terms of the Franklin Covey Co. 2015 Omnibus Incentive Plan, is designed to provide our non-employee directors, who are not eligible to participate in our employee stock purchase plan, an opportunity to obtain an interest in the Company through the acquisition of shares of our common stock. Each eligible director is entitled to receive a whole-share grant equal to $100,000 with a one-year vesting period, which is generally granted in January (following the Annual Shareholders' Meeting) of each year. Shares granted under the terms of this annual award may not be voted or participate in any common stock dividends until they are vested.
Under the terms of this program, we issued 23,338 shares, 29,834 shares, and 25,032 shares of our common stock to eligible members of the Board of Directors during the fiscal years ended August 31, 2018, 2017, and 2016. The fair value of shares awarded to the directors was $0.7 million in fiscal 2018 and $0.5 million in each of fiscal 2017 and fiscal 2016 as calculated on the grant date of the awards. The corresponding compensation cost is recognized over the vesting period of the awards, which is one year. The cost of the common stock issued from treasury for these awards was $0.3 million in fiscal 2018, $0.4 million in fiscal 2017, and $0.3 million in fiscal 2016. The following information applies to our unvested stock awards for the fiscal year ended August 31, 2018:
|
Weighted-
|
||||||||
|
Average Grant-
|
||||||||
|
Date Fair
|
||||||||
|
Number of
|
Value Per
|
|||||||
|
Shares
|
Share
|
|||||||
|
Unvested stock awards at
|
||||||||
|
August 31, 2017
|
29,834
|
$
|
17.60
|
|||||
|
Granted
|
23,338
|
30.00
|
||||||
|
Forfeited
|
-
|
-
|
||||||
|
Vested
|
(29,834
|
)
|
17.60
|
|||||
|
Unvested stock awards at
|
||||||||
|
August 31, 2018
|
23,338
|
$
|
30.00
|
|||||
At August 31, 2018, there was $0.2 million of unrecognized compensation cost related to unvested stock awards, which is expected to be recognized over the remaining weighted-average vesting period of four months. The total recognized income tax benefit from unvested stock awards totaled $0.2 million in fiscal 2018, $0.2 million for fiscal 2017, and $0.1 million in fiscal 2016. The intrinsic value of our unvested stock awards at August 31, 2018 was $0.6 million.
Stock Options
We have an incentive stock option plan whereby options to purchase shares of our common stock may be issued to key employees at an exercise price not less than the fair market value of the Company's common stock on the date of grant. Information related to our stock option activity during the fiscal year ended August 31, 2018 is presented below:
|
Weighted
|
||||||||||||||||
|
Weighted
|
Average
|
|||||||||||||||
|
Avg. Exercise
|
Remaining
|
Aggregate
|
||||||||||||||
|
Number of
|
Price Per
|
Contractual
|
Intrinsic Value
|
|||||||||||||
|
Stock Options
|
Share
|
Life (Years)
|
(thousands)
|
|||||||||||||
|
Outstanding at August 31, 2017
|
568,750
|
$
|
11.67
|
|||||||||||||
|
Granted
|
-
|
-
|
||||||||||||||
|
Exercised
|
-
|
-
|
||||||||||||||
|
Forfeited
|
-
|
-
|
||||||||||||||
|
Outstanding at August 31, 2018
|
568,750
|
$
|
11.67
|
1.8
|
$
|
7,923
|
||||||||||
|
Options vested and exercisable at
|
||||||||||||||||
|
August 31, 2018
|
568,750
|
$
|
11.67
|
1.8
|
$
|
7,923
|
||||||||||
During fiscal 2017, we had 62,500 stock options exercised on a net share basis, which had an intrinsic value of $0.5 million. At August 31, 2018, there was no remaining unrecognized compensation expense related to our stock options and no options were exercised during either fiscal 2018 or 2016.
The following additional information applies to our stock options outstanding at August 31, 2018:
|
Weighted
|
||||||||||||||||||||||
|
Number
|
Average
|
Options
|
||||||||||||||||||||
|
Outstanding
|
Remaining
|
Weighted
|
Exercisable at
|
Weighted
|
||||||||||||||||||
|
at August 31,
|
Contractual
|
Average
|
August 31,
|
Average
|
||||||||||||||||||
|
Exercise Prices
|
2018
|
Life (Years)
|
Exercise Price
|
2018
|
Exercise Price
|
|||||||||||||||||
|
$
|
9.00
|
62,500
|
2.4
|
$
|
9.00
|
62,500
|
$
|
9.00
|
||||||||||||||
|
$
|
10.00
|
168,750
|
1.8
|
$
|
10.00
|
168,750
|
$
|
10.00
|
||||||||||||||
|
$
|
12.00
|
168,750
|
1.8
|
$
|
12.00
|
168,750
|
$
|
12.00
|
||||||||||||||
|
$
|
14.00
|
168,750
|
1.8
|
$
|
14.00
|
168,750
|
$
|
14.00
|
||||||||||||||
|
568,750
|
568,750
|
|||||||||||||||||||||
Fully Vested Stock Awards
We have a stock-based incentive program that is designed to reward our client partners and training consultants for exceptional long-term performance. The program grants shares of our common stock with a total value of $15,000 to each client partner who has sold over $20.0 million in cumulative sales and to each training consultant who has delivered over 1,500 days of training during their career. During fiscal 2018, one individual qualified for this award; nine individuals qualified for this award in fiscal 2017; and four individuals qualified for this award in fiscal 2016.
Employee Stock Purchase Plan
We have an employee stock purchase plan that offers qualified employees the opportunity to purchase shares of our common stock at a price equal to 85 percent of the average fair market value of our common stock on the last trading day of each quarter. We issued a total of 40,941 shares, 43,199 shares, and 49,375 shares to ESPP participants during the fiscal years ended August 31, 2018, 2017, and 2016, which had a corresponding cost basis of $0.6 million, $0.6 million, and $0.7 million, respectively. We received cash proceeds for these shares from ESPP participants totaling $0.8 million in fiscal 2018 and $0.7 million in each of the fiscal years ended August 31, 2017 and 2016.
| 12. |
CONTRACT TERMINATION AND RESTRUCTURING COSTS
|
Contract Termination Costs
During fiscal 2017, we entered into a new 10-year license agreement for Education practice content in a foreign country, with minimum required royalties payable to us totaling approximately $13 million (at current exchange rates) over the life of the arrangement. Under a previously existing profit-sharing agreement, we would have been obligated to pay one-third of the new minimum royalty stream plus one-third of any royalties in excess of the contractual minimums to the licensee that owns the rights for that country. In exchange for a $1.5 million cash payment, we terminated the previously existing profit-sharing agreement and we will not owe any further profit sharing-payments to the international licensee. Based on the guidance for contract termination costs, we expensed the $1.5 million payment during fiscal 2017.
Restructuring Costs
Fiscal 2017 Restructuring Costs
During the third quarter of fiscal 2017, we determined to exit the publishing business in Japan and restructured our U.S./Canada direct office operations in order to support new sales and renewals of the All Access Pass. We expensed $3.6 million related to these changes during fiscal 2017 as described below. The majority of these costs were attributable to our Direct Offices segment.
Exit Japan Publishing Business
Due to a change in strategy designed to focus resources and efforts on sales of the All Access Pass in Japan, and declining sales and profitability of the publishing business, we decided to exit the publishing business in Japan. As a result of this determination, we wrote off the majority of our book inventory located in Japan for $2.1 million, which was recorded as a component of product cost of sales in the accompanying consolidated statements of operations for fiscal 2017.
U.S./Canada Direct Office Restructuring
We restructured the operations of our U.S/Canada direct offices to create new smaller regional teams which are focused on selling the All Access Pass, helping clients strategically implement the AAP, and providing services to further develop long-term client relationships. Accordingly, we determined that our three remaining sales offices located in Atlanta, Georgia; Irvine, California; and Chicago, Illinois were unnecessary since most client partners work from home-based offices; restructured the operations of the Sales Performance and Winning Customer Loyalty Practices; and eliminated certain functions to reduce costs in future periods. The $1.5 million restructuring charge associated with these operational changes was comprised of the following (in thousands):
|
Description
|
Amount
|
|||
|
Severance costs
|
$
|
986
|
||
|
Office closure costs
|
496
|
|||
|
$
|
1,482
|
|||
As of August 31, 2018 and August 31, 2017, we had accrued office closure costs totaling $0.1 million and $0.5 million, which are included as components of accrued liabilities on the accompanying consolidated balance sheets. All of the severance costs associated with this restructuring plan were paid as of August 31, 2017.
Fiscal 2016 Restructuring Costs
In the fourth quarter of fiscal 2016, we restructured the operations of certain of our domestic sales offices. The cost of this restructuring was $0.4 million and was primarily comprised of employee severance costs, which were paid in August and September 2016.
We also restructured the operations of our Australian direct office. The restructuring was designed to reduce ongoing operating costs by closing the sales offices in Brisbane, Sydney, and Melbourne, and by reducing headcount for administrative and certain sales support functions. Our remaining sales and support personnel in Australia now work from home offices, similar to many of our sales personnel located in the U.S. and Canada. The Australia office restructure cost $0.4 million and was primarily comprised of office closure costs, including remaining lease expense on the offices that were closed, and for employee severance costs. The severance costs included in the restructuring charge totaled less than $40,000. As of August 31, 2017 substantially all of the remaining accrued restructuring costs were paid.
| 13. |
EMPLOYEE BENEFIT PLANS
|
Profit Sharing Plans
We have defined contribution profit sharing plans for our employees that qualify under Section 401(k) of the Internal Revenue Code. These plans provide retirement benefits for employees meeting minimum age and service requirements. Qualified participants may contribute up to 75 percent of their gross wages, subject to certain limitations. These plans also provide for matching contributions to the participants that are paid by the Company. The matching contributions, which were expensed as incurred, totaled $2.1 million, $1.9 million, and $1.9 million during the fiscal years ended August 31, 2018, 2017, and 2016. We do not sponsor or participate in any defined-benefit pension plans.
Non-Qualified Deferred Compensation Plan
We had a non-qualified deferred compensation (NQDC) plan that provided certain key officers and employees the ability to defer a portion of their compensation until a later date. Deferred compensation amounts used to pay benefits were held in a "rabbi trust," which invested in insurance contracts, various mutual funds, and shares of our common stock as directed by the plan participants. However, due to legal changes resulting from the American Jobs Creation Act of 2004, we determined to cease compensation deferrals to the NQDC plan after December 31, 2004. Following the cessation of deferrals to the NQDC plan, the number of participants remaining in the plan declined steadily, and our Board of Directors decided to partially terminate the NQDC plan. Following this decision, all of the plan's assets were liquidated, the plan's liabilities were paid, and the only remaining items in the NQDC plan are shares of our common stock owned by the remaining plan participants. At August 31, 2018 and 2017, the cost basis of the shares of our common stock held by the rabbi trust was $0.2 million and $0.4 million. Shares of our common stock held in the rabbi trust are included as components of treasury stock on the accompanying consolidated balance sheets.
| 14. |
INCOME TAXES
|
Our benefit (provision) for income taxes consisted of the following (in thousands):
|
YEAR ENDED
|
||||||||||||
|
AUGUST 31,
|
2018
|
2017
|
2016
|
|||||||||
|
Current:
|
||||||||||||
|
Federal
|
$
|
29
|
$
|
69
|
$
|
(380
|
)
|
|||||
|
State
|
210
|
(71
|
)
|
(197
|
)
|
|||||||
|
Foreign
|
(2,947
|
)
|
(2,320
|
)
|
(2,553
|
)
|
||||||
|
(2,708
|
)
|
(2,322
|
)
|
(3,130
|
)
|
|||||||
|
Deferred:
|
||||||||||||
|
Federal
|
1,426
|
(1,227
|
)
|
(1,584
|
)
|
|||||||
|
State
|
(314
|
)
|
(17
|
)
|
70
|
|||||||
|
Foreign
|
(281
|
)
|
468
|
50
|
||||||||
|
Operating loss carryforward
|
2,636
|
6,964
|
-
|
|||||||||
|
Adjustment for changes in U.S.
|
||||||||||||
|
income tax rates
|
1,654
|
-
|
-
|
|||||||||
|
Valuation allowance
|
(2,780
|
)
|
(129
|
)
|
(301
|
)
|
||||||
|
2,341
|
6,059
|
(1,765
|
)
|
|||||||||
|
$
|
(367
|
)
|
$
|
3,737
|
$
|
(4,895
|
)
|
|||||
The allocation of our total income tax benefit (provision) is as follows (in thousands):
|
YEAR ENDED
|
||||||||||||
|
AUGUST 31,
|
2018
|
2017
|
2016
|
|||||||||
|
Net income (loss)
|
$
|
(367
|
)
|
$
|
3,737
|
$
|
(4,895
|
)
|
||||
|
Other comprehensive income
|
(75
|
)
|
37
|
115
|
||||||||
|
$
|
(442
|
)
|
$
|
3,774
|
$
|
(4,780
|
)
|
|||||
Income (loss) before income taxes consisted of the following (in thousands):
|
YEAR ENDED
|
||||||||||||
|
AUGUST 31,
|
2018
|
2017
|
2016
|
|||||||||
|
United States
|
$
|
(8,960
|
)
|
$
|
(10,126
|
)
|
$
|
9,328
|
||||
|
Foreign
|
3,440
|
(783
|
)
|
2,583
|
||||||||
|
$
|
(5,520
|
)
|
$
|
(10,909
|
)
|
$
|
11,911
|
|||||
The differences between income taxes at the statutory federal income tax rate and the consolidated income tax rate reported in our consolidated statements of operations were as follows:
|
YEAR ENDED
AUGUST 31,
|
2018
|
2017
|
2016
|
|||||||||
|
Federal statutory income tax rate
|
25.7
|
%
|
35.0
|
%
|
(35.0
|
)%
|
||||||
|
State income taxes, net of federal effect
|
2.6
|
2.3
|
(1.9
|
)
|
||||||||
|
Effect of change in U.S. federal tax rate
|
30.0
|
-
|
-
|
|||||||||
|
Valuation allowance
|
(50.4
|
)
|
(1.2
|
)
|
(2.5
|
)
|
||||||
|
Foreign jurisdictions tax differential
|
(6.8
|
)
|
(1.9
|
)
|
0.6
|
|||||||
|
Tax differential on income subject to both U.S. and foreign taxes
|
2.3
|
0.4
|
(1.9
|
)
|
||||||||
|
Uncertain tax positions
|
(5.1
|
)
|
4.4
|
0.4
|
||||||||
|
Non-deductible executive compensation
|
(2.7
|
)
|
(1.6
|
)
|
-
|
|||||||
|
Non-deductible meals and entertainment
|
(8.9
|
)
|
(2.2
|
)
|
(1.6
|
)
|
||||||
|
Payout of deferred compensation (NQDC)
|
4.4
|
-
|
-
|
|||||||||
|
Other
|
2.2
|
(0.9
|
)
|
0.8
|
||||||||
|
(6.7
|
)%
|
34.3
|
%
|
(41.1
|
)%
|
|||||||
The Tax Cut and Jobs Act (the 2017 Tax Act) was signed into law on December 22, 2017. The 2017 Tax Act significantly revises the U.S. corporate income tax code by, among other things, lowering the statutory corporate tax rate from 35 percent to 21 percent; eliminating certain deductions; imposing a mandatory one-time transition tax, or deemed repatriation tax, on accumulated earnings of foreign subsidiaries as of 2017 that were previously tax deferred; introducing new tax regimes; and changing how foreign earnings are subject to U.S. tax.
Since we have an August 31 fiscal year end, the lower corporate income tax rate is phased in, resulting in a U.S. statutory federal rate of 25.7 percent for fiscal 2018 and 21 percent rate for subsequent fiscal years. Other provisions of the 2017 Tax Act will not be effective for us until fiscal 2019, including limitations on the deductibility of interest and executive compensation as well as anti-deferral provisions on Global Intangible Low-Taxed Income.
We have completed our accounting for the effects of the 2017 Tax Act and recorded income tax benefits totaling $1.7 million during fiscal 2018, including a one-time income tax benefit of $0.9 million as of the date of enactment. We recognized $0.8 million of the one-time benefit from re-measuring our net deferred tax liabilities at the reduced U.S. federal tax rate and $0.2 million of the benefit from other changes enacted by the 2017 Tax Act. These benefits were partially offset by $0.1 million of expense from the deemed repatriation of accumulated earnings from our foreign subsidiaries.
On September 1, 2017, we adopted the provisions of ASU 2016-09, which requires that the benefits of deductions resulting from stock-based compensation in excess of the corresponding book expense be recorded as a component of our income tax provision or benefit for the period, instead of being recorded to additional paid-in capital. We recorded an immaterial amount of income tax expense in fiscal 2018 for stock-based compensation deductions that were less than the corresponding book expense. We recorded $0.2 million to paid-in capital in fiscal 2017 for excess tax deductions and an insignificant deduction against paid-in capital during fiscal 2016 for the shortfall in tax deductions related to stock-based compensation.
The significant components of our deferred tax assets and liabilities were comprised of the following (in thousands):
|
AUGUST 31,
|
2018
|
2017
|
||||||
|
Deferred income tax assets:
|
||||||||
|
Net operating loss carryforward
|
$
|
9,039
|
$
|
10,310
|
||||
|
Sale and financing of corporate
|
||||||||
|
headquarters
|
4,919
|
8,420
|
||||||
|
Foreign income tax credit
|
||||||||
|
carryforward
|
6,562
|
4,382
|
||||||
|
Stock-based compensation
|
1,174
|
2,954
|
||||||
|
Inventory and bad debt reserves
|
1,046
|
1,643
|
||||||
|
Bonus and other accruals
|
1,511
|
1,574
|
||||||
|
Deferred revenue
|
236
|
510
|
||||||
|
Other
|
323
|
337
|
||||||
|
Total deferred income tax assets
|
24,810
|
30,130
|
||||||
|
Less: valuation allowance
|
(3,397
|
)
|
(612
|
)
|
||||
|
Net deferred income tax assets
|
21,413
|
29,518
|
||||||
|
Deferred income tax liabilities:
|
||||||||
|
Intangibles step-ups – indefinite lived
|
(5,427
|
)
|
(8,539
|
)
|
||||
|
Intangibles step-ups – finite lived
|
(4,103
|
)
|
(7,607
|
)
|
||||
|
Intangible asset impairment and
|
||||||||
|
amortization
|
(3,023
|
)
|
(4,875
|
)
|
||||
|
Property and equipment depreciation
|
(3,518
|
)
|
(4,960
|
)
|
||||
|
Deferred commissions
|
(1,596
|
)
|
(2,195
|
)
|
||||
|
Unremitted earnings of foreign
|
||||||||
|
subsidiaries
|
(380
|
)
|
(492
|
)
|
||||
|
Other
|
(354
|
)
|
(236
|
)
|
||||
|
Total deferred income tax liabilities
|
(18,401
|
)
|
(28,904
|
)
|
||||
|
Net deferred income taxes
|
$
|
3,012
|
$
|
614
|
||||
Deferred income tax amounts are recorded as follows in our consolidated balance sheets (in thousands):
|
AUGUST 31,
|
2018
|
2017
|
||||||
|
Long-term assets
|
$
|
3,222
|
$
|
1,647
|
||||
|
Long-term liabilities
|
(210
|
)
|
(1,033
|
)
|
||||
|
Net deferred income tax asset
|
$
|
3,012
|
$
|
614
|
||||
As of August 31, 2016, we had utilized all of our U.S. federal net operating loss carryforwards. However, we incurred a federal net operating loss of $16.4 million in fiscal 2017 and acquired a federal net operating loss carryforward of $7.7 million in connection with the purchase of the stock of Jhana Education (Note 2) in fiscal 2017. During fiscal 2018, we incurred a federal net operating loss of $9.7 million. Our U.S. federal net operating loss carryforwards were comprised of the following at August 31, 2018 (in thousands):
|
Loss Carryforward
|
Loss
|
Loss
|
Operating
|
||||||||||||||
|
Loss Carryforward
|
Expires
|
Deductions
|
Deductions
|
Loss Carried
|
|||||||||||||
|
for Year Ended
|
August 31,
|
Amount
|
in Prior Years
|
in Current Year
|
Forward
|
||||||||||||
|
December 31, 2012
|
2031
|
$
|
243
|
$
|
-
|
$
|
-
|
$
|
243
|
||||||||
|
December 31, 2013
|
2032
|
553
|
-
|
-
|
553
|
||||||||||||
|
December 31, 2014
|
2033
|
1,285
|
-
|
-
|
1,285
|
||||||||||||
|
December 31, 2015
|
2034
|
1,491
|
-
|
-
|
1,491
|
||||||||||||
|
December 31, 2016
|
2035
|
3,052
|
-
|
-
|
3,052
|
||||||||||||
|
July 15, 2017 Acquired NOL
|
2036
|
1,117
|
-
|
-
|
1,117
|
||||||||||||
|
|
7,741
|
-
|
-
|
7,741
|
|||||||||||||
|
August 31, 2017
|
2037
|
16,381
|
-
|
-
|
16,381
|
||||||||||||
|
August 31, 2018
|
No expiration
|
9,677
|
-
|
-
|
9,677
|
||||||||||||
|
$
|
33,799
|
$
|
-
|
$
|
-
|
$
|
33,799
|
||||||||||
We have U.S. state net operating loss carryforwards generated in fiscal 2009 and before in various jurisdictions that expire primarily between September 1, 2018 and August 31, 2029. The U.S. state net operating loss carryforwards generated in fiscal 2017 and fiscal 2018 primarily expire on August 31, 2037 and 2038, respectively. The state net operating loss carryforwards acquired through the purchase of Jhana Education stock expire between August 31, 2031 and August 31, 2036.
Our U.S. foreign income tax credit carryforwards were comprised of the following at August 31, 2018 (in thousands):
|
Credit Generated in
|
Credits Used
|
Credits Used
|
Credits
|
||||||||||||||
|
Fiscal Year Ended
|
Credit Expires
|
Credits
|
in Prior
|
in Fiscal
|
Carried
|
||||||||||||
|
August 31,
|
August 31,
|
Generated
|
Years
|
2018
|
Forward
|
||||||||||||
|
2011
|
2021
|
$
|
3,445
|
$
|
(414
|
)
|
$
|
-
|
$
|
3,031
|
|||||||
|
2012
|
2022
|
2,563
|
(2,563
|
)
|
-
|
-
|
|||||||||||
|
2013
|
2023
|
2,815
|
(2,815
|
)
|
-
|
-
|
|||||||||||
|
2014
|
2024
|
1,378
|
(1,378
|
)
|
-
|
-
|
|||||||||||
|
2015
|
2025
|
1,422
|
(1,422
|
)
|
-
|
-
|
|||||||||||
|
2016
|
2026
|
1,569
|
(1,569
|
)
|
-
|
-
|
|||||||||||
|
2017
|
2027
|
1,804
|
-
|
-
|
1,804
|
||||||||||||
|
2018
|
2028
|
1,727
|
-
|
- |
1,727
|
||||||||||||
|
$
|
16,723
|
$
|
(10,161
|
)
|
$
|
-
|
$
|
6,562
|
|||||||||
In fiscal 2018, we established a valuation allowance of $3.0 million against our foreign tax credit carryforward from fiscal 2011, after concluding it is more likely than not that the carryforward will expire unused at the end of fiscal 2021. Our emphasis of the All Access Pass has generated, and will likely continue to generate, substantial amounts of deferred revenue for both book and tax purposes. This situation has produced taxable losses for the past two fiscal years and a more-likely-than-not presumption that insufficient taxable income will be available to realize the fiscal 2011 foreign tax carryforward, which expires at the end of fiscal 2021.
During the year ended August 31, 2016, we determined it was more likely than not that deferred tax assets of a foreign subsidiary would not be realized. Accordingly, we recorded a $0.3 million valuation allowance against these deferred tax assets in fiscal 2016. During fiscal 2017, we increased this valuation allowance by $0.1 million to $0.4 million, which reduced our income tax benefit for the year by $0.1 million. During fiscal 2018, we reduced this valuation allowance by $0.2 million, which increased our income tax benefit for the year by $0.2 million.
We acquired federal and state net operating loss carryforwards in connection with the purchase of Jhana Education stock during fiscal 2017. Section 382 of the Internal Revenue Code limits our ability to use these acquired losses. Accordingly, we recorded valuation allowances in the amount of $0.2 million against the related deferred tax assets. Our income tax benefit for fiscal 2017 was unaffected by this valuation allowance. The reduction of the federal income tax rate under the 2017 Tax Act reduced this valuation allowance by $0.1 million and resulted in a corresponding increase to our income tax benefit during fiscal 2018.
We have determined that projected future taxable income is adequate to allow for realization of all deferred tax assets, except for the assets subject to valuation allowances. We considered sources of taxable income, including reversals of taxable temporary differences, future taxable income exclusive of reversing temporary differences and carryforwards, and reasonable, practical tax-planning strategies to generate additional taxable income. Based on the factors described above, we concluded that realization of our deferred tax assets, except those subject to the valuation allowances described above, is more likely than not at August 31, 2018.
A reconciliation of the beginning and ending amount of gross unrecognized tax benefits is as follows (in thousands):
|
YEAR ENDED
|
||||||||||||
|
AUGUST 31,
|
2018
|
2017
|
2016
|
|||||||||
|
Beginning balance
|
$
|
2,359
|
$
|
3,024
|
$
|
3,115
|
||||||
|
Additions based on tax positions
|
||||||||||||
|
related to the current year
|
27
|
10
|
199
|
|||||||||
|
Additions for tax positions in
|
||||||||||||
|
prior years
|
367
|
85
|
3
|
|||||||||
|
Reductions for tax positions of prior
|
||||||||||||
|
years resulting from the lapse of
|
||||||||||||
|
applicable statute of limitations
|
(253
|
)
|
(634
|
)
|
(212
|
)
|
||||||
|
Other reductions for tax positions of
|
||||||||||||
|
prior years
|
(389
|
)
|
(126
|
)
|
(81
|
)
|
||||||
|
Ending balance
|
$
|
2,111
|
$
|
2,359
|
$
|
3,024
|
||||||
The total amount of unrecognized tax benefits that, if recognized, would affect the effective tax rate is $1.8 million at August 31, 2018, and $1.6 million at August 31, 2017. Included in the ending balance of gross unrecognized tax benefits at August 31, 2018 is $1.8 million related to individual states' net operating loss carryforwards. Interest and penalties related to uncertain tax positions are recognized as components of income tax expense. The net accruals and reversals of interest and penalties increased or decreased our income tax expense by an insignificant amount in each of fiscal 2018, fiscal 2017 and fiscal 2016. The balance of interest and penalties included in other long-term liabilities on our consolidated balance sheets at August 31, 2018 and 2017 was $0.2 million and $0.3 million, respectively.
During the next 12 months, we expect a decrease in unrecognized tax benefits totaling $0.2 million relating to non-deductible expenses and state net operating loss deductions upon the lapse of the applicable statute of limitations.
We file United States federal income tax returns as well as income tax returns in various states and foreign jurisdictions. The tax years that remain subject to examinations for our major tax jurisdictions are shown below.
|
2011-2018
|
Canada and Australia
|
|
2013-2018
|
Japan and the United Kingdom
|
|
2014-2018
|
United States – state and local income tax
|
|
2015-2018
|
United States – federal income tax
|
|
2016-2018
|
China
|
|
2017-2018
|
Singapore
|
| 15. |
EARNINGS (LOSS) PER SHARE
|
The following is a reconciliation from basic earnings (loss) per share (EPS) to diluted EPS (in thousands, except per-share amounts).
|
YEAR ENDED
|
||||||||||||
|
AUGUST 31,
|
2018
|
2017
|
2016
|
|||||||||
|
Numerator for basic and
|
||||||||||||
|
diluted earnings per share:
|
||||||||||||
|
Net income (loss)
|
$
|
(5,887
|
)
|
$
|
(7,172
|
)
|
$
|
7,016
|
||||
|
Denominator for basic and
|
||||||||||||
|
diluted earnings per share:
|
||||||||||||
|
Basic weighted average shares
|
||||||||||||
|
outstanding
|
13,849
|
13,819
|
14,944
|
|||||||||
|
Effect of dilutive securities:
|
||||||||||||
|
Stock options and other
|
||||||||||||
|
stock-based awards
|
-
|
-
|
132
|
|||||||||
|
Diluted weighted average shares
|
||||||||||||
|
outstanding
|
13,849
|
13,819
|
15,076
|
|||||||||
|
EPS Calculations:
|
||||||||||||
|
Net income (loss) per share:
|
||||||||||||
|
Basic and diluted
|
$
|
(0.43
|
)
|
$
|
(0.52
|
)
|
$
|
0.47
|
||||
Since we incurred a net loss for the fiscal year ended August 31, 2018, no potentially dilutive securities were included in the calculation of our loss per share because the inclusion of these securities would be antidilutive. The number of dilutive securities that would have been included at August 31, 2018 was approximately 0.2 million shares. Other securities, including performance stock-based compensation instruments, may have a dilutive effect on our EPS calculation in future periods if our financial results reach specified targets (Note 11).
| 16. |
SEGMENT INFORMATION
|
Reportable Segments
Our sales are primarily comprised of training and consulting services. Consistent with changes during the first quarter of fiscal 2018 in our organization designed to promote the sale of subscription-based offerings, our internal reporting structure was revised and is now comprised of three operating segments and a corporate services group. The former Strategic Markets operating segment was absorbed by the Direct Office operating segment since its target customers and sales methodologies were essentially identical. The remaining operating segments were determined to be reportable segments under the applicable accounting guidance. The following is a brief description of our reportable segments:
|
·
|
Direct Offices – This segment includes our sales personnel that serve the United States and Canada; our international sales offices located in Japan, China, the United Kingdom, and Australia; our governmental sales channel; and our public program operations.
|
|
·
|
Education Practice – This group includes our domestic and international Education practice operations, which are focused on sales to educational institutions.
|
|
·
|
International Licensees – This segment is primarily comprised of our international licensees' royalty revenues.
|
|
·
|
Corporate and Other – Our corporate and other information includes leasing operations, shipping and handling revenues, and certain corporate administrative expenses.
|
We have determined that the Company's chief operating decision maker continues to be the CEO, and the primary measurement tool used in business unit performance analysis is Adjusted EBITDA, which may not be calculated as similarly titled amounts calculated by other companies. For reporting purposes, our consolidated Adjusted EBITDA can be calculated as our income or loss from operations excluding stock-based compensation, contract termination costs, restructuring charges, depreciation expense, amortization expense, and certain other items such as adjustments for changes in the fair value of contingent consideration liabilities from business acquisitions.
Our operations are not capital intensive and we do not own any manufacturing facilities or equipment. Accordingly, we do not allocate assets to the divisions for analysis purposes. Interest expense and interest income are primarily generated at the corporate level and are not allocated. Income taxes are likewise calculated and paid on a corporate level (except for entities that operate in foreign jurisdictions) and are not allocated for analysis purposes.
All prior period segment information has been revised to conform to our current organizational structure, assigned responsibilities, and primary internal reports. We account for our segment information on the same basis as the accompanying consolidated financial statements.
|
Sales to
|
||||||||||||
|
Fiscal Year Ended
|
External
|
Adjusted
|
||||||||||
|
August 31, 2018
|
Customers
|
Gross Profit
|
EBITDA
|
|||||||||
|
Direct offices
|
$
|
145,890
|
$
|
108,140
|
$
|
15,773
|
||||||
|
Education practice
|
45,272
|
28,654
|
3,606
|
|||||||||
|
International licensees
|
13,226
|
10,031
|
5,087
|
|||||||||
|
Total
|
204,388
|
146,825
|
24,466
|
|||||||||
|
Corporate and eliminations
|
5,370
|
1,464
|
(12,588
|
)
|
||||||||
|
Consolidated
|
$
|
209,758
|
$
|
148,289
|
$
|
11,878
|
||||||
|
Fiscal Year Ended
|
||||||||||||
|
August 31, 2017
|
||||||||||||
|
Direct offices
|
$
|
122,309
|
$
|
81,700
|
$
|
4,242
|
||||||
|
Education practice
|
44,122
|
27,916
|
7,195
|
|||||||||
|
International licensees
|
13,571
|
10,483
|
6,415
|
|||||||||
|
Total
|
180,002
|
120,099
|
17,852
|
|||||||||
|
Corporate and eliminations
|
5,254
|
2,568
|
(10,153
|
)
|
||||||||
|
Consolidated
|
$
|
185,256
|
$
|
122,667
|
$
|
7,699
|
||||||
|
Fiscal Year Ended
|
||||||||||||
|
August 31, 2016
|
||||||||||||
|
Direct offices
|
$
|
135,954
|
$
|
95,211
|
$
|
20,610
|
||||||
|
Education practice
|
40,844
|
24,513
|
5,188
|
|||||||||
|
International licensees
|
17,113
|
13,152
|
9,268
|
|||||||||
|
Total
|
193,911
|
132,876
|
35,066
|
|||||||||
|
Corporate and eliminations
|
6,144
|
2,278
|
(8,172
|
)
|
||||||||
|
Consolidated
|
$
|
200,055
|
$
|
135,154
|
$
|
26,894
|
||||||
A reconciliation of Adjusted EBITDA to consolidated net income (loss) is provided below (in thousands):
|
YEAR ENDED
|
||||||||||||
|
AUGUST 31,
|
2018
|
2017
|
2016
|
|||||||||
|
Segment Adjusted EBITDA
|
$
|
24,466
|
$
|
17,852
|
$
|
35,066
|
||||||
|
Corporate expenses
|
(12,588
|
)
|
(10,153
|
)
|
(8,172
|
)
|
||||||
|
Consolidated Adjusted EBITDA
|
11,878
|
7,699
|
26,894
|
|||||||||
|
Stock-based compensation
|
(2,846
|
)
|
(3,658
|
)
|
(3,121
|
)
|
||||||
|
Reduction (increase) in
|
||||||||||||
|
contingent consideration liabilities
|
(1,014
|
)
|
1,936
|
(1,538
|
)
|
|||||||
|
Costs to exit Japan publishing business
|
-
|
(2,107
|
)
|
-
|
||||||||
|
Contract termination costs
|
-
|
(1,500
|
)
|
-
|
||||||||
|
Restructuring costs
|
-
|
(1,482
|
)
|
(776
|
)
|
|||||||
|
ERP system implementation costs
|
(855
|
)
|
(1,404
|
)
|
(448
|
)
|
||||||
|
China office start-up costs
|
-
|
(505
|
)
|
(222
|
)
|
|||||||
|
Business acquisition costs
|
-
|
(442
|
)
|
-
|
||||||||
|
Depreciation
|
(5,161
|
)
|
(3,879
|
)
|
(3,677
|
)
|
||||||
|
Amortization
|
(5,368
|
)
|
(3,538
|
)
|
(3,263
|
)
|
||||||
|
Income (loss) from operations
|
(3,366
|
)
|
(8,880
|
)
|
13,849
|
|||||||
|
Interest income
|
104
|
223
|
115
|
|||||||||
|
Interest expense
|
(2,676
|
)
|
(2,408
|
)
|
(2,263
|
)
|
||||||
|
Accretion of discount on related
|
||||||||||||
|
party receivable
|
418
|
156
|
210
|
|||||||||
|
Income (loss) before income taxes
|
(5,520
|
)
|
(10,909
|
)
|
11,911
|
|||||||
|
Benefit (provision) for income taxes
|
(367
|
)
|
3,737
|
(4,895
|
)
|
|||||||
|
Net income (loss)
|
$
|
(5,887
|
)
|
$
|
(7,172
|
)
|
$
|
7,016
|
||||
Geographic Information
Our revenues are derived primarily from the United States. However, we also operate wholly owned offices or contract with licensees to provide our services in various countries throughout the world. Our consolidated revenues were derived from the following countries/regions (in thousands):
|
YEAR ENDED
|
||||||||||||
|
AUGUST 31,
|
2018
|
2017
|
2016
|
|||||||||
|
United States
|
$
|
151,022
|
$
|
136,206
|
$
|
155,153
|
||||||
|
Japan
|
15,670
|
14,482
|
14,997
|
|||||||||
|
China
|
14,176
|
11,552
|
3,884
|
|||||||||
|
United Kingdom
|
7,411
|
4,754
|
7,716
|
|||||||||
|
Canada
|
4,722
|
4,372
|
4,357
|
|||||||||
|
Australia
|
4,148
|
2,704
|
3,404
|
|||||||||
|
Western Europe
|
2,016
|
1,679
|
1,503
|
|||||||||
|
Brazil
|
1,285
|
1,423
|
319
|
|||||||||
|
Thailand
|
1,219
|
1,147
|
1,226
|
|||||||||
|
Mexico/Central America
|
872
|
751
|
917
|
|||||||||
|
Singapore
|
865
|
722
|
1,143
|
|||||||||
|
Middle East
|
840
|
723
|
584
|
|||||||||
|
Central/Eastern Europe
|
757
|
638
|
644
|
|||||||||
|
Denmark/Scandinavia
|
752
|
775
|
863
|
|||||||||
|
Indonesia
|
715
|
614
|
579
|
|||||||||
|
India
|
647
|
701
|
677
|
|||||||||
|
The Philippines
|
353
|
324
|
332
|
|||||||||
|
Malaysia
|
338
|
364
|
384
|
|||||||||
|
Others
|
1,950
|
1,325
|
1,373
|
|||||||||
|
$
|
209,758
|
$
|
185,256
|
$
|
200,055
|
|||||||
At August 31, 2018, we had wholly owned direct offices in Australia, China, Japan, and the United Kingdom. Our long-lived assets, excluding intangible assets, goodwill, and the long-term portion of the related party receivable were held in the following locations for the periods indicated (in thousands):
|
AUGUST 31,
|
2018
|
2017
|
||||||
|
United States/Canada
|
$
|
34,237
|
$
|
33,146
|
||||
|
Japan
|
1,450
|
2,350
|
||||||
|
China
|
581
|
301
|
||||||
|
Singapore
|
315
|
152
|
||||||
|
United Kingdom
|
276
|
240
|
||||||
|
Australia
|
250
|
466
|
||||||
|
$
|
37,109
|
$
|
36,655
|
|||||
Inter-segment sales were immaterial and were eliminated in consolidation.
| 17. |
RELATED PARTY TRANSACTIONS
|
Knowledge Capital Investment Group
Knowledge Capital Investment Group (Knowledge Capital) held a warrant to purchase 5.9 million shares of our common stock, exercised its warrant at various dates according to the terms of a fiscal 2011 exercise agreement, and received a total of 2.2 million shares of our common stock from shares held in treasury. Two members of our Board of Directors, including our CEO, have an equity interest in Knowledge Capital.
Pursuant to the warrant exercise agreement with Knowledge Capital, we filed a registration statement with the SEC on Form S-3 to register shares held by Knowledge Capital. This registration statement was declared effective on January 26, 2015. At each of August 31, 2018 and 2017, Knowledge Capital held 2.8 million shares of our common stock.
FC Organizational Products
During fiscal 2008, we joined with Peterson Partners to create a new company, FC Organizational Products, LLC (FCOP). This new company purchased substantially all of the assets of our consumer solutions business unit with the objective of expanding the worldwide sales of FCOP as governed by a comprehensive license agreement between us and FCOP. On the date of the sale closing, we invested approximately $1.8 million to purchase a 19.5 percent voting interest in FCOP, and made a $1.0 million priority capital contribution with a 10 percent return. At the time of the transaction, we determined that FCOP was not a variable interest entity.
As a result of FCOP's structure as a limited liability company with separate owner capital accounts, we determined that our investment in FCOP is more than minor and we are required to account for our investment in FCOP using the equity method of accounting. We have not recorded our share of FCOP's losses in the accompanying consolidated statements of operations because we have impaired and written off investment balances, as defined within the applicable accounting guidance, in previous periods in excess of our share of FCOP's losses through August 31, 2018.
Based on changes to FCOP's debt agreements and certain other factors in fiscal 2012, we reconsidered whether FCOP was a variable interest entity as defined under FASC 810, and determined that FCOP was a variable interest entity. Although the changes to the debt agreements did not modify the governing documents of FCOP, the changes were substantial enough to raise doubts regarding the sufficiency of FCOP's equity investment at risk. We further determined that we are not the primary beneficiary of FCOP because we do not have the ability to direct the activities that most significantly impact FCOP's
economic performance, which primarily consist of the day-to-day sale of planning products and related accessories, and we do not have an obligation to absorb losses or the right to receive benefits from FCOP that could potentially be significant. Our voting rights and management board representation approximate our ownership interest and we are unable to exercise control through voting interests or through other means.
The operations of FCOP are primarily financed by the sale of planning products and accessories, and our primary exposure related to FCOP is from amounts owed to us by FCOP. We receive reimbursement from FCOP for certain operating costs and rental payments for the office space that FCOP occupies. We classify our receivables from FCOP based upon expected payment. Long-term receivable balances are discounted at 15 percent, which was the estimated risk-adjusted borrowing rate of FCOP. This rate was based on a variety of factors including, but not limited to, current market interest rates for various qualities of comparable debt, discussions with FCOP's lenders, and an evaluation of the realizability of FCOP's future cash flows. Receivables from FCOP are reported as components of other current and other long-term assets based on their expected payment dates and consisted of the following (in thousands):
|
AUGUST 31,
|
2018
|
2017
|
||||||
|
Other current assets
|
$
|
1,123
|
$
|
1,020
|
||||
|
Other long-term assets
|
411
|
727
|
||||||
|
$
|
1,534
|
$
|
1,747
|
|||||
Amounts receivable from FCOP are presented net of $0.3 million discount at August 31, 2018 and net of $0.7 million discount at August 31, 2017.
CoveyLink Acquisition and Contractual Payments
During fiscal 2009, we acquired the assets of CoveyLink Worldwide, LLC (CoveyLink). CoveyLink conducts training and provides consulting based upon the book The Speed of Trust by Stephen M.R. Covey, who is the brother of one of our executive officers.
Prior to the acquisition date, CoveyLink had granted us a non-exclusive license for content related to The Speed of Trust book and related training courses for which we paid CoveyLink specified royalties. As part of the CoveyLink acquisition, an amended and restated license for intellectual property was signed that granted us an exclusive, perpetual, worldwide, transferable, royalty-bearing license to use, reproduce, display, distribute, sell, prepare derivative works of, and perform the licensed material in any format or medium and through any market or distribution channel. We are required to pay Stephen M.R. Covey royalties for the use of certain intellectual property developed by him. The amount expensed for these royalties totaled $1.8 million, $1.5 million, and $1.4 million during the fiscal years ended August 31, 2018, 2017, and 2016. As part of the acquisition of CoveyLink, we signed an amended license agreement as well as a speaker services agreement. Based on the provisions of the speakers' services agreement, we pay Stephen M.R. Covey a portion of the speaking revenues received for his presentations. We expensed $0.9 million, $1.2 million, and $1.3 million for payment on these presentations during fiscal years 2018, 2017 and 2016. We had $0.7 million accrued for these royalties and speaking fees at each of August 31, 2018 and 2017, which were included as components of accrued liabilities in our consolidated balance sheets.
Acquired License Rights for Intellectual Property
During the third quarter of fiscal 2017, we acquired the license rights for certain intellectual property owned by Higher Moment, LLC for $0.8 million. The intellectual property is in part based on works authored and developed by Dr. Clayton Christensen, a well-known author and lecturer, who is a member of our Board of Directors. However, Dr. Christensen does not have an ownership interest in Higher Moment, LLC. The initial license period is five years and the agreement may be renewed for successive five-year periods for $0.8 million at each renewal date. The agreement may be terminated by either party at any time, but if we choose to terminate the agreement prior to the third renewal date, we are required to pay $0.3 million to Higher Moment, LLC.
Other Related Party Transactions
We pay an executive officer of the Company a percentage of the royalty proceeds received from the sales of certain books authored by him in addition to his annual salary. During the fiscal years ended August 31, 2018, 2017, and 2016, we expensed $0.2 million, $0.2 million, and $0.3 million for these royalties, and we had $0.1 million accrued at each of August 31, 2018 and 2017 as payable under the terms of these arrangements. These amounts are included as components of accrued liabilities in our consolidated balance sheets.
None.
Disclosure Controls and Procedures
Disclosure controls and procedures are designed with the objective of ensuring that information required to be disclosed in the Company's reports filed under the Exchange Act, such as this report, is recorded, processed, summarized, and reported within the time periods specified in the SEC's rules and forms. Disclosure controls and procedures are also designed with the objective of ensuring that such information is accumulated and communicated to the Company's management, including the Company's Chief Executive Officer and Chief Financial Officer, as appropriate, to allow timely decisions regarding required disclosure.
Evaluation of Disclosure Controls and Procedures
An evaluation was conducted under the supervision and with the participation of our management, including the Chief Executive Officer and Chief Financial Officer, of the effectiveness of the design and operation of our disclosure controls and procedures, as defined in Rules 13a-15(e) and 15d-15(e) of the Exchange Act, as of the end of the period covered by this report.
Based on this evaluation, our Chief Executive Officer and our Chief Financial Officer concluded that, as of the end of the period covered by this report, our disclosure controls and procedures were effective.
Management's Report on Internal Control Over Financial Reporting
The management of Franklin Covey Co. is responsible for establishing and maintaining adequate internal control over financial reporting for the Company (including its consolidated subsidiaries) and all related information appearing in the Company's Annual Report on Form 10-K. The Company's internal control over financial reporting is designed to provide reasonable assurance regarding the reliability of financial reporting and the preparation of financial statements for external purposes in accordance with accounting principles generally accepted in the United States of America. Internal control over financial reporting includes those policies and procedures that:
|
1.
|
pertain to the maintenance of records that in reasonable detail accurately and fairly reflect the transactions and dispositions of our assets;
|
|
2.
|
provide reasonable assurance that the transactions are recorded as necessary to permit preparation of financial statements in accordance with generally accepted accounting principles, and that our receipts and expenditures are being made only in accordance with the authorization of management and/or of our Board of Directors; and
|
|
3.
|
provide reasonable assurance regarding the prevention or timely detection of any unauthorized acquisition, use, or disposition of our assets that could have a material effect on our financial statements.
|
Because of its inherent limitations, internal control over financial reporting may not prevent or detect misstatements. Also, projections of any evaluation of effectiveness in future periods are subject to the risk that controls may become inadequate because of changes in conditions, or that the degree of compliance with the policies or procedures may deteriorate.
Under the supervision and with the participation of our management, including our Chief Executive Officer and Chief Financial Officer, we conducted an evaluation of the effectiveness of our internal control over financial reporting using the criteria set forth in Internal Control—Integrated Framework as issued by the Committee of Sponsoring Organizations of the Treadway Commission (2013 COSO Framework). Based upon this evaluation, our management concluded that our internal control over financial reporting was effective as of the end of the period covered by this Annual Report on Form 10-K.
Our independent registered public accounting firm, Deloitte & Touche LLP, has audited the consolidated financial statements included in this annual report on Form 10-K and, as part of their audit, has issued an audit report, included herein, on the effectiveness of our internal control over financial reporting. Their report is included in Item 8 of this Report on Form 10-K.
Changes in Internal Control Over Financial Reporting
There were no changes in our internal control over financial reporting (as defined in Rule 13a-15(f) or 15d-15(f)) during the fourth quarter ended August 31, 2018 that materially affected, or are reasonably likely to materially affect, our internal controls over financial reporting.
None.
Certain information required by this Item is incorporated by reference to the sections entitled "Nominees for Election to the Board of Directors," "Section 16(a) Beneficial Ownership Reporting Compliance," "Corporate Governance," and "Board of Director Meetings and Committees" in our definitive Proxy Statement for the annual meeting of shareholders, which is scheduled to be held on January 25, 2019. The definitive Proxy Statement will be filed with the Securities and Exchange Commission pursuant to Regulation 14A of the Securities Exchange Act of 1934, as amended. Executive officer biographies may be found in Item 1, under the section entitled "Executive Officers," of this report on Form 10-K.
The Board of Directors has determined that one of the Audit Committee members, Mr. Michael Fung, is a "financial expert" as defined in Regulation S-K 407(d)(5) adopted under the Securities Exchange Act of 1934, as amended. Our Board of Directors has also determined that Mr. Fung is an "independent director" as defined by the NYSE.
We have adopted a code of ethics for our senior financial officers that include the Chief Executive Officer, the Chief Financial Officer, and other members of our financial leadership team. This code of ethics is available on our website at www.franklincovey.com. We intend to satisfy any disclosure requirements under Item 5.05 of Form 8-K regarding amendment to, or waiver from, a provision of this Code of Business Conduct and Ethics by posting such information on our web site at the address and location specified above.
The information required by this Item is incorporated by reference to the sections entitled "Compensation Discussion and Analysis," "Compensation Committee Interlocks and Insider Participation," and "Compensation Committee Report" in our definitive Proxy Statement for the annual meeting of shareholders, which is scheduled to be held on January 25, 2019.
ITEM 12. SECURITY OWNERSHIP OF CERTAIN BENEFICIAL OWNERS AND MANAGEMENT AND RELATED STOCKHOLDER MATTERS
Securities Authorized for Issuance Under Equity Compensation Plans
| [a] | [b] | [c] | ||||||||||
|
Plan Category
|
Number of securities to be issued upon exercise of outstanding options, warrants, and rights
|
Weighted-average exercise price of outstanding options, warrants, and rights
|
Number of securities remaining available for future issuance under equity compensation plans (excluding securities reflected in column [a])
|
|||||||||
|
(in thousands)
|
(in thousands)
|
|||||||||||
|
Equity compensation plans approved by security holders
|
1,129
|
(1)(2)
|
$
|
11.67
|
1,200
|
(3)(4)
|
||||||
| (1) |
Excludes 23,338 shares of unvested (restricted) stock awards that are subject to forfeiture.
|
| (2) |
Amount includes 790,143 performance share awards that may be awarded under the terms of various long-term incentive plans. The number of shares eventually awarded to participants through our long-term incentive plans is variable and based upon the achievement of specified financial goals. For performance-based compensation awards where the number of shares may fluctuate within a range based on the achievement of the specified goal, this amount includes the maximum number of shares that may be awarded to participants. The actual number of shares issued to participants therefore, may be less than the amount disclosed. The weighted average exercise price of outstanding options, warrants, and rights does not include the impact of performance awards or restricted stock units. For further information on our stock-based compensation plans, refer to the notes to our financial statements as presented in Item 8 of this report.
|
| (3) |
Amount is comprised of the remaining shares authorized in our 2015 Omnibus Incentive Plan and 2017 Employee Stock Purchase Plan. The number of performance-based plan shares expected to be awarded at August 31, 2018 may change in future periods based upon the achievement of specified goals and revisions to estimates.
|
| (4) |
At August 31, 2018, we had approximately 946,000 shares authorized for purchase by participants in our Employee Stock Purchase Plan.
|
Beneficial Ownership of Company Stock
The remaining information required by this Item is incorporated by reference to the section entitled "Principal Holders of Voting Securities" in our definitive Proxy Statement for the annual meeting of shareholders, which is scheduled to be held on January 25, 2019.
The information required by this Item is incorporated by reference to the section entitled "Certain Relationships and Related Transactions" and "Corporate Governance" in our definitive Proxy Statement for the annual meeting of shareholders, which is scheduled to be held on January 25, 2019.
The information required by this Item is incorporated by reference to the section entitled "Principal Accountant Fees" in our definitive Proxy Statement for the annual meeting of shareholders, which is scheduled to be held on January 25, 2019.
(a) List of documents filed as part of this report:
|
1.
|
Financial Statements. The consolidated financial statements of the Company and Report of Independent Registered Public Accounting Firm thereon included in the Annual Report to Shareholders on Form 10-K for the year ended August 31, 2018, are as follows:
|
Report of Independent Registered Public Accounting Firm
Consolidated Balance Sheets at August 31, 2018 and 2017
Consolidated Statements of Operations and Statements of Comprehensive Income (Loss) for the fiscal years ended August 31, 2018, 2017, and 2016
Consolidated Statements of Cash Flows for the fiscal years ended August 31, 2018, 2017, and 2016
Consolidated Statements of Shareholders' Equity for the fiscal years ended August 31, 2018, 2017, and 2016
Notes to Consolidated Financial Statements
|
2.
|
Financial Statement Schedules.
|
Other financial statement schedules are omitted because they are not required or applicable, or the required information is shown in the financial statements or notes thereto, or contained in this report.
|
3.
|
Exhibit List.
|
|
Exhibit No.
|
Exhibit
|
Incorporated By Reference
|
Filed Herewith
|
|
2.1
|
(8)
|
||
|
2.2
|
(9)
|
||
|
3.1
|
(4)
|
||
|
3.2
|
(7)
|
||
|
3.3
|
(15)
|
||
|
4.1
|
Specimen Certificate of the Registrant's Common Stock, par value $.05 per share
|
(2)
|
|
4.2
|
(3)
|
||
|
4.3
|
(3)
|
||
|
4.4
|
(4)
|
||
|
4.5
|
(4)
|
||
|
10.1*
|
Forms of Nonstatutory Stock Options
|
(1)
|
|
|
10.2
|
(5)
|
||
|
10.3
|
(5)
|
||
|
10.4
|
(6)
|
||
|
10.5
|
(10)
|
||
|
10.6
|
(10)
|
||
|
10.7
|
(10)
|
||
|
10.8
|
(10)
|
||
|
10.9
|
(10)
|
||
|
10.10
|
(11)
|
||
|
10.11
|
(11)
|
||
|
10.12*
|
(12)
|
||
|
10.13
|
(13)
|
||
|
10.14
|
(13)
|
|
10.15
|
(13)
|
||
|
10.16
|
(14)
|
||
|
10.17
|
(16)
|
||
|
10.18
|
(17)
|
||
|
10.19*
|
(18)
|
||
|
10.20
|
(19)
|
||
|
10.21
|
(20)
|
||
|
10.22*
|
(21)
|
||
|
10.23
|
(22)
|
||
|
10.24
|
(23)
|
||
|
10.25
|
(23)
|
||
|
10.26
|
(24)
|
||
|
10.27
|
(25)
|
||
|
10.28
|
(26)
|
||
|
10.29
|
(26)
|
||
|
10.30*
|
(27)
|
|
10.31
|
(28)
|
||
|
21
|
éé
|
||
|
23
|
éé
|
||
|
31.1
|
éé
|
||
|
31.2
|
éé
|
||
|
32
|
éé
|
||
|
101.INS
|
XBRL Instance Document
|
éé
|
|
|
101.SCH
|
XBRL Taxonomy Extension Schema
|
éé
|
|
|
101.CAL
|
XBRL Taxonomy Extension Calculation Linkbase
|
éé
|
|
|
101.DEF
|
XBRL Taxonomy Extension Definition Linkbase
|
éé
|
|
|
101.LAB
|
XBRL Taxonomy Extension Label Linkbase
|
éé
|
|
|
101.PRE
|
XBRL Extension Presentation Linkbase
|
éé
|
|
(1)
|
Incorporated by reference to Registration Statement on Form S-1 filed with the Commission on April 17, 1992, Registration No. 33-47283.
|
|
(2)
|
Incorporated by reference to Amendment No. 1 to Registration Statement on Form S-1 filed with the Commission on May 26, 1992, Registration No. 33-47283.
|
|
(3)
|
Incorporated by reference to Schedule 13D (CUSIP No. 534691090 as filed with the Commission on June 14, 1999). Registration No. 005-43123.
|
|
(4)
|
Incorporated by reference to Report on Form 8-K filed with the Commission on March 10, 2005.**
|
|
(5)
|
Incorporated by reference to Report on Form 8-K filed with the Commission on June 27, 2005.**
|
|
(6)
|
Incorporated by reference to Report on Form 8-K filed with the Commission on October 24, 2005.**
|
|
(7)
|
Incorporated by reference to the Definitive Proxy Statement on Form DEF 14A filed with the Commission on December 12, 2005.**
|
|
(8)
|
Incorporated by reference to Report on Form 8-K/A filed with the Commission on May 29, 2008.**
|
|
(9)
|
Incorporated by reference to Report on Form 10-Q filed July 10, 2008, for the Quarter ended May 31, 2008.**
|
|
(10)
|
Incorporated by reference to Report on Form 8-K filed with the Commission on July 11, 2008.**
|
|
(11)
|
Incorporated by reference to Report on Form 10-Q filed with the Commission on April 9, 2009.**
|
|
(12)
|
Incorporated by reference to the Definitive Proxy Statement on Form DEF 14A (Appendix A) filed with the Commission on December 15, 2010.**
|
|
(13)
|
Incorporated by reference to Report on Form 8-K filed with the Commission on March 17, 2011.**
|
|
(14)
|
Incorporated by reference to Report on Form 8-K filed with the Commission on July 28, 2011.**
|
|
(15)
|
Incorporated by reference to Report on Form 8-K filed with the Commission on February 1, 2012.**
|
|
(16)
|
Incorporated by reference to Report on Form 8-K filed with the Commission on March 15, 2012.**
|
|
(17)
|
Incorporated by reference to Report on Form 8-K filed with the Commission on June 19, 2012.**
|
|
(18)
|
Incorporated by reference to Report on Form 8-K filed with the Commission on March 14, 2012.**
|
|
(19)
|
Incorporated by reference to Report on Form 8-K filed with the Commission on March 14, 2013.**
|
|
(20)
|
Incorporated by reference to Report on Form 8-K filed with the Commission on March 27, 2013.**
|
|
(21)
|
Incorporated by reference to the Definitive Proxy Statement on Form DEF 14A (Appendix A) filed with the Commission on December 22, 2014.**
|
|
(22)
|
Incorporated by reference to Report on Form 8-K filed with the Commission on April 2, 2015.**
|
|
(23)
|
Incorporated by reference to Report on Form 8-K filed with the Commission on May 24, 2016.**
|
|
(24)
|
Incorporated by reference to Report on Form 8-K filed with the Commission on March 3, 2017.**
|
|
(25)
|
Incorporated by reference to Report on Form 8-K filed with the Commission on June 1, 2017.**
|
|
(26)
|
Incorporated by reference to Report on Form 8-K filed with the Commission on August 29, 2017.**
|
|
(27)
|
Incorporated by reference to the Definitive Proxy Statement on Form DEF 14A (Appendix A) filed with the Commission on December 22, 2017.**
|
|
(28)
|
Incorporated by reference to Report on Form 8-K filed with the Commission on August 20, 2018.**
|
éé Filed herewith and attached to this report.
* Indicates a management contract or compensatory plan or agreement.
** Registration No. 001-11107.
None.
Pursuant to the requirements of Section 13 or 15(d) of the Securities Exchange Act of 1934, the Registrant has duly caused this report to be signed on its behalf by the undersigned, thereunto duly authorized, on November 14, 2018.
FRANKLIN COVEY CO.
|
|
By:
|
/s/ Robert A. Whitman
|
|
|
|
Robert A. Whitman
Chairman and Chief Executive Officer
|
Pursuant to the requirements of the Securities Exchange Act of 1934, this report has been signed below by the following persons on behalf of the Registrant and in the capacities and on the dates indicated.
|
Signature
|
Title
|
Date
|
|
/s/ Robert A. Whitman
|
Chairman of the Board
and Chief Executive Officer
|
November 14, 2018
|
|
Robert A. Whitman
|
||
|
/s/ Anne Chow
|
Director
|
November 14, 2018
|
|
Anne Chow
|
||
|
/s/ Clayton M. Christensen
|
Director
|
November 14, 2018
|
|
Clayton M. Christensen
|
||
|
/s/ Michael Fung
|
Director
|
November 14, 2018
|
|
Michael Fung
|
||
|
/s/ Dennis G. Heiner
|
Director
|
November 14, 2018
|
|
Dennis G. Heiner
|
||
|
/s/ Donald J. McNamara
|
Director
|
November 14, 2018
|
|
Donald J. McNamara
|
||
|
/s/ Joel C. Peterson
|
Director
|
November 14, 2018
|
|
Joel C. Peterson
|
||
|
/s/ E. Kay Stepp
|
Director
|
November 14, 2018
|
|
E. Kay Stepp
|
||
|
/s/ Stephen D. Young
|
Chief Financial Officer
and Chief Accounting Officer
|
November 14, 2018
|
|
Stephen D. Young
|
104