UNITED STATES
SECURITIES AND EXCHANGE COMMISSION
Washington, D.C. 20549
Form 10-K
|
þ
|
ANNUAL REPORT PURSUANT TO SECTION 13 OR 15(d) OF THE SECURITIES EXCHANGE ACT OF 1934 FOR THE FISCAL YEAR ENDED AUGUST 31, 2016
|
|
OR
|
|
|
¨
|
TRANSITION REPORT PURSUANT TO SECTION 13 OR 15(d) OF THE SECURITIES EXCHANGE ACT OF 1934 FOR THE TRANSITION PERIOD FROM ___ TO ___
|

Franklin Covey Co.
(Exact name of registrant as specified in its charter)
|
Utah
|
1-11107
|
87-0401551
|
||
|
(State or other jurisdiction of incorporation or organization)
|
(Commission File No.)
|
(IRS Employer Identification No.)
|
2200 West Parkway Boulevard
Salt Lake City, Utah 84119-2331
(Address of principal executive offices, including zip code)
Registrant's telephone number, including area code: (801) 817-1776
Securities registered pursuant to Section 12(b) of the Act:
|
Title of Each Class
|
Name of Each Exchange on Which Registered
|
|
|
Common Stock, $.05 Par Value
|
New York Stock Exchange
|
Securities registered pursuant to Section 12(g) of the Act:
None
Indicate by check mark if the registrant is a well-known seasoned issuer, as defined in Rule 405 of the Securities Act. Yes o No þ
Indicate by check mark if the registrant is not required to file reports pursuant to Section 13 or Section 15(d) of the Act. Yes o No þ
Indicate by check mark whether the Registrant (1) has filed all reports required to be filed by Section 13 or 15(d) of the Securities Exchange Act of 1934 during the preceding 12 months (or for such shorter period that the Registrant was required to file such reports), and (2) has been subject to such filing requirements for the past 90 days. Yes þ No o
Indicate by check mark whether the registrant has submitted electronically and posted on its corporate Website, if any, every Interactive Data File required to be submitted and posted pursuant to Rule 405 of Regulation S-T (§232.405 of this chapter) during the preceding 12 months (or for such shorter period that the registrant was required to submit and post such files). Yes þ No o
Indicate by check mark if disclosure of delinquent filers pursuant to Item 405 of Regulation S-K (§229.405 of this chapter) is not contained herein, and will not be contained, to the best of Registrant's knowledge, in definitive proxy or information statements incorporated by reference in Part III of this Form 10-K or any amendment to this Form 10-K. o
Indicate by check mark whether the registrant is a large accelerated filer, an accelerated filer, a non-accelerated filer, or a smaller reporting company. See definitions of “large accelerated filer,” “accelerated filer” and “smaller reporting company” in Rule 12b-2 of the Exchange Act. (Check one):
|
Large accelerated filer
|
o
|
Accelerated filer
|
þ
|
|
Non-accelerated filer
|
o
|
(Do not check if a smaller reporting company)
|
Smaller reporting company
|
o
|
Indicate by check mark whether the registrant is a shell company (as defined in Rule 12b-2 of the Exchange Act).
Yes o No þ
As of February 26, 2016, the aggregate market value of the Registrant's Common Stock held by non-affiliates of the Registrant was approximately $172.6 million, which was based upon the closing price of $17.16 per share as reported by the New York Stock Exchange.
As of October 31, 2016, the Registrant had 13,791,937 shares of Common Stock outstanding.
DOCUMENTS INCORPORATED BY REFERENCE
Parts of the Registrant's Definitive Proxy Statement for the Annual Meeting of Shareholders, which is scheduled to be held on January 20, 2017, are incorporated by reference in Part III of this Form 10-K.
|
FranklinCovey Co.
|
|||
|
|
|||
| 2 | |||
|
Business
|
2
|
||
|
Risk Factors
|
12
|
||
|
Unresolved Staff Comments
|
22
|
||
|
Properties
|
23
|
||
|
Legal Proceedings
|
23
|
||
|
Mine Safety Disclosures
|
24
|
||
|
24
|
|||
|
Market for the Registrant’s Common Equity, Related Shareholder Matters, and Issuer Purchases of Equity Securities
|
24 | ||
|
Selected Financial Data
|
27 | ||
|
Management’s Discussion and Analysis of Financial Condition and Results of Operations
|
28 | ||
|
Quantitative and Qualitative Disclosures About Market Risk
|
52 | ||
|
Financial Statements and Supplementary Data
|
53 | ||
|
Changes in and Disagreements With Accountants on Accounting and Financial Disclosure
|
97 | ||
|
Controls and Procedures
|
97 | ||
|
Other Information
|
98 | ||
| 98 | |||
|
Directors, Executive Officers and Corporate Governance
|
98 | ||
|
Executive Compensation
|
99 | ||
|
Security Ownership of Certain Beneficial Owners and Management and Related Stockholder Matters
|
99 | ||
|
Certain Relationships and Related Transactions, and Director Independence
|
100 | ||
|
Principal Accountant Fees and Services
|
100 | ||
| 101 | |||
|
Exhibits and Financial Statement Schedules
|
101 | ||
| 106 | |||
1
PART I
Disclosure Regarding Forward-Looking Statements
This Annual Report on Form 10-K contains forward-looking statements within the meaning of Section 27A of the Securities Act of 1933 and Section 21E of the Securities Exchange Act of 1934, as amended, relating to our operations, results of operations, and other matters that are based on our current expectations, estimates, assumptions, and projections. Words such as “may,” “will,” “should,” “likely,” “anticipates,” “expects,” “intends,” “plans,” “projects,” “believes,” “estimates,” and similar expressions are used to identify these forward-looking statements. These statements are not guarantees of future performance and involve risks, uncertainties, and assumptions that are difficult to predict. Forward-looking statements are based upon assumptions as to future events that might not prove to be accurate. Actual outcomes and results could differ materially from what is expressed or forecast in these forward-looking statements. Risks, uncertainties, and other factors that might cause such differences, some of which could be material, include, but are not limited to, the factors discussed under the section of this report entitled “Risk Factors.”
ITEM 1. BUSINESS
General
Franklin Covey Co. (we, us, our, the Company, or FranklinCovey) is a global company specializing in performance improvement. We help organizations achieve results that require a change in human behavior, and our mission is to “enable greatness in people and organizations everywhere.” We believe that our results-driven principle-centered content is a competitive advantage in the marketplace. From the foundational work of Dr. Stephen R. Covey in leadership and Hyrum W. Smith in productivity, we have developed deep expertise that extends to helping organizations and individuals achieve lasting behavioral change in seven crucial areas: Leadership, Execution, Productivity, Trust, Sales Performance, Customer Loyalty, and Educational improvement. We have over 870 employees worldwide delivering these principle-based offerings and effectiveness tools to our customers. Our consolidated net sales for the fiscal year ended August 31, 2016 totaled $200.1 million and our shares of common stock are traded on the New York Stock Exchange (NYSE) under the ticker symbol “FC.”
We operate globally with one common brand and business model designed to enable us to provide clients around the world with the same high level of service. To achieve this level of service we operate three regional sales offices in the United States; an office that specializes in sales to governmental entities; wholly owned subsidiaries in Australia, Japan, and the United Kingdom; and we contract with licensee partners who deliver our content and provide services in over 150 other countries and territories around the world. On September 1, 2016, we opened three new sales offices in China. Our offerings and products were previously sold in China by an independent licensee.
Our business-to-business service utilizes our expertise in training, consulting, and technology that is designed to help our clients define great performance and execute at the highest levels. We also provide clients with training in management skills, relationship skills, and individual effectiveness, and we can provide personal-effectiveness literature and electronic educational solutions to our clients as needed.
During fiscal 2016 we introduced a new way to deliver our content and offerings to our clients. Through the All Access Pass, our clients have access to our world-class offerings and training materials. Clients may utilize complete offerings such as The 7 Habits of Highly Effective People and The 5 Choices to Extraordinary Productivity, or use individual concepts from any of our well-known offerings to create a custom solution to fit their organizational or individual training needs. We believe the flexibility of the All Access Pass will provide significant benefits to our clients and their organizations.
Our fiscal year ends on August 31 of each year. Unless otherwise noted, references to fiscal years apply to the 12 months ended August 31 of the specified year.
Services Overview
Our mission is to “enable greatness in people and organizations everywhere,” and we believe that we are experts at solving certain pervasive, intractable problems, each of which requires a change in human behavior. As we deliver our solutions to these problems, we believe there are four important characteristics that distinguish us from our competitors.
|
1.
|
World Class Content – Rather than rely on “flavor of the month” training fads, our content is principle-centered and based on natural laws of human behavior and effectiveness. Our content is designed to build new skillsets, establish new mindsets, and provide enabling toolsets. When our content is applied consistently in an organization, we believe the culture of that organization will change to enable the organization to achieve their own great purposes. Our content is well researched, subjected to numerous field beta tests, and improved through a proven development process.
|
|
2.
|
Breadth and Scalability of Delivery Options – We have a wide range of content delivery options, including: the All Access Pass and other intellectual property licensing arrangements, on-site training, training led through certified facilitators, on-line learning, blended learning, and organization-wide transformational processes, including consulting and coaching.
|
|
3.
|
Global Capability – We operate three regional sales offices in the United States; wholly owned subsidiaries in Australia, Japan, and the United Kingdom; and contract with licensee partners who deliver our content in over 150 other countries and territories around the world. This capability allows us to deliver content to a wide range of customers, from large, multinational corporations to smaller, local entities. On September 1, 2016 we opened three new sales offices in China. Our offerings and products were previously sold in China by an independent licensee.
|
|
4.
|
Transformational Impact and Reach – We hold ourselves responsible for and measure ourselves by our clients’ achievement of transformational results.
|
Our content, tools, and methodologies are organized into key practice areas, each offering targeted solutions that are designed to drive positive transformational results. We have divided our offerings into the following seven major practices:
|
1.
|
Leadership
|
|
2.
|
Execution
|
|
3.
|
Productivity
|
|
4.
|
Trust
|
|
5.
|
Sales Performance
|
|
6.
|
Customer Loyalty
|
|
7.
|
Education
|
Our practices are designed to provide world-class content and delivery, including best-selling books and audio, innovative and widely recognized thought leadership, multiple delivery and teaching methods, a practice-centric focused sales force, and practice-specific marketing support. These elements allow us to offer our clients training and consulting solutions that are designed to improve individual and organizational behaviors, deliver content that adapts to an organization’s unique needs, and provide meaningful improvements in our clients’ business performance.
The following description of our practices and associated content describes what our offerings are designed to provide to our clients. The description should not be viewed as a warranty or guarantee of results. Further information about our content and services can be found on our website at www.franklincovey.com. However, the information contained in, or that can be accessed through, our website does not constitute a part of this annual report.
|
1.
|
Leadership
|
Dr. Stephen R. Covey, one of our co-founders, once said, “Leadership is communicating to people their worth and potential so clearly that they come to see it in themselves.” Leadership has a profound impact on performance, and is a key lever that mobilizes teams to produce results. We believe that in today’s fast-paced world, the most effective leaders address constant change with timeless principles of effectiveness and unwavering character. Leaders recognize that great leadership is not only about what they do, but about who they are. Franklin Covey’s Leadership practice develops leaders at three levels: personal, team, and organization-wide.
Franklin Covey’s Leadership practice is designed to develop leaders who achieve sustained superior performance, engage employees to achieve the most critical objectives, win the loyalty of customers and other stakeholders, and build a strategic advantage by identifying and making a distinctive contribution. Our key leadership solutions include the following:
The 7 Habits of Highly Effective People®—Signature Program 4.0
Based on the principles found in Dr. Stephen R. Covey’s best-selling business book, The 7 Habits of Highly Effective People, this program was re-created and released during fiscal 2014 with refreshed content and new award-winning video presentations. This program is designed to provide training that helps organizations achieve sustained superior results by helping individuals and leaders be measurably more effective. Participants gain hands-on experience, applying timeless principles that yield greater productivity, improved communication, strengthened relationships, increased influence, and laser-like focus on critical priorities.
The 7 Habits for Managers®
FranklinCovey’s The 7 Habits for Managers solution teaches the fundamentals of leading today’s mobile knowledge worker. Both new and experienced managers acquire a set of tools to help them meet today’s management challenges, including conflict resolution, prioritization, performance management, accountability and trust, execution, collaboration, and team and employee development.
Leadership: Great Leaders, Great Teams, Great Results™
This comprehensive offering contains the entire core content of Franklin Covey’s Leadership practice. The workshop features videos that present the latest on our own research and thinking, along with the best thinking of other leadership experts.
Leadership Modular Series
Drawn from the content of our leadership-development program, the Leadership Modular Series comprises seven stand-alone modules (of three to four hours in duration) that teach imperatives leaders can apply to create a work environment that addresses the needs of today’s knowledge worker.
Executive Coaching
We offer senior executives a coaching experience created in partnership with Columbia University, which includes methodologies approved by the International Coach Federation (ICF). In one-on-one or team sessions, we leverage content, methodology, and tools to guide leaders in discovering and unleashing the potential they already possess.
|
2.
|
Execution
|
Execution remains one of the toughest challenges organizations face today. We believe that our Execution practice provides organizations with the paradigms, practices, and tools to address these challenges. We work directly with leadership teams to help them clarify the few “wildly important goals” that the execution of their strategy requires, identify the few key measures that lead to the achievement of these goals, create clear and compelling scoreboards, and build a culture and cadence of accountability so that the goals are achieved. Our key execution offerings include:
The 4 Disciplines of Execution®: Manager Certification
The purpose of manager certification includes helping managers not only develop specific skills, but to also create actual work plans. We help managers leave the session with clearly identified goals and measures, a draft scoreboard for their team, and an accountability plan to help everyone move forward on the goals.
My4DX.com
My4DX.com is designed to fully support the Company’s 4 Disciplines of Execution methodology. This versatile on-line service assists organizations in developing and tracking progress on “wildly important goals,” and provides a cadence of accountability to both organizations and individuals.
What the CEO Wants You to Know: Building Business Acumen™
This training supports the Execution practice disciplines by helping individuals and teams better understand the financial engine of their business and how they can positively affect it. The material is based on the popular book What the CEO Wants You to Know, by leading CEO and executive coach Ram Charan.
|
3.
|
Productivity
|
Another of Franklin Covey’s co-founders, Hyrum W. Smith, taught that adherence to specified natural laws of behavior would result in increased productivity and inner peace. In today’s fast-paced world of knowledge workers “doing more with less,” we believe that workforce productivity and engagement can be a competitive advantage. Franklin Covey’s Productivity practice equips individuals, teams, and organizations to consistently make intentional high-value decisions and execute on high-impact goals and projects with excellence in the midst of unlimited choices, demands, and distractions. Our Productivity practice offerings include the following:
The 5 Choices to Extraordinary Productivity™
This program is designed to provide the in-depth skills, knowledge, and attitudes that allow individual contributors, teams, and organizations to be able to identify, validate, and act on what’s most important. Instead of trying to get everything done, participants focus on how to get the right things done. This discernment enables them to make wiser decisions, harness technology to enhance workflow, and put their finest attention and energy on executing what matters most.
Project Management Essentials for the Unofficial Project Manager
Today’s knowledge workers have quietly slipped into the role of the unofficial project manager. Stakeholder expectations, scope creep, no formal training, and a lack of process all combine to raise the probability of project failure costing organizations time, money, and employee morale. This work session helps participants consistently complete projects successfully by having them learn to implement a disciplined process to execute projects and to master informal authority of people.
Writing Advantage®
The FranklinCovey Writing Advantage program teaches participants how to set quality writing standards that help people increase productivity, resolve issues, avoid errors, and heighten credibility. Participants learn how to write faster with more clarity, and gain skills for revising and fine-tuning every style of document.
Presentation Advantage®
Unproductive meetings and lost opportunities may occur due to poor presentations. The lack of powerful methods to inform and persuade is one of the greatest hidden and pervasive costs of the 21st century workplace. This work session is designed to help participants consistently deliver highly successful presentations.
|
4.
|
Trust
|
We believe that trust is the hallmark of effective leaders, teams, and organizations. Trust-related problems like bureaucracy, fraud, and excessive turnover discourage productivity, divert resources, and chip away at a company’s brand. On the other hand, leaders who make building trust an explicit goal of their job gain strategic advantages—accelerating growth, enhancing innovation, improving collaboration and execution, and increasing shareholder value. Our Trust practice is built on The New York Times best-selling book, The Speed of Trust by Stephen M. R. Covey, and includes offerings to help leaders and team members develop the competencies to make trust a strategic advantage.
Leading at the Speed of Trust®
This program engages leaders at all levels in identifying and closing the trust gaps in their organization. Instead of paying “trust taxes,” organizations can begin to realize “trust dividends.” We believe that doing business at the “speed of trust” lowers costs, speeds up results, and increases profits and influence.
Working at the Speed of Trust®—For Associates
This workshop helps individual contributors identify and address “trust gaps” in their personal credibility and in their relationships at work. Using examples from their work and focusing on real-world issues, participants discover how to communicate transparently with peers and managers, improve their track record of keeping commitments, focus on improving internal “customer service” with others who depend on their work, and much more.
|
5.
|
Sales Performance
|
We believe that sales performance is about helping clients succeed. FranklinCovey provides an approach that delivers the “what to do” and “how to do” for mutual seller/buyer benefits. Through consulting, training, and coaching, our Sales Performance practice helps sales leaders and salespeople act as genuine trusted business advisors who create value and help clients succeed.
Helping Clients Succeed® is a mind-set, skill-set, and tool-set for becoming client-centered. It is a way of thinking, being, and behaving for sales professionals. We believe this content defines a process for creating candid dialogue, fresh thinking, innovative collaboration, and robust execution—with clients and within an organization. With our suite of consultative sales-training solutions, we believe clients can transform their salespeople into trusted business advisors who focus on helping their clients succeed, resulting in increased sales, shortened sales cycles, improved margins, and satisfied clients.
|
6.
|
Winning Customer Loyalty®
|
Our Customer Loyalty practice helps leaders of multiunit organizations create a culture where employees are engaged and equipped to deliver great customer experiences. To do this, customer loyalty specialists draw from an array of offerings to craft a solution that works with each company’s culture, operating environment, and strategic vision. We have partnered with Frank Reichheld, creator of the Net Promoter SystemTM, to help organizations measure and improve customer and employee loyalty through accurate metrics and world-class training and development.
Our Customer Loyalty practice is designed to help organizations:
|
·
|
Collect statistically valid feedback from a representative sample of customers and employees.
|
|
·
|
Increase the visibility of customer-service metrics so managers get real-time feedback.
|
|
·
|
Apply an accountability process at frontline teams so they deliver exceptional customer service at a much higher percentage of the time.
|
|
·
|
Measure and improve employee engagement.
|
|
7.
|
Education
|
The FranklinCovey Education practice is dedicated to helping educational organizations build a culture that will produce great results. Our offerings address all grade levels and help faculty and students develop the critical leadership and effectiveness skills they will need to succeed in a knowledge-based, networked world.
Primary Education Solutions: The Leader in Me®
The Leader in Me process is designed to be integrated into a school’s core curriculum and everyday language. The methodology is designed to become part of the culture, gain momentum, and help to produce improved results year after year. We believe this methodology benefits schools and students in the following ways:
|
·
|
Increases academic performance.
|
|
·
|
Improves school culture.
|
|
·
|
Decreases disciplinary issues.
|
|
·
|
Increases teacher engagement and parent involvement.
|
Based on Dr. Stephen R. Covey’s best-selling book The 7 Habits of Highly Effective People, The Leader in Me is a whole-school transformation process that integrates principles of leadership and effectiveness into school curriculum using every day, age-appropriate language. At August 31, 2016 there were over 3,000 schools worldwide participating in The Leader in Me program and we believe that the positive results experienced by schools around the world are a major reason why the Education practice is one of our fastest growing practices.
Secondary Education Solutions: The 7 Habits of Highly Effective Teens®
The Introduction to The 7 Habits of Highly Effective Teens® workshop is based on the best-selling book of the same name by Sean Covey and the No. 1 best-selling business book The 7 Habits of Highly Effective People, and gives young people a set of tools to deal with life’s challenges.
Delivery Methods
We have multiple methods to deliver our world-class content to our clients that are designed to provide our customers with a learning environment that suits their needs. Our primary delivery methods include the following:
|
·
|
All Access Pass
|
|
·
|
Onsite Presentations
|
|
·
|
Client Facilitators
|
|
·
|
International Licensees
|
|
·
|
E-Learning
|
|
·
|
Public Workshops
|
|
·
|
Custom Solutions
|
|
·
|
Media Publishing
|
All Access Pass
During fiscal 2016, we launched the All Access Pass. The All Access Pass provides an intellectual property license that provides our clients access to our world-class content, assessments, tools, and videos through a web-based portal over a contracted period. Clients may use our well-known complete training programs or use individual portions of numerous offerings to customize a training or personnel solution that addresses specific organizational needs. Clients may also use our trainers and consultants in connection with AAP content and materials to further enhance the learning experience for their employees.
Onsite Presentations
We employ highly-talented consultants and presenters to deliver our offerings in person at client locations. Based around the world, our consultants represent diverse global industry experience and can tailor their delivery to meet a client’s precise needs. Whether the need is for consulting, training, or customized keynote speeches, our consultants can deliver our curriculums to any level
of an organization, from the C-suite to a team or department. We believe that our delivery consultants provide high-quality services and are a competitive advantage in the marketplace.
Client Facilitators
For organizations seeking cost-effective ways to implement solutions involving large populations of managers and frontline workers, FranklinCovey certifies on-site client facilitators to teach our content and adapt it to their organizational needs. We have thousands of client facilitators around the world who are certified to teach in different content areas. In order to become a client facilitator, an individual must become certified to teach our offerings through a two-step process that is designed to ensure that these trained personnel can deliver our content in a professional and meaningful manner.
International Licensees
In foreign countries where we do not have an office, our content is delivered through independent licensees, who, under strict guidelines, may translate and adapt our offerings to local preferences and customs, if necessary. These licensee partners allow us to deliver the same high quality content to clients that have multinational operations or in countries that have specific cultural requirements. Our licensee partners pay us a royalty based on the programs and content delivered.
|
E-Learning
|
Our E-Learning capabilities bring our content to clients in innovative ways that transcend traditional E-learning solutions. Franklin Covey’s online offerings allow participants to save travel time and expenses as well as providing the opportunity to view our content in smaller time increments.
Public Workshops
Each year, we offer a number of training events, primarily in the United States and Canada, which are open to the public. Prior to the event, we advertise in the geographic region where the event will be held and participants may register for the events in advance. Interested persons may also search for upcoming workshops based on the desired curriculum and register for these workshops through our website at www.franklincovey.com. In addition, our content is taught by certain professional training firms that also offer events to the public.
|
Custom Solutions
|
Whether clients need a program customized, or require a new product developed for their organization, our custom solutions department has the process to build the solution. Content customization builds upon our existing offerings and our clients’ unique needs by using a specific process to deliver results and improve training return on investment for our clients.
|
Media Publishing
|
Our Media Publishing department extends our influence into both traditional publishing and new media channels. FranklinCovey Media Publishing offers books, e-books, audio products, downloadable and paper-based tools, and content-rich software applications for smart phones and other handheld devices to consumer and corporate markets.
Industry Information
According to the Training magazine 2016 Training Industry Survey, the total size of the U.S. training industry is estimated to be $70.7 billion, which is essentially flat compared with the prior year. One of our competitive advantages in this highly fragmented industry stems from our fully integrated principle-centered training offerings, measurement methodologies, and implementation tools to help organizations and individuals measurably improve their effectiveness. This advantage
allows us to deliver not only training to both corporations and individuals, but also to implement the training through the use of powerful behavior-changing tools with the capability to then measure the impact of the delivered content and solutions.
Over our history, we have provided content, services, and products to 97 of the Fortune 100 companies and more than 75 percent of the Fortune 500 companies. We also provide content and services to a number of U.S. and foreign governmental agencies, as well as numerous educational institutions. In addition, we provide training content, measurement services, and implementation tools internationally, either through directly operated offices, or through independent licensed providers.
Segment Information
Our sales are primarily comprised of training and content sales and related products. Effective September 1, 2015, we changed our organizational structure to create four operating divisions, which were determined to be operating segments, and a corporate services group. The following is a brief description of these new reportable segments:
|
·
|
Direct Offices – This segment consists of our geographic sales offices that serve the United States and Canada; our international sales offices located in Japan, the United Kingdom, and Australia; and our public programs group. This division will include our new sales offices in China that were opened on September 1, 2016.
|
|
·
|
Strategic Markets – This segment includes our government services office, the Sales Performance practice, the Customer Loyalty practice, and a new “Global 50” group, which is specifically focused on sales to large, multi-national organizations.
|
|
·
|
Education practice – This segment is comprised of our domestic and international Education practice operations, which are centered on sales to educational institutions such as elementary schools, high schools, and colleges and universities.
|
|
·
|
International Licensees – This segment is primarily comprised of our international licensees’ royalty revenues.
|
For financial and other information regarding our operating segments, refer to the notes to our consolidated financial statements (Note 16).
Clients
We have a relatively broad base of organizational and individual clients. In our direct offices that serve the United States, Canada, Japan, China, Australia, and the United Kingdom, we have more than 5,100 organizational clients consisting of corporations, governmental agencies, educational institutions, and other organizations. We have thousands of additional organizational clients throughout the world, which are served through our global licensee partner network, and we believe that our content, in all its forms, delivers results that encourage strong client loyalty. Employees in each of our domestic and international distribution channels focus on helping our clients achieve measurably positive results from utilizing our content. Due to the nature of our business, we do not have a significant backlog of firm orders.
During the periods presented in this report, none of our clients were responsible for more than ten percent of our consolidated revenues.
Competition
We operate in a highly competitive and rapidly changing global marketplace and compete with a variety of organizations that offer services comparable with those that we offer. The nature of the competition in the performance improvement industry, however, is highly fragmented with few large competitors. Based upon our fiscal 2016 consolidated sales of $200.1 million, we believe that we are a leading competitor in the performance skills and education market. Other significant comparative companies in the performance improvement market are Development Dimensions International, CRA International, Inc., Learning Tree International Inc., GP Strategies Corp., FTI
Consulting, Inc., American Management Association, Wilson Learning, Forum Corporation, Corporate Executive Board Co., The Hackett Group, and the Center for Creative Leadership.
We derive our revenues from a variety of companies with a broad range of sales volumes, governments, educational institutions, and other entities. We believe that the principal competitive factors in the industry in which we compete include the following:
|
·
|
Quality of offerings, services, and solutions
|
|
·
|
Skills and capabilities of people
|
|
·
|
Innovative training and consulting services combined with effective products
|
|
·
|
Ability to add value to client operations
|
|
·
|
Reputation and client references
|
|
·
|
Price
|
|
·
|
Availability of appropriate resources
|
|
·
|
Global reach and scale
|
|
·
|
Branding and name recognition in our marketplace
|
Given the relative ease of entry into the training market, the number of our competitors could increase, many of whom may imitate existing methods of distribution, or could offer similar content and programs at lower prices. Some of these competitors may have greater financial and other resources than we do. However, we believe that we have several areas of competitive differentiation in our industry. We believe that our competitive advantages include: (1) the quality of our content, as indicated by our strong gross margins, branded content, and best-selling books; (2) the breadth of delivery options we are able to offer to customers for utilizing our content, including live presentations by our own training consultants, live presentations though Company certified client-employed facilitators, intellectual property licensing and the All Access Pass, web-based presentations, and film-based presentations; (3) our global reach, which allows truly multinational clients to scale our content uniformly across the globe, through our mix of direct offices and our global licensee network; and (4) the significant impact which our solutions can have on our clients’ results. Moreover, we believe that we are a market leader in the U.S. in leadership, execution, productivity, and individual effectiveness content. Increased competition from existing and future competitors could, however, have a negative impact on our sales and profitability in future fiscal years.
Seasonality
Our fourth quarter of each fiscal year typically has higher sales and operating income than other fiscal quarters primarily due to increased revenues in our Education practice (when school administrators and faculty have professional development days) and to increased facilitator sales that typically occur during that quarter resulting from year-end incentive programs. Overall, training sales are moderately seasonal because of the timing of corporate training, which is not typically scheduled as heavily during holiday and certain vacation periods.
Quarterly fluctuations may also be affected by other factors including the introduction of new offerings, business acquisitions, the addition of new organizational customers, and the elimination of underperforming offerings.
Manufacturing and Distribution
We do not manufacture any of our products. We purchase our training materials and related products from various vendors and suppliers located both domestically and internationally, and we are not dependent upon any one vendor for the production of our training and related materials as the raw materials for these products are readily available. We currently believe that we have good relationships with our suppliers and contractors.
During fiscal 2016 we entered into a three-year contract with HP Enterprise Services (HPE) to provide warehousing and distribution services for our training products and related accessories. Our materials are primarily warehoused and distributed from an HPE facility located in Des Moines, Iowa.
Trademarks, Copyrights, and Intellectual Property
Our success has resulted in part from our proprietary content, methodologies, and other intellectual property rights. We seek to protect our intellectual property through a combination of trademarks, copyrights, and confidentiality agreements. We claim rights for over 550 trademarks in the United States and foreign countries, and we have obtained registration in the United States and numerous foreign countries for many of our trademarks including FranklinCovey, The 7 Habits of Highly Effective People, The 4 Disciplines of Execution, and The 7 Habits. We consider our trademarks and other proprietary rights to be important and material to our business.
We own sole or joint copyrights on our books, manuals, text and other printed information provided in our training programs, and other electronic media products, including audio and video tapes. We may license, rather than sell, facilitator workbooks and other seminar and training materials in order to protect our intellectual property rights therein. We place trademark and copyright notices on our instructional, marketing, and advertising materials. In order to maintain the proprietary nature of our product information, we enter into written confidentiality agreements with certain executives, product developers, sales professionals, training consultants, other employees, and licensees. Although we believe the protective measures with respect to our proprietary rights are important, there can be no assurance that such measures will provide significant protection from competitors.
Employees
One of our most important assets is our people. The diverse and global makeup of our workforce allows us to serve a variety of clients on a worldwide basis. We are committed to attracting, developing, and retaining quality personnel and actively strive to reinforce our employees’ commitment to our clients, and to our mission, vision, culture, and values through the creation of a motivational and rewarding work environment.
We currently have approximately 870 associates located in the United States of America, Canada, China, Japan, the United Kingdom, and Australia. None of our associates are represented by a union or other collective bargaining group. Management believes that its relations with its associates are good and we do not currently foresee a shortage in qualified personnel needed to operate and grow our business.
Available Information
Our principal executive offices are located at 2200 West Parkway Boulevard, Salt Lake City, Utah 84119-2331, and our telephone number is (801) 817-1776.
We regularly file reports with the Securities Exchange Commission (SEC). These reports include, but are not limited to, Annual Reports on Form 10-K, Quarterly Reports on Form 10-Q, Current Reports on Form 8-K, and security transaction reports on Forms 3, 4, or 5. The public may read and copy any materials that the Company files with the SEC at the SEC’s Public Reference Room located at 100 F Street, NE, Washington, DC 20549. The public may obtain information on the operation of the Public Reference Room by calling the SEC at 1-800-SEC-0330. The SEC also maintains electronic versions of the Company’s reports, proxy and information statements, and other information that the Company files with the SEC on its website at www.sec.gov.
The Company makes our Annual Report on Form 10-K, Quarterly Reports on Form 10-Q, current reports on Form 8-K, and other reports filed or furnished with the SEC available to the public, free of charge, through our website at www.franklincovey.com. These reports are provided through our website as soon as is reasonably practicable after we file or furnish these reports with the SEC.
ITEM 1A. RISK FACTORS
Our business environment, current domestic and international economic conditions, and other specific risks may affect our future business decisions and financial performance. The matters discussed below may cause our future results to differ from past results or those described in forward-looking statements and could have a material adverse effect on our business, financial condition, liquidity, results of operations, and stock price, and should be considered in evaluating our Company.
The risks included here are not exhaustive. Other sections of this report may include additional risk factors which could adversely affect our business and financial performance. Moreover, we operate in a very competitive and rapidly changing global environment. New risk factors emerge from time to time and it is not possible for management to predict all such risk factors, nor can we assess the impact of all such risk factors on our business or the extent to which any factor, or combination of factors, may cause actual results to differ materially from those contained in any forward-looking statements. Given these risks and uncertainties, investors should not place undue reliance on forward-looking statements as a prediction of actual results.
Investors should also be aware that while Franklin Covey does, from time to time, communicate with securities analysts, it is against our policy to disclose to them any material non-public information or other confidential commercial information. Accordingly, shareholders should not assume that the Company agrees with any statement or report issued by any analyst irrespective of the content of the statement or report. Furthermore, we do not confirm financial forecasts or projections issued by others. Thus, to the extent that reports issued by securities analysts contain any projections, forecasts, or opinions, such reports are not the responsibility of Franklin Covey Co.
We operate in an intensely competitive industry and our competitors may develop courses that adversely affect our ability to sell our offerings.
The training and consulting services industry is intensely competitive with relatively easy entry. Competitors continually introduce new programs and services that may compete directly with our offerings or that may make our offerings uncompetitive or obsolete. Larger competitors may have superior abilities to compete for clients and skilled professionals, reducing our ability to deliver quality work to our clients. In addition, one or more of our competitors may develop and implement training courses or methodologies that may adversely affect our ability to sell our offerings and products to new clients. Any one of these circumstances could have an adverse effect on our ability to obtain new business and successfully deliver our services.
Our results of operations could be adversely affected by economic and political conditions and the effects of these conditions on our clients’ businesses and their levels of business activity.
Global economic and political conditions affect our clients’ businesses and the markets in which they operate. Our financial results are somewhat dependent on the amount that current and prospective clients budget for training. A serious and/or prolonged economic downturn (or drawn-out recovery) combined with a negative or uncertain political climate could adversely affect our clients’ financial condition and the amount budgeted for training by our clients. These conditions may reduce the demand for our services or depress the pricing of those services and have an adverse impact on our results of operations. Changes in global economic conditions may also shift demand to services for which we do not have competitive advantages, and this could negatively affect the amount of business that we are
able to obtain. Such economic, political, and client spending conditions are influenced by a wide range of factors that are beyond our control and that we have no comparative advantage in forecasting. If we are unable to successfully anticipate these changing conditions, we may be unable to effectively plan for and respond to those changes, and our business could be adversely affected.
Our business success also depends in part upon continued growth in the use of training and consulting services and the renewal of existing contracts by our clients. In challenging economic environments, our clients may reduce or defer their spending on new services and consulting solutions in order to focus on other priorities. At the same time, many companies have already invested substantial resources in their current means of conducting their business and they may be reluctant or slow to adopt new approaches that could disrupt existing personnel and/or processes. If growth in the general use of training and consulting services in business or our clients’ spending on these items declines, or if we cannot convince our clients or potential clients to embrace new services and solutions, our results of operations could be adversely affected.
In addition, our business tends to lag behind economic cycles and, consequently, the benefits of an economic recovery following a period of economic downturn may take longer for us to realize than other segments of the economy.
The All Access Pass is an internet-based platform, and as such we are subject to increased risks of cyber-attacks and other security breaches that could have a material adverse effect on our business.
In fiscal 2016, we introduced the All Access Pass (AAP), which is an internet-based platform that allows our clients to purchase access to a broad base of our intellectual property for a specified period. Clients may utilize entire training offerings or use individual portions of numerous programs to customize a training or personnel program that fits their needs. As part of selling the AAP, we collect, process, and retain a limited amount of sensitive and confidential information regarding our customers. Because the AAP is an internet-based platform, our facilities and systems associated with the AAP may be vulnerable to external or internal security breaches, acts of vandalism, computer viruses, misplaced or lost data, stolen intellectual property, programming or human errors, or other similar events.
The access by unauthorized persons to, or the improper disclosure by us of, confidential information regarding our customers or our own proprietary information, software, methodologies, and business secrets could result in significant legal and financial exposure, damage to our reputation, or a loss of confidence in the security of our systems, products, and services, which could have a material adverse effect on our business, financial condition, or results of operations. To the extent we are involved in any future cyber-attacks or other breaches, our brand and reputation could be affected, and these conditions could also have a material adverse effect on our business, financial condition, or results of operations.
We have only a limited ability to protect our intellectual property rights, which are important to our success.
Our financial success depends, in part, upon our ability to protect our proprietary curriculums and other intellectual property. The existing laws of some countries in which we provide services might offer only limited protection of our intellectual property rights. To protect our intellectual property, we rely upon a combination of confidentiality policies, nondisclosure and other contractual arrangements, as well as copyright and trademark laws. The steps we take in this regard may not be adequate to prevent or deter infringement or
other misappropriation of our intellectual property, and we might not be able to detect unauthorized use of, or take appropriate and timely steps to enforce, our intellectual property rights, especially in foreign jurisdictions.
The loss of proprietary content or the unauthorized use of our intellectual property may create greater competition, loss of revenue, adverse publicity, and may limit our ability to reuse that intellectual property for other clients. Any limitation on our ability to provide a service or solution could cause us to lose revenue-generating opportunities and require us to incur additional expenses to develop new or modified solutions for future engagements.
We could have liability or our reputation could be damaged if we do not protect client data or if our information systems are breached.
We are dependent on information technology networks and systems to process, transmit, and store electronic information and to communicate between our locations around the world and with our clients. Security breaches of this infrastructure could lead to shutdowns or disruptions of our systems and potential unauthorized disclosure of confidential information. We are also required at times to manage, utilize, and store sensitive or confidential client or employee data. As a result, we are subject to numerous U.S. and foreign jurisdiction laws and regulations designed to protect this information, such as the various U.S. federal and state laws governing the protection of individually identifiable information. If any person, including any of our associates, negligently disregards or intentionally breaches our established controls with respect to such data or otherwise mismanages or misappropriates that data, we could be subject to monetary damages, fines, and/or criminal prosecution. Unauthorized disclosure of sensitive or confidential client or employee data, whether through systems failure, employee negligence, fraud, or misappropriation could damage our reputation and cause us to lose clients.
Legal requirements relating to the collection, storage, handling, and transfer of personal data continue to evolve. For example, the European Union and the U.S. formally entered into a new framework in July 2016 that provides a mechanism for companies to transfer data from European Union member states to the U.S. This new framework, called the Privacy Shield, is intended to address shortcomings identified by the European Court of Justice in a predecessor mechanism. The Privacy Shield and other mechanisms are likely to be reviewed by the European courts, which may lead to uncertainty about the legal basis for data transfers across the Atlantic. Ongoing legal reviews may result in burdensome or inconsistent requirements affecting the location and movement of our customer and internal employee data as well as the management of that data. Compliance may require changes in services, business practices, or internal systems that result in increased costs, lower revenue, reduced efficiency, or greater difficulty in competing with foreign-based firms. Failure to comply with existing or new rules may result in significant penalties or orders to stop the alleged noncompliant activity.
Our results of operations and cash flows may be adversely affected if FC Organizational Products LLC is unable to pay the working capital settlement, reimbursable acquisition costs, or reimbursable operating expenses.
In fiscal 2008, we sold our planning products operation to FC Organizational Products, LLC (FCOP), an entity in which we own a 19.5 percent interest. According to the agreements associated with the sale, we were entitled to receive a $1.2 million payment for working capital delivered on the closing date of the sale and to receive $2.3 million as reimbursement for specified costs necessary to complete the transaction. Payment for these costs was originally due in January 2009, but we extended the due date of the payment at FCOP’s request and obtained a promissory note from FCOP for the amount owed, plus
accrued interest. At the time we received the promissory note from FCOP, we believed that we could obtain payment for the amounts owed, based on prior year performance and forecasted financial performance in 2009. However, the financial position of FCOP deteriorated significantly late in fiscal 2009 and the deterioration accelerated subsequent to August 31, 2009. As a result of its deteriorating financial position, we reassessed the collectability of the promissory note. Based on revised expected cash flows and other operational issues, we recorded a $3.6 million impaired asset charge against these receivables in fiscal 2009.
We also receive reimbursement from FCOP for certain operating costs, such as rent, and, although not required by governing documents or our ownership interest, we have previously provided working capital and other advances to FCOP. At August 31, 2016 and 2015 we had $3.2 million and $4.0 million receivable from FCOP, net of related discount, which are recorded as assets on our consolidated balance sheets. Although we believe that we will obtain payment from FCOP for these receivables, the valuation of amounts receivable from FCOP is dependent upon the estimated future earnings and cash flows of FCOP. If FCOP’s estimated future earnings and cash flows decline, or if FCOP fails to pay amounts receivable and we fail to obtain payment on the previously impaired promissory note, our future cash flows and results of operations may be adversely affected.
Our work with governmental clients exposes us to additional risks that are inherent in the government contracting process.
Our clients include national, provincial, state, and local governmental entities, and our work with these governmental entities has various risks inherent in the governmental contracting process. These risks include, but are not limited to, the following:
|
·
|
Governmental entities typically fund projects through appropriated monies. While these projects are often planned and executed as multi-year projects, the governmental entities usually reserve the right to change the scope of, or terminate, these projects for lack of approved funding and other discretionary reasons. Changes in governmental priorities or other political developments, including disruptions in governmental operations, could result in changes in the scope of, or in termination of, our existing contracts.
|
|
·
|
Governmental entities often reserve the right to audit our contract costs, including allocated indirect costs, and conduct inquiries and investigations of our business practices with respect to our government contracts. If the governmental entity finds that the costs are not reimbursable, then we will not be allowed to bill for those costs or the cost must be refunded to the client if it has already been paid to us. Findings from an audit also may result in our being required to prospectively adjust previously agreed upon rates for our work, which may affect our future margins.
|
|
·
|
If a governmental client discovers improper activities in the course of audits or investigations, we may become subject to various civil and criminal penalties and administrative sanctions, which may include termination of contracts, forfeiture of profits, suspension of payments, fines and suspensions or debarment from doing business with other agencies of that government. The inherent limitations of internal controls may not prevent or detect all improper or illegal activities, regardless of their adequacy.
|
|
·
|
Political and economic factors such as pending elections, the outcome of elections, revisions to governmental tax policies, sequestration, debt ceiling negotiations, and reduced tax revenues can affect the number and terms of new governmental contracts signed.
|
The occurrences or conditions described above could affect not only our business with the particular governmental agency involved, but also our business with other agencies of the same or other governmental entities. Additionally, because of their visibility and political nature, governmental contracts may present a heightened risk to our reputation. Any of these factors could have an adverse effect on our business or our results of operations.
Our results of operations may be negatively affected if we cannot expand and develop our services and solutions in response to client demand or if newly developed or acquired services have increased costs.
Our success depends upon our ability to develop and deliver services and solutions that respond to rapid and continuing changes in client needs. We may not be successful in anticipating or responding to these developments on a timely basis, and our offerings may not be successful in the marketplace. The implementation, acquisition, and introduction of new programs and solutions may reduce sales of our other existing programs and services and may entail more risk than supplying existing offerings to our clients. Newly developed or acquired solutions may also require increased royalty payments or carry significant development costs that must be expensed. Any one of these circumstances may have an adverse impact upon our business and results of operations.
If we are unable to attract, retain, and motivate high-quality employees, including training consultants and other key training representatives, we may not be able to grow our business as projected or may not be able to compete effectively.
Our success and ability to grow are dependent, in part, on our ability to hire, retain, and motivate sufficient numbers of talented people with the increasingly diverse skills needed to serve our clients and grow our business. Competition for skilled personnel is intense at all levels of experience and seniority. There is a risk that we will find it difficult to hire and retain a sufficient number of employees with the skills or backgrounds we require, or that it will prove difficult to retain them in a competitive labor market. If we are unable to hire and retain talented sales and delivery employees with the skills, and in the locations, we require, we might not be able to grow our business at projected levels or may not be able to effectively deliver our content and services. If we need to hire additional personnel to maintain a specified number of sales personnel or are required to re-assign personnel from other geographic areas, it could increase our costs and adversely affect our profit margins. In addition, the inability of newly hired sales personnel to achieve projected sales levels may inhibit our ability to attain anticipated growth.
In order to retain key personnel, we continue to offer a variable component of compensation, the payment of which is dependent upon our sales performance and profitability. We adjust our compensation levels and have adopted different methods of compensation in order to attract and retain appropriate numbers of employees with the necessary skills to serve our clients and grow our business. We may also use share-based performance incentives as a component of our executives’ compensation, which may affect amounts of cash compensation. Variations in any of these areas of compensation may adversely impact our operating performance.
Our global operations pose complex management, foreign currency, legal, tax, and economic risks, which we may not adequately address.
We have sales offices in Australia, China, Japan, and the United Kingdom. We also have licensed operations in numerous other foreign countries. As a result of these foreign operations and their impact upon our financial statements, we are subject to a number of risks, including:
|
·
|
Restrictions on the movement of cash
|
|
·
|
Burdens of complying with a wide variety of national and local laws
|
|
·
|
The absence in some jurisdictions of effective laws to protect our intellectual property rights
|
|
·
|
Political instability
|
|
·
|
Currency exchange rate fluctuations
|
|
·
|
Longer payment cycles
|
|
·
|
Price controls or restrictions on exchange of foreign currencies
|
For instance, on June 23, 2016, the United Kingdom held a referendum in which a majority of voters chose to exit the European Union, commonly referred to as “Brexit.” The outcome of this referendum produced significant currency exchange rate fluctuations and volatility in global stock markets and it is expected that the British government will commence negotiations to determine the terms of Brexit. Given the lack of comparable precedent, the implications of Brexit or how such implications might affect us are unclear. Brexit could, among other things, disrupt trade and the free movement of goods, services and people between the United Kingdom and the European Union or other countries as well as create legal and global economic uncertainty. These and other potential implications of Brexit could adversely affect our business and financial results.
We may experience foreign currency gains and losses.
Our sales outside of the United States totaled $44.9 million, or approximately 22 percent of consolidated sales, for the fiscal year ended August 31, 2016. On September 1, 2016 we opened three new directly owned sales offices in China. In previous periods, our offerings were sold in China by an independent licensee and we recognized royalty income from these sales. We believe that opening these sales offices in China will increase the amount of revenue generated outside the United States in future periods. As our international operations grow and become a larger component of our overall financial results, our revenues and operating results may be adversely affected when the dollar strengthens relative to other currencies and may be favorably affected when the dollar weakens. In order to manage a portion of our foreign currency risk, we may make limited use of foreign currency derivative contracts to hedge certain transactions and translation exposure. However, there can be no guarantee that our foreign currency risk management strategy will be effective in reducing the risks associated with foreign currency transactions and translation.
Our global operations expose us to numerous and sometimes conflicting legal and regulatory requirements, and violation of these regulations could harm our business.
Because we provide services to clients in many countries, we are subject to numerous, and sometimes conflicting, regulations on matters as diverse as import/export controls, content requirements, trade restrictions, tariffs, taxation, sanctions, government affairs, internal and disclosure control obligations, data privacy, and labor relations. Violations of these regulations in the conduct of our business could result in fines, criminal sanctions against
us or our officers, prohibitions on doing business, and damage to our reputation. Violations of these regulations in connection with the performance of our obligations to our clients also could result in liability for monetary damages, fines, unfavorable publicity, and allegations by our clients that we have not performed our contractual obligations. Due to the varying degrees of development of the legal systems of the countries in which we operate, local laws may be insufficient to protect our rights.
In many parts of the world, including countries in which we operate, practices in the local business community might not conform to international business standards and could violate anticorruption regulations, including the United States Foreign Corrupt Practices Act, which prohibits giving anything of value intended to influence the awarding of government contracts. Although we have policies and procedures to ensure legal and regulatory compliance, our employees, licensee operators, and agents could take actions that violate these requirements. Violations of these regulations could subject us to criminal or civil enforcement actions, including fines and suspension or disqualification from United States federal procurement contracting, any of which could have an adverse effect on our business.
We may fail to meet analyst expectations, which could cause the price of our stock to decline.
Our common stock is publicly traded on the New York Stock Exchange (NYSE), and at any given time various securities analysts follow our financial results and issue reports on us. These periodic reports include information about our historical financial results as well as the analysts’ estimates of our future performance. The analysts’ estimates are based on their own opinions and are often different from our estimates or expectations. If our operating results are below the estimates or expectations of public market analysts and investors, our stock price could decline. If our stock price is volatile, we may become involved in securities litigation following a decline in price. Any litigation could result in substantial costs and a diversion of management’s attention and resources that are needed to successfully run our business.
Our future quarterly operating results are subject to factors that can cause fluctuations in our stock price.
Historically, our stock price has experienced significant volatility. We expect that our stock price may continue to experience volatility in the future due to a variety of potential factors that may include the following:
|
·
|
Fluctuations in our quarterly results of operations and cash flows
|
|
·
|
Increased overall market volatility
|
|
·
|
Variations between our actual financial results and market expectations
|
|
·
|
Changes in our key balances, such as cash and cash equivalents
|
|
·
|
Currency exchange rate fluctuations
|
|
·
|
Unexpected asset impairment charges
|
|
·
|
Increased or decreased analyst coverage
|
These factors may have an adverse effect upon our stock price in the future.
The sale of a large number of common shares by Knowledge Capital could depress the market price of our common stock.
Knowledge Capital Investment Group (Knowledge Capital), a related party primarily controlled by a member of our Board of Directors, held a warrant to purchase 5.9 million shares of our common stock. Knowledge Capital exercised its warrant at various times on a net share basis and received 2.2 million shares of our common stock in addition to stock it already held. On January 26, 2015, the SEC declared effective a registration statement on Form S-3 to register shares held by Knowledge Capital. On May 20, 2015, Knowledge Capital sold 400,000 shares of our common stock on the open market and we did not purchase any of these shares. Knowledge Capital currently holds 2.8 million shares, or approximately 20 percent, of our outstanding common shares. The sale or prospect of the sale of a substantial number of these shares may have an adverse effect on the market price of our common stock.
Our profitability will suffer if we are not able to maintain our pricing and utilization rates.
The profit margin on our services is largely a function of the rates we are able to recover for our services and the utilization, or chargeability, of our trainers, client partners, and consultants. Accordingly, if we are unable to maintain sufficient pricing for our services or an appropriate utilization rate for our training professionals without corresponding cost reductions, our profit margin and overall profitability will suffer. The rates that we are able to recover for our services are affected by a number of factors that we may be unable to control, including:
|
·
|
Our clients’ perceptions of our ability to add value through our programs and content
|
|
·
|
Competition
|
|
·
|
General economic conditions
|
|
·
|
Introduction of new programs or services by us or our competitors
|
|
·
|
Our ability to accurately estimate, attain, and sustain engagement sales, margins, and cash flows over longer contract periods
|
Our utilization rates are also affected by a number of factors, including:
|
·
|
Seasonal trends, primarily as a result of scheduled training
|
|
·
|
Our ability to forecast demand for our products and services and thereby maintain an appropriate headcount in our employee base
|
|
·
|
Our ability to manage attrition
|
There can be no assurance that we will be able to maintain favorable utilization rates in future periods. Additionally, we may not achieve a utilization rate that is optimal for us. If our utilization rate is too high, it could have an adverse effect on employee engagement and attrition. If our utilization rate is too low, our profit margin and profitability may suffer.
We depend on key personnel, the loss of whom could harm our business.
Our future success will depend, in part, on the continued service of key executive officers and personnel. The loss of the services of any key individuals could harm our business. Our future success also depends on our ability to identify, attract, and retain additional qualified senior personnel. Competition for such individuals in our industry is intense, and we may not be successful in attracting and retaining such personnel.
If we are unable to collect our accounts receivable on a timely basis, our results of operations and cash flows could be adversely affected.
Our business depends on our ability to successfully obtain timely payment from our clients of the amounts they owe us for services performed. We evaluate the financial condition of our clients and usually bill and collect on relatively short cycles. However, as our sales to governmental entities, including school districts, continue to grow, our collection cycle may take longer due to procurement and payment procedures at these clients. We maintain allowances against our receivables and unbilled services that we believe are adequate to reserve for potentially uncollectible amounts. Actual losses on client balances could differ from those that we currently anticipate and, as a result, we may need to adjust our allowances. In addition, there is no guarantee that we will accurately assess the creditworthiness of our clients. Macroeconomic conditions could also result in financial difficulties for our clients, and as a result could cause clients to delay payments to us, request modifications to their payment arrangements that could increase our receivables balance, or not pay their obligations to us. Timely collection of client balances also depends on our ability to complete our contractual commitments and bill and collect our invoiced revenues. If we are unable to meet our contractual requirements, we might experience delays in collection of and/or be unable to collect our client balances, and if this occurs, our results of operations and cash flows may be adversely affected.
The Company’s use of accounting estimates involves judgment and could impact our financial results.
Our most critical accounting estimates are described in Management’s Discussion and Analysis found in Item 7 of this report under the section entitled “Use of Estimates and Critical Accounting Policies.” In addition, as discussed in various footnotes to our financial statements as found in Item 8, we make certain estimates for loss contingencies, including decisions related to legal proceedings and reserves. Because, by definition, these estimates and assumptions involve the use of judgment, our actual financial results may differ from these estimates.
We have significant intangible assets, goodwill, and long-term asset balances that may be impaired if cash flows from related activities decline.
At August 31, 2016 we had $50.2 million of intangible assets, which were primarily generated from the fiscal 1997 merger with the Covey Leadership Center, and $19.9 million of goodwill. Our intangible assets are evaluated for impairment based on qualitative factors or upon cash flows (definite-lived intangible assets) and estimated royalties from revenue streams (indefinite-lived intangible assets) if necessary. Our goodwill is evaluated through qualitative factors and by comparing the fair value of the reporting unit to the carrying value of our net assets if necessary. Our intangible assets, goodwill, and other long-term assets may become impaired if the corresponding cash flows associated with these assets declines in future periods or if our market capitalization declines significantly in future periods. Although our current sales, cash flows, and market capitalization are sufficient to support the carrying basis of these long-lived assets, if our sales, cash flows, or common stock price decline, we may be faced with significant asset impairment charges that would have an adverse impact upon our results of operations.
Failure to comply with the terms and conditions of our credit facility may have an adverse effect upon our business and operations.
Our line of credit facility requires us to be in compliance with customary non-financial terms and conditions as well as specified financial ratios. Failure to comply with these terms and conditions or maintain adequate financial performance to comply with specific financial ratios entitles the lender to certain remedies, including the right to immediately call due any amounts outstanding on the line of credit. Such events would have an adverse effect upon our business and operations as there can be no assurance that we may be able to obtain other forms of financing or raise additional capital on terms that would be acceptable to us.
We may need additional capital in the future, and this capital may not be available to us on favorable terms or at all.
We may need to raise additional funds through public or private debt offerings or equity financings in order to:
|
·
|
Develop new services, programs, or offerings
|
|
·
|
Take advantage of opportunities, including expansion of the business
|
|
·
|
Respond to competitive pressures
|
Going forward, we will continue to incur costs necessary for the day-to-day operation and potential growth of the business and may use our available revolving line of credit facility and other financing alternatives, if necessary, for these expenditures. Our existing lending arrangement expires on March 31, 2019 and we expect to regularly renew our lending agreement to maintain the availability of this credit facility. Additional potential sources of liquidity available to us include factoring receivables, issuance of additional equity, or issuance of debt from public or private sources. If necessary, we will evaluate all of these options and select one or more of them depending on overall capital needs and the associated cost of capital.
Any additional capital raised through the sale of equity could dilute current shareholders’ ownership percentage in us. Furthermore, we may be unable to obtain the necessary capital on terms or conditions that are favorable to us, or at all.
We may have exposure to additional tax liabilities.
As a multinational company, we are subject to income taxes as well as non-income based taxes in both the United States and various foreign tax jurisdictions. Significant judgment is required in determining our worldwide provision for income taxes and other tax liabilities. In the normal course of a global business, there are many intercompany transactions and calculations where the ultimate tax determination is uncertain. As a result, we are routinely subject to audits by various taxing authorities. Although we believe that our tax estimates are reasonable, we cannot guarantee that the final determination of these tax audits will not be different from what is reflected in our historical income tax provisions and accruals.
We are also subject to non-income taxes such as payroll, sales, use, value-added, and property taxes in both the United States and various foreign jurisdictions. We are routinely audited by tax authorities with respect to these non-income taxes and may have exposure from additional non-income tax liabilities.
International hostilities, terrorist activities, and natural disasters may prevent us from effectively serving our clients and thus adversely affect our operating results.
Acts of terrorist violence, armed regional and international hostilities, and international responses to these hostilities, natural disasters, global health risks or pandemics, or the threat of or perceived potential for these events, could have a negative impact on our directly owned or licensee operations. These events could adversely affect our clients’ levels of business activity and precipitate sudden significant changes in regional and global economic conditions and cycles. These events also pose significant risks to our people and to physical facilities and operations around the world, whether the facilities are ours or those of our alliance partners or clients. By disrupting communications and travel and increasing the difficulty of obtaining and retaining highly skilled and qualified personnel, these events could make it difficult or impossible for us or our licensee partners to deliver services to clients. Extended disruptions of electricity, other public utilities, or network services at our facilities, as well as system failures at, or security breaches in, our facilities or systems, could also adversely affect our ability to serve our clients. While we plan and prepare to defend against each of these occurrences, we might be unable to protect our people, facilities, and systems against all such occurrences. In addition, our information systems’ disaster recovery plan may be insufficient to maintain our business at acceptable levels. We generally do not have insurance for losses and interruptions caused by terrorist attacks, conflicts, and wars. If these disruptions prevent us from effectively serving our clients or maintaining our other operations, our operating results could be adversely affected.
Ineffective internal controls could impact our business and operating results.
Our internal control over financial reporting may not prevent or detect misstatements because of its inherent limitations, including the possibility of human error, the circumvention or overriding of controls, or fraud. Even effective internal controls can provide only reasonable assurance with respect to the preparation and fair presentation of financial statements. If we fail to maintain the adequacy of our internal controls, including any failure to implement required new or improved controls, or if we experience difficulties in their implementation, our business and operating results may be harmed and we could fail to meet our financial reporting obligations.
ITEM 1B. UNRESOLVED STAFF COMMENTS
None.
ITEM 2. PROPERTIES
Our principal executive offices are located in Salt Lake City, Utah and as of August 31, 2016, all of the facilities used in our operations are leased. Our leased facilities primarily consist of sales and administrative offices both in the United States and various countries around the world. We also lease warehouse and distribution space at independent facilities in certain foreign countries. Our corporate headquarters lease is accounted for as a financing arrangement and all other facility lease agreements are accounted for as operating leases that expire at various dates through the year 2025.
Corporate Facilities
Corporate Headquarters and Administrative Offices:
Salt Lake City, Utah (7 buildings)
U.S./Canada Sales Offices
Regional Sales Offices:
United States (4 locations)
International Facilities
International Administrative/Sales Offices:
England (1 location)
Japan (1 location)
International Distribution Facilities:
Australia (1 location)
England (1 location)
Japan (1 location)
During the second quarter of fiscal 2016, we restructured the operations of our Australian direct office. As part of the restructuring we closed our sales offices located in Brisbane, Sydney, and Melbourne. Sales personnel in Australia work from their home offices, similar to many of our sales personnel located in the U.S. and Canada. In August 2015, we decided to combine our northeastern and southeastern United States sales regions. In connection with this decision, we closed our northeastern regional sales office located in Pennsylvania. There were no other significant changes to the properties used for our operations for the periods presented in this report. We consider our existing facilities to be in good condition and suitable for our current and anticipated level of operations in the upcoming fiscal year and in future periods.
On September 1, 2016 we opened three sales offices in China. Our offerings and products were previously sold in China by an independent licensee.
A significant portion of our corporate headquarters campus located in Salt Lake City, Utah is subleased to multiple unrelated entities.
ITEM 3. LEGAL PROCEEDINGS
We are the subject of certain legal actions, which we consider routine to our business activities. At August 31, 2016, we believe that, after consultation with legal counsel, any potential liability to the Company under these actions will not materially affect our financial position, liquidity, or results of operations.
ITEM 4. MINE SAFETY DISCLOSURES
Not applicable.
|
ITEM 5. MARKET FOR REGISTRANT’S COMMON EQUITY, RELATED STOCKHOLDER MATTERS AND ISSUER PURCHASES OF EQUITY SECURITIES
|
Our common stock is listed and traded on the New York Stock Exchange (NYSE) under the symbol “FC.” The following table sets forth the high and low sale prices per share for our common stock, as reported by the NYSE, for the fiscal years ended August 31, 2016 and 2015.
|
High
|
Low
|
|||||||
|
Fiscal Year Ended August 31, 2016:
|
||||||||
|
Fourth Quarter
|
$ | 17.53 | $ | 13.45 | ||||
|
Third Quarter
|
18.14 | 13.83 | ||||||
|
Second Quarter
|
18.28 | 14.36 | ||||||
|
First Quarter
|
17.81 | 13.77 | ||||||
|
Fiscal Year Ended August 31, 2015:
|
||||||||
|
Fourth Quarter
|
$ | 20.93 | $ | 14.39 | ||||
|
Third Quarter
|
20.20 | 17.03 | ||||||
|
Second Quarter
|
20.24 | 16.68 | ||||||
|
First Quarter
|
20.33 | 18.27 | ||||||
We did not pay or declare dividends on our common stock during the fiscal years ended August 31, 2016 or 2015. We currently anticipate that we will retain all available funds to repay our obligations, finance future growth and business opportunities, and to repurchase outstanding shares of our common stock.
As of October 31, 2016, we had 13,791,937 shares of common stock outstanding, which were held by 556 shareholders of record.
Purchases of Common Stock
The following table summarizes the purchases of our common stock by monthly fiscal periods during the quarter ended August 31, 2016:
|
Period
|
Total Number of Shares Purchased
|
Average Price Paid Per Share
|
Total Number of Shares Purchased as Part of Publicly Announced Plans or Programs
|
Maximum Dollar Value of Shares That May Yet Be Purchased Under the Plans or Programs(1)
(in thousands)
|
||||||||||||
|
May 29, 2016 to July 2, 2016
|
- | $ | - |
none
|
$ | 23,803 | ||||||||||
|
July 3, 2016 to July 30, 2016
|
328,209 | 15.32 | 328,209 | 18,775 | ||||||||||||
|
July 31, 2016 to August 31, 2016
|
67,500 | 16.55 | 67,500 | 17,658 | ||||||||||||
|
Total Common Shares
|
395,709 | $ | 15.53 | 395,709 | ||||||||||||
|
(1)
|
On January 23, 2015, our Board of Directors approved a new plan to repurchase up to $10.0 million of the Company’s outstanding common stock. All previously existing common stock repurchase plans were canceled and the new common share repurchase plan does not have an expiration date. On March 27, 2015, our Board of Directors increased the aggregate value of shares of Company common stock that may be purchased under the January 2015 plan to $40.0 million so long as we have either $10.0 million in cash and cash equivalents or have access to debt financing of at least $10.0 million. Under the terms of this expanded common stock repurchase plan, we have purchased 1,291,347 shares of our common stock for $22.3 million through August 31, 2016.
|
The actual timing, number, and value of common shares repurchased under this plan will be determined at our discretion and will depend on a number of factors, including, among others, general market and business conditions, the trading price of common shares, and applicable legal requirements. The Company has no obligation to repurchase any common shares under the authorization, and the repurchase plan may be suspended, discontinued, or modified at any time for any reason.
Performance Graph
The following graph demonstrates a five-year comparison of cumulative total returns for Franklin Covey Co. common stock, the S&P SmallCap 600 Index, and the S&P 600 Commercial & Professional Services Index. The graph assumes an investment of $100 on August 31, 2011 in each of our common stock, the stocks comprising the S&P SmallCap 600 Index, and the stocks comprising the S&P 600 Commercial & Professional Services Index. Each of the indices assumes that all dividends were reinvested.
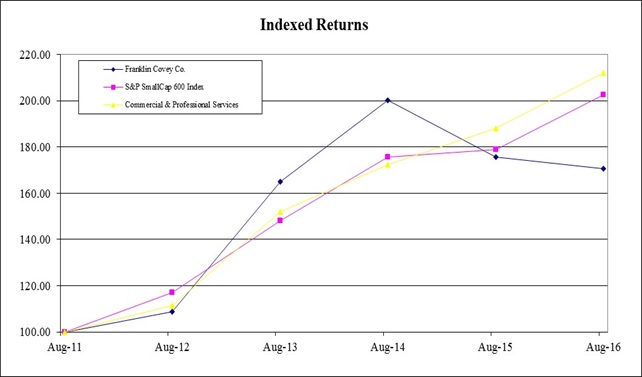
The stock performance shown on the performance graph above is not necessarily indicative of future performance. The Company will not make nor endorse any predictions as to our future stock performance.
The performance graph above is being furnished solely to accompany this report on Form 10-K pursuant to Item 201(e) of Regulation S-K, and is not being filed for purposes of Section 18 of the Securities Exchange Act of 1934, as amended, and is not to be incorporated by reference into any filing of the Company, whether made before or after the date hereof, regardless of any general incorporation language in such filing.
ITEM 6. SELECTED FINANCIAL DATA
The selected consolidated financial data presented below should be read in conjunction with our consolidated financial statements and related footnotes as found in Item 8 of this report on Form 10-K.
|
August 31,
|
2016
|
2015(1)
|
2014(1)
|
2013(1)
|
2012
|
|||||||||||||||
|
In thousands, except per-share data
|
||||||||||||||||||||
|
Income Statement Data:
|
||||||||||||||||||||
|
Net sales
|
$ | 200,055 | $ | 209,941 | $ | 205,165 | $ | 190,924 | $ | 170,456 | ||||||||||
|
Gross profit
|
133,154 | 138,089 | 138,266 | 128,989 | 112,683 | |||||||||||||||
|
Income from operations
|
13,849 | 19,529 | 24,765 | 21,614 | 17,580 | |||||||||||||||
|
Income before income taxes
|
11,911 | 17,412 | 21,759 | 19,398 | 13,747 | |||||||||||||||
|
Income tax provision
|
4,895 | 6,296 | 3,692 | 5,079 | 5,906 | |||||||||||||||
|
Net income
|
7,016 | 11,116 | 18,067 | 14,319 | 7,841 | |||||||||||||||
|
Earnings per share:
|
||||||||||||||||||||
|
Basic
|
$ | .47 | $ | .66 | $ | 1.08 | $ | .83 | $ | .44 | ||||||||||
|
Diluted
|
.47 | .66 | 1.07 | .80 | .43 | |||||||||||||||
|
Balance Sheet Data:
|
||||||||||||||||||||
|
Total current assets
|
$ | 89,741 | $ | 95,425 | $ | 93,016 | $ | 81,108 | $ | 64,915 | ||||||||||
|
Other long-term assets
|
13,713 | 14,807 | 14,785 | 9,875 | 9,534 | |||||||||||||||
|
Total assets
|
190,871 | 200,645 | 205,186 | 189,405 | 164,080 | |||||||||||||||
|
Long-term obligations
|
48,511 | 36,978 | 36,885 | 41,100 | 40,368 | |||||||||||||||
|
Total liabilities
|
97,156 | 75,139 | 78,472 | 82,899 | 73,525 | |||||||||||||||
|
Shareholders’ equity
|
93,715 | 125,506 | 126,714 | 106,506 | 90,555 | |||||||||||||||
|
Cash flows from operating activities
|
$ | 32,665 | $ | 26,190 | $ | 18,124 | $ | 15,528 | $ | 15,562 | ||||||||||
_______________________
|
(1)
|
We elected to amend previously filed U.S. federal income tax returns to claim foreign tax credits instead of foreign tax deductions and recognized significant income tax benefits which reduced our effective income tax rate during these years.
|
ITEM 7. MANAGEMENT’S DISCUSSION AND ANALYSIS OF FINANCIAL CONDITION AND RESULTS OF OPERATIONS
The following management’s discussion and analysis is intended to provide a summary of the principal factors affecting the results of operations, liquidity and capital resources, contractual obligations, and the critical accounting policies of Franklin Covey Co. (also referred to as we, us, our, the Company, and FranklinCovey) and subsidiaries. This discussion and analysis should be read together with the accompanying consolidated financial statements and related notes contained in Item 8 of this Annual Report on Form 10-K (Form 10-K) and the Risk Factors discussed in Item 1A of this Form 10-K. Forward-looking statements in this discussion are qualified by the cautionary statement under the heading “Safe Harbor Statement Under The Private Securities Litigation Reform Act Of 1995” contained later in Item 7 of this Form 10-K.
EXECUTIVE SUMMARY
General Overview
Franklin Covey Co. is a global company focused on individual and organizational performance improvement. Our mission is to “enable greatness in people and organizations everywhere,” and our 870 employees worldwide are organized to help individuals and organizations achieve sustained superior performance through changes in human behavior. Our expertise extends to seven crucial areas: Leadership, Execution, Productivity, Trust, Sales Performance, Customer Loyalty, and Educational improvement. We believe that our clients are able to utilize our content to create cultures whose hallmarks are high-performing, collaborative individuals, led by effective, trust-building leaders who execute with excellence and deliver measurably improved results for all of their key stakeholders.
In the training and consulting marketplace, we believe there are four important characteristics that distinguish us from our competitors.
|
1.
|
World Class Content – Our content is principle-centered and based on natural laws of human behavior and effectiveness. Our content is designed to build new skillsets, establish new mindsets, and provide enabling toolsets. When our content is applied consistently in an organization, we believe the culture of that organization will change to enable the organization to achieve their own great purposes.
|
|
2.
|
Transformational Impact and Reach – We hold ourselves responsible for and measure ourselves by our clients’ achievement of transformational results. Our commitment to achieving lasting impact extends to all of our clients—from CEOs to elementary school students, and from senior management to front-line workers in corporations, governmental, and educational environments.
|
|
3.
|
Breadth and Scalability of Delivery Options – We have a wide range of content delivery options, including: the All Access Pass and other intellectual property licenses, on-site training, training led through certified facilitators, on-line learning, blended learning, and organization-wide transformational processes, including consulting and coaching.
|
|
4.
|
Global Capability – We operate three regional sales offices in the United States; wholly owned subsidiaries in Australia, Japan, and the United Kingdom; and contract with licensee partners who deliver our offerings and provide services in over 150 other countries and territories around the world. On September 1, 2016, we opened three new sales offices in China and we expect that these offices will add to our global reach and capabilities.
|
We have some of the best-known offerings in the training industry, including a suite of individual-effectiveness and leadership-development training content based on the best-selling books, The 7 Habits
of Highly Effective People, The Speed of Trust, and The 4 Disciplines of Execution, and proprietary content in the areas of Execution, Sales Performance, Productivity, Customer Loyalty, and Education. Our offerings are described in further detail at www.franklincovey.com. The information contained in, or that can be accessed through, our website does not constitute a part of this annual report, and the descriptions found therein should not be viewed as a warranty or guarantee of results.
Business Development
All Access Pass
During fiscal 2016, we introduced the All Access Pass (AAP). The All Access Pass provides an intellectual property license to our clients that provides them with access to our world-class content, assessments, tools, and videos through a web-based portal. We believe that the AAP enables our clients to significantly improve their organizations through utilization of well-known established offerings or the use of specific topics and instruction from a variety of offerings to solve their specific organizational challenges.
The launch of the All Access Pass was well received by our existing and potential clients during fiscal 2016. However, based on the nature of AAP sales and applicable accounting guidance for multiple element arrangements, we defer a portion of AAP sales and recognize the deferred portion over the life of the contract. For instance, during fiscal 2016 we invoiced $23.2 million of AAP contracts and related services and recognized $15.9 million of this amount as sales. Of the $8.1 million increase in deferred revenue at August 31, 2016, $7.3 million was attributable to AAP contracts invoiced during fiscal 2016. Future periods will benefit from the recognition of these deferred revenues.
As our experience with the All Access Pass has continued to evolve, and the necessity of providing regular content updates to our clients has become more evident, subsequent to August 31, 2016, for new contracts we have determined to provide our clients with access to updated content, which requires us to account for future sales of AAP contracts as subscriptions. Accordingly, substantially all AAP contract amounts will be deferred and recognized as revenue over the contracted period. We anticipate that this change in revenue recognition will have a profound impact on reported revenues and operating results as AAP sales grow and the transition of other sale types, such as facilitator sales, to AAP or other intellectual property sales continues in future periods. Accordingly, we believe that reported revenues and operating results will be significantly less during fiscal 2017 when compared with fiscal 2016 financial measures. However, since AAP contracts are invoiced at the inception of the contract, we do not believe that our cash flows from operating activities will be adversely impacted by the increased deferral of AAP revenues.
New China Direct Offices
On September 1, 2016, we opened three new sales offices in China. Prior to fiscal 2017, our offerings were sold in China through an independent licensee. We were able to hire many of the previous licensee’s sales and administrative personnel in the transition from a licensee to a directly owned operation. Accordingly, we anticipate that direct office and overall consolidated sales will be favorably impacted by these new offices since we will recognize total sales in China rather than a smaller percentage of sales, which were previously recorded as royalty revenue through our international licensee division. We currently believe that there are potential opportunities for growth and expansion of our offerings in China.
Financial Overview
Compared with fiscal 2015, our consolidated sales and overall financial results for the fiscal year ended August 31, 2016 were significantly impacted by the following items:
|
·
|
Launch of the All Access Pass – As previously described, we launched the AAP in fiscal 2016 and invoiced our clients for $23.2 million of AAP services and products. Approximately $7.3 million of those invoiced contracts remain unrecognized at August 31, 2016 and will benefit future periods. However, the deferral of AAP revenue had an unfavorable impact on our financial results in fiscal 2016 when compared with fiscal 2015 as these deferred revenues also have high gross margins and had a substantial corresponding impact on our operating income during the fiscal year.
|
|
·
|
Large Government Contract – In fiscal 2015, we renewed a contract with a large federal agency and recognized $6.6 million of revenue from this contract during fiscal 2015. However, due to administrative changes at the federal agency, the contract was not opened for renewal bids in fiscal 2016. We recognized $3.9 million of operating income from this large government contract in fiscal 2015 that did not repeat during fiscal 2016.
|
|
·
|
Foreign Exchange Rates – The U.S. dollar strengthened against many of the functional currencies in which our direct offices and international licensees conduct business. The strengthening U.S. dollar had a $0.9 million adverse impact on our consolidated sales (primarily during the first two quarters of fiscal 2016) and had a $0.8 million adverse impact on our operating income. Foreign exchange rate fluctuations did not materially impact our gross profit as $0.6 million of the adverse foreign exchange impacted our licensee royalty revenues, which do not have a significant cost of sales.
|
Including the factors noted above, our net sales in fiscal 2016 were $200.1 million compared with $209.9 million in fiscal 2015, and $205.2 million in fiscal 2014. Our fiscal 2016 fourth-quarter sales remained strong and totaled $64.8 million, which excludes a significant deferral of invoiced AAP contracts. For instance, we invoiced $73.1 million in the fourth quarter of fiscal 2016 compared with $70.7 million in the fourth quarter of fiscal 2015. The following table sets forth consolidated sales data by category and by our primary delivery channels (in thousands):
|
YEAR ENDED
AUGUST 31,
|
2016
|
Percent change
|
2015
|
Percent change
|
2014
|
|||||||||||||||
|
Sales by Category:
|
||||||||||||||||||||
|
Training and consulting services
|
$ | 189,661 | (5 | ) | $ | 198,695 | 3 | $ | 193,720 | |||||||||||
|
Products
|
6,009 | (13 | ) | 6,885 | (8 | ) | 7,518 | |||||||||||||
|
Leasing
|
4,385 | 1 | 4,361 | 11 | 3,927 | |||||||||||||||
| $ | 200,055 | (5 | ) | $ | 209,941 | 2 | $ | 205,165 | ||||||||||||
|
Sales by Segment:
|
||||||||||||||||||||
|
Direct offices
|
$ | 103,613 | (8 | ) | $ | 113,087 | (2 | ) | $ | 115,085 | ||||||||||
|
Strategic markets
|
29,778 | (20 | ) | 37,039 | 16 | 31,841 | ||||||||||||||
|
Education practice
|
40,361 | 22 | 33,128 | 7 | 30,883 | |||||||||||||||
|
International licensees
|
17,629 | 3 | 17,100 | - | 17,065 | |||||||||||||||
|
Corporate and other
|
8,674 | (10 | ) | 9,587 | (7 | ) | 10,291 | |||||||||||||
| $ | 200,055 | (5 | ) | $ | 209,941 | 2 | $ | 205,165 | ||||||||||||
Our gross profit for fiscal 2016 was $135.2 million, compared with $138.1 million in the prior year. The decrease in gross profit was primarily due to sales activity as described above. Our gross margin, which is gross profit as a percent of sales, increased to 67.6 percent compared with 65.8 percent in fiscal 2015. The improvement was primarily due to a change in the mix of sales, which produced increased intellectual property sales, including All Access Pass sales, and decreased onsite presentations.
Our operating expenses increased $2.7 million compared with fiscal 2015 primarily due to a $4.8 million increase in selling, general, and administrative expenses, which was partially offset by a $1.3 million decrease in impaired asset charges, a $0.5 million decrease in depreciation expense, and a $0.5 million decrease in intangible asset amortization expense. The increase in selling, general, and administrative expenses was primarily related to the addition of new sales and sales support personnel; a $1.5 million increase in the contingent consideration liability from a previous business acquisition; and $0.6 million of increased non-cash stock-based compensation expense.
Our income from operations for fiscal 2016 reflected the factors noted above and was $13.8 million, compared with $19.5 million in the prior year. Pre-tax income was $11.9 million for fiscal 2016 compared with $17.4 million in fiscal 2015. Our effective income tax rate was approximately 41 percent in fiscal 2016 compared with approximately 36 percent in fiscal 2015. During fiscal 2015, we finalized the calculations relating to the amendment of previously filed U.S. federal income tax returns to realize foreign tax credits previously treated as expired under the tax positions taken in the original returns. The income tax benefit recognized from these foreign tax credits totaled $0.6 million in fiscal 2015. Our income tax provision was $4.9 million in fiscal 2016 compared with $6.3 million in the prior year. Net income for fiscal 2016 was $7.0 million, or $.47 per diluted share, compared with $11.1 million, or $.66 per diluted share, in fiscal 2015.
Further details regarding these items can be found in the comparative analysis of fiscal 2016 with fiscal 2015 as discussed within this management’s discussion and analysis.
Our liquidity position remained strong during fiscal 2016 and we had $10.5 million of cash and cash equivalents at August 31, 2016 compared with $16.2 million at August 31, 2015, with no borrowings on our revolving line of credit at the end of either fiscal 2016 or fiscal 2015. Our net working capital (current assets minus current liabilities) was $35.7 million at August 31, 2016 compared with $55.8 million at the end of fiscal 2015.
Our primary source of cash is our ongoing business operations. Cash flows from operating activities increased 25 percent to $32.7 million in fiscal 2016 compared with $26.2 million in fiscal 2015. Historically, we have funded our operations, capital purchases, curriculum development, share repurchases, and business acquisitions from our operating activities and from our revolving line of credit facility. Our positive cash flows in fiscal 2016 enabled us to repurchase over $43 million of our common stock during the year, including a tender offer that was completed in January 2016. We anticipate that cash flows from our operating activities, proceeds from our line of credit facility, and term-loan borrowing will be sufficient to support our operations for the foreseeable future. For further information regarding our cash flows and liquidity refer to the Liquidity and Capital Resources discussion found later in this management’s discussion and analysis.
Key Growth Objectives
We believe that the combination of: (1) creating best-in-class content and solutions in each of our practice areas, and continuing to invest in the refinement and expansion of each of our content categories; and (2) significantly increasing the size and capabilities of our various sales and content-delivery channels are the foundation of our long-term strategic growth plan. Each year we make significant investments in the development and enhancement of our existing content, and the development of new services, features, and products that help individuals and organizations achieve their own great purposes. We expect to continue the introduction of new or refreshed content and delivery methods and consider them key to our long-term success. At the same time, we continue to make substantial investments each year to expand the size and capabilities of our sales and delivery forces to take our solutions to market in a way which attracts and retains client organizations.
One of our key strategic objectives is to consistently deliver quality results to our clients. This initiative is focused on ensuring that our content and offerings are best-in-class, and that they have a measurable, lasting impact on our clients’ results. We believe that measurable improvement in our clients’ organizations is key to retaining current clients and to obtaining new sales opportunities.
Other key factors that influence our operating results include: the size and productivity of our sales force; the number and productivity of our international licensee operations; the number of organizations that are active customers; the number of people trained within those organizations; the continuation or renewal of existing services contracts, especially All Access Pass renewals; the availability of budgeted training spending at our clients and prospective clients, which, in certain content categories, can be significantly influenced by general economic conditions; and our ability to manage operating costs necessary to develop and provide meaningful training and related services and products to our clients.
Our fiscal year ends on August 31, and unless otherwise indicated, fiscal 2016, fiscal 2015, and fiscal 2014 refer to the twelve-month periods ended August 31, 2016, 2015, 2014, and so forth.
RESULTS OF OPERATIONS
The following table sets forth, for the fiscal years indicated, the percentage of total sales represented by the line items through income before income taxes in our consolidated income statements. This table should be read in conjunction with the following discussion and analysis and the consolidated financial statements, including the related notes to the consolidated financial statements.
|
YEAR ENDED
AUGUST 31,
|
2016
|
2015
|
2014
|
|||||||||
|
Sales:
|
||||||||||||
|
Training and consulting services
|
94.8 | % | 94.6 | % | 94.4 | % | ||||||
|
Products
|
3.0 | 3.3 | 3.7 | |||||||||
|
Leasing
|
2.2 | 2.1 | 1.9 | |||||||||
|
Total sales
|
100.0 | 100.0 | 100.0 | |||||||||
|
Cost of sales:
|
||||||||||||
|
Training and consulting services
|
29.6 | 31.6 | 30.0 | |||||||||
|
Products
|
1.6 | 1.6 | 1.7 | |||||||||
|
Leasing
|
1.2 | 1.0 | 0.9 | |||||||||
|
Total cost of sales
|
32.4 | 34.2 | 32.6 | |||||||||
|
Gross profit
|
67.6 | 65.8 | 67.4 | |||||||||
|
Selling, general, and administrative
|
56.8 | 51.8 | 51.6 | |||||||||
|
Impaired assets
|
- | 0.6 | 0.1 | |||||||||
|
Restructuring costs
|
0.4 | 0.3 | - | |||||||||
|
Depreciation
|
1.9 | 2.0 | 1.7 | |||||||||
|
Amortization
|
1.6 | 1.8 | 1.9 | |||||||||
|
Total operating expenses
|
60.7 | 56.5 | 55.3 | |||||||||
|
Income from operations
|
6.9 | 9.3 | 12.1 | |||||||||
|
Interest income
|
0.2 | 0.2 | 0.2 | |||||||||
|
Interest expense
|
(1.1 | ) | (1.0 | ) | (1.1 | ) | ||||||
|
Discount on related party receivable
|
- | (0.2 | ) | (0.6 | ) | |||||||
|
Income before income taxes
|
6.0 | % | 8.3 | % | 10.6 | % | ||||||
FISCAL 2016 COMPARED WITH FISCAL 2015
Sales
We offer a variety of training courses, consulting services, and training-related products that are focused on solving organizational problems which require a change in human behavior. Our training and consulting solutions are provided both domestically and internationally through the All Access Pass, our sales and delivery personnel, client facilitators, international licensees, and the internet on various web-based delivery platforms. The following sales analysis for the fiscal year ended August 31, 2016 is based on activity through our operating segments as shown in the preceding comparative sales table.
Direct Offices – This channel includes our three regional sales offices that serve clients in the United States and Canada; our directly owned international offices in Japan, the United Kingdom, and Australia; and our public program operations. As previously mentioned, we introduced the AAP in our domestic direct offices in late January 2016. The AAP was well received by existing and new clients and we invoiced $19.4 million of new AAP contracts during fiscal 2016 through our direct
offices, including $10.7 million in the fourth quarter. However, in accordance with applicable revenue recognition guidance, we deferred $6.2 million (net of amounts previously deferred and subsequently recognized during fiscal 2016) of revenue that will be recognized in fiscal 2017 over the lives of the respective contracts. While sales of new AAP contracts grew significantly in the fourth quarter compared with previous quarters of fiscal 2016, our onsite presentation sales declined compared with the prior year. Our international direct office sales declined by $1.7 million during the fiscal year, primarily due to decreased demand for certain programs in these offices and $0.2 million of unfavorable foreign exchange rates, primarily during the first half of fiscal 2016.
We continue to be encouraged by the initial acceptance and strengthening business pipeline for potential AAP sales. While we expect increased AAP sales to improve overall revenue levels, a portion of AAP sales will continue to be deferred into future periods. As previously mentioned, subsequent to August 31, 2016 we decided to allow clients to have access to content upgrades for new contracts, which generally requires us to account for future AAP contracts on a subscription basis. Accordingly, all invoiced AAP contract amounts will be deferred and recognized as revenue over the contracted service period. We anticipate that this change in revenue recognition will have a profound impact on reported revenues and operating results as AAP sales grow and the transition of other sale types, such as facilitator sales, to AAP or other intellectual property sales continues in future periods. Accordingly, we believe that reported revenues and operating results will be significantly less during fiscal 2017 when compared with fiscal 2016 financial measures for the corresponding periods. However, since AAP contracts are invoiced at the inception of the contract, we do not believe that our cash flows from operating activities will be adversely impacted by the deferral of AAP revenues.
In addition, we expect our newly opened offices in China to increase sales from our direct offices in future periods. Our offerings were previously sold in China through an independent licensee.
Strategic Markets – This division includes our government services office, Sales Performance practice, Customer Loyalty practice, and the new “Global 50” group, which is specifically focused on sales to large, multi-national organizations. The $7.3 million decrease in sales was primarily due to the renewal of a $6.6 million government contract in fiscal 2015, which did not repeat in fiscal 2016 due to administrative changes at the federal agency that resulted in the contract not being opened for renewal bids, and a $2.7 million decrease in Customer Loyalty practice sales. Partially offsetting these decreases were $1.0 million of sales from our Global 50 group, $0.7 million of increased government services sales (excluding the impact of the government contract that was not renewed), and $0.3 million of increased revenue from the Sales Performance practice. Our Customer Loyalty practice sales decreased primarily due to the termination of a contract with a large, multi-unit retailer. Sales Performance practice sales increased due to new contracts obtained primarily during the first half of fiscal 2016.
Education Practice – Our Education practice division is comprised of our domestic and international Education practice operations (focused on sales to educational institutions) and includes our widely acclaimed The Leader In Me program designed for students primarily in K-6 elementary schools. We continue to see increased demand for The Leader in Me program in many school districts in the United States as well as in some international locations, which contributed to a $7.2 million, or 22 percent, increase in Education practice revenues compared with the prior year. At August 31, 2016 over 3,000 schools around the world were using The Leader in Me curriculum. Sales of subscription services during the previous fiscal year also improved sales during fiscal 2016 as we recognized a portion of the revenue that was deferred in previous periods. We continue to make substantial investments in new sales personnel for our Education practice and expect that our sales will continue to grow compared with prior periods in the future.
International Licensees – In countries or foreign locations where we do not have a directly owned office, our training and consulting services are delivered through independent licensees, which may translate and adapt our offerings to local preferences and customs, if necessary. Our international licensee royalties increased $0.5 million as certain of our licensee partners’ sales increased compared
with the prior year. Licensee sales during the fiscal year ended August 31, 2016 were reduced by $0.6 million due to foreign exchange rate fluctuations as the U.S. dollar strengthened during the year. As previously mentioned, effective September 1, 2016, we opened three new sales offices in China and we will recognize actual sales in China rather than royalty revenue on our licensee’s sales. Accordingly, we anticipate a significant decrease in total licensee sales during fiscal 2017 when compared with the corresponding periods of fiscal 2016. While we continue to be confident in our other international licensee partners’ ability to grow during future periods, a strengthening U.S. dollar may offset all or a portion of their growth in their functional currencies.
Corporate and other – Our “corporate and other” sales are mainly comprised of leasing, books and audio product sales, and shipping and handling revenues. During fiscal 2016, these sales decreased primarily due to a $0.4 million decrease in shipping and handling revenues and a $0.2 million decrease in book and audio revenues from royalties on publications.
Gross Profit
Gross profit consists of net sales less the cost of services provided or the cost of goods sold. Our cost of sales includes the direct costs of delivering content onsite at client locations, including presenter costs, materials used in the production of training products and related assessments, assembly, manufacturing labor costs, and freight. Gross profit may be affected by, among other things, the mix of practice solutions sold to clients, prices of materials, labor rates, changes in product discount levels, and freight costs.
Our gross profit for the fiscal year ended August 31, 2016 was $135.2 million compared with $138.1 million in fiscal 2015. The decrease in gross profit was primarily due to sales activity during fiscal 2016 as previously described. Our gross margin for fiscal 2016 increased to 67.6 percent of sales compared with 65.8 percent in fiscal 2015. The improvement in gross margin was primarily due to a change in the mix of sales, which produced increased intellectual property sales, including All Access Pass sales, decreased onsite presentations, increased international licensee royalty revenues, and decreased costs associated with our online offerings as we restructured our online program operations during the first quarter of fiscal 2016.
Operating Expenses
Our operating expenses consisted of the following for the periods indicated (in thousands):
|
YEAR ENDED AUGUST 31,
|
2016
|
2015
|
$ Change
|
% Change
|
||||||||||||
|
Selling, general, and administrative
|
$ | 108,930 | $ | 106,231 | $ | 2,699 | 3 | |||||||||
|
Increase to NinetyFive 5 contingent payment liability
|
1,538 | 35 | 1,503 | 4,294 | ||||||||||||
|
Stock-based compensation expense
|
3,121 | 2,536 | 585 | 23 | ||||||||||||
|
Total selling, general, and administrative expense
|
113,589 | 108,802 | 4,787 | 4 | ||||||||||||
|
Impaired assets
|
- | 1,302 | (1,302 | ) | (100 | ) | ||||||||||
|
Restructuring costs
|
776 | 587 | 189 | 32 | ||||||||||||
|
Depreciation
|
3,677 | 4,142 | (465 | ) | (11 | ) | ||||||||||
|
Amortization
|
3,263 | 3,727 | (464 | ) | (12 | ) | ||||||||||
| $ | 121,305 | $ | 118,560 | $ | 2,745 | 2 | ||||||||||
Selling, General and Administrative (SG&A) – The increase in our SG&A expenses during fiscal 2016 was primarily due to 1) a $2.0 million increase in associate costs, primarily due to new sales and sales-related personnel; 2) a $1.5 million increase in the contingent earn out liability associated with the acquisition of NinetyFive 5; 3) a $1.4 million increase in software costs primarily related to our new enterprise resource planning system that is expected to be placed in service during mid-fiscal 2017; 4) a
$1.1 million increase in bad debt expense resulting primarily from the write off of an Education practice contract and receivables from a large retailer that declared bankruptcy, plus other increases to the allowance for doubtful accounts throughout the fiscal year; and 5) a $0.6 million increase in non-cash stock-based compensation. We continue to invest in new sales and sales-related personnel and had 204 client partners at August 31, 2016 compared with 180 client partners at August 31, 2015. A significant improvement in Sales Performance practice EBITDA during the first half of fiscal 2016 increased the probability of a second $2.2 million contingent consideration payment to the former owners of NinetyFive 5, which led to the significant increase in expense during fiscal 2016. Partially offsetting these increases were $0.8 million of decreased foreign exchange losses, $0.8 million of reduced advertising and promotional expenses, and cost savings in various other areas of our operations.
Restructuring Costs – In the fourth quarter of fiscal 2016, we restructured the operations of certain of our domestic sales offices to reduce ongoing operational costs. The cost of this restructuring was $0.4 million and was primarily comprised of employee severance costs, which were paid in August and September 2016.
During fiscal 2016 we also restructured the operations of our Australian direct office. The restructuring was designed to reduce ongoing operating costs by closing the sales offices in Brisbane, Sydney, and Melbourne, and by reducing headcount for administrative functions. Our remaining sales and support personnel in Australia now work from home offices, as do most of our sales personnel located in the U.S. and Canada. The $0.4 million charge recorded during the second quarter of fiscal 2016 was primarily for office closure costs, including remaining lease expense on the offices that were closed, and for employee severance costs.
Depreciation – Depreciation expense decreased due to certain assets becoming fully depreciated during fiscal 2016. Based on previous property and equipment acquisitions during fiscal 2016 and expected capital additions during fiscal 2017, we expect depreciation expense will total approximately $3.9 million in fiscal 2017.
Amortization – Our consolidated amortization expense decreased compared with the prior year due to the amortization of previously acquired intangibles, which are amortized more heavily early in their estimated useful lives. Based on current carrying amounts of intangible assets and remaining estimated useful lives, we anticipate amortization expense from intangible assets will total $2.9 million in fiscal 2017.
Income Taxes
Our effective tax rate for the fiscal year ended August 31, 2016 was approximately 41 percent compared with approximately 36 percent in fiscal 2015.
Our effective tax rate increased primarily due to the fiscal 2015 recognition of benefits from claiming foreign tax credits instead of foreign tax deductions for fiscal 2008 through fiscal 2010. In fiscal 2015 we finalized the calculations of the impact of amending previously filed federal income tax returns to realize foreign tax credits previously treated as expired under the tax positions taken in the original returns. The income tax benefit recognized from these foreign tax credits totaled $0.6 million in fiscal 2015. As of August 31, 2015, we have amended all available prior year returns to claim foreign tax credits instead of tax deductions. In fiscal 2016 we also recorded a valuation allowance of $0.3 million against the deferred tax assets of a foreign subsidiary with recent and substantial taxable losses. Consistent with fiscal 2016, we expect our effective income tax rate to remain near statutory rates in future periods.
During fiscal 2016, we paid $3.4 million in cash for income taxes, which was less than our income tax provision for fiscal 2016 primarily due to our utilization of foreign tax credit carryforwards. Over the next four to six years, we expect that our total cash paid for income taxes will be less than our total income tax provision if All Access Pass sales continue to increase. A significant increase in AAP sales will create substantial amounts of deferred revenue both for financial statement and income tax purposes and may result in reduced income before taxes. Accordingly, the time over which we will utilize our foreign tax credit carryforwards and other deferred income tax assets may lengthen, resulting in lower total cash payments for income taxes than our income tax provision amounts over future periods.
FISCAL 2015 COMPARED WITH FISCAL 2014
Sales
The following sales analysis for the fiscal year ended August 31, 2015 is based on activity through our operating segments as previously described, and as shown in the preceding comparative sales table.
Direct Office Sales – During fiscal 2015, our direct office sales were primarily impacted by a $1.9 million decrease in sales from our domestic sales offices and by $3.7 million of adverse foreign exchange rate fluctuations at our foreign direct offices. The decrease over the prior year at our domestic sales offices was primarily due to the successful second quarter fiscal 2014 launch of the re-created 7 Habits Signature Program, which is our best-selling offering worldwide, and $0.5 million of adverse impact from foreign exchange rates on sales in Canada. During fiscal 2015, we did not launch an offering with such widespread acceptance.
Reported sales from our international direct offices were significantly impacted by the U.S. dollar strengthening against the functional currencies of these offices. The fluctuation in exchange rates produced a $3.7 million decrease in translated sales when compared with the prior year. Excluding the unfavorable impact of foreign currency translation, sales grew in two of our three international direct offices when compared with the prior year. Our office in the United Kingdom maintained the momentum gained in fiscal 2014 and grew sales by 39 percent (in functional currency), primarily due to a $1.0 million contract obtained during the first quarter combined with strong growth in new clients and contracts during the year. Despite a slowing economy and weak first quarter performance, our office in Japan increased its sales by one percent in functional currency compared with the same period of fiscal 2014. The weakening Japanese Yen created a $2.4 million unfavorable impact on translated sales from our Japan office. Sales decreased by $0.8 million at our office in Australia, of which $0.6 million was due to the translation of Australian dollars into U.S. dollars. The remaining decrease was primarily due to reduced demand during the first half of fiscal 2015.
Strategic Markets – Sales through our strategic market segment increased $5.2 million compared with fiscal 2014. The improvement was primarily due to a $3.5 million increase in government services sales and a $1.9 million increase in Sales Performance practice revenues. The increase in government service sales was due to 1) the renewal of a large government contract that was obtained during the first quarter of fiscal 2015 and the significant delivery of services on this contract during fiscal 2015; and 2) new contracts obtained with other governmental entities during the year. Our Sales Performance practice grew as a result of increased demand and new contracts for these services during fiscal 2015. Partially offsetting these increases was a $0.2 million, or two percent, decrease in our Customer Loyalty practice revenues.
Education Practice – Our Education practice sales increased $2.2 million, or seven percent, compared with fiscal 2014. We continue to see increased demand for The Leader in Me program in many school districts in the United States as well as in some international locations, which contributed to the increase in Education practice revenues. At August 31, 2015, over 2,500 schools were using The Leader in Me program. We have made substantial investments in new sales and sales support personnel in our Education practice and we expect that our sales will continue to grow compared with prior periods.
International Licensees – Despite the unfavorable effects of a strengthening U.S. dollar during fiscal 2015, certain of our licensees had increased sales, which provided a slight increase in our international licensee sales when compared with fiscal 2014. Foreign exchange rates had a $1.0 million adverse impact on our international licensee royalty revenues during the fiscal year ended August 31, 2015.
Corporate and Other – Our other sales decreased primarily due to a $0.6 million contract that was won in the third quarter of fiscal 2014 and which did not repeat in fiscal 2015 and decreased shipping and handling revenues. These declines were partially offset by additional leasing revenues from new contracts on our corporate campus located in Salt Lake City, Utah.
Gross Profit
Our consolidated gross profit for the fiscal year ended August 31, 2015 was $138.1 million compared with $138.3 million in fiscal 2014. Gross profit in fiscal 2015 was adversely impacted by the effects of foreign exchange on translated sales and cost of sales; $1.3 million of increased capitalized curriculum amortization costs, primarily resulting from fiscal 2014 expenditures to re-create the 7 Habits Signature Program; the mix of offerings sold, including lower intellectual property license sales, which have higher gross margins than the majority of our other offerings; and additional coaches hired during the year to support growth in the Education practice. Our consolidated gross margin for fiscal 2015 reflected the combination of the above factors and was 65.8 percent of sales in fiscal 2015 compared with 67.4 percent in fiscal 2014.
Operating Expenses
Our operating expenses consisted of the following for the periods indicated (in thousands):
|
YEAR ENDED AUGUST 31,
|
2015
|
2014
|
$ Change
|
% Change
|
||||||||||||
|
Selling, general, and administrative
|
$ | 108,802 | $ | 105,801 | $ | 3,001 | 3 | |||||||||
|
Impaired assets
|
1,302 | 363 | 939 | 259 | ||||||||||||
|
Restructuring costs
|
587 | - | 587 | n/a | ||||||||||||
|
Depreciation
|
4,142 | 3,383 | 759 | 22 | ||||||||||||
|
Amortization
|
3,727 | 3,954 | (227 | ) | (6 | ) | ||||||||||
| $ | 118,560 | $ | 113,501 | $ | 5,059 | 4 | ||||||||||
Selling, General and Administrative – Our SG&A expenses during fiscal 2015 increased by $3.0 million compared with fiscal 2014. The increase in SG&A expenses over the prior year was primarily due to 1) a $3.7 million increase related to the addition of new sales and sales support personnel in our direct offices and Education practice, and increased commissions on higher sales; 2) fiscal 2014 reductions to estimated contingent earn out payment from the acquisition of Ninety-Five 5 LLC totaling $1.6 million, which did not repeat in fiscal 2015; and 3) $1.0 million of increased foreign exchange transaction losses as the U.S. dollar strengthened during the year. The impact of these increases was partially offset by reduced executive short-term incentive bonus expense as specified growth goals were not fully met, by decreased stock-based compensation expense, by the translation of foreign currency denominated expenses into U.S. dollars, and by cost cutting efforts in various areas of our operations.
Impaired Assets – During fiscal 2015 we impaired $1.3 million of long-term assets, which consisted of $0.6 million of capitalized curriculum that was discontinued (and related prepaid royalties), $0.5 million of long-term receivables from FC Organizational Products (FCOP), and an investment in an unconsolidated subsidiary totaling $0.2 million. We determined that we will receive payment from FCOP for certain rent expenses earlier than previously estimated. While this determination improves cash flows from FCOP in the short term, the present value of our share of cash distributions to cover remaining long-term receivables was reduced and was less than the present value of the receivables previously recorded and accordingly, we recalculated the discount on the long-term receivables and impaired the difference. During the fourth quarter of fiscal 2015, we became aware of financial difficulties at an unconsolidated subsidiary in which we previously invested $0.2 million. Based on this information, we determined that the carrying value of this investment would not be recoverable and we wrote off the investment. We previously accounted for this investment using the cost method based on our insignificant ownership and influence in the entity.
Restructuring Costs – During the fourth quarter of fiscal 2015, we realigned our regional sales offices that serve the United States and Canada. As a result of this realignment, we closed our northeastern regional
sales office located in Pennsylvania and created three geographic sales regions. In connection with this restructuring, we incurred costs related to involuntary severance and office closure costs totaling $0.6 million. The majority of these costs were paid prior to August 31, 2015.
Depreciation – Depreciation expense increased by $0.8 million compared with fiscal 2014 primarily due to the addition of fixed assets, which consisted primarily of computer hardware, software, and leasehold improvements during fiscal 2015 and in the previous year.
Amortization – Our consolidated amortization expense decreased $0.2 million compared with the prior year due to the amortization of previously acquired intangibles, which are amortized more heavily early in their estimated useful lives.
Discount on Related Party Receivable
We record receivables from FCOP for reimbursement of certain operating costs, office space rent, and for working capital and other advances that we make, even though we are not contractually required to make advances or absorb the losses of FCOP. Based on expected payment, some of these receivables are recorded as long-term receivables and are required to be recorded at net present value. We discounted the long-term portion of the FCOP receivable based on forecasted repayments at a discount rate of 15 percent, which was the estimated risk-adjusted borrowing rate of FCOP.
During fiscal 2015, we adjusted the discount and carrying value of our receivables from FCOP as described above in the section entitled “Impaired Assets.” The corresponding adjustment to the discount on our long-term receivables from FCOP totaled $0.4 million. We also adjusted the discount on the long-term portion of our receivables from FCOP in fiscal 2014.
Income Taxes
Our effective tax rate for the fiscal year ended August 31, 2015 was approximately 36 percent compared with approximately 17 percent in fiscal 2014.
Our effective tax rate increased primarily due to the fiscal 2014 recognition of benefits from claiming foreign tax credits instead of foreign tax deductions for fiscal 2008 through fiscal 2010. The net tax benefit of claiming these foreign tax credits totaled $4.2 million in fiscal 2014. In fiscal 2015 we finalized the calculations of the impact of amending previously filed federal income tax returns to realize foreign tax credits previously treated as expired under the tax positions taken in the original returns. The income tax benefit recognized from these foreign tax credits totaled $0.6 million in fiscal 2015. At August 31, 2015 we have amended all available prior year returns to claim foreign tax credits instead of tax deductions.
QUARTERLY RESULTS
The following tables set forth selected unaudited quarterly consolidated financial data for the fiscal years ended August 31, 2016 and 2015. The quarterly consolidated financial data reflects, in the opinion of management, all normal and recurring adjustments necessary to fairly present the results of operations for such periods. Results of any one or more quarters are not necessarily indicative of continuing trends (in thousands, except for per-share amounts).
|
YEAR ENDED AUGUST 31, 2016 (unaudited)
|
||||||||||||||||
|
November 28
|
February 27
|
May 28
|
August 31
|
|||||||||||||
|
Net sales
|
$ | 45,218 | $ | 45,269 | $ | 44,738 | $ | 64,831 | ||||||||
|
Gross profit
|
30,071 | 29,854 | 29,562 | 45,667 | ||||||||||||
|
Selling, general, and administrative
|
26,489 | 27,936 | 29,095 | 30,069 | ||||||||||||
|
Restructuring costs
|
- | 376 | - | 400 | ||||||||||||
|
Depreciation
|
912 | 894 | 1,003 | 868 | ||||||||||||
|
Amortization
|
910 | 909 | 722 | 721 | ||||||||||||
|
Income (loss) from operations
|
1,760 | (261 | ) | (1,258 | ) | 13,609 | ||||||||||
|
Income (loss) before income taxes
|
1,296 | (730 | ) | (1,741 | ) | 13,086 | ||||||||||
|
Net income (loss)
|
790 | (448 | ) | (1,052 | ) | 7,726 | ||||||||||
|
Net income (loss) per share:
|
||||||||||||||||
|
Basic
|
$ | .05 | $ | (.03 | ) | $ | (.07 | ) | $ | .55 | ||||||
|
Diluted
|
.05 | (.03 | ) | (.07 | ) | .55 | ||||||||||
|
YEAR ENDED AUGUST 31, 2015 (unaudited)
|
||||||||||||||||
|
November 29
|
February 28
|
May 30
|
August 31
|
|||||||||||||
|
Net sales
|
$ | 47,875 | $ | 46,316 | $ | 48,306 | $ | 67,444 | ||||||||
|
Gross profit
|
31,204 | 30,015 | 30,322 | 46,547 | ||||||||||||
|
Selling, general, and administrative
|
25,699 | 26,841 | 25,934 | 30,327 | ||||||||||||
|
Impaired assets
|
- | - | 1,082 | 220 | ||||||||||||
|
Restructuring costs
|
- | - | - | 587 | ||||||||||||
|
Depreciation
|
964 | 1,040 | 980 | 1,158 | ||||||||||||
|
Amortization
|
953 | 953 | 912 | 909 | ||||||||||||
|
Income from operations
|
3,588 | 1,181 | 1,414 | 13,346 | ||||||||||||
|
Income before income taxes
|
3,030 | 753 | 753 | 12,876 | ||||||||||||
|
Net income
|
1,828 | 427 | 1,191 | 7,669 | ||||||||||||
|
Net income per share:
|
||||||||||||||||
|
Basic
|
$ | .11 | $ | .03 | $ | .07 | $ | .47 | ||||||||
|
Diluted
|
.11 | .02 | .07 | .46 | ||||||||||||
Our fourth quarter of each fiscal year has higher sales and operating income than other fiscal quarters primarily due to increased revenues in our Education practice (when school administrators and faculty have professional development days) and to increased facilitator sales that typically occur during that quarter resulting from year-end incentive programs. Overall, training sales are moderately seasonal because of the timing of corporate training, which is not typically scheduled as heavily during holiday and certain vacation periods. Quarterly fluctuations may also be affected by other factors including the introduction of new offerings, business acquisitions, the addition of new organizational customers, and the elimination of underperforming offerings.
For more information on our quarterly results of operations, refer to our quarterly reports filed on Form 10-Q as filed with the SEC. Our quarterly reports for the periods indicated are available free of charge at www.sec.gov.
LIQUIDITY AND CAPITAL RESOURCES
Introduction
During fiscal 2016, we used a substantial amount of our liquidity and capital resources to acquire outstanding shares of our common stock. During the second quarter of fiscal 2016 we completed a modified Dutch auction tender offer whereby we purchased 1,971,832 shares of our common stock for $17.75 per share. The total cost of the tender offer, including various professional services fees, was $35.3 million. We also purchased 531,433 shares of our common stock for $8.3 million on the open market under the terms of a Board of Director approved plan during the third and fourth quarters of fiscal 2016. We have $17.7 million remaining under that Board approved common stock purchase plan at August 31, 2016. Our cash balance at August 31, 2016 was $10.5 million, with no borrowings on our line of credit, compared with $16.2 million of cash, and no borrowings on the line of credit, at August 31, 2015. As part of the regular renewal of our existing credit facility (refer to discussion below), we
borrowed $15.0 million on a promissory note that matures in May 2019 to help finance the acquisition of our common stock during fiscal 2016. For further information regarding the impact on our cash flows from these purchases of our common stock, refer to the discussion entitled “cash flows from financing activities.”
Our net working capital (current assets less current liabilities) was $35.7 million at August 31, 2016 compared with $55.8 million at August 31, 2015. The reduction in our working capital was primarily due to reduced cash resulting from the purchases of our common stock during fiscal 2016, a significant increase in deferred revenues primarily from sales of the All Access Pass, and new term-loan borrowing to assist in financing the purchases of our common stock. Of our $10.5 million in cash at August 31, 2016, $8.5 million was held outside the U.S. at our foreign subsidiaries. We routinely repatriate cash from our foreign subsidiaries and consider cash generated from foreign activities a key component of our overall liquidity position. Our primary sources of liquidity are cash flows from the sale of services in the normal course of business and available proceeds from our recently renewed revolving line of credit facility. Our primary uses of liquidity include payments for operating activities, purchases of our common stock, capital expenditures (including curriculum development), working capital expansion, and debt payments.
The following table summarizes our cash flows from operating, investing, and financing activities for the past three years (in thousands):
|
YEAR ENDED AUGUST 31,
|
2016
|
2015
|
2014
|
|||||||||
|
Total cash provided by (used for):
|
||||||||||||
|
Operating activities
|
$ | 32,665 | $ | 26,190 | $ | 18,124 | ||||||
|
Investing activities
|
(6,229 | ) | (4,874 | ) | (17,424 | ) | ||||||
|
Financing activities
|
(32,535 | ) | (14,903 | ) | (2,445 | ) | ||||||
|
Effect of exchange rates on cash
|
321 | (662 | ) | (63 | ) | |||||||
|
Increase (decrease) in cash and cash equivalents
|
$ | (5,778 | ) | $ | 5,751 | $ | (1,808 | ) | ||||
Fifth Modification to Amended and Restated Credit Agreement
On May 24, 2016, we entered into the Fifth Modification Agreement to our existing amended and restated secured credit agreement (the Restated Credit Agreement) with our existing lender. The primary purposes of the Fifth Modification Agreement were to (i) obtain a term loan from the lender for $15.0 million (the Term Loan); (ii) increase the maximum principal amount of the revolving line of credit from $30.0 million to $40.0 million; (iii) extend the maturity date of the Restated Credit Agreement from March 31, 2018 to March 31, 2019; (iv) permit us to convert balances outstanding from time to time under the revolving line of credit to term loans; and (v) adjust the fixed charge coverage ratio from 1.40 to 1.15. The proceeds from the term loans may be used for general corporate purposes.
The Term Loan provided us $15.0 million at an interest rate of LIBOR plus 1.85% per annum. Interest is payable monthly and principal payments of $937,500 are due and payable on the first day of each January, April, July, and October until May 2019. The remaining $3.75 million of principal due at the Term Loan maturity date may be repaid by the Company or converted into another term loan. The Term Loan may also be repaid sooner than May 2019 at the Company’s discretion. Subsequent to August 31, 2016, we obtained an additional term loan with a principal balance of $5.0 million. Principal payments of $312,500 are due and payable on the first day of each January, April, July, and October until October 2019. The other terms and conditions of this term loan are the same (except principal payment amounts) as the Term Loan described above.
The Fifth Modification Agreement preserves existing debt covenants that include (i) a Funded Debt to EBITDAR ratio of less than 3.0 to 1.0; (ii) a Fixed Charge Coverage ratio greater than 1.15 to 1.0 as discussed above; (iii) an annual limit on capital expenditures (excluding capitalized curriculum development) of $8.0 million; and (iv) outstanding borrowings on the revolving line of credit may not
exceed 150 percent of consolidated accounts receivable. The other key terms and conditions of the Fifth Modification Agreement are substantially the same as those defined in the Restated Credit Agreement. We believe that we were in compliance with the financial covenants and other terms applicable to the Restated Credit Agreement at August 31, 2016.
In addition to our revolving line of credit facility and term loan obligations, we have a long-term lease on our corporate campus that is accounted for as a financing obligation.
The following discussion is a description of the primary factors affecting our cash flows and their effects upon our liquidity and capital resources during the fiscal year ended August 31, 2016.
Cash Flows from Operating Activities
Our primary source of cash from operating activities was the sale of services and products to our customers in the normal course of business. The primary uses of cash for operating activities were payments for selling, general, and administrative expenses, payments for direct costs necessary to conduct training programs, payments to suppliers for materials used in training manuals sold, and to fund working capital needs. Our cash provided by operating activities increased to $32.7 million for the fiscal year ended August 31, 2016 compared with $26.2 million in fiscal 2015. Although our net income during fiscal 2016 was reduced by the deferral of a portion of AAP sales, we invoice our clients at the inception of the contracted period and collect invoiced amounts within normal terms. Accordingly, we do not expect our cash flows from operating activities to be unfavorably impacted by increased sales of AAP contracts in future periods.
Although our collections of accounts receivable improved significantly during fiscal 2016, our overall collections continue to be hampered by slower-than-anticipated collections from governmental sales, including Education practice sales, licensees, and longer payment terms on certain services contracts. The longer payment terms granted to certain clients were within our normal credit policy. We anticipate that these longer collection periods may continue in future periods and lengthen our collection cycle.
Cash Flows from Investing Activities and Capital Expenditures
Our cash used for investing activities during fiscal 2016 totaled $6.2 million. Our primary uses of cash for investing activities included purchases of property and equipment, in the normal course of business, and spending on curriculum development.
Our purchases of property and equipment, which totaled $4.0 million, consisted primarily of computer software, hardware, and leasehold improvements. We currently anticipate that our purchases of property and equipment will total approximately $5.4 million in fiscal 2017. However, we are currently in the process of replacing our existing enterprise resource planning software, which may result in increased capital spending compared with current expectations. We currently anticipate that the new enterprise resource planning software will be placed into service in mid-fiscal 2017.
For the fiscal year ended August 31, 2016, we spent $2.2 million on various curriculums, including significant revisions and development to offerings related to The Leader In Me, which is offered through our Education practice, Customer Loyalty, and for the newly released All Access Pass. Our anticipated spending for capitalized curriculum in fiscal 2017 is expected to be approximately $8.0 million. During fiscal 2017 we expect to make significant additions to our All Access Pass offerings and various other practices and offerings.
Cash Flows from Financing Activities
In fiscal 2016 we used $32.5 million of net cash for financing activities. Our primary uses of cash for financing activities consisted of $35.3 million used to purchase 1,971,832 shares of our common stock in a modified Dutch auction tender offer (as previously described); the purchase of 531,433 shares of our
common stock for $8.3 million on the open market under the terms of a Board of Director approved plan; $2.4 million used for principal payments on our long-term financing obligation and Term Loan; and $2.2 million for the payment of contingent consideration from the purchase of NinetyFive 5 in a prior period. Partially offsetting these uses of cash were $15.0 million of proceeds from a term note payable that matures in May 2019 and $0.7 million of cash received from participants in our employee stock purchase plan. Subsequent to August 31, 2016, we obtained an additional term loan with a principal balance of $5.0 million.
On January 23, 2015, our Board of Directors approved a new plan to repurchase up to $10.0 million of the Company’s common stock. All previously existing common stock repurchase plans were canceled and the new common share repurchase plan does not have an expiration date. On March 27, 2015, our Board of Directors increased the aggregate value of shares of Company common stock that may be purchased under the January 2015 plan to $40.0 million so long as we have either $10.0 million in cash and cash equivalents or have access to debt financing of at least $10.0 million. Under the terms of this expanded common stock repurchase plan, we have purchased 1,291,347 shares of our common stock for $22.3 million through August 31, 2016. Future purchases of common stock under the terms of this Board approved plan will increase the amount of cash used for financing activities.
During fiscal 2013, we completed the acquisition of NinetyFive 5, an entity that provides sales success training services. The consideration for the acquisition consisted of an initial $4.2 million payable in four installments through December 2013, and additional potential earn out payments up to a maximum of $8.5 million based on cumulative EBITDA as set forth in the purchase agreement. Based on significantly improved EBITDA from our sales performance group during the first half of fiscal 2016, we paid the first contingent earn out payment of $2.2 million in the third quarter of fiscal 2016 and may have to pay additional contingent earn out payments in fiscal 2017. The contingent earn out liability to the former owners of NinetyFive 5 is required to be recorded at fair value based on current and expected EBITDA performance. At August 31, 2016, the fair value of this liability was $1.9 million, which was recorded as a component of other long-term liabilities in our consolidated balance sheet. The contingent consideration measurement period for this acquisition ends on August 31, 2017.
Sources of Liquidity
We expect to meet our projected capital expenditures, service our existing financing obligation, and meet other working capital requirements during fiscal 2017 from current cash balances, future cash flows from operating activities, and borrowings on our available credit facility. Going forward, we will continue to incur costs necessary for the day-to-day operation and potential growth of the business and may use our available revolving line of credit and other financing alternatives, if necessary, for these expenditures. Our Restated Credit Agreement expires in March 2019 and we expect to renew the Restated Credit Agreement on a regular basis to maintain the long-term borrowing capacity of this credit facility. Additional potential sources of liquidity available to us include factoring receivables, issuance of additional equity, or issuance of debt from public or private sources. If necessary, we will evaluate all of these options and select one or more of them depending on overall capital needs and the associated cost of capital.
We believe that our existing cash and cash equivalents, cash generated by operating activities, and availability of external funds as described above, will be sufficient for us to maintain our operations in the foreseeable future. However, our ability to maintain adequate capital for our operations in the future is dependent upon a number of factors, including sales trends, macroeconomic activity, our ability to contain costs, levels of capital expenditures, collection of accounts receivable, and other factors. Some of the factors that influence our operations are not within our control, such as general economic conditions and the introduction of new offerings or technology by our competitors. We will continue to monitor our liquidity position and may pursue additional financing alternatives, as described above, to maintain sufficient resources for future growth and capital requirements. However, there can be no assurance such financing alternatives will be available to us on acceptable terms, or at all.
Contractual Obligations
We have not structured any special purpose entities, or participated in any commodity trading activities, which would expose us to potential undisclosed liabilities or create adverse consequences to our liquidity. Required contractual payments primarily consist of lease payments resulting from the sale of our corporate campus (financing obligation); term loans payable to our bank; short-term purchase obligations for inventory items and other products and services used in the ordinary course of business; an expected contingent consideration payment to the former owners of NinetyFive 5; minimum operating lease payments for domestic regional and foreign sales office space; and payments to HP Enterprise Services (HPE) for minimum outsourced warehousing and distribution service charges. At August 31, 2016, our expected payments on these obligations over the next five fiscal years and thereafter are as follows (in thousands):
|
Fiscal
|
Fiscal
|
Fiscal
|
Fiscal
|
Fiscal
|
||||||||||||||||||||||||
|
Contractual Obligations
|
2017
|
2018
|
2019
|
2020
|
2021
|
Thereafter
|
Total
|
|||||||||||||||||||||
|
Required lease payments on corporate campus
|
$ | 3,509 | $ | 3,579 | $ | 3,651 | $ | 3,724 | $ | 3,798 | $ | 15,157 | $ | 33,418 | ||||||||||||||
|
Term Loan payable to bank(1)
|
4,039 | 3,949 | 6,660 | - | - | - | 14,648 | |||||||||||||||||||||
|
Purchase obligations
|
5,168 | - | - | - | - | - | 5,168 | |||||||||||||||||||||
|
NinetyFive 5 contingent consideration payment(2)
|
- | 2,167 | - | - | - | - | 2,167 | |||||||||||||||||||||
|
Minimum operating lease payments
|
466 | 298 | 307 | 326 | 325 | 362 | 2,084 | |||||||||||||||||||||
|
Minimum required payments to HPE for warehousing services(3)
|
216 | 216 | 180 | - | - | - | 612 | |||||||||||||||||||||
|
Total expected contractual obligation payments
|
$ | 13,398 | $ | 10,209 | $ | 10,798 | $ | 4,050 | $ | 4,123 | $ | 15,519 | $ | 58,097 | ||||||||||||||
|
(1)
|
Payment amounts shown include interest at 2.4 percent, which is the current rate on our Term Loan obligation.
|
|
(2)
|
The NinetyFive 5 contingent consideration measurement period ends on August 31, 2017, and we currently anticipate the payment amount will be earned in the fourth quarter of fiscal 2017 and paid during the first quarter of fiscal 2018. Actual amounts paid may differ based on the achievement of specified performance objectives.
|
|
(3)
|
Our required minimum payments for warehousing services contains an annual escalation based upon changes in the Employment Cost Index, the impact of which was not estimated in the above table. The warehousing services contract expires in June 2019.
|
Our contractual obligations presented above exclude unrecognized tax benefits of $3.0 million for which we cannot make a reasonably reliable estimate of the amount and period of payment. For further information regarding our unrecognized tax benefits, refer to the notes to our consolidated financial statements as presented in Part II, Item 8 of this report on Form 10-K.
USE OF ESTIMATES AND CRITICAL ACCOUNTING POLICIES
Our consolidated financial statements were prepared in accordance with accounting principles generally accepted in the United States of America. The significant accounting policies that we used to prepare our consolidated financial statements are outlined primarily in Note 1 to the consolidated financial statements, which are presented in Part II, Item 8 of this Annual Report on Form 10-K. Some of those accounting policies require us to make assumptions and use judgments that may affect the amounts reported in our consolidated financial statements. Management regularly evaluates its estimates and assumptions and bases those estimates and assumptions on historical experience, factors that are believed
to be reasonable under the circumstances, and requirements under accounting principles generally accepted in the United States of America. Actual results may differ from these estimates under different assumptions or conditions, including changes in economic and political conditions and other circumstances that are not in our control, but which may have an impact on these estimates and our actual financial results.
The following items require the most significant judgment and often involve complex estimates:
Revenue Recognition
We derive revenues primarily from the following sources:
|
·
|
Training and Consulting Services – We provide training and consulting services to both organizations and individuals in leadership, productivity, strategic execution, trust, sales force performance, customer loyalty, and communication effectiveness skills.
|
|
·
|
Products – We sell books, audio media, and other related products.
|
We recognize revenue when: 1) persuasive evidence of an arrangement exists, 2) delivery of product has occurred or services have been rendered, 3) the price to the customer is fixed or determinable, and 4) collectability is reasonably assured. For training and service sales, these conditions are generally met upon presentation of the training seminar or delivery of the consulting services based upon daily rates. For most of our product sales, these conditions are met upon shipment of the product to the customer. At times, our customers may request access to our intellectual property for the flexibility to print certain training materials or to have access to certain training videos and other training aids at their convenience. For intellectual property license sales, the revenue recognition conditions are generally met at the later of delivery of the curriculum to the client or the effective date of the arrangement.
Revenue recognition for multiple-element arrangements requires judgment to determine if multiple elements exist, whether elements can be accounted for as separate units of accounting, and if so, the fair value for each of the elements. A deliverable constitutes a separate unit of accounting when it has standalone value to our clients. We routinely enter into arrangements that can include various combinations of multiple training curriculum, consulting services, and intellectual property licenses. The timing of delivery and performance of the elements typically varies from contract to contract. Generally, these items qualify as separate units of accounting because they have value to the customer on a standalone basis.
When the Company’s training and consulting arrangements contain multiple deliverables, consideration is allocated at the inception of the arrangement to all deliverables based on their relative selling prices at the beginning of the agreement, and revenue is recognized as each curriculum, consulting service, or intellectual property license is delivered. We use the following selling price hierarchy to determine the fair value to be used for allocating revenue to the elements: (i) vendor-specific objective evidence of fair value (VSOE), (ii) third-party evidence (TPE), and (iii) best estimate of selling price (BESP). Generally, VSOE is based on established pricing and discounting practices for the deliverables when sold separately. In determining VSOE, we require that a substantial majority of the selling prices fall within a narrow range. When VSOE cannot be established, judgment is applied with respect to whether a selling price can be established based on TPE, which is determined based on competitor prices for similar offerings when sold separately. Our products and services normally contain a significant level of differentiation such that the comparable pricing of services with similar functionality cannot be obtained. When we are unable to establish a selling price using VSOE or TPE, BESP is used in our allocation of arrangement consideration. BESPs are established as best estimates of what the selling price would be if the deliverables were sold regularly on a stand-alone basis. Our process for determining BESPs requires judgment and considers multiple factors, such as market conditions, type of customer, geographies, stage of product lifecycle, internal costs, and gross margin objectives. These factors may vary over time depending upon the unique facts and circumstances related to each deliverable. However, we do not
expect the effect of changes in the selling price or method or assumptions used to determine selling price to have a significant effect on the allocation of arrangement consideration.
Our multiple-element arrangements generally do not include performance, cancellation, termination, or refund-type provisions.
Our international strategy includes the use of licensees in countries where we do not have a wholly owned operation. Licensee companies are unrelated entities that have been granted a license to translate our content and curriculum, adapt the content and curriculum to the local culture, and sell our training seminars and products in a specific country or region. Licensees are required to pay us royalties based upon a percentage of their sales to clients. We recognize royalty income each period based upon the sales information reported to us from our licensees. International royalty revenue is reported as a component of training and consulting service sales in our consolidated income statements.
Revenue is recognized as the net amount to be received after deducting estimated amounts for discounts and product returns.
Share-Based Compensation
Our shareholders have approved performance-based long-term incentive plans (LTIP) that provide for grants of share-based performance awards to certain managerial personnel and executive management as directed by the Organization and Compensation Committee of the Board of Directors. The number of common shares that are vested and issued to LTIP participants is variable and is based upon the achievement of specified financial performance objectives during defined performance periods. Due to the variable number of common shares that may be issued under the LTIP, we reevaluate our LTIP grants on a quarterly basis and adjust the expected vesting dates and number of shares expected to be awarded based upon actual and estimated financial results of the Company compared with the performance goals set for the award. Adjustments to the number of shares awarded, and to the corresponding compensation expense, are made on a cumulative basis at the adjustment date based upon the estimated probable number of common shares to be awarded.
The analysis of our LTIP awards contains uncertainties because we are required to make assumptions and judgments about the timing and eventual number of shares that will vest in each LTIP grant. The assumptions and judgments that are essential to the analysis include forecasted sales and operating income levels during the LTIP service periods. The evaluation of LTIP performance awards and the corresponding use of estimated amounts may produce additional volatility in our consolidated financial statements as we record cumulative adjustments to the estimated service periods and number of common shares to be awarded under the LTIP grants as described above.
We have also previously granted share-based compensation awards that have share-price, or market-based, vesting conditions. Accordingly, we used “Monte Carlo” simulation models to determine the fair value and expected service period of these awards. The Monte Carlo pricing models required the input of subjective assumptions, including items such as the expected term of the options. If factors change, and we use different assumptions for estimating share-based compensation expense related to future awards, our share-based compensation expense may differ materially from that recorded in previous periods.
Accounts Receivable Valuation
Trade accounts receivable are recorded at the invoiced amount and do not bear interest. Our allowance for doubtful accounts calculations contain uncertainties because the calculations require us to make assumptions and judgments regarding the collectability of customer accounts, which may be influenced by a number of factors that are not within our control, such as the financial health of each customer. We regularly review the collectability assumptions of our allowance for doubtful accounts calculation and compare them against historical collections. Adjustments to the assumptions may either increase or
decrease our total allowance for doubtful accounts. For example, a 10 percent increase to our allowance for doubtful accounts at August 31, 2016 would decrease our reported income from operations by approximately $0.2 million.
For further information regarding the calculation of our allowance for doubtful accounts, refer to the notes to our financial statements as presented in Item 8 of this report on Form 10-K.
Related Party Receivable
At August 31, 2016, we had receivables from FCOP, an entity in which we own 19.5 percent, for reimbursement of certain operating costs and for working capital and other advances, even though we are not obligated to provide advances to, or fund the losses of FCOP. We make use of estimates to account for these receivables, including estimates of the collectability of amounts receivable from FCOP in future periods and, based upon the timing of estimated collections, we were required to classify a portion of the receivable to long-term. In accordance with applicable accounting guidance, we are required to discount the long-term portion of the receivable to its net present value using an estimated effective borrowing rate for FCOP.
We estimated the effective risk-adjusted borrowing rate to discount the long-term portion of the receivable at 15 percent, which was recorded as a discount on a related party receivable in our consolidated income statements. Our estimate of the effective borrowing rate required us to estimate a variety of factors, including the availability of debt financing for FCOP, projected borrowing rates for comparable debt, and the timing and realizability of projected cash flows from FCOP. These estimates were based on information known at the time of the preparation of these financial statements. A change in the assumptions and factors used, including estimated interest rates, may change the amount of discount taken.
Our assessments regarding the collectability of the FCOP receivable require us to make assumptions and judgments regarding the financial health of FCOP and are dependent on projected financial information for FCOP in future periods. Such financial information contains inherent uncertainties, and is subject to factors that are not within our control. Failure to receive projected cash flows from FCOP in future periods may result in adverse consequences to our liquidity, financial position, and results of operations. For instance, changes in expected cash flows during fiscal 2015 and fiscal 2014 resulted in impaired asset charges and increased discount expense during those periods.
For further information regarding our investment in FCOP, refer to the notes to our financial statements as presented in Item 8 of this report on Form 10-K.
Inventory Valuation
Our inventories are primarily comprised of training materials and related accessories. Inventories are reduced to their fair market value through the use of inventory valuation reserves, which are recorded during the normal course of business. Our inventory valuation calculations contain uncertainties because the calculations require us to make assumptions and judgments regarding a number of factors, including future inventory demand requirements and pricing strategies. During the evaluation process we consider historical sales patterns and current sales trends, but these may not be indicative of future inventory losses. While we have not made material changes to our inventory valuation methodology during the past three years, our inventory requirements may change based on projected customer demand, technological and product life cycle changes, longer or shorter than expected usage periods, and other factors that could affect the valuation of our inventories. If our estimates regarding consumer demand and other factors are inaccurate, we may be exposed to losses that may have an adverse impact upon our financial position and results of operations. For example, a 10 percent increase to our inventory valuation reserves at August 31, 2016 would decrease our reported income from operations by $0.1 million.
Indefinite-Lived Intangible Assets and Goodwill
Intangible assets that are deemed to have an indefinite life and goodwill balances are not amortized, but rather are tested for impairment on an annual basis, or more often if events or circumstances indicate that a potential impairment exists. The Covey trade name intangible asset was generated by the merger with the Covey Leadership Center and has been deemed to have an indefinite life. This intangible asset is quantitatively tested for impairment using the present value of estimated royalties on trade name related revenues, which consist primarily of training seminars and international licensee royalties.
Goodwill is recorded when the purchase price for an acquisition exceeds the estimated fair value of the net tangible and identified intangible assets acquired. We tested goodwill for impairment at August 31, 2016 at the reporting unit level using a quantitative approach. The first step of the goodwill impairment testing process (Step 1) involves determining whether the estimated fair value of the reporting unit exceeds its respective book value. In performing Step 1, we compare the carrying amount of the reporting unit to its estimated fair value. If the fair value exceeds the book value, goodwill of that reporting unit is not impaired. The estimated fair value of each reporting unit was calculated using a combination of the income approach (discounted cash flows) and the market approach (using market multiples derived from a set of companies with comparable market characteristics). The estimated fair values of the reporting units from these approaches were weighted in the determination of the total fair value.
If the Step 1 result concludes that the fair value does not exceed the book value of the reporting unit, goodwill may be impaired and additional analysis is required (Step 2). Step 2 of the goodwill impairment test compares the implied fair value of a reporting unit’s goodwill to its carrying value. The implied fair value of goodwill is derived by performing a hypothetical purchase price allocation for the reporting unit as of the measurement date, allocating the reporting unit’s estimated fair value to its assets and liabilities, including any recognizable intangible assets. The residual amount from performing this allocation represents the implied fair value of goodwill. To the extent this amount is below the carrying value of goodwill, an impairment loss is recorded.
Under the two-step impairment test, we determine the fair value of our reporting units using both an income approach and a market approach, and weigh both approaches to determine the fair value of each reporting unit. Under the income approach, we perform a discounted cash flow analysis which incorporates our cash flow projections over a five-year period and a terminal value is calculated by applying a capitalization rate to terminal year projections based on an estimated long-term growth rate. The five-year projected cash flows and calculated terminal value are discounted using a weighted average cost of capital (WACC) which takes into account the costs of debt and equity. The cost of equity is based on the risk-free interest rate, equity risk premium, and industry and size equity premiums. To arrive at a fair value for each reporting unit, the terminal value is discounted by the WACC and added to the present value of the estimated cash flows over the discrete five-year period. There are a number of other variables which impacted the projected cash flows, such as expected revenue growth and profitability levels, working capital requirements, capital expenditures, and related depreciation expense. Under the market approach, we perform a comparable public company analysis and apply revenue and earnings multiples from the identified set of companies to the reporting unit’s actual and forecasted financial performance to determine the fair value of each reporting unit. We evaluate the reasonableness of the fair value calculations of our reporting units by reconciling the total of the fair values of all our reporting units to our total market capitalization, and adjusting for an appropriate control premium. In addition, we make certain judgments in allocating shared assets and liabilities to determine the carrying values for each of our reporting units.
Determining the fair value of a reporting unit is judgmental in nature and involves the use of significant estimates and assumptions. These estimates and assumptions include revenue growth rates and operating margins used to calculate projected future cash flows, risk-adjusted discount rates, future economic and market conditions, and determination of appropriate market comparables. We base our fair value estimates on assumptions we believe to be reasonable but that are unpredictable and inherently uncertain. Actual future results may differ from those estimates. In addition, we make certain judgments and
assumptions in allocating shared assets and liabilities to determine the carrying values for each of our reporting units. The timing and frequency of our goodwill impairment tests are based on an ongoing assessment of events and circumstances that would indicate a possible impairment. Based on the results of the fiscal 2016 goodwill test, we did not record an impairment charge against our goodwill during fiscal 2016 as each reportable operating segment’s estimated fair value exceeded its carrying value. We will continue to monitor our goodwill and intangible assets for impairment and conduct formal tests when impairment indicators are present.
The acquisition of NinetyFive 5 in fiscal 2013 requires us to reassess the fair value of the contingent earn out payments each reporting period. Although subsequent changes to the contingent consideration liability do not affect the goodwill generated from the acquisition transaction, the valuation of expected contingent consideration requires us to estimate future sales and profitability. These estimates require the use of numerous assumptions, many of which may change frequently and lead to increased or decreased operating income in future periods. For instance, we recorded increases totaling $1.5 million to the fair value of expected contingent consideration payments during fiscal 2016 which resulted in a corresponding increase to selling, general, and administrative expenses.
Impairment of Long-Lived Assets
Long-lived tangible assets and definite-lived intangible assets are reviewed for possible impairment whenever events or changes in circumstances indicate that the carrying amount of such assets may not be recoverable. We use an estimate of undiscounted future net cash flows of the assets over their remaining useful lives in determining whether the carrying value of the assets is recoverable. If the carrying values of the assets exceed the anticipated future cash flows of the assets, we calculate an impairment loss. The impairment loss calculation compares the carrying value of the asset to the asset’s estimated fair value, which may be based upon discounted cash flows over the estimated remaining useful life of the asset. If we recognize an impairment loss, the adjusted carrying amount of the asset becomes its new cost basis, which is then depreciated or amortized over the remaining useful life of the asset. Impairment of long-lived assets is assessed at the lowest levels for which there are identifiable cash flows that are independent from other groups of assets.
Our impairment evaluation calculations contain uncertainties because they require us to make assumptions and apply judgment in order to estimate future cash flows, forecast the useful lives of the assets, and select a discount rate that reflects the risk inherent in future cash flows. Although we have not made any material recent changes to our long-lived assets impairment assessment methodology, if forecasts and assumptions used to support the carrying value of our long-lived tangible and definite-lived intangible assets change in the future, significant impairment charges could result that would adversely affect our results of operations and financial condition.
Income Taxes
We regularly evaluate our United States federal and various state and foreign jurisdiction income tax exposures. We account for certain aspects of our income tax provision using the provisions of FASC 740-10-05, which addresses the determination of whether tax benefits claimed or expected to be claimed on a tax return should be recorded in the financial statements. We may recognize the tax benefit from an uncertain tax position only if it is more likely than not that the tax position will be sustained upon examination by the taxing authorities, based on the technical merits of the position. The tax benefits recognized in the financial statements from such a position are measured based on the largest benefit that has a greater than 50 percent likelihood of being realized upon final settlement. The provisions of FASC 740-10-05 also provide guidance on de-recognition, classification, interest, and penalties on income taxes, accounting for income taxes in interim periods, and require increased disclosure of various income tax items. Taxes and penalties are components of our overall income tax provision.
We record previously unrecognized tax benefits in the financial statements when it becomes more likely than not (greater than a 50 percent likelihood) that the tax position will be sustained. To assess the
probability of sustaining a tax position, we consider all available evidence. In many instances, sufficient positive evidence may not be available until the expiration of the statute of limitations for audits by taxing jurisdictions, at which time the entire benefit will be recognized as a discrete item in the applicable period.
Our unrecognized tax benefits result from uncertain tax positions about which we are required to make assumptions and apply judgment to estimate the exposures associated with our various tax filing positions. The calculation of our income tax provision or benefit, as applicable, requires estimates of future taxable income or losses. During the course of the fiscal year, these estimates are compared to actual financial results and adjustments may be made to our tax provision or benefit to reflect these revised estimates. Our effective income tax rate is also affected by changes in tax law and the results of tax audits by various jurisdictions. Although we believe that our judgments and estimates discussed herein are reasonable, actual results could differ, and we could be exposed to losses or gains that could be material.
We establish valuation allowances for deferred tax assets when we estimate it is more likely than not that the tax assets will not be realized. The determination of whether valuation allowances are needed on our deferred income tax assets contains uncertainties because we must project future income, including the use of tax-planning strategies, by individual tax jurisdictions. Changes in industry and economic conditions and the competitive environment may impact the accuracy of our projections. We regularly assess the likelihood that our deferred tax assets will be realized and determine if adjustments to our valuation allowance are necessary.
RECENTLY ADOPTED ACCOUNTING PRONOUNCEMENT
In November 2015, the Financial Accounting Standards Board (FASB) issued Accounting Standards Update (ASU) No. 2015-17, Income Taxes (Topic 740): Balance Sheet Classification of Deferred Taxes. This guidance requires all deferred tax assets and liabilities to be classified as non-current in the statement of financial position. The provisions of ASU No. 2015-17 are effective for annual periods beginning after December 15, 2016, including interim periods within that reporting period. We have elected, as permitted by the guidance, to early adopt ASU No. 2015-17 on a prospective basis as of August 31, 2016 and prior periods were not restated. The adoption of this standard did not have a material effect on our consolidated balance sheet at August 31, 2016.
ACCOUNTING PRONOUNCEMENTS ISSUED NOT YET ADOPTED
On May 28, 2014 the FASB issued ASU No. 2014-09, Revenue from Contracts with Customers. This new standard was issued in conjunction with the International Accounting Standards Board (IASB) and is designed to create a single, principles-based process by which all businesses calculate revenue. The new standard replaces numerous individual, industry-specific revenue rules found in U.S. generally accepted accounting principles and is required to be adopted in fiscal years beginning after December 15, 2017 and for interim periods therein. The new standard may be applied using the “full retrospective” or “modified retrospective” approach. As of August 31, 2016, we have not yet determined the method of adoption nor the impact that ASU No. 2014-09 will have on our reported revenue or results of operations.
In April 2016, the FASB issued ASU 2016-10, Revenue from Contracts with Customers (Topic 606) - Identifying Performance Obligations and Licensing. The guidance in ASU 2016-10 clarifies aspects of Topic 606 related to identifying performance obligations and the licensing implementation guidance, while retaining the related core principles for those areas. The effective date and transition requirements for ASU 2016-10 are the same as the effective date and transition requirements for Topic 606 (ASU 2014-09) discussed above. While we do not expect the adoption of ASU 2016-10 to have a material effect on our business, we are evaluating the potential impact that adoption of ASU 2016-10 may have on our financial position, results of operations, and cash flows.
On February 25, 2016 the FASB issued ASU No. 2016-02, Leases. The new lease accounting standard is the result of a collaborative effort with the IASB (similar to the new revenue standard described above), although some differences remain between the two standards. This new standard will affect all entities that lease assets and will require lessees to recognize a lease liability and a right-of-use asset for all leases (except for short-term leases that have a duration of less than one year) as of the date on which the lessor makes the underlying asset available to the lessee. For lessors, accounting for leases is substantially the same as in prior periods. For public companies, the new lease standard is effective for fiscal years beginning after December 15, 2018, including interim periods within those fiscal years. Early adoption is permitted for all entities. For leases existing at, or entered into after, the beginning of the earliest comparative period presented in the financial statements, lessees and lessors must apply a modified retrospective transition approach. While we expect the adoption of this new standard will increase reported assets and liabilities, as of August 31, 2016, we have not yet determined the full impact that the adoption of ASU 2016-02 will have on our financial statements.
In March 2016, the FASB issued ASU 2016-09, Compensation - Stock Compensation (Topic 718) - Improvements to Employee Share-Based Payment Accounting. The guidance in ASU 2016-09 simplifies several aspects of the accounting for stock-based payment transactions, including the income tax consequences, classification of awards as either equity or liabilities, and classification of items on the statement of cash flows. ASU 2016-09 is effective for public companies' annual periods, including interim periods within those fiscal years, beginning after December 15, 2016. Early adoption is permitted subject to certain requirements, and the method of application (i.e., retrospective, modified retrospective or prospective) depends on the transaction area that is being amended. Following adoption, the primary impact on our consolidated financial statements will be the recognition of excess tax benefits in the provision for income taxes rather than additional paid-in capital, which will likely result in increased volatility in the reported amounts of income tax expense and net income. As of August 31, 2016, we have not completed our evaluation of the impact of ASU 2016-09 on our results of operations or cash flows.
In June 2014, the FASB issued ASU No. 2014-12, Compensation - Stock Compensation (Topic 718). The guidance in ASU No. 2014-12 addresses accounting for stock-based payments when the terms of an award provide that a performance target could be achieved after the requisite service period. ASU 2014-12 indicates that, in such situations, the performance target should be treated as a performance condition and, accordingly, the performance target should not be reflected in estimating the grant-date fair value of the award. Instead, compensation cost should be recognized in the period in which it becomes probable that the performance target will be achieved. The guidance in ASU 2014-12 is effective for annual periods and interim periods within those annual periods beginning after December 15, 2015. We do not expect the adoption of ASU 2014-12 in fiscal 2017 will have a material effect on our financial position, results of operations, or cash flows.
REGULATORY COMPLIANCE
We are registered in states in which we do business that have a sales tax and we collect and remit sales or use tax on sales made in these jurisdictions. Compliance with environmental laws and regulations has not had a material effect on our operations.
INFLATION AND CHANGING PRICES
Inflation has not had a material effect on our operations. However, future inflation may have an impact on the price of materials used in the production of training products and related accessories, including paper and related raw materials. We may not be able to pass on such increased costs to our customers.
SAFE HARBOR STATEMENT UNDER THE PRIVATE SECURITIES LITIGATION REFORM ACT OF 1995
Certain written and oral statements made by us in this report are “forward-looking statements” within the meaning of the Private Securities Litigation Reform Act of 1995 and Section 21E of the Securities Exchange Act of 1934 as amended (the Exchange Act). Forward-looking statements include, without limitation, any statement that may predict, forecast, indicate, or imply future results, performance, or achievements, and may contain words such as “believe,” “anticipate,” “expect,” “estimate,” “project,” or words or phrases of similar meaning. In our reports and filings we may make forward-looking statements regarding our expectations about future reported revenues and operating results, future sales growth, including the impact of our new China offices, expected introduction of new or refreshed offerings, including additions to the All Access Pass, future training and consulting sales activity, renewal of existing contracts, the release and success of new publications, anticipated expenses, the adequacy of existing capital resources, projected cost reduction and strategic initiatives, expected levels of depreciation and amortization expense, expectations regarding tangible and intangible asset valuation expenses, the seasonality of future sales, the seasonal fluctuations in cash used for and provided by operating activities, future compliance with the terms and conditions of our Restated Credit Agreement, the ability to borrow on, and renew, our Restated Credit Agreement, expectations regarding income tax expenses as well as tax assets and credits and the amount of cash expected to be paid for income taxes, estimated capital expenditures, and cash flow estimates used to determine the fair value of long-lived assets. These, and other forward-looking statements, are subject to certain risks and uncertainties that may cause actual results to differ materially from the forward-looking statements. These risks and uncertainties are disclosed from time to time in reports filed by us with the SEC, including reports on Forms 8-K, 10-Q, and 10-K. Such risks and uncertainties include, but are not limited to, the matters discussed in Item 1A of this annual report on Form 10-K for the fiscal year ended August 31, 2016, entitled “Risk Factors.” In addition, such risks and uncertainties may include unanticipated developments in any one or more of the following areas: unanticipated costs or capital expenditures; difficulties encountered by HP Enterprise Services in operating and maintaining our information systems and controls, including without limitation, the systems related to demand and supply planning, inventory control, and order fulfillment; delays or unanticipated outcomes relating to our strategic plans; dependence on existing products or services; the rate and consumer acceptance of new product introductions; foreign currency exchange rates; competition; the number and nature of customers and their product orders, including changes in the timing or mix of product or training orders; pricing of our products and services and those of competitors; adverse publicity; adverse effects on certain licensee’s performance due to civil unrest in some of the countries where our licensees operate; and other factors which may adversely affect our business.
The risks included here are not exhaustive. Other sections of this report may include additional factors that could adversely affect our business and financial performance. Moreover, we operate in a very competitive and rapidly changing environment. New risk factors may emerge and it is not possible for our management to predict all such risk factors, nor can we assess the impact of all such risk factors on our business or the extent to which any single factor, or combination of factors, may cause actual results to differ materially from those contained in forward-looking statements. Given these risks and uncertainties, investors should not rely on forward-looking statements as a prediction of actual results.
The market price of our common stock has been and may remain volatile. In addition, the stock markets in general have experienced increased volatility. Factors such as quarter-to-quarter variations in revenues and earnings or losses and our failure to meet expectations could have a significant impact on the market price of our common stock. In addition, the price of our common stock can change for reasons unrelated to our performance. Due to our relatively low market capitalization, the price of our common stock may also be affected by conditions such as a lack of analyst coverage and fewer potential investors.
Forward-looking statements are based on management’s expectations as of the date made, and the Company does not undertake any responsibility to update any of these statements in the future except as required by law. Actual future performance and results will differ and may differ materially from that contained in or suggested by forward-looking statements as a result of the factors set forth in this Management’s Discussion and Analysis of Financial Condition and Results of Operations and elsewhere in our filings with the SEC.
ITEM 7A. QUANTITATIVE AND QUALITATIVE DISCLOSURES ABOUT MARKET RISK
Market Risk of Financial Instruments
We are exposed to financial instrument market risk primarily through fluctuations in foreign currency exchange rates and interest rates. To manage risks associated with foreign currency exchange and interest rates, we may make limited use of derivative financial instruments. Derivatives are financial instruments that derive their value from one or more underlying financial instruments. As a matter of policy, our derivative instruments are entered into for periods consistent with the related underlying exposures and do not constitute positions that are independent of those exposures. In addition, we do not enter into derivative contracts for trading or speculative purposes, nor are we party to any leveraged derivative instrument. The notional amounts of derivatives do not represent actual amounts exchanged by the parties to the instrument; and thus are not a measure of exposure to us through our use of derivatives. Additionally, we enter into derivative agreements only with highly rated counterparties and we do not expect to incur any losses resulting from non-performance by other parties.
Foreign Exchange Sensitivity
Due to the global nature of our operations, we are subject to risks associated with transactions that are denominated in currencies other than the United States dollar, as well as the effects of translating amounts denominated in foreign currencies to United States dollars as a normal part of the reporting process. The objective of our foreign currency risk management activities is to reduce foreign currency risk in the consolidated financial statements. In order to manage foreign currency risks, we may make limited use of foreign currency forward contracts and other foreign currency related derivative instruments. However, we did not utilize any foreign currency forward or related derivative contracts during fiscal 2016, fiscal 2015, or fiscal 2014.
Interest Rate Sensitivity
Our long-term liabilities primarily consist of term loans payable obtained from the lender on our Restated Credit Agreement, a long-term lease agreement (financing obligation) associated with the sale of our corporate headquarters facility, deferred income taxes, and the fair value of expected contingent consideration payments from the acquisition of NinetyFive 5. Our overall interest rate sensitivity is primarily influenced by any amounts borrowed on term loans or on our revolving line of credit facility, and the prevailing interest rate on these instruments, which may create additional expense if interest rates increase in future periods. The effective interest rate on the term loans and revolving line of credit facility was 2.3 percent at August 31, 2016. At current borrowing levels, a one percent increase in the interest rate on these debt instruments would increase our interest expense in fiscal 2017 by $0.2 million. Our financing obligation has a payment structure equivalent to a long-term leasing arrangement with a fixed interest rate of 7.7 percent.
During the fiscal years ended August 31, 2016, 2015, and 2014, we were not party to any interest rate swap agreements or similar derivative instruments.
ITEM 8. FINANCIAL STATEMENTS AND SUPPLEMENTARY DATA
REPORT OF INDEPENDENT REGISTERED PUBLIC ACCOUNTING FIRM
To the Board of Directors and Shareholders of Franklin Covey Co.
Salt Lake City, Utah
We have audited the internal control over financial reporting of Franklin Covey Co. (the “Company”) as of August 31, 2016, based on criteria established in Internal Control — Integrated Framework (2013) issued by the Committee of Sponsoring Organizations of the Treadway Commission. The Company’s management is responsible for maintaining effective internal control over financial reporting and for its assessment of the effectiveness of internal control over financial reporting, included in the accompanying Management’s Report on Internal Control over Financial Reporting. Our responsibility is to express an opinion on the Company's internal control over financial reporting based on our audit.
We conducted our audit in accordance with the standards of the Public Company Accounting Oversight Board (United States). Those standards require that we plan and perform the audit to obtain reasonable assurance about whether effective internal control over financial reporting was maintained in all material respects. Our audit included obtaining an understanding of internal control over financial reporting, assessing the risk that a material weakness exists, testing and evaluating the design and operating effectiveness of internal control based on the assessed risk, and performing such other procedures as we considered necessary in the circumstances. We believe that our audit provides a reasonable basis for our opinion.
A company’s internal control over financial reporting is a process designed by, or under the supervision of, the company’s principal executive and principal financial officers, or persons performing similar functions, and effected by the company’s board of directors, management, and other personnel to provide reasonable assurance regarding the reliability of financial reporting and the preparation of financial statements for external purposes in accordance with generally accepted accounting principles. A company’s internal control over financial reporting includes those policies and procedures that (1) pertain to the maintenance of records that, in reasonable detail, accurately and fairly reflect the transactions and dispositions of the assets of the company; (2) provide reasonable assurance that transactions are recorded as necessary to permit preparation of financial statements in accordance with generally accepted accounting principles, and that receipts and expenditures of the company are being made only in accordance with authorizations of management and directors of the company; and (3) provide reasonable assurance regarding prevention or timely detection of unauthorized acquisition, use, or disposition of the company’s assets that could have a material effect on the financial statements.
Because of the inherent limitations of internal control over financial reporting, including the possibility of collusion or improper management override of controls, material misstatements due to error or fraud may not be prevented or detected on a timely basis. Also, projections of any evaluation of the effectiveness of the internal control over financial reporting to future periods are subject to the risk that the controls may become inadequate because of changes in conditions, or that the degree of compliance with the policies or procedures may deteriorate.
In our opinion, the Company maintained, in all material respects, effective internal control over financial reporting as of August 31, 2016, based on the criteria established in Internal Control — Integrated Framework (2013) issued by the Committee of Sponsoring Organizations of the Treadway Commission.
We have also audited, in accordance with the standards of the Public Company Accounting Oversight Board (United States), the consolidated financial statements as of and for the year ended August 31, 2016 of the Company and our report dated November 14, 2016 expressed an unqualified opinion on those financial statements and included an explanatory paragraph regarding the Company’s early adoption of Financial Accounting Standards Board Accounting Standards Update No. 2015-17, “Balance Sheet Classification of Deferred Taxes,” as of August 31, 2016 on a prospective basis.
/s/ Deloitte & Touche LLP
Salt Lake City, Utah
November 14, 2016
REPORT OF INDEPENDENT REGISTERED PUBLIC ACCOUNTING FIRM
To the Board of Directors and Shareholders of Franklin Covey Co.
Salt Lake City, Utah
We have audited the accompanying consolidated balance sheet of Franklin Covey Co. (the "Company") as of August 31, 2016, and the related consolidated statements of income and comprehensive income, shareholders' equity, and cash flows for the year then ended. These financial statements are the responsibility of the Company's management. Our responsibility is to express an opinion on these financial statements based on our audit.
We conducted our audit in accordance with the standards of the Public Company Accounting Oversight Board (United States). Those standards require that we plan and perform the audit to obtain reasonable assurance about whether the financial statements are free of material misstatement. An audit includes examining, on a test basis, evidence supporting the amounts and disclosures in the financial statements. An audit also includes assessing the accounting principles used and significant estimates made by management, as well as evaluating the overall financial statement presentation. We believe that our audit provides a reasonable basis for our opinion.
In our opinion, such consolidated financial statements present fairly, in all material respects, the financial position of Franklin Covey Co. as of August 31, 2016, and the results of its operations and its cash flows for the year then ended, in conformity with accounting principles generally accepted in the United States of America.
As discussed in Note 1 to the consolidated financial statements, the Company early adopted the Financial Accounting Standards Board Accounting Standards Update No. 2015-17, “Balance Sheet Classification of Deferred Taxes,” as of August 31, 2016 on a prospective basis.
We have also audited, in accordance with the standards of the Public Company Accounting Oversight Board (United States), the Company's internal control over financial reporting as of August 31, 2016, based on the criteria established in Internal Control — Integrated Framework (2013) issued by the Committee of Sponsoring Organizations of the Treadway Commission and our report dated November 14, 2016 expressed an unqualified opinion on the Company's internal control over financial reporting.
/s/ Deloitte & Touche LLP
Salt Lake City, Utah
November 14, 2016
REPORT OF THE INDEPENDENT REGISTERED PUBLIC ACCOUNTING FIRM
The Board of Directors and Shareholders of Franklin Covey Co.
We have audited the accompanying consolidated balance sheets of Franklin Covey Co. as of August 31, 2015, and the related consolidated statements of income and comprehensive income, shareholders’ equity, and cash flows for each of the two years in the period ended August 31, 2015. These financial statements are the responsibility of the Company's management. Our responsibility is to express an opinion on these financial statements based on our audits.
We conducted our audits in accordance with the standards of the Public Company Accounting Oversight Board (United States). Those standards require that we plan and perform the audit to obtain reasonable assurance about whether the financial statements are free of material misstatement. An audit includes examining, on a test basis, evidence supporting the amounts and disclosures in the financial statements. An audit also includes assessing the accounting principles used and significant estimates made by management, as well as evaluating the overall financial statement presentation. We believe that our audits provide a reasonable basis for our opinion.
In our opinion, the financial statements referred to above present fairly, in all material respects, the consolidated financial position of Franklin Covey Co. at August 31, 2015, and the consolidated results of its operations and its cash flows for each of the two years in the period ended August 31, 2015, in conformity with U.S. generally accepted accounting principles.
/s/ Ernst & Young LLP
Salt Lake City, Utah
November 12, 2015
FRANKLIN COVEY CO.
CONSOLIDATED BALANCE SHEETS
|
AUGUST 31,
|
2016
|
2015
|
||||||
|
In thousands, except per-share data
|
||||||||
|
ASSETS
|
||||||||
|
Current assets:
|
||||||||
|
Cash and cash equivalents
|
$ | 10,456 | $ | 16,234 | ||||
|
Accounts receivable, less allowance for doubtful accounts of $1,579 and $1,333
|
65,960 | 65,182 | ||||||
|
Receivable from related party
|
1,933 | 2,425 | ||||||
|
Inventories
|
5,042 | 3,949 | ||||||
|
Deferred income tax assets
|
- | 2,479 | ||||||
|
Prepaid expenses
|
2,949 | 2,570 | ||||||
|
Other assets
|
3,401 | 2,586 | ||||||
|
Total current assets
|
89,741 | 95,425 | ||||||
|
Property and equipment, net
|
16,083 | 15,499 | ||||||
|
Intangible assets, net
|
50,196 | 53,449 | ||||||
|
Goodwill
|
19,903 | 19,903 | ||||||
|
Long-term receivable from related party
|
1,235 | 1,562 | ||||||
|
Other long-term assets
|
13,713 | 14,807 | ||||||
| $ | 190,871 | $ | 200,645 | |||||
|
LIABILITIES AND SHAREHOLDERS’ EQUITY
|
||||||||
|
Current liabilities:
|
||||||||
|
Current portion of financing obligation
|
$ | 1,662 | $ | 1,473 | ||||
|
Current portion of term note payable
|
3,750 | - | ||||||
|
Accounts payable
|
10,376 | 8,306 | ||||||
|
Income taxes payable
|
4 | 221 | ||||||
|
Deferred revenue
|
20,847 | 12,752 | ||||||
|
Accrued liabilities
|
17,418 | 16,882 | ||||||
|
Total current liabilities
|
54,057 | 39,634 | ||||||
|
Financing obligation, less current portion
|
22,943 | 24,605 | ||||||
|
Term note payable, less current portion
|
10,313 | - | ||||||
|
Other liabilities
|
3,173 | 3,802 | ||||||
|
Deferred income tax liabilities
|
6,670 | 7,098 | ||||||
|
Total liabilities
|
97,156 | 75,139 | ||||||
|
Commitments and contingencies (Notes 6 and 7)
|
||||||||
|
Shareholders’ equity:
|
||||||||
|
Common stock, $.05 par value; 40,000 shares authorized, 27,056 shares issued
|
1,353 | 1,353 | ||||||
|
Additional paid-in capital
|
211,203 | 208,635 | ||||||
|
Retained earnings
|
76,628 | 69,612 | ||||||
|
Accumulated other comprehensive income
|
1,222 | 192 | ||||||
|
Treasury stock at cost, 13,332 shares and 10,909 shares
|
(196,691 | ) | (154,286 | ) | ||||
|
Total shareholders’ equity
|
93,715 | 125,506 | ||||||
| $ | 190,871 | $ | 200,645 | |||||
See accompanying notes to consolidated financial statements.
FRANKLIN COVEY CO.
CONSOLIDATED STATEMENTS OF INCOME AND COMPREHENSIVE INCOME
|
YEAR ENDED AUGUST 31,
|
2016
|
2015
|
2014
|
|||||||||
|
In thousands, except per-share amounts
|
||||||||||||
|
Net sales:
|
||||||||||||
|
Training and consulting services
|
$ | 189,661 | $ | 198,695 | $ | 193,720 | ||||||
|
Products
|
6,009 | 6,885 | 7,518 | |||||||||
|
Leasing
|
4,385 | 4,361 | 3,927 | |||||||||
| 200,055 | 209,941 | 205,165 | ||||||||||
|
Cost of sales:
|
||||||||||||
|
Training and consulting services
|
59,158 | 66,370 | 61,474 | |||||||||
|
Products
|
3,206 | 3,306 | 3,502 | |||||||||
|
Leasing
|
2,537 | 2,176 | 1,923 | |||||||||
| 64,901 | 71,852 | 66,899 | ||||||||||
|
Gross profit
|
135,154 | 138,089 | 138,266 | |||||||||
|
Selling, general, and administrative
|
113,589 | 108,802 | 105,801 | |||||||||
|
Impaired assets
|
- | 1,302 | 363 | |||||||||
|
Restructuring costs
|
776 | 587 | - | |||||||||
|
Depreciation
|
3,677 | 4,142 | 3,383 | |||||||||
|
Amortization
|
3,263 | 3,727 | 3,954 | |||||||||
|
Income from operations
|
13,849 | 19,529 | 24,765 | |||||||||
|
Interest income
|
325 | 383 | 427 | |||||||||
|
Interest expense
|
(2,263 | ) | (2,137 | ) | (2,237 | ) | ||||||
|
Discount on related-party receivables
|
- | (363 | ) | (1,196 | ) | |||||||
|
Income before income taxes
|
11,911 | 17,412 | 21,759 | |||||||||
|
Provision for income taxes
|
(4,895 | ) | (6,296 | ) | (3,692 | ) | ||||||
|
Net income
|
$ | 7,016 | $ | 11,116 | $ | 18,067 | ||||||
|
Net income per share:
|
||||||||||||
|
Basic
|
$ | 0.47 | $ | 0.66 | $ | 1.08 | ||||||
|
Diluted
|
0.47 | 0.66 | 1.07 | |||||||||
|
Weighted average number of common shares:
|
||||||||||||
|
Basic
|
14,944 | 16,742 | 16,720 | |||||||||
|
Diluted
|
15,076 | 16,923 | 16,947 | |||||||||
|
COMPREHENSIVE INCOME:
|
||||||||||||
|
Net income
|
$ | 7,016 | $ | 11,116 | $ | 18,067 | ||||||
|
Foreign currency translation adjustments, net of income
|
||||||||||||
|
tax benefit (provision) of $115, $52, and ($24)
|
1,030 | (1,259 | ) | (235 | ) | |||||||
|
Comprehensive income
|
$ | 8,046 | $ | 9,857 | $ | 17,832 | ||||||
See accompanying notes to consolidated financial statements.
FRANKLIN COVEY CO.
CONSOLIDATED STATEMENTS OF CASH FLOWS
|
YEAR ENDED AUGUST 31,
|
2016
|
2015
|
2014
|
|||||||||
|
In thousands
|
||||||||||||
|
CASH FLOWS FROM OPERATING ACTIVITIES
|
||||||||||||
|
Net income
|
$ | 7,016 | $ | 11,116 | $ | 18,067 | ||||||
|
Adjustments to reconcile net income to net cash provided
|
||||||||||||
|
by operating activities:
|
||||||||||||
|
Depreciation and amortization
|
6,943 | 7,875 | 7,326 | |||||||||
|
Amortization of capitalized curriculum costs
|
3,865 | 4,093 | 2,824 | |||||||||
|
Deferred income taxes
|
1,854 | 3,665 | (679 | ) | ||||||||
|
Stock-based compensation expense
|
3,121 | 2,536 | 3,534 | |||||||||
|
Impairment of assets
|
- | 1,302 | 363 | |||||||||
|
Excess tax expense (benefit) from stock-based compensation
|
52 | (137 | ) | (2,477 | ) | |||||||
|
Increase (decrease) of estimated acquisition earn out liability
|
1,538 | 35 | (1,579 | ) | ||||||||
|
Changes in assets and liabilities, net of effect of acquired business:
|
||||||||||||
|
Increase in accounts receivable, net
|
(576 | ) | (4,355 | ) | (9,548 | ) | ||||||
|
Decrease (increase) in inventories
|
(908 | ) | 2,239 | (2,136 | ) | |||||||
|
Decrease in receivable from related party
|
820 | 620 | 2,248 | |||||||||
|
Increase in prepaid expenses and other assets
|
(1,119 | ) | (2,010 | ) | (1,543 | ) | ||||||
|
Increase (decrease) in accounts payable and accrued liabilities
|
2,264 | (5,654 | ) | 359 | ||||||||
|
Increase in deferred revenue
|
8,112 | 2,481 | 3,287 | |||||||||
|
Increase (decrease) in income taxes payable/receivable
|
(316 | ) | 2,548 | (1,347 | ) | |||||||
|
Decrease in other long-term liabilities
|
(1 | ) | (164 | ) | (575 | ) | ||||||
|
Net cash provided by operating activities
|
32,665 | 26,190 | 18,124 | |||||||||
|
CASH FLOWS FROM INVESTING ACTIVITIES
|
||||||||||||
|
Purchases of property and equipment
|
(3,993 | ) | (2,446 | ) | (3,470 | ) | ||||||
|
Capitalized curriculum development
|
(2,236 | ) | (2,166 | ) | (7,787 | ) | ||||||
|
Acquisition of business, net of cash acquired
|
- | (262 | ) | (6,167 | ) | |||||||
|
Net cash used for investing activities
|
(6,229 | ) | (4,874 | ) | (17,424 | ) | ||||||
|
CASH FLOWS FROM FINANCING ACTIVITIES
|
||||||||||||
|
Proceeds from line of credit borrowings
|
46,454 | - | 35,331 | |||||||||
|
Payments on line of credit borrowings
|
(46,454 | ) | - | (35,331 | ) | |||||||
|
Proceeds from term notes payable financing
|
15,000 | - | - | |||||||||
|
Principal payments on term notes payable
|
(937 | ) | - | - | ||||||||
|
Principal payments on financing obligation
|
(1,472 | ) | (1,302 | ) | (1,155 | ) | ||||||
|
Purchases of common stock for treasury
|
(43,586 | ) | (14,427 | ) | (4,381 | ) | ||||||
|
Payment of contingent consideration liability
|
(2,167 | ) | - | - | ||||||||
|
Income tax benefit (expense) recorded in paid-in capital
|
(52 | ) | 137 | 2,477 | ||||||||
|
Proceeds from sales of common stock held in treasury
|
679 | 689 | 614 | |||||||||
|
Net cash used for financing activities
|
(32,535 | ) | (14,903 | ) | (2,445 | ) | ||||||
|
Effect of foreign currency exchange rates on cash and cash equivalents
|
321 | (662 | ) | (63 | ) | |||||||
|
Net increase (decrease) in cash and cash equivalents
|
(5,778 | ) | 5,751 | (1,808 | ) | |||||||
|
Cash and cash equivalents at beginning of the year
|
16,234 | 10,483 | 12,291 | |||||||||
|
Cash and cash equivalents at end of the year
|
$ | 10,456 | $ | 16,234 | $ | 10,483 | ||||||
|
Supplemental disclosure of cash flow information:
|
||||||||||||
|
Cash paid for income taxes
|
$ | 3,410 | $ | 2,383 | $ | 6,323 | ||||||
|
Cash paid for interest
|
2,231 | 2,130 | 2,237 | |||||||||
|
Non-cash investing and financing activities:
|
||||||||||||
|
Purchases of property and equipment financed by accounts payable
|
$ | 334 | $ | 134 | $ | 104 | ||||||
See accompanying notes to consolidated financial statements.
FRANKLIN COVEY CO.
CONSOLIDATED STATEMENTS OF SHAREHOLDERS’ EQUITY
|
Accumulated
|
||||||||||||||||||||||||||||
|
Other
|
||||||||||||||||||||||||||||
|
Common
|
Common
|
Additional
|
Retained
|
Comprehensive
|
Treasury
|
Treasury
|
||||||||||||||||||||||
|
Stock Shares
|
Stock Amount
|
Paid-In Capital
|
Earnings
|
Income
|
Stock Shares
|
Stock Amount
|
||||||||||||||||||||||
|
In thousands
|
||||||||||||||||||||||||||||
|
Balance at August 31, 2013
|
27,056 | $ | 1,353 | $ | 210,227 | $ | 40,429 | $ | 1,686 | (10,759 | ) | $ | (147,189 | ) | ||||||||||||||
|
Issuance of common stock from
|
||||||||||||||||||||||||||||
|
treasury
|
(9,010 | ) | 698 | 9,624 | ||||||||||||||||||||||||
|
Purchase of treasury shares
|
(222 | ) | (4,381 | ) | ||||||||||||||||||||||||
|
Unvested share award
|
(202 | ) | 15 | 202 | ||||||||||||||||||||||||
|
Stock-based compensation
|
3,666 | |||||||||||||||||||||||||||
|
Cumulative translation
|
||||||||||||||||||||||||||||
|
adjustments
|
(235 | ) | ||||||||||||||||||||||||||
|
Tax benefits recorded in
|
||||||||||||||||||||||||||||
|
paid-in capital
|
2,477 | |||||||||||||||||||||||||||
|
Other
|
(10 | ) | 2 | 10 | ||||||||||||||||||||||||
|
Net income
|
18,067 | |||||||||||||||||||||||||||
|
Balance at August 31, 2014
|
27,056 | 1,353 | 207,148 | 58,496 | 1,451 | (10,266 | ) | (141,734 | ) | |||||||||||||||||||
|
Issuance of common stock from
|
||||||||||||||||||||||||||||
|
treasury
|
(847 | ) | 111 | 1,536 | ||||||||||||||||||||||||
|
Purchase of treasury shares
|
(778 | ) | (14,427 | ) | ||||||||||||||||||||||||
|
Unvested share award
|
(336 | ) | 24 | 336 | ||||||||||||||||||||||||
|
Stock-based compensation
|
2,536 | |||||||||||||||||||||||||||
|
Cumulative translation
|
||||||||||||||||||||||||||||
|
adjustments
|
(1,259 | ) | ||||||||||||||||||||||||||
|
Tax benefits recorded in
|
||||||||||||||||||||||||||||
|
paid-in capital
|
137 | |||||||||||||||||||||||||||
|
Other
|
(3 | ) | 3 | |||||||||||||||||||||||||
|
Net income
|
11,116 | |||||||||||||||||||||||||||
|
Balance at August 31, 2015
|
27,056 | $ | 1,353 | $ | 208,635 | $ | 69,612 | $ | 192 | (10,909 | ) | $ | (154,286 | ) | ||||||||||||||
|
Issuance of common stock from
|
||||||||||||||||||||||||||||
|
treasury
|
(143 | ) | 57 | 823 | ||||||||||||||||||||||||
|
Purchase of treasury shares
|
(2,505 | ) | (43,586 | ) | ||||||||||||||||||||||||
|
Unvested share award
|
(356 | ) | 25 | 356 | ||||||||||||||||||||||||
|
Stock-based compensation
|
3,121 | |||||||||||||||||||||||||||
|
Cumulative translation
|
||||||||||||||||||||||||||||
|
adjustments
|
1,030 | |||||||||||||||||||||||||||
|
Tax expense recorded in
|
||||||||||||||||||||||||||||
|
paid-in capital
|
(52 | ) | ||||||||||||||||||||||||||
|
Other
|
(2 | ) | 2 | |||||||||||||||||||||||||
|
Net income
|
7,016 | |||||||||||||||||||||||||||
|
Balance at August 31, 2016
|
27,056 | $ | 1,353 | $ | 211,203 | $ | 76,628 | $ | 1,222 | (13,332 | ) | $ | (196,691 | ) | ||||||||||||||
See accompanying notes to consolidated financial statements.
FRANKLIN COVEY CO.
NOTES TO CONSOLIDATED FINANCIAL STATEMENTS
|
1.
|
NATURE OF OPERATIONS AND SUMMARY OF SIGNIFICANT ACCOUNTING POLICIES
|
Franklin Covey Co. (hereafter referred to as we, us, our, or the Company) is a global company specializing in performance improvement. We help individuals and organizations achieve results that require a change in human behavior and our mission is to “enable greatness in people and organizations everywhere.” Our expertise is in the following seven areas: Leadership, Execution, Productivity, Trust, Sales Performance, Customer Loyalty, and Educational improvement. Our offerings are described in further detail at www.franklincovey.com and elsewhere in this report. We have some of the best-known offerings in the training industry, including a suite of individual-effectiveness and leadership-development training and products based on the best-selling books, The 7 Habits of Highly Effective People, The Speed of Trust, The Leader In Me, and The Four Disciplines of Execution, and proprietary content in the areas of Execution, Sales Performance, Productivity, Customer Loyalty, and Educational improvement. Through our organizational research and curriculum development efforts, we seek to consistently create, develop, and introduce new services and products that help individuals and organizations achieve their own great purposes.
Fiscal Year
The Company utilizes a modified 52/53-week fiscal year that ends on August 31 of each year. Corresponding quarterly periods generally consist of 13-week periods that ended on November 28, 2015, February 27, 2016, and May 28, 2016 during fiscal 2016. Unless otherwise noted, references to fiscal years apply to the 12 months ended August 31 of the specified year.
Basis of Presentation
The accompanying consolidated financial statements include the accounts of the Company and our wholly-owned subsidiaries, which consist of Franklin Development Corp., and our offices in Japan, the United Kingdom, and Australia. Intercompany balances and transactions are eliminated in consolidation.
Pervasiveness of Estimates
The preparation of financial statements in conformity with accounting principles generally accepted in the United States of America requires us to make estimates and assumptions that affect the reported amounts of assets and liabilities and the disclosure of contingent assets and liabilities at the dates of the financial statements, and the reported amounts of revenues and expenses during the reporting periods. Actual results could differ from those estimates.
Reclassifications
Certain reclassifications have been made to prior period financial statements to conform to the current period presentation. These reclassifications were made to separately disclose deferred revenue on our consolidated balance sheets and the change in deferred revenue on our consolidated statements of cash flows. Deferred revenue amounts were previously classified as a component of accrued liabilities. These reclassifications did not impact our results of operations, current liabilities, or net cash flows in the periods presented.
Cash and Cash Equivalents
Some of our cash is deposited with financial institutions located throughout the United States of America and at banks in foreign countries where we operate subsidiary offices, and at times may exceed insured limits. We consider all highly liquid debt instruments with a maturity date of three months or less to be cash equivalents. We did not hold a significant amount of investments that would be considered cash equivalent instruments at August 31, 2016 or 2015.
Inventories
Inventories are stated at the lower of cost or market, cost being determined using the first-in, first-out method. Elements of cost in inventories generally include raw materials and direct labor. Cash flows from the sale of inventory are included in cash flows provided by operating activities in our consolidated statements of cash flows. Our inventories are comprised primarily of training materials, books, and related accessories, and consisted of the following (in thousands):
|
AUGUST 31,
|
2016
|
2015
|
||||||
|
Finished goods
|
$ | 5,002 | $ | 3,914 | ||||
|
Raw materials
|
40 | 35 | ||||||
| $ | 5,042 | $ | 3,949 | |||||
Provision is made to reduce excess and obsolete inventories to their estimated net realizable value. In assessing the valuation of inventories, we make judgments regarding future demand requirements and compare these estimates with current and committed inventory levels. Inventory requirements may change based on projected customer demand, training curriculum life-cycle changes, and other factors that could affect the valuation of our inventories.
Property and Equipment
Property and equipment are recorded at cost. Depreciation expense, which includes depreciation on our corporate campus that is accounted for as a financing obligation (Note 5), and the amortization of assets recorded under capital lease obligations, is calculated using the straight-line method over the lesser of the expected useful life of the asset or the contracted lease period. We generally use the following depreciable lives for our major classifications of property and equipment:
|
Description
|
Useful Lives
|
|
Buildings
|
20 years
|
|
Machinery and equipment
|
5–7 years
|
|
Computer hardware and software
|
3–5 years
|
|
Furniture, fixtures, and leasehold improvements
|
5–7 years
|
Our property and equipment were comprised of the following (in thousands):
|
AUGUST 31,
|
2016
|
2015
|
||||||
|
Land and improvements
|
$ | 1,312 | $ | 1,312 | ||||
|
Buildings
|
32,201 | 31,556 | ||||||
|
Machinery and equipment
|
2,279 | 2,273 | ||||||
|
Computer hardware and software
|
18,552 | 18,327 | ||||||
|
Furniture, fixtures, and leasehold
|
||||||||
|
improvements
|
9,292 | 10,367 | ||||||
| 63,636 | 63,835 | |||||||
|
Less accumulated depreciation
|
(47,553 | ) | (48,336 | ) | ||||
| $ | 16,083 | $ | 15,499 | |||||
Leasehold improvements are amortized over the lesser of the useful economic life of the asset or the contracted lease period. We expense costs for repairs and maintenance as incurred. Gains and losses resulting from the sale of property and equipment are recorded in operating income.
Impairment of Long-Lived Assets
Long-lived tangible assets and definite-lived intangible assets are reviewed for possible impairment whenever events or changes in circumstances indicate that the carrying amount of such assets may not be recoverable. We use an estimate of undiscounted future net cash flows of the assets over the remaining useful lives in determining whether the carrying value of the assets is recoverable. If the carrying values of the assets exceed the anticipated future cash flows of the assets, we recognize an impairment loss equal to the difference between the carrying values of the assets and their estimated fair values. Impairment of long-lived assets is assessed at the lowest levels for which there are identifiable cash flows that are independent from other groups of assets. The evaluation of long-lived assets requires us to use estimates of future cash flows. If forecasts and assumptions used to support the realizability of our long-lived tangible and definite-lived intangible assets change in the future, significant impairment charges could result that would adversely affect our results of operations and financial condition. For more information regarding our impaired asset charges in fiscal 2015 and fiscal 2014, refer to Note 11.
Indefinite-Lived Intangible Assets and Goodwill
Intangible assets that are deemed to have an indefinite life and acquired goodwill are not amortized, but rather are tested for impairment on an annual basis or more often if events or circumstances indicate that a potential impairment exists. The Covey trade name intangible asset has been deemed to have an indefinite life. This intangible asset is tested for impairment using qualitative factors or the present value of estimated royalties on trade name related revenues, which consist primarily of training seminars and work sessions, international licensee sales, and related products. Based on the fiscal 2016 evaluation of the Covey trade name, we believe the fair value of the Covey trade name substantially exceeds its carrying value. No impairment charges were recorded against the Covey trade name during the fiscal years ended August 31, 2016, 2015, or 2014.
Goodwill is recorded when the purchase price for an acquisition exceeds the estimated fair value of the net tangible and identified intangible assets acquired. We tested goodwill for impairment at August 31, 2016 at the reporting unit level using a quantitative approach. The first step of the goodwill impairment testing process (Step 1) involves determining whether the estimated fair value of the reporting unit exceeds its respective book value. In performing Step 1, we compare the carrying amount of the reporting unit to its estimated fair value. If the fair value exceeds the book value, goodwill of that reporting unit is not impaired. The estimated fair value of each reporting unit was calculated using a combination of the income approach (discounted cash flows) and the market approach (using market multiples derived from a set of companies with comparable market characteristics). The estimated fair values of the reporting units from these approaches were weighted in the determination of the total fair value.
If the Step 1 result concludes that the fair value does not exceed the book value of the reporting unit, goodwill may be impaired and additional analysis is required (Step 2). Step 2 of the goodwill impairment test compares the implied fair value of a reporting unit’s goodwill to its carrying value. The implied fair value of goodwill is derived by performing a hypothetical purchase price allocation for the reporting unit as of the measurement date, allocating the reporting unit’s estimated fair value to its assets and liabilities, including any recognizable intangible assets. The residual amount from performing this allocation represents the implied fair value of goodwill. To the extent this amount is below the carrying value of goodwill, an impairment loss is recorded.
On an interim basis, we consider whether events or circumstances are present that may lead to the determination that goodwill may be impaired. These circumstances include, but are not limited to, the following:
|
·
|
significant underperformance relative to historical or projected future operating results;
|
|
·
|
significant change in the manner of our use of acquired assets or the strategy for the overall business;
|
|
·
|
significant change in prevailing interest rates;
|
|
·
|
significant negative industry or economic trend;
|
|
·
|
significant change in market capitalization relative to book value; and/or
|
|
·
|
significant negative change in market multiples of the comparable company set.
|
If, based on events or changing circumstances, we determine it is more likely than not that the fair value of a reporting unit does not exceed its carrying value, we would be required to test goodwill for impairment.
Determining the fair value of a reporting unit is judgmental in nature and involves the use of significant estimates and assumptions. These estimates and assumptions include revenue growth rates and operating margins used to calculate projected future cash flows, risk-adjusted discount rates, future economic and market conditions, and determination of appropriate market comparables. We base our fair value estimates on assumptions we believe to be reasonable but that are unpredictable and inherently uncertain. Actual future results may differ from those estimates. In addition, we make certain judgments and assumptions in allocating shared assets and liabilities to determine the carrying values for each of our reporting units. The timing and frequency of our goodwill impairment tests are based on an ongoing assessment of events and circumstances that would indicate a possible impairment. Based on the results of our goodwill impairment testing during fiscal 2016, we determined that no impairment existed at August 31, 2016 and 2015, as each reportable operating segment’s estimated fair value substantially exceeded its carrying value. We will continue to monitor our goodwill and intangible assets for impairment and conduct formal tests when impairment indicators are present. For more information regarding our intangible assets and goodwill, refer to Note 3.
Capitalized Curriculum Development Costs
During the normal course of business, we develop training courses and related materials that we sell to our clients. Capitalized curriculum development costs include certain expenditures to develop course materials such as video segments, course manuals, and other related materials. Our capitalized curriculum development spending in fiscal 2016, which totaled $2.2 million, was primarily for offerings related to The Leader In Me and the All Access Pass, as well as various other offerings. During fiscal 2015, our capital spending included significant revisions to the Speed of Trust offering. In fiscal 2014, the majority of our capital spending on curriculum was for our re-created The 7 Habits of Highly Effective People – Signature Edition, which is our best-selling offering throughout the world. Generally, curriculum costs are capitalized when there is a major revision to an existing course that requires a significant re-write of the course materials or curriculum. Costs incurred to maintain existing offerings are expensed when incurred. In addition, development costs incurred in the research and development of new curriculum and software products to be sold, leased, or otherwise marketed are expensed as incurred until economic and technological feasibility has been established.
Capitalized development costs are amortized over three- to five-year useful lives, which are based on numerous factors, including expected cycles of major changes to our content. Capitalized curriculum development costs are reported as a component of other long-term assets in our consolidated balance sheets and totaled $8.9 million and $10.5 million at August 31, 2016 and 2015. Amortization of capitalized curriculum development costs is reported as a component of cost of sales.
Accrued Liabilities
Significant components of our accrued liabilities were as follows (in thousands):
|
AUGUST 31,
|
2016
|
2015
|
||||||
|
Accrued compensation
|
$ | 8,810 | $ | 8,622 | ||||
|
Other accrued liabilities
|
8,608 | 8,260 | ||||||
| $ | 17,418 | $ | 16,882 | |||||
Contingent Consideration for Business Acquisitions
Acquisitions may include contingent consideration payments based on future financial measures of an acquired company. Contingent consideration is required to be recognized at fair value as of the acquisition date. We estimate the fair value of these liabilities based on financial projections of the acquired company and estimated probabilities of achievement. At each reporting date, the contingent consideration obligation is revalued to estimated fair value and changes in fair value subsequent to the acquisition date are reflected in selling, general, and administrative expense in our consolidated income statements, and could have a material impact on our operating results. Changes in the fair value of contingent consideration obligation may result from changes in discount periods or rates, changes in the timing and amount of earnings estimates, and changes in probability assumptions with respect to the likelihood of achieving various payment criteria.
Foreign Currency Translation and Transactions
The functional currencies of our foreign operations are the reported local currencies. Translation adjustments result from translating our foreign subsidiaries’ financial statements into United States dollars. The balance sheet accounts of our foreign subsidiaries are translated into United States dollars using the exchange rate in effect at the balance sheet date. Revenues and expenses are translated using average exchange rates for each month during the fiscal year. The resulting translation differences are recorded as a component of accumulated other comprehensive income in shareholders’ equity. Foreign currency transaction losses totaled $0.3 million, $1.1 million, and $0.1 million for the fiscal years ended August 31, 2016, 2015, and 2014, respectively, and are included as a component of selling, general, and administrative expenses in our consolidated income statements.
Sales Taxes
We collect sales tax on qualifying transactions with customers based upon applicable sales tax rates in various jurisdictions. We account for sales taxes collected using the net method; accordingly, we do not include sales taxes in net sales reported in our consolidated income statements.
Revenue Recognition
We recognize revenue when: 1) persuasive evidence of an arrangement exists, 2) delivery of product has occurred or services have been rendered, 3) the price to the customer is fixed or determinable, and 4) collectability is reasonably assured. For training and service sales, these conditions are generally met upon presentation of the training seminar or delivery of the consulting services based upon daily rates. For most of our product sales, these conditions are met upon shipment of the product to the customer. At times, our customers may request access to our intellectual property for the flexibility to print certain training materials or to have access to certain training videos and other training aids at their convenience. For intellectual property license sales, the revenue recognition conditions are generally met at the later of delivery of the curriculum to the client or the effective date of the arrangement.
Revenue recognition for multiple-element arrangements requires judgment to determine if multiple elements exist, whether elements can be accounted for as separate units of accounting, and if so, the fair value for each of the elements. A deliverable constitutes a separate unit of accounting when it has standalone value to our clients. We routinely enter into arrangements that can include various combinations of multiple training curriculum, consulting services, and intellectual property licenses. The timing of delivery and performance of the elements typically varies from contract to contract. Generally, these items qualify as separate units of accounting because they have value to the customer on a standalone basis.
When the Company’s training and consulting arrangements contain multiple deliverables, consideration is allocated at the inception of the arrangement to all deliverables based on their relative selling prices at the beginning of the agreement, and revenue is recognized as each curriculum, consulting service, or
intellectual property license is delivered. We use the following selling price hierarchy to determine the fair value to be used for allocating revenue to the elements: (i) vendor-specific objective evidence of fair value (VSOE), (ii) third-party evidence (TPE), and (iii) best estimate of selling price (BESP). Generally, VSOE is based on established pricing and discounting practices for the deliverables when sold separately. In determining VSOE, we require that a substantial majority of the selling prices fall within a narrow range. When VSOE cannot be established, judgment is applied with respect to whether a selling price can be established based on TPE, which is determined based on competitor prices for similar offerings when sold separately. Our products and services normally contain a significant level of differentiation such that the comparable pricing of services with similar functionality cannot be obtained. When we are unable to establish a selling price using VSOE or TPE, BESP is used in our allocation of arrangement consideration. BESPs are established as best estimates of what the selling price would be if the deliverables were sold regularly on a stand-alone basis. Our process for determining BESPs requires judgment and considers multiple factors, such as market conditions, type of customer, geographies, stage of product lifecycle, internal costs, and gross margin objectives. These factors may vary over time depending upon the unique facts and circumstances related to each deliverable. However, we do not expect the effect of changes in the selling price or method or assumptions used to determine selling price to have a significant effect on the allocation of arrangement consideration.
Our multiple-element arrangements generally do not include performance, cancellation, termination, or refund-type provisions.
Our international strategy includes the use of licensees in countries where we do not have a wholly-owned direct office. Licensee companies are unrelated entities that have been granted a license to translate our content and offerings, adapt the content and curriculum to the local culture, and sell our content in a specific country or region. Licensees are required to pay us royalties based upon a percentage of their sales to clients. We recognize royalty income each period based upon the sales information reported to us from our licensees. Licensee royalty revenues are included as a component of training sales and totaled $14.4 million, $13.7 million, and $13.8 million for the fiscal years ended August 31, 2016, 2015, and 2014.
Revenue is recognized as the net amount to be received after deducting estimated amounts for discounts and product returns.
Stock-Based Compensation
We record the compensation expense for all stock-based payments to employees and non-employees, including grants of stock options and the compensatory elements of our employee stock purchase plan, in our consolidated income statements based upon their fair values over the requisite service period. For more information on our stock-based compensation plans, refer to Note 10.
Shipping and Handling Fees and Costs
All shipping and handling fees billed to customers are recorded as a component of net sales. All costs incurred related to the shipping and handling of products are recorded in cost of sales.
Advertising Costs
Costs for advertising are expensed as incurred. Advertising costs included in selling, general, and administrative expenses totaled $6.6 million, $7.4 million, and $7.5 million for the fiscal years ended August 31, 2016, 2015, and 2014.
Income Taxes
Our income tax provision has been determined using the asset and liability approach of accounting for income taxes. Under this approach, deferred income taxes represent the future tax consequences
expected to occur when the reported amounts of assets and liabilities are recovered or paid. The income tax provision represents income taxes paid or payable for the current year plus the change in deferred taxes during the year. Deferred income taxes result from differences between the financial and tax bases of our assets and liabilities and are adjusted for tax rates and tax laws when changes are enacted. A valuation allowance is provided against deferred income tax assets when it is more likely than not that all or some portion of the deferred income tax assets will not be realized. Interest and penalties related to uncertain tax positions are recognized as components of income tax expense in our consolidated income statements.
We may recognize the tax benefit from an uncertain tax position only if it is more likely than not that the tax position will be sustained on examination by the taxing authorities based on the technical merits of the position. The tax benefits recognized in the financial statements from such a position are measured based on the largest benefit that has a greater than 50 percent likelihood of being realized upon ultimate settlement.
We provide for income taxes, net of applicable foreign tax credits, on temporary differences in our investment in foreign subsidiaries, which consist primarily of unrepatriated earnings.
Comprehensive Income
Comprehensive income includes changes to equity accounts that were not the result of transactions with shareholders. Comprehensive income is comprised of net income or loss and other comprehensive income and loss items. Our other comprehensive income and losses generally consist of changes in the cumulative foreign currency translation adjustment, net of tax.
Accounting Pronouncements Issued and Adopted
In November 2015, the Financial Accounting Standards Board (FASB) issued Accounting Standards Update (ASU) No. 2015-17, Income Taxes (Topic 740): Balance Sheet Classification of Deferred Taxes. This guidance requires all deferred tax assets and liabilities to be classified as non-current in the statement of financial position. The provisions of ASU No. 2015-17 are effective for annual periods beginning after December 15, 2016, including interim periods within that reporting period. We have elected, as permitted by the guidance, to early adopt ASU No. 2015-17 on a prospective basis as of August 31, 2016 and prior periods were not restated. The adoption of this standard did not have a material effect on our consolidated balance sheet at August 31, 2016.
Accounting Pronouncements Issued Not Yet Adopted
On May 28, 2014, the FASB issued ASU No. 2014-09, Revenue from Contracts with Customers. This new standard was issued in conjunction with the International Accounting Standards Board (IASB) and is designed to create a single, principles-based process by which all businesses calculate revenue. The new standard replaces numerous individual, industry-specific revenue rules found in U.S. generally accepted accounting principles and is required to be adopted in fiscal years beginning after December 15, 2017 and for interim periods therein. The new standard may be applied using the “full retrospective” or “modified retrospective” approach. As of August 31, 2016, we have not yet determined the method of adoption nor the impact that ASU No. 2014-09 will have on our reported revenue or results of operations.
In April 2016, the FASB issued ASU 2016-10, Revenue from Contracts with Customers (Topic 606) - Identifying Performance Obligations and Licensing. The guidance in ASU 2016-10 clarifies aspects of Topic 606 related to identifying performance obligations and the licensing implementation guidance, while retaining the related core principles for those areas. The effective date and transition requirements for ASU 2016-10 are the same as the effective date and transition requirements for Topic 606 (ASU 2014-09) discussed above. While we do not expect the adoption of ASU 2016-10 to have a material effect on our business, we are evaluating the potential impact that adoption of ASU 2016-10 may have on our financial position, results of operations, and cash flows.
On February 25, 2016, the FASB issued ASU No. 2016-02, Leases. The new lease accounting standard is the result of a collaborative effort with the IASB (similar to the new revenue standard described above), although some differences remain between the two standards. This new standard will affect all entities that lease assets and will require lessees to recognize a lease liability and a right-of-use asset for all leases (except for short-term leases that have a duration of less than one year) as of the date on which the lessor makes the underlying asset available to the lessee. For lessors, accounting for leases is substantially the same as in prior periods. For public companies, the new lease standard is effective for fiscal years beginning after December 15, 2018, including interim periods within those fiscal years. Early adoption is permitted for all entities. For leases existing at, or entered into after, the beginning of the earliest comparative period presented in the financial statements, lessees and lessors must apply a modified retrospective transition approach. While we expect the adoption of this new standard will increase reported assets and liabilities, as of August 31, 2016, we have not yet determined the full impact that the adoption of ASU 2016-02 will have on our financial statements.
In March 2016, the FASB issued ASU 2016-09, Compensation - Stock Compensation (Topic 718) - Improvements to Employee Share-Based Payment Accounting. The guidance in ASU 2016-09 simplifies several aspects of the accounting for stock-based payment transactions, including the income tax consequences, classification of awards as either equity or liabilities, and classification of items on the statement of cash flows. ASU 2016-09 is effective for public companies' annual periods, including interim periods within those fiscal years, beginning after December 15, 2016. Early adoption is permitted subject to certain requirements, and the method of application (i.e., retrospective, modified retrospective or prospective) depends on the transaction area that is being amended. Following adoption, the primary impact on our consolidated financial statements will be the recognition of excess tax benefits in the provision for income taxes rather than additional paid-in capital, which will likely result in increased volatility in the reported amounts of income tax expense and net income. As of August 31, 2016, we have not completed our evaluation of the impact of ASU 2016-09 on our results of operations or cash flows.
In June 2014, the FASB issued ASU No. 2014-12, Compensation - Stock Compensation (Topic 718). The guidance in ASU No. 2014-12 addresses accounting for share-based payments when the terms of an award provide that a performance target could be achieved after the requisite service period. ASU 2014-12 indicates that, in such situations, the performance target should be treated as a performance condition and, accordingly, the performance target should not be reflected in estimating the grant-date fair value of the award. Instead, compensation cost should be recognized in the period in which it becomes probable that the performance target will be achieved. The guidance in ASU 2014-12 is effective for annual periods and interim periods within those annual periods beginning after December 15, 2015. We do not expect the adoption of ASU 2014-12 in fiscal 2017 will have a material effect on our financial position, results of operations, or cash flows.
|
2.
|
ACCOUNTS RECEIVABLE
|
Accounts receivable are recorded at the invoiced amount and do not bear interest. The allowance for doubtful accounts represents our best estimate of the amount of probable credit losses in the existing accounts receivable balance, and we review the adequacy of the allowance for doubtful accounts on a regular basis. We determine the allowance for doubtful accounts using historical write-off experience based on the age of the receivable balances and current economic conditions in general. Receivable balances past due over 90 days, which exceed a specified dollar amount, are reviewed individually for collectability. As we increase sales to governmental organizations, including school districts, and offer longer payment terms on certain contracts (which are still within our normal payment terms), our collection cycle may increase in future periods. If the risk of non-collection increases for such receivable balances, there may be additional charges to expense to increase the allowance for doubtful accounts.
We classify receivable amounts as current or long-term based on expected payment and record long-term accounts receivable at their net present value. During the fourth quarter of fiscal 2015, we became aware of financial difficulties at a contracting partner from whom we receive payment for services rendered on a
large federal government contract. Subsequent to August 31, 2015 we received a $1.8 million payment from this entity and entered into discussions to convert the remaining receivable, which totaled $2.9 million, into a note receivable. Based on expected payment terms as of August 31, 2015, we reclassified this amount to other assets and other long-term assets on the consolidated balance sheet based on expected principal payments. The note receivable is payable over a three-year period and bears interest at 5.0 percent per year. At August 31, 2016, the contracting partner is current on their payments to us. While we believe the remaining amounts due are collectible within the terms of the note receivable, the failure of the contracting partner to pay us may have an adverse impact on our cash flows, financial position, and liquidity.
Account balances are charged off against the allowance after all means of collection have been exhausted and the potential for recovery is considered remote. We do not have any off-balance sheet credit exposure related to our customers nor do we generally require collateral or other security agreements from our customers. The increase in our account write offs during fiscal 2016 was primarily due to a large Education practice contract that was written off and from uncollectible receivables due from a large sporting goods retailer that went bankrupt in fiscal 2016.
Activity in our allowance for doubtful accounts was comprised of the following for the periods indicated (in thousands):
|
YEAR ENDED
|
||||||||||||
|
AUGUST 31,
|
2016
|
2015
|
2014
|
|||||||||
|
Beginning balance
|
$ | 1,333 | $ | 918 | $ | 982 | ||||||
|
Charged to costs and expenses
|
2,022 | 699 | 141 | |||||||||
|
Deductions
|
(1,776 | ) | (284 | ) | (205 | ) | ||||||
|
Ending balance
|
$ | 1,579 | $ | 1,333 | $ | 918 | ||||||
Deductions on the foregoing table represent the write-off of amounts deemed uncollectible during the fiscal year presented. Recoveries of amounts previously written off were insignificant for the periods presented.
|
3.
|
INTANGIBLE ASSETS AND GOODWILL
|
Our intangible assets were comprised of the following (in thousands):
|
Gross Carrying
|
Accumulated
|
Net Carrying
|
||||||||||
|
AUGUST 31, 2016
|
Amount
|
Amortization
|
Amount
|
|||||||||
|
Definite-lived intangible assets:
|
||||||||||||
|
License rights
|
$ | 27,000 | $ | (16,790 | ) | $ | 10,210 | |||||
|
Acquired curriculum
|
58,564 | (42,175 | ) | 16,389 | ||||||||
|
Customer lists
|
16,827 | (16,529 | ) | 298 | ||||||||
|
Internally developed software
|
2,049 | (2,049 | ) | - | ||||||||
|
Trade names
|
1,250 | (951 | ) | 299 | ||||||||
| 105,690 | (78,494 | ) | 27,196 | |||||||||
|
Indefinite-lived intangible asset:
|
||||||||||||
|
Covey trade name
|
23,000 | - | 23,000 | |||||||||
| $ | 128,690 | $ | (78,494 | ) | $ | 50,196 | ||||||
|
AUGUST 31, 2015
|
||||||||||||
|
Definite-lived intangible assets:
|
||||||||||||
|
License rights
|
$ | 27,000 | $ | (15,852 | ) | $ | 11,148 | |||||
|
Acquired curriculum
|
58,549 | (40,587 | ) | 17,962 | ||||||||
|
Customer lists
|
16,827 | (16,303 | ) | 524 | ||||||||
|
Internally developed software
|
2,049 | (1,708 | ) | 341 | ||||||||
|
Trade names
|
1,250 | (776 | ) | 474 | ||||||||
| 105,675 | (75,226 | ) | 30,449 | |||||||||
|
Indefinite-lived intangible asset:
|
||||||||||||
|
Covey trade name
|
23,000 | - | 23,000 | |||||||||
| $ | 128,675 | $ | (75,226 | ) | $ | 53,449 | ||||||
Our intangible assets are amortized over the estimated useful life of the asset. The range of remaining estimated useful lives and weighted-average amortization period over which we are amortizing the major categories of definite-lived intangible assets at August 31, 2016 were as follows:
|
Category of Intangible Asset
|
Range of Remaining Estimated
Useful Lives
|
Weighted Average Original
Amortization Period
|
|
License rights
|
10 years
|
30 years
|
|
Curriculum
|
3 to 10 years
|
26 years
|
|
Customer lists
|
1 to 3 years
|
14 years
|
|
Internally developed software
|
None
|
3 years
|
|
Trade names
|
1 to 3 years
|
5 years
|
Our aggregate amortization expense from definite-lived intangible assets totaled $3.3 million, $3.7 million, and $4.0 million for the fiscal years ended August 31, 2016, 2015, and 2014. Amortization expense from our intangible assets over the next five years is expected to be as follows (in thousands):
|
YEAR ENDING
|
||||
|
AUGUST 31,
|
||||
|
2017
|
$ | 2,883 | ||
|
2018
|
2,729 | |||
|
2019
|
2,489 | |||
|
2020
|
2,450 | |||
|
2021
|
2,449 | |||
Our goodwill balance at August 31, 2016 was generated from the fiscal 2009 acquisition of CoveyLink Worldwide, LLC (CoveyLink), the fiscal 2013 acquisition of Ninety Five 5, LLC (Ninety Five 5), and the fiscal 2014 acquisition of Red Tree, Inc. The previous owners of CoveyLink, which includes a brother of one of our executive officers, were entitled to earn annual contingent payments based upon earnings growth over the subsequent five years. These contingent payments were classified as goodwill on our consolidated balance sheets when paid according to previously existing business combination guidance. During fiscal 2015, we made a $0.3 million final payment based on the results of a reassessment of the terms and conditions of the CoveyLink acquisition. Our consolidated goodwill changed as follows during fiscal 2016 and 2015 (in thousands):
|
Balance at August 31, 2014
|
$ | 19,641 | ||
|
Contingent consideration payment on
|
||||
|
CoveyLink acquisition
|
262 | |||
|
Accumulated impairments
|
- | |||
|
Balance at August 31, 2015
|
19,903 | |||
|
Accumulated impairments
|
- | |||
|
Balance at August 31, 2016
|
$ | 19,903 | ||
In connection with the reorganization or our internal reporting structure during fiscal 2016, we allocated our goodwill to the new reportable operating segments based on their relative fair values as follows (in thousands):
|
Direct offices
|
$ | 10,790 | ||
|
Strategic markets
|
2,930 | |||
|
Education practice
|
2,176 | |||
|
International licensees
|
4,007 | |||
| $ | 19,903 |
The goodwill generated by the Red Tree and Ninety Five 5 acquisitions are primarily attributable to the organization, methodologies, and curriculums that complement our existing practices and content. All of the goodwill generated from the acquisition of Red Tree and Ninety Five 5 is expected to be deductible for income tax purposes.
|
4.
|
REVOLVING LINE OF CREDIT AND TERM NOTES PAYABLE
|
During fiscal 2011, we entered into an amended and restated secured credit agreement (the Restated Credit Agreement) with our existing lender. The Restated Credit Agreement provides us with a revolving line of credit facility and the ability to borrow on other instruments, such as term loans. We generally renew the Restated Credit Agreement on a regular basis to maintain the long-term availability of this credit facility.
On May 24, 2016, we entered into the Fifth Modification Agreement to the Restated Credit Agreement. The primary purposes of the Fifth Modification Agreement were to (i) obtain a term loan for $15.0 million (the Term Loan); (ii) increase the maximum principal amount of the revolving line of credit from $30.0 million to $40.0 million; (iii) extend the maturity date of the Restated Credit Agreement from March 31, 2018 to March 31, 2019; (iv) permit the Company to convert balances outstanding from time to time under the revolving line of credit to term loans; and (v) adjust the fixed charge coverage ratio from 1.40 to 1.15.
In connection with the Fifth Modification Agreement, we entered into a promissory note, a security agreement, repayment guaranty agreements, and a pledge and security agreement. These agreements pledge substantially all of our assets located in the United States to the lender as collateral for borrowings under the Restated Credit Agreement and subsequent amendments.
Revolving Line of Credit
The key terms and conditions of the revolving line of credit under the Fifth Modification Agreement are as follows:
|
·
|
Available Credit – The maximum available credit is $40.0 million. The amount of available credit may be reduced by additional term loans (refer to discussion below) obtained during the life of Restated Credit Agreement.
|
|
·
|
Maturity Date – The maturity date of the Revolving Line of Credit is March 31, 2019.
|
|
·
|
Interest Rate – The effective interest rate continues to be LIBOR plus 1.85 percent per annum and the unused credit fee on the line of credit remains 0.25 percent per annum.
|
|
·
|
Financial Covenants – The Restated Credit Agreement requires us to be in compliance with specified financial covenants, including (a) a funded debt to EBITDAR (earnings before interest, taxes, depreciation, amortization, and rental expense) ratio of less than 3.00 to 1.00; (b) a fixed charge coverage ratio greater than 1.15 to 1.0; (c) an annual limit on capital expenditures (not including capitalized curriculum development) of $8.0 million; and (d) outstanding borrowings on the Revolving Line of Credit may not exceed 150 percent of consolidated accounts receivable.
|
In the event of noncompliance with these financial covenants and other defined events of default, the lender is entitled to certain remedies, including acceleration of the repayment of any amounts outstanding on the Restated Credit Agreement. At August 31, 2016, we believe that we were in compliance with the terms and covenants applicable to the Fifth Modification Agreement. The effective interest rate on our Revolving Line of Credit and term notes payable (refer to discussion below) was 2.3 percent at August 31, 2016 and 2.0 percent August 31, 2015. We did not have any borrowings on the revolving line of credit at August 31, 2016 or 2015.
Term Notes Payable
In connection with the Fifth Modification Agreement, we obtained a $15.0 million term loan and have the ability to obtain additional term loans in increments of $5.0 million up to a maximum of $40.0 million. Each additional term loan will reduce the amount available to borrow on the revolving line of credit facility on a dollar-for-dollar basis. Interest on the term loans is payable monthly at LIBOR plus 1.85 percent per annum and each term loan matures in three years. Interest is payable monthly and principal payments are due and payable on the first day of each January, April, July, and October. Principal payments are equal to the original amount of the term loan divided by 16 and any remaining principal at the maturity date is immediately payable. The proceeds from each term loan may be used for general corporate purposes and each term loan may be repaid sooner than the maturity date at our discretion.
Principal payments by fiscal year through the maturity dates of the term loans are as follows (in thousands):
|
YEAR ENDING
|
||||
|
AUGUST 31,
|
||||
|
2017
|
$ | 3,750 | ||
|
2018
|
3,750 | |||
|
2019
|
6,563 | |||
| $ | 14,063 | |||
Subsequent to August 31, 2016, we obtained an additional term loan with a principal amount of $5.0 million. This additional term loan has the same terms and conditions as described above and the first principal payment is due on October 1, 2016.
|
5.
|
FINANCING OBLIGATION
|
In connection with the sale and leaseback of our corporate headquarters facility located in Salt Lake City, Utah, we entered into a 20-year master lease agreement with the purchaser, an unrelated private investment group. The 20-year master lease agreement also contains six five-year renewal options that will allow us to maintain our operations at the current location for up to 50 years. Although the corporate headquarters facility was sold and the Company has no legal ownership of the property, under applicable accounting guidance we were prohibited from recording the transaction as a sale since we have subleased a significant portion of the property that was sold. Accordingly, we account for the sale as a financing transaction, which requires us to continue reporting the corporate headquarters facility as an asset and to record a financing obligation for the sale price.
The financing obligation on our corporate campus was comprised of the following (in thousands):
|
AUGUST 31,
|
2016
|
2015
|
||||||
|
Financing obligation payable in
|
||||||||
|
monthly installments of $291 at
|
||||||||
|
August 31, 2016, including
|
||||||||
|
principal and interest, with two
|
||||||||
|
percent annual increases
|
||||||||
|
(imputed interest at 7.7%),
|
||||||||
|
through June 2025
|
$ | 24,605 | $ | 26,078 | ||||
|
Less current portion
|
(1,662 | ) | (1,473 | ) | ||||
|
Total financing obligation,
|
||||||||
|
less current portion
|
$ | 22,943 | $ | 24,605 | ||||
Future principal maturities of our financing obligation were as follows at August 31, 2016 (in thousands):
|
YEAR ENDING
|
||||
|
AUGUST 31,
|
||||
|
2017
|
$ | 1,662 | ||
|
2018
|
1,868 | |||
|
2019
|
2,092 | |||
|
2020
|
2,335 | |||
|
2021
|
2,600 | |||
|
Thereafter
|
14,048 | |||
| $ | 24,605 | |||
Our remaining future minimum payments under the financing obligation in the initial 20-year lease term are as follows (in thousands):
|
YEAR ENDING
|
||||
|
AUGUST 31,
|
||||
|
2017
|
$ | 3,509 | ||
|
2018
|
3,579 | |||
|
2019
|
3,651 | |||
|
2020
|
3,724 | |||
|
2021
|
3,798 | |||
|
Thereafter
|
15,157 | |||
|
Total future minimum financing
|
||||
|
obligation payments
|
33,418 | |||
|
Less interest
|
(10,125 | ) | ||
|
Present value of future minimum
|
||||
|
financing obligation payments
|
$ | 23,293 | ||
The $1.3 million difference between the carrying value of the financing obligation and the present value of the future minimum financing obligation payments represents the carrying value of the land sold in the financing transaction, which is not depreciated. At the conclusion of the master lease agreement, the remaining financing obligation and carrying value of the land will be offset and written off of our consolidated financial statements.
|
6.
|
OPERATING LEASES
|
Lease Expense
In the normal course of business, we lease office space and warehouse and distribution facilities under non-cancelable operating lease agreements. We rent office space, primarily for international and domestic regional sales administration offices, in commercial office complexes that are conducive to sales and administrative operations. We also rent warehousing and distribution facilities that are designed to provide secure storage and efficient distribution of our training products, books, and accessories. These operating lease agreements often contain renewal options that may be exercised at our discretion after the completion of the base rental term. In addition, many of the rental agreements provide for regular increases to the base rental rate at specified intervals, which usually occur on an annual basis. At August 31, 2016, we had operating leases with remaining terms ranging from less than one year to approximately seven years. The following table summarizes our future minimum lease payments under operating lease agreements at August 31, 2016 (in thousands):
|
YEAR ENDING
|
||||
|
AUGUST 31,
|
||||
|
2017
|
$ | 466 | ||
|
2018
|
298 | |||
|
2019
|
307 | |||
|
2020
|
326 | |||
|
2021
|
325 | |||
|
Thereafter
|
362 | |||
| $ | 2,084 | |||
We recognize lease expense on a straight-line basis over the life of the lease agreement. Contingent rent expense is recognized as it is incurred and was insignificant for the periods presented. Total rent expense recorded in selling, general, and administrative expense from operating lease agreements was $2.2 million, $2.3 million, and $2.2 million for the fiscal years ended August 31, 2016, 2015, and 2014.
Lease Income
We have subleased the majority of our corporate headquarters campus located in Salt Lake City, Utah to multiple, unrelated tenants as well as to FC Organizational Products (FCOP, refer to Note 17). We recognize sublease income on a straight-line basis over the life of the sublease agreement. The cost basis of the office space available for lease was $35.8 million, which had a carrying value of $9.6 million at August 31, 2016. The following future minimum lease payments due to us from our sublease agreements at August 31, 2016 include lease income of approximately $0.7 million per year from FCOP. The majority of contracted lease income after fiscal 2021 is from FCOP (in thousands):
|
YEAR ENDING
|
||||
|
AUGUST 31,
|
||||
|
2017
|
$ | 4,027 | ||
|
2018
|
4,073 | |||
|
2019
|
3,792 | |||
|
2020
|
3,891 | |||
|
2021
|
2,056 | |||
|
Thereafter
|
2,997 | |||
| $ | 20,836 | |||
Sublease revenue totaled $4.4 million, $4.4 million, and $3.9 million during the fiscal years ended August 31, 2016, 2015, and 2014.
|
7.
|
COMMITMENTS AND CONTINGENCIES
|
Information Systems and Warehouse Outsourcing Contract
Prior to July 2016, we had an outsourcing contract with HP Enterprise Services (HPE) to provide information technology system support and product warehousing and distribution services. Effective July 1, 2016, we entered into a new warehousing services agreement with HPE to provide product kitting, warehousing, and order fulfillment services at an HPE facility in Des Moines, Iowa. Under the terms of the new contract, we pay HPE a fixed charge of $18,000 per month for account management services and variable charges for other warehousing services based on specified activities, including shipping charges. The warehouse charges may be increased each year of the contract based upon changes in the Employment Cost Index. The new warehousing contract with HPE expires on June 30, 2019.
During fiscal years 2016, 2015, and 2014, we expensed $3.8 million, $4.9 million, and $5.2 million for services provided under the terms of the HPE outsourcing contract. The total amount expensed each year under the HPE contract includes freight charges, which are billed to the Company based upon activity. Freight charges included in our HPE outsourcing costs totaled $1.8 million, $1.9 million, and $2.2 million during the fiscal years ended August 31, 2016, 2015, and 2014. Because of the variable component of the agreement, our payments to HPE may fluctuate in future periods based upon sales and levels of specified activities.
Purchase Commitments
During the normal course of business, we issue purchase orders to various vendors for products and services. At August 31, 2016, we had open purchase commitments totaling $5.2 million for products and services to be delivered primarily in fiscal 2017. The increase over the previous year is primarily due to purchase orders related to our new enterprise resource planning system that is expected to be placed in service during mid-fiscal 2017 and other information system infrastructure projects. Other purchase commitments for materials, supplies, and other items incidental to the ordinary conduct of business were immaterial, both individually and in aggregate, to the Company’s operations at August 31, 2016.
Letters of Credit
At August 31, 2016 and 2015, we had standby letters of credit totaling $0.1 million. These letters of credit were primarily required to secure commitments for certain insurance policies and expire in January 2017. No amounts were outstanding on the letters of credit at either August 31, 2016 or August 31, 2015.
Legal Matters and Loss Contingencies
We are the subject of certain legal actions, which we consider routine to our business activities. At August 31, 2016, we believe that, after consultation with legal counsel, any potential liability to us under these other actions will not materially affect our financial position, liquidity, or results of operations.
|
8.
|
SHAREHOLDERS’ EQUITY
|
Preferred Stock
We have 14.0 million shares of preferred stock authorized for issuance. At August 31, 2016 and 2015, no shares of preferred stock were issued or outstanding.
Treasury Stock
Open Market Purchases
On January 23, 2015, our Board of Directors approved a new plan to repurchase up to $10.0 million of the Company’s outstanding common stock. All previously existing common stock repurchase plans were canceled and the new common share repurchase plan does not have an expiration date. On March 27, 2015, our Board of Directors increased the aggregate value of shares of Company common stock that may be purchased under the January 2015 plan to $40.0 million so long as we have either $10.0 million in cash and cash equivalents or have access to debt financing of at least $10.0 million. Through August 31, 2016, we have purchased 1,291,347 shares of our common stock for $22.3 million under the terms of this expanded common stock repurchase plan. The actual timing, number, and value of common shares repurchased under this plan will be determined at our discretion and will depend on a number of factors, including, among others, general market and business conditions, the trading price of our common shares, and applicable legal requirements. The Company has no obligation to repurchase any common shares under the authorization, and the repurchase plan may be suspended, discontinued, or modified at any time for any reason.
The cost of common stock purchased for treasury as shown on our consolidated statement of cash flows for the year ending August 31, 2016 includes 2,260 shares withheld for minimum statutory taxes on stock-based compensation awards issued to participants during the year. The withheld shares were valued at the market price on the date the shares were distributed to participants, which totaled approximately $38,000. For the year ended August 31, 2015, we withheld 17,935 shares for minimum statutory taxes on stock-based compensation awards, which had a total value of $0.3 million.
Fiscal 2016 Tender Offer
On December 8, 2015, we announced that our Board of Directors approved a modified Dutch auction tender offer for up to $35.0 million in value of shares of our common stock at a price within (and including) the range of $15.50 to $17.75 per share. The tender offer commenced on December 14, 2015, and expired at 11:59 p.m. Eastern time, on January 12, 2016. The tender offer was fully subscribed and we acquired 1,971,832 shares of our common stock at $17.75 per share. Including fees to complete the tender offer, the total cost of the tendered shares was $35.3 million, which was financed by existing cash and proceeds from our revolving line of credit facility. For further information regarding the terms and conditions of this completed tender offer, refer to information in the Tender Offer Statement on Schedule TO filed with Securities and Exchange Commission on December 14, 2015 and subsequent amendments thereto.
|
9.
|
FAIR VALUE OF FINANCIAL INSTRUMENTS
|
Fair value is defined as the price that would be received to sell an asset or paid to transfer a liability (an exit price) in an orderly transaction between market participants at the measurement date. The accounting standards related to fair value measurements include a hierarchy for information and valuations used in measuring fair value that is broken down into the following three levels based on reliability:
|
·
|
Level 1 valuations are based on quoted prices in active markets for identical instruments that the Company can access at the measurement date.
|
|
·
|
Level 2 valuations are based on inputs other than quoted prices included in Level 1 that are observable for the instrument, either directly or indirectly, for substantially the full term of the asset or liability including the following:
|
|
a.
|
quoted prices for similar, but not identical, instruments in active markets;
|
|
b.
|
quoted prices for identical or similar instruments in markets that are not active;
|
|
c.
|
inputs other than quoted prices that are observable for the instrument; or
|
|
d.
|
inputs that are derived principally from or corroborated by observable market data by correlation or other means.
|
|
·
|
Level 3 valuations are based on information that is unobservable and significant to the overall fair value measurement.
|
The book value of our financial instruments at August 31, 2016 and 2015 approximated their fair values. The assessment of the fair values of our financial instruments is based on a variety of factors and assumptions. Accordingly, the fair values may not represent the actual values of the financial instruments that could have been realized at August 31, 2016 or 2015, or that will be realized in the future, and do not include expenses that could be incurred in an actual sale or settlement. The following methods and assumptions were used to determine the fair values of our financial instruments, none of which were held for trading or speculative purposes:
Cash, Cash Equivalents, and Accounts Receivable – The carrying amounts of cash, cash equivalents, and accounts receivable approximate their fair values due to the liquidity and short-term maturity of these instruments.
Other Assets – Our other assets, including notes receivable, were recorded at the net realizable value of estimated future cash flows from these instruments.
Debt Obligations – At August 31, 2016, our debt obligations consisted of variable-rate term notes payable and a variable-rate revolving line of credit. The term notes payable and revolving line of credit (Note 4) are negotiated components of our Restated Credit Agreement, which is renewed on a regular basis to maintain the long-term borrowing capability of the agreement. Accordingly, the applicable interest rates on the term loans and revolving line of credit are reflective of current market conditions, and the carrying value of term loan and revolving line of credit obligations approximate their fair value.
Contingent Consideration Liability – During fiscal 2013, we acquired Ninety Five 5, LLC. The purchase price included contingent consideration payments to the former owners up to a maximum of $8.5 million, based on cumulative earnings before interest, income taxes, depreciation, and amortization (EBITDA) as set forth in the purchase agreement. We reassess the fair value of expected contingent consideration and the corresponding liability each period using the Probability Weighted Expected Return Method, which is consistent with the initial measurement of the expected liability. This fair value measurement is considered a Level 3 measurement because we estimate projected earnings during the earn out period utilizing various potential pay-out scenarios. Probabilities were applied to each potential scenario and the resulting values were discounted using a rate that considered Ninety Five 5’s weighted
average cost of capital as well as a specific risk premium associated with the riskiness of the contingent consideration itself, the related projections, and the overall business. Contingent consideration is payable in increments of $2.2 million based on the actual and projected financial results during the measurement period, which ends on August 31, 2017.
As a result of significantly improved EBITDA from the sales performance group during the first half of fiscal 2016, we paid the first contingent earn out payment of $2.2 million in the third quarter of fiscal 2016 and may have to pay additional contingent earn out payments in fiscal 2017. We currently believe that projected financial results indicate one more additional payment may be earned during fiscal 2017. However, financial results would need to increase significantly to reach the third payment threshold and we do not currently believe that a third $2.2 million payment is probable. The contingent consideration liability is classified as a component of other long-term liabilities in our consolidated balance sheets. During the fiscal years ended August 31, 2016 and 2015, the contingent consideration liability changed as follows (in thousands):
|
Contingent consideration liability at August 31, 2014
|
$ | 2,530 | ||
|
Increase in contingent consideration liability
|
35 | |||
|
Contingent consideration liability at August 31, 2015
|
2,565 | |||
|
Payment of first contingent consideration award
|
(2,167 | ) | ||
|
Increase in contingent consideration liability
|
1,538 | |||
|
Contingent consideration liability at August 31, 2016
|
$ | 1,936 |
Changes to the estimated liability are reflected in selling, general, and administrative expenses in our consolidated income statements.
10. STOCK-BASED COMPENSATION PLANS
Overview
We utilize various stock-based compensation plans as integral components of our overall compensation and associate retention strategy. Our shareholders have approved various stock incentive plans that permit us to grant performance awards, unvested share awards, stock options, and employee stock purchase plan (ESPP) shares. In addition, our Board of Directors and shareholders may, from time to time, approve fully vested stock awards. The Organization and Compensation Committee of the Board of Directors (the Compensation Committee) has responsibility for the approval and oversight of our stock-based compensation plans.
On January 23, 2015, our shareholders approved the 2015 Omnibus Incentive Plan (the 2015 Plan), which authorized an additional 1.0 million shares of common stock for issuance to employees and members of the Board of Directors as stock-based payments. We believe that the 2015 Plan will provide sufficient available shares to grant awards over the next several years, based on current expectations of grants in future periods. A more detailed description of the 2015 Plan is set forth in the Company’s Proxy Statement filed with the SEC on December 22, 2014. At August 31, 2016, the 2015 Plan had approximately 705,000 shares available for future grants and our ESPP had approximately 440,000 shares remaining for purchase by plan participants.
The total compensation expense of our stock-based compensation plans was as follows (in thousands):
|
YEAR ENDED
|
||||||||||||
|
AUGUST 31,
|
2016
|
2015
|
2014
|
|||||||||
|
Performance awards
|
$ | 2,492 | $ | 1,890 | $ | 2,716 | ||||||
|
Unvested stock awards
|
450 | 400 | 334 | |||||||||
|
Fully vested stock awards
|
60 | 125 | 371 | |||||||||
|
Compensation cost of the ESPP
|
119 | 121 | 113 | |||||||||
| $ | 3,121 | $ | 2,536 | $ | 3,534 | |||||||
The compensation expense of our stock-based compensation plans was included in selling, general, and administrative expenses in the accompanying consolidated income statements, and no stock-based compensation was capitalized during fiscal years 2016, 2015, or 2014. During fiscal 2016, we issued 81,757 shares of our common stock from shares held in treasury for various stock-based compensation plans. Certain of our stock-based compensation plans allow recipients to have shares withheld from the award to pay minimum statutory tax liabilities. We withheld 2,260 shares of our common stock for minimum statutory taxes during fiscal 2016.
The following is a description of our stock-based compensation plans.
Performance Awards
In fiscal 2015, the Compensation Committee approved a modification to exclude the effects of foreign exchange on the measurement of performance criteria on the outstanding tranches of our long-term incentive plan (LTIP) awards. Accordingly, we calculated incremental compensation expense based upon the fair value of (closing price) our common stock on the modification date, which totaled $0.7 million. We recognized $0.5 million of the incremental compensation expense during fiscal 2015 for service provided in the current and previous fiscal years associated with the modification.
Each of the LTIP performance awards described below have a maximum life of six years and compensation expense is recognized as we determine it is probable that the shares will vest. Adjustments to compensation expense to reflect the timing of and the number of shares expected to be awarded are made on a cumulative basis at the date of the adjustment. No tranches of performance awards vested to participants during fiscal 2016.
Fiscal 2016 LTIP Award – On November 12, 2015, the Compensation Committee granted new performance-based awards for our executive officers and members of senior management. A total of 231,276 shares may be awarded to the participants based on six individual vesting conditions that are divided into two performance measures, trailing four-quarter adjusted earnings before interest, taxes, depreciation, and amortization (Adjusted EBITDA) and increased sales of Organizational Development Suite (OD Suite) offerings as shown below. The OD Suite is defined as Leadership, Productivity, and Trust practice sales.
|
Adjusted EBITDA
|
OD Suite Sales
|
|||||||||||||||
|
Award
|
Award
|
|||||||||||||||
|
Goal
|
Number of
|
Tranche
|
Goal
|
Number of
|
Tranche
|
|||||||||||
|
(millions)
|
Shares
|
Status
|
(millions)
|
Shares
|
Status
|
|||||||||||
| $ | 36.0 | 53,964 |
not vested
|
$ | 107.0 | 23,128 |
not vested
|
|||||||||
| $ | 40.0 | 53,964 |
not vested
|
$ | 116.0 | 23,128 |
not vested
|
|||||||||
| $ | 44.0 | 53,964 |
not vested
|
$ | 125.0 | 23,128 |
not vested
|
|||||||||
| 161,892 | 69,384 | |||||||||||||||
Fiscal 2015 LTIP Award – During fiscal 2015, the Compensation Committee granted a new performance-based award for our executive officers and certain members of senior management. A total of 112,464 shares may be awarded to the participants based on six individual vesting conditions that are divided into two performance measures, trailing four-quarter Adjusted EBITDA and increased sales of OD Suite sales as shown below.
|
Adjusted EBITDA
|
OD Suite Sales
|
|||||||||||||||
|
Award
|
Award
|
|||||||||||||||
|
Goal
|
Number of
|
Tranche
|
Goal
|
Number of
|
Tranche
|
|||||||||||
|
(millions)
|
Shares
|
Status
|
(millions)
|
Shares
|
Status
|
|||||||||||
| $ | 39.6 | 26,241 |
not vested
|
$ | 107.0 | 11,247 |
not vested
|
|||||||||
| $ | 45.5 | 26,241 |
not vested
|
$ | 118.0 | 11,247 |
not vested
|
|||||||||
| $ | 52.3 | 26,241 |
not vested
|
$ | 130.0 | 11,247 |
not vested
|
|||||||||
| 78,723 | 33,741 | |||||||||||||||
Fiscal 2014 LTIP Award – During the first quarter of fiscal 2014, the Compensation Committee granted new performance-based equity awards for our executive officers. A total of 89,418 shares may be awarded to the participants based on six individual vesting conditions that are divided into two performance measures, trailing four-quarter Adjusted EBITDA and trailing four-quarter increased sales of courses related to The 7 Habits of Highly Effective People (the 7 Habits). The following information applies to the fiscal 2014 LTIP award as of August 31, 2016.
|
Adjusted EBITDA
|
7 Habits Increased Sales
|
|||||||||||||||
|
Award
|
Award
|
|||||||||||||||
|
Goal
|
Number of
|
Tranche
|
Goal
|
Number of
|
Tranche
|
|||||||||||
|
(millions)
|
Shares
|
Status
|
(millions)
|
Shares
|
Status
|
|||||||||||
| $ | 37.0 | 20,864 |
not vested
|
$ | 5.0 | 8,942 |
vested
|
|||||||||
| $ | 43.0 | 20,864 |
not vested
|
$ | 10.0 | 8,942 |
vested
|
|||||||||
| $ | 49.0 | 20,864 |
not vested
|
$ | 12.5 | 8,942 |
not vested
|
|||||||||
| 62,592 | 26,826 | |||||||||||||||
Fiscal 2013 LTIP Award – During the first quarter of fiscal 2013, the Compensation Committee granted a new performance-based equity award for the Chief Executive Officer (CEO), Chief Financial Officer (CFO), and the Chief People Officer (CPO). A total of 68,085 shares may be issued to the participants based on six individual vesting conditions that are divided into two performance measures, trailing four-quarter Adjusted EBITDA and Productivity Practice sales. The following information applies to the fiscal 2013 LTIP award as of August 31, 2016.
|
Adjusted EBITDA
|
Productivity Practice Sales
|
|||||||||||||||
|
Award
|
Award
|
|||||||||||||||
|
Goal
|
Number of
|
Tranche
|
Goal
|
Number of
|
Tranche
|
|||||||||||
|
(millions)
|
Shares
|
Status
|
(millions)
|
Shares
|
Status
|
|||||||||||
| $ | 33.0 | 15,887 |
vested
|
$ | 23.5 | 6,808 |
vested
|
|||||||||
| $ | 40.0 | 15,887 |
not vested
|
$ | 26.5 | 6,808 |
not vested
|
|||||||||
| $ | 47.0 | 15,887 |
not vested
|
$ | 29.5 | 6,808 |
not vested
|
|||||||||
| 47,661 | 20,424 | |||||||||||||||
Fiscal 2012 LTIP Award - During fiscal 2012, the Compensation Committee granted a performance-based equity award for the CEO, CFO, and CPO similar to the fiscal 2013 executive award described above. A total of 106,101 shares may be issued to the participants based on six individual vesting conditions that are divided into two performance measures, Adjusted EBITDA and Productivity Practice sales. The following information applies to the fiscal 2012 LTIP award as of August 31, 2016.
|
Adjusted EBITDA
|
Productivity Practice Sales
|
|||||||||||||||
|
Award
|
Award
|
|||||||||||||||
|
Goal
|
Number of
|
Tranche
|
Goal
|
Number of
|
Tranche
|
|||||||||||
|
(millions)
|
Shares
|
Status
|
(millions)
|
Shares
|
Status
|
|||||||||||
| $ | 26.0 | 24,757 |
vested
|
$ | 20.5 | 10,610 |
vested
|
|||||||||
| $ | 33.0 | 24,757 |
vested
|
$ | 23.5 | 10,610 |
vested
|
|||||||||
| $ | 40.0 | 24,757 |
not vested
|
$ | 26.5 | 10,610 |
not vested
|
|||||||||
| 74,271 | 31,830 | |||||||||||||||
Common Stock Price Performance Award – On July 15, 2011, the Compensation Committee approved a stock-based compensation plan that would allow certain members of our management team to receive shares of the Company’s common stock if the closing price of our common stock averaged specified
levels over a five-day period. If the price of our common stock achieved the specified levels within three years of the grant date, 100 percent of the awarded shares would vest. If the price of our common stock reached the specified levels between three and five years from the grant date, only 50 percent of the performance shares would vest. No shares would vest to participants if the specified price targets were met after five years from the grant date. This award was designed to grant approximately one-half of the total award shares in fiscal 2011, approximately one-fourth of the award shares in fiscal 2012, and approximately one-fourth in fiscal 2013. Additional supplemental awards were made to three employees during fiscal 2014 as shown on the table below. This award program was designed to increase shareholder value as shares would only be awarded to participants if our share price increased significantly over a relatively short period of time. During fiscal 2014, the specified common share prices for all grants were achieved and all tranches of the award as described below vested to the participants.
Since this performance award had market-based vesting conditions, the fair value and derived service periods of the grants within this award were determined using Monte Carlo simulation valuation models. The following table presents key information related to the tranches granted in this award.
|
Model Input
|
Fiscal 2014
Grant 2
|
Fiscal 2014
Grant 1
|
Fiscal 2013
Grant
|
Fiscal 2012
Grant
|
Fiscal 2011
Grant
|
|||||||||||||||
|
Number of shares
|
13,477 | 8,352 | 120,101 | 177,616 | 294,158 | |||||||||||||||
|
Vesting price per share
|
$ | 18.05; 22.00 | $ | 22.00 | $ | 22.00 | $ | 18.05 | $ | 17.00 | ||||||||||
|
Grant date price per share
|
$ | 20.01 | $ | 19.68 | $ | 16.03 | $ | 9.55 | $ | 11.34 | ||||||||||
|
Volatility
|
47.1 | % | 52.8 | % | 54.2 | % | 54.6 | % | 49.8 | % | ||||||||||
|
Dividend yield
|
0.0 | % | 0.0 | % | 0.0 | % | 0.0 | % | 0.0 | % | ||||||||||
|
Risk-free rate
|
1.70 | % | 1.39 | % | 1.37 | % | 0.62 | % | 1.48 | % | ||||||||||
|
Grant date
|
April 16, 2014
|
Nov. 22, 2013
|
July 18, 2013
|
July 19, 2012
|
July 15, 2011
|
|||||||||||||||
|
Fair value of award (thousands)
|
$ | 265 | $ | 155 | $ | 1,651 | $ | 1,188 | $ | 2,647 | ||||||||||
|
Derived service period (years)
|
0.2 | 0.2 | 0.6 | 1.4 | 0.9 | |||||||||||||||
The April 2014 grant shown above included 9,557 shares with a vesting price of $18.05 per share (equal to the fiscal 2012 grant vesting price) and 3,920 shares with a $22.00 per share vesting price. Since our share price on the grant date was greater than the vesting price for the 9,557 shares granted, the fair value of these shares was determined by multiplying the number of shares by the grant date price per share, which resulted in $0.2 million of stock-based compensation expense. The $0.2 million of compensation expense for these shares was recorded on the summary stock-based compensation table above as a component of fully vested share award expense.
Unvested Stock Awards
The annual Board of Director unvested stock award, which is administered under the terms of the Franklin Covey Co. 2015 Omnibus Incentive Plan, is designed to provide our non-employee directors, who are not eligible to participate in our employee stock purchase plan, an opportunity to obtain an interest in the Company through the acquisition of shares of our common stock. Each eligible director is entitled to receive a whole-share grant equal to $75,000 with a one-year vesting period, which is generally granted in January (following the Annual Shareholders’ Meeting) of each year. Shares granted under the terms of this annual award are ineligible to be voted or participate in any common stock dividends until they are vested.
Under the terms of this program, we issued 25,032 shares, 24,210 shares, and 14,616 shares of our common stock to eligible members of the Board of Directors during the fiscal years ended August 31, 2016, 2015, and 2014. The fair value of shares awarded to the directors was $0.5 million in each of fiscal years 2016 and 2015, and $0.3 million in fiscal 2014 as calculated on the grant date of the awards. The corresponding compensation cost is recognized over the vesting period of the awards, which is one year. The cost of the common stock issued from treasury for these awards was $0.3 million, $0.3 million, and $0.2 million for the fiscal years ended August 31, 2016, 2015, and 2014. The following information applies to our unvested stock awards for the fiscal year ended August 31, 2016:
|
Weighted-
|
||||||||
|
Average Grant-
|
||||||||
|
Date Fair
|
||||||||
|
Number of
|
Value Per
|
|||||||
|
Shares
|
Share
|
|||||||
|
Unvested stock awards at
|
||||||||
|
August 31, 2015
|
24,210 | $ | 18.59 | |||||
|
Granted
|
25,032 | 17.98 | ||||||
|
Forfeited
|
- | - | ||||||
|
Vested
|
(24,210 | ) | 18.59 | |||||
|
Unvested stock awards at
|
||||||||
|
August 31, 2016
|
25,032 | $ | 17.98 | |||||
At August 31, 2016, there was $0.2 million of unrecognized compensation cost related to unvested stock awards, which is expected to be recognized over the remaining weighted-average vesting period of approximately three months. The total recognized tax benefit from unvested stock awards totaled $0.1 million for each of the fiscal years ended August 31, 2016, 2015, and 2014, respectively. The intrinsic value of our unvested stock awards at August 31, 2016 was $0.4 million.
Stock Options
We have an incentive stock option plan whereby options to purchase shares of our common stock may be issued to key employees at an exercise price not less than the fair market value of the Company’s common stock on the date of grant. Information related to our stock option activity during the fiscal year ended August 31, 2016 is presented below:
|
Weighted
|
||||||||||||||||
|
Weighted
|
Average
|
|||||||||||||||
|
Avg. Exercise
|
Remaining
|
Aggregate
|
||||||||||||||
|
Number of
|
Price Per
|
Contractual
|
Intrinsic Value
|
|||||||||||||
|
Stock Options
|
Share
|
Life (Years)
|
(thousands)
|
|||||||||||||
|
Outstanding at August 31, 2015
|
631,250 | $ | 11.41 | |||||||||||||
|
Granted
|
- | - | ||||||||||||||
|
Exercised
|
- | - | ||||||||||||||
|
Forfeited
|
- | - | ||||||||||||||
|
Outstanding at August 31, 2016
|
631,250 | $ | 11.41 | 3.8 | $ | 3,052 | ||||||||||
|
Options vested and exercisable at
|
||||||||||||||||
|
August 31, 2016
|
631,250 | $ | 11.41 | 3.8 | $ | 3,052 | ||||||||||
During fiscal 2014, we had 43,750 stock options exercised on a net share basis, which had an aggregate intrinsic value of $0.5 million. At August 31, 2016, there was no remaining unrecognized compensation expense related to our stock options and no options were exercised during fiscal 2016 or 2015.
The following additional information applies to our stock options outstanding at August 31, 2016:
|
Weighted
|
||||||||||||||||||||||
|
Number
|
Average
|
Options
|
||||||||||||||||||||
|
Outstanding
|
Remaining
|
Weighted
|
Exercisable at
|
Weighted
|
||||||||||||||||||
|
at August 31,
|
Contractual
|
Average
|
August 31,
|
Average
|
||||||||||||||||||
|
Exercise Prices
|
2016
|
Life (Years)
|
Exercise Price
|
2016
|
Exercise Price
|
|||||||||||||||||
| $ | 9.00 | 125,000 | 3.9 | $ | 9.00 | 125,000 | $ | 9.00 | ||||||||||||||
| $ | 10.00 | 168,750 | 3.8 | $ | 10.00 | 168,750 | $ | 10.00 | ||||||||||||||
| $ | 12.00 | 168,750 | 3.8 | $ | 12.00 | 168,750 | $ | 12.00 | ||||||||||||||
| $ | 14.00 | 168,750 | 3.8 | $ | 14.00 | 168,750 | $ | 14.00 | ||||||||||||||
| 631,250 | 631,250 | |||||||||||||||||||||
Fully Vested Stock Awards
Client Partner and Consultant Award – During fiscal 2011, we implemented a new fully vested stock-based award program that is designed to reward our client partners and training consultants for exceptional long-term performance. The program grants shares of our common stock with a total value of $15,000 to each client partner who has sold over $20.0 million in cumulative sales or training consultant who has delivered over 1,500 days of training during their career. During fiscal 2016, four individuals qualified for this award; in fiscal 2015, five individuals earned this award; and 12 individuals qualified for the award in fiscal 2014.
In the fourth quarter of fiscal 2015, the Compensation Committee approved a fully vested award equal to $10,000 for each general manager or area director that achieved a specified sales goal. Five individuals achieved their sales goals and qualified for the award. This award was only for fourth quarter fiscal 2015 sales performance and no additional awards may be granted under the terms of this award.
Employee Stock Purchase Plan
The Company has an employee stock purchase plan that offers qualified employees the opportunity to purchase shares of our common stock at a price equal to 85 percent of the average fair market value of our common stock on the last trading day of each quarter. We issued a total of 49,375 shares, 42,687 shares, and 36,761 shares to ESPP participants during the fiscal years ended August 31, 2016, 2015, and 2014, which had a corresponding cost basis of $0.7 million, $0.6 million, and $0.5 million, respectively. We received cash proceeds for these shares from ESPP participants totaling $0.7 million, $0.7 million, and $0.6 million during the fiscal years ended August 31, 2016, 2015, and 2014.
|
11.
|
IMPAIRED ASSETS
|
Our impaired asset charges consisted of the following (in thousands):
|
YEAR ENDED
|
||||||||
|
AUGUST 31,
|
2015
|
2014
|
||||||
|
Long-term receivables from FCOP
|
$ | 541 | $ | 363 | ||||
|
Capitalized curriculum
|
414 | - | ||||||
|
Investment cost method subsidiary
|
220 | - | ||||||
|
Prepaid expenses and other long-term assets
|
127 | - | ||||||
| $ | 1,302 | $ | 363 | |||||
The following is a description of the circumstances regarding the impairment of these long-lived assets.
Long-Term Receivables From FCOP – During the third quarter of fiscal 2015, we determined that the operating agreements between the Company and FCOP allow us to collect reimbursement for certain rental expenses prior to the annual required distribution of earnings to FCOP’s creditors. Such rents were previously treated as lower in priority and therefore, were considered long-term receivables. Although this determination is expected to improve our cash flows and collections of rents receivable from FCOP in the short term, it reduces the amount of cash we are expecting to receive from the required distribution of earnings to pay long-term receivable balances. After this determination was made, the present value of our previously recorded long-term receivables was more than the present value of expected corresponding cash flows. Accordingly, we recalculated our discount on the long-term receivables and impaired the remaining balance.
Subsequent to August 31, 2014, we received new cash flow and earnings projections from FCOP that reflected weaker sales of certain accessory products, which had a significant adverse impact on expected cash flows and earnings in future periods. Accordingly, we determined that an additional $0.6 million discount and a corresponding $0.4 million impairment charge were needed to reduce the long-term receivable from FCOP to its net realizable value and net present value.
Capitalized Curriculum – During fiscal 2015, we determined that it would be beneficial to discontinue a component of one of our existing offerings and we received legal notice that another offering contained names trademarked by another entity. Since the Company currently offers a similar program, the decision was made to discontinue the offering rather than modify the curriculum as required by applicable trademark law. Accordingly, we impaired the remaining unamortized carrying value of these offerings. These items were classified as components of other long-term assets on our consolidated balance sheets.
Investment in Cost Method Subsidiary – In the fourth quarter of fiscal 2015, we became aware of financial difficulties at an entity in which we had an investment accounted for under the cost method. Based on discussions with management of the entity, we determined that the investment in this subsidiary would not be recoverable in future periods due to going concern considerations. Accordingly, we impaired the carrying value of the investment in this entity. The investment in this entity was previously classified as a component of other long-term assets in our consolidated balance sheets.
Prepaid Expenses and Other Long-Term Assets – In connection with a component of one of our offerings that was discontinued (as described above), we had prepaid royalties to an unrelated developer. Based on the decision to impair the curriculum, we determined that the probability of receiving cash flows sufficient to recover the prepaid royalties was remote and we expensed the carrying value of these prepaid assets. Approximately $60,000 of this balance was previously included in other long-term assets.
|
12.
|
RESTRUCTURING COSTS
|
|
Fiscal 2016 Restructuring Costs
|
In the fourth quarter of fiscal 2016, we restructured the operations of certain of our domestic sales offices. The cost of this restructuring was $0.4 million and was primarily comprised of employee severance costs, which were paid in August and September 2016.
During the second quarter of fiscal 2016, we restructured the operations of our Australian office. The restructuring was designed to reduce ongoing operating costs by closing the sales offices in Brisbane, Sydney, and Melbourne, and by reducing headcount for administrative and certain sales support functions. Our remaining sales and support personnel in Australia will work from home offices, similar
to many of our sales personnel located in the U.S. and Canada. The Australia office restructure cost $0.4 million and was primarily comprised of office closure costs, including remaining lease expense on the offices that were closed, and for employee severance costs. The severance costs included the restructuring charge totaled less than $40,000. Remaining accrued restructuring costs totaled $0.2 million at August 31, 2016 and were included as a component of accrued liabilities in our consolidated balance sheet.
|
Fiscal 2015 Restructuring Costs
|
During the fourth quarter of fiscal 2015, we realigned our regional sales offices that serve the United States and Canada. As a result of this realignment, we closed our northeastern regional sales office located in Pennsylvania and created new geographic sales regions. In connection with this restructuring, we incurred costs related to involuntary severance and office closure costs. The restructuring charge taken during the fiscal year ended August 31, 2015 was comprised of the following (in thousands):
|
Description
|
Amount
|
|||
|
Severance costs
|
$ | 570 | ||
|
Office closure costs
|
17 | |||
| $ | 587 | |||
The majority of these costs were paid prior to August 31, 2015 and the remaining restructuring liability totaled $0.1 million at August 31, 2015 and was included as a component of accrued liabilities in our consolidated balance sheet. All of the remaining accrued severance at August 31, 2015 was paid during September 2015.
|
13.
|
EMPLOYEE BENEFIT PLANS
|
Profit Sharing Plans
We have defined contribution profit sharing plans for our employees that qualify under Section 401(k) of the Internal Revenue Code. These plans provide retirement benefits for employees meeting minimum age and service requirements. Qualified participants may contribute up to 75 percent of their gross wages, subject to certain limitations. These plans also provide for matching contributions to the participants that are paid by the Company. The matching contributions, which were expensed as incurred, totaled $1.9 million, $1.7 million, and $1.6 million during each of the fiscal years ended August 31, 2016, 2015, and 2014. We do not sponsor or participate in any defined-benefit pension plans.
Deferred Compensation Plan
We had a non-qualified deferred compensation (NQDC) plan that provided certain key officers and employees the ability to defer a portion of their compensation until a later date. Deferred compensation amounts used to pay benefits were held in a “rabbi trust,” which invested in insurance contracts, various mutual funds, and shares of our common stock as directed by the plan participants. However, due to legal changes resulting from the American Jobs Creation Act of 2004, we determined to cease compensation deferrals to the NQDC plan after December 31, 2004. Following the cessation of deferrals to the NQDC plan, the number of participants remaining in the plan declined steadily, and our Board of Directors decided to partially terminate the NQDC plan. Following this decision, all of the plan’s assets were liquidated, the plan’s liabilities were paid, and the only remaining items in the NQDC plan are shares of our common stock owned by the remaining plan participants. At August 31, 2016 and 2015, the cost basis of the shares of our common stock held by the rabbi trust was $0.4 million.
|
14.
|
INCOME TAXES
|
Our provision for income taxes consisted of the following (in thousands):
|
YEAR ENDED
|
||||||||||||
|
AUGUST 31,
|
2016
|
2015
|
2014
|
|||||||||
|
Current:
|
||||||||||||
|
Federal
|
$ | 380 | $ | 220 | $ | (237 | ) | |||||
|
State
|
197 | 208 | 146 | |||||||||
|
Foreign
|
2,553 | 2,691 | 2,557 | |||||||||
| 3,130 | 3,119 | 2,466 | ||||||||||
|
Deferred:
|
||||||||||||
|
Federal
|
1,584 | 3,239 | 1,217 | |||||||||
|
State
|
(70 | ) | 138 | 277 | ||||||||
|
Foreign
|
(50 | ) | (200 | ) | (268 | ) | ||||||
|
Valuation allowance
|
301 | - | - | |||||||||
| 1,765 | 3,177 | 1,226 | ||||||||||
| $ | 4,895 | $ | 6,296 | $ | 3,692 | |||||||
The allocation of our total income tax provision is as follows (in thousands):
|
YEAR ENDED
|
||||||||||||
|
AUGUST 31,
|
2016
|
2015
|
2014
|
|||||||||
|
Net income
|
$ | 4,895 | $ | 6,296 | $ | 3,692 | ||||||
|
Other comprehensive income
|
(115 | ) | (52 | ) | 24 | |||||||
| $ | 4,780 | $ | 6,244 | $ | 3,716 | |||||||
Income before income taxes consisted of the following (in thousands):
|
YEAR ENDED
|
||||||||||||
|
AUGUST 31,
|
2016
|
2015
|
2014
|
|||||||||
|
United States
|
$ | 9,328 | $ | 15,073 | $ | 19,256 | ||||||
|
Foreign
|
2,583 | 2,339 | 2,503 | |||||||||
| $ | 11,911 | $ | 17,412 | $ | 21,759 | |||||||
The differences between income taxes at the statutory federal income tax rate and the consolidated income tax rate reported in our consolidated income statements were as follows:
|
YEAR ENDED
AUGUST 31,
|
2016
|
2015
|
2014
|
|||||||||
|
Federal statutory income tax rate
|
35.0 | % | 35.0 | % | 35.0 | % | ||||||
|
State income taxes, net of federal effect
|
1.9 | 2.3 | 1.9 | |||||||||
|
Valuation allowance
|
2.5 | - | - | |||||||||
|
Foreign jurisdictions tax differential
|
(0.6 | ) | 1.2 | (0.4 | ) | |||||||
|
Tax differential on income subject to both U.S. and foreign taxes
|
1.9 | 0.5 | 0.5 | |||||||||
|
Effect of claiming foreign tax credits instead of deductions for prior years
|
- | (3.2 | ) | (19.3 | ) | |||||||
|
Uncertain tax positions
|
(0.4 | ) | (0.9 | ) | (2.6 | ) | ||||||
|
Non-deductible executive compensation
|
- | 0.2 | 0.9 | |||||||||
|
Non-deductible meals and entertainment
|
1.6 | 1.1 | 0.8 | |||||||||
|
Other
|
(0.8 | ) | - | 0.2 | ||||||||
| 41.1 | % | 36.2 | % | 17.0 | % | |||||||
In prior fiscal years, we elected to take deductions on our U.S. federal income tax returns for foreign income taxes paid, rather than claiming foreign tax credits. During those years we either generated or used net operating loss carryforwards and were therefore unable to utilize foreign tax credits. In fiscal 2011, we began claiming foreign tax credits on our U.S. federal income tax returns. Although we could not utilize the credits we claimed for fiscal 2012 and fiscal 2011 in those respective years, we concluded it was more likely than not that these foreign tax credits will be utilized in the future.
Our overall U.S. taxable income and foreign source income for fiscal 2014 and 2013 were sufficient to utilize all of the foreign tax credits generated during those fiscal years, plus additional credits generated in prior years. Accordingly, we amended our U.S. federal income tax returns from fiscal 2003 through fiscal 2010 to claim foreign tax credits instead of foreign tax deductions. The net tax benefit resulting from claiming these additional foreign tax credits, which was recorded in the period the decision was made to amend the related returns, totaled $4.2 million in fiscal 2014. In fiscal 2015, we finalized the calculations of the impact of amending previously filed federal income tax returns to realize foreign tax credits previously treated as expired under the tax positions taken in the original returns. The income tax benefit recognized from these foreign tax credits totaled $0.6 million in fiscal 2015.
We recognized tax benefits from deductions for stock-based compensation in excess of the corresponding expense recorded for financial statement purposes. Instead of reducing our income tax expense for these benefits, we recorded $0.1 million and $2.5 million for the fiscal years ending August 31, 2015 and 2014. Tax expense related to stock-based compensation recorded in additional paid-in capital for fiscal 2016 was insignificant.
The significant components of our deferred tax assets and liabilities were comprised of the following (in thousands):
|
AUGUST 31,
|
2016
|
2015
|
||||||
|
Deferred income tax assets:
|
||||||||
|
Sale and financing of corporate
|
||||||||
|
headquarters
|
$ | 9,013 | $ | 9,531 | ||||
|
Foreign income tax credit
|
||||||||
|
carryforward
|
2,784 | 5,106 | ||||||
|
Stock-based compensation
|
2,674 | 1,671 | ||||||
|
Inventory and bad debt reserves
|
1,147 | 1,025 | ||||||
|
Bonus and other accruals
|
1,017 | 934 | ||||||
|
Deferred revenue
|
405 | 328 | ||||||
|
Other
|
617 | 810 | ||||||
|
Total deferred income tax assets
|
17,657 | 19,405 | ||||||
|
Less: valuation allowance
|
(301 | ) | - | |||||
|
Net deferred income tax assets
|
17,356 | 19,405 | ||||||
|
Deferred income tax liabilities:
|
||||||||
|
Intangibles step-ups – indefinite lived
|
(8,528 | ) | (8,515 | ) | ||||
|
Intangibles step-ups – definite lived
|
(6,003 | ) | (6,552 | ) | ||||
|
Intangible asset impairment and
|
||||||||
|
amortization
|
(4,505 | ) | (5,001 | ) | ||||
|
Property and equipment depreciation
|
(3,367 | ) | (3,139 | ) | ||||
|
Unremitted earnings of foreign
|
||||||||
|
subsidiaries
|
(574 | ) | (546 | ) | ||||
|
Other
|
(399 | ) | (77 | ) | ||||
|
Total deferred income tax liabilities
|
(23,376 | ) | (23,830 | ) | ||||
|
Net deferred income taxes
|
$ | (6,020 | ) | $ | (4,425 | ) | ||
Deferred income tax amounts are recorded as follows in our consolidated balance sheets (in thousands):
|
AUGUST 31,
|
2016
|
2015
|
||||||
|
Current assets
|
$ | - | $ | 2,479 | ||||
|
Other long-term assets
|
650 | 194 | ||||||
|
Long-term liabilities
|
(6,670 | ) | (7,098 | ) | ||||
|
Net deferred income tax liability
|
$ | (6,020 | ) | $ | (4,425 | ) | ||
As of August 31, 2016, we have utilized all of our U.S. federal net operating loss carryforwards. The Company still has U.S. state net operating loss carryforwards generated in various jurisdictions that expire primarily between September 1, 2016 and August 31, 2029.
Our U.S. foreign income tax credit carryforwards were comprised of the following at August 31, 2016 (in thousands):
|
Credit Generated in
|
Credits Used
|
Credits Used
|
Credits
|
||||||||||||||
|
Fiscal Year Ended
|
Credit Expires
|
Credits
|
in Prior
|
in Fiscal
|
Carried
|
||||||||||||
|
August 31,
|
August 31,
|
Generated
|
Years
|
2016
|
Forward
|
||||||||||||
|
2010
|
2020
|
$ | 2,907 | $ | (1,299 | ) | $ | (1,608 | ) | $ | - | ||||||
|
2011
|
2021
|
3,448 | - | (664 | ) | 2,784 | |||||||||||
|
2012
|
2022
|
2,563 | (2,563 | ) | - | - | |||||||||||
|
2013
|
2023
|
2,815 | (2,815 | ) | - | - | |||||||||||
|
2014
|
2024
|
1,378 | (1,378 | ) | - | - | |||||||||||
|
2015
|
2025
|
1,422 | (1,422 | ) | - | - | |||||||||||
|
2016
|
2026
|
1,648 | - | (1,648 | ) | - | |||||||||||
| $ | 16,181 | $ | (9,477 | ) | $ | (3,920 | ) | $ | 2,784 | ||||||||
We amended our U.S. federal income tax returns from fiscal 2003 through fiscal 2010 to claim foreign tax credits instead of the foreign tax deductions that were previously claimed. The additional taxable income from claiming these foreign tax credits results in the complete utilization of our remaining net operating loss carryforwards in fiscal 2012, as well as the ability to utilize all of the foreign tax credit generated in fiscal 2012.
During the year ended August 31, 2016, we determined it was more likely than not that deferred tax assets of a foreign subsidiary would not be realized. Accordingly, we recorded a $0.3 million valuation allowance against these deferred tax assets.
We have determined that projected future taxable income is adequate to allow for realization of all deferred tax assets, except for the assets subject to the valuation allowance. We considered sources of taxable income, including future reversals of taxable temporary differences, future taxable income exclusive of reversing temporary differences and carryforwards, and reasonable, practical tax-planning strategies to generate additional taxable income. Based on the factors described above, we concluded that realization of our deferred tax assets, except those subject to the valuation allowance, is more likely than not at August 31, 2016.
A reconciliation of the beginning and ending amount of gross unrecognized tax benefits is as follows (in thousands):
|
YEAR ENDED
|
||||||||||||
|
AUGUST 31,
|
2016
|
2015
|
2014
|
|||||||||
|
Beginning balance
|
$ | 3,115 | $ | 3,491 | $ | 4,129 | ||||||
|
Additions based on tax positions
|
||||||||||||
|
related to the current year
|
199 | 244 | 157 | |||||||||
|
Additions for tax positions in
|
||||||||||||
|
prior years
|
3 | 144 | 60 | |||||||||
|
Reductions for tax positions of prior
|
||||||||||||
|
years resulting from the lapse of
|
||||||||||||
|
applicable statute of limitations
|
(212 | ) | (339 | ) | (663 | ) | ||||||
|
Other reductions for tax positions of
|
||||||||||||
|
prior years
|
(81 | ) | (425 | ) | (192 | ) | ||||||
|
Ending balance
|
$ | 3,024 | $ | 3,115 | $ | 3,491 | ||||||
The total amount of unrecognized tax benefits that, if recognized, would affect the effective tax rate is $2.1 million at August 31, 2016 and $2.2 million at August 31, 2015. Included in the ending balance of gross unrecognized tax benefits at August 31, 2016 is $2.7 million related to individual states’ net operating loss carryforwards. Interest and penalties related to uncertain tax positions are recognized as components of income tax expense. The net accruals and reversals of interest and penalties increased
income tax expense by an insignificant amount in each of fiscal 2016, fiscal 2015 and fiscal 2014. The balance of interest and penalties included on our consolidated balance sheets at August 31, 2016 and 2015 was $0.3 million each year.
During the next 12 months we expect a decrease in unrecognized tax benefits totaling $0.3 million related to foreign tax credits upon the lapse of the applicable statute of limitations. We also expect a decrease of $0.2 million in unrecognized tax benefits relating to state net operating loss deductions upon the lapse of the applicable statute of limitations.
We file United States federal income tax returns as well as income tax returns in various states and foreign jurisdictions. The tax years that remain subject to examinations for our major tax jurisdictions are shown below.
|
2009-2016
|
Canada
|
|
2009-2016
|
Australia
|
|
2011-2016
|
Japan, United Kingdom
|
|
2012-2016
|
United States – state and local income tax
|
|
2013-2016
|
United States – federal income tax
|
|
15.
|
EARNINGS PER SHARE
|
The following is a reconciliation from basic earnings per share (EPS) to diluted EPS (in thousands, except per-share amounts).
|
YEAR ENDED
|
||||||||||||
|
AUGUST 31,
|
2016
|
2015
|
2014
|
|||||||||
|
Numerator for basic and
|
||||||||||||
|
diluted earnings per share:
|
||||||||||||
|
Net income
|
$ | 7,016 | $ | 11,116 | $ | 18,067 | ||||||
|
Denominator for basic and
|
||||||||||||
|
diluted earnings per share:
|
||||||||||||
|
Basic weighted average shares
|
||||||||||||
|
outstanding
|
14,944 | 16,742 | 16,720 | |||||||||
|
Effect of dilutive securities:
|
||||||||||||
|
Stock options and other
|
||||||||||||
|
stock-based awards
|
132 | 181 | 227 | |||||||||
|
Diluted weighted average shares
|
||||||||||||
|
outstanding
|
15,076 | 16,923 | 16,947 | |||||||||
|
EPS Calculations:
|
||||||||||||
|
Net income per share:
|
||||||||||||
|
Basic
|
$ | 0.47 | $ | 0.66 | $ | 1.08 | ||||||
|
Diluted
|
0.47 | 0.66 | 1.07 | |||||||||
Other securities, including performance stock-based compensation instruments, may have a dilutive effect on our EPS calculation in future periods if our financial results reach specified targets (Note 10).
|
16.
|
SEGMENT INFORMATION
|
Reportable Segments
Our revenues are primarily obtained from the sale of training and consulting services and related products. Effective September 1, 2015, we reorganized our internal reporting structure to include four new divisions and a corporate services group. A brief description of these new divisions follows:
|
·
|
Direct Offices – This division includes our geographic sales offices that serve the United States and Canada; our international sales offices located in Japan, the United Kingdom, and Australia; and our public programs group.
|
|
·
|
Strategic Markets – This division includes our government services office, the Sales Performance practice, the Customer Loyalty practice, and a new “Global 50” group, which is specifically focused on sales to large, multi-national organizations.
|
|
·
|
Education practice – This division includes our domestic and international Education practice operations, which are centered on sales to educational institutions.
|
|
·
|
International Licensees – This division is primarily comprised of our international licensees’ royalty revenues.
|
We determined that the new divisions are reportable segments under the applicable accounting guidance. Additionally, we determined that the Company’s chief operating decision maker is the CEO, and the primary measurement tool used in business unit performance analysis is Adjusted EBITDA, which may not be calculated as similarly titled amounts calculated by other companies. For reporting purposes, our consolidated Adjusted EBITDA can be calculated as our income or loss from operations excluding stock-based compensation, restructuring charges, depreciation expense, amortization expense, and certain other charges such as impaired asset charges and adjustments for changes in the fair value of contingent earn out liabilities from previous business acquisitions.
Our operations are not capital intensive and we do not own any manufacturing facilities or equipment. Accordingly, we do not allocate assets to the divisions for analysis purposes. Interest expense and interest income are primarily generated at the corporate level and are not allocated. Income taxes are likewise calculated and paid on a corporate level (except for entities that operate in foreign jurisdictions) and are not allocated for analysis purposes.
All prior period segment information has been revised to conform to our current organizational structure, assigned responsibilities, and primary internal reports. We account for our segment information on the same basis as the accompanying consolidated financial statements.
|
Sales to
|
||||||||||||
|
Fiscal Year Ended
|
External
|
Adjusted
|
||||||||||
|
August 31, 2016
|
Customers
|
Gross Profit
|
EBITDA
|
|||||||||
|
Direct offices
|
$ | 103,613 | $ | 74,642 | $ | 17,701 | ||||||
|
Strategic markets
|
29,778 | 18,749 | 3,536 | |||||||||
|
Education practice
|
40,361 | 24,030 | 4,372 | |||||||||
|
International licensees
|
17,629 | 13,667 | 9,174 | |||||||||
|
Total
|
191,381 | 131,088 | 34,783 | |||||||||
|
Corporate and eliminations
|
8,674 | 4,066 | (7,889 | ) | ||||||||
|
Consolidated
|
$ | 200,055 | $ | 135,154 | $ | 26,894 | ||||||
|
Fiscal Year Ended
|
||||||||||||
|
August 31, 2015
|
||||||||||||
|
Direct offices
|
$ | 113,087 | $ | 81,057 | $ | 18,801 | ||||||
|
Strategic markets
|
37,039 | 21,680 | 8,418 | |||||||||
|
Education practice
|
33,128 | 18,797 | 2,531 | |||||||||
|
International licensees
|
17,100 | 12,896 | 7,198 | |||||||||
|
Total
|
200,354 | 134,430 | 36,948 | |||||||||
|
Corporate and eliminations
|
9,587 | 3,659 | (5,090 | ) | ||||||||
|
Consolidated
|
$ | 209,941 | $ | 138,089 | $ | 31,858 | ||||||
|
Fiscal Year Ended
|
||||||||||||
|
August 31, 2014
|
||||||||||||
|
Direct offices
|
$ | 115,085 | $ | 82,162 | $ | 21,667 | ||||||
|
Strategic markets
|
31,841 | 18,156 | 4,625 | |||||||||
|
Education practice
|
30,883 | 18,591 | 4,315 | |||||||||
|
International licensees
|
17,065 | 13,505 | 8,406 | |||||||||
|
Total
|
194,874 | 132,414 | 39,013 | |||||||||
|
Corporate and eliminations
|
10,291 | 5,852 | (4,593 | ) | ||||||||
|
Consolidated
|
$ | 205,165 | $ | 138,266 | $ | 34,420 | ||||||
A reconciliation of Adjusted EBITDA to consolidated net income is provided below (in thousands):
|
YEAR ENDED
|
||||||||||||
|
AUGUST 31,
|
2016
|
2015
|
2014
|
|||||||||
|
Enterprise Adjusted EBITDA
|
$ | 34,783 | $ | 36,948 | $ | 39,013 | ||||||
|
Corporate expenses
|
(7,889 | ) | (5,090 | ) | (4,593 | ) | ||||||
|
Consolidated Adjusted EBITDA
|
26,894 | 31,858 | 34,420 | |||||||||
|
Stock-based compensation
|
(3,121 | ) | (2,536 | ) | (3,534 | ) | ||||||
|
Reduction (increase) in
|
||||||||||||
|
contingent consideration liability
|
(1,538 | ) | (35 | ) | 1,579 | |||||||
|
Other expenses
|
(670 | ) | - | - | ||||||||
|
Impaired assets
|
- | (1,302 | ) | (363 | ) | |||||||
|
Restructuring costs
|
(776 | ) | (587 | ) | - | |||||||
|
Depreciation
|
(3,677 | ) | (4,142 | ) | (3,383 | ) | ||||||
|
Amortization
|
(3,263 | ) | (3,727 | ) | (3,954 | ) | ||||||
|
Income from operations
|
13,849 | 19,529 | 24,765 | |||||||||
|
Interest income
|
325 | 383 | 427 | |||||||||
|
Interest expense
|
(2,263 | ) | (2,137 | ) | (2,237 | ) | ||||||
|
Discount on related party receivable
|
- | (363 | ) | (1,196 | ) | |||||||
|
Income before income taxes
|
11,911 | 17,412 | 21,759 | |||||||||
|
Provision for income taxes
|
(4,895 | ) | (6,296 | ) | (3,692 | ) | ||||||
|
Net income
|
$ | 7,016 | $ | 11,116 | $ | 18,067 | ||||||
Geographic Information
Our revenues are derived primarily from the United States. However, we also operate wholly owned offices or contract with licensees to provide our services in various countries throughout the world. Our consolidated revenues were derived from the following countries (in thousands):
|
YEAR ENDED
|
||||||||||||
|
AUGUST 31,
|
2016
|
2015
|
2014
|
|||||||||
|
United States
|
$ | 155,153 | $ | 162,594 | $ | 153,999 | ||||||
|
Japan
|
14,997 | 14,446 | 16,652 | |||||||||
|
United Kingdom
|
7,716 | 8,997 | 6,899 | |||||||||
|
China/Singapore
|
5,027 | 3,821 | 3,322 | |||||||||
|
Canada
|
4,357 | 6,460 | 8,780 | |||||||||
|
Australia
|
3,404 | 3,774 | 4,623 | |||||||||
|
Thailand
|
1,226 | 1,055 | 860 | |||||||||
|
Mexico/Central America
|
917 | 974 | 923 | |||||||||
|
Denmark/Scandinavia
|
863 | 729 | 831 | |||||||||
|
India
|
677 | 708 | 684 | |||||||||
|
Central/Eastern Europe
|
644 | 492 | 697 | |||||||||
|
Middle East
|
584 | 670 | 594 | |||||||||
|
Indonesia
|
579 | 651 | 761 | |||||||||
|
Malaysia
|
384 | 511 | 405 | |||||||||
|
Brazil
|
319 | 321 | 595 | |||||||||
|
South Korea
|
318 | 179 | 725 | |||||||||
|
Others
|
2,890 | 3,559 | 3,815 | |||||||||
| $ | 200,055 | $ | 209,941 | $ | 205,165 | |||||||
During the periods presented in this report, there were no customers that accounted for more than ten percent of our consolidated revenues.
At August 31, 2016 and 2015, we had wholly owned direct offices in Australia, Japan, and the United Kingdom. Our long-lived assets, excluding intangible assets, goodwill, and the long-term portion of the FCOP receivable were held in the following locations for the periods indicated (in thousands):
|
AUGUST 31,
|
2016
|
2015
|
||||||
|
United States/Canada
|
$ | 27,288 | $ | 28,770 | ||||
|
Japan
|
2,045 | 1,227 | ||||||
|
United Kingdom
|
114 | 101 | ||||||
|
Australia
|
349 | 208 | ||||||
| $ | 29,796 | $ | 30,306 | |||||
Inter-segment sales were immaterial and were eliminated in consolidation.
|
17.
|
RELATED PARTY TRANSACTIONS
|
Knowledge Capital Investment Group
Knowledge Capital Investment Group (Knowledge Capital) held a warrant to purchase 5.9 million shares of our common stock, exercised its warrant at various dates according to the terms of a fiscal 2011 exercise agreement, and received a total of 2.2 million shares of our common stock from shares held in treasury. Two members of our Board of Directors, including our CEO, have an equity interest in Knowledge Capital.
Pursuant to a fiscal 2011 warrant exercise agreement with Knowledge Capital, we filed a registration statement with the SEC on Form S-3 to register shares held by Knowledge Capital. This registration statement was declared effective on January 26, 2015. On May 20, 2015, Knowledge Capital sold 400,000 shares of our common stock on the open market and we did not purchase any of these shares. At each of August 31, 2016 and 2015, Knowledge Capital held 2.8 million shares of our common stock.
FC Organizational Products
During the fourth quarter of fiscal 2008, we joined with Peterson Partners to create a new company, FC Organizational Products, LLC. This new company purchased substantially all of the assets of our consumer solutions business unit with the objective of expanding the worldwide sales of FCOP as governed by a comprehensive license agreement between us and FCOP. On the date of the sale closing, we invested approximately $1.8 million to purchase a 19.5 percent voting interest in FCOP, and made a $1.0 million priority capital contribution with a 10 percent return. At the time of the transaction, we determined that FCOP was not a variable interest entity.
As a result of FCOP’s structure as a limited liability company with separate owner capital accounts, we determined that our investment in FCOP is more than minor and that we are required to account for our investment in FCOP using the equity method of accounting. We have not recorded our share of FCOP’s losses in the accompanying consolidated income statements because we have impaired and written off investment balances, as defined within the applicable accounting guidance, in previous periods in excess of our share of FCOP’s losses through August 31, 2016.
Based on changes to FCOP’s debt agreements and certain other factors in fiscal 2012, we reconsidered whether FCOP was a variable interest entity as defined under FASC 810, and determined that FCOP was a variable interest entity. Although the changes to the debt agreements did not modify the governing documents of FCOP, the changes were substantial enough to raise doubts regarding the sufficiency of FCOP’s equity investment at risk. We further determined that we are not the primary beneficiary of FCOP because we do not have the ability to direct the activities that most significantly impact FCOP’s economic performance, which primarily consist of the day-to-day sale of planning products and related accessories, and we do not have an obligation to absorb losses or the right to receive benefits from FCOP that could potentially be significant. Our voting rights and management board representation approximate our ownership interest and we are unable to exercise control through voting interests or through other means.
Our primary exposures related to FCOP are from amounts owed to us by FCOP. We receive reimbursement from FCOP for certain operating costs, some of which are billed to us by third-party providers. The operations of FCOP are primarily financed by the sale of planning products and accessories in the normal course of business. We classify our receivables from FCOP based upon expected payment. Long-term receivable balances are discounted at 15 percent, which was the estimated risk-adjusted borrowing rate of FCOP. This rate was based on a variety of factors including, but not limited to, current market interest rates for various qualities of comparable debt, discussions with FCOP’s lenders, and an evaluation of the realizability of FCOP’s future cash flows. In fiscal 2013, we began to accrete this long-term receivable and the majority of our interest income from fiscal 2014 through fiscal 2016 is attributable to the accretion of interest on long-term receivables.
Throughout fiscal 2014 we were optimistic about FCOP’s improving financial condition, as they increased their cash flows and did not request any working capital advances during calendar 2014. However, subsequent to August 31, 2014, we received new projected earnings and cash flow information that reflected weaker sales of accessory products, which were expected to have a significant adverse impact on expected earnings and cash flows in future periods. Accordingly, we determined that an additional $0.6 million discount charge and a corresponding $0.4 million impairment charge were needed to reduce the long-term receivable from FCOP to its net realizable value and ultimate net present value.
During fiscal 2015, we determined that we will receive payment from FCOP for certain rent expenses earlier than previously estimated and we recognized additional leasing revenues from FCOP totaling $0.2 million due to the change in the priority of the payment of these items. Although we were able to record additional leasing revenues and our cash flows on current related party receivables will improve in the short term, the present value of our share of cash distributions to cover remaining long-term receivables was reduced and was less than the present value of the receivables previously recorded and accordingly, the Company recalculated its discount on the long-term receivables and impaired the remaining balance, which totaled $0.5 million.
At August 31, 2016 and 2015, we had $3.2 million (net of $0.8 million discount) and $4.0 million (net of $1.0 million discount) receivable from FCOP, which have been classified in current assets and long-term assets in our consolidated balance sheets based on expected payment dates. We also owed FCOP $0.1 million and $50,000 at August 31, 2016 and 2015, respectively, for items purchased in the ordinary course of business. These liabilities were classified in accounts payable in the accompanying consolidated balance sheets. If FCOP is unable to pay us for these receivables, our liquidity, financial position, and cash flows will be adversely affected.
CoveyLink Acquisition and Contingent Earn Out Payments
During fiscal 2009, we acquired the assets of CoveyLink Worldwide, LLC (CoveyLink). CoveyLink conducts training and provides consulting based upon the book The Speed of Trust by Stephen M.R. Covey, who is the brother of one of our executive officers.
We accounted for the acquisition of CoveyLink using the guidance found in Statement of Financial Accounting Standards No. 141, Business Combinations. The purchase price was $1.0 million in cash plus or minus an adjustment for specified working capital and the costs necessary to complete the transaction, which resulted in a total initial purchase price of $1.2 million. The previous owners of CoveyLink, which includes Stephen M.R. Covey, were also entitled to earn annual contingent payments based upon earnings growth during the five years following the acquisition.
During the fiscal year ended August 31, 2014, we paid $3.5 million in cash to the former owners of CoveyLink for a contractual annual contingent payment. During fiscal 2015, we completed a review of the contingent earn out payments and determined that we owed the former owners of CoveyLink an additional $0.3 million for performance during the earn out measurement period. We do not anticipate any further payments related to the acquisition of CoveyLink. The annual contingent payments were classified as goodwill in our consolidated balance sheets under the accounting guidance applicable at the time of the acquisition.
Prior to the acquisition date, CoveyLink had granted us a non-exclusive license for content related to The Speed of Trust book and related training courses for which we paid CoveyLink specified royalties. As part of the CoveyLink acquisition, an amended and restated license of intellectual property was signed that granted us an exclusive, perpetual, worldwide, transferable, royalty-bearing license to use, reproduce, display, distribute, sell, prepare derivative works of, and perform the licensed material in any format or medium and through any market or distribution channel. We are required to pay the brother of one of our executive officers royalties for the use of certain intellectual property developed by him. The amount expensed for these royalties totaled $1.4 million, $1.4 million, and $1.5 million during the fiscal years ended August 31, 2016, 2015, and 2014. As part of the acquisition of CoveyLink, we signed an amended
license agreement as well as a speaker services agreement. Based on the provisions of the speakers’ services agreement, we pay the brother of one of our executive officers a portion of the speaking revenues received for his presentations. We expensed $1.3 million, $1.0 million, and $1.0 million for payment on these presentations during fiscal years 2016, 2015 and 2014. We had $0.7 million accrued for these royalties and speaking fees at each of August 31, 2016 and 2015, which were included as components of accrued liabilities in our consolidated balance sheets.
Red Tree Acquisition
On April 10, 2014, we acquired the assets of Red Tree, Inc. (Red Tree), a company that provides training, consulting, and coaching designed to help organizations effectively manage and engage the “Millennial Generation” in their workforces. We determined that this acquisition met the definition of an acquisition of a business under applicable accounting guidance. The purchase price totaled $0.5 million in cash, which was paid at the closing of the purchase agreement. During the 12 months ended December 31, 2013, Red Tree had revenues of $1.3 million (unaudited) and a net loss of $0.1 million (unaudited). The acquisition of Red Tree had an immaterial impact on our consolidated financial statements during the fiscal year ended August 31, 2014 and was determined to be “not significant” as defined by Regulation S-X.
The following table summarizes the estimated fair values of the assets acquired from Red Tree (in thousands):
|
Inventory
|
$ | 7 | ||
|
Intangible assets
|
405 | |||
|
Goodwill
|
50 | |||
|
Cash paid
|
$ | 462 |
Based on the initial purchase price allocation, we acquired the following intangible assets, which are being amortized over five years (in thousands):
|
Category of
|
Estimated Useful
|
||||
|
Intangible Asset
|
Amount
|
Life
|
|||
|
Tradename
|
$
|
31
|
5 years
|
||
|
Customer lists
|
142
|
5 years
|
|||
|
Content
|
232
|
5 years
|
|||
|
$
|
405
|
||||
The acquisition costs associated with the purchase of Red Tree were insignificant and are included with our selling, general, and administrative expenses in fiscal 2014. The goodwill generated from this transaction is primarily attributable to the methodologies and processes acquired, and is expected to be deductible for income tax purposes.
The former owners of Red Tree are related to one of our Named Executive Officers and are currently employed by us.
Other Related Party Transactions
We pay an executive officer of the Company a percentage of the royalty proceeds received from the sales of certain books authored by him in addition to his annual salary. During the fiscal years ended August 31, 2016, 2015, and 2014, we expensed $0.3 million, $0.2 million, and $0.2 million for these royalties and we had $0.2 million accrued at each of August 31, 2016 and 2015 as payable under the terms of these arrangements. These amounts are included as a component of accrued liabilities in our consolidated balance sheets.
We pay the estate of the late Dr. Stephen R. Covey a percentage of the royalty proceeds received from the sale of certain books that were authored by him. During fiscal 2016, 2015, and 2014, we expensed $0.1 million, $0.1 million, and $0.3 million for royalties under these agreements. At August 31, 2016 and 2015, we had $0.2 million and $0.1 million accrued, respectively, for payment to the estate of the former Vice-Chairman under these royalty agreements. Amounts payable to the estate of Dr. Stephen R. Covey are included as components of accrued liabilities in our consolidated balance sheets.
ITEM 9. CHANGES IN AND DISAGREEMENTS WITH ACCOUNTANTS ON ACCOUNTING AND FINANCIAL DISCLOSURE
None.
ITEM 9A. CONTROLS AND PROCEDURES
Disclosure Controls and Procedures
Disclosure controls and procedures are designed with the objective of ensuring that information required to be disclosed in the Company’s reports filed under the Exchange Act, such as this report, is recorded, processed, summarized, and reported within the time periods specified in the SEC’s rules and forms. Disclosure controls and procedures are also designed with the objective of ensuring that such information is accumulated and communicated to the Company’s management, including the Company’s Chief Executive Officer and Chief Financial Officer, as appropriate, to allow timely decisions regarding required disclosure.
Evaluation of Disclosure Controls and Procedures
An evaluation was conducted under the supervision and with the participation of our management, including the Chief Executive Officer and Chief Financial Officer, of the effectiveness of the design and operation of our disclosure controls and procedures, as defined in Rules 13a-15(e) and 15d-15(e) of the Exchange Act, as of the end of the period covered by this report.
Based on this evaluation, our Chief Executive Officer and our Chief Financial Officer concluded that, as of the end of the period covered by this report, our disclosure controls and procedures were effective.
Management’s Report on Internal Control Over Financial Reporting
The management of Franklin Covey Co. is responsible for establishing and maintaining adequate internal control over financial reporting for the Company (including its consolidated subsidiaries) and all related information appearing in the Company’s annual report on Form 10-K. The Company’s internal control over financial reporting is designed to provide reasonable assurance regarding the reliability of financial reporting and the preparation of financial statements for external purposes in accordance with accounting principles generally accepted in the United States of America. Internal control over financial reporting includes those policies and procedures that:
|
1.
|
pertain to the maintenance of records that in reasonable detail accurately and fairly reflect the transactions and dispositions of our assets;
|
|
2.
|
provide reasonable assurance that the transactions are recorded as necessary to permit preparation of financial statements in accordance with generally accepted accounting principles, and that our receipts and expenditures are being made only in accordance with the authorization of management and/or of our Board of Directors; and
|
|
3.
|
provide reasonable assurance regarding the prevention or timely detection of any unauthorized acquisition, use or disposition of our assets that could have a material effect on our financial statements.
|
Because of its inherent limitations, internal control over financial reporting may not prevent or detect misstatements. Also, projections of any evaluation of effectiveness in future periods are subject to the risk that controls may become inadequate because of changes in conditions, or that the degree of compliance with the policies or procedures may deteriorate.
Under the supervision and with the participation of our management, including our Chief Executive Officer and Chief Financial Officer, we conducted an evaluation of the effectiveness of our internal control over financial reporting using the criteria set forth in Internal Control—Integrated Framework as issued by the Committee of Sponsoring Organizations of the Treadway Commission (2013 COSO Framework). Based upon this evaluation, our management concluded that our internal control over financial reporting was effective as of the end of the period covered by this annual report on Form 10-K.
Our independent registered public accounting firm, Deloitte & Touche LLP, has audited the consolidated financial statements included in this annual report on Form 10-K and, as part of their audit, has issued an audit report, included herein, on the effectiveness of our internal control over financial reporting. Their report is included in Item 8 of this Report on Form 10-K.
Changes in Internal Control Over Financial Reporting
There were no changes in our internal control over financial reporting (as defined in Rule 13a-15(f) or 15d-15(f)) during the fourth quarter ended August 31, 2016 that materially affected, or are reasonably likely to materially affect, our internal controls over financial reporting.
ITEM 9B. OTHER INFORMATION
None.
ITEM 10. DIRECTORS, EXECUTIVE OFFICERS AND CORPORATE GOVERNANCE
Certain information required by this Item is incorporated by reference to the sections entitled “Nominees for Election to the Board of Directors,” “Executive Officers,” “Section 16(a) Beneficial Ownership Reporting Compliance,” “Corporate Governance,” and “Board of Director Meetings and Committees” in our definitive Proxy Statement for the annual meeting of shareholders, which is scheduled to be held on January 20, 2017. The definitive Proxy Statement will be filed with the Securities and Exchange Commission pursuant to Regulation 14A of the Securities Exchange Act of 1934, as amended.
The Board of Directors has determined that one of the Audit Committee members, Mr. Michael Fung, is a “financial expert” as defined in Regulation S-K 407(d)(5) adopted under the Securities Exchange Act of 1934, as amended. Our Board of Directors has also determined that Mr. Fung is an “independent director” as defined by the New York Stock Exchange (NYSE).
We have adopted a code of ethics for our senior financial officers that include the Chief Executive Officer, the Chief Financial Officer, and other members of our financial leadership team. This code of ethics is available on our website at www.franklincovey.com. We intend to satisfy any disclosure requirements under Item 5.05 of Form 8-K regarding amendment to, or waiver from, a provision of this Code of Business Conduct and Ethics by posting such information on our web site at the address and location specified above.
ITEM 11. EXECUTIVE COMPENSATION
The information required by this Item is incorporated by reference to the sections entitled “Compensation Discussion and Analysis,” “Compensation Committee Interlocks and Insider Participation,” and “Compensation Committee Report” in our definitive Proxy Statement for the annual meeting of shareholders, which is scheduled to be held on January 20, 2017.
ITEM 12. SECURITY OWNERSHIP OF CERTAIN BENEFICIAL OWNERS AND MANAGEMENT AND RELATED STOCKHOLDER MATTERS
| [a] | [b] | [c] | ||||||||||
|
Plan Category
|
Number of securities to be
issued upon exercise of outstanding options,
warrants, and rights
|
Weighted-average exercise price
of outstanding options,
warrants, and rights
|
Number of securities remaining available for future issuance
under equity compensation
plans (excluding securities reflected in column [a])
|
|||||||||
|
(in thousands)
|
(in thousands)
|
|||||||||||
|
Equity compensation plans approved by security holders(1)(4)
|
1,127 | (2) | $ | 11.41 | 1,145 | (3) | ||||||
|
(1)
|
Excludes 25,032 shares of unvested (restricted) stock awards and stock units that are subject to forfeiture.
|
|
(2)
|
Amount includes 496,031 performance share awards that are expected to be awarded under the terms of various long-term incentive plans. In some of the performance-based plans, the number of shares eventually awarded to participants is variable and based upon the achievement of specified financial performance goals. The weighted average exercise price of outstanding options, warrants, and rights does not include the impact of performance awards. For further information on our share-based compensation plans, refer to the notes to our financial statements as presented in Item 8 of this report.
|
|
(3)
|
Amount is based upon the number of performance-based plan shares expected to be awarded at August 31, 2016 and may change in future periods based upon the achievement of specified goals and revisions to estimates.
|
|
(4)
|
At August 31, 2016, we had approximately 440,000 shares authorized for purchase by participants in our Employee Stock Purchase Plan.
|
The remaining information required by this Item is incorporated by reference to the section entitled “Principal Holders of Voting Securities” in our definitive Proxy Statement for the annual meeting of shareholders, which is scheduled to be held on January 20, 2017.
ITEM 13. CERTAIN RELATIONSHIPS AND RELATED TRANSACTIONS, AND DIRECTOR INDEPENDENCE
The information required by this Item is incorporated by reference to the section entitled “Certain Relationships and Related Transactions” and “Corporate Governance” in our definitive Proxy Statement for the annual meeting of shareholders, which is scheduled to be held on January 20, 2017.
ITEM 14. PRINCIPAL ACCOUNTANT FEES AND SERVICES
The information required by this Item is incorporated by reference to the section entitled “Principal Accountant Fees” in our definitive Proxy Statement for the annual meeting of shareholders, which is scheduled to be held on January 20, 2017.
ITEM 15. EXHIBITS AND FINANCIAL STATEMENT SCHEDULES
(a) List of documents filed as part of this report:
|
1.
|
Financial Statements. The consolidated financial statements of the Company and Report of Independent Registered Public Accounting Firm thereon included in the Annual Report to Shareholders on Form 10-K for the year ended August 31, 2016, are as follows:
|
Report of Independent Registered Public Accounting Firm
Consolidated Balance Sheets at August 31, 2016 and 2015
Consolidated Income Statements and Statements of Comprehensive Income for the fiscal years ended August 31, 2016, 2015, and 2014
Consolidated Statements of Cash Flows for the fiscal years ended August 31, 2016, 2015, and 2014
Consolidated Statements of Shareholders’ Equity for the fiscal years ended August 31, 2016, 2015, and 2014
Notes to Consolidated Financial Statements
|
2.
|
Financial Statement Schedules.
|
Other financial statement schedules are omitted because they are not required or applicable, or the required information is shown in the financial statements or notes thereto, or contained in this report.
|
3.
|
Exhibit List.
|
|
Exhibit No.
|
Exhibit
|
Incorporated By Reference
|
Filed Herewith
|
|
2.1
|
Master Asset Purchase Agreement between Franklin Covey Products, LLC and Franklin Covey Co. dated May 22, 2008
|
(11)
|
|
|
2.2
|
Amendment to Master Asset Purchase Agreement between Franklin Covey Products, LLC and Franklin Covey Co. dated May 22, 2008
|
(12)
|
|
|
3.1
|
Articles of Restatement dated March 4, 2005 amending and restating the Company’s Articles of Incorporation
|
(4)
|
|
|
3.2
|
Amendment to Amended and Restated Articles of Incorporation of Franklin Covey (Appendix C)
|
(7)
|
|
|
3.3
|
Amended and Restated Bylaws of Franklin Covey Co.
|
(19)
|
|
|
4.1
|
Specimen Certificate of the Registrant’s Common Stock, par value $.05 per share
|
(2)
|
|
|
4.2
|
Stockholder Agreements, dated May 11, 1999 and June 2, 1999
|
(3)
|
|
|
4.3
|
Registration Rights Agreement, dated June 2, 1999
|
(3)
|
|
|
4.4
|
Amended and Restated Shareholders Agreement, dated as of March 8, 2005, between the Company and Knowledge Capital Investment Group
|
(4)
|
|
|
4.5
|
Amended and Restated Registration Rights Agreement, dated as of March 8, 2005, between the Company and Knowledge Capital Investment Group
|
(4)
|
|
|
10.1*
|
Amended and Restated 2004 Employee Stock Purchase Plan
|
(10)
|
|
|
10.2*
|
Forms of Nonstatutory Stock Options
|
(1)
|
|
|
10.3
|
Warrant to Purchase Common Stock, dated March 8, 2005, to purchase 5,913,402 shares of Common Stock issued by the Company to Knowledge Capital Investment Group
|
(4)
|
|
|
10.4
|
Form of Warrant to purchase Common Stock to be issued by the Company to holders of Series A Preferred Stock other than Knowledge Capital Investment Group
|
(4)
|
|
|
10.5
|
Master Lease Agreement, dated June 17, 2005, between Franklin SaltLake LLC (Landlord) and Franklin Development Corporation (Tenant)
|
(5)
|
|
|
10.6
|
Purchase and Sale Agreement and Escrow Instructions between Levy Affiliated Holdings, LLC (Buyer) and Franklin Development Corporation (Seller) and Amendments
|
(5)
|
|
|
10.7
|
Redemption Extension Voting Agreement between Franklin Covey Co. and Knowledge Capital Investment Group, dated October 20, 2005
|
(6)
|
|
|
10.8
|
Agreement for Information Technology Services between each of Franklin Covey Co., Electronic Data Systems Corporation, and EDS Information Services LLC, dated April 1, 2001
|
(8)
|
|
|
10.9
|
Additional Services Addendum No. 1 to Agreement for Information Technology Services between each of Franklin Covey Co., Electronic Data Systems Corporation, and EDS Information Services LLC, dated June 30, 2001
|
(8)
|
|
|
10.10
|
Amendment No. 2 to Agreement for Information Technology Services between each of Franklin Covey Co., Electronic Data Systems Corporation, and EDS Information Services LLC, dated June 30, 2001
|
(8)
|
|
|
10.11
|
Amendment No. 6 to the Agreement for Information Technology Services between each of Franklin Covey Co., Electronic Data Systems Corporation, and EDS Information Services L.L.C. dated April 1, 2006
|
(9)
|
|
|
10.12
|
Master License Agreement between Franklin Covey Co. and Franklin Covey Products, LLC
|
(13)
|
|
|
10.13
|
Supply Agreement between Franklin Covey Products, LLC and Franklin Covey Product Sales, Inc.
|
(13)
|
|
|
10.14
|
Master Shared Services Agreement between The Franklin Covey Products Companies and the Shared Services Companies
|
(13)
|
|
|
10.15
|
Amended and Restated Operating Agreement of Franklin Covey Products, LLC
|
(13)
|
|
|
10.16
|
Sublease Agreement between Franklin Development Corporation and Franklin Covey Products, LLC
|
(13)
|
|
|
10.17
|
Sub-Sublease Agreement between Franklin Covey Co. and Franklin Covey Products, LLC
|
(13)
|
|
|
10.18
|
General Services Agreement between Franklin Covey Co. and Electronic Data Systems, LLP (EDS) dated October 27, 2008
|
(14)
|
|
|
10.19
|
Asset Purchase Agreement by and Among Covey/Link, LLC, CoveyLink Worldwide LLC, Franklin Covey Co., and Franklin Covey Client Sales, Inc. dated December 31, 2008
|
(15)
|
|
|
10.20
|
Amended and Restated License of Intellectual Property by and Among Franklin Covey Co. and Covey/Link, LLC, dated December 31, 2008
|
(15)
|
|
|
10.21*
|
Franklin Covey Co. Second Amended and Restated 1992 Stock Incentive Plan
|
(16)
|
|
|
10.22
|
Amended and Restated Credit Agreement by and between JPMorgan Chase Bank, N.A. and Franklin Covey Co., dated March 14, 2011
|
(17)
|
|
|
10.23
|
Amended and Restated Security Agreement by and among Franklin Covey Co., Franklin Development Corporation, Franklin Covey Travel, Inc., Franklin Covey Client Sales, Inc., and JPMorgan Chase Bank, N.A., dated March 14, 2011
|
(17)
|
|
|
10.24
|
Amended and Restated Repayment Guaranty by and among Franklin Development Corporation, Franklin Covey Travel, Inc., Franklin Covey Client Sales, Inc., and JPMorgan Chase Bank, N.A., dated March 14, 2011
|
(17)
|
|
|
10.25
|
Secured Promissory Note between Franklin Covey Co. and JPMorgan Chase Bank, N.A. for $10.0 million revolving loan, dated March 14, 2011
|
(17)
|
|
|
10.26
|
Agreement dated July 26, 2011, between Franklin Covey Co., and Knowledge Capital Investment Group
|
(18)
|
|
|
10.27
|
First Modification Agreement by and among JPMorgan Chase Bank, N.A. and Franklin Covey Co., dated March 13, 2012
|
(20)
|
|
|
10.28
|
Consent and Agreement of Guarantor by and between Franklin Covey Co., Franklin Development Corporation, Franklin Covey Travel, Inc., Franklin Covey Client Sales, Inc. and JPMorgan Chase Bank, N.A., dated March 13, 2012
|
(20)
|
|
|
10.29
|
Second Modification Agreement by and among JPMorgan Chase Bank, N.A. and Franklin Covey Co., dated June 15, 2012
|
(21)
|
|
|
10.30
|
Consent and Agreement of Guarantor by and between Franklin Covey Co., Franklin Development Corporation, Franklin Covey Travel, Inc., Franklin Covey Client Sales, Inc. and JPMorgan Chase Bank, N.A., dated June 15, 2012
|
(21)
|
|
|
10.31*
|
Form of Change in Control Severance Agreement
|
(22)
|
|
|
10.32
|
Asset Purchase Agreement made as of March 11, 2013 by and among NinetyFive 5 LLC and Franklin Covey Client Sales, Inc. and other parties thereto
|
(23)
|
|
|
10.33
|
Third Modification Agreement by and among JPMorgan Chase Bank, N.A. and Franklin Covey Co. dated March 25, 2013
|
(24)
|
|
|
10.34
|
Consent and Agreement of Guarantor by and between JPMorgan Chase Bank, N.A. and Franklin Covey Co. dated March 25, 2013
|
(24)
|
|
|
10.35*
|
Franklin Covey Co. 2015 Omnibus Incentive Plan
|
(25)
|
|
|
10.36
|
Fourth Modification Agreement by and among JPMorgan Chase Bank, N.A. and Franklin Covey Co. dated March 31, 2015
|
(26)
|
|
|
10.37
|
Consent and Agreement of Guarantor by and between JPMorgan Chase Bank, N.A. and Franklin Covey Co. dated March 31, 2015
|
(26)
|
|
|
10.38
|
Fifth Modification Agreement by and among JPMorgan Chase Bank, N.A., Franklin Covey Co., and the subsidiary guarantors signatory thereto, dated May 24, 2016.
|
(27)
|
|
|
10.39
|
Consent and Agreement of Guarantor by and between JPMorgan Chase Bank, N.A., Franklin Covey Co., and the subsidiary guarantors signatory thereto, dated May 24, 2016.
|
(27)
|
|
|
10.40
|
Secured Promissory Note between Franklin Covey Co. and JPMorgan Chase Bank, N.A., for $15 million term loan, dated May 24, 2016.
|
(27)
|
|
|
21
|
Subsidiaries of the Registrant
|
éé
|
|
|
23.1
|
Consent of Independent Registered Public Accounting Firm
|
éé
|
|
|
23.2
|
Consent of Independent Registered Public Accounting Firm |
éé
|
|
|
31.1
|
Rule 13a-14(a) Certification of the Chief Executive Officer
|
éé
|
|
|
31.2
|
Rule 13a-14(a) Certification of the Chief Financial Officer
|
éé
|
|
|
32
|
Section 1350 Certifications
|
éé
|
|
|
101.INS
|
XBRL Instance Document
|
éé
|
|
|
101.SCH
|
XBRL Taxonomy Extension Schema
|
éé
|
|
|
101.CAL
|
XBRL Taxonomy Extension Calculation Linkbase
|
éé
|
|
|
101.DEF
|
XBRL Taxonomy Extension Definition Linkbase
|
éé
|
|
|
101.LAB
|
XBRL Taxonomy Extension Label Linkbase
|
éé
|
|
|
101.PRE
|
XBRL Extension Presentation Linkbase
|
éé
|
|
(1)
|
Incorporated by reference to Registration Statement on Form S-1 filed with the Commission on April 17, 1992, Registration No. 33-47283.
|
|
(2)
|
Incorporated by reference to Amendment No. 1 to Registration Statement on Form S-1 filed with the Commission on May 26, 1992, Registration No. 33-47283.
|
|
(3)
|
Incorporated by reference to Schedule 13D (CUSIP No. 534691090 as filed with the Commission on June 14, 1999). Registration No. 005-43123.
|
|
(4)
|
Incorporated by reference to Report on Form 8-K filed with the Commission on March 10, 2005.**
|
|
(5)
|
Incorporated by reference to Report on Form 8-K filed with the Commission on June 27, 2005.**
|
|
(6)
|
Incorporated by reference to Report on Form 8-K filed with the Commission on October 24, 2005.**
|
|
(7)
|
Incorporated by reference to Definitive Proxy Statement on Form DEF 14A filed with the Commission on December 12, 2005.**
|
|
(8)
|
Incorporated by reference to Report on Form 10-Q filed July 10, 2001, for the quarter ended May 26, 2001.**
|
|
(9)
|
Incorporated by reference to Report on Form 8-K filed with the Commission on April 5, 2006.**
|
|
(10)
|
Incorporated by reference to Definitive Proxy Statement on Form DEF 14A (Appendix A) filed with the Commission on February 1, 2005.**
|
|
(11)
|
Incorporated by reference to Report on Form 8-K/A filed with the Commission on May 29, 2008.**
|
|
(12)
|
Incorporated by reference to Report on Form 10-Q filed July 10, 2008, for the Quarter ended May 31, 2008.**
|
|
(13)
|
Incorporated by reference to Report on Form 8-K filed with the Commission on July 11, 2008.**
|
|
(14)
|
Incorporated by reference to Report on Form 10-K filed with the Commission on November 14, 2008.**
|
|
(15)
|
Incorporated by reference to Report on Form 10-Q filed with the Commission on April 9, 2009.**
|
|
(16)
|
Incorporated by reference to Definitive Proxy Statement on Form DEF 14A (Appendix A) filed with the Commission on December 15, 2010.**
|
|
(17)
|
Incorporated by reference to Report on Form 8-K filed with the Commission on March 17, 2011.**
|
|
(18)
|
Incorporated by reference to Report on Form 8-K filed with the Commission on July 28, 2011.**
|
|
(19)
|
Incorporated by reference to Report on Form 8-K filed with the Commission on February 1, 2012.**
|
|
(20)
|
Incorporated by reference to Report on Form 8-K filed with the Commission on March 15, 2012.**
|
|
(21)
|
Incorporated by reference to Report on Form 8-K filed with the Commission on June 19, 2012.**
|
|
(22)
|
Incorporated by reference to Report on Form 8-K filed with the Commission on March 14, 2012.**
|
|
(23)
|
Incorporated by reference to Report on Form 8-K filed with the Commission on March 14, 2013.**
|
|
(24)
|
Incorporated by reference to Report on Form 8-K filed with the Commission on March 27, 2013.**
|
|
(25)
|
Incorporated by reference to Definitive Proxy Statement on Form DEF 14A (Appendix A) filed with the Commission on December 22, 2014.**
|
|
(26)
|
Incorporated by reference to Report on Form 8-K filed with the Commission on April 2, 2015.**
|
|
(27)
|
Incorporated by reference to Report on Form 8-K filed with the Commission on May 24, 2016.**
|
|
éé
|
Filed herewith and attached to this report.
|
|
*
|
Indicates a management contract or compensatory plan or agreement.
|
|
**
|
Registration No. 001-11107.
|
SIGNATURES
Pursuant to the requirements of Section 13 or 15(d) of the Securities Exchange Act of 1934, the Registrant has duly caused this report to be signed on its behalf by the undersigned, thereunto duly authorized, on November 14, 2016.
FRANKLIN COVEY CO.
|
By:
|
/s/ Robert A. Whitman
|
|
|
Robert A. Whitman
Chairman and Chief Executive Officer
|
Pursuant to the requirements of the Securities Exchange Act of 1934, this report has been signed below by the following persons on behalf of the Registrant and in the capacities and on the dates indicated.
|
Signature
|
Title
|
Date
|
|
/s/ Robert A. Whitman
|
Chairman of the Board
and Chief Executive Officer
|
November 14, 2016
|
|
Robert A. Whitman
|
||
|
/s/ Anne H. Chow
|
Director
|
November 14, 2016
|
|
Anne H. Chow
|
||
|
/s/ Clayton M. Christensen
|
Director
|
November 14, 2016
|
|
Clayton M. Christensen
|
||
|
/s/ Michael Fung
|
Director
|
November 14, 2016
|
|
Michael Fung
|
||
|
/s/ Dennis G. Heiner
|
Director
|
November 14, 2016
|
|
Dennis G. Heiner
|
||
|
/s/ Donald J. McNamara
|
Director
|
November 14, 2016
|
|
Donald J. McNamara
|
||
|
/s/ Joel C. Peterson
|
Director
|
November 14, 2016
|
|
Joel C. Peterson
|
||
|
/s/ E. Kay Stepp
|
Director
|
November 14, 2016
|
|
E. Kay Stepp
|
||
|
/s/ Stephen D. Young
|
Chief Financial Officer
and Chief Accounting Officer
|
November 14, 2016
|
|
Stephen D. Young
|