
UNITED STATES
SECURITIES AND EXCHANGE COMMISSION
Washington, D.C. 20549
FORM
(Mark One)
|
|
ANNUAL REPORT PURSUANT TO SECTION 13 OR 15(d) OF THE SECURITIES EXCHANGE ACT OF 1934 |
For the fiscal year ended
or
|
|
TRANSITION REPORT PURSUANT TO SECTION 13 OR 15(d) OF THE SECURITIES EXCHANGE ACT OF 1934 |
For the transition period from ____________ to ____________
Commission file number:
(Exact name of registrant as specified in its charter)
|
|
|
|
||
|
(State or other jurisdiction of incorporation or organization) |
|
(I.R.S. Employer Identification No.) |
||
|
|
|
|
||
|
(Address of principal executive offices) |
|
(Zip Code) |
(
(Registrant’s telephone number, including area code)
Securities registered pursuant to Section 12(b) of the Act:
|
Title of each class |
|
Trading Symbol(s) |
|
Name of each exchange on which registered |
|
|
|
|
|
|
|
|
|
__ |
|
New York Stock Exchange |
Securities registered pursuant to Section 12(g) of the Act: None
Indicate by check mark if the registrant is a well-known seasoned issuer, as defined by Rule 405 of the Securities Act.
Indicate by check mark if the registrant is not required to file reports pursuant to Section 13 or 15(d) of the Act. Yes ☐
Indicate by check mark whether the registrant (1) has filed all reports required to be filed by Section 13 or 15(d) of the Securities Exchange Act of 1934 during the preceding 12 months (or for such shorter period that the registrant was required to file such reports), and (2) has been subject to such filing requirements for the past 90 days.
Indicate by check mark whether the registrant has submitted electronically every Interactive Data File required to be submitted pursuant to Rule 405 of Regulation S-T (§ 232.405 of this chapter) during the preceding 12 months (or for such shorter period that the registrant was required to submit such files.)
Indicate by check mark whether registrant is a large accelerated filer, an accelerated filer, a non-accelerated filer, a smaller reporting company, or an emerging growth company. See the definitions of “large accelerated filer,” “accelerated filer,” “smaller reporting company,” and “emerging growth company” in Rule 12b-2 of the Exchange Act.
|
Large accelerated filer |
|
☐ |
|
|
|
☒ |
|
|
Non-accelerated filer |
|
☐ |
|
Smaller reporting company |
|
|
|
|
|
|
|
|
Emerging growth company |
|
|
If an emerging growth company, indicate by check mark if the registrant has elected not to use the extended transition period for complying with any new or revised financial accounting standards provided pursuant to Section 13(a) of the Exchange Act. ☐
Indicate by check mark whether the registrant has filed a report on and attestation to its management’s assessment of the effectiveness of its internal control over financial reporting under Section 404(b) of the Sarbanes-Oxley Act (15 U.S.C. 7262(b)) by the registered public accounting firm that prepared or issued its audit report.
Indicate by check mark whether the registrant is a shell company (as defined in Rule 12b-2 of the Act). Yes
The aggregate market value of the Common Stock (based on its closing price per share on such date) held by non-affiliates on the last business day of the registrant’s most recently completed second fiscal quarter (June 30, 2020) was approximately $
Registrant had
Documents Incorporated by Reference
INDEX
|
|
|
Page |
|
|
|
|
|
Item 1. |
2 |
|
|
Item 1A. |
12 |
|
|
Item 1B. |
16 |
|
|
Item 2. |
16 |
|
|
Item 3. |
16 |
|
|
Item 4. |
16 |
|
|
Other. |
17 |
|
|
|
|
|
|
Item 5. |
18 |
|
|
Item 6. |
19 |
|
|
Item 7. |
Management’s Discussion and Analysis of Financial Condition and Results of Operations |
20 |
|
Item 7A. |
32 |
|
|
Item 8. |
34 |
|
|
Item 9. |
Changes in and Disagreements With Accountants on Accounting and Financial Disclosure |
84 |
|
Item 9A. |
84 |
|
|
Item 9B. |
86 |
|
|
|
|
|
|
Item 10. |
87 |
|
|
Item 11. |
87 |
|
|
Item 12. |
Security Ownership of Certain Beneficial Owners and Management and Related Stockholder Matters |
87 |
|
Item 13. |
Certain Relationships and Related Transactions, and Director Independence |
87 |
|
Item 14. |
87 |
|
|
|
|
|
|
Item 15. |
87
|
|
|
Item 16. |
92 |
In this report, for periods presented, “we,” “us,” “our,” “the Company,” and “Viad Corp” refer to Viad Corp and its subsidiaries.
PART I
Forward-Looking Statements
This Annual Report on Form 10-K (“2020 Form 10-K”) contains a number of forward-looking statements within the meaning of the Private Securities Litigation Reform Act of 1995. Forward-looking statements may appear throughout this 2020 Form 10-K, including the following sections: “Business” (Part I, Item 1), “Risk Factors” (Part I, Item 1A), “Management’s Discussion and Analysis of Financial Condition and Results of Operations” (Part II, Item 7), and “Quantitative and Qualitative Disclosures About Market Risk” (Part II, Item 7A). Words, and variations of words, such as “will,” “may,” “expect,” “would,” “could,” “might,” “intend,” “plan,” “believe,” “estimate,” “anticipate,” “deliver,” “seek,” “aim,” “potential,” “target,” “outlook,” and similar expressions are intended to identify our forward-looking statements. Similarly, statements that describe our business strategy, outlook, objectives, plans, initiatives, intentions, or goals also are forward-looking statements. These forward-looking statements are not historical facts and are subject to a host of risks and uncertainties, many of which are beyond our control, which could cause actual results to differ materially from those in the forward-looking statements. Such risks, uncertainties, and other important factors include, among others: the short- and longer-term effects of the COVID-19 pandemic, including the demand for travel, event business and travel experiences, and levels of consumer confidence; actions that governments, businesses, and individuals take in response to the COVID-19 pandemic or any future resurgence, including limiting or banning travel; the impact of the COVID-19 pandemic, or any future resurgence, on global and regional economies, travel, and economic activity, including the duration and magnitude of its impact on unemployment rates and consumer discretionary spending; and the pace of recovery following the COVID-19 pandemic or any future resurgence.
Important factors that could cause actual results to differ materially from those described in our forward-looking statements include, but are not limited to, the following:
|
|
• |
the impact of the COVID-19 pandemic on our financial condition, liquidity, and cash flow; |
|
|
• |
our ability to anticipate and adjust for the impact of the COVID-19 pandemic on our businesses; |
|
|
• |
general economic uncertainty in key global markets and a worsening of global economic conditions; |
|
|
• |
travel industry disruptions; |
|
|
• |
our ability to successfully integrate and achieve established financial and strategic goals from acquisitions; |
|
|
• |
our dependence on large exhibition event clients; |
|
|
• |
the importance of key members of our account teams to our business relationships; |
|
|
• |
the competitive nature of the industries in which we operate; |
|
|
• |
unanticipated delays and cost overruns of our capital projects, and our ability to achieve established financial and strategic goals for such projects; |
|
|
• |
seasonality of our businesses; |
|
|
• |
transportation disruptions and increases in transportation costs; |
|
|
• |
natural disasters, weather conditions, and other catastrophic events; |
|
|
• |
our multi-employer pension plan funding obligations; |
|
|
• |
our exposure to labor cost increases and work stoppages related to unionized employees; |
|
|
• |
liabilities relating to prior and discontinued operations; |
|
|
• |
adverse effects of show rotation on our periodic results and operating margins; |
|
|
• |
our exposure to currency exchange rate fluctuations; |
|
|
• |
our exposure to cybersecurity attacks and threats; |
|
|
• |
compliance with laws governing the storage, collection, handling, and transfer of personal data and our exposure to legal claims and fines for data breaches or improper handling of such data; and |
|
|
• |
changes affecting the London Inter-bank Offered Rate (“LIBOR”) and the Canadian Dollar Offered Rate (“CDOR”). |
For a more complete discussion of the risks and uncertainties that may affect our business or financial results, refer to “Risk Factors” (Part I, Item 1A of this 2020 Form 10-K). We disclaim and do not undertake any obligation to update or revise any forward-looking statement in this 2020 Form 10-K except as required by applicable law or regulation.
1
Item 1. Business
We are a leading provider of experiential leisure travel and face-to-face events and marketing experiences company with operations in the United States, Canada, the United Kingdom, continental Europe, the United Arab Emirates, and Iceland. We are committed to providing unforgettable experiences to our clients and guests.
We operate through three reportable business segments: GES North America, GES EMEA (collectively, “GES”), and Pursuit:
|
|
• |
GES is a global, full-service live events company offering a comprehensive range of services to the world’s leading brands and event organizers. |
|
|
• |
Pursuit is an attractions and hospitality company that provides a collection of inspiring and unforgettable experiences in iconic destinations. |
COVID-19 Pandemic
In March 2020, the World Health Organization declared COVID-19 a “pandemic.” COVID-19 has spread rapidly, with a high concentration of confirmed cases in the U.S. and other countries in which we operate. The rapid spread has resulted in authorities around the world implementing numerous measures to contain the virus, such as travel bans and restrictions, quarantines, shelter-in-place orders, social distancing, and business shutdowns. The COVID-19 pandemic and these containment measures have had, and are expected to continue to have, a substantial negative impact on businesses around the world and on global, regional, and national economies.
In early March 2020, we began to see event postponements and cancellations at GES, as well as cancelled bookings at Pursuit. This quickly escalated into the shutdown of event activity and tourism as government mandated closures and stay-at-home orders went more broadly into effect around the world. As demand halted, we essentially placed our businesses into a state of hibernation to preserve cash. As government mandated closures and stay-at-home orders started to be lifted, we began to restart our business with enhanced health and safety protocols in place. We phased in most of Pursuit’s attractions and lodging operations starting in May 2020, with most open during the second half of 2020, although generally at reduced capacities. However, exhibition and event activity remained largely dormant. As the pandemic persists, we have been and may be required to re-close certain attractions or events based on local or governmental restrictions.
The extent of the COVID-19 pandemic’s effect on our operational and financial performance will depend on future developments including the duration, spread, and intensity of the virus as well as the success of vaccination efforts, all of which are uncertain and difficult to predict. Due to the evolving and uncertain nature of COVID-19, we are not able at this time to fully estimate the effect of these factors on our business; however, the adverse impact on our business, results of operations, and cash flows has been material. Refer to Management’s Discussion and Analysis of Financial Condition and Results of Operations (Part II, Item 7 of this 2020 Form 10-K) for further discussion regarding the impact of COVID-19 on our 2020 financial results. Refer to Risk Factors (Part I. Item 1A of this 2020 Form 10-K) for a discussion of risks and uncertainties that may affect our business.

GES is a global, full-service provider for live events that partners with show organizers, exhibitors, and brand marketers to create high-value, face-to-face events. GES offers a comprehensive range of live event services, from the design and production of compelling, immersive experiences that engage audiences and build brand awareness, to material handling, rigging, electrical, and other on-site event services. In addition, GES offers clients a full suite of audio-visual services from creative and technology to content and design, along with registration, data analytics, engagement, and online tools powered by next generation technologies that help clients easily manage the complexities of their event.
GES’ clients include event organizers and corporate brand marketers. Event organizers schedule and run the event from start to finish. Corporate brand marketers include exhibitors and domestic and international corporations that want to promote their brands, services and innovations, feature new products, and build business relationships. GES serves corporate brand marketers when they exhibit at shows and when GES is engaged to manage their global exhibit program or produce their proprietary corporate events.
GES has a leading position in the U.S., serving every major exhibition market, including Las Vegas, Chicago, and Orlando. Additionally, GES produces events at many of the most active and popular international event destinations and venues in the United Kingdom, Canada, Germany, the United Arab Emirates, and the Netherlands.
2
Markets Served
GES provides a full suite of services for event organizers and corporate brand marketers across four live event markets: Exhibitions, Conferences, Corporate Events, and Consumer Events (collectively, “Live Events”).
|
|
• |
Exhibitions – Facilitates business-to-business and business-to-consumer sales and marketing. |
|
|
• |
Conferences – Facilitates attendee education. May also include an expo or trade show to further facilitate attendee education and to facilitate business-to-business and business-to-consumer sales and marketing. |
|
|
• |
Corporate Events – Facilitates attendee education of sponsoring company’s products or product ecosystem. |
|
|
• |
Consumer Events – Entertains, educates, or creates an experience, typically around a specific genre. We made the decision to exit the consumer events market in 2020. |
During 2020, many of our corporate clients transitioned to virtual and hybrid events largely as a result of face-to-face event cancellations and postponements during the COVID-19 pandemic.
Services Offered
GES offers a comprehensive range of services and innovative technology to event organizers and corporate brand marketers, including Core Services, Event Technology, and Audio-visual.
|
Core Services |
|
GES provides official contracting services and products to event organizers and corporate brand marketers, which are provided primarily to Exhibitions and Conferences and to a lesser extent to Corporate Events and Consumer Events. Under various agreements with Live Event organizers, GES has the exclusive right to provide certain contracting services to participating exhibitors. This gives exhibitors a single point of contact to facilitate a timely, safe, and efficient move-in/out of a Live Event and to facilitate an organized, professional, during-show experience. GES also competes with other service providers to sell discretionary services to exhibitors. |
|
Exclusive Services |
|
Discretionary Services |
||
|
Event Organizers |
|
Corporate Brand Marketers |
|
Corporate Brand Marketers |
|
Event planning and production Look and feel design Layout and floor plan designs Furnishings and carpet Show traffic analysis Marketing and strategy Electrical distribution Cleaning Plumbing Overhead rigging Booth rigging
|
|
Material handling Electrical distribution Cleaning Plumbing Overhead rigging Booth rigging
|
|
Creative design and strategy Data analytics and insights Integrated marketing and pre/post event communications Event surveys Return on investment analysis Online management tools Attendee/exhibit booth traffic analysis Staff training Logistics/transportation Exhibit storage/refurbishment Furnishings and carpet Installation and dismantling labor Tradeshow program management
|
|
|
|
|
|
|
|
Exclusive Products |
|
Discretionary Products |
||
|
Event Organizers |
|
|
|
Corporate Brand Marketers |
|
Signage Common area structures
|
|
|
|
Custom exhibit design/construction Portable/modular exhibits and design Graphics and signage |
3
|
Event Technology |
|
Event accommodation solutions: •Researching and selection of local hotels •Negotiating and contracting •Room block management •Group reservation management •Rate integrity and monitoring •Marketing services •On-site services •Post-event reporting Registration and data analytics: •Registration and ticketing •Lead management •Reporting and analytics •Web-based enterprise-wide application •Software-as-a-service model or partial and fully managed options Event management tools: •Online ordering capabilities •Sponsorship management solutions •Content management systems •Live Event tracking |
|
Audio-visual |
|
•Video production •Lighting design •Digital studio services •Entertainment services and talent coordination •Projection mapping •Computer rental and support |
Seasonality and Show Rotation
GES’ exhibition and event activity can vary significantly from quarter to quarter and year to year depending on the frequency and timing of shows. Some shows are not held annually and some shift between quarters. Show rotation refers to shows that occur less frequently than annually, as well as annual shows that shift quarters from one year to the next. During 2019, GES reported its highest revenue during second and fourth quarters. During 2020, exhibition and event activity was largely cancelled or postponed after mid-March due to the COVID-19 pandemic.
Competition
In the Live Events industry, GES generally competes across all classes of services and all markets on the basis of discernible differences, value, quality, price, convenience, and service. GES has a competitive advantage through its worldwide network of resources, history of serving as an extension of clients’ teams, experienced and knowledgeable personnel, client focus, creativity, reliable execution, proprietary technology platforms, and financial strength. All known U.S. competitors and most international competitors are privately held companies that provide limited public information regarding their operations. GES’ primary competitor within its Core Services is a privately-held, U.S.-headquartered company; however, there is substantial competition from a large number of service providers in GES’ other service offerings.
Transformation Strategy
GES recently made structural changes to transform and streamline efforts to significantly free up capital, reduce costs, and create a lower and more variable cost structure focused on servicing GES’ more profitable market segments. In 2020, GES exited 21 leased facilities across its warehouse and office network and sold its San Diego area production warehouse. As additional leases come to an end at other facilities, GES will continue to evaluate its physical presence and potentially find additional opportunities to improve its cost structure. Additionally, GES outsourced capital-intensive services by closing its United Kingdom-based audio-visual services business, which will now be serviced by third parties in the United Kingdom, and outsourced the management, cleaning, and storage of aisle carpet in the U.S. As GES anticipates the gradual return of face-to-face Live Events, the company has partnered with a third-party staffing agency to roll out an industry-wide Flex Talent Pool program. Through this program, GES can offer flexible and temporary work opportunities for exhibition professionals as business operations return, while managing its costs.
4

Pursuit is an attractions and hospitality company that provides a collection of inspiring and unforgettable travel experiences in iconic destinations. From world-class attractions, distinctive lodges, and engaging tours in stunning national parks and renowned global travel locations, Pursuit’s elevated attraction and hospitality experiences enable visitors to discover and connect with these iconic destinations. With a strategic direction to build an expanding portfolio of extraordinary experiences, Pursuit remains focused on refreshing, improving, and growing its collection in outstanding places around the globe. Pursuit draws its guests from major markets, including the U.S., Canada, China, the United Kingdom, Australia/New Zealand, Asia Pacific, and Europe. Pursuit markets directly to consumers, as well as through distribution channels that include tour operators, tour wholesalers, destination management companies, and retail travel agencies. Pursuit comprises the following collections:
|
Banff Jasper Collection |
With over 120 years of history in Canada’s oldest national parks, the Banff Jasper Collection provides experiential travel experiences in the majestic Canadian Rockies. Featuring sun-swept lake cruises in Banff and Jasper National Parks, top-of-the-mountain views at the Banff Gondola, and glacier exploration at the toe of the Columbia Icefield, the collection offers visitors unique hotel experiences, attractions, culinary destinations, and retail offerings. The collection is also complemented by a robust sightseeing tour and transportation portfolio.
|
|
Alaska Collection |
From the dramatic and rugged landscapes of Denali National Park to the glaciers, fjords and lush vegetation surrounding Kenai Fjords National Park, the Alaska Collection offers wilderness tours and glacier cruises complemented by unique lodging experiences across some of Alaska’s most recognizable interior and southcentral landscapes. From the port town of Seward, to the authentic mountain town of Talkeetna to the end of the road in Denali National Park, Pursuit offers a collection of unique attractions and hotels, complemented by culinary and retail services.
|
|
Glacier Park Collection
|
Located in and around two stunning national parks, the Glacier Park Collection features lodging, culinary and retail experiences and attractions designed to enable guests to experience both Montana and Southern Alberta’s stunning outdoors. The collection’s unique portfolio of lodging surrounding Glacier and Waterton Lakes National Parks also includes three historic lodges built by the Great Northern Railroad along with RV and rustic cabin stays.
|
|
FlyOver Attractions |
Pursuit’s FlyOver flight ride attractions provide guests with an exhilarating flying experience over iconic natural wonders, hard to reach locations, and picturesque scenery. Utilizing state-of-the-art ride and audio-visual technology, each FlyOver experience features moving ride vehicles with six degrees of motion, multi-sensory special effects, and a spherical screen that provides guests with a flight across stunning landscapes. Special effects, including wind, mist and scents, combine with the ride’s motion to create an unforgettable visceral experience.
|
|
Sky Lagoon |
Pursuit’s Sky Lagoon is an oceanfront geothermal lagoon located in Reykjavik, Iceland. It is a seven-step experience inspired by the traditions of Icelandic bathing culture. The sky lagoon is anticipated to open in the second quarter of 2021. It will feature an ocean-side infinity-edge in addition to cold pool and sauna experiences. It will also feature an in-lagoon bar, dining experiences and retail offerings.
|
5
Pursuit’s collection of experiences focuses on four distinct lines of business. These include attractions, including food and beverage services and retail operations; hospitality, including food and beverage services and retail operations; transportation; and travel planning.
|
Attractions
|
Banff Jasper Collection |
|
|
Banff Gondola transports visitors to an elevation of over 7,000 feet above sea level to the top of Sulphur Mountain in Banff, Alberta, Canada offering an unobstructed view of the Canadian Rockies and overlooking the town of Banff and the Bow Valley. The Banff Gondola was a 2020 Trip Advisor Travelers Choice award winner and the Sky Bistro restaurant, which is located at the top of the Banff Gondola, is currently #1 of 104 restaurants in Banff on Trip Advisor.
|
|
|
|
Lake Minnewanka Cruise provides guests a unique sightseeing experience through interpretive boat cruises on Lake Minnewanka in the Canadian Rockies. The Lake Minnewanka Cruise operations are located adjacent to the town of Banff and include boat tours, small boat rentals, and charter fishing expeditions.
|
|
|
|
Columbia Icefield Adventure is a tour of the Athabasca Glacier on the Columbia Icefield, and provides guests a view of one of the largest accumulations of ice and snow south of the Arctic Circle. Guests ride in a giant “Ice Explorer,” a unique vehicle specially designed for glacier travel.
|
|
|
|
Columbia Icefield Skywalk is a 1,312-foot guided interpretive walkway with a 98-foot glass-floored observation area overlooking the Sunwapta Valley, near our Columbia Icefield Adventure attraction in Jasper National Park, Alberta, Canada. Since opening in 2014, the Columbia Icefield Skywalk continues to win awards and receive international recognition for its innovative design and environmentally sound architecture, including the prestigious Governor General’s Medals in Architecture in 2016.
|
|
|
|
Maligne Lake Cruise provides interpretive boat tours at Maligne Lake, the largest lake in Jasper National Park, Alberta, Canada. In addition to boat tours, Maligne Lake has a marina and day lodge that offers food and beverage and retail services, an historic chalet complex and boat house that offers canoes, kayaks, and rowboats for rental.
|
|
6
|
|
Open Top Touring is Pursuit’s newest attraction that opened in September 2020. Open Top Touring offers guests a guided scenic tour of Banff, including the Bow River, Tunnel Mountain, the Banff Center, and Mount Norquay. Guests ride in a vintage-style 1930s coach, which includes a fully open roof and a guide in period costume.
|
|
|
Alaska Collection |
|
|
|
Kenai Fjords Tours is a leading Alaska wildlife and glacier day cruise, offering guests unforgettable sights of towering glaciers, humpback and grey whales, orcas, arctic birdlife, sea lions, seals, and porpoises of Kenai Fjords National Park. Tours range from a few hours to full days, with some tours including a full meal of wild Alaskan salmon, prime rib, and Alaskan King Crab on Fox Island. |
|
|
|
Sky Lagoon |
|
|
|
Sky Lagoon is a 230-foot premium oceanfront geothermal lagoon. Located in Kársnes Harbour, Kópavogur, just minutes from Reykjavik’s vibrant city centre and iconic urban landmarks, the sky lagoon will showcase expansive ocean vistas punctuated by awe-inspiring sunsets, Northern Lights, and dark sky views. Development of the sky lagoon began in 2019 with the anticipated opening in the second quarter of 2021.
|
|
|
|
FlyOver Attractions |
|
|
|
FlyOver flight ride attractions provide guests with an exhilarating flying experience over iconic natural wonders, hard to reach locations, and picturesque scenery. Utilizing state-of-the-art ride and audio-visual technology, each FlyOver experience features moving ride vehicles with six degrees of motion and multi-sensory special effects before a spherical screen. •FlyOver Canada is located along Vancouver’s waterfront in the heart of downtown. •FlyOver Iceland is located in Reykjavik’s Grandi Harbour District •FlyOver Las Vegas is scheduled to open during the third quarter of 2021. It is located on Las Vegas Boulevard in Las Vegas, Nevada. •FlyOver Canada Toronto is scheduled to open near the end of 2023. It will be located at the base of the CN Tower in Toronto’s Entertainment District. |
|
7
|
Hospitality |
Banff Jasper Collection |
|
|
•Elk + Avenue Hotel (164 rooms) •Mount Royal Hotel (133 rooms) •Glacier View Lodge (32 rooms) •Sawridge Inn & Conference Centre (152 rooms) •Lobstick Lodge (139 rooms) •Chateau Jasper Hotel (119 rooms) •Marmot Lodge (107 rooms) •The Crimson Hotel (99 rooms) •Pyramid Lake Resort (62 rooms) •Pocahontas Cabins (56 rooms) |
|
|
Hospitality |
Alaska Collection |
|
|
•Denali Backcountry Lodge (42 rooms) •Denali Cabins (46 rooms) •Talkeetna Alaskan Lodge (212 rooms) •Windsong Lodge (216 rooms) •Kenai Fjords Wilderness Lodge (8 rooms) |
|
|
|
Glacier Park Collection |
|
|
|
•Glacier Park Lodge (162 rooms) •Grouse Mountain Lodge (145 rooms) •St. Mary Lodge (116 rooms) •Prince of Wales Hotel (86 rooms) •Apgar Village Lodge (48 rooms) •West Glacier Motel & Cabins (32 rooms) •Glacier Basecamp Lodge (32 rooms) •Belton Chalet (27 rooms) •Motel Lake McDonald (27 rooms) •West Glacier RV Park & Cabins (20 rooms) |
|
|
Transportation
|
|
The Banff Jasper Collection: Transportation operations include sightseeing tours, airport shuttle services, and seasonal charter motorcoach services. The sightseeing services include seasonal half- and full-day tours from Calgary, Banff, Lake Louise, and Jasper, Canada and bring guests to the most scenic areas of Banff, Jasper, and Yoho National Parks. The charter business operates a fleet of luxury motorcoaches, available for groups of any size, for travel throughout the Canadian provinces of Alberta and British Columbia during the winter months.
Alaska Collection: Transportation includes a Denali Backcountry Adventure, which is a unique photo safari tour 92 miles deep into Denali National Park.
|
|
Travel Planning
|
|
The Banff Jasper Collection: Travel planning services include a full suite of corporate and event management services for meetings, conferences, incentive travel, sports, and special events. Event-related service offerings include staffing, off-site events, tours/activities, team building, accommodations, event management, theme development, production, and audio-visual services. The Banff Jasper Collection also owns and operates eight Pursuit Adventure Centers, which help guests book their leisure activities in Banff and Jasper National Parks.
Alaska Collection: Travel planning services provide complete travel planning services throughout Alaska. |
8
Seasonality
Pursuit experiences peak activity during the summer months. During 2019, 85% of Pursuit’s revenue was earned in the second and third quarters. During 2020, we experienced lower visitation to Pursuit’s properties due to the COVID-19 pandemic as travel restrictions and border closures largely remained in place. To help reduce the spread of COVID-19, Pursuit’s year-round attractions (the Banff Gondola, FlyOver Canada, and FlyOver Iceland) and year-round lodging properties (Elk + Avenue Hotel, the Mount Royal Hotel, the Mountain Park Lodges, Grouse Mountain Lodge, and Glacier Basecamp Lodge) were closed temporarily starting in mid-March and remained closed during most of the second quarter of 2020. We phased in most of Pursuit’s attractions and lodging operations starting in May 2020 with the majority of properties open and operational during the third quarter of 2020, although at reduced capacities. We seasonally closed our non-year-round properties during the fourth quarter of 2020; however, temporary government mandated closures occurred at FlyOver Canada and FlyOver Iceland during the fourth quarter.
Competition
Pursuit generally competes based on location, uniqueness of facilities, service, quality, and price. Competition exists both locally and regionally across all four lines of business. The hospitality industry has a large number of competitors and competes for leisure travelers (both individual and tour groups) across the U.S. and Canada. Pursuit’s competitive advantage is its distinctive attractions, iconic destinations, and strong culture of hospitality and guest services.
Growth Strategy
Pursuit’s growth strategy is to become a leading attractions hospitality company through its Refresh-Build-Buy initiatives:
|
|
• |
Refresh. Refreshing our existing assets and processes to optimize guest experience, market position, and maximize returns |
|
|
• |
Build. Building new assets that create new guest experiences and additional revenue streams with economies of scale and scope |
|
|
• |
Buy. Buying strategic assets that drive guest experience, economies of scale and scope, and improving financial performance |
We continue to search for opportunities to acquire or to build high return tourism assets in iconic natural and cultural destinations that enjoy perennial demand, bring meaningful scale and market share, and offer cross-selling advantages with a combination of attractions and hotels.
Recent Pursuit Developments
In order to mitigate the negative financial and operational impacts due to the COVID-19 pandemic, we reduced all non-essential capital expenditures during most of 2020 resulting in the delay of the opening of FlyOver Canada Toronto, which is now anticipated to open near the end of 2023. We resumed important growth investments in September of 2020, and we now anticipate opening the Sky Lagoon in the second quarter of 2021 and FlyOver Las Vegas in the third quarter of 2021.
In January 2020, we purchased the Glacier Basecamp Lodge, which is located in Columbia Falls, Montana just 15 miles from the west entrance to Glacier National Park and includes 32 rooms and cabins.
In September 2020, we opened Pursuit’s newest attraction, Open Top Touring. It is a guided scenic tour of Banff in Alberta, Canada and guests ride in a fully open roof of a vintage-style 1930s coach.
Intellectual Property
Our intellectual property rights (including trademarks, patents, copyrights, registered designs, technology, and know-how) are material to our business.
We own or have the right to use numerous trademarks and patents in many countries. Depending on the country, trademarks remain valid for as long as we use them, or as long as we maintain their registration status. Trademark registrations are generally for renewable, fixed terms. We also have patents for current and potential products. Our patents cover inventions ranging from a modular structure having a load-bearing surface that we use in our event and exhibition services, to a surface-covering installation tool and method that reduces our labor costs and improves worker safety. Our U.S. issued utility patents extend for 20 years from the patent application filing date, and our U.S. issued design patents are currently granted for 14 years from the grant date. We also have an extensive design library. Many of the designs have copyright protection and we have also registered many of the copyrights. In the U.S., copyright protection is for 95 years from the date of publication or 120 years from creation, whichever is shorter. While we believe that certain of our patents, trademarks, and copyrights have substantial value, the loss of any one of them would not have a material adverse effect on our financial condition or results of operations.
9
Our Trademarks
Our U.S. registered trademarks and trademarks pending registration include Global Experience Specialists & design®, GES®, GES Servicenter®, GES National Servicenter®, GES MarketWorks®, GES Measurement & Insight®, GES Project Central, The Art and Science of Engagement®, Trade Show Rigging TSR®, TSE Trade Show Electrical & design®, Earth Explorers®, Compass Direct®, ethnoMetrics®, eXPRESSO®, FIT®, ON Services, a GES Company & design®, ON Site Audio Visual & design®, FLYOVER® & design, FLYOVER Canada & design®, FLYOVER Iceland & design®, eco-sense®, ONPEAK®, Mount Royal, Above Banff®, Alaska Denali Travel®, Alaska Denali Escapes®, Alaska Heritage Tours®, by Pursuit, Kenai Fjords Tours & design®, Kenai Fjords Wilderness Lodge® & design, Seward Windsong Lodge & design®, Talkeetna Alaskan Lodge®, Explore Rockies®, Denali Backcountry Adventure®, Denali Backcountry Lodge®, and Denali Cabins & design®.
We also own or have the right to use many registered trademarks and trademarks pending registration outside of the U.S., including GES®, ShowTech®, Poken®, Visit®, Visit by GES®, Blitz, a GES Company & design®, Brewster Inc. & design®, Brewster Attractions Explore & design®, Brewster Hospitality Refresh & design®, Glacier Skywalk®, Above Banff®, Explore Rockies®, FLYOVER & design®, FLYOVER ICELAND & design, FLYOVER Canada & design, GES Event Intelligence AG®, Pursuit®, by Pursuit®, Ský Lagoon®, Soaring Over Canada®, Elk + Avenue Hotel®, Brewster Epic Summer Pass®, and escape.connect.refresh.explore®.
Government Regulation and Compliance
The principal rules and regulations affecting our day-to-day business relate to transportation (such as regulations promulgated by the U.S. Department of Transportation and its state counterparts), our employees (such as regulations implemented by the Occupational Safety and Health Administration, equal employment opportunity laws, guidelines implemented pursuant to the Americans with Disabilities Act, and general federal and state employment laws), unionized labor (such as guidelines imposed by the National Labor Relations Act), U.S. and Canadian regulations relating to national parks (such as regulations established by Parks Canada, the U.S. Department of the Interior, and the U.S. National Park Service), and U.S. and Canadian regulations relating to boating (such as regulations implemented by the U.S. and Canadian Coast Guard and state boating laws).
Our current and former businesses are subject to federal and state environmental regulations. Compliance with these provisions, and environmental stewardship generally, is key to our ongoing operations. To date, these provisions have not had, and we do not expect them to have, a material effect on our results of current and discontinued operations.
On July 18, 2020, an off-road Ice Explorer operated by our Pursuit business was involved in an accident while enroute to the Athabasca Glacier, resulting in three fatalities and multiple other serious injuries. We continue to support the victims and their families, and we are fully cooperating with the applicable regulatory authorities to investigate this accident.
Human Capital
Our business strategy focuses on providing superior experiential services to our customers to generate financial results that create attractive returns on invested capital to our shareholders. We employ the highest quality individuals who embody our values, provide innovative leadership, and deliver superior guest experiences and client services. We are committed to providing great places to work that are diverse and inclusive, creating safe and environmentally conscious experiential services, and giving back to our communities.
We had the following number of employees as of December 31, 2020:
|
|
|
Number of Employees (1) |
|
|
|
GES |
|
|
828 |
|
|
Pursuit |
|
|
836 |
|
|
Viad Corporate |
|
|
33 |
|
|
Total |
|
|
1,697 |
|
|
(1) |
Includes 104 employees covered by collective bargaining agreements and excludes seasonal or temporary employees. The employees covered by collective bargaining agreements are largely used to staff our shows, events, and production facilities pursuant to business demands. We believe that relations with our employees are good and that collective bargaining agreements expiring in 2021 will be renegotiated in the ordinary course of business without adverse effects on our operations. |
GES hires temporary employees on a show-by-show basis, including operations and exhibitor service positions. The number of temporary employees fluctuates depending on the size and location of the exhibition or event. Pursuit hires approximately 2,000 seasonal employees, or 70% of its total workforce, during the peak summer months to help operate its attractions and hospitality properties.
We are governed by a Board of Directors comprising eight non-employee directors and one employee director, and we have an executive management team with five executive officers.
10
Safety and well-being:
The safety and well-being of team members and guests is a leading core value. We believe that maintaining strong standards of health and safety improves employee productivity and operational efficiency and enhances employee well-being. Our employees have a responsibility to maintain a safe and healthy work environment. We take prompt action to correct unsafe or hazardous conditions; we promptly report work-related accidents and injuries in accordance with established procedures; we follow all established work rules related to safety; we ensure that our workers understand the risks, know how to handle hazardous products safely, and are familiar with available information for all hazardous materials used. In response to mitigating the spread of the COVID-19 virus, we implemented enhanced health and safety protocols including employees working from home and additional safety measures for employees continuing critical on-site work. Our Experience Modification Rating assigned by the National Council on Compensation Insurance was 0.77 as of December 31, 2020 and 0.87 as of December 31, 2019, which is considered a rating of better than average.
Compliance and Ethics
As leaders in the live event and adventure travel industries, we uphold and are dedicated to being a responsible corporate citizen and a good steward of our environment. This is reinforced every day in our businesses through our Always Honest Compliance and Ethics Program. Our Always Honest Program was established in 1994 and is our guide to operating with integrity. The Always Honest Program guides our employees in conducting themselves on behalf of the Company, with each other, and with everyone the Company partners with. It guides employees to act honestly, ethically, and always in compliance with the law. We believe that maintaining a culture of high ethical standards gives us a distinct advantage in recruiting and retaining top talent, driving the best value for our customers, and attracting shareholders.
Community involvement:
Giving back to the community is very important to us. We are committed to making a positive impact within the communities we serve through educational programs such as GES’ Exhibition Sponsorships, volunteer services, and environmental/economic sustainable efforts in the community. Many of our offices pull together to volunteer and support local and national organizations. For example, Pursuit was the first corporate donor to Banff Canmore Community Foundation’s “Funding the Future” campaign reinforcing our commitment to the Bow Valley community. Also, in response to the COVID-19 pandemic and the temporary closure of Pursuit’s operations, Pursuit quickly developed an at-cost, ready-made meal program for its staff and community members in Banff and Jasper. Led by Pursuit’s food and beverage team and staffed by volunteers from across its operations, more than 20,000 takeaway meals were served to the communities.
Diversity, equity, and inclusion:
Our team includes people from different backgrounds, all of whom contribute to our continued success. We do not discriminate against employees or applicants based on race, color, age, disability, ethnicity, citizenship, religion, sex, national origin, sexual orientation, genetics or genetic information, or any other categories protected by law. Our emphasis on equality permeates throughout the organization and helps drive our success. For example, Pursuit conducted its first diversity, equity, and inclusion survey in 2020. Pursuit’s Promise to People census was designed to help us understand, recognize, and respect the diversity we have within our team. The key learnings from this voluntary survey are shaping our training and development plans for 2021 and beyond.
Rewards and Performance Management:
Beyond a competitive salary, we offer a range of healthcare benefits to full-time employees, their spouses, and dependents. We encourage our employees to grow professionally, with perks like tuition reimbursement, ongoing training, and internal career opportunities. We utilize a Performance Management Cycle, which provides a framework of six continuous steps designed to maximize performance and cultivate talent consisting of: SMART Goals (Specific, Measurable, Achievable, Realistic/Relevant, and Time-bound); Coaching and Recognition; Learning and Development; Quarterly Checkpoints; Annual Performance Appraisal; and Performance and Rewards Alignment. Salary increases are based on merit. Short- and long-term incentive compensation for senior managers and executives is based on the Company’s and/or stock performance.
Available Information
We were incorporated in Delaware in 1991. Our common stock trades on the New York Stock Exchange under the symbol “VVI.”
Our website address is www.viad.com. All of our SEC filings, including our Annual Reports on Form 10-K, quarterly reports on Form 10-Q, current reports on Form 8-K, and amendments to those reports, are available free of charge on our website as soon as reasonably practicable after we electronically file that material with, or furnish it to, the SEC. The information contained on our website is neither a part of, nor incorporated by reference into, this 2020 Form 10-K.
11
Our investor relations website is www.viad.com/investors/investor-center/default.aspx and includes key information about our corporate governance initiatives, including our Corporate Governance Guidelines, our Board of Directors committee charters, our Code of Ethics, and information concerning our Board members and how to communicate with them.
Item 1A. Risk Factors
Our operations and financial results are subject to known and unknown risks. As a result, past financial performance and historical trends may not be reliable indicators of our future performance.
Macroeconomic Risks
The COVID-19 pandemic and related responsive actions have adversely affected our financial condition, liquidity, and cash flow, and may continue to do so in the future. The COVID-19 pandemic forced the cancellation of many of our events and the temporary closure of substantially all of our attractions, hotels, and other operations. The substantial reduction in our operations has and will result in near-term losses and negative cash flow from operations. The full impact of the pandemic on our longer-term operational and financial performance is highly uncertain and will depend on future developments that we cannot predict, including the duration and spread of the pandemic, any future resurgences of COVID-19, and related social-distancing orders, travel restrictions, and/or government limitations on group gatherings. Our GES business depends on exhibitions, conferences, and other live events and the size of marketing expenditures relating to those events. The continuation of government orders prohibiting large group gatherings will continue to significantly and adversely affect our revenue and results of operations. Even if exhibitions or other live events do occur, we also could suffer from reduced spending for our services because many exhibitors’ marketing budgets are partly discretionary and are frequently among the first expenditures reduced when economic conditions deteriorate, and people may be unwilling to attend large group events.
In addition, the attractions and hospitality operations within our Pursuit business may be subject to government closure orders designed to limit the spread of COVID-19, which adversely affects our profitability and cash flow. Future revenue from our Pursuit operations will depend on any further spread of the virus, our ability to keep our operations open, the willingness of people to travel to our locations, and the amount of disposable income that consumers have available for travel and vacations, which decreases during periods of weak general economic conditions. Both our GES and Pursuit businesses may also experience increased costs in order to supply our customers or guests with personal protection equipment, conduct comprehensive cleaning regimens, and other measures that we determine are in the best interests of our employees, customers, guests, and/or event participants. Even with additional personal protection measures in place, there can be no assurance that employees, customers, guests, and/or event participants will not contract COVID-19. Any such occurrence could result in litigation, legal costs, and reputational risk. The potential adverse COVID-19 impacts to our businesses could have a correspondingly negative effect on our overall liquidity. Our revolving credit facility contains a minimum liquidity requirement that requires us to maintain a minimum level of cash and cash equivalents plus available debt capacity. If we are unable to maintain compliance with this minimum liquidity requirement, our lenders may exercise remedies against us, including the acceleration of our outstanding indebtedness. A prolonged recovery from the COVID-19 pandemic or a resurgence in cases of COVID-19 could further materially and adversely affect our business, financial condition, and results of operations.
Our businesses will face new challenges presented by the ramifications of the COVID-19 pandemic. In addition to the direct economic impacts of the pandemic, it is clear that as our businesses recover, they will be operating in new environments in light of societal, regulatory, and industry changes that have occurred since March 2020. Our ability to adjust to these changes and deliver expected business results may be hampered by ongoing uncertainty presented by the pandemic in terms of proper safety protocols, social norms, and a potential of uneven demand for our services. In addition, our ability to deliver such services and otherwise execute against our recovery and growth strategies may be impacted by the extreme reduction of our workforce over the past year and the resulting loss of knowledge of and experience in our businesses. Moreover, our go-forward strategy includes a heightened use of temporary employees in the delivery of our services, and while those employees will likely include those who were previously employed by us on a full-time basis, the level of execution may not be consistent with previous performance. Taken together, our ability to anticipate and adjust to these changes and new conditions may lead to additional costs, which may materially and adversely impact our business and results of operations.
We are vulnerable to deterioration in general economic conditions. Our business is particularly sensitive to fluctuations in general economic conditions in the U.S. and other global markets in which we operate, including as a result of the economic uncertainty caused by the COVID-19 pandemic. The success of our GES business largely depends on the number of exhibitions or other live events held, the size of marketing expenditures at those events, and on the strength of particular industries that support those events. The number and size of exhibitions generally decrease when the economy weakens, which our business has experienced due to the COVID-19 pandemic. We also could suffer from reduced spending for our services because many live event marketing budgets are partly discretionary and are frequently among the first expenditures reduced when economic conditions deteriorate. In addition, revenue from our Pursuit operations depends largely on the amount of disposable income that consumers have available for travel and vacations, which decreases during periods of weak general economic conditions. As a result, any deterioration in general economic conditions could further materially and adversely affect our business, product sales, financial condition, and results of operations.
12
Travel industry disruptions, particularly those affecting the hotel and airline industries, could adversely affect our business. Our business depends largely on the ability and willingness of people, whether exhibitors, event attendees, tourists, or others, to travel. Factors adversely affecting the travel industry, and particularly the airline and hotel industries, generally also adversely affect our business and results of operations. Factors that could adversely affect the travel industry include high or rising fuel prices, increased security and passport requirements, weather conditions, health epidemics and pandemics, airline accidents, acts of terrorism, and international political instability and hostilities. For example, the COVID-19 pandemic and social distancing orders resulted in severe global travel restrictions, mandatory shutdowns of event venues, hotels, attractions and other operations, and limitations on large gatherings of people. These circumstances had severe effects on our businesses. The occurrence of additional disruptions, a prolonged recovery from the COVID-19 pandemic or a spike or resurgence in cases of COVID-19, or other unexpected events that affect the availability and pricing of air travel and accommodations, could further materially and adversely affect our business and results of operations.
Transportation disruptions and increases in transportation costs could adversely affect our business and results of operations. GES relies on independent transportation carriers to send materials and exhibits to and from exhibition, warehouse, and customer facilities. If our customers and suppliers are unable to secure the services of those independent transportation carriers at favorable rates, it could materially and adversely affect our business and results of operations. In addition, disruption of transportation services due to weather-related problems, labor strikes, lockouts, or other events could adversely affect our ability to supply services to customers and could cause the cancellation of exhibitions, which could materially and adversely affect our business and results of operations.
Natural disasters, weather conditions, accidents, and other catastrophic events could negatively affect our business. The occurrence of catastrophic events ranging from natural disasters (such as hurricanes, fires, floods, and earthquakes), acts of war or terrorism, accidents involving our travel offerings or experiences, the effects of climate change, including any impact of global warming, or the prospect of these events could disrupt our business. Changes in climates may increase the frequency and intensity of adverse weather patterns and make certain destinations less desirable.
Such catastrophic events have, and could have, an adverse impact on Pursuit, which is heavily dependent on the ability and willingness of its guests to travel and/or visit our attractions. Pursuit guests tend to delay or postpone vacations if natural conditions differ from those that typically prevail at competing lodges, resorts, and attractions, and catastrophic events and heightened travel security measures instituted in response to such events could impede the guests’ ability to travel, and interrupt our business operations, including damaging our properties. For example, the accident on July 18, 2020, at Pursuit’s Columbia Icefield attraction, which involved one of our off-road Ice Explorers and resulted in three fatalities and other serious injuries, may have a negative impact on our reputation and traveler willingness to visit that attraction in the future. We continue to support the victims and their families, and we are fully cooperating with applicable regulatory authorities to investigate the accident. This accident has affected the results of operations of Pursuit, and future developments relating to that incident could continue to impact us negatively.
Such catastrophic events could also have a negative impact on GES, causing a cancellation of exhibitions and other events held in public venues or disrupt the services we provide to our customers at convention centers, exhibition halls, hotels, and other public venues. Such events could also have a negative impact on GES’ production facilities, preventing us from timely completing exhibit fabrication and other projects for customers. In addition, unfavorable media attention, or negative publicity, in the wake of any catastrophic event or accident could damage our reputation or reduce the demand for our services. If the conditions arising from such events persist or worsen, they could materially and adversely affect our results of operations and financial condition.
Strategic, Business, and Operational Risks
Completed acquisitions may not perform as anticipated or be integrated as planned. We regularly evaluate and pursue opportunities to acquire businesses that complement, enhance, or expand our current business, or offer growth opportunities. Our acquired businesses might not meet our financial and non-financial expectations or yield anticipated benefits. Our success depends, in part, on our ability to conform controls, policies and procedures, and business cultures; consolidate and streamline operations and infrastructures; identify and eliminate redundant and underperforming operations and assets; manage inefficiencies associated with the integration of operations; and retain the acquired business’s key personnel and customers. Moreover, our acquisition activity may subject us to new regulatory requirements, distract our senior management and employees, and expose us to unknown liabilities or contingencies that we may fail to identify prior to closing. If we are forced to make changes to our business strategy or if external conditions adversely affect our business operations, including the duration and impact of COVID-19, we may be required to record additional future impairment charges, as we did in the first and second quarters of 2020. Additionally, we may borrow funds to finance strategic acquisitions. Debt leverage resulting from future acquisitions would reduce our debt capacity, increase our interest expense, and limit our ability to capitalize on future business opportunities. Such borrowings may also be subject to fluctuations in interest rates. Any of these risks could materially and adversely affect our business, product and service sales, financial condition, and results of operations.
We depend on our large exhibition event clients to renew their service contracts and on our exclusive right to provide those services. GES has a number of large exhibition event organizers and large customer accounts. If any of these large clients do not renew their service contracts, our results of operations could be materially and adversely affected.
13
Moreover, when event organizers hire GES as the official services contractor, they usually also grant GES an exclusive right to perform material handling, electrical, rigging, and other services at the exhibition facility. However, some exhibition facilities have taken certain steps to in-source certain event services (either by performing the services themselves or by hiring a separate service provider) as a result of conditions generally affecting their industry, such as an increased supply of or reduced demand for exhibition space. If exhibition facilities choose to in-source certain event services, GES will lose the ability to provide certain event services, and our results of operations could be materially and adversely affected.
We operate in highly competitive and dynamic industries. Competition in the Live Events markets is driven by price and service quality, among other factors. To the extent competitors seek to gain or retain market presence through aggressive underpricing strategies, we may be required to lower our prices and rates to avoid the loss of related business. Moreover, customer consolidations and other actions have caused downward pricing pressure for our products and services and could affect our ability to negotiate favorable terms with our customers. If we are unable to anticipate and respond as effectively as our competitors to changing business conditions, including new technologies and business models, we could lose market share. Our inability to meet the challenges presented by the competitive and dynamic environment of our industry could materially and adversely affect our results of operations.
New capital projects may not be commercially successful. From time to time, we pursue capital projects, such as our current construction of FlyOver Las Vegas, FlyOver Canada Toronto, the Sky Lagoon, and other efforts to upgrade some of our Pursuit offerings, in order to enhance and expand our business. Capital projects are subject to a number of risks, including unanticipated delays, cost overruns, and the failure to achieve established financial and strategic goals, as well as additional project-specific risks. For example, we recently had to delay FlyOver Canada Toronto due to poor market conditions as a result of the COVID-19 pandemic and a need to preserve capital. Some of our other capital projects, such as Sky Lagoon and FlyOver Las Vegas, have also been impacted by the COVID-19 pandemic. Although Sky Lagoon and FlyOver Las Vegas are on track to open in 2021, and FlyOver Canada Toronto’s opening is planned for 2023, these attractions may be further delayed by market conditions as a result of the COVID-19 pandemic. A prolonged delay in these capital projects, or our failure to accurately predict the revenue or profit that will be generated from these projects, could prevent them from performing in accordance with our commercial expectations and could materially and adversely affect our future success, business, and results of operations.
The seasonality of our business makes us particularly sensitive to adverse events during peak periods. The peak activity for our Pursuit business is during the summer months, as the vast majority of Pursuit’s revenue is earned in the second and third quarters. Our GES exhibition and event activity varies significantly because it is based on the frequency and timing of shows, many of which are not held each year, and which may shift between quarters. If adverse events or conditions occur during these peak periods, such as the COVID-19 pandemic or natural disasters such as forest fires, our results of operations could continue to be materially and adversely affected.
Liabilities relating to prior and discontinued operations may adversely affect our results of operations. We and our predecessors have a corporate history spanning decades and involving diverse businesses. Some of those businesses owned properties and used raw materials that have been, and may continue to be, subject to litigation. Moreover, some of the raw materials used and the waste produced by those businesses have been and are the subject of U.S. federal and state environmental regulations, including laws enacted under the Comprehensive Environmental Response, Compensation and Liability Act, or its state law counterparts. In addition, we may incur other liabilities resulting from indemnification claims involving previously sold properties and subsidiaries, or obligations under defined benefit plans or other employee plans, as well as claims from past operations of predecessors or their subsidiaries. Although we believe we have adequate reserves and sufficient insurance coverage to cover those potential liabilities, future events or proceedings could render our reserves or insurance protections inadequate, any of which could materially and adversely affect our business and results of operations.
Show rotation affects our profitability and makes comparisons between periods difficult. GES results are largely dependent upon the frequency, timing, and location of exhibitions and events. Some large exhibitions are not held annually (they may be held once every two, three, or four years) or may be held at different times of the year from when they were previously held. In addition, the same exhibition may change locations from year to year resulting in lower margins if the exhibition shifts to a higher-cost location. Any of these factors could cause our results of operations to fluctuate significantly from quarter to quarter or from year to year, making periodic comparisons difficult.
We are subject to currency exchange rate fluctuations. We have operations outside of the U.S. primarily in Canada, the United Kingdom, Iceland, the Netherlands, and Germany. During 2020 and 2019, GES EMEA, GES Canada, and Pursuit’s international operations accounted for approximately 30% and 33% of our consolidated revenue, respectively, and 36% and 66% of our segment operating income and loss, respectively. Consequently, a significant portion of our business is exposed to currency exchange rate fluctuations. We do not currently hedge equity risk arising from the translation of non-U.S. denominated assets and liabilities. Our financial results and capital ratios are sensitive to movements in currency exchange rates because a large portion of our assets, liabilities, revenue, and expenses must be translated into U.S. dollars for reporting purposes. The unrealized gains or losses resulting from the currency translation are included as a component of accumulated other comprehensive income (loss) in our Consolidated Balance Sheets. We also have certain loans in currencies other than the entity’s functional currency, which results in gains or losses as exchange rates
14
fluctuate. As a result, significant fluctuations in currency exchange rates could result in material changes to the net equity position we report in our Consolidated Balance Sheets and could adversely affect our results of operations.
Changes affecting the availability of the London Inter-bank Offered Rate (“LIBOR”) and the Canadian Dollar Offered Rate (“CDOR”) or increases in interest rates may have consequences for us that cannot yet be reasonably predicted. We have outstanding debt with variable interest rates based on LIBOR and CDOR. Borrowings under the 2018 Credit Facility are indexed to the prime rate or LIBOR, plus appropriate spreads tied to our leverage ratio. The LIBOR benchmark has been the subject of national, international, and other regulatory guidance and proposals to reform. In July 2017, the United Kingdom Financial Conduct Authority (the authority that regulates LIBOR) announced that it intends to stop compelling banks to submit rates for the calculation of LIBOR after 2021. These reforms may cause LIBOR to perform differently than in the past and LIBOR may ultimately cease to exist after 2021.
However, on November 30, 2020, the ICE Benchmark Administration, the administrator of LIBOR, announced plans to consult on ceasing publication of U.S. dollar LIBOR tenors on December 31, 2021 for only the one-week and two-month U.S. dollar LIBOR tenors, and on June 30, 2023 for all other U.S. dollar LIBOR tenors. In 2017, the Alternative Reference Rates Committee announced that the Secured Overnight Financing Rate (“SOFR”), a broad measure of the cost of borrowing cash overnight collateralized by Treasury securities, as its preferred alternative to LIBOR. In November 2020, Refinitiv, the administrator of the CDOR, announced that it will abandon the six-month and 12-month CDOR tenors effective May 17, 2021. All other CDOR tenors will be available for the foreseeable future. The Canadian Alternative Reference Rate Committee is promoting the use of the Canadian Overnight Repo Rate Average (“CORRA”) as the preferred alternative to the CDOR. Our 2018 Credit Facility includes a method for determining an alternative or successor rate of interest that gives consideration to the new prevailing market convention. The alternative rate could affect our debt and debt payments. At this time, it is not possible to predict the effect of any changes to LIBOR or CDOR, any phase out of LIBOR or CDOR or any establishment of alternative benchmark rates. Any new benchmark rate will likely not replicate LIBOR or CDOR exactly, which could impact our contracts which terminate after 2021. There is uncertainty about how applicable law, the courts, or the Company will address the replacement of LIBOR or CDOR with alternative rates. When U.S. LIBOR ceases to exist after June 30, 2023, the interest rates under our revolving credit facility and the discount rates we apply to finance lease obligations will be based on the alternative rate, which may result in higher interest rates and debt obligations. In addition, any increases to our benchmark interest rates could have an uncertain impact on our cost of funds and our access to the capital markets, which could impact our results of operations and cash flows. Uncertainty as to the nature of such potential changes may also adversely affect the trading market for our securities.
Labor and Employment Risks
Our business is relationship driven. Our GES business is heavily focused on client relationships, and, specifically, on having close collaboration and interaction with our clients. To be successful, our account teams must be able to understand clients’ desires and expectations in order to provide top-quality service. If we are unable to maintain our client relationships, including due to the loss of key members of our account teams, we could also lose customers and our results of operations could be materially and adversely affected.
Our participation in multi-employer pension plans could substantially increase our pension costs. We sponsor a number of defined benefit plans for our U.S. and Canada-based employees. In addition, we are obligated to contribute to multi-employer pension plans under collective bargaining agreements covering our union-represented employees. We contributed $8.6 million in 2020, $27.3 million in 2019, and $26.4 million in 2018 to those multi-employer pension plans. Third-party boards of trustees manage these multi-employer plans. Based upon the information we receive from plan administrators, we believe that several of those multi-employer plans are underfunded. The Pension Protection Act of 2006 requires us to reduce the underfunded status over defined time periods. Moreover, we would be required to make additional payments of our proportionate share of a plan’s unfunded vested liabilities if a plan terminates, or other contributing employers withdraw, due to insolvency or other reasons, or if we voluntarily withdraw from a plan. In 2019, we withdrew from the underfunded Central States Pension Plan and accordingly, we recorded a charge of $15.5 million, which represents the estimated present value of future contributions we will be required to make as a result of the union’s withdrawal. At this time, we do not anticipate triggering any significant withdrawal from any other multi-employer pension plan to which we currently contribute. However, significant plan contribution increases could materially and adversely affect our consolidated financial condition, results of operations, and cash flows. Refer to Note 18 – Pension and Postretirement Benefits of the Notes to Consolidated Financial Statements (Part II, Item 8 of this 2020 Form 10-K) for further information.
Union-represented labor increases our risk of higher labor costs and work stoppages. Significant portions of our employees are unionized. We have approximately 100 collective bargaining agreements, and we are required to renegotiate approximately one-third of those each year. If we increase wages or benefits as a result of labor negotiations, either our operating margins will suffer, or we could increase the cost of our services to our customers, which could lead those customers to turn to other vendors with lower prices. Either event could materially and adversely affect our business and results of operations.
Additionally, if we are unable to reach an agreement with a union during the collective bargaining process, the union may strike or carry out other types of work stoppages. If that happens, we might be unable to find substitute workers with the necessary skills to perform many of the services, or we may incur additional costs to do so, both of which could materially and adversely affect our business and results of operations.
15
Cybersecurity and Data Privacy Risks
We are vulnerable to cybersecurity attacks and threats. We regularly collect and process credit, financial, and other personal and confidential information from individuals and entities who attend or participate in events and exhibitions that we produce, or who visit our attractions and other offerings. In addition, our devices, servers, computer systems, and business systems are vulnerable to cybersecurity risk, including cyberattacks, or we may be the target of email scams that attempt to acquire personal information and company assets. Despite our efforts to protect ourselves with insurance, and create security barriers to such threats, including regularly reviewing our systems for vulnerabilities and continually updating our protections, we might not be able to entirely mitigate these risks. Our failure to effectively prevent, detect, and recover from the increasing number and sophistication of information security threats could lead to business interruptions, delays or loss of critical data, misuse, modification, or destruction of information, including trade secrets and confidential business information, reputational damage, and third-party claims, any of which could materially and adversely affect our results of operations.
Laws and regulations relating to the handling of personal data are evolving and could result in increased costs, legal claims, or fines. We store and process the personally identifiable information of our customers, employees, and third parties with whom we have business relationships. The legal requirements restricting the way we store, collect, handle, and transfer personal data continue to evolve, and there are an increasing number of authorities issuing privacy laws and regulations. These data privacy laws and regulations are subject to differing interpretations, creating uncertainty and inconsistency across jurisdictions. Our compliance with these myriad requirements could involve making changes in our services, business practices, or internal systems, any of which could increase our costs, lower revenue, or reduce efficiency. Our failure to comply with existing or new rules could result in significant penalties or orders to stop the alleged noncompliant activity, litigation, adverse publicity, or could cause our customers to lose trust in our services. In addition, if the third parties we work with violate applicable laws, contractual obligations, or suffer a security breach, those violations could also put us in breach of our obligations under privacy laws and regulations. In addition, the costs of maintaining adequate protection, including insurance protection against such threats, as they develop in the future (or as legal requirements related to data security increase) are expected to increase and could be material. Any of these risks could materially and adversely affect our business and results of operations.
Item 1B. Unresolved Staff Comments
None.
Item 2. Properties
We lease our corporate headquarters in Phoenix, Arizona. Our other principal properties are owned or leased by GES and Pursuit.
GES primarily leases its properties, both domestically and internationally. GES properties consist of offices and multi-use facilities. Multi-use facilities include manufacturing, sales and design, office, storage and/or warehouse, and truck marshaling yards. Multi-use facilities vary in size up to approximately 677,800 square feet in the U.S. and approximately 136,000 square feet in the United Kingdom.
Pursuit primarily owns its properties, both domestically and internationally, and leases its properties related to the FlyOver attractions. Pursuit’s properties mainly include attractions, hotels and lodges, retail stores, and offices. Properties located in Canada and Iceland are subject to multiple long-term ground leases with their respective governments. For further information on Pursuit’s attractions and hospitality assets, refer to the Business Section (Part I, Item 1 of this 2020 Form 10-K).
We believe our owned and leased properties are adequate and suitable for our business operations and that capacity is sufficient for current needs. For additional information related to our lease obligations, refer to Note 12 – Debt and Finance Lease Obligations and Note 20 – Leases and Other of the Notes to Consolidated Financial Statements (Part II, Item 8 of this 2020 Form 10-K).
Item 3. Legal Proceedings
Refer to Note 21 – Litigation, Claims, Contingencies, and Other of the Notes to Consolidated Financial Statements (Part II, Item 8 of this 2020 Form 10-K) for information regarding legal proceedings in which we are involved, which information is incorporated by reference herein.
Item 4. Mine Safety Disclosures
Not applicable.
16
Other. Information about our executive Officers
Our executive officers as of the date of this 2020 Form 10-K were as follows:
|
Name |
|
Age |
|
Business Experience During the Past Five Years and Other Information |
|
Steven W. Moster |
|
51 |
|
President and Chief Executive Officer of Viad since 2014; President of GES from November 2010 to February 2019; prior thereto, held various executive management roles within the GES organization, including Executive Vice President-Chief Sales & Marketing Officer from 2008 to February 2010; Executive Vice President-Products and Services from 2006 to 2008; and Vice President-Products & Services Business from 2005 to 2006; and prior thereto, Engagement Manager, Management Strategy Consulting for McKinsey & Company, a global management consulting firm, from 2000 to 2004. Mr. Moster is a director of Cavco Industries, Inc (NASDAQ: CVCO), which designs and produces factory-built housing products, and serves as the Chair of the Compensation Committee. |
|
|
|
|
|
|
|
Ellen M. Ingersoll |
|
56 |
|
Chief Financial Officer since July 2002; prior thereto, Vice President-Controller or similar position since 2002; prior thereto, Controller of CashX, Inc., a service provider of stored value internet cards, from June 2001 through October 2001; prior thereto, Operations Finance Director of LeapSource, Inc., a provider of business process outsourcing, since January 2000; and prior thereto, Vice President and Controller of Franchise Finance Corporation of America, a real estate investment trust, from 1992 to 2000. |
|
|
|
|
|
|
|
David W. Barry |
|
58 |
|
President of Pursuit since June 2015; prior thereto, Chief Executive Officer and President of Trust Company of America, an independent registered investment adviser custodian, from 2011 to June 2015; prior thereto, Chief Executive Officer of Alpine/CMH, a helicopter skiing company, from 2007 to 2011; and prior thereto, Chief Operating Officer for all U.S. resort operations of Intrawest Corporation (formerly NYSE: IDR) (now Alterra Mountain Company) a North American mountain resort and adventure company, from 2004 to 2007. |
|
|
|
|
|
|
|
Derek P. Linde |
|
45 |
|
General Counsel and Corporate Secretary since 2018; prior thereto, Deputy General Counsel and Assistant Secretary at Illinois Tool Works Inc. (NYSE: ITW), a diversified manufacturer of specialized industrial equipment, from 2014 to 2018, and Associate General Counsel and Assistant Secretary from 2011 to 2014; prior thereto, a partner at the law firm of Winston & Strawn LLP, from 2008 to 2011, and an Associate from 2000 to 2008. |
|
|
|
|
|
|
|
Leslie S. Striedel
|
|
58 |
|
Chief Accounting Officer since 2014; prior thereto, Vice President of Finance from March 2014 to April 2014; prior thereto, Vice President of Finance and Administration or similar positions with Colt Defense LLC, a firearms manufacturer, from 2010 to 2013; prior thereto, Vice President of Finance, Director of Financial Reporting and Compliance, and Corporate Controller of White Electronics Designs Corp. (formerly NASDAQ: WEDC) (now a subsidiary of Microsemi Corporation, a wholly owned subsidiary of Microchip Technology Inc.), a circuits and semiconductors manufacturer, from 2004 to 2010; prior thereto, Corporate Controller of MD Helicopters, an international helicopter manufacturer, from 2002 to 2004; prior thereto, Corporate Controller of Fluke Networks (formerly Microtest, Inc. NASDAQ: MTST), a manufacturing and technology company, from 1999 to 2002; and prior thereto, Senior Tax Manager for KPMG LLP, a global firm providing audit, tax, and advisory services, from 1998 to 1999. |
Our executive officers’ term of office is until our next Board of Directors annual organization meeting to be held on May 14, 2021.
17
PART II
Item 5. Market for Registrant’s Common Equity, Related Stockholder Matters and Issuer Purchases of Equity Securities
Market Information
Our common stock is traded on the New York Stock Exchange under the symbol VVI.
Holders
As of February 15, 2021, there were 4,772 shareholders of record of our common stock, including 154 shareholders that had not converted their shares following a reverse stock split effective on July 1, 2004.
Issuer Purchases of Equity Securities
|
Period |
|
Total Number of Shares Purchased |
|
|
Average Price Paid Per Share |
|
|
Total Number of Shares Purchased as Part of Publicly Announced Plans or Programs |
|
|
Maximum Number of Shares That May Yet Be Purchased Under the Plans or Programs |
|
||||
|
October 1, 2020 - October 31, 2020 |
|
|
— |
|
|
$ |
— |
|
|
|
— |
|
|
|
546,283 |
|
|
November 1, 2020 - November 30, 2020 |
|
|
202 |
|
|
$ |
25.83 |
|
|
|
— |
|
|
|
546,283 |
|
|
December 1, 2020 - December 31, 2020 |
|
|
104 |
|
|
$ |
33.78 |
|
|
|
— |
|
|
|
546,283 |
|
|
Total |
|
|
306 |
|
|
$ |
28.53 |
|
|
|
— |
|
|
|
546,283 |
|
Pursuant to previously announced authorizations, our Board of Directors authorized us to repurchase shares of our common stock from time to time at prevailing market prices. Effective February 7, 2019, our Board of Directors authorized the repurchase of an additional 500,000 shares. No shares were repurchased on the open market during the three months ended December 31, 2020. The Board of Directors’ authorization does not have an expiration date. During the fourth quarter of 2020, certain previously owned shares of common stock were surrendered by employees, former employees, and non-employee directors for tax withholding requirements on vested share-based awards. In March 2020, our Board of Directors suspended future dividend payments and our share repurchase program for the foreseeable future.
18
Performance Graph
The following graph compares the change in the cumulative total shareholder return, from December 31, 2015 to December 31, 2020, on our common stock, the Standard & Poor’s SmallCap 600 Hotels, Restaurants & Leisure, the Standard & Poor’s SmallCap 600 Media Index, the Standard & Poor’s SmallCap 600 Commercial Services & Supplies Index, the Standard & Poor’s SmallCap 600 Index, the Russell 2000 Index, and Standard & Poor’s 500 Index (assuming reinvestment of dividends, as applicable). The graph assumes $100 was invested on December 31, 2015.
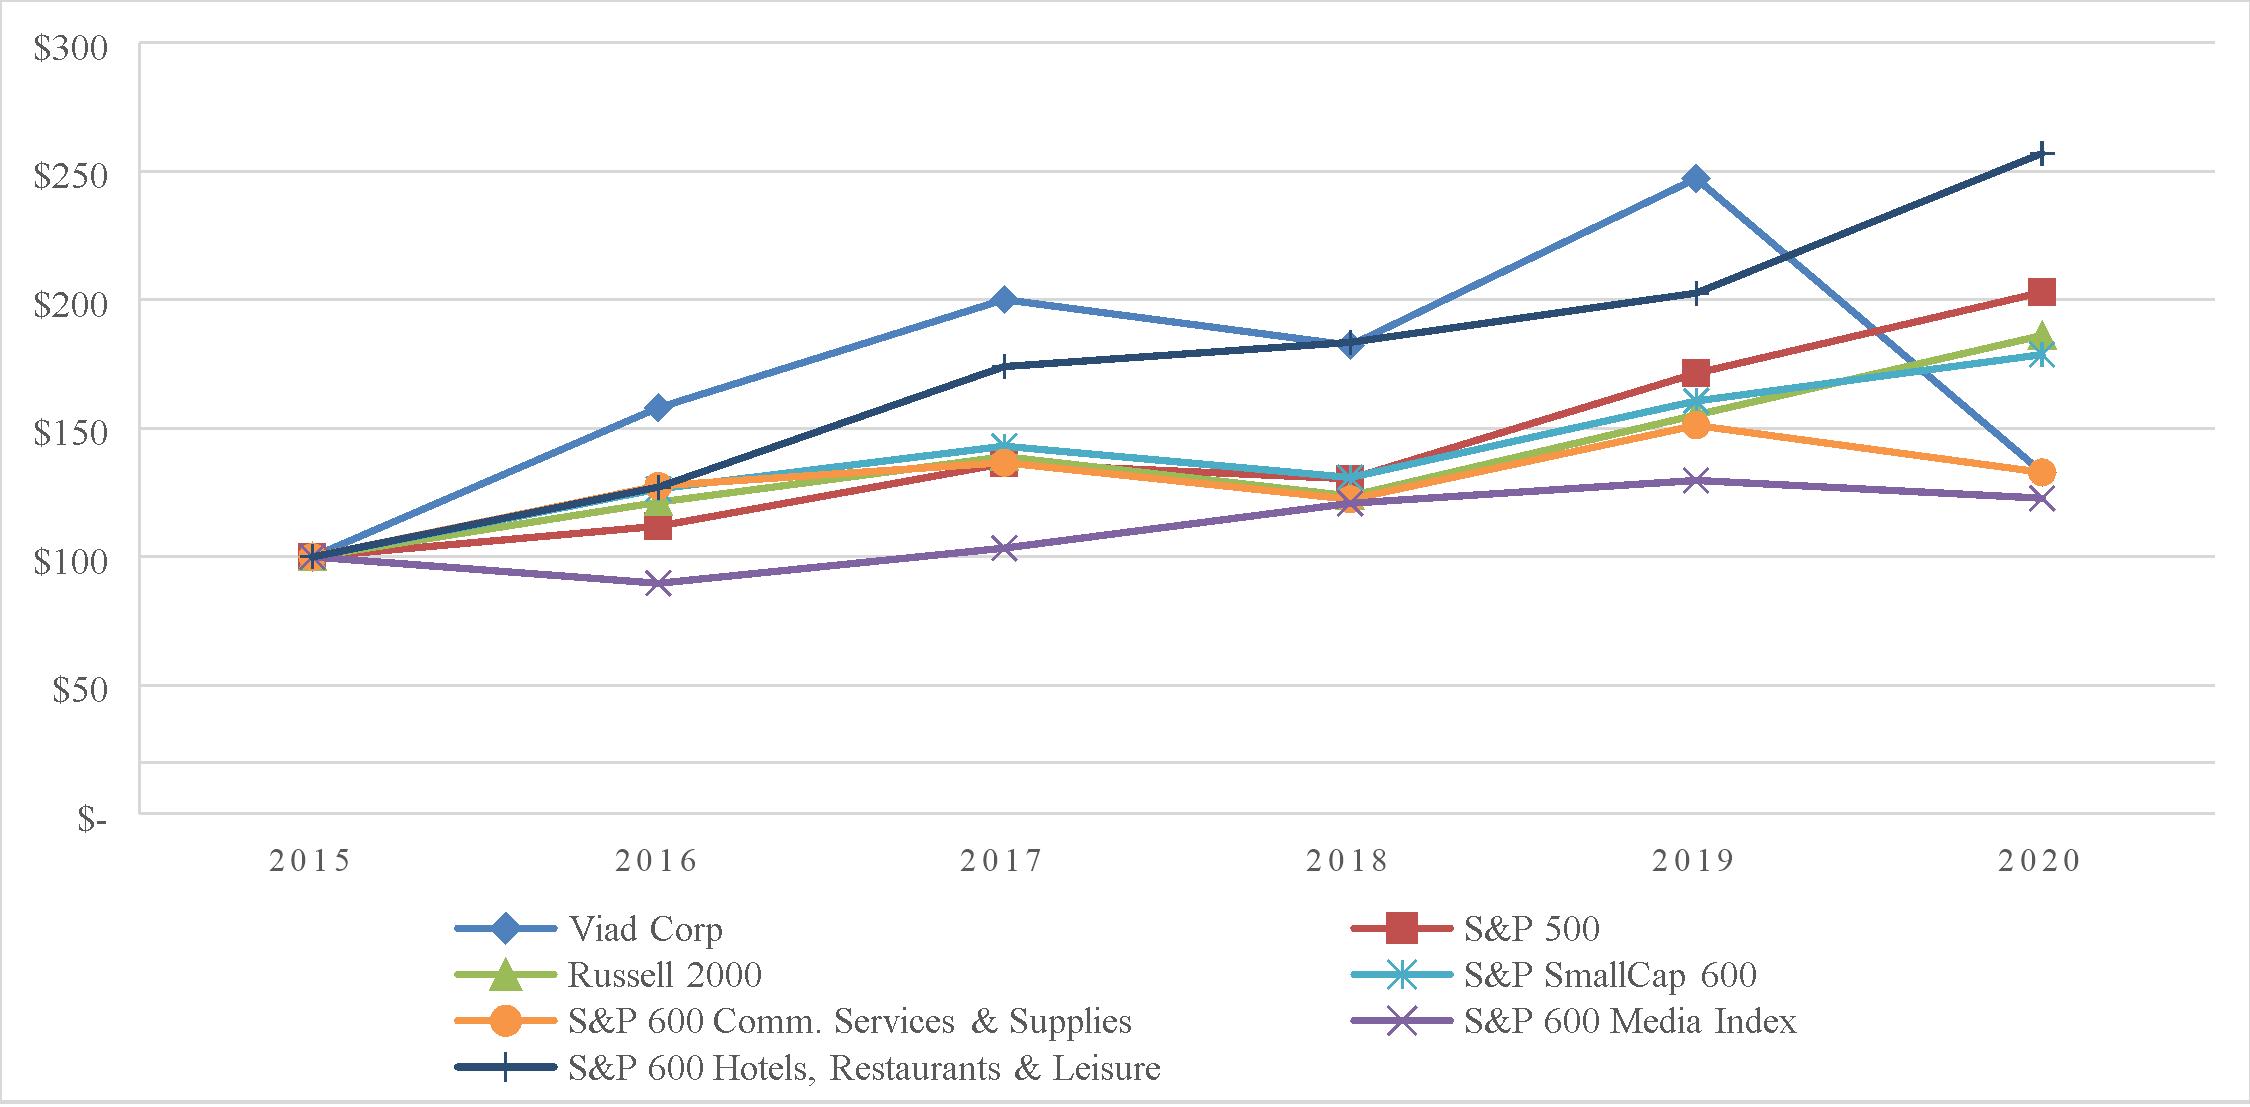
|
|
|
Year Ended December 31, |
|
|||||||||||||||||||||
|
|
|
2015 |
|
|
2016 |
|
|
2017 |
|
|
2018 |
|
|
2019 |
|
|
2020 |
|
||||||
|
Viad Corp |
|
$ |
100.00 |
|
|
$ |
158.03 |
|
|
$ |
200.12 |
|
|
$ |
182.30 |
|
|
$ |
247.23 |
|
|
$ |
132.92 |
|
|
S&P 500 |
|
$ |
100.00 |
|
|
$ |
111.95 |
|
|
$ |
136.38 |
|
|
$ |
130.39 |
|
|
$ |
171.44 |
|
|
$ |
202.96 |
|
|
Russell 2000 |
|
$ |
100.00 |
|
|
$ |
121.28 |
|
|
$ |
139.02 |
|
|
$ |
123.69 |
|
|
$ |
155.21 |
|
|
$ |
186.15 |
|
|
S&P SmallCap 600 |
|
$ |
100.00 |
|
|
$ |
126.46 |
|
|
$ |
143.09 |
|
|
$ |
130.90 |
|
|
$ |
160.66 |
|
|
$ |
178.72 |
|
|
S&P SmallCap 600 Comm. Services & Supplies |
|
$ |
100.00 |
|
|
$ |
127.65 |
|
|
$ |
136.69 |
|
|
$ |
122.42 |
|
|
$ |
151.17 |
|
|
$ |
132.88 |
|
|
S&P SmallCap 600 Media |
|
$ |
100.00 |
|
|
$ |
89.72 |
|
|
$ |
103.42 |
|
|
$ |
120.86 |
|
|
$ |
129.77 |
|
|
$ |
122.84 |
|
|
S&P SmallCap 600 Hotels, Restaurants & Leisure |
|
$ |
100.00 |
|
|
$ |
127.16 |
|
|
$ |
174.05 |
|
|
$ |
183.47 |
|
|
$ |
202.64 |
|
|
$ |
257.00 |
|
Item 6. RESERVED
Not applicable.
19
Item 7. Management’s Discussion and Analysis of Financial Condition and Results of Operations
The following Management’s Discussion and Analysis (“MD&A”) should be read in conjunction with the consolidated financial statements and related notes. The MD&A is intended to assist in understanding our financial condition and results of operations. This discussion contains forward-looking statements that involve risks and uncertainties. Our actual results could differ materially from those anticipated due to various factors discussed under “Risk Factors,” “Forward-Looking Statements,” and elsewhere in this 2020 Form 10-K.
Overview
We are a leading provider of experiential leisure travel and face-to-face events and marketing experiences company with operations in the U.S., Canada, the United Kingdom, continental Europe, the United Arab Emirates, and Iceland. We are committed to providing unforgettable experiences to our clients and guests. We operate through three reportable business segments: GES North America, GES EMEA (collectively, “GES”), and Pursuit.
Impact of COVID-19
The COVID-19 pandemic is having and will likely continue to have a significant and negative impact on our operations and financial performance, with live events largely shut down and tourism activity significantly disrupted. In response to the COVID-19 pandemic, we implemented aggressive cost reduction measures to preserve cash, including furloughs, layoffs, mandatory unpaid time off, or salary reductions for all employees, and the reduction of discretionary spending. We also suspended future dividend payments and share repurchases, and we availed ourselves of governmental assistance programs for wages and tax relief. As event activity essentially halted, GES partnered with other members in the event trade business to convert convention centers into temporary hospitals in early April 2020. GES also completed virtual and hybrid events during the second half of 2020. We continue to implement measures to successfully adapt for the long-term impact of COVID-19. In August 2020, we secured additional capital to strengthen our liquidity position by entering into an investment agreement with funds managed by private equity firm Crestview Partners who made an initial investment of $135 million, offset in part by $9.2 million in fees, in newly issued perpetual convertible preferred stock. Refer to Note 15 – Common and Preferred Stock of the Notes to Consolidated Financial Statements (Part II, Item 8 of this 2020 Form 10-K) for further information. In August 2020, we also amended our Second Amended and Restated Credit Agreement (the “2018 Credit Agreement”) to provide financial flexibility, which, among other things waives our financial covenants until September 30, 2022. Refer to Note 12 – Debt and Finance Lease Obligations of the Notes to Consolidated Financial Statements (Part II, Item 8 of this 2020 Form 10-K) for further information.
Due to the deteriorating macroeconomic environment related to the COVID-19 pandemic, resulting in disruptions to our operations and the decline in our stock price, we determined interim triggering events occurred in the first and second quarters of 2020, which required us to assess the carrying values of goodwill and intangible assets. Based on this assessment, we recorded non-cash goodwill impairment charges of $185.8 million during 2020, which included a full impairment charge to the remaining GES goodwill balance. Our remaining goodwill balance as of December 31, 2020 of $99.8 million pertains to our Pursuit business. We also recorded a non-cash impairment charge to intangible assets of $15.7 million during 2020 related to our U.S. audio-visual production business. The duration and impact of COVID-19 may result in additional future impairment charges as facts and circumstances evolve. Refer to Note 9 – Goodwill and Other Intangible Assets of the Notes to Consolidated Financial Statements (Part II, Item 8 of this 2020 Form 10-K) for further information.
20
Results of Operations
A discussion related to our results of operations for 2020 compared to 2019 is presented below. A discussion related to our results of operations for 2019 compared to 2018 can be found under Part II, Item 7 of our Annual Report on Form 10-K for the year ended December 31, 2019, filed with the SEC on February 26, 2020, and is incorporated herein by reference.
Financial Highlights
|
|
|
Year Ended December 31, |
|
|
|
|
|
|||||
|
(in thousands, except per share data) |
|
2020 |
|
|
2019 |
|
|
Change vs. 2019 |
|
|||
|
Total revenue(1) |
|
$ |
415,435 |
|
|
$ |
1,302,736 |
|
|
|
(68.1 |
)% |
|
Net income (loss) attributable to Viad |
|
$ |
(374,094 |
) |
|
$ |
22,035 |
|
|
** |
|
|
|
Segment operating income (loss)(2) |
|
$ |
(116,240 |
) |
|
$ |
90,243 |
|
|
** |
|
|
|
Diluted income (loss) per common share from continuing operations attributable to Viad common stockholders |
|
$ |
(18.55 |
) |
|
$ |
1.02 |
|
|
** |
|
|
|
(1) |
Subsequent to the issuance of the December 31, 2019 consolidated financial statements, we identified prior period errors related to the recognition of revenue of GES’ Corporate Accounts’ third-party services. Revenue from these services should have been recorded on a net basis to reflect only the fees received for arranging these services, whereas previously, we recorded this revenue on a gross basis, thus overstating revenue and cost of services by the same amount. As a result, GES’ 2019 revenue has been corrected to reflect this immaterial gross-to-net adjustment. Refer to Note 1 – Overview and Summary of Significant Accounting Policies for additional information. |
|
(2) |
Refer to Note 23 – Segment Information of the Notes to Consolidated Financial Statements (Part II, Item 8 of this 2020 Form 10-K) for a reconciliation of the non-GAAP financial measure, segment operating income (loss), to the most directly comparable GAAP measure. |
** Change is greater than +/- 100%
|
|
• |
Total revenue decreased $887.3 million, primarily due to the impact of the COVID-19 pandemic as GES experienced show postponements and cancellations as exhibition and event activity remained largely dormant. Additionally, Pursuit temporarily closed its properties in mid-March through most of the second quarter of 2020 and was affected by lower visitation due to continued border closures and other travel restrictions. |
|
|
• |
Net loss attributable to Viad was $374.1 million during 2020 as compared to income of $22.0 million during 2019. The 2020 net loss was primarily due to lower revenue, impairment charges of $203.1 million mainly related to goodwill impairment charges, and restructuring charges of $13.4 million primarily related to transformation efforts at GES to significantly reduce costs and create a lower and more flexible cost structure, offset in part by lower performance-based compensation expense as we reduced our estimated performance achievement to zero as a result of the COVID-19 pandemic. During 2019, we recorded charges related to our partial withdrawal from the Central States Pension Plan of $15.7 million, a legal settlement charge of $8.5 million, restructuring charges of $8.4 million, and an asset impairment charge of $5.3 million, primarily related to our audio-visual production business in the United Kingdom. |
|
|
• |
Total segment operating loss(1) was $116.2 million during 2020 as compared to income of $90.2 million during 2019. The 2020 losses are primarily due to lower revenue at GES and Pursuit as a result of the COVID-19 pandemic, offset in part by the elimination of performance-based incentives. |
21
Foreign Exchange Rate Variances
We conduct our foreign operations primarily in Canada, the United Kingdom, Iceland, the Netherlands, Germany, and to a lesser extent, in certain other countries.
The following table summarizes the foreign exchange rate variance effects (or “FX Impact”) on revenue and segment operating income (loss) from our significant international operations:
|
|
|
Revenue |
|
|
Segment Operating Income (Loss) |
|
||||||||||||||||||
|
|
|
Weighted-Average Exchange Rates |
|
|
FX Impact |
|
|
Weighted-Average Exchange Rates |
|
|
FX Impact |
|
||||||||||||
|
|
|
2020 |
|
|
2019 |
|
|
(in thousands) |
|
|
2020 |
|
|
2019 |
|
|
(in thousands) |
|
||||||
|
GES North America: |
|
|
|
|
|
|
|
|
|
|
|
|
|
|
|
|
|
|
|
|
|
|
|
|
|
Canada (CAD) |
|
$ |
0.74 |
|
|
$ |
0.75 |
|
|
$ |
(358 |
) |
|
$ |
0.74 |
|
|
$ |
0.75 |
|
|
$ |
(31 |
) |
|
|
|
|
|
|
|
|
|
|
|
|
|
|
|
|
|
|
|
|
|
|
|
|
|
|
|
GES EMEA: |
|
|
|
|
|
|
|
|
|
|
|
|
|
|
|
|
|
|
|
|
|
|
|
|
|
United Kingdom (GBP) |
|
$ |
1.28 |
|
|
$ |
1.27 |
|
|
$ |
(568 |
) |
|
$ |
1.32 |
|
|
$ |
1.27 |
|
|
$ |
(409 |
) |
|
Europe (EUR) |
|
$ |
1.11 |
|
|
$ |
1.12 |
|
|
|
(107 |
) |
|
$ |
1.14 |
|
|
$ |
1.11 |
|
|
|
(168 |
) |
|
|
|
|
|
|
|
|
|
|
|
$ |
(675 |
) |
|
|
|
|
|
|
|
|
|
$ |
(577 |
) |
|
Pursuit: |
|
|
|
|
|
|
|
|
|
|
|
|
|
|
|
|
|
|
|
|
|
|
|
|
|
Canada (CAD) |
|
$ |
0.75 |
|
|
$ |
0.75 |
|
|
$ |
(239 |
) |
|
$ |
0.75 |
|
|
$ |
0.76 |
|
|
$ |
198 |
|
|
Iceland (ISK) |
|
$ |
0.01 |
|
|
$ |
0.01 |
|
|
|
(40 |
) |
|
$ |
0.01 |
|
|
$ |
0.01 |
|
|
|
125 |
|
|
|
|
|
|
|
|
|
|
|
|
$ |
(279 |
) |
|
|
|
|
|
|
|
|
|
$ |
323 |
|
|
Total |
|
|
|
|
|
|
|
|
|
$ |
(1,312 |
) |
|
|
|
|
|
|
|
|
|
$ |
(285 |
) |
Revenue and segment operating income (loss) were primarily impacted by variances of the British pound, the Canadian dollar, the Euro, and the Icelandic krona relative to the U.S. dollar. Future changes in exchange rates may impact overall expected profitability and historical period-to-period comparisons when revenue and segment operating income (loss) are translated into U.S. dollars.
Analysis of Revenue and Operating Results by Reportable Segment
GES
The following table presents a comparison of GES’ reported revenue and segment operating income (loss) to organic revenue(2) and organic segment operating income (loss)(2) for the years ended December 31, 2020 and 2019.
|
|
|
Year Ended December 31, 2020 |
|
|
Year Ended December 31, 2019 |
|
|
Change vs. 2019 |
|
|||||||||||||||||||||||||||
|
(in thousands) |
|
As Reported |
|
|
Acquisitions |
|
|
FX Impact |
|
|
Organic(2) |
|
|
As Reported |
|
|
Acquisitions |
|
|
Organic(2) |
|
|
As Reported |
|
|
Organic(2) |
|
|||||||||
|
Revenue: |
|
|
|
|
|
|
|
|
|
|
|
|
|
|
|
|
|
|
|
|
|
|
|
|
|
|
|
|
|
|
|
|
|
|
|
|
|
GES(1): |
|
|
|
|
|
|
|
|
|
|
|
|
|
|
|
|
|
|
|
|
|
|
|
|
|
|
|
|
|
|
|
|
|
|
|
|
|
North America |
|
$ |
288,921 |
|
|
$ |
— |
|
|
$ |
(358 |
) |
|
$ |
289,279 |
|
|
$ |
884,105 |
|
|
$ |
— |
|
|
$ |
884,105 |
|
|
|
(67.3 |
)% |
|
|
(67.3 |
)% |
|
EMEA |
|
|
53,384 |
|
|
|
— |
|
|
|
(675 |
) |
|
|
54,059 |
|
|
|
216,559 |
|
|
|
— |
|
|
|
216,559 |
|
|
|
(75.3 |
)% |
|
|
(75.0 |
)% |
|
Intersegment eliminations |
|
|
(3,680 |
) |
|
|
— |
|
|
|
— |
|
|
|
(3,680 |
) |
|
|
(20,741 |
) |
|
|
— |
|
|
|
(20,741 |
) |
|
|
82.3 |
% |
|
|
82.3 |
% |
|
Total GES |
|
$ |
338,625 |
|
|
$ |
— |
|
|
$ |
(1,033 |
) |
|
$ |
339,658 |
|
|
$ |
1,079,923 |
|
|
$ |
— |
|
|
$ |
1,079,923 |
|
|
|
(68.6 |
)% |
|
|
(68.5 |
)% |
|
Segment operating income (loss)(3): |
|
|
|
|
|
|
|
|
|
|
|
|
|
|
|
|
|
|
|
|
|
|
|
|
|
|
|
|
|
|
|
|
|
|
|
|
|
GES: |
|
|
|
|
|
|
|
|
|
|
|
|
|
|
|
|
|
|
|
|
|
|
|
|
|
|
|
|
|
|
|
|
|
|
|
|
|
North America |
|
$ |
(56,446 |
) |
|
$ |
— |
|
|
$ |
(31 |
) |
|
$ |
(56,415 |
) |
|
$ |
27,659 |
|
|
$ |
— |
|
|
$ |
27,659 |
|
|
** |
|
|
** |
|
||
|
EMEA |
|
|
(17,451 |
) |
|
|
— |
|
|
|
(577 |
) |
|
|
(16,874 |
) |
|
|
8,274 |
|
|
|
— |
|
|
|
8,274 |
|
|
** |
|
|
** |
|
||
|
Total GES |
|
$ |
(73,897 |
) |
|
$ |
— |
|
|
$ |
(608 |
) |
|
$ |
(73,289 |
) |
|
$ |
35,933 |
|
|
$ |
— |
|
|
$ |
35,933 |
|
|
** |
|
|
** |
|
||
** Change is greater than +/- 100%
22
|
(1) |
Subsequent to the issuance of the December 31, 2019 consolidated financial statements, we identified prior period errors related to the recognition of revenue of GES’ Corporate Accounts’ third-party services. Revenue from these services should have been recorded on a net basis to reflect only the fees received for arranging these services, whereas previously, we recorded this revenue on a gross basis, thus overstating revenue and cost of services by the same amount. As a result, GES’ 2019 revenue has been corrected to reflect this immaterial gross-to-net adjustment. Refer to Note 1 – Overview and Summary of Significant Accounting Policies. |
|
(2) |
Organic revenue and organic segment operating income (loss) are non-GAAP financial measures that adjust for the impacts of exchange rate variances and acquisitions, if any, until such acquisitions are included in the entirety of both comparable periods presented. For more information about organic revenue and organic segment operating income (loss), see the “Non-GAAP Measures” section of this MD&A. |
|
(3) |
Refer to Note 23 – Segment Information of the Notes to Consolidated Financial Statements (Part II, Item 8 of this 2020 Form 10-K) for a reconciliation of the non-GAAP financial measure, segment operating income (loss), to the most directly comparable GAAP measure. |
GES North America
GES North America revenue decreased $595.2 million or 67.3%, primarily due to show postponements and cancellations due to the COVID-19 pandemic. Revenue earned during 2020 was primarily driven by shows completed during the first quarter of 2020, compensation for work completed on cancelled shows, storage, and the conversion of convention centers into temporary hospitals in early April 2020, as well as virtual and hybrid events completed during the second half of 2020. Organic revenue* decreased $594.8 million or 67.3%.
GES North America segment operating loss was $56.4 million during 2020 as compared to income of $27.7 million during 2019. The 2020 losses are primarily due to the decrease in revenue, offset in part by the elimination of performance-based incentives and by the reduction in operating costs by reducing wages and discretionary costs. Organic segment operating loss* was $56.4 million during 2020 as compared to income of $27.7 million during 2019.
GES EMEA
GES EMEA revenue decreased $163.2 million or 75.3%, primarily due to show postponements and cancellations due to the COVID-19 pandemic. Revenue earned during 2020 was primarily driven by shows completed during the first quarter of 2020, compensation for work completed on cancelled shows, and the conversion of convention centers into temporary hospitals in early April 2020, as well as virtual and hybrid events completed during the second half of 2020. Organic revenue* decreased $162.5 million or 75.0%.
GES EMEA segment operating loss was $17.5 million during 2020 as compared to income of $8.3 million during 2019. The 2020 losses are primarily due to the decrease in revenue, offset in part by the elimination of performance-based incentives and by the reduction in operating costs by reducing wages and discretionary costs. Organic segment operating loss* was $16.9 million during 2020 as compared to income of $8.3 million during 2019.
* Refer to footnote (2) in the above table for more information about the non-GAAP financial measures of organic revenue and organic segment operating income (loss).
23
Pursuit
The following table presents a comparison of Pursuit’s reported revenue and segment operating income (loss) to organic revenue(3) and organic segment operating income (loss)(3) for the years ended December 31, 2020 and 2019.
|
|
|
Year Ended December 31, 2020 |
|
|
Year Ended December 31, 2019 |
|
|
Change vs. 2019 |
|
|||||||||||||||||||||||||||
|
(in thousands) |
|
As Reported |
|
|
Acquisitions(2) |
|
|
FX Impact |
|
|
Organic(3) |
|
|
As Reported |
|
|
Acquisitions(2) |
|
|
Organic(3) |
|
|
As Reported |
|
|
Organic(3) |
|
|||||||||
|
Revenue(1): |
|
|
|
|
|
|
|
|
|
|
|
|
|
|
|
|
|
|
|
|
|
|
|
|
|
|
|
|
|
|
|
|
|
|
|
|
|
Pursuit: |
|
|
|
|
|
|
|
|
|
|
|
|
|
|
|
|
|
|
|
|
|
|
|
|
|
|
|
|
|
|
|
|
|
|
|
|
|
Attractions |
|
$ |
28,126 |
|
|
$ |
— |
|
|
$ |
(189 |
) |
|
$ |
28,315 |
|
|
$ |
110,369 |
|
|
$ |
— |
|
|
$ |
110,369 |
|
|
|
(74.5 |
)% |
|
|
(74.3 |
)% |
|
Hospitality |
|
|
45,838 |
|
|
|
17,037 |
|
|
|
(86 |
) |
|
|
28,887 |
|
|
|
94,149 |
|
|
|
19,874 |
|
|
|
74,275 |
|
|
|
(51.3 |
)% |
|
|
(61.1 |
)% |
|
Transportation |
|
|
2,696 |
|
|
|
— |
|
|
|
(7 |
) |
|
|
2,703 |
|
|
|
14,861 |
|
|
|
— |
|
|
|
14,861 |
|
|
|
(81.9 |
)% |
|
|
(81.8 |
)% |
|
Travel Planning |
|
|
467 |
|
|
|
— |
|
|
|
(2 |
) |
|
|
469 |
|
|
|
4,504 |
|
|
|
— |
|
|
|
4,504 |
|
|
|
(89.6 |
)% |
|
|
(89.6 |
)% |
|
Intra-Segment Eliminations & Other |
|
|
(317 |
) |
|
|
— |
|
|
|
5 |
|
|
|
(322 |
) |
|
|
(1,070 |
) |
|
|
— |
|
|
|
(1,070 |
) |
|
|
70.4 |
% |
|
|
69.9 |
% |
|
Total Pursuit |
|
$ |
76,810 |
|
|
$ |
17,037 |
|
|
$ |
(279 |
) |
|
$ |
60,052 |
|
|
$ |
222,813 |
|
|
$ |
19,874 |
|
|
$ |
202,939 |
|
|
|
(65.5 |
)% |
|
|
(70.4 |
)% |
|
|
|
|
|
|
|
|
|
|
|
|
|
|
|
|
|
|
|
|
|
|
|
|
|
|
|
|
|
|
|
|
|
|
|
|
|
|
|
Segment operating income (loss)(4): |
|
|
|
|
|
|
|
|
|
|
|
|
|
|
|
|
|
|
|
|
|
|
|
|
|
|
|
|
|
|
|
|
|
|
|
|
|
Total Pursuit |
|
$ |
(42,343 |
) |
|
$ |
719 |
|
|
$ |
323 |
|
|
$ |
(43,385 |
) |
|
$ |
54,310 |
|
|
$ |
5,693 |
|
|
$ |
48,617 |
|
|
** |
|
|
** |
|
||
|
(1) |
Revenue by line of business does not agree to Note 2 – Revenue and Related Contract Costs and Contract Liabilities of the Notes to Consolidated Financial Statements (Part II, Item 8 of this 2020 Form 10-K) as the amounts in the above table include product revenue from food and beverage and retail operations within each line of business. |
|
(2) |
Acquisitions include Mountain Park Lodges (acquired June 2019) and Belton Chalet (acquired May 2019). |
|
(3) |
Organic revenue and organic segment operating income (loss) are non-GAAP financial measures that adjust for the impacts of exchange rate variances and acquisitions, if any, until such acquisitions are included in the entirety of both comparable periods presented. For more information about organic revenue and organic segment operating income (loss), see the “Non-GAAP Measures” section of this MD&A. |
|
(4) |
Refer to Note 23 – Segment Information of the Notes to Consolidated Financial Statements (Part II, Item 8 of this 2020 Form 10-K) for a reconciliation of the non-GAAP financial measure, segment operating income (loss), to the most directly comparable GAAP measure. |
Pursuit revenue decreased $146.0 million or 65.5%, primarily due to the impact of the COVID-19 pandemic as Pursuit temporarily closed its properties in mid-March through most of the second quarter of 2020. We phased in most of Pursuit’s attractions and lodging operations starting in May 2020 with most open and operational during the third quarter of 2020, although at reduced capacities. The travel and hospitality industry continues to be negatively impacted by the COVID-19 pandemic as travel restrictions and border closures largely remain in place. Organic revenue* decreased $142.9 million or 70.4%.
Pursuit segment operating loss was $42.3 million during 2020 as compared to income of $54.3 million during 2019. The 2020 declines are primarily due to the decrease in revenue, offset in part by the reduction in operating costs through efforts to maximize profitability. Organic segment operating loss* was $43.4 million during 2020 as compared to income of $48.6 million during 2019.
* Refer to footnote (3) in the above table for more information about the non-GAAP financial measures of organic revenue and organic segment operating income (loss).
24
Performance Measures
We use the following key business metrics to evaluate the performance of Pursuit’s attractions business:
|
|
• |
Number of visitors. The number of visitors allows us to assess the volume of tickets sold at each attraction during the period. |
|
|
• |
Revenue per attraction visitor. Revenue per attraction visitor is calculated as total attractions revenue divided by the total number of visitors at all Pursuit attractions during the period. Total attractions revenue includes ticket sales and ancillary revenue generated by attractions, such as food and beverage and retail revenue. Total attractions revenue per visitor measures the total spend per visitor that attraction properties are able to capture, which is important to the profitability of the attractions business. |
|
|
• |
Effective ticket price. Effective ticket price is calculated as revenue from the sale of attraction tickets divided by the total number of visitors at all comparable Pursuit attractions during the period. |
We use the following key business metrics, common in the hospitality industry, to evaluate Pursuit’s hospitality business:
|
|
• |
Revenue per Available Room. RevPAR is calculated as total rooms revenue divided by the total number of room nights available for all comparable Pursuit hospitality properties during the period. Total rooms revenue does not include non-rooms revenue, which consists of ancillary revenue generated by hospitality properties, such as food and beverage and retail revenue. RevPAR measures the period-over-period change in rooms revenue per available room for comparable hospitality properties. RevPAR is affected by average daily rate and occupancy, which have different implications on profitability. |
|
|
• |
Average Daily Rate. ADR is calculated as total rooms revenue divided by the total number of room nights sold for all comparable Pursuit hospitality properties during the period. ADR is used to assess the pricing levels that the hospitality properties are able to realize. Increases in ADR lead to increases in rooms revenue with no substantial effect on variable costs, therefore having a greater impact on margins than increases in occupancy. |
|
|
• |
Occupancy. Occupancy is calculated as the total number of room nights sold divided by the total number of room nights available for all comparable Pursuit hospitality properties during the period. Occupancy measures the utilization of the available capacity at the hospitality properties. Increases in occupancy result in increases in rooms revenue and additional variable operating costs (including housekeeping services, utilities, and room amenity costs), as well as increases in ancillary non-rooms revenue (including food and beverage and retail revenue). |
The following table provides Pursuit’s same-store key performance indicators. The same-store metrics indicate the performance of all Pursuit’s properties and attractions that we owned and operated at full capacity, considering seasonal closures, for the entirety of both periods presented. For Pursuit properties and attractions located outside of the U.S., comparisons to the prior year are on a constant U.S. dollar basis, using the current year quarterly average exchange rates for previous periods, to eliminate the FX Impact. We believe this same-store constant currency basis provides better comparability between reporting periods.
|
|
|
Year Ended December 31, |
|
|||||||||
|
|
|
2020 |
|
|
2019 |
|
|
Change vs. 2019 |
|
|||
|
Same-Store Key Performance Indicators (1) |
|
|
|
|
|
|
|
|
|
|
|
|
|
Attractions: |
|
|
|
|
|
|
|
|
|
|
|
|
|
Number of visitors |
|
|
549,760 |
|
|
|
2,348,069 |
|
|
|
(76.6 |
)% |
|
Revenue per attraction visitor |
|
$ |
44 |
|
|
$ |
46 |
|
|
|
(4.3 |
)% |
|
Effective ticket price |
|
$ |
30 |
|
|
$ |
35 |
|
|
|
(14.3 |
)% |
|
Hospitality: |
|
|
|
|
|
|
|
|
|
|
|
|
|
Room nights available (2) |
|
|
167,442 |
|
|
|
283,483 |
|
|
|
(40.9 |
)% |
|
RevPAR (2) |
|
$ |
69 |
|
|
$ |
144 |
|
|
|
(52.1 |
)% |
|
ADR |
|
$ |
150 |
|
|
$ |
206 |
|
|
|
(27.2 |
)% |
|
Occupancy (2) |
|
|
45.9 |
% |
|
|
70.1 |
% |
|
|
(24.2 |
)% |
|
|
(1) |
Attractions Same-Store Key Performance Indicators exclude FlyOver Iceland (opened August 2019) and Open Top Touring (opened September 2020). Hospitality Same-Store Key Performance Indicators exclude the Glacier Basecamp Lodge (purchased January 2020), West Glacier RV Park & Cabins (opened July 2019), the Mountain Park Lodges (acquired in June 2019), and the Belton Chalet (acquired in May 2019). |
|
|
(2) |
The rooms that were out of service as a result of property closures due to the COVID-19 pandemic were excluded from room nights available when calculating hospitality RevPAR and occupancy. |
On July 18, 2020, one of our off-road Ice Explorers was involved in an accident while enroute to the Athabasca Glacier, resulting in three fatalities and multiple other serious injuries. We continue to support the victims and their families, and we are fully cooperating
25
with the applicable regulatory authorities to investigate this accident. The Columbia Icefield Adventure attraction remained closed through the rest of the season while the investigation was underway.
For the health and well-being of our employees, guests, and community, Pursuit’s year-round attractions and lodging properties were closed temporarily starting in mid-March and remained closed during most of the second quarter of 2020. The majority of Pursuit’s properties were open and operational during the third quarter of 2020, although at reduced capacities. St. Mary Lodge and Glacier Park Lodge remained closed due to a government-imposed closure at the East Glacier entrance at Glacier National Park. We seasonally closed our non-year-round properties during the fourth quarter of 2020. Additionally, temporary government mandated closures occurred at FlyOver Canada and FlyOver Iceland during the fourth quarter of 2020. In order to mitigate the negative financial and operational impacts, we reduced all non-essential capital expenditures during the first and second quarters of 2020 resulting in the delay of the opening of FlyOver Canada Toronto, which is now anticipated to open near the end of 2023. We resumed important growth investments in September of 2020, and now anticipate opening FlyOver Las Vegas in the third quarter of 2021 and the Sky Lagoon in the second quarter of 2021.
Attractions. The decrease in same-store visitors and revenue per attraction was driven by the temporary closure of our attractions and lower visitation due to the continued border closures and travel restrictions as a result of the COVID-19 pandemic. Pursuit’s attractions were open during the third quarter of 2020, although at reduced capacities.
Hospitality. The decrease in RevPAR and ADR was driven by lower demand as a result of the COVID-19 pandemic.
During 2020 and 2019, Pursuit derived approximately 67% and 66% of its revenue, respectively, and 44% and 88% of its segment operating loss and income, respectively, from its Canadian operations. Accordingly, the strengthening or weakening of the Canadian dollar, relative to other currencies, could affect customer volumes and the results of operations. The 2020 results were negatively impacted by travel restrictions and border closures, which affected long-haul travelers to Canada that is largely dependent on foreign customer visitation.
Other Expenses
|
|
|
Year Ended December 31, |
|
|
|
|
|
|||||
|
(in thousands) |
|
2020 |
|
|
2019 |
|
|
Change vs. 2019 |
|
|||
|
Corporate activities |
|
$ |
8,687 |
|
|
$ |
10,865 |
|
|
|
(20.0 |
)% |
|
Interest expense |
|
$ |
18,264 |
|
|
$ |
14,199 |
|
|
|
28.6 |
% |
|
Multi-employer pension plan withdrawal |
|
$ |
462 |
|
|
$ |
15,693 |
|
|
|
(97.1 |
)% |
|
Other expense, net |
|
$ |
1,132 |
|
|
$ |
1,586 |
|
|
|
(28.6 |
)% |
|
Restructuring charges |
|
$ |
13,440 |
|
|
$ |
8,380 |
|
|
|
60.4 |
% |
|
Legal settlement |
|
$ |
— |
|
|
$ |
8,500 |
|
|
** |
|
|
|
Impairment charges |
|
$ |
203,076 |
|
|
$ |
5,346 |
|
|
** |
|
|
|
Income tax expense |
|
$ |
14,246 |
|
|
$ |
2,506 |
|
|
** |
|
|
|
Loss from discontinued operations |
|
$ |
(1,847 |
) |
|
$ |
(81 |
) |
|
** |
|
|
** Change is greater than +/- 100%.
Corporate Activities – The decrease in corporate activities expense during 2020 relative to 2019 was primarily due to lower headcount, lower performance-based compensation expense as we reduced our estimated performance achievement to zero as a result of the COVID-19 pandemic, and higher acquisition transaction-related costs in 2019, offset in part by fees and expenses related to the equity raise and credit facility amendment in 2020.
Interest Expense – The increase in interest expense relative to 2019 was primarily due to higher debt balances during the first half of 2020.
Multi-Employer Pension Plan Withdrawal – During 2019, we finalized the terms of a new collective bargaining agreement with the Teamsters 727 union. The terms included a withdrawal from the underfunded Central States Pension Plan. Accordingly, we recorded a charge of $15.5 million, which represented the estimated present value of future contributions we will be required to make to the plan as a result of this withdrawal from the plan and $0.2 million of other withdrawal costs. Additionally, we recorded $0.5 million in 2020 related to the withdrawal from one of our multi-employer plans.
Restructuring Charges – Restructuring charges during 2020 and 2019 were primarily related to the elimination of certain positions and facility closures at GES, as well as charges related to the closure and liquidation of GES’ United Kingdom-based audio-visual services business during 2020. The 2019 actions arose in connection with our ongoing efforts to simplify and transform GES for greater profitability. In response to the COVID-19 pandemic in 2020, we accelerated our transformation and streamlining efforts at GES to significantly reduce costs and create a lower and more flexible cost structure focused on servicing our more profitable market segments.
26
The 2020 charges also included amounts related to the elimination of certain positions at our corporate office in response to the COVID-19 pandemic.
Legal Settlement – During 2019, we recorded a charge to resolve a legal dispute at GES involving a former industry contractor.
Impairment Charges – During 2020, due to the deteriorating macroeconomic environment related to the COVID-19 pandemic, resulting in disruptions to our operations and the decline in our stock price, we recorded non-cash goodwill impairment charges of $185.8 million primarily related to the write-off of GES’ goodwill, a non-cash impairment charge to intangible assets of $15.7 million related to our audio-visual production business in the U.S., and fixed asset impairment charges of $1.6 million. During 2019, we recorded asset impairment charges of $5.3 million related to our audio-visual production business in the United Kingdom.
Income Tax Expense – Our effective income tax rate was negative 3.9% for 2020 as compared to 9.6% for 2019. The negative effective tax rate for 2020 was due to no tax benefits being recorded in our U.S., United Kingdom, and other European jurisdictions as a result of recording a valuation allowance during the second quarter of 2020 against our net deferred tax assets in these jurisdictions due to our belief that it is more likely than not that we will be unable to realize the tax benefits from our current year losses in these jurisdictions. The 9.6% effective rate for 2019 was low primarily due a $4.5 million benefit resulting from the remeasurement of our Alberta deferred tax assets due to a statutory rate reduction.
Loss from Discontinued Operations – Loss from discontinued operations during 2020 was primarily due to settlement and legal expenses related to previously sold operations. Loss from discontinued operations for 2019 was primarily related to legal expenses, offset in part by a favorable legal settlement related to previously sold operations.
Liquidity and Capital Resources
In early March 2020, we began to see event postponements and cancellations at GES, as well as cancelled bookings at Pursuit as a result of the COVID-19 pandemic. Although we were in compliance with the financial covenants of our 2018 Credit Agreement as of March 31, 2020, we entered into an amendment to our 2018 Credit Agreement in May 2020, which waived our financial covenants for the quarter ending June 30, 2020. As the shut-down of live events and tourism activities escalated, we expected to be unable to meet our financial covenants beginning with the quarter ending September 30, 2020. During the third quarter of 2020, we secured additional capital to strengthen our liquidity position and amended our 2018 Credit Agreement to provide financial covenant relief and financial flexibility as described below.
On August 5, 2020, we entered into an investment agreement with funds managed by private equity firm Crestview Partners (the “Investment Agreement”) who made an initial investment of $135 million, offset in part by $9.2 million in fees, in newly issued perpetual convertible preferred stock that carries a 5.5% cumulative quarterly dividend, which is payable in cash or in-kind at Viad’s option (the “Convertible Preferred Stock”). The Convertible Preferred Stock is convertible into shares of our common stock at a conversion price of $21.25 per share. The Investment Agreement also includes a delayed draw commitment of up to $45 million in additional Convertible Preferred Stock, which we may access during the 12 months following the August 5, 2020 closing date on the same terms and conditions as the initial investment. The proceeds from Crestview’s initial investment were used to repay a portion of our 2018 Credit Facility, will provide additional short-term liquidity, will fund capital expenditures, and will support general corporate purposes. On August 5, 2020, we entered into an amendment to our 2018 Credit Agreement, which, among other things, (i) waives our financial covenants until September 30, 2022 (the “Covenant Waiver Period”) and (ii) requires us to maintain minimum liquidity of $100 million, with liquidity defined as unrestricted cash and available capacity on our 2018 Credit Facility. The interest rate on the borrowings is equal to the London Interbank Offered Rate (“LIBOR”) plus 350 basis points, with a LIBOR floor of one percent during the Covenant Waiver Period. The LIBOR floor continues until the end of the 2018 Credit Agreement. Viad pledged 100% of the capital stock of its wholly-owned domestic subsidiaries and its top-tier foreign subsidiaries (other than Esja Attractions ehf.). Fees related to the amendment were approximately $1.7 million.
Cash, cash equivalents, and restricted cash were $42.0 million as of December 31, 2020, as compared to $62.0 million as of December 31, 2019. Our total available liquidity was $258.0 million, including the available capacity on our 2018 Credit Facility of $173.5 million, unrestricted cash of $39.5 million, and an additional $45 million available through the delayed draw commitment from Crestview Partners. During the year ended December 31, 2020, we used net cash from operating activities of $80.2 million. We believe that our existing sources of liquidity will be sufficient to fund operations and capital commitments, including approximately $60 million in capital expenditures in select growth investments, for at least the next 12 months.
As of December 31, 2020, we held approximately $36.1 million of our cash and cash equivalents outside of the U.S., consisting of $15.6 million in Canada, $9.8 million in the United Kingdom, $7.2 million in the Netherlands, $1.8 million in Iceland, $1.2 million in the United Arab Emirates, and $0.5 million in other countries.
27
Cash Flows
Operating Activities
|
|
|
Year Ended December 31, |
|
|||||
|
(in thousands) |
|
2020 |
|
|
2019 |
|
||
|
Net income (loss) |
|
$ |
(376,952 |
) |
|
$ |
23,523 |
|
|
Depreciation and amortization |
|
|
56,565 |
|
|
|
58,964 |
|
|
Deferred income taxes |
|
|
15,097 |
|
|
|
(10,398 |
) |
|
Loss from discontinued operations |
|
|
1,847 |
|
|
|
81 |
|
|
Restructuring charges |
|
|
13,440 |
|
|
|
8,380 |
|
|
Legal settlement |
|
|
— |
|
|
|
8,500 |
|
|
Impairment charges |
|
|
203,076 |
|
|
|
5,346 |
|
|
Gains on dispositions of property and other assets |
|
|
(14,935 |
) |
|
|
(1,475 |
) |
|
Share-based compensation expense |
|
|
2,653 |
|
|
|
7,190 |
|
|
Multi-employer pension plan withdrawal |
|
|
462 |
|
|
|
15,693 |
|
|
Other non-cash items |
|
|
8,056 |
|
|
|
3,791 |
|
|
Changes in assets and liabilities |
|
|
10,443 |
|
|
|
(11,456 |
) |
|
Net cash (used in) provided by operating activities |
|
$ |
(80,248 |
) |
|
$ |
108,139 |
|
The change in net cash (used in) provided by operating activities of $188.4 million was due to net losses at GES and Pursuit due to the COVID-19 pandemic, offset in part by a reduction in the working capital needed to support lower business volumes and active working capital management.
Investing Activities
|
|
|
Year Ended December 31, |
|
|||||
|
(in thousands) |
|
2020 |
|
|
2019 |
|
||
|
Capital expenditures |
|
$ |
(53,567 |
) |
|
$ |
(76,147 |
) |
|
Cash surrender value of life insurance policies |
|
|
24,767 |
|
|
|
— |
|
|
Cash paid for acquisitions, net |
|
|
— |
|
|
|
(90,992 |
) |
|
Proceeds from dispositions of property and other assets |
|
|
22,027 |
|
|
|
1,583 |
|
|
Net cash used in investing activities |
|
$ |
(6,773 |
) |
|
$ |
(165,556 |
) |
The decrease in net cash used in investing activities of $158.8 million was primarily due to proceeds from the termination of our life insurance policies, proceeds from dispositions of property and other assets in 2020, including $17.1 million from the sale of the GES warehouse in San Diego, cash paid for acquisitions in 2019, and a decrease in capital expenditures as we reduced all non-essential capital expenditures during most of 2020 in response to the COVID-19 pandemic.
Financing Activities
|
|
|
Year Ended December 31, |
|
|||||
|
(in thousands) |
|
2020 |
|
|
2019 |
|
||
|
Proceeds from borrowings |
|
$ |
225,422 |
|
|
$ |
200,473 |
|
|
Payments on debt and finance lease obligations |
|
|
(275,327 |
) |
|
|
(115,708 |
) |
|
Dividends paid on common stock |
|
|
(4,064 |
) |
|
|
(8,094 |
) |
|
Distributions to noncontrolling interest |
|
|
(1,526 |
) |
|
|
(407 |
) |
|
Payments of debt issuance costs |
|
|
(1,585 |
) |
|
|
(39 |
) |
|
Payment of payroll taxes on stock-based compensation through shares withheld or repurchased |
|
|
(1,688 |
) |
|
|
(3,046 |
) |
|
Common stock purchased for treasury |
|
|
(2,785 |
) |
|
|
— |
|
|
Proceeds from issuance of Convertible Series A Preferred Stock, net of issuance costs |
|
|
125,763 |
|
|
|
— |
|
|
Proceeds from exercise of stock options |
|
|
2,077 |
|
|
|
293 |
|
|
Net cash provided by financing activities |
|
$ |
66,287 |
|
|
$ |
73,472 |
|
28
The decrease in net cash provided by financing activities of $7.2 million was primarily due to net debt payments of $49.9 million during 2020 compared to net debt proceeds of $84.8 million during 2019 under the 2018 Credit Facility, offset substantially in part by the proceeds from the issuance of Convertible Series A Preferred Stock.
Debt and Finance Lease Obligations
Refer to Note 12 – Debt and Finance Lease Obligations of the Notes to Consolidated Financial Statements (Part II, Item 8 of this 2020 Form 10-K) for further discussion.
Guarantees
Refer to Note 21 – Litigation, Claims, Contingencies, and Other of the Notes to Consolidated Financial Statements (Part II, Item 8 of this 2020 Form 10-K) for further discussion.
Share Repurchases
Our Board of Directors previously authorized us to repurchase shares of our common stock from time to time at prevailing market prices. Effective February 7, 2019, our Board of Directors authorized the repurchase of an additional 500,000 shares. In March 2020, our Board of Directors suspended our share repurchase program for the foreseeable future. Prior to the suspension, we repurchased 53,784 shares on the open market for $2.8 million in 2020. No shares were repurchased on the open market during 2019. As of December 31, 2020, 546,283 shares remained available for repurchase. The Board of Directors’ authorization does not have an expiration date.
Additionally, we repurchased shares related to tax withholding requirements on vested restricted share-based awards.
Critical Accounting Policies and Estimates
The consolidated financial statements are prepared in accordance with U.S. GAAP. We are required to make estimates and assumptions that affect our reported amounts of assets, liabilities, revenue, and expenses. Critical accounting policies are those policies that are most important to the portrayal of our financial position and results of operations, and that require us to make the most difficult and subjective judgments, often as a result of the need to make estimates of matters that are inherently uncertain. We identified and discussed with our audit committee the following critical accounting policies and estimates and the methodology and disclosures related to those estimates:
Revenue recognition — Revenue is measured based on a specified amount of consideration in a contract with a customer, net of commissions paid to customers and amounts collected on behalf of third parties. We recognize revenue when a performance obligation is satisfied by transferring control of a product or service to a customer. Revenue for goods and services provided for which we do not have control of the goods or services before that good or service is transferred to a customer is recorded on a net basis to reflect only the fees received for arranging these services.
GES’ service revenue is primarily derived through its comprehensive range of services to event organizers and corporate brand marketers including Core Services, Audio-visual, and Event Technology. GES’ service revenue is earned over time over the duration of the exhibition, conference or corporate event, which generally lasts one to three days; however, we use the practical expedient of recognizing service revenue at the close of the event when we have the right to invoice, or when a customer cancels a contract. GES’ product revenue is derived from the build of exhibits and environments and graphics. GES’ product revenue is recognized at a point in time upon delivery of the product, or when a customer cancels a contract.
Pursuit’s service revenue is derived through its accommodations, admissions, transportation, and travel planning services. Pursuit’s product revenue is derived through food and beverage and retail sales. Pursuit’s revenue is recognized at the time services are performed or upon delivery of the product. Pursuit’s service revenue is recognized over time as the customer simultaneously receives and consumes the benefits. Pursuit’s product revenue is recognized at a point in time.
Goodwill and Other Intangible Assets — Goodwill and other intangible assets with indefinite useful lives are not amortized, but instead are tested for impairment at least annually. Intangible assets with finite lives are amortized over their respective estimated useful lives and are reviewed for impairment if an event occurs or circumstances change that would indicate the intangible asset’s carrying value may not be recoverable. Our reporting units are defined, and goodwill is tested, at either an operating segment level or at the component level of an operating segment, depending on various factors including the internal reporting structure of the operating segment, the level of integration among components, the sharing of assets and other resources among components, and the benefits and likely recoverability of goodwill by the component’s operations.
Goodwill is tested for impairment at the reporting unit level on an annual basis as of October 31, and between annual tests if an event occurs or circumstances change that would more-likely-than-not reduce the fair value of a reporting unit below its carrying value. Due to the deteriorating macroeconomic environment related to the COVID-19 pandemic, resulting in disruptions to our operations and the decline in our stock price, we determined interim triggering events occurred in the first and second quarters of 2020, which required us
29
to assess the carrying values of goodwill and intangible assets. Based on this assessment, we recorded non-cash goodwill impairment charges of $185.8 million during 2020, which included a full impairment charge to the remaining GES goodwill balance. We also recorded a non-cash impairment charge to intangible assets of $15.7 million during 2020 related to our U.S. audio-visual production business.
GES North America’s goodwill was assigned to, and tested at, the operating segment level (GES U.S. and GES Canada (collectively “GES North America”). GES EMEA’s goodwill was assigned to and tested at the operating segment level. Pursuit’s goodwill impairment testing is performed at the reporting unit level (Banff Jasper Collection, the Alaska Collection, the Glacier Park Collection, and FlyOver).
For purposes of goodwill impairment testing, we use a discounted expected future cash flow methodology (income approach) to estimate the fair value of our reporting units. The estimates and assumptions regarding expected future cash flows (the most significant being revenue and EBITDA margins), discount rates, and terminal values require considerable judgment and are based on market conditions, financial forecasts, industry trends, and historical experience.
The most critical assumptions and estimates in determining the estimated fair value of our reporting units relate to the amounts and timing of expected future cash flows for each reporting unit and the reporting unit cost of capital (discount rate) applied to those cash flows. We estimate the assumed reporting unit cost of capital rates (discount rates) using a build-up method based on the perceived risk associated with the cash flows pertaining to the specific reporting unit. In order to assess the reasonableness of our fair value estimates, we perform a reconciliation of the aggregate fair values of our reporting units to our market capitalization.
As noted above, the estimates and assumptions regarding expected future cash flows, discount rates, and terminal values require considerable judgment and are based on market conditions, financial forecasts, industry trends, and historical experience. These estimates have inherent uncertainties, and different assumptions could lead to materially different results. As of December 31, 2020, our aggregate goodwill was $99.8 million. As a result of our most recent impairment analysis performed as of October 31, 2020, the excess of the estimated fair value over the carrying value for our reporting units with reported goodwill (expressed as a percentage of the carrying amounts) under step one of the impairment test for the Banff Jasper Collection and the Alaska Collection was significant, and FlyOver was 6%. Significant reductions in FlyOver and our other reporting unit’s expected future revenue, operating income, or cash flow forecasts and projections, or an increase in a reporting unit’s cost of capital, could trigger additional goodwill impairment testing, which may result in impairment charges.
If an impairment indicator related to intangible assets is identified, or if other circumstances indicate an impairment may exist, we perform an assessment to determine if an impairment loss should be recognized. This assessment includes a recoverability test to identify if the expected future undiscounted cash flows are less than the carrying value of the related assets. If the results of the recoverability test indicate that expected future undiscounted cash flows are less than the carrying value of the related assets, we perform a measurement of impairment and we recognize any carrying amount in excess of fair value as an impairment. We periodically evaluate the continued recoverability of intangible assets which were previously evaluated due to an impairment indicator to determine if remeasurement is necessary.
Income taxes — We are required to estimate and record provisions for income taxes in each of the jurisdictions in which we operate. Accordingly, we must estimate our actual current income tax liability, and assess temporary differences arising from the treatment of items for tax purposes, as compared to the treatment for accounting purposes. These differences result in deferred tax assets and liabilities, which are included in the Consolidated Balance Sheets. We use significant judgment in forming conclusions regarding the recoverability of our deferred tax assets and evaluate all available positive and negative evidence to determine if it is more-likely-than-not that the deferred tax assets will be realized. To the extent recovery does not appear likely, a valuation allowance must be recorded. We had gross deferred tax assets of $99.2 million as of December 31, 2020 and $40.5 million as of December 31, 2019. We had a valuation allowance against gross deferred tax assets of $81.8 million as of December 31, 2020 and $4.3 million as of December 31, 2019.
While we believe that the deferred tax assets, net of existing valuation allowances, will be utilized in future periods, there are inherent uncertainties regarding the ultimate realization of these assets. It is possible that the relative weight of positive and negative evidence regarding the realization of deferred tax assets may change, which could result in a material increase or decrease in our valuation allowance. Such a change could result in a material increase or decrease to income tax expense in the period the assessment was made.
We record uncertain tax positions on the basis of a two-step process: first we determine whether it is more-likely-than-not that the tax positions will be sustained on the basis of the technical merits of the position; and, if so, we recognize the largest amount of tax benefit that is more than 50% likely to be realized upon ultimate settlement with the related tax authority.
Pension and postretirement benefits — Our pension plans use traditional defined benefit formulas based on years of service and final average compensation. Funding policies provide that payments to defined benefit pension trusts shall be at least equal to the minimum
30
funding required by applicable regulations. We presently anticipate contributing $0.8 million to our funded pension plans and $0.9 million to our unfunded pension plans in 2021.
We have defined benefit postretirement plans that provide medical and life insurance for certain eligible employees, retirees, and dependents. The related postretirement benefit liabilities are recognized over the employees’ service period. In addition, we retain the obligations for these benefits for retirees of certain sold businesses. While the plans have no funding requirements, we expect to contribute $0.9 million to the plans in 2021.
The discount rates used in determining future pension and postretirement benefit obligations are based on rates determined by actuarial analysis and management review and reflect the estimated rates of return on a high-quality, hypothetical bond portfolio whose cash flows match the timing and amounts of expected benefit payments. Refer to Note 18 – Pension and Postretirement Benefits of the Notes to Consolidated Financial Statements (Part II, Item 8 of this 2020 Form 10-K) for further information.
Share-based compensation — We grant share-based compensation awards to our officers, directors, and certain key employees pursuant to the 2017 Viad Corp Omnibus Incentive Plan, which has a 10-year term and provides for the following types of awards: (a) incentive and non-qualified stock options; (b) restricted stock awards and restricted stock units; (c) performance units or performance shares; (d) stock appreciation rights; (e) cash-based awards; and (f) certain other stock-based awards.
Share-based compensation expense recognized in the consolidated financial statements was $2.7 million in 2020, $7.2 million in 2019, and $4.9 million in 2018. There was no income tax benefit related to such cost in 2020 due to the valuation allowance on our deferred tax assets. We recorded total tax benefits related to such costs of $2.2 million in 2019 and $1.2 million in 2018. No share-based compensation costs were capitalized during 2020, 2019, or 2018.
We account for share-based payment awards that will be settled in cash as liability-based awards. We measure share-based compensation expense of liability-based awards at fair value at each reporting date until the date of settlement based on the number of units expected to vest and, where applicable, the level of achievement of predefined performance goals. These awards are remeasured on each reporting date based on our stock price and the Monte Carlo simulation model. A Monte Carlo simulation requires the use of several assumptions, including historical volatility and correlation between our stock price and the price of the common shares of a comparator group, a risk-free rate of return, and an expected term. We account for share-based awards that will be settled in shares of our common stock as equity-based awards. We measure share-based compensation expense of equity-based awards at fair value on the grant date on a straight-line basis over the vesting period. The estimated number of shares to be achieved is updated each reporting period based on the number of units expected to vest and, where applicable, the level of achievement of predefined performance goals, until the date of settlement. The fair value of stock option grants is estimated on the date of grant using the Black-Scholes stock option pricing model. The Black-Scholes model requires the use of several assumptions, including expected volatility, a risk-free interest rate, a forfeiture rate, and expected life. We measure share-based compensation for performance-based options on a straight-line basis over the performance period and the underlying shares expected to be settled are adjusted each reporting period based on estimated future achievement of the respective performance metrics. Service-based options are recognized on a straight-line basis over the requisite service period on a graded-vesting schedule. Refer to Note 3 – Share-Based Compensation of the Notes to Consolidated Financial Statements (Part II, Item 8 of this 2020 Form 10-K) for further information.
Self-Insurance Liabilities — We are self-insured up to certain limits for workers’ compensation and general liabilities, which includes automobile, product general liability, and client property loss claims. We have also retained and provided for certain workers’ compensation insurance liabilities in conjunction with previously sold businesses. We are also self-insured for certain employee health benefits. Provisions for losses for claims incurred, including actuarially derived estimated claims incurred but not yet reported, are made based on historical experience, claims frequency, and other factors. We have purchased insurance for amounts in excess of the self-insured levels.
Impact of Recent Accounting Pronouncements
Refer to Note 1 – Overview and Summary of Significant Accounting Policies of the Notes to Consolidated Financial Statements (Part II, Item 8 of this 2020 Form 10-K) for further information.
Non-GAAP Measures
In addition to disclosing financial results that are determined in accordance with U.S. generally accepted accounting principles (“GAAP”), we also disclose the following non-GAAP financial measures: Segment operating income (loss), organic revenue, and organic segment operating income (loss) (collectively, the “Non-GAAP Measures”). Our use of Non-GAAP Measures is supplemental to, but not as a substitute for, other measures of financial performance reported in accordance with GAAP. As not all companies use identical calculations, our Non-GAAP Measures may not be comparable to similarly titled measures used by other companies. We believe that our use of Non-GAAP Measures provides useful information to investors regarding our results of operations for trending, analyzing, and benchmarking our performance and the value of our business.
31
|
|
• |
“Segment operating income (loss)” is net income (loss) attributable to Viad before income (loss) from discontinued operations, corporate activities, interest expense and interest income, income taxes, restructuring charges, impairment charges and recoveries, and the reduction for income attributable to noncontrolling interest. Segment operating income (loss) is used to measure the profit and performance of our operating segments to facilitate period-to-period comparisons. Refer to Note 23 – Segment Information of the Notes to Consolidated Financial Statements (Part II, Item 8 of this 2020 Form 10-K) for a reconciliation of segment operating income (loss) to income (loss) from continuing operations before income taxes. |
|
|
• |
“Organic revenue” and “organic segment operating income (loss)” are revenue and segment operating income (loss) (as defined above), respectively, without the impact of exchange rate variances and acquisitions, if any, until such acquisitions are included in the entirety of both comparable periods. The impact of exchange rate variances is calculated as the difference between current period activity translated at the current period’s exchange rates and the comparable prior period’s exchange rates. We believe the presentation of “organic” results permits investors to better understand our performance without the effects of exchange rate variances or acquisitions and to facilitate period-to-period comparisons and analysis of our operating performance. Refer to the “Results of Operations” section of this MD&A for reconciliations of organic revenue and organic segment operating income (loss) to the most directly comparable GAAP measures. |
We believe non-GAAP Measures are useful operating metrics as they eliminate potential variations arising from taxes, debt service costs, impairment charges and recoveries, and the effects of discontinued operations, resulting in additional measures considered to be indicative of our ongoing operations and segment performance. Although we use Non-GAAP Measures to assess the performance of our business, the use of these measures is limited because these measures do not consider material costs, expenses, and other items necessary to operate our business. These items include debt service costs, expenses related to U.S. federal, state, local and foreign income taxes, impairment charges and recoveries, and the effects of discontinued operations. As the Non-GAAP Measures do not consider these items, net income (loss) attributable to Viad should be considered as an important measure of financial performance because it provides a more complete measure of our performance.
Item 7A. Quantitative and Qualitative Disclosures About Market Risk
Our market risk exposure relates to fluctuations in foreign exchange rates and interest rates. Foreign exchange risk is the risk that fluctuating exchange rates will adversely affect our financial condition or results of operations. Interest rate risk is the risk that changing interest rates will adversely affect our financial position or results of operations.
Our foreign operations are primarily in Canada, the United Kingdom, Iceland, the Netherlands, and Germany. The functional currency of our foreign subsidiaries is their local currency. Accordingly, for purposes of consolidation, we translate the assets and liabilities of our foreign subsidiaries into U.S. dollars at the foreign exchange rates in effect at the balance sheet date. The unrealized gains or losses resulting from the translation of these foreign denominated assets and liabilities are included as a component of accumulated other comprehensive income (loss) in the Consolidated Balance Sheets. As a result, significant fluctuations in foreign exchange rates relative to the U.S. dollar may result in material changes to our net equity position reported in the Consolidated Balance Sheets. We do not currently hedge our equity risk arising from the translation of foreign denominated assets and liabilities. We recorded cumulative unrealized foreign currency translation losses in stockholders’ equity of $16.7 million as of December 31, 2020 and $23.8 million as of December 31, 2019. We recorded unrealized foreign currency translation gains in other comprehensive income of $7.1 million during the year ended December 31, 2020 and $12.5 million during the year ended December 31, 2019.
For purposes of consolidation, revenue, expenses, gains, and losses related to our foreign operations are translated into U.S. dollars at the average foreign exchange rates for the period. As a result, our consolidated results of operations are exposed to fluctuations in foreign exchange rates as revenue and segment operating income (loss) of our foreign operations, when translated, may vary from period to period, even when the functional currency amounts have not changed. Such fluctuations may adversely impact overall expected profitability and historical period-to-period comparisons. We do not currently hedge our net earnings exposure arising from the translation of our foreign revenue and segment operating income (loss). Refer to “Management’s Discussion and Analysis of Financial Condition and Results of Operations – Foreign Exchange Rate Variances” (Part II, Item 7 of this 2020 Form 10-K) for a further discussion.
A hypothetical change of 10% in the Canadian dollar exchange rate would result in a change to 2020 operating loss of approximately $2.1 million. A hypothetical change of 10% in the British pound exchange rate would result in a change to 2020 operating loss of approximately $1.0 million. A hypothetical change of 10% in the Euro exchange rate would result in a change to 2020 operating loss of approximately $0.4 million.
We are exposed to foreign exchange transaction risk, as our foreign subsidiaries have certain revenue transactions denominated in currencies other than the functional currency of the respective subsidiary. From time to time, we utilize forward contracts to mitigate the impact on earnings related to these transactions due to fluctuations in foreign exchange rates. As of December 31, 2020 and 2019, we did not have any outstanding foreign currency forward contracts.
32
We are exposed to short-term and long-term interest rate risk on certain of our debt obligations. A hypothetical change of 10% in interest rates would result in a change to 2020 interest expense of approximately $2 million.
We do not currently use derivative financial instruments to hedge cash flows for such obligations.
33
Item 8. Financial Statements and Supplementary Data
INDEX TO FINANCIAL STATEMENTS
|
|
|
|
|
Page |
|
35 |
|
|
36 |
|
|
37 |
|
|
Consolidated Statements of Stockholders’ Equity and Mezzanine Equity |
38 |
|
39 |
|
|
40 |
|
|
82 |
|
|
93 |
34
VIAD CORP
CONSOLIDATED BALANCE SHEETS
|
|
|
December 31, |
|
|||||
|
(in thousands, except share data) |
|
2020 |
|
|
2019 |
|
||
|
Assets |
|
|
|
|
|
|
|
|
|
Current assets |
|
|
|
|
|
|
|
|
|
Cash and cash equivalents |
|
$ |
|
|
|
$ |
|
|
|
Accounts receivable, net of allowances for doubtful accounts of $ respectively |
|
|
|
|
|
|
|
|
|
Inventories |
|
|
|
|
|
|
|
|
|
Current contract costs |
|
|
|
|
|
|
|
|
|
Other current assets |
|
|
|
|
|
|
|
|
|
Total current assets |
|
|
|
|
|
|
|
|
|
Property and equipment, net |
|
|
|
|
|
|
|
|
|
Other investments and assets |
|
|
|
|
|
|
|
|
|
Operating lease right-of-use assets |
|
|
|
|
|
|
|
|
|
Deferred income taxes |
|
|
|
|
|
|
|
|
|
Goodwill |
|
|
|
|
|
|
|
|
|
Other intangible assets, net |
|
|
|
|
|
|
|
|
|
Total Assets |
|
$ |
|
|
|
$ |
|
|
|
Liabilities, Mezzanine Equity, and Stockholders’ Equity |
|
|
|
|
|
|
|
|
|
Current liabilities |
|
|
|
|
|
|
|
|
|
Accounts payable |
|
$ |
|
|
|
$ |
|
|
|
Contract liabilities |
|
|
|
|
|
|
|
|
|
Accrued compensation |
|
|
|
|
|
|
|
|
|
Operating lease obligations |
|
|
|
|
|
|
|
|
|
Other current liabilities |
|
|
|
|
|
|
|
|
|
Current portion of debt and finance lease obligations |
|
|
|
|
|
|
|
|
|
Total current liabilities |
|
|
|
|
|
|
|
|
|
Long-term debt and finance lease obligations |
|
|
|
|
|
|
|
|
|
Pension and postretirement benefits |
|
|
|
|
|
|
|
|
|
Long-term operating lease obligations |
|
|
|
|
|
|
|
|
|
Other deferred items and liabilities |
|
|
|
|
|
|
|
|
|
Total liabilities |
|
|
|
|
|
|
|
|
|
Commitments and contingencies |
|
|
|
|
|
|
|
|
|
Convertible Series A Preferred Stock, $ |
|
|
|
|
|
|
— |
|
|
Redeemable noncontrolling interest |
|
|
|
|
|
|
|
|
|
Stockholders’ equity |
|
|
|
|
|
|
|
|
|
Viad Corp stockholders’ equity: |
|
|
|
|
|
|
|
|
|
Common stock, $ issued and outstanding |
|
|
|
|
|
|
|
|
|
Additional capital |
|
|
|
|
|
|
|
|
|
Retained earnings (deficit) |
|
|
( |
) |
|
|
|
|
|
Accumulated other comprehensive loss |
|
|
( |
) |
|
|
( |
) |
|
Common stock in treasury, at cost, |
|
|
( |
) |
|
|
( |
) |
|
Total Viad stockholders’ equity |
|
|
|
|
|
|
|
|
|
Non-redeemable noncontrolling interest |
|
|
|
|
|
|
|
|
|
Total stockholders’ equity |
|
|
|
|
|
|
|
|
|
Total Liabilities, Mezzanine Equity, and Stockholders’ Equity |
|
$ |
|
|
|
$ |
|
|
Refer to Notes to Consolidated Financial Statements.
35
VIAD CORP
CONSOLIDATED STATEMENTS OF OPERATIONS
|
|
|
Year Ended December 31, |
|
|||||||||
|
(in thousands, except per share data) |
|
2020 |
|
|
2019 |
|
|
2018 |
|
|||
|
Revenue: |
|
|
|
|
|
|
|
|
|
|
|
|
|
Services |
|
$ |
|
|
|
$ |
|
|
|
$ |
|
|
|
Products |
|
|
|
|
|
|
|
|
|
|
|
|
|
Total revenue |
|
|
|
|
|
|
|
|
|
|
|
|
|
Costs and expenses: |
|
|
|
|
|
|
|
|
|
|
|
|
|
Costs of services |
|
|
|
|
|
|
|
|
|
|
|
|
|
Costs of products |
|
|
|
|
|
|
|
|
|
|
|
|
|
Business interruption gain |
|
|
— |
|
|
|
( |
) |
|
|
( |
) |
|
Corporate activities |
|
|
|
|
|
|
|
|
|
|
|
|
|
Interest income |
|
|
( |
) |
|
|
( |
) |
|
|
( |
) |
|
Interest expense |
|
|
|
|
|
|
|
|
|
|
|
|
|
Multi-employer pension plan withdrawal |
|
|
|
|
|
|
|
|
|
|
— |
|
|
Other expense, net |
|
|
|
|
|
|
|
|
|
|
|
|
|
Restructuring charges |
|
|
|
|
|
|
|
|
|
|
|
|
|
Legal settlement |
|
|
— |
|
|
|
|
|
|
|
— |
|
|
Impairment charges (recoveries) |
|
|
|
|
|
|
|
|
|
|
( |
) |
|
Total costs and expenses |
|
|
|
|
|
|
|
|
|
|
|
|
|
Income (loss) from continuing operations before income taxes |
|
|
( |
) |
|
|
|
|
|
|
|
|
|
Income tax expense |
|
|
|
|
|
|
|
|
|
|
|
|
|
Income (loss) from continuing operations |
|
|
( |
) |
|
|
|
|
|
|
|
|
|
Income (loss) from discontinued operations |
|
|
( |
) |
|
|
( |
) |
|
|
|
|
|
Net income (loss) |
|
|
( |
) |
|
|
|
|
|
|
|
|
|
Net (income) loss attributable to non-redeemable noncontrolling interest |
|
|
|
|
|
|
( |
) |
|
|
( |
) |
|
Net loss attributable to redeemable noncontrolling interest |
|
|
|
|
|
|
|
|
|
|
|
|
|
Net income (loss) attributable to Viad |
|
$ |
( |
) |
|
$ |
|
|
|
$ |
|
|
|
Diluted income (loss) per common share: |
|
|
|
|
|
|
|
|
|
|
|
|
|
Continuing operations attributable to Viad common stockholders |
|
$ |
( |
) |
|
$ |
|
|
|
$ |
|
|
|
Discontinued operations attributable to Viad common stockholders |
|
|
( |
) |
|
|
— |
|
|
|
|
|
|
Net income (loss) attributable to Viad common stockholders |
|
$ |
( |
) |
|
$ |
|
|
|
$ |
|
|
|
Weighted-average outstanding and potentially dilutive common shares |
|
|
|
|
|
|
|
|
|
|
|
|
|
Basic income (loss) per common share: |
|
|
|
|
|
|
|
|
|
|
|
|
|
Continuing operations attributable to Viad common stockholders |
|
$ |
( |
) |
|
$ |
|
|
|
$ |
|
|
|
Discontinued operations attributable to Viad common stockholders |
|
|
( |
) |
|
|
— |
|
|
|
|
|
|
Net income (loss) attributable to Viad common stockholders |
|
$ |
( |
) |
|
$ |
|
|
|
$ |
|
|
|
Weighted-average outstanding common shares |
|
|
|
|
|
|
|
|
|
|
|
|
|
Dividends declared per common share |
|
$ |
|
|
|
$ |
|
|
|
$ |
|
|
|
Amounts attributable to Viad common stockholders |
|
|
|
|
|
|
|
|
|
|
|
|
|
Income (loss) from continuing operations |
|
$ |
( |
) |
|
$ |
|
|
|
$ |
|
|
|
Income (loss) from discontinued operations |
|
|
( |
) |
|
|
( |
) |
|
|
|
|
|
Net income (loss) |
|
$ |
( |
) |
|
$ |
|
|
|
$ |
|
|
Refer to Notes to Consolidated Financial Statements.
36
VIAD CORP
CONSOLIDATED STATEMENTS OF COMPREHENSIVE INCOME (LOSS)
|
|
|
Year Ended December 31, |
|
|||||||||
|
(in thousands) |
|
2020 |
|
|
2019 |
|
|
2018 |
|
|||
|
Net income (loss) |
|
$ |
( |
) |
|
$ |
|
|
|
$ |
|
|
|
Other comprehensive income (loss): |
|
|
|
|
|
|
|
|
|
|
|
|
|
Unrealized foreign currency translation adjustments |
|
|
|
|
|
|
|
|
|
|
( |
) |
|
Change in net actuarial loss, net of tax effects of $( |
|
|
( |
) |
|
|
( |
) |
|
|
|
|
|
Change in prior service cost, net of tax effects of $( |
|
|
( |
) |
|
|
( |
) |
|
|
( |
) |
|
Comprehensive income (loss) |
|
|
( |
) |
|
|
|
|
|
|
|
|
|
Non-redeemable noncontrolling interest: |
|
|
|
|
|
|
|
|
|
|
|
|
|
Comprehensive (income) loss attributable to non-redeemable noncontrolling interest |
|
|
|
|
|
|
( |
) |
|
|
( |
) |
|
Unrealized foreign currency translation adjustments |
|
|
|
|
|
|
|
|
|
|
— |
|
|
Redeemable noncontrolling interest: |
|
|
|
|
|
|
|
|
|
|
|
|
|
Comprehensive loss attributable to redeemable noncontrolling interest |
|
|
|
|
|
|
|
|
|
|
|
|
|
Comprehensive income (loss) attributable to Viad |
|
$ |
( |
) |
|
$ |
|
|
|
$ |
|
|
Refer to Notes to Consolidated Financial Statements.
37
VIAD CORP
CONSOLIDATED STATEMENTS OF STOCKHOLDERS’ EQUITY AND MEZZANINE EQUITY
|
|
|
|
|
|
|
|
|
|
|
|
|
|
|
|
|
|
|
|
|
|
|
|
|
|
|
|
|
|
|
|
|
|
|
|
|
|
|
|
|
|
Mezzanine Equity |
|
|||||
|
(in thousands) |
|
Common Stock |
|
|
Additional Capital |
|
|
Retained Earnings (Deficit) |
|
|
Unearned Employee Benefits and Other |
|
|
Accumulated Other Comprehensive Income (Loss) |
|
|
Common Stock in Treasury |
|
|
Total Viad Equity |
|
|
Non-Redeemable Non-Controlling Interest |
|
|
Total Stockholders’ Equity |
|
|
|
|
|
Redeemable Non-Controlling Interest |
|
|
Convertible Series A Preferred Stock |
|
|||||||||||
|
Balance, December 31, 2017 |
|
$ |
|
|
|
$ |
|
|
|
$ |
|
|
|
$ |
|
|
|
$ |
( |
) |
|
$ |
( |
) |
|
$ |
|
|
|
$ |
|
|
|
$ |
|
|
|
|
|
|
$ |
|
|
|
$ |
— |
|
|
Net income |
|
|
— |
|
|
|
— |
|
|
|
|
|
|
|
— |
|
|
|
— |
|
|
|
— |
|
|
|
|
|
|
|
|
|
|
|
|
|
|
|
|
|
|
( |
) |
|
|
— |
|
|
Dividends on common stock ($ |
|
|
— |
|
|
|
— |
|
|
|
( |
) |
|
|
— |
|
|
|
— |
|
|
|
— |
|
|
|
( |
) |
|
|
— |
|
|
|
( |
) |
|
|
|
|
|
— |
|
|
|
— |
|
|
Payment of payroll taxes on stock-based compensation through shares withheld |
|
|
— |
|
|
|
— |
|
|
|
— |
|
|
|
— |
|
|
|
— |
|
|
|
( |
) |
|
|
( |
) |
|
|
— |
|
|
|
( |
) |
|
|
|
|
|
— |
|
|
|
— |
|
|
Common stock purchased for treasury |
|
|
— |
|
|
|
— |
|
|
|
— |
|
|
|
— |
|
|
|
— |
|
|
|
( |
) |
|
|
( |
) |
|
|
— |
|
|
|
( |
) |
|
|
|
|
|
— |
|
|
|
— |
|
|
Employee benefit plans |
|
|
— |
|
|
|
( |
) |
|
|
— |
|
|
|
— |
|
|
|
— |
|
|
|
|
|
|
|
|
|
|
|
— |
|
|
|
|
|
|
|
|
|
|
— |
|
|
|
— |
|
|
Share-based compensation - equity awards |
|
|
— |
|
|
|
|
|
|
|
— |
|
|
|
— |
|
|
|
— |
|
|
|
— |
|
|
|
|
|
|
|
— |
|
|
|
|
|
|
|
|
|
|
— |
|
|
|
— |
|
|
Unrealized foreign currency translation adjustment |
|
|
— |
|
|
|
— |
|
|
|
— |
|
|
|
— |
|
|
|
( |
) |
|
|
— |
|
|
|
( |
) |
|
|
— |
|
|
|
( |
) |
|
|
|
|
|
( |
) |
|
|
— |
|
|
Amortization of net actuarial gain, net of tax |
|
|
— |
|
|
|
— |
|
|
|
— |
|
|
|
— |
|
|
|
|
|
|
|
— |
|
|
|
|
|
|
|
— |
|
|
|
|
|
|
|
|
|
|
— |
|
|
|
— |
|
|
Amortization of prior service cost, net of tax |
|
|
— |
|
|
|
— |
|
|
|
— |
|
|
|
— |
|
|
|
( |
) |
|
|
— |
|
|
|
( |
) |
|
|
— |
|
|
|
( |
) |
|
|
|
|
|
— |
|
|
|
— |
|
|
Adoption of ASU 2016-01 |
|
|
— |
|
|
|
— |
|
|
|
|
|
|
|
— |
|
|
|
( |
) |
|
|
— |
|
|
|
— |
|
|
|
— |
|
|
|
— |
|
|
|
|
|
|
— |
|
|
|
— |
|
|
Adoption of ASU 2018-02 |
|
|
— |
|
|
|
— |
|
|
|
|
|
|
|
— |
|
|
|
( |
) |
|
|
— |
|
|
|
— |
|
|
|
— |
|
|
|
— |
|
|
|
|
|
|
— |
|
|
|
— |
|
|
Other, net |
|
|
— |
|
|
|
( |
) |
|
|
( |
) |
|
|
( |
) |
|
|
— |
|
|
|
|
|
|
|
( |
) |
|
|
— |
|
|
|
( |
) |
|
|
|
|
|
|
|
|
|
— |
|
|
Balance, December 31, 2018 |
|
$ |
|
|
|
$ |
|
|
|
$ |
|
|
|
$ |
|
|
|
$ |
( |
) |
|
$ |
( |
) |
|
$ |
|
|
|
$ |
|
|
|
$ |
|
|
|
|
|
|
$ |
|
|
|
$ |
— |
|
|
Net income |
|
|
— |
|
|
|
— |
|
|
|
|
|
|
|
— |
|
|
|
— |
|
|
|
— |
|
|
|
|
|
|
|
|
|
|
|
|
|
|
|
|
|
|
( |
) |
|
|
— |
|
|
Dividends on common stock ($ |
|
|
— |
|
|
|
— |
|
|
|
( |
) |
|
|
— |
|
|
|
— |
|
|
|
— |
|
|
|
( |
) |
|
|
— |
|
|
|
( |
) |
|
|
|
|
|
— |
|
|
|
— |
|
|
Distributions to noncontrolling interest |
|
|
— |
|
|
|
— |
|
|
|
— |
|
|
|
— |
|
|
|
— |
|
|
|
— |
|
|
|
— |
|
|
|
( |
) |
|
|
( |
) |
|
|
|
|
|
— |
|
|
|
— |
|
|
Payment of payroll taxes on stock-based compensation through shares withheld |
|
|
— |
|
|
|
— |
|
|
|
— |
|
|
|
— |
|
|
|
— |
|
|
|
( |
) |
|
|
( |
) |
|
|
— |
|
|
|
( |
) |
|
|
|
|
|
— |
|
|
|
— |
|
|
Employee benefit plans |
|
|
— |
|
|
|
( |
) |
|
|
— |
|
|
|
— |
|
|
|
— |
|
|
|
|
|
|
|
|
|
|
|
— |
|
|
|
|
|
|
|
|
|
|
— |
|
|
|
— |
|
|
Share-based compensation - equity awards |
|
|
— |
|
|
|
|
|
|
|
— |
|
|
|
— |
|
|
|
— |
|
|
|
— |
|
|
|
|
|
|
|
— |
|
|
|
|
|
|
|
|
|
|
— |
|
|
|
— |
|
|
Unrealized foreign currency translation adjustment |
|
|
— |
|
|
|
— |
|
|
|
— |
|
|
|
— |
|
|
|
|
|
|
|
— |
|
|
|
|
|
|
|
|
|
|
|
|
|
|
|
|
|
|
( |
) |
|
|
— |
|
|
Amortization of net actuarial loss, net of tax |
|
|
— |
|
|
|
— |
|
|
|
— |
|
|
|
— |
|
|
|
( |
) |
|
|
— |
|
|
|
( |
) |
|
|
— |
|
|
|
( |
) |
|
|
|
|
|
— |
|
|
|
— |
|
|
Amortization of prior service cost, net of tax |
|
|
— |
|
|
|
— |
|
|
|
— |
|
|
|
— |
|
|
|
( |
) |
|
|
— |
|
|
|
( |
) |
|
|
— |
|
|
|
( |
) |
|
|
|
|
|
— |
|
|
|
— |
|
|
Acquisitions |
|
|
— |
|
|
|
— |
|
|
|
— |
|
|
|
— |
|
|
|
— |
|
|
|
— |
|
|
|
— |
|
|
|
|
|
|
|
|
|
|
|
|
|
|
— |
|
|
|
— |
|
|
Other, net |
|
|
— |
|
|
|
|
|
|
|
( |
) |
|
|
( |
) |
|
|
— |
|
|
|
( |
) |
|
|
( |
) |
|
|
— |
|
|
|
( |
) |
|
|
|
|
|
|
|
|
|
— |
|
|
Balance, December 31, 2019 |
|
$ |
|
|
|
$ |
|
|
|
$ |
|
|
|
$ |
— |
|
|
$ |
( |
) |
|
$ |
( |
) |
|
$ |
|
|
|
$ |
|
|
|
$ |
|
|
|
|
|
|
$ |
|
|
|
$ |
— |
|
|
Net loss |
|
|
— |
|
|
|
— |
|
|
|
( |
) |
|
|
— |
|
|
|
— |
|
|
|
— |
|
|
|
( |
) |
|
|
( |
) |
|
|
( |
) |
|
|
|
|
|
( |
) |
|
|
— |
|
|
Dividends on common stock ($ |
|
|
— |
|
|
|
— |
|
|
|
( |
) |
|
|
— |
|
|
|
— |
|
|
|
— |
|
|
|
( |
) |
|
|
— |
|
|
|
( |
) |
|
|
|
|
|
— |
|
|
|
— |
|
|
Issuance of Series A convertible preferred stock |
|
|
— |
|
|
|
— |
|
|
|
— |
|
|
|
— |
|
|
|
— |
|
|
|
— |
|
|
|
— |
|
|
|
— |
|
|
|
— |
|
|
|
|
|
|
— |
|
|
|
|
|
|
Dividends on convertible preferred stock |
|
|
— |
|
|
|
( |
) |
|
|
— |
|
|
|
— |
|
|
|
— |
|
|
|
— |
|
|
|
( |
) |
|
|
— |
|
|
|
( |
) |
|
|
|
|
|
— |
|
|
|
|
|
|
Distributions to noncontrolling interest |
|
|
— |
|
|
|
— |
|
|
|
— |
|
|
|
— |
|
|
|
— |
|
|
|
— |
|
|
|
— |
|
|
|
( |
) |
|
|
( |
) |
|
|
|
|
|
— |
|
|
|
— |
|
|
Payment of payroll taxes on stock-based compensation through shares withheld |
|
|
— |
|
|
|
— |
|
|
|
— |
|
|
|
— |
|
|
|
— |
|
|
|
( |
) |
|
|
( |
) |
|
|
— |
|
|
|
( |
) |
|
|
|
|
|
— |
|
|
|
— |
|
|
Common stock purchased for treasury |
|
|
— |
|
|
|
— |
|
|
|
— |
|
|
|
— |
|
|
|
— |
|
|
|
( |
) |
|
|
( |
) |
|
|
— |
|
|
|
( |
) |
|
|
|
|
|
— |
|
|
|
— |
|
|
Employee benefit plans |
|
|
— |
|
|
|
( |
) |
|
|
— |
|
|
|
— |
|
|
|
— |
|
|
|
|
|
|
|
|
|
|
|
— |
|
|
|
|
|
|
|
|
|
|
— |
|
|
|
— |
|
|
Share-based compensation - equity awards |
|
|
— |
|
|
|
|
|
|
|
— |
|
|
|
— |
|
|
|
— |
|
|
|
— |
|
|
|
|
|
|
|
— |
|
|
|
|
|
|
|
|
|
|
— |
|
|
|
— |
|
|
Unrealized foreign currency translation adjustment |
|
|
— |
|
|
|
— |
|
|
|
— |
|
|
|
— |
|
|
|
|
|
|
|
— |
|
|
|
|
|
|
|
|
|
|
|
|
|
|
|
|
|
|
( |
) |
|
|
— |
|
|
Amortization of net actuarial loss, net of tax |
|
|
— |
|
|
|
— |
|
|
|
— |
|
|
|
— |
|
|
|
( |
) |
|
|
— |
|
|
|
( |
) |
|
|
— |
|
|
|
( |
) |
|
|
|
|
|
— |
|
|
|
— |
|
|
Amortization of prior service cost, net of tax |
|
|
— |
|
|
|
— |
|
|
|
— |
|
|
|
— |
|
|
|
( |
) |
|
|
— |
|
|
|
( |
) |
|
|
— |
|
|
|
( |
) |
|
|
|
|
|
— |
|
|
|
— |
|
|
Other, net |
|
|
— |
|
|
|
|
|
|
|
( |
) |
|
|
— |
|
|
|
— |
|
|
|
— |
|
|
|
|
|
|
|
— |
|
|
|
|
|
|
|
|
|
|
|
|
|
|
— |
|
|
Balance, December 31, 2020 |
|
$ |
|
|
|
$ |
|
|
|
$ |
( |
) |
|
$ |
— |
|
|
$ |
( |
) |
|
$ |
( |
) |
|
$ |
|
|
|
$ |
|
|
|
$ |
|
|
|
|
|
|
$ |
|
|
|
$ |
|
|
Refer to Notes to Consolidated Financial Statements.
38
VIAD CORP
CONSOLIDATED STATEMENTS OF CASH FLOWS
|
|
|
|
|
|
|
|
|
|||||
|
|
|
Year Ended December 31, |
|
|||||||||
|
(in thousands) |
|
2020 |
|
|
2019 |
|
|
2018 |
|
|||
|
Cash flows from operating activities |
|
|
|
|
|
|
|
|
|
|
|
|
|
Net income (loss) |
|
$ |
( |
) |
|
$ |
|
|
|
$ |
|
|
|
Adjustments to reconcile net income (loss) to net cash provided by (used in) operating activities: |
|
|
|
|
|
|
|
|
|
|
|
|
|
Depreciation and amortization |
|
|
|
|
|
|
|
|
|
|
|
|
|
Deferred income taxes |
|
|
|
|
|
|
( |
) |
|
|
|
|
|
(Income) loss from discontinued operations |
|
|
|
|
|
|
|
|
|
|
( |
) |
|
Restructuring charges |
|
|
|
|
|
|
|
|
|
|
|
|
|
Legal settlement |
|
|
— |
|
|
|
|
|
|
|
— |
|
|
Impairment charges (recoveries) |
|
|
|
|
|
|
|
|
|
|
( |
) |
|
(Gains) losses on dispositions of property and other assets |
|
|
( |
) |
|
|
( |
) |
|
|
|
|
|
Share-based compensation expense |
|
|
|
|
|
|
|
|
|
|
|
|
|
Multi-employer pension plan withdrawal |
|
|
|
|
|
|
|
|
|
|
— |
|
|
Other non-cash items, net |
|
|
|
|
|
|
|
|
|
|
|
|
|
Change in operating assets and liabilities (excluding the impact of acquisitions): |
|
|
|
|
|
|
|
|
|
|
|
|
|
Receivables |
|
|
|
|
|
|
( |
) |
|
|
( |
) |
|
Inventories |
|
|
|
|
|
|
( |
) |
|
|
( |
) |
|
Current contract costs |
|
|
|
|
|
|
( |
) |
|
|
( |
) |
|
Accounts payable |
|
|
( |
) |
|
|
|
|
|
|
( |
) |
|
Restructuring liabilities |
|
|
( |
) |
|
|
( |
) |
|
|
( |
) |
|
Accrued compensation |
|
|
( |
) |
|
|
|
|
|
|
( |
) |
|
Contract liabilities |
|
|
( |
) |
|
|
|
|
|
|
|
|
|
Income taxes payable |
|
|
|
|
|
|
|
|
|
|
( |
) |
|
Other assets and liabilities, net |
|
|
|
|
|
|
( |
) |
|
|
|
|
|
Net cash (used in) provided by operating activities |
|
|
( |
) |
|
|
|
|
|
|
|
|
|
Cash flows from investing activities |
|
|
|
|
|
|
|
|
|
|
|
|
|
Capital expenditures |
|
|
( |
) |
|
|
( |
) |
|
|
( |
) |
|
Cash surrender value of life insurance policies |
|
|
|
|
|
|
— |
|
|
|
— |
|
|
Cash paid for acquisitions, net |
|
|
— |
|
|
|
( |
) |
|
|
( |
) |
|
Proceeds from dispositions of property and other assets |
|
|
|
|
|
|
|
|
|
|
|
|
|
Net cash used in investing activities |
|
|
( |
) |
|
|
( |
) |
|
|
( |
) |
|
Cash flows from financing activities |
|
|
|
|
|
|
|
|
|
|
|
|
|
Proceeds from borrowings |
|
|
|
|
|
|
|
|
|
|
|
|
|
Payments on debt and finance lease obligations |
|
|
( |
) |
|
|
( |
) |
|
|
( |
) |
|
Dividends paid on common stock |
|
|
( |
) |
|
|
( |
) |
|
|
( |
) |
|
Distributions to noncontrolling interest |
|
|
( |
) |
|
|
( |
) |
|
|
— |
|
|
Payments of debt issuance costs |
|
|
( |
) |
|
|
( |
) |
|
|
( |
) |
|
Payment of payroll taxes on stock-based compensation through shares withheld or repurchased |
|
|
( |
) |
|
|
( |
) |
|
|
( |
) |
|
Common stock purchased for treasury |
|
|
( |
) |
|
|
— |
|
|
|
( |
) |
|
Proceeds from issuance of Convertible Series A Preferred Stock, net of issuance costs |
|
|
|
|
|
|
|
|
|
|
|
|
|
Proceeds from exercise of stock options |
|
|
|
|
|
|
|
|
|
|
|
|
|
Net cash provided by (used in) financing activities |
|
|
|
|
|
|
|
|
|
|
( |
) |
|
Effect of exchange rate changes on cash, cash equivalents, and restricted cash |
|
|
|
|
|
|
|
|
|
|
( |
) |
|
Net change in cash, cash equivalents, and restricted cash |
|
|
( |
) |
|
|
|
|
|
|
( |
) |
|
Cash, cash equivalents, and restricted cash, beginning of year |
|
|
|
|
|
|
|
|
|
|
|
|
|
Cash, cash equivalents, and restricted cash, end of year |
|
$ |
|
|
|
$ |
|
|
|
$ |
|
|
Refer to Notes to Consolidated Financial Statements.
39
VIAD CORP
NOTES TO CONSOLIDATED FINANCIAL STATEMENTS
Note 1. Overview and Summary of Significant Accounting Policies
Basis of Presentation and Principles of Consolidation
The accompanying consolidated financial statements were prepared in accordance with accounting principles generally accepted in the United States of America (“GAAP”) and include the accounts of Viad and its subsidiaries. All significant intercompany account balances and transactions have been eliminated in consolidation.
Nature of Business
We are a leading provider of experiential leisure travel and face-to-face events and marketing experiences company with operations in the U.S., Canada, the United Kingdom, continental Europe, the United Arab Emirates, and Iceland. We are committed to providing unforgettable experiences to our clients and guests. We operate through
GES
GES is a global, full-service live events company offering a comprehensive range of services to event organizers and corporate brand marketers. Event organizers schedule and run events from start to finish. Corporate brand marketers include exhibitors and domestic and international corporations that want to promote their brands, services and innovations, feature new products, and build business relationships. GES serves corporate brand marketers when they exhibit at shows and when GES is engaged to manage their global exhibit program or produce their proprietary corporate events.
Pursuit
Pursuit is a collection of inspiring and unforgettable travel experiences that includes recreational attractions, unique hotels and lodges, food and beverage, retail, sightseeing, and ground transportation services. Pursuit comprises the Banff Jasper Collection, the Alaska Collection, the Glacier Park Collection, and FlyOver.
Impact of COVID-19
On March 11, 2020, the World Health Organization declared COVID-19 a “pandemic.” COVID-19 has spread rapidly, with a high concentration of confirmed cases in the U.S. and other countries in which we operate. The rapid spread has resulted in authorities around the world implementing numerous measures to contain the virus, such as travel bans and restrictions, quarantines, shelter-in-place orders, and business shutdowns. The COVID-19 pandemic and these containment measures have had, and are expected to continue to have, a substantial negative impact on businesses around the world and on global, regional, and national economies.
The COVID-19 pandemic is having and will likely continue to have a significant and negative impact on our operations and financial performance, with live events largely shut down and severe tourism activity disruptions. In response to the COVID-19 pandemic, we implemented aggressive cost reduction measures to preserve cash, including furloughs, layoffs, mandatory unpaid time off, or salary reductions for all employees, and the reduction of discretionary spending. We continue to implement measures to successfully adapt for the long-term impact of COVID-19. During 2020, we secured additional capital to strengthen our liquidity position and amended our Second Amended and Restated Credit Agreement (the “2018 Credit Agreement”) to provide financial covenant relief and financial flexibility.
Investment Agreement
On August 5, 2020, we entered into an investment agreement with funds managed by private equity firm Crestview Partners (the “Investment Agreement”) who made an initial investment of $
40
Credit Agreement Amendment
On August 5, 2020, we entered into an amendment to our 2018 Credit Agreement, which, among other things, (i) waives our financial covenants until September 30, 2022 (the “Covenant Waiver Period”) and (ii) requires us to maintain minimum liquidity of $
Management anticipates that the initial cash proceeds from Crestview Partners, existing cash and cash equivalents, and the amendment to waive financial covenants within the 2018 Credit Agreement until September 30, 2022 will be sufficient to fund operations for at least the next 12 months.
Goodwill and Other Intangible Assets Impairments
Due to the deteriorating macroeconomic environment related to the COVID-19 pandemic, resulting in disruptions to our operations and the decline in our stock price, we determined interim triggering events had occurred in the first and second quarters of 2020, which required us to assess the carrying values of goodwill and intangible assets in accordance with Accounting Standards Codification (“ASC”) No. 350, Intangibles – Goodwill and Other. Based on this assessment, we recorded non-cash goodwill impairment charges of $
Correction to Prior Period Financial Statements
Subsequent to the issuance of the December 31, 2019 consolidated financial statements, we identified prior period errors related to the recognition of revenue of GES’ Corporate Accounts’ third-party services. Revenue from these services should have been recorded on a net basis to reflect only the fees received for arranging these services, whereas previously, we recorded this revenue on a gross basis, thus overstating revenue and cost of services by the same amount. As a result, we corrected the accompanying Consolidated Statements of Operations for the years ended December 31, 2019 and 2018 related to this gross-to-net adjustment.
We determined that the error is not material to the previously issued financial statements. Note 2 – Revenue and Related Contract Costs and Contract Liabilities, Note 23 – Segment Information, and Note 24 – Selected Quarterly Financial Information reflect this correction.
|
|
|
Year Ended December 31, |
|
|||||||||||||
|
|
|
2019 |
|
|
2018 |
|
||||||||||
|
(in thousands) |
|
Services Revenue |
|
|
Cost of Services |
|
|
Services Revenue |
|
|
Cost of Services |
|
||||
|
As previously reported |
|
$ |
|
|
|
$ |
|
|
|
$ |
|
|
|
$ |
|
|
|
Gross to net correction for GES North America |
|
|
( |
) |
|
|
( |
) |
|
|
( |
) |
|
|
( |
) |
|
Gross to net correction for GES EMEA |
|
|
( |
) |
|
|
( |
) |
|
|
( |
) |
|
|
( |
) |
|
Total as corrected |
|
$ |
|
|
|
$ |
|
|
|
$ |
|
|
|
$ |
|
|
Significant Accounting Policies
Use of Estimates
The preparation of financial statements in conformity with U.S. GAAP requires management to make estimates and assumptions that affect the reported amounts of assets and liabilities at the date of the financial statements and the reported amounts of revenue and expenses during the reported period. Estimates and assumptions are used in accounting for, among other things: impairment testing of recorded goodwill and intangible assets and long-lived assets; allowances for uncollectible accounts receivable; sales reserve allowances; provisions for income taxes, including uncertain tax positions; valuation allowances related to deferred tax assets; liabilities for losses related to self-insured liability claims; liabilities for losses related to environmental remediation obligations; sublease income associated with restructuring liabilities; pension and postretirement benefit costs and obligations; share-based compensation costs; the discount rates used to value lease obligations; the redemption value of redeemable noncontrolling interests; and the allocation of purchase price of acquired businesses. Actual results could differ from these and other estimates.
41
Cash, Cash Equivalents, and Restricted Cash
Cash equivalents are highly-liquid investments with remaining maturities when purchased of
Cash, cash equivalents, and restricted cash balances presented in the Consolidated Statements of Cash Flows consisted of the following:
|
|
|
December 31, |
|
|||||
|
(in thousands) |
|
2020 |
|
|
2019 |
|
||
|
Cash and cash equivalents |
|
$ |
|
|
|
$ |
|
|
|
Restricted cash included in other current assets |
|
|
|
|
|
|
|
|
|
Cash, cash equivalents, and restricted cash shown in the statement of cash flows |
|
$ |
|
|
|
$ |
|
|
Allowances for Doubtful Accounts
Allowances for doubtful accounts reflect the best estimate of probable losses inherent in the accounts receivable balance. The allowances for doubtful accounts, including a sales allowance for discounts at the time of sale, are based upon an evaluation of the aging of receivables, historical trends, and the current economic environment.
Inventories
We state inventories, which consist primarily of exhibit design and construction materials and supplies, as well as retail inventory, at the lower of cost (first-in, first-out and specific identification methods) or net realizable value.
Property and Equipment
Leases
We recognize a right-of-use (“ROU”) asset and lease liability on the balance sheet and classify leases as either finance or operating leases. The classification of the lease determines whether the lease expense is recognized on an effective interest method basis (finance lease) or on a straight-line basis (operating lease) over the lease term. In determining whether an agreement contains a lease, we consider if we have a right to control the use of the underlying asset during the lease term in exchange for an obligation to make lease payments arising from the lease. We recognize ROU assets and lease liabilities at commencement date, which is when the underlying asset is available for use to a lessee, based on the present value of lease payments over the lease term.
Our operating and finance leases are primarily facility, equipment, and land leases. Our facility leases comprise mainly manufacturing facilities, sales and design facilities, offices, storage and/or warehouses, and truck marshaling yards. These facility leases generally have lease terms ranging up to
If a lease contains a renewal option that is reasonably certain to be exercised, then the lease term includes the optional periods in measuring a ROU asset and lease liability. The reasonably certain threshold is evaluated at lease commencement and is typically met if we identify substantial economic incentives or termination penalties. We do not include variable leases and variable non-lease components in the calculation of the ROU asset and corresponding lease liability. For facility leases, variable lease costs include the costs of common area maintenance, taxes, and insurance for which we pay our lessors an estimate that is adjusted to actual expense on a quarterly or annual basis depending on the underlying contract terms. We expense these variable lease payments as incurred. Our lease agreements do not contain any significant residual value guarantees or restrictive covenants.
Substantially all of our lease agreements do not specify an implicit borrowing rate, and as such, we utilize an incremental borrowing rate based on lease term and country, in order to calculate the present value of our future lease payments. The discount rate represents a risk-adjusted rate on a collateralized basis and is the expected rate at which we would borrow funds to satisfy the scheduled lease liability payment streams commensurate with the lease term and the country.
We are also a lessor to third party tenants who either lease certain portions of facilities that we own or sublease certain portions of facilities that we lease. We record lease income from owned facilities as rental income and we record sublease income from leased
42
facilities against lease expense in the Consolidated Statements of Operations. We classify all of our leases for which we are the lessor as operating leases.
Goodwill
Goodwill is tested for impairment at the reporting unit level on an annual basis as of October 31, and between annual tests if an event occurs or circumstances change that would more-likely-than-not reduce the fair value of a reporting unit below its carrying value. We use a discounted expected future cash flow methodology (income approach) in order to estimate the fair value of our reporting units for purposes of goodwill impairment testing. The estimates and assumptions regarding expected future cash flows, discount rates, and terminal values require considerable judgment and are based on market conditions, financial forecasts, industry trends, and historical experience. These estimates, however, have inherent uncertainties and different assumptions could lead to materially different results.
Cash Surrender Value of Life Insurance
We had Company-owned life insurance contracts that were intended to fund the cost of certain employee compensation and benefit programs. These contracts were carried at cash surrender value, net of outstanding policy loans. The cash surrender value represented the amount of cash we could receive if the policies were discontinued before maturity. The changes in the cash surrender value of the policies, net of insurance premiums, were included as a component of “Costs of services” in the Consolidated Statements of Operations. In 2020, we terminated the life insurance policies and received cash proceeds of $
Self-Insurance Liabilities
We are self-insured up to certain limits for workers’ compensation and general liabilities, which includes automobile, product general liability, and client property loss claims. We have also retained and provided for certain workers’ compensation insurance liabilities in conjunction with previously sold operations. We are also self-insured for certain employee health benefits. Provisions for losses for claims incurred, including actuarially derived estimated claims incurred but not yet reported, are made based on historical experience, claims frequency, and other factors. We have purchased insurance for amounts in excess of the self-insured levels.
Environmental Remediation Liabilities
Environmental remediation liabilities represent the estimated cost of environmental remediation obligations primarily associated with previously sold operations. The amounts accrued primarily consist of the estimated direct incremental costs, on an undiscounted basis, for contractor and other services related to remedial actions and post-remediation site monitoring. Environmental remediation liabilities are recorded when the specific obligation is considered probable and the costs are reasonably estimable. Subsequent recoveries from third parties, if any, are recorded through discontinued operations when realized. Environmental insurance is maintained that provides coverage for new and undiscovered pre-existing conditions at both our continuing and discontinued operations.
Fair Value of Financial Instruments
The carrying value of cash and cash equivalents, receivables, and accounts payable approximate fair value due to the short-term maturities of these instruments. Refer to Note 12 – Debt and Finance Lease Obligations for the estimated fair value of debt obligations.
Convertible Preferred Stock
We record shares of convertible preferred stock based on proceeds received net of costs on the date of issuance. Redeemable preferred stock (including preferred stock that features redemption rights that are either within the control of the holder or subject to redemption upon the occurrence of uncertain events not solely within our control) is classified as temporary equity and is reported between liabilities and stockholders’ equity in the Consolidated Balance Sheets.
Noncontrolling Interests – Non-redeemable and Redeemable
Non-redeemable noncontrolling interest represents the portion of equity in a subsidiary that is not attributable, directly or indirectly, to us. Our non-redeemable noncontrolling interest relates to the
We consider noncontrolling interests with redemption features that are not solely within our control to be redeemable noncontrolling interests. Our redeemable noncontrolling interest relates to our
43
Operations and the accretion of the redemption value is recorded as an adjustment to retained earnings (deficit) and is included in our income (loss) per share. Refer to Note 22 – Redeemable Noncontrolling Interest for additional information.
Foreign Currency Translation
Our foreign operations are primarily in Canada, the United Kingdom, Iceland, the Netherlands, Germany, and to a lesser extent, in certain other countries. The functional currency of our foreign subsidiaries is their local currency. Accordingly, for purposes of consolidation, we translate the assets and liabilities of our foreign subsidiaries into U.S. dollars at the foreign exchange rates in effect at the balance sheet date. The unrealized gains or losses resulting from the translation of these foreign denominated assets and liabilities are included as a component of accumulated other comprehensive income (loss) in the Consolidated Balance Sheets. For purposes of consolidation, revenue, expenses, gains, and losses related to our foreign operations are translated into U.S. dollars at the average foreign exchange rates for the period.
Revenue Recognition
Revenue is measured based on a specified amount of consideration in a contract with a customer, net of commissions paid to customers and amounts collected on behalf of third parties. We recognize revenue when a performance obligation is satisfied by transferring control of a product or service to a customer.
GES’ service revenue is primarily derived through its comprehensive range of services to event organizers and corporate brand marketers including Core Services, Event Technology, and Audio-visual. GES’ service revenue is earned over time over the duration of the exhibition, conference or corporate event, which generally lasts one to three days. Revenue for goods and services provided for which we do not have control of the goods or services before that good or service is transferred to a customer is recorded on a net basis to reflect only the fees received for arranging these services. GES’ product revenue is derived from the build of exhibits and environments and graphics. GES’ product revenue is recognized at a point in time upon delivery of the product.
Pursuit’s service revenue is derived through its admissions, accommodations, transportation, and travel planning services. Pursuit’s product revenue is derived through food and beverage and retail sales. Pursuit’s revenue is recognized at the time services are performed or upon delivery of the product. Pursuit’s service revenue is recognized over time as the customer simultaneously receives and consumes the benefits. Pursuit’s product revenue is recognized at a point in time.
Share-Based Compensation
Share-based compensation costs related to all share-based payment awards are recognized and measured using the fair value method of accounting. These awards generally include restricted stock awards, restricted stock units, performance units, and stock options, and contain forfeiture and non-compete provisions. We issue share-based payment awards from shares held in treasury. Future vesting is generally subject to continued employment. Holders of share-based awards have the right to receive dividends and vote the shares, but may not sell, assign, transfer, pledge, or otherwise encumber the stock, except to the extent restrictions have lapsed and in accordance with our stock trading policy.
We account for share-based payment awards that will be settled in cash as liability-based awards, which includes performance units and restricted stock units. We measure share-based compensation expense of liability-based awards at fair value at each reporting date until the date of settlement based on the number of units expected to vest and, where applicable, the level of achievement of predefined performance goals. These awards are remeasured on each reporting date based on our stock price and the Monte Carlo simulation model. A Monte Carlo simulation requires the use of several assumptions, including historical volatility and correlation between our stock price and the price of the common shares of a comparator group, a risk-free rate of return, and an expected term. Share-based compensation expense related to liability-based awards is recognized ratably over the requisite service period of approximately
We account for share-based awards that will be settled in shares of our common stock as equity-based awards, which include performance units, restricted stock units, and restricted stock awards. We measure share-based compensation expense of equity-based awards at fair value on the grant date on a straight-line basis over the vesting period. The estimated number of shares to be achieved is updated each reporting period based on the number of units expected to vest and, where applicable, the level of achievement of predefined performance goals, until the date of settlement. Share-based compensation expense related to equity-based awards is recognized ratably over the requisite service period ranging from
The fair value of stock option grants is estimated on the date of grant using the Black-Scholes stock option pricing model. We grant non-qualified stock options that are performance-based and service-based. The performance-based awards are recognized on a straight-line basis over the performance period ranging up to
44
Common Stock in Treasury
Common stock purchased for treasury is recorded at historical cost. Subsequent share reissuances are primarily related to share-based compensation programs and recorded at weighted-average cost.
Income (Loss) Per Common Share
Diluted income per common share is calculated using the more dilutive of the two-class method or as-converted method. The two-class method uses net income available to common stockholders and assumes conversion of all potential shares other than the participating securities. The as-converted method uses net income and assumes conversion of all potential shares including the participating securities. Dilutive potential common shares include outstanding stock options, unvested restricted share units and convertible preferred stock. We apply the two-class method in calculating income per common share as unvested share-based payment awards that contain nonforfeitable rights to dividends and preferred stock are considered participating securities. Accordingly, such securities are included in the earnings allocation in calculating income per share. The adjustment to the carrying value of the redeemable noncontrolling interest is reflected in income per common share.
Impact of Recent Accounting Pronouncements
The following table provides a brief description of recent accounting pronouncements:
|
Standard |
|
Description |
|
Date of adoption |
|
Effect on the financial statements |
|
Standards Not Yet Adopted |
||||||
|
ASU 2020-06, Debt - Debt with Conversion and Other Options (Subtopic 470-20) and Derivatives and Hedging - Contracts in Entity’s Own Equity (Subtopic 815-40) |
|
The amendment simplifies the accounting for convertible instruments by reducing the number of accounting models available for convertible debt instruments and convertible preferred stock. The amendment also requires expanded disclosures about the terms and features of convertible instruments. Early adoption is permitted, but no earlier than fiscal years beginning after December 15, 2020. |
|
1/1/2022 |
|
We are currently evaluating the potential impact of the adoption of this new guidance on our consolidated financial statements and if there are applicable provisions that will simplify our accounting or reporting we will likely pursue early adoption. |
|
Standard |
|
Description |
|
Date of adoption |
|
Effect on the financial statements |
|
Standards Recently Adopted |
||||||
|
ASU 2016-13, Financial Instruments – Credit Losses (Topic 326) - Measurement of Credit Losses on Financial Instruments |
|
The amendment eliminates the incurred credit loss impairment methodology and replaces it with an expected credit loss concept based on historical experience, current conditions, and reasonable and supportable forecasts. |
|
1/1/2020 |
|
We adopted this new standard on a modified retrospective basis. The adoption of this new standard on January 1, 2020 did not have a material impact on our consolidated financial statements. |
|
ASU 2020-04, Reference Rate Reform (Topic 848) |
|
The amendment provides temporary optional guidance to ease the potential burden in accounting for reference rate reform. Topic 848 provides optional expedients and exceptions for applying U.S. GAAP to transactions affected by reference rate reform if certain criteria are met. |
|
3/12/2020 |
|
Topic 848 was effective beginning on March 12, 2020, and we will apply the amendments prospectively through December 31, 2022. There was no impact to our consolidated financial statements as a result of adopting this amendment. |
|
ASU 2019-12, Income Taxes (Topic 740) Simplifying the Accounting for Income Taxes |
|
The amendment enhances and simplifies various aspects of the income tax accounting guidance, including requirements such as ownership changes in investments, and interim-period accounting for enacted changes in tax law. |
|
1/1/2021 |
|
The adoption of this new standard on January 1, 2021 did not have a material impact on our consolidated financial statements. |
Note 2. Revenue and Related Contract Costs and Contract Liabilities
GES’ performance obligations consist of services or product(s) outlined in a contract. While we often sign multi-year contracts for recurring events, the obligations for each occurrence are well defined and conclude upon the occurrence of each event. The obligations are typically the provision of services and/or sale of a product in connection with an exhibition, conference, or other event. Revenue for
45
goods and services provided for which we do not have control of the goods or services before that good or service is transferred to a customer is recorded on a net basis to reflect only the fees received for arranging these services. We recognize revenue for services generally at the close of the exhibition, conference, or corporate event. We recognize revenue for products either upon delivery to the customer’s location, upon delivery to an event that we are serving, or when we have the right to invoice. In circumstances where a customer cancels a contract, we generally have the right to bill the customer for costs incurred to date.
Pursuit’s performance obligations are short-term in nature. They include the provision of a hotel room, an attraction admission, a chartered or ticketed bus or van ride, the fulfillment of travel planning itineraries, and/or the sale of food, beverage, or retail products. Revenue is recognized when the service has been provided or the product has been delivered.
Contract Liabilities
GES and Pursuit typically receive customer deposits prior to transferring the related product or service to the customer. We record these deposits as a contract liability, which are recognized as revenue upon satisfaction of the related contract performance obligation(s). GES also provides customer rebates and volume discounts to certain event organizers that we recognize as a reduction of revenue. We include these amounts in the Consolidated Balance Sheets under the captions “Contract liabilities” and “Other deferred items and liabilities.” The decrease in contract liabilities for the year ended December 31, 2020 was primarily due to the reduction of planned shows in the first half of 2021 due to the COVID-19 pandemic.
Changes to contract liabilities are as follows:
|
(in thousands) |
|
|
|
|
|
Balance at January 1, 2019 |
|
$ |
|
|
|
Cash additions |
|
|
|
|
|
Revenue recognized |
|
|
( |
) |
|
Foreign exchange translation adjustment |
|
|
|
|
|
Balance at December 31, 2019 |
|
|
|
|
|
Cash additions |
|
|
|
|
|
Revenue recognized |
|
|
( |
) |
|
Foreign exchange translation adjustment |
|
|
|
|
|
Balance at December 31, 2020 |
|
$ |
|
|
Contract Costs
GES capitalizes certain incremental costs incurred in obtaining and fulfilling contracts. Capitalized costs principally relate to direct costs of materials and services incurred in fulfilling services of future exhibitions, conferences, and events, and also include up-front incentives and commissions incurred upon contract signing. We expense costs associated with preliminary contract activities (i.e. proposal activities) as incurred.
Changes to contract costs are as follows:
|
(in thousands) |
|
|
|
|
|
Balance at January 1, 2019 |
|
$ |
|
|
|
Additions |
|
|
|
|
|
Expenses |
|
|
( |
) |
|
Cancelled |
|
|
( |
) |
|
Foreign exchange translation adjustment |
|
|
|
|
|
Balance at December 31, 2019 |
|
|
|
|
|
Additions |
|
|
|
|
|
Expenses |
|
|
( |
) |
|
Cancelled |
|
|
( |
) |
|
Foreign exchange translation adjustment |
|
|
( |
) |
|
Balance at December 31, 2020 |
|
$ |
|
|
As of December 31, 2020, capitalized contract costs consisted of $
46
Disaggregation of Revenue
The following tables disaggregate GES and Pursuit revenue by major product line, timing of revenue recognition, and markets served:
GES
|
|
|
Year Ended December 31, 2020 |
|
|||||||||||||
|
(in thousands) |
|
GES North America |
|
|
GES EMEA |
|
|
Intersegment Eliminations |
|
|
Total |
|
||||
|
Services: |
|
|
|
|
|
|
|
|
|
|
|
|
|
|
|
|
|
Core services |
|
$ |
|
|
|
$ |
|
|
|
$ |
— |
|
|
$ |
|
|
|
Audio-visual |
|
|
|
|
|
|
|
|
|
|
— |
|
|
|
|
|
|
Event technology |
|
|
|
|
|
|
|
|
|
|
— |
|
|
|
|
|
|
Intersegment eliminations |
|
|
— |
|
|
|
— |
|
|
|
( |
) |
|
|
(3,680 |
) |
|
Total services |
|
|
|
|
|
|
|
|
|
|
( |
) |
|
|
|
|
|
Products: |
|
|
|
|
|
|
|
|
|
|
|
|
|
|
|
|
|
Core products |
|
|
|
|
|
|
|
|
|
|
— |
|
|
|
|
|
|
Total revenue |
|
$ |
|
|
|
$ |
|
|
|
$ |
( |
) |
|
$ |
|
|
|
|
|
|
|
|
|
|
|
|
|
|
|
|
|
|
|
|
|
Timing of revenue recognition: |
|
|
|
|
|
|
|
|
|
|
|
|
|
|
|
|
|
Services transferred over time |
|
$ |
|
|
|
$ |
|
|
|
$ |
( |
) |
|
$ |
|
|
|
Products transferred over time(1) |
|
|
|
|
|
|
|
|
|
|
— |
|
|
|
|
|
|
Products transferred at a point in time |
|
|
|
|
|
|
|
|
|
|
— |
|
|
|
|
|
|
Total revenue |
|
$ |
|
|
|
$ |
|
|
|
$ |
( |
) |
|
$ |
|
|
|
|
|
|
|
|
|
|
|
|
|
|
|
|
|
|
|
|
|
Markets: |
|
|
|
|
|
|
|
|
|
|
|
|
|
|
|
|
|
Exhibitions |
|
$ |
|
|
|
$ |
|
|
|
$ |
— |
|
|
$ |
|
|
|
Conferences |
|
|
|
|
|
|
|
|
|
|
— |
|
|
|
|
|
|
Corporate events |
|
|
|
|
|
|
|
|
|
|
— |
|
|
|
|
|
|
Consumer events |
|
|
|
|
|
|
|
|
|
|
— |
|
|
|
|
|
|
Intersegment eliminations |
|
|
— |
|
|
|
— |
|
|
|
( |
) |
|
|
(3,680 |
) |
|
Total revenue |
|
$ |
|
|
|
$ |
|
|
|
$ |
( |
) |
|
$ |
|
|
|
(1) |
GES’ graphics product revenue is earned over time over the duration of an event as it is considered a part of the single performance obligation satisfied over time. |
47
|
|
|
Year Ended December 31, 2019 |
|
|||||||||||||
|
(in thousands) |
|
GES North America |
|
|
GES EMEA |
|
|
Intersegment Eliminations |
|
|
Total |
|
||||
|
Services: |
|
|
|
|
|
|
|
|
|
|
|
|
|
|
|
|
|
Core services |
|
$ |
|
|
|
$ |
|
|
|
$ |
— |
|
|
$ |
|
|
|
Audio-visual |
|
|
|
|
|
|
|
|
|
|
— |
|
|
|
|
|
|
Event technology |
|
|
|
|
|
|
|
|
|
|
— |
|
|
|
|
|
|
Intersegment eliminations |
|
|
— |
|
|
|
— |
|
|
|
( |
) |
|
|
(20,741 |
) |
|
Total services |
|
|
|
|
|
|
|
|
|
|
( |
) |
|
|
|
|
|
Products: |
|
|
|
|
|
|
|
|
|
|
|
|
|
|
|
|
|
Core products |
|
|
|
|
|
|
|
|
|
|
— |
|
|
|
|
|
|
Total revenue |
|
$ |
|
|
|
$ |
|
|
|
$ |
( |
) |
|
$ |
|
|
|
|
|
|
|
|
|
|
|
|
|
|
|
|
|
|
|
|
|
Timing of revenue recognition: |
|
|
|
|
|
|
|
|
|
|
|
|
|
|
|
|
|
Services transferred over time |
|
$ |
|
|
|
$ |
|
|
|
$ |
( |
) |
|
$ |
|
|
|
Products transferred over time(1) |
|
|
|
|
|
|
|
|
|
|
— |
|
|
|
|
|
|
Products transferred at a point in time |
|
|
|
|
|
|
|
|
|
|
— |
|
|
|
|
|
|
Total revenue |
|
$ |
|
|
|
$ |
|
|
|
$ |
( |
) |
|
$ |
|
|
|
|
|
|
|
|
|
|
|
|
|
|
|
|
|
|
|
|
|
Markets: |
|
|
|
|
|
|
|
|
|
|
|
|
|
|
|
|
|
Exhibitions |
|
$ |
|
|
|
$ |
|
|
|
$ |
— |
|
|
$ |
|
|
|
Conferences |
|
|
|
|
|
|
|
|
|
|
— |
|
|
|
|
|
|
Corporate events |
|
|
|
|
|
|
|
|
|
|
— |
|
|
|
|
|
|
Consumer events |
|
|
|
|
|
|
|
|
|
|
— |
|
|
|
|
|
|
Intersegment eliminations |
|
|
— |
|
|
|
— |
|
|
|
( |
) |
|
|
(20,741 |
) |
|
Total revenue |
|
$ |
|
|
|
$ |
|
|
|
$ |
( |
) |
|
$ |
|
|
|
(1) |
GES’ graphics product revenue is earned over time over the duration of an event as it is considered a part of the single performance obligation satisfied over time. |
48
|
|
|
Year Ended December 31, 2018 |
|
|||||||||||||
|
(in thousands) |
|
GES North America |
|
|
GES EMEA |
|
|
Intersegment Eliminations |
|
|
Total |
|
||||
|
Services: |
|
|
|
|
|
|
|
|
|
|
|
|
|
|
|
|
|
Core services |
|
$ |
|
|
|
$ |
|
|
|
$ |
— |
|
|
$ |
|
|
|
Audio-visual |
|
|
|
|
|
|
|
|
|
|
— |
|
|
|
|
|
|
Event technology |
|
|
|
|
|
|
|
|
|
|
— |
|
|
|
|
|
|
Intersegment eliminations |
|
|
— |
|
|
|
— |
|
|
|
( |
) |
|
|
(17,140 |
) |
|
Total services |
|
|
|
|
|
|
|
|
|
|
( |
) |
|
|
|
|
|
Products: |
|
|
|
|
|
|
|
|
|
|
|
|
|
|
|
|
|
Core products |
|
|
|
|
|
|
|
|
|
|
— |
|
|
|
|
|
|
Total revenue |
|
$ |
|
|
|
$ |
|
|
|
$ |
( |
) |
|
$ |
|
|
|
|
|
|
|
|
|
|
|
|
|
|
|
|
|
|
|
|
|
Timing of revenue recognition: |
|
|
|
|
|
|
|
|
|
|
|
|
|
|
|
|
|
Services transferred over time |
|
$ |
|
|
|
$ |
|
|
|
$ |
( |
) |
|
$ |
|
|
|
Products transferred over time(1) |
|
|
|
|
|
|
|
|
|
|
— |
|
|
|
|
|
|
Products transferred at a point in time |
|
|
|
|
|
|
|
|
|
|
— |
|
|
|
|
|
|
Total revenue |
|
$ |
|
|
|
$ |
|
|
|
$ |
( |
) |
|
$ |
|
|
|
|
|
|
|
|
|
|
|
|
|
|
|
|
|
|
|
|
|
Markets: |
|
|
|
|
|
|
|
|
|
|
|
|
|
|
|
|
|
Exhibitions |
|
$ |
|
|
|
$ |
|
|
|
$ |
— |
|
|
$ |
|
|
|
Conferences |
|
|
|
|
|
|
|
|
|
|
— |
|
|
|
|
|
|
Corporate events |
|
|
|
|
|
|
|
|
|
|
— |
|
|
|
|
|
|
Consumer events |
|
|
|
|
|
|
|
|
|
|
— |
|
|
|
|
|
|
Intersegment eliminations |
|
|
— |
|
|
|
— |
|
|
|
( |
) |
|
|
(17,140 |
) |
|
Total revenue |
|
$ |
|
|
|
$ |
|
|
|
$ |
( |
) |
|
$ |
|
|
|
(1) |
GES’ graphics product revenue is earned over time over the duration of an event as it is considered a part of the single performance obligation satisfied over time. |
49
Pursuit
|
|
|
Year Ended December 31, |
|
|||||||||
|
(in thousands) |
|
2020 |
|
|
2019 |
|
|
2018 |
|
|||
|
Services: |
|
|
|
|
|
|
|
|
|
|
|
|
|
Admissions |
|
$ |
|
|
|
$ |
|
|
|
$ |
|
|
|
Accommodations |
|
|
|
|
|
|
|
|
|
|
|
|
|
Transportation |
|
|
|
|
|
|
|
|
|
|
|
|
|
Travel planning |
|
|
|
|
|
|
|
|
|
|
|
|
|
Intersegment eliminations |
|
|
( |
) |
|
|
( |
) |
|
|
( |
) |
|
Total services revenue |
|
|
|
|
|
|
|
|
|
|
|
|
|
Products: |
|
|
|
|
|
|
|
|
|
|
|
|
|
Food and beverage |
|
|
|
|
|
|
|
|
|
|
|
|
|
Retail operations |
|
|
|
|
|
|
|
|
|
|
|
|
|
Total products revenue |
|
|
|
|
|
|
|
|
|
|
|
|
|
Total revenue |
|
$ |
|
|
|
$ |
|
|
|
$ |
|
|
|
|
|
|
|
|
|
|
|
|
|
|
|
|
|
Timing of revenue recognition: |
|
|
|
|
|
|
|
|
|
|
|
|
|
Services transferred over time |
|
$ |
|
|
|
$ |
|
|
|
$ |
|
|
|
Products transferred at a point in time |
|
|
|
|
|
|
|
|
|
|
|
|
|
Total revenue |
|
$ |
|
|
|
$ |
|
|
|
$ |
|
|
|
|
|
|
|
|
|
|
|
|
|
|
|
|
|
Markets: |
|
|
|
|
|
|
|
|
|
|
|
|
|
Banff Jasper Collection |
|
$ |
|
|
|
$ |
|
|
|
$ |
|
|
|
Alaska Collection |
|
|
|
|
|
|
|
|
|
|
|
|
|
Glacier Park Collection |
|
|
|
|
|
|
|
|
|
|
|
|
|
FlyOver |
|
|
|
|
|
|
|
|
|
|
|
|
|
Total revenue |
|
$ |
|
|
|
$ |
|
|
|
$ |
|
|
Note 3. Share-Based Compensation
We grant share-based compensation awards to our officers, directors, and certain key employees pursuant to the 2017 Viad Corp Omnibus Incentive Plan (the “2017 Plan”). The 2017 Plan has a
The following table summarizes share-based compensation (income) expense:
|
|
|
Year Ended December 31, |
|
|||||||||
|
(in thousands) |
|
2020 |
|
|
2019 |
|
|
2018 |
|
|||
|
Performance unit incentive plan (“PUP”) |
|
$ |
( |
) |
|
$ |
|
|
|
$ |
|
|
|
Restricted stock awards and restricted stock units |
|
|
|
|
|
|
|
|
|
|
|
|
|
Stock options |
|
|
|
|
|
|
— |
|
|
|
— |
|
|
Share-based compensation expense before income tax |
|
|
|
|
|
|
|
|
|
|
|
|
|
Income tax benefit(1) |
|
|
— |
|
|
|
( |
) |
|
|
( |
) |
|
Share-based compensation expense, net of income tax |
|
$ |
|
|
|
$ |
|
|
|
$ |
|
|
|
(1) |
|
We recorded
50
PUP Awards
PUP awards are performance-based restricted stock units that are tied to our stock price and the expected achievement of certain performance-based criteria. The vesting of PUP award shares is based upon the achievement of the performance-based criteria over a period. We account for PUP awards that will be settled in shares of our common stock as equity-based awards. We measure share-based compensation expense of equity-based awards at fair value on the grant date on a straight-line basis over the vesting period. The estimated number of shares to be achieved is updated each reporting period. We account for PUP awards that will be settled in cash as liability-based awards. We measure share-based compensation expense of liability-based awards at fair value at each reporting date until the date of settlement. Forfeitures are recorded when they occur.
During the year ended December 31, 2020, we granted PUP awards with a grant date fair value of $
In 2020, PUP awards granted in 2017 vested and we paid $
The following table summarizes the activity of the outstanding PUP awards:
|
|
|
Equity-Based PUP Awards |
|
|
Liability-Based PUP Awards |
|
||||||||||
|
|
|
Shares |
|
|
Weighted-Average Grant Date Fair Value |
|
|
Shares |
|
|
Weighted-Average Grant Date Fair Value |
|
||||
|
Balance at December 31, 2019 |
|
|
|
|
|
$ |
|
|
|
|
|
|
|
$ |
|
|
|
Granted |
|
|
|
|
|
$ |
|
|
|
|
|
|
|
$ |
|
|
|
Vested |
|
|
— |
|
|
$ |
— |
|
|
|
( |
) |
|
$ |
|
|
|
Forfeited |
|
|
( |
) |
|
$ |
|
|
|
|
( |
) |
|
$ |
|
|
|
Balance at December 31, 2020 |
|
|
|
|
|
$ |
|
|
|
|
|
|
|
$ |
|
|
Restricted Stock Awards and Restricted Stock Units
Restricted stock awards and restricted stock units are service-based awards. We account for restricted stock awards and restricted stock units that will be settled in shares of our common stock as equity-based awards. We measure share-based compensation expense of equity-based awards at fair value on the grant date on a straight-line basis over the vesting period.
We account for restricted stock units that will be settled in cash as liability-based awards. We measure share-based compensation expense of liability-based awards at fair value at each reporting date until the date of settlement. Forfeitures are recorded when they occur.
As of December 31, 2020, the unamortized cost of outstanding equity-based restricted stock awards and restricted stock units was $
Aggregate liabilities related to liability-based restricted stock units were $
51
The following table summarizes the activity of the outstanding restricted stock awards and restricted stock units:
|
|
|
Equity-Based Restricted Stock Awards |
|
|
Equity-Based Restricted Stock Units |
|
|
Liability-Based Restricted Stock Units |
|
|||||||||||||||
|
|
|
Shares |
|
|
Weighted-Average Grant Date Fair Value |
|
|
Shares |
|
|
Weighted-Average Grant Date Fair Value |
|
|
Shares |
|
|
Weighted-Average Grant Date Fair Value |
|
||||||
|
Balance at December 31, 2019 |
|
|
|
|
|
$ |
|
|
|
|
— |
|
|
$ |
— |
|
|
|
|
|
|
$ |
|
|
|
Granted |
|
|
|
|
|
$ |
|
|
|
|
|
|
|
$ |
|
|
|
|
|
|
|
$ |
|
|
|
Vested |
|
|
( |
) |
|
$ |
|
|
|
|
( |
) |
|
$ |
|
|
|
|
( |
) |
|
$ |
|
|
|
Forfeited |
|
|
( |
) |
|
$ |
|
|
|
|
( |
) |
|
$ |
|
|
|
|
( |
) |
|
$ |
|
|
|
Balance at December 31, 2020 |
|
|
|
|
|
$ |
|
|
|
|
|
|
|
$ |
|
|
|
|
|
|
|
$ |
|
|
Stock Options
We grant non-qualified stock options that are performance-based, as well as non-qualified stock options that are service-based. The performance-based awards are recognized on a straight-line basis over the performance period ranging from 1.0 to
The following table summarizes stock option activity:
|
|
|
Shares |
|
|
Weighted-Average Exercise Price |
|
|
Aggregate Intrinsic Value(1) |
|
|||
|
Options outstanding and exercisable at December 31, 2019 |
|
|
|
|
|
$ |
|
|
|
|
|
|
|
Granted |
|
|
|
|
|
$ |
|
|
|
|
|
|
|
Exercised |
|
|
( |
) |
|
$ |
|
|
|
|
|
|
|
Options outstanding at December 31, 2020 |
|
|
|
|
|
$ |
|
|
|
$ |
|
|
|
Options exercisable at December 31, 2020 |
|
|
— |
|
|
$ |
— |
|
|
$ |
— |
|
|
(1) |
|
The following table summarizes stock options outstanding and exercisable as of December 31, 2020:
|
|
|
|
|
Options Outstanding |
|
|
Options Exercisable |
|
||||||||||||||
|
Range of exercise prices |
|
|
Shares |
|
|
Weighted-Average Remaining Contractual Life (in years) |
|
|
Weighted-Average Exercise Price |
|
|
Shares |
|
|
Weighted-Average Exercise Price |
|
||||||
|
$ |
|
|
|
|
|
|
|
|
|
|
|
$ |
|
|
|
|
— |
|
|
$ |
— |
|
|
$ |
|
|
|
|
|
|
|
|
|
|
|
$ |
|
|
|
|
— |
|
|
$ |
— |
|
|
|
|
|
|
|
|
|
|
|
|
|
$ |
|
|
|
|
— |
|
|
$ |
— |
|
|
The fair value of stock options granted in 2020 was estimated on the date of grant using the Black-Scholes stock option pricing model.
Following is additional information on stock options and the underlying assumptions used in assessing fair value:
|
|
|
Year Ended |
|
|
|
|
|
December 31, 2020 |
|
|
|
Assumptions used to estimate fair value of stock options granted: |
|
|
|
|
|
Risk-free interest rate |
|
|
|
|
|
Expected life |
|
4.3 - 5.4 years |
|
|
|
Expected volatility |
|
|
|
|
|
Expected dividend yield |
|
|
— |
|
|
Weighted average grant-date fair value per share of options granted |
|
$ |
|
|
|
Cash received from exercise of options (in thousands) |
|
$ |
|
|
52
As of December 31, 2020, the total unrecognized compensation cost related to non-vested stock option awards was $
Note 4. Acquisitions
2019 Acquisitions
Belton Chalet
On
Mountain Park Lodges
On
As the majority owner of these properties, we consolidate
The following table summarizes the final allocation of the aggregate purchase price paid and amounts of assets acquired and liabilities assumed based upon the estimated fair value at the date of acquisition.
|
(in thousands) |
|
|
|
|
|
|
|
|
|
Purchase price paid as: |
|
|
|
|
|
|
|
|
|
Cash |
|
|
|
|
|
$ |
|
|
|
Net working capital adjustment |
|
|
|
|
|
|
|
|
|
Consideration transferred |
|
|
|
|
|
|
|
|
|
Right to manage |
|
|
|
|
|
|
( |
) |
|
Purchase price, net |
|
|
|
|
|
|
|
|
|
|
|
|
|
|
|
|
|
|
|
Fair value of net assets acquired: |
|
|
|
|
|
|
|
|
|
Accounts receivable |
|
$ |
|
|
|
|
|
|
|
Inventories |
|
|
|
|
|
|
|
|
|
Prepaid expenses |
|
|
|
|
|
|
|
|
|
Property and equipment |
|
|
|
|
|
|
|
|
|
Intangible assets |
|
|
|
|
|
|
|
|
|
Total assets acquired |
|
|
|
|
|
|
|
|
|
Accounts payable |
|
|
|
|
|
|
|
|
|
Advanced deposits payable |
|
|
|
|
|
|
|
|
|
Deferred tax liability |
|
|
|
|
|
|
|
|
|
Other liabilities |
|
|
|
|
|
|
|
|
|
Total liabilities assumed |
|
|
|
|
|
|
|
|
|
|
|
|
|
|
|
|
|
|
|
Noncontrolling interest equity |
|
|
|
|
|
|
|
|
|
Total fair value of net assets acquired |
|
|
|
|
|
|
|
|
|
Excess purchase price over fair value of net assets acquired (“goodwill”) |
|
|
|
|
|
$ |
|
|
Under the acquisition method of accounting, the purchase price as shown in the table above is allocated to the tangible and identifiable intangible assets acquired and liabilities assumed based on their estimated fair values. The excess purchase price over the fair value of net assets acquired was recorded as “Goodwill.” Goodwill is included in the Pursuit business group. The primary factor that contributed to the purchase price resulting in the recognition of goodwill related to future growth opportunities when combined with our other businesses. Goodwill is not deductible for tax purposes. The estimated values of current assets and liabilities were based upon their historical costs on the acquisition date due to their short-term nature.
Transaction costs associated with the Mountain Park Lodges were $
53
Identifiable intangible assets acquired in the Mountain Park Lodges acquisition were $
Sky Lagoon Attraction
On July 25, 2019, we announced plans for a new geothermal lagoon attraction that is located on an oceanfront lot just outside downtown Reykjavik, Iceland. We acquired a
Supplementary pro forma financial information
The following table summarizes the unaudited pro forma results of operations attributable to Viad, assuming the completion of the Mountain Park Lodges acquisition was on January 1, 2018. We do not consider the Sky Lagoon attraction or the Belton Chalet significant acquisitions and accordingly, they are not included in the following pro forma results of operations:
|
(in thousands, except per share data) |
|
Year Ended December 31, 2019 |
|
|
Year Ended December 31, 2018 |
|
||
|
Revenue |
|
$ |
|
|
|
$ |
|
|
|
Depreciation and amortization |
|
$ |
|
|
|
$ |
|
|
|
Income from continuing operations |
|
$ |
|
|
|
$ |
|
|
|
Net income attributable to Viad |
|
$ |
|
|
|
$ |
|
|
|
Diluted income per share |
|
$ |
|
|
|
$ |
|
|
|
Basic income per share |
|
$ |
|
|
|
$ |
|
|
2018 Acquisition
Maligne Canyon Restaurant
In , we acquired the Maligne Canyon Restaurant and Gift Shop for total cash consideration of $
Note 5. Inventories
The components of inventories consisted of the following:
|
|
|
December 31, |
|
|||||
|
(in thousands) |
|
2020 |
|
|
2019 |
|
||
|
Raw materials |
|
$ |
|
|
|
$ |
|
|
|
Finished goods |
|
|
|
|
|
|
|
|
|
Inventories |
|
$ |
|
|
|
$ |
|
|
54
Note 6. Other Current Assets
Other current assets consisted of the following:
|
|
|
December 31, |
|
|||||
|
(in thousands) |
|
2020 |
|
|
2019 |
|
||
|
Prepaid insurance |
|
$ |
|
|
|
$ |
|
|
|
Prepaid software maintenance |
|
|
|
|
|
|
|
|
|
Restricted cash |
|
|
|
|
|
|
|
|
|
Prepaid vendor payments |
|
|
|
|
|
|
|
|
|
Prepaid taxes |
|
|
|
|
|
|
|
|
|
Income tax receivable |
|
|
|
|
|
|
|
|
|
Prepaid other |
|
|
|
|
|
|
|
|
|
Other |
|
|
|
|
|
|
|
|
|
Other current assets |
|
$ |
|
|
|
$ |
|
|
Note 7. Property and Equipment
Property and equipment consisted of the following:
|
|
|
December 31, |
|
|||||
|
(in thousands) |
|
2020 |
|
|
2019 |
|
||
|
Land and land interests(1) |
|
$ |
|
|
|
$ |
|
|
|
Buildings and leasehold improvements |
|
|
|
|
|
|
|
|
|
Equipment and other |
|
|
|
|
|
|
|
|
|
Gross property and equipment |
|
|
|
|
|
|
|
|
|
Accumulated depreciation |
|
|
( |
) |
|
|
( |
) |
|
Property and equipment, net (excluding finance leases) |
|
|
|
|
|
|
|
|
|
Finance lease ROU assets, net |
|
|
|
|
|
|
|
|
|
Property and equipment, net |
|
$ |
|
|
|
$ |
|
|
|
(1) |
Land and land interests include certain leasehold interests in land within Pursuit for which we are considered to have perpetual use rights. The carrying amount of these leasehold interests was $ |
Depreciation expense was $
Property and equipment purchased through accounts payable and accrued liabilities decreased $
We recorded fixed asset impairment charges of $
Note 8. Other Investments and Assets
Other investments and assets consisted of the following:
|
|
|
December 31, |
|
|||||
|
(in thousands) |
|
2020 |
|
|
2019 |
|
||
|
Self-insured liability receivable |
|
$ |
|
|
|
$ |
|
|
|
Other mutual funds |
|
|
|
|
|
|
|
|
|
Contract costs |
|
|
|
|
|
|
|
|
|
Cash surrender value of life insurance |
|
|
— |
|
|
|
|
|
|
Other |
|
|
|
|
|
|
|
|
|
Other investments and assets |
|
$ |
|
|
|
$ |
|
|
55
Note 9. Goodwill and Other Intangible Assets
The changes in the carrying amount of goodwill are as follows:
|
(in thousands) |
|
GES North America |
|
|
GES EMEA |
|
|
Pursuit |
|
|
Total |
|
||||
|
Balance at December 31, 2018 |
|
$ |
|
|
|
$ |
|
|
|
$ |
|
|
|
$ |
|
|
|
Business acquisitions |
|
|
— |
|
|
|
— |
|
|
|
|
|
|
|
|
|
|
Foreign currency translation adjustments |
|
|
|
|
|
|
|
|
|
|
|
|
|
|
|
|
|
Balance at December 31, 2019 |
|
|
|
|
|
|
|
|
|
|
|
|
|
|
|
|
|
Goodwill impairment |
|
|
( |
) |
|
|
( |
) |
|
|
( |
) |
|
|
( |
) |
|
Foreign currency translation adjustments |
|
|
( |
) |
|
|
( |
) |
|
|
|
|
|
|
( |
) |
|
Other |
|
|
— |
|
|
|
— |
|
|
|
( |
) |
|
|
( |
) |
|
Balance at December 31, 2020 |
|
$ |
— |
|
|
$ |
— |
|
|
$ |
|
|
|
$ |
|
|
The following table summarizes goodwill by reporting unit and segment:
|
|
|
December 31, |
|
|||||
|
(in thousands) |
|
2020 |
|
|
2019 |
|
||
|
GES: |
|
|
|
|
|
|
|
|
|
GES North America: |
|
|
|
|
|
|
|
|
|
U.S. |
|
$ |
— |
|
|
$ |
|
|
|
Canada |
|
|
— |
|
|
|
|
|
|
GES EMEA |
|
|
— |
|
|
|
|
|
|
Total GES |
|
|
— |
|
|
|
|
|
|
Pursuit: |
|
|
|
|
|
|
|
|
|
Banff Jasper Collection |
|
|
|
|
|
|
|
|
|
Alaska Collection |
|
|
|
|
|
|
|
|
|
Glacier Park Collection |
|
|
— |
|
|
|
|
|
|
FlyOver |
|
|
|
|
|
|
|
|
|
Total Pursuit |
|
|
|
|
|
|
|
|
|
Total Goodwill |
|
$ |
|
|
|
$ |
|
|
Goodwill is tested for impairment at the reporting unit level on an annual basis as of October 31, and between annual tests if an event occurs or circumstances change that would more-likely-than-not reduce the fair value of a reporting unit below its carrying value. We use a discounted expected future cash flow methodology (income approach) to estimate the fair value of our reporting units for purposes of goodwill impairment testing.
In early March 2020, as a result of COVID-19 concerns, we began to see event postponements and cancellations at GES, as well as cancelled bookings at Pursuit. This quickly escalated into the shut-down of event activity and tourism as government mandated closures and stay-at-home orders went more broadly into effect around the world. As demand halted, we essentially placed our businesses into a state of hibernation to preserve cash. As government mandated closures and stay-at-home orders started to be lifted, we began to restart our business with enhanced health and safety protocols in place. We phased in most of Pursuit’s attractions and lodging operations starting in May 2020. However, exhibition and event activity remain largely dormant. For GES, we believe that as governments continue to lift restrictions, events in certain geographies will gradually increase.
During the first quarter of 2020, we determined that an interim triggering event had occurred due to the deteriorating macroeconomic environment related to the COVID-19 pandemic, resulting in disruptions to our operations and the decline in our stock price. As such, we performed an interim evaluation of goodwill as of March 31, 2020. As a result, we recorded non-cash goodwill impairment charges of $
During the second quarter of 2020, GES continued to experience event postponements and cancellations and we experienced further declines in our stock price. There was also an increased spread of the COVID-19 virus throughout the United States, which resulted in further closures and government orders that we believed had increased the uncertainty regarding when the live event industry would re-commence and how long it would take to get back to similar pre-COVID-19 business levels. The uncertainty regarding the duration of the current domestic and global economic conditions and whether further deterioration in the macroeconomic environment would
56
continue as a result of the COVID-19 pandemic was factored into our second quarter goodwill impairment analysis. As a result, we recorded a full impairment charge to the remaining GES goodwill balance of $
Although Pursuit’s reporting units continued to operate at a loss due to travel restrictions, we did not record any additional impairment charges during the third or fourth quarter of 2020 as there were no significant changes to our outlook for the future years and the risk profile of the reporting units had not changed. Additionally, we experienced a slight increase in our stock price during the third and fourth quarters of 2020 once news of a vaccine was announced and the vaccine was rolled out.
Given the evolving nature of COVID-19 and the uncertain government and consumer reactions, the estimates and assumptions regarding expected future cash flows, discount rates, and terminal values used in our goodwill impairment analysis require considerable judgment and are based on our current estimates of market conditions, financial forecasts, and industry trends. These estimates, however, have inherent uncertainties and different assumptions could lead to materially different results including additional impairment charges in the future.
Our accumulated goodwill impairment was $
Other intangible assets consisted of the following:
|
|
|
|
|
December 31, 2020 |
|
|
December 31, 2019 |
|
||||||||||||||||||
|
(in thousands) |
|
Useful Life (Years) |
|
Gross Carrying Value |
|
|
Accumulated Amortization |
|
|
Net Carrying Value |
|
|
Gross Carrying Value |
|
|
Accumulated Amortization |
|
|
Net Carrying Value |
|
||||||
|
Intangible assets subject to amortization: |
|
|
|
|
|
|
|
|
|
|
|
|
|
|
|
|
|
|
|
|
|
|
|
|
|
|
|
Customer contracts and relationships |
|
|
|
$ |
|
|
|
$ |
( |
) |
|
$ |
|
|
|
$ |
|
|
|
$ |
( |
) |
|
$ |
|
|
|
Operating contracts and licenses |
|
|
|
|
|
|
|
|
( |
) |
|
|
|
|
|
|
|
|
|
|
( |
) |
|
|
|
|
|
In-place lease |
|
|
|
|
|
|
|
|
( |
) |
|
|
|
|
|
|
|
|
|
|
( |
) |
|
|
|
|
|
Tradenames |
|
|
|
|
|
|
|
|
( |
) |
|
|
|
|
|
|
|
|
|
|
( |
) |
|
|
|
|
|
Non-compete agreements |
|
|
|
|
|
|
|
|
( |
) |
|
|
|
|
|
|
|
|
|
|
( |
) |
|
|
|
|
|
Other |
|
|
|
|
|
|
|
|
( |
) |
|
|
|
|
|
|
|
|
|
|
( |
) |
|
|
|
|
|
Total amortized intangible assets |
|
|
|
|
|
|
|
|
( |
) |
|
|
|
|
|
|
|
|
|
|
( |
) |
|
|
|
|
|
Indefinite-lived intangible assets: |
|
|
|
|
|
|
|
|
|
|
|
|
|
|
|
|
|
|
|
|
|
|
|
|
|
|
|
Business licenses |
|
|
|
|
|
|
|
|
— |
|
|
|
573 |
|
|
|
|
|
|
|
— |
|
|
|
571 |
|
|
Other intangible assets |
|
|
|
$ |
|
|
|
$ |
(32,502 |
) |
|
$ |
|
|
|
$ |
|
|
|
$ |
(49,157 |
) |
|
$ |
|
|
Intangible asset amortization expense was $
|
(in thousands) |
|
|
|
|
|
Year ending December 31, |
|
|
|
|
|
2021 |
|
$ |
|
|
|
2022 |
|
|
|
|
|
2023 |
|
|
|
|
|
2024 |
|
|
|
|
|
2025 |
|
|
|
|
|
Thereafter |
|
|
|
|
|
Total |
|
$ |
|
|
57
Note 10. Other Current Liabilities
Other current liabilities consisted of the following:
|
|
|
December 31, |
|
|||||
|
(in thousands) |
|
2020 |
|
|
2019 |
|
||
|
Continuing operations: |
|
|
|
|
|
|
|
|
|
Self-insured liability |
|
$ |
|
|
|
$ |
|
|
|
Accrued interest payable |
|
|
|
|
|
|
|
|
|
Accrued restructuring |
|
|
|
|
|
|
|
|
|
Accrued employee benefit costs |
|
|
|
|
|
|
|
|
|
Current portion of pension and postretirement liabilities |
|
|
|
|
|
|
|
|
|
Accrued professional fees |
|
|
|
|
|
|
|
|
|
Accrued sales and use taxes |
|
|
|
|
|
|
|
|
|
Commissions payable |
|
|
|
|
|
|
|
|
|
Accommodation services deposits |
|
|
|
|
|
|
|
|
|
Accrued legal settlement |
|
|
— |
|
|
|
|
|
|
Accrued dividends |
|
|
— |
|
|
|
|
|
|
Other taxes |
|
|
|
|
|
|
|
|
|
Other |
|
|
|
|
|
|
|
|
|
Total continuing operations |
|
|
|
|
|
|
|
|
|
Discontinued operations: |
|
|
|
|
|
|
|
|
|
Environmental remediation liabilities |
|
|
|
|
|
|
|
|
|
Self-insured liability |
|
|
|
|
|
|
|
|
|
Other |
|
|
|
|
|
|
|
|
|
Total discontinued operations |
|
|
|
|
|
|
|
|
|
Total other current liabilities |
|
$ |
|
|
|
$ |
|
|
|
|
Note 11. Other Deferred Items and Liabilities
Other deferred items and liabilities consisted of the following:
|
|
|
December 31, |
|
|||||
|
(in thousands) |
|
2020 |
|
|
2019 |
|
||
|
Continuing operations: |
|
|
|
|
|
|
|
|
|
Foreign deferred tax liability |
|
$ |
|
|
|
$ |
|
|
|
Multi-employer pension plan withdrawal liability |
|
|
|
|
|
|
|
|
|
Self-insured liability |
|
|
|
|
|
|
|
|
|
Self-insured excess liability |
|
|
|
|
|
|
|
|
|
Accrued compensation |
|
|
|
|
|
|
|
|
|
Accrued restructuring |
|
|
|
|
|
|
|
|
|
Contract liabilities |
|
|
|
|
|
|
|
|
|
Other |
|
|
|
|
|
|
|
|
|
Total continuing operations |
|
|
|
|
|
|
|
|
|
Discontinued operations: |
|
|
|
|
|
|
|
|
|
Environmental remediation liabilities |
|
|
|
|
|
|
|
|
|
Self-insured liability |
|
|
|
|
|
|
|
|
|
Other |
|
|
|
|
|
|
|
|
|
Total discontinued operations |
|
|
|
|
|
|
|
|
|
Total other deferred items and liabilities |
|
$ |
|
|
|
$ |
|
|
58
Note 12. Debt and Finance Lease Obligations
The components of debt and finance lease obligations consisted of the following:
|
|
|
December 31, |
|
|||||
|
(in thousands, except interest rates) |
|
2020 |
|
|
2019 |
|
||
|
2018 Credit Facility, |
|
$ |
|
|
|
$ |
|
|
|
FlyOver Iceland Credit Facility, |
|
|
|
|
|
|
|
|
|
FlyOver Iceland Term Loans, |
|
|
|
|
|
|
— |
|
|
Less unamortized debt issuance costs |
|
|
( |
) |
|
|
( |
) |
|
Total debt(2) |
|
|
|
|
|
|
|
|
|
Finance lease obligations, 8.0% weighted-average interest rate at December 31, 2020 and 7.7% at December 31, 2019, due through 2039 |
|
|
|
|
|
|
|
|
|
Total debt and finance lease obligations(3) |
|
|
|
|
|
|
|
|
|
Current portion(4) |
|
|
( |
) |
|
|
( |
) |
|
Long-term debt and finance lease obligations |
|
$ |
|
|
|
$ |
|
|
|
(1) |
Represents the weighted-average interest rate in effect at the respective periods, including any applicable margin. The interest rates do not include amortization of debt issuance costs or commitment fees. |
|
(2) |
The weighted-average interest rate on total debt (including unamortized debt issuance costs and commitment fees) was |
|
(3) |
Cash paid for interest on debt was $ |
|
(4) |
|
2018 Credit Agreement
Effective October 24, 2018, we entered into a Second Amended and Restated Credit Agreement (the “2018 Credit Agreement”). The 2018 Credit Agreement has a maturity date of
Effective August 5, 2020, we entered into an amendment to the 2018 Credit Agreement, which, among other things, (i) waives our financial covenants until September 30, 2022 (the “Covenant Waiver Period”) and (ii) requires us to maintain minimum liquidity of $
59
LIBOR floor continues until the end of the 2018 Credit Agreement. A revised pricing grid goes into effect after the Covenant Waiver Period ends. Additionally, we are precluded from paying cash dividends, from issuing unsecured debt, and from accessing the $
As of December 31, 2020, capacity remaining under the 2018 Credit Facility was $
We index borrowings under the 2018 Credit Facility to the prime rate or the London Inter-bank Offered Rate (“LIBOR”), plus appropriate spreads tied to our leverage ratio. As LIBOR will begin to be phased out in 2021, our 2018 Credit Facility includes a method for determining an alternative or successor rate of interest that gives consideration to the new prevailing market convention. The vast majority of our borrowings under the 2018 Credit Facility are indexed to LIBOR. Commitment fees and letters of credit fees are also tied to our leverage ratio. The fees on the unused portion of the 2018 Credit Facility were
FlyOver Iceland Credit Facility
Effective February 15, 2019, FlyOver Iceland ehf., (“FlyOver Iceland”) a wholly-owned subsidiary of Esja, entered into a credit agreement with a €
FlyOver Iceland Term Loans
During 2020, FlyOver Iceland entered into three term loans totaling ISK
Aggregate annual maturities of long-term debt (excluding finance leases) as of December 31, 2020 are as follows:
|
(in thousands) |
|
Credit Facilities |
|
|
|
Year ending December 31, |
|
|
|
|
|
2021 |
|
$ |
|
|
|
2022 |
|
|
|
|
|
2023 |
|
|
|
|
|
2024 |
|
|
|
|
|
2025 |
|
|
|
|
|
Thereafter |
|
|
|
|
|
Total |
|
$ |
|
|
The aggregate annual maturities and the related amounts representing interest on finance lease obligations are included in Note 20 – Leases and Other.
60
Note 13. Fair Value Measurements
The fair value of an asset or liability is defined as the price that would be received by selling an asset or paying to transfer a liability in an orderly transaction between market participants at the measurement date. The fair value guidance requires an entity to maximize the use of quoted prices and other observable inputs and minimize the use of unobservable inputs when measuring fair value, and also establishes a fair value hierarchy, which prioritizes the inputs to valuation techniques used to measure fair value as follows:
Level 1 - Quoted prices in active markets for identical assets or liabilities.
Level 2 - Observable inputs other than quoted prices included within Level 1 that are observable for the asset or liability, either directly or indirectly.
Level 3 - Unobservable inputs to the valuation methodology that are significant to the measurement of fair value.
Money market mutual funds and certain other mutual fund investments are measured at fair value on a recurring basis using Level 1 inputs.
|
|
|
|
|
|
|
Fair Value Measurements at Reporting Date Using |
|
|||||||||
|
(in thousands) |
|
December 31, 2020 |
|
|
Quoted Prices in Active Markets (Level 1) |
|
|
Significant Other Observable Inputs (Level 2) |
|
|
Significant Unobservable Inputs (Level 3) |
|
||||
|
Assets: |
|
|
|
|
|
|
|
|
|
|
|
|
|
|
|
|
|
Money market funds(1) |
|
$ |
|
|
|
$ |
|
|
|
$ |
— |
|
|
$ |
— |
|
|
Other mutual funds(2) |
|
|
|
|
|
|
|
|
|
|
— |
|
|
|
— |
|
|
Total assets at fair value on a recurring basis |
|
$ |
|
|
|
$ |
|
|
|
$ |
— |
|
|
$ |
— |
|
|
|
|
|
|
|
|
Fair Value Measurements at Reporting Date Using |
|
|||||||||
|
(in thousands) |
|
December 31, 2019 |
|
|
Quoted Prices in Active Markets (Level 1) |
|
|
Significant Other Observable Inputs (Level 2) |
|
|
Significant Unobservable Inputs (Level 3) |
|
||||
|
Assets: |
|
|
|
|
|
|
|
|
|
|
|
|
|
|
|
|
|
Money market funds(1) |
|
$ |
|
|
|
$ |
|
|
|
$ |
— |
|
|
$ |
— |
|
|
Other mutual funds(2) |
|
|
|
|
|
|
|
|
|
|
— |
|
|
|
— |
|
|
Total assets at fair value on a recurring basis |
|
$ |
|
|
|
$ |
|
|
|
$ |
— |
|
|
$ |
— |
|
|
(1) |
We include money market funds in “Cash and cash equivalents” in the Consolidated Balance Sheets. We classify these investments as available-for-sale and recorded them at fair value. There have been |
|
(2) |
|
The carrying values of cash and cash equivalents, receivables, and accounts payable approximate fair value due to the short-term nature of these instruments. Refer to Note 12 – Debt and Finance Lease Obligations for the estimated fair value of debt obligations.
61
Note 14. Income (Loss) Per Share
The components of basic and diluted income per share are as follows:
|
|
|
|
|
|||||||||
|
|
|
Year Ended December 31, |
|
|||||||||
|
(in thousands, except per share data) |
|
2020 |
|
|
2019 |
|
|
2018 |
|
|||
|
Net income (loss) attributable to Viad (diluted) |
|
$ |
( |
) |
|
$ |
|
|
|
$ |
|
|
|
Less: Allocation to non-vested shares |
|
|
— |
|
|
|
( |
) |
|
|
( |
) |
|
Convertible preferred stock dividends |
|
|
( |
) |
|
|
— |
|
|
|
— |
|
|
Adjustment to the redemption value of redeemable noncontrolling interest |
|
|
( |
) |
|
|
( |
) |
|
|
( |
) |
|
Net income (loss) allocated to Viad common stockholders (basic) |
|
$ |
( |
) |
|
$ |
|
|
|
$ |
|
|
|
Basic weighted-average outstanding common shares |
|
|
|
|
|
|
|
|
|
|
|
|
|
Additional dilutive shares related to share-based compensation |
|
|
— |
|
|
|
|
|
|
|
|
|
|
Diluted weighted-average outstanding shares |
|
|
|
|
|
|
|
|
|
|
|
|
|
Income (loss) per share: |
|
|
|
|
|
|
|
|
|
|
|
|
|
Basic income (loss) attributable to Viad common stockholders |
|
$ |
( |
) |
|
$ |
|
|
|
$ |
|
|
|
Diluted income (loss) attributable to Viad common stockholders(1) |
|
$ |
( |
) |
|
$ |
|
|
|
$ |
|
|
|
(1) |
Diluted loss per share amount cannot exceed basic loss per share. |
We excluded the following weighted-average potential common shares from the calculations of diluted net income (loss) per common share during the applicable periods because their inclusion would have been anti-dilutive:
|
|
|
Year Ended December 31, |
|
|||||||||
|
|
|
2020 |
|
|
2019 |
|
|
2018 |
|
|||
|
Convertible preferred stock (as converted to common stock) |
|
|
|
|
|
|
— |
|
|
|
— |
|
|
Unvested restricted share-based awards |
|
|
|
|
|
|
|
|
|
|
|
|
|
Stock options |
|
|
|
|
|
|
— |
|
|
|
— |
|
62
Note 15. Common and Preferred Stock
Preferred Stock
We authorized
Convertible Series A Preferred Stock
On August 5, 2020, we entered into an Investment Agreement with funds managed by private equity firm Crestview Partners, relating to the issuance of
The Convertible Series A Preferred Stock carries a
Holders of the Convertible Series A Preferred Stock are entitled to vote with holders of Viad’s common stock on an as-converted basis.
Common Stock Repurchases
Our Board of Directors previously authorized us to repurchase shares of our common stock from time to time at prevailing market prices. Effective February 7, 2019, our Board of Directors authorized the repurchase of an additional
Stockholder Rights Plan
On March 29, 2020, our Board of Directors adopted a short-term stockholder rights plan and declared a dividend payable to stockholders of record on
Subject to limited exceptions, if a person or group acquired 10% (20% in the case of a passive institutional investor) or more of our common stock (including shares that were synthetically owned pursuant to derivative transactions or ownership of derivative securities) or announced a tender offer, and the consummation of that offer would have resulted in such ownership (we refer to such a person or group as an “acquiring person”), each right entitled its holder to purchase, at the right’s then-current exercise price, a number of shares of common stock having a market value at that time of twice the right’s exercise price. Rights held by the acquiring person would have become void and would not be exercisable. If the Company had been acquired in a merger or other business combination transaction that had not been approved by our Board of Directors after the rights would have become exercisable, each right would have entitled its holder to purchase, at the right’s then-current exercise price, a number of shares of the acquiring company’s common stock having a market value at that time of twice the right’s exercise price.
63
Note 16. Accumulated Other Comprehensive Income (Loss)
Changes in accumulated other comprehensive income (“AOCI”) by component are as follows:
|
(in thousands) |
|
Cumulative Foreign Currency Translation Adjustments |
|
|
Unrecognized Net Actuarial Loss and Prior Service Credit, Net |
|
|
Accumulated Other Comprehensive Income (Loss) |
|
|||
|
Balance at December 31, 2018 |
|
$ |
( |
) |
|
$ |
( |
) |
|
$ |
( |
) |
|
Other comprehensive income (loss) before reclassifications |
|
|
|
|
|
|
( |
) |
|
|
|
|
|
Amounts reclassified from AOCI, net of tax |
|
|
— |
|
|
|
( |
) |
|
|
( |
) |
|
Net other comprehensive income (loss) |
|
|
|
|
|
|
( |
) |
|
|
|
|
|
Balance at December 31, 2019 |
|
$ |
( |
) |
|
$ |
( |
) |
|
$ |
( |
) |
|
Other comprehensive income (loss) before reclassifications |
|
|
|
|
|
|
( |
) |
|
|
|
|
|
Amounts reclassified from AOCI, net of tax |
|
|
— |
|
|
|
( |
) |
|
|
( |
) |
|
Net other comprehensive income (loss) |
|
|
|
|
|
|
( |
) |
|
|
|
|
|
Balance at December 31, 2020 |
|
$ |
( |
) |
|
$ |
( |
) |
|
$ |
( |
) |
Amounts reclassified that relate to our defined benefit pension and postretirement plans include the amortization of prior service costs and actuarial net losses recognized during each period presented. These costs are recorded as components of net periodic cost for each period presented. Refer to Note 18 – Pension and Postretirement Benefits for additional information.
Note 17. Income Taxes
We record current income tax expense for the amounts that we expect to report and pay on our income tax returns and deferred income tax expense for the change in the deferred tax assets and liabilities. On December 22, 2017, the U.S. enacted the Tax Cuts and Jobs Act (the “Tax Act”) that significantly changed U.S. tax law. One part of this Tax Act required the Company to pay a deemed repatriation tax of $
Income from continuing operations before income taxes consisted of the following:
|
|
|
Year Ended December 31, |
|
|||||||||
|
(in thousands) |
|
2020 |
|
|
2019 |
|
|
2018 |
|
|||
|
Foreign |
|
$ |
( |
) |
|
$ |
|
|
|
$ |
|
|
|
United States |
|
|
( |
) |
|
|
( |
) |
|
|
|
|
|
Income (loss) from continuing operations before income taxes |
|
$ |
( |
) |
|
$ |
|
|
|
$ |
|
|
Significant components of the income tax provision from continuing operations are as follows:
|
|
|
Year Ended December 31, |
|
|||||||||
|
(in thousands) |
|
2020 |
|
|
2019 |
|
|
2018 |
|
|||
|
Current: |
|
|
|
|
|
|
|
|
|
|
|
|
|
United States: |
|
|
|
|
|
|
|
|
|
|
|
|
|
Federal |
|
$ |
( |
) |
|
$ |
( |
) |
|
$ |
|
|
|
State |
|
|
|
|
|
|
|
|
|
|
( |
) |
|
Foreign |
|
|
( |
) |
|
|
|
|
|
|
|
|
|
Total current |
|
|
( |
) |
|
|
|
|
|
|
|
|
|
Deferred: |
|
|
|
|
|
|
|
|
|
|
|
|
|
United States: |
|
|
|
|
|
|
|
|
|
|
|
|
|
Federal |
|
|
|
|
|
|
( |
) |
|
|
|
|
|
State |
|
|
|
|
|
|
( |
) |
|
|
|
|
|
Foreign |
|
|
( |
) |
|
|
( |
) |
|
|
|
|
|
Total deferred |
|
|
|
|
|
|
( |
) |
|
|
|
|
|
Income tax expense |
|
$ |
|
|
|
$ |
|
|
|
$ |
|
|
64
We are subject to income tax in jurisdictions in which we operate. A reconciliation of the statutory federal income tax rate to the effective tax rate is as follows:
|
|
|
Year Ended December 31, |
|
|||||||||||||||||||||
|
(in thousands) |
|
2020 |
|
|
2019 |
|
|
2018 |
|
|||||||||||||||
|
Computed income tax (benefit) expense at statutory federal income tax rate |
|
$ |
( |
) |
|
|
|
% |
|
$ |
|
|
|
|
|
% |
|
$ |
|
|
|
|
|
% |
|
State income tax (benefit), net of federal benefit |
|
|
( |
) |
|
|
|
% |
|
|
( |
) |
|
|
( |
)% |
|
|
|
|
|
|
|
% |
|
Deemed mandatory repatriation state tax |
|
|
— |
|
|
|
|
% |
|
|
— |
|
|
|
|
% |
|
|
( |
) |
|
|
( |
)% |
|
Deemed mandatory repatriation federal tax, net of foreign tax credit |
|
|
— |
|
|
|
|
% |
|
|
— |
|
|
|
|
% |
|
|
( |
) |
|
|
( |
)% |
|
Remeasurement of deferred taxes due to change in tax rates |
|
|
— |
|
|
|
|
% |
|
|
( |
) |
|
|
( |
)% |
|
|
( |
) |
|
|
( |
)% |
|
Foreign tax rate differential |
|
|
( |
) |
|
|
|
% |
|
|
|
|
|
|
|
% |
|
|
|
|
|
|
|
% |
|
U.S. tax (benefit) on current year foreign earnings, net of foreign tax credits |
|
|
— |
|
|
|
|
% |
|
|
( |
) |
|
|
( |
)% |
|
|
( |
) |
|
|
( |
)% |
|
Goodwill impairment |
|
|
|
|
|
|
( |
)% |
|
|
— |
|
|
|
|
% |
|
|
— |
|
|
|
|
% |
|
Change in valuation allowance |
|
|
|
|
|
|
( |
)% |
|
|
|
|
|
|
|
% |
|
|
( |
) |
|
|
( |
)% |
|
Other adjustments, net |
|
|
|
|
|
|
( |
)% |
|
|
( |
) |
|
|
( |
)% |
|
|
( |
) |
|
|
( |
)% |
|
Income tax expense |
|
$ |
|
|
|
|
( |
)% |
|
$ |
|
|
|
|
|
% |
|
$ |
|
|
|
|
|
% |
The components of deferred income tax assets and liabilities included in the Consolidated Balance Sheets are as follows:
|
|
|
December 31, |
|
|||||
|
(in thousands) |
|
2020 |
|
|
2019 |
|
||
|
Deferred tax assets: |
|
|
|
|
|
|
|
|
|
Tax credit carryforwards |
|
$ |
|
|
|
$ |
|
|
|
Pension, compensation, and other employee benefits |
|
|
|
|
|
|
|
|
|
Provisions for losses |
|
|
|
|
|
|
|
|
|
Net operating loss carryforwards |
|
|
|
|
|
|
|
|
|
State income taxes |
|
|
— |
|
|
|
|
|
|
Leases |
|
|
|
|
|
|
— |
|
|
Goodwill and other intangible assets |
|
|
|
|
|
|
— |
|
|
Other deferred income tax assets |
|
|
|
|
|
|
|
|
|
Total deferred tax assets |
|
|
|
|
|
|
|
|
|
Valuation allowance |
|
|
( |
) |
|
|
( |
) |
|
Foreign deferred tax assets included above |
|
|
( |
) |
|
|
( |
) |
|
United States net deferred tax assets |
|
|
|
|
|
|
|
|
|
Deferred tax liabilities: |
|
|
|
|
|
|
|
|
|
Property and equipment |
|
|
( |
) |
|
|
( |
) |
|
Goodwill and other intangible assets |
|
|
( |
) |
|
|
( |
) |
|
Leases |
|
|
( |
) |
|
|
— |
|
|
Life insurance |
|
|
— |
|
|
|
( |
) |
|
Other deferred income tax liabilities |
|
|
( |
) |
|
|
( |
) |
|
Total deferred tax liabilities |
|
|
( |
) |
|
|
( |
) |
|
Foreign deferred tax liabilities included above |
|
|
|
|
|
|
|
|
|
United States net deferred tax assets (liabilities) |
|
$ |
( |
) |
|
$ |
22,434 |
|
We use significant judgment in forming conclusions regarding the recoverability of our deferred tax assets and evaluate all available positive and negative evidence to determine if it is more-likely-than-not that the deferred tax assets will be realized. To the extent recovery does not appear likely, a valuation allowance must be recorded. In determining the recoverability of our deferred assets, we considered our cumulative loss incurred over the period ended December 31, 2020 in each tax jurisdiction. Given the weight of objectively verifiable historical losses from our operations, we recorded a valuation allowance on all deferred tax assets in the U.S., United Kingdom, Germany, and Switzerland. We had gross deferred tax assets of $
65
The valuation allowance was $
As of December 31, 2020, foreign tax credit carryforwards were $
We had gross federal, state, and foreign net operating loss carryforwards of $
We have not recorded deferred taxes for withholding taxes on current unremitted earnings of our subsidiaries located in Canada, the United Kingdom, and the Netherlands as we expect to reinvest those earnings in operations outside of the U.S.
We exercise judgment in determining the income tax provision for positions taken on prior returns when the ultimate tax determination is uncertain. We classify liabilities associated with uncertain tax positions as “Other deferred items and liabilities” in the Consolidated Balance Sheets unless expected to be paid or released within one year. We had liabilities associated with uncertain tax positions of $
A reconciliation of the liabilities associated with uncertain tax positions (excluding interest and penalties) is as follows:
|
(in thousands) |
|
|
|
|
|
Balance at December 31, 2017 |
|
$ |
|
|
|
Additions for tax positions taken in prior years |
|
|
|
|
|
Reductions for lapse of applicable statutes |
|
|
( |
) |
|
Balance at December 31, 2018 |
|
|
|
|
|
Additions for tax positions taken in prior years |
|
|
|
|
|
Reductions for lapse of applicable statutes |
|
|
( |
) |
|
Balance at December 31, 2019 |
|
|
|
|
|
Additions for tax positions taken in prior years |
|
|
|
|
|
Reductions for lapse of applicable statutes |
|
|
|
|
|
Balance at December 31, 2020 |
|
$ |
|
|
Our 2017 through 2019 U.S. federal tax years and various state tax years from 2015 through 2019 remain subject to income tax examinations by tax authorities. The tax years 2016 through 2019 remain subject to examination by various foreign taxing jurisdictions.
We received cash refunds from income taxes of $
66
Note 18. Pension and Postretirement Benefits
Domestic Plans
We have frozen defined benefit pension plans held in trust for certain employees which we funded. We also maintain certain unfunded defined benefit pension plans, which provide supplemental benefits to select management employees. These plans use traditional defined benefit formulas based on years of service and final average compensation. Funding policies provide that payments to defined benefit pension trusts shall be at least equal to the minimum funding required by applicable regulations.
We also have certain defined benefit postretirement plans that provide medical and life insurance for certain eligible employees, retirees, and dependents. The related postretirement benefit liabilities are recognized over the period that services are provided by employees. In addition, we retained the obligations for these benefits for retirees of certain sold businesses. While the plans have no funding requirements, we may fund the plans.
The components of net periodic benefit cost and other amounts recognized in other comprehensive income (loss) of our pension plans consist of the following:
|
|
|
December 31, |
|
|||||||||
|
(in thousands) |
|
2020 |
|
|
2019 |
|
|
2018 |
|
|||
|
Net periodic benefit cost: |
|
|
|
|
|
|
|
|
|
|
|
|
|
Service cost |
|
$ |
— |
|
|
$ |
|
|
|
$ |
|
|
|
Interest cost |
|
|
|
|
|
|
|
|
|
|
|
|
|
Expected return on plan assets |
|
|
( |
) |
|
|
( |
) |
|
|
( |
) |
|
Recognized net actuarial loss |
|
|
|
|
|
|
|
|
|
|
|
|
|
Net periodic benefit cost |
|
|
|
|
|
|
|
|
|
|
|
|
|
Other changes in plan assets and benefit obligations recognized in other comprehensive income: |
|
|
|
|
|
|
|
|
|
|
|
|
|
Net actuarial (gain) loss |
|
|
|
|
|
|
|
|
|
|
( |
) |
|
Reversal of amortization item: |
|
|
|
|
|
|
|
|
|
|
|
|
|
Net actuarial loss |
|
|
( |
) |
|
|
( |
) |
|
|
( |
) |
|
Total recognized in other comprehensive income |
|
|
|
|
|
|
|
|
|
|
( |
) |
|
Total recognized in net periodic benefit cost and other comprehensive income |
|
$ |
|
|
|
$ |
|
|
|
$ |
|
|
The components of net periodic benefit cost and other amounts recognized in other comprehensive income of our postretirement benefit plans consist of the following:
|
|
|
December 31, |
|
|||||||||
|
(in thousands) |
|
2020 |
|
|
2019 |
|
|
2018 |
|
|||
|
Net periodic benefit cost: |
|
|
|
|
|
|
|
|
|
|
|
|
|
Service cost |
|
$ |
|
|
|
$ |
|
|
|
$ |
|
|
|
Interest cost |
|
|
|
|
|
|
|
|
|
|
|
|
|
Amortization of prior service credit |
|
|
( |
) |
|
|
( |
) |
|
|
( |
) |
|
Recognized net actuarial loss |
|
|
|
|
|
|
|
|
|
|
|
|
|
Net periodic benefit cost |
|
|
|
|
|
|
|
|
|
|
|
|
|
Other changes in plan assets and benefit obligations recognized in other comprehensive income: |
|
|
|
|
|
|
|
|
|
|
|
|
|
Net actuarial (gain) loss |
|
|
|
|
|
|
( |
) |
|
|
|
|
|
Prior service credit |
|
|
— |
|
|
|
— |
|
|
|
— |
|
|
Reversal of amortization item: |
|
|
|
|
|
|
|
|
|
|
|
|
|
Net actuarial loss |
|
|
( |
) |
|
|
( |
) |
|
|
( |
) |
|
Prior service credit |
|
|
|
|
|
|
|
|
|
|
|
|
|
Total recognized in other comprehensive income |
|
|
|
|
|
|
( |
) |
|
|
( |
) |
|
Total recognized in net periodic benefit cost and other comprehensive income |
|
$ |
|
|
|
$ |
( |
) |
|
$ |
|
|
67
The following table indicates the funded status of the plans as of December 31:
|
|
|
|
|
|
|
|
|
|
|
|
|
|
|
|
|
|
|
Postretirement |
|
|||||
|
|
|
Funded Plans |
|
|
Unfunded Plans |
|
|
Benefit Plans |
|
|||||||||||||||
|
(in thousands) |
|
2020 |
|
|
2019 |
|
|
2020 |
|
|
2019 |
|
|
2020 |
|
|
2019 |
|
||||||
|
Change in benefit obligation: |
|
|
|
|
|
|
|
|
|
|
|
|
|
|
|
|
|
|
|
|
|
|
|
|
|
Benefit obligation at beginning of year |
|
$ |
|
|
|
$ |
|
|
|
$ |
|
|
|
$ |
|
|
|
$ |
|
|
|
$ |
|
|
|
Service cost |
|
|
— |
|
|
|
— |
|
|
|
— |
|
|
|
|
|
|
|
|
|
|
|
|
|
|
Interest cost |
|
|
|
|
|
|
|
|
|
|
|
|
|
|
|
|
|
|
|
|
|
|
|
|
|
Actuarial adjustments |
|
|
|
|
|
|
|
|
|
|
|
|
|
|
|
|
|
|
|
|
|
|
( |
) |
|
Benefits paid |
|
|
( |
) |
|
|
( |
) |
|
|
( |
) |
|
|
( |
) |
|
|
( |
) |
|
|
( |
) |
|
Benefit obligation at end of year |
|
|
|
|
|
|
|
|
|
|
|
|
|
|
|
|
|
|
|
|
|
|
|
|
|
Change in plan assets: |
|
|
|
|
|
|
|
|
|
|
|
|
|
|
|
|
|
|
|
|
|
|
|
|
|
Fair value of plan assets at beginning of year |
|
|
|
|
|
|
|
|
|
|
— |
|
|
|
— |
|
|
|
— |
|
|
|
— |
|
|
Actual return on plan assets |
|
|
|
|
|
|
|
|
|
|
— |
|
|
|
— |
|
|
|
— |
|
|
|
— |
|
|
Company contributions |
|
|
|
|
|
|
|
|
|
|
|
|
|
|
|
|
|
|
|
|
|
|
|
|
|
Benefits paid |
|
|
( |
) |
|
|
( |
) |
|
|
( |
) |
|
|
( |
) |
|
|
( |
) |
|
|
( |
) |
|
Fair value of plan assets at end of year |
|
|
|
|
|
|
|
|
|
|
— |
|
|
|
— |
|
|
|
— |
|
|
|
— |
|
|
Funded status at end of year |
|
$ |
( |
) |
|
$ |
( |
) |
|
$ |
( |
) |
|
$ |
( |
) |
|
$ |
( |
) |
|
$ |
( |
) |
The net amounts recognized in the Consolidated Balance Sheets under the caption “Pension and postretirement benefits” as of December 31 are as follows:
|
|
|
|
|
|
|
|
|
|
|
|
|
|
|
|
|
|
|
Postretirement |
|
|||||
|
|
|
Funded Plans |
|
|
Unfunded Plans |
|
|
Benefit Plans |
|
|||||||||||||||
|
(in thousands) |
|
2020 |
|
|
2019 |
|
|
2020 |
|
|
2019 |
|
|
2020 |
|
|
2019 |
|
||||||
|
Other current liabilities |
|
$ |
— |
|
|
$ |
— |
|
|
$ |
|
|
|
$ |
|
|
|
$ |
|
|
|
$ |
|
|
|
Non-current liabilities |
|
|
|
|
|
|
|
|
|
|
|
|
|
|
|
|
|
|
|
|
|
|
|
|
|
Net amount recognized |
|
$ |
|
|
|
$ |
|
|
|
$ |
|
|
|
$ |
|
|
|
$ |
|
|
|
$ |
|
|
Amounts recognized in AOCI as of December 31 are as follows:
|
|
|
|
|
|
|
|
|
|
|
|
|
|
|
|
|
|
|
Postretirement |
|
|
|
|
|
|
|
|
|
|||||
|
|
|
Funded Plans |
|
|
Unfunded Plans |
|
|
Benefit Plans |
|
|
Total |
|
|
Total |
|
|||||||||||||||||
|
(in thousands) |
|
2020 |
|
|
2019 |
|
|
2020 |
|
|
2019 |
|
|
2020 |
|
|
2019 |
|
|
2020 |
|
|
2019 |
|
||||||||
|
Net actuarial loss |
|
$ |
|
|
|
$ |
|
|
|
$ |
|
|
|
$ |
|
|
|
$ |
|
|
|
$ |
|
|
|
$ |
|
|
|
$ |
|
|
|
Prior service credit |
|
|
— |
|
|
|
— |
|
|
|
— |
|
|
|
— |
|
|
|
|
|
|
|
|
|
|
|
|
|
|
|
|
|
|
Subtotal |
|
|
|
|
|
|
|
|
|
|
|
|
|
|
|
|
|
|
|
|
|
|
|
|
|
|
|
|
|
|
|
|
|
Less tax effect |
|
|
— |
|
|
|
( |
) |
|
|
— |
|
|
|
( |
) |
|
|
— |
|
|
|
( |
) |
|
|
— |
|
|
|
( |
) |
|
Total |
|
$ |
|
|
|
$ |
|
|
|
$ |
|
|
|
$ |
|
|
|
$ |
|
|
|
$ |
|
|
|
$ |
|
|
|
$ |
|
|
The fair value of the domestic plans’ assets by asset class are as follows:
|
|
|
|
|
|
|
Fair Value Measurements at December 31, 2020 |
|
|||||||||
|
|
|
|
|
|
|
Quoted Prices in Active Markets |
|
|
Significant Other Observable Inputs |
|
|
Significant Unobservable Inputs |
|
|||
|
(in thousands) |
|
Total |
|
|
(Level 1) |
|
|
(Level 2) |
|
|
(Level 3) |
|
||||
|
Domestic pension plans: |
|
|
|
|
|
|
|
|
|
|
|
|
|
|
|
|
|
Fixed income securities |
|
$ |
|
|
|
$ |
|
|
|
$ |
— |
|
|
$ |
— |
|
|
Equity securities |
|
|
|
|
|
|
|
|
|
|
— |
|
|
|
— |
|
|
Cash |
|
|
|
|
|
|
|
|
|
|
— |
|
|
|
— |
|
|
Other |
|
|
|
|
|
|
— |
|
|
|
|
|
|
|
— |
|
|
Total |
|
$ |
|
|
|
$ |
|
|
|
$ |
|
|
|
$ |
— |
|
68
|
|
|
|
|
|
|
Fair Value Measurements at December 31, 2019 |
|
|||||||||
|
|
|
|
|
|
|
Quoted Prices in Active Markets |
|
|
Significant Other Observable Inputs |
|
|
Significant Unobservable Inputs |
|
|||
|
(in thousands) |
|
Total |
|
|
(Level 1) |
|
|
(Level 2) |
|
|
(Level 3) |
|
||||
|
Domestic pension plans: |
|
|
|
|
|
|
|
|
|
|
|
|
|
|
|
|
|
Fixed income securities |
|
$ |
|
|
|
$ |
|
|
|
$ |
— |
|
|
$ |
— |
|
|
Equity securities |
|
|
|
|
|
|
|
|
|
|
— |
|
|
|
— |
|
|
Cash |
|
|
|
|
|
|
|
|
|
|
— |
|
|
|
— |
|
|
Other |
|
|
|
|
|
|
— |
|
|
|
|
|
|
|
— |
|
|
Total |
|
$ |
|
|
|
$ |
|
|
|
$ |
|
|
|
$ |
— |
|
We employ a total return investment approach whereby a mix of equities and fixed income securities is used to maximize the long-term return of plan assets for a prudent level of risk. Risk tolerance is established through careful consideration of plan liabilities, plan funded status, and corporate financial condition. The investment portfolio contains a diversified blend of equity and fixed income securities. Furthermore, equity securities are diversified across U.S. and non-U.S. stocks, as well as growth and value. Investment risk is measured and monitored on an ongoing basis through quarterly investment portfolio reviews and annual liability measurements.
We utilize a building-block approach in determining the long-term expected rate of return on plan assets. Historical markets are studied and long-term historical relationships between equity securities and fixed income securities are preserved consistent with the widely accepted capital market principle that assets with higher volatility generate a greater return over the long run. Current market factors such as inflation and interest rates are evaluated before long-term capital market assumptions are determined. The long-term portfolio return also considers diversification and rebalancing. Peer data and historical returns are reviewed relative to our assumed rates for reasonableness and appropriateness.
The following pension and postretirement benefit payments, which reflect expected future service, as appropriate, are expected to be paid:
|
(in thousands) |
|
Funded Plans |
|
|
Unfunded Plans |
|
|
Postretirement Benefit Plans |
|
|||
|
2021 |
|
$ |
|
|
|
$ |
|
|
|
$ |
|
|
|
2022 |
|
$ |
|
|
|
$ |
|
|
|
$ |
|
|
|
2023 |
|
$ |
|
|
|
$ |
|
|
|
$ |
|
|
|
2024 |
|
$ |
|
|
|
$ |
|
|
|
$ |
|
|
|
2025 |
|
$ |
|
|
|
$ |
|
|
|
$ |
|
|
|
2026-2030 |
|
$ |
|
|
|
$ |
|
|
|
$ |
|
|
Foreign Pension Plans
Certain of our foreign operations also maintain defined benefit pension plans held in trust for certain employees which are funded by the companies, and unfunded defined benefit pension plans providing supplemental benefits to select management employees. These plans use traditional defined benefit formulas based on years of service and final average compensation. Funding policies provide that
69
payments to defined benefit pension trusts shall be at least equal to the minimum funding required by applicable regulations.
|
|
|
December 31, |
|
|||||||||
|
(in thousands) |
|
2020 |
|
|
2019 |
|
|
2018 |
|
|||
|
Net periodic benefit cost: |
|
|
|
|
|
|
|
|
|
|
|
|
|
Service cost |
|
$ |
|
|
|
$ |
|
|
|
$ |
|
|
|
Interest cost |
|
|
|
|
|
|
|
|
|
|
|
|
|
Expected return on plan assets |
|
|
( |
) |
|
|
( |
) |
|
|
( |
) |
|
Recognized net actuarial loss |
|
|
|
|
|
|
|
|
|
|
|
|
|
Settlement |
|
|
— |
|
|
|
— |
|
|
|
— |
|
|
Net periodic benefit cost |
|
|
|
|
|
|
|
|
|
|
|
|
|
Other changes in plan assets and benefit obligations recognized in other comprehensive income (loss): |
|
|
|
|
|
|
|
|
|
|
|
|
|
Net actuarial loss |
|
|
|
|
|
|
|
|
|
|
( |
) |
|
Reversal of amortization of net actuarial loss |
|
|
( |
) |
|
|
( |
) |
|
|
( |
) |
|
Total recognized in other comprehensive income (loss) |
|
|
|
|
|
|
|
|
|
|
( |
) |
|
Total recognized in net periodic benefit cost and other comprehensive income (loss) |
|
$ |
|
|
|
$ |
|
|
|
$ |
|
|
The following table represents the funded status of the plans as of December 31:
|
|
|
Funded Plans |
|
|
Unfunded Plans |
|
||||||||||
|
(in thousands) |
|
2020 |
|
|
2019 |
|
|
2020 |
|
|
2019 |
|
||||
|
Change in benefit obligation: |
|
|
|
|
|
|
|
|
|
|
|
|
|
|
|
|
|
Benefit obligation at beginning of year |
|
$ |
|
|
|
$ |
|
|
|
$ |
|
|
|
$ |
|
|
|
Service cost |
|
|
|
|
|
|
|
|
|
|
— |
|
|
|
— |
|
|
Interest cost |
|
|
|
|
|
|
|
|
|
|
|
|
|
|
|
|
|
Actuarial adjustments |
|
|
|
|
|
|
|
|
|
|
|
|
|
|
|
|
|
Benefits paid |
|
|
( |
) |
|
|
( |
) |
|
|
( |
) |
|
|
( |
) |
|
Translation adjustment |
|
|
|
|
|
|
|
|
|
|
|
|
|
|
|
|
|
Benefit obligation at end of year |
|
|
|
|
|
|
|
|
|
|
|
|
|
|
|
|
|
Change in plan assets: |
|
|
|
|
|
|
|
|
|
|
|
|
|
|
|
|
|
Fair value of plan assets at beginning of year |
|
|
|
|
|
|
|
|
|
|
— |
|
|
|
— |
|
|
Actual return on plan assets |
|
|
|
|
|
|
|
|
|
|
— |
|
|
|
— |
|
|
Company contributions |
|
|
|
|
|
|
|
|
|
|
|
|
|
|
|
|
|
Benefits paid |
|
|
( |
) |
|
|
( |
) |
|
|
( |
) |
|
|
( |
) |
|
Translation adjustment |
|
|
|
|
|
|
|
|
|
|
— |
|
|
|
— |
|
|
Fair value of plan assets at end of year |
|
|
|
|
|
|
|
|
|
|
— |
|
|
|
— |
|
|
Funded status at end of year |
|
$ |
( |
) |
|
$ |
|
|
|
$ |
( |
) |
|
$ |
( |
) |
The net amounts recognized in the Consolidated Balance Sheets under the caption “Pension and postretirement benefits” as of December 31 were as follows:
|
|
|
Funded Plans |
|
|
Unfunded Plans |
|
||||||||||
|
(in thousands) |
|
2020 |
|
|
2019 |
|
|
2020 |
|
|
2019 |
|
||||
|
Non-current assets |
|
$ |
( |
) |
|
$ |
( |
) |
|
$ |
— |
|
|
$ |
— |
|
|
Other current liabilities |
|
|
— |
|
|
|
— |
|
|
|
|
|
|
|
|
|
|
Non-current liabilities |
|
|
|
|
|
|
|
|
|
|
|
|
|
|
|
|
|
Net amount recognized |
|
$ |
|
|
|
$ |
( |
) |
|
$ |
|
|
|
$ |
|
|
Net actuarial losses for the foreign funded plans recognized in AOCI were $
70
The fair value information related to the foreign pension plans’ assets is summarized in the following tables:
|
|
|
|
|
|
|
Fair Value Measurements at Reporting Date Using |
|
|||||||||
|
(in thousands) |
|
December 31, 2020 |
|
|
Quoted Prices in Active Markets (Level 1) |
|
|
Significant Other Observable Inputs (Level 2) |
|
|
Significant Unobserved Inputs (Level 3) |
|
||||
|
Assets: |
|
|
|
|
|
|
|
|
|
|
|
|
|
|
|
|
|
Fixed income securities |
|
$ |
|
|
|
$ |
|
|
|
$ |
— |
|
|
$ |
— |
|
|
Equity securities |
|
|
|
|
|
|
|
|
|
|
— |
|
|
|
— |
|
|
Other |
|
|
|
|
|
|
|
|
|
|
— |
|
|
|
— |
|
|
Total |
|
$ |
|
|
|
$ |
|
|
|
$ |
— |
|
|
$ |
— |
|
|
|
|
|
|
|
|
Fair Value Measurements at Reporting Date Using |
|
|||||||||
|
(in thousands) |
|
December 31, 2019 |
|
|
Quoted Prices in Active Markets (Level 1) |
|
|
Significant Other Observable Inputs (Level 2) |
|
|
Significant Unobserved Inputs (Level 3) |
|
||||
|
Assets: |
|
|
|
|
|
|
|
|
|
|
|
|
|
|
|
|
|
Fixed income securities |
|
$ |
|
|
|
$ |
|
|
|
$ |
— |
|
|
$ |
— |
|
|
Equity securities |
|
|
|
|
|
|
|
|
|
|
— |
|
|
|
— |
|
|
Other |
|
|
|
|
|
|
|
|
|
|
— |
|
|
|
— |
|
|
Total |
|
$ |
|
|
|
$ |
|
|
|
$ |
— |
|
|
$ |
— |
|
The following payments, which reflect expected future service, as appropriate, are expected to be paid:
|
(in thousands) |
|
Funded Plans |
|
|
Unfunded Plans |
|
||
|
2021 |
|
$ |
|
|
|
$ |
|
|
|
2022 |
|
$ |
|
|
|
$ |
|
|
|
2023 |
|
$ |
|
|
|
$ |
|
|
|
2024 |
|
$ |
|
|
|
$ |
|
|
|
2025 |
|
$ |
|
|
|
$ |
|
|
|
2026-2030 |
|
$ |
|
|
|
$ |
|
|
Information for Pension Plans with an Accumulated Benefit Obligation in Excess of Plan Assets
The accumulated benefit obligations in excess of plan assets as of December 31 were as follows:
|
|
|
Domestic Plans |
|
|||||||||||||
|
|
|
Funded Plans |
|
|
Unfunded Plans |
|
||||||||||
|
(in thousands) |
|
2020 |
|
|
2019 |
|
|
2020 |
|
|
2019 |
|
||||
|
Projected benefit obligation |
|
$ |
|
|
|
$ |
|
|
|
$ |
|
|
|
$ |
|
|
|
Accumulated benefit obligation |
|
$ |
|
|
|
$ |
|
|
|
$ |
|
|
|
$ |
|
|
|
Fair value of plan assets |
|
$ |
|
|
|
$ |
|
|
|
$ |
— |
|
|
$ |
— |
|
|
|
|
Foreign Plans |
|
|||||||||||||
|
|
|
Funded Plans |
|
|
Unfunded Plans |
|
||||||||||
|
(in thousands) |
|
2020 |
|
|
2019 |
|
|
2020 |
|
|
2019 |
|
||||
|
Projected benefit obligation |
|
$ |
|
|
|
$ |
|
|
|
$ |
|
|
|
$ |
|
|
|
Accumulated benefit obligation |
|
$ |
|
|
|
$ |
|
|
|
$ |
|
|
|
$ |
|
|
|
Fair value of plan assets |
|
$ |
|
|
|
$ |
|
|
|
$ |
— |
|
|
$ |
— |
|
Contributions
In aggregate for both the domestic and foreign plans, we anticipate contributing $
71
Weighted-Average Assumptions
Weighted-average assumptions used to determine benefit obligations as of December 31 were as follows:
|
|
|
Domestic Plans |
|
|
|
|
|
|
|
|
|
|||||||||||||||||||||
|
|
|
Funded Plans |
|
|
Unfunded Plans |
|
|
Postretirement Benefit Plans |
|
|
Foreign Plans |
|
||||||||||||||||||||
|
|
|
2020 |
|
|
2019 |
|
|
2020 |
|
|
2019 |
|
|
2020 |
|
|
2019 |
|
|
2020 |
|
|
2019 |
|
||||||||
|
Discount rate |
|
|
|
% |
|
|
|
% |
|
|
|
% |
|
|
|
% |
|
|
|
% |
|
|
|
% |
|
|
|
% |
|
|
|
% |
|
Rate of compensation increase |
|
N/A |
|
|
N/A |
|
|
|
|
% |
|
|
|
% |
|
N/A |
|
|
N/A |
|
|
|
|
% |
|
|
|
% |
||||
Weighted-average assumptions used to determine net periodic benefit costs as of December 31 were as follows:
|
|
|
Domestic Plans |
|
|
|
|
|
|
|
|
|
|||||||||||||||||||||
|
|
|
Funded Plans |
|
|
Unfunded Plans |
|
|
Postretirement Benefit Plans |
|
|
Foreign Plans |
|
||||||||||||||||||||
|
|
|
2020 |
|
|
2019 |
|
|
2020 |
|
|
2019 |
|
|
2020 |
|
|
2019 |
|
|
2020 |
|
|
2019 |
|
||||||||
|
Discount rate |
|
|
|
% |
|
|
|
% |
|
|
|
% |
|
|
|
% |
|
|
|
% |
|
|
|
% |
|
|
|
% |
|
|
|
% |
|
Expected return on plan assets |
|
|
|
% |
|
|
|
% |
|
N/A |
|
|
N/A |
|
|
|
|
% |
|
|
|
% |
|
|
|
% |
|
|
|
% |
||
|
Rate of compensation increase |
|
N/A |
|
|
N/A |
|
|
|
|
% |
|
|
|
% |
|
N/A |
|
|
N/A |
|
|
|
|
% |
|
|
|
% |
||||
Multi-employer Plans
We contribute to various defined benefit pension plans under the terms of collective bargaining agreements that cover our union-represented employees. The financial risks of participating in these multi-employer pension plans generally include the fact that the unfunded obligations of the plan may be borne by solvent participating employers. In addition, if we were to discontinue participating in some of our multi-employer pension plans, we could be required to pay a withdrawal liability amount based on the underfunded status of the plan. During the year ended December 31, 2019, we finalized the terms of the new collective bargaining agreement with the Teamsters 727 union. The terms included a withdrawal from the underfunded Central States pension plan. Accordingly, for the year ended December 31, 2019, we recorded a charge of $
72
Our participation in multi-employer pension plans for 2020 is outlined in the following table. Unless otherwise noted, the most recent Pension Protection Act zone status available in 2020 and 2019 relates to the plan’s year end as of December 31, 2019 and 2018, respectively, and is based on information received from the plan. Among other factors, plans in the red zone are generally less than
|
|
|
|
|
Plan |
|
|
Pension Protection Act Zone Status |
|
FIP/RP Status Pending/ Implemented |
|
Viad Contributions |
|
|
Surcharge Paid |
|
Expiration Date of Collective Bargaining Agreement(s) |
||||||||||||
|
(in thousands) |
|
EIN |
|
No. |
|
|
2020 |
|
2019 |
|
|
|
2020 |
|
|
2019 |
|
|
2018 |
|
|
|
|
|
||||
|
Pension Fund: |
|
|
|
|
|
|
|
|
|
|
|
|
|
|
|
|
|
|
|
|
|
|
|
|
|
|
|
|
|
Western Conference of Teamsters Pension Plan |
|
|
|
|
|
|
|
|
|
|
|
|
|
$ |
|
|
|
$ |
|
|
|
$ |
|
|
|
|
|
|
|
Southern California Local 831—Employer Pension Fund(1) |
|
|
|
|
|
|
|
|
|
|
|
|
|
|
|
|
|
|
|
|
|
|
|
|
|
|
|
|
|
IBEW Local Union No 357 Pension Plan A |
|
|
|
|
|
|
|
|
|
|
|
|
|
|
|
|
|
|
|
|
|
|
|
|
|
|
|
|
|
Chicago Regional Council of Carpenters Pension Fund |
|
|
|
|
|
|
|
|
|
|
|
|
|
|
|
|
|
|
|
|
|
|
|
|
|
|
|
|
|
Electrical Contractors Assoc. Chicago Local Union 134, IBEW Joint Pension Trust of Chicago Plan #2 |
|
|
|
|
|
|
|
|
|
|
|
|
|
|
|
|
|
|
|
|
|
|
|
|
|
|
|
|
|
Machinery Movers Riggers & Mach Erect Local 136 Supplemental Retirement Plan(1) |
|
|
|
|
|
|
|
|
|
|
|
|
|
|
|
|
|
|
|
|
|
|
|
|
|
|
|
|
|
Southwest Carpenters Pension Trust |
|
|
|
|
|
|
|
|
|
|
|
|
|
|
|
|
|
|
|
|
|
|
|
|
|
|
|
|
|
Sign Pictorial & Display Industry Pension Plan(1) |
|
|
|
|
|
|
|
|
|
|
|
|
|
|
|
|
|
|
|
|
|
|
|
|
|
|
|
|
|
Southern California IBEW-NECA Pension Fund |
|
|
|
|
|
|
|
|
|
|
|
|
|
|
|
|
|
|
|
|
|
|
|
|
|
|
|
|
|
New England Teamsters & Trucking Industry Pension |
|
|
|
|
|
|
|
|
|
|
|
|
|
|
|
|
|
|
|
|
|
|
|
|
|
|
|
|
|
Central States, Southeast and Southwest Areas Pension Plan |
|
|
|
|
|
|
|
|
|
|
|
|
|
|
|
|
|
|
|
|
|
|
|
|
|
|
|
|
|
All other funds(2) |
|
|
|
|
|
|
|
|
|
|
|
|
|
|
|
|
|
|
|
|
|
|
|
|
|
|
|
|
|
Total contributions to defined benefit plans |
|
|
|
|
|
|
|
|
|
|
|
|
|
|
|
|
|
|
|
|
|
|
|
|
|
|
|
|
|
Total contributions to other plans |
|
|
|
|
|
|
|
|
|
|
|
|
|
|
|
|
|
|
|
|
|
|
|
|
|
|
|
|
|
Total contributions to multi-employer plans |
|
|
|
|
|
|
|
|
|
|
|
|
|
$ |
|
|
|
$ |
|
|
|
$ |
|
|
|
|
|
|
|
(1) |
|
|
(2) |
|
Other Employee Benefits
We match U.S. employee contributions to the 401(k) Plan with shares of our common stock held in treasury up to
73
Note 19. Restructuring Charges
GES
As part of our efforts to drive efficiencies and simplify our business operations, we took certain restructuring actions designed to simplify and transform GES for greater profitability. In response to the COVID-19 pandemic in 2020, we accelerated our transformation and streamlining efforts at GES to significantly reduce costs and create a lower and more flexible cost structure focused on servicing our more profitable market segments. These initiatives included recording restructuring charges related to the elimination of certain positions and facility closures at GES, as well as charges related to the closure and liquidation of GES’ United Kingdom-based audio-visual services business. During 2019, we completed some strategic simplification actions, including a facility consolidation in Las Vegas and other restructuring actions. As a result, we recorded restructuring charges primarily consisting of severance and related benefits as a result of workforce reductions and charges related to the consolidation and downsizing of facilities representing the remaining operating lease obligations (net of estimated sublease income) and related costs.
Other Restructurings
We recorded restructuring charges in connection with the consolidation of certain support functions at our corporate headquarters and certain reorganization activities within Pursuit. These charges primarily consist of severance and related benefits due to headcount reductions and charges related to the downsizing of facilities.
Changes to the restructuring liability by major restructuring activity are as follows:
|
|
|
GES |
|
|
Other Restructurings |
|
|
|
|
|
||||||
|
(in thousands) |
|
Severance & Employee Benefits |
|
|
Facilities |
|
|
Severance & Employee Benefits |
|
|
Total |
|
||||
|
Balance at December 31, 2017 |
|
$ |
|
|
|
$ |
|
|
|
$ |
|
|
|
$ |
|
|
|
Restructuring charges |
|
|
|
|
|
|
— |
|
|
|
|
|
|
|
|
|
|
Cash payments |
|
|
( |
) |
|
|
( |
) |
|
|
( |
) |
|
|
( |
) |
|
Adjustment to liability |
|
|
|
|
|
|
( |
) |
|
|
( |
) |
|
|
( |
) |
|
Balance at December 31, 2018 |
|
|
|
|
|
|
|
|
|
|
|
|
|
|
|
|
|
Restructuring charges |
|
|
|
|
|
|
|
|
|
|
|
|
|
|
|
|
|
Cash payments |
|
|
( |
) |
|
|
( |
) |
|
|
( |
) |
|
|
( |
) |
|
Adjustment to liability |
|
|
( |
) |
|
|
|
|
|
|
|
|
|
|
|
|
|
Balance at December 31, 2019 |
|
|
|
|
|
|
|
|
|
|
|
|
|
|
|
|
|
Restructuring charges |
|
|
|
|
|
|
|
|
|
|
|
|
|
|
|
|
|
Cash payments |
|
|
( |
) |
|
|
( |
) |
|
|
( |
) |
|
|
( |
) |
|
Non-cash items(1) |
|
|
— |
|
|
|
( |
) |
|
|
— |
|
|
|
( |
) |
|
Adjustment to liability |
|
|
( |
) |
|
|
|
|
|
|
( |
) |
|
|
( |
) |
|
Balance at December 31, 2020 |
|
$ |
|
|
|
$ |
|
|
|
$ |
|
|
|
$ |
|
|
|
(1) |
Represents the impact related to the closure and liquidation of GES’ United Kingdom-based audio-visual services business during the year ended December 31, 2020. |
74
As of December 31, 2020, we expect to pay all but $
Note 20. Leases and Other
The balance sheet presentation of our operating and finance leases is as follows:
|
|
|
|
|
December 31, |
|
|||||
|
(in thousands) |
|
Classification on the Consolidated Balance Sheet |
|
2020 |
|
|
2019 |
|
||
|
Assets: |
|
|
|
|
|
|
|
|
|
|
|
Operating lease assets |
|
Operating lease right-of-use assets |
|
$ |
|
|
|
$ |
|
|
|
Finance lease assets |
|
Property and equipment, net |
|
|
|
|
|
|
|
|
|
Total lease assets |
|
|
|
$ |
|
|
|
$ |
|
|
|
|
|
|
|
|
|
|
|
|
|
|
|
Liabilities: |
|
|
|
|
|
|
|
|
|
|
|
Current: |
|
|
|
|
|
|
|
|
|
|
|
Operating lease obligations |
|
Operating lease obligations |
|
$ |
|
|
|
$ |
|
|
|
Finance lease obligations |
|
Current portion of debt and finance lease obligations |
|
|
|
|
|
|
|
|
|
Noncurrent: |
|
|
|
|
|
|
|
|
|
|
|
Operating lease obligations |
|
Long-term operating lease obligations |
|
|
|
|
|
|
|
|
|
Finance lease obligations |
|
Long-term debt and finance lease obligations |
|
|
|
|
|
|
|
|
|
Total lease liabilities |
|
|
|
$ |
|
|
|
$ |
|
|
The components of lease expense consisted of the following:
|
|
|
Year Ended December 31, |
|
|||||
|
(in thousands) |
|
2020 |
|
|
2019 |
|
||
|
Finance lease cost: |
|
|
|
|
|
|
|
|
|
Amortization of right-of-use assets |
|
$ |
|
|
|
$ |
|
|
|
Interest on lease liabilities |
|
|
|
|
|
|
|
|
|
Operating lease cost |
|
|
|
|
|
|
|
|
|
Short-term lease cost |
|
|
|
|
|
|
|
|
|
Variable lease cost |
|
|
|
|
|
|
|
|
|
Total lease cost, net |
|
$ |
|
|
|
$ |
|
|
Other information related to operating and finance leases are as follows:
|
|
|
Year Ended December 31, |
|
|||||
|
(in thousands) |
|
2020 |
|
|
2019 |
|
||
|
Cash paid for amounts included in the measurement of lease liabilities: |
|
|
|
|
|
|
|
|
|
Operating cash flows from operating leases |
|
$ |
|
|
|
$ |
|
|
|
Operating cash flows from finance leases |
|
$ |
|
|
|
$ |
|
|
|
Financing cash flows from finance leases |
|
$ |
|
|
|
$ |
|
|
|
ROU assets obtained in exchange for lease obligations: |
|
|
|
|
|
|
|
|
|
Operating leases |
|
$ |
|
|
|
$ |
|
|
|
Finance leases |
|
$ |
|
|
|
$ |
|
|
|
|
|
|
|
|
|
|
|
|
|
|
|
|
|
|
|
|
|
|
|
|
|
December 31, |
|
|||||
|
|
|
2020 |
|
|
2019 |
|
||
|
Weighted-average remaining lease term (years): |
|
|
|
|
|
|
|
|
|
Operating leases |
|
|
|
|
|
|
|
|
|
Finance leases |
|
|
|
|
|
|
|
|
|
Weighted-average discount rate: |
|
|
|
|
|
|
|
|
|
Operating leases |
|
|
|
% |
|
|
|
% |
|
Finance leases |
|
|
|
% |
|
|
|
% |
75
As of December 31, 2020, the estimated future minimum lease payments under non-cancellable leases, excluding variable leases and variable non-lease components, are as follows:
|
(in thousands) |
|
Operating Leases |
|
|
Finance Leases |
|
|
Total |
|
|||
|
2021 |
|
$ |
|
|
|
$ |
|
|
|
$ |
|
|
|
2022 |
|
|
|
|
|
|
|
|
|
|
|
|
|
2023 |
|
|
|
|
|
|
|
|
|
|
|
|
|
2024 |
|
|
|
|
|
|
|
|
|
|
|
|
|
2025 |
|
|
|
|
|
|
|
|
|
|
|
|
|
Thereafter |
|
|
|
|
|
|
|
|
|
|
|
|
|
Total future lease payments |
|
|
|
|
|
|
|
|
|
|
|
|
|
Less: Amount representing interest |
|
|
( |
) |
|
|
( |
) |
|
|
( |
) |
|
Present value of minimum lease payments |
|
|
|
|
|
|
|
|
|
|
|
|
|
Current portion |
|
|
|
|
|
|
|
|
|
|
|
|
|
Long-term portion |
|
$ |
|
|
|
$ |
|
|
|
$ |
|
|
As of December 31, 2020, the estimated future minimum rentals under non-cancellable leases, which includes rental income from facilities that we own, are as follows:
|
(in thousands) |
|
|
|
|
|
2021 |
|
$ |
|
|
|
2022 |
|
|
|
|
|
2023 |
|
|
|
|
|
2024 |
|
|
|
|
|
2025 |
|
|
|
|
|
Thereafter |
|
|
|
|
|
Total minimum sublease rents |
|
$ |
|
|
Leases Not Yet Commenced
As of December 31, 2020,
Note 21. Litigation, Claims, Contingencies, and Other
We are plaintiffs or defendants to various actions, proceedings, and pending claims, some of which involve, or may involve, compensatory, punitive, or other damages. Litigation is subject to many uncertainties and it is possible that some of the legal actions, proceedings, or claims could be decided against us. During the year ended December 31, 2019, we recorded an $
On July 18, 2020, an off-road Ice Explorer operated by our Pursuit business was involved in an accident while enroute to the Athabasca Glacier, resulting in three fatalities and multiple other serious injuries. We continue to support the victims and their families, and we are fully cooperating with the applicable regulatory authorities to investigate this accident. We immediately reported the accident to our relevant insurance carriers, who are also supporting the investigation and subsequent claims. Subject to customary deductibles, we believe that our insurance coverage is sufficient to cover potential claims related to this accident.
We are subject to various U.S. federal, state, and foreign laws and regulations governing the prevention of pollution and the protection of the environment in the jurisdictions in which we have or had operations. If we fail to comply with these environmental laws and regulations, civil and criminal penalties could be imposed, and we could become subject to regulatory enforcement actions in the form of injunctions and cease and desist orders. As is the case with many companies, we also face exposure to actual or potential claims and lawsuits involving environmental matters relating to our past operations. As of December 31, 2020, we had recorded environmental remediation liabilities of $
76
As of December 31, 2020, on behalf of our subsidiaries, we had certain obligations under guarantees to third parties. These guarantees are not subject to liability recognition in the consolidated financial statements and relate to leased facilities and equipment leases entered into by our subsidiary operations. We would generally be required to make payments to the respective third parties under these guarantees in the event that the related subsidiary could not meet its own payment obligations. The maximum potential amount of future payments that we would be required to make under all guarantees existing as of December 31, 2020 would be $
A significant number of our employees are unionized and we are a party to approximately
We are self-insured up to certain limits for workers’ compensation and general liabilities, which includes automobile, product general liability, and client property loss claims. The aggregate amount of insurance liabilities (up to our retention limit) related to our continuing operations was $
In addition, as of December 31, 2020, we have recorded insurance liabilities of $
Note 22. Redeemable Noncontrolling Interest
On November 3, 2017, we acquired the controlling interest (
The minority Esja shareholders have the right to sell (or “put”) their Esja shares to us based on a multiple of 5.0x EBITDA as calculated on the trailing
The noncontrolling interest’s carrying value is determined by the fair value of the noncontrolling interest as of the acquisition date and the noncontrolling interest’s share of the subsequent net income or loss. This value is benchmarked against the redemption value of the sellers’ put option. The carrying value is adjusted to the redemption value, provided that it does not fall below the initial carrying value, as determined by the purchase price allocation. We have made a policy election to reflect any changes caused by such an adjustment to retained earnings, rather than to current earnings.
77
Changes in the redeemable noncontrolling interest are as follows:
|
(in thousands) |
|
|
|
|
|
Balance at December 31, 2018 |
|
$ |
|
|
|
Net loss attributable to redeemable noncontrolling interest |
|
|
( |
) |
|
Adjustment to the redemption value |
|
|
|
|
|
Foreign currency translation adjustment |
|
|
( |
) |
|
Balance at December 31, 2019 |
|
|
|
|
|
Net loss attributable to redeemable noncontrolling interest |
|
|
( |
) |
|
Adjustment to the redemption value |
|
|
|
|
|
Foreign currency translation adjustment |
|
|
( |
) |
|
Balance at December 31, 2020 |
|
$ |
|
|
78
Note 23. Segment Information
We measure the profit and performance of our operations on the basis of segment operating income (loss) which excludes restructuring charges and recoveries and impairment charges and recoveries. Intersegment sales are eliminated in consolidation and intersegment transfers are not significant. Corporate activities include expenses not allocated to operations. Depreciation and amortization and share-based compensation expense are the only significant non-cash items for the reportable segments.
Our reportable segments, with reconciliations to consolidated totals, are as follows:
|
|
|
Year Ended December 31, |
|
|||||||||
|
(in thousands) |
|
2020 |
|
|
2019 |
|
|
2018 |
|
|||
|
Revenue: |
|
|
|
|
|
|
|
|
|
|
|
|
|
GES: |
|
|
|
|
|
|
|
|
|
|
|
|
|
GES North America |
|
$ |
|
|
|
$ |
|
|
|
$ |
|
|
|
GES EMEA |
|
|
|
|
|
|
|
|
|
|
|
|
|
Intersegment eliminations |
|
|
( |
) |
|
|
( |
) |
|
|
( |
) |
|
Total GES |
|
|
|
|
|
|
|
|
|
|
|
|
|
Pursuit |
|
|
|
|
|
|
|
|
|
|
|
|
|
Total revenue |
|
$ |
|
|
|
$ |
|
|
|
$ |
|
|
|
Segment operating income (loss): |
|
|
|
|
|
|
|
|
|
|
|
|
|
GES: |
|
|
|
|
|
|
|
|
|
|
|
|
|
GES North America |
|
$ |
( |
) |
|
$ |
|
|
|
$ |
|
|
|
GES EMEA |
|
|
( |
) |
|
|
|
|
|
|
|
|
|
Total GES |
|
|
( |
) |
|
|
|
|
|
|
|
|
|
Pursuit |
|
|
( |
) |
|
|
|
|
|
|
|
|
|
Segment operating income (loss) |
|
|
( |
) |
|
|
|
|
|
|
|
|
|
Corporate eliminations (1) |
|
|
|
|
|
|
|
|
|
|
|
|
|
Corporate activities |
|
|
( |
) |
|
|
( |
) |
|
|
( |
) |
|
Operating income (loss) |
|
|
( |
) |
|
|
|
|
|
|
|
|
|
Interest income |
|
|
|
|
|
|
|
|
|
|
|
|
|
Interest expense |
|
|
( |
) |
|
|
( |
) |
|
|
( |
) |
|
Multi-employer pension plan withdrawal |
|
|
( |
) |
|
|
( |
) |
|
|
— |
|
|
Other expense |
|
|
( |
) |
|
|
( |
) |
|
|
( |
) |
|
Restructuring (charges) recoveries: |
|
|
|
|
|
|
|
|
|
|
|
|
|
GES North America |
|
|
( |
) |
|
|
( |
) |
|
|
( |
) |
|
GES EMEA |
|
|
( |
) |
|
|
( |
) |
|
|
( |
) |
|
Pursuit |
|
|
( |
) |
|
|
( |
) |
|
|
( |
) |
|
Corporate |
|
|
( |
) |
|
|
( |
) |
|
|
|
|
|
Impairment (charges) recoveries: |
|
|
|
|
|
|
|
|
|
|
|
|
|
GES North America |
|
|
( |
) |
|
|
( |
) |
|
|
— |
|
|
GES EMEA |
|
|
( |
) |
|
|
— |
|
|
|
— |
|
|
Pursuit |
|
|
( |
) |
|
|
— |
|
|
|
|
|
|
Legal settlement: |
|
|
|
|
|
|
|
|
|
|
|
|
|
GES |
|
|
— |
|
|
|
( |
) |
|
|
— |
|
|
Income (loss) from continuing operations before income taxes |
|
$ |
( |
) |
|
$ |
|
|
|
$ |
|
|
|
(1) |
|
|
|
|
79
|
|
|
December 31, |
|
|||||||||
|
(in thousands) |
|
2020 |
|
|
2019 |
|
|
2018 |
|
|||
|
Assets: |
|
|
|
|
|
|
|
|
|
|
|
|
|
GES: |
|
|
|
|
|
|
|
|
|
|
|
|
|
GES North America |
|
$ |
|
|
|
$ |
|
|
|
$ |
|
|
|
GES EMEA |
|
|
|
|
|
|
|
|
|
|
|
|
|
Pursuit |
|
|
|
|
|
|
|
|
|
|
|
|
|
Corporate and other |
|
|
|
|
|
|
|
|
|
|
|
|
|
|
|
$ |
|
|
|
$ |
|
|
|
$ |
|
|
|
Depreciation and amortization: |
|
|
|
|
|
|
|
|
|
|
|
|
|
GES: |
|
|
|
|
|
|
|
|
|
|
|
|
|
GES North America |
|
$ |
|
|
|
$ |
|
|
|
$ |
|
|
|
GES EMEA |
|
|
|
|
|
|
|
|
|
|
|
|
|
Pursuit |
|
|
|
|
|
|
|
|
|
|
|
|
|
Corporate and other |
|
|
|
|
|
|
|
|
|
|
|
|
|
|
|
$ |
|
|
|
$ |
|
|
|
$ |
|
|
|
Capital expenditures: |
|
|
|
|
|
|
|
|
|
|
|
|
|
GES: |
|
|
|
|
|
|
|
|
|
|
|
|
|
GES North America |
|
$ |
|
|
|
$ |
|
|
|
$ |
|
|
|
GES EMEA |
|
|
|
|
|
|
|
|
|
|
|
|
|
Pursuit |
|
|
|
|
|
|
|
|
|
|
|
|
|
Corporate and other |
|
|
— |
|
|
|
|
|
|
|
|
|
|
|
|
$ |
|
|
|
$ |
|
|
|
$ |
|
|
Geographic Areas
Our foreign operations are primarily in Canada, the United Kingdom, Iceland, the Netherlands, Germany, and to a lesser extent, in certain other countries. GES revenue is designated as domestic or foreign based on the originating location of the product or service. Long-lived assets are attributed to domestic or foreign based principally on the physical location of the assets. Long-lived assets consist of “Property and equipment, net” and “Other investments and assets.”
|
|
|
December 31, |
|
|||||||||
|
(in thousands) |
|
2020 |
|
|
2019 |
|
|
2018 |
|
|||
|
Revenue: |
|
|
|
|
|
|
|
|
|
|
|
|
|
United States |
|
$ |
|
|
|
$ |
|
|
|
$ |
|
|
|
EMEA |
|
|
|
|
|
|
|
|
|
|
|
|
|
Canada |
|
|
|
|
|
|
|
|
|
|
|
|
|
Total revenue |
|
$ |
|
|
|
$ |
|
|
|
$ |
|
|
|
Long-lived assets: |
|
|
|
|
|
|
|
|
|
|
|
|
|
United States |
|
$ |
|
|
|
$ |
|
|
|
$ |
|
|
|
EMEA |
|
|
|
|
|
|
|
|
|
|
|
|
|
Canada |
|
|
|
|
|
|
|
|
|
|
|
|
|
Total long-lived assets |
|
$ |
|
|
|
$ |
|
|
|
$ |
|
|
80
Note 24. Selected Quarterly Financial Information (Unaudited)
The following table sets forth selected unaudited consolidated quarterly financial information:
|
2020 |
|
2020 |
|
|
2019 |
|
||||||||||||||||||||||||||
|
(in thousands, except per share data) |
|
First Quarter |
|
|
Second Quarter |
|
|
Third Quarter |
|
|
Fourth Quarter |
|
|
First Quarter |
|
|
Second Quarter |
|
|
Third Quarter |
|
|
Fourth Quarter |
|
||||||||
|
Revenue as previously reported |
|
$ |
|
|
|
$ |
|
|
|
$ |
|
|
|
|
|
|
|
$ |
|
|
|
$ |
|
|
|
$ |
|
|
|
$ |
|
|
|
Gross to net correction(1) |
|
|
( |
) |
|
|
( |
) |
|
|
( |
) |
|
|
|
|
|
|
( |
) |
|
|
( |
) |
|
|
( |
) |
|
|
( |
) |
|
Revenue as corrected |
|
$ |
|
|
|
$ |
|
|
|
$ |
|
|
|
$ |
|
|
|
$ |
|
|
|
$ |
|
|
|
$ |
|
|
|
$ |
|
|
|
|
|
|
|
|
|
|
|
|
|
|
|
|
|
|
|
|
|
|
|
|
|
|
|
|
|
|
|
|
|
|
|
|
|
Operating income (loss): |
|
|
|
|
|
|
|
|
|
|
|
|
|
|
|
|
|
|
|
|
|
|
|
|
|
|
|
|
|
|
|
|
|
Ongoing operations(2) |
|
$ |
( |
) |
|
$ |
( |
) |
|
$ |
( |
) |
|
$ |
( |
) |
|
$ |
( |
) |
|
$ |
|
|
|
$ |
|
|
|
$ |
|
|
|
Business interruption gain |
|
|
— |
|
|
|
— |
|
|
|
— |
|
|
|
— |
|
|
|
— |
|
|
|
|
|
|
|
— |
|
|
|
— |
|
|
Corporate activities |
|
|
( |
) |
|
|
( |
) |
|
|
( |
) |
|
|
( |
) |
|
|
( |
) |
|
|
( |
) |
|
|
( |
) |
|
|
( |
) |
|
Interest income |
|
|
|
|
|
|
|
|
|
|
|
|
|
|
|
|
|
|
|
|
|
|
|
|
|
|
|
|
|
|
|
|
|
Interest expense |
|
|
( |
) |
|
|
( |
) |
|
|
( |
) |
|
|
( |
) |
|
|
( |
) |
|
|
( |
) |
|
|
( |
) |
|
|
( |
) |
|
Multi-employer pension plan withdrawal |
|
|
— |
|
|
|
( |
) |
|
|
— |
|
|
|
— |
|
|
|
— |
|
|
|
( |
) |
|
|
— |
|
|
|
( |
) |
|
Other expense, net |
|
|
( |
) |
|
|
( |
) |
|
|
( |
) |
|
|
( |
) |
|
|
( |
) |
|
|
( |
) |
|
|
( |
) |
|
|
( |
) |
|
Restructuring charges |
|
|
( |
) |
|
|
( |
) |
|
|
( |
) |
|
|
( |
) |
|
|
( |
) |
|
|
( |
) |
|
|
( |
) |
|
|
( |
) |
|
Legal settlement |
|
|
— |
|
|
|
— |
|
|
|
— |
|
|
|
— |
|
|
|
( |
) |
|
|
— |
|
|
|
— |
|
|
|
— |
|
|
Impairment charges |
|
|
( |
) |
|
|
( |
) |
|
|
( |
) |
|
|
— |
|
|
|
— |
|
|
|
— |
|
|
|
— |
|
|
|
( |
) |
|
Income (loss) from continuing operations before income taxes |
|
$ |
( |
) |
|
$ |
( |
) |
|
$ |
( |
) |
|
$ |
( |
) |
|
$ |
( |
) |
|
$ |
|
|
|
$ |
|
|
|
$ |
( |
) |
|
Income (loss) from continuing operations attributable to Viad |
|
$ |
( |
) |
|
$ |
( |
) |
|
$ |
( |
) |
|
$ |
( |
) |
|
$ |
( |
) |
|
$ |
|
|
|
$ |
|
|
|
$ |
( |
) |
|
Net income (loss) attributable to Viad |
|
$ |
( |
) |
|
$ |
( |
) |
|
$ |
( |
) |
|
$ |
( |
) |
|
$ |
( |
) |
|
$ |
|
|
|
$ |
|
|
|
$ |
( |
) |
|
Diluted income (loss) per common share:(3) |
|
|
|
|
|
|
|
|
|
|
|
|
|
|
|
|
|
|
|
|
|
|
|
|
|
|
|
|
|
|
|
|
|
Income (loss) from continuing operations attributable to Viad common stockholders |
|
$ |
( |
) |
|
$ |
( |
) |
|
$ |
( |
) |
|
$ |
( |
) |
|
$ |
( |
) |
|
$ |
|
|
|
$ |
|
|
|
$ |
( |
) |
|
Net income (loss) attributable to Viad common stockholders |
|
$ |
( |
) |
|
$ |
( |
) |
|
$ |
( |
) |
|
$ |
( |
) |
|
$ |
( |
) |
|
$ |
|
|
|
$ |
|
|
|
$ |
( |
) |
|
|
(1) |
The quarterly financial data for the four quarters of 2019 and the first three quarters of 2020 were adjusted for immaterial errors related to the recognition of revenue of GES’ Corporate Accounts’ third-party services. Refer to Note 1 – Overview and Summary of Significant Accounting Policies for additional information. The Company intends to correct for these errors prospectively in subsequent quarterly filings. |
|
|
(2) |
|
|
|
(3) |
|
Note 25. Subsequent Event
Sale of Orlando warehouse
On January 25, 2021, we sold a GES warehouse in Orlando and received cash proceeds of approximately $
81
REPORT OF INDEPENDENT REGISTERED PUBLIC ACCOUNTING FIRM
To the Board of Directors and Stockholders of Viad Corp
Opinion on the Financial Statements
We have audited the accompanying consolidated balance sheets of Viad Corp and subsidiaries (the “Company”) as of December 31, 2020 and 2019, the related consolidated statements of operations, comprehensive income (loss), stockholders’ equity and mezzanine equity, and cash flows, for each of the three years in the period ended December 31, 2020, and the related notes and the schedule listed in the Index at Item 15 (collectively referred to as the “financial statements”). In our opinion, the financial statements present fairly, in all material respects, the financial position of the Company as of December 31, 2020 and 2019, and the results of its operations and its cash flows for each of the three years in the period ended December 31, 2020, in conformity with accounting principles generally accepted in the United States of America.
We have also audited, in accordance with the standards of the Public Company Accounting Oversight Board (United States) (PCAOB), the Company’s internal control over financial reporting as of December 31, 2020, based on criteria established in Internal Control — Integrated Framework (2013) issued by the Committee of Sponsoring Organizations of the Treadway Commission and our report dated March 1, 2021 expressed an unqualified opinion on the Company’s internal control over financial reporting.
Basis for Opinion
These financial statements are the responsibility of the Company’s management. Our responsibility is to express an opinion on the Company’s financial statements based on our audits. We are a public accounting firm registered with the PCAOB and are required to be independent with respect to the Company in accordance with the U.S. federal securities laws and the applicable rules and regulations of the Securities and Exchange Commission and the PCAOB.
We conducted our audits in accordance with the standards of the PCAOB. Those standards require that we plan and perform the audit to obtain reasonable assurance about whether the financial statements are free of material misstatement, whether due to error or fraud. Our audits included performing procedures to assess the risks of material misstatement of the financial statements, whether due to error or fraud, and performing procedures that respond to those risks. Such procedures included examining, on a test basis, evidence regarding the amounts and disclosures in the financial statements. Our audits also included evaluating the accounting principles used and significant estimates made by management, as well as evaluating the overall presentation of the financial statements. We believe that our audits provide a reasonable basis for our opinion.
Critical Audit Matters
The critical audit matters communicated below are matters arising from the current-period audit of the financial statements that were communicated or required to be communicated to the audit committee and that (1) relate to accounts or disclosures that are material to the financial statements and (2) involved our especially challenging, subjective, or complex judgments. The communication of critical audit matters does not alter in any way our opinion on the financial statements, taken as a whole, and we are not, by communicating the critical audit matters below, providing a separate opinion on the critical audit matters or on the accounts or disclosures to which they relate.
Litigation, Claims, Contingencies, and Other—Self Insurance Reserves —Refer to Notes 1 and 21 to the financial statements
Critical Audit Matter Description
The Company is self-insured up to certain limits for workers’ compensation, automobile, product and general liability claims. Reserves for losses for claims incurred, including actuarially derived estimated claims incurred but not reported, are made by the Company based on historical experience, claims frequency, insurance coverage, and other factors. The Company purchases insurance for amounts in excess of self-insured levels. The aggregate amount of these insurance liabilities related to continuing operations was $18.7 million as of December 31, 2020.
Given the subjectivity of estimating the projected settlement value of reported and unreported claims, auditing the self-insurance reserves involved especially subjective auditor judgment and an increased extent of effort, including the need to involve our actuarial specialists when auditing the self-insurance reserves, and therefore we have identified this as a critical audit matter.
How the Critical Audit Matter Was Addressed in the Audit
Our audit procedures related to the self-insurance reserves included the following, among others:
|
• |
We tested the effectiveness of controls related to self-insurance reserves, including those over the projection of settlement value of reported and unreported claims. |
82
|
• |
We evaluated the methods and assumptions used by management to estimate the self-insurance reserves by: |
|
|
• |
Agreeing the underlying claims data to source documents that served as the basis for the Company’s actuarial analysis, to evaluate whether the inputs to the actuarial estimate were reasonable. |
|
|
• |
Comparing management’s prior-year assumptions of expected development and ultimate loss to actuals incurred during the current year to identify potential bias in the determination of the self-insurance reserves. |
|
• |
With the assistance of our actuarial specialists, we developed independent estimates of the self-insurance reserves, using standard traditional actuarial methodologies, and compared our estimates to management’s estimates. |
Goodwill — GES U.S., GES EMEA, GES Canada, and FlyOver – Refer to Notes 1 and 9 to the financial statements
Critical Audit Matter Description
The Company’s evaluation of goodwill for impairment involves the comparison of the fair value of each reporting unit to its carrying value. The Company used the discounted cash flow model to estimate fair value, which requires management to make significant estimates and assumptions related to discount rates and forecasts of future revenues and earnings before interest, taxes, depreciation, and amortization (EBITDA) margins. Changes in these assumptions could have a significant impact on either the fair value, the amount of goodwill impairment charge, or both. The fair value of GES US, GES EMEA, and GES Canada reporting units did not exceed their carrying values and therefore, the Company recorded total impairment charges across these reporting units of $184 million. The fair value of the FlyOver reporting unit exceeded its carrying value and therefore no impairment was recognized.
Given the significant judgments made by management to estimate the fair value of these reporting units, performing audit procedures to evaluate the reasonableness of management’s estimates and assumptions related to selection of the discount rate and forecasts of future revenue and EBITDA margins required a high degree of auditor judgment and an increased extent of effort, including the need to involve our fair value specialists.
How the Critical Audit Matter Was Addressed in the Audit
Our audit procedures related to the discount rates and forecasts of future revenue and EBITDA margins (“forecasts”) used by management to estimate the fair values of GES U.S., GES EMEA, GES Canada and FlyOver reporting units included the following procedures:
|
|
• |
We tested the effectiveness of controls over management’s goodwill impairment evaluation, including those over the determination of the fair values of the reporting units, such as the control related to management’s selection of the discount rates and forecasts. |
|
|
• |
We evaluated the reasonableness of management’s forecasts by comparing the forecasts to (1) historical results of the Company, (2) internal communications to management, and (3) forecasted information included in industry reports of the Company. |
|
|
• |
With the assistance of our fair value specialists, we evaluated the reasonableness of the (1) valuation methodology and (2) discount rate, including testing the source information underlying the determination of the discount rate, testing the mathematical accuracy of the calculation, and developing a range of independent estimates and comparing those to the discount rate selected by management. |
/s/ Deloitte & Touche LLP
Phoenix, Arizona
March 1, 2021
We have served as the Company’s auditor since at least 1929; however, an earlier year could not be reliably determined.
83
Item 9. Changes in and Disagreements With Accountants on Accounting and Financial Disclosure
None.
Item 9A. Controls and Procedures
We have established disclosure controls and procedures that are designed to ensure that information required to be disclosed in our reports filed or submitted under the Securities Exchange Act of 1934, as amended (the “Exchange Act”) is recorded, processed, summarized, and reported within the time periods specified in SEC rules and forms, and such information is accumulated and communicated to our management, including our Chief Executive Officer (“CEO”) and Chief Financial Officer (“CFO”), as appropriate to allow timely decisions regarding required disclosure. Management, together with our CEO and CFO, evaluated the effectiveness of our disclosure controls and procedures as of December 31, 2020. Based on this evaluation, the CEO and CFO concluded that our disclosure controls and procedures were effective as of December 31, 2020.
There were no changes in our internal control over financial reporting during the fourth quarter of 2020 that have materially affected, or are reasonably likely to materially affect, our internal control over financial reporting.
84
MANAGEMENT’S REPORT ON INTERNAL CONTROL OVER FINANCIAL REPORTING
Management is responsible for establishing and maintaining adequate internal control over financial reporting. Internal control over financial reporting is defined in Rule 13a-15(f) or 15d-15(f) of the Exchange Act as a process designed by, or under the supervision of, our principal executive and principal financial officers and effected by our board of directors, our management and other personnel, to provide reasonable assurance regarding the reliability of financial reporting and the preparation of financial statements for external purposes in accordance with U.S. GAAP and includes those policies and procedures that:
|
|
• |
Pertain to the maintenance of records that in reasonable detail accurately and fairly reflect the transactions and dispositions of our assets; |
|
|
• |
Provide reasonable assurance that transactions are recorded as necessary to permit preparation of financial statements in accordance with U.S. GAAP, and that our receipts and expenditures are being made only in accordance with authorizations of our management and directors; and |
|
|
• |
Provide reasonable assurance regarding prevention or timely detection of unauthorized acquisition, use or disposition of our assets that could have a material effect on our financial statements. |
Because of inherent limitations, internal control over financial reporting may not prevent or detect misstatements. Projections of any evaluation of effectiveness to future periods are subject to the risk that controls may become inadequate because of changes in conditions, or that the degree of compliance with the policies or procedures may deteriorate. All internal control systems, no matter how well designed, have inherent limitations. Therefore, even those systems determined to be effective can provide only reasonable assurance with respect to financial statement preparation and presentation. Because of the inherent limitations of internal control, there is a risk that material misstatements may not be prevented or detected on a timely basis by internal control over financial reporting. However, these inherent limitations are known features of the financial reporting process. Therefore, it is possible to design into the process safeguards to reduce, though not eliminate, this risk.
Management performed an assessment of the effectiveness of our internal control over financial reporting using the criteria described in the “Internal Control - Integrated Framework (2013),” issued by the Committee of Sponsoring Organizations of the Treadway Commission. The objective of this assessment was to determine whether our internal control over financial reporting was effective as of December 31, 2020.
Based on our assessment, we concluded that, as of December 31, 2020, our internal control over financial reporting is effective based on those criteria.
Our independent registered public accounting firm, Deloitte & Touche LLP, has issued a report relating to our audit of the effectiveness of our internal control over financial reporting, which appears on the following page of this 2020 Form 10-K.
85
REPORT OF INDEPENDENT REGISTERED PUBLIC ACCOUNTING FIRM
To the Board of Directors and Stockholders of Viad Corp
Opinion on Internal Control over Financial Reporting
We have audited the internal control over financial reporting of Viad Corp and subsidiaries (the “Company”) as of December 31, 2020, based on criteria established in Internal Control — Integrated Framework (2013) issued by the Committee of Sponsoring Organizations of the Treadway Commission (COSO). In our opinion, the Company maintained, in all material respects, effective internal control over financial reporting as of December 31, 2020, based on criteria established in Internal Control — Integrated Framework (2013) issued by COSO.
We have also audited, in accordance with the standards of the Public Company Accounting Oversight Board (United States) (PCAOB), the consolidated financial statements as of and for the year ended December 31, 2020, of the Company and our report dated March 1, 2021, expressed an unqualified opinion on those consolidated financial statements and financial statement schedule.
Basis for Opinion
The Company’s management is responsible for maintaining effective internal control over financial reporting and for its assessment of the effectiveness of internal control over financial reporting, included in the accompanying Management’s Report on Internal Control over Financial Reporting. Our responsibility is to express an opinion on the Company’s internal control over financial reporting based on our audit. We are a public accounting firm registered with the PCAOB and are required to be independent with respect to the Company in accordance with the U.S. federal securities laws and the applicable rules and regulations of the Securities and Exchange Commission and the PCAOB.
We conducted our audit in accordance with the standards of the PCAOB. Those standards require that we plan and perform the audit to obtain reasonable assurance about whether effective internal control over financial reporting was maintained in all material respects. Our audit included obtaining an understanding of internal control over financial reporting, assessing the risk that a material weakness exists, testing and evaluating the design and operating effectiveness of internal control based on the assessed risk, and performing such other procedures as we considered necessary in the circumstances. We believe that our audit provides a reasonable basis for our opinion.
Definition and Limitations of Internal Control over Financial Reporting
A company’s internal control over financial reporting is a process designed to provide reasonable assurance regarding the reliability of financial reporting and the preparation of financial statements for external purposes in accordance with generally accepted accounting principles. A company’s internal control over financial reporting includes those policies and procedures that (1) pertain to the maintenance of records that, in reasonable detail, accurately and fairly reflect the transactions and dispositions of the assets of the company; (2) provide reasonable assurance that transactions are recorded as necessary to permit preparation of financial statements in accordance with generally accepted accounting principles, and that receipts and expenditures of the company are being made only in accordance with authorizations of management and directors of the company; and (3) provide reasonable assurance regarding prevention or timely detection of unauthorized acquisition, use, or disposition of the company’s assets that could have a material effect on the financial statements.
Because of its inherent limitations, internal control over financial reporting may not prevent or detect misstatements. Also, projections of any evaluation of effectiveness to future periods are subject to the risk that controls may become inadequate because of changes in conditions, or that the degree of compliance with the policies or procedures may deteriorate.
/s/ Deloitte & Touche LLP
Phoenix, Arizona
March 1, 2021
Item 9B. Other Information
Not applicable.
86
PART III
Item 10. Directors, Executive Officers and Corporate Governance
Information regarding our directors, director nomination procedures, and the Audit Committee of our Board of Directors is included in our Proxy Statement for the Annual Meeting of Shareholders to be held on May 14, 2021 (the “Proxy Statement”), under the captions “Election of Directors,” “Board of Directors and Corporate Governance,” and “Stock Ownership Information,” and are incorporated herein by reference. Information regarding our executive officers is located in Part I, “Other – Information about our Executive Officers” of this 2020 Form 10-K.
We adopted a Code of Ethics for all of our directors, officers and employees. A copy of our Code of Ethics is available at our website at www.viad.com/about-us/corporate-governance/documents-and-charters/default.aspx and is also available without charge to any shareholder upon written request to: Viad Corp, 1850 North Central Avenue, Suite 1900, Phoenix, Arizona 85004-4565, Attention: Corporate Secretary.
Item 11. Executive Compensation
Information in the Proxy Statement under the captions “Compensation Discussion and Analysis,” “Board of Directors and Corporate Governance,” and “Executive Compensation” is incorporated herein by reference.
Item 12. Security Ownership of Certain Beneficial Owners and Management and Related Stockholder Matters
Information in the Proxy Statement under the captions “Executive Compensation” and “Stock Ownership Information” is incorporated herein by reference.
Item 13. Certain Relationships and Related Transactions, and Director Independence
Information in the Proxy Statement under the caption “Board of Directors and Corporate Governance” is incorporated herein by reference.
Item 14. Principal AccountANT Fees and Services
Information regarding principal accountant fees and services and the pre-approval policies and procedures for such fees and services, as adopted by the Audit Committee of the Board of Directors, is contained in the Proxy Statement under the caption “Ratification of the Selection of Deloitte & Touche LLP as Our Independent Registered Public Accounting Firm for 2021” and is incorporated herein by reference.
PART IV
Item 15. Exhibits AND Financial Statement Schedule
|
(a) |
Financial Statements and Schedule |
See Index to Financial Statements and Financial Statement Schedule at Item 8 of this 2020 Form 10-K.
|
(b) |
Exhibit Index |
87
|
|
|
|
|
|
|
Incorporated by Reference |
||||||
|
Exhibit Number |
|
|
|
Exhibit Description |
|
Form |
|
Period Ending |
|
Exhibit |
|
Filing Date |
|
|
|
|
|
|
|
|
|
|
|
|
|
|
|
2.A |
|
|
|
|
8-K |
|
|
|
2.1 |
|
5/30/2019 |
|
|
|
|
|
|
|
|
|
|
|
|
|
|
|
|
2.B |
|
|
|
|
8-K |
|
|
|
2.2 |
|
5/30/2019 |
|
|
|
|
|
|
|
|
|
|
|
|
|
|
|
|
3.A |
|
|
|
|
10-Q |
|
6/30/2004 |
|
3.A |
|
8/9/2004 |
|
|
|
|
|
|
|
|
|
|
|
|
|
|
|
|
3.B |
|
|
|
|
8-K |
|
|
|
3 |
|
12/9/2013 |
|
|
|
|
|
|
|
|
|
|
|
|
|
|
|
|
3.C |
|
|
|
Certificate of Designations of 5.5% Series A Convertible Preferred Stock. |
|
8-K |
|
|
|
3.1 |
|
8/5/2020 |
|
|
|
|
|
|
|
|
|
|
|
|
|
|
|
4.A1 |
|
|
|
|
8-K |
|
|
|
4.1 |
|
3/30/2020 |
|
|
|
|
|
|
|
|
|
|
|
|
|
|
|
|
4.A2 |
|
|
|
|
8-K |
|
|
|
10.3 |
|
8/5/2020 |
|
|
|
|
|
|
|
|
|
|
|
|
|
|
|
|
4.B |
|
|
|
|
8-K |
|
|
|
4.1 |
|
8/5/2020 |
|
|
|
|
|
|
|
|
|
|
|
|
|
|
|
|
4.C |
|
|
|
|
10-K |
|
12/31/2019 |
|
4.B |
|
2/26/2020 |
|
|
|
|
|
|
|
|
|
|
|
|
|
|
|
|
10.A1 |
|
+ |
|
|
DEF 14A |
|
|
|
|
|
4/13/2012 |
|
|
|
|
|
|
|
|
|
|
|
|
|
|
|
|
10.A2 |
|
+ |
|
|
8-K |
|
|
|
10.A |
|
3/28/2014 |
|
|
|
|
|
|
|
|
|
|
|
|
|
|
|
|
10.A3 |
|
+ |
|
|
8-K |
|
|
|
10.B |
|
3/28/2014 |
|
|
|
|
|
|
|
|
|
|
|
|
|
|
|
|
10.A4 |
|
+ |
|
|
8-K |
|
|
|
10.F |
|
2/28/2008 |
|
|
|
|
|
|
|
|
|
|
|
|
|
|
|
|
10.A5 |
|
+ |
|
|
8-K |
|
|
|
10.B |
|
2/26/2010 |
|
|
|
|
|
|
|
|
|
|
|
|
|
|
|
|
|
|
|
|
|
|
|
|
|
|
|
|
|
88
|
|
|
|
|
|
|
Incorporated by Reference |
||||||
|
Exhibit Number |
|
|
|
Exhibit Description |
|
Form |
|
Period Ending |
|
Exhibit |
|
Filing Date |
|
|
|
|
|
|
|
|
|
|
|
|
|
|
|
10.A6 |
|
+ |
|
|
8-K |
|
|
|
10.A |
|
2/26/2010 |
|
|
|
|
|
|
|
|
|
|
|
|
|
|
|
|
10.A7 |
|
|
|
|
10-Q |
|
9/30/2020 |
|
10.7 |
|
11/6/2020 |
|
|
|
|
|
|
|
|
|
|
|
|
|
|
|
|
10.A8 |
|
+ |
|
|
8-K |
|
|
|
10.D |
|
3/5/2013 |
|
|
|
|
|
|
|
|
|
|
|
|
|
|
|
|
10.A9 |
|
+ |
|
|
8-K |
|
|
|
10.B |
|
3/1/2016 |
|
|
|
|
|
|
|
|
|
|
|
|
|
|
|
|
10.A10 |
|
+ |
|
|
8-K |
|
|
|
10.C |
|
3/28/2014 |
|
|
|
|
|
|
|
|
|
|
|
|
|
|
|
|
10.A11 |
|
+ |
|
|
8-K |
|
|
|
10.A |
|
3/1/2016 |
|
|
|
|
|
|
|
|
|
|
|
|
|
|
|
|
10.B1 |
|
+ |
|
2017 Viad Corp Omnibus Incentive Plan, effective as of May 18, 2017. |
|
8-K |
|
|
|
10.1 |
|
5/23/2017 |
|
|
|
|
|
|
|
|
|
|
|
|
|
|
|
10.B3 |
|
+ |
|
|
8-K |
|
|
|
10.4 |
|
5/23/2017 |
|
|
|
|
|
|
|
|
|
|
|
|
|
|
|
|
10.B4 |
|
+
|
|
|
10-K |
|
12/31/2017 |
|
10.B4 |
|
2/28/2018 |
|
|
|
|
|
|
|
|
|
|
|
|
|
|
|
|
10.B5 |
|
+
|
|
|
10-K |
|
12/31/2017 |
|
10.B5 |
|
2/28/2018 |
|
|
|
|
|
|
|
|
|
|
|
|
|
|
|
|
10.B6 |
|
+
|
|
|
10-K |
|
12/31/2017 |
|
10.B6 |
|
2/28/2018 |
|
|
|
|
|
|
|
|
|
|
|
|
|
|
|
|
10.B7 |
|
+
|
|
|
10-K |
|
12/31/2017 |
|
10.B7 |
|
2/28/2018 |
|
|
|
|
|
|
|
|
|
|
|
|
|
|
|
|
10.B8 |
|
+
|
|
|
10-K |
|
12/31/2017 |
|
10.B8 |
|
2/28/2018 |
|
|
|
|
|
|
|
|
|
|
|
|
|
|
|
|
10.B9 |
|
+ |
|
|
8-K |
|
|
|
10.2 |
|
5/23/2017 |
|
|
|
|
|
|
|
|
|
|
|
|
|
|
|
|
|
|
|
|
|
|
|
|
|
|
|
|
|
89
|
|
|
|
|
|
|
Incorporated by Reference |
||||||
|
Exhibit Number |
|
|
|
Exhibit Description |
|
Form |
|
Period Ending |
|
Exhibit |
|
Filing Date |
|
|
|
|
|
|
|
|
|
|
|
|
|
|
|
10.B10 |
|
+
|
|
|
10-K |
|
12/31/2017 |
|
10.B10 |
|
2/28/2018 |
|
|
|
|
|
|
|
|
|
|
|
|
|
|
|
|
10.C1 |
|
+ |
|
|
8-K |
|
|
|
10.B |
|
8/29/2007 |
|
|
|
|
|
|
|
|
|
|
|
|
|
|
|
|
10.C2 |
|
+ |
|
Form of Viad Corp Executive Severance Plan (Tier I-2013) effective as February 27, 2013. |
|
8-K |
|
|
|
10.B |
|
3/5/2013 |
|
|
|
|
|
|
|
|
|
|
|
|
|
|
|
10.C3 |
|
+ |
|
Amendment No. 1 to Viad Corp Executive Severance Plan (Tier I), effective as of February 26, 2014. |
|
8-K |
|
|
|
10 |
|
3/4/2014 |
|
|
|
|
|
|
|
|
|
|
|
|
|
|
|
10.C4 |
|
+ |
|
|
8-K |
|
|
|
10.B |
|
12/5/2014 |
|
|
|
|
|
|
|
|
|
|
|
|
|
|
|
|
10.C5 |
|
+ |
|
|
10-K |
|
12/31/2015 |
|
10.H4 |
|
3/11/2016 |
|
|
|
|
|
|
|
|
|
|
|
|
|
|
|
|
10.C6 |
|
+ |
|
|
8-K/A |
|
|
|
10.1 |
|
12/1/2017 |
|
|
|
|
|
|
|
|
|
|
|
|
|
|
|
|
10.C7 |
|
|
|
|
10-Q |
|
3/31/2020 |
|
10.1 |
|
6/22/2020 |
|
|
|
|
|
|
|
|
|
|
|
|
|
|
|
|
10. D1 |
|
|
|
|
8-K |
|
|
|
4.1 |
|
10/25/2018 |
|
|
|
|
|
|
|
|
|
|
|
|
|
|
|
|
10.D2 |
|
|
|
|
8-K |
|
|
|
4.A2 |
|
7/25/2019 |
|
|
|
|
|
|
|
|
|
|
|
|
|
|
|
|
10.D3 |
|
|
|
Amendment No. 2 to $450 million Second Amended and Restated Credit Agreement, dated May 8, 2020. |
|
8-K |
|
|
|
4.A3 |
|
5/11/2020 |
|
|
|
|
|
|
|
|
|
|
|
|
|
|
|
10.D4 |
|
|
|
|
8-K |
|
|
|
10.6 |
|
8/5/2020 |
|
|
|
|
|
|
|
|
|
|
|
|
|
|
|
|
10.E1 |
|
+ |
|
|
8-K |
|
|
|
10.A |
|
8/29/2007 |
|
|
|
|
|
|
|
|
|
|
|
|
|
|
|
|
10.F1 |
|
+ |
|
|
8-K |
|
|
|
10.E |
|
3/5/2013 |
|
|
|
|
|
|
|
|
|
|
|
|
|
|
|
|
10.G1 |
|
+ |
|
Executive Officer Pay Continuation Policy adopted February 7, 2007. |
|
8-K |
|
|
|
10.A |
|
2/13/2007 |
|
|
|
|
|
|
|
|
|
|
|
|
|
|
90
|
|
|
|
|
|
|
|
|
|
|
|
|
|
|
|
|
|
|
|
|
Incorporated by Reference |
||||||
|
Exhibit Number |
|
|
|
Exhibit Description |
|
Form |
|
Period Ending |
|
Exhibit |
|
Filing Date |
|
10.H1 |
|
+ |
|
Viad Corp Directors’ Matching Gift Program, effective as of February 18, 1999. |
|
10-K |
|
12/31/2018 |
|
10.H1 |
|
2/27/2019 |
|
|
|
|
|
|
|
|
|
|
|
|
|
|
|
10.I1 |
|
+ |
|
|
10-K |
|
12/31/2008 |
|
10.1 |
|
2/27/2009 |
|
|
|
|
|
|
|
|
|
|
|
|
|
|
|
|
10.J1 |
|
+ * |
|
|
|
|
|
|
|
|
|
|
|
|
|
|
|
|
|
|
|
|
|
|
|
|
|
10.K1 |
|
|
|
|
8-K |
|
|
|
10.1 |
|
8/5/2020 |
|
|
|
|
|
|
|
|
|
|
|
|
|
|
|
|
10.K2 |
|
|
|
|
8-K |
|
|
|
10.2 |
|
8/5/2020 |
|
|
|
|
|
|
|
|
|
|
|
|
|
|
|
|
10.K3 |
|
|
|
|
8-K |
|
|
|
10.4 |
|
8/5/2020 |
|
|
|
|
|
|
|
|
|
|
|
|
|
|
|
|
10.K4 |
|
|
|
|
8-K |
|
|
|
10.5 |
|
8/5/2020 |
|
|
|
|
|
|
|
|
|
|
|
|
|
|
|
|
21 |
|
* |
|
|
|
|
|
|
|
|
|
|
|
|
|
|
|
|
|
|
|
|
|
|
|
|
|
23 |
|
* |
|
|
|
|
|
|
|
|
|
|
|
|
|
|
|
|
|
|
|
|
|
|
|
|
|
24 |
|
* |
|
|
|
|
|
|
|
|
|
|
|
|
|
|
|
|
|
|
|
|
|
|
|
|
|
31.1 |
|
* |
|
|
|
|
|
|
|
|
|
|
|
|
|
|
|
|
|
|
|
|
|
|
|
|
|
31.2 |
|
* |
|
|
|
|
|
|
|
|
|
|
|
|
|
|
|
|
|
|
|
|
|
|
|
|
|
32.1 |
|
** |
|
|
|
|
|
|
|
|
|
|
|
|
|
|
|
|
|
|
|
|
|
|
|
|
|
101.INS |
|
*** |
|
XBRL Instance Document. |
|
|
|
|
|
|
|
|
|
|
|
|
|
|
|
|
|
|
|
|
|
|
|
101.SCH |
|
**** |
|
XBRL Taxonomy Extension Schema Document. |
|
|
|
|
|
|
|
|
|
|
|
|
|
|
|
|
|
|
|
|
|
|
|
101.CAL |
|
**** |
|
XBRL Taxonomy Extension Calculation Linkbase Document. |
|
|
|
|
|
|
|
|
|
|
|
|
|
|
|
|
|
|
|
|
|
|
|
101.LAB |
|
**** |
|
XBRL Taxonomy Extension Label Linkbase Document. |
|
|
|
|
|
|
|
|
|
|
|
|
|
|
|
|
|
|
|
|
|
|
|
101.PRE |
|
**** |
|
XBRL Taxonomy Extension Presentation Linkbase Document. |
|
|
|
|
|
|
|
|
|
|
|
|
|
|
|
|
|
|
|
|
|
|
|
101.DEF |
|
**** |
|
XBRL Taxonomy Extension Definition Linkbase Document. |
|
|
|
|
|
|
|
|
|
|
|
|
|
|
|
|
|
|
|
|
|
|
|
104 |
|
*** |
|
Cover Page Interactive Data File |
|
|
|
|
|
|
|
|
91
|
* |
Filed herewith. |
|
** |
Furnished herewith. |
|
*** |
The XBRL Instance Document and Cover Page Interactive Data File do not appear in the Interactive Data File because their XBRL tags are embedded within the Inline XBRL document. |
|
**** |
Submitted electronically herewith |
|
+ |
Management contract or compensation plan or arrangement. |
Item 16. Form 10-K summary
None.
92
VIAD CORP
SCHEDULE II – VALUATION AND QUALIFYING ACCOUNTS
|
|
|
|
|
|
|
Additions |
|
|
Deductions |
|
|
|
|
|
|
|
|
|
||||||
|
(in thousands) |
|
Balance at Beginning of Year |
|
|
Charged to Expense |
|
|
Charged to Other Accounts |
|
|
Write-Offs |
|
|
Other(1) |
|
|
Balance at End of Year |
|
||||||
|
Allowances for doubtful accounts: |
|
|
|
|
|
|
|
|
|
|
|
|
|
|
|
|
|
|
|
|
|
|
|
|
|
December 31, 2018 |
|
|
|
|
|
|
|
|
|
|
|
|
|
|
( |
) |
|
|
( |
) |
|
|
|
|
|
December 31, 2019 |
|
|
|
|
|
|
|
|
|
|
|
|
|
|
( |
) |
|
|
( |
) |
|
|
|
|
|
December 31, 2020 |
|
|
|
|
|
|
|
|
|
|
|
|
|
|
( |
) |
|
|
|
|
|
|
|
|
|
Deferred tax valuation allowance: |
|
|
|
|
|
|
|
|
|
|
|
|
|
|
|
|
|
|
|
|
|
|
|
|
|
December 31, 2018 |
|
|
|
|
|
|
|
|
|
|
— |
|
|
|
( |
) |
|
|
( |
) |
|
|
|
|
|
December 31, 2019 |
|
|
|
|
|
|
|
|
|
|
— |
|
|
|
— |
|
|
|
|
|
|
|
|
|
|
December 31, 2020 |
|
|
|
|
|
|
|
|
|
|
— |
|
|
|
— |
|
|
|
|
|
|
|
|
|
|
(1) |
“Other” primarily includes foreign exchange translation adjustments. |
93
SIGNATURES
Pursuant to the requirements of Section 13 or 15(d) of the Securities Exchange Act of 1934, the registrant has duly caused this report to be signed on its behalf by the undersigned, thereunto duly authorized, on March 1, 2021.
|
|
VIAD CORP |
|
|
|
|
|
|
|
By: |
/s/ Steven W. Moster |
|
|
|
Steven W. Moster |
|
|
|
President and Chief Executive Officer |
Pursuant to the requirements of the Securities Exchange Act of 1934, this report has been signed below by the following persons on behalf of the registrant and in the capacities and on the dates indicated:
|
|
|||||
|
|
|
|
|
|
|
|
|
|
|
Principal Executive Officer |
||
|
|
|
|
|
|
|
|
Date: |
March 1, 2021 |
|
By: |
/s/ Steven W. Moster |
|
|
|
|
|
|
Steven W. Moster |
|
|
|
|
|
|
President and Chief Executive Officer, Director |
|
|
|
|
|
|
|
|
|
|
|
|
Principal Financial Officer |
||
|
|
|
|
|
|
|
|
Date: |
March 1, 2021 |
|
By: |
/s/ Ellen M. Ingersoll |
|
|
|
|
|
|
Ellen M. Ingersoll |
|
|
|
|
|
|
Chief Financial Officer |
|
|
|
|
|
|
|
|
|
|
|
|
Principal Accounting Officer |
||
|
|
|
|
|
||
|
Date: |
March 1, 2021 |
|
By: |
/s/ Leslie S. Striedel |
|
|
|
|
|
|
Leslie S. Striedel |
|
|
|
|
|
|
Chief Accounting Officer |
|
|
|
|
|
|
|
|
|
|
|
|
Directors |
||
|
|
|
|
|
||
|
|
|
|
Andrew B. Benett* |
||
|
|
|
|
Brian P. Cassidy* |
||
|
|
|
|
Denise M. Coll* |
||
|
|
|
|
Richard H. Dozer* |
||
|
|
|
|
Virginia L. Henkels* |
||
|
|
|
|
Edward E. Mace* |
||
|
|
|
|
Kevin M. Rabbit* |
||
|
|
|
|
Joshua E. Schechter* |
||
|
|
|
|
|
|
|
|
Date: |
March 1, 2021 |
|
By: |
/s/ Ellen M. Ingersoll |
|
|
|
|
|
|
Ellen M. Ingersoll |
|
|
|
|
|
|
Attorney-in-Fact |
|
|
* |
Pursuant to power of attorney filed as Exhibit 24 to this 2020 Form 10-K |
94