UNITED STATES
SECURITIES AND EXCHANGE COMMISSION
Washington, D.C. 20549
FORM 10-K
(Mark One)
ANNUAL REPORT PURSUANT TO SECTION 13 OR 15(d) OF THE SECURITIES EXCHANGE ACT OF 1934 | |
For the fiscal year ended December 31, 2019
or
TRANSITION REPORT PURSUANT TO SECTION 13 OR 15(d) OF THE SECURITIES EXCHANGE ACT OF 1934 | |
For the transition period from to
Commission File No. 0-19731
(Exact Name of Registrant as Specified in Its Charter)
(State or Other Jurisdiction of Incorporation) | (IRS Employer Identification No.) |
(Address of principal executive offices) (Zip Code)
(Registrant’s Telephone Number, Including Area Code)
Securities registered pursuant to Section 12(b) of the Act:
Title of each class | Trading Symbol(s) | Name of each exchange on which registered | ||
Indicate by check mark if the registrant is a well-known seasoned issuer, as defined in Rule 405 of the Securities Act. Yes x No ¨
Indicate by check mark if the registrant is not required to file reports pursuant to Section 13 or Section 15(d) of the Act. Yes ¨ No x
Indicate by check mark whether the registrant (1) has filed all reports required to be filed by Section 13 or 15(d) of the Securities Exchange Act of 1934 during the preceding 12 months (or for such shorter period that the registrant was required to file such reports), and (2) has been subject to such filing requirements for the past 90 days. Yes x No ¨
Indicate by check mark whether the registrant has submitted electronically every Interactive Data File required to be submitted pursuant to Rule 405 of Regulation S-T (§ 232.405 of this chapter) during the preceding 12 months (or for such shorter period that the registrant was required to submit and post such files). Yes x No ¨
Indicate by check mark whether registrant is a large accelerated filer, an accelerated filer, a non-accelerated filer, or a smaller reporting company. See the definitions of “large accelerated filer,” “accelerated filer,” “smaller reporting company” and “emerging growth company” in Rule 12b-2 of the Exchange Act.
Smaller reporting company ☐ Emerging growth company ☐
If an emerging growth company, indicate by check mark if the registrant has elected not to use the extended transition period for complying with any new or revised financial accounting standards provided pursuant to Section 13(a) of the Exchange Act. ¨
Indicate by check mark whether the registrant is a shell company (as defined in Rule 12b-2 of the Exchange Act). Yes ☐ No x
The aggregate market value of the voting and non-voting common equity held by non-affiliates of the registrant based upon the closing price of its Common Stock on the Nasdaq Global Select Market on June 28, 2019 was $66.4 billion.*
The number of shares outstanding of the registrant’s Common Stock on February 18, 2020 was 1,263,636,656 .
DOCUMENTS INCORPORATED BY REFERENCE
Specified portions of the registrant’s proxy statement, which will be filed with the Commission pursuant to Regulation 14A in connection with the registrant’s 2020 Annual Meeting of Stockholders, to be held on May 6, 2020, are incorporated by reference into Part III of this Report.
* Based on a closing price of $67.56 per share on June 28, 2019. Excludes 284,647,252 shares of the registrant’s Common Stock held by executive officers, directors and any stockholders whose ownership exceeds 5% of registrant’s common stock outstanding at June 28, 2019. Exclusion of such shares should not be construed to indicate that any such person possesses the power, direct or indirect, to direct or cause the direction of the management or policies of the registrant or that such person is controlled by or under common control with the registrant.
GILEAD SCIENCES, INC.
2019 Form 10-K Annual Report
Table of Contents
PART I | ||
Item 1 | ||
Item 1A | ||
Item 1B | ||
Item 2 | ||
Item 3 | ||
Item 4 | ||
PART II | ||
Item 5 | ||
Item 6 | ||
Item 7 | ||
Item 7A | ||
Item 8 | ||
Item 9 | ||
Item 9A | ||
Item 9B | ||
PART III | ||
Item 10 | ||
Item 11 | ||
Item 12 | ||
Item 13 | ||
Item 14 | ||
PART IV | ||
Item 15 | ||
Item 16 | ||
We own or have rights to various trademarks, copyrights and trade names used in our business, including the following: GILEAD®, GILEAD SCIENCES®, AMBISOME®, ATRIPLA®, BIKTARVY®, CAYSTON®, COMPLERA®, DESCOVY®, DESCOVY FOR PREP®, EMTRIVA®, EPCLUSA®, EVIPLERA®, GENVOYA®, HARVONI®, HEPSERA®, LETAIRIS®, ODEFSEY®, RANEXA®, SOVALDI®, STRIBILD®, TRUVADA®, TRUVADA FOR PREP®, TYBOST®, VEMLIDY®, VIREAD®, VOSEVI®, YESCARTA® and ZYDELIG®. LEXISCAN® is a registered trademark of Astellas U.S. LLC. MACUGEN® is a registered trademark of Bausch Health Ireland Limited. SYMTUZA® is a registered trademark of Janssen Sciences Ireland UC. TAMIFLU® is a registered trademark of Hoffmann-La Roche Inc. This report also refers to trademarks, service marks and trade names of other companies.
This Annual Report on Form 10-K, including the section entitled “Management’s Discussion and Analysis of Financial Condition and Results of Operations,” contains forward-looking statements regarding future events and our future results that are subject to the safe harbors created under the Securities Act of 1933, as amended (the Securities Act), and the Securities Exchange Act of 1934, as amended (the Exchange Act). Words such as “expect,” “anticipate,” “target,” “goal,” “project,” “hope,” “intend,” “plan,” “believe,” “seek,” “estimate,” “continue,” “may,” “could,” “should,” “might,” "forecast," variations of such words and similar expressions are intended to identify such forward-looking statements. In addition, any statements other than statements of historical fact are forward-looking statements, including statements regarding overall trends, operating cost and revenue trends, liquidity and capital needs and other statements of expectations, beliefs, future plans and strategies, anticipated events or trends and similar expressions.
We have based these forward-looking statements on our current expectations about future events. These statements are not guarantees of future performance and involve risks, uncertainties and assumptions that are difficult to predict. Our actual results may differ materially from those suggested by these forward-looking statements for various reasons, including those identified in Part I, Item 1A of this Annual Report on Form 10-K under the heading “Risk Factors.” Given these risks and uncertainties, you are cautioned not to place undue reliance on forward-looking statements. The forward-looking statements included in this report are made only as of the date hereof. Except as required under federal securities laws and the rules and regulations of the Securities and Exchange Commission (SEC), we do not undertake, and specifically decline, any obligation to update any of these statements or to publicly announce the results of any revisions to any forward-looking statements after the distribution of this report, whether as a result of new information, future events, changes in assumptions or otherwise.
2
PART I
ITEM 1. | BUSINESS |
Gilead Sciences, Inc. (Gilead, we, our or us), incorporated in Delaware on June 22, 1987, is a research-based biopharmaceutical company that discovers, develops and commercializes innovative medicines in areas of unmet medical need. With each new discovery and investigational drug candidate, we strive to transform and simplify care for people with life-threatening illnesses around the world. We have operations in more than 35 countries worldwide, with headquarters in Foster City, California. Gilead’s primary areas of focus include viral diseases, inflammatory and fibrotic diseases and oncology. We seek to add to our existing portfolio of products through our internal discovery and clinical development programs, product acquisition, in-licensing and strategic collaborations.
Our Principal Products
Our innovative medicines represent advancements by offering enhanced modes of delivery, more convenient treatment regimens, improved resistance profiles, reduced side effects and greater efficacy. Our focus on innovation has allowed us to deliver more than 24 marketed products across multiple therapeutic areas.
Our principal products and the approved indications in the United States are as follows:
HIV/AIDS
• | Biktarvy® is an oral formulation dosed once a day for the treatment of HIV-1 infection in certain patients. Biktarvy is a single tablet regimen of a fixed-dose combination of our antiretroviral medications, bictegravir, emtricitabine and tenofovir alafenamide (TAF). |
• | Descovy® is an oral formulation indicated in combination with other antiretroviral agents for the treatment of HIV-1 infection in certain patients. Descovy is a fixed-dose combination of our antiretroviral medications, emtricitabine and TAF. Descovy is also approved by U.S. Food and Drug Administration (FDA) for a pre-exposure prophylaxis (PrEP) indication to reduce the risk of sexually acquired HIV-1 infection in certain at-risk patients. |
• | Odefsey® is an oral formulation dosed once a day for the treatment of HIV-1 infection in certain patients. Odefsey is a single tablet regimen of a fixed-dose combination of our antiretroviral medications, emtricitabine and TAF, and rilpivirine marketed by Janssen Sciences Ireland UC, one of the Janssen Pharmaceutical Companies of Johnson & Johnson (Janssen). |
• | Genvoya® is an oral formulation dosed once a day for the treatment of HIV-1 infection in certain patients. Genvoya is a single tablet regimen of a fixed-dose combination of our antiretroviral medicines, elvitegravir, cobicistat, emtricitabine and TAF. |
• | Stribild® is an oral formulation dosed once a day for the treatment of HIV-1 infection in certain patients. Stribild is a single tablet regimen of a fixed-dose combination of our antiretroviral medications, elvitegravir, cobicistat, tenofovir disoproxil fumarate (TDF) and emtricitabine. |
• | Complera®/Eviplera® is an oral formulation dosed once a day for the treatment of HIV-1 infection in certain patients. The product, marketed in the United States as Complera and in Europe as Eviplera, is a single tablet regimen of a fixed-dose combination of our antiretroviral medications, TDF and emtricitabine, and Janssen’s rilpivirine hydrochloride. |
• | Atripla® is an oral formulation indicated as a complete regimen for the treatment of HIV-1 infection in certain patients. Atripla is a fixed-dose combination of our antiretroviral medications, TDF and emtricitabine, and Bristol-Myers Squibb Company (BMS)’s efavirenz. |
• | Truvada® is an oral formulation indicated in combination with other antiretroviral agents for the treatment of HIV-1 infection in certain patients. It is a fixed-dose combination of our antiretroviral medications, TDF and emtricitabine. Truvada is also approved by FDA for a PrEP indication, in combination with safer sex practices, to reduce the risk of sexually acquired HIV-1 infection in certain at-risk patients. |
Liver Diseases
• | Vosevi® is an oral formulation of a once-daily, single tablet regimen of sofosbuvir, velpatasvir and voxilaprevir for the re-treatment of chronic hepatitis C virus (HCV) infection in adults: (i) with genotype 1, 2, 3, 4, 5 or 6 previously treated with an NS5A inhibitor-containing regimen or (ii) with genotype 1a or 3 previously treated with a sofosbuvir-containing regimen without an NS5A inhibitor. |
• | Epclusa® is an oral formulation of a once-daily single tablet regimen of sofosbuvir and velpatasvir for the treatment of chronic HCV infection in adults with genotype 1, 2, 3, 4, 5 or 6: (i) without cirrhosis or with compensated cirrhosis or (ii) with decompensated cirrhosis for use in combination with ribavirin. |
• | Harvoni® is an oral formulation of a once-daily, single tablet regimen of ledipasvir and sofosbuvir for the treatment of chronic HCV infection in: (i) adults with genotype 1, 4, 5 or 6 without cirrhosis or with compensated cirrhosis, (ii) adults with genotype 1 infection with decompensated cirrhosis, in combination with ribavirin, (iii) adults with genotype 1 or 4 |
3
who are liver transplant recipients without cirrhosis or with compensated cirrhosis, in combination with ribavirin, or (iv) certain pediatric patients with genotype 1, 4, 5 or 6 without cirrhosis or with compensated cirrhosis.
• | Vemlidy® is an oral formulation of TAF dosed once a day for the treatment of chronic hepatitis B virus (HBV) infection in adults with compensated liver disease. |
• | Viread® is an oral formulation of TDF dosed once a day for the treatment of chronic HBV infection in adults and certain pediatric patients. |
Hematology/Oncology
• | Yescarta® (axicabtagene ciloleucel) is a chimeric antigen receptor (CAR) T cell therapy for the treatment of adult patients with relapsed or refractory large B-cell lymphoma after two or more lines of systemic therapy, including diffuse large B-cell lymphoma (DLBCL) not otherwise specified, primary mediastinal large B-cell lymphoma, high-grade B-cell lymphoma and DLBCL arising from follicular lymphoma. |
• | Zydelig® (idelalisib) is an oral formulation of a kinase inhibitor for the treatment of patients with: (i) relapsed chronic lymphocytic leukemia (CLL), in combination with rituximab, for whom rituximab alone would be considered appropriate therapy due to other co-morbidities, (ii) relapsed follicular B-cell non-Hodgkin lymphoma (FL) in patients who have received at least two prior systemic therapies or (iii) relapsed small lymphocytic lymphoma who have received at least two prior systemic therapies. |
Other
• | Letairis® (ambrisentan) is an oral formulation of an endothelin receptor antagonist for the treatment of pulmonary arterial hypertension (PAH) (WHO Group I) (i) to improve exercise capacity and delay clinical worsening or (ii) in combination with tadalafil to reduce the risks of disease progression and hospitalization for worsening PAH, and to improve exercise ability. |
• | Ranexa® (ranolazine) is an oral formulation of an extended-release tablet of an antianginal for the treatment of chronic angina. |
• | AmBisome® (amphotericin B liposome for injection) is a proprietary liposomal formulation of amphotericin B, an antifungal agent, for the treatment of serious invasive fungal infections caused by various fungal species in adults. |
For information about our product revenues, including the amount of revenue contributed by each of the products listed above for each of the last three fiscal years, see Note 2. Revenues of the Notes to Consolidated Financial Statements included in Part II, Item 8 of this Annual Report on Form 10-K.
Commercialization and Distribution
We have U.S. and international commercial sales operations, with marketing subsidiaries in more than 35 countries. Our products are marketed through our commercial teams and/or in conjunction with third-party distributors and corporate partners. Our commercial teams promote our products through direct field contact with physicians, hospitals, clinics and other healthcare providers. We generally grant our third-party distributors the exclusive right to promote our product in a territory for a specified period of time. Most of our agreements with these distributors provide for collaborative efforts between the distributor and Gilead in obtaining and maintaining regulatory approval for the product in the specified territory.
We sell and distribute most of our products in the United States exclusively through the wholesale channel. Our product sales to three large wholesalers, AmerisourceBergen Corporation, Cardinal Health, Inc. and McKesson Corporation, each accounted for more than 10% of total revenues for each of the years ended December 31, 2019, 2018 and 2017. On a combined basis, in 2019, these wholesalers accounted for approximately 87% of our product sales in the United States and approximately 64% of our total worldwide revenues. We sell and distribute our products in Europe and countries outside the United States where the product is approved, either through our commercial teams, third-party distributors or corporate partners.
Competition
We operate in a highly competitive environment. We face significant competition from global pharmaceutical and biotechnology companies, specialized pharmaceutical firms and generic drug manufacturers. Our products compete with other commercially available products based primarily on efficacy, safety, tolerability, acceptance by doctors, ease of patient compliance, ease of use, price, insurance and other reimbursement coverage, distribution and marketing. As our products mature, private insurers and government payers often reduce the amount they will reimburse patients, which increases pressure on us to reduce prices. Further, as new branded or generic products are introduced into major markets, our ability to maintain pricing and market share may be affected. For a description of our competitors, see Item 1A. Risk Factors “We face significant competition.”
4
Research and Development
Our research and development (R&D) philosophy and strategy are to develop best-in-class drugs that improve safety or efficacy for unmet medical needs. We intend to continue committing significant resources to internal R&D opportunities and external business development activity.
Our product development efforts are focused primarily in viral diseases, inflammatory and fibrotic diseases and oncology. We have research scientists engaged in the discovery and development of new molecules and technologies that we hope will lead to the approval of new medicines that will advance the current standard of care and address unmet medical needs.
The development of our product candidates is subject to various risks and uncertainties. These risks and uncertainties include our ability to enroll patients in clinical trials, the possibility of unfavorable results of our clinical trials, the need to modify or delay our clinical trials or to perform additional trials and the risk of failing to obtain regulatory approvals. As a result, our product candidates may never be successfully commercialized. Drug development is inherently risky and many product candidates fail during the drug development process.
In 2019, we continued to invest in and advance our R&D pipeline across our therapeutic areas. At the end of 2019, our R&D pipeline included 104 active clinical studies, of which 27 were Phase 3 clinical trials.
Below is a summary of our key product candidates and their corresponding current stages of development.
Product Candidates in Viral Diseases
Product Candidates | Description | |
Phase 2 | ||
GS-6207 | GS-6207, a capsid inhibitor, is being evaluated for the treatment of HIV infection. | |
Selgantolimod | Selgantolimod, a TLR-8 agonist, is being evaluated for the treatment of chronic HBV infection. | |
Phase 1 | ||
Vesatolimod | Vesatolimod, a TLR-7 agonist, is being evaluated as a potential cure for HIV infection. | |
Elipovimab | Elipovimab, a broadly neutralizing antibody, is being evaluated as a potential cure for HIV infection. | |
GS-4224 | GS-4224, a PD-L1 inhibitor, is being evaluated for the treatment of chronic HBV infection. | |
Product Candidates in Inflammatory and Fibrotic Diseases
Product Candidates | Description | |
Phase 3 | ||
Filgotinib | Filgotinib, a JAK1 inhibitor, is being evaluated for the treatment of (i) Crohn’s disease, (ii) ulcerative colitis and (iii) psoriatic arthritis. | |
Cilofexor | Cilofexor, a FXR agonist, is being evaluated for the treatment of primary sclerosing cholangitis. | |
GLPG-1690(2) | GLPG-1690, an autotaxin inhibitor, is being evaluated for the treatment of idiopathic pulmonary fibrosis. | |
Phase 2 | ||
Filgotinib | Filgotinib is being evaluated for the treatment of (i) ankylosing spondylitis and (ii) uveitis. | |
GS-4875 | GS-4875, a TPL2 inhibitor, is being evaluated for the treatment of ulcerative colitis. | |
GLPG-1972(1) | GLPG-1972, an ADAMTS-5 inhibitor, is being evaluated for the treatment of osteoarthritis. | |
Selonsertib | Selonsertib, an ASK-1 inhibitor, is being evaluated for the treatment of diabetic kidney disease. | |
Cilofexor, firsocostat and selonsertib combinations | Cilofexor, firsocostat (an ACC inhibitor) and selonsertib combinations are being evaluated for the treatment of nonalcoholic steatohepatitis (NASH). | |
GLPG-1690(2) | GLPG-1690 is being evaluated for the treatment of systemic sclerosis. | |
GLPG-1205(1) | GLPG-1205, a GPR84 inhibitor, is being evaluated for the treatment of idiopathic pulmonary fibrosis. | |
Phase 1 | ||
GLPG-0555(1) | GLPG-0555 is being evaluated for the treatment of inflammatory diseases. | |
GLPG-3312(1) | GLPG-3312 is being evaluated for the treatment of inflammatory diseases. | |
GLPG-3970(1) | GLPG-3970 is being evaluated for the treatment of inflammatory diseases. | |
GLPG-3667(1) | GLPG-3667 is being evaluated for the treatment of inflammatory diseases. | |
5
Product Candidates in Oncology
Product Candidates | Description | |
Phase 3 | ||
Axicabtagene ciloleucel | Axicabtagene ciloleucel is being evaluated for the treatment of second line DLBCL. | |
Phase 2 | ||
Axicabtagene ciloleucel | Axicabtagene ciloleucel is being evaluated for the treatment of indolent non-Hodgkin lymphoma. Axicabtagene ciloleucel is also being evaluated for the treatment of (i) first line DLBCL and (ii) DLBCL in combination with either rituximab or lenalidomide. | |
KTE-X19 | KTE-X19, a CAR T cell therapy, is being evaluated for the treatment of (i) adult and pediatric acute lymphoblastic leukemia and (ii) CLL. | |
Phase 1 | ||
Axicabtagene ciloleucel | Axicabtagene ciloleucel is being evaluated for the treatment of DLBCL in combination with utomilumab. | |
KITE-718 | KITE-718, a MAGE A3/A6, is being evaluated for the treatment of solid tumors. | |
KITE-439 | KITE-439, an HPV E7, is being evaluated for the treatment of solid tumors. | |
GS-1423 | GS-1423, a bi-specific antibody, is being evaluated for the treatment of solid tumors. | |
GS-4224 | GS-4224, an oral PD-L1 inhibitor, is being evaluated for the treatment of solid tumors. | |
AGEN1223(1) | AGEN1223, a bi-specific mAb, is being evaluated for the treatment of multiple indications in oncology. | |
AGEN2373(1) | AGEN2373, an anti-CD137 mAb, is being evaluated for the treatment of multiple indications in oncology. | |
______________________________________________________
(1) | Optionable partner program |
(2) | Optioned partner program |
In addition to our internal discovery and clinical development programs, we seek to add to our portfolio of products through product acquisition, in-licensing and strategic collaborations. In 2019, we completed 27 strategic partnerships, licensing deals and equity investments, which reflects our commitment to developing our pipeline across a range of diseases to address areas of significant unmet medical need and positioning ourselves for the long-term growth of our business.
Patents and Proprietary Rights
U.S. and European Patent Expiration
We have a number of U.S. and foreign patents, patent applications and rights to patents related to our compounds, products and technology, but we cannot be certain that issued patents will be enforceable or provide adequate protection or that pending patent applications will result in issued patents.
The following table shows the estimated expiration dates (including patent term extensions, supplementary protection certificates and/or pediatric exclusivity where granted) in the United States and the European Union for the primary (typically compound) patents for our Phase 3 product candidates. For our product candidates that are fixed-dose combinations of single tablet regimens, the estimated patent expiration date provided corresponds to the latest expiring compound patent for one of the active ingredients in the single tablet regimen.
Phase 3 Product Candidates | Patent Expiration | |||||
U.S. | E.U. | |||||
Product Candidates in Inflammatory and Fibrotic Diseases: | ||||||
Filgotinib for the treatment of rheumatoid arthritis, Crohn’s disease, ulcerative colitis and psoriatic arthritis | 2030 | 2030 | ||||
GLPG-1690 for the treatment of idiopathic pulmonary fibrosis | 2034 | 2034 | ||||
Cilofexor for the treatment of primary sclerosing cholangitis | 2032 | 2032 | ||||
Product Candidate in Oncology: | ||||||
Axicabtagene ciloleucel for the treatment of second line DLBCL | 2027 | * | ||||
__________________________________________
* | The composition of matter patent has expired in the European Union. In the European Union and the United States, patent applications are pending relating to proprietary manufacturing processes of Kite, a Gilead company. |
The following table shows the actual or estimated expiration dates (including patent term extensions, supplementary protection certificates and/or pediatric exclusivity where granted) in the United States and the European Union for the primary (typically compound) patents for our principal products. For our products that are fixed-dose combinations or single tablet regimens,
6
the estimated patent expiration dates provided correspond to the latest expiring compound patent for one of the active ingredients in the single tablet regimen.
Products | Patent Expiration | |||||
U.S. | E.U. | |||||
Letairis | 2018 | (1) | 2020 | |||
Ranexa | 2019 | (2) | 2023 | |||
Atripla | 2021 | (3) | 2017 | |||
Truvada | 2021 | (3) | 2017 | (4) | ||
Descovy | 2022 | (5) | 2026 | |||
Vemlidy | 2022 | (5) | 2026 | |||
Complera/Eviplera | 2025 | 2026 | ||||
Zydelig | 2025 | (6) | 2025 | (6) | ||
Odefsey | 2025 | 2026 | ||||
Yescarta | 2027 | (6) | - | (7) | ||
Stribild | 2029 | 2028 | ||||
Genvoya | 2029 | 2028 | ||||
Harvoni | 2030 | 2030 | (6) | |||
Epclusa | 2032 | 2032 | ||||
Biktarvy | 2033 | 2033 | ||||
Vosevi | 2034 | 2033 | ||||
_________________________________________ | ||||||
These estimated expiration dates do not include any potential additional exclusivity (e.g., patent term extensions, supplementary protection certificates or pediatric exclusivity) that has not yet been granted. | ||||||
__________________________________________
(1) | In 2017, Gilead and Watson Laboratories, Inc. reached an agreement to settle a patent litigation matter related to Letairis. |
(2) | In 2013, Gilead and Lupin Limited reached an agreement to settle a patent litigation matter related to Ranexa. |
(3) | In 2014, Gilead and Teva Pharmaceuticals reached an agreement to settle the patent litigation concerning patents that protect emtricitabine in our Truvada and Atripla products. For additional information, see Item 1A. Risk Factors “We face significant competition.” |
(4) | Supplementary protection certificates (SPCs) have been granted in several European countries. The validity of these SPCs has been challenged by several generic manufacturers, many of whom launched their competing products in 2017. |
(5) | An application for patent term extension was filed in the United States that, if granted, would extend the U.S. expiration date to at least 2025. |
(6) | Applications for patent term extensions are pending in the United States and/or SPCs are pending in one or more countries in the European Union for these products. |
(7) | The composition of matter patent has expired in the European Union. In the European Union and the United States, patent applications are pending relating to proprietary manufacturing processes of Kite. |
Patent Protection and Certain Challenges
Patents and other proprietary rights are very important to our business. If we have a properly drafted and enforceable patent, it can be more difficult for our competitors to use our technology to create competitive products and more difficult for our competitors to obtain a patent that prevents us from using technology we create. As part of our business strategy, we actively seek patent protection both in the United States and internationally and file additional patent applications, when appropriate, to cover improvements in our compounds, products and technology.
Patents covering certain of the active pharmaceutical ingredients (API) of most of our HIV products as well as Yescarta are held by third parties. We acquired exclusive rights to these patents in the agreements we have with these parties.
We may obtain patents for certain products many years before marketing approval is obtained. Because patents have a limited life that may begin to run prior to the commercial sale of the related product, the commercial value of the patent may be limited. However, we may be able to apply for patent term extensions or supplementary protection certificates in some countries. For example, extensions for the patents or supplementary protection certificates on many of our products have been granted in the United States and in a number of European countries, compensating in part for delays in obtaining marketing approval. Similar patent term extensions may be available for other products we are developing, but we cannot be certain we will obtain them in some countries.
It is also important that we do not infringe the valid patents of third parties. If we infringe the valid patents of third parties, our reputation may be harmed and we may be required to pay significant monetary damages, we may be prevented from commercializing products or we may be required to obtain licenses from these third parties. We may not be able to obtain alternative technologies or any required license on reasonable terms or at all. If we fail to obtain these licenses or alternative technologies, we may be unable to develop or commercialize some or all of our products. For example, we are aware of patents and patent
7
applications owned by other parties that such parties may claim to cover the use of sofosbuvir, axicabtagene ciloleucel and bictegravir.
Because patent applications are confidential for a period of time until a patent is issued, we may not know if our competitors have filed patent applications for technology covered by our pending applications or if we were the first to invent or first to file an application directed toward the technology that is the subject of our patent applications. Competitors may have filed patent applications or received patents and may obtain additional patents and proprietary rights that block or compete with our products. In addition, if competitors file patent applications covering our technology, we may have to participate in interference/derivation proceedings or litigation to determine the right to a patent. Litigation and interference/derivation proceedings are unpredictable and expensive, such that, even if we are ultimately successful, our results of operations may be adversely affected by such events.
Patents relating to pharmaceutical, biopharmaceutical and biotechnology products, compounds and processes such as those that cover our existing compounds, products and processes and those that we will likely file in the future, do not always provide complete or adequate protection. Future litigation or other proceedings regarding the enforcement or validity of our existing patents or any future patents could result in the invalidation of our patents or substantially reduce their protection. From time to time, certain individuals or entities may challenge our patents.
Our pending patent applications and the patent applications filed by our collaborative partners may not result in the issuance of any patents or may result in patents that do not provide adequate protection. As a result, we may not be able to prevent third parties from developing compounds or products that are closely related to those which we have developed or are developing. In addition, certain countries do not provide effective enforcement of our patents, and third-party manufacturers may be able to sell generic versions of our products in those countries.
For a description of our significant pending legal proceedings, see Note 14. Commitments and Contingencies - Legal Proceedings of the Notes to Consolidated Financial Statements included in Part II, Item 8 of this Annual Report on Form 10-K.
Trade Secrets
We also rely on unpatented trade secrets and improvements, unpatented internal know-how and technological innovation. For example, a great deal of our liposomal manufacturing expertise, which is a key component of our liposomal technology, is not covered by patents but is instead protected as a trade secret. We protect these rights mainly through confidentiality agreements with our corporate partners, employees, consultants and vendors. These agreements provide that all confidential information developed or made known to an individual during the course of their relationship with us will be kept confidential and will not be used or disclosed to third parties except in specified circumstances. In the case of employees, the agreements provide that all inventions made by an individual while employed by us will be our exclusive property. We cannot be certain that these parties will comply with these confidentiality agreements, that we have adequate remedies for any breach or that our trade secrets will not otherwise become known or be independently discovered by our competitors. Under some of our R&D agreements, inventions become jointly owned by us and our corporate partners and in other cases become the exclusive property of one party. In certain circumstances, it can be difficult to determine who owns a particular invention and disputes could arise regarding those inventions. If our trade secrets or confidential information become known or independently discovered by competitors, or if we enter into disputes over ownership of inventions, our business and results of operations could be adversely affected.
Manufacturing and Raw Materials
Our products are manufactured either at our own facilities or by third-party contract manufacturers. We depend on third parties to perform manufacturing activities for the majority of our API and drug products. For most of our products, including our HIV and HCV products, we use multiple third-party contract manufacturers so that we have primary and back-up suppliers and manufacturing sites. For Yescarta, we have established clinical and commercial manufacturing facilities for cell processing activities. For our future products, we continue to develop additional manufacturing capabilities and establish additional third-party suppliers to manufacture sufficient quantities of our product candidates to undertake clinical trials and to manufacture sufficient quantities of any product that is approved for commercial sale.
Our Manufacturing Facilities
We own or lease manufacturing facilities to manufacture and distribute certain products and API for clinical and/or commercial uses. These facilities are located in Foster City, San Dimas, La Verne, Oceanside and El Segundo, California; Dublin and Cork, Ireland; Hoofddorp, Netherlands; and Edmonton, Canada.
• | Foster City, California: We conduct process chemistry research and formulation development activities, manufacture API and drug product for our clinical trials and oversee our third-party contract manufacturers. |
• | San Dimas and La Verne, California: We manufacture AmBisome and also package and label the majority of our commercial products for distribution to the Americas and Pacific Rim. |
• | Oceanside, California: We utilize the facility for clinical manufacturing and process development of our biologics candidates. |
8
• | El Segundo, California: We utilize the facility for clinical and commercial manufacturing and processing of Yescarta. |
• | Cork and Dublin, Ireland: We utilize the Cork facility for commercial manufacturing, packaging and labeling of our products. We also perform quality control testing, labeling, packaging and final release of many of our products for distribution to the European Union and other international markets. The Dublin facility is also responsible for distribution activities for our products. |
• | Edmonton, Canada: We conduct process chemistry research and scale-up activities for our clinical development candidates, manufacture API for both investigational and commercial products and conduct chemical development activities to improve existing commercial manufacturing processes. |
• | Hoofddorp, Netherlands: We utilize the facility for commercial manufacturing and processing of Yescarta. |
Third-Party Manufacturers
We believe the technology we use to manufacture our products is proprietary. For products manufactured by our third-party contract manufacturers, we have disclosed all necessary aspects of this technology to enable them to manufacture the products for us. We have agreements with these third-party manufacturers that are intended to restrict them from using or revealing this technology, but we cannot be certain that these third-party manufacturers will comply with these restrictions.
For more information about our third-party manufacturers, see Item 1A. Risk Factors “Manufacturing problems, including at our third-party manufacturers and corporate partners, could cause inventory shortages and delay product shipments and regulatory approvals, which may adversely affect our results of operations.”
Regulation of Manufacturing Process
The manufacturing process for pharmaceutical products is highly regulated and regulators may shut down manufacturing facilities that they believe do not comply with regulations. We, our third-party manufacturers and our corporate partners are subject to current Good Manufacturing Practices, which are extensive regulations governing manufacturing processes, stability testing, record keeping and quality standards as defined by FDA and the European Medicines Agency. Similar regulations are in effect in other jurisdictions. Our manufacturing operations are subject to routine inspections by regulatory agencies.
For Yescarta, we are required by FDA to comply with the Risk Evaluation and Mitigation Strategy program, which includes educating and certifying medical personnel regarding the therapy procedures and the potential side effect profile of our therapy, such as the potential adverse side effects related to cytokine release syndrome and neurologic toxicities. Additionally, we are required to maintain a complex chain of identity and custody with respect to patient material as such material moves to the manufacturing facilities, through the manufacturing process, and back to the patient.
Access to Raw Materials
We need access to certain raw materials to conduct our clinical trials and manufacture our products. These raw materials are generally available from multiple sources, purchased worldwide and normally available in quantities adequate to meet the needs of our business. We attempt to manage the risks associated with our supply chain by inventory management, relationship management and evaluation of alternative sources when feasible. For more information, see Item 1A. Risk Factors “We may not be able to obtain materials or supplies necessary to conduct clinical trials or to manufacture and sell our products, which could limit our ability to generate revenues.”
Seasonality of Operations and Backlog
Our worldwide product sales do not reflect any significant degree of seasonality in end-user demand. In the United States, fluctuations in wholesaler inventory levels have impacted our product sales. We have observed that strong wholesaler and sub-wholesaler purchases of our products in the fourth quarter have resulted in inventory draw-down by wholesalers and sub-wholesalers in the subsequent first quarter. Several other factors, including government budgets, annual grant cycles for federal and state funds and other buying patterns, have impacted the product sales recorded in a particular quarter. For more information, see Item 1A. Risk Factors “Our inability to accurately predict demand for our products and fluctuations in purchasing patterns or wholesaler inventories makes it difficult for us to accurately forecast sales and may cause our forecasted revenues and earnings to fluctuate, which could adversely affect our financial results and stock price.”
For the most part, we operate in markets characterized by short lead times and the absence of significant backlogs. We do not believe that backlog information is material to our business as a whole.
Government Regulation
Our operations and activities are subject to extensive regulation by numerous government authorities in the United States, the European Union and other countries, including laws and regulations governing the testing, manufacture, safety, efficacy, labeling, storage, record keeping, approval, advertising and promotion of our products. As a result of these regulations, product
9
development and product approval processes are very expensive and time consuming. The regulatory requirements applicable to drug development and approval are subject to change. Any legal and regulatory changes may impact our operations in the future.
A country’s regulatory agency, such as FDA in the United States and European Commission for the European Union, as well as the national authorities of the European Union Member States, must approve a drug before it can be sold in the respective country or countries. The general process for drug approval in the United States is summarized below. Many other countries, including countries in the European Union, have similar regulatory structures.
Preclinical Testing
Before we can test a drug candidate in humans, we must study the drug in laboratory experiments and in animals to generate data to support the drug candidate’s potential benefits and safety. We submit this data to FDA in an investigational new drug (IND) application seeking its approval to test the compound in humans.
Clinical Trials
If FDA accepts the IND, the drug candidate can then be studied in human clinical trials to determine if the drug candidate is safe and effective. These clinical trials involve three separate phases that often overlap, can take many years and are very expensive. These three phases, which are subject to considerable regulation, are as follows:
• | Phase 1. The drug candidate is given to a small number of healthy human control subjects or patients suffering from the indicated disease, to test for safety, dose tolerance, pharmacokinetics, metabolism, distribution and excretion. |
• | Phase 2. The drug candidate is given to a limited patient population to determine the effect of the drug candidate in treating the disease, the best dose of the drug candidate, and the possible side effects and safety risks of the drug candidate. It is not uncommon for a drug candidate that appears promising in Phase 1 clinical trials to fail in the more rigorous and extensive Phase 2 clinical trials. |
• | Phase 3. If a drug candidate appears to be effective and safe in Phase 2 clinical trials, Phase 3 clinical trials are commenced to confirm those results. Phase 3 clinical trials are conducted over a longer term, involve a significantly larger population, are conducted at numerous sites in different geographic regions and are carefully designed to provide reliable and conclusive data regarding the safety and benefits of a drug candidate. It is not uncommon for a drug candidate that appears promising in Phase 2 clinical trials to fail in the more rigorous and extensive Phase 3 clinical trials. |
FDA Approval Process
When we believe that the data from our clinical trials show an acceptable benefit-risk profile, we submit the appropriate filing, usually in the form of a New Drug Application (NDA) or supplemental NDA, with FDA seeking approval to sell the drug candidate for a particular use. At FDA’s discretion, FDA may hold a public hearing where an independent advisory committee of expert advisors asks additional questions and makes recommendations regarding the drug candidate. This committee makes a recommendation to FDA that is not binding but is generally followed by FDA. If FDA agrees that the compound has met the required level of safety and efficacy for a particular use, it will allow us to sell the drug candidate in the United States for that use. It is not unusual, however, for FDA to reject an application because it believes that the drug candidate is not safe enough or efficacious enough or because it does not believe that the data submitted is reliable or conclusive.
At any point in this process, the development of a drug candidate can be stopped for a number of reasons including safety concerns and lack of treatment benefit. We cannot be certain that any clinical trials that we are currently conducting or any that we conduct in the future will be completed successfully or within any specified time period. We may choose, or FDA may require us, to delay or suspend our clinical trials at any time if it appears that patients are being exposed to an unacceptable health risk or if the drug candidate does not appear to have sufficient treatment benefit.
FDA may also require Phase 4 non-registrational studies to explore scientific questions to further characterize safety and efficacy during commercial use of our drug. FDA may also require us to provide additional data or information, improve our manufacturing processes, procedures or facilities or may require extensive surveillance to monitor the safety or benefits of our product candidates if it determines that our filing does not contain adequate evidence of the safety and benefits of the drug. In addition, even if FDA approves a drug, it could limit the uses of the drug. FDA can withdraw approvals if it does not believe that we are complying with regulatory standards or if concerns about the safety or efficacy are uncovered or occur after approval.
In addition to obtaining FDA approval for each drug, we obtain FDA approval of the manufacturing facilities for any drug we sell, including those of companies who manufacture our drugs for us. All of these facilities are subject to periodic inspections by FDA. FDA must also approve foreign establishments that manufacture products to be sold in the United States and these facilities are subject to periodic regulatory inspection. Our manufacturing facilities located in California also must be licensed by the State of California in compliance with local regulatory requirements. Our manufacturing facilities in Canada, Ireland and Netherlands also must obtain local licenses and permits in compliance with local regulatory requirements.
Drugs that treat serious or life-threatening diseases and conditions that are not adequately addressed by existing drugs, and for which the development program is designed to address the unmet medical need, may be designated as fast track candidates by
10
FDA and may be eligible for priority review. Drugs for the treatment of HIV infection that are designated for use under the U.S. President’s Emergency Plan for AIDS Relief may also qualify for an expedited review.
European Union Regulatory System and Approval Process
In the European Union (EU), our products are subject to a variety of EU and EU Member State regulations governing clinical trials, commercial sales and distribution. We are required to obtain a marketing authorization in the EU before we can market our medicinal products on the relevant market. The conduct of clinical trials in the EU is governed by, among others, Directive 2001/20/EC and the EU Good Clinical Practice rules. These impose legal and regulatory obligations that are similar to those provided in applicable U.S. laws. The conduct of clinical trials in the EU must be approved by the competent authorities of each EU Member States in which the clinical trials take place, and a positive opinion must be obtained from the relevant Ethics Committee in the relevant Member State. In 2014, the EU legislator adopted Regulation (EU) No 536/2014 to replace Directive 2001/20/EC and to introduce a coordinated procedure for authorization of clinical trials. This Regulation is expected to apply in 2021 or 2022.
Marketing authorization holders, manufacturers, importers, wholesalers and distributors of medicinal products placed on the market in the EU are required to comply with a number of regulatory requirements including pharmacovigilance, Good Manufacturing Practices compliance and the requirement to obtain manufacturing, import and/or distribution licenses issued by the competent authorities of the EU Member States. Failure to comply with these requirements may lead to the imposition of civil, criminal or administrative sanctions, including suspension of marketing or manufacturing authorizations.
Pricing and Reimbursement
Successful commercialization of our products depends, in part, on the availability of governmental and third-party payer reimbursement for the cost of such products and related treatments in the markets where we sell our products. Government health authorities, private health insurers and other organizations generally provide reimbursement. In the United States, the European Union and other significant or potentially significant markets for our products and product candidates, government authorities and third-party payers are increasingly attempting to limit or regulate the price of medical products and services. A significant portion of our sales of the majority of our products are subject to substantial discounts from their list prices. As a result, the price increases we implement from time to time on certain products may have a limited effect on our product sales in certain markets. In addition, standard reimbursement structures may not adequately reimburse for innovative therapies.
As our products mature, private insurers and government payers often reduce the amount they will reimburse providers, which increases pressure on us to reduce prices. Further, as new branded or generic products are introduced into major markets, our ability to maintain pricing and market share may be affected.
For more information, see Item 1A. Risk Factors “Our existing products are subject to reimbursement from government agencies and other third parties, and we may be required to provide rebates and other discounts on our products, which may result in an adjustment to our product revenues. Pharmaceutical pricing and reimbursement pressures may adversely affect our profitability and our results of operations” and “Our inability to accurately predict demand for our products and fluctuations in purchasing patterns or wholesaler inventories makes it difficult for us to accurately forecast sales and may cause our forecasted revenues and earnings to fluctuate, which could adversely affect our financial results and stock price.”
Patient Assistance Programs
Recently, there has been enhanced scrutiny of company-sponsored patient assistance programs, including co-pay assistance programs and manufacturer donations to third-party charities that provide such assistance. There has also been enhanced scrutiny by governments on reimbursement support offerings, clinical education programs and promotional speaker programs. If we, or our agents and vendors, are deemed to have failed to comply with laws, regulations or government guidance in any of these areas, we could be subject to criminal and civil sanctions. Any similar violations by our competitors could also negatively impact our industry reputation and increase scrutiny over our business and our products.
Health Care Fraud and Abuse Laws; Anti-Bribery Laws
We are subject to various U.S. federal and state laws pertaining to health care “fraud and abuse,” including anti-kickback laws and false claim laws. Anti-kickback laws make it illegal for a prescription drug manufacturer to solicit, offer, receive or pay any remuneration in exchange for, or to induce, the referral of business, including the purchase or prescription of a particular drug. Due to the breadth of the statutory provisions and the attention being given to them by law enforcement authorities, it is possible that certain of our practices may be challenged under anti-kickback or similar laws. False claims laws generally prohibit anyone from knowingly presenting, or causing to be presented, a false or fraudulent claim for payment by federal and certain state payers (including Medicare and Medicaid), or knowingly making, using or causing to be made or used, a false record or statement material to a false or fraudulent claim. Our sales, marketing, patient support and medical activities may be subject to scrutiny under these laws. Similarly, in Europe, interactions between pharmaceutical companies and physicians are subject to strict laws, regulations, industry self‑regulation codes of conduct and physicians’ codes of professional conduct, as applicable, including the EU Member States anti-corruption laws and the UK Bribery Act 2010.
11
In addition, the U.S. Foreign Corrupt Practices Act and similar worldwide anti-bribery laws generally prohibit companies and their intermediaries from making improper payments for the purpose of obtaining or retaining business. Our policies mandate compliance with these anti-bribery laws. We operate in parts of the world that have experienced governmental corruption to some degree. In certain circumstances, strict compliance with anti-bribery laws may conflict with local customs and practices or may require us to interact with doctors and hospitals, some of which may be state controlled, in a manner that is different than local custom.
Despite our training and compliance program, our internal control policies and procedures may not protect us from reckless or criminal acts committed by our employees or agents. Violations of fraud and abuse laws or anti-bribery laws may be punishable by criminal and/or civil sanctions, including fines and civil monetary penalties, as well as the possibility of exclusion from federal health care programs (including Medicare and Medicaid). Violations can also lead to the imposition of a Corporate Integrity Agreement or similar government oversight program.
U.S. Healthcare Reform
The U.S. federal and state governments continue to propose and pass legislation designed to regulate the healthcare industry, including legislation that seeks to indirectly or directly regulate pharmaceutical drug pricing.
For more information, see Item 1A. Risk Factors “Our results of operations may be adversely affected by current and potential future healthcare legislative and regulatory actions” and “Laws and regulations applicable to the health care industry could impose new obligations on us, require us to change our business practices and restrict our operations in the future.”
Employees
As of January 31, 2020, we had approximately 11,800 employees. We believe we have good relations with our employees.
Environment
We are subject to a number of laws and regulations that require compliance with federal, state, and local regulations for the protection of the environment. The regulatory landscape continues to evolve, and we anticipate additional regulations in the future. Laws and regulations are implemented and under consideration to mitigate the effects of climate change mainly caused by greenhouse gas emissions. Our business is not energy intensive. Therefore, we do not anticipate being subject to a cap and trade system or other mitigation measure that would materially impact our capital expenditures, operations or competitive position.
Other Information
We are subject to the information requirements of the Securities Exchange Act of 1934 (Exchange Act). Therefore, we file periodic reports, proxy and information statements and other information with the SEC. The SEC maintains a website (http://www.sec.gov) that contains reports, proxy and information statements and other information regarding issuers that file electronically with the SEC.
The mailing address of our headquarters is 333 Lakeside Drive, Foster City, California 94404, and our telephone number at that location is 650-574-3000. Our website is www.gilead.com. Through a link on the “Investors” page of our website (under “SEC Filings” section), we make available the following filings free of charge as soon as reasonably practicable after they are electronically filed with or furnished to the SEC: our Annual Reports on Form 10-K; Quarterly Reports on Form 10-Q; Current Reports on Form 8-K; and any amendments to those reports filed or furnished pursuant to Section 13(a) or 15(d) of the Exchange Act.
12
ITEM 1A. | RISK FACTORS |
In evaluating our business, you should carefully consider the following risks in addition to the other information in this Annual Report on Form 10-K. A manifestation of any of the following risks could materially and adversely affect our business, results of operations and financial condition. We note these factors for investors as permitted by the Private Securities Litigation Reform Act of 1995. It is not possible to predict or identify all such factors and, therefore, you should not consider the following risks to be a complete statement of all the potential risks or uncertainties that we face.
A substantial portion of our revenues is derived from sales of our HIV products. If we are unable to increase or maintain our HIV sales, then our results of operations may be adversely affected.
We receive a substantial portion of our revenue from sales of our products for the treatment and prevention of HIV infection. During the year ended December 31, 2019, sales of our HIV products accounted for approximately 74% of our total product sales, and our HIV products account for a higher percentage of our total product sales in 2019 than in 2018. Most of our HIV products contain tenofovir alafenamide (TAF), tenofovir disoproxil fumarate (TDF) and/or emtricitabine (FTC), which belong to the nucleoside class of antiviral therapeutics. If the treatment paradigm for HIV changes, causing nucleoside-based therapeutics to fall out of favor, or if we are unable to maintain or increase our HIV product sales, our results of operations would likely suffer and we would likely need to scale back our operations, including our future drug development and spending on research and development (R&D) efforts.
In addition, future sales of our HIV products depend, in part, on the extent of reimbursement of our products by private and public payers. We may continue to experience global pricing pressure that could result in larger discounts or rebates on our products or delayed reimbursement, which negatively impacts our product sales and results of operations. Also, private and public payers can choose to exclude our products from their formulary coverage lists or limit the types of patients for whom coverage will be provided, which would negatively impact the demand for, and revenues of, our products. Any change in the formulary coverage, reimbursement levels or discounts or rebates offered on our products to payers may impact our anticipated revenues. If we are unable to achieve our forecasted HIV sales, our stock price could be adversely impacted.
We may be unable to sustain or increase sales of our HIV products for any number of reasons including, but not limited to, the reasons discussed above and the following:
• | As our products are used over a longer period of time in many patients and in combination with other products, and additional studies are conducted, new issues with respect to safety, resistance and interactions with other drugs may arise, which could cause us to provide additional warnings or contraindications on our labels, narrow our approved indications or halt sales of a product, each of which could reduce our revenues. |
• | As our products mature, private insurers and government payers often reduce the amount they will reimburse patients for these products, which increases pressure on us to reduce prices. |
• | If physicians do not see the benefit of our HIV products, the sales of our HIV products will be limited. |
• | As new branded or generic products are introduced into major markets, our ability to maintain pricing and market share may be affected. |
If we fail to develop and commercialize new products or expand the indications for existing products, our prospects for future revenues and our results of operations may be adversely affected.
The success of our business depends on our ability to introduce new products as well as expand the indications for our existing products to address areas of unmet medical need. The launch of commercially successful products is necessary to cover our substantial R&D expenses and to offset revenue losses when our existing products lose market share due to various factors such as competition and loss of patent exclusivity, as well as to provide for the growth of our business. There are many difficulties and uncertainties inherent in drug development and the introduction of new products. The product development cycle is characterized by significant investments of resources, long lead times and unpredictable outcomes due to the nature of developing medicines for human use. We expend significant time and resources on our product pipeline without any assurance that we will recoup our investments or that our efforts will be commercially successful. A high rate of failure is inherent in the discovery and development of new products, and failure can occur at any point in the process, including late in the process after substantial investment. For example, see “We face risks in our clinical trials, including the potential for unfavorable results, delays in anticipated timelines and disruption, which may adversely affect our prospects for future revenue growth and our results of operations.” We cannot state with certainty when or whether any of our product candidates under development will be approved or launched; whether we will be able to develop, license or acquire additional product candidates or products; or whether any products, once launched, will be commercially successful. Failure to launch commercially successful new products or new indications for existing products could have a material adverse effect on our future revenues, results of operations and long-term success.
13
Our inability to accurately predict demand for our products and fluctuations in purchasing patterns or wholesaler inventories makes it difficult for us to accurately forecast sales and may cause our forecasted revenues and earnings to fluctuate, which could adversely affect our financial results and stock price.
We may be unable to accurately predict demand for our products, including the uptake of new products, as demand depends on a number of factors. For example, the non-retail sector in the United States, which includes government institutions, including state AIDS Drug Assistance Programs (ADAPs), the U.S. Department of Veterans Affairs, correctional facilities and large health maintenance organizations, tends to be less consistent in terms of buying patterns and often causes quarter-over-quarter fluctuations that do not necessarily mirror patient demand for our products. Federal and state budget pressures, as well as the annual grant cycles for federal and state funds, may cause purchasing patterns to not reflect patient demand for our products. We expect to continue to experience fluctuations in the purchasing patterns of our non-retail customers, which may result in fluctuations in our product sales, revenues and earnings in the future. In light of the budget crises faced by many European countries, we have observed variations in purchasing patterns induced by cost containment measures in Europe. We believe these measures have caused some government agencies and other purchasers to reduce inventory of our products in the distribution channels, which has decreased our revenues and caused fluctuations in our product sales and earnings. We may continue to see this trend in the future.
We sell and distribute most of our products in the United States exclusively through the wholesale channel. During the year ended December 31, 2019, approximately 87% of our product sales in the United States were to three wholesalers, AmerisourceBergen Corporation, Cardinal Health, Inc. and McKesson Corporation. The U.S. wholesalers with whom we have entered into inventory management agreements make estimates to determine end user demand and may not be completely effective in matching their inventory levels to actual end user demand. As a result, changes in inventory levels held by those wholesalers can cause our operating results to fluctuate unexpectedly if our sales to these wholesalers do not match end user demand. In addition, inventory is held at retail pharmacies and other non-wholesaler locations with whom we have no inventory management agreements and no control over buying patterns. Adverse changes in economic conditions, increased competition or other factors may cause retail pharmacies to reduce their inventories of our products, which would reduce their orders from wholesalers and, consequently, the wholesalers’ orders from us, even if end user demand has not changed. In addition, we have observed that strong wholesaler and sub-wholesaler purchases of our products in the fourth quarter typically results in inventory draw-down by wholesalers and sub-wholesalers in the subsequent first quarter. As inventory in the distribution channel fluctuates from quarter to quarter, we may continue to see fluctuations in our earnings and a mismatch between prescription demand for our products and our revenues.
We face significant competition.
We face significant competition from global pharmaceutical and biotechnology companies, specialized pharmaceutical firms and generic drug manufacturers. Our products compete with other available products based primarily on efficacy, safety, tolerability, acceptance by doctors, ease of patient compliance, ease of use, price, insurance and other reimbursement coverage, distribution and marketing.
Our TAF-containing HIV products compete primarily with products from ViiV Healthcare Company (ViiV). We also face competition from generic HIV products. Generic versions of efavirenz, a component of Atripla, are available in the United States, Canada and Europe. We have observed some pricing pressure related to the efavirenz component of our Atripla sales. TDF, one of the active pharmaceutical ingredients in Truvada, Atripla, Complera/Eviplera and Stribild, faces generic competition in the European Union, the United States and certain other countries. In addition, because FTC, the other active pharmaceutical ingredient of Truvada, faces generic competition in the European Union, Truvada also faces generic competition in the European Union and certain other countries outside of the United States. Pursuant to a settlement agreement relating to patents that protect Truvada and Atripla, Teva Pharmaceuticals is permitted to launch generic fixed-dose combinations of FTC and TDF and generic fixed-dose combinations of FTC, TDF and efavirenz in the United States on September 30, 2020.
Our hepatitis C virus (HCV) products compete primarily with products marketed by AbbVie Inc. and Merck & Co., Inc.
Our hepatitis B virus (HBV) products face competition from existing therapies for treating patients with HBV as well as generic versions of TDF. Our HBV products also compete with products marketed by Bristol-Myers Squibb Company and Novartis Pharmaceuticals Corporation (Novartis).
Yescarta competes with a CAR T cell therapy marketed by Novartis and a non-CAR T product marketed by Roche and is expected to compete with products from other companies developing advanced T cell therapies. Yescarta and other commercial products also face competition from certain clinical trials that are enrolling CAR T eligible patients.
In addition, a number of companies are pursuing the development of technologies which are competitive with our existing products or research programs. These competing companies include specialized pharmaceutical firms and large pharmaceutical companies acting either independently or together with other pharmaceutical companies. Furthermore, academic institutions, government agencies and other public and private organizations conducting research may seek patent protection and may establish collaborative arrangements for competitive products or programs. If any of these competitors gain market share as a result of new technologies, commercialization strategies or otherwise, it could adversely affect our results of operations and stock price.
14
We may be required to pay significant damages and royalty payments as a result of ongoing litigation related to Yescarta and Biktarvy.
Adverse outcomes in ongoing litigation related to our Yescarta and Biktarvy products could require us to pay significant monetary damages and royalty payments for past and future sales. We cannot predict the ultimate outcome of these litigation matters, but the timing and magnitude of any such payments could have a material adverse impact on our results of operations, financial condition and stock price.
In October 2017, Juno Therapeutics, Inc. and Sloan Kettering Cancer Center (collectively, Juno) filed a lawsuit against us in the U.S. District Court for the Central District of California alleging that the commercialization of axicabtagene ciloleucel, sold commercially as Yescarta, infringes on U.S. Patent No. 7,446,190 (the ‘190 patent). A jury trial was held on the ‘190 patent, and in December 2019, the jury found that the asserted claims of the ‘190 patent were valid, and that we willfully infringed the asserted claims of the ‘190 patent. The jury also awarded Juno damages in amounts of $585 million in an up-front payment and a 27.6% running royalty from October 2017 through the date of the jury’s verdict. The parties filed post-trial motions in January 2020 and will file further briefings during the first quarter of 2020, and we expect the judge to rule on these matters later in 2020. Once the district court has issued these rulings and has entered judgment, the case may be appealed to the U.S. Court of Appeals for the Federal Circuit. Although we cannot predict with certainty the ultimate outcome of this litigation, we believe the jury’s verdict to be in error, and we also believe that errors were made by the court with respect to certain rulings before and during trial.
If the jury’s verdict is not upheld on appeal, the loss will be zero, If the jury’s verdict is upheld in its entirety on appeal, we estimate the upper end of the range of possible loss through December 31, 2019 to be approximately $1.6 billion, which consists of (i) the $585 million up-front payment determined by the jury, (ii) approximately $200 million, which represents estimated royalties on our adjusted revenues from Yescarta from October 18, 2017 through December 31, 2019, and (iii) enhanced damages requested by Juno of up to two times the sum of (i) and (ii) above as a result of the jury’s finding of willfulness. This sum excludes costs and pre-judgment interest. Supplemental damages consisting of royalties on sales of Yescarta after December 13, 2019 through the date of judgment could be subject to the 27.6% royalty in the jury’s verdict, the 33.1% prospective royalty proposed by Juno, or to enhancement. Any post-judgment sales of Yescarta would be subject to prospective royalties, which we have estimated could be up to 33.1%, and which would be payable on adjusted Yescarta revenues after the judgment in 2020 until the expiry of the ‘190 patent in August 2024. We expect the judge to rule on the amount of prospective royalties and any enhanced damages in the course of deciding the post-trial motions. The court’s determination of prospective royalties and enhanced damages, if any, can also be appealed. If the jury’s verdict is upheld on appeal, the amount we could be required to pay to Juno could be significant, and such payment could have a material adverse impact on our results of operations, financial condition and stock price.
In February 2018, ViiV filed a lawsuit against us in the U.S. District Court of Delaware, alleging that the commercialization of bictegravir, sold commercially in combination with TAF and FTC as Biktarvy, infringes on ViiV’s U.S. Patent No. 8,129,385 (the ‘385 patent), covering ViiV’s dolutegravir. Bictegravir is structurally different from dolutegravir, and we believe that bictegravir does not infringe the claims of the ‘385 patent. To the extent that ViiV’s patent claims are interpreted to cover bictegravir, we believe those claims are invalid. The court has set a trial date of September 2020 for this lawsuit. For more information about this litigation, as well as related litigation in countries outside of the United States, see Note 14. Commitments and Contingencies of the Notes to Consolidated Financial Statements included in Part II, Item 8 of this Annual Report on Form 10-K. Although we cannot predict with certainty the ultimate outcome of this litigation, an adverse judgment could result in significant monetary damages and royalty payments on past and future sales, which could have a material impact on our results of operations, financial condition and stock price.
Our results of operations may be adversely affected by current and potential future healthcare legislative and regulatory actions.
Legislative and regulatory actions affecting government prescription drug procurement and reimbursement programs occur relatively frequently. In the United States, the Affordable Care Act (ACA) was enacted in 2010 to expand healthcare coverage. Since then, numerous efforts have been made to repeal, amend or administratively limit the ACA in whole or in part. For example, in December 2019, the U.S. Court of Appeals for the Fifth Circuit held that the individual health insurance mandate in the ACA is unconstitutional and remanded the case back to the district court to determine whether the other provisions of the ACA can stand without the individual health insurance mandate. The ongoing challenges to the ACA and new legislative proposals have resulted in uncertainty regarding the ACA’s future viability and destabilization of the health insurance market. The resulting impact on our business is uncertain and could be material.
Efforts to control prescription drug prices could also have a material adverse effect on our business. For example, in 2018, President Trump and the Secretary of the U.S. Department of Health and Human Services (HHS) released the “American Patients First Blueprint” and have begun implementing certain portions. The initiative includes proposals to increase generic drug and biosimilar competition, enable the Medicare program to negotiate drug prices more directly, improve transparency regarding drug prices and lower consumers’ out-of-pocket costs. The Trump administration also proposed to establish an “international pricing index” that would be used as a benchmark to determine the costs and potentially limit the reimbursement of drugs under Medicare
15
Part B. In addition, in December 2019, U.S. Food and Drug Administration (FDA) issued a proposal to implement two pathways for the legal importation of certain prescription drugs from Canada and prescription drugs that are FDA-approved, manufactured abroad, authorized for sale in a foreign country and originally intended for sale in that foreign country. Among other pharmaceutical manufacturer industry-related proposals, Congress has proposed bills to change the Medicare Part D benefit to impose an inflation-based rebate in Medicare Part D and to alter the benefit structure to increase manufacturer contributions in some or all benefit phases. The volume of drug pricing-related bills has dramatically increased under the current Congress, and the resulting impact on our business is uncertain and could be material.
In addition, a majority of states have enacted legislation that seeks to indirectly or directly regulate pharmaceutical drug pricing, such as by requiring biopharmaceutical manufacturers to publicly report proprietary pricing information or creating review boards for recommending price caps or other means for controlling prices of pharmaceutical products purchased by state agencies. For example, in 2017, California’s governor signed a prescription drug price transparency state bill into law, requiring prescription drug manufacturers to provide advance notice and explanation for price increases of certain drugs that exceed a specified threshold. Many other states have proposed or enacted similar legislation. In addition, many state legislatures are considering, or have already passed, various bills that would reform drug purchasing and price negotiations, facilitate the import of lower-priced drugs from outside the United States, and encourage the use of generic drugs. Such initiatives and legislation may cause added pricing pressures on our products.
Changes to the Medicaid program at the federal or state level could also have a material adverse effect on our business. Proposals that could impact coverage and reimbursement of our products, including giving states more flexibility to manage drugs covered under the Medicaid program, could have a material adverse effect by limiting our products’ use and coverage. Furthermore, state Medicaid programs could request additional supplemental rebates on our products for many reasons. To the extent that private insurers or managed care programs follow Medicaid coverage and payment developments, they could use the enactment of these increased rebates to exert pricing pressure on our products, and the adverse effects may be magnified by their adoption of lower payment schedules.
Other proposed regulatory actions affecting manufacturers could have a material adverse effect on our business. It is difficult to predict the impact, if any, of any such proposed legislative and regulatory actions or resulting state actions on the use and reimbursement of our products in the United States, but such actions may adversely affect our results of operations.
Many countries outside the United States, including the European Union (EU) Member States, have established complex and lengthy procedures to obtain price approvals, coverage and reimbursement. Many EU Member States review periodically their decisions concerning the pricing and reimbursement of medicinal products. The outcome of this review cannot be predicted and could have an adverse effect on the pricing and reimbursement of our medicinal products in the EU Member States. Reductions in the pricing of our medicinal products in one EU Member State could affect the price in other EU Member States and have a negative impact on our financial results.
Our existing products are subject to reimbursement from government agencies and other third parties, and we may be required to provide rebates and other discounts on our products, which may result in an adjustment to our product revenues. Pharmaceutical pricing and reimbursement pressures may adversely affect our profitability and our results of operations.
Successful commercialization of our products depends, in part, on the availability of governmental and third-party payer reimbursement for the cost of such products and related treatments in the markets where we sell our products. Government health authorities, private health insurers and other organizations generally provide reimbursement. In the United States, the European Union and other significant or potentially significant markets for our products and product candidates, government authorities and third-party payers are increasingly attempting to limit or regulate the price of medical products and services. A substantial portion of our product sales is subject to significant discounts from list price, including rebates that we may be required to pay certain governmental agencies. In addition, standard reimbursement structures may not adequately reimburse for innovative therapies.
For example, for fiscal year 2020, the Centers for Medicare and Medicaid Services (CMS) has established Medicare inpatient reimbursement for Yescarta that includes payment for a severity adjusted diagnosis related group (DRG) 016, a new technology add-on payment (NTAP) for Yescarta that at most will cover 65% of the cost of Yescarta and may cover less than that, and, in some cases, an outlier payment. Taken together, the total payment may not be sufficient to reimburse hospitals for their cost of care for patients receiving Yescarta. CMS also has not made a decision as to how much it will pay for Yescarta in fiscal year 2021 and beyond. If Medicare does not adequately reimburse for the cost of Yescarta, this could impact the willingness of some hospitals to offer the therapy and of doctors to recommend the therapy and could lessen the attractiveness of our therapy to patients, which could have an adverse effect on sales of Yescarta and on our results of operations. Additionally, in the European Union, there are barriers to reimbursement in individual countries that could limit the uptake of Yescarta.
In addition, we estimate the rebates we will be required to pay in connection with sales during a particular quarter based on claims data from prior quarters. In the United States, actual rebate claims are typically made by payers one to three quarters in arrears. Actual claims and payments may vary significantly from our estimates which can cause an adjustment to our product
16
revenues. To the extent our actual or anticipated product revenues fall short of investors’ expectations, our stock price could be adversely impacted.
For more information concerning the EU pricing and reimbursement regime, please see “Our results of operations may be adversely affected by current and potential future healthcare legislative and regulatory actions.”
Laws and regulations applicable to the health care industry could impose new obligations on us, require us to change our business practices and restrict our operations in the future.
The health care industry is subject to various federal, state and international laws and regulations pertaining to drug reimbursement, rebates, price reporting, health care fraud and abuse, and data privacy and security. In the United States, these laws include anti-kickback and false claims laws, laws and regulations relating to the Medicare and Medicaid programs and other federal and state programs, the Medicaid Rebate Statute, individual state laws relating to pricing and sales and marketing practices, the Health Insurance Portability and Accountability Act (HIPAA) and other federal and state laws relating to the privacy and security of health information.
Violations of these laws or any related regulations may be punishable by criminal and/or civil sanctions, including, in some instances, substantial fines, civil monetary penalties, exclusion from participation in federal and state health care programs, including Medicare, Medicaid, Veterans Administration health programs, and federal employee health benefit programs, actions against executives overseeing our business and significant remediation measures. In addition, these laws and regulations are broad in scope and they are subject to change and evolving interpretations, which could require us to incur substantial costs associated with compliance or to alter one or more of our sales or marketing practices. Violations of these laws, or allegations of such violations, could also result in negative publicity or other consequences that could harm our reputation, disrupt our business or adversely affect our results of operations. If any or all of these events occur, our business and stock price could be materially and adversely affected.
Recently, there has been enhanced scrutiny of company-sponsored patient assistance programs, including co-pay assistance programs, and manufacturer donations to third-party charities that provide such assistance. There has also been enhanced scrutiny by governments on reimbursement support offerings, clinical education programs and promotional speaker programs. If we, or our agents and vendors, are deemed to have failed to comply with laws, regulations or government guidance in any of these areas, we could be subject to criminal or civil sanctions. Any similar violations by our competitors could also negatively impact our industry reputation and increase scrutiny over our business and our products.
In addition, government price reporting and payment regulations are complex and we are continually assessing the methods by which we calculate and report pricing in accordance with these obligations. Our methodologies for calculations are inherently subjective and may be subject to review and challenge by various government agencies, which may disagree with our interpretation. If the government disagrees with our reported calculations, we may need to restate previously reported data and could be subject to additional financial and legal liability as described above.
For a description of our government investigations and related litigation, see Note 14. Commitments and Contingencies of the Notes to Consolidated Financial Statements included in Part II, Item 8 of this Annual Report on Form 10-K.
Yescarta, a chimeric antigen receptor (CAR) T cell therapy, represents a novel approach to cancer treatment that creates significant challenges for us, which may impact our ability to increase sales of Yescarta.
Yescarta, a CAR T cell therapy, involves (i) harvesting T cells from the patient’s blood, (ii) engineering T cells to express cancer-specific receptors, (iii) increasing the number of engineered T cells and (iv) infusing the functional cancer-specific T cells back into the patient. Advancing this novel and personalized therapy creates significant challenges, including:
• | educating and certifying medical personnel regarding the procedures and the potential side effect profile of our therapy, such as the potential adverse side effects related to cytokine release syndrome and neurologic toxicities, in compliance with the Risk Evaluation and Mitigation Strategy program required by FDA for Yescarta; |
• | using medicines to manage adverse side effects of our therapy, such as tocilizumab and corticosteroids, which may not be available in sufficient quantities, may not adequately control the side effects and/or may have a detrimental impact on the efficacy of the treatment; |
• | developing a robust and reliable process, while limiting contamination risks, for engineering a patient’s T cells ex vivo and infusing the engineered T cells back into the patient; and |
• | conditioning patients with chemotherapy in advance of administering our therapy, which may increase the risk of adverse side effects. |
The use of engineered T cells as a potential cancer treatment is a recent development and may not be broadly accepted by physicians, patients, hospitals, cancer treatment centers, payers and others in the medical community. We may not be able to establish or demonstrate to the medical community or commercial or governmental payers the safety and efficacy of Yescarta and
17
the potential advantages compared to existing and future therapeutics. For challenges related to the reimbursement of Yescarta, see also “Our existing products are subject to reimbursement from government agencies and other third parties, and we may be required to provide rebates and other discounts on our products, which may result in an adjustment to our product revenues. Pharmaceutical pricing and reimbursement pressures may adversely affect our profitability and our results of operations.” If we fail to overcome these significant challenges, our sales of Yescarta, results of operations and stock price could be adversely affected.
We have engaged in, and may in the future engage in, business acquisitions, licensing arrangements, collaborations, disposals of our assets and other strategic transactions, which could cause us to incur significant expenses and could adversely affect our financial condition and results of operations.
We have engaged in, and may in the future engage in, business acquisitions, licensing arrangements, collaborations, disposals of our assets and other transactions, as part of our business strategy. We may not identify suitable transactions in the future and, if we do, we may not complete such transactions in a timely manner, on a cost-effective basis, or at all, and may not realize the expected benefits. For example, if we are successful in making an acquisition, the products and technologies that are acquired may not be successful or may require significantly greater resources and investments than originally anticipated. We also may not be able to integrate acquisitions successfully into our existing business and could incur or assume significant debt and unknown or contingent liabilities. We have also acquired, and may in the future acquire, equity investments in our strategic transactions, such as in connection with our collaboration with Galapagos NV, and the value of our equity investments may fluctuate and decline in value. Further, we conduct annual impairment testing of our goodwill and other indefinite-lived intangible assets in the fourth quarter, and earlier if impairment indicators exist, as required under U.S. generally accepted accounting principles, which may result in impairment charges. For example, during the fourth quarter of 2019 and 2018, we recognized $800 million and $820 million, respectively, of impairment charges related to indefinite-lived intangible assets acquired in connection with our acquisition of Kite Pharma, Inc. If we fail to overcome these risks, it could cause us to incur significant expenses and negatively affect profitability, which could have an adverse effect on our results of operations. We could also experience negative effects on our reported results of operations from acquisition or disposition-related charges, amortization of expenses related to intangibles and charges for impairment of long-term assets.
We face risks associated with our global operations, which may adversely affect our financial condition and results of operations.
Our operations outside of the United States are accompanied by certain financial, political, economic and other risks, including those listed below:
• | Foreign Currency Exchange: In 2019, approximately 25% of our product sales were outside the United States. Because a significant percentage of our product sales is denominated in foreign currencies, primarily the Euro, we face exposure to adverse movements in foreign currency exchange rates. Overall, we are a net receiver of foreign currencies, and therefore, we benefit from a weaker U.S. dollar and are adversely affected by a stronger U.S. dollar. While we use foreign currency exchange forward and options contracts to hedge a percentage of our forecasted international sales, our hedging program does not eliminate our exposure to currency fluctuations. We cannot predict future fluctuations in the foreign currency exchange rates of the U.S. dollar. If the U.S. dollar appreciates significantly against certain currencies and our hedging program does not sufficiently offset the effects of such appreciation, our results of operations will be adversely affected and our stock price may decline. |
• | Anti-Bribery: We are subject to the U.S. Foreign Corrupt Practices Act and similar worldwide anti-bribery laws that govern our international operations with respect to payments to government officials. Our international operations are heavily regulated and require significant interaction with foreign officials. Though our policies mandate compliance with these anti-bribery laws, we operate in parts of the world that have experienced governmental corruption to some degree. In certain circumstances, strict compliance with anti-bribery laws may conflict with local customs and practices or may require us to interact with doctors and hospitals, some of which may be state controlled, in a manner that is different than local custom. It is possible that certain of our practices may be challenged under these laws. In addition, despite our training and compliance program, our internal control policies and procedures may not protect us from reckless or criminal acts committed by our employees and agents. Enforcement activities under anti-bribery laws could subject us to administrative and legal proceedings and actions, which could result in civil and criminal sanctions, including monetary penalties and exclusion from health care programs. |
• | Other risks inherent in conducting a global business include: |
◦ | Our international operations, including the use of third-party manufacturers, distributors and collaboration arrangements outside the United States, expose us to increased risk of theft of our intellectual property and other proprietary technology, particularly in jurisdictions with less robust intellectual property protections than the United States, as well as restrictive government actions against our intellectual property and other foreign assets such as nationalization, expropriation or the imposition of compulsory licenses. |
18
◦ | We may be subject to protective economic policies taken by foreign governments, such as trade protection measures and import and export licensing requirements, which may result in the imposition of trade sanctions or similar restrictions by the United States or other governments. |
◦ | Our operations may be adversely affected if there is instability, disruption or destruction in a geographic region where we operate, regardless of cause, including war, terrorism, social unrest and political changes and instability. For example, on January 31, 2020, the United Kingdom (UK) withdrew from the European Union (EU), which initiated a transition period during which the UK and EU will negotiate their future relationship. There is uncertainty concerning any changes in the laws and regulations governing the conduct of clinical trials and marketing of medicinal products in the UK following the country’s exit from the EU. This uncertainty may lead to significant complexity and risks for our company and our ability to research, develop and market medicinal products in the EU and the UK. See also “Business disruptions from natural or man-made disasters may adversely affect our revenues and materially reduce our earnings.” |
If we were to encounter any of these risks, our global operations may be adversely affected, which could have an adverse effect on our overall business and results of operations.
If significant safety issues arise for our marketed products or our product candidates, our reputation may be harmed and our future sales may be reduced, which could adversely affect our results of operations.
The data supporting the marketing approvals for our products and forming the basis for the safety warnings in our product labels were obtained in controlled clinical trials of limited duration and, in some cases, from post-approval use. As our products are used over longer periods of time by patients with underlying health problems or other medicines, we expect to continue finding new issues related to safety, resistance or drug interactions. Any such issues may require changes to our product labels, such as additional warnings, contraindications or even narrowed indications. If any of these were to occur, it could reduce the market acceptance and sales of our products.
Regulatory authorities have been moving towards more active and transparent pharmacovigilance and are making greater amounts of stand-alone safety information and clinical trial data directly available to the public through websites and other means, such as periodic safety update report summaries, risk management plan summaries and various adverse event data. Safety information, without the appropriate context and expertise, may be misinterpreted and lead to misperception or legal action which may potentially cause our product sales or stock price to decline.
Further, if serious safety, resistance or drug interaction issues arise with our marketed products, sales of these products could be limited or halted by us or by regulatory authorities and our results of operations could be adversely affected.
Our operations depend on compliance with complex FDA and comparable international regulations. Failure to obtain broad approvals on a timely basis or to maintain compliance could delay or halt commercialization of our products.
The products we develop must be approved for marketing and sale by regulatory authorities and, once approved, are subject to extensive regulation by FDA, the European Medicines Agency (EMA) and comparable regulatory agencies in other countries. We are continuing clinical trials for many of our products for currently approved and additional uses. We anticipate that we will file for marketing approval in additional countries and for additional indications and products over the next several years. These products may fail to receive such marketing approvals on a timely basis, or at all.
Further, how we manufacture and sell our products is subject to extensive regulation and review. Discovery of previously unknown problems with our marketed products or problems with our manufacturing, safety reporting or promotional activities may result in restrictions on our products, including withdrawal of the products from the market. If we fail to comply with applicable regulatory requirements, including those related to promotion and manufacturing, we could be subject to penalties including fines, suspensions of regulatory approvals, product recalls, seizure of products and criminal prosecution.
For example, under FDA rules, we are often required to conduct post-approval clinical studies to assess a known serious risk, signals of serious risk or to identify an unexpected serious risk. In certain circumstances, we may be required to implement a Risk Evaluation and Mitigation Strategy program for our products, which could include a medication guide, patient package insert, a communication plan to healthcare providers, restrictions on distribution or use of a product and other elements FDA deems necessary to assure safe use of the drug. Failure to comply with these or other requirements imposed by FDA could result in significant civil monetary penalties and our operating results may be adversely affected.
We face risks in our clinical trials, including the potential for unfavorable results, delays in anticipated timelines and disruption, which may adversely affect our prospects for future revenue growth and our results of operations.
We are required to demonstrate the safety and efficacy of products that we develop for each intended use through extensive preclinical studies and clinical trials. The results from preclinical and early clinical studies do not always accurately predict results in later, large-scale clinical trials. Even successfully completed large-scale clinical trials may not result in marketable products.
19
For example, in February 2019, we announced that our KITE-585 program, an anti-B cell maturation antigen being evaluated for the treatment of multiple myeloma, would not be moving forward. We also recently announced that STELLAR-3 and STELLAR-4, Phase 3 studies evaluating the safety and efficacy of selonsertib for the treatment of nonalcoholic steatohepatitis (NASH), did not meet the pre-specified week 48 primary endpoints. If any of our product candidates fails to achieve its primary endpoint in clinical trials, if safety issues arise or if the results from our clinical trials are otherwise inadequate to support regulatory approval of our product candidates, commercialization of that product candidate could be delayed or halted. In addition, we may also face challenges in clinical trial protocol design.
If the clinical trials for any of the product candidates in our pipeline are delayed or terminated, our prospects for future revenue growth and our results of operations may be adversely impacted. For example, we face numerous risks and uncertainties with our product candidates, including filgotinib for the treatment of rheumatoid arthritis, Crohn’s disease, ulcerative colitis and psoriatic arthritis; GLPG-1690 for the treatment of idiopathic pulmonary fibrosis; cilofexor for the treatment of primary sclerosing cholangitis; and axicabtagene ciloleucel for the treatment of second line diffuse large B-cell lymphoma, each currently in Phase 3 clinical trials, that could prevent completion of development of these product candidates. These risks include our ability to enroll patients in clinical trials, the possibility of unfavorable results of our clinical trials, the need to modify or delay our clinical trials or to perform additional trials and the risk of failing to obtain FDA and other regulatory body approvals. As a result, our product candidates may never be successfully commercialized. Further, we may make a strategic decision to discontinue development of our product candidates if, for example, we believe commercialization will be difficult relative to other opportunities in our pipeline. If these programs and others in our pipeline cannot be completed on a timely basis or at all, then our prospects for future revenue growth and our results of operations may be adversely impacted. In addition, clinical trials involving our commercial products could raise new safety issues for our existing products, which could in turn adversely affect our results of operations and harm our business.
In addition, we extensively outsource our clinical trial activities and usually perform only a small portion of the start-up activities in-house. We rely on independent third-party contract research organizations (CROs) to perform most of our clinical studies, including document preparation, site identification, screening and preparation, pre-study visits, training, program management, patient enrollment, ongoing monitoring, site management and bioanalytical analysis. Many important aspects of the services performed for us by the CROs are out of our direct control. If there is any dispute or disruption in our relationship with our CROs, our clinical trials may be delayed. Moreover, in our regulatory submissions, we rely on the quality and validity of the clinical work performed by third-party CROs. If any of our CROs’ processes, methodologies or results were determined to be invalid or inadequate, our own clinical data and results and related regulatory approvals may be adversely affected.
We depend on relationships with third parties for sales and marketing performance, technology, development, logistics and commercialization of products. Failure to maintain these relationships, poor performance by these companies or disputes with these third parties could negatively impact our business.
We rely on a number of collaborative relationships with third parties for our sales and marketing performance in certain territories. For example, we have collaboration arrangements with Janssen Sciences Ireland UC for Odefsey, Complera/Eviplera and Symtuza. In some countries, we rely on international distributors for sales of certain of our products. Some of these relationships also involve the clinical development of these products by our partners. Reliance on collaborative relationships poses a number of risks, including the risk that:
• | we are unable to control the resources our corporate partners devote to our programs or products; |
• | disputes may arise with respect to the ownership of rights to technology developed with our corporate partners; |
• | disagreements with our corporate partners could cause delays in, or termination of, the research, development or commercialization of product candidates or result in litigation or arbitration; |
• | contracts with our corporate partners may fail to provide significant protection or may fail to be effectively enforced if one of these partners fails to perform; |
• | our corporate partners have considerable discretion in electing whether to pursue the development of any additional products and may pursue alternative technologies or products either on their own or in collaboration with our competitors; |
• | our corporate partners with marketing rights may choose to pursue competing technologies or to devote fewer resources to the marketing of our products than they do to products of their own development; and |
• | our distributors and our corporate partners may be unable to pay us. |
Given these risks, there is a great deal of uncertainty regarding the success of our current and future collaborative efforts. If these efforts fail, our product development or commercialization of new products could be delayed or revenues from products could decline.
In addition, we rely on third-party sites to collect patients’ white blood cells, known as apheresis centers, shippers, couriers, and hospitals for the logistical collection of patients’ white blood cells and ultimate delivery of Yescarta to patients. Any disruption or difficulties encountered by any of these vendors could result in product loss and regulatory action and harm our Yescarta business
20
and our reputation. To ensure that any apheresis center is prepared to ship cells to our manufacturing facilities, we plan to conduct quality certifications of each apheresis center. However, apheresis centers may choose not to participate in the certification process or we may be unable to complete certification in a timely manner or at all, which could delay or restrain our manufacturing and commercialization efforts. As a result, our sales of Yescarta may be limited which could harm our results of operations.
Our success depends to a significant degree on our ability to defend our patents and other intellectual property rights both domestically and internationally. We may not be able to obtain effective patents to protect our technologies from use by competitors.
Patents and other proprietary rights are very important to our business. Our success depends to a significant degree on our ability to:
• | obtain patents and licenses to patent rights; |
• | preserve trade secrets and internal know-how; |
• | defend against infringement of our patents and efforts to invalidate them; and |
• | operate without infringing on the intellectual property of others. |
If we have a properly drafted and enforceable patent, it can be more difficult for our competitors to use our technology to create competitive products and more difficult for our competitors to obtain a patent that prevents us from using technology we create. As part of our business strategy, we actively seek patent protection both in the United States and internationally and file additional patent applications, when appropriate, to cover improvements in our compounds, products and technology.
Patent applications are confidential for a period of time before a patent is issued. As a result, we may not know if our competitors filed patent applications for technology covered by our pending applications or if we were the first to invent or first to file an application directed toward the technology that is the subject of our patent applications. In addition, if competitors file patent applications covering our technology, we may have to participate in litigation, post-grant proceedings before the U.S. Patent and Trademark Office (USPTO) or other proceedings to determine the right to a patent or validity of any patent granted. Litigation, post-grant proceedings before the USPTO or other proceedings are unpredictable and expensive, and could divert management attention from other operations, such that, even if we are ultimately successful, our results of operations may be adversely affected by such events.
Generic manufacturers have sought, and may continue to seek, FDA approval to market generic versions of our products through an abbreviated new drug application (ANDA), the application process typically used by manufacturers seeking approval of a generic drug. For a description of our ANDA litigation, see Note 14. Commitments and Contingencies of the Notes to Consolidated Financial Statements included in Part II, Item 8 of this Annual Report on Form 10-K. The entry of generic versions of our products has, and may in the future, lead to market share and price erosion and have a negative impact on our business and results of operations.
Our success depends in large part on our ability to operate without infringing upon the patents or other proprietary rights of third parties.
If we are found to infringe the valid patents of third parties, we may be required to pay significant monetary damages or we may be prevented from commercializing products or may be required to obtain licenses from these third parties. We may not be able to obtain alternative technologies or any required license on commercially reasonable terms or at all. If we fail to obtain these licenses or alternative technologies, we may be unable to develop or commercialize some or all of our products. For example, we are aware of patents and patent applications owned by third parties that such parties may claim cover the use of sofosbuvir, axicabtagene ciloleucel or bictegravir. See “We may be required to pay significant damages and royalty payments as a result of ongoing litigation related to Yescarta and Biktarvy.” See also a description of our litigation regarding sofosbuvir, axicabtagene ciloleucel, bictegravir, and TDF or TAF in combination with FTC for the use of pre-exposure prophylaxis in Note 14. Commitments and Contingencies of the Notes to Consolidated Financial Statements included in Part II, Item 8 of this Annual Report on Form 10-K.
Furthermore, we also rely on unpatented trade secrets and improvements, unpatented internal know-how and technological innovation. For example, a great deal of our liposomal manufacturing expertise, which is a key component of our liposomal technology, is not covered by patents but is instead protected as a trade secret. We protect these rights mainly through confidentiality agreements with our corporate partners, employees, consultants and vendors. We cannot be certain that these parties will comply with these confidentiality agreements, that we have adequate remedies for any breach or that our trade secrets, internal know-how or technological innovation will not otherwise become known or be independently discovered by our competitors. Under some of our R&D agreements, inventions become jointly owned by us and our corporate partner and in other cases become the exclusive property of one party. In certain circumstances, it can be difficult to determine who owns a particular invention and disputes could arise regarding those inventions. If our trade secrets, internal know-how, technological innovation or confidential information become known or independently discovered by competitors or if we enter into disputes over ownership of inventions, our business and results of operations could be adversely affected.
21
Manufacturing problems, including at our third-party manufacturers and corporate partners, could cause inventory shortages and delay product shipments and regulatory approvals, which may adversely affect our results of operations.
In order to generate revenue from our products, we must be able to produce sufficient quantities of our products to satisfy demand. Many of our products are the result of complex manufacturing processes. The manufacturing process for pharmaceutical products is also highly regulated and regulators may shut down manufacturing facilities that they believe do not comply with regulations.
Our products are either manufactured at our own facilities or by third-party manufacturers or corporate partners. We depend on third parties to perform manufacturing activities effectively and on a timely basis for the majority of our solid dose products. We, our third-party manufacturers and our corporate partners are subject to Good Manufacturing Practices (GMP), which are extensive regulations governing manufacturing processes, stability testing, record keeping and quality standards as defined by FDA and EMA. Similar regulations are in effect in other jurisdictions.
Our third-party manufacturers and corporate partners are independent entities subject to their own unique operational and financial risks that are out of our control. If we or any of these third-party manufacturers or corporate partners fail to perform as required, this could impair our ability to deliver our products on a timely basis or receive royalties or could cause delays in our clinical trials and applications for regulatory approval. Further, we may have to write off the costs of manufacturing any batch that fails to pass quality inspection or meet regulatory approval. In addition, we, our third-party manufacturers and our corporate partners may only be able to produce some of our products at one or a limited number of facilities and, therefore, have limited manufacturing capacity for certain products, and we may not be able to locate additional or replacement facilities on a reasonable basis or at all. Our sales of such products could also be adversely impacted by our reliance on such limited number of facilities. To the extent these risks materialize and affect their performance obligations to us, our financial results may be adversely affected.
Our manufacturing operations are subject to routine inspections by regulatory agencies. If we are unable to remedy any deficiencies cited by FDA in these inspections, our currently marketed products and the timing of regulatory approval of products in development could be adversely affected. Further, there is risk that regulatory agencies in other countries where marketing applications are pending will undertake similar additional reviews or apply a heightened standard of review, which could delay the regulatory approvals for products in those countries. If approval of any of our product candidates were delayed or if production of our marketed products were interrupted, our anticipated revenues and our stock price may be adversely affected.
We may not be able to obtain materials or supplies necessary to conduct clinical trials or to manufacture and sell our products, which could limit our ability to generate revenues.
We need access to certain supplies and products to conduct our clinical trials and to manufacture and sell our products. If we are unable to purchase sufficient quantities of these materials or find suitable alternative materials in a timely manner, our development efforts for our product candidates may be delayed or our ability to manufacture our products could be limited, which could limit our ability to generate revenues.
Suppliers of key components and materials must be named in the new drug application or marketing authorization application filed with the regulatory authority for any product candidate for which we are seeking marketing approval, and significant delays can occur if the qualification of a new supplier is required. Even after a manufacturer is qualified by the regulatory authority, the manufacturer must continue to expend time, money and effort in the area of production and quality control to ensure full compliance with GMP. Manufacturers are subject to regular periodic inspections by regulatory authorities following initial approval. If, as a result of these inspections, a regulatory authority determines that the equipment, facilities, laboratories or processes do not comply with applicable regulations and conditions of product approval, the regulatory authority may suspend the manufacturing operations. If the manufacturing operations of any of the single suppliers for our products are suspended, we may be unable to generate sufficient quantities of commercial or clinical supplies of product to meet market demand, which could in turn decrease our revenues and harm our business. In addition, if deliveries of materials from our suppliers were interrupted for any reason, we may be unable to ship certain of our products for commercial supply or to supply our product candidates in development for clinical trials. In addition, some of our products and the materials that we utilize in our operations are manufactured at only one facility, which we may not be able to replace in a timely manner and on commercially reasonable terms, or at all. Problems with any of the single suppliers we depend on, including in the event of a disaster, such as an earthquake, equipment failure or other difficulty, may negatively impact our development and commercialization efforts.
A significant portion of the raw materials and intermediates used to manufacture our antiviral products are supplied by third-party manufacturers and corporate partners outside of the United States. As a result, any political or economic factors in a specific country or region, including any changes in or interpretations of trade regulations, compliance requirements or tax legislation, that would limit or prevent third parties outside of the United States from supplying these materials could adversely affect our ability to manufacture and supply our antiviral products to meet market needs and have a material and adverse effect on our operating results.
22
If we were to encounter any of these difficulties, our ability to conduct clinical trials on product candidates and to manufacture and sell our products could be impaired, which could have an adverse effect on our business.
Imports from countries where our products are available at lower prices and unapproved generic or counterfeit versions of our products could have a negative impact on our reputation and business.
Prices for our products are based on local market economics and competition and sometimes differ from country to country. Our sales in countries with relatively higher prices may be reduced if products can be imported and resold into those countries from lower price markets. If our HIV, HBV and HCV products, which we have agreed to make available at substantially reduced prices to certain low- and middle-income countries participating in our Gilead Access Program, are re-exported into the United States, Europe or other higher price markets, our revenues could be adversely affected. In addition, we have entered into agreements with generic drug manufacturers as well as a licensing agreement with the Medicines Patent Pool, a United Nations-backed public health organization, which allows generic drug manufacturers to manufacture certain generic versions of our products for distribution in certain low- and middle-income countries. If generic versions of our products produced and/or distributed under these agreements are then re-exported to the United States, Europe or other higher price markets, our revenues could be adversely affected.
In the European Union, we are required to permit products purchased in one EU member state to be sold in another EU member state. Purchases of our products in countries where our selling prices are relatively low for resale in countries in which our selling prices are relatively high can affect the inventory level held by our wholesalers and can cause the relative sales levels in the various countries to fluctuate from quarter to quarter and not reflect the actual consumer demand in any given quarter. These quarterly fluctuations may impact our earnings, which could adversely affect our stock price and harm our business.
Additionally, use of diverted products could occur in countries where they have not been approved and patients could source the product outside the legitimate supply chain. Therefore, the products may be handled, shipped and stored inappropriately, which may affect the efficacy of the product and could harm patients, our brands or the commercial or scientific reputation of our products.
We are also aware of the existence of various “Buyers Clubs” around the world that promote the personal importation of generic versions of our HCV and HIV products that have not been approved for use in the countries into which they are imported. As a result, patients may be at risk of taking unapproved medications which may not be what they purport to be, may not have the potency they claim to have or may contain harmful substances. To the extent patients take unapproved generic versions of one or more of our medications and are injured by these generic products, our brands or the commercial or scientific reputation of our HCV and HIV products could be harmed.
Further, third parties may illegally distribute and sell counterfeit versions of our products, which do not meet the rigorous quality standards of our manufacturing and supply chain. We actively take actions to discourage the distribution and sale of counterfeits of our products around the world, including working with local regulatory and legal authorities to enforce laws against counterfeit drugs, raising public awareness of the dangers of counterfeit drugs and promoting public policies to hinder the sale and availability of counterfeit drugs. Counterfeit drugs pose a serious risk to patient health and safety and may raise the risk of product recalls. Our reputation and business could suffer as a result of counterfeit drugs sold under our brand names.
Expensive litigation and government investigations have increased our expenses which may continue to reduce our earnings.
We are involved in a number of litigation, investigation and other dispute-related matters that require us to expend substantial internal and financial resources. We expect these matters will continue to require a high level of internal and financial resources for the foreseeable future. These matters have reduced and will continue to reduce our earnings and require significant management attention. For a description of our litigation, investigations and other dispute-related matters, see Note 14. Commitments and Contingencies of the Notes to Consolidated Financial Statements included in Part II, Item 8 of this Annual Report on Form 10-K. See also “We may be required to pay significant damages and royalty payments as a result of ongoing litigation related to Yescarta and Biktarvy.” The outcome of such legal proceedings or any other legal proceedings that may be brought against us, the investigations or any other investigations that may be initiated and any other dispute-related matters, are inherently uncertain, and adverse developments or outcomes can result in significant expenses, monetary damages, penalties or injunctive relief against us that could significantly reduce our earnings and cash flows and harm our business and reputation.
We may face significant liability resulting from our products and such liability could materially reduce our earnings.
The testing, manufacturing, marketing and use of our commercial products, as well as product candidates in development, involve substantial risk of product liability claims. These claims may be made directly by consumers, healthcare providers, pharmaceutical companies or others. We have limited insurance for product liabilities that may arise. If claims exceed our coverage, our financial condition will be adversely affected. In addition, negative publicity associated with any claims, regardless of their merit, may decrease the future demand for our products and impair our financial condition. For a description of our product liability
23
matters, see Note 14. Commitments and Contingencies of the Notes to Consolidated Financial Statements included in Part II, Item 8 of this Annual Report on Form 10-K.
If we fail to attract, develop and retain highly qualified personnel, our business and operations may be adversely affected.
Our future success will depend in large part on our continued ability to attract, develop and retain highly qualified scientific, technical and management personnel, as well as personnel with expertise in clinical testing, governmental regulation and commercialization. We face competition for personnel from other companies, universities, public and private research institutions, government entities and other organizations. Competition for qualified personnel in the biopharmaceutical field is intense, and there is a limited pool of qualified potential employees to recruit. We may not be able to attract and retain quality personnel on acceptable terms. Our ability to do so also depends on how well we maintain a strong workplace culture that is attractive to employees, particularly during the leadership transition that we are currently experiencing. Additionally, changes to U.S. immigration and work authorization laws and regulations could make it more difficult for employees to work in or transfer to jurisdictions in which we have operations and could impair our ability to attract and retain qualified personnel. If we are unsuccessful in our recruitment, development and retention efforts or we fail to maintain a strong workplace culture, our business and reputation may be harmed.
We have recently made significant changes to our senior leadership team. In 2019, we appointed Daniel O’Day as Chairman and Chief Executive Officer, Andrew Dickinson as Chief Financial Officer, Johanna Mercier as Chief Commercial Officer, Merdad Parsey as Chief Medical Officer, Brett Pletcher as Executive Vice President, Corporate Affairs and General Counsel, Jyoti Mehra as Executive Vice President, Human Resources, and Christi Shaw as Chief Executive Officer of Kite. Changes in management and other key personnel may lead to potential organizational realignments and additional personnel changes, which may disrupt our business and adversely affect our operations.
Business disruptions from natural or man-made disasters may adversely affect our revenues and materially reduce our earnings.
Our worldwide operations, third-party manufacturers or corporate partners could be subject to business interruptions stemming from natural or man-made disasters, such as climate change, terrorist attacks, armed conflicts, earthquakes, hurricanes, flooding, fires or actual or threatened public health emergencies, or efforts taken by third parties to prevent or mitigate such disasters, such as public safety power shutoffs and facility shutdowns, for which we or they may be uninsured or inadequately insured. Our corporate headquarters in Foster City and our Santa Monica location, which together house a majority of our R&D activities, and our San Dimas, La Verne, Oceanside and El Segundo manufacturing facilities are located in California, a seismically active region. As we may not carry adequate earthquake insurance and significant recovery time could be required to resume operations, our financial condition and operating results could be materially adversely affected in the event of a major earthquake.
We are dependent on information technology systems, infrastructure and data, which may be subject to cyberattacks, security breaches and legal claims.
We are dependent upon information technology systems, infrastructure and data, including our Kite Konnect platform, which is critical to ensure chain of identity and chain of custody of Yescarta. The multitude and complexity of our computer systems make them inherently vulnerable to service interruption or destruction, malicious intrusion and random attack. Likewise, data privacy or security breaches by employees or others pose a risk that sensitive data, including our intellectual property or trade secrets or the personal information of our employees, patients, customers or other business partners may be exposed to unauthorized persons or to the public. Cyberattacks are increasing in their frequency, sophistication and intensity. Cyberattacks could include the deployment of harmful malware, denial-of-service, social engineering and other means to affect service reliability and threaten data confidentiality, integrity and availability. Our business and technology partners face similar risks and any security breach of their systems could adversely affect our security posture. While we have invested, and continue to invest, in the protection of our data and information technology infrastructure, there can be no assurance that our efforts, or the efforts of our partners and vendors, will prevent future service interruptions or identify breaches in our systems. Such interruptions or breaches could adversely affect our business and operations and/or cause the loss of critical or sensitive information, including personal information, which could result in financial, legal, business or reputational harm to us. In addition, our insurance may not be sufficient in type or amount to cover the financial, legal, business or reputational losses that may result from an interruption or breach of our systems.
Regulators globally are also imposing new data privacy and security requirements, including new and greater monetary fines for privacy violations. For example, the General Data Protection Regulation (GDPR) that became effective in Europe in 2018 established regulations regarding the handling of personal data, and non-compliance with the GDPR may result in monetary penalties of up to four percent of worldwide revenue. In addition, new domestic data privacy and security laws, such as the California Consumer Privacy Act (CCPA) that became effective in January 2020, and others that may be passed, similarly introduce requirements with respect to personal information, and non-compliance with CCPA may result in liability through private actions (subject to statutorily defined damages in the event of certain data breaches) and enforcement. The GDPR, CCPA and other changes,
24
or new laws or regulations associated with the enhanced protection of personal information, including in some cases healthcare data or other personal information, could greatly increase our cost of providing our products and services or even prevent us from offering certain services in jurisdictions in which we operate.
Changes in our effective income tax rate could reduce our earnings.
We are subject to income taxes in the United States and various foreign jurisdictions including Ireland. Due to economic and political conditions, various countries are actively considering and have made changes to existing tax laws. We cannot predict the form or timing of potential legislative and regulatory changes that could have a material adverse impact on our results of operations. For example, the United States enacted significant tax reform, and certain provisions of the new law are complex and will continue to significantly affect us.
In addition, significant judgment is required in determining our worldwide provision for income taxes. Various factors may have favorable or unfavorable effects on our income tax rate including, but not limited to, our portion of the non-tax deductible annual branded prescription drug fee, the accounting for stock options and other share-based awards, mergers and acquisitions, future levels of R&D spending, ability to maintain manufacturing and other operational activities in our Irish facilities, changes in the mix of earnings in the various tax jurisdictions in which we operate, changes in overall levels of pre-tax earnings, resolution of federal, state and foreign income tax audits. The impact on our income tax provision resulting from the above mentioned factors may be significant and could have a negative impact on our consolidated results of operations.
Our income tax returns are subject to audit by federal, state and foreign tax authorities. We are currently under examination by the Internal Revenue Service for the tax years from 2013 to 2015 and by various state and foreign jurisdictions. There are differing interpretations of tax laws and regulations and, as a result, significant disputes may arise with these tax authorities involving issues of the timing and amount of deductions and allocations of income among various tax jurisdictions. Resolution of one or more of these exposures in any reporting period could have a material impact on the results of operations for that period.
There can be no assurance that we will continue to pay dividends or repurchase stock.
Our Board of Directors authorized a dividend program under which we intend to pay quarterly dividends of $0.68 per share, subject to quarterly declarations by our Board of Directors. In the first quarter of 2016, our Board of Directors also approved the repurchase of up to $12.0 billion of our common stock (2016 Program), of which $3.4 billion is available for repurchase as of December 31, 2019. In the first quarter of 2020, our Board of Directors authorized a new $5.0 billion stock repurchase program (2020 Program), which will commence upon the completion of the 2016 Program. Purchases under the 2020 Program may be made in the open market or in privately negotiated transactions. Any future declarations, amount and timing of any dividends and/or the amount and timing of such stock repurchases are subject to capital availability and determinations by our Board of Directors that cash dividends and/or stock repurchases are in the best interest of our stockholders and are in compliance with all respective laws and our agreements applicable to the declaration and payment of cash dividends and the repurchase of stock. Our ability to pay dividends and/or repurchase stock will depend upon, among other factors, our cash balances and potential future capital requirements for strategic transactions, including acquisitions, debt service requirements, results of operations, financial condition and other factors beyond our control that our Board of Directors may deem relevant. A reduction in or elimination of our dividend payments, our dividend program and/or stock repurchases could have a negative effect on our stock price.
25
ITEM 1B. | UNRESOLVED STAFF COMMENTS |
Not applicable.
ITEM 2. | PROPERTIES |
Our corporate headquarters are located in Foster City, California, where we house our administrative and certain of our R&D activities. We also have R&D facilities in Emeryville, Oceanside and Santa Monica, California; Gaithersburg, Maryland; Seattle, Washington; Edmonton, Canada; and Amsterdam, Netherlands. Our principal manufacturing facilities are in El Segundo, La Verne, Oceanside and San Dimas, California; Edmonton, Canada; Cork, Ireland; and Hoofddorp, Netherlands. For more information about our manufacturing facilities, see Item 1 - Business “Our Manufacturing Facilities.” Our global operations include offices in Europe, North America, Asia, South America, Africa, Australia and the Middle East.
We believe that our existing properties, including both owned and leased sites, are in good condition and suitable for the conduct of our business. We believe our capital resources are sufficient to purchase, lease or construct any additional facilities required to meet our expected long-term growth needs.
ITEM 3. | LEGAL PROCEEDINGS |
For a description of our significant pending legal proceedings, please see Note 14. Commitments and Contingencies - Legal Proceedings of the Notes to Consolidated Financial Statements included in Part II, Item 8 of this Annual Report on Form 10-K, which is incorporated herein by reference.
ITEM 4. | MINE SAFETY DISCLOSURES |
Not applicable.
26
PART II
ITEM 5. | MARKET FOR REGISTRANT’S COMMON EQUITY, RELATED STOCKHOLDER MATTERS AND ISSUER PURCHASES OF EQUITY SECURITIES |
Our common stock is traded on the Nasdaq Global Select Market under the symbol “GILD.”
As of February 18, 2020, we had approximately 473 stockholders of record of our common stock.
Performance Graph (1)
The following graph compares our cumulative total stockholder return for the past five years to two indices: the Standard & Poor’s 500 Stock Index (S&P 500 Index) and the Nasdaq Biotechnology Index (NBI Index). The stockholder return shown on the graph below is not necessarily indicative of future performance, and we do not make or endorse any predictions as to future stockholder returns.
Comparison of Cumulative Total Return on Investment for the Past Five Years (2)
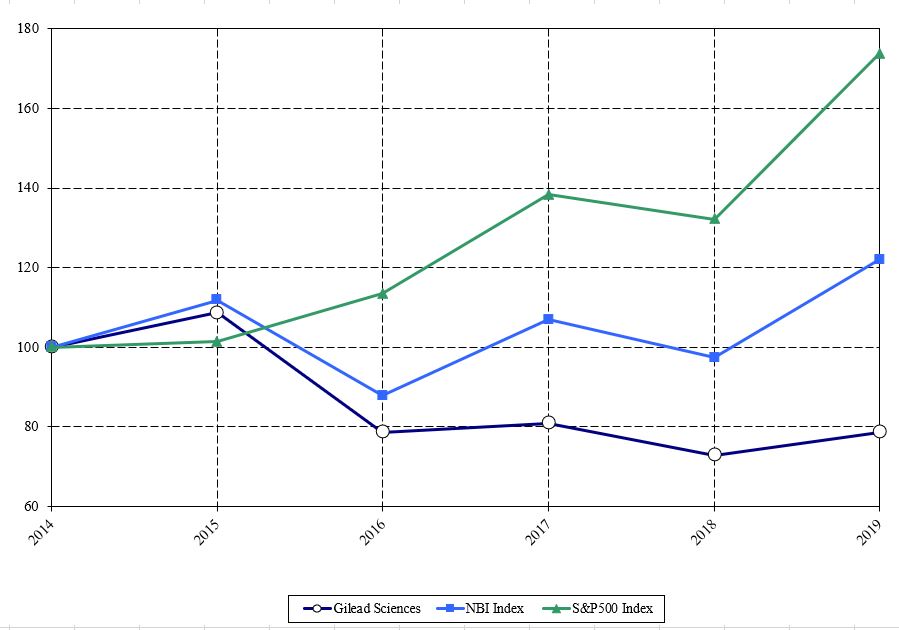
______________________________________________________
(1) | This section is not “soliciting material,” is not deemed “filed” with the SEC and is not to be incorporated by reference in any of our filings under the Securities Act or the Exchange Act whether made before or after the date hereof and irrespective of any general incorporation language in any such filing. |
(2) | Shows the cumulative return on investment assuming an investment of $100 in our common stock, the NBI Index and the S&P 500 Index on December 31, 2014, and assuming that all dividends were reinvested. |
27
Equity Compensation Plan Information
The following table provides certain information with respect to our equity compensation plans in effect as of December 31, 2019 (in millions, except per share amounts):
Number of Common Shares to be Issued Upon Exercise of Outstanding Options, Warrants and Rights | Weighted-average Exercise Price of Outstanding Options, Warrants and Rights(1) | Number of Common Shares Remaining Available for Future Issuance Under Equity Compensation Plans (Excluding Securities Reflected in Column (a)) | ||||||||
Plan Category | (a) | (b) | (c) | |||||||
Equity Compensation plans approved by security holders: | ||||||||||
2004 Equity Incentive Plan | 19.5 | $ | 61.35 | 79.2 | ||||||
Employee Stock Purchase Plan(2) | 8.9 | |||||||||
Total equity compensation plans approved by security holders | 19.5 | $ | 61.35 | 88.1 | ||||||
Equity Compensation plans not approved by security holders | — | — | — | |||||||
Total | 19.5 | $ | 61.35 | 88.1 | ||||||
_________________________________________ | ||||||||||
(1) | Does not take into account 18 million restricted stock units, performance share awards or units and phantom shares, which have no exercise price and were granted under our 2004 Equity Incentive Plan. |
(2) | Under our Employee Stock Purchase Plan, participants are permitted to purchase our common stock at a discount on certain dates through payroll deductions within a pre-determined purchase period. Accordingly, these numbers are not determinable. |
Issuer Purchases of Equity Securities
In the first quarter of 2016, our Board of Directors authorized a $12.0 billion share repurchase program (2016 Program) under which repurchases may be made in the open market or in privately negotiated transactions. During 2019, we repurchased and retired 26 million shares of our common stock for $1.7 billion through open market transactions under the 2016 Program.
The table below summarizes our stock repurchase activity for the three months ended December 31, 2019 (in thousands, except per share amounts):
Total Number of Shares Purchased | Average Price Paid per Share | Total Number of Shares Purchased as Part of a Publicly Announced Program | Maximum Fair Value of Shares that May Yet Be Purchased Under the Program | |||||||||||
October 1 - October 31, 2019 | 712 | $ | 63.84 | 688 | $ | 3,459 | ||||||||
November 1 - November 30, 2019 | 768 | $ | 65.14 | 557 | $ | 3,423 | ||||||||
December 1 - December 31, 2019 | 393 | $ | 66.59 | 372 | $ | 3,398 | ||||||||
Total | 1,873 | (1) | $ | 64.95 | 1,617 | (1) | ||||||||
_________________________________________ | ||||||||||||||
(1) | The difference between the total number of shares purchased and the total number of shares purchased as part of a publicly announced program is due to shares of common stock withheld by us from employee restricted stock unit awards in order to satisfy applicable tax withholding obligations. |
In the first quarter of 2020, our Board of Directors authorized a new $5.0 billion stock repurchase program (2020 Program), which will commence upon the completion of the 2016 Program. Purchases under the 2020 Program may be made in the open market or in privately negotiated transactions.
28
ITEM 6. | SELECTED FINANCIAL DATA |
GILEAD SCIENCES, INC.
SELECTED CONSOLIDATED FINANCIAL DATA
(in millions, except per share amounts)
Year Ended December 31, | |||||||||||||||||||
2019 | 2018 | 2017 | 2016 | 2015 | |||||||||||||||
CONSOLIDATED STATEMENT OF INCOME DATA(1): | |||||||||||||||||||
Total revenues (2) | $ | 22,449 | $ | 22,127 | $ | 26,107 | $ | 30,390 | $ | 32,639 | |||||||||
Total costs and expenses | $ | 18,162 | $ | 13,927 | $ | 11,983 | $ | 12,757 | $ | 10,446 | |||||||||
Income from operations(2) | $ | 4,287 | $ | 8,200 | $ | 14,124 | $ | 17,633 | $ | 22,193 | |||||||||
Provision for income taxes(3) | $ | (204 | ) | $ | 2,339 | $ | 8,885 | $ | 3,609 | $ | 3,553 | ||||||||
Net income(2)(3)(4) | $ | 5,364 | $ | 5,460 | $ | 4,644 | $ | 13,488 | $ | 18,106 | |||||||||
Net income attributable to Gilead(2)(3)(4) | $ | 5,386 | $ | 5,455 | $ | 4,628 | $ | 13,501 | $ | 18,108 | |||||||||
Net income per share attributable to Gilead common stockholders - basic(2)(3)(4) | $ | 4.24 | $ | 4.20 | $ | 3.54 | $ | 10.08 | $ | 12.37 | |||||||||
Shares used in per share calculation - basic | 1,270 | 1,298 | 1,307 | 1,339 | 1,464 | ||||||||||||||
Net income per share attributable to Gilead common stockholders - diluted(2)(3)(4) | $ | 4.22 | $ | 4.17 | $ | 3.51 | $ | 9.94 | $ | 11.91 | |||||||||
Shares used in per share calculation - diluted | 1,277 | 1,308 | 1,319 | 1,358 | 1,521 | ||||||||||||||
Cash dividends declared per share | $ | 2.52 | $ | 2.28 | $ | 2.08 | $ | 1.84 | $ | 1.29 | |||||||||
December 31, | |||||||||||||||||||
2019 | 2018 | 2017 | 2016 | 2015 | |||||||||||||||
CONSOLIDATED BALANCE SHEET DATA(1): | |||||||||||||||||||
Cash, cash equivalents and marketable debt securities(5) | $ | 25,840 | $ | 31,512 | $ | 36,694 | $ | 32,380 | $ | 26,208 | |||||||||
Working capital(3)(4)(5)(6) | $ | 20,537 | $ | 25,231 | $ | 20,188 | $ | 10,370 | $ | 14,044 | |||||||||
Total assets(5)(6) | $ | 61,627 | $ | 63,675 | $ | 70,283 | $ | 56,977 | $ | 51,716 | |||||||||
Other long-term obligations(6) | $ | 1,009 | $ | 1,040 | $ | 558 | $ | 297 | $ | 395 | |||||||||
Long-term debt, including current portion(5) | $ | 24,593 | $ | 27,322 | $ | 33,542 | $ | 26,346 | $ | 22,055 | |||||||||
Retained earnings(2)(3)(4)(6) | $ | 19,388 | $ | 19,024 | $ | 19,012 | $ | 18,154 | $ | 18,001 | |||||||||
Total stockholders’ equity(2)(3)(4)(6) | $ | 22,650 | $ | 21,534 | $ | 20,501 | $ | 19,363 | $ | 19,113 | |||||||||
_________________________________________ | |
(1) | See Management’s Discussion and Analysis of Financial Condition and Results of Operations included in Item 7 of this Annual Report on Form 10-K for a description of our results of operations for 2019. |
(2) | In 2018, we adopted Accounting Standards Update No. 2014-09 (Topic 606) “Revenue from Contracts with Customers” using the modified retrospective method. As such, results for reporting periods beginning after January 1, 2018 are presented under Topic 606, while prior period amounts are not adjusted and continue to be reported in accordance with our historical accounting under Topic 605 “Revenue Recognition.” |
(3) | In December 2019, we recorded a deferred tax benefit of $1.2 billion related to intangible asset transfers from a foreign subsidiary to Ireland and the United States. In 2018, we recorded a deferred tax charge of $588 million related to a transfer of acquired intangible assets from a foreign subsidiary to the United States. In December 2017, we recorded an estimated $5.5 billion net charge related to the enactment of the Tax Cuts and Jobs Act (Tax Reform). Tax Reform also lowered the corporate tax rate in the United States from 35% to 21% effective for tax years beginning after December 31, 2017. See Note 19. Income Taxes of the Notes to Consolidated Financial Statements included in Item 8 of this Annual Report on Form 10-K for additional details. |
(4) | Investments in equity securities, other than equity method investments, for which we have not elected the fair value method of accounting, are recorded at fair market value, if fair value is readily determinable and, beginning January 1, 2018, unrealized gains and losses are included in Other income (expense), net on our Consolidated Statements of Income. For periods presented prior to January 1, 2018, unrealized gains and losses were included in accumulated other comprehensive income as a separate component of stockholders’ equity. |
(5) | In 2019, we repaid $2.8 billion principal amount of our senior unsecured notes at maturity. In 2018, we repaid $1.8 billion principal amount of our senior unsecured notes at maturity and repaid $4.5 billion of term loans borrowed in connection with our acquisition of Kite Pharma, Inc. In 2017, in connection with the acquisition of Kite Pharma, Inc., we issued $3.0 billion aggregate principal amount of senior unsecured notes and borrowed $6.0 billion aggregate principal amount term loan facility credit agreement, of which $1.5 billion was repaid in 2017. In 2016, we issued $5.0 billion principal amount of senior unsecured notes and repaid $285 million of principal balance of convertible senior notes and $700 million of principal balance of senior unsecured notes at maturity. In 2015, we issued $10.0 billion principal amount of senior unsecured notes and repaid $213 million of principal balance of convertible senior notes at maturity. |
(6) | In 2019, we adopted Accounting Standards Update No. 2016-02 (Topic 842) “Leases,” which requires lessees to recognize right-of-use assets and lease liabilities for operating leases with a lease term greater than one year. We adopted Topic 842 using the modified retrospective method. As such, results for reporting periods beginning after January 1, 2019 are presented under Topic 842, while prior period amounts are not adjusted and continue to be reported in accordance with our historical accounting under Topic 840 “Leases.” See Note 1. Organization and Summary of Significant Accounting Policies and Note 13. Leases, of the Notes to Consolidated Financial Statements included in Item 8 of our Annual Report on Form 10-K for further information. |
29
ITEM 7. | MANAGEMENT’S DISCUSSION AND ANALYSIS OF FINANCIAL CONDITION AND RESULTS OF OPERATIONS |
The following Management’s Discussion and Analysis of Financial Condition and Results of Operations (MD&A) is intended to help the reader understand our results of operations and financial condition. MD&A is provided as a supplement to, and should be read in conjunction with, our audited Consolidated Financial Statements and the accompanying Notes to Consolidated Financial Statements and other disclosures included in this Annual Report on Form 10-K (including the disclosures under Part I, Item 1A, “Risk Factors”). Additional information related to the comparison of our results of operations between the years 2018 and 2017 is included in “Item 7. Management’s Discussion and Analysis of Financial Condition and Results of Operations” of our 2018 Form 10-K filed with the SEC and is incorporated by reference into this Annual Report on Form 10-K. Our Consolidated Financial Statements have been prepared in accordance with U.S. generally accepted accounting principles and are presented in U.S. dollars.
MANAGEMENT OVERVIEW
Gilead Sciences, Inc. (Gilead, we, our or us), incorporated in Delaware on June 22, 1987, is a research-based biopharmaceutical company that discovers, develops and commercializes innovative medicines in areas of unmet medical need. With each new discovery and investigational drug candidate, we strive to transform and simplify care for people with life-threatening illnesses around the world. We have operations in more than 35 countries worldwide, with headquarters in Foster City, California. Gilead’s primary areas of focus include viral diseases, inflammatory and fibrotic diseases and oncology. We seek to add to our existing portfolio of products through our internal discovery and clinical development programs, product acquisition, in-licensing and strategic collaborations.
Our portfolio of marketed products includes AmBisome®, Atripla®, Biktarvy®, Cayston®, Complera®/Eviplera®, Descovy®, Descovy for PrEP®, Emtriva®, Epclusa®, Genvoya®, Harvoni®, Hepsera®, Letairis®, Odefsey®, Ranexa®, Sovaldi®, Stribild®, Truvada®, Truvada for PrEP®, Tybost®, Vemlidy®, Viread®, Vosevi®, Yescarta® and Zydelig®. We also sell and distribute authorized generic versions of Epclusa and Harvoni in the United States through our separate subsidiary, Asegua Therapeutics, LLC. In addition, we sell and distribute certain products through our corporate partners under collaborative agreements.
2019 Business Highlights
Our financial performance in 2019 was solid, as growth across our HIV franchise continued to drive results. We took several significant steps to position us for future growth, including an important research and development (R&D) collaboration, the introduction of a new corporate strategy and the hiring of key members of our executive leadership team. In 2019:
•We developed a new, corporate strategy to guide our work as we seek to drive growth over the next decade, with the ambitious goal of launching 10 new, transformative therapies over the next 10 years.
•We continued to make progress with our pipeline. We currently have 40 clinical-stage programs, with 14 programs either in registrational or in label-enabling studies. Of these programs, four have already received Breakthrough Therapy designation from U.S. Food and Drug Administration (FDA).
•We achieved sales of $16.4 billion across our HIV franchise in 2019, an increase of 12% from 2018, reaching another all-time high. The continued revenue growth of our HIV products was driven by the demand for Biktarvy and the increase in the number of individuals taking our products for pre-exposure prophylaxis (PrEP). At the end of 2019, Biktarvy was available in most major markets and, in the United States, approximately 27% of individuals on PrEP were receiving Descovy.
•We entered into a transformative R&D collaboration with Galapagos NV (Galapagos) in July, building on an existing partnership, and effectively enabling us to double our R&D footprint and accelerate our development of novel treatments for inflammatory and fibrotic diseases. We submitted a regulatory filing for filgotinib to FDA, and the compound is now under priority review for rheumatoid arthritis (RA). We also submitted filgotinib for approval in Europe and Japan and actively prepared for competitive launches in all three regions. We and Galapagos continued to advance the Phase 3 study of GLPG-1690 for the treatment of idiopathic pulmonary fibrosis. With regard to nonalcoholic steatohepatitis (NASH), after the STELLAR and ATLAS studies failed to reach their primary endpoints, we continued to work to understand the results to determine appropriate next steps for these therapies, including the potential for combination therapeutic approaches.
•In cell therapy, Kite, a Gilead company (Kite), submitted KTE-X19 for regulatory approval in the United States and Europe as a treatment for relapsed or refractory mantle cell lymphoma (MCL). If approved, Kite will be the first company with two cell therapies on the market. We also continued to demonstrate the efficacy of Yescarta. Data shared at the end of 2019 showed that approximately half of patients treated with Yescarta for refractory large B-cell lymphoma were still alive three years following treatment in the ZUMA-1 study, confirming Yescarta’s benefit/risk profile. In addition to cell therapy, we continued to grow our research portfolio in immuno-oncology.
•Our business also expanded geographically, including in China, where eight products have been approved since 2017 and four products (Vemlidy, Epclusa, Harvoni and Genvoya) have been listed on the National Reimbursement Drug List effective in January 2020.
30
During 2019, we continued to advance our product pipeline across our therapeutic areas with the goal of delivering best-in-class drugs that have the potential to improve the lives of patients with serious illnesses.
Key corporate, product, pipeline and other updates included:
Viral Diseases
• | Licensing and collaboration agreements with The Rockefeller University, Novartis AG and Lyndra Therapeutics, Inc. |
• | Approval of Vosevi and Biktarvy by the China National Medical Products Administration. |
• | Approval of a PrEP indication for Descovy by FDA. |
• | Approval of Biktarvy and Epclusa by Japan’s Ministry of Health, Labour and Welfare (MHLW). |
Inflammatory and Fibrotic Diseases
• | Collaborations with Kyverna Therapeutics, Inc. Glympse Bio, Inc., Renown Institute for Health Innovation, Goldfinch Bio, Inc., Insitro, Inc., Novo Nordisk A/S and Yuhan Corporation. |
• | Agreement with Eisai Co., Ltd. for the distribution and co-promotion of filgotinib in Japan, pending regulatory approval from Japan’s MHLW, for the treatment of RA. |
• | Submission of a New Drug Application (NDA) under priority review to FDA and submission of a NDA to Japan’s MHLW for filgotinib. |
• | Topline results from the Phase 2 ATLAS study of combination and monotherapy investigational treatments in patients with bridging fibrosis (F3) and compensated cirrhosis (F4) due to NASH. While the study did not meet its primary endpoint, we continued to analyze the ATLAS data to determine appropriate next steps for these therapies. |
• | Collaboration with Galapagos and equity investment in Galapagos to gain access to Galapagos’ current and future product portfolio. See Note 11. Collaborative and Other Arrangements of the Notes to Consolidated Financial Statements included in Item 8 of this Annual Report on Form 10-K for additional information. |
• | European Medicines Agency’s validation of the marketing authorization application for filgotinib; the application is now under evaluation by the Agency. |
Oncology
• | FDA’s acceptance of our Biologics License Application and granting Priority Review designation for KTE-X19 for the treatment of adult patients with relapsed or refractory MCL. |
• | European Medicines Agency’s validation of the marketing authorization application for KTE-X19; the application is now under evaluation by the Agency. |
• | Collaborations with Carna Biosciences Inc., Nurix Therapeutics, Inc., Humanigen, Inc. and Kiniksa Pharmaceuticals, Ltd. |
Leadership Changes
• | We have put in place a diverse, highly experienced leadership team. Senior leadership changes in 2019 included the appointment of Daniel P. O’Day as Chairman and Chief Executive Officer, Andrew D. Dickinson as Executive Vice President and Chief Financial Officer, Merdad V. Parsey as Chief Medical Officer, Christi L. Shaw as Chief Executive Officer of Kite, Johanna Mercier as Chief Commercial Officer; the departures of John G. McHutchison, Chief Scientific Officer and Head of Research and Development, Gregg H. Alton, Chief Patient Officer, and Katie L. Watson, Executive Vice President, Human Resources; and the planned retirement of Robin L. Washington from her role as Executive Vice President and Chief Financial Officer. |
Other
• | Donation to the U.S. Centers for Disease Control and Prevention of up to 2.4 million bottles of Truvada and Descovy annually until 2030 for uninsured Americans at risk for HIV. |
2019 Financial Highlights
Total revenues increased to $22.4 billion and total product sales increased to $22.1 billion in 2019, compared to $22.1 billion and $21.7 billion in 2018, respectively, primarily due to higher sales of our HIV products, partially offset by lower sales of Ranexa and Letairis and our HCV products. In the United States, product sales were $16.6 billion in 2019, compared to $16.2 billion in 2018. In Europe, product sales were $3.6 billion in 2019, compared to $3.7 billion in 2018. Product sales in other international locations were $2.0 billion in 2019, compared to $1.8 billion in 2018.
Cost of goods sold decreased to $4.7 billion in 2019, compared to $4.9 billion in 2018, primarily due to $259 million of lower royalty expenses, and lower amortization expenses related to intangible assets associated with Ranexa, partially offset by higher inventory write-downs. In 2019 and 2018, we recorded write-downs of $547 million and $440 million, respectively, for
31
slow moving and excess raw material and work in process inventory primarily due to lower long-term demand for our HCV products.
R&D expenses increased to $9.1 billion in 2019, compared to $5.0 billion in 2018, primarily due to up-front collaboration and licensing expenses of $3.9 billion related to our collaboration with Galapagos as well as higher personnel costs largely to support our cell therapy business, partially offset by lower stock-based compensation expense. In 2019 and 2018, we recorded impairment charges of $800 million and $820 million, respectively, related to in-process R&D (IPR&D) intangible assets acquired in connection with the acquisition of Kite Pharma, Inc.
Selling, general and administrative (SG&A) expenses increased to $4.4 billion in 2019, compared to $4.1 billion in 2018, primarily due to promotional expenses in the United States and expenses associated with the expansion of our business in Japan and China, partially offset by lower stock-based compensation expense.
Net income attributable to Gilead changed to $5.4 billion or $4.22 per diluted share in 2019, compared to $5.5 billion or $4.17 per diluted share in 2018, primarily due to pre-tax up-front collaboration and licensing expenses of $3.9 billion related to our collaboration with Galapagos, partially offset by the net favorable fluctuation in tax effects of intra-entity intangible asset transfers to different tax jurisdictions and an increase in net unrealized gains from equity securities. The year-over-year diluted earnings per share were favorably impacted by our stock repurchase activities.
As of December 31, 2019, we had $25.8 billion of cash, cash equivalents and marketable debt securities compared to $31.5 billion as of December 31, 2018. During 2019, we generated $9.1 billion in operating cash flow and paid $5.6 billion in connection with the collaboration with and equity investments in Galapagos, which was classified as cash flows from investing activities. We also repaid $2.8 billion of principal amount of debt, paid cash dividends of $3.2 billion and utilized $1.7 billion on repurchases of common stock in 2019.
Strategy and Outlook 2020
Our focus is to create possibilities for patients through scientific breakthroughs and innovation, by leveraging our pillars of a durable core business, existing pipeline opportunities and our strategy to drive additional growth. Our strategy includes ambitions and priorities, which enable us to achieve those ambitions. Our strategic ambitions define what success looks like over the next decade and are summarized as (i) bring 10+ transformative therapies to patients by 2030; (ii) be the biotech employer and partner of choice; and (iii) deliver shareholder value in a sustainable and responsible manner. Our strategic priorities reflect how we will deliver those ambitions: (i) expand internal and external innovation; (ii) strengthen portfolio strategy and decision making; (iii) increase patient benefit and access; and (iv) continue to evolve our culture.
In 2020, we expect underlying growth in our base business, which is expected to offset the full-year impact of our cardiopulmonary products loss of exclusivity, which occurred in 2019, and the initial generic version of Truvada in the United States in late 2020. We will also continue to invest to support the growth of Biktarvy, our Descovy for PrEP launch, preparation for competitive launches of filgotinib in RA in the United States, Japan and Europe, and continued investments in our pipeline, cell therapy and external partnerships. Our overall plan is now guided by our newly established corporate strategy that provides focus and guides resource and capital allocation priorities. We expect data read-outs in 2020 including filgotinib for ulcerative colitis, KTE-X19 for acute lymphoblastic leukemia (ALL), axicabtagene ciloleucel CD19 for indolent B-cell non-Hodgkin lymphoma (iNHL) and second line diffuse large B-cell lymphoma and GLPG-1972 for osteoarthritis. To further augment our product pipeline, we continue to pursue opportunities for collaborations, partnerships and strategic investments that fit into our long-term strategic plan.
Our progress on all of these initiatives is subject to a number of uncertainties, including, but not limited to, the possibility of unfavorable results from new and ongoing clinical trials; the continuation of an uncertain global macroeconomic environment; additional pricing pressures from payers and competitors; slower than anticipated growth in our HIV products; an increase in discounts, chargebacks and rebates due to ongoing contracts and future negotiations with commercial and government payers; market share and price erosion caused by the introduction of generic versions of products containing tenofovir disoproxil fumarate (TDF) outside the United States and Viread, Letairis and Ranexa in the United States; inaccuracies in our HCV patient start estimates; potential amendments to the Affordable Care Act or other government action that could have the effect of lowering prices; a larger-than anticipated shift in payer mix to more highly discounted payer segment; and volatility in foreign currency exchange rates.
32
RESULTS OF OPERATIONS
Total Revenues
The following table summarizes the period-over-period changes in our revenues:
(In millions, except percentages) | 2019 | Change | 2018 | Change | 2017 | |||||||||||||
Revenues: | ||||||||||||||||||
Product sales | $ | 22,119 | 2 | % | $ | 21,677 | (16 | )% | $ | 25,662 | ||||||||
Royalty, contract and other revenues | 330 | (27 | )% | 450 | 1 | % | 445 | |||||||||||
Total revenues | $ | 22,449 | 1 | % | $ | 22,127 | (15 | )% | $ | 26,107 | ||||||||
Product Sales
2019 Compared to 2018
Total product sales increased by 2% to $22.1 billion in 2019, compared to $21.7 billion in 2018, primarily due to higher sales of our HIV products, partially offset by lower sales of Ranexa and Letairis and our HCV products.
HIV product sales increased by 12% to $16.4 billion in 2019, compared to $14.6 billion in 2018, primarily due to higher sales volume as a result of the continued uptake of Biktarvy. The increase was partially offset by decreases in sales volumes of Genvoya and our Truvada (emtricitabine (FTC)/TDF)-based products and lower average net selling price.
HCV product sales decreased by 20% to $2.9 billion in 2019, compared to $3.7 billion in 2018, primarily due to lower average net selling price, including a decline in U.S. Medicare prices in 2019.
Yescarta sales increased by 73% to $456 million in 2019, compared to $264 million in 2018, primarily due to a higher number of therapies provided to patients and the continued expansion in Europe.
Other product sales, which include Vemlidy, Viread, Letairis, Ranexa, Zydelig, AmBisome and Cayston, decreased by 26% to $2.3 billion in 2019, compared to $3.1 billion in 2018, primarily due to the expected decline in sales of Ranexa and Letairis after the entry of generic versions in the United States in early 2019.
Of our total product sales, 25% were generated outside the United States in 2019. We faced exposure to movements in foreign currency exchange rates, primarily in the Euro. We used foreign currency exchange contracts to hedge a percentage of our foreign currency exposure. Foreign currency exchange, net of hedges, had an immaterial impact on our product sales in 2019, based on a comparison using foreign currency exchange rates from 2018.
We record product sales net of estimated government and other rebates and chargebacks, cash discounts for prompt payment, distributor fees and other related costs. These deductions are generally referred to as gross-to-net deductions, which totaled $15.3 billion, or 41% of gross product sales in 2019, compared to $16.5 billion, or 43% of gross product sales in 2018. Of the $15.3 billion in 2019, $13.5 billion or 36% of gross product sales in 2019 was related to government and other rebates and chargebacks, and $1.8 billion was related to cash discounts for prompt payment, distributor fees and other related costs.
Product sales in the United States increased by 2% to $16.6 billion in 2019, compared to $16.2 billion in 2018, primarily due to higher sales of our HIV products, partially offset by lower sales of Ranexa and Letairis following the entry of generic versions in 2019 and lower sales of our HCV products. The increase in sales of our HIV products was primarily due to the continued uptake of Biktarvy and an increase in the number of individuals taking PrEP, partially offset by the decreases in sales volumes of our other HIV products including Genvoya, Atripla and Stribild. The decrease in sales of our HCV products was primarily due to lower average net selling price, including a decline in U.S. Medicare prices in 2019.
Product sales in Europe decreased by 3% to $3.6 billion in 2019, compared to $3.7 billion in 2018, primarily due to lower sales of our HCV products and the broader availability of generic versions of Truvada and Atripla. The decrease in sales of our HCV products was primarily due to lower patient starts and lower average net selling price. The decrease was partially offset by the continued uptake of Biktarvy, Odefsey and Yescarta, and favorable net adjustments for government rebates related to sales made in prior years.
Product sales in other international locations increased by 11% to $2.0 billion in 2019, compared to $1.8 billion in 2018, primarily due to higher HIV product sales in Japan, as a result of acquiring the rights to certain products in our HIV portfolio in Japan effective January 1, 2019, and higher HCV product sales in Japan due to the launch of Epclusa in 2019.
33
The following table summarizes the period-over-period changes in our product sales:
(In millions, except percentages) | 2019 | Change | 2018 | Change | 2017 | |||||||||||||
Atripla | $ | 600 | (50 | )% | $ | 1,206 | (33 | )% | $ | 1,806 | ||||||||
Biktarvy | 4,738 | * | 1,184 | * | — | |||||||||||||
Complera/Eviplera | 406 | (38 | )% | 653 | (32 | )% | 966 | |||||||||||
Descovy | 1,500 | (5 | )% | 1,581 | 30 | % | 1,218 | |||||||||||
Genvoya | 3,931 | (15 | )% | 4,624 | 26 | % | 3,674 | |||||||||||
Odefsey | 1,655 | 4 | % | 1,598 | 44 | % | 1,106 | |||||||||||
Stribild | 369 | (43 | )% | 644 | (39 | )% | 1,053 | |||||||||||
Truvada | 2,813 | (6 | )% | 2,997 | (4 | )% | 3,134 | |||||||||||
Other HIV(1) | 47 | (23 | )% | 61 | 5 | % | 58 | |||||||||||
Revenue share - Symtuza(2) | 379 | * | 79 | * | — | |||||||||||||
Total HIV | 16,438 | 12 | % | 14,627 | 12 | % | 13,015 | |||||||||||
AmBisome | 407 | (3 | )% | 420 | 15 | % | 366 | |||||||||||
Ledipasvir/Sofosbuvir(3) | 643 | (47 | )% | 1,222 | (72 | )% | 4,370 | |||||||||||
Letairis | 618 | (34 | )% | 943 | 6 | % | 887 | |||||||||||
Ranexa | 216 | (72 | )% | 758 | 6 | % | 717 | |||||||||||
Sofosbuvir/Velpatasvir(4) | 1,965 | — | % | 1,966 | (44 | )% | 3,510 | |||||||||||
Vemlidy | 488 | 52 | % | 321 | * | 122 | ||||||||||||
Viread | 243 | (21 | )% | 307 | (71 | )% | 1,046 | |||||||||||
Vosevi | 257 | (35 | )% | 396 | 35 | % | 293 | |||||||||||
Yescarta | 456 | 73 | % | 264 | * | 7 | ||||||||||||
Zydelig | 103 | (23 | )% | 133 | (11 | )% | 149 | |||||||||||
Other(5) | 285 | (11 | )% | 320 | (73 | )% | 1,180 | |||||||||||
Total product sales | $ | 22,119 | 2 | % | $ | 21,677 | (16 | )% | $ | 25,662 | ||||||||
_________________________________________ | |
* | Percentage is greater than 100% |
(1) | Includes Emtriva and Tybost |
(2) | Represents our revenue from cobicistat (C), emtricitabine (FTC) and tenofovir alafenamide (TAF) in Symtuza (darunavir/C/FTC/TAF), a fixed dose combination product commercialized by Janssen Sciences Ireland UC |
(3) | Amounts consist of sales of Harvoni and the authorized generic version of Harvoni sold by our separate subsidiary, Asegua Therapeutics LLC |
(4) | Amounts consist of sales of Epclusa and the authorized generic version of Epclusa sold by our separate subsidiary, Asegua Therapeutics LLC |
(5) | Includes Cayston, Hepsera and Sovaldi |
The following is additional discussion of sales of our HIV and HCV products:
• | Descovy (FTC/TAF)-based products: Biktarvy, Descovy, Genvoya, Odefsey and Revenue Share - Symtuza |
The following table summarizes the period-over-period changes in our sales of Descovy (FTC/TAF)-based products:
(In millions, except percentages) | 2019 | Change | 2018 | Change | 2017 | |||||||||||||
U.S. | $ | 9,716 | 34 | % | $ | 7,261 | 47 | % | $ | 4,955 | ||||||||
Europe | 1,857 | 22 | % | 1,528 | 71 | % | 892 | |||||||||||
Other locations | 630 | 127 | % | 277 | 83 | % | 151 | |||||||||||
Total | $ | 12,203 | 35 | % | $ | 9,066 | 51 | % | $ | 5,998 | ||||||||
% of total product sales | 55 | % | 42 | % | 23 | % | ||||||||||||
% of HIV product sales | 74 | % | 62 | % | 46 | % | ||||||||||||
Descovy (FTC/TAF)-based product sales increased in all major markets in 2019 compared to 2018. The increase in both the United States and Europe was primarily due to higher demand and a shift in product mix toward Biktarvy. The increase in other international locations was primarily due to higher product sales in Japan as a result of acquiring the rights to certain products in our HIV portfolio in Japan effective January 1, 2019.
34
• | Truvada (FTC/TDF)-based products: Atripla, Complera/Eviplera, Stribild and Truvada |
The following table summarizes the period-over-period changes in our sales of Truvada (FTC/TDF)-based products:
(In millions, except percentages) | 2019 | Change | 2018 | Change | 2017 | |||||||||||||
U.S. | $ | 3,569 | (18 | )% | $ | 4,353 | (9 | )% | $ | 4,771 | ||||||||
Europe | 450 | (45 | )% | 815 | (51 | )% | 1,677 | |||||||||||
Other locations | 169 | (49 | )% | 332 | (35 | )% | 511 | |||||||||||
Total | $ | 4,188 | (24 | )% | $ | 5,500 | (21 | )% | $ | 6,959 | ||||||||
% of total product sales | 19 | % | 25 | % | 27 | % | ||||||||||||
Truvada (FTC/TDF)-based product sales decreased in the United States and Europe in 2019 compared to 2018. The decrease in U.S. sales was primarily due to lower sales volume as a result of patients switching to newer regimens containing FTC/TAF, partially offset by the increased usage of Truvada for PrEP. The decrease in Europe sales was primarily due to lower sales volumes of Truvada and Atripla as a result of the broader availability of generic versions and patients switching to newer regimens containing FTC/TAF. We expect a decline in our sales of Truvada in the United States as patients switch to Descovy for PrEP from Truvada for PrEP and the expected entry of generic versions in late 2020.
• | HCV products: Epclusa, Harvoni, Sovaldi, Vosevi and Authorized Generics of Epclusa and Harvoni |
The following table summarizes the period-over-period changes in our sales of HCV products:
(In millions, except percentages) | 2019 | Change | 2018 | Change | 2017 | |||||||||||||
U.S. | $ | 1,465 | (28 | )% | $ | 2,023 | (65 | )% | $ | 5,854 | ||||||||
Europe | 742 | (17 | )% | 896 | (52 | )% | 1,853 | |||||||||||
Other locations | 729 | (5 | )% | 767 | (46 | )% | 1,430 | |||||||||||
Total | $ | 2,936 | (20 | )% | $ | 3,686 | (60 | )% | $ | 9,137 | ||||||||
% of total product sales | 13 | % | 17 | % | 36 | % | ||||||||||||
The decrease in HCV product sales in the United States in 2019 compared to 2018 was primarily due to lower average net selling price, including a decline in U.S. Medicare prices in 2019. The decrease in HCV product sales in Europe in 2019 compared to 2018 was primarily due to lower patient starts and lower average net selling price, partially offset by favorable net adjustments for government rebates and discounts related to sales made in prior years. The decrease in HCV product sales in other international locations in 2019 compared to 2018 was primarily due to lower sales of Sovaldi, partially offset by higher sales of Epclusa.
Cost of Goods Sold and Product Gross Margin
The following table summarizes the period-over-period changes in our product sales, cost of goods sold and product gross margin:
(In millions, except percentages) | 2019 | Change | 2018 | Change | 2017 | |||||||||||||
Total product sales | $ | 22,119 | 2 | % | $ | 21,677 | (16 | )% | $ | 25,662 | ||||||||
Cost of goods sold | $ | 4,675 | (4 | )% | $ | 4,853 | 11 | % | $ | 4,371 | ||||||||
Product gross margin | 79 | % | 78 | % | 83 | % | ||||||||||||
In 2019, cost of goods sold decreased by $178 million compared to 2018, primarily due to lower royalty expenses and lower amortization expense related to the intangible assets associated with Ranexa, which was fully amortized in the first quarter of 2019, partially offset by higher inventory write-downs. In 2019, we recorded inventory write-downs of $649 million, of which $547 million was related to slow moving and excess raw material and work in process inventory primarily due to lower long-term demand for our HCV products. In 2018, we recorded inventory write-downs of $572 million, of which $440 million was related to excess raw materials primarily due to a sustained decrease in demand for Harvoni as a result of a shift in the market from Harvoni to Epclusa. Royalty expenses decreased by $259 million in 2019, compared to 2018, primarily due to lower sales of Atripla, Ranexa, Letairis and products containing elvitegravir.
Research and Development Expenses
The following table summarizes the period-over-period changes in our R&D expenses:
(In millions, except percentages) | 2019 | Change | 2018 | Change | 2017 | |||||||||||||
R&D expenses | $ | 9,106 | 81 | % | $ | 5,018 | 34 | % | $ | 3,734 | ||||||||
35
R&D expenses consist primarily of clinical studies performed by contract research organizations, materials and supplies, payments under collaborative and other arrangements, including up-front and milestone payments, licenses and fees, as well as expense reimbursements to the collaboration partners, IPR&D impairment charges, personnel costs, including salaries, benefits and stock-based compensation expense, and overhead allocations consisting of various support and infrastructure costs.
We do not track total R&D expenses by product candidate, therapeutic area or development phase. However, we manage our R&D expenses by identifying the R&D activities we anticipate will be performed during a given period and then prioritizing efforts based on scientific data, probability of technical and regulatory successful development, market potential, available human and capital resources and other considerations. We continually review our R&D projects based on unmet medical need and, as necessary, reallocate resources among our internal R&D portfolio and external opportunities that we believe will best support the long-term growth of our business.
The following table provides a breakout of our R&D expenses by major cost type:
(In millions, except percentages) | 2019 | Change | 2018 | Change | 2017 | |||||||||||||
Up-front collaboration and licensing expenses | $ | 4,251 | * | $ | 278 | 25 | % | $ | 222 | |||||||||
Personnel, infrastructure and other expenses | 2,016 | 7 | % | 1,876 | 34 | % | 1,399 | |||||||||||
Clinical studies and outside services | 1,750 | 5 | % | 1,665 | (11 | )% | 1,881 | |||||||||||
IPR&D impairment charges | 800 | (2 | )% | 820 | * | — | ||||||||||||
Stock-based compensation expenses | 289 | (24 | )% | 379 | 63 | % | 232 | |||||||||||
Total | $ | 9,106 | 81 | % | $ | 5,018 | 34 | % | $ | 3,734 | ||||||||
_________________________________________ | |
* | Percentage is greater than 100% |
In 2019, R&D expenses increased by $4.1 billion compared to 2018, primarily due to $3.9 billion of up-front collaboration and licensing expenses related to our collaboration with Galapagos as well as higher personnel costs largely to support our cell therapy business and increased investment in our research projects, partially offset by lower stock-based compensation expense.
In 2019, we recorded an impairment charge of $800 million related to IPR&D intangible assets acquired in connection with our acquisition of Kite Pharma, Inc. primarily for the treatment of indolent non-Hodgkin lymphoma largely driven by changes in the estimated market opportunities as new therapies or combinations of existing therapies were approved. In 2018, we recorded an impairment charge of $820 million related to IPR&D intangible assets for the KITE-585 program (an anti-B cell maturation antigen being evaluated for the treatment of multiple myeloma) due to its discontinuance.
Stock-based compensation expense for 2019 decreased by $90 million, compared to 2018, primarily due to the 2018 impact of stock-based compensation expense associated with our acquisition of Kite Pharma, Inc.
Selling, General and Administrative Expenses
The following table summarizes the period-over-period changes in our SG&A expenses:
(In millions, except percentages) | 2019 | Change | 2018 | Change | 2017 | |||||||||||||
SG&A expenses | $ | 4,381 | 8 | % | $ | 4,056 | 5 | % | $ | 3,878 | ||||||||
SG&A expenses relate to sales and marketing, finance, human resources, legal and other administrative activities. Expenses consist primarily of personnel costs, facilities and overhead costs, outside marketing, advertising and legal expenses and other general and administrative costs. SG&A expenses also include the Branded Prescription Drug (BPD) fee. In the United States, we, along with other pharmaceutical manufacturers of branded drug products, are required to pay a portion of the BPD fee, which is estimated based on select government sales during the prior year as a percentage of total industry government sales and is trued-up upon receipt of invoices from the Internal Revenue Service.
In 2019, SG&A expenses increased by $325 million compared to 2018, primarily due to higher promotional expenses in the United States and expenses associated with the expansion of our business in Japan and China, partially offset by lower stock-based compensation expense. Stock-based compensation expense for 2019 decreased by $106 million, compared to 2018, primarily due to the 2018 impact of stock-based compensation expense associated with our acquisition of Kite Pharma, Inc.
BPD fee expenses were $247 million, $229 million and $385 million in 2019, 2018 and 2017, respectively. BPD fee expenses are not tax-deductible.
36
Other Income (Expense), Net
The following table summarizes the period-over-period changes in our Other income (expense), net:
(In millions, except percentages) | 2019 | Change | 2018 | Change | 2017 | |||||||||||||
Other income (expense), net | $ | 1,868 | 176 | % | $ | 676 | 29 | % | $ | 523 | ||||||||
The change in Other income (expense), net in 2019, compared to 2018, was primarily due to higher net unrealized gains of $1.1 billion from changes in the fair value of our equity securities largely relating to our equity investments in Galapagos. Starting in January 2018, we recorded unrealized gains (losses) from changes in the fair value of our marketable equity securities in Other income (expense), net, on our Consolidated Statements of Income as a result of the adoption of Accounting Standards Update No. 2016-01 “Financial Instruments - Overall: Recognition and Measurement of Financial Assets and Financial Liabilities.”
Provision for Income Taxes
The following table summarizes the period-over-period changes in our Provision for income taxes:
(In millions, except percentages) | 2019 | Change | 2018 | Change | 2017 | |||||||||||||
Effective tax rate | (4.0 | )% | (34.0 | )% | 30.0 | % | (35.7 | )% | 65.7 | % | ||||||||
Provision for income taxes | $ | (204 | ) | $ | 2,339 | $ | 8,885 | |||||||||||
The decrease in effective tax rate and provision for income taxes in 2019, compared to 2018, was primarily due to a $1.2 billion deferred tax benefit in 2019 related to intangible asset transfers from a foreign subsidiary to Ireland and the United States. The 2018 effective tax rate included a $588 million deferred tax charge resulting from a transfer of acquired intangible assets from a foreign subsidiary to the United States.
The decrease in effective tax rate and provision for income taxes in 2018, compared to 2017, was primarily due to a $5.5 billion net tax charge in 2017 and a reduction to the U.S. corporate tax rate in 2018 as a result of the enactment of the Tax Cuts and Jobs Act (Tax Reform) in December 2017. The 2018 effective tax rate was further decreased due to a $202 million tax benefit recorded in 2018 related to settlement of tax examinations, offset by the $588 million deferred tax charge in 2018 discussed above, changes to the geographic mix of earnings and the tax on Global Intangible Low-Taxed Income (enacted as part of Tax Reform).
See Note 19. Income Taxes of the Notes to Consolidated Financial Statements included in Item 8 of this Annual Report on Form 10-K for additional details on Tax Reform.
LIQUIDITY AND CAPITAL RESOURCES
The following table summarizes our cash, cash equivalents, and marketable debt securities and working capital:
December 31, | |||||||||
(In millions) | 2019 | 2018 | |||||||
Cash, cash equivalents and marketable debt securities | $ | 25,840 | $ | 31,512 | |||||
Working capital | $ | 20,537 | $ | 25,231 | |||||
Cash, Cash Equivalents and Marketable Debt Securities
Cash, cash equivalents and marketable debt securities decreased by $5.7 billion, or 18%, compared to December 31, 2018. During 2019, we generated $9.1 billion in operating cash flow, paid $5.6 billion in connection with our collaboration with and equity investments in Galapagos, repaid $2.8 billion of debt, paid cash dividends of $3.2 billion and repurchased 26 million shares of our common stock for $1.7 billion through open market transactions.
Working Capital
Working capital decreased by $4.7 billion, or 19%, compared to December 31, 2018, primarily due to the use of cash noted above under the heading Cash, Cash Equivalents and Marketable Debt Securities.
37
Cash Flows
The following table summarizes our cash flow activities:
(In millions) | 2019 | 2018 | 2017 | ||||||||||
Cash provided by (used in): | |||||||||||||
Operating activities | $ | 9,144 | $ | 8,400 | $ | 11,898 | |||||||
Investing activities | $ | (7,817 | ) | $ | 14,355 | $ | (16,069 | ) | |||||
Financing activities | $ | (7,634 | ) | $ | (12,318 | ) | $ | 3,393 | |||||
Cash Provided by Operating Activities
Cash provided by operating activities represents the cash receipts and disbursements related to all of our activities other than investing and financing activities. Operating cash flow is derived by adjusting our net income for non-cash items and changes in operating assets and liabilities. Cash provided by operating activities increased by $744 million to $9.1 billion in 2019 compared to 2018, primarily due to lower tax payments in 2019, partially offset by lower collections on accounts receivable in 2019 and the collection of a receivable from Bristol-Myers Squibb Company in 2018 following the termination of a collaboration pursuant to the terms of the existing agreements. The tax payments made in 2018 included a $500 million payment related to the first annual installment of the Tax Reform transition tax, a $771 million deemed early payment of the Tax Reform transition tax and a $514 million settlement of a tax examination.
Starting in 2019, up-front and milestone payments related to collaborative and other arrangements are classified as cash flows from investing activities in our Consolidated Statements of Cash Flows. Comparative prior year amounts were not material and were not reclassified to investing activities from operating activities.
Cash Provided by (Used in) Investing Activities
Cash provided by (used in) investing activities primarily consists of purchases, sales and maturities of our marketable debt securities, capital expenditures, up-front and milestone payments related to collaborative and other arrangements, purchases of equity securities and other investments. Cash used in investing activities was $7.8 billion in 2019 compared to cash provided by investing activities of $14.4 billion in 2018. The change in cash provided by (used in) investing activities was primarily due to higher purchases of marketable debt securities and the $5.6 billion payments made in connection with our collaboration with and equity investments in Galapagos, partially offset by higher proceeds from sales of marketable debt securities. The higher purchases of marketable debt securities were the result of a shift in our investment strategy to investing in longer dated securities in 2019 compared to 2018. In addition, we paid Japan Tobacco Inc. $365 million during 2019 in connection with acquiring the rights to market and distribute certain HIV products in Japan.
Cash provided by investing activities was $14.4 billion in 2018 compared to cash used in investing activities of $16.1 billion in 2017. The change in cash provided by (used in) investing activities was primarily due to higher proceeds from maturities of our marketable debt securities and lower purchases of marketable debt securities, partially offset by lower proceeds from sales of our marketable debt securities. In addition, $10.4 billion cash was used to acquire Kite Pharma, Inc. in 2017, whereas no cash was used for business combinations in 2018.
Cash Provided by (Used in) Financing Activities
Cash used in financing activities decreased by $4.7 billion to $7.6 billion in 2019 compared to 2018, primarily due to $3.5 billion lower repayments of debt and $1.2 billion lower repurchases of our common stock during 2019.
Cash used in financing activities was $12.3 billion in 2018, compared to cash provided by financing activities of $3.4 billion in 2017. The change in cash provided by (used in) financing activities was primarily due to higher repayment of debt and repurchases of our common stock in 2018. In addition, we had $9.0 billion net proceeds from debt issuances to partially fund our acquisition of Kite Pharma, Inc. in 2017, whereas no debt was issued in 2018.
Debt and Credit Facilities
In 2019 and 2018, we repaid at maturity $2.8 billion and $1.8 billion principal amount of senior unsecured notes, respectively. In addition, in 2018, we repaid $4.5 billion borrowed under our term loan facility credit agreement, at which time the term loan facility credit agreement was terminated. In February 2020, we repaid at maturity $500 million principal amount of senior unsecured notes.
As of December 31, 2019, no amounts were outstanding under our $2.5 billion five-year revolving credit facility maturing in May 2021.
38
We are required to comply with certain covenants under our notes indentures, and as of December 31, 2019, we were not in violation of any covenants.
The summary of our borrowings under various financing arrangements is included in Note 12. Debt and Credit Facilities of the Notes to Consolidated Financial Statements included in Item 8 of this Annual Report on Form 10-K.
Capital Return Program
The details of our Stock Repurchase Programs and Dividends are included in Note 15. Stockholders’ Equity of the Notes to Consolidated Financial Statements included in Item 8 of this Annual Report on Form 10-K.
Stock Repurchase Programs
In the first quarter of 2016, our Board of Directors authorized a $12.0 billion stock repurchase program (2016 Program), under which repurchases may be made in the open market or in privately negotiated transactions. We started repurchases under the 2016 Program in April 2016.
Repurchases under the 2016 Program were 26 million and 40 million shares of our common stock for $1.7 billion and $2.9 billion in 2019 and 2018, respectively. As of December 31, 2019, the remaining authorized repurchase amount under the 2016 Program was $3.4 billion.
In the first quarter of 2020, our Board of Directors authorized a new $5.0 billion stock repurchase program (2020 Program), which will commence upon the completion of the 2016 Program. Purchases under the 2020 Program may be made in the open market or in privately negotiated transactions.
Dividends
We declared and paid quarterly cash dividends for an aggregate amount of $3.2 billion or $2.52 per share of our common stock and $3.0 billion or $2.28 per share of our common stock in 2019 and 2018, respectively.
On February 4, 2020, we announced that our Board of Directors declared a quarterly cash dividend increase of 8% from $0.63 to $0.68 per share of our common stock, with a payment date of March 30, 2020 to all stockholders of record as of the close of business on March 13, 2020. Future dividends are subject to declaration by the Board of Directors.
Capital Resources
We believe our existing capital resources, supplemented by cash flows generated from our operations, will be adequate to satisfy our capital needs for the foreseeable future. Our future capital requirements will depend on many factors, including but not limited to the following:
• | the commercial performance of our current and future products; |
• | the progress and scope of our R&D efforts, including preclinical studies and clinical trials; |
• | the cost, timing and outcome of regulatory reviews; |
• | the expansion of our sales and marketing capabilities; |
• | the possibility of acquiring additional manufacturing capabilities or office facilities; |
• | the possibility of acquiring other companies or new products; |
• | debt service requirements; |
• | the establishment of additional collaborative relationships with other companies; and |
• | costs associated with the defense, settlement and adverse results of government investigations and litigation. |
We may in the future require additional funding, which could be in the form of proceeds from equity or debt financings. If such funding is required, we cannot guarantee that it will be available to us on favorable terms, if at all.
39
CRITICAL ACCOUNTING POLICIES, ESTIMATES AND JUDGMENTS
The discussion and analysis of our financial condition and results of operations is based on our Consolidated Financial Statements included in Item 8 of this Annual Report on Form 10-K, which have been prepared in accordance with U.S. generally accepted accounting principles. The preparation of these financial statements requires us to make estimates and judgments that affect the reported amounts of assets, liabilities, revenues and expenses and related disclosures. On an ongoing basis, we evaluate and base our estimates on historical experience and on various other market specific and other relevant assumptions that we believe to be reasonable under the circumstances, the results of which form the basis for making judgments about the carrying values of assets and liabilities that are not readily apparent from other sources. Actual results may differ significantly from these estimates.
We believe the following critical accounting policies reflect the more significant judgments and estimates used in the preparation of our Consolidated Financial Statements.
Revenue Recognition
Product Sales
We recognize revenue from product sales when control of the product transfers, generally upon shipment or delivery, to the customer, or in certain cases, upon the corresponding sales by our customer to a third party. Upon recognition of revenue from product sales, provisions are made for various forms of variable consideration, which include government and other rebates such as Medicaid reimbursements, customer incentives such as cash discounts for prompt payment, distributor fees and expected returns of expired products, as appropriate. Variable consideration is included in the net sales price only to the extent a significant reversal in the amount of cumulative revenue recognized is not probable of occurring when the uncertainty associated with the variable consideration is subsequently resolved. Government and other rebates and chargebacks represent the majority of our variable consideration and require complex and significant judgment by management. Estimates are assessed each period and updated to reflect current information.
Government and Other Rebates and Chargebacks
Government and other rebates and chargebacks include amounts paid to payers and healthcare providers in the United States, including Medicaid rebates, AIDS Drug Assistance Program rebates and chargebacks, Veterans Administration and Public Health Service chargebacks and other rebates, as well as foreign government rebates. Rebates and chargebacks are based on contractual arrangements or statutory requirements which may vary by product, by payer and individual payer plans.
For qualified programs that can purchase our products through wholesalers or other distributors at a lower contractual price, the wholesalers or distributors charge back to us the difference between their acquisition cost and the lower contractual price.
Our allowances for government and other rebates and chargebacks are estimated based on products sold, historical payer mix, and as available, pertinent third-party industry information, estimated patient population, known market events or trends, and for our U.S. product sales, channel inventory data obtained from our major U.S. wholesalers in accordance with our inventory management agreements. We also take into consideration, as available, new information regarding changes in programs’ regulations and guidelines that would impact the amount of the actual rebates and/or our expectations regarding future payer mix for these programs. We believe the methodology that we use to estimate our government and other rebates and chargebacks is reasonable and appropriate given the current facts and circumstances. However, actual results may differ significantly from our estimates. Historically, our actual government rebates and chargebacks claimed for prior periods have varied by less than 5% from our estimates.
Government and other chargebacks that are payable to our direct customers are classified as reductions of Accounts receivable in our Consolidated Balance Sheets and totaled $655 million and $492 million at December 31, 2019 and 2018, respectively. Government and other rebates that are payable to third party payers and healthcare providers are recorded in Accrued government and other rebates on our Consolidated Balance Sheets and totaled $3.5 billion and $3.9 billion at December 31, 2019 and 2018, respectively.
40
The following table summarizes the consolidated activities and ending balances in our government and other rebates and chargebacks accounts:
(in millions) | Balance at Beginning of Year | Decrease/(Increase) to Product Sales | Payments | Balance at End of Year | ||||||||||||
Year ended December 31, 2019: | ||||||||||||||||
Activity related to 2019 sales | $ | — | $ | 13,791 | $ | (9,920 | ) | $ | 3,871 | |||||||
Activity related to sales prior to 2019 | 4,420 | (279 | ) | (3,904 | ) | 237 | ||||||||||
Total | $ | 4,420 | $ | 13,512 | $ | (13,824 | ) | $ | 4,108 | |||||||
Year ended December 31, 2018: | ||||||||||||||||
Activity related to 2018 sales | $ | — | $ | 14,784 | $ | (10,953 | ) | $ | 3,831 | |||||||
Activity related to sales prior to 2018 | 5,044 | 41 | (4,496 | ) | 589 | |||||||||||
Total | $ | 5,044 | $ | 14,825 | $ | (15,449 | ) | $ | 4,420 | |||||||
Legal Contingencies
We are a party to various legal actions. The most significant of these are described in Note 14. Commitments and Contingencies - Legal Proceedings of the Notes to Consolidated Financial Statements included in Item 8 of this Annual Report on Form 10-K. It is not possible to determine the outcome of these matters. We recognize accruals for such actions to the extent that we conclude that a loss is both probable and reasonably estimable. We accrue for the best estimate of a loss within a range; however, if no estimate in the range is better than any other, then we accrue the minimum amount in the range. If we determine that a loss is reasonably possible and the loss or range of loss can be estimated, we disclose the possible loss.
Significant judgment is required in both the determination of probability and the determination as to whether an exposure is reasonably estimable. Because of the inherent uncertainty and unpredictability related to these matters, accruals are based on what we believe to be the best information available at the time of our assessment, including the legal facts and circumstances of the case, status of the proceedings, applicable law and the views of legal counsel. Upon the final resolution of such matters, it is possible that there may be a loss in excess of the amount recorded, and such amounts could have a material adverse effect on our results of operations, cash flows or financial position. We periodically reassess these matters when additional information becomes available and adjust our estimates and assumptions when facts and circumstances indicate the need for any changes. We did not have any material accruals in our Consolidated Balance Sheets for such matters as of December 31, 2019 and 2018.
Valuation of Intangible Assets
We have acquired, and expect to continue to acquire, intangible assets through acquisition or consolidation of variable interest entities. The identifiable intangible assets are measured at their respective fair values as of the acquisition date and may be subject to revision within the measurement period, which may be up to one year from the acquisition date. The fair values of the assets are generally determined using a probability-weighted income approach that discounts expected future cash flows to present value. The estimated net cash flows are discounted using a discount rate that is based on the estimated weighted-average cost of capital for companies with profiles similar to our profile and represents the rate that market participants would use to value the intangible assets. The discounted cash flow models used in valuing these intangible assets require the use of significant estimates and assumptions including but not limited to:
• | estimates of revenues and operating profits related to the products or product candidates; |
• | the probability of technical and regulatory success for unapproved product candidates considering their stages of development; |
• | the time and resources needed to complete the development and approval of product candidates; |
• | the life of the potential commercialized products and associated risks, including the inherent difficulties and uncertainties in developing a product candidate such as obtaining FDA and other regulatory approvals; and |
• | risks related to the viability of and potential alternative treatments in any future target markets. |
We believe the fair values used to record intangible assets acquired are based upon reasonable estimates and assumptions given the facts and circumstances as of the related valuation dates.
Intangible assets related to IPR&D projects are considered to be indefinite-lived until the completion or abandonment of the associated R&D efforts. During the period the assets are considered indefinite-lived, they are not amortized. When development is complete, which generally occurs if and when regulatory approval to market a product is obtained, the associated assets would
41
be deemed finite-lived and then be amortized based on their respective estimated useful lives at that point in time primarily on a straight-line basis.
Intangible assets are reviewed for impairment on an annual basis as well as between annual tests if we become aware of any events or changes that would indicate that it is more likely than not that the fair values of the intangible assets and/or IPR&D projects are below their respective carrying amounts. When performing quantitative impairment assessments, we calculate the fair value using discounted cash flow models that require significant estimates and assumptions similar to the methodology for determining the acquisition date fair value of intangible assets, as described above. If the carrying value of an intangible asset exceeds its fair value, then the intangible asset is written-down to its fair value. Significant judgment is employed in determining these estimates and assumptions and changes to our estimates and assumptions could have a significant impact on our results of operations in any given period. For example, in 2019, we recognized an $800 million impairment charge related to IPR&D projects primarily for the treatment of indolent non-Hodgkin lymphoma due to changes in estimated market opportunities.
There are often major risks and uncertainties associated with IPR&D projects as we are required to obtain regulatory approvals in order to be able to market these products. Such approvals require completing clinical trials that demonstrate a product candidate is safe and effective. Consequently, the eventual realized value of the acquired IPR&D project may vary from its fair value at the date of acquisition, and IPR&D impairment charges may occur in future periods which could have a material adverse effect on our results of operations. For example, in 2018, we concluded that the KITE-585 program acquired in connection with our acquisition of Kite Pharma, Inc. did not justify further efforts based on the totality of the clinical data gathered and discontinued the program. As a result, the carrying value of the IPR&D relating to the KITE-585 program was written down to zero and we recorded an impairment charge of $820 million.
See Note 9. Intangible Assets of the Notes to Consolidated Financial Statements included in Item 8 of this Annual Report on Form 10-K for additional information on the impairment charges related to our indefinite-lived IPR&D intangible assets.
Provision for Income Taxes
We estimate our income tax provision, including deferred tax assets and liabilities, based on significant management judgment. We evaluate the realization of all or a portion of our deferred tax assets on a quarterly basis. We record a valuation allowance to reduce our deferred tax assets to the amounts that are more likely than not to be realized. We consider future taxable income, ongoing tax planning strategies and our historical financial performance in assessing the need for a valuation allowance. If we expect to realize deferred tax assets for which we have previously recorded a valuation allowance, we will reduce the valuation allowance in the period in which such determination is first made.
We are subject to income taxes in the United States and various foreign jurisdictions including Ireland. Due to economic and political conditions, various countries are actively considering and have made changes to existing tax laws. For example, the United States enacted significant tax reform, and certain provisions of the new law will continue to significantly affect us. We cannot predict the form or timing of potential legislative changes that could have a material adverse impact on our results of operations. In addition, significant judgment is required in determining our worldwide provision for income taxes.
We record liabilities related to uncertain tax positions in accordance with the guidance that clarifies the accounting for uncertainty in income taxes recognized in an enterprise’s financial statements by prescribing a minimum recognition threshold and measurement attribute for the financial statement recognition and measurement of a tax position taken or expected to be taken in a tax return. An adverse resolution of one or more of these uncertain tax positions in any period could have a material impact on the results of operations for that period.
See Note 19. Income Taxes of the Notes to Consolidated Financial Statements included in Item 8 of this Annual Report on Form 10-K for additional information.
OFF BALANCE SHEET ARRANGEMENTS
We do not have any off balance sheet arrangements as defined in Item 303(a)(4)(ii) of Regulation S-K.
42
CONTRACTUAL OBLIGATIONS
Contractual obligations represent future cash commitments related to significant enforceable and legally binding obligations and certain purchase obligations that we are likely to continue regardless of the fact that they may be cancelable. The expected timing and payment amounts presented below are estimated based on existing contracts and do not reflect any future modifications to, or terminations of, existing contracts or anticipated or potential new contracts.
The following table summarizes the aggregate maturities of our contractual obligations as of December 31, 2019:
Payments due by Period | ||||||||||||||||||||
(In millions) | Total | 2020 | 2021-2022 | 2023-2024 | Thereafter | |||||||||||||||
Debt(1) | $ | 38,123 | $ | 3,456 | $ | 5,421 | $ | 3,962 | $ | 25,284 | ||||||||||
Operating lease obligations(2) | 850 | 125 | 226 | 187 | 312 | |||||||||||||||
Purchase obligations(3) | 1,682 | 1,315 | 267 | 84 | 16 | |||||||||||||||
Transition tax payable(4) | 4,639 | 148 | 946 | 2,068 | 1,477 | |||||||||||||||
Total(5)(6) | $ | 45,294 | $ | 5,044 | $ | 6,860 | $ | 6,301 | $ | 27,089 | ||||||||||
_________________________________________ | |
(1) | Debt consists of senior unsecured notes and includes principal and future interest payments. Interest payments for our fixed rate senior unsecured notes are incurred and calculated based on terms of the related notes. See Note 12. Debt and Credit Facilities of the Notes to Consolidated Financial Statements included in Item 8 of this Annual Report on Form 10-K for additional information. |
(2) | See Note 13. Leases of the Notes to Consolidated Financial Statements included in Item 8 of this Annual Report on Form 10-K for additional information. |
(3) | Amounts primarily relate to capital commitments, active pharmaceutical ingredients (API) with minimum purchase commitments and certain inventory-related items, advertising and R&D commitments. Significant R&D commitments related to clinical studies performed by contract research organizations (CROs) are excluded from the table as material CRO contracts are cancelable by us. In addition, the table does not reflect approximately $220 million of additional minimum purchase commitments resulting from an API contract amended in January 2020. |
(4) | In connection with Tax Reform we recorded a federal income tax payable for transition tax on the mandatory deemed repatriation of foreign earnings that is payable over an eight-year period. The amounts included in the table above represent the remaining federal income tax payable at December 31, 2019. |
(5) | As of December 31, 2019, our long-term income taxes payable includes unrecognized tax benefits, interest and penalties totaling $1.6 billion. Due to the high degree of uncertainty on the timing of future cash settlement and other events that could extinguish these unrecognized tax benefits, we are unable to estimate the period of cash settlement and therefore we have excluded these unrecognized tax benefits. |
(6) | We have committed to make potential future milestone and other payments to third parties as part of licensing, collaboration, development and other arrangements. Payments under these agreements generally are contingent upon certain future events including achievement of certain developmental, regulatory or commercial milestones. Because the achievement of these events is neither probable nor reasonably estimable and such potential payments have not been recorded in our Consolidated Balance Sheets, they have not been included in the table above. |
RECENT ACCOUNTING PRONOUNCEMENTS
The information required by this item is included in Note 1. Organization and Summary of Significant Accounting Policies of the Notes to Consolidated Financial Statements included in Item 8 of this Annual Report on Form 10-K.
ITEM 7A. | QUANTITATIVE AND QUALITATIVE DISCLOSURES ABOUT MARKET RISK |
We are exposed to market risks that may result from changes in foreign currency exchange rates, interest rates, credit risks and market price. To reduce certain of these risks, we enter into various types of foreign currency or interest rate derivative hedging transactions, follow investment guidelines and monitor outstanding receivables as part of our risk management program.
Foreign Currency Exchange Risk
We have operations in more than 35 countries worldwide. As a result, our financial results could be significantly affected by factors such as changes in foreign currency exchange rates or weak economic conditions in the foreign markets in which we distribute our products. Our operating results are exposed to changes in foreign currency exchange rates between the U.S. dollar and various foreign currencies, the most significant of which is the Euro. When the U.S. dollar strengthens against these currencies, the relative value of sales made in the respective foreign currency decreases. Conversely, when the U.S. dollar weakens against these currencies, the relative amounts of such sales increase. Overall, we are a net receiver of foreign currencies and, therefore, benefit from a weaker U.S. dollar and are adversely affected by a stronger U.S. dollar relative to those foreign currencies in which we transact significant amounts of business.
Approximately 25% of our product sales were denominated in foreign currencies during 2019. To partially mitigate the impact of changes in currency exchange rates on net cash flows from our foreign currency denominated sales, we may enter into foreign currency exchange forward and option contracts. We also hedge certain monetary assets and liabilities denominated in foreign currencies, which reduces but does not eliminate our exposure to currency fluctuations between the date a transaction is recorded and the date that cash is collected or paid. In general, the market risks of these contracts are offset by corresponding gains and losses on the transactions being hedged.
43
As of December 31, 2019 and 2018, we had open foreign currency forward contracts with notional amounts of $2.9 billion and $2.2 billion, respectively. A hypothetical 10% adverse movement in foreign currency exchange rates compared with the U.S. dollar relative to exchange rates at December 31, 2019 and December 31, 2018 would have resulted in a reduction in fair value of these contracts of approximately $285 million and $218 million, respectively, on this date and, if realized, would negatively affect earnings over the remaining life of the contracts. The analysis does not consider the impact that hypothetical changes in foreign currency exchange rates would have on anticipated transactions that these foreign currency sensitive instruments were designed to offset.
Interest Rate Risk
Our portfolio of available-for-sale debt securities and our fixed rate long-term debt create an exposure to interest rate risk. With respect to our investment portfolio, we adhere to an investment policy that requires us to limit amounts invested in securities based on credit rating, maturity, industry group and investment type and issuer, except for securities issued by the U.S. government. The goals of our investment policy, in order of priority, are as follows:
• | safety and preservation of principal and diversification of risk; |
• | liquidity of investments sufficient to meet cash flow requirements; and |
• | competitive after-tax rate of return. |
The following table summarizes the expected maturities and average interest rates of our interest-generating assets and interest-bearing liabilities at December 31, 2019:
Expected Maturity | Total Fair Value | |||||||||||||||||||||||||||||||
(In millions, except percentages) | 2020 | 2021 | 2022 | 2023 | 2024 | Thereafter | Total | |||||||||||||||||||||||||
Assets | ||||||||||||||||||||||||||||||||
Available-for-sale debt securities | $ | 15,012 | $ | 1,453 | $ | 5 | $ | 3 | $ | 4 | $ | 23 | $ | 16,500 | $ | 16,500 | ||||||||||||||||
Average interest rate | 1.88 | % | 1.98 | % | 2.04 | % | 3.50 | % | 3.53 | % | 2.18 | % | ||||||||||||||||||||
Liabilities | ||||||||||||||||||||||||||||||||
Fixed rate long-term debt, including current portion(1): | $ | 2,500 | $ | 2,250 | $ | 1,500 | $ | 750 | $ | 1,750 | $ | 16,000 | $ | 24,750 | $ | 27,298 | ||||||||||||||||
Average interest rate | 2.51 | % | 4.44 | % | 2.82 | % | 2.50 | % | 3.70 | % | 4.21 | % | ||||||||||||||||||||
_________________________________________ | |
(1) | Amounts represent principal balances. In addition to the fixed rate long-term debt, we have a $2.5 billion five-year revolving credit facility that matures in May 2021. There were no amounts outstanding under the five-year revolving credit facility as of December 31, 2019. See Note 12. Debt and Credit Facilities of the Notes to Consolidated Financial Statements included in Item 8 of this Annual Report on Form 10-K for additional information. |
Market Price Risk
We hold shares of common stock of certain publicly traded biotechnology companies primarily in connection with license and collaboration agreements. These equity securities are measured at fair value with any changes in fair value recognized in earnings.
The fair value of these equity securities was approximately $3.8 billion and $881 million as of December 31, 2019 and 2018, respectively. Changes in fair value of these equity securities are impacted by the volatility of the stock market and changes in general economic conditions, among other factors. A hypothetical 20% increase or decrease in the stock prices of these equity securities would increase or decrease their fair value at December 31, 2019 and 2018 by approximately $760 million and $176 million, respectively.
44
ITEM 8. | FINANCIAL STATEMENTS AND SUPPLEMENTARY DATA |
GILEAD SCIENCES, INC.
INDEX TO CONSOLIDATED FINANCIAL STATEMENTS AND SUPPLEMENTARY DATA
Years ended December 31, 2019, 2018 and 2017
CONTENTS
45
Report of Independent Registered Public Accounting Firm
To the Stockholders and the Board of Directors of Gilead Sciences, Inc.
Opinion on the Financial Statements
We have audited the accompanying consolidated balance sheets of Gilead Sciences, Inc. (the Company) as of December 31, 2019 and 2018, the related consolidated statements of income, comprehensive income, stockholders’ equity and cash flows for each of the three years in the period ended December 31, 2019, and the related notes and financial statement schedule listed in the index at Item 15(a) (collectively referred to as the “consolidated financial statements”). In our opinion, the consolidated financial statements present fairly, in all material respects, the financial position of the Company at December 31, 2019 and 2018, and the results of its operations and its cash flows for each of the three years in the period ended December 31, 2019, in conformity with U.S. generally accepted accounting principles.
We also have audited, in accordance with the standards of the Public Company Accounting Oversight Board (United States) (PCAOB), the Company’s internal control over financial reporting as of December 31, 2019, based on criteria established in Internal Control-Integrated Framework issued by the Committee of Sponsoring Organizations of the Treadway Commission (2013 framework) and our report dated February 24, 2020 expressed an unqualified opinion thereon.
Basis for Opinion
These financial statements are the responsibility of the Company’s management. Our responsibility is to express an opinion on the Company’s financial statements based on our audits. We are a public accounting firm registered with the PCAOB and are required to be independent with respect to the Company in accordance with the U.S. federal securities laws and the applicable rules and regulations of the Securities and Exchange Commission and the PCAOB.
We conducted our audits in accordance with the standards of the PCAOB. Those standards require that we plan and perform the audit to obtain reasonable assurance about whether the financial statements are free of material misstatement, whether due to error or fraud. Our audits included performing procedures to assess the risks of material misstatement of the financial statements, whether due to error or fraud, and performing procedures that respond to those risks. Such procedures included examining, on a test basis, evidence regarding the amounts and disclosures in the financial statements. Our audits also included evaluating the accounting principles used and significant estimates made by management, as well as evaluating the overall presentation of the financial statements. We believe that our audits provide a reasonable basis for our opinion.
Critical Audit Matters
The critical audit matters communicated below are matters arising from the current period audit of the financial statements that were communicated or required to be communicated to the audit committee and that: (1) relate to accounts or disclosures that are material to the financial statements and (2) involved our especially challenging, subjective, or complex judgments. The communication of critical audit matters does not alter in any way our opinion on the consolidated financial statements, taken as a whole, and we are not, by communicating the critical audit matters below, providing separate opinions on the critical audit matters or on the accounts or disclosures to which they relate.
Government and commercial rebates | ||
Description of the Matter | As more fully described in Note 1, the Company estimates reductions to its revenues for amounts payable to payers and healthcare providers in the United States under various government and commercial rebate programs in the period that the related sales occur. Rebates may vary by product, payer and individual payer plans, which may not be known at the point of sale. Estimated reductions to revenue are based on products sold, historical payer mix, historical discount rates, and various other estimated and actual data, adjusted for current period expectations. Auditing the Company’s estimated reductions to revenue for rebates was complex and involved significant judgment, particularly in assessing the reasonableness of estimated payer utilization and discount rates applied to sales during the period. These estimates rely heavily on historical data that is adjusted for changes in utilization and discount rates over time. | |
46
How We Addressed the Matter in Our Audit | We evaluated and tested the design and operating effectiveness of the Company’s internal controls over management’s estimation and review of reductions from revenue for rebate programs, including controls to assess the utilization rate and discount rate assumptions. We also tested the completeness and accuracy of data utilized in the controls, and the accuracy of calculations supporting management’s estimates. To test management’s estimation methodology for determining the utilization and discount rates, our audit procedures included, among others, evaluating evidence contrary to the estimated amounts, performing a sensitivity analysis on the rates used in the estimates and performing a comparison of actual payments related to amounts accrued during the current and prior year. | |
Valuation of in-process research and development intangible assets | ||
Description of the Matter | At December 31, 2019, the Company’s in-process research and development (IPR&D) intangible assets were $1.1 billion. The Company recorded an impairment charge of $800 million during the year. As discussed in Note 1, intangible assets with indefinite useful lives related to purchased IPR&D projects are measured at their respective fair values as of the acquisition date and are considered indefinite-lived until the completion or abandonment of the associated R&D efforts. The Company tests indefinite-lived intangible assets for impairment on an annual basis and in between annual tests if they become aware of any events or changes that would indicate the fair values of the assets are below their carrying amounts. Auditing the impairment tests was complex due to the significant judgment required in estimating the fair values of the IPR&D intangible assets. In particular, the fair value estimates were sensitive to significant assumptions (e.g., discount rate, projected research and development costs, probability of technical success, addressable patient population, projected market share and product profitability), which were affected by expected future market or economic conditions. | |
How We Addressed the Matter in Our Audit | We evaluated and tested the design and operating effectiveness of the Company’s internal controls over the determination of the estimated fair value of the IPR&D intangible assets. For example, we tested controls over management’s review of the valuation models and the significant assumptions used to develop the fair value estimates of the indefinite lived intangible assets. We also tested management’s controls to validate that the data used in the fair value estimates were complete and accurate. To test the estimated fair value of the Company’s IPR&D intangible assets, our audit procedures included, among others, evaluating the Company’s use of appropriate valuation methodologies with the assistance of a valuation specialist, testing the significant assumptions discussed above and testing the completeness and accuracy of the underlying data. For example, we compared the significant assumptions to current industry, market and economic trends, to historical results of the Company’s business and other guideline companies within the same industry and to other relevant factors. In addition, to evaluate the probability of technical success, we considered the phase of development of the IPR&D projects, and the Company’s history of obtaining regulatory approval. We also performed a sensitivity analysis of the significant assumptions to evaluate the change in the estimated fair values of the IPR&D intangible assets resulting from changes in the assumptions. | |
/s/ Ernst & Young LLP
We have served as the Company’s auditor since 1988.
San Jose, California
February 24, 2020
47
GILEAD SCIENCES, INC.
Consolidated Balance Sheets
(in millions, except per share amounts)
December 31, | |||||||
2019 | 2018 | ||||||
Assets | |||||||
Current assets: | |||||||
Cash and cash equivalents | $ | $ | |||||
Short-term marketable securities | |||||||
Accounts receivable, net of allowances of $758 and $583, respectively | |||||||
Inventories | |||||||
Prepaid and other current assets | |||||||
Total current assets | |||||||
Property, plant and equipment, net | |||||||
Long-term marketable securities | |||||||
Intangible assets, net | |||||||
Goodwill | |||||||
Other long-term assets | |||||||
Total assets | $ | $ | |||||
Liabilities and Stockholders’ Equity | |||||||
Current liabilities: | |||||||
Accounts payable | $ | $ | |||||
Accrued government and other rebates | |||||||
Other accrued liabilities | |||||||
Current portion of long-term debt and other obligations, net | |||||||
Total current liabilities | |||||||
Long-term debt, net | |||||||
Long-term income taxes payable | |||||||
Other long-term obligations | |||||||
Commitments and contingencies (Note 14) | |||||||
Stockholders’ equity: | |||||||
Preferred stock, par value $0.001 per share; 5 shares authorized; none outstanding | |||||||
Common stock, par value $0.001 per share; 5,600 authorized; 1,266 and 1,282 shares issued and outstanding, respectively | |||||||
Additional paid-in capital | |||||||
Accumulated other comprehensive income | |||||||
Retained earnings | |||||||
Total Gilead stockholders’ equity | |||||||
Noncontrolling interest | |||||||
Total stockholders’ equity | |||||||
Total liabilities and stockholders’ equity | $ | $ | |||||
See accompanying notes.
48
GILEAD SCIENCES, INC.
Consolidated Statements of Income
(in millions, except per share amounts)
Year Ended December 31, | ||||||||||||
2019 | 2018 | 2017 | ||||||||||
Revenues: | ||||||||||||
Product sales | $ | $ | $ | |||||||||
Royalty, contract and other revenues | ||||||||||||
Total revenues | ||||||||||||
Costs and expenses: | ||||||||||||
Cost of goods sold | ||||||||||||
Research and development expenses | ||||||||||||
Selling, general and administrative expenses | ||||||||||||
Total costs and expenses | ||||||||||||
Income from operations | ||||||||||||
Interest expense | ( | ) | ( | ) | ( | ) | ||||||
Other income (expense), net | ||||||||||||
Income before provision for income taxes | ||||||||||||
Provision for income taxes | ( | ) | ||||||||||
Net income | ||||||||||||
Net (loss) income attributable to noncontrolling interest | ( | ) | ||||||||||
Net income attributable to Gilead | $ | $ | $ | |||||||||
Net income per share attributable to Gilead common stockholders - basic | $ | $ | $ | |||||||||
Shares used in per share calculation - basic | ||||||||||||
Net income per share attributable to Gilead common stockholders - diluted | $ | $ | $ | |||||||||
Shares used in per share calculation - diluted | ||||||||||||
See accompanying notes.
49
GILEAD SCIENCES, INC.
Consolidated Statements of Comprehensive Income
(in millions)
Year Ended December 31, | ||||||||||||
2019 | 2018 | 2017 | ||||||||||
Net income | $ | $ | $ | |||||||||
Other comprehensive income (loss): | ||||||||||||
Net foreign currency translation gain (loss), net of tax | ( | ) | ( | ) | ||||||||
Available-for-sale debt securities: | ||||||||||||
Net unrealized gain, net of tax | ||||||||||||
Reclassifications to net income, net of tax | ( | ) | ( | ) | ||||||||
Net change | ||||||||||||
Cash flow hedges: | ||||||||||||
Net unrealized gain (loss), net of tax | ( | ) | ||||||||||
Reclassification to net income, net of tax | ( | ) | ||||||||||
Net change | ( | ) | ( | ) | ||||||||
Other comprehensive income (loss) | ( | ) | ||||||||||
Comprehensive income | ||||||||||||
Comprehensive (loss) income attributable to noncontrolling interest | ( | ) | ||||||||||
Comprehensive income attributable to Gilead | $ | $ | $ | |||||||||
See accompanying notes.
50
GILEAD SCIENCES, INC.
Consolidated Statements of Stockholders’ Equity
(in millions, except per share amounts)
Gilead Stockholders’ Equity | Noncontrolling Interest | Total Stockholders’ Equity | |||||||||||||||||||||||||
Common Stock | Additional Paid-In Capital | Accumulated Other Comprehensive Income (Loss) | Retained Earnings | ||||||||||||||||||||||||
Shares | Amount | ||||||||||||||||||||||||||
Balance at December 31, 2016 | $ | $ | $ | $ | $ | $ | |||||||||||||||||||||
Change in noncontrolling interest | — | — | ( | ) | — | — | ( | ) | ( | ) | |||||||||||||||||
Net income | — | — | — | — | |||||||||||||||||||||||
Other comprehensive loss, net of tax | — | — | — | ( | ) | — | — | ( | ) | ||||||||||||||||||
Issuances under employee stock purchase plan | — | — | — | — | |||||||||||||||||||||||
Issuances under equity incentive plans | — | — | — | — | |||||||||||||||||||||||
Stock-based compensation | — | — | — | — | — | ||||||||||||||||||||||
Repurchases of common stock | ( | ) | — | ( | ) | — | ( | ) | — | ( | ) | ||||||||||||||||
Dividends declared ($2.08 per share) | — | — | — | — | ( | ) | — | ( | ) | ||||||||||||||||||
Balance at December 31, 2017 | |||||||||||||||||||||||||||
Change in noncontrolling interest | — | — | — | — | |||||||||||||||||||||||
Net income | — | — | — | — | |||||||||||||||||||||||
Other comprehensive income, net of tax | — | — | — | — | — | ||||||||||||||||||||||
Issuances under employee stock purchase plan | — | — | — | — | |||||||||||||||||||||||
Issuances under equity incentive plans | — | — | — | — | |||||||||||||||||||||||
Stock-based compensation | — | — | — | — | — | ||||||||||||||||||||||
Repurchases of common stock | ( | ) | — | ( | ) | — | ( | ) | — | ( | ) | ||||||||||||||||
Dividends declared ($2.28 per share) | — | — | — | — | ( | ) | — | ( | ) | ||||||||||||||||||
Cumulative effect from the adoption of new accounting standards | — | — | — | ( | ) | — | |||||||||||||||||||||
Balance at December 31, 2018 | |||||||||||||||||||||||||||
Net income (loss) | — | — | — | — | ( | ) | |||||||||||||||||||||
Other comprehensive income, net of tax | — | — | — | — | — | ||||||||||||||||||||||
Issuances under employee stock purchase plan | — | — | — | — | |||||||||||||||||||||||
Issuances under equity incentive plans | — | — | — | — | |||||||||||||||||||||||
Stock-based compensation | — | — | — | — | — | ||||||||||||||||||||||
Repurchases of common stock | ( | ) | — | ( | ) | — | ( | ) | — | ( | ) | ||||||||||||||||
Dividends declared ($2.52 per share) | — | — | — | — | ( | ) | — | ( | ) | ||||||||||||||||||
Cumulative effect from the adoption of new accounting standards (Note 1) | — | — | — | — | — | ||||||||||||||||||||||
Balance at December 31, 2019 | $ | $ | $ | $ | $ | $ | |||||||||||||||||||||
See accompanying notes.
51
GILEAD SCIENCES, INC.
Consolidated Statements of Cash Flows
(in millions)
Year Ended December 31, | ||||||||||||
2019 | 2018 | 2017 | ||||||||||
Operating Activities: | ||||||||||||
Net income | $ | $ | $ | |||||||||
Adjustments to reconcile net income to net cash provided by operating activities: | ||||||||||||
Depreciation expense | ||||||||||||
Amortization expense | ||||||||||||
Stock-based compensation expense | ||||||||||||
Deferred income taxes | ( | ) | ( | ) | ||||||||
Net gains from equity securities | ( | ) | ( | ) | ||||||||
Up-front and milestone expense related to collaborative and other arrangements | ||||||||||||
In-process research and development impairment | ||||||||||||
Write-downs for slow moving and excess raw material and work in process inventory | ||||||||||||
Other | ||||||||||||
Changes in operating assets and liabilities: | ||||||||||||
Accounts receivable, net | ( | ) | ||||||||||
Inventories | ( | ) | ( | ) | ( | ) | ||||||
Prepaid expenses and other | ( | ) | ||||||||||
Accounts payable | ( | ) | ( | ) | ( | ) | ||||||
Income taxes payable | ( | ) | ||||||||||
Accrued liabilities | ( | ) | ( | ) | ( | ) | ||||||
Net cash provided by operating activities | ||||||||||||
Investing Activities: | ||||||||||||
Purchases of marketable debt securities | ( | ) | ( | ) | ( | ) | ||||||
Proceeds from sales of marketable debt securities | ||||||||||||
Proceeds from maturities of marketable debt securities | ||||||||||||
Up-front and milestone payments related to collaborative and other arrangements | ( | ) | ||||||||||
Purchases of equity securities | ( | ) | ( | ) | ||||||||
Acquisitions, net of cash acquired | ( | ) | ||||||||||
Capital expenditures | ( | ) | ( | ) | ( | ) | ||||||
Other | ( | ) | ( | ) | ||||||||
Net cash (used in) provided by investing activities | ( | ) | ( | ) | ||||||||
Financing Activities: | ||||||||||||
Proceeds from debt financing, net of issuance costs | ||||||||||||
Proceeds from issuances of common stock | ||||||||||||
Repurchases of common stock | ( | ) | ( | ) | ( | ) | ||||||
Repayments of debt and other obligations | ( | ) | ( | ) | ( | ) | ||||||
Payment of dividends | ( | ) | ( | ) | ( | ) | ||||||
Other | ( | ) | ( | ) | ( | ) | ||||||
Net cash (used in) provided by financing activities | ( | ) | ( | ) | ||||||||
Effect of exchange rate changes on cash and cash equivalents | ( | ) | ( | ) | ||||||||
Net change in cash and cash equivalents | ( | ) | ( | ) | ||||||||
Cash and cash equivalents at beginning of period | ||||||||||||
Cash and cash equivalents at end of period | $ | $ | $ | |||||||||
Supplemental disclosure of cash flow information: | ||||||||||||
Interest paid, net of amounts capitalized | $ | $ | $ | |||||||||
Income taxes paid | $ | $ | $ | |||||||||
See accompanying notes.
52
GILEAD SCIENCES, INC.
NOTES TO CONSOLIDATED FINANCIAL STATEMENTS
1. | ORGANIZATION AND SUMMARY OF SIGNIFICANT ACCOUNTING POLICIES |
Overview
Gilead Sciences, Inc. (Gilead, we, our or us), incorporated in Delaware on June 22, 1987, is a research-based biopharmaceutical company that discovers, develops and commercializes innovative medicines in areas of unmet medical need. With each new discovery and investigational drug candidate, we strive to transform and simplify care for people with life-threatening illnesses around the world. We have operations in more than 35 countries worldwide, with headquarters in Foster City, California. Gilead’s primary areas of focus include viral diseases, inflammatory and fibrotic diseases and oncology. We seek to add to our existing portfolio of products through our internal discovery and clinical development programs, product acquisition, in-licensing and strategic collaborations.
Our portfolio of marketed products includes AmBisome®, Atripla®, Biktarvy®, Cayston®, Complera®/Eviplera®, Descovy®, Descovy for PrEP®, Emtriva®, Epclusa®, Genvoya®, Harvoni®, Hepsera®, Letairis®, Odefsey®, Ranexa®, Sovaldi®, Stribild®, Truvada®, Truvada for PrEP®, Tybost®, Vemlidy®, Viread®, Vosevi®, Yescarta® and Zydelig®. We also sell and distribute authorized generic versions of Epclusa and Harvoni in the United States through our separate subsidiary, Asegua Therapeutics, LLC. In addition, we sell and distribute certain products through our corporate partners under collaborative agreements.
Basis of Presentation
The accompanying Consolidated Financial Statements include the accounts of Gilead, our wholly-owned subsidiaries and certain variable interest entities for which we are the primary beneficiary. All intercompany transactions have been eliminated. For consolidated entities where we own or are exposed to less than 100% of the economics, we record net income (loss) attributable to noncontrolling interests in our Consolidated Statements of Income equal to the percentage of the economic or ownership interest retained in such entities by the respective noncontrolling parties.
We assess whether we are the primary beneficiary of a variable interest entity (VIE) at the inception of the arrangement and at each reporting date. This assessment is based on our power to direct the activities of the VIE that most significantly impact the VIE’s economic performance and our obligation to absorb losses or the right to receive benefits from the VIE that could potentially be significant to the VIE.
Significant Accounting Policies, Estimates and Judgments
The preparation of these Consolidated Financial Statements requires us to make estimates and judgments that affect the reported amounts of assets, liabilities, revenues and expenses, and related disclosures. On an ongoing basis, we evaluate our significant accounting policies and estimates. We base our estimates on historical experience and on various market specific and other relevant assumptions that we believe to be reasonable under the circumstances, the results of which form the basis for making judgments about the carrying values of assets and liabilities that are not readily apparent from other sources. Actual results may differ significantly from these estimates.
Revenue Recognition
On January 1, 2018, we adopted Accounting Standards Update No. 2014-09 “Revenue from Contracts with Customers” (Topic 606) using the modified retrospective method. Topic 606 supersedes the revenue recognition requirements in Topic 605 “Revenue Recognition” (Topic 605). As a result, we have changed our accounting policies for revenue recognition as detailed below.
Policy Elections and Practical Expedients Taken
• | We account for shipping and handling activities that are performed after a customer has obtained control of a good as fulfillment costs rather than as separate performance obligations; and |
• | If we expect, at contract inception, that the period between the transfer of control and corresponding payment from the customer will be one year or less, we do not adjust the amount of consideration for the effects of a significant financing component. |
Product Sales
We recognize revenue from product sales when control of the product transfers, generally upon shipment or delivery, to the customer, or in certain cases, upon the corresponding sales by our customer to a third party. Upon recognition of revenue from product sales, provisions are made for various forms of variable consideration, which include government and other rebates such as Medicaid reimbursements, customer incentives such as cash discounts for prompt payment, distributor fees and expected returns of expired products, as appropriate. Variable consideration is included in the net sales price only to the extent a significant reversal
53
in the amount of cumulative revenue recognized is not probable of occurring when the uncertainty associated with the variable consideration is subsequently resolved. Our payment terms to customers generally range from 30 to 90 days.
Variable Consideration
Rebates and Chargebacks
We estimate reductions to our revenues for amounts paid to payers and healthcare providers in the United States, including Medicaid rebates, AIDS Drug Assistance Program rebates and chargebacks, Veterans Administration and Public Health Service rebates and chargebacks, as well as foreign government rebates. Rebates and chargebacks are based on contractual arrangements or statutory requirements which may vary by product, payer and individual payer plans. Our estimates are based on products sold, historical payer mix, and as available, pertinent third-party industry information, estimated patient population, known market events or trends, and for our U.S. product sales, channel inventory data obtained from our major U.S. wholesalers in accordance with our inventory management agreements. We also take into consideration, as available, new information regarding changes in programs’ regulations and guidelines that would impact the amount of the actual rebates and/or our expectations regarding future payer mix for these programs. Government and other chargebacks that are payable to our direct customers are classified as reductions of Accounts receivable on our Consolidated Balance Sheets. Government and other rebates that are payable to third party payers and healthcare providers are recorded in Accrued government and other rebates on our Consolidated Balance Sheets.
Cash Discounts
We estimate cash discounts based on contractual terms, historical customer payment patterns and our expectations regarding future customer payment patterns.
Distributor Fees
Under our inventory management agreements with our significant U.S. wholesalers, we pay the wholesalers a fee primarily for compliance with certain contractually determined covenants such as the maintenance of agreed upon inventory levels. These distributor fees are based on a contractually determined fixed percentage of sales.
Product Returns
We do not provide our customers with a general right of product return, but typically permit returns if the product is damaged, defective, or otherwise cannot be used when received by the customer, or in the case of product sold in the United States and certain other countries, if the product has expired. We will accept returns for product that will expire within six months or that have expired up to one year after their expiration dates. Our estimates for expected returns of expired products are based primarily on an ongoing analysis of our historical return patterns, historical industry information reporting the return rates for similar products and contractual agreements intended to limit the amount of inventory maintained by our wholesalers.
Royalty, Contract and Other Revenues
Royalty revenue is recognized in the period in which the obligation is satisfied and the corresponding sales by our corporate partners occur.
Research and Development Expenses
Research and development (R&D) expenses consist primarily of personnel costs, including salaries, benefits and stock-based compensation, clinical studies performed by contract research organizations (CROs), materials and supplies, payments under collaborative and other arrangements, including up-front and milestone payments, license and option fees, as well as expense reimbursements to the collaboration partners and overhead allocations consisting of various support and infrastructure costs.
We charge R&D costs, including clinical study costs, to expense when incurred. Clinical study costs are a significant component of R&D expenses. Most of our clinical studies are performed by third-party CROs. We monitor levels of performance under each significant contract including the extent of patient enrollment and other activities through communications with our CROs. We accrue costs for clinical studies performed by CROs over the service periods specified in the contracts and adjust our estimates, if required, based upon our ongoing review of the level of effort and costs actually incurred by the CROs. All of our material CRO contracts are terminable by us upon written notice and we are generally only liable for actual services completed by the CRO and certain non-cancelable expenses incurred at any point of termination.
Selling, General and Administrative Expenses
Selling, general and administrative (SG&A) expenses relate to sales and marketing, finance, human resources, legal and other administrative activities. SG&A expenses consist primarily of personnel costs, facilities and overhead costs, outside marketing, advertising and legal expenses, and other general and administrative costs. SG&A expenses also include the branded prescription drug (BPD) fee. In the United States, we, along with other pharmaceutical manufacturers of branded drug products, are required to pay a portion of the BPD fee, which is estimated based on select government sales during the prior year as a percentage of total industry government sales.
54
We expense the costs of advertising, including promotional expenses, as incurred. Advertising expenses were $784 million, $587 million and $600 million for the years ended December 31, 2019, 2018 and 2017, respectively.
Cash and Cash Equivalents
We consider highly liquid investments with insignificant interest rate risk and an original maturity of three months or less on the purchase date to be cash equivalents.
Marketable and Nonmarketable Securities
Marketable Debt Securities
We determine the appropriate classification of our marketable debt securities at the time of purchase and reevaluate such designation at each balance sheet date. All of our marketable debt securities are considered available-for-sale and carried at estimated fair values and reported in cash equivalents, short-term marketable securities or long-term marketable securities. Unrealized gains and losses on available-for-sale debt securities are excluded from net income and reported in accumulated other comprehensive income (loss) (AOCI) as a separate component of stockholders’ equity. Other income (expense), net, includes interest, amortization of purchase premiums and discounts, realized gains and losses on sales of securities and other-than-temporary declines in the fair value of securities, if any. The cost of securities sold is based on the specific identification method. We regularly review all of our investments for other-than-temporary declines in fair value. Our review includes the consideration of the cause of the impairment, including the creditworthiness of the security issuers, the number of securities in an unrealized loss position, the severity and duration of the unrealized losses, whether we have the intent to sell the securities and whether it is more likely than not that we will be required to sell the securities before the recovery of their amortized cost basis. When we determine that the decline in fair value of an investment is below our accounting basis and the decline is other-than-temporary, we reduce the carrying value of the security we hold and record a loss for the amount of such decline.
Marketable and Non-Marketable Equity Securities
Investments in equity securities, other than equity method investments, are recorded at fair market value, if fair value is readily determinable and, beginning January 1, 2018, unrealized gains and losses are included in Other income (expense), net on our Consolidated Statements of Income. For periods presented prior to January 1, 2018, unrealized gains and losses were included in AOCI as a separate component of stockholders’ equity.
For investments in entities over which we have significant influence but do not meet the requirements for consolidation and have not elected the fair value option, we use the equity method of accounting with our share of the underlying income or loss of such entities reported in Other income (expense), net on our Consolidated Statements of Income. We have elected the fair value option to account for our equity investment in Galapagos NV (Galapagos) over which we have significant influence. We believe the fair value option best reflects the underlying economics of the investment. See Note 11. Collaborative and Other Arrangements for additional information.
Equity securities without readily determinable fair values are recorded using the measurement alternative of cost less impairment, if any, adjusted for observable price changes in orderly transactions for identical or similar investments of the same issuer. Certain investments in equity securities of non-public companies are accounted for using the equity method based on our ownership percentage and other factors that indicate we have significant influence over the investee. Investments in equity securities without readily determinable fair values and investments in non-public companies that are accounted for using the equity method of accounting are not material for the periods presented.
Our investments in equity securities are recorded in Prepaid and other current assets or Other long-term assets on our Consolidated Balance Sheet. We regularly review our securities for indicators of impairment.
Concentrations of Risk
We are subject to credit risk from our portfolio of cash equivalents and marketable securities. Under our investment policy, we limit amounts invested in such securities by credit rating, maturity, industry group, investment type and issuer, except for securities issued by the U.S. government. We are not exposed to any significant concentrations of credit risk from these financial instruments. The goals of our investment policy, in order of priority, are as follows: safety and preservation of principal and diversification of risk; liquidity of investments sufficient to meet cash flow requirements; and a competitive after-tax rate of return.
We are also subject to credit risk from our accounts receivable related to our product sales. Trade accounts receivable are recorded net of allowances for wholesaler chargebacks related to government and other programs, cash discounts for prompt payment and doubtful accounts. Estimates of our allowance for doubtful accounts are determined based on existing contractual payment terms, historical payment patterns of our customers and individual customer circumstances, an analysis of days sales outstanding by geographic region and a review of the local economic environment and its potential impact on government funding and reimbursement practices. The majority of our trade accounts receivable arises from product sales in the United States, Europe
55
and Japan. To date, we have not experienced significant losses with respect to the collection of our accounts receivable. We believe that our allowance for doubtful accounts was adequate at December 31, 2019.
Certain of the raw materials and components that we utilize in our operations are obtained through single suppliers. Certain of the raw materials that we utilize in our operations are made at only one facility. Since the suppliers of key components and raw materials must be named in a new drug application filed with U.S. Food and Drug Administration (FDA) for a product, significant delays can occur if the qualification of a new supplier is required. If delivery of material from our suppliers is interrupted for any reason, we may be unable to ship our commercial products or to supply our product candidates for clinical trials.
Inventories
Inventories are recorded at the lower of cost or net realizable value, with cost determined on a first-in, first-out basis. We periodically review our inventories to identify obsolete, slow moving, excess or otherwise unsaleable items. If obsolete, slow moving, excess or unsaleable items are observed and there are no alternate uses for the inventory, we record a write-down to net realizable value through a charge to Cost of goods sold on our Consolidated Statements of Income. The determination of net realizable value requires judgment including consideration of many factors, such as estimates of future product demand, product net selling prices, current and future market conditions and potential product obsolescence, among others.
Property, Plant and Equipment
Property, plant and equipment is stated at cost less accumulated depreciation and amortization. Depreciation and amortization are recognized using the straight-line method. Repairs and maintenance costs are expensed as incurred. Estimated useful lives in years are generally as follows:
Description | Estimated Useful Life |
Buildings and improvements | Shorter of 35 years or useful life |
Laboratory and manufacturing equipment | 4-10 |
Office and computer equipment | 3-7 |
Leasehold improvements | Shorter of useful life or lease term |
We account for business combinations using the acquisition method of accounting, which requires that assets acquired, including in-process research and development (IPR&D) projects, and liabilities assumed be recorded at their fair values as of the acquisition date on our Consolidated Balance Sheets. Any excess of purchase price over the fair value of net assets acquired is recorded as goodwill. The determination of estimated fair value requires us to make significant estimates and assumptions. As a result, we may record adjustments to the fair values of assets acquired and liabilities assumed within the measurement period (up to one year from the acquisition date) with the corresponding offset to goodwill. Transaction costs associated with business combinations are expensed as they are incurred.
Goodwill and Intangible Assets
Goodwill represents the excess of the consideration transferred over the estimated fair value of assets acquired and liabilities assumed in a business combination. Intangible assets are measured at their respective fair values as of the acquisition date and may be subject to revision within the measurement period, which may be up to one year from the acquisition date. Intangible assets related to IPR&D projects are considered to be indefinite-lived until the completion or abandonment of the associated R&D efforts. We do not amortize goodwill and intangible assets with indefinite useful lives. We test goodwill and indefinite-lived intangible assets for impairment on an annual basis and in between annual tests if we become aware of any events or circumstances that would indicate the fair values of the assets are below their carrying amounts.
56
When development is successfully completed, which generally occurs when regulatory approval is obtained, the associated assets are deemed finite-lived and amortized over their respective estimated useful lives beginning at that point in time. Intangible assets with finite useful lives are amortized over their estimated useful lives, primarily on a straight-line basis, and are reviewed for impairment when facts or circumstances indicate that the carrying value of these assets may not be recoverable.
Foreign Currency Translation, Transaction Gains and Losses, and Hedging Contracts
Non-U.S. entity operations are recorded in the functional currency of each entity. Results of operations for non-U.S. dollar functional currency entities are translated into U.S. dollars using average currency rates. Assets and liabilities are translated using currency rates at period end. Foreign currency translation adjustments are recorded as a component of AOCI within stockholders’ equity. Foreign currency transaction gains and losses are recorded in Other income (expense), net, on our Consolidated Statements of Income. Net foreign currency transaction gains and losses were not material for the years ended December 31, 2019, 2018 and 2017.
We hedge a portion of our foreign currency exposures related to outstanding monetary assets and liabilities as well as forecasted product sales using foreign currency exchange forward contracts. In general, the market risk related to these contracts is offset by corresponding gains and losses on the hedged transactions. The credit risk associated with these contracts is driven by changes in interest and currency exchange rates and, as a result, varies over time. By working only with major banks and closely monitoring current market conditions, we seek to limit the risk that counterparties to these contracts may be unable to perform. We also seek to limit our risk of loss by entering into contracts that permit net settlement at maturity. Therefore, our overall risk of loss in the event of a counterparty default is limited to the amount of any unrealized gains on outstanding contracts (i.e., those contracts that have a positive fair value) at the date of default. We do not enter into derivative contracts for trading purposes.
Fair Value of Financial Instruments
We apply fair value accounting for all financial assets and liabilities and non-financial assets and liabilities that are recognized or disclosed at fair value in the financial statements on a recurring basis. We define fair value as the price that would be received from selling an asset or paid to transfer a liability in an orderly transaction between market participants at the measurement date. When determining the fair value measurements for assets and liabilities which are required to be recorded at fair value, we consider the principal or most advantageous market in which we would transact and the market-based risk measurements or assumptions that market participants would use in pricing the asset or liability, such as risks inherent in valuation techniques, transfer restrictions and credit risks.
Derivative Financial Instruments
We recognize all derivative instruments as either assets or liabilities at fair value on our Consolidated Balance Sheets. Changes in the fair value of derivatives designated as part of a hedge transaction are recorded each period in current earnings or AOCI. Changes in the fair value of derivatives that are not part of a hedge transaction are recorded each period in current earnings.
We assess, both at inception and on an ongoing basis, whether the derivatives that are used in hedging transactions are effective in offsetting the changes in cash flows or fair values of the hedged items. If we determine that a forecasted transaction is probable of not occurring, we discontinue hedge accounting for the affected portion of the hedge instrument, and any related unrealized gain or loss on the contract is recognized in Other income (expense), net on our Consolidated Statements of Income.
Income Taxes
Our income tax provision is computed under the liability method. Deferred tax assets and liabilities are determined based on the difference between the financial statement and tax basis of assets and liabilities using enacted tax rates in effect for the year in which the differences are expected to reverse. Significant estimates are required in determining our provision for income taxes. Some of these estimates are based on interpretations of applicable tax laws or regulations.
We record liabilities related to unrecognized tax benefits in accordance with the guidance that clarifies the accounting for uncertainty in income taxes recognized in an enterprise’s financial statements by prescribing a minimum recognition threshold and measurement attribute for the financial statement recognition and measurement of a tax position taken or expected to be taken
57
in a tax return. An adverse resolution of one or more of these uncertain tax positions in any period could have a material impact on the results of operations for that period.
We have elected to account for the tax on Global Intangible Low-Taxed Income (GILTI), enacted as part of the Tax Cuts and Jobs Act (Tax Reform), as a component of tax expense in the period in which the tax is incurred (period cost method).
Presentation of Cash Flows
Starting in 2019, up-front and milestone payments related to collaborative and other arrangements are classified as cash flows from investing activities in our Consolidated Statements of Cash Flows. Comparative prior year amounts were not material and were not reclassified to investing activities from operating activities.
Recently Adopted Accounting Pronouncements
In February 2016, the Financial Accounting Standards Board (FASB) issued Accounting Standards Update No. 2016-02 “Leases” (ASU 2016-02) and subsequently issued supplemental adoption guidance and clarification (collectively, Topic 842). Topic 842 amends a number of aspects of lease accounting, including requiring lessees to recognize right-of-use assets and lease liabilities for operating leases with a lease term greater than one year. Topic 842 supersedes Topic 840 “Leases.”
On January 1, 2019, we adopted Topic 842 using the modified retrospective method. Results for reporting periods beginning after January 1, 2019 are presented under Topic 842, while prior period amounts are not adjusted and continue to be reported in accordance with our historical accounting under Topic 840. We elected the package of practical expedients permitted under the transition guidance within Topic 842, which allowed us to carry forward the historical lease classification, retain the initial direct costs for any leases that existed prior to the adoption of the standard and not reassess whether any contracts entered into prior to the adoption are leases. We also elected to account for lease and nonlease components in our lease agreements as a single lease component in determining lease assets and liabilities. In addition, we elected not to recognize the right-of-use assets and liabilities for leases with lease terms of one year or less.
Upon adoption of Topic 842, we recorded $441 million of right-of-use assets within Other long-term assets and $490 million of operating lease liabilities, classified primarily within Other long-term obligations on our Consolidated Balance Sheet, as of January 1, 2019. The adoption did not have a material impact on our Consolidated Statements of Operations or Consolidated Statements of Cash Flows. See Note 13. Leases for additional information.
Recently Issued Accounting Pronouncements Not Yet Adopted
In June 2016, the FASB issued Accounting Standards Update No. 2016-13 “Financial Instruments-Credit Losses: Measurement of Credit Losses on Financial Instruments” (ASU 2016-13). ASU 2016-13 requires measurement and recognition of expected credit losses for financial assets. In April 2019, the FASB issued clarification to ASU 2016-13 within ASU 2019-04 “Codification Improvements to Topic 326, Financial Instruments-Credit Losses, Topic 815, Derivatives and Hedging, and Topic 825, Financial Instruments.” The guidance will become effective for us beginning in the first quarter of 2020 and must be adopted using a modified retrospective approach, with certain exceptions. We do not expect the adoption of these standards to have a material impact on our Consolidated Financial Statements.
In November 2018, the FASB issued Accounting Standards Update No. 2018-18 “Collaborative Arrangements (Topic 808): Clarifying the Interaction between Topic 808 and Topic 606” (ASU 2018-18). ASU 2018-18 clarifies that certain transactions between participants in a collaborative arrangement should be accounted for under ASC 606 when the counterparty is a customer. In addition, the update precludes an entity from presenting consideration from a transaction in a collaborative arrangement as revenue if the counterparty is not a customer for that transaction. This guidance will become effective for us beginning in the first quarter of 2020 and will be applied retrospectively to January 1, 2018 when we initially adopted Topic 606. We do not expect the adoption of this standard to have a material impact on our Consolidated Financial Statements.
58
2. | REVENUES |
Disaggregation of Revenues
The following table disaggregates our product sales by product and geographic region and disaggregates our royalty, contract and other revenues by geographic region (in millions):
Year Ended December 31, 2019 | Year Ended December 31, 2018 | Year Ended December 31, 2017(6) | ||||||||||||||||||||||||||||||||||||||||||||||
U.S. | Europe | Other International | Total | U.S. | Europe | Other International | Total | U.S. | Europe | Other International | Total | |||||||||||||||||||||||||||||||||||||
Product Sales: | ||||||||||||||||||||||||||||||||||||||||||||||||
Atripla | $ | $ | $ | $ | $ | $ | $ | $ | $ | $ | $ | $ | ||||||||||||||||||||||||||||||||||||
Biktarvy | ||||||||||||||||||||||||||||||||||||||||||||||||
Complera/Eviplera | ||||||||||||||||||||||||||||||||||||||||||||||||
Descovy | ||||||||||||||||||||||||||||||||||||||||||||||||
Genvoya | ||||||||||||||||||||||||||||||||||||||||||||||||
Odefsey | ||||||||||||||||||||||||||||||||||||||||||||||||
Stribild | ||||||||||||||||||||||||||||||||||||||||||||||||
Truvada | ||||||||||||||||||||||||||||||||||||||||||||||||
Other HIV(1) | ||||||||||||||||||||||||||||||||||||||||||||||||
Revenue share – Symtuza(2) | ||||||||||||||||||||||||||||||||||||||||||||||||
AmBisome | ||||||||||||||||||||||||||||||||||||||||||||||||
Ledipasvir/Sofosbuvir(3) | ||||||||||||||||||||||||||||||||||||||||||||||||
Letairis | ||||||||||||||||||||||||||||||||||||||||||||||||
Ranexa | ||||||||||||||||||||||||||||||||||||||||||||||||
Sofosbuvir/Velpatasvir(4) | ||||||||||||||||||||||||||||||||||||||||||||||||
Vemlidy | ||||||||||||||||||||||||||||||||||||||||||||||||
Viread | ||||||||||||||||||||||||||||||||||||||||||||||||
Vosevi | ||||||||||||||||||||||||||||||||||||||||||||||||
Yescarta | ||||||||||||||||||||||||||||||||||||||||||||||||
Zydelig | ||||||||||||||||||||||||||||||||||||||||||||||||
Other(5) | ||||||||||||||||||||||||||||||||||||||||||||||||
Total product sales | ||||||||||||||||||||||||||||||||||||||||||||||||
Royalty, contract and other revenues | ||||||||||||||||||||||||||||||||||||||||||||||||
Total revenues | $ | $ | $ | $ | $ | $ | $ | $ | $ | $ | $ | $ | ||||||||||||||||||||||||||||||||||||
_________________________________________ | |
(1) | Includes Emtriva and Tybost. |
(2) | Represents our revenue from cobicistat (C), emtricitabine (FTC) and tenofovir alafenamide (TAF) in Symtuza (darunavir/C/FTC/TAF), a fixed dose combination product commercialized by Janssen Sciences Ireland UC (Janssen). |
(3) | Amounts consist of sales of Harvoni and the authorized generic version of Harvoni sold by our separate subsidiary, Asegua Therapeutics LLC. |
(4) | Amounts consist of sales of Epclusa and the authorized generic version of Epclusa sold by our separate subsidiary, Asegua Therapeutics LLC. |
(5) | Includes Cayston, Hepsera and Sovaldi. |
(6) | The information for the year ended December 31, 2017 has not been adjusted in accordance with our modified retrospective adoption of Topic 606 and continues to be reported in accordance with our historical accounting under Topic 605. |
Revenues Recognized from Performance Obligations Satisfied in Prior Periods
Revenues recognized from performance obligations satisfied in prior years related to royalties for licenses of our intellectual property were $741 million and $541 million for the years ended December 31, 2019 and 2018, respectively. Changes in estimates for variable consideration related to sales made in prior years resulted in a $257 million increase and a $56 million decrease in revenues for the years ended December 31, 2019 and 2018, respectively.
Contract Balances
59
3. | FAIR VALUE MEASUREMENTS |
We determine the fair value of financial and non-financial assets and liabilities using the fair value hierarchy, which establishes three levels of inputs that may be used to measure fair value, as follows:
• | Level 1 inputs include quoted prices in active markets for identical assets or liabilities; |
• | Level 2 inputs include observable inputs other than Level 1 inputs, such as quoted prices for similar assets or liabilities; quoted prices for identical or similar assets or liabilities in markets that are not active; or other inputs that are observable or can be corroborated by observable market data for substantially the full term of the asset or liability. For our marketable securities, we review trading activity and pricing as of the measurement date. When sufficient quoted pricing for identical securities is not available, we use market pricing and other observable market inputs for similar securities obtained from various third-party data providers. These inputs either represent quoted prices for similar assets in active markets or have been derived from observable market data; and |
• | Level 3 inputs include unobservable inputs that are supported by little or no market activity and that are significant to the fair value of the underlying asset or liability. Our Level 3 assets and liabilities include those whose fair value measurements are determined using pricing models, discounted cash flow methodologies or similar valuation techniques and significant management judgment or estimation. |
Our financial instruments consist primarily of cash and cash equivalents, marketable debt securities, accounts receivable, foreign currency exchange contracts, equity securities, accounts payable and short-term and long-term debt. Cash and cash equivalents, marketable debt securities and certain equity securities, and foreign currency exchange contracts are reported at their respective fair values in our Consolidated Balance Sheets. Equity securities without readily determinable fair values are recorded using the measurement alternative of cost less impairment, if any, adjusted for observable price changes in orderly transactions for identical or similar investments of the same issuer. Short-term and long-term debt are reported at their amortized costs in our Consolidated Balance Sheets. The remaining financial instruments are reported in our Consolidated Balance Sheets at amounts that approximate current fair values.
The following table summarizes the types of assets and liabilities measured at fair value on a recurring basis by level within the fair value hierarchy (in millions):
December 31, 2019 | December 31, 2018 | ||||||||||||||||||||||||||||||
Level 1 | Level 2 | Level 3 | Total | Level 1 | Level 2 | Level 3 | Total | ||||||||||||||||||||||||
Assets: | |||||||||||||||||||||||||||||||
Available-for-sale debt securities: | |||||||||||||||||||||||||||||||
U.S. treasury securities | $ | $ | $ | $ | $ | $ | $ | $ | |||||||||||||||||||||||
Certificates of deposit | |||||||||||||||||||||||||||||||
U.S. government agencies securities | |||||||||||||||||||||||||||||||
Non-U.S. government securities | |||||||||||||||||||||||||||||||
Corporate debt securities | |||||||||||||||||||||||||||||||
Residential mortgage and asset-backed securities | |||||||||||||||||||||||||||||||
Equity securities: | |||||||||||||||||||||||||||||||
Equity investment in Galapagos | |||||||||||||||||||||||||||||||
Money market funds | |||||||||||||||||||||||||||||||
Other publicly traded equity securities | |||||||||||||||||||||||||||||||
Deferred compensation plan | |||||||||||||||||||||||||||||||
Foreign currency derivative contracts | |||||||||||||||||||||||||||||||
Total | $ | $ | $ | $ | $ | $ | $ | $ | |||||||||||||||||||||||
Liabilities: | |||||||||||||||||||||||||||||||
Deferred compensation plan | $ | $ | $ | $ | $ | $ | $ | $ | |||||||||||||||||||||||
Foreign currency derivative contracts | |||||||||||||||||||||||||||||||
Total | $ | $ | $ | $ | $ | $ | $ | $ | |||||||||||||||||||||||
Changes in the fair value of equity securities resulted in net unrealized gains of $1.2 billion and $115 million for the years ended December 31, 2019 and 2018, respectively, which were included in Other income (expense), net, on our Consolidated Statements of Income.
60
The following table summarizes the classification of our equity investment in Galapagos in our Consolidated Balance Sheets (in millions):
December 31, 2019 | December 31, 2018 | ||||||
Prepaid and other current assets | $ | $ | |||||
Other long-term assets | |||||||
Total | $ | $ | |||||
See Note 11. Collaborative and Other Arrangements for additional information on our equity investment in Galapagos.
The following table summarizes the classification of our other equity securities in our Consolidated Balance Sheets (in millions):
December 31, 2019 | December 31, 2018 | ||||||
Cash and cash equivalents | $ | $ | |||||
Prepaid and other current assets | |||||||
Other long-term assets | |||||||
Total | $ | $ | |||||
Our available-for-sale debt securities are classified as cash equivalents, short-term marketable securities and long-term marketable securities in our Consolidated Balance Sheets. See Note 4. Available-for-Sale Debt Securities for additional information.
Level 2 Inputs
We estimate the fair values of Level 2 instruments by taking into consideration valuations obtained from third-party pricing services. The pricing services utilize industry standard valuation models, including both income-based and market-based approaches, for which all significant inputs are observable, either directly or indirectly, to estimate the fair value. These inputs include reported trades of and broker/dealer quotes on the same or similar securities, issuer credit spreads, benchmark securities, prepayment/default projections based on historical data and other observable inputs.
Substantially all of our foreign currency derivative contracts have maturities within an 18 month time horizon and all are with counterparties that have a minimum credit rating of A- or equivalent by S&P Global Ratings, Moody’s Investors Service, Inc. or Fitch Ratings, Inc. We estimate the fair values of these contracts by taking into consideration the valuations obtained from a third-party valuation service that utilizes an income-based industry standard valuation model for which all significant inputs are observable, either directly or indirectly. These inputs include foreign currency exchange rates, London Interbank Offered Rates (LIBOR) and swap rates. These inputs, where applicable, are observable at commonly quoted intervals.
The total estimated fair values of our short-term and long-term debt, determined using Level 2 inputs based on their quoted market values, were approximately $27.3 billion and $27.1 billion at December 31, 2019 and 2018, respectively, and the carrying values were $24.6 billion and $27.3 billion at December 31, 2019 and 2018, respectively.
Level 3 Inputs
As of December 31, 2019 and 2018, the only assets or liabilities that were measured using Level 3 inputs on a recurring basis were our contingent consideration liabilities, which were not material.
The fair values of our acquired IPR&D assets are based on probability-adjusted discounted cash flow calculations using Level 3 fair value measurements and inputs including estimated revenues, costs, probability of technical and regulatory success and discount rates. Amounts capitalized as IPR&D are subject to impairment testing until the completion or abandonment of the associated R&D efforts. During the fourth quarter of 2019, we recognized an impairment charge of $800 million associated with the IPR&D intangible assets acquired in connection with the acquisition of Kite Pharma, Inc. (Kite) primarily for the treatment of indolent B-cell non-Hodgkin lymphoma (iNHL). During the fourth quarter of 2018, we recognized an impairment charge of $820 million to write down to zero the carrying value of the KITE-585 program (an anti-B cell maturation antigen being evaluated for the treatment of multiple myeloma). See Note 6. Acquisitions and Note 9. Intangible Assets for additional information.
Our policy is to recognize transfers into or out of Level 3 classification as of the actual date of the event or change in circumstances that caused the transfer. There were no transfers between Level 1, Level 2 and Level 3 in the periods presented.
61
4. AVAILABLE-FOR-SALE DEBT SECURITIES
The following table summarizes our available-for-sale debt securities (in millions):
December 31, 2019 | December 31, 2018 | |||||||||||||||||||||||||||||||
Amortized Cost | Gross Unrealized Gains | Gross Unrealized Losses | Estimated Fair Value | Amortized Cost | Gross Unrealized Gains | Gross Unrealized Losses | Estimated Fair Value | |||||||||||||||||||||||||
U.S. treasury securities | $ | $ | $ | $ | $ | $ | $ | ( | ) | $ | ||||||||||||||||||||||
Certificates of deposit | ||||||||||||||||||||||||||||||||
U.S. government agencies securities | ( | ) | ||||||||||||||||||||||||||||||
Non-U.S. government securities | ( | ) | ||||||||||||||||||||||||||||||
Corporate debt securities | ( | ) | ( | ) | ||||||||||||||||||||||||||||
Residential mortgage and asset-backed securities | ( | ) | ||||||||||||||||||||||||||||||
Total | $ | $ | $ | ( | ) | $ | $ | $ | $ | ( | ) | $ | ||||||||||||||||||||
The following table summarizes the classification of our available-for-sale debt securities in our Consolidated Balance Sheets (in millions):
December 31, 2019 | December 31, 2018 | ||||||
Cash and cash equivalents | $ | $ | |||||
Short-term marketable securities | |||||||
Long-term marketable securities | |||||||
Total | $ | $ | |||||
The following table summarizes our available-for-sale debt securities by contractual maturity (in millions):
December 31, 2019 | |||||||
Amortized Cost | Fair Value | ||||||
Within one year | $ | $ | |||||
After one year through five years | |||||||
After five years | |||||||
Total | $ | $ | |||||
The following table summarizes our available-for-sale debt securities that were in a continuous unrealized loss position, but were not deemed to be other-than-temporarily impaired (in millions):
Less Than 12 Months | 12 Months or Greater | Total | ||||||||||||||||||||||
Gross Unrealized Losses | Estimated Fair Value | Gross Unrealized Losses | Estimated Fair Value | Gross Unrealized Losses | Estimated Fair Value | |||||||||||||||||||
December 31, 2019 | ||||||||||||||||||||||||
Corporate debt securities | $ | ( | ) | $ | $ | $ | $ | ( | ) | $ | ||||||||||||||
December 31, 2018 | ||||||||||||||||||||||||
U.S. treasury securities | $ | $ | $ | ( | ) | $ | $ | ( | ) | $ | ||||||||||||||
U.S. government agencies securities | ( | ) | ( | ) | ||||||||||||||||||||
Non-U.S. government securities | ( | ) | ( | ) | ||||||||||||||||||||
Corporate debt securities | ( | ) | ( | ) | ( | ) | ||||||||||||||||||
Residential mortgage and asset-backed securities | ( | ) | ( | ) | ||||||||||||||||||||
Total | $ | ( | ) | $ | $ | ( | ) | $ | $ | ( | ) | $ | ||||||||||||
We held a total of 305 and 1,348 positions, which were in an unrealized loss position as of December 31, 2019 and 2018, respectively.
62
Based on our review of these securities, we believe we had no other-than-temporary impairments as of December 31, 2019 and 2018, because we do not intend to sell these securities nor do we believe that we will be required to sell these securities before the recovery of their amortized cost basis. Gross realized gains and gross realized losses on available-for-sale debt securities were not material for the years ended December 31, 2019 and 2018.
5. | DERIVATIVE FINANCIAL INSTRUMENTS |
Our operations in foreign countries expose us to market risk associated with foreign currency exchange rate fluctuations between the U.S. dollar and various foreign currencies, primarily the Euro. To manage this risk, we may hedge a portion of our foreign currency exposures related to outstanding monetary assets and liabilities as well as forecasted product sales using foreign currency exchange forward or option contracts. In general, the market risk related to these contracts is offset by corresponding gains and losses on the hedged transactions. The credit risk associated with these contracts is driven by changes in interest and currency exchange rates and, as a result, varies over time. By working only with major banks and closely monitoring current market conditions, we seek to limit the risk that counterparties to these contracts may be unable to perform. We also seek to limit our risk of loss by entering into contracts that permit net settlement at maturity. Therefore, our overall risk of loss in the event of a counterparty default is limited to the amount of any unrealized gains on outstanding contracts (i.e., those contracts that have a positive fair value) at the date of default. We do not enter into derivative contracts for trading purposes.
We hedge our exposure to foreign currency exchange rate fluctuations for certain monetary assets and liabilities of our entities that are denominated in a non-functional currency. The derivative instruments we use to hedge this exposure are not designated as hedges, and as a result, changes in their fair value are recorded in Other income (expense), net, on our Consolidated Statements of Income.
We hedge our exposure to foreign currency exchange rate fluctuations for forecasted product sales that are denominated in a non-functional currency. The derivative instruments we use to hedge this exposure are designated as cash flow hedges and have maturities of 18 months or less. Upon executing a hedging contract and quarterly thereafter, we assess hedge effectiveness using regression analysis. The unrealized gains or losses in AOCI are reclassified into product sales when the respective hedged transactions affect earnings. The majority of gains and losses related to the hedged forecasted transactions reported in AOCI at December 31, 2019 are expected to be reclassified to product sales within 12 months.
The cash flow effects of our derivative contracts for the years ended December 31, 2019, 2018 and 2017 are included within Net cash provided by operating activities on our Consolidated Statements of Cash Flows.
We had notional amounts on foreign currency exchange contracts outstanding totaling $2.9 billion and $2.2 billion at December 31, 2019 and 2018, respectively.
While all our derivative contracts allow us the right to offset assets and liabilities, we have presented amounts on a gross basis. The following table summarizes the classification and fair values of derivative instruments in our Consolidated Balance Sheets (in millions):
December 31, 2019 | ||||||||||||
Asset Derivatives | Liability Derivatives | |||||||||||
Classification | Fair Value | Classification | Fair Value | |||||||||
Derivatives designated as hedges: | ||||||||||||
Foreign currency exchange contracts | Other current assets | $ | Other accrued liabilities | $ | ( | ) | ||||||
Foreign currency exchange contracts | Other long-term assets | Other long-term obligations | ( | ) | ||||||||
Total derivatives designated as hedges | ( | ) | ||||||||||
Derivatives not designated as hedges: | ||||||||||||
Foreign currency exchange contracts | Other current assets | Other accrued liabilities | ||||||||||
Total derivatives not designated as hedges | ||||||||||||
Total derivatives | $ | $ | ( | ) | ||||||||
63
December 31, 2018 | ||||||||||||
Asset Derivatives | Liability Derivatives | |||||||||||
Classification | Fair Value | Classification | Fair Value | |||||||||
Derivatives designated as hedges: | ||||||||||||
Foreign currency exchange contracts | Other current assets | $ | Other accrued liabilities | $ | ( | ) | ||||||
Foreign currency exchange contracts | Other long-term assets | Other long-term obligations | ||||||||||
Total derivatives designated as hedges | ( | ) | ||||||||||
Derivatives not designated as hedges: | ||||||||||||
Foreign currency exchange contracts | Other current assets | Other accrued liabilities | ||||||||||
Total derivatives not designated as hedges | ||||||||||||
Total derivatives | $ | $ | ( | ) | ||||||||
The following table summarizes the effect of our foreign currency exchange contracts on our Consolidated Financial Statements (in millions):
Year Ended December 31, | ||||||||||||
2019 | 2018 | 2017 | ||||||||||
Derivatives designated as hedges: | ||||||||||||
Gain (loss) recognized in AOCI | $ | $ | $ | ( | ) | |||||||
Gain (loss) reclassified from AOCI into product sales | $ | $ | ( | ) | $ | ( | ) | |||||
Gain recognized in Other income (expense), net | $ | $ | $ | |||||||||
Derivatives not designated as hedges: | ||||||||||||
Gain (loss) recognized in Other income (expense), net | $ | $ | ( | ) | $ | ( | ) | |||||
From time to time, we may discontinue cash flow hedges, and as a result, record related amounts in Other income (expense), net, on our Consolidated Statements of Income. There was no discontinuance of cash flow hedges for the years presented.
As of December 31, 2019 and 2018, we only held foreign currency exchange contracts. The following table summarizes the potential effect of offsetting derivatives by type of financial instrument on our Consolidated Balance Sheets (in millions):
Gross Amounts Not Offset on the Consolidated Balance Sheets | ||||||||||||||||||||||||
Description | Gross Amounts of Recognized Assets/Liabilities | Gross Amounts Offset on the Consolidated Balance Sheets | Amounts of Assets/Liabilities Presented on the Consolidated Balance Sheets | Derivative Financial Instruments | Cash Collateral Received/Pledged | Net Amount (Legal Offset) | ||||||||||||||||||
As of December 31, 2019 | ||||||||||||||||||||||||
Derivative assets | $ | $ | $ | $ | ( | ) | $ | $ | ||||||||||||||||
Derivative liabilities | ( | ) | ( | ) | ( | ) | ||||||||||||||||||
As of December 31, 2018 | ||||||||||||||||||||||||
Derivative assets | $ | $ | $ | $ | ( | ) | $ | $ | ||||||||||||||||
Derivative liabilities | ( | ) | ( | ) | ||||||||||||||||||||
6. ACQUISITIONS
Kite Pharma, Inc.
In October 2017 (the Acquisition Date), we completed a tender offer for all of the outstanding common stock of Kite for $180 per share in cash. As a result, Kite became our wholly-owned subsidiary. The acquisition of Kite helps establish our foundation for improving the treatment of hematological malignancies and solid tumors.
The consideration transferred for the acquisition was $11,155 million, consisting of $10,420 million in cash to the outstanding Kite common stockholders, $645 million cash payment to vested equity award holders, $15 million to warrant holders and $75 million representing the portion of the replaced stock-based awards attributable to the pre-combination period. In addition, $733 million was excluded from the consideration transferred, representing the portion of the replaced stock-based awards attributable
64
to the post combination period (Replacement Awards), which is expected to be recognized through 2021. As of December 31, 2019, unrecognized compensation cost related to the Replacement Awards was not material.
The acquisition of Kite was accounted for as a business combination using the acquisition method of accounting. This method requires, among other things, that assets acquired and liabilities assumed be recognized at fair value as of the acquisition date. The determination of estimated fair value requires us to make significant estimates and assumptions. During 2018, we recorded a $42 million reduction to goodwill primarily due to revision of deferred income taxes as a result of finalization of Kite’s pre-acquisition federal income tax return. The fair value estimates for the assets acquired and liabilities assumed have been completed.
The following table summarizes the acquisition date fair values of assets acquired and liabilities assumed, and the consideration transferred (in millions):
Cash and cash equivalents | $ | |||
Identifiable intangible assets | ||||
Indefinite-lived intangible assets - IPR&D | ||||
Outlicense acquired | ||||
Deferred income taxes | ( | ) | ||
Other assets acquired (liabilities assumed), net | ||||
Total identifiable net assets | ||||
Goodwill | ||||
Total consideration transferred | $ | |||
Identifiable Intangible Assets
We acquired intangible assets primarily related to IPR&D for axicabtagene ciloleucel, KITE-585 program, and KTE-X19 (formerly KTE-C19, being evaluated for the treatment of acute lymphoblastic leukemia (ALL)), which had an estimated aggregate fair value of $8,950 million as of the Acquisition Date.
Intangible assets related to IPR&D projects are considered to be indefinite-lived assets until the completion or abandonment of the associated R&D efforts. In October 2017, axicabtagene ciloleucel, now known commercially as Yescarta, was approved by FDA for the treatment of adult patients with relapsed or refractory diffuse large B-cell lymphoma (DLBCL) after two or more lines of systemic therapy. Upon FDA approval of Yescarta, $6,200 million of the purchased IPR&D was reclassified as a finite-lived intangible asset and is being amortized over an estimated useful life of 18 years using the straight-line method. In 2019, we recognized an impairment charge of $800 million primarily related to axicabtagene ciloleucel for the treatment of iNHL. In 2018, we recognized an impairment charge of $820 million to write down to zero the carrying value of the KITE-585 program. See Note 9. Intangible Assets for additional information.
Additionally, we acquired an outlicensing arrangement with Daiichi Sankyo Company Limited, which had an estimated fair value of $91 million as of the Acquisition Date. This definite-lived intangible asset is being amortized over an estimated useful life of 14 years on a straight-line basis. The fair value was determined by estimating the probability-weighted net cash flows attributable to the outlicense discounted to present value using a discount rate that represents the estimated rate that market participants would use to value this intangible asset.
Goodwill
The $2,945 million goodwill represents the excess of the consideration transferred over the fair values of assets acquired and liabilities assumed and represents the future economic benefits arising from other assets acquired that could not be individually identified and separately recognized. None of the goodwill is deductible for income tax purposes.
Cell Design Labs, Inc.
In December 2017, we acquired all of the issued and outstanding stock of Cell Design Labs, Inc., a privately held company (Cell Design Labs), which was in addition to the approximately 12.2 % of shares in Cell Design Labs we obtained in the acquisition of Kite. With this acquisition, we gained new technology platforms that will enhance R&D efforts in cellular therapy.
The cash consideration totaled $150 million, net of acquired cash. Additionally, the shareholders of Cell Design Labs, other than us, are eligible to receive contingent development and regulatory milestone-based payments of up to $322 million. Our 12.2 % equity interest in Cell Design Labs had a carrying value of $30 million. The transaction was accounted for as an asset acquisition. As a result, $172 million was expensed as acquired IPR&D within Research and development expenses on our Consolidated Statements of Income.
65
7. | INVENTORIES |
The following table summarizes our inventories (in millions):
December 31, | ||||||||
2019 | 2018 | |||||||
Raw materials | $ | $ | ||||||
Work in process | ||||||||
Finished goods | ||||||||
Total | $ | $ | ||||||
Reported as: | ||||||||
Inventories | $ | $ | ||||||
Other long-term assets | ||||||||
Total | $ | $ | ||||||
Amounts reported as other long-term assets primarily consisted of raw materials as of December 31, 2019 and 2018.
During the year ended December 31, 2019, we recorded inventory write-downs of $649 million, of which $547 million was related to slow moving and excess raw material and work in progress inventory primarily due to lower long-term demand for our hepatitis C virus (HCV) products. During the year ended December 31, 2018, we recorded inventory write-downs of $572 million, of which $440 million was related to excess raw materials primarily due to a sustained decrease in demand for Harvoni. Inventory write-downs recorded for the year ended December 31, 2017 were not material.
8. | PROPERTY, PLANT AND EQUIPMENT |
The following table summarizes our Property, plant and equipment (in millions):
December 31, | ||||||||
2019 | 2018 | |||||||
Land and land improvements | $ | $ | ||||||
Buildings and improvements (including leasehold improvements) | ||||||||
Laboratory and manufacturing equipment | ||||||||
Office and computer equipment | ||||||||
Construction in progress | ||||||||
Subtotal | ||||||||
Less accumulated depreciation and amortization | ( | ) | ( | ) | ||||
Total | $ | $ | ||||||
Office and computer equipment includes capitalized software. We had unamortized capitalized software costs on our Consolidated Balance Sheets of $108 million and $121 million as of December 31, 2019 and 2018, respectively. Capitalized interest on construction in-progress is included in property, plant and equipment. Interest capitalized in 2019, 2018 and 2017 was not material.
66
9. | INTANGIBLE ASSETS |
The following table summarizes our intangible assets, net (in millions):
December 31, 2019 | December 31, 2018 | |||||||||||||||||||||||||||||||
Gross Carrying Amount | Accumulated Amortization | Foreign Currency Translation Adjustment | Net Carrying Amount | Gross Carrying Amount | Accumulated Amortization | Foreign Currency Translation Adjustment | Net Carrying Amount | |||||||||||||||||||||||||
Finite-lived assets | ||||||||||||||||||||||||||||||||
Intangible asset - sofosbuvir | $ | $ | ( | ) | $ | $ | $ | $ | ( | ) | $ | $ | ||||||||||||||||||||
Intangible asset - axicabtagene ciloleucel (DLBCL) | ( | ) | ( | ) | ||||||||||||||||||||||||||||
Intangible asset - Ranexa | ( | ) | ( | ) | ||||||||||||||||||||||||||||
Other | ( | ) | ( | ) | ( | ) | ( | ) | ||||||||||||||||||||||||
Total finite-lived assets | ( | ) | ( | ) | ( | ) | ( | ) | ||||||||||||||||||||||||
Indefinite-lived assets - IPR&D | — | ( | ) | — | ( | ) | ||||||||||||||||||||||||||
Total intangible assets | $ | $ | ( | ) | $ | ( | ) | $ | $ | $ | ( | ) | $ | ( | ) | $ | ||||||||||||||||
Aggregate amortization expense related to finite-lived intangible assets was $1.1 billion, $1.2 billion and $912 million for the years ended December 31, 2019, 2018 and 2017, respectively, and is primarily included in Cost of goods sold on our Consolidated Statements of Income.
Amounts capitalized as IPR&D are subject to impairment testing until the completion or abandonment of the associated R&D efforts. During the fourth quarter of 2019, we performed quantitative impairment testing of our IPR&D intangible assets using a probability-weighted income approach that discounts expected future cash flows to present value. The estimated net cash flows were discounted using a discount rate of 9.5 %, which is based on the estimated weighted-average cost of capital for companies with profiles similar to our profile and represents the rate that market participants would use to value the intangible assets. The discounted cash flow models used in valuing these intangible assets also require the use of Level 3 fair value measurements and inputs including estimated revenues, costs, and probability of technical and regulatory success. In comparison to the 2018 assessment, we used lower estimated revenues in 2019 due to changes in the estimated market opportunities as new therapies or combinations of existing therapies were approved. The lower estimated revenues reduced the fair value of the IPR&D intangible assets, primarily related to axicabtagene ciloleucel for the treatment of iNHL, below carrying value resulting in the recognition of an impairment charge of $800 million, which was recorded within Research and development expenses on our Consolidated Statements of Income.
In 2018, we concluded that the KITE-585 program did not justify further efforts based on the totality of the clinical data gathered and discontinued the program. As a result, the carrying value of the IPR&D relating to the KITE-585 program was written down to zero and we recorded an impairment charge of $820 million within Research and development expenses on our Consolidated Statements of Income. No IPR&D impairment charges were recorded in 2017.
The following table summarizes the estimated future amortization expense associated with our finite-lived intangible assets as of December 31, 2019 (in millions):
Fiscal Year | Amount | ||
2020 | $ | ||
2021 | |||
2022 | |||
2023 | |||
2024 | |||
Thereafter | |||
Total | $ | ||
67
10. | OTHER FINANCIAL INFORMATION |
Other Accrued Liabilities
The following table summarizes the components of Other accrued liabilities (in millions):
December 31, | ||||||||
2019 | 2018 | |||||||
Compensation and employee benefits | $ | $ | ||||||
Income taxes payable | ||||||||
Accrued payment for marketing-related rights acquired from Japan Tobacco Inc. | ||||||||
Other accrued expenses | ||||||||
Total | $ | $ | ||||||
11. | COLLABORATIVE AND OTHER ARRANGEMENTS |
We enter into collaborative and other similar arrangements with third parties for the development and commercialization of certain products and product candidates. These arrangements involve two or more parties who are active participants in the operating activities of the collaboration and are exposed to significant risks and rewards depending on the commercial success of the activities. These arrangements may include non-refundable, up-front payments, payments by us for options to acquire certain rights, contingent obligations by us for potential development and regulatory milestone payments and/or sales-based milestone payments, royalty payments, revenue or profit-sharing arrangements, cost-sharing arrangements and equity investments.
Galapagos
Filgotinib Collaboration
In 2016, we closed a license and collaboration agreement with Galapagos, a clinical-stage biotechnology company based in Belgium, for the development and commercialization of filgotinib, a JAK1-selective inhibitor being evaluated for inflammatory disease indications (the filgotinib agreement). Upon closing, we made an up-front license fee payment and an equity investment in Galapagos by subscribing for 6.8 million new ordinary shares of Galapagos at a price of €58 per share. The equity investment, net of issuance premium, was $357 million.
Under the terms of the filgotinib agreement, as amended in 2019, we have an exclusive, worldwide, royalty-bearing, sublicensable license for filgotinib and products containing filgotinib. As of December 31, 2019, Galapagos is eligible to receive from us potential future development and regulatory milestone-based payments of up to $640 million, sales-based milestone payments of up to $600 million, plus tiered royalties on global net sales ranging from 20 % to 30 %, with the exception of certain co-commercialization territories where profits would be shared equally. The co-commercialization territories are the UK, Germany, France, Italy, Spain, Belgium, the Netherlands and Luxembourg. We share global development costs for filgotinib equally. For the periods presented, the payments between Galapagos and us for the development costs and milestones were not material. Termination of the agreement may be on a country-by-country basis and will depend on the circumstances, including expiration of royalty term or in the co-commercialization territories, sale of a generic product, or material breach by either party. We may also terminate the entire agreement without cause following a certain period.
Global Collaboration
In August 2019, we closed an Option, License and Collaboration Agreement (the Collaboration Agreement) and a Subscription Agreement (the Subscription Agreement), each with Galapagos, pursuant to which the parties entered into a global collaboration that covers Galapagos’ current and future product portfolio (other than filgotinib). Upon closing, we paid $5.05 billion for the license and option rights and for 6.8 million new ordinary shares of Galapagos at a subscription price of €140.59 per share with a fair value of $1.13 billion, which included an issuance discount of $63 million calculated based on Galapagos’ closing stock price on the date of closing of the Subscription Agreement. The remaining $3.92 billion of the payment was recorded within Research and development expenses on our Consolidated Statements of Income.
Pursuant to the Subscription Agreement, we were issued warrants that confer the right to subscribe, from time to time, for a number of new shares to be issued by Galapagos sufficient to bring the number of shares owned by us to 29.9 % of the issued and outstanding shares at the time of our exercises. In the fourth quarter of 2019, we exercised a warrant to subscribe for 2.6 million ordinary shares of Galapagos at €140.59 per share and purchased shares on the open market with an aggregate fair value of $586 million, which brought the number of shares owned by us to 16.7 million or approximately 25.8 % of the shares then issued and outstanding.
Our equity investment in Galapagos is classified as Other long-term assets on our Consolidated Balance Sheets as it is subject to contractual lock-up provisions. We are subject to a 10 -year standstill restricting our ability to acquire voting securities of
68
Galapagos exceeding more than 29.9 % of the then issued and outstanding voting securities of Galapagos. We agreed not to, without the prior consent of Galapagos, dispose of any equity securities of Galapagos prior to the second anniversary of the closing of the Subscription Agreement or dispose of any equity securities of Galapagos thereafter until the fifth anniversary of the closing of the Subscription Agreement, if after such disposal we would own less than 20.1 % of the then issued and outstanding voting securities of Galapagos, subject to certain exceptions and termination events. We have two designees appointed to Galapagos’ board of directors.
We have elected the fair value option to account for our equity investment in Galapagos whereby the investment is marked to market through earnings in each reporting period based on the market price of Galapagos’ shares. We believe the fair value option best reflects the underlying economics of the investment. See Note 3. Fair Value Measurements for additional information.
Under the Collaboration Agreement, we have an exclusive license for the development and commercialization of GLPG-1690, a Phase 3 candidate for idiopathic pulmonary fibrosis, in our territories and have an option to participate in the development and commercialization of GLPG-1972, a Phase 2b candidate for osteoarthritis, and Galapagos’ other current and future clinical programs that have entered clinical development during the first ten years of the collaboration, subject to extension in certain circumstances. We may exercise our option for a program after the receipt of a data package from a completed, qualifying Phase 2 study for such program (or, in certain circumstances, the first Phase 3 study). If GLPG-1690 receives marketing approval in the United States, we will pay Galapagos $325 million as well as tiered royalties described below. If we exercise our option to the GLPG-1972 program, we will pay a $250 million option exercise fee and Galapagos would be eligible to receive up to $750 million in development, regulatory and commercial milestones as well as tiered royalties described below. With respect to all other programs in Galapagos’ current and future pipeline, if we exercise our option to a program, we will pay a $150 million option exercise fee per program. In addition, Galapagos will receive tiered royalties ranging from 20 % to 24 % on net sales in our territories of each Galapagos product optioned by us (including GLPG-1690 and GLPG-1972). If we exercise our option for a program, the parties will share equally in development costs and mutually agreed commercialization costs incurred subsequent to our exercise of the option. Galapagos retains exclusive commercialization rights for the optioned programs in the European Union, the UK, Iceland, Norway, Lichtenstein and Switzerland, and we have exclusive commercialization rights for all other countries globally, except for GLPG-1972 where we will only acquire the U.S. rights. We may terminate the collaboration in its entirety or on a program-by-program and country-by-country basis with advance notice as well as following other customary termination events.
Janssen
Complera/Eviplera and Odefsey
In 2009, we entered into a license and collaboration agreement with Janssen Sciences Ireland UC (Janssen), formerly Tibotec Pharmaceuticals, to develop and commercialize a fixed-dose combination of our Truvada and Janssen’s non-nucleoside reverse transcriptase inhibitor, rilpivirine. This combination was approved in the United States and European Union in 2011 and is sold under the brand name Complera in the United States and Eviplera in the European Union.
The agreement was amended in 2014 to expand the collaboration to include another product containing Janssen’s rilpivirine and our emtricitabine and tenofovir alafenamide (Odefsey).
Under the amended agreement, Janssen granted us an exclusive license to Complera/Eviplera and Odefsey worldwide, but retained rights to distribute both combination products in certain countries outside of the United States. Neither party is restricted from combining its drugs with any other drug products except those which are similar to the components of Complera/Eviplera and Odefsey.
We are responsible for manufacturing Complera/Eviplera and Odefsey and have the lead role in registration, distribution and commercialization of both products except in the countries where Janssen distributes. Janssen has exercised a right to co-detail the combination product in some of the countries where we are the selling party.
Under the financial provisions of the 2014 amendment, the selling party sets the price of the combined products and the parties share revenues based on the ratio of the net selling prices of the party’s component(s), subject to certain restrictions and adjustments. We retain a specified percentage of Janssen’s share of revenues, including up to 30 % in major markets. Sales of these products are included in Product sales and Janssen’s shares of revenues are included in Cost of goods sold on our Consolidated Statements of Income. Cost of goods sold relating to Janssen’s shares were $574 million, $608 million and $561 million for the years ended December 31, 2019, 2018 and 2017, respectively.
Termination of the agreement may be on a product or country basis and will depend on the circumstances, including withdrawal of a product from the market, material breach by either party or expiry of revenue share payment term. We may terminate the agreement without cause with respect to the countries where we sell the products in which case Janssen has the right to become the selling party for such country if the product has launched but has been on the market for fewer than 10 years.
69
Symtuza
In 2014, we amended a license and collaboration agreement with Janssen to develop and commercialize a fixed-dose combination of Janssen’s darunavir and our cobicistat, emtricitabine and tenofovir alafenamide. This combination was approved in the United States and European Union in July 2018 and September 2017, respectively, and is sold under the brand name Symtuza.
Under the terms of the 2014 amendment, we granted Janssen an exclusive license to Symtuza worldwide. Janssen is responsible for manufacturing, registration, distribution and commercialization of Symtuza worldwide. We are responsible for the intellectual property related to cobicistat, emtricitabine and tenofovir alafenamide (Gilead Compounds) and are the exclusive supplier of the Gilead Compounds. Neither party is restricted from combining its drugs with any other drug products except those which are similar to the components of Symtuza.
Janssen sets the price of Symtuza and the parties share revenue based on the ratio of the net selling prices of the party’s component(s), subject to certain restrictions and adjustments. The intellectual property license and supply obligations related to the Gilead Compounds are accounted for as a single performance obligation. As the license was deemed to be the predominant item to which the revenue share relates, we recognize our share of the Symtuza revenue in the period when the corresponding sales of Symtuza by Janssen occur. We record our share of the Symtuza revenue as Product sales on our Consolidated Statements of Income primarily because we supply the Gilead Compounds to Janssen for Symtuza. See Note 2. Revenues for revenue recognized for the periods presented.
Termination of the agreement may be on a product or country basis and will depend on the circumstances, including withdrawal of a product from the market, material breach by either party or expiry of revenue share payment term. Janssen may terminate the agreement without cause on a country-by-country basis, in which case Gilead has the right to become the selling party for such country(ies) if the product has launched but has been on the market for fewer than 10 years. Janssen may also terminate the entire agreement without cause.
Japan Tobacco
In 2005, Japan Tobacco, Inc. (Japan Tobacco) granted us exclusive rights to develop and commercialize elvitegravir, a novel HIV integrase inhibitor, in all countries of the world, excluding Japan, where Japan Tobacco retained such rights and paid a royalty to us based on its product sales in Japan. Under the agreement, we are responsible for seeking regulatory approval in our territories and are required to use diligent efforts to commercialize elvitegravir for the treatment of HIV infection. We bear all costs and expenses associated with such commercialization efforts and pay a royalty to Japan Tobacco based on our product sales. Japan Tobacco also marketed and distributed certain other products in our HIV portfolio in Japan and paid a royalty to us based on these product sales.
We received approval for Stribild and Genvoya (elvitegravir-containing products) in 2012 and 2015, respectively. Our sales of these products are included in Product sales. Royalties due to Japan Tobacco based on our product sales are included in Cost of goods sold. Royalties due from Japan Tobacco based on its product sales in Japan are included in Royalty, contract and other revenues on our Consolidated Statements of Income. Royalty expenses recognized were $358 million, $452 million and $400 million for the years ended December 31, 2019, 2018 and 2017, respectively. Royalty income recognized was not material for the periods presented.
Effective in December 2018, we entered into an agreement with Japan Tobacco to acquire the rights to market and distribute certain products in our HIV portfolio in Japan and to expand our rights to develop and commercialize elvitegravir to include Japan. We are responsible for the marketing of the products as of January 1, 2019.
Under the terms of the agreement, we paid Japan Tobacco $559 million in cash, of which $194 million was paid as an up-front payment in 2018, and the remaining $365 million was paid in 2019. We recognized an intangible asset of $550 million reflecting the estimated fair value of the marketing-related rights acquired from Japan Tobacco with the remaining $9 million recorded as Prepaid and other current assets on our Consolidated Balance Sheets. The intangible asset is being amortized over nine years , representing the period over which the majority of the benefits are expected to be derived from the applicable products in our HIV portfolio. The amortization expense is classified as selling expense and recorded as Selling, general and administrative expenses on our Consolidated Statements of Income.
Termination of the agreement may be on a product or country basis and will depend on the circumstances, including material breach by either party or expiry of royalty payment term. We may also terminate the entire agreement without cause.
Gadeta
In July 2018, we entered into a collaboration arrangement with Gadeta, a privately-held company based in Utrecht, the Netherlands, to develop gamma delta T cell receptor therapies for various cancers. Under the financial terms, we provide R&D funding for the collaboration, and Gadeta is eligible to receive future payments upon achievement of certain regulatory milestones. In addition, we made an upfront purchase of equity in Gadeta from Gadeta’s shareholders and may acquire additional equity in Gadeta upon achievement of certain R&D milestones. We also have the exclusive option to acquire the remaining equity in Gadeta
70
for €300 million, adjusted for closing cash, transaction expenses and closing indebtedness. The option is exercisable at our discretion.
Gadeta is a VIE, and we are its primary beneficiary because we have the power to direct the activities of Gadeta that most significantly impact its economic performance and as a result of the financial terms described above. Upon the initial consolidation of Gadeta, we recorded assets of $117 million, primarily intangible assets related to IPR&D and $82 million to Noncontrolling interest on our Consolidated Balance Sheets. Gadeta does not meet the definition of a business as defined in ASC 805, “Business Combinations”, and as a result, no goodwill was recognized.
Bristol-Myers Squibb Company
North America
We had a collaboration arrangement with Bristol-Myers Squibb Company (BMS) to develop and commercialize a single tablet regimen containing our Truvada and BMS’s Sustiva (efavirenz) in the United States and Canada. This combination is sold under the brand name Atripla. We and BMS structured this collaboration as a joint venture that operated as a limited liability company, which we consolidated.
On December 31, 2017, we terminated BMS’s participation in the collaboration following the launch of a generic version of Sustiva in the U.S. and became the sole owner of the joint venture. BMS is not permitted to commercialize Atripla in the United States and Canada but is entitled to receive from us certain fees based on net sales of Atripla in 2018, 2019 and 2020 on a declining annual scale. BMS supplies Sustiva to us at cost plus a markup during this three-year period but may terminate the supply agreement after a notice period. BMS notified us of their voluntary termination of the supply agreement in 2019.
For the years ended December 31, 2019 and 2018 we recorded $58 million and $198 million. respectively, of fee expenses within Cost of goods sold on our Consolidated Statements of Income.
Europe
Gilead Sciences Ireland UC, our wholly-owned subsidiary, and BMS have a collaboration agreement which sets forth the terms and conditions under which we and BMS commercialize and distribute Atripla in the European Union, Iceland, Liechtenstein, Norway and Switzerland (collectively, the European Territory). The parties formed a limited liability company which we consolidate, to manufacture Atripla for distribution in the European Territory using efavirenz that it purchases from BMS at BMS’s estimated net selling price of efavirenz in the European Territory. The parties also formed a limited liability company to hold the marketing authorization for Atripla in the European Territory.
Starting in 2012, except for a limited number of activities that are jointly managed, the parties no longer coordinate detailing and promotional activities in the European Territory. We are responsible for manufacturing, product distribution, inventory management and warehousing and have primary responsibility for regulatory activities. Through our local subsidiaries, we have primary responsibility for order fulfillment, collection of receivables, customer relations and handling of sales returns in all the territories where we and BMS promote Atripla. In general, the parties share revenues and out-of-pocket expenses in proportion to the net selling prices of the components of Atripla, Truvada and efavirenz. As of December 31, 2019 and 2018, efavirenz purchased from BMS at BMS’s estimated net selling price of efavirenz in the European Territory was included in Inventories on our Consolidated Balance Sheets.
In September 2019, BMS elected to voluntarily terminate the agreement effective March 31, 2020. Post termination, BMS is not permitted to commercialize Atripla in the European territory but is entitled to receive from us certain fees based on net sales of Atripla on a declining annual scale for a three-year period following the effective date of the termination.
Other collaboration arrangements that are not individually significant
During 2019 and 2018, we entered into several collaborative and other similar arrangements, including equity investments and licensing arrangements, that we do not consider to be individually material. Cash outflows related to these arrangements totaled $467 million and $474 million for the years ended December 31, 2019 and 2018, respectively. We recorded up-front collaboration and licensing expenses related to these arrangements of $331 million and $278 million for the years ended December 31, 2019 and 2018, respectively, within Research and development expenses on our Consolidated Statements of Income and the remaining amounts were recorded in current and other long-term assets on our Consolidated Balance Sheets. We made no material cash payments related to individually insignificant collaboration arrangements entered into in 2017.
71
12. | DEBT AND CREDIT FACILITIES |
The following table summarizes the carrying amount of our borrowings under various financing arrangements (in millions):
December 31, | ||||||||||||||
Type of Borrowing | Issue Date | Due Date | Interest Rate | 2019 | 2018 | |||||||||
Senior Unsecured | September 2017 | March 2019 | 3-month LIBOR + 0.22% | $ | $ | |||||||||
Senior Unsecured | March 2014 | April 2019 | ||||||||||||
Senior Unsecured | September 2017 | September 2019 | ||||||||||||
Senior Unsecured | September 2017 | September 2019 | 3-month LIBOR + 0.25% | |||||||||||
Senior Unsecured | November 2014 | February 2020 | ||||||||||||
Senior Unsecured | September 2015 | September 2020 | ||||||||||||
Senior Unsecured | March 2011 | April 2021 | ||||||||||||
Senior Unsecured | December 2011 | December 2021 | ||||||||||||
Senior Unsecured | September 2016 | March 2022 | ||||||||||||
Senior Unsecured | September 2015 | September 2022 | ||||||||||||
Senior Unsecured | September 2016 | September 2023 | ||||||||||||
Senior Unsecured | March 2014 | April 2024 | ||||||||||||
Senior Unsecured | November 2014 | February 2025 | ||||||||||||
Senior Unsecured | September 2015 | March 2026 | ||||||||||||
Senior Unsecured | September 2016 | March 2027 | ||||||||||||
Senior Unsecured | September 2015 | September 2035 | ||||||||||||
Senior Unsecured | September 2016 | September 2036 | ||||||||||||
Senior Unsecured | December 2011 | December 2041 | ||||||||||||
Senior Unsecured | March 2014 | April 2044 | ||||||||||||
Senior Unsecured | November 2014 | February 2045 | ||||||||||||
Senior Unsecured | September 2015 | March 2046 | ||||||||||||
Senior Unsecured | September 2016 | March 2047 | ||||||||||||
Total debt, net | ||||||||||||||
Less current portion | ||||||||||||||
Total long-term debt, net | $ | $ | ||||||||||||
Senior Unsecured Notes
We did not enter into any borrowings in 2019 or 2018. In 2017, in connection with our acquisition of Kite, we issued $3.0 billion aggregate principal amount of senior unsecured notes, of which $750 million of principal balance was repaid at maturity in 2018 and the remaining $2.25 billion was repaid at maturity in 2019.
We collectively refer to our senior unsecured notes issued in September 2016 (the 2016 Notes), in September 2015 (the 2015 Notes), in March and November 2014 (the 2014 Notes) and in March and December 2011 (the 2011 Notes) as our Senior Notes. In 2019 and 2018, we repaid at maturity $500 million and $1.0 billion of principal balance related to the 2014 Notes and 2015 Notes, respectively. In February 2020, we repaid at maturity $500 million of principal balance related to the 2014 Notes.
Our Senior Notes may be redeemed at our option at a redemption price equal to the greater of (i) 100 % of the principal amount of the notes to be redeemed and (ii) the sum, as determined by an independent investment banker, of the present values of the remaining scheduled payments of principal and interest on the notes to be redeemed (exclusive of interest accrued to the date of redemption) discounted to the redemption date on a semiannual basis at the Treasury Rate, plus a make-whole premium as defined in the indenture. Our Senior Notes maturing after 2020 also have a call feature, exercisable at our option, to redeem the notes at par in whole or in part one to six months immediately preceding maturity. In each case, accrued and unpaid interest is also required to be redeemed to the date of redemption.
In the event of the occurrence of a change in control and a downgrade in the rating of our Senior Notes below investment grade by Moody’s Investors Service, Inc. and S&P Global Ratings, the holders may require us to purchase all or a portion of their notes at a price equal to 101 % of the aggregate principal amount of the notes repurchased, plus accrued and unpaid interest to the date of repurchase. We are required to comply with certain covenants under our Senior Notes and as of December 31, 2019 and 2018, we were not in violation of any covenants.
72
Interest expense on our Senior Notes related to the contractual coupon rates and amortization of the debt discount and issuance costs was $1.0 billion, $1.1 billion and $1.0 billion in 2019, 2018 and 2017, respectively.
Credit Facilities
In 2017, in connection with our acquisition of Kite, we borrowed $6.0 billion against our term loan credit facility, of which $1.5 billion was repaid in 2017 and the remaining $4.5 billion was repaid in 2018. The term loan credit facility agreement was terminated in 2018.
In 2016, we entered into a $2.5 billion five-year revolving credit facility agreement maturing in May 2021 (the Five-Year Revolving Credit Agreement). The revolving credit facility can be used for working capital requirements and for general corporate purposes, including, without limitation, acquisitions. As of December 31, 2019 and 2018, there were no amounts outstanding under the Five-Year Revolving Credit Agreement.
The Five-Year Revolving Credit Agreement contains customary representations, warranties, affirmative and negative covenants and events of default. At December 31, 2019, we were not in violation of any covenants. Loans under the Five-Year Revolving Credit Agreement bear interest at either (i) the Eurodollar Rate plus the Applicable Percentage, or (ii) the Base Rate plus the Applicable Percentage, each as defined in the Five-Year Revolving Credit Agreement. We may terminate or reduce the commitments and may prepay any loans under the Five-Year Revolving Credit Agreement in whole or in part at any time without premium or penalty.
Contractual Maturities of Financing Obligations
As of December 31, 2019, the aggregate future principal maturities of financing obligations for each of the next five years, based on contractual due dates, are as follows (in millions):
2020 | 2021 | 2022 | 2023 | 2024 | ||||||||||||||||
Contractual Maturities | $ | $ | $ | $ | $ | |||||||||||||||
13. | LEASES |
Our operating leases consist primarily of properties and equipment for our administrative, manufacturing and R&D activities. We determine if an arrangement contains a lease at inception. Right-of-use assets and lease liabilities are recognized at the commencement date based on the present value of the lease payments over the lease term, which is the non-cancelable period stated in the contract adjusted for any options to extend or terminate when it is reasonably certain that we will exercise that option. Some of our leases include options to extend the terms for up to 15 years and some include options to terminate the lease within one year after the lease commencement date. Right-of-use assets are adjusted for prepaid lease payments, lease incentives and initial direct costs incurred.
As of December 31, 2019, we do not have material finance leases. As most of our operating leases do not provide an implicit interest rate, we generally utilize a collateralized incremental borrowing rate, applied in a portfolio approach when relevant, based on the information available at the commencement date to determine the lease liability. Operating lease expense for the minimum lease payments is recognized on a straight-line basis over the lease term. Operating lease expenses, including variable costs and short-term leases, were $162 million for the year ended December 31, 2019. Operating lease expense under the prior lease standard was $109 million and $84 million for the years ended December 31, 2018 and 2017, respectively.
The following table summarizes balance sheet and other information related to our operating leases as of December 31, 2019 (in millions, except weighted average amounts):
Classification | Amount | |||||
Right-of-use assets, net | Other long-term assets | $ | ||||
Lease liabilities - current | Other accrued liabilities | $ | ||||
Lease liabilities - noncurrent | Other long-term obligations | $ | ||||
Weighted average remaining lease term | ||||||
Weighted average discount rate | % | |||||
73
The following table summarizes other supplemental information related to our operating leases (in millions):
Year Ended | ||||
December 31, 2019 | ||||
Cash paid for amounts included in the measurement of lease liabilities | $ | |||
Right-of-use assets obtained in exchange for lease liabilities | $ | |||
The following table summarizes a maturity analysis of our operating lease liabilities showing the aggregate lease payments as of December 31, 2019 (in millions):
Fiscal Year | Amount | |||
2020 | $ | |||
2021 | ||||
2022 | ||||
2023 | ||||
2024 | ||||
Thereafter | ||||
Total undiscounted lease payments | ||||
Less: imputed interest | ( | ) | ||
Total discounted lease payments | $ | |||
The following table summarizes the aggregate undiscounted non-cancelable future minimum lease payments for operating leases under the prior lease standard as of December 31, 2018 (in millions):
Fiscal Year | Amount | ||
2019 | $ | ||
2020 | |||
2021 | |||
2022 | |||
2023 | |||
Thereafter | |||
Total minimum lease payments | $ | ||
14. | COMMITMENTS AND CONTINGENCIES |
Legal Proceedings
We are a party to various legal actions. The most significant of these are described below. We recognize accruals for such actions to the extent that we conclude that a loss is both probable and reasonably estimable. We accrue for the best estimate of a loss within a range; however, if no estimate in the range is better than any other, then we accrue the minimum amount in the range. If we determine that a loss is reasonably possible and the loss or range of loss can be estimated, we disclose the possible loss. Unless otherwise noted, it is not possible to determine the outcome of these matters, and we cannot reasonably estimate the maximum potential exposure or the range of possible loss.
We did not have any material accruals for the matters described below in our Consolidated Balance Sheets as of December 31, 2019 and 2018.
Litigation Related to Sofosbuvir
In 2012, we acquired Pharmasset, Inc. (Pharmasset). Through the acquisition, we acquired sofosbuvir, a nucleotide analog that acts to inhibit the replication of the HCV. In 2013, we received approval from FDA for sofosbuvir, now known commercially as Sovaldi. Sofosbuvir is also included in all of our marketed HCV products. We have received a number of litigation claims regarding sofosbuvir. While we have carefully considered these claims both prior to and following the acquisition and believe they are without merit, we cannot predict the ultimate outcome of such claims or range of loss.
We are aware of patents and patent applications owned by third parties that have been or may in the future be alleged by such parties to cover the use of our HCV products. If third parties obtain valid and enforceable patents, and successfully prove
74
infringement of those patents by our HCV products, we could be required to pay significant monetary damages. We cannot predict the ultimate outcome of intellectual property claims related to our HCV products. We have spent, and will continue to spend, significant resources defending against these claims.
Litigation with Idenix Pharmaceuticals, Inc. (Idenix), Universita Degli Studi di Cagliari (UDSG), Centre National de la Recherche Scientifique and L’Université Montpellier II
In 2013, Idenix, UDSG, Centre National de la Recherche Scientifique and L’Université Montpellier II sued us in U.S. District Court for the District of Delaware alleging that the commercialization of sofosbuvir infringes U.S. Patent No. 7,608,600 (the ‘600 patent). We prevailed at all phases of litigation concerning the ‘600 patent, and in 2018, the U.S. Supreme Court denied Idenix’s petition for certiorari. Also in 2013, Idenix and UDSG sued us in the U.S. District Court for the District of Massachusetts alleging that the commercialization of sofosbuvir infringes U.S. Patent Nos. 6,914,054 (the ‘054 patent) and 7,608,597 (the ‘597 patent). In 2014, the court transferred the Massachusetts litigation to the U.S. District Court for the District of Delaware.
Prior to trial in 2016, Idenix committed to give us a covenant not to sue with respect to any claims arising out of the ‘054 patent related to sofosbuvir and withdrew that patent from the trial. A jury trial was held in 2016 on the ‘597 patent, and the jury found that we willfully infringed the asserted claims of the ‘597 patent and awarded Idenix $2.54 billion in past damages. In 2018, the judge invalidated Idenix’s ‘597 patent and vacated the jury’s award of $2.54 billion in past damages. Idenix appealed this decision to the U.S. Court of Appeals for the Federal Circuit (CAFC), and in October 2019, the CAFC issued an opinion affirming the trial court’s decision that the ‘597 patent is invalid. Idenix has petitioned for rehearing by the CAFC en banc and may seek review by the U.S. Supreme Court.
Litigation with the University of Minnesota
The University of Minnesota (the University) has obtained U.S. Patent No. 8,815,830 (the ‘830 patent), which purports to broadly cover nucleosides with antiviral and anticancer activity. In 2016, the University filed a lawsuit against us in the U.S. District Court for the District of Minnesota, alleging that the commercialization of sofosbuvir-containing products infringes the ‘830 patent. We believe the ‘830 patent is invalid and will not be infringed by the continued commercialization of sofosbuvir. In 2017, the court granted our motion to transfer the case to California. We have also filed four petitions for inter partes review with the U.S. Patent and Trademark Office (USPTO) Patent Trial and Appeal Board (PTAB) alleging that all asserted claims are invalid for anticipation and obviousness. In 2018, the U.S. District Court for the Northern District of California stayed the litigation until after the PTAB rules on our petitions for inter partes review.
Litigation Related to Axicabtagene Ciloleucel
We own patents and patent applications that protect our axicabtagene ciloleucel chimeric DNA segments. Third parties may have, or may obtain rights to, patents that allegedly could be used to prevent or attempt to prevent us from commercializing axicabtagene ciloleucel or to require us to obtain a license in order to commercialize axicabtagene ciloleucel.
In October 2017, Juno Therapeutics, Inc. and Sloan Kettering Cancer Center (collectively, Juno) filed a lawsuit against us in the U.S. District Court for the Central District of California, alleging that the commercialization of axicabtagene ciloleucel, sold commercially as Yescarta, infringes on U.S. Patent No. 7,446,190 (the ‘190 patent). A jury trial was held on the ‘190 patent, and in December 2019, the jury found that the asserted claims of the ‘190 patent were valid, and that we willfully infringed the asserted claims of the ‘190 patent. The jury also awarded Juno damages in amounts of $585 million in an up-front payment and a 27.6 % running royalty from October 2017 through the date of the jury’s verdict. The parties filed post-trial motions in January 2020 and will file further briefing during the first quarter of 2020, and we expect the judge to rule on these matters later in 2020. Once the district court has issued these rulings and has entered judgment, the case may be appealed to the CAFC. Although we cannot predict with certainty the ultimate outcome of this litigation, we believe the jury’s verdict to be in error, and we also believe that errors were made by the court with respect to certain rulings before and during trial.
In assessing whether we should accrue a liability for this litigation in our consolidated financial statements, we considered various factors, including the legal and factual circumstances of the case, the jury’s verdict, the district court’s pre- and post-trial orders, the current status of the proceedings, applicable law, the views of legal counsel and the likelihood that the jury’s verdict will be upheld on appeal. As a result of this review, we have determined, in accordance with applicable accounting standards, that it is not probable that we will incur a material loss as a result of this litigation.
If the jury’s verdict is not upheld on appeal, the loss will be zero , If the jury’s verdict is upheld in its entirety on appeal, we estimate the upper end of the range of possible loss through December 31, 2019 to be approximately $1.6 billion, which consists of (i) the $585 million up-front payment determined by the jury, (ii) approximately $200 million, which represents estimated royalties on our adjusted revenues from Yescarta from October 18, 2017 through December 31, 2019, and (iii) enhanced damages requested by Juno of up to two times the sum of (i) and (ii) above as a result of the jury’s finding of willfulness. This sum excludes costs and pre-judgment interest. Supplemental damages consisting of royalties on sales of Yescarta after December 13, 2019 through the date of judgment could be subject to the 27.6 % royalty in the jury’s verdict, the 33.1 % prospective royalty proposed
75
by Juno, or to enhancement. Any post-judgment sales of Yescarta would be subject to prospective royalties, which we have estimated could be up to 33.1 %, and which would be payable on adjusted Yescarta revenues after the judgment in 2020 until the expiry of the ‘190 patent in August 2024. We expect the judge to rule on the amount of prospective royalties and any enhanced damages in the course of deciding the post-trial motions. The court’s determination of prospective royalties and enhanced damages, if any, can also be appealed.
Litigation Related to Bictegravir
In 2018, ViiV Healthcare Company (ViiV) filed a lawsuit against us in the U.S. District Court of Delaware, alleging that the commercialization of bictegravir, sold commercially in combination with tenofovir alafenamide and emtricitabine as Biktarvy, infringes ViiV’s U.S. Patent No. 8,129,385 (the ‘385 patent) covering ViiV’s dolutegravir. Bictegravir is structurally different from dolutegravir, and we believe that bictegravir does not infringe the claims of the ‘385 patent. To the extent that ViiV’s patent claims are interpreted to cover bictegravir, we believe those claims are invalid. The court has set a trial date of September 2020 for this lawsuit.
In 2018, ViiV also filed a lawsuit against us in the Federal Court of Canada, alleging that our activities relating to our bictegravir compound have infringed ViiV’s Canadian Patent No. 2,606,282 (the ‘282 patent), which was issued to Shionogi & Co. Ltd. and ViiV. The ‘282 patent is the compound patent covering ViiV’s dolutegravir. We believe that bictegravir does not infringe the claims of the ‘282 patent. In January 2020, the court held a summary trial to assess ViiV’s infringement allegations. The court’s decision is expected in March 2020.
In November and December 2019, ViiV filed lawsuits in France, Germany, Ireland and the UK asserting the relevant national designations of European Patent No. 3 045 206; in Australia asserting Australian Patent No. 2006239177; in Japan asserting Japanese Patent No. 4295353; and in Korea asserting Korean Patent Nos. 1848819 and 1363875. These patents all relate to molecules which ViiV claim would act as integrase inhibitors. We believe that bictegravir does not infringe the claims of any of ViiV’s patents. In all jurisdictions, to the extent that the claims of ViiV’s patents are interpreted to cover bictegravir, we believe that those claims are invalid. We cannot predict the ultimate outcome of intellectual property claims related to bictegravir.
Litigation Relating to Pre-Exposure Prophylaxis
In August 2019, we filed petitions requesting inter partes review of U.S. Patent Nos. 9,044,509, 9,579,333, 9,937,191 (‘191 patent) and 10,335,423 (‘423 patent) (collectively, HHS Patents) by PTAB. The HHS Patents are assigned to the U.S. Department of Health and Human Services and purport to claim a process of protecting a primate host from infection by an immunodeficiency retrovirus by administering a combination of emtricitabine and tenofovir or TDF prior to exposure of the host to the immunodeficiency retrovirus, a process commonly known as pre-exposure prophylaxis (PrEP). In November 2019, the U.S. Department of Justice filed a lawsuit against us in the U.S. District Court of Delaware, alleging that the sale of Truvada and Descovy for use as PrEP infringes the HHS Patents. In February 2020, PTAB declined to institute our petitions for inter partes review of the HHS Patents. Although we cannot predict with certainty the ultimate outcome of this litigation, we believe that Truvada and Descovy do not infringe the HHS Patents and that the HHS Patents are invalid over prior art descriptions of Truvada’s use for PrEP and post-exposure prophylaxis, and because physicians and patients were using the claimed methods years before the Centers for Disease Control and Prevention filed the applications for the patents.
Litigation with Generic Manufacturers
As part of the approval process for some of our products, FDA granted us a New Chemical Entity (NCE) exclusivity period during which other manufacturers’ applications for approval of generic versions of our product will not be approved. Generic manufacturers may challenge the patents protecting products that have been granted NCE exclusivity one year prior to the end of the NCE exclusivity period. Generic manufacturers have sought and may continue to seek FDA approval for a similar or identical drug through an abbreviated new drug application (ANDA), the application form typically used by manufacturers seeking approval of a generic drug. The sale of generic versions of our products earlier than their patent expiration would have a significant negative effect on our revenues and results of operations. To seek approval for a generic version of a product having NCE status, a generic company may submit its ANDA to FDA four years after the branded product’s approval.
Starting in December 2019, we received letters from Lupin Ltd., Apotex Inc., Shilpa Medicare Ltd., Sunshine Lake Pharma Co. Ltd., Laurus Labs, Natco Pharma Ltd. and Cipla Ltd. (collectively, generic manufacturers) indicating that they have submitted ANDAs to FDA requesting permission to market and manufacture generic versions of certain of our tenofovir alafenamide (TAF)-containing products. Between them, these generic manufacturers seek to market generic versions of Odefsey, Descovy and Vemlidy. Some generic manufacturers have challenged the validity of four patents listed on the Orange Book and associated with TAF, while others have challenged the validity of two of our Orange Book-listed patents associated with TAF. We are evaluating the letters and intend to enforce and defend our intellectual property.
76
European Patent Claims
In 2015, several parties filed oppositions in the European Patent Office (EPO) requesting revocation of one of our granted European patents covering sofosbuvir that expires in 2028. In 2016, the EPO upheld the validity of certain claims of our sofosbuvir patent. We have appealed this decision, seeking to restore all of the original claims, and several of the original opposing parties have also appealed, requesting full revocation. The appeal hearing is scheduled for July 2020.
In 2017, several parties filed oppositions in the EPO requesting revocation of our granted European patent relating to sofosbuvir that expires in 2024. The EPO conducted an oral hearing for this opposition in 2018 and upheld the claims. Two of the original opposing parties have appealed, requesting full revocation.
In 2016, several parties filed oppositions in the EPO requesting revocation of our granted European patent covering TAF that expires in 2026. In 2017, the EPO upheld the validity of the claims of our TAF patent. Three parties have appealed this decision.
In 2017, several parties filed oppositions in the EPO requesting revocation of our granted European patent relating to TAF hemifumarate that expires in 2032. In 2019, the EPO upheld the validity of the claims of our TAF hemifumarate patent. Three parties have appealed this decision.
In 2016, three parties filed oppositions in the EPO requesting revocation of our granted European patent covering cobicistat that expires in 2027. In 2017, the EPO upheld the validity of the claims of our cobicistat patent. Two parties have appealed this decision.
The appeal process may take several years for all EPO opposition proceedings. While we are confident in the strength of our patents, we cannot predict the ultimate outcome of these oppositions. If we are unsuccessful in defending these oppositions, some or all of our patent claims may be narrowed or revoked and the patent protection for sofosbuvir, TAF, TAF hemifumarate and cobicistat in the European Union could be substantially shortened or eliminated entirely. If our patents are revoked, and no other European patents are granted covering these compounds, our exclusivity may be based entirely on regulatory exclusivity granted by the European Medicines Agency. If we lose patent protection for any of these compounds, our revenues and results of operations could be negatively impacted for the years including and succeeding the year in which such exclusivity is lost.
Government Investigations and Related Litigation
In 2011, we received a subpoena from the U.S. Attorney’s Office for the Northern District of California requesting documents related to the manufacture, and related quality and distribution practices, of Complera, Atripla, Truvada, Viread, Emtriva, Hepsera and Letairis. We cooperated with the government’s inquiry. In 2014, the U.S. Department of Justice informed us that, following an investigation, it declined to intervene in a False Claims Act lawsuit filed by two former employees. Also in 2014, the former employees served a First Amended Complaint, and the U.S. District Court for the Northern District of California issued an order granting in its entirety, without prejudice, our motion to dismiss the First Amended Complaint. In 2015, the plaintiffs filed a Second Amended Complaint, and the District Court issued an order granting our motion to dismiss the Second Amended Complaint. The plaintiffs then filed a notice of appeal in the U.S. Court of Appeals for the Ninth Circuit (Ninth Circuit). In 2017, the Ninth Circuit granted our motion to stay the case pending an appeal to the U.S. Supreme Court, and we filed a Petition for a Writ of Certiorari to the U.S. Supreme Court. In 2018, the Solicitor General submitted a brief for the United States to the U.S. Supreme Court stating its intention to file a motion to dismiss under the federal False Claims Act. In January 2019, the U.S. Supreme Court denied the petition and the case has been remanded to the District Court. In March 2019, the Department of Justice filed a motion to dismiss the Second Amended Complaint. The District Court granted the Department of Justice’s motion to dismiss in November 2019, dismissing relators’ federal False Claims Act claims.
In 2016, we received a subpoena from the U.S. Attorney’s Office for the District of Massachusetts requesting documents related to our support of 501(c)(3) organizations that provide financial assistance to patients and documents concerning our provision of financial assistance to patients for our HCV products. We are cooperating with this inquiry. In 2017, we received a subpoena from the U.S. Attorney’s Office for the District of Massachusetts requesting documents related to our copay coupon program and Medicaid price reporting methodology. We are cooperating with this inquiry.
In 2017, we received a voluntary request for information from the U.S. Attorney’s Office for the Eastern District of Pennsylvania requesting information related to our reimbursement support offerings, clinical education programs and interactions with specialty pharmacies for Sovaldi and Harvoni. In 2018, we received another voluntary request for information related to our speaker programs and advisory boards for our HCV and hepatitis B virus products. We are cooperating with these voluntary requests. In October 2019, the U.S. Department of Justice informed us that, following an investigation, it declined to intervene in a False Claims Act lawsuit against us relating to hepatitis B speaker programs and advisory boards brought by two plaintiffs in the U.S. District Court for the Eastern District of Pennsylvania. Notwithstanding the government’s declination, plaintiffs have continued to pursue the lawsuit and served us with the Seconded Amended Complaint in November 2019. Although we cannot predict the ultimate outcome of this lawsuit, we believe the action is without merit and we intend to vigorously defend against it.
77
In 2017, we received a subpoena from the California Department of Insurance and the Alameda County District Attorney’s Office requesting documents related to our marketing activities, reimbursement support offerings, clinical education programs and interactions with specialty pharmacies for Harvoni and Sovaldi. We are cooperating with this inquiry.
In 2017, we also received a subpoena from the U.S. Attorney’s Office for the Southern District of New York requesting documents related to our promotional speaker programs for HIV. We are cooperating with this inquiry.
Product Liability
We have been named as a defendant in one class action lawsuit and various product liability lawsuits related to Viread, Truvada, Atripla, Complera and Stribild. Plaintiffs allege that Viread, Truvada, Atripla, Complera and/or Stribild caused them to suffer kidney and/or bone injuries. The lawsuits, which are pending in state or federal court in California, Delaware or Florida, involve thousands of plaintiffs. Plaintiffs in these cases seek damages and other relief on various grounds for alleged personal injury and economic loss. We intend to vigorously defend ourselves in these actions. While we believe these cases are without merit, we cannot predict the ultimate outcome. If plaintiffs are successful in their claims, we could be required to pay significant monetary damages.
Antitrust and Consumer Protection
We (along with Japan Tobacco, BMS and Johnson & Johnson, Inc.) have been named as defendants in a class action lawsuit filed in 2019 related to various drugs used to treat HIV, including drugs used in combination antiretroviral therapy. Plaintiffs allege that we (and the other defendants) engaged in various conduct to restrain competition in violation of federal and state antitrust laws and state consumer protection laws. The lawsuit, a consolidated action pending in the U.S. District Court for the Northern District of California, seeks to bring claims on behalf of a nationwide class of end-payor purchasers. A similar lawsuit was also recently filed in the U.S. District Court for the Southern District of Florida, which may also be consolidated. Plaintiffs seek damages, permanent injunctive relief, and other relief. We intend to vigorously defend ourselves in this action. While we believe this action is without merit, we cannot predict the ultimate outcome. If plaintiffs are successful in their claims, we could be required to pay significant monetary damages or could be subject to permanent injunctive relief.
Other Matters
We are a party to various legal actions that arose in the ordinary course of our business. We do not believe that these other legal actions will have a material adverse impact on our consolidated business, financial position or results of operations.
Other Commitments
In the normal course of business, we enter into various firm purchase commitments primarily related to active pharmaceutical ingredients (API) and certain inventory related items. As of December 31, 2019, these commitments for the next five years were approximately $271 million in 2020, $45 million in 2021, $22 million in 2022, $22 million in 2023 and $14 million in 2024. The amounts related to API represent minimum purchase commitments. Actual payments for the purchases of API and certain inventory related items were $529 million in 2019, $1.0 billion in 2018 and $1.7 billion in 2017. In January 2020, we amended an API contract, which increased our firm purchase commitments by approximately $220 million.
15. | STOCKHOLDERS’ EQUITY |
Stock Repurchase Programs
In the first quarter of 2016, our Board of Directors authorized a $12.0 billion stock repurchase program (2016 Program) under which repurchases may be made in the open market or in privately negotiated transactions. As of December 31, 2019, the remaining authorized repurchase amount under the 2016 Program was $3.4 billion.
The following table summarizes our stock repurchases under the 2016 Program (in millions, except per share amounts):
Year ended December 31, | ||||||||||||
2019 | 2018 | 2017 | ||||||||||
Shares repurchased and retired | ||||||||||||
Amount | $ | $ | $ | |||||||||
Average price per share | $ | $ | $ | |||||||||
In addition to repurchases from the 2016 Program, we repurchased shares of common stock withheld by us from employee restricted stock awards to satisfy our applicable tax withholding obligations, which are immaterial and excluded from the table above.
78
We use the par value method of accounting for our stock repurchases. Under the par value method, common stock is first charged with the par value of the shares involved. The excess of the cost of shares acquired over the par value is allocated to additional paid-in capital (APIC) based on an estimated average sales price per issued share with the excess amounts charged to retained earnings.
The following table summarizes the reduction of common stock and APIC and the charge to retained earnings as a result of our stock repurchases (in millions):
Year ended December 31, | ||||||||||||
2019 | 2018 | 2017 | ||||||||||
Reduction of common stock and APIC | $ | $ | $ | |||||||||
Charge to retained earnings | $ | $ | $ | |||||||||
In the first quarter of 2020, our Board of Directors authorized a new $5.0 billion stock repurchase program (2020 Program), which will commence upon the completion of the 2016 Program. Purchases under the 2020 Program may be made in the open market or in privately negotiated transactions.
Dividends
The following table summarizes cash dividends declared on our common stock (in millions, except per share amounts):
2019 | 2018 | |||||||||||||||
Dividend Per Share | Amount | Dividend Per Share | Amount | |||||||||||||
First quarter | $ | $ | $ | $ | ||||||||||||
Second quarter | ||||||||||||||||
Third quarter | ||||||||||||||||
Fourth quarter | ||||||||||||||||
Total | $ | $ | $ | $ | ||||||||||||
Our restricted stock and performance share awards or units have dividend equivalent rights entitling holders to dividend equivalents to be paid upon vesting for each share of the underlying unit
On February 4, 2020, we announced that our Board of Directors declared a quarterly cash dividend of $0.68 per share of our common stock, with a payment date of March 30, 2020 to all stockholders of record as of the close of business on March 13, 2020 . Future dividends are subject to declaration by the Board of Directors.
Preferred Stock
We have 5 million shares of authorized preferred stock issuable in series. Our Board is authorized to determine the designation, powers, preferences and rights of any such series. There was no preferred stock outstanding as of December 31, 2019 and 2018.
79
Accumulated Other Comprehensive Income
The following table summarizes the changes in AOCI by component, net of tax (in millions):
Foreign Currency Translation | Unrealized Gains and Losses on Available-for-Sale Debt Securities | Unrealized Gains and Losses on Cash Flow Hedges | Total | |||||||||||||
Balance at December 31, 2017 | $ | $ | $ | ( | ) | $ | ||||||||||
Reclassifications to retained earnings as a result of the adoption of new accounting standards | ( | ) | ( | ) | ||||||||||||
Balance at January 1, 2018 | $ | $ | ( | ) | $ | ( | ) | $ | ( | ) | ||||||
Net unrealized (loss) gain | ( | ) | ||||||||||||||
Reclassifications to net income | ||||||||||||||||
Net current period other comprehensive (loss) income | ( | ) | ||||||||||||||
Balance at December 31, 2018 | $ | $ | ( | ) | $ | $ | ||||||||||
Net unrealized gain | ||||||||||||||||
Reclassifications to net income | ( | ) | ( | ) | ( | ) | ||||||||||
Net current period other comprehensive income (loss) | ( | ) | ||||||||||||||
Balance at December 31, 2019 | $ | $ | $ | $ | ||||||||||||
The amounts reclassified to net income for gains and losses on cash flow hedges are recorded as part of Product sales on our Consolidated Statements of Income. See Note 5. Derivative Financial Instruments for additional information. The amounts reclassified to net income for gains and losses on available-for-sale debt securities are recorded as part of Other income (expense), net, on our Consolidated Statements of Income. The income tax impact allocated to each component of other comprehensive income was not material for the period presented.
16. EMPLOYEE BENEFITS
We provide share-based compensation in the form of various types of equity-based awards, including restricted stock units (RSUs), performance share awards or units (PSUs) and stock options. Compensation expense is recognized on the Consolidated Statements of Income based on the estimated fair value of the award on the grant date. The estimated fair value of RSUs is based on the closing price of our common stock. For PSUs, estimated fair value is based on either the Monte Carlo valuation methodology or the stock price on the date of grant. For stock option awards, estimated fair value is based on the Black-Scholes option valuation model.
2004 Equity Incentive Plan
In May 2004, our stockholders approved and we adopted the Gilead Sciences, Inc. 2004 Equity Incentive Plan (as amended, the 2004 Plan). The 2004 Plan is a broad based incentive plan that provides for the grant of equity-based awards, including stock options, restricted stock units, restricted stock awards and performance share awards, to employees, directors and consultants. The 2004 Plan authorized the issuance of a total of 309 million shares of common stock. As of December 31, 2019, a total of 79 million shares remain available for future grant under the 2004 Plan.
Stock Options
The 2004 Plan provides for option grants designated as either non-qualified or incentive stock options. All stock options granted after January 1, 2006 have been non-qualified stock options. Employee stock options generally vest over three or four years . All options are exercisable over a period not to exceed the contractual term of ten years from the date the stock options are issued and are granted at prices not less than the fair market value of our common stock on the grant date. Stock option exercises are settled with common stock from the 2004 Plan’s previously authorized and available pool of shares.
80
The following table summarizes activity and related information under our stock option plans. All option grants presented in the table had exercise prices not less than the fair value of the underlying common stock on the grant date:
Shares (in millions) | Weighted- Average Exercise Price (in dollars) | Weighted-Average Remaining Contractual Term (years) | Aggregate Intrinsic Value (in millions) | ||||||||||
Outstanding at December 31, 2018 | $ | ||||||||||||
Granted | $ | ||||||||||||
Forfeited | ( | ) | $ | ||||||||||
Expired | ( | ) | $ | ||||||||||
Exercised | ( | ) | $ | ||||||||||
Outstanding at December 31, 2019 | $ | $ | |||||||||||
Exercisable at December 31, 2019 | $ | $ | |||||||||||
Expected to vest, net of estimated forfeitures at December 31, 2019 | $ | $ | |||||||||||
Aggregate intrinsic value represents the value of our closing stock price on the last trading day of the year in excess of the weighted-average exercise price multiplied by the number of options outstanding or exercisable. Total intrinsic value of options exercised was $209 million for 2019, $412 million for 2018 and $337 million for 2017.
The weighted-average grant date fair value of the stock options granted was $12.15 per share for 2019, $17.03 per share for 2018 and $38.78 per share for 2017. The weighted-average grant date fair value of stock options granted in 2017 was higher due to replacement awards granted in connection with our acquisitions of Kite and Cell Design Labs.
As of December 31, 2019, there was $85 million of unrecognized compensation cost related to stock options, which is expected to be recognized over an estimated weighted-average period of 2.1 years.
Restricted Stock and Performance Share Awards
We grant time-based RSUs to certain employees as part of our annual employee equity compensation review program as well as to new hire employees and to non-employee members of our Board. RSUs are share-based awards that entitle the holder to receive freely tradable shares of our common stock upon vesting. RSUs generally vest over three or four years from the date of grant. The fair value of an RSU is equal to the closing price of our common stock on the grant date.
We grant PSUs which vest upon the achievement of specified market or performance goals, which could include achieving a total shareholder return compared to a pre-determined peer group or achieving revenue targets. The actual number of common shares ultimately issued is calculated by multiplying the number of PSUs by a payout percentage ranging from 0 % to 200 %, and these awards generally vest only when a committee (or subcommittee) of our Board has determined that the specified market and performance goals have been achieved. The fair value of each PSU is estimated at the date of grant or when performance objectives are defined for the grants. Depending on the terms of the award, fair value on the date of grant is determined based on either the Monte Carlo valuation methodology or the closing stock price on the date of grant.
In addition, we have also granted other PSUs to certain of our employees under the 2004 Plan. The vesting of these awards is subject to the achievement of specified individual performance goals, typically within a one to two year period. The fair value of such an award is equal to the closing price of our common stock on the grant date.
The following table summarizes our RSU and PSU activity and related information (in millions, except per share amounts):
RSUs | PSUs | |||||||||||||
Shares | Weighted- Average Grant Date Fair Value Per Share | Shares (1) | Weighted- Average Grant Date Fair Value Per Share(1) | |||||||||||
Outstanding at December 31, 2018 | $ | $ | ||||||||||||
Granted | $ | $ | ||||||||||||
Vested | ( | ) | $ | ( | ) | $ | ||||||||
Forfeited | ( | ) | $ | ( | ) | $ | ||||||||
Outstanding at December 31, 2019 | $ | $ | ||||||||||||
_________________________________________ | ||||||||||||||
(1) |
81
The weighted-average grant date fair value of RSUs granted was $64.31 per share for 2019, $77.98 per share for 2018, and $73.56 per share for 2017. The weighted-average grant date fair value of PSUs granted was $68.30 per share for 2019, $88.76 per share for 2018, and $74.42 per share for 2017. The total grant date fair value of our vested RSUs and PSUs was $450 million for , $481 million for 2018 and $329 million for 2017, and total fair value as of the respective vesting dates was $372 million for 2019, $446 million for 2018 and $288 million for 2017.
As of December 31, 2019, there was $802 million of unrecognized compensation cost related to unvested RSUs and PSUs, which is expected to be recognized over a weighted-average period of 2.2 years.
Employee Stock Purchase Plan
Under our Employee Stock Purchase Plan and the International Employee Stock Purchase Plan (together, as amended, the ESPP), employees can purchase shares of our common stock based on a percentage of their compensation subject to certain limits. The purchase price per share is equal to the lower of 85 % of the fair market value of our common stock on the offering date or the purchase date. The ESPP offers a six-month look-back feature as well as an automatic reset feature that provides for an offering period to be reset to a new lower-priced offering if the offering price of the new offering period is less than that of the current offering period. ESPP purchases are settled with common stock from the ESPP’s previously authorized and available pool of shares. During 2019, 2 million shares were issued under the ESPP for $90 million. A total of 79 million shares of common stock have been authorized for issuance under the ESPP, and there were 9 million shares available for issuance under the ESPP as of December 31, 2019.
Stock-Based Compensation
The following table summarizes total stock-based compensation expenses included on our Consolidated Statements of Income (in millions):
Year Ended December 31, | ||||||||||||
2019 | 2018 | 2017 | ||||||||||
Cost of goods sold | $ | $ | $ | |||||||||
Research and development expenses | ||||||||||||
Selling, general and administrative expenses | ||||||||||||
Stock-based compensation expense included in total costs and expenses | ||||||||||||
Income tax effect(1) | ( | ) | ( | ) | ||||||||
Stock-based compensation expense, net of tax | $ | $ | $ | |||||||||
_______________________ | ||||||||||||
(1) | Income tax effect for the year ended December 31, 2019 included a $ |
Stock-based compensation is recognized as expense over the requisite service periods on our Consolidated Statements of Income using the straight-line expense attribution approach, reduced for estimated forfeitures. We estimate forfeitures based on our historical experience. The requisite service period could be shorter than the vesting period if an employee is retirement eligible.
82
Valuation Assumptions
Fair value of options granted under our 2004 Plan and purchases under our ESPP were estimated at grant or purchase dates using a Black-Scholes option valuation model. The Black-Scholes option valuation model was developed for use in estimating the fair value of traded options, which have no vesting restrictions and are fully transferable. In addition, option valuation models require the input of highly subjective assumptions, including expected stock price volatility and expected award life. We used the following assumptions to calculate the estimated fair value of the awards:
Year Ended December 31, | |||||||||
2019 | 2018 | 2017 | |||||||
Expected volatility: | |||||||||
Stock options | % | % | % | ||||||
ESPP | % | % | % | ||||||
Expected term in years: | |||||||||
Stock options | |||||||||
ESPP | |||||||||
Risk-free interest rate: | |||||||||
Stock options | % | % | % | ||||||
ESPP | % | % | % | ||||||
Expected dividend yield | % | % | % | ||||||
The fair value of stock options granted was calculated using the single option approach. We use a blend of historical volatility along with implied volatility for traded options on our common stock to determine our expected volatility. The expected term of stock-based awards represents the weighted-average period the awards are expected to remain outstanding. We estimate the weighted-average expected term based on historical cancellation and historical exercise data related to our stock options as well as the contractual term and vesting terms of the awards. The risk-free interest rate is based upon observed interest rates appropriate for the term of the stock-based awards. The dividend yield is based on our history and expectation of dividend payouts.
Deferred Compensation
We maintain a retirement saving plan under which eligible U.S. employees may defer compensation for income tax purposes under Section 401(k) of the Internal Revenue Code (the Gilead Sciences 401k Plan). In certain foreign subsidiaries, we maintain defined benefit plans as required by local regulatory requirements. Our total matching contribution expense under the Gilead Sciences 401k Plan and other defined benefit plans was $110 million during 2019, $91 million during 2018 and $74 million during 2017.
We maintain a deferred compensation plan under which our directors and key employees may defer compensation. Amounts deferred by participants are deposited into a rabbi trust. The total assets and liabilities associated with the deferred compensation plan were $171 million as of December 31, 2019 and $124 million as of December 31, 2018.
17. | NET INCOME PER SHARE ATTRIBUTABLE TO GILEAD COMMON STOCKHOLDERS |
Basic net income per share attributable to Gilead common stockholders is calculated based on the weighted-average number of shares of our common stock outstanding during the period. Diluted net income per share attributable to Gilead common stockholders is calculated based on the weighted-average number of shares of our common stock and other dilutive securities outstanding during the period. The potentially dilutive shares of our common stock resulting from the assumed exercise of outstanding stock options and equivalents were determined under the treasury stock method.
Potential shares of common stock excluded from the computation of diluted net income per share attributable to Gilead common shareholders because their effect would have been antidilutive were 14 million, 13 million and 11 million during 2019, 2018 and 2017, respectively.
83
The following table shows the calculation of basic and diluted net income per share attributable to Gilead common stockholders (in millions, except per share amounts):
Year Ended December 31, | ||||||||||||
2019 | 2018 | 2017 | ||||||||||
Net income attributable to Gilead | $ | $ | $ | |||||||||
Shares used in per share calculation - basic | ||||||||||||
Dilutive effect of stock options and equivalents | ||||||||||||
Shares used in per share calculation - diluted | ||||||||||||
Net income per share attributable to Gilead common stockholders - basic | $ | $ | $ | |||||||||
Net income per share attributable to Gilead common stockholders - diluted | $ | $ | $ | |||||||||
18. | SEGMENT INFORMATION |
We have one operating segment, which primarily focuses on the discovery, development and commercialization of innovative medicines in areas of unmet medical need. Our Chief Executive Officer (CEO), as the chief operating decision-maker, manages and allocates resources to the operations of our company on an entity-wide basis. Managing and allocating resources on an entity-wide basis enables our CEO to assess the overall level of resources available and how to best deploy these resources across functions and R&D projects based on unmet medical need and, as necessary, reallocate resources among our internal R&D portfolio and external opportunities to best support the long-term growth of our business. See Note 2. Revenues for a summary of disaggregated revenues by product and geographic region.
Revenues From Major Customers
The following table summarizes revenues from each of our customers who individually accounted for 10 % or more of our total revenues (as a percentage of total revenues):
Year Ended December 31, | |||||||||
2019 | 2018 | 2017 | |||||||
AmerisourceBergen Corp. | % | % | % | ||||||
Cardinal Health, Inc. | % | % | % | ||||||
McKesson Corp. | % | % | % | ||||||
Long-Lived Assets
The net book value of our property, plant and equipment (less office and computer equipment) in the United States was $3.5 billion as of December 31, 2019, $3.2 billion as of December 31, 2018 and $2.6 billion as of December 31, 2017. The corresponding amount in international locations was $791 million as of December 31, 2019, $620 million as of December 31, 2018 and $520 million as of December 31, 2017. All individual international locations accounted for less than 10% of the total balances.
19. INCOME TAXES
Income before provision for income taxes consists of the following (in millions):
Year Ended December 31, | ||||||||||||
2019 | 2018 | 2017 | ||||||||||
Domestic | $ | $ | $ | |||||||||
Foreign | ||||||||||||
Income before provision for income taxes | $ | $ | $ | |||||||||
84
The provision for income taxes consists of the following (in millions):
Year Ended December 31, | ||||||||||||
2019 | 2018 | 2017 | ||||||||||
Federal: | ||||||||||||
Current | $ | $ | $ | |||||||||
Deferred | ( | ) | ( | ) | ||||||||
State: | ||||||||||||
Current | ||||||||||||
Deferred | ( | ) | ( | ) | ( | ) | ||||||
Foreign: | ||||||||||||
Current | ||||||||||||
Deferred | ( | ) | ( | ) | ||||||||
( | ) | |||||||||||
Provision for income taxes | $ | ( | ) | $ | $ | |||||||
The 2019 provision for income taxes included a $1.2 billion deferred tax benefit related to intangible asset transfers from a foreign subsidiary to Ireland and the United States. In the fourth quarter of 2019, we completed an intra-entity asset transfer of certain intangible assets from a foreign subsidiary to Ireland. The transaction resulted in a step-up of the Irish tax-deductible basis in the transferred assets, and accordingly, created a temporary difference where the tax basis exceeded the book basis of such intangible assets. As a result, we recognized a deferred tax asset of $1.2 billion on our consolidated financial statements. The tax deductions for amortization of the assets will be recognized in the future and any amortization not deducted for tax purposes will be carried forward indefinitely under Irish tax laws. We expect to be able to realize the deferred tax asset resulting from this intra-entity asset transfer. The impact of the intangible asset transfer from a foreign subsidiary to the United States was not material.
The 2018 provision for income taxes included a $588 million deferred tax charge related to a transfer of acquired intangible assets from a foreign subsidiary to the United States. This transaction did not result in a step-up of the U.S. tax-deductible basis; and as a result, we recognized a deferred tax liability of $588 million for the temporary difference where the book basis exceeded the tax basis of these acquired intangible assets.
The 2017 provision for income taxes included a $5.5 billion provisional charge to income tax expense related to Tax Reform enacted in December 2017. Tax reform made significant changes to the Internal Revenue Code of 1986, as amended, which include, but are not limited to, a corporate tax rate decrease from 35% to 21% effective for tax years beginning after December 31, 2017, a repatriation tax on deemed repatriated earnings of foreign subsidiaries, implementation of a modified territorial tax system, which has the effect of subjecting earnings of our foreign subsidiaries to U.S. taxation on GILTI. We elected to account for the tax on GILTI under the period cost method.
The reconciliation between the federal statutory tax rate applied to income before taxes and our effective tax rate is summarized as follows:
Year Ended December 31, | |||||||||
2019 | 2018 | 2017 | |||||||
Federal statutory rate | % | % | % | ||||||
State taxes, net of federal benefit | % | % | % | ||||||
Foreign earnings at different rates | ( | )% | ( | )% | ( | )% | |||
Research and other credits | ( | )% | ( | )% | ( | )% | |||
US tax on foreign earnings | % | % | % | ||||||
Deferred tax - intra-entity transfer of intangible assets | ( | )% | % | % | |||||
Transition tax | % | ( | )% | % | |||||
Deferred tax revaluation | % | % | ( | )% | |||||
Settlement of tax examinations | ( | )% | ( | )% | % | ||||
Other | % | % | % | ||||||
Effective tax rate | ( | )% | % | % | |||||
85
Deferred income taxes reflect the net tax effects of temporary differences between the carrying amounts of assets and liabilities for financial reporting purposes and the amounts used for income tax purposes. Significant components of our deferred tax assets and liabilities are as follows (in millions):
December 31, | ||||||||
2019 | 2018 | |||||||
Deferred tax assets: | ||||||||
Net operating loss carryforwards | $ | $ | ||||||
Stock-based compensation | ||||||||
Reserves and accruals not currently deductible | ||||||||
Excess of tax basis over book basis of intangible assets | ||||||||
Up-front and milestone payments | ||||||||
Research and other credit carryforwards | ||||||||
Other, net | ||||||||
Total deferred tax assets before valuation allowance | ||||||||
Valuation allowance | ( | ) | ( | ) | ||||
Total deferred tax assets | ||||||||
Deferred tax liabilities: | ||||||||
Property, plant and equipment | ( | ) | ( | ) | ||||
Excess of book basis over tax basis of intangible assets | ( | ) | ( | ) | ||||
Other | ( | ) | ( | ) | ||||
Total deferred tax liabilities | ( | ) | ( | ) | ||||
Net deferred tax assets (liabilities) | $ | $ | ( | ) | ||||
The valuation allowance was $217 million and $331 million at December 31, 2019 and 2018, respectively. The decrease of our valuation allowance in 2019 was primarily related to a reduction in net operating loss carryforwards under the asset recognition framework and the corresponding valuation allowance with respect to certain foreign jurisdictions.
At December 31, 2019, we had U.S. federal net operating loss carryforwards of approximately $231 million. The federal net operating loss carryforwards will start to expire in 2021, if not utilized. We also had federal tax credit carryforwards of approximately $88 million which will start to expire in 2020, if not utilized. In addition, we had state net operating loss and tax credit carryforwards of approximately $1.4 billion and $543 million, respectively. The state net operating loss will start to expire in 2021 if not utilized and state tax credit carryforwards is carried forward indefinitely.
Utilization of net operating losses and tax credits may be subject to an annual limitation due to ownership change limitations provided in the Internal Revenue Code of 1986, as amended, and similar state provisions. This annual limitation may result in the expiration of the net operating losses and credits before utilization.
We file federal, state and foreign income tax returns in the United States and in many foreign jurisdictions. For federal income tax purposes, the statute of limitations is open for 2013 and onwards and 2010 and onwards for California income tax purposes. For certain acquired entities, the statute of limitations is open for all years from inception due to our utilization of their net operating losses and credits carried over from prior years.
Our income tax returns are subject to audit by federal, state and foreign tax authorities. We are currently under examination by the IRS for the tax years from 2013 to 2015 and by various state and foreign jurisdictions. There are differing interpretations of tax laws and regulations, and as a result, significant disputes may arise with these tax authorities involving issues of the timing and amount of deductions and allocations of income among various tax jurisdictions. We periodically evaluate our exposures associated with our tax filing positions.
Of the total unrecognized tax benefits, $1.6 billion and $1.3 billion at December 31, 2019 and 2018, if recognized, would reduce our effective tax rate in the period of recognition. Interest and penalties related to unrecognized tax benefits included as part of provision for income taxes on our Consolidated Statements of Income were $105 million for the year ended December 31, 2019. Interest and penalties related to unrecognized tax benefits for the years ended December 31, 2018 and 2017, respectively, were not material. Accrued interest and penalties related to unrecognized tax benefits were $259 million and $154 million at December 31, 2019 and 2018, respectively. As of December 31, 2019, we believe that it is reasonably possible that our unrecognized tax benefits may materially change in the next 12 months due to potential resolutions with a tax authority. An estimate of the range of the reasonably possible change cannot be determined at this time.
86
In June 2019, the Ninth Circuit Court of Appeals (Ninth Circuit) issued an opinion in Altera Corp. v. Commissioner reversing the prior decision of the United States Tax Court and requiring related parties in an intercompany cost-sharing arrangement to share expenses related to stock-based compensation. In July 2019, the taxpayer requested a rehearing before the full Ninth Circuit and the request was denied in November 2019. As a result, we recorded a cumulative income tax expense of $114 million in the fourth quarter of 2019. On February 10, 2020, the taxpayer requested a hearing before the Supreme Court of the United States; and as such, although the final outcome of the case is still uncertain, we recorded income tax expense in the fourth quarter of 2019 based on the Ninth Circuit’s denial.
The following is a rollforward of our total gross unrecognized tax benefits (in millions):
Year Ended December 31, | ||||||||||||
2019 | 2018 | 2017 | ||||||||||
Balance, beginning of period | $ | $ | $ | |||||||||
Tax positions related to current year: | ||||||||||||
Additions | ||||||||||||
Reductions | ||||||||||||
Tax positions related to prior years: | ||||||||||||
Additions | ||||||||||||
Reductions | ( | ) | ||||||||||
Settlements | ( | ) | ( | ) | ( | ) | ||||||
Lapse of statute of limitations | ( | ) | ( | ) | ( | ) | ||||||
Balance, end of period | $ | $ | $ | |||||||||
87
SELECTED QUARTERLY FINANCIAL INFORMATION (UNAUDITED)
(in millions, except per share amounts)
1st Quarter | 2nd Quarter | 3rd Quarter | 4th Quarter | |||||||||||||
2019 | ||||||||||||||||
Total revenues | $ | $ | $ | $ | ||||||||||||
Gross profit on product sales | $ | $ | $ | $ | ||||||||||||
Net income (loss)(1)(2) | $ | $ | $ | ( | ) | $ | ||||||||||
Net income (loss) attributable to Gilead(1)(2) | $ | $ | $ | ( | ) | $ | ||||||||||
Net income (loss) per share attributable to Gilead common stockholders - basic(1)(2)(3) | $ | $ | $ | ( | ) | $ | ||||||||||
Net income (loss) per share attributable to Gilead common stockholders - diluted(1)(2)(3) | $ | $ | $ | ( | ) | $ | ||||||||||
2018 | ||||||||||||||||
Total revenues | $ | $ | $ | $ | ||||||||||||
Gross profit on product sales | $ | $ | $ | $ | ||||||||||||
Net income(4) | $ | $ | $ | $ | ||||||||||||
Net income attributable to Gilead(4) | $ | $ | $ | $ | ||||||||||||
Net income per share attributable to Gilead common stockholders - basic(4)(5) | $ | $ | $ | $ | ||||||||||||
Net income per share attributable to Gilead common stockholders - diluted(4)(5) | $ | $ | $ | $ | ||||||||||||
_________________________________________ | ||||||||||||||||
(1) | Amounts for the third quarter of 2019 included up-front collaboration and licensing expenses of $ |
(2) | Amounts for the fourth quarter of 2019 included a $ |
(3) | Amounts for the fourth quarter of 2019 included a net favorable impact of $ |
(4) | Amounts for the fourth quarter of 2018 included an $ |
(5) | Amounts for the fourth quarter of 2018 included an unfavorable impact of $ |
88
GILEAD SCIENCES, INC.
Schedule II: Valuation and Qualifying Accounts
(in millions)
Balance at Beginning of Period | Additions/Charged to Expense | Deductions | Balance at End of Period | |||||||||||||
Year ended December 31, 2019: | ||||||||||||||||
Accounts receivable allowances(1) | $ | $ | $ | $ | ||||||||||||
Sales return allowance | $ | $ | $ | $ | ||||||||||||
Valuation allowances for deferred tax assets | $ | $ | $ | $ | ||||||||||||
Year ended December 31, 2018: | ||||||||||||||||
Accounts receivable allowances(1) | $ | $ | $ | $ | ||||||||||||
Sales return allowance | $ | $ | $ | $ | ||||||||||||
Valuation allowances for deferred tax assets | $ | $ | $ | $ | ||||||||||||
Year ended December 31, 2017: | ||||||||||||||||
Accounts receivable allowances(1) | $ | $ | $ | $ | ||||||||||||
Sales return allowance | $ | $ | $ | $ | ||||||||||||
Valuation allowances for deferred tax assets | $ | $ | $ | $ | ||||||||||||
_________________________________________ | ||||||||||||||||
(1) | Allowances are for doubtful accounts, cash discounts and chargebacks. |
89
ITEM 9. | CHANGES IN AND DISAGREEMENTS WITH ACCOUNTANTS ON ACCOUNTING AND FINANCIAL DISCLOSURE |
Not applicable.
ITEM 9A. | CONTROLS AND PROCEDURES |
(a) Evaluation of Disclosure Controls and Procedures
An evaluation as of December 31, 2019 was carried out under the supervision and with the participation of our management, including our Chief Executive Officer and Chief Financial Officer, of the effectiveness of our “disclosure controls and procedures,” which are defined in Rule 13a-15(e) under the Securities Exchange Act of 1934, as amended (the Exchange Act), as controls and other procedures of a company that are designed to ensure that the information required to be disclosed by a company in the reports that it files or submits under the Exchange Act is recorded, processed, summarized and reported, within the time periods specified in the Securities and Exchange Commission’s rules and forms, and that such information is accumulated and communicated to the company’s management, including its Chief Executive Officer and Chief Financial Officer, as appropriate, to allow timely decisions regarding required disclosure. Based upon that evaluation, our Chief Executive Officer and Chief Financial Officer concluded that our disclosure controls and procedures were effective at December 31, 2019.
(b) Management’s Report on Internal Control over Financial Reporting
Our management is responsible for establishing and maintaining adequate internal control over financial reporting, as such term is defined in Rule 13a-15(f) of the Exchange Act. Our internal control system is designed to provide reasonable assurance regarding the preparation and fair presentation of financial statements for external purposes in accordance with generally accepted accounting principles. All internal control systems, no matter how well designed, have inherent limitations and can provide only reasonable assurance that the objectives of the internal control system are met.
Under the supervision and with the participation of our management, including our Chief Executive Officer and Chief Financial Officer, we conducted an evaluation of the effectiveness of our internal control over financial reporting, based on criteria established by the Committee of Sponsoring Organizations of the Treadway Commission (COSO) in its 2013 Internal Control-Integrated Framework. Based on our evaluation, we concluded that our internal control over financial reporting was effective as of December 31, 2019.
Our independent registered public accounting firm, Ernst & Young LLP, has audited our Consolidated Financial Statements included in Item 8 of this Annual Report on Form 10-K and have issued a report on our internal control over financial reporting as of December 31, 2019. Their report on the audit of internal control over financial reporting appears below.
(c) Changes in Internal Control over Financial Reporting
Our management, including our Chief Executive Officer and Chief Financial Officer, has evaluated any changes in our internal control over financial reporting that occurred during the quarter ended December 31, 2019, and has concluded that there was no change during such quarter that has materially affected, or is reasonably likely to materially affect, our internal control over financial reporting.
90
Report of Independent Registered Accounting Firm
To the Stockholders and the Board of Directors of Gilead Sciences, Inc.
Opinion on Internal Control over Financial Reporting
We have audited Gilead Sciences, Inc.’s internal control over financial reporting as of December 31, 2019, based on criteria established in Internal Control-Integrated Framework issued by the Committee of Sponsoring Organizations of the Treadway Commission (2013 framework) (the COSO criteria). In our opinion, Gilead Sciences, Inc. (the Company) maintained, in all material respects, effective internal control over financial reporting as of December 31, 2019, based on the COSO criteria.
We also have audited, in accordance with the standards of the Public Company Accounting Oversight Board (United States) (PCAOB), the consolidated balance sheets of the Company as of December 31, 2019 and 2018, the related consolidated statements of income, comprehensive income, stockholders’ equity and cash flows for each of the three years in the period ended December 31, 2019, and the related notes and financial statement schedule listed in the Index at Item 15(a) and our report dated February 24, 2020 expressed an unqualified opinion thereon.
Basis for Opinion
The Company’s management is responsible for maintaining effective internal control over financial reporting and for its assessment of the effectiveness of internal control over financial reporting included in the accompanying Management’s Report on Internal Control over Financial Reporting. Our responsibility is to express an opinion on the Company’s internal control over financial reporting based on our audit. We are a public accounting firm registered with the PCAOB and are required to be independent with respect to the Company in accordance with the U.S. federal securities laws and the applicable rules and regulations of the Securities and Exchange Commission and the PCAOB.
We conducted our audit in accordance with the standards of the PCAOB. Those standards require that we plan and perform the audit to obtain reasonable assurance about whether effective internal control over financial reporting was maintained in all material respects.
Our audit included obtaining an understanding of internal control over financial reporting, assessing the risk that a material weakness exists, testing and evaluating the design and operating effectiveness of internal control based on the assessed risk, and performing such other procedures as we considered necessary in the circumstances. We believe that our audit provides a reasonable basis for our opinion.
Definition and Limitations of Internal Control Over Financial Reporting
A company’s internal control over financial reporting is a process designed to provide reasonable assurance regarding the reliability of financial reporting and the preparation of financial statements for external purposes in accordance with generally accepted accounting principles. A company’s internal control over financial reporting includes those policies and procedures that (1) pertain to the maintenance of records that, in reasonable detail, accurately and fairly reflect the transactions and dispositions of the assets of the company; (2) provide reasonable assurance that transactions are recorded as necessary to permit preparation of financial statements in accordance with generally accepted accounting principles, and that receipts and expenditures of the company are being made only in accordance with authorizations of management and directors of the company; and (3) provide reasonable assurance regarding prevention or timely detection of unauthorized acquisition, use, or disposition of the company’s assets that could have a material effect on the financial statements.
Because of its inherent limitations, internal control over financial reporting may not prevent or detect misstatements. Also, projections of any evaluation of effectiveness to future periods are subject to the risk that controls may become inadequate because of changes in conditions, or that the degree of compliance with the policies or procedures may deteriorate.
/s/ Ernst & Young LLP
San Jose, California
February 24, 2020
91
ITEM 9B. | OTHER INFORMATION |
Not applicable.
PART III
ITEM 10. | DIRECTORS, EXECUTIVE OFFICERS AND CORPORATE GOVERNANCE |
The information required by this Item concerning our directors and executive officers is incorporated by reference to the sections of our Definitive Proxy Statement to be filed with the Securities and Exchange Commission pursuant to Regulation 14A in connection with our 2020 Annual Meeting of Stockholders (the Proxy Statement) under the headings “The Gilead Board of Directors - Nominees,” “Board Structure,” “Executive Officers,” and, if applicable, “Delinquent Section 16(a) Reports.”
Our written Code of Ethics applies to all of our directors and employees, including our executive officers, including without limitation our principal executive officer, principal financial officer, principal accounting officer or controller or persons performing similar functions. The Code of Ethics is available on our website at http://www.gilead.com in the Investors section under “Corporate Governance.” We intend to disclose future amendments to certain provisions of the Code of Ethics, and waivers of the Code of Ethics granted to executive officers and directors, on the website within four business days following the date of the amendment or waiver.
ITEM 11. | EXECUTIVE COMPENSATION |
The information required by this Item is incorporated by reference to the sections of the Proxy Statement under the headings “Executive Compensation,” “Committees of our Board of Directors,” “Compensation Committee Report,” and “Compensation of Non-Employee Board Members.”
ITEM 12. | SECURITY OWNERSHIP OF CERTAIN BENEFICIAL OWNERS AND MANAGEMENT AND RELATED STOCKHOLDER MATTERS |
The information required by this Item is incorporated by reference to Item 5 of our Annual Report on Form 10-K under the heading “Equity Compensation Plan Information” and the section of the Proxy Statement under the heading “Security Ownership of Certain Beneficial Owners and Management.”
ITEM 13. | CERTAIN RELATIONSHIPS AND RELATED TRANSACTIONS, AND DIRECTOR INDEPENDENCE |
The information required by this Item is incorporated by reference to the sections of the Proxy Statement under the headings “The Gilead Board of Directors,” and “Board Processes.”
ITEM 14. | PRINCIPAL ACCOUNTANT FEES AND SERVICES |
The information required by this Item is incorporated by reference to the section of the Proxy Statement under the heading “Principal Accountant Fees and Services.”
PART IV
ITEM 15. | EXHIBITS AND FINANCIAL STATEMENT SCHEDULES |
(a) The following documents are filed as part of this Annual Report on Form 10-K:
(1) Index list to Consolidated Financial Statements:
(2) Schedule II is included on page 89 of this report. All other schedules are omitted because they are not required or the required information is included in the financial statements or notes thereto.
92
(3) Exhibits.
The following exhibits are filed herewith or incorporated by reference:
Exhibit Footnote | Exhibit Number | Description of Document | ||
(1) | 3.1 | |||
(1) | 3.2 | |||
4.1 | Reference is made to Exhibit 3.1 and Exhibit 3.2 | |||
(2) | 4.2 | |||
(2) | 4.3 | |||
(3) | 4.4 | |||
(4) | 4.5 | |||
(5) | 4.6 | |||
(6) | 4.7 | |||
(7) | 4.8 | |||
4.9** | ||||
(8) | 10.1* | |||
(9) | 10.2* | |||
(10) | 10.3* | |||
(11) | 10.4* | |||
(12) | 10.5* | |||
(13) | 10.6* | |||
(14) | 10.7* | |||
(14) | 10.8* | |||
(15) | 10.9* | |||
(11) | 10.10* | |||
(16) | 10.11* | |||
(16) | 10.12* | |||
(11) | 10.13* | |||
(16) | 10.14* | |||
(16) | 10.15* | |||
(11) | 10.16* | |||
(10) | 10.17* | |||
(11) | 10.18* | |||
(12) | 10.19* | |||
(12) | 10.20* | |||
(11) | 10.21* | |||
(18) | 10.22* | |||
(11) | 10.23* | |||
93
(12) | 10.24* | |||
(18) | 10.25* | |||
(19) | 10.26* | |||
(20) | 10.27* | |||
10.28*,** | ||||
10.29*, ** | ||||
(12) | 10.30* | |||
(12) | 10.31* | |||
(21) | 10.32* | |||
(11) | 10.33* | |||
(11) | 10.34* | |||
(11) | 10.35* | |||
(11) | 10.36* | |||
(11) | 10.37* | |||
(22) | 10.38* | Form of Indemnity Agreement entered into between Registrant and its directors and executive officers | ||
(22) | 10.39* | Form of Employee Proprietary Information and Invention Agreement entered into between Registrant and certain of its officers and key employees | ||
(23) | 10.40* | |||
+(24) | 10.41 | Amendment Agreement, dated October 25, 1993, between Registrant, the Institute of Organic Chemistry and Biochemistry (IOCB) and Rega Stichting v.z.w. (REGA), together with the following exhibits: the License Agreement, dated December 15, 1991, between Registrant, IOCB and REGA (the 1991 License Agreement); the License Agreement, dated October 15, 1992, between Registrant, IOCB and REGA (the October 1992 License Agreement); and the License Agreement, dated December 1, 1992, between Registrant, IOCB and REGA (the December 1992 License Agreement) | ||
+(25) | 10.42 | |||
+(26) | 10.43 | |||
+(27) | 10.44 | |||
+(28) | 10.45 | |||
+(29) | 10.46 | |||
+(29) | 10.47 | |||
++(30) | 10.48 | |||
++(30) | 10.49 | |||
+(31) | 10.50 | |||
+(32) | 10.51 | |||
++(12) | 10.52 | |||
21.1** | ||||
23.1** | ||||
31.1** | ||||
31.2** | ||||
32*** | ||||
101.INS** | XBRL Instance Document - The instance document does not appear in the Interactive Data File because its XBRL tags are embedded within the Inline XBRL document | |||
94
101.SCH** | Inline XBRL Taxonomy Extension Schema Document | |||
101.CAL** | Inline XBRL Taxonomy Extension Calculation Linkbase Document | |||
101.DEF** | Inline XBRL Taxonomy Extension Definition Linkbase Document | |||
101.LAB** | Inline XBRL Taxonomy Extension Label Linkbase Document | |||
101.PRE** | Inline XBRL Taxonomy Extension Presentation Linkbase Document | |||
104 | The cover page from the Company’s Annual Report on Form 10-K for the fiscal year ended December 31, 2019, formatted in Inline XBRL | |||
(1) | Filed as an exhibit to Registrant’s Current Report on Form 8-K filed on May 9, 2019, and incorporated herein by reference. |
(2) | Filed as an exhibit to Registrant’s Current Report on Form 8-K filed on April 1, 2011, and incorporated herein by reference. |
(3) | Filed as an exhibit to Registrant’s Current Report on Form 8-K filed on December 13, 2011, and incorporated herein by reference. |
(4) | Filed as an exhibit to Registrant’s Current Report on Form 8-K filed on March 7, 2014, and incorporated herein by reference. |
(5) | Filed as an exhibit to Registrant’s Current Report on Form 8-K filed on November 17, 2014, and incorporated herein by reference. |
(6) | Filed as an exhibit to Registrant’s Current Report on Form 8-K filed on September 14, 2015, and incorporated herein by reference. |
(7) | Filed as an exhibit to Registrant’s Current Report on Form 8-K filed on September 20, 2016, and incorporated herein by reference. |
(8) | Filed as an exhibit to Registrant’s Current Report on Form 8-K filed on May 12, 2017, and incorporated herein by reference. |
(9) | Filed as an exhibit to Registrant’s Annual Report on Form 10-K for the fiscal year ended December 31, 2009, and incorporated herein by reference. |
(10) | Filed as an exhibit to Registrant’s Quarterly Report on Form 10-Q for the quarter ended March 31, 2011, and incorporated herein by reference. |
(11) | Filed as an exhibit to Registrant’s Quarterly Report on Form 10-Q for the quarter ended June 30, 2019, and incorporated herein by reference. |
(12) | Filed as an exhibit to Registrant’s Quarterly Report on Form 10-Q for the quarter ended September 30, 2019, and incorporated herein by reference. |
(13) | Filed as an exhibit to Registrant’s Quarterly Report on Form 10-Q for the quarter ended June 30, 2009, and incorporated herein by reference. |
(14) | Filed as an exhibit to Registrant’s Quarterly Report on Form 10-Q for the quarter ended June 30, 2013, and incorporated herein by reference |
(15) | Filed as an exhibit to Registrant’s Quarterly Report on Form 10-Q for the quarter ended June 30, 2014, and incorporated herein by reference. |
(16) | Filed as an exhibit to Registrant’s Quarterly Report on Form 10-Q for the quarter ended March 31, 2016, and incorporated herein by reference. |
(17) | Filed as an exhibit to Registrant’s Current Report on Form 8-K filed on May 8, 2015, and incorporated herein by reference. |
(18) | Filed as an exhibit to Registrant’s Quarterly Report on Form 10-Q for the quarter ended June 30, 2018, and incorporated herein by reference. |
(19) | Filed as an exhibit to Registrant’s Quarterly Report on Form 10-Q for the quarter ended September 30, 2018, and incorporated herein by reference. |
(20) | Filed as an exhibit to Registrant’s Quarterly Report on Form 10-Q for the quarter ended June 30, 2008, and incorporated herein by reference. |
(21) | Filed as an exhibit to Registrant’s Current Report on Form 8-K filed on December 10, 2018, and incorporated herein by reference. |
(22) | Filed as an exhibit to Registrant’s Registration Statement on Form S-1 (No. 33-55680), as amended, and incorporated herein by reference. |
(23) | Filed as an exhibit to Registrant’s Annual Report on Form 10-K for the fiscal year ended December 31, 2006, and incorporated herein by reference. |
(24) | Filed as an exhibit to Registrant’s Annual Report on Form 10-K for the fiscal year ended March 31, 1994, and incorporated herein by reference. |
(25) | Filed as an exhibit to Registrant’s Annual Report on Form 10-K for the fiscal year ended December 31, 2000, and incorporated herein by reference. |
(26) | Filed as an exhibit to Registrant’s Quarterly Report on Form 10-Q for the quarter ended September 30, 2006, and incorporated herein by reference. |
(27) | Filed as an exhibit to Registrant’s Quarterly Report on Form 10-Q for the quarter ended September 30, 2013, and incorporated herein by reference. |
(28) | Filed as an exhibit to Triangle Pharmaceuticals, Inc.’s Quarterly Report on Form 10-Q/A filed on November 3, 1999, and incorporated herein by reference. |
(29) | Filed as an exhibit to Registrant’s Quarterly Report on Form 10-Q for the quarter ended September 30, 2005, and incorporated herein by reference. |
(30) | Filed as an exhibit to Registrant’s Amendment No. 1 to Annual Report on Form 10-K/A filed on April 18, 2019, and incorporated herein by reference. |
(31) | Filed as an exhibit to Registrant’s Annual Report on Form 10-K for the fiscal year ended December 31, 2014, and incorporated herein by reference. |
(32) | Filed as an exhibit to Kite Pharma, Inc.’s Registration Statement on Form S-1/A (No. 333-196081) filed on June 17, 2014, and incorporated herein by reference. |
* | Management contract or compensatory plan or arrangement. |
** | Filed herewith. |
*** | Furnished herewith. |
+ | Certain confidential portions of this Exhibit were omitted by means of marking such portions with an asterisk (the Mark). This Exhibit has been filed separately with the Secretary of the Securities and Exchange Commission without the Mark pursuant to Registrant’s Application Requesting Confidential Treatment under Rule 24b-2 under the Securities Exchange Act of 1934, as amended. |
++ | Certain confidential portions of this Exhibit were omitted by means of marking such portions with the Mark because the identified confidential portions are (i) not material and (ii) would be competitively harmful if publicly disclosed. |
ITEM 16. | FORM 10-K SUMMARY |
None.
95
SIGNATURES
Pursuant to the requirements of Section 13 or 15(d) of the Securities Exchange Act of 1934, the registrant has duly caused this report to be signed on its behalf by the undersigned, thereunto duly authorized.
GILEAD SCIENCES, INC. | |
By: | /s/ DANIEL P. O’DAY |
Daniel P. O’Day Chairman and Chief Executive Officer | |
POWER OF ATTORNEY
KNOW ALL PERSONS BY THESE PRESENTS, that each person whose signature appears below constitutes and appoints Daniel P. O’Day and Brett A. Pletcher, and each of them, as his true and lawful attorneys-in-fact and agents, with full power of substitution and resubstitution, for him or her and in his or her name, place, and stead, in any and all capacities, to sign any and all amendments to this Report, and to file the same, with all exhibits thereto, and other documents in connection therewith, with the Securities and Exchange Commission, granting unto said attorneys-in-fact and agents, and each of them, full power and authority to do and perform each and every act and thing requisite and necessary to be done in connection therewith, as fully to all intents and purposes as he might or could do in person, hereby ratifying and confirming that all said attorneys-in-fact and agents, or any of them or their or his substitute or substitutes, may lawfully do or cause to be done by virtue hereof.
Pursuant to the requirements of the Securities Exchange Act of 1934, as amended, this Report has been signed below by the following persons on behalf of the registrant and in the capacities and on the dates indicated.
96
Signature | Title | Date | ||
/s/ DANIEL P. O’DAY | Chairman and Chief Executive Officer | February 24, 2020 | ||
Daniel P. O’Day* | (Principal Executive Officer) | |||
/s/ ANDREW D. DICKINSON | Executive Vice President and Chief Financial Officer | February 24, 2020 | ||
Andrew D. Dickinson | (Principal Financial Officer) | |||
/s/ DIANE E. WILFONG | Senior Vice President and Chief Accounting Officer | February 24, 2020 | ||
Diane E. Wilfong | (Principal Accounting Officer) | |||
/s/ JOHN F. COGAN | Director | February 24, 2020 | ||
John F. Cogan, Ph.D.* | ||||
/s/ KELLY A. KRAMER | Director | February 24, 2020 | ||
Kelly A. Kramer* | ||||
/s/ KEVIN E. LOFTON | Director | February 24, 2020 | ||
Kevin E. Lofton* | ||||
/s/ HARISH MANWANI | Director | February 24, 2020 | ||
Harish Manwani* | ||||
/s/ RICHARD J. WHITLEY | Director | February 24, 2020 | ||
Richard J. Whitley, M.D.* | ||||
/s/ GAYLE E. WILSON | Director | February 24, 2020 | ||
Gayle E. Wilson* | ||||
/s/ PER WOLD-OLSEN | Director | February 24, 2020 | ||
Per Wold-Olsen* | ||||
*Represents a majority of the Board of Directors
97