UNITED STATES
SECURITIES AND EXCHANGE COMMISSION
Washington, D.C. 20549
FORM
(Mark One)
For the fiscal year ended
or
For the transition period from _______________ to ____________________
Commission file number:
(Exact Name of Registrant as Specified in Its Charter)
| ||
(State or Other Jurisdiction of | (I.R.S. Employer Identification No.) | |
Incorporation or Organization) | ||
(Address of Principal Executive Offices) | (Zip Code) |
Registrant’s telephone number, including area code (
Securities registered pursuant to Section 12(b) of the Act:
Title of each class | Trading Symbol(s) | Name of each exchange on which registered | ||
Securities registered pursuant to Section 12(g) of the Act:
None
(Title of class)
Indicate by check mark if the registrant is a well-known seasoned issuer, as defined in Rule 405 of the Securities Act. Yes ◻
Indicate by check mark if the registrant is not required to file reports pursuant to Section 13 or 15(d) of the Act. Yes ◻
Indicate by check mark whether the registrant (1) has filed all reports required to be filed by Section 13 or 15(d) of the Securities Exchange Act of 1934 during the preceding 12 months (or for such shorter period that the registrant was required to file such reports), and (2) has been subject to such filing requirements for the past 90 days.
Indicate by check mark whether the registrant has submitted electronically every Interactive Data File required to be submitted pursuant to Rule 405 of Regulation S-T (§232.405 of this chapter) during the preceding 12 months (or for such shorter period that the registrant was required to submit such files).
Indicate by check mark whether the registrant is a large accelerated filer, an accelerated filer, a non-accelerated filer, a smaller reporting company, or an emerging growth company. See the definitions of “large accelerated filer,” “accelerated filer,” “smaller reporting company” and “emerging growth company” in Rule 12b-2 of the Exchange Act.
Accelerated filer ◻ | |
Non-accelerated filer ◻ | Smaller reporting company |
Emerging growth company |
If an emerging growth company, indicate by check mark if the registrant has elected not to use the extended transition period for complying with any new or revised financial accounting standards provided pursuant to Section 13(a) of the Exchange Act. ◻
Indicate by check mark whether the registrant is a shell company (as defined in Rule 12b-2 of the Act). Yes
The aggregate market value of the 255,723 shares of Seaboard common stock held by nonaffiliates was approximately $
DOCUMENTS INCORPORATED BY REFERENCE
Part III incorporates information by reference to the registrant’s definitive proxy statement, to be filed with the Securities and Exchange Commission within 120 days after the close of the fiscal year ended December 31, 2019.
SEABOARD CORPORATION
FORM 10-K
YEAR ENDED DECEMBER 31, 2019
TABLE OF CONTENTS
Part I | Page | |
Item 1 | 2 | |
Item 1A | 6 | |
Item 1B | 12 | |
Item 2 | 12 | |
Item 3 | 13 | |
Item 4 | 13 | |
Part II | ||
Item 5 | 14 | |
Item 6 | 15 | |
Item 7 | Management’s Discussion and Analysis of Financial Condition and Results of Operations | 16 |
Item 7A | 25 | |
Item 8 | 27 | |
27 | ||
29 | ||
30 | ||
31 | ||
32 | ||
33 | ||
Item 9 | Changes in and Disagreements with Accountants on Accounting and Financial Disclosure | 63 |
Item 9A | 63 | |
Item 9B | 65 | |
Part III | ||
Item 10 | 65 | |
Item 11 | 65 | |
Item 12 | Security Ownership of Certain Beneficial Owners and Management and Related Stockholder Matters | 65 |
Item 13 | Certain Relationships and Related Transactions, and Director Independence | 65 |
Item 14 | 65 | |
Part IV | ||
Item 15 | 65 | |
Item 16 | 68 | |
69 | ||
PART I
Forward-looking Statements
This report, including information included or incorporated by reference in this report, contains certain forward-looking statements with respect to the financial condition, results of operations, plans, objectives, future performance and business of Seaboard Corporation and its subsidiaries (“Seaboard”). Forward-looking statements generally may be identified as statements that are not historical in nature and statements preceded by, followed by or that include the words “believes,” “expects,” “may,” “will,” “should,” “could,” “anticipates,” “estimates,” “intends” or similar expressions.
In more specific terms, forward-looking statements include, without limitation:
| ● | statements concerning the projection of revenues, income or loss, capital expenditures, capital structure or other financial items; |
| ● | statements regarding the plans and objectives of management for future operations; |
| ● | statements of future economic performance; |
| ● | statements regarding the intent, belief or current expectations of Seaboard and its management with respect to: |
| (i) | Seaboard’s ability to obtain adequate financing and liquidity; |
| (ii) | the price of feed stocks and other materials used by Seaboard; |
| (iii) | the sale price or market conditions for pork, agricultural commodities, sugar, alcohol, turkey and other products and services; |
| (iv) | the recorded tax effects under certain circumstances and changes in tax laws; |
| (v) | the volume of business and working capital requirements associated with the competitive trading environment for the Commodity Trading and Milling (CT&M) segment; |
| (vi) | the charter hire rates and fuel prices for vessels; |
| (vii) | the fuel costs and related spot market prices in the Dominican Republic; |
| (viii) | the effect of the fluctuation in foreign currency exchange rates; |
| (ix) | the profitability or sales volume of any of Seaboard’s segments; |
| (x) | the anticipated costs and completion timetables for Seaboard’s scheduled capital improvements, acquisitions and dispositions; |
| (xi) | the productive capacity of facilities that are planned or under construction, and the timing of the commencement of operations at such facilities; or |
| (xii) | other trends affecting Seaboard’s financial condition or results of operations, and statements of the assumptions underlying or relating to any of the foregoing statements. |
This list of forward-looking statements is not exclusive. Seaboard undertakes no obligation to publicly update or revise any forward-looking statement, whether as a result of new information, future events, changes in assumptions or otherwise, except as required by law. Forward-looking statements are not guarantees of future performance or results. They involve risks, uncertainties and assumptions. Actual results may differ materially from those contemplated by the forward-looking statements due to a variety of factors. The information contained in this Form 10-K and in other filings Seaboard makes with the Securities and Exchange Commission (the “SEC”), including without limitation, the information under the items “Risk Factors” and “Management’s Discussion and Analysis of Financial Condition and Results of Operations” in this Form 10-K, identifies important factors which could cause such differences.
1
Item 1. Business
General Development of Business
Seaboard Corporation was originally founded in 1918 as a flour brokerage business and was organized as a Delaware corporation in 1946. Seaboard Corporation and its subsidiaries (collectively, “Seaboard”) together comprise a diverse global agribusiness and transportation company. In the United States (“U.S.”), Seaboard is primarily engaged in hog production, pork processing and ocean transportation. Overseas, Seaboard is primarily engaged in commodity merchandising, grain processing, sugar and alcohol production and electric power generation. Seaboard also has an equity method investment in Butterball, LLC (“Butterball”), a producer and processor of branded and non-branded turkey products. See Note 15 to the consolidated financial statements for specific developments for each segment.
Approximately 77% of the outstanding common stock of Seaboard is collectively owned by Seaboard Flour LLC and SFC Preferred, LLC. Mr. Steven J. Bresky, President and Chief Executive Officer of Seaboard, and other members of the Bresky family, including trusts created for their benefit, own the equity interests of Seaboard Flour LLC and SFC Preferred, LLC, which are Delaware limited liability companies.
Description of Business
Principal Products and Services
Pork Segment – Seaboard, through its subsidiary Seaboard Foods LLC, engages in the business of hog production and pork processing in the U.S. Seaboard’s Pork segment is a vertically integrated pork producer that primarily produces and sells fresh and frozen pork products to further processors, foodservice operators, distributors and grocery stores. This segment sells to U.S. customers and exports to Japan, Mexico, China and numerous other foreign markets. Pork products include fresh pork, such as loins, tenderloins and ribs which are primarily sold to distributors and grocery stores and fresh and frozen pork products sold in bulk to further processors who produce products, such as lunchmeat, ham, bacon and sausage.
This segment’s pork processing plant, located in Guymon, Oklahoma, generally operates at a double-shift processing capacity of approximately six million hogs annually. Seaboard also has a ham boning and processing plant in Mexico. In 2019, Seaboard raised approximately 88% of the hogs processed at its processing plant, with the remaining hog requirements purchased primarily under contracts from independent producers. Seaboard’s hog production facilities consist of genetic and commercial breeding, farrowing, nursery and finishing buildings located in the Central U.S. These facilities have capacity to produce approximately eight million hogs annually.
The Pork segment also produces biodiesel at facilities in Oklahoma and Missouri. Biodiesel is produced from pork fat supplied by the Oklahoma pork processing plant and from other animal fats and vegetable oils purchased from third parties. The biodiesel is sold to fuel blenders for distribution. In 2019, the Pork segment purchased and began modifying an idle ethanol plant in Hugoton, Kansas, that it plans to use to produce renewable diesel in the future. The Kansas plant is expected to produce 85 million gallons of renewable diesel annually when operating at full capacity.
Seaboard has a 50% noncontrolling interest in Seaboard Triumph Foods, LLC (“STF”), which operates a pork processing plant located in Sioux City, Iowa. STF began single-shift operations in September 2017 and a second shift commenced in October 2018. STF’s plant is designed to process approximately six million market hogs annually when operating at full capacity. Seaboard has agreements with STF and Triumph Foods, LLC (“Triumph”), an independent pork processor, to market substantially all pork products produced at STF’s and Triumph’s pork processing plants. Seaboard and Triumph supply a portion of the hogs processed at the STF plant. Seaboard’s revenues for its pork products are primarily based on a margin sharing arrangement that considers the average sales price, standard costs and the mix of products sold from the Seaboard and Triumph pork processing plants. The Pork segment also has a 50% noncontrolling interest in Daily’s Premium Meats, LLC (“Daily’s”). Daily’s produces and markets raw and pre-cooked bacon using pork bellies sourced from Seaboard, Triumph and STF.
Commodity Trading and Milling Segment – Seaboard’s CT&M segment, which is managed under the name of Seaboard Overseas and Trading Group, is an integrated agricultural commodity trading, processing and logistics company. Overall, the CT&M segment has facilities in 29 countries, primarily in Africa, South America and the Caribbean. This segment sources, transports and markets approximately 13 million metric tons per year of wheat, corn, soybeans, soybean meal and other commodities. Also, Seaboard and its affiliates produce approximately six million metric tons of wheat flour, maize meal, manufactured feed and oilseed crush commodities per year in addition to other related grain-based products. This segment owns three vessels, but the majority of the trading business is transacted with chartered ships.
2
Marine Segment – Seaboard, through its subsidiary, Seaboard Marine Ltd., and various foreign affiliated companies and third-party agents, provides cargo shipping services in the U.S. and 26 countries in the Caribbean and Central and South America. The Marine segment’s primary operations are at PortMiami and include a terminal and an off-port warehouse for cargo consolidation and temporary storage. At the Port of Houston, this segment operates a cargo terminal facility that includes on-dock warehouse space for temporary storage of bagged grains, resins and other cargoes. Seaboard also makes scheduled vessel calls to Brooklyn, New Orleans, Philadelphia, Savannah and various ports in the Caribbean and Central and South America. The Marine segment uses a network of offices and agents throughout the U.S., Canada, the Caribbean and Central and South America to sell freight services. Seaboard’s capabilities allow transport by truck or rail of import and export cargo to and from various U.S. ports and foreign ports. This segment’s fleet consists of 22 chartered and 3 owned vessels, and includes dry, refrigerated and specialized containers and other cargo related equipment.
Sugar and Alcohol Segment – Seaboard, through its subsidiary, Seaboard Energías Renovables y Alimentos S.R.L., operates a vertically integrated sugar and alcohol production facility in Argentina. Sugarcane grown on owned land supplies most of the raw material processed in its plant. The sugar is primarily marketed locally, with some exports to the U.S. and other countries. The alcohol is primarily marketed to industrial users or sold as dehydrated alcohol to certain oil companies under the Argentine governmental bioethanol program, which requires alcohol to be blended with gasoline. This segment also owns a 51 megawatt cogeneration power plant, which is fueled by the burning of sugarcane by-products, natural gas and other biomass when available.
Power Segment – Seaboard, through its subsidiary, Transcontinental Capital Corp. (Bermuda) Ltd., is an independent power producer generating electricity for the Dominican Republic power grid. Seaboard’s Power segment owns and operates a power generating barge, located on the Ozama River, that contains a system of engines capable of using natural gas or heavy fuel oil to produce up to 108 megawatts of electricity. Seaboard’s Power segment sells the electricity it generates primarily on the spot market to government-owned distribution companies. It is not directly involved in the transmission or distribution of electricity and is exempt from regulations under the Public Utility Holding Company Act of 1938, as amended. Seaboard’s Power segment is currently constructing a new floating power barge with capacity to generate approximately 146 megawatts of electricity using gaseous fuels, including natural gas. Operations are anticipated to begin in mid-2021. Seaboard is exploring strategic alternatives for the existing barge, including selling, relocating or operating in conjunction with the new barge at the current site. The estimated total cost of the project ranges from approximately $185 million to $210 million depending upon the alternative selected.
Turkey Segment – Seaboard has a 50% noncontrolling interest in Butterball, LLC (“Butterball”), a vertically integrated producer and processor of branded and non-branded conventional, antibiotic-free and organic turkey products. Butterball is a national supplier to retail stores, foodservice outlets and industrial entities, and to a lesser extent, exports products to Mexico and other foreign markets.
Other Businesses – Seaboard, through its subsidiary, Mount Dora Farms Inc., processes jalapeño peppers at its plant in Honduras, which are primarily shipped to and sold in the U.S.
The information required by this item with respect to the amount or percentage of total revenue contributed by any class of similar products or services, which account for 10% or more of consolidated revenue in any of the last three fiscal years, is set forth in Note 15 to the consolidated financial statements.
Sources and Availability of Raw Materials
The Power segment and Turkey segment utilize material amounts of raw materials that are dependent on purchases from one supplier or a small group of dominant suppliers. The Power segment has one primary supplier of natural gas, but the barge can run on other types of fuel. The Turkey segment purchases a significant portion of its feed and grain used in the manufacturing of feed for its turkeys in North Carolina from Seaboard’s 50% partner in Butterball.
Patents, Trademarks, Licenses, Franchises and Concessions
Seaboard believes there is significant recognition of the trademarks identified below in the various industries Seaboard serves and by many of its customers. Seaboard uses the trademark of Seaboard™.
The Pork segment uses registered trademarks including, but not limited to, Seaboard Foods®, Seaboard Farms®, Seaboard EnergyTM, Prairie Fresh®, Our Farms, Our Commitment®, St. Joe Pork®, and Cook-in Bag®. Daily’s uses the trademarks Daily’s®, Daily’s Premium Meats Since 1893®, Belly Up to the Best®, Buffet Brand® and Del Pueblo®. Seaboard considers the use of these trademarks important to the marketing and promotion of its pork products.
3
The CT&M segment uses registered trademarks including, but not limited to, Mothers Pride® and Zambia’s Pride® in Zambia, Thunderbolt Flour® and Maid Marian® in Guyana, GMA® and Top Pain® in Ivory Coast, and GMD® and Jarga® in Senegal.
The Marine segment uses the registered trademarks of Seaboard Marine® and Seaboard Solutions®.
The Sugar and Alcohol segment markets sugar under the Chango® brand.
The Turkey segment uses registered trademarks including, but not limited to, Butterball®, Carolina Turkey® and Farm to Family Butterball®. Seaboard considers the use of these trademarks important to marketing and promotion of its turkey products.
Seasonal Business
The Turkey business is seasonal for whole birds and related products with the Thanksgiving and Christmas holiday demands driving the majority of those sales. Seaboard’s other segments are not seasonally dependent to any material extent.
Dependence on a Single Customer or Few Customers
Seaboard does not have sales to any one customer equal to 10% or more of consolidated revenues. The CT&M segment derived 11% and 12% of its sales from a former non-consolidated affiliate for the years ended December 31, 2018 and 2017, respectively. Additional equity interests were obtained in 2019 and as a result, this entity became consolidated in 2019. The Sugar and Alcohol segment derived 25%, 29% and 39% of its sales from one customer for the years ended December 31, 2019, 2018 and 2017, respectively, and another customer represented 23%, 19% and 10% of its sales for the years ended December 31, 2019, 2018 and 2017, respectively. The Power segment sells power in the Dominican Republic on the spot market accessed primarily by three wholly government-owned distribution companies. The Turkey segment had one customer that represented 16%, 15% and 13% of its sales for the years ended December 31, 2019, 2018 and 2017, respectively, and another customer that represented 12%, 11% and 11% of its sales for the years ended December 31, 2019, 2018 and 2017, respectively. No other segment has sales to a few customers that, if lost, would have a material adverse effect on any such segment or on Seaboard taken as a whole.
Competitive Conditions
Competition in Seaboard’s Pork segment comes from a variety of regional, national and international producers and processors and is based primarily on product quality, customer service and price. According to the trade publications Successful Farming and Informa Economics, Seaboard was ranked number three in hog production (based on sows in production) and number four in pork processing in the U.S. in 2019 (based on daily processing capacity, including Triumph’s and STF’s capacity).
Seaboard’s commodity trading business faces competition from numerous traders around the world. Most of the grain processing and related businesses face competition from either imported products or other local producers in the same industries.
Seaboard’s Marine segment faces competition based on price, reliable sailing frequencies and customer service. Seaboard believes it is among the top five ranking ocean liner services for cargoes in the Caribbean and Central America based on cargo volume.
Seaboard’s Sugar and Alcohol segment owns one of the largest sugar mills in Argentina and faces significant competition for sugar sales in the local Argentine market. Sugar prices in Argentina can fluctuate compared to world markets due to Argentine government price controls and protection policies.
Seaboard’s Power segment sells the power it generates to the spot market or to contract customers at prices based on market conditions and cost-based rates.
Competition for the Turkey segment comes from a variety of regional and national producers and processors and is based primarily on product quality, customer service and price. Butterball ranks as one of the nation’s top three turkey producers based on live production.
Environmental Compliance
Seaboard’s Pork segment and Turkey segment are subject to numerous federal, state and local laws and regulations relating to the environment that require the expenditure of funds in the ordinary course of business. Seaboard’s Pork segment and Turkey segment do not anticipate making expenditures for these purposes that, in the aggregate, would have a material effect on Seaboard’s financial condition or results of operations.
4
Number of Persons Employed by Registrant
At the time of this report, Seaboard, excluding non-consolidated affiliates, had approximately 13,100 employees, of whom approximately 6,600 were employed in the U.S.
Available Information
Seaboard electronically files with the SEC annual reports on Form 10-K, quarterly reports on Form 10-Q, current reports on Form 8-K and amendments to those reports pursuant to Section 13(a) or 15(d) of the Exchange Act. The SEC maintains an internet website that contains reports, proxy and information statements, and other information regarding electronic filers at http://www.sec.gov. Seaboard provides access to its most recent Form 10-K, 10-Q and 8-K reports, and any amendments to these reports, on its internet website, www.seaboardcorp.com, free of charge, as soon as reasonably practicable after those reports are electronically filed with the SEC. Please note that any internet addresses provided in this report are for information purposes only and are not intended to be hyperlinks. Accordingly, no information provided at such internet addresses is intended or deemed to be incorporated herein by reference.
Executive Officers of the Registrant
The following table lists the executive officers of Seaboard. Generally, executive officers are elected at the annual meeting of the Board of Directors following the Annual Meeting of Stockholders and hold office until the next such annual meeting or until their respective successors are duly chosen and qualified. There are no arrangements or understandings pursuant to which any executive officer was elected.
Name (Age) |
| Positions and Offices with Registrant and Affiliates |
Steven J. Bresky (66) | President and Chief Executive Officer | |
Robert L. Steer (60) | Executive Vice President, Chief Financial Officer | |
David M. Becker (58) | Senior Vice President, General Counsel and Secretary | |
James L. Gutsch (66) | Senior Vice President, Engineering | |
Ralph L. Moss (74) | Senior Vice President, Governmental Affairs | |
David S. Oswalt (52) | Senior Vice President, Finance and Treasurer | |
David H. Rankin (48) | Senior Vice President, Tax and Business Development | |
Michael D. Trollinger (51) | Vice President, Corporate Controller and Chief Accounting Officer | |
Ty A. Tywater (50) | Vice President, Audit Services | |
Ivan J. Winfield, Jr (55) | Vice President, Information Technology | |
David M. Dannov (58) | President, Seaboard Overseas and Trading Group | |
Edward A. Gonzalez (54) | President, Seaboard Marine Ltd. | |
Darwin E. Sand (55) | President, Seaboard Foods LLC |
Mr. Bresky has served as President and Chief Executive Officer of Seaboard since July 2006.
Mr. Steer has served as Executive Vice President, Chief Financial Officer of Seaboard since April 2011.
Mr. Becker has served as Senior Vice President, General Counsel and Secretary of Seaboard since April 2011.
Mr. Gutsch has served as Senior Vice President, Engineering of Seaboard since April 2011.
Mr. Moss has served as Senior Vice President, Governmental Affairs of Seaboard since April 2011.
Mr. Oswalt has served as Senior Vice President, Finance and Treasurer since April 2013.
Mr. Rankin has served as Senior Vice President, Taxation and Business Development since April 2015 and previously as Vice President, Taxation and Business Development since April 2013.
Mr. Trollinger has served as Vice President, Corporate Controller and Chief Accounting Officer of Seaboard since March 2015. Prior to that, he served as Vice President, Finance and Operational Reporting for Jack Cooper Enterprises, Inc. from 2011 to 2015.
Mr. Tywater has served as Vice President, Audit Services of Seaboard since November 2008.
Mr. Winfield has served as Vice President, Information Technology since February 2018 and previously as Director of Information Technology from 2009 to 2018.
Mr. Dannov has served as President of Seaboard Overseas and Trading Group since August 2006.
Mr. Gonzalez has served as President of Seaboard Marine Ltd. since January 2005.
Mr. Sand has served as President of Seaboard Foods LLC since March 2018 and previously as Senior Vice President of Sales since 2011.
5
Item 1A. Risk Factors
Seaboard has identified important risks and uncertainties that could affect the results of operations, financial condition or business and that could cause them to differ materially from Seaboard’s historical results of operations, financial condition or business, or those contemplated by forward-looking statements made herein or elsewhere, by, or on behalf of, Seaboard. Factors that could cause or contribute to such differences include those factors described below.
| (a) | General |
| (1) | Seaboard’s Operations Are Subject to the General Risks of the Food Industry. The food products manufacturing industry is subject to the risks posed by: |
| ● | food spoilage; |
| ● | food contamination, including contamination caused by disease-producing organisms or pathogens, such as Listeria monocytogenes, Salmonella, pathogenic E coli and aflatoxin; |
| ● | food allergens; |
| ● | evolving consumer preferences and nutritional and health-related concerns; |
| ● | international, foreign, federal, state and local food processing regulations; |
| ● | consumer product liability claims; |
| ● | product recall; |
| ● | product tampering; and |
| ● | public perception of food production practices, including handling of production and live animals. |
Pathogens which may cause food contamination are found generally in livestock and in the environment and therefore may be present in Seaboard’s products. These pathogens also can be introduced to its products as a result of improper handling by customers or consumers. Seaboard does not have control over handling procedures once products have been shipped for distribution. If one or more of these risks were to materialize, Seaboard’s revenues could decrease, costs of doing business could increase, and Seaboard’s operating results could be adversely affected.
| (2) | International Operations Subject Seaboard to Risks That Could Have a Significant Impact on Seaboard’s Business. Seaboard is a diverse agribusiness and transportation company with global operations in several industries. Most of the sales and costs of Seaboard’s segments are significantly influenced by worldwide fluctuations in commodity prices or changes in foreign political and economic conditions. Accordingly, revenues, operating income and cash flows could fluctuate significantly from year to year. In addition, Seaboard’s international activities pose risks not faced by companies that limit themselves to U.S. markets. These risks include: |
| ● | changes in foreign currency exchange rates; |
| ● | foreign currency exchange controls; |
| ● | changes in a specific country’s or region’s political or economic conditions, particularly in emerging markets; |
| ● | hyperinflation; |
| ● | heightened customer credit and execution risk; |
| ● | tariffs, other trade protection measures and import or export licensing requirements; |
| ● | closing of borders by foreign countries to the import of meat products due to animal disease or other perceived health or safety issues; |
| ● | potentially negative consequences from changes in tax laws; |
| ● | legal and regulatory structures and unexpected changes in legal and regulatory requirements and any lawsuits that may arise; |
| ● | negative perception within a foreign country of a U.S. company doing business in that foreign country; |
| ● | compliance with laws and regulations for conducting international business such as Foreign Account Tax Compliance Act, Foreign Corrupt Practices Act and Office of Foreign Assets Control regulations; |
| ● | expropriation, civil unrest and government instability; and |
| ● | inconsistent application or enforcement of local laws, including tax laws. |
| (3) | Deterioration of Economic Conditions Could Negatively Impact Seaboard’s Business. Seaboard’s business may be adversely affected by changes in national or global economic conditions, including inflation, interest rates, including LIBOR phase-out risks, availability of capital markets, consumer spending rates, energy availability and costs, and the effects of governmental initiatives to manage economic conditions. Any such changes could adversely affect the demand for Seaboard’s meat products, grains, shipping services and other products, or the cost and availability of needed raw materials and packaging materials, thereby negatively affecting Seaboard’s financial results. The current national and global economic conditions, could, among other things: |
| ● | impair the financial condition of some of Seaboard’s customers and suppliers, thereby increasing customer bad debts or non-performance by customers and suppliers; |
6
| ● | negatively impact global demand for protein and grain-based products, which could result in a reduction of revenues, operating income and cash flows; |
| ● | decrease the value of Seaboard’s investments in equity and debt securities, including pension plan assets, causing losses that would adversely impact Seaboard’s net earnings; and |
| ● | impair the financial viability of Seaboard’s insurers. |
| (4) | Decentralization May Present Certain Risks. Seaboard’s operations are relatively decentralized in comparison with its peers. While Seaboard management believes this practice enables it to remain responsive to risks, opportunities and to customers’ needs, it necessarily places significant control and decision-making powers in the hands of local management. This presents various risks, including the risk that management may be slower or less able to identify or react to problems affecting a key business than in a more centralized environment. In addition, it means that Seaboard may be slower to detect compliance related problems (e.g., a rogue employee undertaking activities that are prohibited by applicable law or Seaboard’s internal policies) and that “company-wide” business initiatives, such as the integration of disparate information technology systems, are often more challenging and costly to implement, and their risk of failure higher, than they would be in a more centralized environment. Depending on the nature of the problem or initiative in question, such failure could materially adversely affect Seaboard’s business, financial condition or results of operations. |
| (5) | Ocean Transportation Has Inherent Risks. Seaboard’s owned and chartered vessels along with related cargoes are at risk of being damaged or lost because of events such as: |
| ● | bad weather; |
| ● | mechanical failures; |
| ● | grounding, fire, explosions and collisions; |
| ● | human error; and |
| ● | war, piracy and terrorism. |
Any of these hazards could result in death or injury to persons, loss of property, environmental damages, delays or rerouting. If one of Seaboard’s vessels were involved in an incident, the resulting negative public perception could have a material adverse effect on Seaboard’s business, financial condition and results of operations. Also, many aspects of the shipping industry are subject to extensive governmental regulations. Compliance with applicable laws, regulations and standards may require installation of costly equipment or operational changes, while the failure to comply may result in administrative and civil penalties, criminal sanctions, the suspension or termination of Seaboard’s operations or detention of its vessels.
| (6) | Fluctuations in Fuel Costs Could Adversely Affect Operating Margins. Fuel expenses are a large expense for the Marine segment and impacts the CT&M segment’s results. Fuel prices can vary greatly from year to year. While such fluctuations may be offset through fuel surcharges or other mechanisms, such mechanisms do not act with precision in terms of timing and amount and may not adjust revenues enough to offset the increase in costs. The reduced global sulfur emissions cap from 3.5% to 0.5%, effective January 1, 2020, increased fuel costs or required equipment to clean emissions. Seaboard does not know the long-term effects of this new emissions requirement. |
| (7) | Seaboard’s Common Stock Is Thinly Traded and Subject to Daily Price Fluctuations. The common stock of Seaboard is closely held and thinly traded on a daily basis on the NYSE American. Seaboard Flour LLC and SFC Preferred, LLC, which are beneficially owned by Mr. Steven Bresky, President and Chief Executive Officer of Seaboard, and other members of the Bresky family, hold approximately 77% of Seaboard’s outstanding common stock. Accordingly, the price of a share of common stock could fluctuate more significantly from day-to-day than that of a share of more widely held stock that is actively traded on a daily basis. |
| (8) | Seaboard Has Investments in Non-Consolidated Affiliates That Are Managed by Third Parties. Seaboard has several equity method investments in which it owns 50% or less, with various third-party business partners owning the remaining equity. Due to the ownership structure of these affiliates, Seaboard does not control all of the decision making processes and could be exposed to various business risks if the business partners’ business decisions do not align with Seaboard’s best interests, which could adversely impact the results for Seaboard’s income (loss) from affiliates. |
| (9) | Seaboard Is Increasingly Dependent on Information Technology Systems to Manage and Support a Variety of Business Processes and Activities. Seaboard may be adversely impacted if it is unable to protect its information technology systems against, or effectively respond to, cyber-attacks or cybersecurity breaches. Attempted cyber-attacks and other cyber incidents are occurring more frequently and are being made by groups and individuals with a wide range of motives and expertise. Any significant penetration, invasion, destruction, or interruption of these systems could negatively impact operations and there is a risk of business interruption and reputational damage from the unauthorized disclosure of confidential information and a risk of loss to financial assets related to manipulated electronic communications. This includes additional costs for increased security, system remediation and breach detection. If Seaboard is unable to prevent such breaches or failures, its operations could be disrupted or it could negatively impact its financial condition, results of operations, and the market price of its |
7
| common stock. |
| (b) | Pork Segment |
| (1) | Fluctuations in Commodity Pork Prices Could Adversely Affect the Results of Operations. Sales prices for this segment’s products are directly affected by both domestic and worldwide supply and demand for pork products and other proteins, all of which are determined by constantly changing market forces of supply and demand as well as other factors over which Seaboard has little to no control. Commodity pork prices demonstrate a cyclical nature over periods of years, reflecting changes in the supply of fresh pork and competing proteins on the market, especially beef and chicken. This segment’s results of operations could be adversely affected by fluctuations in pork commodity prices. |
| (2) | Increases in Costs of This Segment’s Feed Components and Third-Party Hog Purchases Could Adversely Affect Costs and Operating Margins. Feed costs are the most significant single component of the cost of raising hogs and could be materially affected by commodity price fluctuations for corn and soybean meal. The results of this segment could be negatively affected by increased costs of its feed components. The continued operation of ethanol plants has elevated this risk as it has increased the competing demand for feed ingredients, primarily corn. Approximately 12% of this segment’s slaughtered hogs are purchased from third parties, and commodity price fluctuations for hogs could have an impact on this segment’s total costs. The cost and supply of feed components and the third-party hogs that this segment purchases are determined by constantly changing market forces of supply and demand, which are driven by matters over which Seaboard has no control, including weather, current and projected worldwide grain stocks and prices, grain export prices and supports, and governmental agricultural policies. This segment attempts to manage certain of these risks through the use of financial instruments; however, this may also limit its ability to participate in gains from favorable commodity fluctuations. Unless wholesale pork prices correspondingly increase, increases in the prices of this segment’s feed components or in the cost of third-party hogs purchased would adversely affect Seaboard’s operating margins. |
| (3) | Seaboard May Be Unable to Obtain and Retain Appropriate Personnel. The remote locations of the pork processing plant and live hog operations and a more restrictive national policy on immigration could negatively affect the availability and cost of labor. This segment is dependent on having a sufficient number of properly trained operations personnel. Attracting and retaining qualified personnel is important to this segment’s success. The inability to acquire and retain the services of such personnel could have a material adverse effect on Seaboard’s operations. |
| (4) | The Loss of This Segment’s Oklahoma Pork Processing Plant Could Adversely Affect the Business. This segment is largely dependent on the continued operation of its Oklahoma pork processing plant. The loss of or damage to this plant for any reason, including fire, tornado or earthquake, or the occurrence of adverse governmental action could adversely affect the business of this segment. |
| (5) | Environmental Regulation and Related Litigation Could Have a Material Adverse Effect on the Business. This segment’s operations and properties are subject to extensive and increasingly stringent laws and regulations pertaining to, among other things, odors, the discharge of materials into the environment and the handling and disposition of wastes (including solid and hazardous wastes) or otherwise relating to protection of the environment. Failure to comply with these laws and regulations and any future changes to them could result in significant consequences to Seaboard, including civil and criminal penalties, liability for damages and negative publicity. Some requirements applicable to this segment may also be enforced by citizen groups. Seaboard has incurred, and will continue to incur, operating expenditures to comply with these laws and regulations. |
| (6) | Health Risk to Livestock Could Adversely Affect Production, the Supply of Raw Materials and the Business. Seaboard is subject to risks relating to its ability to maintain animal health and control diseases. The general health of the hogs and the reproductive performance of the sows could have an adverse impact on production and production costs, the supply of raw material to this segment’s pork processing operations and consumer confidence. If this segment’s hogs are affected by disease, Seaboard could be required to destroy infected livestock, which could adversely affect this segment’s production or ability to sell or export its products. Moreover, the herd health of third-party suppliers could adversely affect the supply and cost of hogs available for purchase. Adverse publicity concerning any disease or health concern could also cause customers to lose confidence in the safety and quality of this segment’s food products. |
| (7) | International Trade Barriers Could Adversely Affect This Segment’s Operations. This segment realizes revenues from international markets, particularly Japan, Mexico and China. International sales are subject to risks related to general economic conditions, imposition of tariffs, quotas, trade barriers and other restrictions, enforcement of remedies in foreign jurisdictions and compliance with applicable foreign laws, and other economic and political uncertainties. These and other risks have resulted in, and in the future may result in, border closings or other international trade barriers that could have an adverse effect on Seaboard’s earnings. |
| (8) | The Operating Profit of the Biodiesel Production Facilities Could Be Adversely Impacted by Various Factors. The profitability of this segment’s biodiesel plants could be adversely affected by various factors, including the market price of pork fat, other animal fats and vegetable oils, all of which are utilized to produce biodiesel, and the market price for biodiesel, which is influenced by world oil prices and U.S. government mandates and incentives to use biofuels. Unfavorable changes in these prices over extended periods of time or adverse changes in U.S. government mandates |
| and incentives to use biofuels could adversely affect this segment’s results of operations and could result in the potential impairment of the recorded value of the property, plant and equipment related to these facilities. Also, the federal blender’s credits are not permanent and may not be renewed beyond 2022. |
| (9) | Difficulties Could Be Experienced in the Conversion of the New Renewable Diesel Production Facility. In February 2019, the Pork segment purchased an idle ethanol plant in Kansas. Projected costs to convert the existing plant’s infrastructure to support the new renewable diesel production facility and the costs to construct the new portions of the renewable diesel plant are variable and could be higher than initially projected by the time the plant is operational. Also, significant construction delays could delay the expected timing of operations. |
| (c) | Commodity Trading and Milling Segment |
| (1) | This Segment Is Subject to Risks Associated with Foreign Operations. This segment principally operates in Africa, South America and the Caribbean and, in most cases, in what are generally regarded to be lesser-developed countries. Many of these foreign operations are subject to risks of doing business in lesser-developed countries, which are subject to potential civil unrest and government instability, increasing the exposure to potential expropriation, confiscation, war, insurrection, civil strife and revolution, corruption, currency inconvertibility and devaluation, and currency exchange controls. In addition, foreign government policies and regulations could restrict the purchase of various agricultural commodities and commodity products, reducing or limiting this segment’s ability to access materials or to limit this segment’s sales prices for products sold in local markets. |
| (2) | Fluctuations in Commodity Prices Could Adversely Affect the Business of This Segment. This segment’s sales are significantly affected by fluctuating worldwide prices for various commodities, such as wheat, corn, soybeans, soybean meal and, to a lesser degree, various other agricultural commodity products. These prices are determined by constantly changing market forces of supply and demand, as well as other factors over which Seaboard has little or no control. European flour exports, donated food aid, flour dumping practices and worldwide and local crop production could contribute to these fluctuating market conditions and could have a significant impact on the trading and milling businesses’ sales, value of commodities held in inventory and operating income. |
| (3) | This Segment Uses a Material Amount of Derivative Products to Manage Certain Market Risks. The commodity trading portion of this segment enters into various commodity derivative and foreign exchange derivative transactions to create what management believes is an economic hedge for commodity trades it executes or intends to execute with its customers. This portion of the segment also enters into speculative derivative transactions related to its market risks. Failure to execute or improper execution of a derivative position or a firmly committed sale or purchase contract or a speculative transaction that closes without the desired result or exposure to counter party risk could have an adverse impact on the results of operations and liquidity. |
| (4) | This Segment Is Subject to Higher Than Normal Risks for Attracting and Retaining Key Personnel. In the commodity trading environment, loss of a key employee such as a commodity trader could have a negative impact resulting from the loss of revenues as personal customer relationships can be vital to obtaining and retaining business with various foreign customers. In the milling portion of this segment, employing and retaining qualified expatriate personnel are key elements to success given the difficult living conditions, the unique operating environments and the reliance on a relatively small number of executives to manage each individual location. |
| (5) | This Segment Faces Increasing Competition. This segment is experiencing increasing competition in certain foreign markets by well-capitalized originators, traders of commodities making sales directly to end-use customers and industrial-asset owners that compete in the same markets as this segment. If various raw-material originators refuse to sell commodities to Seaboard for sale in these foreign markets, it could be more challenging for this segment to purchase commodities for sale to its customers at competitive prices. This segment’s sales volume and sale prices for commodities to customers, as well as results of operations, could be adversely impacted by such increased competition. |
| (d) | Marine Segment |
| (1) | The Demand for This Segment’s Services Are Affected by International Trade and Fluctuating Freight Rates. This segment provides cargo shipping services primarily from the U.S. to many different countries in the Caribbean and Central and South America. In addition to the risks of overseas operations, fluctuations in economic conditions and unstable or hostile local political situations in the countries in which this segment operates could affect trade volumes and cargo freight rates, as well as adversely affect this segment’s results of operations. |
| (2) | Chartered Ships Are Subject to Fluctuating Rates. Time-charter expenses are one of this segment’s largest expenses. Certain ships are under charters longer than one year while others are less than one year. These costs can vary greatly due to a number of factors including the worldwide supply and demand for shipping. It is not possible to determine in advance whether a charter contract for more or less than one year will be favorable to this segment’s business. Accordingly, entering into either long-term charter hire contracts during periods of decreasing charter hire costs or short-term charter hire contracts during periods of increasing charter hire costs could have an adverse effect on this segment’s results of operations. In an effort to improve cargo services on higher frequency routes and use more capacity, this segment purchases space, also known as slots, on certain third-party operated vessels. It is expected that this |
9
| segment will continue purchasing slots in the future, but these ship providers may not be reliable and cause shipment delays, damaged goods or other challenges. |
| (3) | Hurricanes May Disrupt Operations. This segment’s port operations can be subject to disruption due to hurricanes, especially at this segment’s major ports in Miami, Florida and Houston, Texas, which could have an adverse effect on this segment’s results of operations. |
| (4) | This Segment Is Subject to Complex Laws and Regulations That May Adversely Affect the Revenues, Costs, Manner or Feasibility of Doing Business. Federal, state and local laws and domestic and international regulations governing worker health and safety, environmental protection, port and terminal security, and the operation of vessels, including fuel regulations, significantly affect this segment’s operations, including rate discussions and other related arrangements. Many aspects of the shipping industry, including rate agreements and vessel cost sharing agreements, are subject to extensive governmental regulation by the Federal Maritime Commission, the U.S. Coast Guard, and U.S. Customs and Border Protection, as well as regulation by private industry organizations. Compliance with applicable laws, regulations and standards may require installation of costly equipment or operational changes, while the failure to comply may result in administrative and civil penalties, criminal sanctions, the suspension or termination of Seaboard’s operations or detention of its vessels. In addition, future changes in laws, regulations and standards, including allowed freight rate discussions and other related arrangements, may result in additional costs or a reduction in revenues. |
| (e) | Sugar and Alcohol Segment |
| (1) | The Success of This Segment Depends on the Condition of the Argentine Economy, Currency and Political Climate. This segment operates a sugar mill, alcohol production and power generation facility in Argentina. Fluctuations in economic conditions or changes in the Argentine political climate could have an impact on the costs of operations, the sales prices of products, export opportunities and the exchange rate of the Argentine peso to the U.S. dollar. In this regard, local sales prices for bioethanol are affected by government price controls and domestic prices for sugar are affected by import duties imposed by the Argentine government, impacting local volume sold, as well as imported and exported volumes to and from international markets. If import duties are changed, this could have a negative impact on the sales prices of this segment’s products. In addition, the majority of this segment’s sales are within Argentina, and any Argentine government attempts to control inflation through retail price controls on mass consumption products, including sugar, could adversely impact the local sales prices of this segment’s products and the results of operations for this segment. In the second quarter of 2018, Argentina was determined to be a highly inflationary economy. A devaluation of the Argentine peso would have a negative impact on this segment’s financial position and results of operations. |
| (2) | This Segment Is Subject to the Risks That Are Inherent in any Agricultural Business. Seaboard’s results of operations for this segment may be adversely affected by numerous factors over which Seaboard has little or no control and that are inherent in any agricultural business, including reductions in the market prices for this segment’s products, adverse weather and growing conditions, pest and disease problems, and new government regulations regarding agriculture and the marketing of agricultural products. Of these risks, weather particularly could adversely affect the amount and quality of the sugarcane produced by this segment and its competitors located in other regions of Argentina. |
| (3) | The Loss of This Segment’s Sole Processing Facility Would Adversely Affect the Business. This segment is largely dependent on the continued operation of a single sugar mill. The loss of or damage to this mill for any reason, including fire, tornado or earthquake, or the occurrence of adverse governmental action or labor unrest resulting in labor strikes could adversely affect the business of this segment. |
| (4) | Labor Relations Challenges Could Adversely Affect Operations. This segment is dependent on unionized labor at its single sugar mill in Argentina. The political and economic environment in Argentina makes normal labor relations very challenging. Contributing to the situation are the historical policies of Argentina’s government and the failure of the Argentine courts to enforce contractual obligations with unions and basic property rights. Interruptions in production as a result of labor unrest could adversely impact the quantity of sugarcane harvested and the amount of sugar, alcohol and power produced and could interfere with the distribution of products stored at the facility. |
| (5) | The Operating Profit of the Alcohol Production Facility Could Be Adversely Impacted by Government Regulations. The profitability of this segment’s alcohol production facility could be adversely affected by Argentine government regulations regarding production quotas, fuel blends and sales prices in the bioethanol market. In addition, corn alcohol producers in Argentina have increased competition in the bioethanol market. Adverse changes in the Argentine government’s regulations regarding bioethanol production quotas and fuel blends could adversely affect this segment’s results of operations. |
| (6) | The Operating Profit of the Cogeneration Power Plant Could Be Adversely Impacted by Contract for the Sale of Energy. The sale price for energy produced and sold by this segment’s cogeneration power plant is based on a biomass cogeneration contract with the Argentine government. The profitability of the cogeneration power plant could be adversely affected by this segment’s failure to enforce the terms of the contract, which could adversely affect this |
| segment’s results of operations and could result in the potential impairment of the recorded value of the property, plant and equipment related to this facility. |
| (f) | Power Segment |
| (1) | The Success of This Segment Depends on the Condition of the Dominican Republic Economy, Currency and Political Climate. Fluctuations in economic conditions or changes in the Dominican Republic political climate could have an impact on the costs of operations, the sales prices of products and the exchange rate of the Dominican peso to the U.S. dollar. In addition to significant currency fluctuations and the other risks of overseas operations, this segment could experience difficulty in obtaining timely collections of trade receivables from the government owned distribution companies or other companies that must also collect from the government in order to make payments on their accounts. Currently, the Dominican Republic does not allow a free market to enable prices to rise with demand, which could limit this segment’s profitability. The government has the ability to arbitrarily decide which power units will be able to operate, which can ultimately determine spot market prices for electricity generated and sold into the power grid and, therefore, could have adverse effects on results of operations. |
| (2) | Supply of Natural Gas Is Limited in the Dominican Republic. Supply of natural gas in the Dominican Republic is limited to one primary supplier. Although the barge can run on other types of fuel, supply disruptions of natural gas could have a negative impact on this segment’s operating income. |
| (3) | The Loss of This Segment’s Sole Facility Would Adversely Affect the Business. This segment is dependent on the continued operation of a single facility. The loss of or damage to this facility for any reason, including fire, hurricane, tornado or earthquake, or the occurrence of adverse governmental actions or labor unrest resulting in labor strikes would adversely affect the business of this segment. |
| (4) | Difficulties Could Be Experienced in the Construction and Installation of the New Power Generating Barge. The new power generating barge is being constructed in Singapore, with delivery to the Dominican Republic expected in late 2020. Installation and commissioning are anticipated to take several months, with commercial operations expected in mid-2021. Significant operational delays, plans for the existing barge or other difficulties encountered in the start-up of operations could have adverse effects on results of operations. |
| (g) | Turkey Segment |
| (1) | Fluctuations in Commodity Turkey Prices Could Adversely Affect the Results of Operations. Sales prices for turkey products are directly affected by both domestic and worldwide supply and demand for turkey products and other proteins, which are determined by constantly changing market forces of supply and demand as well as other factors over which Butterball has little or no control. Butterball’s results of operations and the value of Seaboard’s investment in Butterball could be adversely affected by fluctuations in turkey commodity prices. |
| (2) | Increases in Costs of Butterball’s Feed Components and Turkey Purchases Could Adversely Affect Costs and Operating Margins. Feed costs are the most significant single component of the cost of raising turkeys and could be materially affected by commodity price fluctuations for corn, soybean meal and other commodity grain inputs. Butterball’s results may be negatively affected by increased costs of the feed components. Butterball attempts to manage some of these risks through the use of financial instruments; however, this may also limit its ability to participate in gains from favorable commodity fluctuations. Unless wholesale turkey prices correspondingly increase, increases in the prices of Butterball’s feed components would adversely affect Butterball’s results of operations and the value of Seaboard’s investment in Butterball. |
| (3) | Adverse Operating Results Could Result in Need for Additional Investment. Butterball has third-party bank loan facilities that are secured by substantially all of the assets of Butterball. Adverse operating results could cause Butterball to default on such loan facilities, which could result in a significant adverse impact on Butterball’s financial position or result in Seaboard needing to increase its investment or provide financing to Butterball. |
| (4) | Decreased Perception of Value in the Butterball Brand and Changes in Consumer Preferences Could Adversely Affect Sales Quantity and Price of Butterball Products. Butterball is a premium brand name, built on a long history of offering a quality product that has been differentiated in the market. The value of the Butterball brand allows for sales of a higher unit price than other turkey products. In order to maintain this advantage, Butterball must continue to support the brand with successful marketing efforts and develop new products. Consumer product preferences continue to evolve as a result of, among other things, shifting consumer demographics; changes in consumer lifestyles; digital shopping patterns; and competitive product and pricing pressures. If Butterball’s products fail to meet consumer preferences, or Butterball fails to introduce new products or product extensions on a timely basis, the brand value could diminish significantly. In addition, negative news reports for any reason related to Butterball or the turkey/poultry industry could negatively impact this brand perception, Butterball’s results of operations and the value of Seaboard’s investment in Butterball. |
11
| (5) | The Loss of Butterball’s Primary Further Processing Facility Could Adversely Affect Butterball’s Business. Although Butterball has four processing plants and two further processing plants, Butterball is disproportionately dependent on the continued operation of the processing plant in Mt. Olive, North Carolina, that handles a significant volume of the production of further processed turkey products. The loss of or damage to this plant for any reason, including fire, hurricane, tornado or the occurrence of an adverse governmental action could adversely affect the results of operations for Butterball and the value of Seaboard’s investment in Butterball. |
| (6) | Health Risk to Poultry Could Adversely Affect Production, the Supply of Raw Materials and Butterball’s Business. Butterball is subject to risks relating to its ability to maintain animal health and control diseases, such as avian influenza. The general health of the turkeys and reproductive performance could have an adverse impact on production and production costs, the supply of raw material to Butterball’s processing operations and consumer confidence. If Butterball’s turkeys are affected by disease, Butterball may be required to destroy infected birds, which could adversely affect Butterball’s production or ability to sell or export its products. Adverse publicity concerning any disease or health concern could also cause customers to lose confidence in the safety and quality of Butterball products, resulting in an adverse effect on Butterball’s results of operations and the value of Seaboard’s investment in Butterball. |
| (7) | Butterball May Be Unable to Obtain and Retain Appropriate Personnel. The remote locations of some of Butterball’s processing plants and live turkey operations, along with a more restrictive national policy on immigration, could negatively affect the availability and cost of labor. Butterball is dependent on having sufficient properly trained operations personnel. Attracting and retaining qualified personnel is important to Butterball’s success. The inability to acquire and retain the services of such personnel could have a material adverse effect on Butterball’s operations and the value of Seaboard’s investment in Butterball. |
Item 1B. Unresolved Staff Comments
None.
Item 2. Properties
Management believes that Seaboard’s present facilities are adequate and suitable for its current purposes. Seaboard’s principal properties by segment are described below:
(1) Pork — Seaboard’s Pork segment owns a pork processing plant in Guymon, Oklahoma. It has a double-shift capacity to process approximately six million hogs annually and generally operates at capacity with additional weekend shifts depending on market conditions. Seaboard’s hog production operations consist of the breeding and raising of approximately eight million hogs annually at facilities it primarily owns or at facilities owned and operated by third parties with whom it has grower contracts. This segment owns and operates seven centrally located feed mills, which have a combined capacity to produce approximately three million tons of formulated feed annually. These feed mills are used primarily to support Seaboard’s existing hog production and have the capability of supporting additional hog production in the future. These facilities are located in Iowa, Oklahoma, Texas, Kansas and Colorado. The Pork segment also operates a ham-boning and processing plant in Mexico that has the capacity to process 96 million pounds of ham annually. The Pork segment owns biodiesel plants in Oklahoma and Missouri, with the capacity to produce 46 million gallons and 30 million gallons, respectively, of biodiesel annually. In 2019, the Pork segment purchased and began modifying an idle ethanol plant in Hugoton, Kansas, that it plans to use to produce renewable diesel in the future. The Kansas plant is expected to produce 85 million gallons of renewable diesel annually when operating at full capacity.
(2) Commodity Trading and Milling — Seaboard’s CT&M grain-processing business, which includes 10 consolidated and 17 non-consolidated affiliates, operates facilities at 41 locations in 23 countries. Seaboard and its affiliates produce approximately six million metric tons of wheat flour, maize meal, manufactured feed and oilseed crush commodities per year in addition to other related grain-based products. The grain-processing and related agribusiness operations located in Botswana, Brazil, Colombia, the Democratic Republic of Congo, Ecuador, Gambia, Ghana, Guyana, Haiti, Jamaica, Kenya, Lesotho, Mauritania, Morocco, Mozambique, Nigeria, Peru, Republic of Congo, South Africa, Turkey, and Zambia own their facilities; and in Ivory Coast, Kenya, Lesotho, Morocco, Mozambique, Nigeria, Republic of Congo, Senegal and Zambia, the land on which certain facilities are located is leased under long-term agreements. Certain foreign milling operations may operate at less than full capacity due to low demand, poor consumer purchasing power, excess milling capacity in their competitive environment or imported flour. The commodity trading business has 13 offices in 12 countries, in addition to two non-consolidated affiliates in two other countries. Seaboard’s CT&M segment owns three 18,900 metric ton deadweight dry bulk vessels and charters between 30 and 59 bulk vessels with deadweights ranging from 5,000 to 64,000 metric tons under short-term agreements. Also, the CT&M segment charters four dry bulk vessels, each with a deadweight of 28,000 metric tons, which were originally purchased and then subsequently sold and leased-back.
(3) Marine — Seaboard’s Marine segment leases approximately 297,000 square feet of off-port warehouse space and approximately 86 acres of port terminal land and facilities in Miami, Florida, which are used in its containerized cargo
12
operations. Seaboard’s Marine segment also leases an approximately 62-acre cargo handling and terminal facility in Houston, Texas, which includes several on-dock warehouses totaling approximately 690,000 square feet for cargo storage. As of December 31, 2019, the Marine segment owned three ocean cargo vessels with deadweights ranging from 7,700 to 11,000 metric tons. In addition, this segment chartered 22 vessels under contracts ranging from less than one year to over two years with deadweights ranging from approximately 8,500 to 34,700 metric tons but has also entered into some contracts for longer-term charters that range up to 11 years. Seaboard’s Marine segment owns or leases dry, refrigerated and specialized containers and other related equipment.
(4) Sugar and Alcohol — Seaboard’s Sugar and Alcohol segment owns nearly 70,000 acres of planted sugarcane and a sugar mill with an annual capacity to crush approximately three million metric tons of sugar cane. The facility, including an alcohol distillery, has an annual production capacity of approximately 250,000 metric tons of sugar and approximately 33 million gallons of alcohol. This capacity is sufficient to process all of the cane harvested by this segment and additional quantities purchased from third-party farmers in the region. The sugarcane fields, processing mill, distillery and 51 megawatt cogeneration power plant are located in northern Argentina in the Salta Province. This area experiences seasonal rainfalls that may limit the harvest season, which then affects the duration of mill operations and quantities of sugar and alcohol produced.
(5) Power — Seaboard’s Power segment owns one power generating barge with capacity to generate approximately 108 megawatts of electricity that is secured on the Ozama River in Santo Domingo, Dominican Republic. Seaboard’s Power segment is currently constructing a new floating power barge with capacity to generate approximately 146 megawatts of electricity using gaseous fuels, including natural gas.
(6) Turkey — Seaboard’s Turkey segment has a total of four processing plants, two further processing plants and numerous company and third-party live production facilities and feed milling operations, located in North Carolina, Arkansas, Missouri and Kansas. These facilities produce over one billion pounds of turkey each year. Although capacity to meet core further processing demand is sufficient, Butterball uses third-party copack arrangements to supplement portions of its portfolio where it either does not maintain competencies, or to meet demand beyond its internal production capacity.
Item 3. Legal Proceedings
The information required by this item is included in Note 9 to the consolidated financial statements.
Item 4. Mine Safety Disclosures
Not Applicable.
13
PART II
Item 5. Market for Registrant’s Common Equity, Related Stockholder Matters and Issuer Purchases of Equity Securities
Seaboard’s common stock is traded on the NYSE American under the symbol SEB. Seaboard had 2,308 stockholders of record of its common stock as of January 31, 2020.
Stock Performance Chart
The SEC requires a five-year comparison of stock performance for Seaboard with that of an appropriate broad equity market index and similar industry index. Since there is no single industry index to compare stock performance, the companies comprising the Dow Jones U.S. Food Products and Dow Jones U.S. Marine Transportation Industry indices (the “Peer Group”) were chosen as the second comparison.
The following graph shows a five-year comparison of cumulative total return for Seaboard Corporation, the NYSE American Index and the companies comprising the Peer Group, weighted by market capitalization for the five fiscal years commencing December 31, 2014 and ending December 31, 2019.
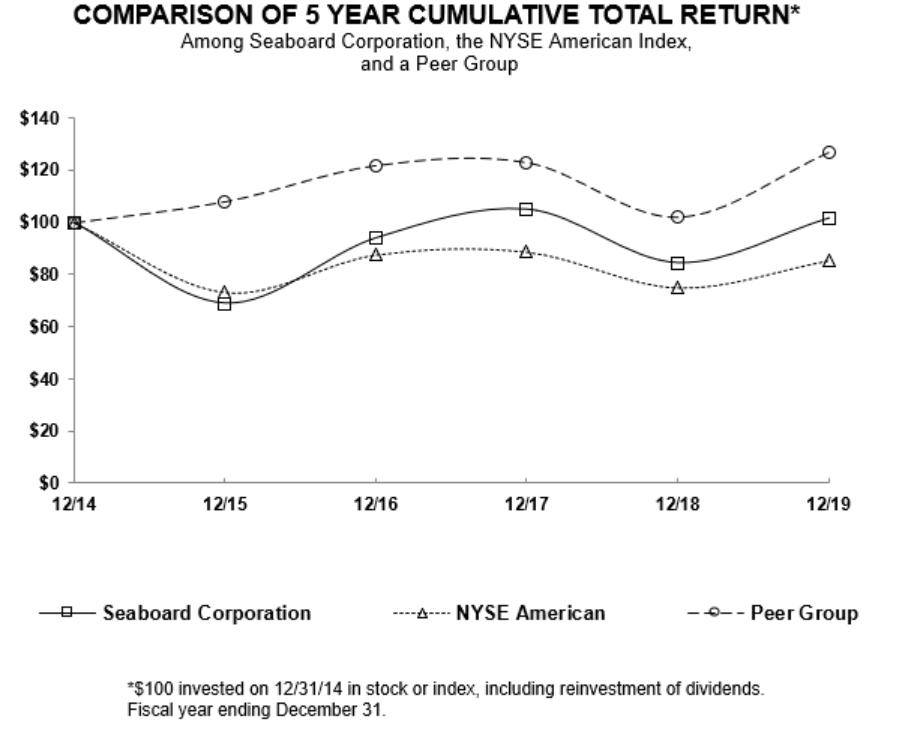
The comparison of cumulative total returns presented in the above graph was plotted using the following index values and common stock price values:
| 12/31/14 |
| 12/31/15 |
| 12/31/16 |
| 12/31/17 |
| 12/31/18 |
| 12/31/19 |
| |||||||
Seaboard Corporation | $ | 100.00 | $ | 68.96 | $ | 94.14 | $ | 105.21 | $ | 84.54 | $ | 101.79 | |||||||
NYSE American | $ | 100.00 | $ | 73.17 | $ | 87.62 | $ | 88.68 | $ | 74.91 | $ | 85.42 | |||||||
Peer Group | $ | 100.00 | $ | 107.99 | $ | 121.71 | $ | 122.82 | $ | 102.13 | $ | 126.73 | |||||||
14
In each of the four quarters of 2019, Seaboard declared and paid quarterly dividends of $2.25 per share of common stock. In each of the four quarters of 2018 and 2017, Seaboard declared and paid quarterly dividends of $1.50 per share of common stock. Seaboard’s Board of Directors intends that Seaboard will continue to pay quarterly dividends for the reasonably foreseeable future, with the amount of any dividends being dependent upon such factors as Seaboard’s financial condition, results of operations and current and anticipated cash needs, including capital requirements. As discussed in Note 8 to the consolidated financial statements, Seaboard’s ability to declare and pay dividends is subject to limitations imposed by debt agreements.
Seaboard has not established any equity compensation plans or individual agreements for its employees under which Seaboard common stock, or options, rights or warrants with respect to Seaboard common stock, may be granted.
As of December 31, 2019, Seaboard may repurchase up to $78 million of its common stock at market value from time to time in open market or privately negotiated purchases under its share repurchase program. There were no purchases made by or on behalf of Seaboard or any “affiliated purchaser” (as defined by applicable rules of the SEC) of shares of Seaboard’s common stock during the fourth quarter of the fiscal year covered by this report. See Note 12 to the consolidated financial statements for discussion of share repurchase activity during 2019.
Item 6. Selected Financial Data
Years ended December 31, | ||||||||||||||||
(Millions of dollars except per share amounts) |
| 2019 |
| 2018 |
| 2017 |
| 2016 |
| 2015 | ||||||
Net sales | $ | 6,840 | $ | 6,583 | $ | 5,809 | $ | 5,379 | $ | 5,594 | ||||||
Operating income | $ | 104 | $ | 209 | $ | 240 | $ | 230 | $ | 126 | ||||||
Net earnings (loss) attributable to Seaboard | $ | 283 | (b) | $ | (17) | (b) | $ | 247 | (b)(c) | $ | 312 | (b) | $ | 171 | (d) | |
Basic earnings (loss) per common share | $ | 242.78 | (b) | $ | (14.61) | (b) | $ | 211.01 | (b)(c) | $ | 266.50 | (b) | $ | 146.44 | (d) | |
Total assets | $ | 6,285 | (a) | $ | 5,307 | $ | 5,161 | $ | 4,755 | $ | 4,431 | |||||
Long-term debt, less current maturities | $ | 730 | $ | 739 | $ | 482 | $ | 499 | $ | 518 | ||||||
Stockholders’ equity | $ | 3,554 | $ | 3,329 | $ | 3,408 | $ | 3,175 | $ | 2,882 | ||||||
Dividends declared per common share (e) | $ | 9.00 | $ | 6.00 | $ | 6.00 | $ | — | $ | — | ||||||
| (a) | Total assets increased $496 million with the adoption of the new leasing guidance. See Note 1 to the consolidated financial statements for further information. |
| (b) | In 2019, net earnings attributable to Seaboard included other investment income of $225 million, which included $176 million of non-cash unrealized mark-to-market gains on short-term investments. Net earnings (loss) attributable to Seaboard for 2018, 2017 and 2016 included other investment income (losses) of $(152) million, $177 million and $69 million, respectively. |
| (c) | In 2017, Seaboard recorded $65 million of additional income tax expense, or $55.31 per common share, as a result of the December 22, 2017 enactment of the Tax Cuts and Job Act (the “2017 Tax Act”). The additional income tax expense included a provisional $112 million of additional federal tax, payable over eight years, associated with the mandatory deemed repatriation of permanently invested foreign profits, offset by an estimated reduction in deferred taxes resulting from the rate decrease from 35% to 21%. See Note 14 to the consolidated financial statements for further information on the 2017 Tax Act. |
| (d) | In the fourth quarter of 2015, Seaboard recorded interest income of $23 million, net of taxes ($31 million before taxes), or $19.49 per common share, for interest recognized on certain outstanding customer receivable balances in its Power segment. This interest income related to amounts determined to be collectible as of December 31, 2015, but previously had been considered uncollectable in prior years. This amount was fully collected by Seaboard in January 2016. |
| (e) | In 2017, Seaboard resumed declaring quarterly dividends. In December 2012, Seaboard declared and paid a dividend of $12.00 per common share. The amount of the dividend represented a prepayment of the annual 2013, 2014, 2015 and 2016 dividends ($3.00 per common share per year). Basic and diluted earnings per common share are the same for all periods presented. |
15
Item 7. Management’s Discussion and Analysis of Financial Condition and Results of Operations
OVERVIEW
Sales and costs of Seaboard’s segments are significantly influenced by worldwide fluctuations in commodity prices and changes in foreign political and economic conditions. Accordingly, sales, operating income and cash flows can fluctuate significantly from year to year. As each segment operates in a distinct industry and a different geographic location, management evaluates their operations separately. Seaboard’s reporting segments are based on information used by Seaboard’s Chief Executive Officer to determine allocation of resources and assess performance, in his capacity as chief operating decision maker.
Pork Segment
The Pork segment primarily produces hogs to process and sells fresh and frozen pork products to further processors, foodservice operators, distributors and grocery stores throughout the U.S. and to foreign markets. This segment also produces biodiesel from pork fats and other animal fat and vegetable oils for sale to third parties. Sales prices are directly affected by both domestic and worldwide supply and demand for pork products and other proteins. Feed accounts for the largest input cost in raising hogs and is materially affected by price changes for corn and soybean meal. Market prices for hogs purchased from third parties for processing at the plant also represent a major cost factor. Within the portfolio of Seaboard’s businesses, management believes profitability of the Pork segment is most susceptible to commodity price fluctuations. As a result, this segment’s operating income and cash flows can materially fluctuate from year to year, significantly affecting Seaboard’s consolidated operating income and cash flows. This segment is Seaboard’s most capital-intensive segment, representing approximately 53% of Seaboard’s total fixed assets, in addition to approximately 41% of total inventories. With the plant generally operating at capacity, Seaboard is continually looking for ways to enhance the plant’s operational efficiency, while also looking to increase margins by introducing new, higher value products.
CT&M Segment
The CT&M segment provides integrated agricultural commodity trading, processing and logistics services. The majority of the CT&M segment’s sales are derived from sourcing agricultural commodities from multiple origins which are delivered to third-party and affiliate customers in various international locations. The execution of these purchase and delivery transactions have long cycles of completion, which may extend for several months with a high degree of price volatility. As a result, these factors can significantly affect sales volumes, operating income, working capital and related cash flows from period to period. This segment represents approximately 52% of Seaboard’s total inventories. This segment owns three vessels, but the majority of the trading business is transacted with chartered ships. Consolidated and non-consolidated affiliates operate the grain processing business in foreign countries that are, in most cases, lesser developed. Foreign operations can be significantly impacted by changes in local crop production, political instability and local government policies, as well as fluctuations in economic and industry conditions and foreign currency exchange rates. This segment’s sales are also significantly affected by fluctuating prices of various commodities, such as wheat, corn, soybeans and soybean meal. Exports from various countries can exacerbate volatile market conditions that may have a significant impact on both the trading and milling businesses’ sales and operating income. Profit margins are sometimes protected by using commodity derivatives and other risk management practices. The CT&M segment has invested in several entities in recent years and continues to seek opportunities to expand its trading, milling and agro-processing businesses.
Marine Segment
The Marine segment provides cargo shipping services in the U.S., the Caribbean and Central and South America. Fluctuations in economic conditions and political instability in the regions or countries in which this segment operates may affect trade volumes and operating profits. In addition, cargo rates can fluctuate depending on regional supply and demand for shipping services. Since the Marine segment time-charters the majority of its ocean cargo vessels, it is affected by fluctuations in charter hire rates as well as fuel costs. This segment continues to explore ways to increase volumes on existing routes while seeking opportunities to broaden its route structure in the regions it serves.
Sugar and Alcohol Segment
The Sugar and Alcohol segment produces and processes sugar and alcohol in Argentina, primarily to be marketed locally. The Sugar and Alcohol segment’s sales and operating income are significantly affected by local and worldwide sugar and alcohol prices. Domestic sugar production levels in Argentina affect the local price. Global sugar price fluctuations, to a lesser extent, have an impact in Argentina as well. Historically, the functional currency of this segment was the Argentine peso, but during the third quarter of 2018 highly inflationary accounting was adopted and the U.S. dollar became the functional currency for U.S. generally accepted accounting principles (“GAAP”) purposes. See Note 1 to the consolidated
16
financial statements for discussion on highly inflationary accounting. The currency exchange rate can have an impact on reported U.S. dollar sales, operating income and cash flows.
Power Segment
The Power segment is an independent power producer in the Dominican Republic operating a power generating barge. Supply of power in the Dominican Republic is determined by a government body and is subject to fluctuations based on governmental budgetary constraints. While fuel is this segment’s largest cost component and is subject to price fluctuations, higher fuel costs generally have been passed on to customers.
Turkey Segment
The Turkey segment, accounted for using the equity method, produces turkeys to process and sells branded and non-branded turkey products. Sales prices are directly affected by both domestic and worldwide supply and demand for turkey products and other proteins. Feed accounts for the largest input cost in raising turkeys and is materially affected by price changes for corn and soybean meal. As a result, commodity price fluctuations can significantly affect the profitability and cash flows of Butterball.
LIQUIDITY AND CAPITAL RESOURCES
As of December 31, 2019, Seaboard had cash and short-term investments of $1.6 billion and additional total working capital of $602 million. Accordingly, management believes Seaboard’s combination of internally generated cash, liquidity, capital resources and borrowing capabilities will be adequate for its existing operations and any currently known potential plans for expansion of existing operations or business segments for the next twelve months.
As of December 31, 2019, $195 million of the $1.6 billion of cash and short-term investments were held by Seaboard’s foreign subsidiaries. Historically, Seaboard has considered substantially all foreign profits as being permanently invested in its foreign operations, including all cash and short-term investments held by foreign subsidiaries. Seaboard intends to continue permanently reinvesting the majority of these funds outside the U.S. as current plans do not demonstrate a need to repatriate them to fund Seaboard’s U.S. operations. For any planned repatriation to the U.S., Seaboard would record applicable deferred taxes for state or foreign withholding taxes. See Note 14 for discussion of repatriation.
Summary of Sources and Uses of Cash
Cash and short-term investments as of December 31, 2019 increased $29 million from December 31, 2018. The increase was primarily the result of $171 million of net cash from operating activities, $132 million net proceeds from short-term investments, $42 million net proceeds from long-term debt and lines of credit and $24 million proceeds from sale of a non-consolidated affiliate. Partially offsetting the increase was cash used for capital expenditures of $349 million. Cash from operating activities decreased $67 million from 2018, primarily due to lower adjusted earnings for unrealized gains on short-term investments and significant cash outlays for inventories.
Capital Expenditures, Acquisitions and Other Investing Activities
During 2019, Seaboard invested $349 million in property, plant and equipment, of which $164 million was in the Pork segment, $23 million in the CT&M segment, $26 million in the Marine segment, $15 million in the Sugar and Alcohol segment and $121 million in the Power segment. The Pork segment expenditures were primarily for the expansion of the Oklahoma pork processing plant and the purchase and modifications of an idle ethanol plant and its related assets in Hugoton, Kansas. The CT&M segment expenditures were primarily for milling assets. The Sugar and Alcohol expenditures were primarily for alcohol fermentation expansion. The Power segment expenditures were primarily for its power generating barge under construction. All other capital expenditures were primarily of a normal recurring nature such as replacements of machinery and equipment and general facility modernizations and upgrades.
The total budget for 2020 capital expenditures is $313 million. The Pork segment budgeted $215 million primarily for the expansion of the pork processing plant that is expected to be completed in the first half of 2020 and the modifications to convert the Hugoton, Kansas plant to a renewable diesel production facility, with operations expected to begin in 2022. The estimated cost of the conversion is expected to be between approximately $220 million and $270 million, depending upon finalization of construction contracts. The CT&M segment budgeted $25 million primarily for milling assets, including a new mixing plant, and other improvements to existing facilities and related equipment. The Marine segment budgeted $37 million primarily for additional cargo carrying and handling equipment. The Sugar and Alcohol segment budgeted $14 million primarily for general plant improvements and production process updates. The Power segment budgeted $22 million for further capital expenditures associated with the new power barge. Seaboard’s Power segment continues to explore strategic alternatives for the existing barge, including selling, relocating or operating in conjunction with the new barge at the current site. The estimated total cost of the project is expected to be between approximately $185 million to $210 million, depending upon the alternative selected. Management anticipates paying for these capital
17
expenditures from a combination of available cash, the use of available short-term investments and Seaboard’s available borrowing capacity.
Seaboard has acquired businesses in 2019, 2018 and 2017, and intends to continue to look for opportunities to further grow and diversify its operations. Also, from time to time, Seaboard may fund capital calls and borrowings for its equity method investments based on the specific facts and circumstances. During 2019, Seaboard contributed $20 million to STF, a non-consolidated affiliate of the Pork segment, for working capital needs.
Financing Activities
The following table presents a summary of Seaboard’s available borrowing capacity:
| Total amount |
| ||
(Millions of dollars) | available | |||
Short-term uncommitted and committed lines | $ | 688 | ||
Amounts drawn against lines |
| (246) | ||
Letters of credit reducing borrowing availability |
| (18) | ||
Available borrowing capacity as of December 31, 2019 | $ | 424 | ||
Seaboard has long-term debt of $793 million, which includes a term loan of $691 million and foreign subsidiary obligations of $102 million. Seaboard has capacity under existing Term Loan Credit Agreement debt covenants to undertake additional debt financings of approximately $1,326 million as of December 31, 2019. See Note 8 to the consolidated financial statements for discussion of lines of credit and long-term debt.
Management intends to continue seeking opportunities for expansion in the industries in which Seaboard operates, utilizing existing liquidity, available borrowing capacity and other financing alternatives. The terms and availability of such financing may be impacted by economic and financial market conditions, as well as Seaboard's financial condition and results of operations at the time Seaboard seeks such financing, and there can be no assurances that Seaboard will be able to obtain such financing on terms that will be acceptable or advantageous.
Seaboard’s Board of Directors intends that Seaboard will continue to pay quarterly dividends for the reasonably foreseeable future, with the amount of any dividends being dependent upon such factors as Seaboard’s financial condition, results of operations and current and anticipated cash needs, including capital requirements. Also, Seaboard may repurchase shares of its common stock from time to time.
Contractual Obligations and Off-Balance Sheet Arrangements
Several of Seaboard’s segments have long-term contractual obligations, including purchase commitments and non-cancelable lease agreements. See Notes 9 and 6 to the consolidated financial statements for discussion on purchase commitments and leases, respectively.
The following table provides a summary of Seaboard’s long-term contractual obligations as of December 31, 2019:
Payments due by period | ||||||||||||||||
|
|
| Less than |
| 1-3 |
| 3-5 |
| More than | |||||||
(Millions of dollars) | Total | 1 year | years | years | 5 years | |||||||||||
Purchase commitments | $ | 1,801 | $ | 1,025 | $ | 283 | $ | 180 | $ | 313 | ||||||
Operating lease obligations | 597 | 130 | 197 | 106 | 164 | |||||||||||
Finance lease obligations | 61 | 7 | 14 | 14 | 26 | |||||||||||
Long-term debt | 793 | 62 | 61 | 14 | 656 | |||||||||||
Interest payments on long-term debt (a) |
| 202 |
| 26 |
| 48 |
| 45 |
| 83 | ||||||
Retirement benefit payments (b) |
| 95 |
| 13 |
| 27 |
| 23 |
| 32 | ||||||
Mandatory deemed repatriation tax (c) | 62 | — | 8 | 18 | 36 | |||||||||||
Total contractual cash obligations | $ | 3,611 | $ | 1,263 | $ | 638 | $ | 400 | $ | 1,310 | ||||||
(a) Interest payments in the table above include expected cash payments for interest on variable and fixed rate long-term debt. Variable interest rates are based on interest rates as of December 31, 2019.
(b) Retirement benefit payments in the table above represent expected benefit payments for various non-qualified pension plans and supplemental retirement arrangements as discussed in Note 10 to the consolidated financial
18
statements, which are unfunded obligations that are deemed to be employer contributions. No contributions are planned at this time to the qualified pension plan.
(c) U.S. federal income tax on mandatory deemed repatriation pursuant to the 2017 Tax Act.
Deferred income taxes and certain other long-term liabilities in the consolidated balance sheets are not included in the table above as management is unable to reliably estimate the timing of the payments for these items.
RESULTS OF OPERATIONS
Net sales for the years ended December 31, 2019, 2018 and 2017 were $6.8 billion, $6.6 billion and $5.8 billion, respectively. The increase for 2019 compared to 2018 primarily reflected higher volumes of certain commodities in the CT&M segment and higher prices for pork products sold in the Pork segment, partially offset by lower biodiesel revenue in the Pork segment and lower volumes and prices of sugar and alcohol sold in the Sugar and Alcohol segment. The increase for 2018 compared to 2017 primarily reflected higher volumes and sales prices for certain commodities in the CT&M segment, higher biodiesel revenue and higher volumes of market hogs and pork products sold in the Pork segment and higher cargo volumes and rates in the Marine segment.
Operating income for the years ended December 31, 2019, 2018 and 2017 was $104 million, $209 million and $240 million, respectively. The decrease for 2019 compared to 2018 primarily reflected derivative contract losses and lower margins on biodiesel sales in the Pork segment, lower alcohol margins in the Sugar and Alcohol segment and higher voyage costs in the Marine segment. The decrease for 2018 compared to 2017 primarily reflected lower prices on pork products sold and higher feed costs in the Pork segment, partially offset by higher margins from biodiesel sales in the Pork segment, higher margins on third-party sales in the CT&M segment and higher spot market rates in the Power segment.
Pork Segment
(Millions of dollars) |
|
|
| 2019 |
| 2018 |
| 2017 |
| |||
Net sales | $ | 1,851 | $ | 1,774 | $ | 1,609 | ||||||
Operating income | $ | 54 | $ | 117 | $ | 193 | ||||||
Loss from affiliates | $ | (22) | $ | (30) | $ | (10) | ||||||
Net sales for the Pork segment increased $77 million for the year ended December 31, 2019 compared to 2018. The increase was primarily the result of higher volumes and prices of market hogs sold, higher prices and volumes for pork products sold and the recognition of the federal blender’s credits of $60 million in December 2019 for biodiesel production in tax years 2018 and 2019, partially offset by lower biodiesel prices and volumes. In the first quarter of 2018, the Pork segment received $42 million of revenue related to 2017 biodiesel production.
Operating income for the Pork segment decreased $63 million for the year ended December 31, 2019 compared to 2018. The decrease was primarily due to derivative contract losses, lower margins on biodiesel sales and a $14 million expense related to the withdrawal liability from a multi-employer pension fund as discussed in Note 10 to the consolidated financial statements, partially offset by higher margins on pork product sales and the increase in federal blender’s credits received. Margins on pork product sales increased as higher sales prices were only partially offset by higher production and processing costs. Seaboard sells pork to international customers located in China, among other countries, and incremental tariffs, the duration of which is uncertain, continue to have a negative impact on earnings. Management is unable to predict future market prices for pork products, the cost of feed or third-party hogs; however, management anticipates positive operating income for this segment in 2020.
Loss from affiliates decreased $8 million for the year ended December 31, 2019 compared to 2018, primarily due to the commencement of a second shift in October 2018 at the STF plant.
Net sales for the Pork segment increased $165 million for the year ended December 31, 2018 compared to 2017. The increase was primarily the result of higher overall increased volumes of pork products sold, increased volumes and prices of biodiesel sales, the recognition of the federal blender’s credits of $42 million and higher sales of market hogs to third parties and affiliates. The increase was partially offset by lower prices for both pork products and market hogs sold.
Operating income for the Pork segment decreased $76 million for the year ended December 31, 2018 compared to 2017. The decrease was primarily the result of lower prices for pork products along with higher feed costs, partially offset by higher volumes of pork products sold and the federal blender’s credits of $42 million.
Loss from affiliates increased $20 million for the year ended December 31, 2018 compared to 2017, primarily due to the start-up of STF operations, which began in September 2017.
19
Commodity Trading and Milling Segment
(Millions of dollars) |
|
| 2019 |
| 2018 |
| 2017 |
| |||
Net sales | $ | 3,672 | $ | 3,428 | $ | 2,945 | |||||
Operating income as reported | $ | 62 | $ | 46 | $ | 25 | |||||
Mark-to-market adjustments |
| 5 |
| 3 |
| (4) | |||||
Operating income excluding mark-to-market adjustments | $ | 67 | $ | 49 | $ | 21 | |||||
Income (loss) from affiliates | $ | (5) | $ | (11) | $ | 7 | |||||
Net sales for the CT&M segment increased $244 million for the year ended December 31, 2019 compared to 2018. The increase primarily reflected higher volumes of certain commodities for third-party customers, including sales for a business acquired in January 2018 with certain entities on a three-month lag and another business acquired in October 2019, and higher wheat, corn and other commodity prices, partially offset by lower affiliate volumes and sales prices.
Operating income for the CT&M segment increased $16 million for the year ended December 31, 2019 compared to 2018. The increase primarily reflected higher margins on third-party sales, partially offset by higher selling, general and administrative costs related to the business acquired. Due to worldwide commodity price fluctuations, the uncertain political and economic conditions in the countries in which this segment operates, and the volatility in the commodity markets, management is unable to predict future sales and operating results for this segment. However, management anticipates positive operating income for this segment in 2020, excluding the effects of marking to market derivative contracts.
Had Seaboard not applied mark-to-market accounting to its derivative instruments, operating income for this segment would have been higher by $5 and $3 million in 2019 and 2018, respectively, and lower by $4 million in 2017. While management believes its commodity futures, options and foreign exchange contracts are primarily economic hedges of its firm purchase and sales contracts or anticipated sales contracts, Seaboard does not perform the extensive record-keeping required to account for these transactions as hedges for accounting purposes. Accordingly, while the changes in value of the derivative instruments were marked to market, the changes in value of the firm purchase or sales contracts were not. As products are delivered to customers, these existing mark-to-market adjustments should be primarily offset by realized margins or losses as revenue is recognized over time and therefore, these mark-to-market adjustments could reverse in fiscal 2020. Management believes eliminating these mark-to-market adjustments provides a more reasonable presentation to compare and evaluate period-to-period financial results for this segment.
Loss from affiliates for the CT&M segment decreased by $6 million for the year ended December 31, 2019 compared to 2018. Based on the uncertainty of local political and economic environments in the countries in which Seaboard’s affiliates operate, management cannot predict future results.
Net sales for the CT&M segment increased $483 million for the year ended December 31, 2018 compared to 2017. The increase primarily reflected higher volumes of third-party sales, including sales for a business acquired in January 2018, and higher affiliate sales prices, partially offset by lower third-party sales prices.
Operating income for the CT&M segment increased $21 million for the year ended December 31, 2018 compared to 2017. The increase primarily reflected higher margins on third-party sales, predominantly related to the business acquired, partially offset by higher selling, general and administrative costs related to the business acquired. Excluding the effects of the mark-to-market adjustments for derivative contracts, operating income increased $28 million.
Income from affiliates for the CT&M segment decreased $18 million for the year ended December 31, 2018 compared to 2017. The decrease primarily reflected price and volume volatility in local markets of certain Seaboard affiliates, including losses at an equity method investment located in the Democratic Republic of Congo.
20
Marine Segment
(Millions of dollars) |
|
| 2019 |
| 2018 |
| 2017 | ||||
Net sales | $ | 1,061 | $ | 1,057 | $ | 956 | |||||
Operating income | $ | 4 | $ | 25 | $ | 21 | |||||
Income (loss) from affiliate | $ | 3 | $ | 2 | $ | (7) | |||||
Net sales for the Marine segment increased $4 million for the year ended December 31, 2019 compared to 2018. The increase was primarily the result of a change in cargo mix, with more reefer containers that generally have a higher rate, partially offset by lower cargo volumes.
Operating income for the Marine segment decreased $21 million for the year ended December 31, 2019 compared to 2018. The decrease was primarily the result of higher voyage costs related to charter hire rates, terminal costs and fuel costs. The reduced global sulfur emissions cap from 3.5% to 0.5% became effective on January 1, 2020 and resulted in higher fuel costs as purchases of low-sulfur fuel began in late 2019. Management cannot predict changes in future cargo volumes, cargo rates and fuel costs or to what extent changes in economic conditions in markets served will affect net sales or operating income. Based on market conditions, management currently cannot predict if this segment will be profitable in 2020.
Net sales for the Marine segment increased $101 million for the year ended December 31, 2018 compared to 2017. The increase was primarily the result of higher volumes and rates in certain markets during 2018 compared to 2017.
Operating income for the Marine segment increased $4 million for the year ended December 31, 2018 compared to 2017. The increase was primarily the result of higher revenues, partially offset by higher voyage costs related to fuel price increases and other expenses.
Income from affiliates increased $9 million for the year ended December 31, 2018 compared to 2017, primarily due to an other-than-temporary impairment charge of $6 million incurred in 2017.
Sugar and Alcohol Segment
(Millions of dollars) |
|
| 2019 |
| 2018 |
| 2017 | ||||
Net sales | $ | 121 | $ | 184 | $ | 186 | |||||
Operating income (loss) | $ | (16) | $ | 9 | $ | 21 | |||||
Income from affiliates | $ | 1 | $ | 1 | $ | 1 | |||||
Net sales for the Sugar and Alcohol segment decreased $63 million for the year ended December 31, 2019 compared to 2018. The decrease primarily reflected lower volumes and prices of sugar and alcohol sold. Sugar and alcohol sales are denominated in Argentine pesos, and an increase in local sales prices was offset by exchange rate changes as the Argentine peso continued to weaken against the U.S. dollar. Management cannot predict local sugar and alcohol prices or the volatility in the currency exchange rate. Argentina was determined by management to be a highly inflationary economy in the second quarter of 2018, and as a result, this segment’s functional currency is the U.S. dollar effective in the third quarter of 2018 until the economic environment stabilizes.
Operating income for the Sugar and Alcohol decreased $25 million for the year ended December 31, 2019 compared to 2018. The decrease primarily reflected lower margins on alcohol, partially offset by lower selling, general and administrative expenses. Based on market conditions, management cannot predict if this segment will be profitable in 2020.
Net sales for the Sugar and Alcohol segment decreased $2 million for the year ended December 31, 2018 compared to 2017. The decrease primarily reflected lower prices of sugar and alcohol sold, partially offset by higher volumes of sugar and alcohol sold.
Operating income for the Sugar and Alcohol segment decreased $12 million for the year ended December 31, 2018 compared to 2017. The decrease primarily reflected lower margins on sugar, alcohol and cogeneration, partially offset by lower selling, general and administrative expenses related to salaries and benefits.
21
Power Segment
(Millions of dollars) |
|
| 2019 |
| 2018 |
| 2017 | ||||
Net sales | $ | 117 | $ | 122 | $ | 97 | |||||
Operating income | $ | 27 | $ | 21 | $ | 9 | |||||
Income from affiliate | $ | 3 | $ | 10 | $ | 6 | |||||
Net sales for the Power segment decreased $5 million for the year ended December 31, 2019 compared to 2018. The decrease primarily reflected lower spot market rates as a result of lower fuel prices.
Operating income for the Power segment increased $6 million for the year ended December 31, 2019 compared to 2018 primarily due to lower fuel costs, partially offset by lower revenues. Management cannot predict future fuel costs or the extent that spot market rates will fluctuate compared to fuel costs; however, management anticipates positive operating income for this segment in 2020.
Net sales for the Power segment increased $25 million for the year ended December 31, 2018 compared to 2017. The increase primarily reflected higher spot market rates.
Operating income for the Power segment increased $12 million for the year ended December 31, 2018 compared to 2017 primarily due to higher spot market rates, partially offset by higher fuel costs.
Turkey Segment
(Millions of dollars) |
|
| 2019 |
| 2018 |
| 2017 | ||||
Loss from affiliate | $ | (21) | $ | (16) | $ | (4) | |||||
The Turkey segment, accounted for using the equity method, represents Seaboard’s investment in Butterball. The increase in loss from affiliate for 2019 compared to 2018 was primarily the result of higher production and other costs, including interest, partially offset by higher prices for turkey products sold. Management is unable to predict future market prices for turkey products or the cost of feed. Based on market conditions, management currently cannot predict if this segment will be profitable in 2020.
The increase in income from affiliate for 2018 compared to 2017 was primarily the result of higher logistics and production costs and lower volumes of turkey products sold in 2018, partially offset by Seaboard’s proportionate share of the Illinois plant closure during 2017. Butterball closed a further processing plant located in Illinois and recognized fixed asset impairment charges and accrued severance. Seaboard’s proportionate share of these charges, recognized in income (loss) from affiliates, was $18 million, all recorded in 2017.
Selling, General and Administrative Expenses
Selling, general and administrative (“SG&A”) expenses for the year ended December 31, 2019 increased $22 million compared to 2018. The increase was primarily the result of increased personnel-related costs, including higher costs related to Seaboard’s deferred compensation program and the businesses acquired. The deferred compensation program costs are offset by the effect of the mark-to-market on investments recorded in other investment income (loss). SG&A expenses for the year ended December 31, 2018 increased $5 million compared to 2017. The increase was primarily the result of increased personnel-related costs in the CT&M segment, related to the business acquired in January 2018, partially offset by lower costs related to Seaboard’s deferred compensation program. As a percentage of revenues, SG&A was 5% for 2019, 2018 and 2017.
Interest Expense
Interest expense totaled $36 million, $44 million and $29 million for the years ended December 31, 2019, 2018 and 2017, respectively. The decrease in interest expense for 2019 compared to 2018 primarily related to lower interest rates on outstanding debt for the Sugar and Alcohol segment and more capitalized interest related to capital expenditure investments, partially offset by higher debt outstanding related to the Term Loan due 2028 amended in September 2018. The increase in interest expense for 2018 compared to 2017 primarily related to more debt outstanding, an increase in interest rates and less capitalized interest.
Interest Income
Interest income totaled $28 million, $11 million and $15 million for the years ended December 31, 2019, 2018 and 2017, respectively. The increase for 2019 compared to 2018 was primarily due to increased investments in debt securities.
22
Interest Income from Affiliates
Interest income from affiliates totaled $2 million, $3 million and $22 million for the years ended December 31, 2019, 2018 and 2017, respectively. The decrease for 2018 compared 2017 primarily related to the Butterball note receivable, which was repaid in December 2017.
Other Investment Income (Loss), Net
Other investment income (loss), net totaled $225 million, $(152) million and $177 million for the years ended December 31, 2019, 2018 and 2017, respectively. The changes primarily reflect mark-to-market fluctuations on short-term investments.
Foreign Currency Gains, Net
Foreign currency gains, net totaled $0 million, $4 million and $14 million for the years ended December 31, 2019, 2018 and 2017, respectively. The decrease in foreign currency gains for 2019 compared to 2018 primarily reflected losses in the Argentine peso, partially offset by fluctuations of other currency exchange rates in several foreign countries. The decrease in foreign currency gains for 2018 compared to 2017 primarily reflected losses in the euro and British pound on Seaboard’s short-term investments and the Zambian kwacha, partially offset by gains in the Argentine peso, among fluctuations of other currency exchange rates in several foreign countries. The Sugar and Alcohol segment’s functional currency became the U.S. dollar in mid-2018 due to highly inflationary accounting and any translation gains or losses are recorded in the income statement rather than other comprehensive income.
Income Tax Expense
The 2019 effective tax rate was lower than the 2018 effective tax rate primarily due to increased federal investment tax credits and more tax-exempt income from the retroactive extension of the federal blender’s credits in December 2019 for both 2018 and 2019. Also, the 2018 rate was impacted by the change in tax classification of a wholly owned subsidiary from a partnership to a corporation and an adjustment to the Tax Cuts and Jobs Act (“2017 Tax Act”) income tax liability. The 2018 effective tax rate was lower than 2017 primarily due to a current year loss versus prior year earnings, tax exempt income from the retroactive extension of the 2017 federal blender’s credits during the first quarter of 2018 and the lower statutory U.S. federal income tax rate per the 2017 Tax Act. The decrease was partially offset by a tax classification entity change, additional tax related to the 2017 Tax Act and a change in mix of domestic and foreign earnings from the prior year. See Note 14 to the consolidated financial statements for further information on Seaboard’s income taxes.
OTHER FINANCIAL INFORMATION
See Note 1 to the consolidated financial statements for a discussion of recently issued accounting standards.
CRITICAL ACCOUNTING ESTIMATES
This discussion and analysis of financial condition and results of operations is based upon Seaboard’s consolidated financial statements, which have been prepared in accordance with GAAP. The preparation of these financial statements requires Seaboard to make estimates, judgments, and assumptions that can have a meaningful effect on the reporting of consolidated financial statements. See Note 1 for a discussion of significant accounting policies. Management has identified the accounting estimates believed to be the most important to the portrayal of Seaboard’s financial condition and results, and that require management’s most difficult, subjective or complex judgments, often as a result of the need to make estimates about the effect of matters that are inherently uncertain. Management has reviewed these critical accounting estimates with the Audit Committee of the Board of Directors.
Allowance for Doubtful Accounts – Seaboard primarily uses a specific identification approach to evaluate the adequacy of this reserve for estimated uncollectible receivables at the consolidated balance sheet date. Changes in estimates, developing trends and other new information can have a material effect on future evaluations. Furthermore, Seaboard’s total gross current receivables are weighted toward foreign receivables ($390 million or 59% as of December 31, 2019), including foreign receivables due from affiliates ($81 million as of December 31, 2019), which generally represent more of a collection risk than its domestic receivables. Receivables due from affiliates are generally associated with entities located in foreign countries considered less developed than the U.S. that can experience conditions causing sudden changes to their ability to pay such receivables on a timely basis or in full. Based on various historical experiences, future collections of receivables or lack thereof could result in a material charge or credit to earnings depending on the ultimate resolution of each individual customer past due receivable. Bad debt expense for the years ended December 31, 2019, 2018 and 2017 was $5 million, $7 million and $12 million, respectively.
Valuation of Inventories – Inventories are generally valued at the lower of cost and net realizable value. In determining net realizable value, management makes assumptions regarding estimated sales prices, estimated costs to complete and estimated disposal costs. For commodity trading inventories, when contract performance by a customer becomes a
23
concern, management must also evaluate available options to dispose of the inventory, including assumptions about potential negotiated changes to sales contracts, sales prices in alternative markets in various foreign countries and potentially additional transportation costs. At times, management must consider probability, weighting various viable alternatives, in its determination of the net realizable value of the inventories. These assumptions and probabilities are subjective in nature and are based on management’s best estimates and judgments existing at the time of preparation. Changes in future market prices or facts and circumstances could result in a material write down in the value of inventory or decreased future margins on the sale of inventory.
Impairment of Long-Lived Assets – The recoverability of long-lived assets, primarily property, plant and equipment and definite-lived intangibles, are reviewed for impairment whenever events or changes in circumstances indicate that the carrying amount may not be recoverable. Some of the key assumptions utilized in determining future projected cash flows include estimated growth rates, expected future sales prices, estimated costs, royalty rates and terminal values. In some cases, judgment is also required in assigning probability weighting to the various future cash flow scenarios. The probability weighting percentages used, and the various future projected cash flow models prepared by management are based on facts and circumstances existing at the time of preparation and management’s best estimates and judgment of future operating results. Seaboard cannot predict the occurrence of certain future events that might adversely affect the reported value of long-lived assets, which include, but are not limited to, a change in the business climate, government incentives, a negative change in relationships with significant customers, and changes to strategic decisions made in response to economic and competitive conditions. Changes in these facts, circumstances and management’s estimates and judgment could result in an impairment of property, plant and equipment or definite-lived intangibles, resulting in a material charge to earnings.
Lease liabilities and right of use assets – For leases other than short-term leases, Seaboard recognizes right of use assets and lease liabilities based primarily on the present value of future minimum lease payments over the lease term at lease commencement. As Seaboard’s leases do not have readily determinable implicit discount rates, Seaboard adjusts its incremental borrowing rate to determine the present value of the lease payments. The incremental borrowing rate represents an estimate of the interest rate that would be required to borrow on a collateralized basis over a similar term an amount equal to the lease payments in a similar economic environment. Seaboard determines the incremental borrowing rates for its leases by adjusting the local risk-free interest rate on its Term Loan due 2028 with a credit risk premium corresponding to Seaboard’s unreported credit rating. Estimation of the incremental borrowing rate requires judgment by management and reflects an assessment of Seaboard’s credit standing to derive an implied secured credit rating and corresponding yield curve. The discount rate is further impacted by Seaboard’s global footprint, operating in more than 45 countries with diverse economies, and related foreign currency rates. Changes in management’s estimates of discount rate assumptions could result in a significant overstatement or understatement of right of use assets or lease liabilities, resulting in an adverse impact to Seaboard’s financial position.
Equity Method Investments – Seaboard has numerous investments in and advances to various businesses that it owns 50% or less and are accounted for using the equity method. In addition, for some of these investments, Seaboard also has notes receivable for loans it provided to these businesses. For the CT&M segment, these investments are primarily in foreign countries, which are less developed than the U.S., and therefore, expose Seaboard to greater financial risks. At certain times when there are ongoing operating losses, local economies are depressed, commodity-based markets are less stable, or foreign governments cause challenging business conditions, the fair value of the equity method investment is evaluated by management. The fair value of these investments is not readily determinable as almost all of these investments are not publicly traded. Management will use other methods to determine fair value such as estimated future cash flows, including assumptions on growth rates, for the business and consideration of other local business conditions as applicable. In addition, Seaboard may need to write down any affiliate or notes receivables to estimated realizable value. Information and events creating uncertainty about the realization of recorded amounts for notes include, but are not limited to, the estimated cash flows to be generated by the affiliate’s business, the sufficiency of collateral securing the amounts, the creditworthiness of the counterparties involved, and the consideration of other local business conditions as applicable. Changes in facts, circumstances and management’s estimates and judgment could result in a material charge to earnings.
Income Taxes – Income taxes are determined by management based on current tax regulations in the various worldwide taxing jurisdictions in which Seaboard conducts its business. In various situations, accruals have been made for estimates of the tax effects for certain transactions, business structures, the estimated reversal of timing differences and future projected profitability of Seaboard’s various business units based on management’s interpretation of existing facts, circumstances and tax regulations. Should new evidence come to management’s attention that could alter previous
24
conclusions or if taxing authorities disagree with the positions taken by Seaboard, the change in estimate could result in a material adverse or favorable impact on the financial statements.
Accrued Pension Liability – The measurement of Seaboard’s pension liability and related expense is dependent on a variety of assumptions and estimates regarding future events. These assumptions include discount rates, assumed rate of return on plan assets, compensation increases, mortality rates and retirement rates. The discount rate and return on plan assets are important elements of liability and expense measurement and are reviewed on an annual basis. The effect of decreasing both the discount rate and assumed rate of return on plan assets by 50 basis points would be a decrease in pension expense of approximately $1 million per year. The effects of actual results differing from the assumptions (i.e. gains or losses) are primarily accumulated in accrued pension liability and amortized over future periods if it exceeds the 10% corridor and, therefore, could affect Seaboard’s recognized pension expense in such future periods, as permitted under GAAP. See Note 10 to the consolidated financial statements for discussion of the pension rates and assumptions.
Item 7A. Quantitative and Qualitative Disclosures About Market Risk
DERIVATIVE INFORMATION
Seaboard is exposed to various types of market risks in its day-to-day operations. Primary market risk exposures result from changing commodity prices, foreign currency exchange rates, interest rates and equity prices. Occasionally derivatives are used to manage these overall market risks; however, Seaboard does not perform the extensive record-keeping required to account for derivative transactions as hedges. Management believes it uses derivatives primarily as economic hedges, although they do not qualify as hedges for accounting purposes. Since these derivatives are not accounted for as hedges, fluctuations in the related prices could have a material impact on earnings in any given year. From time to time, Seaboard also enters into speculative derivative transactions related to its market risks.
Commodity price changes affect the cost of necessary raw materials and other inventories, finished product sales and firm sales commitments. Seaboard uses various grain, oilseed and other commodity futures and options purchase contracts to manage certain risks of increasing prices of raw materials and firm sales commitments or anticipated sales contracts. Short sales contracts are used to offset the open purchase derivatives when the related commodity inventory is purchased in advance of the derivative maturity, effectively offsetting the initial futures or option purchase contract. From time to time, hog futures are used to manage risks of increasing prices of hogs acquired for processing, and hog futures are used to manage risks of fluctuating prices of pork product inventories and related future sales. Inventories that are sensitive to changes in commodity prices, including carrying amounts as December 31, 2019 and 2018, are presented in Note 4 to the consolidated financial statements.
The political and economic conditions of the countries in which Seaboard does business, along with fluctuations in the value of the U.S. dollar, cause volatility in currency exchange rates, which exposes Seaboard to fluctuating foreign currency gains and losses that cannot be predicted. Since changes in foreign currency exchange rates affect the cash paid or received on foreign currency denominated receivables and payables, Seaboard manages certain of these risks through the use of foreign currency exchange agreements. Also, since changes in interest rates affect the cash required to service variable-rate debt, Seaboard sometimes uses interest rate exchange agreements to manage risks of increasing interest rates.
Equity price risk is the risk that Seaboard may incur losses due to adverse changes in the market prices of the equity securities it holds in its short-term investment portfolio. Market prices for equity securities are subject to fluctuation and may result from perceived changes in the underlying economic characteristics of the investee, the relative price of alternative investments and general market conditions. As of December 31, 2019 and 2018, the fair value of Seaboard’s marketable equity securities was approximately $910 million and $878 million, respectively. Seaboard enters into equity futures contracts to manage the equity price risk with respect to certain short-term investments.
25
The following table presents the sensitivity of the fair value of Seaboard’s open net commodity future and option contracts, foreign currency exchange agreements and marketable equity securities to a hypothetical 10% change in market prices, foreign exchange rates and interest rates as of December 31, 2019 and 2018. For all open derivatives, the fair value of such positions is a summation of the fair values calculated for each item by valuing each net position at quoted market prices as of the applicable date.
(Millions of dollars) |
| December 31, 2019 |
| December 31, 2018 | ||
Grains and oilseeds | $ | 12 | $ | 23 | ||
Vegetable oils |
| 4 |
| — | ||
Energy related resources |
| 2 |
| 1 | ||
Hogs |
| — |
| 2 | ||
Equity prices | 91 | 88 | ||||
Foreign currencies |
| 11 |
| 10 | ||
The table below provides information about Seaboard’s long-term debt that is sensitive to changes in interest rates as of December 31, 2019. For this variable rate debt, the table presents principal cash flows and related weighted average interest rates by expected maturity dates.
(Millions of dollars) | 2020 | 2021 | 2022 | 2023 | 2024 | Thereafter | Total | ||||||||||||||
Long-term debt: | |||||||||||||||||||||
Variable rate | $ | 62 | $ | 9 | $ | 8 | $ | 7 | $ | 7 | $ | 656 | $ | 749 | |||||||
Weighted average interest rate | 3.35% | 4.59% | 4.35% | 3.70% | 3.42% | 3.42% | 3.44% |
Long-term debt sensitive to changes in interest rates as of December 31, 2018 totaled $735 million with a weighted average interest rate of 4.16%.
26
Item 8. Financial Statements and Supplementary Data
Report of Independent Registered Public Accounting Firm
To the Stockholders and Board of Directors
Seaboard Corporation:
Opinion on the Consolidated Financial Statements
We have audited the accompanying consolidated balance sheets of Seaboard Corporation and subsidiaries (the Company) as of December 31, 2019 and 2018, the related consolidated statements of comprehensive income, changes in equity, and cash flows for each of the years in the three-year period ended December 31, 2019, and the related notes (collectively, the consolidated financial statements). In our opinion, the consolidated financial statements present fairly, in all material respects, the financial position of the Company as of December 31, 2019 and 2018, and the results of its operations and its cash flows for each of the years in the three-year period ended December 31, 2019, in conformity with U.S. generally accepted accounting principles.
We also have audited, in accordance with the standards of the Public Company Accounting Oversight Board (United States) (PCAOB), the Company’s internal control over financial reporting as of December 31, 2019, based on criteria established in Internal Control – Integrated Framework (2013) issued by the Committee of Sponsoring Organizations of the Treadway Commission, and our report dated February 19, 2020 expressed an unqualified opinion on the effectiveness of the Company’s internal control over financial reporting.
Change in Accounting Principle
As discussed in Note 1 to the consolidated financial statements, the Company has changed its method of accounting for leases as of January 1, 2019 due to the adoption of Accounting Standards Update 2016-02 – Leases (Topic 842).
Basis for Opinion
These consolidated financial statements are the responsibility of the Company’s management. Our responsibility is to express an opinion on these consolidated financial statements based on our audits. We are a public accounting firm registered with the PCAOB and are required to be independent with respect to the Company in accordance with the U.S. federal securities laws and the applicable rules and regulations of the Securities and Exchange Commission and the PCAOB.
We conducted our audits in accordance with the standards of the PCAOB. Those standards require that we plan and perform the audit to obtain reasonable assurance about whether the consolidated financial statements are free of material misstatement, whether due to error or fraud. Our audits included performing procedures to assess the risks of material misstatement of the consolidated financial statements, whether due to error or fraud, and performing procedures that respond to those risks. Such procedures included examining, on a test basis, evidence regarding the amounts and disclosures in the consolidated financial statements. Our audits also included evaluating the accounting principles used and significant estimates made by management, as well as evaluating the overall presentation of the consolidated financial statements. We believe that our audits provide a reasonable basis for our opinion.
Critical Audit Matters
The critical audit matters communicated below are matters arising from the current period audit of the consolidated financial statements that were communicated or required to be communicated to the audit committee and that: (1) relate to accounts or disclosures that are material to the consolidated financial statements and (2) involved our especially challenging, subjective, or complex judgments. The communication of critical audit matters does not alter in any way our opinion on the consolidated financial statements, taken as a whole, and we are not, by communicating the critical audit matters below, providing separate opinions on the critical audit matters or on the accounts or disclosures to which they relate.
Evaluation of lease liabilities
As discussed in Notes 1 and 6 to the consolidated financial statements, the Company’s lease liabilities as of December 31, 2019 were $528 million. The lease liability represents the obligation to make the lease payments arising from leases, measured on a discounted basis, using an estimated incremental borrowing rate.
We identified the evaluation of the Company’s lease liability recorded as of January 1, 2019, the transition date for the adoption of Accounting Standards Update 2016-02 – Leases (Topic 842), to be a critical audit matter.
27
Specialized skills were required to evaluate the Company’s assumptions used to determine the lease liability, specifically the incremental borrowing rates.
The primary procedures we performed to address this critical audit matter included the following. We tested certain internal controls over the Company’s lease liability determination process including controls to evaluate the incremental borrowing rates used to calculate the lease liability. We involved a valuation professional with specialized skills and knowledge, who assisted in understanding the Company’s methodology and assumptions used to determine the incremental borrowing rates. The valuation professional also assisted us in developing an independent estimate of the incremental borrowing rates. We compared the independent estimate of the incremental borrowing rates to those utilized by the Company, and we performed sensitivity analyses over the incremental borrowing rates to assess the impact on the Company’s calculation of the lease liability.
Evaluation of the sufficiency of audit evidence over revenue
As described in Note 13 to the consolidated financial statements, the Company earned $6.8 billion of revenue in 2019. The revenue was primarily generated by the Pork, Commodity, Trading and Milling, Marine, Sugar and Alcohol, and Power reporting segments. Within these reporting segments, the Company has operating locations associated with consolidated entities in over 45 countries. Revenue generated based on the location of the operations sourcing the product or service primarily resides within the United States, Colombia, and South Africa, and comprised 42% of revenue. The remaining 58% of revenue was sourced from other countries throughout the Caribbean, Central, and South America, Africa, Pacific Basin and Far East, Canada/Mexico, Europe, and other countries.
We identified the evaluation of the sufficiency of audit evidence over revenue as a critical audit matter. The geographical dispersion of revenue required especially subjective auditor judgment in determining which locations to perform procedures and evaluating the sufficiency of audit evidence. Furthermore, given the time zone, language and business composition differences between countries, our audit team consisted of auditors located in multiple countries around the world.
The primary procedures we performed to address this critical audit matter included the following. We evaluated the nature and amounts of the Company’s revenue at its various locations and applied auditor judgment to determine the locations at which procedures were to be performed. We tested certain internal controls over the Company’s revenue process, including controls related to the recognition and consolidation of global revenue amounts. We tested a sample of individual revenue transactions by comparing the amounts recognized by the Company to relevant underlying documentation such as contracts. In addition, we evaluated the overall sufficiency of audit evidence obtained over revenue.
|

We have served as the Company’s auditor since 1959.
Kansas City, Missouri
February 19, 2020
28
SEABOARD CORPORATION
Consolidated Statements of Comprehensive Income
Years ended December 31, | ||||||||||
(Millions of dollars except share and per share amounts) |
| 2019 |
| 2018 |
| 2017 |
| |||
Net sales: | ||||||||||
Products (includes sales to affiliates of $ | $ | | $ | | $ | | ||||
Services revenues (includes sales to affiliates of $ |
| |
| |
| | ||||
Other |
| |
| |
| | ||||
Total net sales |
| |
| |
| | ||||
Cost of sales and operating expenses: | ||||||||||
Products |
| |
| |
| | ||||
Services |
| |
| |
| | ||||
Other |
| |
| |
| | ||||
Total cost of sales and operating expenses |
| |
| |
| | ||||
Gross income |
| |
| |
| | ||||
Selling, general and administrative expenses |
| |
| |
| | ||||
Operating income |
| |
| |
| | ||||
Other income (expense): | ||||||||||
Interest expense |
| ( |
| ( |
| ( | ||||
Interest income |
| |
| |
| | ||||
Interest income from affiliates |
| |
| |
| | ||||
Loss from affiliates |
| ( |
| ( |
| ( | ||||
Other investment income (loss), net |
| |
| ( |
| | ||||
Foreign currency gains, net |
| — |
| |
| | ||||
Miscellaneous, net |
| |
| ( |
| ( | ||||
Total other income (loss), net |
| |
| ( |
| | ||||
Earnings (loss) before income taxes |
| |
| ( |
| | ||||
Income tax expense |
| ( |
| ( |
| ( | ||||
Net earnings (loss) | $ | | $ | ( | $ | | ||||
Less: Net loss attributable to noncontrolling interests |
| — |
| — |
| | ||||
Net earnings (loss) attributable to Seaboard | $ | | $ | ( | $ | | ||||
Earnings (loss) per common share | $ | $ | ( | $ | ||||||
Average number of shares outstanding |
| |
| |
| | ||||
Other comprehensive income (loss), net of income tax benefit (expense) of $ | ||||||||||
Foreign currency translation adjustment |
| ( |
| ( |
| ( | ||||
Unrealized gain on investments |
| — |
| — |
| | ||||
Unrecognized pension cost |
| ( |
| |
| ( | ||||
Other comprehensive loss, net of tax | $ | ( | $ | ( | $ | ( | ||||
Comprehensive income (loss) |
| |
| ( |
| | ||||
Less: Comprehensive loss attributable to noncontrolling interests |
| — |
| |
| | ||||
Comprehensive income (loss) attributable to Seaboard | $ | | $ | ( | $ | | ||||
See accompanying notes to consolidated financial statements.
29
SEABOARD CORPORATION
Consolidated Balance Sheets
| December 31, |
| |||||
(Millions of dollars except share and per share amounts) |
| 2019 |
| 2018 |
| ||
Assets | |||||||
Current assets: | |||||||
Cash and cash equivalents | $ | | $ | | |||
Short-term investments |
| |
| | |||
Receivables: | |||||||
Trade |
| |
| | |||
Due from affiliates |
| |
| | |||
Other |
| |
| | |||
Total receivables |
| |
| | |||
Allowance for doubtful accounts |
| ( |
| ( | |||
Net receivables |
| |
| | |||
Inventories |
| |
| | |||
Prepaid expenses |
| |
| | |||
Other current assets |
| |
| | |||
Total current assets |
| |
| | |||
Net property, plant and equipment |
| |
| | |||
Operating lease right of use assets, net | | — | |||||
Investments in and advances to affiliates |
| |
| | |||
Goodwill |
| |
| | |||
Other intangible assets, net |
| |
| | |||
Other non-current assets |
| |
| | |||
Total assets | $ | | $ | | |||
Liabilities and Stockholders’ Equity | |||||||
Current liabilities: | |||||||
Lines of credit | $ | | $ | | |||
Current maturities of long-term debt |
| |
| | |||
Accounts payable (includes $ |
| |
| | |||
Accrued compensation and benefits |
| |
| | |||
Deferred revenue (includes $ | | | |||||
Operating lease liabilities | | — | |||||
Accrued voyage costs |
| |
| | |||
Other current liabilities |
| |
| | |||
Total current liabilities |
| |
| | |||
Long-term debt, less current maturities |
| |
| | |||
Long-term operating lease liabilities | | — | |||||
Accrued pension liability |
| |
| | |||
Deferred income taxes |
| |
| | |||
Long-term income tax liability | | | |||||
Other liabilities |
| |
| | |||
Total non-current liabilities |
| |
| | |||
Commitments and contingent liabilities | |||||||
Stockholders’ equity: | |||||||
Common stock of $ |
| |
| | |||
Accumulated other comprehensive loss |
| ( |
| ( | |||
Retained earnings |
| |
| | |||
Total Seaboard stockholders’ equity |
| |
| | |||
Noncontrolling interests |
| |
| | |||
Total equity |
| |
| | |||
Total liabilities and stockholders’ equity | $ | | $ | | |||
See accompanying notes to consolidated financial statements.
30
SEABOARD CORPORATION
Consolidated Statements of Cash Flows
| Years ended December 31, |
| ||||||||
(Millions of dollars) |
| 2019 |
| 2018 |
| 2017 |
| |||
Cash flows from operating activities: | ||||||||||
Net earnings (loss) | $ | | $ | ( | $ | | ||||
Adjustments to reconcile net earnings (loss) to cash from operating activities: | ||||||||||
Depreciation and amortization |
| |
| |
| | ||||
Deferred income taxes |
| ( |
| ( |
| | ||||
Mandatory deemed repatriation tax | ( | | | |||||||
Loss from affiliates |
| |
| |
| | ||||
Dividends received from affiliates |
| |
| |
| | ||||
Other investment loss (income), net |
| ( |
| |
| ( | ||||
Other, net |
| |
| |
| ( | ||||
Changes in assets and liabilities, net of acquisitions: | ||||||||||
Receivables, net of allowance |
| ( |
| ( |
| ( | ||||
Inventories |
| ( |
| ( |
| ( | ||||
Prepaid expenses | | | ( | |||||||
Other assets |
| |
| |
| ( | ||||
Other liabilities, exclusive of debt |
| |
| ( |
| ( | ||||
Net cash from operating activities |
| |
| |
| | ||||
Cash flows from investing activities: | ||||||||||
Purchase of short-term investments |
| ( |
| ( |
| ( | ||||
Proceeds from sale of short-term investments |
| |
| |
| | ||||
Proceeds from maturity of short-term investments |
| |
| |
| | ||||
Capital expenditures |
| ( |
| ( |
| ( | ||||
Proceeds from sale of non-consolidated affiliate |
| |
| — |
| — | ||||
Acquisition of businesses | ( | ( | ( | |||||||
Investments in and advances to affiliates, net |
| ( |
| ( |
| ( | ||||
Principal payments received on notes receivable from affiliates |
| |
| |
| | ||||
Purchase of long-term investments |
| ( |
| ( |
| ( | ||||
Other, net |
| ( |
| |
| ( | ||||
Net cash from investing activities |
| ( |
| ( |
| ( | ||||
Cash flows from financing activities: | ||||||||||
Lines of credit, net |
| |
| — |
| | ||||
Proceeds from long-term debt |
| |
| |
| | ||||
Principal payments of long-term debt |
| ( |
| ( |
| ( | ||||
Repurchase of common stock |
| ( |
| ( |
| — | ||||
Dividends paid |
| ( |
| ( |
| ( | ||||
Other, net |
| ( |
| ( |
| ( | ||||
Net cash from financing activities |
| |
| |
| | ||||
Effect of exchange rate changes on cash and cash equivalents |
| |
| ( |
| | ||||
Net change in cash and cash equivalents |
| ( |
| |
| | ||||
Cash and cash equivalents at beginning of year |
| |
| |
| | ||||
Cash and cash equivalents at end of year | $ | | $ | | $ | | ||||
Supplemental disclosures of cash flow information: | ||||||||||
Cash paid during the period for: | ||||||||||
Interest, net of interest capitalized | $ | | $ | | $ | | ||||
Income taxes, net of refunds |
| |
| |
| | ||||
See accompanying notes to consolidated financial statements.
31
SEABOARD CORPORATION
Consolidated Statements of Changes in Equity
| Accumulated |
|
|
|
| |||||||||||
Other |
| |||||||||||||||
Common | Comprehensive | Retained | Noncontrolling |
| ||||||||||||
(Millions of dollars) | Stock | Loss | Earnings | Interests | Total | |||||||||||
Balances, January 1, 2017 |
| $ | | $ | ( | $ | | $ | | $ | | |||||
Adoption of accounting guidance (See Note 1) | — | ( | | — | — | |||||||||||
Comprehensive income: | ||||||||||||||||
Net earnings (loss) | — | — |
| |
| ( |
| | ||||||||
Other comprehensive loss, net of tax | — |
| ( | — |
| — |
| ( | ||||||||
Reduction to noncontrolling interests | — | — |
| — |
| ( |
| ( | ||||||||
Dividends on common stock, $ | — | — | ( |
| — |
| ( | |||||||||
Balances, December 31, 2017 |
| | ( | | | | ||||||||||
Adoption of accounting guidance (See Note 1) | — | ( | | — | — | |||||||||||
Comprehensive loss: | ||||||||||||||||
Net loss | — | — |
| ( |
| — |
| ( | ||||||||
Other comprehensive loss, net of tax | — |
| ( | — |
| ( |
| ( | ||||||||
Repurchase of common stock |
| — | — |
| ( | — |
| ( | ||||||||
Additions to noncontrolling interests | — | — | — | | | |||||||||||
Reduction to noncontrolling interests | — | — |
| ( |
| ( |
| ( | ||||||||
Dividends on common stock, $ | — | — | ( | — | ( | |||||||||||
Balances, December 31, 2018 | | ( | | | | |||||||||||
Comprehensive income: | ||||||||||||||||
Net earnings | — | — |
| |
| — |
| | ||||||||
Other comprehensive loss, net of tax | — |
| ( | — |
| — |
| ( | ||||||||
Repurchase of common stock |
| — | — |
| ( | — |
| ( | ||||||||
Reduction to noncontrolling interests | — | — |
| — |
| ( |
| ( | ||||||||
Dividends on common stock, $ | — | — | ( | — | ( | |||||||||||
Balances, December 31, 2019 | $ | | $ | ( | $ | | $ | | $ | | ||||||
See accompanying notes to consolidated financial statements.
32
SEABOARD CORPORATION
Notes to Consolidated Financial Statements
Note 1 - Summary of Significant Accounting Policies
Operations of Seaboard Corporation and its Subsidiaries
Seaboard Corporation and its subsidiaries (collectively, “Seaboard”) together comprise a diverse global agribusiness and transportation company. In the United States (“U.S.”), Seaboard is primarily engaged in hog production and pork processing and ocean transportation. Overseas, Seaboard is primarily engaged in commodity merchandising, grain processing, sugar and alcohol production and electric power generation. Seaboard also has an equity method investment in Butterball, LLC (“Butterball”), a producer and processor of branded and non-branded turkey products. Approximately
Principles of Consolidation and Investments in Affiliates
The consolidated financial statements include the accounts of Seaboard Corporation and its domestic and foreign subsidiaries. All significant intercompany balances and transactions have been eliminated in consolidation. Investments in non-controlled affiliates where we have significant influence are accounted for by the equity method. Financial information from certain foreign subsidiaries and affiliates is reported on a - to
Use of Estimates
The preparation of the consolidated financial statements in conformity with U.S. generally accepted accounting principles (“GAAP”) requires management to make estimates and assumptions that affect the reported amounts of assets and liabilities, the disclosure of contingent assets and liabilities at the date of the consolidated financial statements and the reported amounts of revenues and expenses during the reporting period. Significant items subject to such estimates and assumptions include those related to allowance for doubtful accounts, valuation of inventories, impairment of long-lived assets, potential write down related to investments in and advances to affiliates and notes receivable from affiliates, income taxes, lease liabilities and right of use (“ROU”) assets and accrued pension liability. Actual results could differ from those estimates.
Foreign Currency Transactions and Translation
Seaboard has operations in several foreign countries, and the currencies of the countries fluctuate in relation to the U.S. dollar. Certain of the major contracts and transactions, however, are denominated in U.S. dollars. In addition, the value of the U.S. dollar fluctuates in relation to the currencies of countries where certain of Seaboard’s foreign subsidiaries and affiliates primarily conduct business. These fluctuations result in exchange gains and losses. The activities of these foreign subsidiaries and affiliates are primarily conducted with U.S. subsidiaries or operate in hyper-inflationary environments. As a result, the financial statements of certain foreign subsidiaries and affiliates are re-measured using the U.S. dollar as the functional currency. Certain CT&M segment consolidated subsidiaries located in Brazil, Canada, Guyana, Ivory Coast, Senegal, South Africa and Zambia use local currency as their functional currency. Also, certain non-controlled, non-consolidated affiliates of the CT&M and Sugar and Alcohol segments use local currency as their functional currency. Assets and liabilities of these subsidiaries are translated to U.S. dollars at year-end exchange rates, and income and expenses are translated at average rates. Translation gains and losses are recorded as components of other comprehensive income (loss). For the consolidated subsidiaries and non-consolidated affiliates, U.S. dollar denominated net asset or liability conversions to the local currency are recorded through income.
GAAP requires the use of highly inflationary accounting for countries whose cumulative three-year inflation exceeds 100%. In the second quarter of 2018, the Argentine peso rapidly devalued relative to the U.S. dollar, which along with increased inflation, indicated that the
33
SEABOARD CORPORATION
Notes to Consolidated Financial Statements
Cash and Cash Equivalents
For purposes of the consolidated statements of cash flows, management considers all demand deposits, overnight investments and other investments with original maturities less than three months as cash equivalents.
Supplemental Cash Flow Information
For the year ended December 31, 2019, cash paid for amounts included in the measurement of operating lease liabilities was $
Short-Term Investments
Short-term investments are categorized as trading securities and reported at their estimated fair value with any unrealized gains and losses included in other investment income (loss), net in the consolidated statements of comprehensive income. Purchases and sales are recorded on a settlement date basis, and gains and losses on investment sales are generally based on the specific identification method. Short-term investments are retained for future use in the business.
Accounts Receivable
Accounts receivable are recorded at the invoiced amount and generally do not bear interest. The Power segment, however, collects interest on certain past due accounts, and the Commodity Trading and Milling (“CT&M”) segment provides extended payment terms for certain customers in certain countries due to local market conditions. The allowance for doubtful accounts is Seaboard’s best estimate of the amount of probable credit losses. For most operating segments, Seaboard uses a specific identification approach to determine, in management’s judgment, the collection value of certain past due accounts based on contractual terms. For the Marine segment, the allowance for doubtful accounts is based on an aging percentage methodology primarily based on historical write-off experience. Seaboard reviews its allowance for doubtful accounts monthly. Management believes its allowance for doubtful accounts is adequate and reduces receivables recorded to their expected net realizable value. As of December 31, 2019 and 2018, Seaboard had gross non-affiliate foreign receivables of approximately $
| Balance at |
|
|
| Balance at |
| |||||
(Millions of dollars) | beginning of year | Provision(a) | Net deductions(b) | end of year |
| ||||||
Allowance for Doubtful Accounts: | |||||||||||
Year Ended December 31, 2019 | $ | |
| |
| ( | $ | | |||
Year Ended December 31, 2018 | $ | |
| |
| ( | $ | | |||
Year Ended December 31, 2017 | $ | |
| |
| ( | $ | | |||
(a) During 2019 and 2018, $
(b) Includes write-offs net of recoveries, foreign currency translation adjustments and other adjustments.
Notes Receivable
Seaboard monitors the credit quality of notes receivable, the majority of which are from its affiliates. For notes receivable from affiliates, Seaboard obtains and reviews financial information on a monthly basis and Seaboard representatives serve on their Board of Directors. If it is indicated based on current information and events it is probable that Seaboard will be unable to collect all amounts due according to the contractual terms of the notes receivable and an amount can be reasonably estimated, Seaboard reduces the notes receivable to estimated realizable value.
34
SEABOARD CORPORATION
Notes to Consolidated Financial Statements
The activity within the allowance for notes receivable was as follows:
| Balance at |
|
|
| Balance at |
| |||||
(Millions of dollars) | beginning of year | Provision | Net deductions | end of year |
| ||||||
Allowance for Notes Receivable: | |||||||||||
Year Ended December 31, 2019 | $ | |
| — |
| — | $ | | |||
Year Ended December 31, 2018 | $ | |
| |
| — | $ | | |||
Year Ended December 31, 2017 | $ | |
| — |
| — | $ | | |||
Inventories
Seaboard uses the lower of last-in, first-out (“LIFO”) cost or market for determining inventory cost of hogs, fresh pork products and related materials. Grain, flour and feed inventories at foreign milling operations are valued at the lower of weighted average cost and net realizable value. All other inventories are valued at the lower of first-in, first-out (“FIFO”) cost and net realizable value.
Property, Plant and Equipment
Property, plant and equipment are carried at cost and are being depreciated on the straight-line method over useful lives, ranging from
Right of Use Assets and Lease Liabilities
ROU assets and lease liabilities are recognized at the lease commencement date based on the present value of lease payments over the lease term. The present value of lease payments is determined primarily using the incremental borrowing rate based on the information available at the lease commencement date. Seaboard has elected not to recognize ROU assets and lease liabilities for short-term leases for all classes of underlying assets. Short-term leases are leases with terms greater than 1 month, but less than 12 months. Also, Seaboard elected to account for lease and nonlease maintenance components as a single lease component for all classes of underlying assets.
Goodwill and Other Intangible Assets
Goodwill is assessed annually for impairment by each reporting unit at the quarter end closest to the anniversary date of the acquisition, or more frequently if circumstances indicate that impairment is likely. Any one event or a combination of events such as change in the business climate, a negative change in relationships with significant customers and changes to strategic decisions, including decisions to expand made in response to economic or competitive conditions, could require an interim assessment prior to the next required annual assessment. If qualitative factors indicate more likely than not an impairment is possible, Seaboard performs its annual, or interim, goodwill impairment test by comparing the fair value of a reporting unit with its carrying amount and would recognize an impairment charge for the amount by which the carrying amount exceeds the reporting unit’s fair value. Based on the annual assessment conducted by these reporting units, there were impairment charges recorded for the year ended December 31, 2019.
The changes in the carrying amount of goodwill were as follows:
Pork | CT&M | ||||||||
(Millions of dollars) |
| Segment |
| Segment | Total | ||||
Balance as of December 31, 2017 | $ | | $ | | $ | | |||
Acquisition | — | | | ||||||
Foreign currency translation |
| — |
| ( | ( | ||||
Balance as of December 31, 2018 | | | | ||||||
Acquisition | — | | | ||||||
Foreign currency translation |
| — |
| ( | ( | ||||
Balance as of December 31, 2019 | $ | | $ | | $ | |
35
SEABOARD CORPORATION
Notes to Consolidated Financial Statements
Separable intangible assets with finite lives are amortized over their estimated useful lives and evaluated for impairment similar to property, plant and equipment discussed above. The gross carrying amount and accumulated amortization for finite-lived intangible were as follows:
December 31, 2019 | December 31, 2018 | |||||||||||||
Customer | Trade | Customer | Trade | |||||||||||
(Millions of dollars) | relationships | names | Total | relationships | names | Total | ||||||||
Gross carrying amount | $ | $ | $ | $ | $ | $ | ||||||||
Accumulated amortization and currency translation | ( | ( | ( | ( | ( | ( | ||||||||
Net carrying amount | $ | $ | $ | $ | $ | $ | ||||||||
Amortization of intangible assets was $
Accrued Self-Insurance
Seaboard is self-insured for certain levels of workers’ compensation, health care coverage, property damage, vehicle, product recall and general liability. The cost of these self-insurance programs is accrued based upon estimated settlements for known and anticipated claims. Changes in estimates to previously recorded reserves are reflected in current operating results.
Asset Retirement Obligation
Seaboard has recorded long-lived assets and a related liability for the asset retirement obligation costs associated with the closure of the hog lagoons it is legally obligated to close in the future should Seaboard cease operations or plan to close such lagoons voluntarily in accordance with a changed operating plan. Based on detailed assessments and appraisals obtained to estimate the future asset retirement obligation costs, Seaboard recorded the present value of the projected costs in non-current other liabilities in the consolidated balance sheets with the retirement asset depreciated over the economic life of the related asset. The following table shows the changes in the asset retirement obligation:
Years ended December 31, | ||||||
(Millions of dollars) |
| 2019 |
| 2018 | ||
Beginning balance | $ | | $ | | ||
Accretion expense |
| |
| | ||
Ending balance | $ | | $ | | ||
Revenue Recognition
Seaboard recognizes revenue when control of the promised goods or services is transferred to its customers, in an amount that reflects the consideration it expects to receive in exchange for those goods or services. A performance obligation is a promise in a contract to transfer a distinct good or service to the customer. The majority of Seaboard’s revenue arrangements consist of a single performance obligation as the promise to transfer the individual product or service is not separately identifiable from other promises in the contracts, including shipping and handling and customary storage, and, therefore, not distinct. Seaboard’s transaction prices are mostly fixed, but occasionally include minimal variable consideration for early payment, volume and other similar discounts, which are highly probable based on the history with the respective customers. Taxes assessed by a governmental authority that are collected by Seaboard from a customer are excluded from sales.
Derivative Instruments and Hedging Activities
Seaboard recognizes all derivatives as either assets or liabilities at their fair values. Accounting for changes in the fair value of a derivative depends on its designation and effectiveness. Derivatives qualify for treatment as hedges for accounting purposes when there is a high correlation between the change in fair value of the instrument and the related change in value of the underlying commitment. Additionally, in order to designate a derivative financial instrument as a hedge for accounting purposes, extensive record keeping is required. For derivatives that qualify as hedges for accounting purposes, the change in fair value has no net impact on earnings, to the extent the derivative is considered effective, until the hedged transaction affects earnings. For derivatives that are not designated as hedging instruments for accounting purposes, or for the ineffective portion of a hedging instrument, the change in fair value affects current period net earnings.
36
SEABOARD CORPORATION
Notes to Consolidated Financial Statements
Seaboard uses derivative instruments to manage various types of market risks, including primarily commodity futures and option contracts, foreign currency exchange agreements, interest rate exchange agreements and equity future contracts. While management believes each of these instruments are primarily entered into in order to effectively manage various market risks, as of December 31, 2019, of the derivatives were designated and accounted for as hedges, primarily as a result of the extensive record-keeping requirements. From time to time, Seaboard also enters into speculative derivative transactions not directly related to its raw materials requirements.
Income Taxes
Deferred income taxes are recognized for the tax consequences of temporary differences by applying enacted statutory tax rates applicable to future years to differences between the financial statement carrying amounts and the tax bases of existing assets and liabilities.
Earnings Per Common Share
Earnings per common share are based upon the weighted average shares outstanding during the period. Basic and diluted earnings per share are the same for all periods presented.
Recently Issued Accounting Standards Adopted
On January 1, 2019, Seaboard adopted guidance which requires the recognition of ROU assets and lease liabilities for most leases. As a result of this adoption, Seaboard recorded operating lease ROU assets of $
On January 1, 2018, Seaboard adopted guidance that eliminated cost method accounting and requires measuring equity investments, other than those accounted for using the equity method of accounting, at fair value and recognizing fair value changes in net income if a readily determinable fair value exists. On , $
Seaboard early adopted guidance that permitted companies to reclassify stranded tax effects resulting from the Tax Cuts and Job Act from accumulated other comprehensive income (“AOCI”) to retained earnings. Seaboard reclassified $
Recently Issued Accounting Standards Not Yet Adopted
In June 2016, the Financial Accounting Standards Board (“FASB”) issued guidance on the measurement of financial instrument credit losses that requires, among other things, the use of a new current expected credit loss ("CECL") model in order to determine the allowance for doubtful accounts with respect to accounts receivable and notes receivable. The CECL model requires estimation of lifetime expected credit loss based on historical experience, current conditions and reasonable supportable forecasts. The new guidance replaces the existing incurred loss model and will be effective for Seaboard on January 1, 2020. Seaboard expects the cumulative-effect adjustment to retained earnings will be less than $
In December 2019, the FASB issued guidance which simplifies the accounting for income taxes by removing certain exceptions to the general principles and improves consistent application of GAAP for other areas by clarifying and amending existing guidance. This guidance is effective for Seaboard on January 1, 2021. Seaboard is evaluating the effect of adopting this new accounting guidance but does not expect adoption will have a material impact on its disclosures.
Note 2 - Acquisitions
On October 28, 2019, Seaboard’s CT&M segment increased its ownership percentage from
37
SEABOARD CORPORATION
Notes to Consolidated Financial Statements
Seaboard is currently completing the fair value assessment of the acquired assets and liabilities and any adjustments identified in the measurement period, which will not exceed one year from the acquisition date, will be accounted for prospectively. The following table summarizes the preliminary purchase price allocation resulting from this consolidation:
(Millions of dollars) | |||
Receivables | $ | | |
Inventories |
| | |
Other current assets | | ||
Property, plant and equipment |
| | |
Goodwill | | ||
Total fair value of assets acquired | | ||
Lines of credit | ( | ||
Current maturities of long-term debt | ( | ||
Other current liabilities | ( | ||
Long-term debt, less current maturities | ( | ||
Total fair value of liabilities assumed | ( | ||
Net fair value of assets acquired | $ | |
Goodwill represents CLDP’s market presence and its experienced workforce. For the year ended December 31, 2019, net sales of $
On January 5, 2018, Seaboard’s CT&M segment acquired substantially all of the outstanding common shares of Borisniak Corp., Les Grands Moulins d’Abidjan, Les Grands Moulins de Dakar, Eurafrique, and Societe Mediterraneenne de Transport, collectively operating as Groupe Mimran (“Mimran”). Mimran operates
The total purchase price for this acquisition based on the acquisition date fair values and using the exchange rate in effect at the time of acquisition, was $
(Millions of dollars) | ||||
Cash payment, net of $ |
| $ | | |
Euro-denominated note payable due 2021, |
| | ||
Contingent consideration | | |||
Total fair value of consideration at acquisition date | $ | |
See Note 8 for further description of the note payable. The fair value of the contingent consideration, classified in other non-current liabilities in the consolidated balance sheet, is dependent on the probability of Mimran achieving certain financial performance targets using earnings before interest, taxes, depreciation and amortization (“EBITDA”) as a metric. The contingent consideration ranges between and $
38
SEABOARD CORPORATION
Notes to Consolidated Financial Statements
The following table summarizes the purchase price allocation resulting from this acquisition:
(Millions of dollars) | ||||
Current assets |
| $ | | |
Property, plant and equipment |
| | ||
Intangible assets | | |||
Goodwill | | |||
Other long-term assets | | |||
Total fair value of assets acquired | | |||
Current liabilities | ( | |||
Other long-term liabilities | ( | |||
Total fair value of liabilities assumed | ( | |||
Less: Noncontrolling interest | ( | |||
Net fair value of assets acquired | $ | |
The intangible assets include $
Certain Mimran entities acquired are accounted for on a
The following unaudited pro forma information presents the combined consolidated financial results for Seaboard as if the acquisition had been completed at January 1, 2017:
Year ended | |||||||
(Unaudited) | December 31, | ||||||
(Millions of dollars except per share amounts) | 2018 | 2017 | |||||
Net sales | $ | | $ | | |||
Net earnings (loss) | $ | ( | $ | | |||
Earnings (loss) per common share | $ | ( | $ | | |||
Note 3 - Investments
The following is a summary of the estimated fair value of short-term investments classified as trading securities:
December 31, |
| ||||||||
(Millions of dollars) | 2019 | 2018 | |||||||
Domestic equity securities | $ | | $ | | |||||
Domestic debt securities |
| |
| | |||||
Foreign equity securities | | | |||||||
High yield securities | | | |||||||
Foreign debt securities | | | |||||||
Collateralized loan obligations | | | |||||||
Money market funds held in trading accounts | | | |||||||
Other trading securities | | | |||||||
Total trading short-term investments | $ | | $ | | |||||
The change in unrealized gains (losses) related to trading securities still held at the end of the respective reporting period was $
Seaboard had $
39
SEABOARD CORPORATION
Notes to Consolidated Financial Statements
various other currencies. Seaboard had $
In addition to its short-term investments, Seaboard also has trading securities related to Seaboard’s deferred compensation plans classified in other current assets in the consolidated balance sheets. See Note 11 for information on the types of trading securities held related to the deferred compensation plans. See Note 10 for a discussion of assets held in conjunction with investments related to Seaboard’s defined benefit pension plan.
Note 4 - Inventories
The following table is a summary of inventories:
| December 31, |
| ||||||
(Millions of dollars) |
| 2019 |
| 2018 | ||||
At lower of LIFO cost or market: | ||||||||
Hogs and materials | $ | | $ | | ||||
Fresh pork and materials |
| |
| | ||||
LIFO adjustment |
| ( |
| ( | ||||
Total inventories at lower of LIFO cost or market |
| |
| | ||||
At lower of FIFO cost and net realizable value: | ||||||||
Grains, oilseeds and other commodities |
| |
| | ||||
Sugar produced and in process |
| |
| | ||||
Other |
| |
| | ||||
Total inventories at lower of FIFO cost and net realizable value |
| |
| | ||||
Grain, flour and feed at lower of weighted average cost and net realizable value |
| |
| | ||||
Total inventories | $ | | $ | | ||||
The use of the LIFO method for certain inventories of the Pork segment decreased net earnings $
| Balance at |
| Increase |
| Balance at |
| |||
(Millions of dollars) | beginning of year | (decrease) | end of year |
| |||||
Reserve for LIFO Valuation: | |||||||||
Year Ended December 31, 2019 | $ | |
| | $ | | |||
Year Ended December 31, 2018 | $ | |
| | $ | | |||
Year Ended December 31, 2017 | $ | |
| | $ | | |||
Note 5 - Net Property, Plant and Equipment
The following table is a summary of property, plant and equipment:
Useful | December 31, | ||||||||||
(Millions of dollars) |
| Lives |
| 2019 |
| 2018 | |||||
Land and improvements |
| - | years | $ | | $ | | ||||
Buildings and improvements |
| years |
| |
| | |||||
Machinery and equipment |
| - | years |
| |
| | ||||
Vessels and vehicles |
| - | years |
| |
| | ||||
Office furniture and fixtures |
| years |
| |
| | |||||
Contract growers | - | years | | — | |||||||
Construction in progress |
| |
| | |||||||
| |
| | ||||||||
Accumulated depreciation and amortization |
| ( |
| ( | |||||||
Net property, plant and equipment | $ | | $ | | |||||||
40
SEABOARD CORPORATION
Notes to Consolidated Financial Statements
Finance lease ROU assets of $
Seaboard’s capitalized interest on construction in progress was $
Note 6 – Leases
Seaboard’s operating leases are primarily for ports, vessels, contract grower assets, and to a lesser extent, land, buildings and machinery and equipment. Seaboard’s finance leases are primarily for contract grower assets. Seaboard’s Marine segment leases its PortMiami terminal, among other ports. The Marine and CT&M segments lease vessels for use in operations. The Pork segment has contract grower agreements in place with farmers to raise a portion of Seaboard’s hogs using the farmer’s buildings, land and equipment. Seaboard’s nonlease components are primarily for services related to labor associated with caring for hogs in its contract grower agreements and crew services on vessel charter arrangements.
As of December 31, 2019, the weighted average remaining lease term for Seaboard’s operating and finance leases was approximately
Seaboard’s operating lease assets and liabilities are reported separately in the consolidated balance sheet. The classification of Seaboard’s finance leases in the consolidated balance sheet as of December 31, 2019 was as follows:
(Millions of dollars) | |||||
Finance lease right of use assets, net | $ | | |||
Finance lease liabilities | | ||||
Non-current finance lease liabilities | |
The components of lease cost for 2019 were as follows:
(Millions of dollars) | ||
Operating lease cost | $ | |
Finance lease cost: | ||
Amortization of right of use assets | | |
Interest on lease liabilities | | |
Variable lease cost | | |
Short-term lease cost | | |
Total lease cost | $ | |
Operating lease cost and short-term lease cost are recognized on a straight-line basis over the lease term. Finance lease cost is recognized based on the effective interest method for the lease liability and straight-line amortization of the ROU asset. Variable lease payments are recognized when the circumstance in the lease agreement on which those payments are assessed occurs. Variable lease payments are primarily for payments in excess of minimums with regards to throughput of shipping containers. Short-term leases are primarily for containers and vessels at Seaboard’s Marine segment. Lease cost is included in various line items in the consolidated statements of comprehensive income or capitalized to inventory. Rental expense for leases with terms of a month or less are excluded from the total lease cost above.
Rental expense for facility and equipment operating leases for all segments was $
41
SEABOARD CORPORATION
Notes to Consolidated Financial Statements
Maturities of lease liabilities as of December 31, 2019 were as follows:
Operating | Finance | |||||
(Millions of dollars) |
| Leases | Leases |
| ||
2020 | $ | | $ | | ||
2021 | |
| | |||
2022 | | | ||||
2023 | | | ||||
2024 | | | ||||
Thereafter | |
| | |||
Total undiscounted lease payments | | | ||||
Less imputed interest | ( | ( | ||||
Total lease liability | $ | | $ | |
Seaboard’s weighted average discount rate for operating and finances leases was
Below is Seaboard’s commitments table as of December 31, 2018 that disclosed operating lease payments for the next five years and thereafter. Seaboard had no material capital leases as of December 31, 2018.
Years ended December 31, |
| |||||||||||||||||||
(Millions of dollars) |
| 2019 |
| 2020 |
| 2021 |
| 2022 |
| 2023 |
| Thereafter | ||||||||
Ports | $ | | $ | | $ | | $ | | $ | | $ | | ||||||||
Vessel, time and voyage-charters |
| |
| |
| |
| |
| |
| | ||||||||
Contract grower agreements | |
| |
| |
| |
| |
| | |||||||||
Other operating lease payments |
| |
| |
| |
| |
| |
| | ||||||||
Total unrecognized non-cancelable commitments | $ | | $ | | $ | | $ | | $ | | $ | | ||||||||
Note 7 – Equity Method Investments
Seaboard has several investments in and advances to non-controlled, non-consolidated affiliates that are all accounted for using the equity method of accounting. See Note 15 for detail of the investments in and advances to affiliates by segment. Financial information from certain foreign affiliates is reported on a - to
Pork Segment |
| December 31, | |||||||
(Millions of dollars) | 2019 | 2018 | 2017 | ||||||
Net sales | $ | | $ | | $ | | |||
Net income (loss) | $ | ( | $ | ( | $ | ( | |||
Total assets | $ | | $ | | $ | | |||
Total liabilities | $ | | $ | | $ | | |||
Total equity | $ | | $ | | $ | | |||
The Pork segment has a
Seaboard and Triumph Foods, LLC (“Triumph”) formed STF in May 2015 with equal ownership of
42
SEABOARD CORPORATION
Notes to Consolidated Financial Statements
Commodity Trading and Milling Segment | December 31, | ||||||||
(Millions of dollars) |
| 2019 |
| 2018 |
| 2017 | |||
Net sales | $ | |
| $ | |
| $ | | |
Net income (loss) | $ | ( |
| $ | ( |
| $ | | |
Total assets | $ | |
| $ | |
| $ | | |
Total liabilities | $ | |
| $ | |
| $ | | |
Total equity | $ | |
| $ | |
| $ | | |
The CT&M segment has noncontrolling interests in foreign businesses conducting flour, maize and feed milling, baking operations, poultry production and processing, and agricultural commodity trading. Combined condensed financial information of these entities for each of Seaboard’s years ended is included in the table above. As of December 31, 2019, the location and percentage ownership of CT&M’s affiliates were as follows: Botswana (
During 2018, Seaboard’s CT&M segment acquired a
Marine Segment |
| December 31, | |||||||
(Millions of dollars) |
| 2019 | 2018 | 2017 | |||||
Net sales | $ | | $ | | $ | | |||
Net income | $ | | $ | | $ | | |||
Total assets | $ | | $ | | $ | | |||
Total liabilities | $ | | $ | | $ | | |||
Total equity | $ | | $ | | $ | | |||
The Marine segment has a
Sugar and Alcohol Segment | December 31, | ||||||||
(Millions of dollars) |
| 2019 |
| 2018 |
| 2017 | |||
Net sales | $ | |
| $ | |
| $ | | |
Net income | $ | |
| $ | |
| $ | | |
Total assets | $ | |
| $ | |
| $ | | |
Total liabilities | $ | |
| $ | |
| $ | | |
Total equity | $ | |
| $ | |
| $ | | |
The Sugar and Alcohol segment has noncontrolling interests in
43
SEABOARD CORPORATION
Notes to Consolidated Financial Statements
Power Segment | December 31, | ||||||||
(Millions of dollars) |
| 2019 |
| 2018 |
| 2017 | |||
Net sales | $ | |
| $ | |
| $ | | |
Net income | $ | |
| $ | |
| $ | | |
Total assets | $ | |
| $ | |
| $ | | |
Total liabilities | $ | |
| $ | |
| $ | | |
Total equity | $ | |
| $ | |
| $ | | |
The Power segment has noncontrolling interests in
Turkey Segment | December 31, | |||||||||
(Millions of dollars) |
| 2019 |
| 2018 |
| 2017 | ||||
Net sales | $ | |
| $ | |
| $ | | ||
Operating income (loss) | $ | ( | $ | ( | $ | | ||||
Net loss | $ | ( |
| $ | ( |
| $ | ( | ||
Total assets | $ | |
| $ | |
| $ | | ||
Total liabilities | $ | |
| $ | |
| $ | | ||
Total equity | $ | |
| $ | |
| $ | | ||
The Turkey segment represents Seaboard’s
In connection with its initial investment in Butterball in December 2010, Seaboard provided Butterball with a $
44
SEABOARD CORPORATION
Notes to Consolidated Financial Statements
Note 8 – Lines of Credit and Long-Term Debt
The outstanding balance under uncommitted lines of credit was $
Seaboard has a $
Long-term Debt
Long-term debt includes borrowings under term loans and other contractual obligations for payment, including notes payable. The following table is a summary of long-term debt:
December 31, | |||||||
(Millions of dollars) | 2019 | 2018 | |||||
Term Loan due 2028 | $ | | $ | | |||
Foreign subsidiary obligations | | | |||||
Total long-term debt at face value | | | |||||
Current maturities of long-term debt and unamortized discount and costs | ( | ( | |||||
Long-term debt, less current maturities and unamortized discount and costs | $ | | $ | | |||
On September 25, 2018, Seaboard Foods LLC entered into an Amended and Restated Term Loan Credit Agreement (“Credit Agreement”) with CoBank, ACB, Farm Credit Services of America, PCA, and the lenders party thereto. This Credit Agreement replaced Seaboard Foods LLC’s $
The Term Loan requires, among other terms, the maintenance of certain ratios involving a maximum debt to capitalization ratio, which shall not exceed
Foreign subsidiary long-term debt is primarily denominated in euros and U.S. dollars. In conjunction with the acquisition discussed in Note 2, Seaboard incurred a euro-denominated note payable due to the sellers with a balance of $
45
SEABOARD CORPORATION
Notes to Consolidated Financial Statements
Seaboard was in compliance with all restrictive debt covenants relating to these agreements as of December 31, 2019. The aggregate minimum principal payments required on long-term debt as of December 31, 2019 were as follows: $
Note 9 - Commitments and Contingencies
Legal Proceedings
On June 28, 2018, Wanda Duryea and
On March 20, 2018, the bankruptcy trustee (the “Trustee”) for Cereoil Uruguay S.A. (“Cereoil”) filed a suit in the Bankruptcy Court of First Instance in Uruguay that was served during the second quarter of 2018 naming as parties Seaboard and Seaboard’s subsidiaries, Seaboard Overseas Limited (“SOL”) and Seaboard Uruguay Holdings Ltd. (“Seaboard Uruguay”). Seaboard has a
On April 27, 2018, the Trustee for Cereoil filed another suit in the Bankruptcy Court of First Instance in Uruguay that was served during the second quarter of 2018 naming as parties Seaboard, SOL, Seaboard Uruguay, all directors of Cereoil, including two individuals employed by Seaboard who served as directors at the behest of Seaboard, and the Chief Financial Officer of Cereoil, an employee of Seaboard who also served at the behest of Seaboard (collectively, the “Cereoil Defendants”). The Trustee contends that the Cereoil Defendants acted with willful misconduct to cause Cereoil’s insolvency, and thus should be ordered to pay all liabilities of Cereoil, net of assets. The bankruptcy filing lists total liabilities of $
46
SEABOARD CORPORATION
Notes to Consolidated Financial Statements
In addition, in the event of an adverse ruling, the Bankruptcy Court of First Instance could order payment of the Trustee’s professional fees, interest, and other expenses. Any award in this case would offset against any award in the case described above filed on March 20, 2018.
A creditor of Cereoil which has a claim in the bankruptcy proceeding pending in Uruguay of approximately $
On May 15, 2018, the Trustee for Nolston S.A. (“Nolston”) filed a suit in the Bankruptcy Court of First Instance in Uruguay that was served during the second quarter of 2018 naming as parties Seaboard and the other Cereoil Defendants. Seaboard has a
On September 18, 2014, and subsequently in 2015 and 2016, Seaboard received a number of grand jury subpoenas and informal requests for information from the Department of Justice, Asset Forfeiture and Money Laundering Section (“AFMLS”), seeking records related to specified foreign companies and individuals. The companies and individuals as to which the requested records relate were not affiliated with Seaboard, although Seaboard has also received subpoenas and requests for additional information relating to an affiliate of Seaboard. During 2017, Seaboard received grand jury subpoenas requesting documents and information related to money transfers and bank accounts in the Democratic Republic of Congo and other African countries and requests to interview certain Seaboard employees and to obtain testimony before a grand jury. Seaboard retained outside counsel and cooperated with the government’s investigation. There has been no further communication from AFMLS for more than 18 months and to the knowledge of Seaboard, there has been no further action taken by AFMLS. As such, unless further communication is received from AFMLS or action is taken by AFMLS, disclosure of the matter described in this paragraph will not appear in Seaboard’s future SEC periodic reports.
Seaboard is subject to various administrative and judicial proceedings and other legal matters related to the normal conduct of its business. In the opinion of management, the ultimate resolution of these items is not expected to have a material adverse effect on the consolidated financial statements of Seaboard.
Guarantees
Certain of the non-consolidated affiliates and third-party contractors who perform services for Seaboard have bank debt supporting their underlying operations. From time to time, Seaboard will provide guarantees of that debt in order to further Seaboard’s business objectives. Seaboard does not issue guarantees for compensation. As of December 31, 2019, guarantees outstanding were not material. Seaboard has not accrued a liability for any of the guarantees as management considers the likelihood of loss to be remote. See discussion of bank letters of credit in Note 8.
47
SEABOARD CORPORATION
Notes to Consolidated Financial Statements
Commitments
As of December 31, 2019, Seaboard had various non-cancelable commitments under contractual agreements:
Years ended December 31, |
|
| |||||||||||||||||||
(Millions of dollars) |
| 2020 |
| 2021 |
| 2022 |
| 2023 |
| 2024 | Thereafter |
| Totals | ||||||||
Hog procurement contracts (a) | $ | | $ | | $ | | $ | | $ | | $ | — | $ | | |||||||
Grain commitments (b) |
| |
| |
| — |
| — |
| — |
| — |
| | |||||||
Grain purchase contracts for resale (c) | | — | — | — | — | — | | ||||||||||||||
Fuel supply contracts (d) |
| |
| |
| |
| |
| |
| |
| | |||||||
Construction commitments (e) | | | — | — | — | — | | ||||||||||||||
Equipment and other commitments |
| |
| |
| |
| |
| |
| |
| | |||||||
Total unrecognized non-cancelable commitments | $ | | $ | | $ | | $ | | $ | | $ | | $ | | |||||||
| (a) | The Pork segment has contracted with third parties for the purchase of hogs to support its operations. The amounts are based on projected market prices as of December 31, 2019. During 2019, 2018 and 2017, the Pork segment paid $ |
| (b) | The Pork segment enters into grain purchase contracts to support its hog operations. The amounts are based on projected commodity prices as of December 31, 2019. |
| (c) | The CT&M segment enters into grain purchase contracts, primarily to support firm sales commitments. The amounts are based on projected commodity prices as of December 31, 2019. |
| (d) | The Power segment has a natural gas supply contract for a significant portion of the fuel required for the barge under construction. The commitment has both fixed and variable price components and the amount included is partially based on market prices as of December 31, 2019. The Marine segment also has fuel purchase contracts. |
| (e) | The Power segment’s commitments to the contractor for its new power generating barge, anticipated to begin operations in mid-2021, were approximately $ |
Note 10 - Employee Benefits
Seaboard has a qualified defined benefit pension plan (the “Plan”) for its domestic salaried and clerical employees that were hired before January 1, 2014. Benefits are generally based upon the number of years of service and a percentage of final average pay. Seaboard has historically based pension contributions on minimum funding standards to avoid the Pension Benefit Guaranty Corporation (“PBGC”) variable rate premiums established by the Employee Retirement Income Security Act (“ERISA”) of 1974. Seaboard did not make any contributions in 2019 and 2018 and currently does not plan on making any contributions in 2020.
Pursuant to Seaboard’s investment policy, assets are invested in the Plan to achieve a diversified target allocation of approximately
December 31, | ||||||||||||
(Millions of dollars) | 2019 | Level 1 | Level 2 | Level 3 | ||||||||
Assets: | ||||||||||||
Domestic equity securities | $ | | $ | | $ | — | $ | — | ||||
Foreign equity securities |
| |
| |
| — |
| — | ||||
Domestic fixed income mutual funds | | | — | — | ||||||||
Foreign fixed income mutual funds |
| | | — |
| — | ||||||
Money market funds |
| |
| | — |
| — | |||||
Total assets | $ | | $ | | $ | — | $ | — | ||||
48
SEABOARD CORPORATION
Notes to Consolidated Financial Statements
December 31, | ||||||||||||
(Millions of dollars) | 2018 | Level 1 | Level 2 | Level 3 | ||||||||
Assets: | ||||||||||||
Domestic equity securities | $ | | $ | | $ | — | $ | — | ||||
Foreign equity securities |
| |
| |
| — |
| — | ||||
Domestic fixed income mutual funds |
| | | — | — | |||||||
Foreign fixed income mutual funds |
| |
| |
| — |
| — | ||||
Money market funds |
| |
| |
| — |
| — | ||||
Total assets | $ | | $ | | $ | — | $ | — | ||||
Seaboard also sponsors non-qualified, unfunded supplemental executive plans, and has certain individual, non-qualified, unfunded supplemental retirement agreements for certain retired employees. Management has no plans to provide funding for these supplemental executive plans in advance of when the benefits are paid.
Assumptions used in determining pension information for all of the above plans were:
Years ended December 31, |
| ||||||||||||
| 2019 | 2018 |
| 2017 |
| ||||||||
Weighted average assumptions | |||||||||||||
Discount rate used to determine obligations | - | % | - | % | - | % | |||||||
Discount rate used to determine net periodic benefit cost | - | % | - | % | - | % | |||||||
Expected return on plan assets | % | % | % | ||||||||||
Long-term rate of increase in compensation levels | % | % | % | ||||||||||
Management selected the discount rate based on a model-based result where the timing and amount of cash flows approximates the estimated payouts. The expected returns on the Plan’s assets assumption are based on the weighted average of asset class expected returns that are consistent with historical returns. The assumed rate of return selected was based on model-based results that reflect the Plan’s asset allocation and related long-term projected returns. The measurement date for all plans is December 31.
The aggregate changes in the benefit obligation and fair value of assets for the Plan, supplemental executive plans and retirement agreements and the funded status were as follows:
December 31, | |||||||
(Millions of dollars) |
| 2019 | 2018 |
| |||
Reconciliation of benefit obligation: | |||||||
Benefit obligation at beginning of year | $ | | $ | | |||
Service cost |
| |
| | |||
Interest cost |
| |
| | |||
Actuarial losses (gains) |
| |
| ( | |||
Plan settlements | ( | — | |||||
Benefits paid |
| ( |
| ( | |||
Other | | — | |||||
Benefit obligation at end of year | $ | | $ | | |||
Reconciliation of fair value of plan assets: | |||||||
Fair value of plan assets at beginning of year | $ | | $ | | |||
Actual return on plan assets |
| |
| ( | |||
Employer contributions |
| |
| | |||
Plan settlements | ( | — | |||||
Benefits paid |
| ( |
| ( | |||
Fair value of plan assets at end of year | $ | | $ | | |||
Funded status | $ | ( | $ | ( | |||
The net funded status of the Plan was $(
49
SEABOARD CORPORATION
Notes to Consolidated Financial Statements
of December 31, 2019 and 2018, respectively. Expected future net benefit payments for all plans during each of the next five years and thereafter were as follows: $
The net periodic benefit cost of these plans was as follows:
| Years ended December 31, | ||||||||||
(Millions of dollars) |
|
| 2019 |
| 2018 |
| 2017 | ||||
Components of net periodic benefit cost: | |||||||||||
Service cost | $ | | $ | | $ | | |||||
Interest cost |
| |
| |
| | |||||
Expected return on plan assets |
| ( |
| ( |
| ( | |||||
Amortization |
| |
| |
| | |||||
Settlement loss recognized | | — | | ||||||||
Net periodic benefit cost | $ | | $ | | $ | | |||||
The service cost component is recorded in either cost of sales or selling, general and administrative expenses depending upon the employee, and the other components of net periodic benefit cost are recorded in miscellaneous, net in the consolidated statements of comprehensive income. The amounts not reflected in net periodic benefit cost and included in accumulated other comprehensive loss before taxes as of December 31, 2019 and 2018 were $
Seaboard participated in a multi-employer pension fund, the United Food and Commercial Workers International Union-Industry Pension Fund (the “Fund”), which covered certain union employees under a collective bargaining agreement. Contribution expense for this Fund was $
Seaboard maintains a defined contribution plan covering most of its domestic salaried and clerical employees. In 2019, 2018 and 2017, Seaboard contributed to this plan an amount equal to
Seaboard has a deferred compensation plan that allows certain employees to reduce their compensation in exchange for values in various investments. Seaboard contributes
50
SEABOARD CORPORATION
Notes to Consolidated Financial Statements
Note 11 - Derivatives and Fair Value of Financial Instruments
The fair value hierarchy prioritizes inputs to valuation techniques used to measure fair value into three broad levels:
Level 1 — Observable inputs such as unadjusted quoted prices in active markets for identical assets or liabilities.
Level 2 — Inputs other than quoted prices in active markets that are observable either directly or indirectly, including: quoted prices for similar assets and liabilities in active markets; quoted prices for identical or similar assets and liabilities in markets that are not active or other inputs that are observable or can be corroborated by observable market data.
Level 3 — Unobservable inputs that are supported by little or no market data and require the reporting entity to develop its own assumptions.
The following tables show assets and liabilities measured at fair value on a recurring basis as of December 31, 2019 and 2018, respectively, and the level within the fair value hierarchy used to measure each category of assets and liabilities. The trading securities classified as other current assets below are assets held for Seaboard’s deferred compensation plans.
December 31, |
| ||||||||||||
(Millions of dollars) | 2019 | Level 1 | Level 2 | Level 3 |
| ||||||||
Assets: | |||||||||||||
Trading securities – short-term investments: | |||||||||||||
Domestic equity securities | $ | | $ | | $ | — | $ | — | |||||
Domestic debt securities |
| |
| |
| |
| — | |||||
Foreign equity securities | | | — | — | |||||||||
High yield securities | | | | — | |||||||||
Foreign debt securities | | — | | — | |||||||||
Collateralized loan obligations |
| |
| — |
| |
| — | |||||
Money market funds held in trading accounts | | | — | — | |||||||||
Other trading securities | | | — | — | |||||||||
Trading securities – other current assets: | |||||||||||||
Domestic equity securities |
| |
| |
| — |
| — | |||||
Money market funds held in trading accounts | | | — | — | |||||||||
Foreign equity securities |
| |
| |
| — |
| — | |||||
Fixed income securities |
| |
| |
| — |
| — | |||||
Derivatives: | |||||||||||||
Commodities |
| |
| |
| — |
| — | |||||
Total assets | $ | | $ | | $ | | $ | — | |||||
Liabilities: | |||||||||||||
Contingent consideration | $ | | $ | — | $ | — | $ | | |||||
Derivatives: | |||||||||||||
Commodities | | | — | — | |||||||||
Foreign currencies |
| |
| — |
| |
| — | |||||
Total liabilities | $ | | $ | | $ | | $ | | |||||
51
SEABOARD CORPORATION
Notes to Consolidated Financial Statements
December 31, |
| ||||||||||||
(Millions of dollars) | 2018 | Level 1 | Level 2 | Level 3 |
| ||||||||
Assets: | |||||||||||||
Trading securities – short-term investments: | |||||||||||||
Domestic equity securities | $ | | $ | | $ | — | $ | — | |||||
Domestic debt securities | | | | — | |||||||||
Foreign equity securities | | | — | — | |||||||||
Money market funds held in trading accounts |
| |
| |
| — |
| — | |||||
Collateralized loan obligations | | — | | — | |||||||||
High yield securities | | | | — | |||||||||
Foreign debt securities | | | | — | |||||||||
Other trading securities |
| |
| |
| — |
| — | |||||
Trading securities – other current assets: | |||||||||||||
Domestic equity securities |
| |
| |
| — |
| — | |||||
Money market funds held in trading accounts | | | — | — | |||||||||
Foreign equity securities |
| |
| |
| — |
| — | |||||
Fixed income securities |
| |
| |
| — |
| — | |||||
Other |
| |
| |
| — |
| — | |||||
Derivatives: | |||||||||||||
Commodities |
| |
| |
| |
| — | |||||
Foreign currencies |
| |
| — |
| |
| — | |||||
Total assets | $ | | $ | | $ | | $ | — | |||||
Liabilities: | |||||||||||||
Trading securities – short-term investments: | |||||||||||||
Other trading securities | $ | | $ | — | $ | | $ | — | |||||
Contingent consideration | | — | — | | |||||||||
Derivatives: | |||||||||||||
Commodities | | | — | — | |||||||||
Total liabilities | $ | | $ | | $ | | $ | | |||||
Financial instruments consisting of cash and cash equivalents, net receivables, lines of credit and accounts payable are carried at cost, which approximates fair value, as a result of the short-term nature of the instruments.
Domestic debt securities categorized as level 1 in the fair value hierarchy include debt securities held in mutual funds and ETFs. Domestic debt securities categorized as level 2 include corporate bonds, mortgage-backed securities, asset-backed securities and U.S. Treasuries. Foreign debt securities categorized as level 1 in the fair value hierarchy included debt securities held in mutual funds and ETFs with a country of origin concentration outside the U.S. Foreign debt securities categorized as level 2 include foreign government or government related securities, corporate bonds and asset-backed securities with a country of origin concentration outside the U.S. High yield securities categorized as level 1 in the fair value hierarchy include high yield securities held in mutual funds and ETFs, and level 2 includes primarily corporate bonds and bank loans.
The fair value of long-term debt is estimated by comparing interest rates for debt with similar terms and maturities. As Seaboard’s long-term debt is mostly variable-rate, its carrying amount approximates fair value. If Seaboard’s long-term debt was measured at fair value on its consolidated balance sheets, it would have been classified as level 2 in the fair value hierarchy. See Note 8 for a discussion of Seaboard’s long-term debt. The fair value of Seaboard’s contingent consideration related to a 2018 acquisition was classified as a level 3 in the fair value hierarchy since the calculation is dependent upon projected company specific inputs using a Monte Carlo simulation. Seaboard remeasures the estimated fair value of the contingent consideration liability until settled.
While management believes its derivatives are primarily economic hedges, Seaboard does not perform the extensive record-keeping required to account for these types of transactions as hedges for accounting purposes. As the derivatives discussed below are not accounted for as hedges, fluctuations in the related commodity prices, foreign currency exchange rates and equity prices could have a material impact on earnings in any given reporting period.
52
SEABOARD CORPORATION
Notes to Consolidated Financial Statements
Commodity Instruments
Seaboard uses various derivative futures and options to manage its risk to price fluctuations for raw materials and other inventories, finished product sales and firm sales commitments. Occasionally, Seaboard also enters into speculative derivative transactions not directly related to its raw material requirements. Commodity derivatives are recorded at fair value, with any changes in fair value being marked-to-market as a component of cost of sales in the consolidated statements of comprehensive income.
As of December 31, 2019, Seaboard had open net derivative contracts to purchase
Foreign Currency Exchange Agreements
Seaboard enters into foreign currency exchange agreements to manage the foreign currency exchange rate risk with respect to certain transactions denominated in foreign currencies. Foreign currency exchange agreements that primarily relate to an underlying commodity transaction are recorded at fair value with changes in value marked-to-market as a component of cost of sales in the consolidated statements of comprehensive income. Foreign currency exchange agreements that are not related to an underlying commodity transaction are recorded at fair value with changes in value marked-to-market as a component of foreign currency gains (losses), net in the consolidated statements of comprehensive income. As of December 31, 2019 and 2018, Seaboard had foreign currency exchange agreements with notional amounts of $
Equity Futures Contracts
Seaboard enters into equity futures contracts to manage the equity price risk with respect to certain short-term investments. Equity futures contracts are recorded at fair value with changes in value marked-to-market as a component of other investment income (loss), net in the consolidated statements of comprehensive income. The notional amounts of these equity futures contracts were $
The following table provides the amount of gain (loss) recognized for each type of derivative and where it was recognized in the consolidated statements of comprehensive income for the years ended December 31, 2019 and 2018:
(Millions of dollars) |
|
| 2019 |
| 2018 | ||||
Commodities |
| Cost of sales | $ | ( | $ | ( | |||
Foreign currencies |
| Cost of sales |
| |
| | |||
Foreign currencies |
| Foreign currency gains (losses), net |
| ( |
| | |||
Equity |
| Other investment income (loss), net |
| ( |
| ( | |||
The following table provides the fair value of each type of derivative held as of December 31, 2019 and 2018 and where each derivative is included in the consolidated balance sheets:
Asset Derivatives | Liability Derivatives | |||||||||||||||
December 31, | December 31, | December 31, | December 31, | |||||||||||||
(Millions of dollars) |
|
| 2019 |
| 2018 |
|
| 2019 |
| 2018 | ||||||
Commodities(a) |
| Other current assets | $ | | $ |
| Other current liabilities | $ | | $ | ||||||
Foreign currencies |
| Other current assets |
| — |
|
| Other current liabilities |
| |
| — | |||||
Equity(a) |
| Short-term investments |
| — |
| — |
| Short-term investments |
| — |
| | ||||
(a) Seaboard’s commodity derivative assets and liabilities are presented in the consolidated balance sheets on a net basis, including netting the derivatives with the related margin accounts. As of December 31, 2019 and 2018, the commodity derivatives had a margin account balance of $
53
SEABOARD CORPORATION
Notes to Consolidated Financial Statements
Note 12 - Stockholders’ Equity and Accumulated Other Comprehensive Loss
In October 2019, the Board of Directors extended through October 31, 2020 Seaboard’s share repurchase program. Under this share repurchase program, Seaboard is authorized to repurchase its common stock from time to time in open market or privately negotiated purchases, which may be above or below the traded market price. During the period that the share repurchase program remains in effect, from time to time, Seaboard may enter into a 10b5-1 plan authorizing a third party to make such purchases on behalf of Seaboard. All stock repurchased will be made in compliance with applicable legal requirements and funded by cash on hand. The timing of the repurchases and the number of shares repurchased at any given time will depend upon market conditions, compliance with SEC regulations, and other factors. The Board of Directors’ stock repurchase authorization does not obligate Seaboard to acquire a specific amount of common stock, and the stock repurchase program may be suspended at any time at Seaboard’s discretion. As of December 31, 2019, $
In each of the four quarters of 2019, Seaboard declared and paid a quarterly dividend of $
The components of accumulated other comprehensive loss, net of related taxes, were as follows:
| Cumulative |
|
|
| |||||||||
Foreign | Unrealized | ||||||||||||
Currency | Gain | Unrecognized | |||||||||||
Translation | on | Pension | |||||||||||
(Millions of dollars) | Adjustment | Investments | Cost | Total | |||||||||
Balance December 31, 2017 | $ | ( | $ | | $ | ( | $ | ( | |||||
Other comprehensive loss before reclassifications |
| ( |
| — |
| ( |
| ( | |||||
Amounts reclassified from accumulated other comprehensive loss to net loss |
| — |
| — |
| | (a) |
| | ||||
Other comprehensive income (loss), net of tax |
| ( |
| — |
| |
| ( | |||||
Amounts reclassified from accumulated other comprehensive loss to retained earnings | — | ( | (b) | — | ( | ||||||||
Balance December 31, 2018 | $ | ( | $ | — | $ | ( | $ | ( | |||||
Other comprehensive loss before reclassifications |
| ( |
| — |
| ( |
| ( | |||||
Amounts reclassified from accumulated other comprehensive loss to net earnings |
| — |
| — |
| | (a) |
| | ||||
Other comprehensive loss, net of tax |
| ( |
| — |
| ( |
| ( | |||||
Balance December 31, 2019 | $ | ( | $ | — | $ | ( | $ | ( | |||||
(a) This primarily represents the amortization of actuarial losses that was included in net periodic pension cost and recorded in operating income. See Note 10 for further discussion.
(b) Effective January 1, 2018, upon adoption of new guidance, all unrealized gains (losses) on investments were included in the consolidated statement of comprehensive income. The AOCI balance as of December 31, 2017, was reclassified to retained earnings on January 1, 2018.
The cumulative foreign currency translation adjustment primarily represents the effect of the Argentine peso currency exchange fluctuation on the net assets of the Sugar and Alcohol segment. Effective in the third quarter of 2018, the Sugar and Alcohol segment’s functional currency changed from the Argentine peso to the U.S. dollar due to highly inflationary accounting. See Note 1 for discussion of the functional currency change. During 2019, the foreign currency translation adjustment primarily related to CT&M entities with a functional currency of the West African franc.
Income taxes for the unrecognized pension cost component of accumulated other comprehensive loss was recorded using a
54
SEABOARD CORPORATION
Notes to Consolidated Financial Statements
Note 13 – Revenue Recognition
Seaboard has multiple segments with diverse revenue streams. For additional information on Seaboard’s segments, see Note 15. The following tables presents Seaboard’s sales disaggregated by revenue source and segment:
Year Ended December 31, 2019 | ||||||||||||||||||||||
(Millions of dollars) | Pork | CT&M | Marine | Sugar and Alcohol | Power | All Other | Consolidated Totals | |||||||||||||||
Major Products/Services Lines: | ||||||||||||||||||||||
Products | $ | | $ | | $ | — | $ | | $ | — | $ | | $ | | ||||||||
Transportation | | — | | — | — | | | |||||||||||||||
Energy | | — | — | | | — | | |||||||||||||||
Other | | | — | — | — | — | | |||||||||||||||
Segment/Consolidated Totals | $ | | $ | | $ | | $ | | $ | | $ | | $ | | ||||||||
Year Ended December 31, 2018 | ||||||||||||||||||||||
(Millions of dollars) | Pork | CT&M | Marine | Sugar and Alcohol | Power | All Other | Consolidated Totals | |||||||||||||||
Major Products/Services Lines: | ||||||||||||||||||||||
Products | $ | | $ | | $ | — | $ | | $ | — | $ | | $ | | ||||||||
Transportation | | — | | — | — | — | | |||||||||||||||
Energy | | — | — | | | — | | |||||||||||||||
Other | | | — | — | — | — | | |||||||||||||||
Segment/Consolidated Totals | $ | | $ | | $ | | $ | | $ | | $ | | $ | | ||||||||
Revenue from goods and services transferred to customers at a single point in time accounted for approximately
Almost all of Seaboard’s contracts with its customers are short-term, defined as less than one year. Seaboard elected to use all practical expedients and therefore will not disclose the value of unsatisfied performance obligations for: (i) contracts with an original expected length of year or less; and (ii) contracts for which revenue is recognized at the amount to which it has the right to invoice for services performed. Also, Seaboard will recognize a financing component only on obligations that extend longer than one year.
Deferred revenue represents cash payments received in advance of Seaboard’s performance or revenue billed that is unearned. The CT&M segment requires certain customers to pay in advance or upon delivery to avoid collection risk. The Marine segment’s deferred revenue balance primarily relates to the unearned portion of billed revenue when a ship is on the water and has not arrived at the designated port. Deferred revenue balances are reduced when revenue is recognized. The deferred revenue balance as of December 31, 2018 was recognized as revenue during the first quarter of 2019.
55
SEABOARD CORPORATION
Notes to Consolidated Financial Statements
Note 14 - Income Taxes
Earnings before income taxes were as follows:
Years ended December 31, | |||||||||
(Millions of dollars) |
| 2019 |
| 2018 |
| 2017 | |||
United States | $ | | $ | ( | $ | | |||
Foreign |
| |
| |
| | |||
Total earnings (loss) excluding noncontrolling interests |
| |
| ( |
| | |||
Net loss attributable to noncontrolling interests |
| — |
| — |
| | |||
Total earnings (loss) before income taxes | $ | | $ | ( | $ | | |||
The components of total income taxes were as follows:
Years ended December 31, | |||||||||
(Millions of dollars) |
| 2019 |
| 2018 |
| 2017 | |||
Current: | |||||||||
Federal | $ | | $ | ( | $ | | |||
Foreign |
| |
| |
| | |||
State and local |
| ( |
| — |
| | |||
Deferred: | |||||||||
Federal |
| ( |
| |
| | |||
Foreign |
| ( |
| ( |
| | |||
State and local |
| ( |
| ( |
| | |||
Income tax expense |
| |
| |
| | |||
Unrealized changes in other comprehensive income (loss) |
| ( |
| |
| ( | |||
Total income taxes | $ | ( | $ | | $ | | |||
Income taxes for the years ended December 31, 2019, 2018 and 2017 differed from the amounts computed by applying the statutory U.S. federal income tax rate of
Years ended December 31, |
| |||||||||
(Millions of dollars) |
| 2019 |
| 2018 |
| 2017 |
| |||
Computed “expected” tax expense (benefit) excluding noncontrolling interests | $ | | $ | ( | $ | | ||||
Adjustments to tax expense (benefit) attributable to: | ||||||||||
Foreign tax differences |
| |
| |
| ( | ||||
Tax-exempt income |
| ( |
| ( |
| — | ||||
State income taxes, net of federal benefit |
| ( |
| ( |
| | ||||
Repatriation tax | — | | | |||||||
Effect on deferreds of federal rate reduction | — | — | ( | |||||||
Foreign entity tax status change | — | | — | |||||||
Federal tax credits |
| ( |
| ( |
| ( | ||||
Federal rate reduction effect on capital loss carryback |
| — |
| ( |
| — | ||||
Domestic manufacturing deduction |
| — |
| — |
| ( | ||||
Other |
| |
| |
| ( | ||||
Total income tax expense | $ | | $ | | $ | | ||||
In December 2019, the President of the U.S. signed into law the Further Consolidated Appropriations Act (the “2019 Tax Act”) that extended the federal blender’s credits through 2022, with retroactive recognition for 2018 and 2019. As a result, in the fourth quarter of 2019, Seaboard recognized non-taxable revenue of $
56
SEABOARD CORPORATION
Notes to Consolidated Financial Statements
with GAAP, the effects of changes in tax laws, including retroactive changes, are recognized in the financial statements in the period that the changes are enacted.
Seaboard has certain investments in various entities that are expected to enable Seaboard to obtain certain investment tax credits. Seaboard has invested in
During 2018, Seaboard elected to change the tax status of a wholly owned subsidiary from a partnership to a corporation. This change in tax status resulted in an estimated $
On December 22, 2017, the President of the U.S. signed into law the Tax Cuts and Job Act (“2017 Tax Act”). Among other things, the 2017 Tax Act lowered corporate income tax rates from a maximum of
As of December 31, 2019 and 2018, Seaboard had income taxes receivable of $
Seaboard provided for U.S. federal income tax on $
57
SEABOARD CORPORATION
Notes to Consolidated Financial Statements
Components of the net deferred income tax liability were as follows:
December 31, | ||||||
(Millions of dollars) | 2019 | 2018 | ||||
Deferred income tax liabilities: | ||||||
Depreciation |
| $ | |
| $ | |
Domestic partnerships | | | ||||
Unrealized gain on investments | | — | ||||
Other | | | ||||
$ | | $ | | |||
Deferred income tax assets: | ||||||
Reserves/accruals | $ | | $ | | ||
Net operating and capital loss carry-forwards | | | ||||
LIFO | | | ||||
Tax credit carry-forwards | | | ||||
Other | | | ||||
| | |||||
Valuation allowance | | | ||||
Net deferred income tax liability | $ | | $ | | ||
The activity within the valuation allowance account was as follows:
| Balance at |
| Charge (credit) |
| Balance at |
| |||
(Millions of dollars) | beginning of year | to expense | end of year |
| |||||
Allowance for Deferred Tax Assets: | |||||||||
Year Ended December 31, 2019 | $ | |
| | $ | | |||
Year Ended December 31, 2018 | $ | |
| — | $ | | |||
Year Ended December 31, 2017 | $ | |
| | $ | | |||
Management believes Seaboard’s future taxable income will be sufficient for full realization of the net deferred tax assets. The valuation allowance relates to the tax benefits from state net operating losses and foreign net operating losses and tax credits. Management does not believe these benefits are more likely than not to be realized due to limitations imposed on the utilization of these losses and credits. As of December 31, 2019, Seaboard had state net operating loss carry-forwards of approximately $
Seaboard’s tax returns are regularly audited by federal, state and foreign tax authorities, which may result in material adjustments. Seaboard’s 2013, 2014, 2015 and 2016 U.S. income tax returns are currently under Internal Revenue Service examination. Tax years prior to 2013 are generally no longer subject to U.S. tax assessment. In Seaboard’s major non-U.S. jurisdictions, including Argentina, the Dominican Republic, Ivory Coast and Senegal, tax years are typically subject to examination for to
As of December 31, 2019 and 2018, Seaboard had $
58
SEABOARD CORPORATION
Notes to Consolidated Financial Statements
The following table is a reconciliation of the beginning and ending amount of unrecognized tax benefits:
(Millions of dollars) |
| 2019 |
| 2018 | ||
Beginning balance at January 1 | $ | | $ | | ||
Additions for uncertain tax positions of prior years |
| |
| | ||
Decreases for uncertain tax positions of prior years |
| ( |
| — | ||
Additions for uncertain tax positions of current year |
| |
| | ||
Lapse of statute of limitations |
| ( |
| ( | ||
Ending balance as of December 31 | $ | | $ | | ||
Seaboard accrues interest related to unrecognized tax benefits and penalties in income tax expense and had approximately $
Note 15 - Segment Information
Seaboard has
In February 2019, the Pork segment entered into an asset purchase agreement to buy an idle ethanol plant in Hugoton, Kansas for approximately $
In October 2019, the CT&M segment obtained control of a former non-consolidated affiliate that operates a grain trading business in Peru. On January 5, 2018, the CT&M segment acquired flour milling and associated businesses in Senegal, Ivory Coast and Monaco. See Note 2 for further details of these acquisitions.
The Power segment is currently constructing a power barge for use in the Dominican Republic that is anticipated to begin operations in 2021. Seaboard’s Power segment continues to explore strategic alternatives for the existing barge, including selling, relocating or operating in conjunction with the new barge at the current site. During 2019, the Power segment sold its
The following tables set forth specific financial information about each segment as reviewed by Seaboard’s management, except for the Turkey segment information previously disclosed in Note 7. Operating income for segment reporting is prepared on the same basis as that used for consolidated operating income. Operating income, along with income (loss) from affiliates for the Pork, CT&M and Turkey segments, are used as the measures of evaluating segment performance because management does not consider interest, other investment income (loss) and income tax expense on a segment
59
SEABOARD CORPORATION
Notes to Consolidated Financial Statements
basis. Administrative services provided by the corporate office are allocated to the individual segments and represent corporate services rendered to and costs incurred for each specific segment, with no allocation to individual segments of general corporate management oversight costs. Corporate assets include short-term investments, other current assets related to deferred compensation plans, fixed assets, and other miscellaneous items. Corporate operating losses represent certain operating costs not specifically allocated to individual segments and include costs related to Seaboard’s deferred compensation programs, which are offset by the effect of the mark-to-market adjustments on these investments recorded in other investment income (loss), net.
Sales to External Customers:
| Years ended December 31, | ||||||||||
(Millions of dollars) |
|
| 2019 |
| 2018 |
| 2017 | ||||
Pork | $ | | $ | | $ | | |||||
Commodity Trading and Milling |
| |
| |
| | |||||
Marine |
| |
| |
| | |||||
Sugar and Alcohol |
| |
| |
| | |||||
Power |
| |
| |
| | |||||
All Other |
| |
| |
| | |||||
Segment/Consolidated Totals | $ | | $ | | $ | | |||||
Operating Income (Loss):
| Years ended December 31, | ||||||||||
(Millions of dollars) |
|
| 2019 |
| 2018 |
| 2017 | ||||
Pork | $ | | $ | | $ | | |||||
Commodity Trading and Milling |
| |
| |
| | |||||
Marine |
| |
| |
| | |||||
Sugar and Alcohol |
| ( |
| |
| | |||||
Power |
| |
| |
| | |||||
All Other |
| |
| |
| | |||||
Segment Totals |
| |
| |
| | |||||
Corporate |
| ( |
| ( |
| ( | |||||
Consolidated Totals | $ | | $ | | $ | | |||||
Income (Loss) from Affiliates:
| Years ended December 31, | ||||||||||
(Millions of dollars) |
|
| 2019 |
| 2018 |
| 2017 | ||||
Pork | $ | ( | $ | ( | $ | ( | |||||
Commodity Trading and Milling | ( | ( | | ||||||||
Marine | | | ( | ||||||||
Sugar and Alcohol |
| |
| |
| | |||||
Power | | | | ||||||||
Turkey |
| ( |
| ( |
| ( | |||||
Segment/Consolidated Totals | $ | ( | $ | ( | $ | ( | |||||
Depreciation and Amortization:
Years ended December 31, | |||||||||
(Millions of dollars) |
| 2019 |
| 2018 |
| 2017 | |||
Pork | $ | | $ | | $ | | |||
Commodity Trading and Milling |
| |
| |
| | |||
Marine |
| |
| |
| | |||
Sugar and Alcohol |
| |
| |
| | |||
Power |
| |
| |
| | |||
Segment Totals |
| |
| |
| | |||
Corporate |
| |
| |
| — | |||
Consolidated Totals | $ | | $ | | $ | | |||
60
SEABOARD CORPORATION
Notes to Consolidated Financial Statements
Total Assets:
| December 31, | |||||||
(Millions of dollars) |
|
| 2019 |
| 2018 | |||
Pork | $ | | $ | | ||||
Commodity Trading and Milling |
| |
| | ||||
Marine |
| |
| | ||||
Sugar and Alcohol |
| |
| | ||||
Power |
| |
| | ||||
Turkey |
| |
| | ||||
All Other |
| |
| | ||||
Segment Totals |
| |
| | ||||
Corporate |
| |
| | ||||
Consolidated Totals | $ | | $ | | ||||
Investments in and Advances to Affiliates:
| December 31, | |||||||
(Millions of dollars) |
|
| 2019 |
| 2018 | |||
Pork | $ | | $ | | ||||
Commodity Trading and Milling | | | ||||||
Marine | | | ||||||
Sugar and Alcohol |
| |
| | ||||
Power | | | ||||||
Turkey |
| |
| | ||||
Segment/Consolidated Totals | $ | | $ | | ||||
Capital Expenditures:
Years ended December 31, | |||||||||
(Millions of dollars) |
| 2019 |
| 2018 |
| 2017 | |||
Pork | $ | | $ | | $ | | |||
Commodity Trading and Milling |
| |
| |
| | |||
Marine |
| |
| |
| | |||
Sugar and Alcohol |
| |
| |
| | |||
Power |
| |
| |
| | |||
Segment Totals |
| |
| |
| | |||
Corporate |
| — |
| |
| — | |||
Consolidated Totals | $ | | $ | | $ | | |||
Geographic Information
Seaboard had sales in Colombia totaling $
61
SEABOARD CORPORATION
Notes to Consolidated Financial Statements
The following table provides a geographic summary of net sales based on the location of product delivery:
Years ended December 31, | |||||||||
(Millions of dollars) |
| 2019 |
| 2018 |
| 2017 | |||
Caribbean, Central and South America | $ | | $ | | $ | | |||
Africa |
| |
| |
| | |||
United States |
| |
| |
| | |||
Pacific Basin and Far East |
| |
| |
| | |||
Canada/Mexico | | | | ||||||
Europe |
| |
| |
| | |||
All other |
| |
| |
| | |||
Totals | $ | | $ | | $ | | |||
The following table provides a geographic summary of Seaboard’s property, plant and equipment according to their physical location and primary port for the vessels:
December 31, | |||||||
(Millions of dollars) |
| 2019 |
| 2018 | |||
United States | $ | | $ | | |||
Singapore | | | |||||
Dominican Republic |
| |
| | |||
Argentina |
| |
| | |||
Senegal | | | |||||
Zambia | | | |||||
Ivory Coast | | | |||||
All other |
| |
| | |||
Totals | $ | | $ | | |||
Note 16 - Quarterly Financial Data (unaudited) | ||||||||||||||||
1st | 2nd | 3rd | 4th | Total for | ||||||||||||
(Millions of dollars except per share amounts) |
| Quarter |
| Quarter |
| Quarter |
| Quarter |
| the Year | ||||||
2019 | ||||||||||||||||
Net sales | $ | | $ | | $ | | $ | | (a) | $ | | |||||
Operating income (loss) | $ | ( | $ | | $ | ( | $ | | (a) | $ | | |||||
Net earnings (loss) attributable to Seaboard | $ | | $ | | $ | ( | $ | | (a) | $ | | |||||
Earnings (loss) per common share | $ | | $ | | $ | ( | $ | | (a) | $ | | |||||
2018 | ||||||||||||||||
Net sales | $ | | $ | | $ | | $ | | $ | | ||||||
Operating income | $ | | $ | | $ | | $ | | $ | | ||||||
Net earnings (loss) attributable to Seaboard | $ | | $ | | $ | | $ | ( | (b) | $ | ( | |||||
Earnings (loss) per common share | $ | | $ | | $ | | $ | ( | (b) | $ | ( | |||||
| (a) | During the fourth quarter of 2019, Seaboard recognized $ |
| (b) | During the fourth quarter of 2018, Seaboard recorded other investment losses of $ |
62
Item 9. Changes in and Disagreements with Accountants on Accounting and Financial Disclosure
None.
Item 9A. Controls and Procedures
As of December 31, 2019, Seaboard’s management has evaluated, under the direction of its chief executive and chief financial officers, the effectiveness of Seaboard’s disclosure controls and procedures, as defined under the Securities Exchange Act of 1934 (the “Exchange Act”) Rule 13a-15(e). Based upon and as of the date of that evaluation, Seaboard’s chief executive and chief financial officers concluded that Seaboard’s disclosure controls and procedures were effective to provide reasonable assurance that information required to be disclosed in the reports it files and submits under the Exchange Act is recorded, processed, summarized and reported as and when required. It should be noted that any system of disclosure controls and procedures, however well designed and operated, can provide only reasonable, and not absolute, assurance that the objectives of the system are met. In addition, the design of any system of disclosure controls and procedures is based in part upon assumptions about the likelihood of future events. Due to these and other inherent limitations of any such system, there can be no assurance that any design will always succeed in achieving its stated goals under all potential future conditions.
Management’s Report on Internal Control Over Financial Reporting
The management of Seaboard is responsible for establishing and maintaining adequate internal control over financial reporting, as such term is defined in the Securities Exchange Act of 1934 Rule 13a-15(f). Under the supervision, and with the participation of management and its Internal Audit Department, Seaboard conducted an evaluation of the effectiveness of its internal control over financial reporting based on the framework in Internal Control - Integrated Framework (2013) issued by the Committee of Sponsoring Organizations of the Treadway Commission (“COSO”). Based on its evaluation under the framework in Internal Control - Integrated Framework (2013), management concluded that Seaboard’s internal control over financial reporting was effective as of December 31, 2019.
The effectiveness of our internal control over financial reporting as of December 31, 2019 has been audited by KPMG, an independent registered public accounting firm, as stated in their report which appears on page 64.
Change in Internal Control Over Financial Reporting –There have been no changes in Seaboard’s internal control over financial reporting that occurred during the fiscal quarter ended December 31, 2019 that has materially affected, or is reasonably likely to materially affect, Seaboard’s internal control over financial reporting.
63
Report of Independent Registered Public Accounting Firm
To the Stockholders and Board of Directors
Seaboard Corporation:
Opinion on Internal Control Over Financial Reporting
We have audited Seaboard Corporation and subsidiaries’ (the Company) internal control over financial reporting as of December 31, 2019, based on criteria established in Internal Control – Integrated Framework (2013) issued by the Committee of Sponsoring Organizations of the Treadway Commission. In our opinion, the Company maintained, in all material respects, effective internal control over financial reporting as of December 31, 2019, based on criteria established in Internal Control – Integrated Framework (2013) issued by the Committee of Sponsoring Organizations of the Treadway Commission.
We also have audited, in accordance with the standards of the Public Company Accounting Oversight Board (United States) (PCAOB), the consolidated balance sheets of the Company as of December 31, 2019 and 2018, the related consolidated statements of comprehensive income, changes in equity, and cash flows for each of the years in the three-year period ended December 31, 2019, and the related notes (collectively, the consolidated financial statements), and our report dated February 19, 2020 expressed an unqualified opinion on those consolidated financial statements.
Basis for Opinion
The Company’s management is responsible for maintaining effective internal control over financial reporting and for its assessment of the effectiveness of internal control over financial reporting, included in the accompanying “Management’s Report on Internal Control Over Financial Reporting.” Our responsibility is to express an opinion on the Company’s internal control over financial reporting based on our audit. We are a public accounting firm registered with the PCAOB and are required to be independent with respect to the Company in accordance with the U.S. federal securities laws and the applicable rules and regulations of the Securities and Exchange Commission and the PCAOB.
We conducted our audit in accordance with the standards of the PCAOB. Those standards require that we plan and perform the audit to obtain reasonable assurance about whether effective internal control over financial reporting was maintained in all material respects. Our audit of internal control over financial reporting included obtaining an understanding of internal control over financial reporting, assessing the risk that a material weakness exists, and testing and evaluating the design and operating effectiveness of internal control based on the assessed risk. Our audit also included performing such other procedures as we considered necessary in the circumstances. We believe that our audit provides a reasonable basis for our opinion.
Definition and Limitations of Internal Control Over Financial Reporting
A company’s internal control over financial reporting is a process designed to provide reasonable assurance regarding the reliability of financial reporting and the preparation of financial statements for external purposes in accordance with generally accepted accounting principles. A company’s internal control over financial reporting includes those policies and procedures that (1) pertain to the maintenance of records that, in reasonable detail, accurately and fairly reflect the transactions and dispositions of the assets of the company; (2) provide reasonable assurance that transactions are recorded as necessary to permit preparation of financial statements in accordance with generally accepted accounting principles, and that receipts and expenditures of the company are being made only in accordance with authorizations of management and directors of the company; and (3) provide reasonable assurance regarding prevention or timely detection of unauthorized acquisition, use, or disposition of the company’s assets that could have a material effect on the financial statements.
Because of its inherent limitations, internal control over financial reporting may not prevent or detect misstatements. Also, projections of any evaluation of effectiveness to future periods are subject to the risk that controls may become inadequate because of changes in conditions, or that the degree of compliance with the policies or procedures may deteriorate.
|
Kansas City, Missouri
February 19, 2020
64
Item 9B. Other Information
None.
PART III
Item 10. Directors, Executive Officers and Corporate Governance
The information about the executive officers of Seaboard is included under the caption “Executive Officers of the Registrant” in Item 1 of this annual report on Form 10-K.
Seaboard has a Code of Conduct and Ethics Policy for Senior Financial Officers applicable to its senior financial officers (including the chief executive officer, chief financial officer, chief accounting officer and controller and persons performing similar functions) and a Code of Ethics Policy applicable to its directors, officers and other employees (together the “Codes”). Seaboard has posted the Codes on its internet website, www.seaboardcorp.com, and intends to satisfy the disclosure requirement under Item 10 of Form 10-K regarding any future changes and waivers to the Codes by posting such information on that website.
In addition to the information provided above, the information required by this item is incorporated herein by reference to the information under the captions “Item 1: Election of Directors,” “Board of Directors Information – Committees of the Board – Audit Committee,” “Board of Directors Information – Director Nominations” and “Section 16(a) Beneficial Ownership Reporting Compliance” of Seaboard’s definitive proxy statement for the 2020 annual meeting of stockholders, which will be filed no later than 120 days after December 31, 2019 (“Proxy Statement”).
Item 11. Executive Compensation
The information required by this item is incorporated herein by reference to the information under the captions “Board of Directors Information – Compensation of Directors,” “Executive Compensation and Other Information,” “Employment Arrangements with Named Executive Officers,” “Benefit Plans,” “Compensation Committee Interlocks and Insider Participation,” “Compensation Committee Report,” and “Compensation Discussion and Analysis” included in the Proxy Statement.
Item 12. Security Ownership of Certain Beneficial Owners and Management and Related Stockholder Matters
Seaboard has not established any equity compensation plans or individual agreements for its employees under which Seaboard common stock, or options, rights or warrants with respect to Seaboard common stock may be granted.
In addition to the information provided above, the information required by this item is incorporated herein by reference to the information under the captions “Principal Stockholders” and “Share Ownership of Management and Directors” included in the Proxy Statement.
Item 13. Certain Relationships and Related Transactions, and Director Independence
The information required by this item is incorporated herein by reference to the information under the captions “Compensation Committee Interlocks and Insider Participation,” “Board of Directors Information – Controlled Corporation” and “Board of Directors Information – Committees of the Board” included in the Proxy Statement.
Item 14. Principal Accounting Fees and Services
The information required by this item is incorporated herein by reference to the information under the captions “Item 2: Selection of Independent Auditors” included in the Proxy Statement.
PART IV
Item 15. Exhibits, Financial Statement Schedules
(a) List the following documents filed as a part of the report:
1. Financial statements.
The financial statements are included in Item 8 of this Form 10-K.
2. Financial statement schedules.
All schedules are omitted as the required information is not applicable or the information is presented in the consolidated financial statements or related consolidated notes.
65
3. Exhibits.
Exhibit No. | Description | ||||
3.1 | |||||
3.2 | |||||
4+ | |||||
10.1* | |||||
10.2* | |||||
10.3* | |||||
10.4* | |||||
10.5* | |||||
10.6* | |||||
10.7* | |||||
10.8* | |||||
10.9* | |||||
10.10* | |||||
10.11* | |||||
10.12* | |||||
10.13* |
66
10.14* | |||||
10.15* | |||||
10.16* | |||||
10.17* | |||||
10.18* | |||||
10.19* | |||||
|
|
| |||
10.20* | |||||
10.21* | |||||
|
|
| |||
10.22* | |||||
10.23 | |||||
10.24 | |||||
10.25 | |||||
10.26 | |||||
10.27 | |||||
10.28 | |||||
21+ | |||||
31.1+ | |||||
67
31.2+ | |||
32.1+ | |||
32.2+ | |||
101.INS+ | Inline XBRL Instance Document (the instance document does not appear in the Interactive Data File because its XBRL tags are embedded within the Inline XBRL document) | ||
101.SCH+ | Inline XBRL Taxonomy Extension Schema Document | ||
101.CAL+ | Inline XBRL Taxonomy Extension Calculation Linkbase Document | ||
101.DEF+ | Inline XBRL Taxonomy Extension Definition Linkbase Document | ||
101.LAB+ | Inline XBRL Taxonomy Extension Label Linkbase Document | ||
101.PRE+ | Inline XBRL Taxonomy Extension Presentation Linkbase Document | ||
104+ | Cover Page Interactive Data File (formatted as inline XBRL and contained in Exhibit 101) |
* Management contract or compensatory plan or arrangement.
+ Filed electronically with this annual report on Form 10-K with the SEC and transmitted via EDGAR.
(b) Exhibits.
See exhibits identified above under Item 15(a)(3).
(c) Financial Statement Schedules.
None.
Item 16. Form 10-K Summary
None.
68
SIGNATURES
Pursuant to the requirements of Section 13 or 15(d) of the Securities Exchange Act of 1934, the Registrant has duly caused this report to be signed on its behalf by the undersigned, thereunto duly authorized.
SEABOARD CORPORATION | |||
(Registrant) | |||
By: | /s/ Steven J. Bresky | ||
Steven J. Bresky, Chairman of the Board, | |||
President and Chief Executive Officer | |||
Date: | February 19, 2020 | ||
Pursuant to the requirements of the Securities Exchange Act of 1934, this report has been signed below by the following persons on behalf of the Registrant and in the capacities and on the dates indicated.
Name | Date | Title | |||
/s/ Steven J. Bresky | February 19, 2020 | Chairman of the Board, President, | |||
Steven J. Bresky | Chief Executive Officer and | ||||
Director (principal executive | |||||
officer) | |||||
/s/ Robert L. Steer | February 19, 2020 | Executive Vice President, | |||
Robert L. Steer | Chief Financial Officer | ||||
(principal financial officer) | |||||
/s/ Michael D. Trollinger | February 19, 2020 | Vice President, Corporate | |||
Michael D. Trollinger | Controller and Chief Accounting | ||||
Officer (principal accounting | |||||
officer) | |||||
/s/ David A. Adamsen | February 19, 2020 | Director | |||
David A. Adamsen | |||||
/s/ Douglas W. Baena | February 19, 2020 | Director | |||
Douglas W. Baena | |||||
/s/ Edward I. Shifman, Jr. | February 19, 2020 | Director | |||
Edward I. Shifman, Jr. | |||||
/s/ Paul M. Squires | February 19, 2020 | Director | |||
Paul M. Squires | |||||
69