UNITED STATES
SECURITIES AND EXCHANGE COMMISSION
Washington, D.C. 20549
FORM
(Mark One)
ANNUAL REPORT PURSUANT TO SECTION 13 OR 15(d) OF THE SECURITIES EXCHANGE ACT OF 1934 |
For the fiscal year ended
OR
TRANSITION REPORT PURSUANT TO SECTION 13 OR 15(d) OF THE SECURITIES EXCHANGE ACT OF 1934 FOR THE TRANSITION PERIOD FROM TO |
Commission File Number
CSB BANCORP, INC.
(Exact name of Registrant as specified in its Charter)
(State or other jurisdiction of incorporation or organization) |
(I.R.S. Employer Identification No.) |
(Address of principal executive offices) |
(Zip Code) |
Registrant’s telephone number, including area code: (
Securities registered pursuant to Section 12(g) of the Act:
Title of each class |
|
Trading Symbol(s) |
|
Name of each exchange on which registered |
|
|
Securities registered pursuant to Section 12(g) of the Act: None
Indicate by check mark if the Registrant is a well-known seasoned issuer, as defined in Rule 405 of the Securities Act. Yes ☐
Indicate by check mark if the Registrant is not required to file reports pursuant to Section 13 or 15(d) of the Act. Yes ☐
Indicate by check mark whether the Registrant: (1) has filed all reports required to be filed by Section 13 or 15(d) of the Securities Exchange Act of 1934 during the preceding 12 months (or for such shorter period that the Registrant was required to file such reports), and (2) has been subject to such filing requirements for the past 90 days.
Indicate by check mark whether the Registrant has submitted electronically every Interactive Data File required to be submitted pursuant to Rule 405 of Regulation S-T (§232.405 of this chapter) during the preceding 12 months (or for such shorter period that the Registrant was required to submit such files).
Indicate by check mark whether the registrant is a large accelerated filer, an accelerated filer, a non-accelerated filer, smaller reporting company, or an emerging growth company. See the definitions of “large accelerated filer,” “accelerated filer,” “smaller reporting company,” and “emerging growth company” in Rule 12b-2 of the Exchange Act.
Large accelerated filer |
|
☐ |
|
Accelerated filer |
|
☐ |
|
|
|
|
|||
|
☒ |
|
Smaller reporting company |
|
||
|
|
|
|
|
|
|
Emerging growth company |
|
|
|
|
|
|
If an emerging growth company, indicate by check mark if the registrant has elected not to use the extended transition period for complying with any new or revised financial accounting standards provided pursuant to Section 13(a) of the Exchange Act. ☐
Indicate by check mark whether the registrant has filed a report on and attestation to its management’s assessment of the effectiveness of its internal control over financial reporting under Section 404(b) of the Sarbanes-Oxley Act (15 U.S.C. 7262(b)) by the registered public accounting firm that prepared or issued its audit report.
If securities are registered pursuant to Section 12(b) of the Act, indicate by check mark whether the financial statements of the registrant included in the filing reflect the correction of an error to previously issued financial statements. ☐
Indicate by check mark whether any of those error corrections are restatements that required a recovery analysis of incentive-based compensation received by any of the registrant’s executive officers during the relevant recovery period pursuant to §240.10D-1(b). ☐
Indicate by check mark whether the Registrant is a shell company (as defined in Rule 12b-2 of the Exchange Act). Yes ☐ No
The aggregate market value of the voting and non-voting common equity held by non-affiliates of the Registrant, based on the closing price of the shares of common stock as of June 30, 2022 of $38.00 per share on the OTC Stock Market, was $
The number of shares of Registrant’s Common Stock outstanding as of March 15, 2023 was
DOCUMENTS INCORPORATED BY REFERENCE
Portions of CSB Bancorp Inc.’s Proxy Statement for the 2023 Annual Meeting of Shareholders are incorporated by reference in Part III of this Form 10-K.
Auditor Firm Id: |
Auditor Name: |
Auditor Location: |
PART I
ITEM 1. BUSINESS.
General
CSB Bancorp, Inc. (“CSB”), is a registered financial holding company under the Bank Holding Company Act of 1956, as amended, and was incorporated under the laws of the State of Ohio in 1991. The Commercial and Savings Bank of Millersburg, Ohio (the “Bank”), an Ohio banking corporation chartered in 1879, is a wholly owned subsidiary of CSB. The Bank is a member of the Federal Reserve System, and its deposits are insured up to the maximum amount provided by law by the Federal Deposit Insurance Corporation (“FDIC”). The primary regulators of the Bank are the Federal Reserve Board and the Ohio Division of Financial Institutions. CSB Investment Services, LLC, an Ohio limited liability company (“CSB Investment”), is a wholly owned subsidiary of CSB that is licensed to engage in the business of insurance in the State of Ohio. In this Annual Report on Form 10-K, CSB and its subsidiaries are sometimes collectively referred to as the “Company.”
Cautionary Statement Regarding Forward-Looking Information
Certain statements contained in this Annual Report on Form 10-K, which are not statements of historical fact, constitute forward-looking statements within the meaning of the Private Securities Litigation Reform Act of 1995. Words such as “anticipate”, “estimates”, “may”, “feels”, “expects”, “believes”, “plans”, “will”, “would”, “should”, “could” and similar expressions are intended to identify these forward-looking statements but are not the exclusive means of identifying such statements. Examples of forward-looking statements include: (i) projections of income or expense, earnings per share, the payment or non-payment of dividends, capital structure, and other financial items; (ii) statements of plans and objectives of the Company and of its management or Board of Directors, including those relating to products or services; (iii) statements of future economic performance; and (iv) statements of assumptions underlying such statements. Forward-looking statements are subject to risks and uncertainties that may cause actual results to differ materially.
Other factors not currently anticipated may also materially and adversely affect the Company’s business, financial condition, results of operations, or cash flows. There can be no assurance that future results will meet expectations. While the Company believes that the forward-looking statements in this Annual Report on Form 10-K are reasonable, the reader should not place undue reliance on any forward-looking statement. In addition, these statements speak only as of the date made. The Company does not undertake, and expressly disclaims, any obligation to update or alter any statements whether as a result of new information, future events, or otherwise, except as may be required by applicable law.
The Private Securities Litigation Reform Act of 1995 provides a “safe harbor” for forward-looking statements to encourage companies to provide prospective information so long as those statements are identified as forward-looking and are accompanied by meaningful cautionary statements identifying important factors that could cause actual results to differ materially from those discussed in the forward-looking statements. The Company desires to take advantage of the “safe harbor” provisions of the Private Securities Litigation Reform Act of 1995.
Business Overview and Lending Activities
CSB operates primarily through the Bank and CSB Investment Services, LLC, providing a wide range of banking, trust, financial, and brokerage services to corporate, institutional, and individual customers throughout northeast Ohio. The Bank provides retail and commercial banking services to its customers, including checking and savings accounts, time deposits, IRAs, safe deposit facilities, personal loans, commercial loans, real estate mortgage loans, installment loans, night depository facilities, brokerage, and trust services.
The Bank provides residential real estate, commercial real estate, commercial, and consumer loans to customers located primarily in Holmes, Stark, Tuscarawas, Wayne, and portions of surrounding counties in Ohio. The Bank’s market area has historically exhibited relatively stable economic conditions. Economic activity slowed slightly in the fourth quarter of 2022 after growing modestly earlier in the year. Continued inflationary pressure led to households spending on necessities as opposed to discretionary items. Higher interest rates and increasing borrowing costs are also contributing to a slowing in loan demand. Reported unemployment levels in December 2022 ranged from 2.9% to 4.0% in the four primary counties served by the Bank. These levels increased from December 2021 in all four counties served by the Bank. Labor demand increased moderately in some sectors while wage pressures have eased somewhat over the past year. The local housing market continues to be strong with low inventory levels keeping home prices from declining. Construction costs remain high and higher interest rates have also contributed to slowing construction activity.
Certain risks are involved in providing loans, including, but not limited to, the borrowers’ ability and willingness to repay the debt. Before the Bank extends a new loan or renews an existing loan to a customer, these risks are assessed through a review of the borrower’s past and current credit history, the collateral being used to secure the transaction, if any, and other factors. For all commercial loan relationships greater than $500,000 the Bank’s internal credit department performs an annual risk rating review. In addition to this review, an independent, outside loan review firm is engaged to review a sample of watch list and adversely classified credits over $500,000 and a sample of commercial loan relationships greater than $1,000,000. The outside loan review will also assess management’s current credit grades and provide commentary with regard to assigned ratings and the need for a credit to be classified as a troubled debt restructuring, as well as assess management’s specific loan loss reserves for loans included in their sample that are considered to be impaired. In addition, any loan over $100,000 identified as a problem credit by management and/or the external loan review consultants is assigned to the Bank’s “loan watch list,” has a written action plan created specifically for the loan relationship and is subject to ongoing review at least quarterly by the Bank’s credit department and the assigned loan officer to ensure appropriate action is taken if deterioration continues.
2
Commercial loan rates are variable and fixed and include operating lines of credit and term loans made to businesses, primarily based on their ability to repay the loan from the cash flow of the business. Business assets such as equipment, accounts receivable, and inventory typically secure such loans. When the borrower is not an individual, the Bank generally obtains the personal guarantee of the business owner. These loans typically involve larger loan balances, are generally dependent on the cash flow of the business, and thus may be subject to a greater extent to adverse conditions in the general economy or in a specific industry. Management reviews the borrower’s cash flows when deciding whether to grant the credit in order to evaluate whether estimated future cash flows will be adequate to service principal and interest of the new obligation in addition to existing obligations.
Commercial real estate loans are primarily secured by borrower-occupied business real estate and are dependent on the ability of the related business to generate adequate cash flow to service the debt. Commercial real estate loans are generally originated with a loan-to-value ratio of 80% of the lower of cost or appraised value. Commercial construction loans are secured by commercial real estate and in most cases the Bank also provides the permanent financing. The Bank monitors advances and the maximum loan to value ratio is typically limited to the lesser of 80% of cost or appraised value. Management performs much of the same analysis when deciding whether to grant a commercial real estate loan as when deciding whether to grant a commercial loan.
Residential real estate loans carry both fixed and variable rates and are secured by the borrower’s residence. Such loans are made based on the borrower’s ability to make repayment from employment and other income. Management assesses the borrower’s ability and willingness to repay the debt through review of credit history and ratings, verification of employment and other income, review of debt-to-income ratios, and other measures of repayment ability. The Bank generally makes these loans in amounts of 80% or less of the value of the collateral or up to 95% of collateral value with private mortgage insurance. An appraisal from a qualified real estate appraiser or an evaluation based on comparable market values is obtained for substantially all loans secured by real estate. Residential construction loans are secured by residential real estate that generally will be occupied by the borrower upon completion. The Bank usually makes the permanent loan at the end of the construction phase. Generally, construction loans are made in amounts of 80% or less of the value of the as-completed collateral.
Home equity lines of credit are made to individuals and are secured by second or first mortgages on the borrower’s residence. Loans are based on similar credit and appraisal criteria used for residential real estate loans; however, loans up to 90% of the value of the property may be approved for borrowers with excellent credit histories. These loans typically bear interest at variable rates and require minimum monthly payments of the accrued interest.
Installment loans to individuals include unsecured loans and loans secured by recreational vehicles (“RV’s”), automobiles, and other consumer assets. Consumer loans for the purchase of new RV’s and new automobiles generally do not exceed 125% of Dealer Invoice on RV’s or 110% of the Manufacturer’s Suggested Retail Price (MSRP) of an automobile. Loans for used RV’s and automobiles do not exceed 120% of the “clean trade-in value” as reported in the current “J.D. Power” used guides. Overdraft protection loans are unsecured personal lines of credit to individuals who have demonstrated good credit character with reasonably assured sources of income and satisfactory credit histories. Consumer loans generally involve more risk than residential mortgage loans because of the type and nature of collateral and, in certain types of consumer loans, absence of collateral. Since these loans are generally repaid from ordinary income of the individual or family unit, repayment may be adversely affected by job loss, divorce, ill health, or by a general decline in economic conditions. The Bank assesses the borrower’s ability and willingness to repay through a review of credit history, credit ratings, debt-to-income ratios, and other measures of repayment ability.
While CSB’s chief decision-makers monitor the revenue streams of the various financial products and services, operations are managed, and financial performance is evaluated on a Company-wide basis. Accordingly, all of the Company’s banking operations are considered by management to be aggregated in one reportable operating segment. For a discussion of the Company’s financial performance for the fiscal year ended December 31, 2022, see the Consolidated Financial Statements and Notes to the Consolidated Financial Statements found in Item 8 of this Annual Report on Form 10-K.
Employees
On December 31, 2022, the Company had 183 employees, 154 of which were employed on a full-time basis. CSB has no separate employees not also employed by the Bank. No employees are covered by collective bargaining agreements. Employees are provided benefit programs, some of which are contributory. Management considers its employee relations to be good.
Competition
The financial services industry is highly competitive. In its primary market area of Holmes, Stark, Tuscarawas, Wayne and surrounding Ohio counties, the Bank competes for new deposit dollars and loans with other commercial banks, including both large regional banks and smaller community banks, as well as savings and loan associations, credit unions, finance companies, insurance companies, brokerage firms, investment companies, private lenders, and technology-based providers of financial services (sometimes referred to as “fintech” companies).
Competition within the financial service industry continues to increase as a result of mergers between, and expansion of, financial service providers within and outside of the Company’s primary market areas. In addition, securities firms and insurance companies that have elected to become financial holding companies may acquire commercial banks and other financial institutions, which can create additional competitive pressure.
3
Management believes the primary factors in competing for loans and deposits are interest rates, availability of services, quality of customer service, convenience, and name recognition. Some of the Company’s competitors may have greater resources and as such, higher lending limits, or fewer regulatory constraints and lower cost structures, all of which may adversely affect the Company’s ability to compete.
Investor Relations
The Company’s website address is www.csb1.com. The Company makes available its Annual Report on Form 10-K, Quarterly Reports on Form 10-Q, Current Reports on Form 8-K, and all amendments to those reports, free of charge on its website as soon as reasonably practicable after such material is electronically filed with the Securities and Exchange Commission (the “SEC”). The Company also makes available through its website, other reports filed with the SEC under the Securities Exchange Act of 1934, as amended (the “Exchange Act”), including its proxy statements and reports filed by officers and directors under Section 16(a) of the Exchange Act, as well as the Company’s Code of Ethics. References to our website in this Annual Report on Form 10-K are provided as a convenience and do not constitute, and should not be deemed, an incorporation by reference of the information contained on, or available through, the website, and such information should not be considered part of this Annual Report on Form 10-K.
In addition, the Company’s filings are available on the SEC’s website at www.sec.gov free of charge as soon as reasonably practicable after the Company has filed the above referenced reports.
Supervision and Regulation of CSB and the Bank
CSB and the Bank are subject to extensive regulation by federal and state regulatory agencies. The regulation of financial holding companies and their subsidiaries by bank regulatory agencies is intended primarily for the protection of consumers, depositors, borrowers, the deposit insurance funds of the FDIC (the “DIF”), and the banking system as a whole and not for the protection of shareholders.
CSB is a bank holding company that has registered with the Federal Reserve Board (“FRB”) as a financial holding company under the Bank Holding Company Act of 1956, as amended (the “BHC Act”). Pursuant to the Gramm-Leach-Bliley Act of 1999 (“GLBA”), a qualifying bank holding company may elect to become a financial holding company and thereby affiliate with securities firms and insurance companies and engage in other activities that are financial in nature and not otherwise permissible for a bank holding company, if: (i) the holding company is "well managed" and "well capitalized" and (ii) each of its subsidiary banks (a) is well capitalized under the Federal Deposit Insurance Corporation Act of 1991 prompt corrective action provisions, (b) is well managed, and (c) has at least a "satisfactory" rating under the Community Reinvestment Act (the “CRA”). CSB has been a financial holding company since 2005. No regulatory approval is required for a financial holding company to acquire a company, other than a bank or savings association, engaged in activities that are financial in nature or incidental to activities that are financial in nature, as determined by the FRB. The financial holding company and its subsidiaries must continue to meet the above-described requirements in order to continue to engage in activities that are financial in nature without being subjected to regulatory action or restriction, which could include divestiture of the subsidiary or subsidiaries.
GLBA defines “financial in nature” to include securities underwriting, dealing, and market making; sponsoring mutual funds and investment companies; insurance underwriting and agency; merchant banking; and activities that the FRB has determined to be closely related to banking. CSB is also subject to the disclosure and regulatory requirements of the Securities Act of 1933, as amended, the Exchange Act, and the regulations rules and regulations promulgated thereunder, as administered by the SEC.
The Bank, as an Ohio state-chartered bank and member of the Federal Reserve System, is subject to regulation, supervision, and examination by the Ohio Division of Financial Institutions and the FRB. Because the FDIC insures its deposits, the Bank is also subject to certain FDIC regulations. The FDIC is an independent federal agency which insures the deposits, up to prescribed statutory limits, of federally insured banks and savings associations, and safeguards the safety and soundness of the financial institution industry. The Bank’s deposits are insured up to applicable limits by the DIF, and the Bank is subject to deposit insurance assessments to maintain the DIF. In addition, the Bank is subject to regulations promulgated by the Consumer Financial Protection Bureau (the “CFPB”), which was established by the Dodd-Frank Wall Street Reform and Consumer Protection Act of 2010, as amended (the “Dodd-Frank Act”).
The earnings, dividends, and other aspects of the operations and activities of CSB and the Bank are affected by state and federal laws and regulations, and by policies of various regulatory authorities. These policies include, for example, statutory maximum lending rates, requirements on maintenance of reserves against deposits, domestic monetary policies of the FRB, United States fiscal and economic policies, international currency regulations, and monetary policies, certain restrictions on relationships with many phases of the securities business, and capital adequacy, and liquidity restraints.
The following information describes selected federal and state statutory and regulatory provisions that have, or could have, a material impact on the Company’s business. This discussion is qualified in its entirety by reference to the full text of the particular statutory or regulatory provisions contained or referenced herein.
Regulation of Bank Holding Companies
As a financial holding company, CSB’s activities are subject to regulation by the FRB. CSB is subject to regular examinations by the FRB and is required to file reports and such additional information as the FRB may require.
The FRB has extensive enforcement authority over bank holding companies, including the ability to assess civil money penalties, issue cease and desist orders, and require that a bank holding company divest subsidiaries (including subsidiary banks). The FRB may initiate enforcement
4
actions for violations of laws and regulations, and for unsafe and unsound practices. Under FRB policies, a bank holding company is expected to act as a “source of strength” to its subsidiary banks and to commit resources to support those subsidiary banks. Under this policy, the FRB may require a bank holding company to contribute additional capital to an undercapitalized subsidiary bank.
The BHC Act requires the prior approval of the FRB in cases where a bank holding company proposes to acquire direct or indirect ownership or control of more than 5% of the voting shares of any bank that is not already majority-owned by it, acquire all or substantially all of the assets of another bank or another financial or bank holding company, or merge or consolidate with any other financial or bank holding company.
Economic Growth, Regulatory Relief and Consumer Protection Act
On May 25, 2018, the Economic Growth, Regulatory Relief and Consumer Protection Act (the “Regulatory Relief Act”) was signed into law. The Regulatory Relief Act repealed or modified certain provisions of the Dodd-Frank Act and eased regulations on all but the largest banks (those with consolidated assets in excess of $250 billion). Bank holding companies with consolidated assets of less than $100 billion, including CSB, are no longer subject to enhanced prudential standards. The Regulatory Relief Act also relieves bank holding companies and banks with consolidated assets of less than $100 billion, including CSB, from certain record-keeping, reporting and disclosure requirements. Certain other regulatory requirements applied only to banks with assets in excess of $50 billion and so did not apply to CSB even before the enactment of the Regulatory Relief Act.
Current Expected Credit Loss Model
In December 2019, the federal banking agencies issued a final rule to address regulatory treatment of credit loss allowances under the current expected loss (‘CECL”) models. The rule revised the federal banking agencies’ regulatory capital rules to identify which credit loss allowances under the CECL model are eligible for inclusion in regulatory capital and to provide banking organizations the option to phase in over three years the day-one adverse effects on regulatory capital that may result from the adoption of the CECL model. Concurrent with the enactment of the Coronavirus Aid, Relief, and Economic Security Act of 2020, as amended, federal banking agencies issued an interim final rule that delayed the estimated impact on regulatory capital resulting from the adoption of CECL. The interim final rule provided banking organizations that implemented CECL prior to the end of 2020 the option to delay for two years the estimated impact of CECL on regulatory capital relative to regulatory capital determined under the prior incurred loss methodology, followed by a three-year transition period to phase out the aggregate amount of capital benefit provided during the initial two-year delay. On August 26, 2020, the federal banking agencies issued a final rule that made certain technical changes to the interim final rule, including expanding the pool of eligible institutions. The bank is required to adopt the CECL model after January 1, 2023, since it is a smaller reporting company.
Regulatory Capital
The FRB adopted risk-based capital guidelines for bank holding companies and state member banks, designed to absorb losses. The guidelines provide a systematic analytical framework, which makes regulatory capital requirements sensitive to differences in risk profiles among banking organizations, takes off-balance sheet exposures expressly into account in evaluating capital adequacy and incentivizes holding liquid, low-risk assets. Capital levels as measured by these standards are also used to categorize financial institutions for purposes of certain Prompt Corrective Action regulatory provisions.
In July 2013, the United States banking regulators issued new capital rules applicable to smaller banking organizations which also implement certain of the provisions of the Dodd-Frank Act (the “Basel III Capital Rules”). Community banking organizations, including CSB, began transitioning to the new rules on January 1, 2015. The new minimum capital requirements became effective on January 1, 2015; while a new capital conservation buffer and deductions from common equity capital phased in from January 1, 2016 through January 1, 2019, and most deductions from common equity tier 1 capital phased in from January 1, 2015 through January 1, 2019.
The Basel III Capital Rules include (i) a minimum common equity tier 1 capital ratio of 4.5%, (ii) a minimum tier 1 capital ratio of 6.0%, (iii) a minimum total capital ratio of 8.0%, and (iv) a minimum leverage ratio of 4.0%.
Common equity for the common equity tier 1 capital ratio includes common stock (plus related surplus) and retained earnings, plus limited amounts of minority interests in the form of common stock, less the majority of certain regulatory deductions.
Tier 1 capital includes common equity as defined for the common equity tier 1 capital ratio, plus certain non-cumulative preferred stock and related surplus, cumulative preferred stock and related surplus, and trust preferred securities that have been grandfathered (but which are not permitted going forward), and limited amounts of minority interests in the form of additional tier 1 capital instruments, less certain deductions.
Tier 2 capital, which can be included in the total capital ratio, includes certain capital instruments (such as subordinated debt) and limited amounts of the allowance for loan and lease losses, subject to new eligibility criteria, less applicable deductions.
The deductions from common equity tier 1 capital include goodwill and other intangibles, certain deferred tax assets, mortgage-servicing assets above certain levels, gains on sale in connection with a securitization, investments in a banking organization’s own capital instruments, and investments in the capital of unconsolidated financial institutions (above certain levels).
5
Under the guidelines, capital is compared to the relative risk related to the balance sheet. To derive the risk included in the balance sheet, one of several risk weights is applied to different balance sheet and off-balance sheet assets, primarily based on the relative credit risk of the counterparty. The capital amounts and classification are also subject to qualitative judgments by the regulators about components, risk weightings, and other factors.
The Basel III Capital Rules place restrictions on the payment of capital distributions, including dividends, and certain discretionary bonus payments to executive officers in the event the Company does not hold a capital conservation buffer of greater than 2.5% composed of common equity tier 1 capital above its minimum risk-based capital requirements, or if its eligible retained income is negative in that quarter and its capital conservation buffer ratio was less than 2.5% at the beginning of the quarter. Pursuant to the FRB’s Small Bank Holding Company Policy statement (“SBHC Policy”), as amended in September 2018, a bank holding company with assets of less than $3 billion and meeting certain other requirements is not required to comply with the consolidated capital requirements until such company exceeds $3 billion in assets or is otherwise determined by the FRB not to qualify as a small bank holding company. On December 31, 2022, CSB was deemed to be a small bank holding company under the SBHC Policy and was not required to comply with the FRB’s regulatory capital requirements. The Bank, however, must comply with the new capital requirements.
The implementation of the Basel III Capital Rules did not have a material impact on CSB’s or the Bank’s capital ratios.
Prompt Corrective Action
The federal banking agencies have established a system of “prompt corrective action” to resolve certain of the problems of undercapitalized institutions. This system is based on five capital level categories for insured depository institutions: “well capitalized,” “adequately capitalized,” “undercapitalized,” “significantly undercapitalized”, and “critically undercapitalized.”
The federal banking agencies may (or in some cases must) take certain supervisory actions depending upon a bank’s capital level. For example, the banking agencies must appoint a receiver or conservator for a bank within 90 days after it becomes “critically undercapitalized” unless the bank’s primary regulator determines, with the concurrence of the FDIC, that other action would better achieve regulatory purposes. Banking operations otherwise may be significantly affected depending on a bank’s capital category. For example, a bank that is not “well capitalized” generally is prohibited from accepting brokered deposits and offering interest rates on deposits higher than the prevailing rate in its market, and the holding company of any undercapitalized depository institution must guarantee, in part, specific aspects of the bank’s capital plan for the plan to be acceptable.
In order to be “well-capitalized,” a bank must have a minimum common equity tier 1 capital ratio of 6.5%, a total risk-based capital ratio of at least 10.0%, a tier 1 risk-based capital ratio of at least 8.0%, and a leverage ratio of at least 5.0%, and the bank must not be subject to any written agreement, order, capital directive, or prompt corrective action directive to meet and maintain a specific capital level for any capital measure.
As of December 31, 2022, the Bank met the ratio requirements in effect at that date to be deemed “well-capitalized.” See Note 12 – Regulatory Matters of the Notes to Consolidated Financial Statements, located in Item 8 Financial Statements and Supplementary Data of this 10-K. Management of the Company believes the Bank also meets the capital requirements to be deemed “well-capitalized” under the new guidelines.
Deposit Insurance
Substantially all of the deposits of the Bank are insured up to applicable limits by the DIF, and the Bank is assessed quarterly deposit insurance premiums to maintain the DIF. Insurance premiums for each insured institution are determined based upon the institution’s capital level and supervisory rating provided to the FDIC by the institution’s primary federal regulator and other information deemed by the FDIC to be relevant to the risk posed to the Deposit Insurance Fund by the institution. The assessment rate is then applied to the amount of the institution’s assessment base to determine the institution’s insurance premium. The deposit insurance assessment base is calculated on average assets less average tangible equity.
The FDIC assesses a quarterly deposit insurance premium on each insured institution based on risk characteristics of the insured institution and may also impose special assessments in emergency situations. The premiums fund the DIF. Pursuant to the Dodd-Frank Act, the FDIC has established reserve ratios. On June 30, 2019, the reserve ratios were met and the FDIC applied credits for banks with assets of less than $10 billion ("small bank credits") beginning September 30, 2019 through the June 2020 premium payment. The FDIC rules further changed the method of determining risk-based assessment rates for established banks with less than $10 billion in assets to better ensure that banks taking on greater risks pay more for deposit insurance than banks that take on less risk.
6
As insurer, the FDIC is authorized to conduct examinations of, and to require reporting by, federally insured institutions. It also may prohibit any federally insured institution from engaging in any activity the FDIC determines by regulation or order to pose a serious threat to the Deposit Insurance Fund. The FDIC also has the authority to take enforcement actions against insured institutions. Insurance of deposits may be terminated by the FDIC upon a finding that the institution has engaged or is engaging in unsafe and unsound practices, is in an unsafe or unsound condition to continue operations, or has violated any applicable law, regulation, rule, order, or condition imposed by the FDIC or written agreement entered into with the FDIC.
The management of the Bank does not know of any practice, condition, or violation that might lead to termination of deposit insurance.
Limits on Dividends and Other Payments
There are various legal limitations on the extent to which subsidiary banks may finance or otherwise supply funds to their parent holding of credit to, or investments in the securities of, their bank holding companies. Subsidiary banks are also subject to collateral security requirements for any loan or extension of credit permitted by such exceptions.
Payments of dividends by the Bank are limited by applicable state and federal laws and regulations. The ability of CSB to obtain funds for the payment of dividends and for other cash requirements is largely dependent on the amount of dividends that may be declared by the Bank. However, the FRB expects CSB to serve as a source of strength for the Bank and may require CSB to retain capital for further investment in the Bank, rather than pay dividends to CSB shareholders. Payment of dividends by the Bank may be restricted at any time at the discretion of its applicable regulatory authorities if they deem such dividends to constitute an unsafe or unsound banking practice. These provisions could have the effect of limiting CSB’s ability to pay dividends on its common shares.
FRB policy requires CSB to provide notice to the FRB in advance of the payment of a dividend to CSB’s shareholders under certain circumstances and states that insured banks and bank holding companies should generally only pay dividends out of current operating earnings. Additionally, The Ohio Revised Code, restricts the amount a Bank can dividend if the total amount of all dividends, including the proposed dividend, declared by the Bank in any calendar year exceeds the total of its retained net income of that year to date, combined with its retained net income of the two preceding years, unless the dividend is approved by the Ohio Division of Financial Institutions.
Consumer Protection Laws and Regulations
Banks are subject to regular examination to ensure compliance with federal statutes and regulations applicable to their business, including consumer protection statutes and implementing regulations. The Dodd-Frank Act established the CFPB, which has extensive regulatory and enforcement powers over consumer financial products and services. The CFPB has adopted numerous rules with respect to consumer protection laws, amending some existing regulations and adopting new ones, and has commenced enforcement actions. The following are just some of the consumer protection laws applicable to the Bank:
The banking regulators also use their authority under the Federal Trade Commission Act to take supervisory or enforcement action with respect to unfair or deceptive acts or practices by banks that may not necessarily fall within the scope of specific banking or consumer finance law.
Customer Privacy
Under the GLBA, federal banking agencies have adopted rules that limit the ability of banks and other financial institutions to disclose non-public information about consumers to nonaffiliated third parties. These limitations require distribution of privacy policies to consumers and, in some circumstances, allow consumers to prevent disclosure of certain personal information to nonaffiliated third parties.
USA Patriot Act
The Uniting and Strengthening America by Providing Appropriate Tools Required to Intercept and Obstruct Terrorism Act of 2001, as amended (the “Patriot Act”), and related regulations require regulated financial institutions to establish a program specifying procedures for obtaining
7
identifying information from customers seeking to open new accounts and establish enhanced due diligence policies, procedures and controls designed to detect and report suspicious activity.
The Bank has established policies and procedures to be compliant with the requirements of the Patriot Act.
Office of Foreign Assets Control Regulation
The United States Treasury Department’s Office of Foreign Assets Control (“OFAC”) administers and enforces economic and trade sanctions against targeted foreign countries and regimes, under authority of various laws, including designated foreign countries, nationals and others. OFAC publishes lists of specially designated targets and countries. CSB is responsible for, among other things, blocking accounts of, and transactions with, such targets and countries, prohibiting unlicensed trade and financial transactions with them and reporting blocked transactions after their occurrence. Failure to comply with these sanctions could have serious financial, legal and reputational consequences, including causing applicable bank regulatory authorities not to approve merger or acquisition transactions when regulatory approval is required or to prohibit such transactions even if approval is not required. Regulatory authorities have imposed cease and desist orders and civil money penalties against institutions found to be violating these obligations.
Cybersecurity
In March 2015, federal regulators issued two related statements regarding cybersecurity. One statement indicates that financial institutions should design multiple layers of security controls to establish several lines of defense and to ensure that their risk management processes also address the risk posed by compromised customer credentials, including security measures to reliably authenticate customers accessing Internet-based services of the financial institution. The other statement indicates that a financial institution’s management is expected to maintain sufficient business continuity planning processes to ensure the rapid recovery, resumption, and maintenance of the financial institution’s operations after a cyber-attack involving destructive malware. A financial institution is also expected to develop appropriate processes to enable recovery of data and business operations and address rebuilding network capabilities and restoring data if the financial institution or its critical service providers fall victim to this type of cyber-attack. If CSB fails to observe the regulatory guidance, it could be subject to various regulatory sanctions, including financial penalties.
In February 2018, the SEC published interpretive guidance to assist public companies in preparing disclosures about cybersecurity risks and incidents. These SEC guidelines, and any other regulatory guidance, are in addition to notification and disclosure requirements under state and federal banking law and regulations.
In November 2021, federal banking agencies issued a final rule that became effective in May 2022 requiring banking organizations that experience a cybersecurity incident to notify certain entities. A cybersecurity incident occurs when actual or potential harm to the confidentiality, integrity, or availability of information or an information system occurs, or there is a violation or imminent threat of a violation to banking security policies and procedures. The affected bank must notify its respective federal regulator of the cybersecurity incident as soon as possible and no later than 36 hours after the bank determines a cybersecurity incident that rises to the level of a notification incident has occurred. These notifications are intended to promote early awareness of threats to banking organizations and will help banks react to those threats before they manifest into larger incidents. This rule also requires bank service providers to notify their bank organization customers of a cybersecurity incident that has caused, or is reasonably likely to cause, a material service disruption or degradation for four or more hours.
Furthermore, once final rules are adopted, the Cyber Incident Reporting for Critical Infrastructure Act, enacted in March 2022, will require certain covered entities to report a covered cyber incident to the U.S. Department of Homeland Security’s Cybersecurity & Infrastructure Security Agency (“CISA”) within 72 hours after it reasonably believes an incident has occurred. Separate reporting to CISA will also be required within 24 hours, if a ransom payment is made as a result of a ransomware attack.
State regulators have also been increasingly active in implementing privacy and cybersecurity standards and regulations. Recently, several states have adopted regulations requiring certain financial institutions to implement cybersecurity programs and providing detailed requirements with respect to these programs, including data encryption requirements. Many states have also recently implemented or modified their data breach notification and data privacy requirements. CSB expects this trend of state-level activity in those areas to continue and is continually monitoring developments in the states in which our customers are located.
In the ordinary course of business, CSB relies on electronic communications and information systems to conduct its operations and to store sensitive data. CSB employs an in-depth, layered, defensive approach that leverages people, processes and technology to manage and maintain cybersecurity controls. CSB employs a variety of preventative and detective tools to monitor, block, and provide alerts regarding suspicious activity, as well as to report on any suspected advanced persistent threats. Notwithstanding the strength of CSB’s defensive measures, the threat from cyber-attacks is severe, attacks are sophisticated and increasing in volume, and attackers respond rapidly to changes in defensive measures. While to date, CSB has not detected a significant compromise, significant data loss or any material financial losses related to cybersecurity attacks, CSB’s systems and those of its customers and third-party service providers are under constant threat and it is possible that CSB could experience a significant event in the future. Risks and exposures related to cybersecurity attacks are expected to remain high for the foreseeable future due to the rapidly evolving nature and sophistication of these threats, as well as due to the expanding use of internet banking, mobile banking and other technology-based products and services by us and our customers.
Effect of Environmental Regulation
Compliance with federal, state, and local provisions regulating the discharge of materials into the environment, or otherwise relating to the protection of the environment, has not had a material effect upon the capital expenditures, earnings, or competitive position of CSB or its subsidiaries. CSB believes the nature of the operations of its subsidiaries has little, if any, environmental impact. CSB, therefore, anticipates no material capital expenditures for environmental control facilities for its current fiscal year or for the foreseeable future.
8
CSB believes its primary exposure to environmental risk is through the lending activities of the Bank. In cases where management believes environmental risk potentially exists, the Bank mitigates environmental risk exposure by requiring environmental site assessments at the time of loan origination to confirm collateral quality as to commercial real estate parcels posing higher than normal potential for environmental impact, as determined by reference to present and past uses of the subject property and adjacent sites.
Executive and Incentive Compensation
Public companies will be required, once stock exchanges adopt additional listing requirements under the Dodd-Frank Act and rules adopted by the SEC in October 2022, to adopt and implement “clawback” procedures policies for incentive compensation payments and to disclose the details of the procedures which allow recovery of incentive compensation that was paid on the basis of erroneous financial information necessitating an accounting restatement due to material noncompliance with financial reporting requirements. This clawback policy is intended to apply to compensation paid within the three completed fiscal years immediately preceding the date the issuer is required to prepare a restatement a three-year look-back window of the restatement and would cover all executives (including former executives) who received incentive awards.
Future Legislation
Various and significant legislation affecting financial institutions and the financial industry is from time to time adopted by the U.S. Congress and state legislatures, and regulatory agencies frequently adopt or amend regulations. Such legislation and regulation may continue to change banking laws and regulations and the operating environment of CSB and its subsidiaries in substantial and unpredictable ways and could significantly increase or decrease costs of doing business, limit or expand permissible activities, or affect the competitive balance among financial institutions. The nature and extent of future legislative and regulatory changes affecting financial institutions remains very unpredictable.
Statistical Disclosures
The following schedules present, for the periods indicated, certain financial and statistical information of the Company as required under the SEC’s “Subpart 1400 of regulation S-K”, as amended on September 11, 2020, or a specific reference as to the location of required disclosures in Item 7 Management’s Discussion and Analysis of Financial Condition and Results of Operations (“MD&A”) or Item 8 Financial Statements and Supplementary Data of this Annual Report on Form 10-K.
Distribution of Assets, Liabilities, and Stockholders’ Equity; Interest Rates and Interest Differential
The information set forth under the heading, “Average Balance Sheets and Net Interest Margin Analysis” located in Item 7 MD&A is incorporated by reference herein.
The information set forth under the heading, “Rate/Volume Analysis of Changes in Income and Expense” located in Item 7 MD&A is incorporated by reference herein.
Investment Portfolio
The following is a schedule of maturities for each category of debt securities and the related weighted average yield of such securities as of December 31, 2022:
|
|
One Year or Less |
|
|
After One Year |
|
|
Maturing |
|
|
After Ten Years |
|
|
Total |
|
|
|||||||||||||||||||||||||
(Dollars in thousands) |
|
Amortized |
|
|
Yield |
|
|
Amortized |
|
|
Yield |
|
|
Amortized |
|
|
Yield |
|
|
Amortized |
|
|
Yield |
|
|
Amortized |
|
|
Yield |
|
|
||||||||||
Available-for-sale: |
|
|
|
|
|
|
|
|
|
|
|
|
|
|
|
|
|
|
|
|
|
|
|
|
|
|
|
|
|
|
|
||||||||||
U.S. Treasuries |
|
$ |
4,992 |
|
|
|
0.58 |
|
% |
$ |
18,202 |
|
|
|
2.02 |
|
% |
$ |
— |
|
|
|
— |
|
% |
$ |
— |
|
|
|
— |
|
% |
$ |
23,194 |
|
|
|
1.71 |
|
% |
U.S. Government agencies |
|
|
— |
|
|
|
— |
|
|
|
13,999 |
|
|
|
0.47 |
|
|
|
— |
|
|
|
— |
|
|
|
— |
|
|
|
— |
|
|
|
13,999 |
|
|
|
0.47 |
|
|
Mortgage-backed securities of |
|
|
1 |
|
|
|
3.94 |
|
|
|
973 |
|
|
|
2.63 |
|
|
|
7,468 |
|
|
|
2.77 |
|
|
|
69,235 |
|
|
|
2.10 |
|
|
|
77,677 |
|
|
|
2.18 |
|
|
Asset-backed securities of |
|
|
— |
|
|
|
— |
|
|
|
— |
|
|
|
— |
|
|
|
633 |
|
|
|
5.57 |
|
|
|
— |
|
|
|
— |
|
|
|
633 |
|
|
|
5.57 |
|
|
State and political subdivisions |
|
|
973 |
|
|
|
2.84 |
|
|
|
9,135 |
|
|
|
2.79 |
|
|
|
10,354 |
|
|
|
1.75 |
|
|
|
— |
|
|
|
— |
|
|
|
20,462 |
|
|
|
2.27 |
|
|
Corporate bonds |
|
|
— |
|
|
|
— |
|
|
|
22,265 |
|
|
|
2.77 |
|
|
|
6,475 |
|
|
|
3.71 |
|
|
|
— |
|
|
|
— |
|
|
|
28,740 |
|
|
|
2.98 |
|
|
Total |
|
$ |
5,966 |
|
|
|
0.95 |
|
% |
$ |
64,574 |
|
|
|
2.06 |
|
% |
$ |
24,930 |
|
|
|
2.66 |
|
% |
$ |
69,235 |
|
|
|
2.10 |
|
% |
$ |
164,705 |
|
|
|
2.13 |
|
% |
|
|
|
|
|
|
|
|
|
|
|
|
|
|
|
|
|
|
|
|
|
|
|
|
|
|
|
|
|
|
|
|
||||||||||
Held-to-maturity: |
|
|
|
|
|
|
|
|
|
|
|
|
|
|
|
|
|
|
|
|
|
|
|
|
|
|
|
|
|
|
|
||||||||||
U.S. Treasuries |
|
$ |
2,497 |
|
|
|
0.42 |
|
% |
$ |
7,412 |
|
|
|
0.99 |
|
% |
$ |
2,844 |
|
|
|
1.83 |
|
% |
$ |
— |
|
|
|
— |
|
% |
$ |
12,753 |
|
|
|
0.91 |
|
% |
Mortgage-backed securities of |
|
|
— |
|
|
|
— |
|
|
|
— |
|
|
|
— |
|
|
|
231 |
|
|
|
1.15 |
|
|
|
231,837 |
|
|
|
2.02 |
|
|
|
232,068 |
|
|
|
2.02 |
|
|
State and political subdivisions |
|
|
— |
|
|
|
— |
|
|
|
— |
|
|
|
— |
|
|
|
1,686 |
|
|
|
2.08 |
|
|
|
894 |
|
|
|
1.54 |
|
|
|
2,580 |
|
|
|
1.90 |
|
|
Total |
|
$ |
2,497 |
|
|
|
0.42 |
|
% |
$ |
7,412 |
|
|
|
0.99 |
|
% |
$ |
4,761 |
|
|
|
1.51 |
|
% |
$ |
232,731 |
|
|
|
2.02 |
|
% |
$ |
247,401 |
|
|
|
1.96 |
|
% |
The weighted average yields are calculated using amortized cost of investments and are based on coupon rates for securities purchased at par value, and on effective interest rates considering amortization or accretion if securities were purchased at a premium or discount. The weighted average yield on tax-exempt obligations is presented on a tax-equivalent basis based on the Company’s marginal federal income tax rate of 21%.
9
Loan Portfolio
The following is a schedule of maturities of loans based on contract terms and assuming no amortization or prepayments, as of December 31, 2022:
|
|
Maturing |
|
|||||||||||||||||
(Dollars in thousands) |
|
One Year |
|
|
One |
|
|
Five Through Fifteen Years |
|
|
After Fifteen |
|
|
Total |
|
|||||
Commercial |
|
$ |
55,120 |
|
|
$ |
49,638 |
|
|
$ |
22,265 |
|
|
$ |
2,320 |
|
|
$ |
129,343 |
|
Commercial real estate |
|
|
3,321 |
|
|
|
20,289 |
|
|
|
47,884 |
|
|
|
160,291 |
|
|
|
231,785 |
|
Residential real estate |
|
|
853 |
|
|
|
12,535 |
|
|
|
80,263 |
|
|
|
100,474 |
|
|
|
194,125 |
|
Construction & land development |
|
|
764 |
|
|
|
11,413 |
|
|
|
4,745 |
|
|
|
38,396 |
|
|
|
55,318 |
|
Consumer |
|
|
702 |
|
|
|
7,168 |
|
|
|
8,433 |
|
|
|
84 |
|
|
|
16,387 |
|
Total |
|
$ |
60,760 |
|
|
$ |
101,043 |
|
|
$ |
163,590 |
|
|
$ |
301,565 |
|
|
$ |
626,958 |
|
The following is a schedule of fixed rate and variable rate loans due after one year from December 31, 2022.
(Dollars in thousands) |
|
Fixed Rate |
|
|
Variable Rate |
|
||
Commercial |
|
$ |
51,928 |
|
|
$ |
22,295 |
|
Commercial real estate |
|
|
3,016 |
|
|
|
225,448 |
|
Residential real estate |
|
|
49,380 |
|
|
|
143,892 |
|
Construction & land development |
|
|
7,847 |
|
|
|
46,707 |
|
Consumer |
|
|
15,061 |
|
|
|
624 |
|
For the year ended December 31, 2022, interest income recognized on impaired loans amounted to $50 thousand, while $73 thousand would have been recognized had the loans been performing under their contractual terms. For the year ended December 31, 2021, interest income recognized on impaired loans amounted to $147 thousand, while $265 thousand would have been recognized had the loans been performing under their contractual terms.
Impaired loans are comprised of commercial, commercial real estate, and residential real estate loans, and are carried at the present value of expected cash flows discounted at the loan’s effective interest rate or at fair value of the collateral if the loan is collateral dependent. A portion of the allowance for loan losses is allocated to impaired loans.
Smaller-balance homogeneous loans are evaluated for impairment in total. Such loans include residential first-mortgage loans secured by one to four-family residences, residential construction loans, automobile loans, home equity loans, and second-mortgage loans. These consumer loans are included in nonaccrual and past due disclosures above as well as impaired loans when they become nonperforming. Commercial loans and mortgage loans secured by other properties are evaluated individually for impairment. When analysis of borrower operating results and financial condition indicates that underlying cash flows of the borrower’s business are not adequate to meet its debt service requirements, the loan is evaluated for impairment. Impaired loans or portions thereof, are charged-off when deemed uncollectible.
On December 31, 2022, no loans were identified for which management had serious doubts about the borrowers’ ability to comply with present loan repayment terms that are not included in the tables set forth above. On a monthly basis, the Company internally classifies certain loans based on various factors. On December 31, 2022, these amounts, including impaired and nonperforming loans, amounted to $16 million of substandard loans and no doubtful loans.
As of December 31, 2022, there was one concentration of loans greater than 10% of total loans that is not otherwise disclosed as a category of loans in the loan portfolio table set forth above. Loans to lessors of non-residential buildings totaled $73 million, or 12% of total loans as of December 31, 2022.
Summary of Loan Loss Experience
The following schedule presents an analysis of net charge-offs (recoveries) to average loans, and related ratios for the years ended December 31:
|
2022 |
|
2021 |
||||||||||||||||||||||
(Dollars in thousands) |
Net (Charge-offs) Recoveries |
|
|
Average Loans |
|
|
Net (Charge-offs) Recoveries as a % of Average Loans |
|
|
|
Net (Charge-offs) Recoveries |
|
|
Average Loans |
|
|
Net (Charge-offs) Recoveries as a % of Average Loans |
|
|
||||||
Commercial |
$ |
(177 |
) |
|
$ |
129,916 |
|
|
|
-0.14 |
% |
|
|
$ |
(4 |
) |
|
$ |
148,512 |
|
|
|
0.00 |
% |
|
Commercial real estate |
|
(10 |
) |
|
|
200,174 |
|
|
|
0.00 |
% |
|
|
|
8 |
|
|
|
185,439 |
|
|
|
0.00 |
% |
|
Residential real estate |
|
3 |
|
|
|
180,740 |
|
|
|
0.00 |
% |
|
|
|
25 |
|
|
|
173,006 |
|
|
|
0.01 |
% |
|
Construction & land development |
|
312 |
|
|
|
61,034 |
|
|
|
0.51 |
% |
|
|
|
— |
|
|
|
38,695 |
|
|
|
0.00 |
% |
|
Consumer |
|
(13 |
) |
|
|
15,946 |
|
|
|
-0.08 |
% |
|
|
|
(30 |
) |
|
|
16,940 |
|
|
|
-0.18 |
% |
|
Total |
$ |
115 |
|
|
$ |
587,810 |
|
|
|
0.02 |
% |
|
|
$ |
(1 |
) |
|
$ |
562,592 |
|
|
|
0.00 |
% |
|
10
The allowance for loan losses balance and provision charged to expense are determined by management based on periodic reviews of the loan portfolio, past loan loss experience, economic conditions, and various other circumstances subject to change over time. In making this judgment, management reviews selected large loans, as well as impaired loans, other delinquent, nonaccrual and problem loans, and loans to industries experiencing economic difficulties. The collectability of these loans is evaluated after considering current operating results and financial position of the borrower, estimated market value of collateral, guarantees and the Company’s collateral position versus other creditors. Judgments, which are necessarily subjective, as to the probability of loss and amount of such loss are formed on these loans, as well as other loans taken together.
The following schedule is a breakdown of the allowance for loan losses allocated by type of loan and related ratios. While management’s periodic analysis of the adequacy of the allowance for loan losses may allocate portions of the allowance for specific problem-loan situations, the entire allowance is available for any loan charge-offs that occur.
|
Allocation of the Allowance for Loan Losses |
||||||||||||||||
|
(Dollars in thousands) |
||||||||||||||||
|
|
Allowance |
|
|
Percentage |
|
|
Allowance |
|
|
Percentage |
|
|
||||
|
|
December 31, 2022 |
|
|
December 31, 2021 |
|
|
||||||||||
Commercial |
|
$ |
1,110 |
|
|
|
20.6 |
|
% |
$ |
1,240 |
|
|
|
22.6 |
|
% |
Commercial real estate |
|
|
2,760 |
|
|
|
37.0 |
|
|
|
2,838 |
|
|
|
35.5 |
|
|
Residential real estate |
|
|
1,268 |
|
|
|
30.9 |
|
|
|
992 |
|
|
|
30.6 |
|
|
Construction & land development |
|
|
803 |
|
|
|
8.9 |
|
|
|
1,380 |
|
|
|
8.4 |
|
|
Consumer |
|
|
233 |
|
|
|
2.6 |
|
|
|
421 |
|
|
|
2.9 |
|
|
Unallocated |
|
|
664 |
|
|
|
|
|
|
747 |
|
|
|
|
|
||
Total |
|
$ |
6,838 |
|
|
|
100.0 |
|
% |
$ |
7,618 |
|
|
|
100.0 |
|
% |
Deposits
The following is a schedule of average deposit amounts and average rates paid on each category for the periods indicated:
|
|
Average Amounts Outstanding |
|
|
Average Rate Paid |
||||||||||||
(Dollars in thousands) |
|
2022 |
|
|
2021 |
|
|
2022 |
|
|
2021 |
|
|
||||
Noninterest-bearing demand |
|
$ |
337,759 |
|
|
$ |
304,351 |
|
|
N/A |
|
|
N/A |
|
|
||
Interest-bearing demand |
|
|
240,904 |
|
|
|
259,111 |
|
|
|
0.27 |
|
% |
|
0.12 |
|
% |
Savings deposits |
|
|
315,881 |
|
|
|
281,888 |
|
|
|
0.21 |
|
|
|
0.10 |
|
|
Time deposits |
|
|
118,085 |
|
|
|
123,659 |
|
|
|
0.86 |
|
|
|
1.04 |
|
|
Total deposits |
|
$ |
1,012,629 |
|
|
$ |
969,009 |
|
|
|
|
|
|
|
|
||
The Bank does not have any material deposits by foreign depositors. The total uninsured portion of all deposit accounts greater than $250 thousand was $267 million as of December 31, 2022, and $265 million as of December 31, 2021. The following is a schedule of maturities of time certificates of deposit in amounts greater than $250 thousand as of December 31, 2022:
(Dollars in thousands) |
|
|
|
|
Three months or less |
|
$ |
7,611 |
|
Over three through six months |
|
|
4,539 |
|
Over six through twelve months |
|
|
6,365 |
|
Over twelve months |
|
|
9,574 |
|
Total |
|
$ |
28,089 |
|
ITEM 1A. RISK FACTORS.
Not Applicable.
ITEM 1B. UNRESOLVED STAFF COMMENTS.
Not applicable.
11
ITEM 2. PROPERTIES.
The Bank operates sixteen banking centers as noted below:
|
|
|
|
|
|
|
|
|
|
|
|||
Location |
|
Address |
|
Owned |
|
Leased |
Walnut Creek |
|
4980 Old Pump Street, Walnut Creek, Ohio 44687 |
|
X |
|
|
Winesburg |
|
2225 U.S. 62, Winesburg, Ohio 44690 |
|
X |
|
|
Sugarcreek |
|
127 South Broadway, Sugarcreek, Ohio 44681 |
|
X |
|
|
Charm |
|
4440 C.R. 70, Charm, Ohio 44617 |
|
X |
|
|
Clinton Commons |
|
2102 Glen Drive, Millersburg, Ohio 44654 |
|
|
|
X |
Berlin |
|
4587 S.R. 39 Suite B, Berlin, Ohio 44610 |
|
|
|
X |
South Clay |
|
91 South Clay Street, Millersburg, Ohio 44654 |
|
X |
|
|
Shreve |
|
333 West South Street, Shreve, Ohio 44676 |
|
X |
|
|
Orrville |
|
119 West High Street, Orrville, Ohio 44667 |
|
X |
|
|
Gnadenhutten |
|
100 South Walnut Street, Gnadenhutten, Ohio 44629 |
|
X |
|
|
New Philadelphia |
|
635 West High Avenue, New Philadelphia, Ohio 44663 |
|
X |
|
|
North Canton |
|
600 South Main Street, North Canton, Ohio 44720 |
|
X |
|
|
Bolivar |
|
11113 Fairoaks Road NE, Bolivar, Ohio 44612 |
|
|
|
X |
Wooster |
|
350 East Liberty Street, Wooster, Ohio 44691 |
|
X |
|
|
Wooster |
|
3562 Commerce Parkway, Wooster, Ohio 44691 |
|
X |
|
|
Operations Center |
|
91 North Clay Street, Millersburg, Ohio 44654 |
|
X |
|
|
The Bank considers its physical properties to be in good operating condition and suitable for the purposes for which they are being used. All properties owned by the Bank are unencumbered by any mortgage or security interest and in management’s opinion, are adequately insured.
ITEM 3. LEGAL PROCEEDINGS.
In the normal course of business, CSB is subject to pending and threatened legal actions, including claims for which material relief or damages are sought. Although CSB is not able to predict the outcome of such actions, after reviewing pending and threatened actions, management believes that the outcome of any or all such actions will not have a material adverse effect on the results of operations, the financial position, or shareholders’ equity of CSB. Further, there are no material legal proceedings in which any director, executive officer, principal shareholder, or affiliate of CSB is a party or has a material interest that is adverse to CSB or the Bank.
ITEM 4. MINE SAFETY DISCLOSURES.
Not applicable.
12
PART II
ITEM 5. MARKET FOR REGISTRANT’ S COMMON EQUITY AND RELATED STOCKHOLDER MATTERS.
Information contained in the section captioned “Common Stock and Shareholder Information” included in Item 7. Management’s Discussion and Analysis of Financial Condition and Results of Operations is incorporated herein by reference.
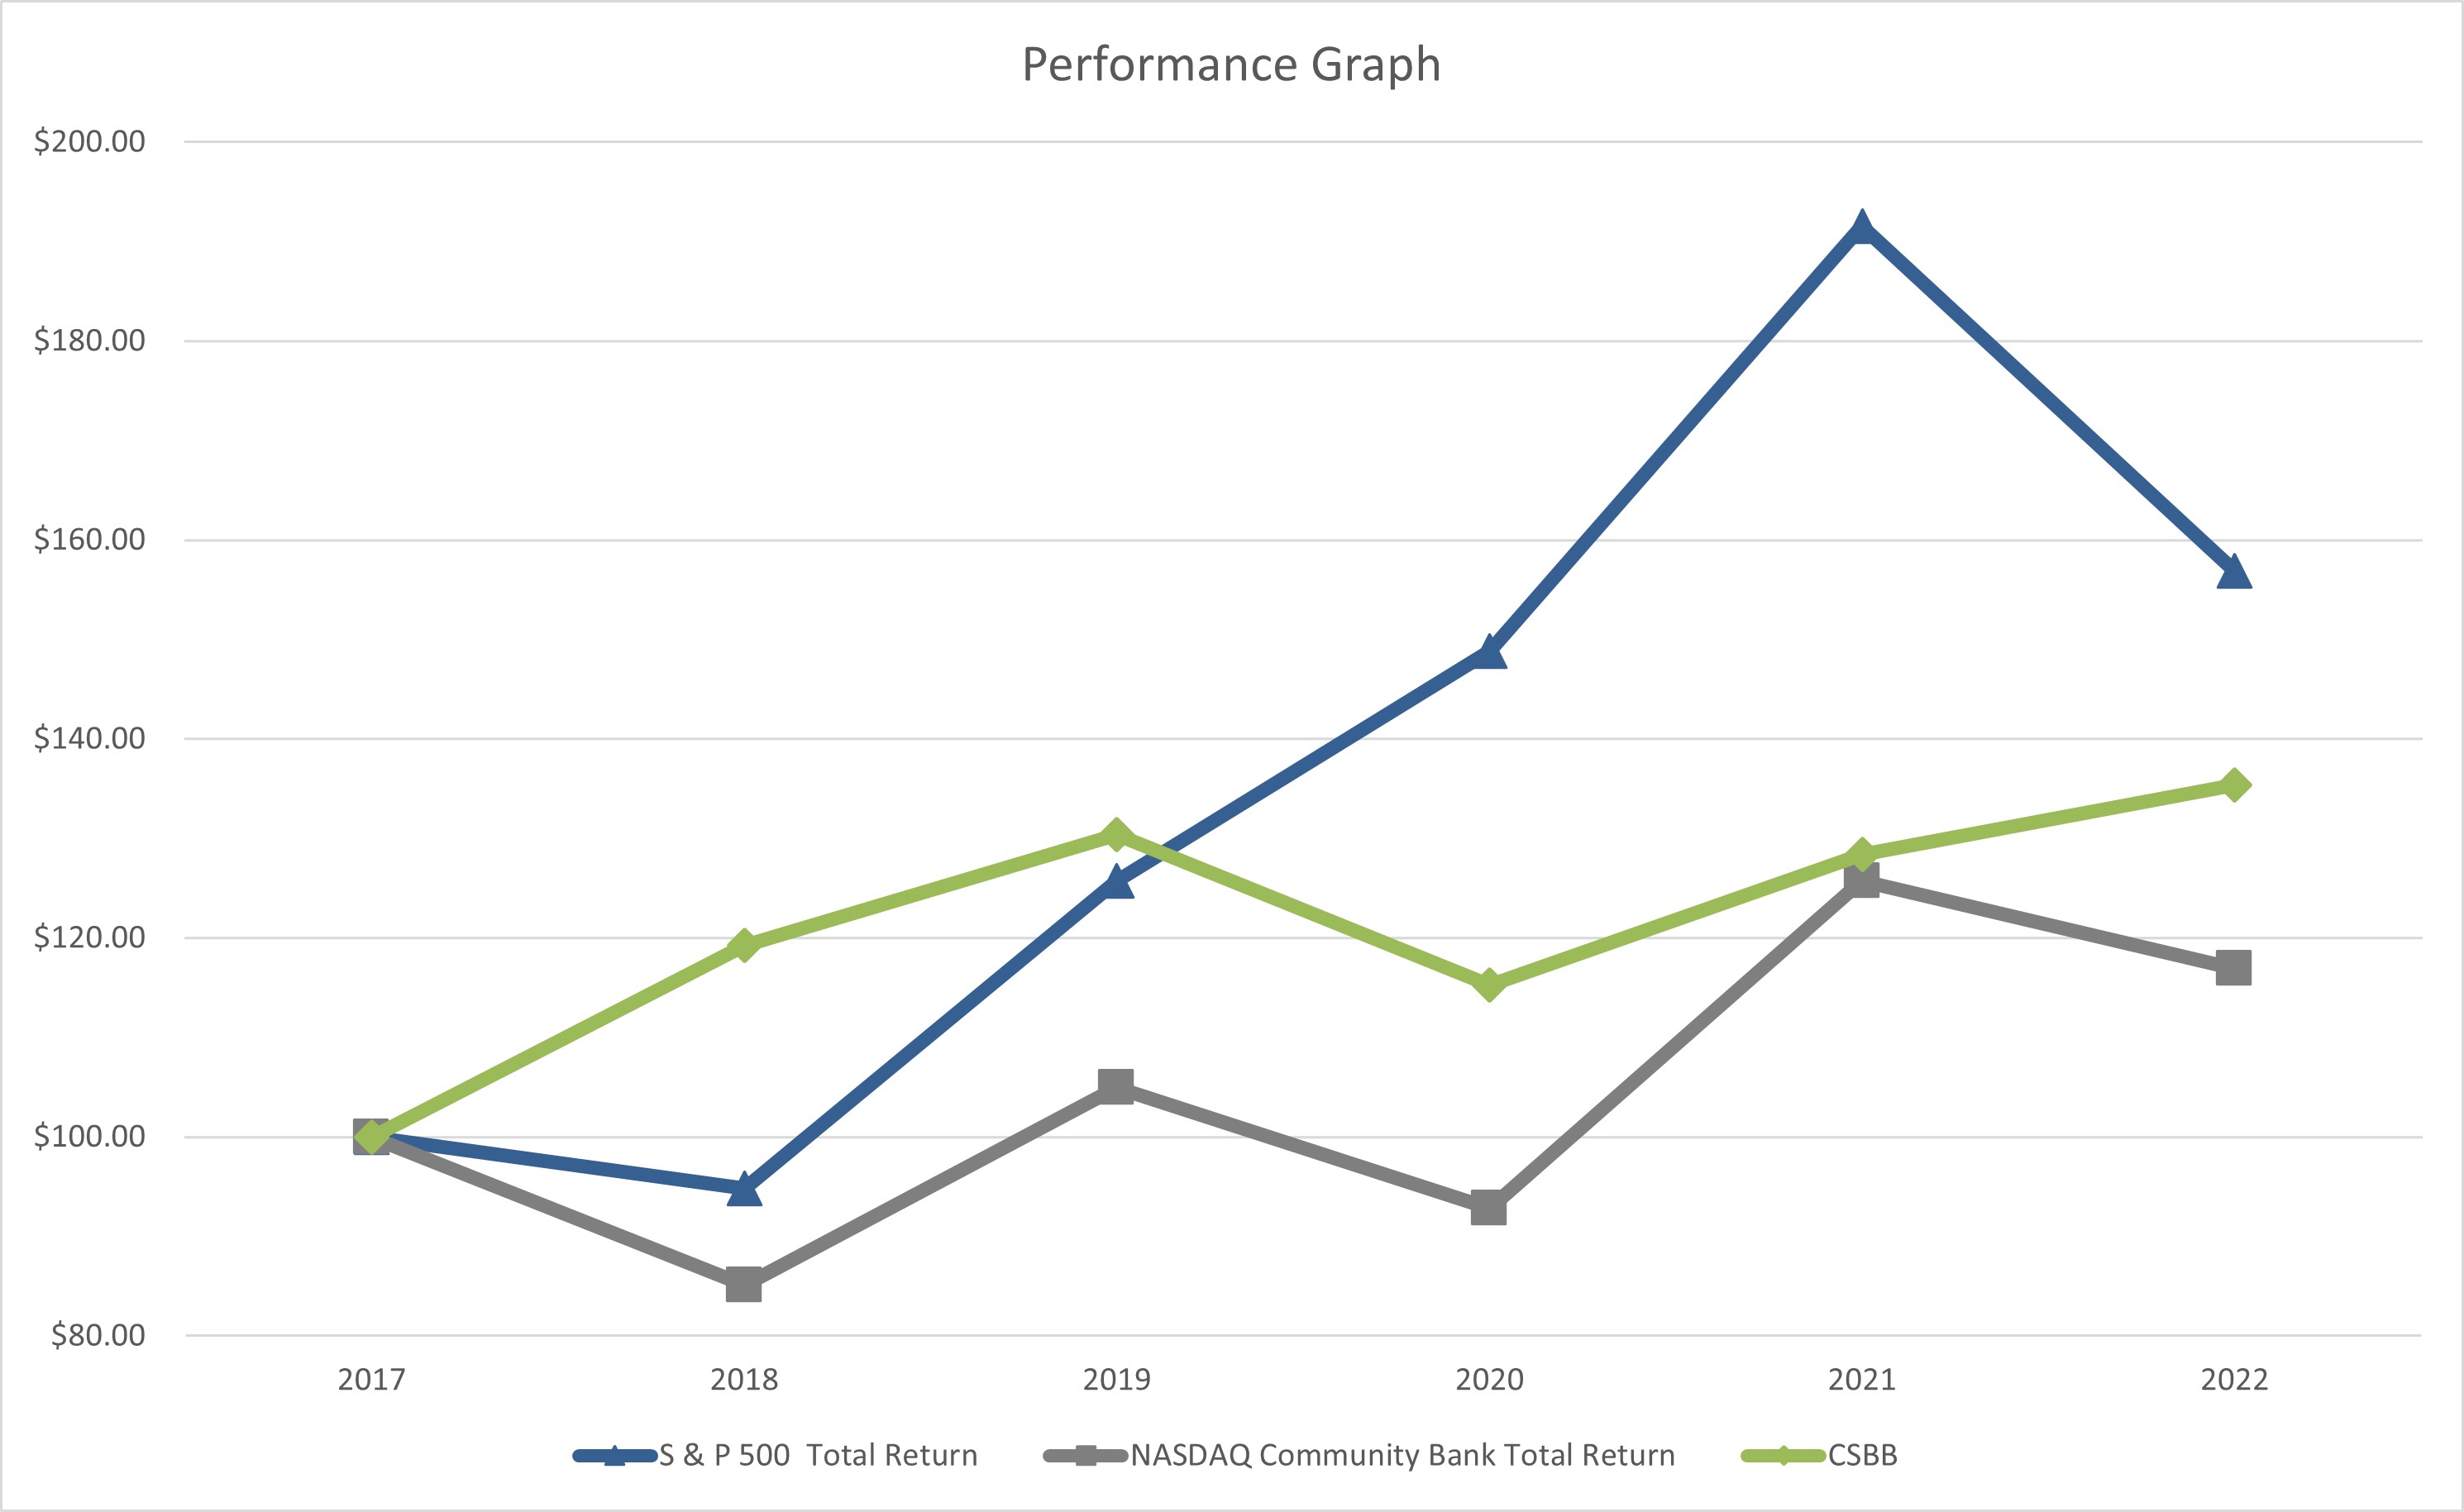
PERFORMANCE GRAPH
The following graph compares the yearly stock change and the cumulative total shareholder return on CSB’s Common Shares during the five-year period ended December 31, 2022, with the cumulative total return on the Standard and Poor’s 500 Stock Index and the NASDAQ Community Bank Stock Index. The comparison assumes $100 was invested on December 31, 2017, in CSB’s Common Shares and in each of the indicated indices and assumes reinvestment of dividends.
|
|
2017 |
|
|
2018 |
|
|
2019 |
|
|
2020 |
|
|
2021 |
|
|
2022 |
|
||||||
CSBB |
|
$ |
100 |
|
|
$ |
119 |
|
|
$ |
130 |
|
|
$ |
115 |
|
|
$ |
128 |
|
|
$ |
135 |
|
S & P 500 |
|
|
100 |
|
|
|
95 |
|
|
|
126 |
|
|
|
149 |
|
|
|
192 |
|
|
|
157 |
|
NASDAQ Bank |
|
|
100 |
|
|
|
85 |
|
|
|
105 |
|
|
|
93 |
|
|
|
126 |
|
|
|
117 |
|
ISSUER PURCHASES OF EQUITY SECURITIES
Period |
|
Total Number of Shares Purchased |
|
|
Average Price Paid Per Share |
|
|
Total number of Shares Purchased as Part of Publicly Announced Plans |
|
|
Maximum Number of Shares that May Yet be Purchased Under the Plan |
|
||||
October 1, 2022 to October 31, 2022 |
|
|
— |
|
|
$ |
— |
|
|
|
— |
|
|
|
102,344 |
|
November 1, 2022 to November 30, 2022 |
|
|
— |
|
|
|
— |
|
|
|
— |
|
|
|
102,344 |
|
December 1, 2022 to December 31, 2022 |
|
|
— |
|
|
|
— |
|
|
|
— |
|
|
|
102,344 |
|
On March 2, 2021, CSB filed a Current Report on Form 8-K with the SEC announcing that its Board of Directors approved a Stock Repurchase Program authorizing the repurchase of up to 5% of CSB’s common shares. Repurchases may be made periodically as market and business
13
conditions warrant, in the open market, through block purchases and in negotiated private transactions. The Stock Repurchase Program has no scheduled expiration date. CSB repurchased 10,448 Common Shares during 2022 and 24,326 Common Shares during 2021.
ITEM 6. [RESERVED]
14
ITEM 7. MANAGEMENT’S DISCUSSION AND ANALYSIS OF FINANCIAL CONDITION AND RESULTS OF OPERATIONS.
2022 FINANCIAL REVIEW
INTRODUCTION
CSB Bancorp, Inc. (the “Company” or “CSB”) was incorporated under the laws of the State of Ohio in 1991 and is a registered financial holding company. The Company’s wholly owned subsidiaries are The Commercial and Savings Bank (the “Bank”) and CSB Investment Services, LLC. The Bank is chartered under the laws of the State of Ohio and was organized in 1879. The Bank is a member of the Federal Reserve System, with deposits insured by the Federal Deposit Insurance Corporation, and its primary regulators are the Ohio Division of Financial Institutions and the Federal Reserve Board.
The Company, through the Bank, provides retail and commercial banking services to its customers including checking and savings accounts, time deposits, cash management, safe deposit facilities, commercial loans, real estate mortgage loans, consumer loans, IRAs, night depository facilities, and trust and brokerage services. Its customers are located primarily in Holmes, Stark, Tuscarawas, Wayne, and portions of surrounding counties in Ohio.
Economic activity in the Company’s market area declined moderately in the fourth quarter of 2022 after solid growth earlier in the year stemming from a continued recovery following the COVID-19 pandemic economic effects of 2020. Demand for goods and services slowed during the fourth quarter 2022 with households spending more on necessities and less on discretionary items. Supply chain challenges improved during the year. Consumer spending has softened due to inflation pressures and increased interest rates. Reported unemployment levels in December 2022 ranged from 2.9% to 4.0% in the four primary counties served by the Company. These levels increased from the December 2021 range of 2.0% to 3.5% in the four counties served by the Company. Labor demand remained solid as competition for workers has put upward pressure on labor costs. The local housing market continues to be strong with extremely low inventory levels. Residential construction has declined year over year with higher interest rates as the main factor reducing demand.
FORWARD-LOOKING STATEMENTS
Certain statements contained in Management’s Discussion and Analysis of Financial Condition and Results of Operations are not related to historical results but are forward-looking statements within the meaning of the Private Securities Litigation Reform Act of 1995. These statements involve a number of risks and uncertainties. Any forward-looking statements made by the Company herein and in future reports and statements are not guarantees of future performance. Actual results may differ materially from those in forward-looking statements because of various risk factors as discussed in this annual report. The Company does not undertake, and specifically disclaims, any obligation to publicly release the result of any revisions to any forward-looking statements to reflect the occurrence of unanticipated events or circumstances after the date of such statements.
15
FINANCIAL DATA
The following table set forth certain selected consolidated financial information:
(Dollars in thousands, except per share data) |
|
|
2022 |
|
|
|
2021 |
|
|
|
2020 |
|
|
|
2019 |
|
|
|
2018 |
|
|
|||||
Statements of income: |
|
|
|
|
|
|
|
|
|
|
|
|
|
|
|
|
|
|
|
|
|
|||||
Total interest income |
|
$ |
|
34,819 |
|
|
$ |
|
29,529 |
|
|
$ |
|
31,066 |
|
|
$ |
|
32,461 |
|
|
$ |
|
29,637 |
|
|
Total interest expense |
|
|
|
2,496 |
|
|
|
|
2,012 |
|
|
|
|
2,913 |
|
|
|
|
4,062 |
|
|
|
|
2,886 |
|
|
Net interest income |
|
|
|
32,323 |
|
|
|
|
27,517 |
|
|
|
|
28,153 |
|
|
|
|
28,399 |
|
|
|
|
26,751 |
|
|
Provision (recovery) for loan losses |
|
|
|
(895 |
) |
|
|
|
(655 |
) |
|
|
|
1,650 |
|
|
|
|
1,140 |
|
|
|
|
1,316 |
|
|
Net interest income after provision (recovery) for loan losses |
|
|
|
33,218 |
|
|
|
|
28,172 |
|
|
|
|
26,503 |
|
|
|
|
27,259 |
|
|
|
|
25,435 |
|
|
Noninterest income |
|
|
|
6,711 |
|
|
|
|
7,325 |
|
|
|
|
6,935 |
|
|
|
|
5,428 |
|
|
|
|
4,758 |
|
|
Noninterest expense |
|
|
|
23,393 |
|
|
|
|
22,093 |
|
|
|
|
20,342 |
|
|
|
|
19,769 |
|
|
|
|
18,518 |
|
|
Income before income taxes |
|
|
|
16,536 |
|
|
|
|
13,404 |
|
|
|
|
13,096 |
|
|
|
|
12,918 |
|
|
|
|
11,675 |
|
|
Income tax provision |
|
|
|
3,223 |
|
|
|
|
2,567 |
|
|
|
|
2,528 |
|
|
|
|
2,504 |
|
|
|
|
2,263 |
|
|
Net income |
|
$ |
|
13,313 |
|
|
$ |
|
10,837 |
|
|
$ |
|
10,568 |
|
|
$ |
|
10,414 |
|
|
$ |
|
9,412 |
|
|
|
|
|
|
|
|
|
|
|
|
|
|
|
|
|
|
|
|
|
|
|
|
|||||
Per share of common stock: |
|
|
|
|
|
|
|
|
|
|
|
|
|
|
|
|
|
|
|
|
|
|||||
Basic earnings per share |
|
$ |
|
4.91 |
|
|
$ |
|
3.97 |
|
|
$ |
|
3.85 |
|
|
$ |
|
3.80 |
|
|
$ |
|
3.43 |
|
|
Diluted earnings per share |
|
|
|
4.91 |
|
|
|
|
3.97 |
|
|
|
|
3.85 |
|
|
|
|
3.80 |
|
|
|
|
3.43 |
|
|
Dividends |
|
|
|
1.30 |
|
|
|
|
1.22 |
|
|
|
|
1.13 |
|
|
|
|
1.08 |
|
|
|
|
0.98 |
|
|
Book value |
|
|
|
35.43 |
|
|
|
|
35.80 |
|
|
|
|
34.23 |
|
|
|
|
31.17 |
|
|
|
|
27.91 |
|
|
Average basic common shares outstanding |
|
|
|
2,714,045 |
|
|
|
|
2,733,126 |
|
|
|
|
2,742,350 |
|
|
|
|
2,742,296 |
|
|
|
|
2,742,242 |
|
|
Average diluted common shares outstanding |
|
|
|
2,714,045 |
|
|
|
|
2,733,126 |
|
|
|
|
2,742,350 |
|
|
|
|
2,742,296 |
|
|
|
|
2,742,242 |
|
|
|
|
|
|
|
|
|
|
|
|
|
|
|
|
|
|
|
|
|
|
|
|
|||||
Year-end balances: |
|
|
|
|
|
|
|
|
|
|
|
|
|
|
|
|
|
|
|
|
|
|||||
Loans, net |
|
$ |
|
620,333 |
|
|
$ |
|
541,536 |
|
|
$ |
|
600,885 |
|
|
$ |
|
544,616 |
|
|
$ |
|
543,067 |
|
|
Securities |
|
|
|
401,144 |
|
|
|
|
311,245 |
|
|
|
|
204,184 |
|
|
|
|
130,721 |
|
|
|
|
110,913 |
|
|
Total assets |
|
|
|
1,159,108 |
|
|
|
|
1,144,239 |
|
|
|
|
1,031,632 |
|
|
|
|
818,683 |
|
|
|
|
731,722 |
|
|
Deposits |
|
|
|
1,023,417 |
|
|
|
|
1,002,747 |
|
|
|
|
891,562 |
|
|
|
|
683,546 |
|
|
|
|
606,498 |
|
|
Borrowings |
|
|
|
35,011 |
|
|
|
|
39,937 |
|
|
|
|
41,879 |
|
|
|
|
45,219 |
|
|
|
|
45,940 |
|
|
Shareholders’ equity |
|
|
|
95,920 |
|
|
|
|
97,315 |
|
|
|
|
93,859 |
|
|
|
|
85,476 |
|
|
|
|
76,536 |
|
|
|
|
|
|
|
|
|
|
|
|
|
|
|
|
|
|
|
|
|
|
|
|
|||||
Average balances: |
|
|
|
|
|
|
|
|
|
|
|
|
|
|
|
|
|
|
|
|
|
|||||
Loans, net |
|
$ |
|
580,454 |
|
|
$ |
|
554,547 |
|
|
$ |
|
601,419 |
|
|
$ |
|
545,483 |
|
|
$ |
|
529,522 |
|
|
Securities |
|
|
|
388,827 |
|
|
|
|
231,285 |
|
|
|
|
129,508 |
|
|
|
|
112,290 |
|
|
|
|
118,511 |
|
|
Total assets |
|
|
|
1,151,925 |
|
|
|
|
1,111,808 |
|
|
|
|
931,330 |
|
|
|
|
765,722 |
|
|
|
|
716,243 |
|
|
Deposits |
|
|
|
1,012,629 |
|
|
|
|
969,009 |
|
|
|
|
788,904 |
|
|
|
|
636,441 |
|
|
|
|
589,646 |
|
|
Borrowings |
|
|
|
40,218 |
|
|
|
|
42,600 |
|
|
|
|
48,358 |
|
|
|
|
44,478 |
|
|
|
|
51,014 |
|
|
Shareholders’ equity |
|
|
|
94,850 |
|
|
|
|
96,145 |
|
|
|
|
90,247 |
|
|
|
|
81,548 |
|
|
|
|
73,002 |
|
|
|
|
|
|
|
|
|
|
|
|
|
|
|
|
|
|
|
|
|
|
|
|
|||||
Select ratios: |
|
|
|
|
|
|
|
|
|
|
|
|
|
|
|
|
|
|
|
|
|
|||||
Net interest margin, FTE basis1 |
|
|
|
2.98 |
|
% |
|
|
2.63 |
|
% |
|
|
3.22 |
|
% |
|
|
3.97 |
|
% |
|
|
3.98 |
|
% |
Return on average total assets |
|
|
|
1.16 |
|
|
|
|
0.97 |
|
|
|
|
1.13 |
|
|
|
|
1.36 |
|
|
|
|
1.31 |
|
|
Return on average shareholders’ equity |
|
|
|
14.04 |
|
|
|
|
11.27 |
|
|
|
|
11.71 |
|
|
|
|
12.77 |
|
|
|
|
12.89 |
|
|
Average shareholders’ equity as a percent of average total assets |
|
|
|
8.23 |
|
|
|
|
8.65 |
|
|
|
|
9.69 |
|
|
|
|
10.65 |
|
|
|
|
10.19 |
|
|
Net loan charge-offs (recoveries) as a percent of average loans |
|
|
|
(0.02 |
) |
|
|
|
0.00 |
|
|
|
|
0.06 |
|
|
|
|
0.01 |
|
|
|
|
0.19 |
|
|
Allowance for loan losses as a percent of loans at year-end |
|
|
|
1.09 |
|
|
|
|
1.39 |
|
|
|
|
1.36 |
|
|
|
|
1.27 |
|
|
|
|
1.08 |
|
|
Shareholders’ equity as a percent of total year-end assets |
|
|
|
8.28 |
|
|
|
|
8.50 |
|
|
|
|
9.10 |
|
|
|
|
10.44 |
|
|
|
|
10.46 |
|
|
Dividend payout ratio2 |
|
|
|
26.48 |
|
|
|
|
30.73 |
|
|
|
|
29.35 |
|
|
|
|
28.42 |
|
|
|
|
28.57 |
|
|
¹Net interest margin is shown on a fully taxable equivalent basis.
2Dividend payout ratio is calculated as dividends declared as a percentage of net income.
16
RESULTS OF OPERATIONS
Net Income
CSB’s 2022 net income was $13.3 million compared to $10.8 million for 2021, an increase of 23%. Total revenue, net interest income plus noninterest income, increased $4.2 million, or 12%, over the prior year to a total of $39.0 million. The provision for loan losses decreased to a $895 thousand recovery as compared to a $655 thousand recovery for the prior year. Noninterest expense increased $1.3 million, or 6% and the provision for income tax increased $656 thousand over the prior year due to an increase in taxable income. Basic and diluted earnings per share were $4.91, up 24% from the prior year. The return on average assets was 1.16% in 2022 compared to 0.97% in 2021 and return on average equity was 14.04% in 2022 compared to 11.27% in 2021.
Net Interest Income
(Dollars in thousands) |
|
|
2022 |
|
|
|
2021 |
|
|
||
Net interest income |
|
$ |
|
32,323 |
|
|
$ |
|
27,517 |
|
|
Taxable equivalent1 |
|
|
|
145 |
|
|
|
|
154 |
|
|
Net interest income, FTE |
|
$ |
|
32,468 |
|
|
$ |
|
27,671 |
|
|
Net interest margin |
|
|
|
2.97 |
|
% |
|
|
2.61 |
|
% |
Taxable equivalent adjustment1 |
|
|
|
0.01 |
|
|
|
|
0.02 |
|
|
Net interest margin, FTE |
|
|
|
2.98 |
|
% |
|
|
2.63 |
|
% |
¹Taxable equivalent adjustments have been computed assuming a 21% tax rate in 2022, and 2021 (non-GAAP).
Net interest income is the largest source of the Company’s revenue and consists of the difference between interest income generated on earning assets and interest expense incurred on liabilities (deposits, short-term and long-term borrowings). Volumes, interest rates, composition of interest-earning assets, and interest-bearing liabilities affect net interest income. Net interest income increased $4.8 million, or 17%, in 2022 compared to 2021. The increase was a result of a $5.3 million increase in interest income, partially offset by an increase of $484 thousand in interest expense. The FTE net interest margin increased to 2.98% from 2.63% in 2021.
Interest income increased $5.3 million, or 18%, in 2022 compared to 2021 primarily due to an increase of $4.1 million, or 155%, in taxable securities interest income due to an increase in average balances of $158 million and an increase in yield of 56 basis points ("bps"). Interest income on interest-earning deposits mainly held at the Federal Reserve increased $1.4 million in 2022 compared to 2021 primarily due to a 139 basis points yield increase. Interest income on loans decreased $109 thousand primarily due to a decrease of 22 basis points in yield which was partially offset by an increase in loan volume of $25 million. The decrease in yield occurred as Payckeck Prtection Program ("PPP") loans were forgiven by the Small Business Administration ("SBA"), the bank recognized origination fees of $176 thousand in interest income in 2022 as compared to $2.8 million in 2021 on the forgiven PPP loans.
Interest expense increased $484 thousand, or 24%, in 2022 as compared to 2021 primarily due to rate increases of 7 bps on deposits and 10 basis points on other borrowed funds. Average interest-bearing demand and savings deposit balances increased $16 million during the year as savings rates continued but at a lesser pace than the prior year as the increase in the money supply created by the government to offset pandemic economic decreases was being phased out to consumers and businesses. Average time deposit balances decreased $5.6 million, and the average interest rate decreased 18 bps.
17
The following table provides detailed analysis of changes in average balances, yield, and net interest income:
AVERAGE BALANCE SHEETS AND NET INTEREST MARGIN ANALYSIS
|
2022 |
|
|
|
2021 |
|
|
||||||||||||||||||||||
(Dollars in thousands) |
|
Average |
|
|
|
Interest |
|
|
Average |
|
|
|
|
Average |
|
|
|
Interest |
|
|
Average |
|
|
||||||
Interest-earning |
|
|
|
|
|
|
|
|
|
|
|
|
|
|
|
|
|
|
|
|
|
|
|
||||||
Interest-earning |
$ |
|
111,775 |
|
|
$ |
|
1,703 |
|
|
|
1.52 |
|
% |
|
$ |
|
259,789 |
|
|
$ |
|
337 |
|
|
|
0.13 |
|
% |
Securities: |
|
|
|
|
|
|
|
|
|
|
|
|
|
|
|
|
|
|
|
|
|
|
|
||||||
Taxable |
|
|
364,478 |
|
|
|
|
6,665 |
|
|
|
1.83 |
|
|
|
|
|
206,077 |
|
|
|
|
2,613 |
|
|
|
1.27 |
|
|
Tax exempt 4 |
|
|
24,349 |
|
|
|
|
553 |
|
|
|
2.27 |
|
|
|
|
|
25,208 |
|
|
|
|
577 |
|
|
|
2.28 |
|
|
Loans 3, 4 |
|
|
587,765 |
|
|
|
|
26,043 |
|
|
|
4.43 |
|
|
|
|
|
562,592 |
|
|
|
|
26,156 |
|
|
|
4.65 |
|
|
Total interest- |
|
|
1,088,367 |
|
|
|
|
34,964 |
|
|
|
3.21 |
|
% |
|
|
|
1,053,666 |
|
|
|
|
29,683 |
|
|
|
2.82 |
|
% |
Noninterest- |
|
|
|
|
|
|
|
|
|
|
|
|
|
|
|
|
|
|
|
|
|
|
|
||||||
Cash and due |
|
|
20,435 |
|
|
|
|
|
|
|
|
|
|
|
|
19,891 |
|
|
|
|
|
|
|
|
|
||||
Bank premises |
|
|
13,601 |
|
|
|
|
|
|
|
|
|
|
|
|
13,372 |
|
|
|
|
|
|
|
|
|
||||
Other assets |
|
|
36,833 |
|
|
|
|
|
|
|
|
|
|
|
|
32,924 |
|
|
|
|
|
|
|
|
|
||||
Allowance for loan |
|
|
(7,311 |
) |
|
|
|
|
|
|
|
|
|
|
|
(8,045 |
) |
|
|
|
|
|
|
|
|
||||
Total assets |
$ |
|
1,151,925 |
|
|
|
|
|
|
|
|
|
|
$ |
|
1,111,808 |
|
|
|
|
|
|
|
|
|
||||
|
|
|
|
|
|
|
|
|
|
|
|
|
|
|
|
|
|
|
|
|
|
|
|
||||||
Interest-bearing |
|
|
|
|
|
|
|
|
|
|
|
|
|
|
|
|
|
|
|
|
|
|
|
||||||
Demand deposits |
$ |
|
240,904 |
|
|
|
|
648 |
|
|
|
0.27 |
|
% |
|
$ |
|
259,111 |
|
|
|
|
317 |
|
|
|
0.12 |
|
% |
Savings deposits |
|
|
315,881 |
|
|
|
|
670 |
|
|
|
0.21 |
|
|
|
|
|
281,888 |
|
|
|
|
281 |
|
|
|
0.10 |
|
|
Time deposits |
|
|
118,085 |
|
|
|
|
1,017 |
|
|
|
0.86 |
|
|
|
|
|
123,659 |
|
|
|
|
1,286 |
|
|
|
1.04 |
|
|
Borrowed funds |
|
|
40,218 |
|
|
|
|
161 |
|
|
|
0.40 |
|
|
|
|
|
42,600 |
|
|
|
|
128 |
|
|
|
0.30 |
|
|
Total interest- |
|
|
715,088 |
|
|
|
|
2,496 |
|
|
|
0.35 |
|
% |
|
|
|
707,258 |
|
|
|
|
2,012 |
|
|
|
0.28 |
|
% |
Noninterest-bearing |
|
|
|
|
|
|
|
|
|
|
|
|
|
|
|
|
|
|
|
|
|
|
|
||||||
Demand deposits |
|
|
337,759 |
|
|
|
|
|
|
|
|
|
|
|
|
304,351 |
|
|
|
|
|
|
|
|
|
||||
Other liabilities |
|
|
4,228 |
|
|
|
|
|
|
|
|
|
|
|
|
4,054 |
|
|
|
|
|
|
|
|
|
||||
Shareholders’ equity |
|
|
94,850 |
|
|
|
|
|
|
|
|
|
|
|
|
96,145 |
|
|
|
|
|
|
|
|
|
||||
Total liabilities |
$ |
|
1,151,925 |
|
|
|
|
|
|
|
|
|
|
$ |
|
1,111,808 |
|
|
|
|
|
|
|
|
|
||||
Net interest |
|
|
|
|
|
|
32,468 |
|
|
|
|
|
|
|
|
|
|
|
|
27,671 |
|
|
|
|
|
||||
FTE adjustment |
|
|
|
|
|
|
(145 |
) |
|
|
|
|
|
|
|
|
|
|
|
(154 |
) |
|
|
|
|
||||
GAAP net interest |
|
|
|
|
$ |
|
32,323 |
|
|
|
|
|
|
|
|
|
|
$ |
|
27,517 |
|
|
|
|
|
||||
Net interest margin |
|
|
|
|
|
|
|
|
|
2.98 |
|
% |
|
|
|
|
|
|
|
|
|
|
2.63 |
|
% |
||||
Net interest spread |
|
|
|
|
|
|
|
|
|
2.86 |
|
% |
|
|
|
|
|
|
|
|
|
|
2.54 |
|
% |
||||
¹Average balances have been computed on an average daily basis.
²Average rates have been computed based on the amortized cost of the corresponding asset or liability.
³Average loan balances include nonaccrual loans.
4Interest income is shown on a fully tax-equivalent basis (non-GAAP), reconciled to the GAAP amount at the bottom of the table.
18
The following table compares the impact of changes in average rates and changes in average volumes on net interest income:
RATE/VOLUME ANALYSIS OF CHANGES IN INCOME AND EXPENSE¹
|
|
|
2022 v. 2021 |
|
|||||||||||
|
|
|
Net Increase |
|
|
|
|
|
|
|
|
|
|||
(Dollars in thousands) |
|
|
(Decrease) |
|
|
|
Volume |
|
|
|
Rate |
|
|||
Increase (decrease) in interest income: |
|
|
|
|
|
|
|
|
|
|
|
|
|||
Interest-earning deposits in other banks |
|
$ |
|
1,366 |
|
|
$ |
|
(2,255 |
) |
|
$ |
|
3,621 |
|
Securities: |
|
|
|
|
|
|
|
|
|
|
|
|
|||
Taxable |
|
|
|
4,052 |
|
|
|
|
2,904 |
|
|
|
|
1,148 |
|
Tax exempt 2 |
|
|
|
(24 |
) |
|
|
|
(18 |
) |
|
|
|
(6 |
) |
Loans 2 |
|
|
|
(113 |
) |
|
|
|
1,115 |
|
|
|
|
(1,228 |
) |
Total interest income change 2 |
|
|
|
5,281 |
|
|
|
|
1,746 |
|
|
|
|
3,535 |
|
Increase (decrease) in interest expense: |
|
|
|
|
|
|
|
|
|
|
|
|
|||
Demand deposits |
|
|
|
331 |
|
|
|
|
(49 |
) |
|
|
|
380 |
|
Savings deposits |
|
|
|
389 |
|
|
|
|
72 |
|
|
|
|
317 |
|
Time deposits |
|
|
|
(269 |
) |
|
|
|
(48 |
) |
|
|
|
(221 |
) |
Borrowed funds |
|
|
|
33 |
|
|
|
|
(10 |
) |
|
|
|
43 |
|
Total interest expense change |
|
|
|
484 |
|
|
|
|
(35 |
) |
|
|
|
519 |
|
Net interest income change 2 |
|
$ |
|
4,797 |
|
|
$ |
|
1,781 |
|
|
$ |
|
3,016 |
|
¹ Changes attributable to both volume and rate, which cannot be segregated, have been allocated based on the absolute value of the change due to volume and the change due to rate.
2 Interest income is shown on a fully tax-equivalent basis (non-GAAP).
Provision (Recovery) For Loan Losses
The provision (recovery) for loan losses is determined by management as the amount required to bring the allowance for loan losses to a level considered appropriate to absorb probable incurred net charge-offs inherent in the loan portfolio as of period end. During 2022 a recovery of credit losses of $895 thousand was recognized compared to a 2021 recovery of credit losses of $655 thousand. The recapture of provision for loan losses for the year primarily reflects the improvement in credit quality including the reduction of impaired and adversely classified loans, as well as the improvement in economic indicators including unemployment, residential real estate prices and consumer confidence. Nonperforming loans decreased $832 thousand from 2021 to 2022. See Financial Condition – Allowance for Loan Losses for additional discussion and information relative to the provision for loan losses.
Noninterest Income
|
|
YEAR ENDED DECEMBER 31 |
|
|||||||||||||||
|
|
|
|
|
|
Change from 2021 |
|
|
|
|||||||||
(Dollars in thousands) |
|
2022 |
|
|
|
Amount |
|
|
% |
|
|
|
2021 |
|
||||
Service charges on deposit accounts |
$ |
|
1,174 |
|
|
$ |
|
235 |
|
|
|
25 |
|
% |
$ |
|
939 |
|
Trust services |
|
|
954 |
|
|
|
|
(105 |
) |
|
|
(10 |
) |
|
|
|
1,059 |
|
Debit card interchange fees |
|
|
2,105 |
|
|
|
|
55 |
|
|
|
3 |
|
|
|
|
2,050 |
|
Credit card fees |
|
|
677 |
|
|
|
|
195 |
|
|
|
40 |
|
|
|
|
482 |
|
Gain on sale of loans, including MSRs |
|
|
331 |
|
|
|
|
(1,118 |
) |
|
|
(77 |
) |
|
|
|
1,449 |
|
Earnings on bank-owned life insurance |
|
|
674 |
|
|
|
|
55 |
|
|
|
9 |
|
|
|
|
619 |
|
Unrealized (loss) gain on equity securities |
|
|
(3 |
) |
|
|
|
(31 |
) |
|
|
(111 |
) |
|
|
|
28 |
|
Other |
|
|
799 |
|
|
|
|
100 |
|
|
|
14 |
|
|
|
|
699 |
|
Total noninterest income |
$ |
|
6,711 |
|
|
$ |
|
(614 |
) |
|
|
(8 |
) |
% |
$ |
|
7,325 |
|
Noninterest income decreased $614 thousand, or 8%, in 2022 compared to the same period in 2021. Gain on sales of mortgage loans including mortgage servicing rights (“MSRs”) decreased $1.1 million due to fewer sales of real estate mortgage loans into the secondary market as many consumers took advantage of the large mortgage interest rate declines in 2021. The Bank sold $10 million in mortgage loans, including gains, in 2022 as compared to the sale of $47 million of loans in 2021. Trust service revenue decreased $105 thousand with market declines. Service charges on deposits, which are primarily customer overdraft fees, increased $235 thousand in 2022. Debit card interchange fees increased $55 thousand in 2022 compared to 2021 due to volume increases. Credit card interchange income increased $195 thousand as business credit card usage continued to increase. Earnings on bank owned life insurance increased $55 thousand.
19
Noninterest Expenses
|
|
|
YEAR ENDED DECEMBER 31 |
|
||||||||||||||||
|
|
|
|
|
|
|
Change from 2021 |
|
|
|
||||||||||
(Dollars in thousands) |
|
|
2022 |
|
|
|
Amount |
|
|
|
% |
|
|
|
2021 |
|
||||
Salaries and employee benefits |
|
$ |
|
13,446 |
|
|
$ |
|
847 |
|
|
|
|
7 |
|
% |
$ |
|
12,599 |
|
Occupancy expense |
|
|
|
1,085 |
|
|
|
|
52 |
|
|
|
|
5 |
|
|
|
|
1,033 |
|
Equipment expense |
|
|
|
781 |
|
|
|
|
67 |
|
|
|
|
9 |
|
|
|
|
714 |
|
Professional and director fees |
|
|
|
1,551 |
|
|
|
|
367 |
|
|
|
|
31 |
|
|
|
|
1,184 |
|
Financial institutions tax |
|
|
|
779 |
|
|
|
|
28 |
|
|
|
|
4 |
|
|
|
|
751 |
|
Marketing and public relations |
|
|
|
551 |
|
|
|
|
90 |
|
|
|
|
20 |
|
|
|
|
461 |
|
Software expense |
|
|
|
1,429 |
|
|
|
|
87 |
|
|
|
|
6 |
|
|
|
|
1,342 |
|
Debit card expense |
|
|
|
734 |
|
|
|
|
24 |
|
|
|
|
3 |
|
|
|
|
710 |
|
FDIC insurance |
|
|
|
345 |
|
|
|
|
(133 |
) |
|
|
|
(28 |
) |
|
|
|
478 |
|
Amortization of intangible assets |
|
|
|
— |
|
|
|
|
(44 |
) |
|
|
|
(100 |
) |
|
|
|
44 |
|
Other |
|
|
|
2,692 |
|
|
|
|
(85 |
) |
|
|
|
(3 |
) |
|
|
|
2,777 |
|
Total noninterest expenses |
|
$ |
|
23,393 |
|
|
$ |
|
1,300 |
|
|
|
|
6 |
|
% |
$ |
|
22,093 |
|
Noninterest expense increased $1.3 million, or 6%, in 2022 compared to 2021. Salaries and employee benefits increased $847 thousand from increases in base and incentive compensation of $575 thousand. The capitalization of employee costs of loan originations increased the amount recognized in salary expense by $250 thousand in 2022, a result of decreased origination of commercial and mortgage loans. Professional and director fees increased $367 thousand primarily due to an increase in third party assistance with contracting the bank's core vendor, increase of $64 thousand in legal expenses related to loan collections, $50 thousand increase in audit and accounting fees, and $33 thousand increase in director's fees. Marketing and public relations expense increased $90 thousand, or 20%, with increasing market coverage. Software expense increased $87 thousand, or 6%, due to full-year implementation of a new mobile banking platform along with core software provider increases. Equipment expense increased $67 thousand in 2022, as compared to 2021, with increased depreciation expense and equipment maintenance contracts. Occupancy expense increased $52 thousand primarily from depreciation from branch renovations, property taxes and insurance. An increase of $28 thousand in the Ohio financial institutions tax was recognized as capital increased. Debit card expense increased $24 thousand in 2022 due to increased volume. The FDIC insurance assessment decreased $133 thousand, or 28%, with improved credit quality and increased earnings. Other expenses decreased $85 thousand, or 3%.
Income Taxes
The provision for income taxes amounted to $3.2 million in 2022 as compared to $2.6 million in 2021. The slight increase in 2022 resulted from an increase in income. The corporate statutory tax rate was 21% for 2022 and 2021. The effective tax rate in 2022 and 2021 approximates 19%.
FINANCIAL CONDITION
Total assets of the Company were $1.2 billion on December 31, 2022 compared to $1.1 billion on December 31, 2021, representing an increase of $15 million, or 1%. Net loans increased $79 million, or 15%, while investment securities increased $90 million, or 29%, and total cash and cash equivalents decreased $157 million, or 65%. Deposits increased $21 million and short-term borrowings decreased $4 million, while other borrowings from the Federal Home Loan Bank (“FHLB”) decreased by $946 thousand, or 28%.
Securities
Total investment securities increased $90 million, or 29%, to $401 million at year-end 2022. CSB’s portfolio is primarily comprised of agency mortgage-backed securities, obligations of state and political subdivisions, U.S. Treasury notes, other government agencies’ debt, and corporate bonds. Restricted securities consist primarily of FHLB stock.
The Company has no exposure to government-sponsored enterprise preferred stocks, collateralized debt obligations, or trust preferred securities. The Company’s municipal bond portfolio consists of tax-exempt general obligation and revenue bonds. As of December 31, 2022, 73% of such bonds held an S&P or Moody’s investment grade rating, and 27% were non-rated local issues. The municipal portfolio includes a broad spectrum of counties, towns, universities, and school districts with 83% of the portfolio originating in Ohio, and 17% in Pennsylvania. Gross unrealized security losses within the portfolio were 13% of total securities on December 31, 2022, reflecting interest rate increases, not credit downgrades.
During December 2021, investments with an amortized cost of approximately $79 million and a fair value of $77 million were transferred from available-for-sale to held-to-maturity as rising interest rates and a slowing of monthly cash payments were occurring. The transfer included $76 million of U.S. Government agency mortgage-backed securities and $3 million of U.S. Treasury notes. These bonds will still provide liquidity through pledging and for use as collateral against borrowings. No additional transfers to held to maturity were made in 2022, as bonds were assigned their held to maturity classification on their purchase date in 2022.
20
One of the primary functions of the securities portfolio is to provide a source of liquidity and it is structured such that maturities and cash flows provide a portion of the Company’s liquidity needs and asset/liability management requirements.
Loans
Total loans increased $78 million, or 14%, during 2022 with increases in all loan categories. Volume increases were recognized as follows: commercial loans including PPP loans increased $5 million, or 4%, during 2022, with PPP loan forgiveness of $4 million offsetting the increase. Remaining PPP loan balances were $359 thousand as of December 31, 2022. Construction and land development loans increased $9 million, or 20% as several commercial projects were under construction and consumer demand slowed for 1-4 family residential construction at year end. Residential real estate loans increased $26 million, or 15%. Commercial real estate loans increased $37 million, or 19%. Commercial real estate and construction loan demand remained strong, however there was a slowing of commercial loan growth with increased competition from private lenders and excess business liquidity remaining from government stimulus programs.
The Company originated $69 million and $67 million of residential mortgage loans held in the portfolio, including residential construction, conventional 1-4 family, and equity line loans, which were predominately variable rate, in 2022 and 2021, respectively. The increase in interest rates slowed consumer demand for 1-4 family fixed-rate thirty-year residential mortgages which are sold into the secondary market as the Company sold $10 million of mortgages into the secondary market in 2022 as compared to $46 million in 2021. Demand for home equity loans strengthened in 2022, with balances increasing $7 million, as consumers opted to not refinance their lower fixed-rate mortgages. Installment loans increased $300 thousand.
Management anticipates modest economic growth in the Company’s local service areas will continue to improve. Commercial and commercial real estate loans, in aggregate, comprise approximately 58% of the total loan portfolio at year-end 2022 and 2021. Residential real estate loans remained at 31% of the portfolio in 2022 and 2021. Construction and land development loans increased to 9% of the portfolio as loan demand for commercial construction projects increased by $7 million and residential construction loans increased by $2 million, year over year. The Company is well within the respective regulatory guidelines for investment in construction, development, and investment property loans that are not owner occupied.
Most of the Company’s lending activity is with customers primarily located within Holmes, Stark, Tuscarawas and Wayne counties in Ohio. The majority of the Company’s loan portfolio consists of commercial and industrial and commercial real estate loans. See concentration of credit discussion included in Note 3 in the Notes to Consolidated Financial Statements.
21
Nonperforming Assets, Impaired Loans, and Loans Past Due 90 Days or More
Nonperforming assets consist of nonaccrual loans, loans past due 90 days and still accruing, and other real estate acquired through or in lieu of foreclosure. Other impaired loans include certain loans internally classified as substandard or doubtful. Loans are placed on nonaccrual status when they become past due 90 days or more, or when mortgage loans are past due as to principal and interest 120 days or more, unless they are both well secured and in the process of collection.
NONPERFORMING ASSETS |
|
|
DECEMBER 31 |
|
|
||||||
(Dollars in thousands) |
|
|
2022 |
|
|
|
2021 |
|
|
||
Nonaccrual loans |
|
|
|
|
|
|
|
|
|
||
Commercial |
|
$ |
|
— |
|
|
$ |
|
208 |
|
|
Commercial real estate |
|
|
|
92 |
|
|
|
|
139 |
|
|
Residential real estate |
|
|
|
99 |
|
|
|
|
367 |
|
|
Construction & land development |
|
|
|
— |
|
|
|
|
329 |
|
|
Consumer |
|
|
|
65 |
|
|
|
|
40 |
|
|
|
|
|
|
|
|
|
|
|
|
||
Loans past due 90 days or more and still accruing |
|
|
|
|
|
|
|
|
|
||
Commercial |
|
|
|
— |
|
|
|
|
5 |
|
|
Total nonperforming loans |
|
|
|
256 |
|
|
|
|
1,088 |
|
|
|
|
|
|
|
|
|
|
|
|
||
Other real estate owned |
|
|
|
— |
|
|
|
|
— |
|
|
Other repossessed assets |
|
|
|
— |
|
|
|
|
— |
|
|
Total nonperforming assets |
|
$ |
|
256 |
|
|
$ |
|
1,088 |
|
|
|
|
|
|
|
|
|
|
|
|
||
Nonaccrual loans to total loans |
|
|
|
0.04 |
|
% |
|
|
0.20 |
|
% |
Allowance for Loan Losses
The allowance for loan losses is maintained at a level considered by management to be adequate to cover loan losses currently anticipated based on past loss experience, general economic conditions, changes in mix and size of the loan portfolio, information about specific borrower situations, and other factors and estimates which are subject to change over time. Management periodically reviews selected large loans, delinquent and other problem loans, and selected other loans. Collectability of these loans is evaluated by considering the current financial position and performance of the borrower, estimated market value of the collateral, the Company’s collateral position in relationship to other creditors, guarantees, and other potential sources of repayment. Management forms judgments, which are in part subjective, as to the probability of loss and the amount of loss on these loans as well as other loans taken together. The Company’s Allowance for Loan Losses Policy includes, among other items, provisions (recoveries) for classified loans, and a provision (recovery) for the remainder of the portfolio based on historical data, including past charge-offs.
During 2022, $689 thousand in nonaccrual loans were collected, $226 thousand were charged-off, $93 thousand were returned to accrual, while $181 thousand new loans entered nonaccrual status.
ALLOWANCE FOR LOAN LOSSES |
FOR THE YEAR ENDED |
|
|
||||||||
(Dollars in thousands) |
|
|
2022 |
|
|
|
2021 |
|
|
||
Net charge-offs (recoveries) as a percentage of average total loans |
|
|
|
(0.02 |
) |
% |
|
|
— |
|
% |
Allowance for loan losses as a percentage of total loans |
|
|
|
1.09 |
|
|
|
|
1.39 |
|
|
Allowance for loan losses to total nonacrrual loans |
|
|
|
26.71 |
|
x |
|
|
7.00 |
|
x |
|
|
|
|
|
|
|
|
|
|
||
Components of the allowance for loan losses: |
|
|
|
|
|
|
|
|
|
||
General reserves |
|
$ |
|
6,834 |
|
|
$ |
|
7,396 |
|
|
Specific reserve allocations |
|
|
|
4 |
|
|
|
|
222 |
|
|
Total allowance for loan losses |
|
$ |
|
6,838 |
|
|
$ |
|
7,618 |
|
|
The allowance for loan losses totaled $6.8 million, or 1.09%, of total loans at year-end 2022 as compared to $7.6 million, or 1.39%, of total loans at year-end 2021. The Bank had net loan recoveries of $115 thousand in 2022 compared to net loan charge-offs of $1 thousand for 2021.
The Company maintains an internal watch list on which it places loans where management’s analysis of the borrower’s operating results and financial condition indicates the borrower’s cash flows are inadequate to meet its debt service requirements and loans where there exists an increased risk that such a shortfall may occur. Nonperforming loans, which consist of loans past due 90 days or more and nonaccrual loans, aggregated $256 thousand, or 0.04%, of loans at year-end 2022 compared to $1.1 million, or 0.20%, of loans at year-end 2021. Impaired loans were $1 million at year-end 2022 as compared to $2 million at year-end 2021. Management has assigned loss allocations to absorb the estimated losses on impaired loans. These allocations are included in the total allowance for loan losses balance.
22
Other Assets
Net premises and equipment decreased $452 thousand to $13.4 million at year-end 2022 with depreciation expense exceeding purchases. Total bank-owned life insurance increased from $24 million at year-end 2021 to $24.7 million at year-end 2022 with increasing cash surrender values. There was no other real estate owned on December 31, 2022 or 2021. The Company recognized a net deferred tax asset of $3 million on December 31, 2022 compared to a net deferred tax asset of $325 thousand on December 31, 2021. The increase in the net deferred tax asset is a result of the increase in the gross unrealized losses on available-for-sale securities which is a result of rising interest rates during 2022.
Deposits
The Company’s deposits are obtained primarily from individuals and businesses located in its market area. For deposits, the Company must compete with products offered by other financial institutions, as well as alternative investment options. Demand and savings deposits increased for the year ended 2022, at a lesser growth trajectory following the trillions of government stimulus relief pumped into the economy during the COVID-19 pandemic. Market rates on deposits and cash management products increased throughout the year as liquidity decreased in the industry.
|
|
|
December 31 |
|
|
|
Change from 2021 |
|
|
||||||||||||
(Dollars in thousands) |
|
|
2022 |
|
|
|
2021 |
|
|
|
Amount |
|
|
|
% |
|
|
||||
Noninterest-bearing demand |
|
$ |
|
350,283 |
|
|
$ |
|
334,346 |
|
|
$ |
|
15,937 |
|
|
|
|
5 |
|
% |
Interest-bearing demand |
|
|
|
241,227 |
|
|
|
|
242,387 |
|
|
|
|
(1,160 |
) |
|
|
|
— |
|
|
Traditional savings |
|
|
|
194,918 |
|
|
|
|
191,836 |
|
|
|
|
3,082 |
|
|
|
|
2 |
|
|
Money market savings |
|
|
|
118,908 |
|
|
|
|
112,803 |
|
|
|
|
6,105 |
|
|
|
|
5 |
|
|
Time deposits in excess of $250,000 |
|
|
|
28,089 |
|
|
|
|
26,213 |
|
|
|
|
1,876 |
|
|
|
|
7 |
|
|
Other time deposits |
|
|
|
89,992 |
|
|
|
|
95,162 |
|
|
|
|
(5,170 |
) |
|
|
|
(5 |
) |
|
Total deposits |
|
$ |
|
1,023,417 |
|
|
$ |
|
1,002,747 |
|
|
$ |
|
20,670 |
|
|
|
|
2 |
|
% |
Other Funding Sources
The Company obtains additional funds through securities sold under repurchase agreements, overnight borrowings from the FHLB or other financial institutions, and advances from the FHLB. Short-term borrowings, consisting of securities sold under repurchase agreements, decreased $4 million. Other borrowings, consisting of FHLB advances, decreased $946 thousand as the result of principal repayments. All FHLB borrowings on December 31, 2022, have long term maturities with monthly amortizing payments.
CAPITAL RESOURCES
Total shareholders’ equity was $95.9 million at December 31, 2022 compared to $97.3 million on December 31, 2021. This decrease was primarily due to a $10.8 million accumulated other comprehensive loss recognized on the available-for-sale securities portfolio resulting from increasing interest rates. Dividends were paid of $3.5 million and $388 thousand treasury stock was repurchased in 2022, which was partially offset by net income of $13.3 million. The Board of Directors approved a Stock Repurchase Program on February 26, 2021, allowing the repurchase of up to 5% of the Company’s then-outstanding common shares. Repurchased shares are to be held as treasury stock and are available for general corporate purposes. On December 31, 2022, approximately 102 thousand shares could still be repurchased under the current authorized program. Shares repurchased during 2022 totaled 10,448 shares for $388 thousand and shares purchased in 2021 totaled 24,326 shares for $939 thousand.
Effective January 1, 2015, the Federal Reserve adopted final rules implementing Basel III and regulatory capital changes required by the Dodd-Frank Act. The rules apply to both the Company and the Bank. The rules established minimum risk-based and leverage capital requirements for all banking organizations. The rules include: (a) a common equity tier 1 capital ratio of at least 4.5%, (b) a tier 1 capital ratio of at least 6.0%, (c) a minimum total capital ratio of at least 8.0%, and (d) a minimum leverage ratio of 4%. Under the guidelines, capital is compared to the relative risk related to the balance sheet. To derive the risk included in the balance sheet, one of several risk weights is applied to different balance sheet and off-balance sheet assets primarily based on the relative credit risk of the counterparty. The capital amounts and classifications are also subject to qualitative judgments by the regulators about components, risk weightings, and other factors. The rules also place restrictions on the payment of capital distributions, including dividends, and certain discretionary bonus payments to executive officers if the company does not hold a capital conservation buffer of greater than 2.5% composed of common equity tier 1 capital above its minimum risk-based capital requirements. The Company and Bank’s actual and required capital amounts are disclosed in Note 12 to the consolidated financial statements.
Dividends paid by the Bank to CSB are the primary source of funds available to the Company for payment of dividends to shareholders and for other working capital needs. The payment of dividends by the Bank to the Company is subject to restrictions by regulatory authorities, which generally limit dividends to current year net income and the prior two (2) years net retained earnings, as defined by regulation. In addition, dividend payments generally cannot reduce regulatory capital levels below the minimum regulatory guidelines discussed above.
23
LIQUIDITY
|
|
|
December 31 |
|
|
|
|
|
|
|||||||
(Dollars in thousands) |
|
|
2022 |
|
|
|
2021 |
|
|
|
Change |
|
|
|||
Cash and cash equivalents |
|
$ |
|
86,420 |
|
|
$ |
|
243,657 |
|
|
$ |
|
(157,237 |
) |
|
Unused lines of credit |
|
|
|
122,062 |
|
|
|
|
107,054 |
|
|
|
|
15,008 |
|
|
Unpledged AFS securities at fair market value |
|
|
|
134,401 |
|
|
|
|
108,158 |
|
|
|
|
26,243 |
|
|
|
|
$ |
|
342,883 |
|
|
$ |
|
458,869 |
|
|
$ |
|
(115,986 |
) |
|
Net deposits and short-term liabilities |
|
$ |
|
1,041,016 |
|
|
$ |
|
1,016,821 |
|
|
$ |
|
24,195 |
|
|
Liquidity ratio |
|
|
|
32.9 |
|
% |
|
|
47.6 |
|
% |
|
|
|
|
|
Minimum board approved liquidity ratio |
|
|
|
20.0 |
|
% |
|
|
20.0 |
|
% |
|
|
|
|
|
Liquidity refers to the Company’s ability to generate sufficient cash to fund current loan demand, meet deposit withdrawals, pay operating expenses, and meet other obligations. Liquidity is monitored by CSB’s Asset Liability Committee. The Company was within all Board-approved limits on December 31, 2022, and 2021. Additional sources of liquidity include net income, loan repayments, the availability of borrowings, and adjustments of interest rates to attract deposit accounts.
As summarized in the Consolidated Statements of Cash Flows, the most significant investing activities for the Company in 2022 included net loan originations of $78 million and securities purchases of $144 million, offset by maturities and repayment of securities totaling $38 million. The Company’s financing activities included a $21 million increase in deposits, $4 million in cash dividends paid, and a $4 million decrease in short-term borrowings.
QUANTITATIVE AND QUALITATIVE DISCLOSURES ABOUT MARKET RISK
The most significant market risk the Company is exposed to is interest rate risk. The business of the Company and the composition of its balance sheet consist of investments in interest-earning assets (primarily loans and securities), which are funded by interest-bearing liabilities (deposits and borrowings). These financial instruments have varying levels of sensitivity to changes in the market rates of interest, resulting in market risk. None of the Company’s financial instruments are held for trading purposes.
The Board of Directors establishes policies and operating limits with respect to interest rate risk. The Company manages interest rate risk regularly through its Asset Liability Committee. The Committee meets periodically to review various asset and liability management information including, but not limited to, the Company’s liquidity position, projected sources and uses of funds, interest rate risk position, and economic conditions.
Interest rate risk is monitored primarily through the use of an earnings simulation model. The model is highly dependent on various assumptions, which change regularly as the balance sheet and market interest rates change. The earnings simulation model projects change in net interest income resulting from the effect of changes in interest rates. The analysis is performed quarterly over a twenty-four-month horizon. The analysis includes two (2) balance sheet models, one based on a static balance sheet and one on a dynamic balance sheet with projected growth in assets and liabilities. This analysis is performed by estimating the expected cash flows of the Company’s financial instruments using interest rates in effect at year-end 2022 and 2021. Interest rate risk policy limits are tested by measuring the anticipated change in net interest income over a two-year period. The tests assume quarterly ramped increases and decreases in market interest rates over twenty-four month hoizons, as compared to a stable rate environment or base model. The following table reflects the change to net interest income using a dynamic balance sheet for the first twelve-month periods of the twenty-four month horizon.
Net Interest Income at Risk
24
|
December 31, 2022 |
|
|||||||||||||||||||||
|
|
Change In |
|
|
Net |
|
|
|
Dollar |
|
|
Percentage |
|
|
Board |
|
|||||||
(Dollars in thousands) |
|
|
+ 400 |
|
|
|
$ |
|
38,810 |
|
|
$ |
|
1,090 |
|
|
|
2.9 |
|
% |
± 25 |
% |
|
|
|
|
+ 300 |
|
|
|
|
|
38,581 |
|
|
|
|
861 |
|
|
|
2.3 |
|
|
± 15 |
|
|
|
|
|
+ 200 |
|
|
|
|
|
38,302 |
|
|
|
|
582 |
|
|
|
1.5 |
|
|
± 10 |
|
|
|
|
|
+ 100 |
|
|
|
|
|
38,003 |
|
|
|
|
283 |
|
|
|
0.8 |
|
|
± 5 |
|
|
|
|
|
|
0 |
|
|
|
|
|
37,720 |
|
|
|
|
— |
|
|
|
— |
|
|
|
|
|
|
|
– 100 |
|
|
|
|
|
37,368 |
|
|
|
|
(352 |
) |
|
|
(0.9 |
) |
|
± 5 |
|
|
|
|
|
– 200 |
|
|
|
|
|
36,869 |
|
|
|
|
(851 |
) |
|
|
(2.3 |
) |
|
± 10 |
|
|
|
|
|
– 300 |
|
|
|
|
|
35,973 |
|
|
|
|
(1,747 |
) |
|
|
(4.6 |
) |
|
± 15 |
|
|
|
|
|
– 400 |
|
|
|
|
|
35,519 |
|
|
|
|
(2,201 |
) |
|
|
(5.8 |
) |
|
± 25 |
|
|
|
|
|
|
|
|
|
|
|
|
|
|
|
|
|
|
|
|
|
|
||||
|
December 31, 2021 |
|
|||||||||||||||||||||
|
|
|
+ 400 |
|
|
|
$ |
|
28,632 |
|
|
$ |
|
1,499 |
|
|
|
5.5 |
|
% |
± 25 |
% |
|
|
|
|
+ 300 |
|
|
|
|
|
28,283 |
|
|
|
|
1,150 |
|
|
|
4.2 |
|
|
± 15 |
|
|
|
|
|
+ 200 |
|
|
|
|
|
27,924 |
|
|
|
|
791 |
|
|
|
2.9 |
|
|
± 10 |
|
|
|
|
|
+ 100 |
|
|
|
|
|
27,523 |
|
|
|
|
390 |
|
|
|
1.4 |
|
|
± 5 |
|
|
|
|
|
|
0 |
|
|
|
|
|
27,133 |
|
|
|
|
— |
|
|
|
— |
|
|
|
|
|
|
|
– 100 |
|
|
|
|
|
26,504 |
|
|
|
|
(629 |
) |
|
|
(2.3 |
) |
|
± 5 |
|
|
|
|
|
– 200 |
|
|
|
|
|
25,714 |
|
|
|
|
(1,419 |
) |
|
|
(5.2 |
) |
|
± 10 |
|
|
Management reviews Net Interest Income at Risk with the Board on a periodic basis. The Company was within all Board-approved limits at December 31, 2022 and 2021 for the first twelve-month periods of the twenty-four month horizon.
Economic Value of Equity at Risk
|
December 31, 2022 |
|||||||
Change In |
Percentage |
|
|
Board |
|
|||
|
+ 400 |
|
|
13.2 |
|
% |
± 35 |
% |
|
+ 300 |
|
|
11.2 |
|
|
± 30 |
|
|
+ 200 |
|
|
8.5 |
|
|
± 20 |
|
|
+ 100 |
|
|
4.8 |
|
|
± 15 |
|
|
– 100 |
|
|
(6.3 |
) |
|
± 15 |
|
|
– 200 |
|
|
(14.5 |
) |
|
± 20 |
|
|
– 300 |
|
|
(25.4 |
) |
|
± 30 |
|
|
– 400 |
|
|
(39.4 |
) |
|
± 35 |
|
|
|
|
|
|
|
|
|
|
|
December 31, 2021 |
|||||||
|
+ 400 |
|
|
40.3 |
|
% |
± 35 |
% |
|
+ 300 |
|
|
33.0 |
|
|
± 30 |
|
|
+ 200 |
|
|
24.4 |
|
|
± 20 |
|
|
+ 100 |
|
|
13.8 |
|
|
± 15 |
|
|
– 100 |
|
|
(18.4 |
) |
|
± 15 |
|
|
– 200 |
|
n/a |
|
|
± 20 |
|
|
The economic value of equity is calculated by subjecting the period-end balance sheet to changes in interest rates and measuring the impact of the changes on the values of the assets and liabilities. Hypothetical changes in interest rates are then applied to the financial instruments. Then the cash flows and fair values are again estimated using these hypothetical rates. For the net interest income estimates, the hypothetical rates are applied to the financial instruments based on the assumed cash flows.
Management periodically measures and reviews the economic value of equity at risk with the Board. As of December 31, 2022, the percentage change of the market value of equity was outside of the board policy limit in the -400 basis point scenario and as of December 31, 2021, the percentage change was outside the board policy limits in the +200 through +400 basis point rate scenarios as well as the -100 basis point change. In the rising rate scenarios, the exceptions are positive as the market value of equity increases as interest rates increase. The technical fails have a favorable impact to equity in the rising rate scenarios. In the declining rate scenarios in 2022 and 2021, the duration of liabilities remains high and loan prepayment speeds increase causing decreases in the market value of equity of (39.4)% in the -400 basis point rate scenario as of December 31, 2022 and (18.4)% in the -100 basis point rate scenario as of December 31, 2021.
SIGNIFICANT ASSUMPTIONS AND OTHER CONSIDERATIONS
25
The above analysis is based on numerous assumptions, including relative levels of market interest rates, loan prepayments, and reactions of depositors to changes in interest rates and this should not be relied upon as being indicative of actual results. Further, the analysis does not contemplate all actions the Company may undertake in response to changes in interest rates.
U.S. Treasury securities, obligations of U.S. Government corporations and agencies, obligations of states and political subdivisions will generally repay at their stated maturity or if callable, prior to their final maturity date. Mortgage-backed security payments increase when interest rates are low and decrease when interest rates rise. Most of the Company’s loans permit the borrower to prepay the principal balance prior to maturity without penalty. The likelihood of prepayment depends on a number of factors: current interest rate and interest rate index (if any) on the loan, the financial ability of the borrower to refinance, the economic benefit to be obtained from refinancing, availability of refinancing at attractive terms, as well as economic conditions in specific geographic areas, which affect the sales and price levels of residential and commercial property. In a changing interest rate environment, prepayments may increase or decrease on fixed and adjustable-rate loans depending on the current relative levels and expectations of future short-term and long-term interest rates. Prepayments on adjustable-rate loans generally increase when long-term interest rates fall or are at historically low levels relative to short-term interest rates, thus making fixed rate loans more desirable. While savings and checking deposits generally may be withdrawn upon the customer’s request without prior notice, a continuing relationship with customers resulting in future deposits and withdrawals is generally predictable, leading to a dependable and uninterrupted source of funds. Time deposits generally have early withdrawal penalties, which discourage customer withdrawal prior to maturity. Short-term borrowings have fixed maturities. Certain advances from the FHLB carry prepayment penalties and are expected to be repaid in accordance with their contractual terms.
FAIR VALUE MEASUREMENTS
The Company discloses the estimated fair value of its financial instruments on December 31, 2022, and 2021 in Note 15 to the Consolidated Financial Statements.
OFF-BALANCE SHEET ARRANGEMENTS, CONTRACTUAL OBLIGATIONS, AND CONTINGENT LIABILITIES AND COMMITMENTS
The following table summarizes the Company’s loan commitments, including letters of credit, as of December 31, 2022:
|
Amount of Commitment to Expire Per Period |
|
|||||||||||||||||||||||
(Dollars in thousands) |
|
|
Total |
|
|
|
Less than |
|
|
|
1 to 3 |
|
|
|
3 to 5 |
|
|
|
Over 5 |
|
|||||
Commercial lines of credit |
|
$ |
|
152,607 |
|
|
$ |
|
129,332 |
|
|
$ |
|
18,363 |
|
|
$ |
|
4,847 |
|
|
$ |
|
65 |
|
Commercial real estate |
|
|
|
4,416 |
|
|
|
|
4,366 |
|
|
|
|
— |
|
|
|
|
50 |
|
|
|
|
— |
|
Residential real estate lines of credit |
|
|
|
77,855 |
|
|
|
|
2,912 |
|
|
|
|
10,066 |
|
|
|
|
14,937 |
|
|
|
|
49,940 |
|
Construction |
|
|
|
16,268 |
|
|
|
|
12,973 |
|
|
|
|
3,295 |
|
|
|
|
— |
|
|
|
|
— |
|
Consumer lines of credit |
|
|
|
596 |
|
|
|
|
596 |
|
|
|
|
— |
|
|
|
|
— |
|
|
|
|
— |
|
Credit card lines |
|
|
|
7,465 |
|
|
|
|
7,465 |
|
|
|
|
— |
|
|
|
|
— |
|
|
|
|
— |
|
Overdraft privilege |
|
|
|
7,215 |
|
|
|
|
7,215 |
|
|
|
|
— |
|
|
|
|
— |
|
|
|
|
— |
|
Letters of credit |
|
|
|
1,376 |
|
|
|
|
1,245 |
|
|
|
|
105 |
|
|
|
|
26 |
|
|
|
|
— |
|
Total commitments |
|
$ |
|
267,798 |
|
|
$ |
|
166,104 |
|
|
$ |
|
31,829 |
|
|
$ |
|
19,860 |
|
|
$ |
|
50,005 |
|
All lines of credit represent either fee-paid or legally binding loan commitments for the loan categories noted. Letters of credit are also included in the amounts noted in the table since the Company requires each letter of credit be supported by a loan agreement. The commercial and consumer lines represent both unsecured and secured obligations. The real estate lines are secured by mortgages on residential property. It is anticipated that a significant portion of these lines will expire without being drawn upon.
The following table summarizes the Company’s other contractual obligations, exclusive of interest, as of December 31, 2022:
|
Payment Due by Period |
|
|||||||||||||||||||||||
(Dollars in thousands) |
|
|
Total |
|
|
|
Less |
|
|
|
1 to 3 |
|
|
|
3 to 5 |
|
|
|
Over 5 |
|
|||||
Total time deposits |
|
$ |
|
118,081 |
|
|
$ |
|
66,598 |
|
|
$ |
|
49,606 |
|
|
$ |
|
1,877 |
|
|
$ |
|
— |
|
Short-term borrowings |
|
|
|
32,550 |
|
|
|
|
32,550 |
|
|
|
|
— |
|
|
|
|
— |
|
|
|
|
— |
|
Other borrowings |
|
|
|
2,461 |
|
|
|
|
707 |
|
|
|
|
837 |
|
|
|
|
457 |
|
|
|
|
460 |
|
Operating leases |
|
|
|
326 |
|
|
|
|
92 |
|
|
|
|
178 |
|
|
|
|
56 |
|
|
|
|
— |
|
Total obligations |
|
$ |
|
153,418 |
|
|
$ |
|
99,947 |
|
|
$ |
|
50,621 |
|
|
$ |
|
2,390 |
|
|
$ |
|
460 |
|
The other borrowings noted in the preceding table represent borrowings from the FHLB. The notes require payment of interest on a monthly basis with principal due in monthly installments. The obligations bear stated fixed interest rates and stipulate a prepayment penalty if the note’s interest rate exceeds the current market rate for similar borrowings at the time of repayment. As the notes mature, the Company evaluates the liquidity and interest rate circumstances at that time to determine whether to pay off or renew the note. The evaluation process typically includes: the strength of current and projected customer loan demand, the Company’s federal funds sold or purchased position, projected cash flows from
26
maturing investment securities, the current and projected market interest rate environment, local and national economic conditions, and customer demand for the Company’s deposit product offerings.
CRITICAL ACCOUNTING POLICIES
The Company’s Consolidated Financial Statements are prepared in accordance with U.S. Generally Accepted Accounting Principles and follow general practices within the commercial banking industry. Application of these principles requires management to make estimates, assumptions, and judgments affecting the amounts reported in the financial statements. These estimates, assumptions, and judgments are based upon the information available as of the date of the financial statements.
The most significant accounting policies followed by the Company are presented in Note 1- Summary of Significant Accounting Policies. These policies, along with the other disclosures presented in the Notes to Consolidated Financial Statements and the 2022 Financial Review, provide information about how significant assets and liabilities are valued in the financial statements and how those values are determined. Management has identified the other-than-temporary impairment of securities, allowance for loan losses, goodwill, and the fair value of financial instruments as the accounting areas requiring the most subjective and complex estimates, assumptions, and judgments and, as such, could be the most subject to revision as new information becomes available.
Securities are evaluated periodically to determine whether a decline in their value is other-than-temporary. Management utilizes criteria such as the magnitude and duration of the decline, in addition to the reasons underlying the decline, to determine whether the loss in value is other-than-temporary. The term “other-than-temporary” is not intended to indicate a permanent decline but indicates that the prospect for a near-term recovery of value is not necessarily favorable, or that there is a lack of evidence to support a realizable value equal to or greater than the carrying value of the investment. Once a decline in value is determined to be other-than-temporary, the value of the security is reduced and a corresponding charge to earnings is recognized.
As previously noted in the section entitled Allowance for Loan Losses, management performs an analysis to assess the adequacy of its allowance for loan losses. This analysis encompasses a variety of factors including: the potential loss exposure for individually reviewed loans, the historical loss experience, the volume of nonperforming loans (i.e., loans in nonaccrual status or past due 90 days or more), and loans past due 30 to 89 days, any significant changes in lending or loan review staff, an evaluation of current and future economic conditions, any significant changes in the volume or mix of loans within each category, a review of the significant concentrations of credit, and any legal, competitive, or regulatory concerns.
The Company accounts for business combinations using the acquisition method of accounting. Goodwill and intangible assets with indefinite useful lives are not amortized. Intangible assets with finite useful lives are amortized using accelerated methods over their estimated weighted-average useful lives, approximating ten years.
The Company groups financial assets and financial liabilities measured at fair value in three (3) levels based on the markets in which the assets and liabilities are traded, and the reliability of the assumptions used to determine fair value. Level I valuations are obtained from readily available pricing sources for market transactions involving identical assets or liabilities. Level II valuations are for instruments traded in less active dealer or broker markets and incorporate values obtained for identical or comparable instruments. Level III valuations are derived from other valuation methodologies, including discounted cash flow models and similar techniques, and not based on market exchange, dealer, or broker traded transactions. Level III valuations incorporate certain assumptions and projections in determining the fair value assigned to each instrument.
IMPACT OF INFLATION AND CHANGING PRICES
The Consolidated Financial Statements and related data presented herein have been prepared in accordance with U.S. Generally Accepted Accounting Principles, requiring measurement of financial position, and results of operations primarily in terms of historical dollars without considering changes in the relative purchasing power of money over time due to inflation. Most assets and liabilities of the Company are monetary in nature. Therefore, interest rates have a more significant impact on the Company’s performance than the effects of general levels of inflation. Interest rates do not necessarily move in the same direction or magnitude as prices of goods and services. The liquidity, maturity structure, and quality of the Company’s assets and liabilities are critical to maintenance of acceptable performance levels.
COMMON STOCK AND SHAREHOLDER INFORMATION
Common shares of the Company are not traded on an established market. Shares are traded on the OTC market through broker/ dealers under the symbol “CSBB” and through private transactions. The table below represents the range of high and low prices paid for transactions known to the Company. Management does not have knowledge of prices paid on all transactions. Because of the lack of an established market, these prices may not reflect the prices at which stock would trade in an active market. These quotations reflect interdealer prices, without mark-up, mark-down, or commission and may not represent actual transactions. The table specifies cash dividends declared by the Company to its shareholders during 2022 and 2021. No assurances can be given that future dividends will be declared, or if declared, what the amount of any such dividends
27
will be. Additional information concerning restrictions over the payment of dividends is included in Note 12 of the Consolidated Financial Statements.
Quarterly Common Stock Price and Dividend Data
Quarter Ended |
|
|
High |
|
|
|
Low |
|
|
|
Dividends |
|
|
|
Dividends |
|
||||
March 31, 2022 |
|
$ |
|
39.60 |
|
|
$ |
|
37.50 |
|
|
$ |
|
0.00 |
|
|
$ |
|
— |
|
June 30, 2022 |
|
|
|
43.45 |
|
|
|
|
36.50 |
|
|
|
|
0.62 |
|
|
|
|
1,685,175 |
|
September 30, 2022 |
|
|
|
40.50 |
|
|
|
|
37.00 |
|
|
|
|
0.33 |
|
|
|
|
893,500 |
|
December 31, 2022 |
|
|
|
43.00 |
|
|
|
|
35.02 |
|
|
|
|
0.35 |
|
|
|
|
947,652 |
|
|
|
|
|
|
|
|
|
|
|
|
|
|
|
|
|
|
||||
March 31, 2021 |
|
$ |
|
38.50 |
|
|
$ |
|
36.11 |
|
|
$ |
|
0.30 |
|
|
$ |
|
822,705 |
|
June 30, 2021 |
|
|
|
39.00 |
|
|
|
|
37.10 |
|
|
|
|
0.30 |
|
|
|
|
820,273 |
|
September 30, 2021 |
|
|
|
39.98 |
|
|
|
|
36.65 |
|
|
|
|
0.31 |
|
|
|
|
844,912 |
|
December 31, 2021 |
|
|
|
39.99 |
|
|
|
|
37.50 |
|
|
|
|
0.31 |
|
|
|
|
842,587 |
|
As of December 31, 2022, the Company had 1,082 shareholders of record and 2,707,576 outstanding shares of common stock.
ITEM 7A. QUANTITATIVE AND QUALITATIVE DISCLOSURES ABOUT MARKET RISK.
Information contained in the section captioned, “Quantitative and Qualitative Disclosures about Market Risk” located in Item 7 MD&A is incorporated by reference herein.
ITEM 8. FINANCIAL STATEMENTS AND SUPPLEMENTARY DATA.
REPORT ON MANAGEMENT’S ASSESSMENT OF INTERNAL CONTROL OVER FINANCIAL REPORTING
The management of CSB Bancorp, Inc. is responsible for establishing and maintaining adequate internal control over financial reporting as defined in Rules 13a-15(f) and 15d-15(f) of the Securities Exchange Act of 1934, as amended. The Company’s internal control over financial reporting is designed to provide reasonable assurance that our published financial statements are fairly presented, in all material respects, in conformity with generally accepted accounting principles.
Because of its inherent limitations, internal control over financial reporting may not prevent or detect misstatements. Also, projections of any evaluation of effectiveness to future periods are subject to the risk that controls may become inadequate because of changes in conditions, or that the degree of compliance with the policies or procedures may deteriorate.
Management conducted the required assessment of the effectiveness of the Company’s internal control over financial reporting as of December 31, 2022. Management’s assessment did not identify any material weaknesses in the Company’s internal control over financial reporting. In making this assessment, management used the criteria set forth by the Committee of Sponsoring Organizations of the Treadway Commission (COSO) in the 2013 Internal Control-Integrated Framework. Based upon this assessment, management believes that the Company’s internal control over financial reporting is effective as of December 31, 2022.
|
|
|
|
|
|
|
|
|
|
Eddie L. Steiner |
|
|
|
Paula J. Meiler |
President, |
|
|
|
Senior Vice President, |
Chief Executive Officer |
|
|
|
Chief Financial Officer |
28

REPORT OF INDEPENDENT REGISTERED PUBLIC ACCOUNTING FIRM
To the Shareholders and the Board of Directors of CSB Bancorp, Inc.
Opinion on the Financial Statements
We have audited the accompanying consolidated balance sheets of CSB Bancorp, Inc. and subsidiaries (the “Company”) as of December 31, 2022 and 2021; the related consolidated statements of income, comprehensive income, changes in shareholders’ equity, and cash flows for the years then ended; and the related notes to the consolidated financial statements (collectively, the financial statements). In our opinion, the financial statements present fairly, in all material respects, the financial position of the Company as of December 31, 2022 and 2021, and the results of its operations and its cash flows for the years then ended, in conformity with accounting principles generally accepted in the United States of America.
Basis for Opinion
These financial statements are the responsibility of the Company’s management. Our responsibility is to express an opinion on the Company’s financial statements based on our audits. We are a public accounting firm registered with the Public Company Accounting Oversight Board (United States) (PCAOB) and are required to be independent, with respect to the Company, in accordance with U.S. federal securities laws and the applicable rules and regulations of the Securities and Exchange Commission and the PCAOB.
We conducted our audits in accordance with the standards of the PCAOB. Those standards require that we plan and perform the audit to obtain reasonable assurance about whether the financial statements are free of material misstatement, whether due to error or fraud. The Company is not required to have, nor were we engaged to perform, an audit of its internal control over financial reporting. As part of our audits, we are required to obtain an understanding of internal control over financial reporting but not for the purpose of expressing an opinion on the effectiveness of the Company’s internal control over financial reporting. Accordingly, we express no such opinion.
Our audits included performing procedures to assess the risks of material misstatement of the financial statements, whether due to error or fraud, and performing procedures that respond to those risks. Such procedures included examining, on a test basis, evidence regarding the amounts and disclosures in the financial statements. Our audits also included evaluating the accounting principles used and significant estimates made by management, as well as evaluating the overall presentation of the financial statements. We believe that our audits provide a reasonable basis for our opinion.
Critical Audit Matters
The critical audit matters communicated below are matters arising from the current period audit of the financial statements that were communicated or required to be communicated to the Audit Committee and that: (1) relate to accounts or disclosures that are material to the financial statements; and (2) involve our especially challenging, subjective, or complex judgments. The communication of critical audit matters does not alter, in any way, our opinion on the financial statements, taken as a whole, and we are not, by communicating the critical audit matters below, providing separate opinions on the critical audit matters or on the accounts or disclosures to which they relate.
29

Crititcal Audit Matters (continued)
Allowance for Loan Losses (ALL) – Qualitative Factors
Description of the Matter
The Company’s loan portfolio totaled $627 million as of December 31, 2022, and the associated ALL was $6.8 million. As discussed in Notes 1 and 3 to the consolidated financial statements, determining the amount of the ALL requires significant judgment about the collectability of loans, which includes an assessment of historical loss experience within each risk category of loans, qualitative adjustment to those historical loss allocations, and testing of certain commercial loans for impairment. Management applies qualitative adjustments to the historical loss rate to reflect the inherent losses that exist in the loan portfolio at the balance sheet date that are not reflected in the historical loss experience. Qualitative adjustments are made based upon changes in lending policies and practices, economic conditions, changes in the loan portfolio mix, trends in loan delinquencies and classified loans, collateral values, concentrations of credit risk for the commercial loan
portfolios, and other specific industry factors.
We identified these qualitative adjustments within the ALL as critical audit matters because they involve a high degree of subjectivity and are highly difficult to estimate. In turn, auditing management’s judgments regarding the qualitative factors applied in the ALL calculation involved a high degree of subjectivity.
How We Addressed the Matter in Our Audit
We gained an understanding of the Company’s process for establishing the ALL, including the qualitative adjustments made to the ALL. We evaluated the design and tested the operating effectiveness of controls over the Company’s ALL process, which included, among others, management’s review and approval controls designed to assess the need and level of qualitative adjustments to the ALL, as well as the reliability of the data utilized to support management’s assessment. To test the qualitative adjustments, we evaluated the appropriateness of management’s methodology and assessed whether all relevant risks were reflected in the ALL.
Regarding the measurement of the qualitative adjustments, we evaluated the completeness, accuracy, and relevance of the data and inputs utilized in management’s estimate. For example, we compared the inputs and data used in the estimate to third-party macroeconomic data, and other internal and external data points, while considering the existence of new or contrary information. Furthermore, we analyzed the changes in the components of the qualitative reserves relative to changes in the supporting external or internal data. We assessed the reasonableness of the factors from both a directional perspective and from an overall magnitude perspective as compared to the underlying data. We also compared the level of the Company’s ALL reserves to a peer group (adjusted for differences in credit quality) to gain additional evidence of the reasonableness of the magnitude of the ALL overall.
We have served as the Company’s auditor since 2005.

Cranberry Township, Pennsylvania
March 16, 2023
30
CONSOLIDATED BALANCE SHEETS
At December 31, 2022 and 2021
(Dollars in thousands, except per share data) |
|
2022 |
|
|
2021 |
|
||
ASSETS |
|
|
|
|
|
|
||
Cash and cash equivalents |
|
|
|
|
|
|
||
Cash and due from banks |
|
$ |
|
|
$ |
|
||
Interest-earning deposits in other banks |
|
|
|
|
|
|
||
Total cash and cash equivalents |
|
|
|
|
|
|
||
|
|
|
|
|
|
|
||
Securities |
|
|
|
|
|
|
||
Available-for-sale, at fair value |
|
|
|
|
|
|
||
Held-to-maturity; fair value of $ |
|
|
|
|
|
|
||
Equity securities |
|
|
|
|
|
|
||
Restricted stock, at cost |
|
|
|
|
|
|
||
Total securities |
|
|
|
|
|
|
||
|
|
|
|
|
|
|
||
Loans held for sale |
|
|
|
|
|
|
||
|
|
|
|
|
|
|
||
Loans |
|
|
|
|
|
|
||
Less allowance for loan losses |
|
|
|
|
|
|
||
Net loans |
|
|
|
|
|
|
||
|
|
|
|
|
|
|
||
Premises and equipment, net |
|
|
|
|
|
|
||
Goodwill |
|
|
|
|
|
|
||
Bank-owned life insurance |
|
|
|
|
|
|
||
Accrued interest receivable and other assets |
|
|
|
|
|
|
||
TOTAL ASSETS |
|
$ |
|
|
$ |
|
||
|
|
|
|
|
|
|
||
LIABILITIES AND SHAREHOLDERS’ EQUITY |
|
|
|
|
|
|
||
LIABILITIES |
|
|
|
|
|
|
||
Deposits |
|
|
|
|
|
|
||
Noninterest-bearing |
|
$ |
|
|
$ |
|
||
Interest-bearing |
|
|
|
|
|
|
||
Total deposits |
|
|
|
|
|
|
||
|
|
|
|
|
|
|
||
Short-term borrowings |
|
|
|
|
|
|
||
Other borrowings |
|
|
|
|
|
|
||
Accrued interest payable and other liabilities |
|
|
|
|
|
|
||
Total liabilities |
|
|
|
|
|
|
||
|
|
|
|
|
|
|
||
SHAREHOLDERS’ EQUITY |
|
|
|
|
|
|
||
Common stock, $ |
|
|
|
|
|
|
||
Additional paid-in capital |
|
|
|
|
|
|
||
Retained earnings |
|
|
|
|
|
|
||
Treasury stock at cost: |
|
|
( |
) |
|
|
( |
) |
Accumulated other comprehensive loss |
|
|
( |
) |
|
|
( |
) |
Total shareholders’ equity |
|
|
|
|
|
|
||
TOTAL LIABILITIES AND SHAREHOLDERS’ EQUITY |
|
$ |
|
|
$ |
|
||
These consolidated financial statements should be read in connection with the accompanying notes to the consolidated financial statements.
31
CONSOLIDATED STATEMENTS OF INCOME
Years Ended December 31, 2022 and 2021
(Dollars in thousands, except per share data) |
|
2022 |
|
|
2021 |
|
||
INTEREST AND DIVIDEND INCOME |
|
|
|
|
|
|
||
Loans, including fees |
|
$ |
|
|
$ |
|
||
Taxable securities |
|
|
|
|
|
|
||
Nontaxable securities |
|
|
|
|
|
|
||
Other |
|
|
|
|
|
|
||
Total interest and dividend income |
|
|
|
|
|
|
||
INTEREST EXPENSE |
|
|
|
|
|
|
||
Deposits |
|
|
|
|
|
|
||
Short-term borrowings |
|
|
|
|
|
|
||
Other borrowings |
|
|
|
|
|
|
||
Total interest expense |
|
|
|
|
|
|
||
NET INTEREST INCOME |
|
|
|
|
|
|
||
|
|
|
|
|
|
|
||
RECOVERY FOR LOAN LOSSES |
|
|
( |
) |
|
|
( |
) |
Net interest income, after recovery for loan losses |
|
|
|
|
|
|
||
NONINTEREST INCOME |
|
|
|
|
|
|
||
Service charges on deposit accounts |
|
|
|
|
|
|
||
Trust services |
|
|
|
|
|
|
||
Debit card interchange fees |
|
|
|
|
|
|
||
Credit card fees |
|
|
|
|
|
|
||
Gain on sale of loans, net |
|
|
|
|
|
|
||
Earnings on bank owned life insurance |
|
|
|
|
|
|
||
Unrealized (loss) gain on equity securities |
|
|
( |
) |
|
|
|
|
Other income |
|
|
|
|
|
|
||
Total noninterest income |
|
|
|
|
|
|
||
NONINTEREST EXPENSES |
|
|
|
|
|
|
||
Salaries and employee benefits |
|
|
|
|
|
|
||
Occupancy expense |
|
|
|
|
|
|
||
Equipment expense |
|
|
|
|
|
|
||
Professional and director fees |
|
|
|
|
|
|
||
Financial institutions tax |
|
|
|
|
|
|
||
Marketing and public relations |
|
|
|
|
|
|
||
Software expense |
|
|
|
|
|
|
||
Debit card expense |
|
|
|
|
|
|
||
Amortization of intangible assets |
|
|
— |
|
|
|
|
|
FDIC insurance expense |
|
|
|
|
|
|
||
Other expenses |
|
|
|
|
|
|
||
Total noninterest expenses |
|
|
|
|
|
|
||
INCOME BEFORE INCOME TAXES |
|
|
|
|
|
|
||
FEDERAL INCOME TAX PROVISION |
|
|
|
|
|
|
||
NET INCOME |
|
$ |
|
|
$ |
|
||
EARNINGS PER SHARE |
|
|
|
|
|
|
||
Basic and diluted |
|
$ |
|
|
$ |
|
||
These consolidated financial statements should be read in connection with the accompanying notes to the consolidated financial statements.
32
CONSOLIDATED STATEMENTS OF COMPREHENSIVE INCOME
Years Ended December 31, 2022 and 2021
(Dollars in thousands) |
|
2022 |
|
|
2021 |
|
||
Net income |
|
$ |
|
|
$ |
|
||
Other comprehensive loss |
|
|
|
|
|
|
||
Unrealized loss on available-for-sale securities arising during the period |
|
|
( |
) |
|
|
( |
) |
Unrealized loss on securities transferred from available-for-sale to held-to-maturity |
|
|
— |
|
|
|
( |
) |
Amortization of held-to-maturity discount resulting from transfer |
|
|
|
|
|
|
||
Income tax effect at |
|
|
|
|
|
|
||
Other comprehensive loss |
|
|
( |
) |
|
|
( |
) |
Total comprehensive income |
|
$ |
|
|
$ |
|
||
These consolidated financial statements should be read in connection with the accompanying notes to the consolidated financial statements.
33
CONSOLIDATED STATEMENTS OF CHANGES IN
Years Ended December 31, 2022 and 2021
(Dollars in thousands, except per share data) |
|
Common |
|
|
Additional |
|
|
Retained |
|
|
Treasury |
|
|
Accumulated |
|
|
Total |
|
||||||
BALANCE AT DECEMBER 31, 2020 |
|
$ |
|
|
$ |
|
|
$ |
|
|
$ |
( |
) |
|
$ |
|
|
$ |
|
|||||
Net income |
|
|
— |
|
|
|
— |
|
|
|
|
|
|
— |
|
|
|
— |
|
|
|
|
||
Other comprehensive loss |
|
|
— |
|
|
|
— |
|
|
|
— |
|
|
|
— |
|
|
|
( |
) |
|
|
( |
) |
Purchase of |
|
|
— |
|
|
|
— |
|
|
|
— |
|
|
|
( |
) |
|
|
— |
|
|
|
( |
) |
Cash dividends declared, $ |
|
|
— |
|
|
|
— |
|
|
|
( |
) |
|
|
— |
|
|
|
— |
|
|
|
( |
) |
|
|
|
|
|
|
|
|
|
|
|
|
|
|
|
|
|
|
|
||||||
BALANCE AT DECEMBER 31, 2021 |
|
$ |
|
|
$ |
|
|
$ |
|
|
$ |
( |
) |
|
$ |
( |
) |
|
$ |
|
||||
Net income |
|
|
— |
|
|
|
— |
|
|
|
|
|
|
— |
|
|
|
— |
|
|
|
|
||
Other comprehensive loss |
|
|
— |
|
|
|
— |
|
|
|
— |
|
|
|
— |
|
|
|
( |
) |
|
|
( |
) |
Purchase of |
|
|
— |
|
|
|
— |
|
|
|
— |
|
|
|
( |
) |
|
|
— |
|
|
|
( |
) |
Cash dividends declared, $ |
|
|
— |
|
|
|
— |
|
|
|
( |
) |
|
|
— |
|
|
|
— |
|
|
|
( |
) |
|
|
|
|
|
|
|
|
|
|
|
|
|
|
|
|
|
|
|
||||||
BALANCE AT DECEMBER 31, 2022 |
|
$ |
|
|
$ |
|
|
$ |
|
|
$ |
( |
) |
|
$ |
( |
) |
|
$ |
|
||||
These consolidated financial statements should be read in connection with the accompanying notes to the consolidated financial statements.
34
CONSOLIDATED STATEMENTS OF CASH FLOWS
Years Ended December 31, 2022 and 2021
(Dollars in thousands) |
|
2022 |
|
|
2021 |
|
||
CASH FLOWS FROM OPERATING ACTIVITIES |
|
|
|
|
|
|
||
Net income |
|
$ |
|
|
$ |
|
||
Adjustments to reconcile net income to net cash provided by |
|
|
|
|
|
|
||
Depreciation and amortization of premises, equipment |
|
|
|
|
|
|
||
Deferred income taxes |
|
|
( |
) |
|
|
( |
) |
Recovery of provision for loan losses |
|
|
( |
) |
|
|
( |
) |
Gain on sale of loans, net |
|
|
( |
) |
|
|
( |
) |
Security amortization, net of accretion |
|
|
|
|
|
|
||
Secondary market loan sale proceeds |
|
|
|
|
|
|
||
Originations of secondary market loans held-for-sale |
|
|
( |
) |
|
|
( |
) |
Earnings on bank-owned life insurance |
|
|
( |
) |
|
|
( |
) |
Effects of changes in operating assets and liabilities: |
|
|
|
|
|
|
||
Net deferred loan fees (costs) |
|
|
( |
) |
|
|
( |
) |
Accrued interest receivable |
|
|
( |
) |
|
|
|
|
Accrued interest payable |
|
|
|
|
|
( |
) |
|
Other assets and liabilities |
|
|
|
|
|
|
||
Net cash provided by operating activities |
|
$ |
|
|
$ |
|
||
|
|
|
|
|
|
|
||
CASH FLOWS FROM INVESTING ACTIVITIES |
|
|
|
|
|
|
||
Securities: |
|
|
|
|
|
|
||
Proceeds from repayments, available-for-sale |
|
$ |
|
|
$ |
|
||
Proceeds from repayments, held-to-maturity |
|
|
|
|
|
|
||
Purchases, available-for-sale |
|
|
( |
) |
|
|
( |
) |
Purchases, held-to-maturity |
|
|
( |
) |
|
|
( |
) |
Purchases, equity securities |
|
|
( |
) |
|
|
— |
|
Redemption of restricted stock |
|
|
|
|
|
— |
|
|
Purchase of bank-owned life insurance |
|
|
— |
|
|
|
( |
) |
Loan originations and payments, net |
|
|
( |
) |
|
|
|
|
Purchases of premises and equipment |
|
|
( |
) |
|
|
( |
) |
Purchases of software |
|
|
( |
) |
|
|
( |
) |
Net cash used in investing activities |
|
$ |
( |
) |
|
$ |
( |
) |
These consolidated financial statements should be read in connection with the accompanying notes to the consolidated financial statements.
35
CONSOLIDATED STATEMENTS OF CASH FLOWS
Years Ended December 31, 2022 and 2021
(Dollars in thousands) |
|
2022 |
|
|
2021 |
|
||
CASH FLOWS FROM FINANCING ACTIVITIES |
|
|
|
|
|
|
||
Net change in deposits |
|
$ |
|
|
$ |
|
||
Net change in short-term borrowings |
|
|
( |
) |
|
|
( |
) |
Repayment of other borrowings |
|
|
( |
) |
|
|
( |
) |
Cash dividends paid |
|
|
( |
) |
|
|
( |
) |
Purchase of treasury stock |
|
|
( |
) |
|
|
( |
) |
Net cash provided by financing activities |
|
$ |
|
|
$ |
|
||
|
|
|
|
|
|
|
||
NET (DECREASE) INCREASE IN CASH AND CASH EQUIVALENTS |
|
|
( |
) |
|
|
|
|
|
|
|
|
|
|
|
||
CASH AND CASH EQUIVALENTS AT BEGINNING OF YEAR |
|
|
|
|
|
|
||
|
|
|
|
|
|
|
||
CASH AND CASH EQUIVALENTS AT END OF YEAR |
|
$ |
|
|
$ |
|
||
|
|
|
|
|
|
|
||
SUPPLEMENTAL DISCLOSURES |
|
|
|
|
|
|
||
Cash paid during the year for: |
|
|
|
|
|
|
||
Interest |
|
$ |
|
|
$ |
|
||
Income taxes |
|
|
|
|
|
|
||
|
|
|
|
|
|
|
||
Noncash investing activities: |
|
|
|
|
|
|
||
Transfer of securities from available-for-sale to held-to-maturity |
|
|
— |
|
|
|
|
|
These consolidated financial statements should be read in connection with the accompanying notes to the consolidated financial statements.
36
NOTE 1 – SUMMARY OF SIGNIFICANT ACCOUNTING POLICIES
CSB Bancorp, Inc. (the “Company” or “CSB”) was incorporated in 1991 in the State of Ohio, and is a registered bank holding company. The Company’s wholly-owned subsidiaries are The Commercial and Savings Bank of Millersburg, Ohio (the “Bank”) and CSB Investment Services, LLC. The Company, through its subsidiaries, operates in
The Bank, an Ohio-chartered bank organized in 1879, provides financial services through its
Significant accounting policies followed by the Company are presented below:
USE OF ESTIMATES IN PREPARING FINANCIAL STATEMENTS
In preparing the Consolidated Financial Statements, in conformity with accounting principles generally accepted in the United States of America, management makes estimates and assumptions affecting the reported amounts of assets and liabilities as of the date of the Consolidated Balance Sheets and reported amounts of revenues and expenses during each reporting period. Actual results could differ from those estimates. The most significant estimates susceptible to change in the near term relate to management’s determination of the allowance for loan losses and the fair value of financial instruments.
PRINCIPLES OF CONSOLIDATION
The Consolidated Financial Statements include the accounts of the Company and its wholly-owned subsidiaries. All significant inter-company balances and transactions have been eliminated in consolidation.
The Bank has a trust department and the assets held by the Bank in fiduciary or agency capacities for its customers are not included in the Consolidated Balance Sheets as such items are not assets of the Bank.
CASH AND CASH EQUIVALENTS
For purposes of the Consolidated Statements of Cash Flows, cash and cash equivalents include cash on hand and amounts due from banks which mature or within
CASH RESERVE REQUIREMENTS
Effective, March 26, 2020, the Federal Reserve reduced reserve requirements to zero for all depository institutions. There were
DEBT SECURITIES
At the time of purchase all debt securities are evaluated and designated as available-for-sale or held-to-maturity. Securities designated as available-for-sale are carried at fair value with unrealized gains and losses on such securities, net of applicable income taxes, recognized as other comprehensive income or loss. During 2021, approximately $
Gains and losses on sales of securities are accounted for on a trade date basis, using the specific identification method, and are included in noninterest income. Securities are periodically reviewed for other-than-temporary impairment based upon a number of factors, including, but not limited to: the length of time and extent to which the market value has been less than cost, the financial condition of the underlying issuer, the receipt of principal and interest according to the contractual terms, the ability of the issuer to meet contractual obligations, the likelihood of the security’s ability to recover any decline in its market value and management’s intent, and ability to hold the security for a period of time sufficient to allow for a recovery in market value. Among the factors considered in determining management’s intent and ability to hold the security, is a review of the Company’s capital adequacy, interest rate risk position, and liquidity. The assessment of a security’s ability to recover any decline in market value, the ability of the issuer to meet contractual obligations, and management’s intent and ability to hold the security requires
37
considerable judgment. A decline in value considered to be other-than-temporary, is recorded as a loss within noninterest income in the Consolidated Statements of Income.
EQUITY SECURITIES
Equity securities are held at fair value. Holding gains and losses are recorded in income. Dividends on equity securities are recognized as income when earned.
RESTRICTED STOCK
Investments in FHLB and Federal Reserve Bank stock are classified as restricted stock, carried at cost, and evaluated for impairment. The Bank is required to maintain an investment in common stock of the FHLB and Federal Reserve Bank because the Bank is a member of the FHLB and the Federal Reserve System.
LOANS
Loans that management has the intent and ability to hold for the foreseeable future, until maturity, or pay-off, generally are stated at their outstanding principal amount, adjusted for charge-offs, the allowance for loan losses, and any deferred loan fees or costs on originated loans. Interest is accrued based upon the daily outstanding principal balance. Loan origination fees and certain direct origination costs are capitalized and recognized as an adjustment of the yield over the life of the related loan.
Interest income is not reported when full repayment is in doubt, typically when the loan is impaired, or payments are past due over 90 days. All interest accrued, but not collected for loans placed on nonaccrual or charged-off is reversed against interest income. The interest on these loans is accounted for on the cash-basis or cost-recovery method, until qualifying for return to accrual. Loans are returned to accrual status when all the principal and interest amounts contractually due are brought current and future payments are reasonably assured.
At origination, a determination is made whether a loan will be held in the Bank’s portfolio or is intended for sale in the secondary market. Mortgage loans held for sale are recorded at the lower of the aggregate cost or fair value. Generally, these loans are held for sale for less than three (3) days. The Bank recognizes gains and losses on sales of the loans held for sale when the sale is completed.
ALLOWANCE FOR LOAN LOSSES
The allowance for loan losses is established as losses are estimated to have occurred through a provision for loan losses charged to income. Loan losses are charged against the allowance when management believes the uncollectability of a loan balance is confirmed. Subsequent recoveries, if any, are credited to the allowance.
The allowance for loan losses is evaluated on a regular basis by management and is based upon management’s periodic review of the collectability of the loans in light of historical experience, the nature and volume of the loan portfolio, adverse situations that may affect borrowers’ ability to repay, estimated value of any underlying collateral, and prevailing economic conditions. This evaluation is inherently subjective as it requires estimates that are susceptible to significant revision as more information becomes available.
A loan is considered impaired when, based on current information and events, it is probable that the Company will be unable to collect the scheduled payments of principal or interest when due according to the contractual terms of the loan agreement. Factors considered by management in determining impairment include payment status, collateral value and the probability of collecting scheduled principal and interest payments when due. Loans experiencing insignificant payment delays and payment shortfalls generally are not classified as impaired. Management determines the significance of payment delays and payment shortfalls on a case-by-case basis, taking into consideration all the circumstances surrounding the loan and the borrower, including the length of the delay, the reasons for the delay, the borrower’s prior payment record and the amount of the shortfall in relation to the principal and interest owed. Impairment is measured on a loan-by-loan basis for commercial, commercial real estate, construction loans, and troubled debt restructurings by either the present value of expected future cash flows discounted at the loan’s effective interest rate, the loan’s obtainable market price, or the fair value of the collateral if the loan is collateral dependent.
Large groups of smaller balance homogeneous loans are collectively evaluated for impairment. Accordingly, the Company does not separately identify individual residential real estate or consumer loans for impairment disclosures.
OTHER REAL ESTATE OWNED
Other real estate acquired through or in lieu of foreclosure is initially recorded at fair value, less estimated costs to sell, and any loan balance in excess of fair value is charged to the allowance for loan losses. Subsequent valuations are periodically performed and write-downs are included in noninterest expenses, as well as expenses related to maintenance of the properties. Gains or losses upon sale are recorded through noninterest income. There was
PREMISES AND EQUIPMENT
Premises and equipment are stated at cost, less accumulated depreciation and amortization. Land is carried at cost. Depreciation and amortization are determined based on the estimated useful lives of the individual assets (typically
38
term, whichever is shorter. Expenses for maintenance and repairs are charged against income as incurred. Costs of major additions and improvements are capitalized.
GOODWILL
Goodwill is not amortized, but is tested for impairment at least annually in the fourth quarter or more frequently if indicators of impairment are present. The evaluation for impairment involves comparing the current fair value of the reporting unit to the carrying value, including goodwill. If the current fair value of a reporting unit exceeds the carrying value, no additional testing is required, and an impairment loss is not recorded. The Company uses market capitalization and multiples of tangible book value methods, based on observable bank acquisitions in the state of Ohio, to determine the estimated current fair value of its reporting unit. Based on this analysis
MORTGAGE SERVICING RIGHTS
Mortgage servicing rights (“MSRs”) represent the right to service loans for third party investors. MSRs are recognized at fair value as a separate asset upon the sale of mortgage loans to a third-party investor with the servicing rights retained by the Company. Originated MSRs are recorded at allocated fair value at the time of the sale of the loans to the third-party investor. MSRs are amortized in proportion to and over the estimated period of net servicing income. MSRs are carried at amortized cost, less a valuation allowance for impairment, if any. MSRs are evaluated on a discounted earnings basis to determine the present value of future earnings of the underlying serviced mortgages. All assumptions are reviewed annually, or more frequently if necessary, adjusted to reflect current, and anticipated market conditions.
BANK-OWNED LIFE INSURANCE
The cash surrender value of bank-owned life insurance policies is included as an asset on the Consolidated Balance Sheets and any increases in the cash surrender value are recorded as noninterest income on the Consolidated Statements of Income. In the event of the death of an individual insured under these policies, the Company would receive a death benefit, which would be recorded as noninterest income.
REPURCHASE AGREEMENTS
Substantially all securities sold under repurchase agreements represent amounts advanced by various customers. Securities owned by the Bank are pledged to secure those obligations. Repurchase agreements are not deposits and are not covered by federal deposit insurance.
ADVERTISING COSTS
All advertising costs are expensed as incurred. Advertising expenses amounted to $
FEDERAL INCOME TAXES
The Company and its subsidiaries file a consolidated tax return. Deferred income taxes are provided on temporary differences between financial statement and income tax reporting. Temporary differences are differences between the amounts of assets and liabilities reported for financial statement purposes and their respective tax bases. Deferred tax assets are recognized for temporary differences deductible in future years’ tax returns and for operating loss and tax credit carry forwards. Deferred tax assets are reduced by a valuation allowance if it is deemed more likely than not that some or all of the deferred tax assets will not be realized. Deferred tax liabilities are recognized for temporary differences taxable in future years’ tax returns.
The Bank, domiciled in Ohio, is not currently subject to state and local income taxes.
COMPREHENSIVE INCOME
The Company includes recognized revenue, expenses, gains, and losses in net income. Although certain changes in assets and liabilities, such as unrealized gains and losses on available-for-sale securities, are reported as a separate component of the equity section of the Consolidated Balance Sheets, net of tax, these items along with net income are components of comprehensive income.
TRANSFERS OF FINANCIAL ASSETS
Transfers of financial assets are accounted for as sales when control over the assets has been surrendered. Control over transferred assets is deemed to be surrendered when (1) the assets have been isolated from the Company, (2) the transferee obtains the right (free of conditions constraining it from taking advantage of that right) to pledge or exchange the transferred assets, and (3) the Company does not maintain effective control over the transferred assets through an agreement to repurchase them before their maturity.
39
PER SHARE DATA
Earnings per share is computed based on the weighted average number of shares of common stock outstanding during each year. The company currently maintains a simple capital structure, thus, there are
The weighted average number of common shares outstanding for earnings per share computations was as follows:
(Dollars in thousands, except per share data) |
|
2022 |
|
|
2021 |
|
||
Weighted average common shares |
|
|
|
|
|
|
||
Average treasury shares |
|
|
( |
) |
|
|
( |
) |
Total weighted average common shares outstanding basic and diluted |
|
|
|
|
|
|
||
Net income |
|
$ |
|
|
$ |
|
||
Earnings per share, basic and diluted |
|
|
|
|
|
|
||
RECENTLY ISSUED ACCOUNTING PRONOUNCEMENTS
ASU 2016-13 - Financial Instruments - Credit Losses: Measurement of Credit Losses on Financial Instruments. The Update and all subsequent ASU’s that modified Topic 326, requires financial assets be presented at the net amount expected to be collected (i.e. net of expected credit losses), eliminating the probable recognition threshold for credit losses on financial assets measured at amortized cost. The measurement of expected credit losses should be based on relevant information about past events, including historical experience, current conditions, and reasonable and supportable forecasts that affect the collectability of the reported amount. The amount of any adjustment will be impacted by the portfolio composition and quality at the adoption date, as well as economic conditions and forecasts at that time. The new current expected credit losses model ("CECL") will apply to the allowance for loan losses, available-for-sale and held-to-maturity debt securities, purchased financial assets with credit deterioration and certain off-balance sheet credit exposures.
Management has completed its implementation plan, segmentation and testing, and model validation. The implementation plan included drafting of additional controls and policies to govern data uploads to its third-party vendor, balancing and reconciling, testing and auditing of inputs, and review and decision-making surrounding segmentation, methodologies, qualitative factor adjustments, and reasonable and supportable forecasts. Parallel runs were processed during 2022 and the results were consistent with management's expectations. The implementation plan is currently going through the Company's control structure and internal control testing is being performed.
As a result of adopting this standard, which is effective January 1, 2023, the Company has completed the calculation and is in the process of finalizing the qualitative factors, which will determine the total amount of the adjustment to the allowance for loan losses and the reserves for unfunded commitments. These estimates are subject to further refinements based on ongoing evaluations of our model, methodologies, and judgments, as well as prevailing economic conditions and forecasts as of the adoption date. The adoption of ASU 2016-13 is not expected to have a significant
The Company expects to record no allowance for credit losses related to AFS or HTM debt securities at the date of adoption, January 1, 2023, as the majority of the Company's debt securities are issued by U.S. government entities and agencies and there is zero credit loss expectation on these securities.
ASU 2017-04 - Simplifying the Test for Goodwill Impairment. The Update, and all subsequent ASU’s, simplifies the goodwill impairment test. Under the new guidance, Step 2 of the goodwill impairment process that requires an entity to determine the implied fair value of its goodwill by assigning fair value to all its assets and liabilities is eliminated. Instead, the entity should recognize an impairment charge for the amount by which the carrying amount exceeds the reporting unit's fair value. An entity still has the option to perform the qualitative assessment for a reporting unit to determine if the quantitative impairment test is necessary. The new guidance is effective for annual and interim goodwill tests performed in fiscal years beginning after December 15, 2019. Early adoption is permitted. In November 2019, the FASB deferred the effective date for ASC 350, Intangibles – Goodwill and Other, for smaller reporting companies to fiscal years beginning after December 15, 2022, and interim periods within those fiscal years. This Update is not expected to have a material
ASU 2020-04 - Reference Rate Reform (Topic 848). This update provides temporary optional expedients and exceptions to the U.S. GAAP guidance on contract modifications and hedge accounting to ease the financial reporting burdens of the expected market transition from LIBOR and other interbank offered rates to alternative reference rates, such as the Secured Overnight Financing Rate. Entities can elect not to apply certain modification accounting requirements to contracts affected by what the guidance calls "reference rate reform" if certain criteria are met. An entity that makes this election would not have to remeasure the contracts at the modification date or reassess a previous accounting determination. Also, entities can elect various optional expedients allowing them to continue applying hedge accounting for hedging relationships affected by reference rate reform, if certain criteria are met, and can make a one-time election to sell and/or reclassify held-to-maturity debt securities that reference an interest rate affected by reference rate reform. The amendments in this ASU are effective for all entities upon issuance through December 31, 2022. In December 2022, the FASB issued ASU 2022-06, Reference Rate Reform (Topic 848): Deferral of the Sunset Date of Topic 848, which extends the sunset (or expiration) date of Accounting Standards Codification (ASC) Topic 848 to December 31, 2024. This gives reporting entities two additional years to apply the accounting relief provided under ASC Topic 848 for matters related to reference
40
rate reform. ASU 2022-06 is effective for all reporting entities immediately upon issuance and must be applied on a prospective basis. This Update is not expected to have a significant
ASU 2022-02, Financial Instruments – Credit Losses (ASC 326): Troubled Debt Restructurings (TDRs) and Vintage Disclosures. The guidance amends ASC 326 to eliminate the accounting guidance for TDRs by creditors, while enhancing disclosure requirements for certain loan refinancing and restructuring activities by creditors when a borrower is experiencing financial difficulty. Specifically, rather than applying TDR recognition and measurement guidance, creditors will determine whether a modification results in a new loan or continuation of existing loan. These amendments are intended to enhance existing disclosure requirements and introduce new requirements related to certain modifications of receivables made to borrowers experiencing financial difficulty. Additionally, the amendments to ASC 326 require that an entity disclose current-period gross write-offs by year of origination within the vintage disclosures, which requires that an entity disclose the amortized cost basis of financing receivables by credit quality indicator and class of financing receivable by year of origination. The guidance is only for entities that have adopted the amendments in Update 2016-13 for fiscal years, and interim periods within those fiscal years, beginning after December 15, 2022. This Update is not expected to have a significant
RECLASSIFICATION OF COMPARATIVE AMOUNTS
Certain comparative amounts from the prior years have been reclassified to conform to current year classifications. Such classifications had
41
NOTE 2 – SECURITIES
Securities consisted of the following on December 31:
(Dollars in thousands) |
|
Amortized |
|
|
Gross |
|
|
Gross |
|
|
Fair |
|
||||
2022 |
|
|
|
|
|
|
|
|
|
|
|
|
||||
Available-for-sale |
|
|
|
|
|
|
|
|
|
|
|
|
||||
U.S. Treasury securities |
|
$ |
|
|
$ |
— |
|
|
$ |
( |
) |
|
$ |
|
||
U.S. Government agencies |
|
|
|
|
|
— |
|
|
|
( |
) |
|
|
|
||
Mortgage-backed securities of government agencies |
|
|
|
|
|
|
|
|
( |
) |
|
|
|
|||
Asset-backed securities of government agencies |
|
|
|
|
|
— |
|
|
|
( |
) |
|
|
|
||
State and political subdivisions |
|
|
|
|
|
— |
|
|
|
( |
) |
|
|
|
||
Corporate bonds |
|
|
|
|
|
— |
|
|
|
( |
) |
|
|
|
||
Total available-for-sale |
|
|
|
|
|
|
|
|
( |
) |
|
|
|
|||
Held-to-maturity |
|
|
|
|
|
|
|
|
|
|
|
|
||||
U.S. Treasury securities |
|
|
|
|
|
— |
|
|
|
( |
) |
|
|
|
||
Mortgage-backed securities of government agencies |
|
|
|
|
|
— |
|
|
|
( |
) |
|
|
|
||
State and political subdivisions |
|
|
|
|
|
|
|
|
( |
) |
|
|
|
|||
Total held-to-maturity |
|
|
|
|
|
|
|
|
( |
) |
|
|
|
|||
Equity securities |
|
|
|
|
|
|
|
|
— |
|
|
|
|
|||
Restricted stock |
|
|
|
|
|
— |
|
|
|
— |
|
|
|
|
||
Total securities |
|
$ |
|
|
$ |
|
|
$ |
( |
) |
|
$ |
|
|||
|
|
|
|
|
|
|
|
|
|
|
|
|
||||
2021 |
|
|
|
|
|
|
|
|
|
|
|
|
||||
Available-for-sale |
|
|
|
|
|
|
|
|
|
|
|
|
||||
U.S. Treasury securities |
|
$ |
|
|
$ |
— |
|
|
$ |
( |
) |
|
$ |
|
||
U.S. Government agencies |
|
|
|
|
|
— |
|
|
|
( |
) |
|
|
|
||
Mortgage-backed securities of government agencies |
|
|
|
|
|
|
|
|
( |
) |
|
|
|
|||
Asset-backed securities of government agencies |
|
|
|
|
|
— |
|
|
|
( |
) |
|
|
|
||
State and political subdivisions |
|
|
|
|
|
|
|
|
( |
) |
|
|
|
|||
Corporate bonds |
|
|
|
|
|
|
|
|
( |
) |
|
|
|
|||
Total available-for-sale |
|
|
|
|
|
|
|
|
( |
) |
|
|
|
|||
Held-to-maturity |
|
|
|
|
|
|
|
|
|
|
|
|
||||
U.S. Treasury securities |
|
|
|
|
|
|
|
|
( |
) |
|
|
|
|||
Mortgage-backed securities of government agencies |
|
|
|
|
|
|
|
|
( |
) |
|
|
|
|||
State and political subdivisions |
|
|
|
|
|
|
|
|
( |
) |
|
|
|
|||
Total held-to-maturity |
|
|
|
|
|
|
|
|
( |
) |
|
|
|
|||
Equity securities |
|
|
|
|
|
|
|
|
— |
|
|
|
|
|||
Restricted stock |
|
|
|
|
|
— |
|
|
|
— |
|
|
|
|
||
Total securities |
|
$ |
|
|
$ |
|
|
$ |
( |
) |
|
$ |
|
|||
42
The amortized cost and fair value of debt securities on December 31, 2022, by contractual maturity, are shown below. Actual maturities may differ from contractual maturities because borrowers may have the right to call or prepay obligations with or without call or prepayment penalties.
(Dollars in thousands) |
|
Amortized |
|
|
Fair |
|
||
Available-for-sale |
|
|
|
|
|
|
||
Due in one year or less |
|
$ |
|
|
$ |
|
||
Due after one through five years |
|
|
|
|
|
|
||
Due after five through ten years |
|
|
|
|
|
|
||
Due after ten years |
|
|
|
|
|
|
||
Total debt securities available-for-sale |
|
$ |
|
|
$ |
|
||
|
|
|
|
|
|
|
||
Held-to-maturity |
|
|
|
|
|
|
||
Due in one year or less |
|
$ |
|
|
$ |
|
||
Due after one through five years |
|
|
|
|
|
|
||
Due after five through ten years |
|
|
|
|
|
|
||
Due after ten years |
|
|
|
|
|
|
||
Total debt securities held-to-maturity |
|
$ |
|
|
$ |
|
||
Securities with a carrying value of approximately $
Restricted stock primarily consists of investments in FHLB and Federal Reserve Bank stock. The Bank’s investment in FHLB stock amounted to $
There were
43
The following table presents gross unrealized losses, fair value of securities, aggregated by investment category, and length of time individual securities have been in a continuous unrealized loss position, on December 31:
|
|
Less Than 12 Months |
|
|
12 Months or More |
|
|
Total |
|
|||||||||||||||
(Dollars in thousands) |
|
Gross |
|
|
Fair |
|
|
Gross |
|
|
Fair |
|
|
Gross |
|
|
Fair |
|
||||||
2022 |
|
|
|
|
|
|
|
|
|
|
|
|
|
|
|
|
|
|
||||||
Available-for-sale |
|
|
|
|
|
|
|
|
|
|
|
|
|
|
|
|
|
|
||||||
U.S. Treasury securities |
|
$ |
( |
) |
|
$ |
|
|
$ |
( |
) |
|
$ |
|
|
$ |
( |
) |
|
$ |
|
|||
U.S. Government agencies |
|
|
— |
|
|
|
— |
|
|
|
( |
) |
|
|
|
|
|
( |
) |
|
|
|
||
Mortgage-backed securities of government |
|
|
( |
) |
|
|
|
|
|
( |
) |
|
|
|
|
|
( |
) |
|
|
|
|||
Asset-backed securities of government |
|
|
— |
|
|
|
— |
|
|
|
( |
) |
|
|
|
|
|
( |
) |
|
|
|
||
State and political subdivisions |
|
|
( |
) |
|
|
|
|
|
( |
) |
|
|
|
|
|
( |
) |
|
|
|
|||
Corporate bonds |
|
|
( |
) |
|
|
|
|
|
( |
) |
|
|
|
|
|
( |
) |
|
|
|
|||
Held-to-maturity |
|
|
|
|
|
|
|
|
|
|
|
|
|
|
|
|
|
|
||||||
U.S. Treasury securities |
|
|
— |
|
|
|
— |
|
|
|
( |
) |
|
|
|
|
|
( |
) |
|
|
|
||
Mortgage-backed securities of government |
|
|
( |
) |
|
|
|
|
|
( |
) |
|
|
|
|
|
( |
) |
|
|
|
|||
State and political subdivisions |
|
|
— |
|
|
|
— |
|
|
|
( |
) |
|
|
|
|
|
( |
) |
|
|
|
||
Total temporarily impaired securities |
|
$ |
( |
) |
|
$ |
|
|
$ |
( |
) |
|
$ |
|
|
$ |
( |
) |
|
$ |
|
|||
|
|
|
|
|
|
|
|
|
|
|
|
|
|
|
|
|
|
|
||||||
2021 |
|
|
|
|
|
|
|
|
|
|
|
|
|
|
|
|
|
|
||||||
Available-for-sale |
|
|
|
|
|
|
|
|
|
|
|
|
|
|
|
|
|
|
||||||
U.S. Treasury securities |
|
$ |
( |
) |
|
$ |
|
|
$ |
— |
|
|
$ |
— |
|
|
$ |
( |
) |
|
$ |
|
||
U.S. Government agencies |
|
|
( |
) |
|
|
|
|
|
( |
) |
|
|
|
|
|
( |
) |
|
|
|
|||
Mortgage-backed securities of government |
|
|
( |
) |
|
|
|
|
|
( |
) |
|
|
|
|
|
( |
) |
|
|
|
|||
Asset-backed securities of government |
|
|
— |
|
|
|
— |
|
|
|
( |
) |
|
|
|
|
|
( |
) |
|
|
|
||
State and political subdivisions |
|
|
( |
) |
|
|
|
|
|
— |
|
|
|
— |
|
|
|
( |
) |
|
|
|
||
Corporate bonds |
|
|
( |
) |
|
|
|
|
|
( |
) |
|
|
|
|
|
( |
) |
|
|
|
|||
Held-to-maturity |
|
|
|
|
|
|
|
|
|
|
|
|
|
|
|
|
|
|
||||||
U.S. Treasury securities |
|
|
( |
) |
|
|
|
|
|
— |
|
|
|
— |
|
|
|
( |
) |
|
|
|
||
Mortgage-backed securities of government |
|
|
( |
) |
|
|
|
|
|
— |
|
|
|
— |
|
|
|
( |
) |
|
|
|
||
State and political subdivisions |
|
|
( |
) |
|
|
|
|
|
— |
|
|
|
— |
|
|
|
( |
) |
|
|
|
||
Total temporarily impaired securities |
|
$ |
( |
) |
|
$ |
|
|
$ |
( |
) |
|
$ |
|
|
$ |
( |
) |
|
$ |
|
|||
There were
44
NOTE 3 – LOANS
Loans consisted of the following on December 31:
(Dollars in thousands) |
|
2022 |
|
|
2021 |
|
||
Commercial |
|
$ |
|
|
$ |
|
||
Commercial real estate |
|
|
|
|
|
|
||
Residential real estate |
|
|
|
|
|
|
||
Construction & land development |
|
|
|
|
|
|
||
Consumer |
|
|
|
|
|
|
||
Total loans before deferred loan (fees) and costs |
|
|
|
|
|
|
||
Deferred loan (fees) and costs |
|
|
|
|
|
|
||
Total loans |
|
$ |
|
|
$ |
|
||
Loan Origination/Risk Management
The Company has certain lending policies and procedures in place designed to maximize loan income within an acceptable level of risk. Management reviews and the Board of Directors approves these policies and procedures on a regular basis. A reporting system supplements the review process by providing management with frequent reports related to loan production, loan quality, concentrations of credit, loan delinquencies, and non-performing and potential problem loans. Diversification in the loan portfolio is a means of managing risk associated with fluctuations in economic conditions.
Commercial loans are underwritten after evaluating and understanding the borrower’s ability to operate profitably and prudently expand their business. Underwriting standards are designed to promote relationship banking rather than transactional banking. The Company’s management examines current and occasionally projected cash flows to determine the ability of the borrower to repay their obligations as agreed. Commercial loans are primarily made based on the identified cash flows of the borrower and secondarily on the underlying collateral provided by the borrower. However, the cash flows of borrowers may not be as expected and the collateral securing these loans may fluctuate in value. Most commercial loans are secured by the assets being financed or other business assets, such as accounts receivable or inventory, and generally incorporate a personal guarantee; however, some short-term loans may be made on an unsecured basis. In the case of loans secured by accounts receivable, the availability of funds for the repayment of these loans may be substantially dependent on the ability of the borrower to collect amounts due from its customers.
Commercial real estate loans are subject to underwriting standards and processes similar to commercial loans, in addition to those of real estate loans. These loans are viewed primarily as cash flow loans and secondarily as loans secured by real estate. Commercial real estate lending typically involves higher loan principal amounts and the repayment of these loans is largely dependent on the successful operation of the property securing the loan or the business conducted on the property securing the loan. Commercial real estate loans may be adversely affected by conditions in the real estate markets or in the general economy. The properties securing the Company’s commercial real estate portfolio are diverse in terms of type. This diversity helps reduce the Company’s exposure to adverse economic events that affect any single industry. Management monitors and evaluates commercial real estate loans based on collateral, geography, and risk grade criteria.
With respect to loans to developers and builders secured by non-owner occupied properties, the Company generally requires the borrower to have had an existing relationship with the Company and have a proven record of success. Construction and land development loans are underwritten utilizing independent appraisal reviews, sensitivity analysis of absorption, lease rates, and financial analysis of developers and property owners. Construction and land development loans are generally based upon estimates of costs and value associated with the completed project. These estimates may be inaccurate. Construction and land development loans often involve the disbursement of substantial funds with repayment substantially dependent on the success of the project. Sources of repayment for these types of loans may be pre-committed permanent loans from approved long-term lenders, sales of developed property, or permanent financing from the Company. These loans are closely monitored by on-site inspections and are considered to have higher risk than other real estate loans due to their ultimate repayment being sensitive to interest rate changes, governmental regulation of real property, general economic conditions, and the availability of long-term financing.
The Company originates consumer loans utilizing a judgmental underwriting process. Policies and procedures are developed and modified, as needed, by management to monitor and manage consumer loan risk. This activity, coupled with relatively small loan amounts spread across many individual borrowers, minimizes risk.
The Company engages an independent loan review vendor that reviews and validates the credit risk program on a periodic basis. Results of these reviews are presented to management and the Audit Committee. The loan review process complements and reinforces the risk identification and assessment decisions made by lenders and credit personnel, as well as the Company’s policies and procedures.
Paycheck Protection Program
The Coronavirus Aid, Relief, and Economic Security Act, or CARES Act, was signed into law on March 27, 2020 and provided over $2 trillion in economic relief to individuals and businesses impacted by the COVID-19 pandemic. The CARES Act authorized the SBA to temporarily guarantee loans under a new 7(a) loan program called the Paycheck Protection Program (“PPP”). As a qualified SBA lender, the Company was automatically authorized to originate PPP loans. The PPP provided loans to small businesses who were affected by economic conditions as a result of COVID-19 to provide cash flow assistance to employers who maintained their payroll (including healthcare and certain related expenses), mortgage interest, rent, leases, utilities and interest on existing debt during the COVID-19 emergency. During 2021 and 2020, the
45
Company originated
Concentrations of Credit
Nearly all the Company’s lending activity occurs within the State of Ohio, including the four counties of Holmes, Stark, Tuscarawas, and Wayne, as well as other markets. The majority of the Company’s loan portfolio consists of commercial and industrial and commercial real estate loans. Credit concentrations, including commitments, as determined using North American Industry Classification Codes (NAICS), to the
Allowance for Loan Losses
The following table details activity in the allowance for loan losses by portfolio segment for the years ended December 31, 2022, and 2021. Allocation of a portion of the allowance to one category of loans does not preclude its availability to absorb losses in other categories.
During 2022, the decrease in the provision (recovery) for loan losses for construction and land development and commercial real estate loans was primarily related to the improvement in loans to businesses that were negatively impacted by the COVID-19 pandemic, the reduction of impaired and adversely classified loans, as well as a large recovery received on a previously charged-off loan. The decrease in the provision for consumer loans was primarily related to the tightening of underwriting guidelines pertaining to the RV portfolio along with a decline in RV loan balances and fewer consumer loan charge-offs in 2022. The provision related to residential real estate loans increased as a result of the growth in loan balances along with an increase in the general loss ratios due to elevated levels of economic uncertainty associated with increased inflation and higher interest rates.
During 2021, the increase in the provision for loan losses for construction and land development loans was primarily related to loans to assisted living facilities that have been affected by the COVID-19 pandemic. The decrease in the provision related to commercial, commercial real estate and residential real estate loans was primarily related to the improvement in economic conditions along with fewer delinquent and nonperforming loans and improvement in adversely classified loans. The provision related to consumer loans increased primarily as a result of the increase in historical losses of loans in this category.
Summary of Allowance for Loan Losses
(Dollars in thousands) |
|
Commercial |
|
|
Commercial |
|
|
Residential |
|
|
Construction |
|
|
Consumer |
|
|
Unallocated |
|
|
Total |
|
|||||||
December 31, 2022 |
|
|
|
|
|
|
|
|
|
|
|
|
|
|
|
|
|
|
|
|
|
|||||||
Beginning balance |
|
$ |
|
|
$ |
|
|
$ |
|
|
$ |
|
|
$ |
|
|
$ |
|
|
$ |
|
|||||||
(Recovery) provision for loan losses |
|
|
|
|
|
( |
) |
|
|
|
|
|
( |
) |
|
|
( |
) |
|
|
( |
) |
|
|
( |
) |
||
Charge-offs |
|
|
( |
) |
|
|
( |
) |
|
|
— |
|
|
|
— |
|
|
|
( |
) |
|
|
|
|
|
( |
) |
|
Recoveries |
|
|
|
|
|
|
|
|
|
|
|
|
|
|
|
|
|
|
|
|
|
|||||||
Net (charge-offs) |
|
|
( |
) |
|
|
( |
) |
|
|
|
|
|
|
|
|
( |
) |
|
|
|
|
|
|
||||
Ending balance |
|
$ |
|
|
$ |
|
|
$ |
|
|
$ |
|
|
$ |
|
|
$ |
|
|
$ |
|
|||||||
|
|
|
|
|
|
|
|
|
|
|
|
|
|
|
|
|
|
|
|
|
|
|||||||
December 31, 2021 |
|
|
|
|
|
|
|
|
|
|
|
|
|
|
|
|
|
|
|
|
|
|||||||
Beginning balance |
|
$ |
|
|
$ |
|
|
$ |
|
|
$ |
|
|
$ |
|
|
$ |
|
|
$ |
|
|||||||
(Recovery) provision for loan losses |
|
|
( |
) |
|
|
( |
) |
|
|
( |
) |
|
|
|
|
|
|
|
|
( |
) |
|
|
( |
) |
||
Charge-offs |
|
|
( |
) |
|
|
— |
|
|
|
— |
|
|
|
— |
|
|
|
( |
) |
|
|
|
|
|
( |
) |
|
Recoveries |
|
|
|
|
|
|
|
|
|
|
|
— |
|
|
|
|
|
|
|
|
|
|
||||||
Net (charge-offs) |
|
|
( |
) |
|
|
|
|
|
|
|
|
— |
|
|
|
( |
) |
|
|
|
|
|
( |
) |
|||
Ending balance |
|
$ |
|
|
$ |
|
|
$ |
|
|
$ |
|
|
$ |
|
|
$ |
|
|
$ |
|
|||||||
46
The following table presents the balance in the allowance for loan losses and the ending loan balances by portfolio segment and impairment method as of December 31:
(Dollars in thousands) |
|
Commercial |
|
|
Commercial |
|
|
Residential |
|
|
Construction |
|
|
Consumer |
|
|
Unallocated |
|
|
Total |
|
|||||||
2022 |
|
|
|
|
|
|
|
|
|
|
|
|
|
|
|
|
|
|
|
|
|
|||||||
Allowance for loan losses: |
|
|
|
|
|
|
|
|
|
|
|
|
|
|
|
|
|
|
|
|
|
|||||||
Ending allowance balances |
|
|
|
|
|
|
|
|
|
|
|
|
|
|
|
|
|
|
|
|
|
|||||||
Individually evaluated for |
|
$ |
— |
|
|
$ |
— |
|
|
$ |
— |
|
|
$ |
— |
|
|
$ |
|
|
$ |
— |
|
|
$ |
|
||
Collectively evaluated for |
|
|
|
|
|
|
|
|
|
|
|
|
|
|
|
|
|
|
|
|
|
|||||||
Total ending allowance |
|
$ |
|
|
$ |
|
|
$ |
|
|
$ |
|
|
$ |
|
|
$ |
|
|
$ |
|
|||||||
|
|
|
|
|
|
|
|
|
|
|
|
|
|
|
|
|
|
|
|
|
|
|||||||
Loans: |
|
|
|
|
|
|
|
|
|
|
|
|
|
|
|
|
|
|
|
|
|
|||||||
Loans individually |
|
$ |
|
|
$ |
|
|
$ |
|
|
$ |
— |
|
|
$ |
|
|
|
|
|
$ |
|
||||||
Loans collectively |
|
|
|
|
|
|
|
|
|
|
|
|
|
|
|
|
|
|
|
|
|
|||||||
Total ending loans balance |
|
$ |
|
|
$ |
|
|
$ |
|
|
$ |
|
|
$ |
|
|
|
|
|
$ |
|
|||||||
|
|
|
|
|
|
|
|
|
|
|
|
|
|
|
|
|
|
|
|
|
|
|||||||
2021 |
|
|
|
|
|
|
|
|
|
|
|
|
|
|
|
|
|
|
|
|
|
|||||||
Allowance for loan losses: |
|
|
|
|
|
|
|
|
|
|
|
|
|
|
|
|
|
|
|
|
|
|||||||
Ending allowance balances |
|
|
|
|
|
|
|
|
|
|
|
|
|
|
|
|
|
|
|
|
|
|||||||
Individually evaluated for |
|
$ |
|
|
$ |
|
|
$ |
|
|
$ |
— |
|
|
$ |
|
|
$ |
— |
|
|
$ |
|
|||||
Collectively evaluated for |
|
|
|
|
|
|
|
|
|
|
|
|
|
|
|
|
|
|
|
|
|
|||||||
Total ending allowance |
|
$ |
|
|
$ |
|
|
$ |
|
|
$ |
|
|
$ |
|
|
$ |
|
|
$ |
|
|||||||
|
|
|
|
|
|
|
|
|
|
|
|
|
|
|
|
|
|
|
|
|
|
|||||||
Loans: |
|
|
|
|
|
|
|
|
|
|
|
|
|
|
|
|
|
|
|
|
|
|||||||
Loans individually |
|
$ |
|
|
$ |
|
|
$ |
|
|
$ |
|
|
$ |
|
|
|
|
|
$ |
|
|||||||
Loans collectively |
|
|
|
|
|
|
|
|
|
|
|
|
|
|
|
|
|
|
|
|
|
|||||||
Total ending loans balance |
|
$ |
|
|
$ |
|
|
$ |
|
|
$ |
|
|
$ |
|
|
|
|
|
$ |
|
|||||||
47
The following table presents loans individually evaluated for impairment by class of loans as of December 31:
(Dollars in thousands) |
|
Unpaid |
|
|
Recorded |
|
|
Recorded |
|
|
Total |
|
|
Related |
|
|
Average |
|
|
Interest |
|
|||||||
2022 |
|
|
|
|
|
|
|
|
|
|
|
|
|
|
|
|
|
|
|
|
|
|||||||
Commercial |
|
$ |
|
|
$ |
|
|
$ |
— |
|
|
$ |
|
|
$ |
— |
|
|
$ |
|
|
$ |
|
|||||
Commercial real estate |
|
|
|
|
|
|
|
|
|
|
|
|
|
|
— |
|
|
|
|
|
|
|
||||||
Residential real estate |
|
|
|
|
|
|
|
|
|
|
|
|
|
|
— |
|
|
|
|
|
|
|
||||||
Construction & land development |
|
|
— |
|
|
|
— |
|
|
|
— |
|
|
|
— |
|
|
|
— |
|
|
|
|
|
|
— |
|
|
Consumer |
|
|
|
|
|
|
|
|
|
|
|
|
|
|
|
|
|
|
|
|
|
|||||||
Total impaired loans |
|
$ |
|
|
$ |
|
|
$ |
|
|
$ |
|
|
$ |
|
|
$ |
|
|
$ |
|
|||||||
|
|
|
|
|
|
|
|
|
|
|
|
|
|
|
|
|
|
|
|
|
|
|||||||
2021 |
|
|
|
|
|
|
|
|
|
|
|
|
|
|
|
|
|
|
|
|
|
|||||||
Commercial |
|
$ |
|
|
$ |
|
|
$ |
|
|
$ |
|
|
$ |
|
|
$ |
|
|
$ |
|
|||||||
Commercial real estate |
|
|
|
|
|
|
|
|
|
|
|
|
|
|
|
|
|
|
|
|
|
|||||||
Residential real estate |
|
|
|
|
|
|
|
|
|
|
|
|
|
|
|
|
|
|
|
|
|
|||||||
Construction & land development |
|
|
|
|
|
|
|
|
— |
|
|
|
|
|
|
— |
|
|
|
|
|
|
— |
|
||||
Consumer |
|
|
|
|
|
|
|
|
|
|
|
|
|
|
|
|
|
|
|
|
|
|||||||
Total impaired loans |
|
$ |
|
|
$ |
|
|
$ |
|
|
$ |
|
|
$ |
|
|
$ |
|
|
$ |
|
|||||||
1 Includes principal, accrued interest, unearned fees, and origination costs.
The following table presents the aging of accruing past due and nonaccrual loans by class of loans as of December 31:
|
|
|
|
|
Accruing Loans |
|
|
|
|
|
|
|
|
|
|
|||||||||||||
(Dollars in thousands) |
|
Current |
|
|
30-59 |
|
|
60-89 |
|
|
90 Days + |
|
|
Nonaccrual |
|
|
Total Past |
|
|
Total |
|
|||||||
2022 |
|
|
|
|
|
|
|
|
|
|
|
|
|
|
|
|
|
|
|
|
|
|||||||
Commercial |
|
$ |
|
|
$ |
|
|
$ |
|
|
$ |
— |
|
|
$ |
— |
|
|
$ |
|
|
$ |
|
|||||
Commercial real estate |
|
|
|
|
|
— |
|
|
|
— |
|
|
|
— |
|
|
|
|
|
|
|
|
|
|
||||
Residential real estate |
|
|
|
|
|
|
|
|
|
|
|
— |
|
|
|
|
|
|
|
|
|
|
||||||
Construction & land development |
|
|
|
|
|
|
|
|
— |
|
|
|
— |
|
|
|
— |
|
|
|
|
|
|
|
||||
Consumer |
|
|
|
|
|
|
|
|
|
|
|
— |
|
|
|
|
|
|
|
|
|
|
||||||
Total loans |
|
$ |
|
|
$ |
|
|
$ |
|
|
$ |
— |
|
|
$ |
|
|
$ |
|
|
$ |
|
||||||
|
|
|
|
|
|
|
|
|
|
|
|
|
|
|
|
|
|
|
|
|
|
|||||||
2021 |
|
|
|
|
|
|
|
|
|
|
|
|
|
|
|
|
|
|
|
|
|
|||||||
Commercial |
|
$ |
|
|
$ |
|
|
$ |
|
|
$ |
|
|
$ |
|
|
$ |
|
|
$ |
|
|||||||
Commercial real estate |
|
|
|
|
|
— |
|
|
|
— |
|
|
|
— |
|
|
|
|
|
|
|
|
|
|
||||
Residential real estate |
|
|
|
|
|
|
|
|
— |
|
|
|
— |
|
|
|
|
|
|
|
|
|
|
|||||
Construction & land development |
|
|
|
|
|
— |
|
|
|
— |
|
|
|
— |
|
|
|
|
|
|
|
|
|
|
||||
Consumer |
|
|
|
|
|
|
|
|
— |
|
|
|
— |
|
|
|
|
|
|
|
|
|
|
|||||
Total loans |
|
$ |
|
|
$ |
|
|
$ |
|
|
$ |
|
|
$ |
|
|
$ |
|
|
$ |
|
|||||||
Troubled Debt Restructurings
The Company had troubled debt restructurings (“TDRs”) of $
48
There were no l
(Dollars in thousands) |
|
Number Of |
|
|
Pre-Modification |
|
|
Post-Modification |
|
|||
2021 |
|
|
|
|
|
|
|
|
|
|||
Commercial |
|
|
|
|
$ |
|
|
$ |
|
|||
Commercial Real Estate |
|
|
|
|
|
|
|
|
|
|||
Residential Real Estate |
|
|
|
|
|
|
|
|
|
|||
Consumer |
|
|
|
|
|
|
|
|
|
|||
Total restructured loans |
|
|
|
|
$ |
|
|
$ |
|
|||
The loans restructured were modified by changing the monthly payment to interest only and extending the maturity dates. No principal reductions were made.
Real Estate Loans in Foreclosure
There was
Credit Quality Indicators
The Company categorizes commercial and commercial real estate loans into risk categories based on relevant information about the ability of borrowers to service their debt such as: current financial information, historical payment experience, credit documentation, public information, and current economic trends, among other factors. The Company analyzes commercial and commercial real estate loans individually by classifying the loans as to credit risk. This analysis includes commercial loans with an outstanding balance greater than $
The Company uses the following definitions for risk ratings:
Pass. Loans classified as pass (Cash Secured, Exceptional, Acceptable, Monitor or Pass Watch) may exhibit a wide array of characteristics but at a minimum represent an acceptable risk to the Bank. Borrowers in this rating may have leveraged but acceptable balance sheet positions, satisfactory asset quality, stable to favorable sales and earnings trends, acceptable liquidity, and adequate cash flow. Loans are considered fully collectable and require an average amount of administration. While generally adhering to credit policy, these loans may exhibit occasional exceptions that do not result in undue risk to the Bank. Borrowers are generally capable of absorbing setbacks, financial and otherwise, without the threat of failure.
Special Mention. Loans classified as special mention have a material weakness deserving of management’s close attention. If left uncorrected, these weaknesses may result in deterioration of the repayment prospects for the loan or of the Bank’s credit position at some future date.
Substandard. Loans classified as substandard are inadequately protected by the current net worth and paying capacity of the obligor or of the collateral pledged, if any. Loans so classified have a well-defined weakness or weaknesses jeopardizing the liquidation of the debt. They are characterized by the distinct possibility that the Bank will sustain some loss if the deficiencies are not corrected.
Doubtful. Loans classified as doubtful have all the weaknesses inherent in those classified as substandard, with the added characteristic that the weaknesses make collection or liquidation in full, on the basis of currently existing facts, conditions, values, highly questionable, and improbable.
Loans not meeting the criteria above that are analyzed individually as part of the above-described process are considered to be pass rated loans. Loans listed as not rated are either less than $
(Dollars in thousands) |
|
Pass |
|
|
Special |
|
|
Substandard |
|
|
Doubtful |
|
|
Not |
|
|
Total |
|
||||||
2022 |
|
|
|
|
|
|
|
|
|
|
|
|
|
|
|
|
|
|
||||||
Commercial |
|
$ |
|
|
$ |
|
|
$ |
|
|
$ |
— |
|
|
$ |
|
|
$ |
|
|||||
Commercial real estate |
|
|
|
|
|
|
|
|
|
|
|
— |
|
|
|
|
|
|
|
|||||
Construction & land development |
|
|
|
|
|
|
|
|
— |
|
|
|
— |
|
|
|
|
|
|
|
||||
Total |
|
$ |
|
|
$ |
|
|
$ |
|
|
$ |
— |
|
|
$ |
|
|
$ |
|
|||||
|
|
|
|
|
|
|
|
|
|
|
|
|
|
|
|
|
|
|
||||||
2021 |
|
|
|
|
|
|
|
|
|
|
|
|
|
|
|
|
|
|
||||||
Commercial |
|
$ |
|
|
$ |
|
|
$ |
|
|
$ |
— |
|
|
$ |
|
|
$ |
|
|||||
Commercial real estate |
|
|
|
|
|
|
|
|
|
|
|
— |
|
|
|
|
|
|
|
|||||
Construction & land development |
|
|
|
|
|
|
|
|
|
|
|
— |
|
|
|
|
|
|
|
|||||
Total |
|
$ |
|
|
$ |
|
|
$ |
|
|
$ |
— |
|
|
$ |
|
|
$ |
|
|||||
49
Management monitors the credit quality of residential real estate and consumer loans as homogenous groups. These loans are evaluated based on delinquency status and included in the past due table in this section. Nonperforming loans include loans past due 90 days and greater and loans on nonaccrual of interest status.
Mortgage Servicing Rights
For the years ended December 31, 2022 and 2021, the Company had outstanding MSRs of $
Total loans serviced for others approximated $
The following summarizes mortgage servicing rights capitalized and amortized during each year:
(Dollars in thousands) |
2022 |
|
|
2021 |
|
||
Beginning of year |
$ |
|
|
$ |
|
||
Capitalized additions |
|
|
|
|
|
||
Amortization |
|
( |
) |
|
|
( |
) |
Valuation allowance |
|
— |
|
|
|
— |
|
End of year |
$ |
|
|
$ |
|
||
NOTE 4 – PREMISES AND EQUIPMENT
Premises and equipment consisted of the following on December 31:
(Dollars in thousands) |
|
2022 |
|
|
2021 |
|
||
Land and improvements |
|
$ |
|
|
$ |
|
||
Buildings and improvements |
|
|
|
|
|
|
||
Furniture and equipment |
|
|
|
|
|
|
||
Leasehold improvements |
|
|
|
|
|
|
||
|
|
|
|
|
|
|
||
Accumulated depreciation |
|
|
|
|
|
|
||
Premises and equipment, net |
|
$ |
|
|
$ |
|
||
Depreciation expense amounted to $
NOTE 5 – LEASES
Operating leases in which the Company is the lessee are recorded as operating lease Right of Use (“ROU”) assets and operating lease liabilities, included in other assets and other liabilities, respectively, on the consolidated balance sheets. The Company does not currently have any finance leases. Operating lease ROU assets represent the right to use an underlying asset during the lease term and operating lease liabilities represent the obligation to make lease payments arising from the lease. The Company elected to adopt the transition method, which uses a modified retrospective transition approach. ROU assets and operating lease liabilities are recognized as of the date of adoption based on the present value of the remaining lease payments using a discount rate that represents the Company’s incremental borrowing rate at the date of initial application.
Operating lease expense, which is comprised of amortization of the ROU asset and the implicit interest accreted on the operating lease liability, is recognized on a straight-line basis over the lease term and is recorded in occupancy and equipment expense in the consolidated statements of income and other comprehensive income. The leases relate to bank branches with remaining lease terms of generally
As of December 31, 2022, assets were $
The following table summarizes other information related to our operating leases:
December 31, 2022 |
|
|
|
|
|
Weighted-average remaining lease term - operating leases in years |
|
|
|
|
|
Weighted-average discount rate - operating leases |
|
|
|
% |
|
50
The following table presents aggregate lease maturities and obligations as of December 31, 2022:
(Dollars in thousands) |
|
|
|
|
December 31, 2022 |
|
|
|
|
2023 |
|
$ |
|
|
2024 |
|
|
|
|
2025 |
|
|
|
|
2026 |
|
|
|
|
2027 |
|
|
|
|
2028 and thereafter |
|
|
— |
|
Total lease payments |
|
|
|
|
Less: interest |
|
|
|
|
Present value of lease liabilities |
|
$ |
|
|
NOTE 6 – INTEREST-BEARING DEPOSITS
Interest-bearing deposits on December 31 were as follows:
(Dollars in thousands) |
|
2022 |
|
|
2021 |
|
||
Demand |
|
$ |
|
|
$ |
|
||
Savings |
|
|
|
|
|
|
||
Time deposits: |
|
|
|
|
|
|
||
$250,000 and greater |
|
|
|
|
|
|
||
Other |
|
|
|
|
|
|
||
Total interest-bearing deposits |
|
$ |
|
|
$ |
|
||
On December 31, 2022, stated maturities of time deposits were as follows:
(Dollars in thousands) |
|
|
|
|
2023 |
|
$ |
|
|
2024 |
|
|
|
|
2025 |
|
|
|
|
2026 |
|
|
|
|
2027 |
|
|
|
|
Total |
|
$ |
|
|
NOTE 7 – BORROWINGS
Short-term borrowings
Short-term borrowings include overnight repurchase agreements, federal funds purchased, and short-term advances through the FHLB.
(Dollars in thousands) |
|
2022 |
|
|
|
2021 |
|
|
||
Balance at year-end |
|
$ |
|
|
|
$ |
|
|
||
Average balance outstanding |
|
|
|
|
|
|
|
|
||
Maximum month-end balance |
|
|
|
|
|
|
|
|
||
Weighted-average rate at year-end |
|
|
|
% |
|
|
|
% |
||
Weighted-average rate during the year |
|
|
|
|
|
|
|
|
||
Average balances outstanding during the year represent daily average balances; average interest rates represent interest expenses divided by the related average balances.
51
The following table provides additional detail regarding the collateral pledged to secure repurchase agreements accounted for as secured borrowings:
|
|
Remaining Contractual Maturity |
|
|||||
(Dollars in thousands) |
|
December 31, |
|
|
December 31, |
|
||
Securities of U.S. Government agencies and mortgage-backed securities of |
|
$ |
|
|
$ |
|
||
Repurchase agreements |
|
|
|
|
|
|
||
Other borrowings
The following table sets forth information concerning other borrowings:
|
|
Maturity Range |
|
Weighted |
|
|
Stated Interest |
|
|
At December 31, |
|
|||||||||||||
(Dollars in thousands) |
|
From |
|
To |
|
Rate |
|
|
From |
|
|
To |
|
|
2022 |
|
|
2021 |
|
|||||
Fixed-rate amortizing |
|
|
|
|
% |
|
|
% |
|
|
% |
|
$ |
|
|
$ |
|
|||||||
Maturities of other borrowings on December 31, 2022, are summarized as follows for the years ended December 31:
(Dollars in thousands) |
|
Amount |
|
|
Weighted |
|
|
||
2023 |
|
$ |
|
|
|
|
% |
||
2024 |
|
|
|
|
|
|
|
||
2025 |
|
|
|
|
|
|
|
||
2026 |
|
|
|
|
|
|
|
||
2027 |
|
|
|
|
|
|
|
||
2028 and beyond |
|
|
|
|
|
|
|
||
|
|
$ |
|
|
|
|
% |
||
Monthly principal and interest payments, as well as
NOTE 8 – INCOME TAXES
Income tax expense was as follows:
(Dollars in thousands) |
|
2022 |
|
|
2021 |
|
||
Current |
|
$ |
|
|
$ |
|
||
Deferred |
|
|
( |
) |
|
|
( |
) |
Total income tax provision |
|
$ |
|
|
$ |
|
||
Effective tax rates were
(Dollars in thousands) |
|
2022 |
|
|
2021 |
|
||
Expected provision using statutory federal income tax rate |
|
$ |
|
|
$ |
|
||
Effect of bond and loan tax-exempt income |
|
|
( |
) |
|
|
( |
) |
Bank owned life insurance income |
|
|
( |
) |
|
|
( |
) |
Other |
|
|
|
|
|
|
||
Total income tax provision |
|
$ |
|
|
$ |
|
||
52
The tax effects of temporary differences that give rise to deferred tax assets and deferred tax liabilities on December 31 were as follows:
(Dollars in thousands) |
|
2022 |
|
|
2021 |
|
||
Allowance for loan losses |
|
$ |
|
|
$ |
|
||
Unrealized loss on securities |
|
|
|
|
|
|
||
Other |
|
|
|
|
|
|
||
Deferred tax assets |
|
|
|
|
|
|
||
Premises and equipment |
|
|
( |
) |
|
|
( |
) |
Federal Home Loan Bank stock dividends |
|
|
( |
) |
|
|
( |
) |
Deferred loan fees |
|
|
( |
) |
|
|
( |
) |
Prepaid expenses |
|
|
( |
) |
|
|
( |
) |
Other |
|
|
( |
) |
|
|
( |
) |
Deferred tax liabilities |
|
|
( |
) |
|
|
( |
) |
Net deferred tax asset (liability) |
|
$ |
|
|
$ |
|
||
There is currently
NOTE 9 – EMPLOYEE BENEFITS
The Company sponsors a contributory 401(k) profit-sharing plan (the “Plan”) covering substantially all employees who meet certain age and service requirements. The Plan permits investment in the Company’s common stock subject to various limitations and provides for discretionary profit sharing and matching contributions. The discretionary profit-sharing contribution is determined annually by the Board of Directors and amounted to
The Company sponsors a non-qualified deferred compensation plan covering eligible officers. Expense under the plan amounted to $
NOTE 10 – FINANCIAL INSTRUMENTS WITH OFF-BALANCE SHEET RISK
The Bank is party to financial instruments with off-balance sheet risk in the normal course of business to meet the financing needs of its customers. These financial instruments are primarily loan commitments to extend credit and letters of credit. These instruments involve, to varying degrees, elements of credit risk in excess of the amounts recognized in the Consolidated Balance Sheets. The contract amount of these instruments reflects the extent of involvement the Bank has in these financial instruments. The Bank’s exposure to credit loss in the event of the nonperformance by the other party to the financial instruments for loan commitments to extend credit and letters of credit is represented by the contractual amounts of these instruments. The Bank uses the same credit policies in making loan commitments as it does for on-balance sheet loans.
The following financial instruments whose contract amount represents credit risk were outstanding on December 31:
(Dollars in thousands) |
|
2022 |
|
|
2021 |
|
||
Commitments to extend credit |
|
$ |
|
|
$ |
|
||
Letters of credit |
|
|
|
|
|
|
||
Commitments to extend credit are agreements to lend to a customer as long as there is no violation of any condition established in the contract. Consumer commitments generally have fixed expiration dates and commercial commitments are generally due on demand and may require payment of a fee. Since many of the commitments are expected to expire without being drawn upon, the total commitment amount does not necessarily represent future cash requirements. The Company evaluates each customer’s credit worthiness on a case-by-case basis. The amount of collateral, obtained if deemed necessary by the Company upon extension of credit, is based on management’s credit evaluation of the customer. Collateral held varies but may include residential real estate, accounts receivable, recognized inventory, property, plant and equipment, and income-producing commercial properties.
53
Letters of credit are written conditional commitments issued by the Company to guarantee the performance of a customer to a third party and are reviewed for renewal at expiration. The credit risk involved in issuing letters of credit is essentially the same as that involved in extending loans to customers. The Company requires collateral supporting these commitments when deemed appropriate.
The Company had $
NOTE 11 – RELATED-PARTY TRANSACTIONS
In the ordinary course of business, loans are made by the Bank to executive officers, directors, their immediate family members, and their related business interests consistent with Federal Reserve Regulation O and GAAP definition of related parties.
The following is an analysis of activity of related-party loans for the years ended December 31:
(Dollars in thousands) |
|
2022 |
|
|
2021 |
|
||
Balance at beginning of year |
|
$ |
|
|
$ |
|
||
New loans and advances |
|
|
|
|
|
|
||
Repayments, including loans sold |
|
|
|
|
|
|
||
Balance at end of year |
|
$ |
|
|
$ |
|
||
Deposits from executive officers, directors, their immediate family members, and their related business interests on December 31, 2022, and 2021 were approximately $
NOTE 12 – REGULATORY MATTERS
The Company (on a consolidated basis) and Bank are subject to various regulatory capital requirements administered by the federal and state banking agencies. Failure to meet minimum capital requirements can initiate certain mandatory and possibly additional discretionary actions by regulators that, if undertaken, could have a direct material effect on the Company’s and Bank’s financial performance. Under capital adequacy guidelines and the regulatory framework for prompt corrective action, the Company and Bank must meet specific capital guidelines involving quantitative measures of the assets, liabilities, and certain off-balance-sheet items as calculated under regulatory accounting practices. The capital amounts and classification are also subject to qualitative judgments by the regulators about components, risk weightings, and other factors.
Quantitative measures established by regulation to ensure capital adequacy require the Company and Bank to maintain minimum amounts and ratios (set forth in the following table) of Total capital, Tier 1 capital and Common equity tier 1 capital (as defined in the regulations) to risk-weighted assets (as defined), and of Tier 1 capital to average assets (as defined). Management believes as of December 31, 2022 and 2021, the Company and Bank met or exceeded all capital adequacy requirements to which they are subject.
As of December 31, 2022, the most recent notification from federal and state banking agencies categorized the Bank as “well capitalized” under the regulatory framework for prompt corrective action. To be categorized as “well capitalized” an institution must maintain minimum Total risk-based, Tier 1 risk-based, Common equity Tier 1, and Tier 1 leverage ratios as set forth in the following tables. There are no known conditions or events since that notification that Management believes have changed the Bank’s category.
54
The actual capital amounts and ratios of the Company and Bank as of December 31 are presented in the following tables:
|
|
Actual |
|
|
|
Minimum |
|
|
|
Minimum Required |
|
|
|||||||||||||||
(Dollars in thousands) |
|
Amount |
|
|
Ratio |
|
|
|
Amount |
|
|
Ratio |
|
|
|
Amount |
|
|
Ratio |
|
|
||||||
2022 |
|
|
|
|
|
|
|
|
|
|
|
|
|
|
|
|
|
|
|
|
|
||||||
Total capital to risk-weighted assets |
|
|
|
|
|
|
|
|
|
|
|
|
|
|
|
|
|
|
|
|
|
||||||
Consolidated |
|
$ |
|
|
|
|
% |
|
$ |
|
|
|
|
% |
|
$ |
|
|
|
|
% |
||||||
Bank |
|
|
|
|
|
|
|
|
|
|
|
|
|
|
|
|
|
|
|
|
|
||||||
Tier 1 capital to risk-weighted assets |
|
|
|
|
|
|
|
|
|
|
|
|
|
|
|
|
|
|
|
|
|
||||||
Consolidated |
|
|
|
|
|
|
|
|
|
|
|
|
|
|
|
|
|
|
|
|
|
||||||
Bank |
|
|
|
|
|
|
|
|
|
|
|
|
|
|
|
|
|
|
|
|
|
||||||
Common equity tier 1 capital to |
|
|
|
|
|
|
|
|
|
|
|
|
|
|
|
|
|
|
|
|
|
||||||
Consolidated |
|
|
|
|
|
|
|
|
|
|
|
|
|
|
|
|
|
|
|
|
|
||||||
Bank |
|
|
|
|
|
|
|
|
|
|
|
|
|
|
|
|
|
|
|
|
|
||||||
Tier 1 leverage ratio |
|
|
|
|
|
|
|
|
|
|
|
|
|
|
|
|
|
|
|
|
|
||||||
Consolidated |
|
|
|
|
|
|
|
|
|
|
|
|
|
|
|
|
|
|
|
|
|
||||||
Bank |
|
|
|
|
|
|
|
|
|
|
|
|
|
|
|
|
|
|
|
|
|
||||||
|
|
|
|
|
|
|
|
|
|
|
|
|
|
|
|
|
|
|
|
|
|
||||||
2021 |
|
|
|
|
|
|
|
|
|
|
|
|
|
|
|
|
|
|
|
|
|
||||||
Total capital to risk-weighted assets |
|
|
|
|
|
|
|
|
|
|
|
|
|
|
|
|
|
|
|
|
|
||||||
Consolidated |
|
$ |
|
|
|
|
% |
|
$ |
|
|
|
|
% |
|
$ |
|
|
|
|
% |
||||||
Bank |
|
|
|
|
|
|
|
|
|
|
|
|
|
|
|
|
|
|
|
|
|
||||||
Tier 1 capital to risk-weighted assets |
|
|
|
|
|
|
|
|
|
|
|
|
|
|
|
|
|
|
|
|
|
||||||
Consolidated |
|
|
|
|
|
|
|
|
|
|
|
|
|
|
|
|
|
|
|
|
|
||||||
Bank |
|
|
|
|
|
|
|
|
|
|
|
|
|
|
|
|
|
|
|
|
|
||||||
Common equity tier 1 capital to |
|
|
|
|
|
|
|
|
|
|
|
|
|
|
|
|
|
|
|
|
|
||||||
Consolidated |
|
|
|
|
|
|
|
|
|
|
|
|
|
|
|
|
|
|
|
|
|
||||||
Bank |
|
|
|
|
|
|
|
|
|
|
|
|
|
|
|
|
|
|
|
|
|
||||||
Tier 1 leverage ratio |
|
|
|
|
|
|
|
|
|
|
|
|
|
|
|
|
|
|
|
|
|
||||||
Consolidated |
|
|
|
|
|
|
|
|
|
|
|
|
|
|
|
|
|
|
|
|
|
||||||
Bank |
|
|
|
|
|
|
|
|
|
|
|
|
|
|
|
|
|
|
|
|
|
||||||
The Company’s primary source of funds with which to pay dividends, are dividends received from the Bank. The payment of dividends by the Bank to the Company is subject to restrictions by its regulatory agencies. These restrictions generally limit dividends to current year net income and prior
55
NOTE 13 – CONDENSED PARENT COMPANY FINANCIAL INFORMATION
A summary of condensed financial information of the parent company as of December 31, 2022, and 2021, and for each of the two years in the period ended December 31, 2022, follows:
(Dollars in thousands) |
|
2022 |
|
|
2021 |
|
||
CONDENSED BALANCE SHEETS |
|
|
|
|
|
|
||
ASSETS |
|
|
|
|
|
|
||
Cash deposited with subsidiary bank |
|
$ |
|
|
$ |
|
||
Investment in subsidiary bank |
|
|
|
|
|
|
||
Securities available-for-sale |
|
|
|
|
|
|
||
Other assets |
|
|
|
|
|
|
||
TOTAL ASSETS |
|
$ |
|
|
$ |
|
||
LIABILITIES AND SHAREHOLDERS’ EQUITY |
|
|
|
|
|
|
||
Total liabilities |
|
$ |
|
|
$ |
|
||
Total shareholders’ equity |
|
|
|
|
|
|
||
TOTAL LIABILITIES AND SHAREHOLDERS’ EQUITY |
|
$ |
|
|
$ |
|
||
(Dollars in thousands) |
|
2022 |
|
|
2021 |
|
||
CONDENSED STATEMENTS OF COMPREHENSIVE INCOME |
|
|
|
|
|
|
||
Dividends on securities |
|
$ |
|
|
$ |
|
||
Dividends from subsidiary |
|
|
|
|
|
|
||
Unrealized (loss) gain on equity securities |
|
|
( |
) |
|
|
|
|
Total income |
|
|
|
|
|
|
||
Operating expenses |
|
|
|
|
|
|
||
Income before taxes and undistributed equity |
|
|
|
|
|
|
||
Income tax benefit |
|
|
( |
) |
|
|
( |
) |
Equity earnings in subsidiary, net of dividends |
|
|
|
|
|
|
||
NET INCOME |
|
$ |
|
|
$ |
|
||
COMPREHENSIVE INCOME |
|
$ |
|
|
$ |
|
||
(Dollars in thousands) |
|
2022 |
|
|
2021 |
|
||
CONDENSED STATEMENTS OF CASH FLOWS |
|
|
|
|
|
|
||
Cash flows from operating activities |
|
|
|
|
|
|
||
Net income |
|
$ |
|
|
$ |
|
||
Adjustments to reconcile net income to cash provided by operations: |
|
|
|
|
|
|
||
Equity earnings in subsidiary, net of dividends |
|
|
( |
) |
|
|
( |
) |
Change in other assets, liabilities |
|
|
( |
) |
|
|
( |
) |
Net cash provided by operating activities |
|
|
|
|
|
|
||
Cash flows from investing activities |
|
|
|
|
|
|
||
Purchase of equity securities |
|
|
( |
) |
|
|
— |
|
Net cash used in investing activities |
|
|
( |
) |
|
|
— |
|
Cash flows from financing activities |
|
|
|
|
|
|
||
Cash dividends paid |
|
|
( |
) |
|
|
( |
) |
Purchase of treasury stock |
|
|
( |
) |
|
|
( |
) |
Net cash used in financing activities |
|
|
( |
) |
|
|
( |
) |
Decrease in cash |
|
|
( |
) |
|
|
( |
) |
Cash at beginning of year |
|
|
|
|
|
|
||
Cash at end of year |
|
$ |
|
|
$ |
|
||
56
NOTE 14 – FAIR VALUE MEASUREMENTS
The Company provides disclosures about assets and liabilities carried at fair value. The framework provides a fair value hierarchy prioritizing the inputs to valuation techniques used to measure fair value. The hierarchy gives the highest priority to unadjusted quoted prices in active markets for identical assets or liabilities and lowest priority to unobservable inputs. The three broad levels of the fair value hierarchy are described below:
Level I: |
|
Inputs to the valuation methodology are unadjusted quoted prices for identical assets or liabilities in active markets the Company has the ability to access. |
Level II: |
|
Inputs to the valuation methodology include quoted prices for similar assets or liabilities in active markets; quoted prices for identical or similar assets or liabilities in inactive markets; inputs other than quoted prices observable for the asset or liability; inputs derived principally from or corroborated by observable market data by or other means including certified appraisals. If the asset or liability has a specified (contractual) term, the Level II input must be observable for substantially the full term of the asset or liability. |
Level III: |
|
Inputs to the valuation methodology are unobservable and significant to the fair value measurement. |
The following table presents the assets reported on the consolidated statements of financial condition at their fair value on a recurring basis as of December 31, 2022, and December 31, 2021, by level within the fair value hierarchy.
(Dollars in thousands) |
|
Level I |
|
|
Level II |
|
|
Level III |
|
|
Total |
|
||||
Assets: |
|
|
|
|
December 31, |
|
|
|
|
|||||||
Securities available-for-sale |
|
|
|
|
|
|
|
|
|
|
|
|
||||
U.S. Treasury securities |
|
$ |
|
|
$ |
— |
|
|
$ |
— |
|
|
$ |
|
||
U.S. Government agencies |
|
|
— |
|
|
|
|
|
|
— |
|
|
|
|
||
Mortgage-backed securities of government |
|
|
— |
|
|
|
|
|
|
— |
|
|
|
|
||
Asset-backed securities of government agencies |
|
|
— |
|
|
|
|
|
|
— |
|
|
|
|
||
State and political subdivisions |
|
|
— |
|
|
|
|
|
|
— |
|
|
|
|
||
Corporate bonds |
|
|
— |
|
|
|
|
|
|
— |
|
|
|
|
||
Total available-for-sale securities |
|
$ |
|
|
$ |
|
|
$ |
— |
|
|
$ |
|
|||
Equity securities |
|
$ |
|
|
$ |
— |
|
|
$ |
— |
|
|
$ |
|
||
|
|
|
|
|
|
|
|
|
|
|
|
|
||||
Assets: |
|
|
|
|
December 31, |
|
|
|
|
|||||||
Securities available-for-sale |
|
|
|
|
|
|
|
|
|
|
|
|
||||
U.S. Treasury securities |
|
$ |
|
|
$ |
— |
|
|
$ |
— |
|
|
$ |
|
||
U.S. Government agencies |
|
|
— |
|
|
|
|
|
|
— |
|
|
|
|
||
Mortgage-backed securities of government |
|
|
— |
|
|
|
|
|
|
— |
|
|
|
|
||
Asset-backed securities of government agencies |
|
|
— |
|
|
|
|
|
|
— |
|
|
|
|
||
State and political subdivisions |
|
|
— |
|
|
|
|
|
|
— |
|
|
|
|
||
Corporate bonds |
|
|
— |
|
|
|
|
|
|
— |
|
|
|
|
||
Total available-for-sale securities |
|
$ |
|
|
$ |
|
|
$ |
— |
|
|
$ |
|
|||
Equity securities |
|
$ |
|
|
$ |
— |
|
|
$ |
— |
|
|
$ |
|
||
57
There were
NOTE 15 – FAIR VALUES OF FINANCIAL INSTRUMENTS
The estimated fair values of recognized financial instruments carried at amortized cost as of December 31 were as follows:
|
|
2022 |
|
||||||||||||||||||
|
|
|
Carrying |
|
|
|
|
|
|
|
|
|
|
|
Total Fair |
|
|||||
(Dollars in thousands) |
|
|
Value |
|
|
Level I |
|
|
Level II |
|
|
Level III |
|
|
Value |
|
|||||
Financial assets |
|
|
|
|
|
|
|
|
|
|
|
|
|
|
|
|
|||||
Securities held-to-maturity |
|
$ |
|
|
|
$ |
|
|
$ |
|
|
$ |
— |
|
|
$ |
|
||||
Loans held for sale |
|
|
|
|
|
|
|
|
|
— |
|
|
|
— |
|
|
|
|
|||
Net loans |
|
|
|
|
|
|
— |
|
|
|
— |
|
|
|
|
|
|
|
|||
Mortgage servicing rights |
|
|
|
|
|
|
— |
|
|
|
— |
|
|
|
|
|
|
|
|||
Financial liabilities |
|
|
|
|
|
|
|
|
|
|
|
|
|
|
|
|
|||||
Deposits |
|
$ |
|
|
|
$ |
|
|
$ |
— |
|
|
$ |
|
|
$ |
|
||||
Other borrowings |
|
|
|
|
|
|
— |
|
|
|
— |
|
|
|
|
|
|
|
|||
|
|
|
|
|
|
|
|
|
|
|
|
|
|
|
|
|
|||||
|
|
2021 |
|
||||||||||||||||||
|
|
|
Carrying |
|
|
|
|
|
|
|
|
|
|
|
Total Fair |
|
|||||
(Dollars in thousands) |
|
|
Value |
|
|
Level I |
|
|
Level II |
|
|
Level III |
|
|
Value |
|
|||||
Financial assets |
|
|
|
|
|
|
|
|
|
|
|
|
|
|
|
|
|||||
Securities held-to-maturity |
|
$ |
|
|
|
$ |
|
|
$ |
|
|
$ |
— |
|
|
$ |
|
||||
Loans held for sale |
|
|
|
|
|
|
|
|
|
— |
|
|
|
— |
|
|
|
|
|||
Net loans |
|
|
|
|
|
|
— |
|
|
|
— |
|
|
|
|
|
|
|
|||
Mortgage servicing rights |
|
|
|
|
|
|
— |
|
|
|
— |
|
|
|
|
|
|
|
|||
Financial liabilities |
|
|
|
|
|
|
|
|
|
|
|
|
|
|
|
|
|||||
Deposits |
|
$ |
|
|
|
$ |
|
|
$ |
— |
|
|
$ |
|
|
$ |
|
||||
Other borrowings |
|
|
|
|
|
|
— |
|
|
|
— |
|
|
|
|
|
|
|
|||
Other financial instruments carried at amortized cost include cash and cash equivalents, restricted stock, bank-owned life insurance, accrued interest receivable, short-term borrowings, and accrued interest payable, all of which have a level 1 fair value that approximates their carrying value.
58
NOTE 16 – ACCUMULATED OTHER COMPREHENSIVE LOSS
The following table presents the changes in accumulated other comprehensive (loss) income by component net of tax for the years ended December 31, 2022, and 2021:
(Dollars in thousands) |
|
Pretax |
|
|
Tax Effect |
|
|
After-Tax |
|
|||
BALANCE AS OF DECEMBER 31, 2020 |
|
$ |
|
|
$ |
( |
) |
|
$ |
|
||
Unrealized holding loss on available-for-sale |
|
|
( |
) |
|
|
|
|
|
( |
) |
|
Unrealized loss on securities transferred from available-for-sale to held to maturity |
|
|
( |
) |
|
|
|
|
|
( |
) |
|
Amortization of held-to-maturity discount resulting |
|
|
|
|
|
( |
) |
|
|
|
||
Total other comprehensive loss |
|
|
( |
) |
|
|
|
|
|
( |
) |
|
|
|
|
|
|
|
|
|
|
|
|||
BALANCE AS OF DECEMBER 31, 2021 |
|
$ |
( |
) |
|
$ |
|
|
$ |
( |
) |
|
Unrealized holding loss on available-for-sale |
|
|
( |
) |
|
|
|
|
|
( |
) |
|
Amortization of held-to-maturity discount resulting |
|
|
|
|
|
( |
) |
|
|
|
||
Total other comprehensive loss |
|
|
( |
) |
|
|
|
|
|
( |
) |
|
|
|
|
|
|
|
|
|
|
|
|||
BALANCE AS OF DECEMBER 31, 2022 |
|
$ |
( |
) |
|
$ |
|
|
$ |
( |
) |
|
NOTE 17 – CONTINGENT LIABILITIES
In the normal course of business, the Company is subject to pending and threatened legal actions. Although, the Company is not able to predict the outcome of such actions, after reviewing pending and threatened actions, management believes that the outcome of any or all such actions will not have a material adverse effect on the results of operations or shareholders’ equity of the Company.
NOTE 18– QUARTERLY FINANCIAL DATA (UNAUDITED)
The following is a summary of selected quarterly financial data (unaudited) for the years ended December 31:
(Dollars in thousands, except per share data) |
|
Interest |
|
|
Net |
|
|
Net |
|
|
Basic and Diluted |
|
||||
2022 |
|
|
|
|
|
|
|
|
|
|
|
|
||||
First quarter |
|
$ |
|
|
$ |
|
|
$ |
|
|
$ |
|
||||
Second quarter |
|
|
|
|
|
|
|
|
|
|
|
|
||||
Third quarter |
|
|
|
|
|
|
|
|
|
|
|
|
||||
Fourth quarter |
|
|
|
|
|
|
|
|
|
|
|
|
||||
|
|
|
|
|
|
|
|
|
|
|
|
|
||||
2021 |
|
|
|
|
|
|
|
|
|
|
|
|
||||
First quarter |
|
$ |
|
|
$ |
|
|
$ |
|
|
$ |
|
||||
Second quarter |
|
|
|
|
|
|
|
|
|
|
|
|
||||
Third quarter |
|
|
|
|
|
|
|
|
|
|
|
|
||||
Fourth quarter |
|
|
|
|
|
|
|
|
|
|
|
|
||||
59
ITEM 9. CHANGES IN AND DISAGREEMENTS WITH ACCOUNTANTS ON ACCOUNTING AND FINANCIAL DISCLOSURE.
None.
ITEM 9A. CONTROLS AND PROCEDURES.
Disclosure Controls and Procedures
With the participation of the Company’s management, including the Company’s Chief Executive Officer and Chief Financial Officer, an evaluation of the effectiveness of the Company’s disclosure controls and procedures (as defined in Rules 13a-15(e) and 15d-15(e) of the Securities Exchange Act of 1934) was performed, as of the end of the period covered by this Annual Report on Form 10-K. Based on this evaluation, the Chief Executive Officer and Chief Financial Officer have concluded that the Company’s disclosure controls and procedures were effective.
Internal Control over Financial Reporting
Information contained in the Report On Management’s Assessment of Internal Control Over Financial Reporting in Item 8 of this Annual Report on Form 10-K is incorporated herein by reference
Changes in Internal Control over Financial Reporting
There have been no changes during the quarter ended December 31, 2022, in the Company’s internal controls over financial reporting (as defined in Rules 13a-15(e) and 15d-15(e) of the Securities Exchange Act of 1934) that have materially affected, or are reasonably likely to materially affect, CSB’s 2022 internal control over financial reporting.
ITEM 9B. OTHER INFORMATION.
None.
ITEM 9C. DISCLOSURE REGARDING FOREIGN JURISDICTIONS THAT PREVENT INSPECTIONS.
Not applicable.
60
PART III
ITEM 10. DIRECTORS, EXECUTIVE OFFICERS, AND CORPORATE GOVERNANCE.
The information required by Item 401 of Regulation S-K concerning the directors of the Company and the nominees for election as directors of the Company at the Annual Meeting of Shareholders to be held on April 26, 2023 (the “2023 Annual Meeting”), is incorporated herein by reference from the information to be included under the captions “Proposal One – Election of Directors,” “Nominees for Election of Directors,” and “Directors Continuing in Office” in the Company’s definitive proxy statement relating to the 2023 Annual Meeting to be filed with the SEC (the “2023 Proxy Statement”) no later than 120 days after December 31, 2022. The information required by Item 401 of Regulation S-K concerning the executive officers of the Company is incorporated herein by reference from the information to be included under the caption “Executive Officers” in the 2023 Proxy Statement.
Code of Ethics
The Company has adopted a Code of Ethics that applies to its principal officers, including the Chief Executive Officer and Chief Financial Officer. The Company has posted its Code of Ethics on its website at www.csb1.com; select Investor Relations/Corporate Governance/Governance Documents. The Company plans to satisfy SEC disclosure requirements regarding any amendments to, or waiver of, the Code of Ethics relating to its Chief Executive Officer or Chief Financial Officer, and persons performing similar functions, by posting such information on the Company’s website or by making any necessary filings with the SEC. Any person may receive a copy of our Code of Ethics free of charge upon request by calling the Company during business hours or by sending a written request.
Procedures for Recommending Director Nominees
Information concerning the procedures by which shareholders may recommend nominees to the Company’s Board of Directors can be found under the caption, “Shareholder Recommendations” in the 2023 Proxy Statement. This is a new proposal, if approved, to amend the code of regulations to conform with the Commision's newly adopted Rule 14a-19 of the Exchange Act. Shareholders will be required to comply with the amended nomination procedure as described under Propasal Three - Approve the Amendment to Article III, Section 3 of our code of regulations.
Audit Committee
The information required by Items 407(d)(4) and (d)(5) of Regulation S-K is incorporated herein by reference from the disclosure to be included under the sections, “Membership and Meetings of the Board and its Committees” and the subsection, “Committees of the Board of Directors – Audit Committee” in the 2023 Proxy Statement.
ITEM 11. EXECUTIVE COMPENSATION.
The information required by Item 402 of Regulation S-K is incorporated herein by reference from the disclosure to be included under the sections, “Discussion of Executive Compensation Programs” and, “Executive Compensation and Other Information” and the subsection, “Directors’ Compensation” under the section captioned, “Membership and Meetings of the Board and its Committees” in the 2023 Proxy Statement.
The information required by Item 407(e)(4) of Regulation S-K is incorporated herein by reference from the disclosure to be included under the section, “Compensation Committee Interlocks and Insider Participation” in the 2023 Proxy Statement.
The information required by Item 407(e)(5) of Regulation S-K is incorporated herein by reference from the disclosure to be included under the section, “The Compensation Committee Report” in the 2023 Proxy Statement.
ITEM 12. SECURITY OWNERSHIP OF CERTAIN BENEFICIAL OWNERS AND MANAGEMENT AND RELATED STOCKHOLDER MATTERS.
Equity Compensation Plan Information
None.
Security Ownership of Certain Beneficial Owners and Management
The information required by Item 403 of Regulation S-K is incorporated herein by reference from the disclosure to be included under the section, “Beneficial Ownership of Management and Certain Beneficial Owners” in the 2023 Proxy Statement.
ITEM 13. CERTAIN RELATIONSHIPS AND RELATED TRANSACTIONS, AND DIRECTOR INDEPENDENCE.
The information required by Item 404 of Regulation S-K is incorporated herein by reference from the disclosure to be included under the section, “Certain Relationships and Related Transactions” in the 2023 Proxy Statement.
The information required by Item 407(a) of Regulation S-K is incorporated herein by reference from the disclosure to be included under the section, “Membership and Meetings of the Board and its Committees” in the 2023 Proxy Statement.
ITEM 14. PRINCIPAL ACCOUNTANT FEES AND SERVICES.
The information required by this Item 14 is incorporated herein by reference from the disclosure to be included under the section, “Independent Registered Public Accounting Firm Fees” and subsection, “Audit Committee Procedures for Pre-Approval of Services by the Independent Public Accounting Firm” in the 2023 Proxy Statement.
61
PART IV
ITEM 15. EXHIBITS AND FINANCIAL STATEMENT SCHEDULES.
All schedules for which provision is made in the applicable accounting regulation of the Securities and Exchange Commission are not required under the related instructions or are inapplicable and have been omitted.
The documents listed in the Index to Exhibits that immediately precedes the "Signatures" pages of this Annual Report on Form 10-K are filed or furnished with this Annual Report on Form 10-K as exhibits or incorporated into this Annual Report on Form 10-K by reference.
Certain schedules have been omitted because the required information is included in the consolidated financial statements and notes thereto or because they are not applicable or not required.
ITEM 16. FORM 10-K SUMMARY.
None.
62
(a)(3) Exhibits
The documents listed below are filed with this Annual Report on Form 10-K as exhibits or incorporated into this Annual Report on Form 10-K by reference as noted:
Exhibit Number |
|
Description of Document |
|
|
|
3.1 |
|
|
|
|
|
3.1.1 |
|
|
|
|
|
3.2 |
|
Code of Regulations of CSB Bancorp, Inc. (incorporated by reference to Registrant’s Form 10-SB). |
|
|
|
3.2.1 |
|
|
|
|
|
4 |
|
|
|
|
|
10.1+ |
|
|
|
|
|
10.2+ |
|
|
|
|
|
10.3+ |
|
|
|
|
|
10.4+ |
|
|
|
|
|
10.5+ |
|
|
|
|
|
21* |
|
|
|
|
|
23.1* |
|
|
|
|
|
31.1* |
|
|
|
|
|
31.2* |
|
|
|
|
|
32.1** |
|
|
|
|
|
32.2** |
|
|
|
|
|
101.INS |
|
Inline XBRL Instance Document – the instance document does not appear in the Interactive Data File because its XBRL tags are embedded within the Inline XBRL document. |
|
|
|
101.SCH |
|
Inline XBRL Taxonomy Extension Schema Document |
|
|
|
101.CAL |
|
Inline XBRL Taxonomy Extension Calculation Linkbase Document |
|
|
|
101.DEF |
|
Inline XBRL Taxonomy Extension Definition Linkbase Document |
|
|
|
101.LAB |
|
Inline XBRL Taxonomy Extension Label Linkbase Document |
|
|
|
101.PRE |
|
Inline XBRL Taxonomy Extension Presentation Linkbase Document |
|
|
|
104 |
|
The cover page for the Company’s Annual Report on Form 10-K for the year ended December 31, 2022, has been formatted in Inline XBRL and contained in Exhibit 101 |
* Filed herewith.
** Furnished herewith.
+ Indicates management contract or compensatory plan.
63
SIGNATURES
Pursuant to the requirements of Section 13 or 15(d) of the Securities Exchange Act of 1934, the registrant has duly caused this report to be signed on its behalf by the undersigned, thereunto duly authorized.
|
|
CSB BANCORP, INC. |
|
|
|
|
|
/s/ Eddie L. Steiner |
Date: March 16, 2023 |
|
Eddie L. Steiner, President and Chief Executive Officer |
Pursuant to the requirements of the Securities Exchange Act of 1934, this report has been signed below by the following persons on behalf of the registrant and in the capacities indicated on March 16, 2023.
Signatures |
|
Title |
|
|
|
/s/ Eddie L. Steiner |
|
President and Chief Executive Officer |
Eddie L. Steiner |
|
|
|
|
|
/s/ Paula J. Meiler |
|
Senior Vice President and Chief Financial Officer |
Paula J. Meiler |
|
|
|
|
|
/s/ Pamela S. Basinger |
|
Vice President and Principal Accounting Officer |
Pamela S. Basinger |
|
|
|
|
|
/s/ Robert K. Baker |
|
Director |
Robert K. Baker |
|
|
|
|
|
/s/ Vikki G. Briggs |
|
Director |
Vikki G. Briggs |
|
|
|
|
|
/s/ Julian L. Coblentz |
|
Director |
Julian L. Coblentz |
|
|
|
|
|
/s/ Cheryl M. Kirkbride |
|
Director |
Cheryl M. Kirkbride |
|
|
|
|
|
/s/ Jeffery A. Robb, Sr. |
|
Director |
Jeffery A. Robb, Sr. |
|
|
|
|
|
|
|
|
64