| Label |
Element |
Value |
| Risk/Return: |
rr_RiskReturnAbstract |
|
|
| Risk/Return [Heading] |
rr_RiskReturnHeading |
Fund Summary |
|
| Objective [Heading] |
rr_ObjectiveHeading |
Investment Objective |
|
| Objective, Primary [Text Block] |
rr_ObjectivePrimaryTextBlock |
As its primary goal, the fund seeks high current income exempt from federal income tax. |
|
| Objective, Secondary [Text Block] |
rr_ObjectiveSecondaryTextBlock |
As a secondary goal, the fund may seek capital appreciation to the extent consistent with its primary goal. |
|
| Expense [Heading] |
rr_ExpenseHeading |
Fees and Expenses |
|
| Expense Narrative [Text Block] |
rr_ExpenseNarrativeTextBlock |
This table describes the fees and expenses that you may pay if you buy and hold shares of the fund. You may qualify for sales charge discounts if you and your family invest, or agree to invest in the future, at least $50,000 in certain funds in the Dreyfus Family of Funds. More information about these and other discounts is available from your financial professional and in the Shareholder Guide section beginning on page 9 of this prospectus and in the How to Buy Shares section and the Additional Information About How to Buy Shares section on beginning on page II-1 and page III-1, respectively, of the fund's Statement of Additional Information. Class Z shares generally are not available for new accounts. |
|
| Shareholder Fees Caption [Text] |
rr_ShareholderFeesCaption |
Shareholder Fees (fees paid directly from your investment) |
|
| Operating Expenses Caption [Text] |
rr_OperatingExpensesCaption |
Annual Fund Operating Expenses (expenses that you pay each year as a percentage of the value of your investment) |
|
| Portfolio Turnover [Heading] |
rr_PortfolioTurnoverHeading |
Portfolio Turnover |
|
| Portfolio Turnover [Text Block] |
rr_PortfolioTurnoverTextBlock |
The fund pays transaction costs, such as commissions, when it buys and sells securities (or "turns over" its portfolio). A higher portfolio turnover may indicate higher transaction costs and may result in higher taxes when fund shares are held in a taxable account. These costs, which are not reflected in annual fund operating expenses or in the example, affect the fund's performance. During the most recent fiscal year, the fund's portfolio turnover rate was 26.27% of the average value of its portfolio. |
|
| Portfolio Turnover, Rate |
rr_PortfolioTurnoverRate |
26.27% |
|
| Expense Breakpoint Discounts [Text] |
rr_ExpenseBreakpointDiscounts |
You may qualify for sales charge discounts if you and your family invest, or agree to invest in the future, at least $50,000 in certain funds in the Dreyfus Family of Funds. |
|
| Expense Breakpoint, Minimum Investment Required [Amount] |
rr_ExpenseBreakpointMinimumInvestmentRequiredAmount |
$ 50,000 |
|
| Expense Example [Heading] |
rr_ExpenseExampleHeading |
Example |
|
| Expense Example Narrative [Text Block] |
rr_ExpenseExampleNarrativeTextBlock |
The Example is intended to help you compare the cost of investing in the fund with the cost of investing in other mutual funds. The Example assumes that you invest $10,000 in the fund for the time periods indicated and then redeem all of your shares at the end of those periods. The Example also assumes that your investment has a 5% return each year and that the fund's operating expenses remain the same. Although your actual costs may be higher or lower, based on these assumptions your costs would be: |
|
| Expense Example, No Redemption, By Year, Caption [Text] |
rr_ExpenseExampleNoRedemptionByYearCaption |
You would pay the following expenses if you did not redeem your shares: |
|
| Strategy [Heading] |
rr_StrategyHeading |
Principal Investment Strategy |
|
| Strategy Narrative [Text Block] |
rr_StrategyNarrativeTextBlock |
To pursue its goals, the fund normally invests at least 80% of its net assets, plus any borrowings for investment purposes, in municipal bonds that provide income exempt from federal income tax. The fund invests at least 50% of its assets in municipal bonds rated BBB/Baa or lower by independent rating agencies or the unrated equivalent as determined by The Dreyfus Corporation. Municipal bonds rated below investment grade (BB/Ba or lower) are commonly known as "high yield" or "junk" bonds. These bonds typically offer higher yields than investment grade bonds, but involve greater risks, including the possibility of default, and increased market price volatility. The fund may invest up to 10% of its assets in defaulted municipal bonds. The fund may invest up to 50% of its assets in higher quality municipal bonds (those rated AAA/Aaa to A or the unrated equivalent as determined by The Dreyfus Corporation).
The dollar-weighted average maturity of the fund's portfolio is not restricted, but normally exceeds ten years.
The portfolio managers focus on identifying undervalued sectors and securities. To select municipal bonds for the fund, the portfolio managers use fundamental credit analysis to estimate the relative value and attractiveness of various sectors and securities and actively trade among various sectors, based on their apparent relative values.
Although the fund seeks to provide income exempt from federal income tax, the fund may invest without limitation in municipal bonds the income from which is subject to the federal alternative minimum tax. In addition, the fund may invest temporarily in taxable obligations. |
|
| Risk [Heading] |
rr_RiskHeading |
Principal Risks |
|
| Risk Narrative [Text Block] |
rr_RiskNarrativeTextBlock |
An investment in the fund is not a bank deposit. It is not insured or guaranteed by the Federal Deposit Insurance Corporation (FDIC) or any other government agency. It is not a complete investment program. The fund's share price fluctuates, sometimes dramatically, which means you could lose money.
· Municipal securities risk. The amount of public information available about municipal securities is generally less than that for corporate equities or bonds. Special factors, such as legislative changes, and state and local economic and business developments, may adversely affect the yield and/or value of the fund's investments in municipal securities. Other factors include the general conditions of the municipal securities market, the size of the particular offering, the maturity of the obligation and the rating of the issue. Changes in economic, business or political conditions relating to a particular municipal project, municipality, or state in which the fund invests may have an impact on the fund's share price.
· Interest rate risk. Prices of municipal bonds tend to move inversely with changes in interest rates. Typically, a rise in rates will adversely affect bond prices and, accordingly, the fund's share price. The longer the effective maturity and duration of the fund's portfolio, the more the fund's share price is likely to react to interest rates. For example, the market price of a fixed-income security with a duration of three years would be expected to decline 3% if interest rates rose 1%. Conversely, the market price of the same security would be expected to increase 3% if interest rates fell 1%.
· Credit risk. Failure of an issuer to make timely interest or principal payments, or a decline or perception of a decline in the credit quality of a municipal bond, can cause the bond's price to fall, potentially lowering the fund's share price. The lower a bond's credit rating, the greater the chance – in the rating agency's opinion – that the bond issuer will default or fail to meet its payment obligations. To the extent the fund invests in high yield ("junk") bonds, its portfolio is subject to heightened credit risk.
· Liquidity risk. When there is little or no active trading market for specific types of securities, it can become more difficult to sell the securities at or near their perceived value. In such a market, the value of such securities and the fund's share price may fall dramatically, even during periods of declining interest rates. The secondary market for certain municipal bonds tends to be less well developed or liquid than many other securities markets, which may adversely affect the fund's ability to sell such municipal bonds at attractive prices.
· Non-diversification risk. The fund is non-diversified, which means that the fund may invest a relatively high percentage of its assets in a limited number of issuers. Therefore, the fund's performance may be more vulnerable to changes in the market value of a single issuer or group of issuers and more susceptible to risks associated with a single economic, political or regulatory occurrence than a diversified fund. |
|
| Risk Lose Money [Text] |
rr_RiskLoseMoney |
The fund's share price fluctuates, sometimes dramatically, which means you could lose money. |
|
| Risk Nondiversified Status [Text] |
rr_RiskNondiversifiedStatus |
The fund is non-diversified, which means that the fund may invest a relatively high percentage of its assets in a limited number of issuers. Therefore, the fund's performance may be more vulnerable to changes in the market value of a single issuer or group of issuers and more susceptible to risks associated with a single economic, political or regulatory occurrence than a diversified fund. |
|
| Risk Not Insured Depository Institution [Text] |
rr_RiskNotInsuredDepositoryInstitution |
An investment in the fund is not a bank deposit. It is not insured or guaranteed by the Federal Deposit Insurance Corporation (FDIC) or any other government agency. |
|
| Bar Chart and Performance Table [Heading] |
rr_BarChartAndPerformanceTableHeading |
Performance |
|
| Performance Narrative [Text Block] |
rr_PerformanceNarrativeTextBlock |
The following bar chart and table provide some indication of the risks of investing in the fund. The bar chart shows changes in the performance of the fund's Class Z shares from year to year. The table compares the average annual total returns of the fund's shares to those of a broad measure of market performance. The fund's past performance (before and after taxes) is not necessarily an indication of how the fund will perform in the future. Sales charges, if any, are not reflected in the bar chart, and if those charges were included, returns would have been less than those shown. More recent performance information may be available at www.dreyfus.com.
Since the fund's Class Y shares are new, past performance information is not available for Class Y shares as of the date of this prospectus. Class Y shares would have had substantially similar annual returns as Class A, C, I and Z shares because each share class is invested in the same portfolio of securities and the annual returns would have differed only to the extent that the classes do not have the same expenses. |
|
| Performance Information Illustrates Variability of Returns [Text] |
rr_PerformanceInformationIllustratesVariabilityOfReturns |
The following bar chart and table provide some indication of the risks of investing in the fund. |
|
| Performance Availability Website Address [Text] |
rr_PerformanceAvailabilityWebSiteAddress |
www.dreyfus.com |
|
| Performance Past Does Not Indicate Future [Text] |
rr_PerformancePastDoesNotIndicateFuture |
The fund's past performance (before and after taxes) is not necessarily an indication of how the fund will perform in the future. |
|
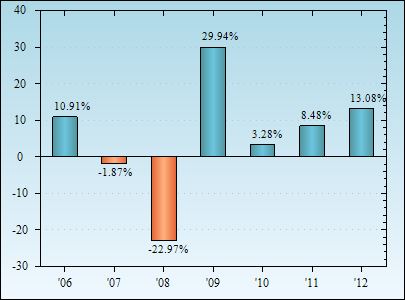
| Bar Chart [Heading] |
rr_BarChartHeading |
Year-by-Year Total Returns as of 12/31 each year (%) Class Z |
|
| Bar Chart Does Not Reflect Sales Loads [Text] |
rr_BarChartDoesNotReflectSalesLoads |
Sales charges, if any, are not reflected in the bar chart, and if those charges were included, returns would have been less than those shown. |
|
| Bar Chart Closing [Text Block] |
rr_BarChartClosingTextBlock |
Best Quarter
Q3, 2009: 13.47%
Worst Quarter
Q4, 2008: -17.47%
The year-to-date total return of the fund's Class Z shares as of March 31, 2013 was 1.30%. |
|
| Year to Date Return, Label |
rr_YearToDateReturnLabel |
The year-to-date total return of the fund's Class Z shares |
|
| Bar Chart, Year to Date Return, Date |
rr_BarChartYearToDateReturnDate |
Mar. 31,
2013 |
|
| Bar Chart, Year to Date Return |
rr_BarChartYearToDateReturn |
1.30% |
|
| Highest Quarterly Return, Label |
rr_HighestQuarterlyReturnLabel |
Best Quarter |
|
| Highest Quarterly Return, Date |
rr_BarChartHighestQuarterlyReturnDate |
Sep. 30,
2009 |
|
| Highest Quarterly Return |
rr_BarChartHighestQuarterlyReturn |
13.47% |
|
| Lowest Quarterly Return, Label |
rr_LowestQuarterlyReturnLabel |
Worst Quarter |
|
| Lowest Quarterly Return, Date |
rr_BarChartLowestQuarterlyReturnDate |
Dec. 31,
2008 |
|
| Lowest Quarterly Return |
rr_BarChartLowestQuarterlyReturn |
(17.47%) |
|
| Index No Deduction for Fees, Expenses, Taxes [Text] |
rr_IndexNoDeductionForFeesExpensesTaxes |
reflects no deduction for fees, expenses or taxes |
|
| Performance Table Uses Highest Federal Rate |
rr_PerformanceTableUsesHighestFederalRate |
After-tax returns are calculated using the historical highest individual federal marginal income tax rates, and do not reflect the impact of state and local taxes. |
|
| Performance Table Not Relevant to Tax Deferred |
rr_PerformanceTableNotRelevantToTaxDeferred |
Actual after-tax returns depend on the investor's tax situation and may differ from those shown, and the after tax returns shown are not relevant to investors who hold their shares through tax-deferred arrangements such as 401(k) plans or individual retirement accounts. |
|
| Performance Table One Class of after Tax Shown [Text] |
rr_PerformanceTableOneClassOfAfterTaxShown |
After-tax performance is shown only for Class Z shares. After-tax performance of the fund's other share classes will vary. |
|
| Performance Table Narrative |
rr_PerformanceTableNarrativeTextBlock |
After-tax performance is shown only for Class Z shares. After-tax performance of the fund's other share classes will vary. After-tax returns are calculated using the historical highest individual federal marginal income tax rates, and do not reflect the impact of state and local taxes. Actual after-tax returns depend on the investor's tax situation and may differ from those shown, and the after tax returns shown are not relevant to investors who hold their shares through tax-deferred arrangements such as 401(k) plans or individual retirement accounts.
For the fund's Class A, C and I shares, periods prior to the inception date of such classes reflect the performance of the fund's Class Z shares adjusted to reflect any applicable sales charges. Such performance figures have not been adjusted to reflect applicable class fees and expenses; if such fees and expenses had been reflected, the performance shown for Class A and C shares for such periods would have been lower. |
|
| Caption |
rr_AverageAnnualReturnCaption |
Average Annual Total Returns (as of 12/31/12) |
|
|
Barclays Municipal Bond Index reflects no deduction for fees, expenses or taxes
|
|
|
|
| Risk/Return: |
rr_RiskReturnAbstract |
|
|
| Average Annual Returns, 1 Year |
rr_AverageAnnualReturnYear01 |
6.78% |
|
| Average Annual Returns, 5 Years |
rr_AverageAnnualReturnYear05 |
5.91% |
|
| Average Annual Returns, Since Inception |
rr_AverageAnnualReturnSinceInception |
5.31% |
|
|
Class A
|
|
|
|
| Risk/Return: |
rr_RiskReturnAbstract |
|
|
| Maximum sales charge (load) imposed on purchases (as a percentage of offering price) |
rr_MaximumSalesChargeImposedOnPurchasesOverOfferingPrice |
4.50% |
|
| Maximum deferred sales charge (load) (as a percentage of lower of purchase or sale price) |
rr_MaximumDeferredSalesChargeOverOther |
none
|
[1] |
| Redemption Fee (as a percentage of Amount Redeemed) |
rr_RedemptionFeeOverRedemption |
(2.00%) |
|
| Management fees |
rr_ManagementFeesOverAssets |
0.60% |
|
| Distribution (12b-1) fees |
rr_DistributionAndService12b1FeesOverAssets |
none
|
|
| Other expenses (including shareholder services fees) |
rr_OtherExpensesOverAssets |
0.42% |
[2] |
| Total annual fund operating expenses |
rr_ExpensesOverAssets |
1.02% |
|
| Expenses Deferred Charges [Text Block] |
rr_ExpensesDeferredChargesTextBlock |
Class A shares bought without an initial sales charge as part of an investment of $1 million or more may be charged a deferred sales charge of 1.00% if redeemed within one year. |
|
| Expense Example, with Redemption, 1 Year |
rr_ExpenseExampleYear01 |
549 |
|
| Expense Example, with Redemption, 3 Years |
rr_ExpenseExampleYear03 |
760 |
|
| Expense Example, with Redemption, 5 Years |
rr_ExpenseExampleYear05 |
988 |
|
| Expense Example, with Redemption, 10 Years |
rr_ExpenseExampleYear10 |
1,642 |
|
| Expense Example, No Redemption, 1 Year |
rr_ExpenseExampleNoRedemptionYear01 |
549 |
|
| Expense Example, No Redemption, 3 Years |
rr_ExpenseExampleNoRedemptionYear03 |
760 |
|
| Expense Example, No Redemption, 5 Years |
rr_ExpenseExampleNoRedemptionYear05 |
988 |
|
| Expense Example, No Redemption, 10 Years |
rr_ExpenseExampleNoRedemptionYear10 |
1,642 |
|
| Average Annual Returns, 1 Year |
rr_AverageAnnualReturnYear01 |
7.84% |
|
| Average Annual Returns, 5 Years |
rr_AverageAnnualReturnYear05 |
3.78% |
|
| Average Annual Returns, Since Inception |
rr_AverageAnnualReturnSinceInception |
4.30% |
|
| Average Annual Returns, Inception Date |
rr_AverageAnnualReturnInceptionDate |
Mar. 15,
2007 |
|
|
Class C
|
|
|
|
| Risk/Return: |
rr_RiskReturnAbstract |
|
|
| Maximum sales charge (load) imposed on purchases (as a percentage of offering price) |
rr_MaximumSalesChargeImposedOnPurchasesOverOfferingPrice |
none
|
|
| Maximum deferred sales charge (load) (as a percentage of lower of purchase or sale price) |
rr_MaximumDeferredSalesChargeOverOther |
1.00% |
|
| Redemption Fee (as a percentage of Amount Redeemed) |
rr_RedemptionFeeOverRedemption |
(2.00%) |
|
| Management fees |
rr_ManagementFeesOverAssets |
0.60% |
|
| Distribution (12b-1) fees |
rr_DistributionAndService12b1FeesOverAssets |
0.75% |
|
| Other expenses (including shareholder services fees) |
rr_OtherExpensesOverAssets |
0.43% |
[2] |
| Total annual fund operating expenses |
rr_ExpensesOverAssets |
1.78% |
|
| Expense Example, with Redemption, 1 Year |
rr_ExpenseExampleYear01 |
281 |
|
| Expense Example, with Redemption, 3 Years |
rr_ExpenseExampleYear03 |
560 |
|
| Expense Example, with Redemption, 5 Years |
rr_ExpenseExampleYear05 |
964 |
|
| Expense Example, with Redemption, 10 Years |
rr_ExpenseExampleYear10 |
2,095 |
|
| Expense Example, No Redemption, 1 Year |
rr_ExpenseExampleNoRedemptionYear01 |
181 |
|
| Expense Example, No Redemption, 3 Years |
rr_ExpenseExampleNoRedemptionYear03 |
560 |
|
| Expense Example, No Redemption, 5 Years |
rr_ExpenseExampleNoRedemptionYear05 |
964 |
|
| Expense Example, No Redemption, 10 Years |
rr_ExpenseExampleNoRedemptionYear10 |
2,095 |
|
| Average Annual Returns, 1 Year |
rr_AverageAnnualReturnYear01 |
11.05% |
|
| Average Annual Returns, 5 Years |
rr_AverageAnnualReturnYear05 |
3.94% |
|
| Average Annual Returns, Since Inception |
rr_AverageAnnualReturnSinceInception |
4.33% |
|
| Average Annual Returns, Inception Date |
rr_AverageAnnualReturnInceptionDate |
Mar. 15,
2007 |
|
|
Class I
|
|
|
|
| Risk/Return: |
rr_RiskReturnAbstract |
|
|
| Maximum sales charge (load) imposed on purchases (as a percentage of offering price) |
rr_MaximumSalesChargeImposedOnPurchasesOverOfferingPrice |
none
|
|
| Maximum deferred sales charge (load) (as a percentage of lower of purchase or sale price) |
rr_MaximumDeferredSalesChargeOverOther |
none
|
|
| Redemption Fee (as a percentage of Amount Redeemed) |
rr_RedemptionFeeOverRedemption |
(2.00%) |
|
| Management fees |
rr_ManagementFeesOverAssets |
0.60% |
|
| Distribution (12b-1) fees |
rr_DistributionAndService12b1FeesOverAssets |
none
|
|
| Other expenses (including shareholder services fees) |
rr_OtherExpensesOverAssets |
0.18% |
[2] |
| Total annual fund operating expenses |
rr_ExpensesOverAssets |
0.78% |
|
| Expense Example, with Redemption, 1 Year |
rr_ExpenseExampleYear01 |
80 |
|
| Expense Example, with Redemption, 3 Years |
rr_ExpenseExampleYear03 |
249 |
|
| Expense Example, with Redemption, 5 Years |
rr_ExpenseExampleYear05 |
433 |
|
| Expense Example, with Redemption, 10 Years |
rr_ExpenseExampleYear10 |
966 |
|
| Expense Example, No Redemption, 1 Year |
rr_ExpenseExampleNoRedemptionYear01 |
80 |
|
| Expense Example, No Redemption, 3 Years |
rr_ExpenseExampleNoRedemptionYear03 |
249 |
|
| Expense Example, No Redemption, 5 Years |
rr_ExpenseExampleNoRedemptionYear05 |
433 |
|
| Expense Example, No Redemption, 10 Years |
rr_ExpenseExampleNoRedemptionYear10 |
966 |
|
| Average Annual Returns, 1 Year |
rr_AverageAnnualReturnYear01 |
13.21% |
|
| Average Annual Returns, 5 Years |
rr_AverageAnnualReturnYear05 |
4.92% |
|
| Average Annual Returns, Since Inception |
rr_AverageAnnualReturnSinceInception |
5.10% |
|
| Average Annual Returns, Inception Date |
rr_AverageAnnualReturnInceptionDate |
Dec. 15,
2008 |
|
|
Class Y
|
|
|
|
| Risk/Return: |
rr_RiskReturnAbstract |
|
|
| Maximum sales charge (load) imposed on purchases (as a percentage of offering price) |
rr_MaximumSalesChargeImposedOnPurchasesOverOfferingPrice |
none
|
|
| Maximum deferred sales charge (load) (as a percentage of lower of purchase or sale price) |
rr_MaximumDeferredSalesChargeOverOther |
none
|
|
| Redemption Fee (as a percentage of Amount Redeemed) |
rr_RedemptionFeeOverRedemption |
(2.00%) |
|
| Management fees |
rr_ManagementFeesOverAssets |
0.60% |
|
| Distribution (12b-1) fees |
rr_DistributionAndService12b1FeesOverAssets |
none
|
|
| Other expenses (including shareholder services fees) |
rr_OtherExpensesOverAssets |
0.13% |
[2] |
| Total annual fund operating expenses |
rr_ExpensesOverAssets |
0.73% |
|
| Other Expenses, New Fund, Based on Estimates [Text] |
rr_OtherExpensesNewFundBasedOnEstimates |
Other expenses for Class Y are based on estimated amounts for the current fiscal year. |
|
| Expense Example, with Redemption, 1 Year |
rr_ExpenseExampleYear01 |
75 |
|
| Expense Example, with Redemption, 3 Years |
rr_ExpenseExampleYear03 |
233 |
|
| Expense Example, with Redemption, 5 Years |
rr_ExpenseExampleYear05 |
406 |
|
| Expense Example, with Redemption, 10 Years |
rr_ExpenseExampleYear10 |
906 |
|
| Expense Example, No Redemption, 1 Year |
rr_ExpenseExampleNoRedemptionYear01 |
75 |
|
| Expense Example, No Redemption, 3 Years |
rr_ExpenseExampleNoRedemptionYear03 |
233 |
|
| Expense Example, No Redemption, 5 Years |
rr_ExpenseExampleNoRedemptionYear05 |
406 |
|
| Expense Example, No Redemption, 10 Years |
rr_ExpenseExampleNoRedemptionYear10 |
906 |
|
| Performance One Year or Less [Text] |
rr_PerformanceOneYearOrLess |
Since the fund's Class Y shares are new, past performance information is not available for Class Y shares as of the date of this prospectus. |
|
|
Class Z
|
|
|
|
| Risk/Return: |
rr_RiskReturnAbstract |
|
|
| Maximum sales charge (load) imposed on purchases (as a percentage of offering price) |
rr_MaximumSalesChargeImposedOnPurchasesOverOfferingPrice |
none
|
|
| Maximum deferred sales charge (load) (as a percentage of lower of purchase or sale price) |
rr_MaximumDeferredSalesChargeOverOther |
none
|
|
| Redemption Fee (as a percentage of Amount Redeemed) |
rr_RedemptionFeeOverRedemption |
(2.00%) |
|
| Management fees |
rr_ManagementFeesOverAssets |
0.60% |
|
| Distribution (12b-1) fees |
rr_DistributionAndService12b1FeesOverAssets |
0.20% |
|
| Other expenses (including shareholder services fees) |
rr_OtherExpensesOverAssets |
0.15% |
[2] |
| Total annual fund operating expenses |
rr_ExpensesOverAssets |
0.95% |
|
| Expense Example, with Redemption, 1 Year |
rr_ExpenseExampleYear01 |
97 |
|
| Expense Example, with Redemption, 3 Years |
rr_ExpenseExampleYear03 |
303 |
|
| Expense Example, with Redemption, 5 Years |
rr_ExpenseExampleYear05 |
525 |
|
| Expense Example, with Redemption, 10 Years |
rr_ExpenseExampleYear10 |
1,166 |
|
| Expense Example, No Redemption, 1 Year |
rr_ExpenseExampleNoRedemptionYear01 |
97 |
|
| Expense Example, No Redemption, 3 Years |
rr_ExpenseExampleNoRedemptionYear03 |
303 |
|
| Expense Example, No Redemption, 5 Years |
rr_ExpenseExampleNoRedemptionYear05 |
525 |
|
| Expense Example, No Redemption, 10 Years |
rr_ExpenseExampleNoRedemptionYear10 |
$ 1,166 |
|
| Annual Return 2006 |
rr_AnnualReturn2006 |
10.91% |
|
| Annual Return 2007 |
rr_AnnualReturn2007 |
(1.87%) |
|
| Annual Return 2008 |
rr_AnnualReturn2008 |
(22.97%) |
|
| Annual Return 2009 |
rr_AnnualReturn2009 |
29.94% |
|
| Annual Return 2010 |
rr_AnnualReturn2010 |
3.28% |
|
| Annual Return 2011 |
rr_AnnualReturn2011 |
8.48% |
|
| Annual Return 2012 |
rr_AnnualReturn2012 |
13.08% |
|
| Average Annual Returns, 1 Year |
rr_AverageAnnualReturnYear01 |
13.08% |
|
| Average Annual Returns, 5 Years |
rr_AverageAnnualReturnYear05 |
4.87% |
|
| Average Annual Returns, Since Inception |
rr_AverageAnnualReturnSinceInception |
5.06% |
|
| Average Annual Returns, Inception Date |
rr_AverageAnnualReturnInceptionDate |
Sep. 30,
2005 |
|
|
Class Z | After Taxes on Distributions
|
|
|
|
| Risk/Return: |
rr_RiskReturnAbstract |
|
|
| Average Annual Returns, 1 Year |
rr_AverageAnnualReturnYear01 |
13.07% |
|
| Average Annual Returns, 5 Years |
rr_AverageAnnualReturnYear05 |
4.85% |
|
| Average Annual Returns, Since Inception |
rr_AverageAnnualReturnSinceInception |
5.03% |
|
|
Class Z | After Taxes on Distributions and Sale of Fund Shares
|
|
|
|
| Risk/Return: |
rr_RiskReturnAbstract |
|
|
| Average Annual Returns, 1 Year |
rr_AverageAnnualReturnYear01 |
10.09% |
|
| Average Annual Returns, 5 Years |
rr_AverageAnnualReturnYear05 |
4.86% |
|
| Average Annual Returns, Since Inception |
rr_AverageAnnualReturnSinceInception |
5.03% |
|
|
|
|