Sit Mutual Funds, Inc.
UNITED STATES SECURITIES AND EXCHANGE COMMISSION
Washington, D.C. 20549
FORM N-CSR
-------------------
CERTIFIED SHAREHOLDER REPORT OF REGISTERED
MANAGEMENT INVESTMENT COMPANIES
Investment
Company Act file number: 811-06373
-------------
Sit Mutual Funds, Inc.
(Exact name of registrant as specified in charter)
80 South Eighth Street
3300 IDS
Center
Minneapolis, MN 55402
(Address of principal executive offices)
Paul E. Rasmussen, VP Treasurer
Sit Mutual Funds, Inc.
80 South
Eighth Street
3300 IDS Center
Minneapolis, MN 55402
(Name and
address of agent for service)
Copy to:
Mike Radmer, Esq.
Dorsey & Whitney
Suite
1500
50 South Sixth Street
Minneapolis, MN 55402-1498
Registrant’s telephone number, including area code:
(612) 332-3223
Date of fiscal year end:
June 30, 2017
Date of reporting period: December 31, 2016
Item 1: Reports to Stockholders
Sit Mutual Funds
STOCK FUNDS SEMI-ANNUAL
REPORT
TABLE OF CONTENTS
This document must be preceded or
accompanied by a Prospectus.
CHAIRMAN’S LETTER
February 3, 2017
Dear Fellow Shareholders:
Despite many “expert” predictions to the contrary, equity markets
rallied and bond prices fell sharply in response to the Trump/Republican victory in November. While investors could well be frustrated in the months ahead by challenges and delays to policy implementation, our view is that, for the first time in
this economic cycle, growth prospects are now more skewed to the upside rather than the downside over the intermediate term.
Economic Overview
Importantly, the U.S. economy has begun 2017 with most indicators showing solid growth. Job gains have slowed as the
economy is increasingly showing signs of full employment, with wage growth accelerating in recent months. Auto sales remain at elevated levels and housing continues to slowly recover, although higher interest rates may dampen near-term activity. The
manufacturing economy has shown signs of improvement after several quarters of lackluster growth and a protracted inventory destocking cycle. Finally, near-term economic activity could be boosted by sharp post-election increases in CEO confidence,
consumer confidence, and small business optimism. It remains to be seen whether more optimism will translate into an uptick in economic activity, but it will be critical given time required for the Trump Administration to bring forward their growth
initiatives.
Key elements of the Trump Administration’s agenda include corporate tax reform, personal income tax
reductions, repatriation of cash from abroad, regulatory reform, and increased spending on infrastructure and defense. While economists and analysts have studiously attempted to gauge the economic benefits of each of these initiatives, there is
little historical precedent to model these potential once-in-a-generation changes. It stands to reason that measuring the “multiplier” effects is very difficult if these pro-growth proposals are enacted simultaneously. In addition, the
impact of improved consumer confidence and “animal spirits” could lift business spending, which has been notably absent in recent years. Increased bank lending, lower taxes, and less regulation should have a particularly positive impact on
new business formation and small business activity, which are truly the lifeblood of our entrepreneurial economy.
To be sure, any major change in the environment will always bring about new risks. Higher inflation and interest rates,
for example, are likely byproducts of faster economic growth. As the economy inches closer to full employment, faster growth may spark a strong uptick in wages, along with other inflationary pressures. Improved growth and inflation could result in
the Federal Reserve tightening policy more than what is currently anticipated. In addition, the U.S. dollar could continue to appreciate as U.S. economic growth prospects diverge from the rest of the world. This would have negative implications for
U.S. multinational earnings, U.S. manufacturers, and
many emerging economies struggling with elevated levels of U.S. dollar-denominated debt.
Finally, President-elect Trump has clearly articulated his dissatisfaction with U.S. trade policy; punitive trade actions against China and/or Mexico could spark a broader trade war that could serve to offset pro-growth initiatives.
Outside the U.S., growth trends have been relatively stable in most major regions, but we see many near-term challenges. In
Europe, growth remains fragile against a backdrop of rising political risk given Brexit negotiations and key upcoming elections in France, the Netherlands, and Germany. The Chinese economy has shown encouraging trends of late, but we remain
concerned that sustainability is a question given debt-fueled growth and overreliance on government stimulus. Finally, Japan is having limited success in overcoming structural challenges (e.g., demographics, debt) with pro-growth policies, and we
remain cautious on growth prospects in 2017.
Equity Strategy
Following a solid 2016, we believe 2017 has the potential to be another reasonable year for the U.S. stock market, driven by
improvements in corporate earnings and various policy initiatives. We suspect, however, that the market will likely be subject to a number of fits and starts in response to progress (or lack thereof) in Washington and global macroeconomic
conditions.
We believe market valuations are at “fair” levels relative to our view of the path of corporate
earnings and interest rates. The S&P 500® Index is currently trading at a forward price-to-earnings multiple of roughly 17 times (in line with its long-term historical average), although consensus earnings expectations, which call for +12
percent growth, appear too aggressive unless pro-growth policies are enacted quickly. In this regard, earnings projections for the winners and losers of policy initiatives will continue to be adjusted as more policy details become available. For
example, estimates do not yet take into consideration the benefit of tax reform, which alone could boost S&P 500® earnings by +10 to +15 percent. The benefits of fiscal stimulus and deregulation are more difficult to quantify, but we suspect
any earnings uptick from these factors will not materialize until 2018 or later.
From a positioning standpoint, we
have implemented a barbell strategy, with recent portfolio changes emphasizing companies/industries with upside potential based on a combination of policy changes and the resulting, eventual uptick in economic growth. For example, we have
significant positions in the finance and transportation sectors, two groups that have the most to gain from improved growth and policy initiatives, including tax reform and deregulation.
|
|
|
|
2 |
|
SIT MUTUAL FUNDS
SEMI-ANNUAL REPORT |
As discussed, however, we are cognizant of the risks and challenges as policy
changes are undertaken. There are many moving parts on the policy front and only one thing is clear: the investment landscape is now more positive, but the range of outcomes, or “tail risks,” have increased as well. Therefore, we believe
it is prudent to maintain exposure to attractively-valued, non-cyclical, largely domestically-focused industries that have growth potential, including defense, HMOs, and telecom. Conversely, underweights largely consist of low growth groups that may
be negatively impacted by policy side effects, including higher interest rates and a stronger U.S. dollar. Regardless of sector, we strongly believe a quality focus is appropriate in the environment ahead, as the era of extremely accommodative
monetary policy has largely run its course. Ultra-low interest rates and easy access to credit can often provide cover for fundamental weakness in a business. The year ahead may well be marked by greater volatility across financial markets after
years of relative stability, resulting in significant opportunities to improve risk/reward potential across Sit Mutual Fund strategies. In general, our quality bias has not been rewarded in the QE-driven backdrop (i.e., easy money) prevailing in
recent years. We strongly believe a different, and potentially more volatile, environment lies ahead.
In Europe,
equity valuations are generally in line-to-slightly-above long-term averages, but earnings still remain depressed for a number of sectors. The MSCI Europe Index is currently trading at a forward price-to-earnings multiple of about 14.5 times, which
is slightly above its 30-year median of 13 times and a 15 percent discount to the S&P 500 Index. Equity fund flows and investor surveys have both been indicative of a fair amount of pessimism, suggesting European stocks may be poised for a
meaningful reversal in sentiment as policy uncertainty eases and as corporate earnings improve against easy comparisons. Looking forward, we believe the performance of European equities will remain choppy in response to both political and global
macroeconomic events. However, investors will likely begin to anticipate diminished political risk heading into 2018 and the potential for improved fiscal/corporate spending, implying a solid underlying bid for European stocks as we move through the
year. We do not expect a “rising tide lifts all boats” scenario by any means and remain selective with regard to our sector, end-market, and company-specific exposures. Given the negative impact of a strong U.S. dollar and a myriad of
other concerns, we are underweighting stocks with significant emerging market exposure. We prefer companies that are either plays on domestic secular/cyclical/niche growth, address markets where there is pent-up demand, benefit from modest
inflation/rising global yields, and/or have meaningful exposure to the United States. As such, we have recently increased
weightings in financial stocks (i.e., insurance and banks) that will benefit from the potential
for lower regulation and a steeper interest rate curve in the United States as well as a modestly improving banking environment in Europe.
Turning to Asia, Japanese equities performed well to finish 2016, bid higher as the yen fell and global growth prospects
improved somewhat. Outflows from Japanese equities have also abated and valuations remain cheap relative to other global equity markets. However, we continue to remain meaningfully underweight Japan across global and international portfolios, given
our cautious view on the economy’s long-term growth prospects. The key concern remains the ability of “Abenomics” to overcome the substantial structural challenges of a declining population, rigid labor market, and elevated debt
levels. Within our Japanese holdings, we increasingly prefer beneficiaries from a weaker yen, such as exporters and multinationals that benefit from favorable currency translation as well as those leveraged to regions where growth prospects are
improving, such as the U.S. In terms of China, we expect a mild slowdown in the economy in 2017, with debt levels and capital outflow concerns likely to linger. In addition, potential rising trade tensions with the incoming U.S. Administration may
also limit near-term upside. However, looking beyond near-term cautiousness, we are maintaining our China Internet exposure despite its recent underperformance, as growth remains solid and the outlook is positive. We expect these stocks to
outperform the market, even if growth concerns persist.
As we have often mentioned, the one common theme throughout each
Sit Equity Mutual Fund is an emphasis on quality. Quality, from our perspective, refers to the sustainability of business models, strong balance sheets, and the quality of earnings, with generation of free cash flow an important indicator. In
addition, the experience and track record of management teams is also an important consideration, as navigating a rapidly changing environment is sure to bring about both opportunities and challenges.
With best wishes,

Roger J. Sit
Chairman, President, CEO and Global CIO
OBJECTIVE & STRATEGY
The dual objectives of the Sit Balanced Fund are to seek long-term growth of capital consistent with the preservation of principal and to
provide regular income. It pursues its objectives by investing in a diversified portfolio of stocks and bonds. The Fund may emphasize either equity securities or fixed-income securities, or hold equal amounts of each, dependent upon the
Adviser’s analysis of market, financial and economic conditions.
The Fund’s permissible investment allocation is: 35-65% in
equity securities and 35-65% in fixed-income securities. At all times at least 25% of the fixed-income assets will be invested in fixed-income senior securities.
The Sit Balanced Fund’s six-month return was +3.37%, while the S&P 500® Index
gained +7.82% and the Bloomberg Barclays Capital Aggregate Bond Index decreased -2.53% over the period.
Stocks and bond prices went in
opposite directions, particularly after the election, as markets quickly determined that pro-growth policies, which could lift the economy (and corporate earnings) out of slow-growth mode, are on the way. A stronger dollar and higher interest rates
(and lower bond prices) are near-term consequences of this optimism, representing headwinds for investors to consider until policy actions take hold. While the path may be choppy, we are optimistic that the combination of lower corporate and
personal tax rates, a reduction in regulations, and fiscal stimulus will be positive for equity markets once it becomes clear that corporate earnings will step higher. Within the equity portion of the Fund, we have recently added to several sectors
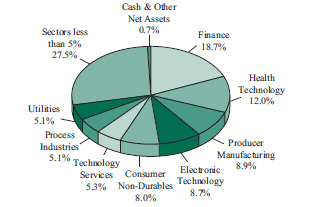
(including financials) that stand to benefit from faster growth, while maintaining a focus on quality with some attractively-valued, more defensive holdings should policy delays or headwinds to growth emerge. The Fund’s largest sector
weightings are technology services, health technology and finance. The equity portion of the Fund underperformed the S&P 500® Index over the past six months, driven by poor stock selection in the commercial services sector and an
underweighted position in the finance sector, which outperformed significantly over the period.
With respect to fixed income markets,
interest rates increased meaningfully over the second half of 2016, as the unexpected November presidential election result produced a new market consensus for improved economic growth. Interestingly, the rise in bond yields did the heavy lifting
for the Federal Reserve, paving the way for them to raise the fed funds rate target a quarter percent to 0.50% in December. The combined result was negative returns for most bonds (e.g., 30-year Treasury bond producing a 14% loss in the fourth
quarter alone). Looking ahead, we believe the Federal Reserve is in the process of gradually moving towards a “neutral” fed funds rate that will neither be considered stimulative nor restrictive to economic policy, with additional rate
hikes at a relatively slow, steady pace over time. In terms of performance over the second half of the year, we estimate the fixed income portion of the Fund generated a return of -1.5%, which compares
favorably to the -2.5% return for the Bloomberg Barclays Aggregate Bond Index. A meaningful income advantage relative to the benchmark continues to be the primary driver of returns.
HYPOTHETICAL GROWTH OF $10,000
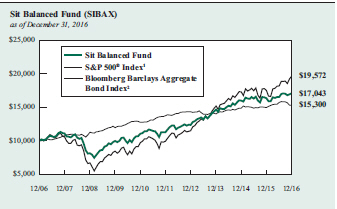
The chart above illustrates the total value of a hypothetical $10,000 investment in the Fund over the past
10 years as compared to the performance of the S&P 500® Index and the Bloomberg Barclays Aggregate Bond Index. Past performance does not guarantee future results. Returns include the reinvestment of distributions. The chart does not reflect
the deduction of taxes that a shareholder would pay on Fund distributions or the redemption of Fund shares.
1 S&P 500® Index
is an unmanaged capitalization-weighted index that measures the performance of 500 widely held common stocks of large-cap companies. It is not possible to invest directly in an index. This is the primary index for the equity portion of the Fund.
2 Bloomberg Barclays Aggregate Bond Index is an unmanaged market value-weighted index which measures the performance of investment
grade debt securities with maturities of at least one year. This is the primary index for the fixed income portion of the Fund.
The portfolio also benefitted from a shorter-than-benchmark duration as interest rates rose. Lastly, an overweight allocation in corporate
bonds also benefitted returns, as improving expectations for corporate profits resulted in this being one of the best performing sectors for the period.
The stock/fixed income allocation is currently 63.3% equities, 34.2% fixed income, and 2.5% cash and equivalents. We expect to continue an
above-average allocation to equities, based our view that stocks, as a whole, are somewhat more attractive than bonds, given our expectation that economic growth may begin to improve.
Roger J. Sit
Bryce A. Doty
Portfolio Managers
|
|
|
|
4 |
|
SIT MUTUAL FUNDS
SEMI-ANNUAL REPORT |
COMPARATIVE RATES OF RETURNS
as of December 31, 2016
|
|
|
|
|
|
|
|
|
|
|
|
|
| |
|
Sit
Balanced Fund |
|
|
S&P 500®
Index 1 |
|
|
Bloomberg
Barclays Aggregate
Bond Index 2 |
|
| Six Month |
|
|
3.37% |
|
|
|
7.82% |
|
|
|
-2.53% |
|
| One Year |
|
|
4.60 |
|
|
|
11.96 |
|
|
|
2.65 |
|
| Five Year |
|
|
8.72 |
|
|
|
14.66 |
|
|
|
2.23 |
|
| Ten Year |
|
|
5.48 |
|
|
|
6.95 |
|
|
|
4.34 |
|
| Since Inception
(12/31/93) |
|
|
6.71 |
|
|
|
9.17 |
|
|
|
5.38 |
|
Performance figures are historical and do not guarantee future results. Investment returns and principal value will vary, and you may have a
gain or loss when you sell shares. Current performance may be lower or higher than the performance data quoted. Contact the Fund for performance data current to the most recent month-end. Returns include changes in share price as well as
reinvestment of all dividends and capital gains. Returns do not reflect the deduction of taxes that a shareholder would pay on Fund distributions or the redemption of Fund shares. Management fees and administrative expenses are included in the
Fund’s performance. Returns for periods greater than one year are compounded average annual rates of return.
1 S&P 500®
Index is an unmanaged capitalization-weighted index that measures the performance of 500 widely held common stocks of large-cap companies. It is not possible to invest directly in an index.
2 Bloomberg Barclays Aggregate Bond Index is an unmanaged market value-weighted index which measures the performance of investment grade debt
securities with maturities of at least one year.
PORTFOLIO SUMMARY
|
|
|
| Net Asset Value 12/31/16: |
|
$20.91 Per Share |
| Net Asset Value 6/30/16: |
|
$20.40 Per Share |
| Total Net Assets: |
|
$24.6 Million |
TOP HOLDINGS
Top Equity Holdings:
1. Alphabet, Inc.
2. Apple, Inc.
3. Visa, Inc.
4. Microsoft Corp.
5. JPMorgan Chase & Co.
Top Fixed Income Holdings:
1.
U.S. Treasury Note, 1.75%, 3/31/22
2. U.S. Treasury Strip, 2.59%, 5/15/44
3. FHLMC, 5.00%, 10/1/43
4. BlackRock Income Trust
5. INVISTA Finance, LLC, 4.25%, 10/15/19
Based on total net assets as of
December 31, 2016. Subject to change.
FUND DIVERSIFICATION
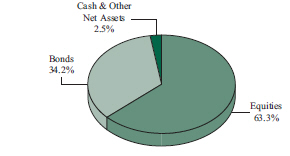
Based on total net assets as of December 31, 2016. Subject to change.
SCHEDULE OF INVESTMENTS (Unaudited)
December 31, 2016
Sit Balanced Fund
|
|
|
|
|
|
|
| |
|
|
|
|
| Quantity |
|
Name of Issuer |
|
Fair Value ($) |
|
| |
|
|
| Common Stocks - 63.3% |
|
| Commercial Services - 1.1% |
|
| 1,225 |
|
Equifax, Inc. |
|
|
144,832 |
|
| 3,150 |
|
Nielsen Holdings, PLC |
|
|
132,142 |
|
|
|
|
|
|
|
|
|
|
|
|
|
|
|
|
276,974 |
|
|
|
|
|
|
|
|
|
| Communications - 1.8% |
|
| 850 |
|
SBA Communications Corp. * |
|
|
87,771 |
|
| 6,500 |
|
Verizon Communications, Inc. |
|
|
346,970 |
|
|
|
|
|
|
|
|
|
|
|
|
|
|
|
|
434,741 |
|
|
|
|
|
|
|
|
|
| Consumer Durables - 0.7% |
|
| 1,450 |
|
Electronic Arts, Inc. * |
|
|
114,202 |
|
| 600 |
|
Genuine Parts Co. |
|
|
57,324 |
|
|
|
|
|
|
|
|
|
|
|
|
|
|
|
|
171,526 |
|
|
|
|
|
|
|
|
|
| Consumer Non-Durables - 4.2% |
|
| 2,875 |
|
Estee Lauder Cos., Inc.-Class A |
|
|
219,909 |
|
| 3,825 |
|
NIKE, Inc. |
|
|
194,425 |
|
| 2,925 |
|
PepsiCo, Inc. |
|
|
306,043 |
|
| 1,150 |
|
Philip Morris International, Inc. |
|
|
105,214 |
|
| 2,500 |
|
Procter & Gamble Co. |
|
|
210,200 |
|
|
|
|
|
|
|
|
|
|
|
|
|
|
|
|
1,035,791 |
|
|
|
|
|
|
|
|
|
| Consumer Services - 5.8% |
|
| 2,450 |
|
CBS Corp. |
|
|
155,869 |
|
| 1,900 |
|
Marriott International, Inc. |
|
|
157,092 |
|
| 6,200 |
|
Starbucks Corp. |
|
|
344,224 |
|
| 1,700 |
|
Time Warner, Inc. |
|
|
164,101 |
|
| 6,150 |
|
Visa, Inc. |
|
|
479,823 |
|
| 1,125 |
|
Walt Disney Co. |
|
|
117,248 |
|
|
|
|
|
|
|
|
|
|
|
|
|
|
|
|
1,418,357 |
|
|
|
|
|
|
|
|
|
| Electronic Technology - 6.3% |
|
| 4,350 |
|
Apple, Inc. |
|
|
503,817 |
|
| 9,250 |
|
Applied Materials, Inc. |
|
|
298,498 |
|
| 1,925 |
|
Broadcom, Ltd. |
|
|
340,282 |
|
| 4,000 |
|
Ciena Corp. * |
|
|
97,640 |
|
| 6,700 |
|
Intel Corp. |
|
|
243,009 |
|
| 1,025 |
|
Skyworks Solutions, Inc. |
|
|
76,526 |
|
|
|
|
|
|
|
|
|
|
|
|
|
|
|
|
1,559,772 |
|
|
|
|
|
|
|
|
|
| Energy Minerals - 2.7% |
|
| 650 |
|
Chevron Corp. |
|
|
76,505 |
|
| 2,250 |
|
Continental Resources, Inc. * |
|
|
115,965 |
|
| 850 |
|
EOG Resources, Inc. |
|
|
85,935 |
|
| 3,800 |
|
Marathon Petroleum Corp. |
|
|
191,330 |
|
| 2,825 |
|
Occidental Petroleum Corp. |
|
|
201,225 |
|
|
|
|
|
|
|
|
|
|
|
|
|
|
|
|
670,960 |
|
|
|
|
|
|
|
|
|
| Finance - 7.8% |
|
| 850 |
|
Ameriprise Financial, Inc. |
|
|
94,299 |
|
| 3,800 |
|
Brixmor Property Group, Inc. |
|
|
92,796 |
|
| 1,250 |
|
Chubb, Ltd. |
|
|
165,150 |
|
|
|
|
|
|
|
|
| |
|
|
|
|
| Quantity |
|
Name of Issuer |
|
Fair Value ($) |
|
| |
|
|
|
|
| 1,175 |
|
Goldman Sachs Group, Inc. |
|
|
281,354 |
|
| 4,000 |
|
Invesco, Ltd. |
|
|
121,360 |
|
| 4,575 |
|
JPMorgan Chase & Co. |
|
|
394,777 |
|
| 2,600 |
|
KeyCorp |
|
|
47,502 |
|
| 1,600 |
|
Marsh & McLennan Cos., Inc. |
|
|
108,144 |
|
| 6,050 |
|
Synchrony Financial |
|
|
219,434 |
|
| 550 |
|
T Rowe Price Group, Inc. |
|
|
41,393 |
|
| 3,150 |
|
US Bancorp |
|
|
161,816 |
|
| 3,450 |
|
Wells Fargo & Co. |
|
|
190,130 |
|
|
|
|
|
|
|
|
|
|
|
|
|
|
|
|
1,918,155 |
|
|
|
|
|
|
|
|
|
| Health Services - 1.8% |
|
| 2,000 |
|
Centene Corp. * |
|
|
113,020 |
|
| 550 |
|
Humana, Inc. |
|
|
112,216 |
|
| 1,400 |
|
UnitedHealth Group, Inc. |
|
|
224,056 |
|
|
|
|
|
|
|
|
|
|
|
|
|
|
|
|
449,292 |
|
|
|
|
|
|
|
|
|
| Health Technology - 7.5% |
|
| 2,550 |
|
AbbVie, Inc. |
|
|
159,681 |
|
| 550 |
|
Alexion Pharmaceuticals, Inc. * |
|
|
67,293 |
|
| 625 |
|
Allergan, PLC * |
|
|
131,256 |
|
| 125 |
|
Biogen, Inc. * |
|
|
35,448 |
|
| 1,500 |
|
Celgene Corp. * |
|
|
173,625 |
|
| 2,150 |
|
Gilead Sciences, Inc. |
|
|
153,962 |
|
| 1,000 |
|
Incyte Corp. * |
|
|
100,270 |
|
| 2,100 |
|
Johnson & Johnson |
|
|
241,941 |
|
| 4,650 |
|
Medtronic, PLC |
|
|
331,220 |
|
| 5,650 |
|
Pfizer, Inc. |
|
|
183,512 |
|
| 1,000 |
|
Thermo Fisher Scientific, Inc. |
|
|
141,100 |
|
| 1,125 |
|
Zimmer Holdings, Inc. |
|
|
116,100 |
|
|
|
|
|
|
|
|
|
|
|
|
|
|
|
|
1,835,408 |
|
|
|
|
|
|
|
|
|
| Industrial Services - 0.4% |
|
| 1,150 |
|
Schlumberger, Ltd. |
|
|
96,542 |
|
|
|
|
|
|
|
|
|
| Process Industries - 1.2% |
|
| 2,425 |
|
Ecolab, Inc. |
|
|
284,258 |
|
|
|
|
|
|
|
|
|
| Producer Manufacturing - 3.9% |
|
| 825 |
|
3M Co. |
|
|
147,320 |
|
| 525 |
|
Danaher Corp. |
|
|
40,877 |
|
| 1,200 |
|
Delphi Automotive, PLC |
|
|
80,820 |
|
| 2,450 |
|
General Electric Co. |
|
|
77,420 |
|
| 1,850 |
|
Honeywell International, Inc. |
|
|
214,322 |
|
| 1,800 |
|
Raytheon Co. |
|
|
255,600 |
|
| 1,400 |
|
United Technologies Corp. |
|
|
153,468 |
|
|
|
|
|
|
|
|
|
|
|
|
|
|
|
|
969,827 |
|
|
|
|
|
|
|
|
|
| Retail Trade - 4.3% |
|
| 145 |
|
Amazon.com, Inc. * |
|
|
108,731 |
|
| 1,325 |
|
CVS Health Corp. |
|
|
104,556 |
|
| 2,375 |
|
Home Depot, Inc. |
|
|
318,440 |
|
| 1,600 |
|
Macy’s, Inc. |
|
|
57,296 |
|
| 2,300 |
|
Target Corp. |
|
|
166,129 |
|
|
|
|
| See accompanying notes to financial statements. |
|
|
|
6 |
|
SIT MUTUAL FUNDS
SEMI-ANNUAL REPORT |
|
|
|
|
|
|
|
| |
|
Quantity /
Principal
Amount ($) |
|
Name of Issuer |
|
Fair Value ($) |
|
| |
|
|
|
|
| 2,900 |
|
TJX Cos., Inc. |
|
|
217,877 |
|
| 340 |
|
Ulta Salon Cosmetics & Fragrance, Inc.
* |
|
|
86,680 |
|
|
|
|
|
|
|
|
|
|
|
|
|
|
|
|
1,059,709 |
|
|
|
|
|
|
|
|
|
|
| Technology Services - 10.4% |
|
|
|
|
| 1,600 |
|
Accenture, PLC |
|
|
187,408 |
|
| 3,700 |
|
Adobe Systems, Inc. * |
|
|
380,915 |
|
| 450 |
|
Alphabet, Inc.-Class A * |
|
|
356,603 |
|
| 255 |
|
Alphabet, Inc.-Class C * |
|
|
196,814 |
|
| 1,250 |
|
ANSYS, Inc. * |
|
|
115,613 |
|
| 3,375 |
|
Cognizant Technology Solutions Corp.
* |
|
|
189,101 |
|
| 2,525 |
|
Facebook, Inc. * |
|
|
290,501 |
|
| 7,575 |
|
Microsoft Corp. |
|
|
470,710 |
|
| 2,750 |
|
PayPal Holdings, Inc. |
|
|
108,542 |
|
| 185 |
|
priceline.com, Inc. * |
|
|
271,221 |
|
|
|
|
|
|
|
|
|
|
|
|
|
|
|
|
2,567,428 |
|
|
|
|
|
|
|
|
|
|
| Transportation - 2.9% |
|
|
|
|
| 5,575 |
|
Delta Air Lines, Inc. |
|
|
274,234 |
|
| 925 |
|
FedEx Corp. |
|
|
172,235 |
|
| 1,450 |
|
Union Pacific Corp. |
|
|
150,336 |
|
| 900 |
|
United Parcel Service, Inc. |
|
|
103,176 |
|
|
|
|
|
|
|
|
|
|
|
|
|
|
|
|
699,981 |
|
|
|
|
|
|
|
|
|
|
| Utilities - 0.5% |
|
|
|
|
| 975 |
|
NextEra Energy, Inc. |
|
|
116,474 |
|
|
|
|
|
|
|
|
|
|
| Total Common Stocks
(cost: $11,543,421) |
|
|
15,565,195 |
|
|
|
|
|
|
|
|
|
|
| Bonds - 32.1% |
|
|
|
|
|
|
| Asset-Backed Securities - 0.9% |
|
|
|
|
| 2,165 |
|
Centex Home Equity,
2004-D AF4, 5.18%, 6/25/32
14 |
|
|
2,162 |
|
| 6,256 |
|
Citifinancial Mortgage Securities, Inc.,
2004-1 AF3, 4.27%, 4/25/34 14 |
|
|
6,284 |
|
| 8,184 |
|
Conseco Finance, 2001-D M1,
2.05%, 11/15/32
1 |
|
|
8,122 |
|
| 8,223 |
|
Conseco Financial Corp.,
1997-7 A6, 6.76%, 7/15/28 |
|
|
8,333 |
|
| 74,989 |
|
Credit Suisse First Boston Mortgage Corp.,
2005-AGE1 M3, 1.41%, 2/25/32 1 |
|
|
73,259 |
|
| 23,783 |
|
HouseHold Home Equity Loan Trust,
2007-2 A4, 0.86%, 7/20/36 1 |
|
|
23,681 |
|
| 6,747 |
|
Irwin Home Equity Corp.,
2005-1 M1, 5.92%, 6/25/35 14 |
|
|
6,812 |
|
| 18,352 |
|
New Century Home Equity Loan Trust,
2005-A A4W, 4.88%, 8/25/35 14 |
|
|
18,999 |
|
| 58,956 |
|
Park Place Securities, Inc.,
2005-WHQ3 M2, 1.43%, 6/25/35 1 |
|
|
58,886 |
|
| 4,126 |
|
Residential Funding Mortgage Securities II, Inc.,
2003-HI2 A6, 5.26%, 7/25/28 14 |
|
|
4,117 |
|
|
|
|
|
|
|
|
|
|
|
|
|
210,655 |
|
|
|
|
|
|
|
|
|
|
|
|
|
|
|
| |
|
|
Principal
Amount ($) |
|
Name of Issuer |
|
Fair Value ($) |
|
| |
|
|
|
| Collateralized Mortgage Obligations - 5.2% |
|
|
|
|
|
|
Fannie Mae: |
|
|
|
|
| 48,173 |
|
2004-T1 1A1, 6.00%, 1/25/44 |
|
|
53,863 |
|
| 26,828 |
|
1999-17 C, 6.35%, 4/25/29 |
|
|
29,595 |
|
| 37,218 |
|
2001-82 ZA, 6.50%, 1/25/32 |
|
|
41,905 |
|
| 13,171 |
|
2009-30 AG, 6.50%, 5/25/39 |
|
|
14,330 |
|
| 5,732 |
|
2013-28 WD, 6.50%, 5/25/42 |
|
|
6,492 |
|
| 28,341 |
|
2004-W9 2A1, 6.50%, 2/25/44 |
|
|
32,596 |
|
| 76,444 |
|
2015-88 CJ, 6.50%, 7/25/44 |
|
|
86,568 |
|
| 4,289 |
|
2010-108 AP, 7.00%, 9/25/40 |
|
|
4,820 |
|
| 13,122 |
|
2004-T3, 1A3, 7.00%, 2/25/44 |
|
|
15,089 |
|
|
|
Freddie Mac: |
|
|
|
|
| 43,997 |
|
K014 1A, 2.79%, 10/25/20 |
|
|
44,713 |
|
| 37,167 |
|
4293 BA, 5.35%, 10/15/47 1 |
|
|
39,763 |
|
| 38,694 |
|
2102 Z, 6.00%, 12/15/28 |
|
|
43,241 |
|
| 40,041 |
|
2122 ZE, 6.00%, 2/15/29 |
|
|
43,120 |
|
| 47,010 |
|
2980 QA, 6.00%, 5/15/35 |
|
|
53,378 |
|
| 22,535 |
|
2283 K, 6.50%, 12/15/23 |
|
|
24,607 |
|
| 37,356 |
|
2357 ZJ, 6.50%, 9/15/31 |
|
|
42,395 |
|
| 33,445 |
|
T-59 1A1, 6.50%, 10/25/43 |
|
|
39,211 |
|
| 72,753 |
|
4520 HM, 6.50%, 8/15/45 |
|
|
86,083 |
|
| 92,770 |
|
1142 IA, 7.00%, 10/15/21 |
|
|
101,001 |
|
| 9,072 |
|
3946 KW, 7.00%, 11/15/29 |
|
|
9,602 |
|
| 40,107 |
|
3704 CT, 7.00%, 12/15/36 |
|
|
46,503 |
|
| 29,171 |
|
2238 PZ, 7.50%, 6/15/30 |
|
|
33,216 |
|
|
|
Government National Mortgage Association: |
|
| 61,059 |
|
2015-80 BA, 6.98%, 6/20/45 1 |
|
|
71,039 |
|
| 60,967 |
|
2014-69 W, 7.26%, 11/20/34 1 |
|
|
71,982 |
|
| 52,575 |
|
2013-133 KQ, 7.37%, 8/20/38 |
|
|
62,398 |
|
| 34,366 |
|
2005-74 HA, 7.50%, 9/16/35 |
|
|
38,402 |
|
| 48,905 |
|
New Residential Mortgage Loan Trust,
2016-2A B3, 5.70%, 11/26/35 1, 4 |
|
|
49,001 |
|
|
|
Sequoia Mortgage Trust: |
|
|
|
|
| 30,918 |
|
2013-3 A2, 2.50%, 3/25/43 1 |
|
|
28,981 |
|
| 16,559 |
|
2012-4 A2, 3.00%, 9/25/42 1 |
|
|
16,325 |
|
|
|
Vendee Mortgage Trust: |
|
|
|
|
| 28,288 |
|
2008-1 B, 7.43%, 3/15/25 1 |
|
|
31,831 |
|
| 22,746 |
|
1994-2 2, 8.64%, 5/15/24 1 |
|
|
24,663 |
|
|
|
|
|
|
|
|
|
|
|
|
|
|
|
|
1,286,713 |
|
|
|
|
|
|
|
|
|
|
| Corporate Bonds - 13.4% |
|
|
|
|
| 25,000 |
|
Activision Blizzard, Inc., 6.13%,
9/15/23 4 |
|
|
27,353 |
|
| 25,000 |
|
Affiliated Managers Group, Inc., 4.25%, 2/15/24 |
|
|
25,131 |
|
| 59,655 |
|
Aircraft Certificate Owner Trust 2003,
7.00%, 9/20/22 4 |
|
|
62,936 |
|
| 50,000 |
|
Alphabet, Inc., 3.63%, 5/19/21 |
|
|
53,024 |
|
| 39,429 |
|
American Airlines 2013-2 Class B Trust,
5.60%, 7/15/20 4 |
|
|
40,908 |
|
| 50,000 |
|
American Equity Investment Life Holding Co.,
6.63%, 7/15/21 |
|
|
52,125 |
|
| 50,000 |
|
American Express Credit Corp., 2.38%, 5/26/20 |
|
|
49,972 |
|
| 50,000 |
|
Ameriprise Financial, Inc., 3.70%, 10/15/24 |
|
|
51,089 |
|
|
|
|
| See accompanying notes to financial statements. |
|
|
| DECEMBER 31, 2016 |
|
7 |
SCHEDULE OF INVESTMENTS (Unaudited)
December 31, 2016
Sit Balanced Fund
(Continued)
|
|
|
|
|
|
|
| |
|
|
Principal
Amount ($) |
|
Name of Issuer |
|
Fair Value ($) |
|
| |
|
|
|
|
| 25,000 |
|
Anheuser-Busch InBev Finance, Inc., 3.65%,
2/1/26 |
|
|
25,380 |
|
| 25,000 |
|
Aspen Insurance Holdings, Ltd., 4.65%,
11/15/23 |
|
|
25,731 |
|
| 100,000 |
|
Assured Guaranty US Holdings, Inc.,
7.00%, 6/1/34 |
|
|
109,282 |
|
| 50,000 |
|
Bank One Corp. (Subordinated), 7.63%,
10/15/26 |
|
|
63,508 |
|
| 25,000 |
|
Bank One Michigan (Subordinated), 8.25%,
11/1/24 |
|
|
31,983 |
|
| 25,000 |
|
Basell Finance Co. BV, 8.10%, 3/15/27
4 |
|
|
32,685 |
|
| 25,000 |
|
Berkshire Hathaway Finance Corp., 3.00%,
5/15/22 |
|
|
25,473 |
|
| 50,000 |
|
Berkshire Hathaway, Inc., 3.13%, 3/15/26 |
|
|
49,675 |
|
|
|
BlackRock, Inc.: |
|
|
|
|
| 25,000 |
|
3.50%, 3/18/24 |
|
|
25,892 |
|
| 50,000 |
|
4.25%, 5/24/21 |
|
|
53,807 |
|
|
|
Burlington Northern Santa Fe, LLC: |
|
|
|
|
| 25,000 |
|
7.00%, 12/15/25 |
|
|
31,867 |
|
| 25,000 |
|
7.08%, 5/13/29 |
|
|
32,139 |
|
| 50,000 |
|
Caterpillar Financial Services Corp.,
2.50%, 11/13/20 |
|
|
50,029 |
|
| 75,000 |
|
Citigroup, Inc., 3.50%, 2/27/33 14 |
|
|
72,966 |
|
| 25,000 |
|
Comcast Corp., 2.75%, 3/1/23 |
|
|
24,821 |
|
| 50,000 |
|
ConocoPhillips Co., 4.95%, 3/15/26 |
|
|
55,200 |
|
| 42,516 |
|
Continental Airlines 2000-1 Class A-1 Trust,
8.05%, 11/1/20 |
|
|
47,246 |
|
| 20,693 |
|
Continental Airlines 2012-1 Class A Trust,
4.15%, 4/11/24 |
|
|
21,262 |
|
| 25,000 |
|
Costco Wholesale Corp., 2.25%, 2/15/22 |
|
|
24,779 |
|
| 39,555 |
|
Delta Air Lines 2007-1 Class A Trust,
6.82%, 8/10/22 |
|
|
45,488 |
|
| 54,344 |
|
Doric Nimrod Air Alpha 2012-1 Class A Trust, 5.13%, 11/30/22 4 |
|
|
56,586 |
|
| 50,916 |
|
Doric Nimrod Air Alpha 2013-1 Trust, 5.25%, 5/30/23
4 |
|
|
53,080 |
|
| 25,000 |
|
Dr. Pepper Snapple Group, Inc., 2.53%,
11/15/21 |
|
|
24,854 |
|
| 50,000 |
|
Eaton Vance Corp., 3.63%, 6/15/23 |
|
|
50,779 |
|
| 80,000 |
|
Exxon Mobil Corp., 4.11%, 3/1/46 |
|
|
81,942 |
|
| 25,000 |
|
General Electric Co., 7.50%, 8/21/35 |
|
|
33,498 |
|
| 43,364 |
|
Hawaiian Airlines 2013-1 Class A, 3.90%,
1/15/26 |
|
|
44,285 |
|
| 51,000 |
|
Ingersoll-Rand Co., 7.20%, 6/1/25 |
|
|
57,617 |
|
| 25,000 |
|
Intel Corp., 3.10%, 7/29/22 |
|
|
25,708 |
|
|
|
Invesco Finance, PLC: |
|
|
|
|
| 25,000 |
|
3.13%, 11/30/22 |
|
|
25,184 |
|
| 50,000 |
|
3.75%, 1/15/26 |
|
|
50,669 |
|
| 150,000 |
|
INVISTA Finance, LLC, 4.25%, 10/15/19
4 |
|
|
148,709 |
|
| 25,000 |
|
ITT, LLC, 7.40%, 11/15/25 |
|
|
31,660 |
|
| 50,000 |
|
JPMorgan Chase & Co., 3.88%, 2/1/24 |
|
|
51,819 |
|
| 25,000 |
|
Kaiser Foundation Hospitals, 3.50%, 4/1/22 |
|
|
25,799 |
|
| 25,000 |
|
KKR Group Finance Co., LLC, 6.38%,
9/29/20
4 |
|
|
28,156 |
|
|
|
|
|
|
|
|
| |
|
|
Principal
Amount ($) |
|
Name of Issuer |
|
Fair Value ($) |
|
| |
|
|
|
|
| 50,000 |
|
Loews Corp., 3.75%, 4/1/26 |
|
|
50,826 |
|
| 25,000 |
|
Lowe’s Companies, Inc., 7.59%, 6/18/27 |
|
|
30,429 |
|
| 125,000 |
|
Manufacturers & Traders Trust Co.
(Subordinated), 1.57%, 12/1/21 1 |
|
|
122,656 |
|
| 50,000 |
|
Medtronic, Inc., 2.50%, 3/15/20 |
|
|
50,560 |
|
| 25,000 |
|
Microsoft Corp., 2.00%, 8/8/23 |
|
|
23,895 |
|
| 40,000 |
|
Northern States Power Co., 7.13%, 7/1/25 |
|
|
49,956 |
|
| 31,048 |
|
Northwest Airlines 2007-1 A Trust,
7.03%, 11/1/19 |
|
|
34,656 |
|
| 50,000 |
|
OM Asset Management, PLC, 4.80%, 7/27/26 |
|
|
47,373 |
|
| 25,000 |
|
PACCAR Financial Corp., 1.65%, 8/11/21 |
|
|
24,019 |
|
| 25,000 |
|
PepsiCo, Inc., 1.70%, 10/6/21 |
|
|
24,287 |
|
| 25,000 |
|
Pfizer, Inc., 5.80%, 8/12/23 |
|
|
29,476 |
|
| 50,000 |
|
Progressive Corp. (Subordinated),
6.70%, 6/15/37
1 |
|
|
48,875 |
|
| 75,000 |
|
Raytheon Co., 4.88%, 10/15/40 |
|
|
84,339 |
|
| 50,000 |
|
Rockwell Automation, Inc., 2.88%, 3/1/25 |
|
|
48,978 |
|
| 50,000 |
|
Rockwell Collins, Inc., 3.70%, 12/15/23 |
|
|
51,183 |
|
| 75,000 |
|
Security Benefit Life Insurance Co.
(Subordinated), 7.45%, 10/1/33 4 |
|
|
83,660 |
|
| 50,000 |
|
Security Capital Group, Inc., 7.70%, 6/15/28 |
|
|
65,949 |
|
| 46,205 |
|
Spirit Airlines 2015-1B Trust, 4.45%, 4/1/24 |
|
|
47,014 |
|
| 50,000 |
|
State Street Corp., 7.35%, 6/15/26 |
|
|
64,002 |
|
| 75,000 |
|
Symetra Financial Corp., 4.25%, 7/15/24 |
|
|
74,110 |
|
| 38,079 |
|
US Airways 2001-1C Trust (Subordinated),
7.35%, 3/20/22 |
|
|
41,982 |
|
| 25,000 |
|
US Bancorp, 2.95%, 7/15/22 |
|
|
25,148 |
|
| 25,000 |
|
US Bancorp (Subordinated), 3.10%, 4/27/26 |
|
|
24,339 |
|
| 2,000 |
|
Verizon Communications, 5.90%, 2/15/54 |
|
|
52,180 |
|
| 15,107 |
|
Virgin Australia 2013-1A Trust,
5.00%, 10/23/23
4 |
|
|
15,787 |
|
| 50,000 |
|
Wells Fargo & Co. (Subordinated), 4.10%,
6/3/26 |
|
|
50,659 |
|
| 25,000 |
|
Wyeth, LLC, 5.95%, 4/1/37 |
|
|
31,461 |
|
|
|
|
|
|
|
|
|
|
|
|
|
|
|
|
3,299,895 |
|
|
|
|
|
|
|
|
|
|
| Federal Home Loan Mortgage Corporation - 1.4% |
|
|
|
|
| 152,209 |
|
5.00%, 10/1/43 |
|
|
169,849 |
|
| 6,151 |
|
6.00%, 10/1/21 |
|
|
6,451 |
|
| 57,903 |
|
6.50%, 2/1/22 |
|
|
62,064 |
|
| 39,904 |
|
7.50%, 7/1/29 |
|
|
46,221 |
|
| 13,005 |
|
7.50%, 11/1/36 |
|
|
15,833 |
|
| 23,554 |
|
8.00%, 2/1/34 |
|
|
28,079 |
|
| 3,409 |
|
8.38%, 5/17/20 |
|
|
3,549 |
|
|
|
|
|
|
|
|
|
|
|
|
|
|
|
|
332,046 |
|
|
|
|
|
|
|
|
|
|
| Federal National Mortgage Association - 3.0% |
|
|
|
|
| 33,187 |
|
5.00%, 2/1/33 |
|
|
34,200 |
|
| 131,449 |
|
5.50%, 10/1/33 |
|
|
148,046 |
|
| 95,773 |
|
6.00%, 2/1/38 |
|
|
109,057 |
|
| 53,211 |
|
6.14%, 11/1/43 |
|
|
59,217 |
|
| 64,082 |
|
6.50%, 9/1/27 |
|
|
72,735 |
|
| 96,582 |
|
6.50%, 10/1/36 |
|
|
109,269 |
|
| 15,372 |
|
7.00%, 1/1/32 |
|
|
16,265 |
|
|
|
|
| See accompanying notes to financial statements. |
|
|
|
8 |
|
SIT MUTUAL FUNDS
SEMI-ANNUAL REPORT |
|
|
|
|
|
|
|
| |
|
|
Principal
Amount ($) |
|
Name of Issuer |
|
Fair Value ($) |
|
| |
|
|
|
|
| 21,526 |
|
7.00%, 3/1/33 |
|
|
24,712 |
|
| 15,106 |
|
7.00%, 12/1/36 |
|
|
18,013 |
|
| 26,844 |
|
8.00%, 6/1/24 |
|
|
29,902 |
|
| 36,420 |
|
8.00%, 1/1/31 |
|
|
39,077 |
|
| 28,280 |
|
8.00%, 2/1/31 |
|
|
34,876 |
|
| 5,905 |
|
8.47%, 7/15/26 |
|
|
6,704 |
|
| 36,226 |
|
8.50%, 10/1/30 |
|
|
42,630 |
|
|
|
|
|
|
|
|
|
|
|
|
|
|
|
|
744,703 |
|
|
|
|
|
|
|
|
|
|
| Government National Mortgage Association - 2.1% |
|
|
|
|
| 76,374 |
|
5.75%, 12/15/22 |
|
|
82,647 |
|
| 70,745 |
|
6.00%, 4/15/29 |
|
|
82,200 |
|
| 42,932 |
|
6.50%, 11/20/38 |
|
|
49,558 |
|
| 16,530 |
|
7.00%, 12/15/24 |
|
|
17,914 |
|
| 24,173 |
|
7.00%, 11/20/27 |
|
|
28,077 |
|
| 60,529 |
|
7.00%, 9/20/29 |
|
|
70,341 |
|
| 24,011 |
|
7.00%, 9/20/38 |
|
|
27,299 |
|
| 59,389 |
|
7.50%, 4/20/32 |
|
|
66,286 |
|
| 22,692 |
|
8.00%, 7/15/24 |
|
|
24,875 |
|
| 64,560 |
|
8.38%, 3/15/31 |
|
|
66,934 |
|
|
|
|
|
|
|
|
|
|
|
|
|
|
|
|
516,131 |
|
|
|
|
|
|
|
|
|
|
| Taxable Municipal Securities - 3.7% |
|
|
|
|
| 50,000 |
|
Alaska Muni Bond Bank Auth., 5.99%, 9/1/25 |
|
|
53,987 |
|
| 50,000 |
|
Banning Redevelopment Agency Successor
Agency, 3.51%, 9/1/31 |
|
|
46,848 |
|
| 75,000 |
|
City of Tooele City UT, 2.32%, 12/1/24 |
|
|
70,930 |
|
| 40,000 |
|
Kentucky Housing Corp., 3.50%, 1/1/40 |
|
|
40,396 |
|
| 50,000 |
|
Los Angeles Comm. Red. Agy.,
8.00%, 9/1/38 |
|
|
62,798 |
|
| 38,398 |
|
Louisiana Housing Corp., 3.05%, 12/1/38 |
|
|
37,681 |
|
| 50,000 |
|
Louisiana Public Facilities Auth.,
4.50%, 7/1/43 |
|
|
46,311 |
|
| 50,000 |
|
Macomb Interceptor Drain Drainage District,
5.50%, 5/1/30 |
|
|
51,654 |
|
| 50,000 |
|
Massachusetts Edu. Fin. Auth., 4.00%, 1/1/32 |
|
|
49,666 |
|
| 100,000 |
|
Mississippi Development Bank,
2.54%, 8/1/24 |
|
|
95,729 |
|
| 61,000 |
|
Multistate Liquidating Trust No. 1, 3.11%,
12/15/28 4, |
|
|
17
57,479 |
|
| 75,000 |
|
Northern Illinois Muni Power Agy., 6.86%,
1/1/39 |
|
|
89,012 |
|
| 50,000 |
|
Soledad Redevelopment Agency, 6.13%, 12/1/32 |
|
|
52,237 |
|
| 150,000 |
|
Tennessee Valley Auth., 3.67%, 1/15/30
6 |
|
|
93,633 |
|
| 65,000 |
|
Texas St. Pub. Fin. Auth. Charter Sch. Fin.,
8.75%, 8/15/27 |
|
|
69,735 |
|
|
|
|
|
|
|
|
|
|
|
|
|
|
|
|
918,096 |
|
|
|
|
|
|
|
|
|
|
| U.S. Government / Federal Agency Securities -
1.3% |
|
|
|
|
| 300,000 |
|
U.S. Treasury Note, 1.75%, 3/31/22 |
|
|
296,004 |
|
| 50,000 |
|
U.S. Treasury Strips, 3.16%, 11/15/45
6 |
|
|
20,124 |
|
|
|
|
|
|
|
|
|
|
|
|
|
|
|
|
316,128 |
|
|
|
|
|
|
|
|
|
|
|
|
|
|
|
| |
|
| Principal
Amount ($)
Quantity |
|
Name of Issuer |
|
Fair Value ($) |
|
| |
|
|
| U.S. Treasury / Federal Agency Securities -
1.1% |
|
|
|
U.S. Treasury Strips: |
|
|
|
|
| 50,000 |
|
2.04%, 2/15/27 6 |
|
|
38,791 |
|
| 525,000 |
|
2.59%, 5/15/44 6 |
|
|
222,766 |
|
|
|
|
|
|
|
|
|
|
|
|
|
|
|
|
261,557 |
|
|
|
|
|
|
|
|
|
|
| Total Bonds
(cost: $8,013,507) |
|
|
7,885,924 |
|
|
|
|
|
|
|
|
|
|
| Investment Companies - 2.1% |
|
|
|
|
| 6,513 |
|
BlackRock Enhanced Government Fund |
|
|
85,972 |
|
| 24,300 |
|
BlackRock Income Trust |
|
|
153,819 |
|
| 8,700 |
|
Duff & Phelps Utility and Corporate Bond Trust |
|
|
82,128 |
|
| 27,600 |
|
MFS Intermediate Income Trust |
|
|
122,544 |
|
| 16,352 |
|
Putnam Premier Income Trust |
|
|
81,269 |
|
|
|
|
|
|
|
|
|
|
| Total Investment Companies
(cost: $552,701) |
|
|
525,732 |
|
|
|
|
|
|
|
|
| Short-Term Securities - 2.4% |
|
|
|
|
| 591,726 |
|
Fidelity Instl. Money Mkt. Govt. Fund, 0.39% |
|
|
|
|
| Total Short-Term Securities
(cost: $591,726) |
|
|
591,726 |
|
|
|
|
|
|
|
|
|
|
| Total Investments in Securities - 99.9%
(cost: $20,701,355) |
|
|
24,568,577 |
|
| Other Assets and Liabilities, net - 0.1% |
|
|
29,012 |
|
|
|
|
|
|
|
|
|
|
| Total Net Assets - 100.0% |
|
|
$24,597,589 |
|
|
|
|
|
|
|
|
| * |
Non-income producing security. |
| 1 |
Variable rate security. Rate disclosed is as of December 31, 2016. |
| 4 |
144A Restricted Security. The total value of such securities as of December 31, 2016 was $656,340 and represented 2.7% of net assets. These securities have been determined to be liquid by the Adviser in
accordance with guidelines established by the Board of Directors. |
| 6 |
Zero coupon or convertible capital appreciation bond, for which the rate disclosed is either the effective yield on purchase date or the coupon rate to be paid upon conversion to coupon paying, respectively.
|
| 14 |
Step Coupon: A bond that pays an initial coupon rate for the first period and then a higher coupon rate for the following periods. Rate disclosed is as of December 31, 2016. |
| 17 |
Security that is either an absolute and unconditional obligation of the United States Government or is collateralized by securities, loans, or leases guaranteed by the U.S. Government or its agencies or
instrumentalities. |
Numeric footnotes not disclosed are not applicable to this Schedule of Investments.
LLC — Limited Liability Company
PLC — Public Limited Company
|
|
|
| See accompanying notes to financial statements. |
|
|
| DECEMBER 31, 2016 |
|
9 |
SCHEDULE OF INVESTMENTS (Unaudited)
December 31, 2016
Sit Balanced Fund
(Continued)
A summary of the levels for the Fund’s investments as of December 31, 2016 is as follows (see Note 2 - significant accounting
policies in the notes to financial statements):
|
|
|
|
|
|
|
|
|
|
|
|
|
|
|
|
|
|
|
|
|
| |
|
Investment in Securities |
| |
|
Level 1
Quoted
Price ($) |
|
Level 2
Other significant
observable inputs ($) |
|
Level 3
Significant
unobservable inputs ($) |
|
Total ($) |
| Common Stocks ** |
|
|
|
15,565,195 |
|
|
|
|
— |
|
|
|
|
— |
|
|
|
|
15,565,195 |
|
| Asset-Backed Securities |
|
|
|
— |
|
|
|
|
210,655 |
|
|
|
|
— |
|
|
|
|
210,655 |
|
| Collateralized Mortgage Obligations |
|
|
|
— |
|
|
|
|
1,286,713 |
|
|
|
|
— |
|
|
|
|
1,286,713 |
|
| Corporate Bonds |
|
|
|
— |
|
|
|
|
3,299,895 |
|
|
|
|
— |
|
|
|
|
3,299,895 |
|
| Federal Home Loan Mortgage Corporation |
|
|
|
— |
|
|
|
|
332,046 |
|
|
|
|
— |
|
|
|
|
332,046 |
|
| Federal National Mortgage Association |
|
|
|
— |
|
|
|
|
744,703 |
|
|
|
|
— |
|
|
|
|
744,703 |
|
| Government National Mortgage Association |
|
|
|
— |
|
|
|
|
516,131 |
|
|
|
|
— |
|
|
|
|
516,131 |
|
| Taxable Municipal Securities |
|
|
|
— |
|
|
|
|
918,096 |
|
|
|
|
— |
|
|
|
|
918,096 |
|
| U.S. Government / Federal Agency Securities |
|
|
|
— |
|
|
|
|
316,128 |
|
|
|
|
— |
|
|
|
|
316,128 |
|
| U.S. Treasury / Federal Agency Securities |
|
|
|
— |
|
|
|
|
261,557 |
|
|
|
|
— |
|
|
|
|
261,557 |
|
| Investment Companies |
|
|
|
525,732 |
|
|
|
|
— |
|
|
|
|
— |
|
|
|
|
525,732 |
|
| Short-Term Securities |
|
|
|
591,726 |
|
|
|
|
— |
|
|
|
|
— |
|
|
|
|
591,726 |
|
|
|
|
|
|
| Total: |
|
|
|
16,682,653 |
|
|
|
|
7,885,924 |
|
|
|
|
— |
|
|
|
|
24,568,577 |
|
| ** |
For equity securities categorized in a single level, refer to the Schedule of Investments for further breakdown. |
For the reporting period, there were no transfers between levels 1, 2 and 3.
|
|
|
| See accompanying notes to financial statements. |
|
|
|
10 |
|
SIT MUTUAL FUNDS
SEMI-ANNUAL REPORT |
[This page intentionally left blank.]
|
| |
|
Sit Dividend Growth Fund - Class I and Class S |
OBJECTIVE & STRATEGY
The objective of the Sit Dividend Growth Fund is to provide current income that exceeds the dividend yield of the S&P 500® Index and that grows over a period of years. Secondarily, the Fund seeks long-term capital appreciation.
The Fund seeks to achieve its objectives by investing, under normal market conditions, at least 80% of its net assets in dividend-paying common
stocks. The Fund may invest the balance of its assets in preferred stocks, convertible bonds, and U.S. Treasury securities.
The Sit Dividend Growth Fund Class I posted a +6.27% return for the last six months of 2016,
compared to the +7.82% return for the S&P 500® Index. The Fund’s gross dividend yield (before deduction of Fund expenses) is 2.52% compared to the 2.08% of the S&P 500® Index.
U.S. stocks posted solid returns during the second half of 2016, fueled by a sharp rally following the presidential election. Markets have
risen in hopes that an improving economic and corporate earnings backdrop will emerge from President-elect Trump’s pro-growth policies, including lower tax rates, fiscal stimulus and deregulation. While there is clearly a risk that the market
may be expecting too much, too soon, we believe there could be significant opportunities for investors if growth initiatives are pushed forward. Certainly, tax, spending, and regulatory policies will likely have very different impacts across
companies and sectors. Our recent portfolio positioning, therefore, has been based on identifying likely “winners” once policies are enacted. For example, we have increased positions in financials, transportation and producer
manufacturing, as these are cyclical sectors that should see immediate benefits of policy changes and an uptick in economic growth. Conversely, we have reduced our commitment to the health technology sector, given the lack of policy upside, currency
pressures, and concerns over drug pricing. Regardless of sector, we remain focused on companies that have strong balance sheets, generate consistent growth in earnings and cash flow, and maintain a commitment to increasing dividends to shareholders
over the longer term. To this point, 81 out of 85 companies held in the Fund increased their dividends over the past twelve months, with an average increase of just over +9%.
The Fund’s defensive positioning relative to the S&P 500® Index negatively impacted performance over the second half of 2016.
Poor stock selection and overweighting the lagging health care sector was a key detractor, while performance in the finance sector was weighed down by overweighting REITs and underweighting banks and life insurers, which surged during the period
with the sharp increase in interest rates. In terms of individual stocks, Medtronic, CVS Health,
HYPOTHETICAL GROWTH OF $10,000

The chart above illustrates the total value of a hypothetical $10,000 investment in the Fund over the past
10 years as compared to the performance of the S&P 500® Index. Past performance does not guarantee future results. Returns include the reinvestment of distributions. The chart does not reflect the deduction of taxes that a shareholder would
pay on Fund distributions or the redemption of Fund shares.
1 S&P 500® Index is an unmanaged capitalization-weighted index
that measures the performance of 500 widely held common stocks of large-cap companies. It is not possible to invest directly in an index. This is the Fund’s primary index.
Nielsen Holdings, Teva Pharmaceutical
Industries and Life Storage were among the underperformers during the period. The Fund benefitted from strong stock selection in process industries and technology services sectors. Top individual performers included KeyCorp, Applied Materials,
Synchrony Financial, Delta Air Lines and Scotts Miracle-Gro.
We continue to believe that dividend-paying growth stocks held in the Fund
remain attractively valued relative to current dividend yields and growth rates.
Roger J. Sit
Kent L. Johnson
Michael J. Stellmacher
Portfolio Managers
|
|
|
|
12 |
|
SIT MUTUAL FUNDS
SEMI-ANNUAL REPORT |
COMPARATIVE RATES OF RETURNS
as of December 31, 2016
|
|
|
|
|
|
|
|
|
|
|
|
|
|
|
|
| |
|
Sit Dividend |
|
|
| |
|
Growth Fund |
|
|
| |
|
|
|
|
|
S&P 500® |
| |
|
Class I |
|
Class S |
|
Index 1 |
| Six Month |
|
|
|
6.27 |
% |
|
|
|
6.16 |
% |
|
|
|
7.82 |
% |
| One Year |
|
|
|
10.73 |
|
|
|
|
10.49 |
|
|
|
|
11.96 |
|
| Five Year |
|
|
|
12.67 |
|
|
|
|
12.40 |
|
|
|
|
14.66 |
|
| Ten Year |
|
|
|
8.10 |
|
|
|
|
7.83 |
|
|
|
|
6.95 |
|
| Since Inception - Class I
(12/31/03) |
|
|
|
9.16 |
|
|
|
|
n/a |
|
|
|
|
7.73 |
|
| Since Inception - Class S
(3/31/06) |
|
|
|
n/a |
|
|
|
|
8.32 |
|
|
|
|
7.49 |
|
Performance figures are historical and do not guarantee future results. Investment returns and principal value will vary, and you may have a
gain or loss when you sell shares. Current performance may be lower or higher than the performance data quoted. Contact the Fund for performance data current to the most recent month-end. Returns include changes in share price as well as
reinvestment of all dividends and capital gains. Returns do not reflect the deduction of the 2% redemption fee imposed if shares are redeemed or exchanged within 30 calendar days from their date of purchase. If imposed, the fee would reduce the
performance quoted. Returns do not reflect the deduction of taxes that a shareholder would pay on Fund distributions or the redemption of Fund shares. Management fees and administrative expenses are included in the Fund’s performance. Returns
for periods greater than one year are compounded average annual rates of return.
1 S&P 500® Index is an unmanaged
capitalization-weighted index that measures the performance of 500 widely held common stocks of large-cap companies. It is not possible to invest directly in an index.
PORTFOLIO SUMMARY
|
|
|
|
|
| Class I: |
|
|
|
|
| Net Asset Value 12/31/16: |
|
|
$15.59 Per Share |
|
| Net Asset Value 6/30/16: |
|
|
$15.82 Per Share |
|
| Total Net Assets: |
|
|
$927.3 Million |
|
| Class S: |
|
|
|
|
| Net Asset Value 12/31/16: |
|
|
$15.54 Per Share |
|
| Net Asset Value 6/30/16: |
|
|
$15.76 Per Share |
|
| Total Net Assets: |
|
|
$67.4 Million |
|
|
|
| Weighted Average Market Cap: |
|
|
$111.7 Billion |
|
TOP 10 HOLDINGS
1. Microsoft Corp.
2. Verizon Communications, Inc.
3. Johnson & Johnson
4. JPMorgan Chase & Co.
5. Intel Corp.
6. Home Depot, Inc.
7. Broadcom, Ltd.
8. Apple, Inc.
9. UnitedHealth Group, Inc.
10. Pfizer, Inc.
Based on total net assets as of December 31, 2016. Subject to change.
FUND DIVERSIFICATION
Based on total net assets as of December 31, 2016. Subject to change.
SCHEDULE OF INVESTMENTS (Unaudited)
December 31, 2016
Sit Dividend Growth
Fund
|
|
|
|
|
|
|
| |
|
|
|
|
| Quantity |
|
Name of Issuer |
|
Fair Value ($) |
|
| |
|
|
| Common Stocks - 99.3% |
|
| Communications - 2.9% |
|
| 547,875 |
|
Verizon Communications, Inc. |
|
|
29,245,568 |
|
|
|
|
|
|
|
|
|
|
| Consumer Durables - 2.9% |
|
|
|
|
| 124,950 |
|
Genuine Parts Co. |
|
|
11,937,723 |
|
| 39,800 |
|
Snap-On, Inc. |
|
|
6,816,546 |
|
| 88,000 |
|
Stanley Black & Decker, Inc. |
|
|
10,092,720 |
|
|
|
|
|
|
|
|
|
|
|
|
|
|
|
|
28,846,989 |
|
|
|
|
|
|
|
|
|
|
| Consumer Non-Durables - 8.0% |
|
|
|
|
| 129,300 |
|
B&G Foods, Inc. |
|
|
5,663,340 |
|
| 135,075 |
|
General Mills, Inc. |
|
|
8,343,583 |
|
| 86,300 |
|
JM Smucker Co. |
|
|
11,051,578 |
|
| 123,350 |
|
Kraft Heinz Co. |
|
|
10,770,922 |
|
| 152,750 |
|
PepsiCo, Inc. |
|
|
15,982,232 |
|
| 140,650 |
|
Philip Morris International, Inc. |
|
|
12,868,068 |
|
| 174,350 |
|
Procter & Gamble Co. |
|
|
14,659,348 |
|
|
|
|
|
|
|
|
|
|
|
|
|
|
|
|
79,339,071 |
|
|
|
|
|
|
|
|
|
|
| Consumer Services - 4.7% |
|
|
|
|
| 190,800 |
|
CBS Corp. |
|
|
12,138,696 |
|
| 143,450 |
|
Starbucks Corp. |
|
|
7,964,344 |
|
| 73,600 |
|
Time Warner, Inc. |
|
|
7,104,608 |
|
| 126,525 |
|
Visa, Inc. |
|
|
9,871,480 |
|
| 94,175 |
|
Walt Disney Co. |
|
|
9,814,918 |
|
|
|
|
|
|
|
|
|
|
|
|
|
|
|
|
46,894,046 |
|
|
|
|
|
|
|
|
|
|
| Electronic Technology - 8.7% |
|
|
|
|
| 164,300 |
|
Apple, Inc. |
|
|
19,029,226 |
|
| 488,800 |
|
Applied Materials, Inc. |
|
|
15,773,576 |
|
| 109,900 |
|
Broadcom, Ltd. |
|
|
19,427,023 |
|
| 544,150 |
|
Intel Corp. |
|
|
19,736,320 |
|
| 111,300 |
|
Skyworks Solutions, Inc. |
|
|
8,309,658 |
|
| 64,600 |
|
Xilinx, Inc. |
|
|
3,899,902 |
|
|
|
|
|
|
|
|
|
|
|
|
|
|
|
|
86,175,705 |
|
|
|
|
|
|
|
|
|
|
| Energy Minerals - 3.8% |
|
|
|
|
| 161,450 |
|
Marathon Petroleum Corp. |
|
|
8,129,008 |
|
| 207,925 |
|
Occidental Petroleum Corp. |
|
|
14,810,498 |
|
| 444,725 |
|
Suncor Energy, Inc. |
|
|
14,538,060 |
|
|
|
|
|
|
|
|
|
|
|
|
|
|
|
|
37,477,566 |
|
|
|
|
|
|
|
|
|
|
|
|
|
|
|
| |
|
|
|
|
| Quantity |
|
Name of Issuer |
|
Fair Value ($) |
|
| |
|
|
|
| Finance - 18.7% |
|
|
|
|
| 123,475 |
|
Allstate Corp. |
|
|
9,151,967 |
|
| 457,200 |
|
Brixmor Property Group, Inc. |
|
|
11,164,824 |
|
| 75,275 |
|
Chubb, Ltd. |
|
|
9,945,333 |
|
| 54,300 |
|
Goldman Sachs Group, Inc. |
|
|
13,002,135 |
|
| 207,400 |
|
Hartford Financial Services Group, Inc. |
|
|
9,882,610 |
|
| 645,075 |
|
Huntington Bancshares, Inc. |
|
|
8,527,892 |
|
| 247,875 |
|
Invesco, Ltd. |
|
|
7,520,528 |
|
| 268,275 |
|
JPMorgan Chase & Co. |
|
|
23,149,450 |
|
| 840,600 |
|
KeyCorp |
|
|
15,357,762 |
|
| 386,275 |
|
Legg Mason, Inc. |
|
|
11,553,485 |
|
| 157,200 |
|
Macquarie Infrastructure Corp. |
|
|
12,843,240 |
|
| 196,100 |
|
MetLife, Inc. |
|
|
10,567,829 |
|
| 383,375 |
|
Synchrony Financial |
|
|
13,905,011 |
|
| 94,900 |
|
T Rowe Price Group, Inc. |
|
|
7,142,174 |
|
| 269,500 |
|
US Bancorp |
|
|
13,844,215 |
|
| 211,600 |
|
XL Group, Ltd. |
|
|
7,884,216 |
|
|
|
|
|
|
|
|
|
|
|
|
|
|
|
|
185,442,671 |
|
|
|
|
|
|
|
|
|
|
| Health Services - 3.2% |
|
|
|
|
| 36,300 |
|
Aetna, Inc. |
|
|
4,501,563 |
|
| 144,725 |
|
Cardinal Health, Inc. |
|
|
10,415,858 |
|
| 107,725 |
|
UnitedHealth Group, Inc. |
|
|
17,240,309 |
|
|
|
|
|
|
|
|
|
|
|
|
|
|
|
|
32,157,730 |
|
|
|
|
|
|
|
|
|
|
| Health Technology - 12.0% |
|
|
|
|
| 209,125 |
|
Abbott Laboratories |
|
|
8,032,491 |
|
| 218,650 |
|
AbbVie, Inc. |
|
|
13,691,863 |
|
| 95,675 |
|
Becton Dickinson and Co. |
|
|
15,838,996 |
|
| 55,575 |
|
Gilead Sciences, Inc. |
|
|
3,979,726 |
|
| 217,275 |
|
Johnson & Johnson |
|
|
25,032,253 |
|
| 202,450 |
|
Medtronic, PLC |
|
|
14,420,514 |
|
| 232,700 |
|
Merck & Co., Inc. |
|
|
13,699,049 |
|
| 518,075 |
|
Pfizer, Inc. |
|
|
16,827,076 |
|
| 79,450 |
|
Zimmer Holdings, Inc. |
|
|
8,199,240 |
|
|
|
|
|
|
|
|
|
|
|
|
|
|
|
|
119,721,208 |
|
|
|
|
|
|
|
|
|
|
| Industrial Services - 1.0% |
|
|
|
|
| 121,000 |
|
Schlumberger, Ltd. |
|
|
10,157,950 |
|
|
|
|
|
|
|
|
|
|
| Process Industries - 5.1% |
|
|
|
|
| 241,525 |
|
Dow Chemical Co. |
|
|
13,820,060 |
|
| 177,175 |
|
International Paper Co. |
|
|
9,400,906 |
|
| 115,500 |
|
LyondellBasell Industries NV |
|
|
9,907,590 |
|
| 83,150 |
|
Scotts Miracle-Gro Co. |
|
|
7,944,982 |
|
| 37,475 |
|
Sherwin-Williams Co. |
|
|
10,071,032 |
|
|
|
|
|
|
|
|
|
|
|
|
|
|
|
|
51,144,570 |
|
|
|
|
|
|
|
|
|
|
|
| See accompanying notes to financial statements. |
|
|
|
14 |
|
SIT MUTUAL FUNDS
SEMI-ANNUAL REPORT |
|
|
|
|
|
|
|
| |
|
|
|
|
| Quantity |
|
Name of Issuer |
|
Fair Value ($) |
|
| |
|
|
|
| Producer Manufacturing - 8.9% |
|
|
|
|
| 38,500 |
|
3M Co. |
|
|
6,874,945 |
|
| 71,850 |
|
Delphi Automotive, PLC |
|
|
4,839,098 |
|
| 284,225 |
|
General Electric Co. |
|
|
8,981,510 |
|
| 138,275 |
|
Honeywell International, Inc. |
|
|
16,019,159 |
|
| 5,032 |
|
Hubbell, Inc. |
|
|
587,234 |
|
| 142,550 |
|
Ingersoll-Rand, PLC |
|
|
10,696,952 |
|
| 39,720 |
|
Lockheed Martin Corp. |
|
|
9,927,617 |
|
| 75,950 |
|
Orbital ATK, Inc. |
|
|
6,663,094 |
|
| 106,075 |
|
Raytheon Co. |
|
|
15,062,650 |
|
| 81,800 |
|
United Technologies Corp. |
|
|
8,966,916 |
|
|
|
|
|
|
|
|
|
|
|
|
|
|
|
|
88,619,175 |
|
|
|
|
|
|
|
|
|
|
| Retail Trade - 4.2% |
|
|
|
|
| 45,350 |
|
Costco Wholesale Corp. |
|
|
7,260,988 |
|
| 146,500 |
|
Home Depot, Inc. |
|
|
19,642,720 |
|
| 65,375 |
|
Target Corp. |
|
|
4,722,036 |
|
| 130,100 |
|
TJX Cos., Inc. |
|
|
9,774,413 |
|
|
|
|
|
|
|
|
|
|
|
|
|
|
|
|
41,400,157 |
|
|
|
|
|
|
|
|
|
|
| Technology Services - 5.3% |
|
|
|
|
| 94,475 |
|
Accenture, PLC |
|
|
11,065,857 |
|
| 9,125 |
|
Alphabet, Inc.-Class A * |
|
|
7,231,106 |
|
| 550,500 |
|
Microsoft Corp. |
|
|
34,208,070 |
|
|
|
|
|
|
|
|
|
|
|
|
|
|
|
|
52,505,033 |
|
|
|
|
|
|
|
|
|
|
| Transportation - 4.8% |
|
|
|
|
| 58,600 |
|
Alaska Air Group, Inc. |
|
|
5,199,578 |
|
| 243,125 |
|
Delta Air Lines, Inc. |
|
|
11,959,319 |
|
| 69,825 |
|
FedEx Corp. |
|
|
13,001,415 |
|
| 72,629 |
|
Ryder System, Inc. |
|
|
5,406,503 |
|
| 112,400 |
|
Union Pacific Corp. |
|
|
11,653,632 |
|
|
|
|
|
|
|
|
|
|
|
|
|
|
|
|
47,220,447 |
|
|
|
|
|
|
|
|
|
|
|
|
|
|
|
| |
|
|
|
|
| Quantity |
|
Name of Issuer |
|
Fair Value ($) |
|
| |
|
|
|
| Utilities - 5.1% |
|
|
|
|
| 529,200 |
|
CenterPoint Energy, Inc. |
|
|
13,039,488 |
|
| 132,770 |
|
DTE Energy Co. |
|
|
13,079,173 |
|
| 110,100 |
|
NextEra Energy, Inc. |
|
|
13,152,546 |
|
| 239,000 |
|
Southern Co. |
|
|
11,756,410 |
|
|
|
|
|
|
|
|
|
|
|
|
|
|
|
|
51,027,617 |
|
|
|
|
|
|
|
|
|
|
| Total Common Stocks
(cost: $858,848,363) |
|
|
987,375,503 |
|
|
|
|
|
|
|
|
|
|
| Short-Term Securities - 0.5% |
|
|
|
|
| 5,064,387 |
|
Fidelity Instl. Money Mkt. Govt. Fund, 0.39% |
|
|
|
|
|
|
| Total Short-Term Securities
(cost: $5,064,387) |
|
|
5,064,387 |
|
|
|
|
|
|
|
|
|
|
| Total Investments in Securities - 99.8%
(cost: $863,912,750) |
|
|
992,439,890 |
|
| Other Assets and Liabilities, net - 0.2% |
|
|
2,297,412 |
|
|
|
|
|
|
|
|
|
|
| Total Net Assets - 100.0% |
|
|
$994,737,302 |
|
|
|
|
|
|
|
|
| * |
Non-income producing security. |
Numeric footnotes not disclosed are not applicable to
this Schedule of Investments.
PLC — Public Limited Company
A summary of the levels
for the Fund’s investments as of December 31, 2016 is as follows (see Note 2 - significant accounting policies in the notes to financial statements):
|
|
|
|
|
|
|
|
|
|
|
|
|
| |
|
Investment in Securities |
|
| |
|
Level 1 |
|
|
Level 2 |
|
Level 3 |
|
|
|
| |
|
Quoted |
|
|
Other significant |
|
Significant |
|
|
|
| |
|
Price ($) |
|
|
observable inputs ($) |
|
unobservable inputs ($) |
|
Total ($) |
|
| Common Stocks ** |
|
|
987,375,503 |
|
|
— |
|
— |
|
|
987,375,503 |
|
| Short-Term Securities |
|
|
5,064,387 |
|
|
— |
|
— |
|
|
5,064,387 |
|
|
|
|
|
|
| Total: |
|
|
992,439,890 |
|
|
— |
|
— |
|
|
992,439,890 |
|
| ** |
For equity securities categorized in a single level, refer to the Schedule of Investments for further breakdown. |
For the reporting period, there were no transfers between levels 1, 2 and 3.
|
|
|
| See accompanying notes to financial statements. |
|
|
| DECEMBER 31, 2016 |
|
15 |
|
| |
|
Sit Global Dividend Growth Fund - Class I and Class S |
OBJECTIVE & STRATEGY
The objective of the Sit Global Dividend Growth Fund is to provide current income that exceeds the dividend yield of the MSCI World Index and
that grows over a period of years. Secondarily, the Fund seeks long-term capital appreciation.
The Fund seeks to achieve its objectives by
investing, under normal market conditions, at least 80% of its net assets in dividend-paying common stocks issued by U.S. and foreign companies. The Fund may invest the balance of its assets in preferred stocks, convertible bonds, and U.S. Treasury
securities.
The Global Dividend Growth Fund Class I generated a total return +3.57% for the 6-month period
ending December 31, 2016 versus a total return of +6.81% for the MSCI World Index. The growth equity investment style underperformed the Index meaningfully in the last six months, but particularly in the fourth quarter of 2016, as did the Fund.
Global equities posted solid returns during the second half of 2016, fueled by a sharp rally following U.S. presidential election. Equity
markets have risen in anticipation of improving economic growth and higher corporate earnings on the back of President-elect Trump’s pro-growth policies, which include lower tax rates, fiscal stimulus, and deregulation. Although there is a risk
that investors may be expecting too much too soon, we believe attractive investment prospects exist for stocks and continue selectively invest in potential beneficiaries of Trump’s pro-growth initiatives. We continue to increase exposure to the
transportation and industrial sectors while at the same time reducing health technology exposure where drug-pricing issues continue to plague stocks and companies. Elsewhere in the world, we believe the performance of European equities will remain
choppy in response to both political and global macroeconomic events. In Japan, the key concern remains the ability of “Abenomics” to overcome the substantial structural challenges of a declining population, rigid labor market, and
elevated debt levels.
Contributing favorably to relative performance during the 6-month period were the Fund’s holdings in
transportation (Delta Airlines and Union Pacific), software & services (Microsoft) and insurance (Prudential) industries. The household & personal products industry also contributed to the outperformance given the underweight
position relative to the Index. Conversely, pharmaceutical (Teva Pharmaceutical and Roche Holding), health care equipment (Medtronic and Cardinal Health) and diversified financial (Macquarie Infrastructure and AURELIUS Equity) industries negatively
impacted absolute and relative performance.
Regionally, the Asia/Pacific region was the top contributing region due to strong stock
selection. The top contributing stocks in Asia/ Pacific were HSBC Holdings and Broadcom. Stock selection in Euroland was the largest negative detractor to the Fund, with more defensive-oriented holdings in Medtronic, Anheuser-Busch Inbev, Nielsen
HYPOTHETICAL GROWTH OF $10,000
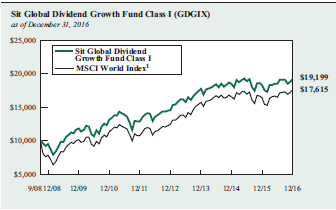
The chart above illustrates the total value of a hypothetical $10,000 investment in the Fund over the past
10 years (or for the life of the Fund if shorter) as compared to the performance of the MSCI World Index. Past performance does not guarantee future results. Returns include the reinvestment of distributions. The chart does not reflect the deduction
of taxes that a shareholder would pay on Fund distributions or the redemption of Fund shares.
1 The MSCI World Index is a free float-adjusted market capitalization weighted index that is designed to measure the equity market performance of developed markets. It is not possible to invest
directly in an index. This is the Fund’s primary index.
Holding, and Veolia Environment having the largest negative impact.
The Fund’s gross dividend (before deduction of Fund expenses) yield is 3.0% and is approximately +50 basis points higher than the 2.5%
yield of the Index. In periods of low absolute returns, the dividend component of the return becomes more significant and this should benefit the dividend paying companies that are the focus of this strategy. The portfolio emphasizes high quality,
dividend paying growth stocks and continues to be well diversified. We believe the portfolio is well positioned to outperform in down markets if financial market volatility pick up, as we believe it will throughout 2017. Dividends rose throughout
2016 and the bulk of the companies (79%) in the Fund increased their dividends. The median dividend increase for the Fund in 2016 was 7.0% versus 2.6% for the Index.
Roger J. Sit Raymond E. Sit Tasha M. Murdoff
Kent L. Johnson Michael J. Stellmacher
Portfolio Managers
|
|
|
|
16 |
|
SIT MUTUAL FUNDS
SEMI-ANNUAL REPORT |
COMPARATIVE RATES OF RETURNS
as of December 31, 2016
|
|
|
|
|
|
|
|
|
|
|
|
|
|
|
|
| |
|
Sit Global |
|
|
| |
|
Dividend |
|
|
| |
|
Growth Fund |
|
MSCI |
| |
|
Class I |
|
Class S |
|
World
Index 1 |
| Six Month |
|
|
|
3.57 |
% |
|
|
|
3.38 |
% |
|
|
|
6.81 |
% |
| One Year |
|
|
|
4.96 |
|
|
|
|
4.71 |
|
|
|
|
7.51 |
|
| Five Year |
|
|
|
8.38 |
|
|
|
|
8.11 |
|
|
|
|
10.41 |
|
| Since Inception |
|
|
|
8.22 |
|
|
|
|
7.95 |
|
|
|
|
7.10 |
|
| (9/30/08) |
|
|
|
|
|
|
|
|
|
|
|
|
|
|
|
Performance figures are historical and do not guarantee future results. Investment returns and principal value will vary, and you may have a
gain or loss when you sell shares. Current performance may be lower or higher than the performance data quoted. Contact the Fund for performance data current to the most recent month-end. Returns include changes in share price as well as
reinvestment of all dividends and capital gains. Returns do not reflect the deduction of the 2% redemption fee imposed if shares are redeemed or exchanged within 30 calendar days from their date of purchase. If imposed, the fee would reduce the
performance quoted. Returns do not reflect the deduction of taxes that a shareholder would pay on Fund distributions or the redemption of Fund shares. Management fees and administrative expenses are included in the Fund’s performance. Returns
for periods greater than one year are compounded average annual rates of return.
1 The MSCI World Index is a free float-adjusted
market capitalization weighted index that is designed to measure the equity market performance of developed markets. It is not possible to invest directly in an index.
PORTFOLIO SUMMARY
|
|
|
|
|
| Class I: |
|
|
|
|
| Net Asset Value 12/31/16: |
|
|
$13.51 Per Share |
|
| Net Asset Value 6/30/16: |
|
|
$13.19 Per Share |
|
| Total Net Assets: |
|
|
$ 22.7 Million |
|
| Class S: |
|
|
|
|
| Net Asset Value 12/31/16: |
|
|
$13.50 Per Share |
|
| Net Asset Value 6/30/16: |
|
|
$13.18 Per Share |
|
| Total Net Assets: |
|
|
$3.1 Million |
|
|
|
| Weighted Average Market Cap: |
|
|
$ 115.4 Billion |
|
TOP 10 HOLDINGS
1. Verizon Communications,
Inc.
2. Microsoft Corp.
3. JPMorgan Chase & Co.
4. Pfizer, Inc.
5. Roche Holding AG
6. Nestle SA
7. Apple, Inc.
8. BCE, Inc.
9. Iberdrola SA
10.
Diageo, PLC, ADR
Based on total net assets as of December 31, 2016. Subject to change.
FUND DIVERSIFICATION
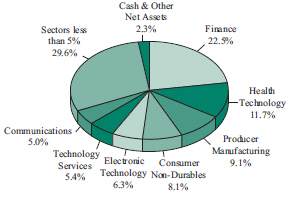
Based on total net assets as of December 31, 2016. Subject to change.
SCHEDULE OF INVESTMENTS (Unaudited)
December 31, 2016
Sit Global Dividend
Growth Fund
|
|
|
|
|
|
|
| |
|
|
|
|
| Quantity |
|
Name of Issuer |
|
Fair Value ($) |
|
| |
|
|
|
| Common Stocks - 97.7% |
|
|
|
|
| Asia - 5.4% |
|
|
|
|
| China/Hong Kong - 1.0% |
|
|
|
|
| 6,475 |
|
HSBC Holdings, PLC, ADR |
|
|
260,165 |
|
|
|
|
|
|
|
|
|
|
| Japan - 2.6% |
|
|
|
|
| 21,000 |
|
Astellas Pharma, Inc. |
|
|
291,340 |
|
| 61,900 |
|
Mitsubishi UFJ Financial Group, Inc., ADR |
|
|
381,304 |
|
|
|
|
|
|
|
|
|
|
|
|
|
|
|
|
672,644 |
|
|
|
|
|
|
|
|
|
|
| Singapore - 1.8% |
|
|
|
|
| 2,525 |
|
Broadcom, Ltd. |
|
|
446,344 |
|
|
|
|
|
|
|
|
|
|
| Europe - 29.5% |
|
|
|
|
| Belgium - 1.4% |
|
|
|
|
| 3,475 |
|
Anheuser-Busch InBev NV, ADR |
|
|
366,404 |
|
|
|
|
|
|
|
|
|
|
| France - 3.0% |
|
|
|
|
| 4,900 |
|
Schlumberger, Ltd. |
|
|
411,355 |
|
| 1,550 |
|
Unibail-Rodamco SE |
|
|
369,374 |
|
|
|
|
|
|
|
|
|
|
|
|
|
|
|
|
780,729 |
|
|
|
|
|
|
|
|
|
|
| Germany - 3.6% |
|
|
|
|
| 16,400 |
|
Allianz SE, ADR |
|
|
270,272 |
|
| 4,200 |
|
Aurelius SE & Co. |
|
|
245,562 |
|
| 3,325 |
|
Siemens AG |
|
|
407,114 |
|
|
|
|
|
|
|
|
|
|
|
|
|
|
|
|
922,948 |
|
|
|
|
|
|
|
|
|
|
| Ireland - 3.1% |
|
|
|
|
| 2,750 |
|
Accenture, PLC |
|
|
322,108 |
|
| 6,900 |
|
Medtronic, PLC |
|
|
491,487 |
|
|
|
|
|
|
|
|
|
|
|
|
|
|
|
|
813,595 |
|
|
|
|
|
|
|
|
|
|
| Netherlands - 5.0% |
|
|
|
|
| 31,900 |
|
ING Groep NV, ADR |
|
|
449,790 |
|
| 4,450 |
|
LyondellBasell Industries NV |
|
|
381,721 |
|
| 28,100 |
|
RELX NV |
|
|
472,640 |
|
|
|
|
|
|
|
|
|
|
|
|
|
|
|
|
1,304,151 |
|
|
|
|
|
|
|
|
|
|
| Spain - 2.0% |
|
|
|
|
| 77,400 |
|
Iberdrola SA |
|
|
506,808 |
|
|
|
|
|
|
|
|
|
|
| Switzerland - 6.8% |
|
|
|
|
| 2,500 |
|
Chubb, Ltd. |
|
|
330,300 |
|
| 7,350 |
|
Nestle SA |
|
|
526,536 |
|
| 2,375 |
|
Roche Holding AG |
|
|
541,387 |
|
| 1,265 |
|
Zurich Insurance Group AG |
|
|
347,647 |
|
|
|
|
|
|
|
|
|
|
|
|
|
|
|
|
1,745,870 |
|
|
|
|
|
|
|
|
| United Kingdom - 4.6% |
|
|
|
|
|
|
|
| 1,900 |
|
Delphi Automotive, PLC |
|
|
127,965 |
|
| 4,825 |
|
Diageo, PLC, ADR |
|
|
501,510 |
|
|
|
|
|
|
|
|
| |
|
|
|
|
| Quantity |
|
Name of Issuer |
|
Fair Value ($) |
|
| |
|
|
|
|
| 72,925 |
|
DS Smith, PLC |
|
|
366,202 |
|
| 4,500 |
|
Nielsen Holdings, PLC |
|
|
188,775 |
|
|
|
|
|
|
|
|
|
|
|
|
|
|
|
|
1,184,452 |
|
|
|
|
|
|
|
|
|
|
| North America - 62.8% |
|
|
|
|
| Bermuda - 1.7% |
|
|
|
|
| 8,900 |
|
Invesco, Ltd. |
|
|
270,026 |
|
| 4,700 |
|
XL Group, Ltd. |
|
|
175,122 |
|
|
|
|
|
|
|
|
|
|
|
|
|
|
|
|
445,148 |
|
|
|
|
|
|
|
|
|
|
| Canada - 2.6% |
|
|
|
|
| 11,725 |
|
BCE, Inc. |
|
|
506,989 |
|
| 4,800 |
|
Suncor Energy, Inc. |
|
|
156,912 |
|
|
|
|
|
|
|
|
|
|
|
|
|
|
|
|
663,901 |
|
|
|
|
|
|
|
|
|
|
| United States - 58.5% |
|
|
|
|
| 2,225 |
|
3M Co. |
|
|
397,318 |
|
| 6,050 |
|
AbbVie, Inc. |
|
|
378,851 |
|
| 3,825 |
|
Allstate Corp. |
|
|
283,509 |
|
| 400 |
|
Alphabet, Inc.-Class A * |
|
|
316,980 |
|
| 4,500 |
|
Apple, Inc. |
|
|
521,190 |
|
| 8,000 |
|
Applied Materials, Inc. |
|
|
258,160 |
|
| 5,300 |
|
Arthur J Gallagher & Co. |
|
|
275,388 |
|
| 15,575 |
|
Brixmor Property Group, Inc. |
|
|
380,341 |
|
| 3,365 |
|
Cardinal Health, Inc. |
|
|
242,179 |
|
| 11,500 |
|
CenterPoint Energy, Inc. |
|
|
283,360 |
|
| 9,075 |
|
Delta Air Lines, Inc. |
|
|
446,399 |
|
| 4,700 |
|
Dow Chemical Co. |
|
|
268,934 |
|
| 8,750 |
|
General Electric Co. |
|
|
276,500 |
|
| 2,625 |
|
Genuine Parts Co. |
|
|
250,792 |
|
| 3,600 |
|
Gilead Sciences, Inc. |
|
|
257,796 |
|
| 3,075 |
|
Home Depot, Inc. |
|
|
412,296 |
|
| 4,100 |
|
Honeywell International, Inc. |
|
|
474,985 |
|
| 10,925 |
|
Intel Corp. |
|
|
396,250 |
|
| 4,450 |
|
International Paper Co. |
|
|
236,117 |
|
| 3,875 |
|
Johnson & Johnson |
|
|
446,439 |
|
| 7,950 |
|
JPMorgan Chase & Co. |
|
|
686,006 |
|
| 20,900 |
|
KeyCorp |
|
|
381,843 |
|
| 2,250 |
|
Kimberly-Clark Corp. |
|
|
256,770 |
|
| 1,365 |
|
Lockheed Martin Corp. |
|
|
341,168 |
|
| 4,600 |
|
Macquarie Infrastructure Corp. |
|
|
375,820 |
|
| 5,300 |
|
Marathon Petroleum Corp. |
|
|
266,855 |
|
| 12,325 |
|
Microsoft Corp. |
|
|
765,876 |
|
| 6,200 |
|
Occidental Petroleum Corp. |
|
|
441,626 |
|
| 4,275 |
|
PepsiCo, Inc. |
|
|
447,293 |
|
| 19,200 |
|
Pfizer, Inc. |
|
|
623,616 |
|
| 3,025 |
|
Prudential Financial, Inc. |
|
|
314,782 |
|
| 1,200 |
|
Snap-On, Inc. |
|
|
205,524 |
|
| 7,075 |
|
Starbucks Corp. |
|
|
392,804 |
|
| 3,300 |
|
Target Corp. |
|
|
238,359 |
|
| 5,150 |
|
TJX Cos., Inc. |
|
|
386,920 |
|
| 4,325 |
|
Union Pacific Corp. |
|
|
448,416 |
|
|
|
|
| See accompanying notes to financial statements. |
|
|
|
18 |
|
SIT MUTUAL FUNDS
SEMI-ANNUAL REPORT |
|
|
|
|
|
|
|
| |
|
|
|
|
| Quantity |
|
Name of Issuer |
|
Fair Value ($) |
|
| |
|
|
|
|
| 2,100 |
|
United Parcel Service, Inc. |
|
|
240,744 |
|
| 3,000 |
|
United Technologies Corp. |
|
|
328,860 |
|
| 14,875 |
|
Verizon Communications, Inc. |
|
|
794,028 |
|
| 6,300 |
|
WEC Energy Group, Inc. |
|
|
369,495 |
|
|
|
|
|
|
|
|
|
|
|
|
|
|
|
|
15,110,589 |
|
|
|
|
|
|
|
|
|
|
| Total Common Stocks
(cost: $23,015,551) |
|
|
25,223,748 |
|
|
|
|
|
|
|
|
|
|
| Short-Term Securities - 2.3% |
|
|
|
|
| 580,438 |
|
Fidelity Instl. Money Mkt. Govt. Fund, 0.39% |
|
| Total Short-Term Securities
(cost: $580,438) |
|
|
580,438 |
|
|
|
|
|
|
|
|
|
|
| Total Investments in Securities - 100.0%
(cost: $23,595,989) |
|
|
25,804,186 |
|
| Other Assets and Liabilities, net - 0.0% |
|
|
8,251 |
|
|
|
|
|
|
|
|
|
|
| Total Net Assets - 100.0% |
|
|
$25,812,437 |
|
|
|
|
|
|
|
|
| * |
Non-income producing security. |
Numeric footnotes not disclosed are not applicable to
this Schedule of Investments
ADR — American Depositary Receipt
PLC — Public Limited Company
|
|
|
| See accompanying notes to financial statements. |
|
|
| DECEMBER 31, 2016 |
|
19 |
SCHEDULE OF INVESTMENTS (Unaudited)
December 31, 2016
Sit Global Dividend
Growth Fund (Continued)
A summary of the levels for the Fund’s investments as of December 31, 2016 is as follows (see Note 2 - significant accounting
policies in the notes to financial statements):
|
|
|
|
|
|
|
|
|
|
|
|
|
|
|
|
|
| |
|
Investment in Securities |
|
| |
|
Level 1
Quoted
Price ($) |
|
|
Level 2
Other significant
observable inputs ($) |
|
|
Level 3
Significant
unobservable inputs ($) |
|
|
Total ($) |
|
| Common Stocks |
|
|
|
|
|
|
|
|
|
|
|
|
|
|
|
|
| Belgium |
|
|
366,404 |
|
|
|
— |
|
|
|
— |
|
|
|
366,404 |
|
| Bermuda |
|
|
445,148 |
|
|
|
— |
|
|
|
— |
|
|
|
445,148 |
|
| Canada |
|
|
663,901 |
|
|
|
— |
|
|
|
— |
|
|
|
663,901 |
|
| China/Hong Kong |
|
|
260,165 |
|
|
|
— |
|
|
|
— |
|
|
|
260,165 |
|
| France |
|
|
411,355 |
|
|
|
369,374 |
|
|
|
— |
|
|
|
780,729 |
|
| Germany |
|
|
270,272 |
|
|
|
652,676 |
|
|
|
— |
|
|
|
922,948 |
|
| Ireland |
|
|
813,595 |
|
|
|
— |
|
|
|
— |
|
|
|
813,595 |
|
| Japan |
|
|
381,304 |
|
|
|
291,340 |
|
|
|
— |
|
|
|
672,644 |
|
| Netherlands |
|
|
831,511 |
|
|
|
472,640 |
|
|
|
— |
|
|
|
1,304,151 |
|
| Singapore |
|
|
446,344 |
|
|
|
— |
|
|
|
— |
|
|
|
446,344 |
|
| Spain |
|
|
— |
|
|
|
506,808 |
|
|
|
— |
|
|
|
506,808 |
|
| Switzerland |
|
|
330,300 |
|
|
|
1,415,570 |
|
|
|
— |
|
|
|
1,745,870 |
|
| United Kingdom |
|
|
818,250 |
|
|
|
366,202 |
|
|
|
— |
|
|
|
1,184,452 |
|
| United States |
|
|
15,110,589 |
|
|
|
— |
|
|
|
— |
|
|
|
15,110,589 |
|
| Short-Term Securities |
|
|
580,438 |
|
|
|
— |
|
|
|
— |
|
|
|
580,438 |
|
|
|
|
|
|
| Total: |
|
|
21,729,576 |
|
|
|
4,074,610 |
|
|
|
— |
|
|
|
25,804,186 |
|
The Fund adjusts the closing price of foreign equity securities by applying a systematic process for events
occurring after the close of the foreign exchanges. At each reporting period, this process is applied for all foreign securities and therefore all foreign securities are classified as level 2. There are no transfers between level 1 and level 2
between reporting periods as a result of applying this process. Level 1 securities of foreign issuers are primarily American Depositary Receipts (ADRs), Public Limited Companies (PLCs) or Global Depositary Receipts (GDRs). There were no transfers
into or out of level 3 during the reporting period.
|
|
|
| See accompanying notes to financial statements. |
|
|
|
20 |
|
SIT MUTUAL FUNDS
SEMI-ANNUAL REPORT |
[This page intentionally left blank.]
|
| |
|
Sit Large Cap Growth Fund |
OBJECTIVE & STRATEGY
The objective of the Sit Large Cap Growth Fund is to maximize long-term capital appreciation. The Fund pursues this objective by investing at
least 80% of its net assets in the common stocks of domestic growth companies with capitalizations of $5 billion or more at the time of purchase.
The The Sit Large Cap Growth Fund’s six-month return was +6.04%, compared to the +5.64%
return for the Russell 1000® Growth Index. The S&P 500® Index return for the period was +7.82%.
Equities surged ahead
following the U.S. presidential election, as investors became optimistic that pro-growth policies will lift economic growth out of the subdued range experienced over the past several years. While headwinds (e.g., stronger dollar, higher rates) and
policy initiatives are a concern, we believe the combined impact of tax cuts, fiscal spending and deregulation will jump-start growth and eventually lead to higher corporate earnings. Recognizing both the upside and downside potential in this
environment, we have adopted a “barbell” strategy within the portfolio, increasing exposure to sectors most leveraged to positive policy changes (e.g., financials, transports), while maintaining a high quality bias in more defensive groups
(e.g., health care) to provide some downside support if markets are disappointed with progress on proposed initiatives. In general, our quality bias has not been rewarded in recent years, as unprecedented monetary policy has broadly lifted markets.
We believe a different, and potentially more volatile, environment lies ahead in which quality will be rewarded. The heaviest-weighted sectors within the Fund are technology services, electronic technology and health technology. We believe these
sectors are attractively valued relative to their growth prospects. Conversely, the Fund has limited exposure to slow growth groups, including utilities, industrial services and consumer durables.
The Fund outperformed the Russell 1000® Growth Index over the past six months. Relative performance was positively impacted by stock
selection in finance and transportation. From a sector standpoint, overweighting transportation and electronic technology, while underweighting consumer non-durables, added to relative returns. Goldman Sachs Group, Applied Materials, JP Morgan
Chase, Synchrony Financial and Alaska Air Group were among the standout individual stock performers over the past six months. On the negative
HYPOTHETICAL GROWTH OF $10,000
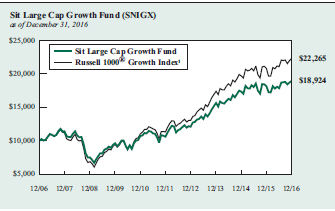
The chart above illustrates the total value of a hypothetical $10,000 investment in the Fund over the past
10 years as compared to the performance of the Russell 1000® Growth Index. Past performance does not guarantee future results. Returns include the reinvestment of distributions. The chart does not reflect the deduction of taxes that a
shareholder would pay on Fund distributions or the redemption of Fund shares.
1 Russell 1000® Growth Index is an unmanaged index
that measures the performance of those Russell 1000 Index companies with higher price-to-book ratios and higher forecasted growth values. It is not possible to invest directly in an index. This is the Fund’s primary index.
side, stock selection negatively
impacted returns in the health technology, commercial services and producer manufacturing sectors.
We remain enthusiastic about the
long-term outlook for companies held in the Fund, based on attractive valuations and sustainable earnings growth potential.
Roger J. Sit
Ronald D. Sit
Michael J. Stellmacher
Portfolio Managers
|
|
|
|
22 |
|
SIT MUTUAL FUNDS
SEMI-ANNUAL REPORT |
COMPARATIVE RATES OF RETURNS
as of December 31, 2016
|
|
|
|
|
|
|
|
|
|
|
|
|
|
|
|
| |
|
|
|
Russell |
|
|
| |
|
Sit Large |
|
1000® |
|
Russell |
| |
|
Cap Growth |
|
Growth |
|
1000® |
| |
|
Fund |
|
Index 1 |
|
Index 2 |
| Six Month |
|
|
|
6.04 |
% |
|
|
|
5.64 |
% |
|
|
|
8.01% |
|
| One Year |
|
|
|
4.36 |
|
|
|
|
7.08 |
|
|
|
|
12.05 |
|
| Five Year |
|
|
|
12.24 |
|
|
|
|
14.50 |
|
|
|
|
14.69 |
|
| Ten Year |
|
|
|
6.59 |
|
|
|
|
8.33 |
|
|
|
|
7.08 |
|
| Since Inception 3
(9/2/82) |
|
|
|
9.73 |
|
|
|
|
10.87 |
|
|
|
|
11.66 |
|
Performance figures are historical and do not guarantee future results. Investment returns and principal value will vary, and you may have a
gain or loss when you sell shares. Current performance may be lower or higher than the performance data quoted. Contact the Fund for performance data current to the most recent month-end. Returns include changes in share price as well as
reinvestment of all dividends and capital gains. Returns do not reflect the deduction of the 2% redemption fee imposed if shares are redeemed or exchanged within 30 calendar days from their date of purchase. If imposed, the fee would reduce the
performance quoted. Returns do not reflect the deduction of taxes that a shareholder would pay on Fund distributions or the redemption of Fund shares. Management fees and administrative expenses are included in the Fund’s performance. Returns
for periods greater than one year are compounded average annual rates of return.
1 Russell 1000® Growth Index is an unmanaged
index that measures the performance of those Russell 1000 Index companies with higher price-to-book ratios and higher forecasted growth values. It is not possible to invest directly in an index.
2 Russell 1000® Index is an unmanaged index that measures the performance of approximately 1,000 of the largest U.S. companies by market
capitalization.
3 On 6/6/93, the Fund’s investment objective changed to allow for a portfolio of 100% stocks. Prior to that
time, the portfolio was required to contain no more than 80% stocks.
PORTFOLIO SUMMARY
|
|
|
| Net Asset Value 12/31/16: |
|
$35.49 Per Share |
| Net Asset Value 6/30/16: |
|
$36.02 Per Share |
| Total Net Assets: |
|
$111.9 Million |
| Weighted Average Market Cap: |
|
$151.3 Billion |
TOP 10 HOLDINGS
1. Alphabet, Inc.
2. Apple, Inc.
3. Microsoft Corp.
4. Facebook, Inc.
5. Visa, Inc.
6. PepsiCo, Inc.
7. Adobe Systems, Inc.
8. Broadcom, Ltd.
9. Home Depot, Inc.
9. Verizon Communications, Inc.
Based on total net assets as of December 31,
2016. Subject to change.
FUND DIVERSIFICATION
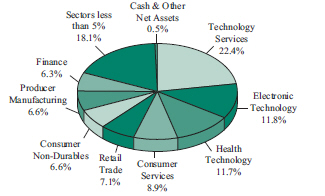
Based on total net assets as of December 31, 2016. Subject to change.
SCHEDULE OF INVESTMENTS (Unaudited)
December 31, 2016
Sit Large Cap Growth
Fund
|
|
|
|
|
|
|
| |
|
|
|
|
| Quantity |
|
Name of Issuer |
|
Fair Value ($) |
|
| |
|
|
| Common Stocks - 99.5% |
|
| Commercial Services - 1.8% |
|
| 9,300 |
|
Equifax, Inc. |
|
|
1,099,539 |
|
| 21,400 |
|
Nielsen Holdings, PLC |
|
|
897,730 |
|
|
|
|
|
|
|
|
|
|
|
|
|
|
|
|
1,997,269 |
|
|
|
|
|
|
|
|
|
|
| Communications - 2.8% |
|
|
|
|
| 5,900 |
|
SBA Communications Corp. * |
|
|
609,234 |
|
| 46,775 |
|
Verizon Communications, Inc. |
|
|
2,496,850 |
|
|
|
|
|
|
|
|
|
|
|
|
|
|
|
|
3,106,084 |
|
|
|
|
|
|
|
|
|
|
| Consumer Durables - 1.1% |
|
|
|
|
| 10,300 |
|
Electronic Arts, Inc. * |
|
|
811,228 |
|
| 4,200 |
|
Genuine Parts Co. |
|
|
401,268 |
|
|
|
|
|
|
|
|
|
|
|
|
|
|
|
|
1,212,496 |
|
|
|
|
|
|
|
|
|
|
| Consumer Non-Durables - 6.6% |
|
|
|
|
| 19,775 |
|
Estee Lauder Cos., Inc.-Class A |
|
|
1,512,590 |
|
| 31,450 |
|
NIKE, Inc. |
|
|
1,598,604 |
|
| 26,300 |
|
PepsiCo, Inc. |
|
|
2,751,769 |
|
| 17,600 |
|
Procter & Gamble Co. |
|
|
1,479,808 |
|
|
|
|
|
|
|
|
|
|
|
|
|
|
|
|
7,342,771 |
|
|
|
|
|
|
|
|
|
|
| Consumer Services - 8.9% |
|
|
|
|
| 18,100 |
|
CBS Corp. |
|
|
1,151,522 |
|
| 13,900 |
|
Marriott International, Inc. |
|
|
1,149,252 |
|
| 41,900 |
|
Starbucks Corp. |
|
|
2,326,288 |
|
| 14,575 |
|
Time Warner, Inc. |
|
|
1,406,925 |
|
| 40,100 |
|
Visa, Inc. |
|
|
3,128,602 |
|
| 7,600 |
|
Walt Disney Co. |
|
|
792,072 |
|
|
|
|
|
|
|
|
|
|
|
|
|
|
|
|
9,954,661 |
|
|
|
|
|
|
|
|
|
|
| Electronic Technology - 11.8% |
|
|
|
|
| 49,875 |
|
Apple, Inc. |
|
|
5,776,522 |
|
| 69,500 |
|
Applied Materials, Inc. |
|
|
2,242,765 |
|
| 14,900 |
|
Broadcom, Ltd. |
|
|
2,633,873 |
|
| 28,100 |
|
Ciena Corp. * |
|
|
685,921 |
|
| 34,600 |
|
Intel Corp. |
|
|
1,254,942 |
|
| 12,400 |
|
MACOM Technology Solutions Holdings, Inc.
* |
|
|
573,872 |
|
|
|
|
|
|
|
|
|
|
|
|
|
|
|
|
13,167,895 |
|
|
|
|
|
|
|
|
|
|
| Energy Minerals - 2.0% |
|
|
|
|
| 3,900 |
|
Chevron Corp. |
|
|
459,030 |
|
| 18,600 |
|
Marathon Petroleum Corp. |
|
|
936,510 |
|
| 5,400 |
|
Occidental Petroleum Corp. |
|
|
384,642 |
|
| 2,300 |
|
Pioneer Natural Resources Co. |
|
|
414,161 |
|
|
|
|
|
|
|
|
|
|
|
|
|
|
|
|
2,194,343 |
|
|
|
|
|
|
|
|
|
|
| Finance - 6.3% |
|
|
|
|
| 28,600 |
|
Brixmor Property Group, Inc. |
|
|
698,412 |
|
| 5,450 |
|
Chubb, Ltd. |
|
|
720,054 |
|
| 5,900 |
|
Goldman Sachs Group, Inc. |
|
|
1,412,755 |
|
| 20,600 |
|
JPMorgan Chase & Co. |
|
|
1,777,574 |
|
| 24,200 |
|
Legg Mason, Inc. |
|
|
723,822 |
|
|
|
|
|
|
|
|
| |
|
|
|
|
| Quantity |
|
Name of Issuer |
|
Fair Value ($) |
|
| |
|
|
|
|
| 40,125 |
|
Synchrony Financial |
|
|
1,455,334 |
|
| 3,900 |
|
T Rowe Price Group, Inc. |
|
|
293,514 |
|
|
|
|
|
|
|
|
|
|
|
|
|
|
|
|
7,081,465 |
|
|
|
|
|
|
|
|
|
|
| Health Services - 2.7% |
|
|
|
|
| 14,000 |
|
Centene Corp. * |
|
|
791,140 |
|
| 3,500 |
|
Humana, Inc. |
|
|
714,105 |
|
| 9,825 |
|
UnitedHealth Group, Inc. |
|
|
1,572,393 |
|
|
|
|
|
|
|
|
|
|
|
|
|
|
|
|
3,077,638 |
|
|
|
|
|
|
|
|
|
|
| Health Technology - 11.7% |
|
|
|
|
| 20,400 |
|
AbbVie, Inc. |
|
|
1,277,448 |
|
| 4,700 |
|
Alexion Pharmaceuticals, Inc. * |
|
|
575,045 |
|
| 5,175 |
|
Allergan, PLC * |
|
|
1,086,802 |
|
| 900 |
|
Biogen, Inc. * |
|
|
255,222 |
|
| 11,475 |
|
Celgene Corp. * |
|
|
1,328,231 |
|
| 19,700 |
|
Gilead Sciences, Inc. |
|
|
1,410,717 |
|
| 15,300 |
|
Johnson & Johnson |
|
|
1,762,713 |
|
| 31,000 |
|
Medtronic, PLC |
|
|
2,208,130 |
|
| 42,000 |
|
Pfizer, Inc. |
|
|
1,364,160 |
|
| 7,500 |
|
Thermo Fisher Scientific, Inc. |
|
|
1,058,250 |
|
| 7,925 |
|
Zimmer Holdings, Inc. |
|
|
817,860 |
|
|
|
|
|
|
|
|
|
|
|
|
|
|
|
|
13,144,578 |
|
|
|
|
|
|
|
|
|
|
| Industrial Services - 0.7% |
|
|
|
|
| 9,100 |
|
Schlumberger, Ltd. |
|
|
763,945 |
|
|
|
|
|
|
|
|
|
|
| Process Industries - 1.8% |
|
|
|
|
| 17,300 |
|
Ecolab, Inc. |
|
|
2,027,906 |
|
|
|
|
|
|
|
|
|
|
| Producer Manufacturing - 6.6% |
|
|
|
|
| 8,850 |
|
3M Co. |
|
|
1,580,344 |
|
| 3,700 |
|
Danaher Corp. |
|
|
288,008 |
|
| 21,800 |
|
General Electric Co. |
|
|
688,880 |
|
| 14,425 |
|
Honeywell International, Inc. |
|
|
1,671,136 |
|
| 13,500 |
|
Raytheon Co. |
|
|
1,917,000 |
|
| 11,600 |
|
United Technologies Corp. |
|
|
1,271,592 |
|
|
|
|
|
|
|
|
|
|
|
|
|
|
|
|
7,416,960 |
|
|
|
|
|
|
|
|
|
|
| Retail Trade - 7.1% |
|
|
|
|
| 1,025 |
|
Amazon.com, Inc. * |
|
|
768,617 |
|
| 12,475 |
|
CVS Health Corp. |
|
|
984,402 |
|
| 18,725 |
|
Home Depot, Inc. |
|
|
2,510,648 |
|
| 16,100 |
|
Target Corp. |
|
|
1,162,903 |
|
| 24,600 |
|
TJX Cos., Inc. |
|
|
1,848,198 |
|
| 2,500 |
|
Ulta Salon Cosmetics & Fragrance, Inc.
* |
|
|
637,350 |
|
|
|
|
|
|
|
|
|
|
|
|
|
|
|
|
7,912,118 |
|
|
|
|
|
|
|
|
|
|
| Technology Services - 22.4% |
|
|
|
|
| 15,075 |
|
Accenture, PLC |
|
|
1,765,735 |
|
| 26,100 |
|
Adobe Systems, Inc. * |
|
|
2,686,995 |
|
| 3,950 |
|
Alphabet, Inc.-Class A * |
|
|
3,130,177 |
|
| 5,966 |
|
Alphabet, Inc.-Class C * |
|
|
4,604,678 |
|
| 10,800 |
|
ANSYS, Inc. * |
|
|
998,892 |
|
|
|
|
| See accompanying notes to financial statements. |
|
|
|
24 |
|
SIT MUTUAL FUNDS
SEMI-ANNUAL REPORT |
|
|
|
|
|
|
|
| |
|
|
|
|
| Quantity |
|
Name of Issuer |
|
Fair Value ($) |
|
| |
|
|
|
|
| 28,600 |
|
Cognizant Technology Solutions Corp.
* |
|
|
1,602,458 |
|
| 27,800 |
|
Facebook, Inc. * |
|
|
3,198,390 |
|
| 70,600 |
|
Microsoft Corp. |
|
|
4,387,084 |
|
| 21,500 |
|
PayPal Holdings, Inc. |
|
|
848,605 |
|
| 1,275 |
|
priceline.com, Inc. * |
|
|
1,869,226 |
|
|
|
|
|
|
|
|
|
|
|
|
|
|
|
|
25,092,240 |
|
|
|
|
|
|
|
|
|
|
| Transportation - 4.7% |
|
|
|
|
| 11,900 |
|
Alaska Air Group, Inc. |
|
|
1,055,887 |
|
| 21,615 |
|
Delta Air Lines, Inc. |
|
|
1,063,242 |
|
| 6,900 |
|
FedEx Corp. |
|
|
1,284,780 |
|
| 9,800 |
|
Union Pacific Corp. |
|
|
1,016,064 |
|
| 7,000 |
|
United Parcel Service, Inc. |
|
|
802,480 |
|
|
|
|
|
|
|
|
|
|
|
|
|
|
|
|
5,222,453 |
|
|
|
|
|
|
|
|
|
|
| Utilities - 0.5% |
|
|
|
|
| 5,000 |
|
NextEra Energy, Inc. |
|
|
597,300 |
|
|
|
|
|
|
|
|
|
|
| Total Common Stocks
(cost: $71,721,275) |
|
|
111,312,122 |
|
|
|
|
|
|
|
|
|
|
|
|
|
|
|
| |
|
|
|
|
| Quantity |
|
Name of Issuer |
|
Fair Value ($) |
|
| |
|
|
|
| Short-Term Securities - 0.7% |
|
|
|
|
| 775,998 |
|
Fidelity Instl. Money Mkt. Govt. Fund, 0.39% |
|
|
|
|
|
|
| Total Short-Term Securities
(cost: $775,998) |
|
|
775,998 |
|
|
|
|
|
|
|
|
|
|
| Total Investments in Securities - 100.2%
(cost: $72,497,273) |
|
|
112,088,120 |
|
| Other Assets and Liabilities, net - (0.2%) |
|
|
(174,421 |
) |
|
|
|
|
|
|
|
|
|
| Total Net Assets - 100.0% |
|
|
$111,913,699 |
|
|
|
|
|
|
|
|
| * |
Non-income producing security. |
Numeric footnotes not disclosed are not applicable to
this Schedule of Investments.
PLC — Public Limited Company
A summary of the levels
for the Fund’s investments as of December 31, 2016 is as follows (see Note 2 - significant accounting policies in the notes to financial statements):
|
|
|
|
|
|
|
|
|
|
|
|
|
| |
|
Investment in Securities |
|
| |
|
Level 1
Quoted
Price ($) |
|
|
Level 2
Other significant
observable inputs ($) |
|
Level 3
Significant
unobservable inputs ($) |
|
Total ($) |
|
| Common Stocks ** |
|
|
111,312,122 |
|
|
— |
|
— |
|
|
111,312,122 |
|
| Short-Term Securities |
|
|
775,998 |
|
|
— |
|
— |
|
|
775,998 |
|
|
|
|
|
|
| Total: |
|
|
112,088,120 |
|
|
— |
|
— |
|
|
112,088,120 |
|
| ** |
For equity securities categorized in a single level, refer to the Schedule of Investments for further breakdown. |
For the reporting period, there were no transfers between levels 1, 2 and 3.
|
|
|
| See accompanying notes to financial statements. |
|
|
| DECEMBER 31, 2016 |
|
25 |
|
| |
|
Sit ESG Growth Fund - Class I and Class S |
OBJECTIVE & STRATEGY
The objective of the Sit ESG Growth Fund is to maximize long-term capital appreciation. The Fund seeks to achieve its objectives by
investing, under normal market conditions, at least 80% of its net assets in companies that the Adviser believes have strong environmental, social and corporate governance (ESG) practices at the time of purchase. The Fund invests in common stocks of
U.S. and foreign companies, primarily of large to medium capitalizations (companies with market capitalization in excess of $2 billion).
The Sit ESG Growth Fund Class I generated a total return of +2.01% in the second half of
calendar 2016 compared to the MSCI World Index return of +6.81%. Just over 70% of the underperformance relative to the Index is attributable to an average cash balance of 17.6% over the six-month period. While the cash balance remained elevated
during the first three months of the Fund’s inception as we opportunistically purchased stocks in the uncertain market environment (i.e., Brexit, U.S. political elections), the cash balance is currently at a more normalized level of roughly 2%.
Global equities performed well following the U.S. presidential election as investors became optimistic that pro-growth policies would lift
economic growth out of the subdued range experienced over the past several years. While headwinds (i.e., stronger U.S. dollar and higher rates) policy initiatives are a concern, we believe the combined impact of tax cuts, fiscal spending, and
deregulation will jump start growth and eventually lead to higher corporate earnings, particularly in the U.S. Recognizing both the upside and downside potential in this environment, we have adopted a “barbell” strategy within the
portfolio, increasing exposure to sectors (i.e., financials and transports) most levered to policy change while maintaining a high quality bias in more defensive groups (i.e., health care) provides some downside support if markets are disappointed
with progress on proposed initiatives.
Elsewhere, we believe the performance of European equities will remain choppy in response to both
political and global macroeconomic events. However, investors will likely begin to anticipate diminished political risk heading into 2018 and the potential for improved fiscal/corporate spending, implying a solid underlying bid for European stocks
as we move through the year. In Japan, the key concern remains the ability of “Abenomics” to overcome the substantial structural challenges of a declining population, rigid labor market, and elevated debt levels.
The industries contributing most favorably to relative performance were transportation (Delta Airlines and FedEx), insurance (Prudential
Financial and Zurich Insurance) and health care equipment & services (Humana and UnitedHealth Group). Conversely, cash was the largest detractor, followed by the technology hardware & equipment (Ingenico) and food,
beverage & tobacco (Coca-Cola
HYPOTHETICAL GROWTH OF $10,000
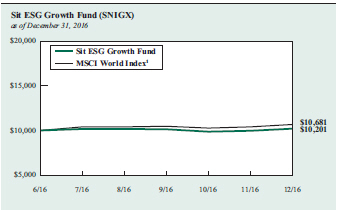
The chart above illustrates the total value of a hypothetical $10,000 investment in the Fund over the past
10 years (or for the life of the Fund if shorter) as compared to the performance of the MSCI World Index. Past performance does not guarantee future results. Returns include the reinvestment of distributions. The chart does not reflect the deduction
of taxes that a shareholder would pay on Fund distributions or the redemption of Fund shares.
1 The MSCI World Index is a free
float-adjusted market capitalization weighted index that is designed to measure the equity market performance of developed markets. It is not possible to invest directly in an index. This is the Fund’s primary index
European Partners, Anheuser-Busch Inbev, Nestle and
Ajinomoto) industries.
The focus of the Sit ESG Fund is to invest at least 80% of the assets in companies that have strong ESG
(environmental, social and corporate governance) practices. At of the end calendar 2016, the Fund’s Sustainalytics ESG percentile of 86% was well ahead of the Index at 70%. The Fund has a High Morningstar Sustainability Ranking and is ranked in
the top 1% in the Large Growth category. We remain positive about the long-term outlook for companies held in the Fund based on attractive valuations and sustainable earnings growth potential.
Roger J. Sit
Ronald D. Sit
Michael J. Stellmacher
Portfolio Managers
|
|
|
|
26 |
|
SIT MUTUAL FUNDS
SEMI-ANNUAL REPORT |
COMPARATIVE RATES OF RETURNS
as of December 31, 2016
|
|
|
|
|
|
|
|
|
|
|
|
|
|
|
|
| |
|
|
|
|
|
World |
| |
|
Class I |
|
Class S |
|
Index 1 |
| Since Inception
(6/30/16) |
|
|
|
2.01 |
% |
|
|
|
1.88 |
% |
|
|
|
6.81 |
% |
Performance figures are historical and do not guarantee future results. Investment returns and principal value will vary, and you may have a
gain or loss when you sell shares. Current performance may be lower or higher than the performance data quoted. Contact the Fund for performance data current to the most recent month-end. Returns include changes in share price as well as
reinvestment of all dividends and capital gains. Returns do not reflect the deduction of the 2% redemption fee imposed if shares are redeemed or exchanged within 30 calendar days from their date of purchase. If imposed, the fee would reduce the
performance quoted. Returns do not reflect the deduction of taxes that a shareholder would pay on Fund distributions or the redemption of Fund shares. Management fees and administrative expenses are included in the Fund’s performance. Returns
for periods greater than one year are compounded average annual rates of return.
1 The MSCI World Index is a free float-adjusted
market capitalization weighted index that is designed to measure the equity market performance of developed markets. It is not possible to invest directly in an index.
PORTFOLIO SUMMARY
|
|
|
|
|
| Class I: |
|
|
|
|
| Net Asset Value 12/31/16: |
|
|
$10.18 Per Share |
|
| Net Asset Value 6/30/162: |
|
|
$10.00 Per Share |
|
| Total Net Assets: |
|
|
$2.1 Million |
|
| Class S: |
|
|
|
|
| Net Asset Value 12/31/16: |
|
|
$10.18 Per Share |
|
| Net Asset Value 6/30/162: |
|
|
$10.00 Per Share |
|
| Total Net Assets: |
|
|
$2.1 Million |
|
|
|
| Weighted Average Market Cap: |
|
|
$105.8 Billion |
|
2 Inception date of the Fund.
TOP 10 HOLDINGS
1. Johnson &
Johnson
2. Pfizer, Inc.
3. Iberdrola SA, ADR
4. Delta Air Lines, Inc.
5. Verizon Communications, Inc.
6. Ingersoll-Rand, PLC
7. ING Groep NV, ADR
8. Occidental Petroleum Corp.
9. Marriott International, Inc.
10. Goldman Sachs Group, Inc.
Based on total net assets as of December 31,
2016. Subject to change.
FUND DIVERSIFICATION
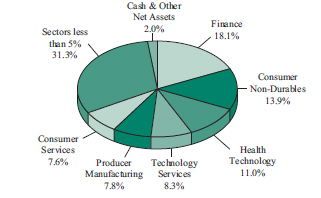
Based on total net assets as of December 31, 2016. Subject to change.
SCHEDULE OF INVESTMENTS (Unaudited)
December 31, 2016
Sit ESG Growth Fund
|
|
|
|
|
|
|
| |
|
|
|
|
| Quantity |
|
Name of Issuer |
|
Fair Value ($) |
|
| |
|
|
| Common Stocks - 98.0% |
|
| Asia - 6.8% |
|
|
|
|
| China/Hong Kong - 1.3% |
|
|
|
|
| 1,300 |
|
HSBC Holdings, PLC, ADR |
|
|
52,234 |
|
|
|
|
|
|
|
|
|
| Japan - 5.5% |
|
| 2,900 |
|
Ajinomoto Co., Inc. |
|
|
58,355 |
|
| 2,400 |
|
Asics Corp. |
|
|
47,827 |
|
| 5,300 |
|
Astellas Pharma, Inc. |
|
|
73,529 |
|
| 8,325 |
|
Mitsubishi UFJ Financial Group, Inc., ADR |
|
|
51,282 |
|
|
|
|
|
|
|
|
|
|
|
|
|
|
|
|
230,993 |
|
|
|
|
|
|
|
|
|
| Europe - 29.0% |
|
| Belgium - 1.3% |
|
| 500 |
|
Anheuser-Busch InBev NV, ADR |
|
|
52,720 |
|
|
|
|
|
|
|
|
|
| France - 3.8% |
|
| 685 |
|
Ingenico Group SA |
|
|
54,653 |
|
| 550 |
|
Schlumberger, Ltd. |
|
|
46,172 |
|
| 2,500 |
|
Unibail-Rodamco SE, ADR |
|
|
59,425 |
|
|
|
|
|
|
|
|
|
|
|
|
|
|
|
|
160,250 |
|
|
|
|
|
|
|
|
|
| Germany - 2.9% |
|
| 3,200 |
|
Allianz SE, ADR |
|
|
52,736 |
|
| 550 |
|
Siemens AG, ADR |
|
|
67,331 |
|
|
|
|
|
|
|
|
|
|
|
|
|
|
|
|
120,067 |
|
|
|
|
|
|
|
|
|
| Ireland - 5.1% |
|
| 510 |
|
Accenture, PLC |
|
|
59,736 |
|
| 1,250 |
|
Ingersoll-Rand, PLC |
|
|
93,800 |
|
| 825 |
|
Medtronic, PLC |
|
|
58,765 |
|
|
|
|
|
|
|
|
|
|
|
|
|
|
|
|
212,301 |
|
|
|
|
|
|
|
|
|
| Netherlands - 4.1% |
|
| 6,575 |
|
ING Groep NV, ADR |
|
|
92,708 |
|
| 4,700 |
|
RELX NV, ADR |
|
|
78,772 |
|
|
|
|
|
|
|
|
|
|
|
|
|
|
|
|
171,480 |
|
|
|
|
|
|
|
|
|
| Spain - 4.3% |
|
| 3,850 |
|
Iberdrola SA, ADR |
|
|
100,986 |
|
| 2,250 |
|
Industria de Diseno Textil SA |
|
|
76,649 |
|
|
|
|
|
|
|
|
|
|
|
|
|
|
|
|
177,635 |
|
|
|
|
|
|
|
|
|
| Switzerland - 4.4% |
|
| 900 |
|
Nestle SA, ADR |
|
|
64,566 |
|
| 1,500 |
|
Roche Holding AG, ADR |
|
|
42,795 |
|
| 2,725 |
|
Zurich Insurance Group AG, ADR |
|
|
75,128 |
|
|
|
|
|
|
|
|
|
|
|
|
|
182,489 |
|
|
|
|
|
|
|
|
|
| United Kingdom - 3.1% |
|
| 2,100 |
|
Coca-Cola European Partners, PLC |
|
|
65,940 |
|
| 600 |
|
Diageo, PLC, ADR |
|
|
62,364 |
|
|
|
|
|
|
|
|
|
|
|
|
|
|
|
|
128,304 |
|
|
|
|
|
|
|
|
|
|
|
|
|
|
|
| |
|
|
|
|
| Quantity |
|
Name of Issuer |
|
Fair Value ($) |
|
| |
|
|
| North America - 62.2% |
|
| Canada - 5.3% |
|
| 1,925 |
|
BCE, Inc. |
|
|
83,237 |
|
| 2,200 |
|
Gildan Activewear, Inc. |
|
|
55,814 |
|
| 2,475 |
|
Suncor Energy, Inc. |
|
|
80,908 |
|
|
|
|
|
|
|
|
|
|
|
|
|
|
|
|
219,959 |
|
|
|
|
|
|
|
|
|
| United States - 56.9% |
|
| 475 |
|
3M Co. |
|
|
84,821 |
|
| 950 |
|
AbbVie, Inc. |
|
|
59,489 |
|
| 500 |
|
Adobe Systems, Inc. * |
|
|
51,475 |
|
| 1,050 |
|
Allstate Corp. |
|
|
77,826 |
|
| 85 |
|
Alphabet, Inc.-Class A * |
|
|
67,358 |
|
| 750 |
|
Cognizant Technology Solutions Corp.
* |
|
|
42,022 |
|
| 2,050 |
|
Delta Air Lines, Inc. |
|
|
100,840 |
|
| 1,000 |
|
Dow Chemical Co. |
|
|
57,220 |
|
| 425 |
|
Ecolab, Inc. |
|
|
49,818 |
|
| 340 |
|
Facebook, Inc. * |
|
|
39,117 |
|
| 400 |
|
FedEx Corp. |
|
|
74,480 |
|
| 2,500 |
|
General Electric Co. |
|
|
79,000 |
|
| 375 |
|
Goldman Sachs Group, Inc. |
|
|
89,794 |
|
| 665 |
|
Home Depot, Inc. |
|
|
89,163 |
|
| 400 |
|
Humana, Inc. |
|
|
81,612 |
|
| 2,350 |
|
Intel Corp. |
|
|
85,234 |
|
| 975 |
|
Johnson & Johnson |
|
|
112,330 |
|
| 800 |
|
JPMorgan Chase & Co. |
|
|
69,032 |
|
| 350 |
|
Kimberly-Clark Corp. |
|
|
39,942 |
|
| 1,600 |
|
Legg Mason, Inc. |
|
|
47,856 |
|
| 1,100 |
|
Marriott International, Inc. |
|
|
90,948 |
|
| 1,400 |
|
Microsoft Corp. |
|
|
86,996 |
|
| 1,100 |
|
NIKE, Inc. |
|
|
55,913 |
|
| 1,300 |
|
Occidental Petroleum Corp. |
|
|
92,599 |
|
| 700 |
|
PepsiCo, Inc. |
|
|
73,241 |
|
| 3,375 |
|
Pfizer, Inc. |
|
|
109,620 |
|
| 835 |
|
Prudential Financial, Inc. |
|
|
86,890 |
|
| 1,525 |
|
Starbucks Corp. |
|
|
84,668 |
|
| 950 |
|
TJX Cos., Inc. |
|
|
71,374 |
|
| 375 |
|
UnitedHealth Group, Inc. |
|
|
60,015 |
|
| 1,775 |
|
Verizon Communications, Inc. |
|
|
94,750 |
|
| 800 |
|
Visa, Inc. |
|
|
62,416 |
|
|
|
|
|
|
|
|
|
|
|
|
|
|
|
|
2,367,859 |
|
|
|
|
|
|
|
|
|
|
| Total Common Stocks
(cost: $3,974,627) |
|
|
4,076,291 |
|
|
|
|
|
|
|
|
|
|
|
| See accompanying notes to financial statements. |
|
|
|
28 |
|
SIT MUTUAL FUNDS
SEMI-ANNUAL REPORT |
|
|
|
|
|
|
|
| |
|
|
|
|
| Quantity |
|
Name of Issuer |
|
Fair Value ($) |
|
| |
|
|
|
| Short-Term Securities - 2.0% |
|
|
|
|
| 81,313 |
|
Fidelity Instl. Money Mkt. Govt. Fund, 0.39% |
|
|
|
| Total Short-Term Securities
(cost: $81,313) |
|
|
81,313 |
|
|
|
|
|
|
|
|
|
|
| Total Investments in Securities - 100.0%
(cost: $4,055,940) |
|
|
4,157,604 |
|
| Other Assets and Liabilities, net - 0.0% |
|
|
1,503 |
|
|
|
|
|
|
|
|
|
|
| Total Net Assets - 100.0% |
|
|
$4,159,107 |
|
|
|
|
|
|
|
|
| * |
Non-income producing security. |
Numeric footnotes not disclosed are not applicable to
this Schedule of Investments
ADR — American Depositary Receipt
PLC — Public Limited Company
A summary of the levels for
the Fund’s investments as of December 31, 2016 is as follows (see Note 2 - significant accounting policies in the notes to financial statements):
|
|
|
|
|
|
|
|
|
|
|
|
|
|
|
|
|
| |
|
Investment in Securities |
|
| |
|
Level 1
Quoted
Price ($) |
|
|
Level 2
Other significant
observable inputs ($) |
|
|
Level 3
Significant
unobservable inputs ($) |
|
|
Total ($) |
|
| Common Stocks |
|
|
|
|
|
|
|
|
|
|
|
|
|
|
|
|
| Belgium |
|
|
52,720 |
|
|
|
— |
|
|
|
— |
|
|
|
52,720 |
|
| Canada |
|
|
219,959 |
|
|
|
— |
|
|
|
— |
|
|
|
219,959 |
|
| China/Hong Kong |
|
|
52,234 |
|
|
|
— |
|
|
|
— |
|
|
|
52,234 |
|
| France |
|
|
105,597 |
|
|
|
54,653 |
|
|
|
— |
|
|
|
160,250 |
|
| Germany |
|
|
120,067 |
|
|
|
— |
|
|
|
— |
|
|
|
120,067 |
|
| Ireland |
|
|
212,301 |
|
|
|
— |
|
|
|
— |
|
|
|
212,301 |
|
| Japan |
|
|
51,282 |
|
|
|
179,711 |
|
|
|
— |
|
|
|
230,993 |
|
| Netherlands |
|
|
171,480 |
|
|
|
— |
|
|
|
— |
|
|
|
171,480 |
|
| Spain |
|
|
100,986 |
|
|
|
76,649 |
|
|
|
— |
|
|
|
177,635 |
|
| Switzerland |
|
|
182,489 |
|
|
|
— |
|
|
|
— |
|
|
|
182,489 |
|
| United Kingdom |
|
|
128,304 |
|
|
|
— |
|
|
|
— |
|
|
|
128,304 |
|
| United States |
|
|
2,367,859 |
|
|
|
— |
|
|
|
— |
|
|
|
2,367,859 |
|
| Short-Term Securities |
|
|
81,313 |
|
|
|
— |
|
|
|
— |
|
|
|
81,313 |
|
|
|
|
|
|
| Total: |
|
|
3,846,591 |
|
|
|
311,013 |
|
|
|
— |
|
|
|
4,157,604 |
|
The Fund adjusts the closing price of foreign equity securities by applying a systematic process for events
occurring after the close of the foreign exchanges. At each reporting period, this process is applied for all foreign securities and therefore all foreign securities are classified as level 2. There are no transfers between level 1 and level 2
between reporting periods as a result of applying this process. Level 1 securities of foreign issuers are primarily American Depositary Receipts (ADRs), Public Limited Companies (PLCs) or Global Depositary Receipts (GDRs). There were no transfers
into or out of level 3 during the reporting period.
|
|
|
| See accompanying notes to financial statements. |
|
|
| DECEMBER 31, 2016 |
|
29 |
OBJECTIVE & STRATEGY
The objective of the Sit Midcap® Growth Fund is to maximize long-term capital
appreciation. The Fund pursues this objective by investing at least 80% of its net assets in common stocks that, at the time of purchase, have market capitalizations that fall within the range of companies included in the Russell Midcap® Growth
Index during the most recent 12-month period. The Russell Midcap® Growth Index ranged from approximately $171 million to $33 billion during the 12-month period ended December 31, 2016.
The Sit Mid Cap Growth Fund’s return for the second half of 2016 was +5.72%, compared to
+5.07% for the Russell Mid Cap® Growth Index. The S&P MidCap 400® Index rose 11.87% during the period.
Mid-cap stocks posted
solid gains over the second half of 2016, as the U.S. presidential election proved to be a much-needed catalyst for stock prices. While we see the market’s positive reaction to potential policy changes as rational, we caution investors that
President-elect Trump’s initiatives will take time to be formulated and have an impact on the economy and corporate earnings. However, given relatively high valuations following the run-up in prices, we believe the market will need to see signs
of progress rather quickly, if market enthusiasm is to be maintained. Our investment team continues to focus on high quality, well-managed mid-cap companies that can produce strong earnings growth, even if the current slow growth environment
prevails into the future. We continue to believe that maintaining a well-diversified, high quality portfolio is appropriate given the many crosscurrents at the present time. Technology services and electronic technology carry the heaviest sector
weightings within the Fund, as we think many tech companies are undervalued relative to both their cyclical and secular growth prospects. We also hold a significant weighting in the finance sector, as we believe many financial firms have much to
gain from faster growth and expected policy changes, including lower taxes and decreased regulations. Regardless of sector, we remain focused on quality companies that have strong balance sheets and exhibit consistent growth in both earnings and
cash flow over the longer term.
Over the past six months, the Fund exceeded the return for the Russell Mid Cap® Growth Index. In terms
of relative returns, the sectors that had the most positive impact over the period included consumer non- durables, transportation and process industries. In terms of individual stocks, the top six-month performers included Alaska Air Group, Applied
Materials, Cardtronics, Aspen Technology and Scotts Miracle-Gro. The worst performing sectors, in terms of relative returns, included health services, health technology and
HYPOTHETICAL GROWTH OF $10,000
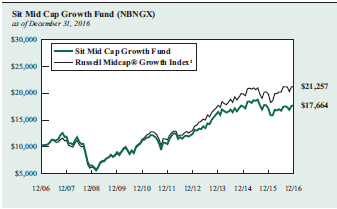
The chart above illustrates the total value of a hypothetical $10,000 investment in the Fund over the past
10 years as compared to the performance of the Russell Midcap® Growth Index. Past performance does not guarantee future results. Returns include the reinvestment of distributions. The chart does not reflect the deduction of taxes that a
shareholder would pay on Fund distributions or the redemption of Fund shares.
1 Russell Midcap® Growth Index is an unmanaged
index that measures the performance of those Russell Midcap Index companies with higher price-to-book ratios and higher forecasted growth values. It is not possible to invest directly in an index. This is the Fund’s primary index.
producer manufacturing. Individual
stocks that hurt returns over the period included Ultimate Software Group, Novavax, Envision Healthcare, Acadia Healthcare and Mobileye.
Our research staff remains committed and focused on identifying investment opportunities that will help our shareholders achieve their
investment goals over the long term.
Roger J. Sit
Kent L. Johnson
Robert W. Sit
Portfolio Managers
|
|
|
|
30 |
|
SIT MUTUAL FUNDS
SEMI-ANNUAL REPORT |
COMPARATIVE RATES OF RETURNS
as of December 31, 2016
|
|
|
|
|
|
|
|
|
|
|
|
|
|
|
|
| |
|
Sit
Mid Cap
Growth Fund |
|
Russell
Midcap®
Growth
Index 1 |
|
Russell
Midcap®
Index 2 |
| Six Month |
|
|
|
5.72 |
% |
|
|
|
5.07 |
% |
|
|
|
7.87 |
% |
| One Year |
|
|
|
3.10 |
|
|
|
|
7.33 |
|
|
|
|
13.80 |
|
| Five Year |
|
|
|
11.04 |
|
|
|
|
13.51 |
|
|
|
|
14.72 |
|
| Ten Year |
|
|
|
5.85 |
|
|
|
|
7.83 |
|
|
|
|
7.86 |
|
| Since Inception
(9/2/82) |
|
|
|
11.32 |
|
|
|
|
n/a |
|
|
|
|
n/a |
|
Performance figures are historical and do not guarantee future results. Investment returns and principal value will vary, and you may have a
gain or loss when you sell shares. Current performance may be lower or higher than the performance data quoted. Contact the Fund for performance data current to the most recent month-end. Returns include changes in share price as well as
reinvestment of all dividends and capital gains and all fee waivers. Without the fee waivers total return and yield figures would have been lower. Returns do not reflect the deduction of the 2% redemption fee imposed if shares are redeemed or
exchanged within 30 calendar days from their date of purchase. If imposed, the fee would reduce the performance quoted. Returns do not reflect the deduction of taxes that a shareholder would pay on Fund distributions or the redemption of Fund
shares. Management fees and administrative expenses are included in the Fund’s performance. Returns for periods greater than one year are compounded average annual rates of return.
1 Russell Midcap® Growth Index is an unmanaged index that measures the performance of those Russell Midcap Index companies with higher
price-to-book ratios and higher forecasted growth values. It is not possible to invest directly in an index.
2 Russell Midcap®
Index is an unmanaged index that measures the performance of approximately 800 of the smallest companies in the Russell 1000® Index.
PORTFOLIO SUMMARY
|
|
|
| Net Asset Value 12/31/16: |
|
$16.08 Per Share |
| Net Asset Value 6/30/16: |
|
$15.36 Per Share |
| Total Net Assets: |
|
$142.0 Million |
| Weighted Average Market Cap: |
|
$20.3 Billion |
TOP 10 HOLDINGS
1. Ulta Salon
Cosmetics & Fragrance, Inc.
2. TJX Cos., Inc.
3. Broadcom, Ltd.
4. Ecolab, Inc.
5. Waste Connections, Inc.
6. Alaska Air Group, Inc.
7. Ultimate Software Group, Inc.
8. Applied Materials, Inc.
9. priceline.com, Inc.
10. Cardtronics, PLC
Based on total net assets as of December 31,
2016. Subject to change.
FUND DIVERSIFICATION
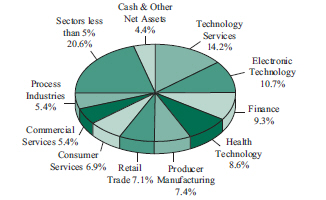
Based on total net assets as of December 31, 2016. Subject to change.
SCHEDULE OF INVESTMENTS (Unaudited)
December 31, 2016
Sit Mid Cap Growth
Fund
|
|
|
|
|
|
|
| |
|
|
|
|
| Quantity |
|
Name of Issuer |
|
Fair Value ($) |
|
| |
|
|
| Common Stocks - 95.6% |
|
| Commercial Services - 5.4% |
|
| 37,900 |
|
Booz Allen Hamilton Holding Corp. |
|
|
1,367,054 |
|
| 55,300 |
|
Cardtronics, PLC * |
|
|
3,017,721 |
|
| 15,000 |
|
Equifax, Inc. |
|
|
1,773,450 |
|
| 35,200 |
|
Nielsen Holdings, PLC |
|
|
1,476,640 |
|
|
|
|
|
|
|
|
|
|
|
|
|
|
|
|
7,634,865 |
|
|
|
|
|
|
|
|
|
| Communications - 1.3% |
|
| 18,300 |
|
SBA Communications Corp. * |
|
|
1,889,658 |
|
|
|
|
|
|
|
|
|
| Consumer Durables - 4.7% |
|
| 15,300 |
|
Carlisle Cos., Inc. |
|
|
1,687,437 |
|
| 20,000 |
|
Electronic Arts, Inc. * |
|
|
1,575,200 |
|
| 8,700 |
|
Genuine Parts Co. |
|
|
831,198 |
|
| 6,300 |
|
Polaris Industries, Inc. |
|
|
519,057 |
|
| 12,350 |
|
Snap-On, Inc. |
|
|
2,115,184 |
|
|
|
|
|
|
|
|
|
|
|
|
|
|
|
|
6,728,076 |
|
|
|
|
|
|
|
|
|
| Consumer Non-Durables - 1.1% |
|
| 48,900 |
|
Coca-Cola European Partners, PLC |
|
|
1,535,460 |
|
|
|
|
|
|
|
|
|
| Consumer Services - 6.9% |
|
| 3,000 |
|
Chipotle Mexican Grill, Inc. * |
|
|
1,131,960 |
|
| 42,600 |
|
Cinemark Holdings, Inc. |
|
|
1,634,136 |
|
| 53,600 |
|
Dunkin’ Brands Group, Inc. |
|
|
2,810,784 |
|
| 33,832 |
|
Marriott International, Inc. |
|
|
2,797,230 |
|
| 48,900 |
|
Service Corp. International |
|
|
1,388,760 |
|
|
|
|
|
|
|
|
|
|
|
|
|
|
|
|
9,762,870 |
|
|
|
|
|
|
|
|
|
| Electronic Technology - 10.7% |
|
| 98,400 |
|
Applied Materials, Inc. |
|
|
3,175,368 |
|
| 24,800 |
|
Arista Networks, Inc. * |
|
|
2,399,896 |
|
| 22,800 |
|
Broadcom, Ltd. |
|
|
4,030,356 |
|
| 58,200 |
|
Ciena Corp. * |
|
|
1,420,662 |
|
| 27,200 |
|
MACOM Technology Solutions Holdings, Inc.
* |
|
|
1,258,816 |
|
| 38,300 |
|
Skyworks Solutions, Inc. |
|
|
2,859,478 |
|
|
|
|
|
|
|
|
|
|
|
|
|
|
|
|
15,144,576 |
|
|
|
|
|
|
|
|
|
| Energy Minerals - 2.2% |
|
| 23,800 |
|
Continental Resources, Inc. * |
|
|
1,226,652 |
|
| 39,010 |
|
Marathon Petroleum Corp. |
|
|
1,964,154 |
|
|
|
|
|
|
|
|
|
|
|
|
|
|
|
|
3,190,806 |
|
|
|
|
|
|
|
|
|
| Finance - 9.3% |
|
| 11,400 |
|
Affiliated Managers Group, Inc. * |
|
|
1,656,420 |
|
| 7,800 |
|
Ameriprise Financial, Inc. |
|
|
865,332 |
|
| 35,300 |
|
Arthur J Gallagher & Co. |
|
|
1,834,188 |
|
| 66,300 |
|
Brixmor Property Group, Inc. |
|
|
1,619,046 |
|
| 23,600 |
|
First Republic Bank |
|
|
2,174,504 |
|
| 16,600 |
|
Hartford Financial Services Group, Inc. |
|
|
790,990 |
|
| 28,500 |
|
Intercontinental Exchange, Inc. |
|
|
1,607,970 |
|
| 51,600 |
|
Legg Mason, Inc. |
|
|
1,543,356 |
|
|
|
|
|
|
|
|
| |
|
|
|
|
| Quantity |
|
Name of Issuer |
|
Fair Value ($) |
|
| |
|
|
|
|
| 4,400 |
|
SVB Financial Group * |
|
|
755,304 |
|
| 4,900 |
|
T Rowe Price Group, Inc. |
|
|
368,774 |
|
|
|
|
|
|
|
|
|
|
|
|
|
13,215,884 |
|
|
|
|
|
|
|
|
|
| Health Services - 4.0% |
|
| 26,300 |
|
Centene Corp. * |
|
|
1,486,213 |
|
| 20,200 |
|
Envision Healthcare Corp. * |
|
|
1,278,458 |
|
| 23,100 |
|
HealthSouth Corp. |
|
|
952,644 |
|
| 21,800 |
|
Patterson Cos, Inc. |
|
|
894,454 |
|
| 15,500 |
|
Surgical Care Affiliates, Inc. * |
|
|
717,185 |
|
| 7,400 |
|
Team Health Holdings, Inc. * |
|
|
321,530 |
|
|
|
|
|
|
|
|
|
|
|
|
|
|
|
|
5,650,484 |
|
|
|
|
|
|
|
|
|
| Health Technology - 8.6% |
|
| 12,000 |
|
Alexion Pharmaceuticals, Inc. * |
|
|
1,468,200 |
|
| 12,200 |
|
Align Technology, Inc. * |
|
|
1,172,786 |
|
| 8,100 |
|
Allergan, PLC * |
|
|
1,701,081 |
|
| 15,700 |
|
Celgene Corp. * |
|
|
1,817,275 |
|
| 4,500 |
|
DexCom, Inc. * |
|
|
268,650 |
|
| 9,300 |
|
Incyte Corp. * |
|
|
932,511 |
|
| 7,900 |
|
Jazz Pharmaceuticals, PLC * |
|
|
861,337 |
|
| 19,650 |
|
Thermo Fisher Scientific, Inc. |
|
|
2,772,615 |
|
| 11,675 |
|
Zimmer Holdings, Inc. |
|
|
1,204,860 |
|
|
|
|
|
|
|
|
|
|
|
|
|
|
|
|
12,199,315 |
|
|
|
|
|
|
|
|
|
| Industrial Services - 2.5% |
|
| 45,500 |
|
Waste Connections, Inc. |
|
|
3,575,845 |
|
|
|
|
|
|
|
|
|
| Process Industries - 5.4% |
|
| 31,200 |
|
Ecolab, Inc. |
|
|
3,657,264 |
|
| 18,800 |
|
International Paper Co. |
|
|
997,528 |
|
| 30,800 |
|
Scotts Miracle-Gro Co. |
|
|
2,942,940 |
|
|
|
|
|
|
|
|
|
|
|
|
|
|
|
|
7,597,732 |
|
|
|
|
|
|
|
|
|
| Producer Manufacturing - 7.4% |
|
| 4,689 |
|
Adient, PLC * |
|
|
274,775 |
|
| 24,000 |
|
AMETEK, Inc. |
|
|
1,166,400 |
|
| 10,950 |
|
Anixter International, Inc. * |
|
|
887,498 |
|
| 18,400 |
|
Delphi Automotive, PLC |
|
|
1,239,240 |
|
| 3,100 |
|
Hubbell, Inc. |
|
|
361,770 |
|
| 26,400 |
|
Ingersoll-Rand, PLC |
|
|
1,981,056 |
|
| 46,890 |
|
Johnson Controls International, PLC |
|
|
1,931,399 |
|
| 18,600 |
|
Mobileye NV * |
|
|
709,032 |
|
| 23,100 |
|
Orbital ATK, Inc. |
|
|
2,026,563 |
|
|
|
|
|
|
|
|
|
|
|
|
|
|
|
|
10,577,733 |
|
|
|
|
|
|
|
|
|
| Retail Trade - 7.1% |
|
| 40,200 |
|
Macy’s, Inc. |
|
|
1,439,562 |
|
| 55,300 |
|
TJX Cos., Inc. |
|
|
4,154,689 |
|
| 17,700 |
|
Ulta Salon Cosmetics & Fragrance, Inc.
* |
|
|
4,512,438 |
|
|
|
|
|
|
|
|
|
|
|
|
|
|
|
|
10,106,689 |
|
|
|
|
|
|
|
|
|
| Technology Services - 14.2% |
|
| 25,100 |
|
ANSYS, Inc. * |
|
|
2,321,499 |
|
| 53,300 |
|
Aspen Technology, Inc. * |
|
|
2,914,444 |
|
|
|
|
| See accompanying notes to financial statements. |
|
|
|
32 |
|
SIT MUTUAL FUNDS
SEMI-ANNUAL REPORT |
|
|
|
|
|
|
|
| |
|
|
|
|
| Quantity |
|
Name of Issuer |
|
Fair Value ($) |
|
| |
|
|
|
|
| 17,900 |
|
Autodesk, Inc. * |
|
|
1,324,779 |
|
| 36,400 |
|
Cognizant Technology Solutions Corp.
* |
|
|
2,039,492 |
|
| 6,700 |
|
DST Systems, Inc. |
|
|
717,905 |
|
| 31,275 |
|
Euronet Worldwide, Inc. * |
|
|
2,265,248 |
|
| 11,700 |
|
Fair Isaac Corp. |
|
|
1,394,874 |
|
| 30,300 |
|
Genpact, Ltd. * |
|
|
737,502 |
|
| 2,150 |
|
priceline.com, Inc. * |
|
|
3,152,029 |
|
| 18,100 |
|
Ultimate Software Group, Inc. * |
|
|
3,300,535 |
|
|
|
|
|
|
|
|
|
|
|
|
|
|
|
|
20,168,307 |
|
|
|
|
|
|
|
|
|
| Transportation - 3.7% |
|
| 38,100 |
|
Alaska Air Group, Inc. |
|
|
3,380,613 |
|
| 24,700 |
|
Ryder System, Inc. |
|
|
1,838,668 |
|
|
|
|
|
|
|
|
|
|
|
|
|
|
|
|
5,219,281 |
|
|
|
|
|
|
|
|
|
| Utilities - 1.1% |
|
| 27,800 |
|
WEC Energy Group, Inc. |
|
|
1,630,470 |
|
|
|
|
|
|
|
|
|
|
| Total Common Stocks
(cost: $84,319,899) |
|
|
135,828,051 |
|
|
|
|
|
|
|
|
|
|
|
|
|
|
|
| |
|
|
|
|
| Quantity |
|
Name of Issuer |
|
Fair Value ($) |
|
| |
|
|
|
| Short-Term Securities - 4.4% |
|
|
|
|
| 6,222,617 |
|
Fidelity Instl. Money Mkt. Govt. Fund, 0.39% |
|
|
|
|
|
|
| Total Short-Term Securities
(cost: $6,222,617) |
|
|
6,222,617 |
|
|
|
|
|
|
|
|
|
|
| Total Investments in Securities - 100.0%
(cost: $90,542,516) |
|
|
142,050,668 |
|
| Other Assets and Liabilities, net - 0.0% |
|
|
(51,744 |
) |
|
|
|
|
|
|
|
|
|
| Total Net Assets - 100.0% |
|
|
$141,998,924 |
|
|
|
|
|
|
|
|
| * |
Non-income producing security. |
Numeric footnotes not disclosed are not applicable to this Schedule of
Investments.
PLC — Public Limited Company
A summary of the levels
for the Fund’s investments as of December 31, 2016 is as follows (see Note 2 - significant accounting policies in the notes to financial statements):
|
|
|
|
|
|
|
|
|
|
|
|
|
| |
|
Investment in Securities |
|
| |
|
Level 1 |
|
|
Level 2 |
|
Level 3 |
|
|
|
| |
|
Quoted
Price ($) |
|
|
Other significant
observable inputs ($) |
|
Significant
unobservable inputs ($) |
|
Total ($) |
|
| Common Stocks ** |
|
|
135,828,051 |
|
|
— |
|
— |
|
|
135,828,051 |
|
| Short-Term Securities |
|
|
6,222,617 |
|
|
— |
|
— |
|
|
6,222,617 |
|
|
|
|
|
|
| Total: |
|
|
142,050,668 |
|
|
— |
|
— |
|
|
142,050,668 |
|
| ** |
For equity securities categorized in a single level, refer to the Schedule of Investments for further breakdown. |
For the reporting period, there were no transfers between levels 1, 2 and 3.
|
|
|
| See accompanying notes to financial statements. |
|
|
| DECEMBER 31, 2016 |
|
33 |
|
| |
|
Sit Small Cap Dividend Growth Fund Class I and Class S |
OBJECTIVE & STRATEGY
The objective of the Sit Small Cap Dividend Growth Fund is to provide current income that exceeds the Fund’s benchmark index and that
grows over a period of years. Secondarily the Fund seeks long-term capital appreciation. The Fund seeks to achieve its objectives by investing, under normal market conditions, at least 80% of its net assets in small cap dividend-paying common stocks
that have market capitalizations at the time of purchase of up to $3.0 billion, or up to the market capitalization of the largest company included in the Russell 2000® Index measured at the end of the previous twelve months ($8.5 billion as of
December 31, 2016). The Fund may invest the balance of its assets in preferred stocks, convertible bonds, U.S. Treasury securities (including Treasury bills, notes and bonds), closed-end investment companies, and master limited partnerships.
The Sit Small Cap Dividend Growth Fund posted a +11.29% return over the past six months,
compared to the +18.68% return for the Russell 2000® Index. The Fund’s gross dividend yield (before deduction of Fund expenses) is 2.30% compared to the 1.80% yield of the Russell 2000® Index.
Investor sentiment toward small capitalization stocks soared in recent
months, as post-election optimism propelled small cap stocks to record levels. We believe much of this optimism is justified, but given elevated valuations, investors may need to see visible signs of progress on policies for further gains to be
achieved. Importantly, small cap stocks stand to benefit disproportionately (relative to larger cap stocks) from President-elect Trump’s agenda, which calls for lower tax rates, deregulation and fiscal stimulus. These initiatives will clearly
favor U.S. domestically-focused companies which tend to fall within the small cap universe. We view the financial sector as the greatest beneficiary of policy changes and an improving economic backdrop, including higher interest rates. While the
heaviest weighting is in finance, the Fund remains well-diversified in other sectors, with significant positions in consumer services, process industries and consumer durables. While we are hopeful that
pro-growth policies will catalyze economic growth (and corporate earnings growth) for many sectors held in the Fund, we recognize the risks (e.g., dollar strength, inflation) and potential for investor frustration if policy implementation is
delayed. We believe downside risks can be mitigated with a focus on quality firms that pay consistent dividends to shareholders.
The Fund
underperformed the Russell 2000® Index over the past six months. Underweighting banks within the finance sector was a key factor, with additional pressure from poor stock selection in commercial service and health services. In addition, the
Fund’s cash balance negatively impacted returns, given the market surge. In terms of individual stocks, Life Storage, Kindred Healthcare, Carter’s, DST Systems and Physicians Realty Trust were laggards. On the positive side, the
Fund’s holdings in the transportation, energy minerals and
HYPOTHETICAL GROWTH OF $10,000
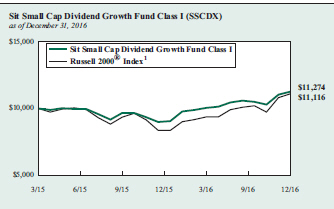
The chart above illustrates the total value of a hypothetical $10,000 investment in the Fund over the past
10 years as compared to the performance of the Russell 2000® Index. Past performance does not guarantee future results. Returns include the reinvestment of distributions. The chart does not reflect the deduction of taxes that a shareholder would
pay on Fund distributions or the redemption of Fund shares.
1 Russell 2000® Index is an unmanaged index that measures the
performance of the 2,000 smallest companies in the Russell 3000® Index, an index consisting of the 3,000 largest U.S. companies based on market capitalization. It is not possible to invest directly in an index. This is the Fund’s primary
index.
consumer durables
sectors aided returns. Key outperformers within these sectors included Alaska Air Group, Western Refining, and Thor Industries.
We
strongly believe in the merits of the Sit Small Cap Dividend Growth Fund’s strategy. Our focus remains on high quality, well-managed firms, with strong financial characteristics and management teams committed to returning capital to
shareholders. We appreciate our investors’ interest in the Fund.
|
|
|
|
|
| Roger J. Sit |
|
Michael T. Manns |
|
|
| Kent L. Johnson |
|
Robert W. Sit |
|
|
| Portfolio Managers |
|
|
|
|
|
|
34 |
|
SIT MUTUAL FUNDS
SEMI-ANNUAL REPORT |
COMPARATIVE RATES OF RETURNS
as of December 31, 2016
|
|
|
|
|
|
|
|
|
|
|
|
|
|
|
|
| |
|
Sit Small Cap |
|
|
| |
|
Dividend |
|
|
| |
|
Growth Fund |
|
Russell |
| |
|
|
|
|
|
2000® |
| |
|
Class I |
|
Class S |
|
Index 1 |
| Six Month |
|
|
|
11.29 |
% |
|
|
|
11.09 |
% |
|
|
|
18.68% |
|
| One Year |
|
|
|
20.59 |
|
|
|
|
20.31 |
|
|
|
|
21.31 |
|
| Since Inception
(3/31/15) |
|
|
|
7.07 |
|
|
|
|
6.81 |
|
|
|
|
6.21 |
|
Performance figures are historical and do not guarantee future results. Investment returns and principal value will vary, and you may have a
gain or loss when you sell shares. Current performance may be lower or higher than the performance data quoted. Contact the Fund for performance data current to the most recent month-end. Returns include changes in share price as well as
reinvestment of all dividends and capital gains. Returns do not reflect the deduction of the 2% redemption fee imposed if shares are redeemed or exchanged within 30 calendar days from their date of purchase. If imposed, the fee would reduce the
performance quoted. Returns do not reflect the deduction of taxes that a shareholder would pay on Fund distributions or the redemption of Fund shares. Management fees and administrative expenses are included in the Fund’s performance. Returns
for periods greater than one year are compounded average annual rates of return.
1 Russell 2000® Index is an unmanaged index that measures the performance of the 2,000 smallest companies in the Russell 3000® Index, an index consisting
of the 3,000 largest U.S. companies based on market capitalization. It is not possible to directly invest in an index.
PORTFOLIO SUMMARY
|
|
|
|
|
| Class I: |
|
|
|
|
| Net Asset Value 12/31/16: |
|
|
$11.04 Per Share |
|
| Net Asset Value 6/30/16: |
|
|
$10.00 Per Share |
|
| Total Net Assets: |
|
|
$10.5 Million |
|
| Class S: |
|
|
|
|
| Net Asset Value 12/31/16: |
|
|
$11.04 Per Share |
|
| Net Asset Value 6/30/16: |
|
|
$10.00 Per Share |
|
| Total Net Assets: |
|
|
$3.0 Million |
|
|
|
| Weighted Average Market Cap: |
|
|
$3.9 Billion |
|
TOP 10 HOLDINGS
1. East West Bancorp, Inc.
2. MKS Instruments, Inc.
3. Thor Industries, Inc.
4. DST Systems, Inc.
5. Deluxe Corp.
6. Power Integrations, Inc.
7. Monolithic Power Systems, Inc.
8. Booz Allen Hamilton Holding Corp.
9. Legg Mason, Inc.
10. HealthSouth Corp.
Based on total net assets as of December 31,
2016. Subject to change.
FUND DIVERSIFICATION
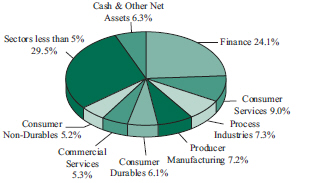
Based on total net assets as of December 31, 2016. Subject to change.
SCHEDULE OF INVESTMENTS (Unaudited)
December 31, 2016
Sit Small Cap
Dividend Growth Fund
|
|
|
|
|
|
|
| |
|
|
|
|
| Quantity |
|
Name of Issuer |
|
Fair Value ($) |
|
| |
|
|
| Common Stocks - 93.1% |
|
| Commercial Services - 5.3% |
|
| 5,475 |
|
Booz Allen Hamilton Holding Corp. |
|
|
197,483 |
|
| 1,600 |
|
CEB, Inc. |
|
|
96,960 |
|
| 2,850 |
|
Deluxe Corp. |
|
|
204,088 |
|
| 950 |
|
Dun & Bradstreet Corp. |
|
|
115,254 |
|
| 2,425 |
|
Herman Miller, Inc. |
|
|
82,935 |
|
| 1,400 |
|
Nautilus, Inc. * |
|
|
25,900 |
|
|
|
|
|
|
|
|
|
|
|
|
|
|
|
|
722,620 |
|
|
|
|
|
|
|
|
|
| Communications - 0.9% |
|
| 4,300 |
|
Shenandoah Telecommunications Co. |
|
|
117,390 |
|
|
|
|
|
|
|
|
|
| Consumer Durables - 6.1% |
|
| 1,125 |
|
Carlisle Cos, Inc. |
|
|
124,076 |
|
| 3,675 |
|
Ethan Allen Interiors, Inc. |
|
|
135,424 |
|
| 610 |
|
Snap-On, Inc. |
|
|
104,475 |
|
| 2,300 |
|
Thor Industries, Inc. |
|
|
230,115 |
|
| 1,925 |
|
Toro Co. |
|
|
107,704 |
|
| 2,350 |
|
Tupperware Brands Corp. |
|
|
123,657 |
|
|
|
|
|
|
|
|
|
|
|
|
|
|
|
|
825,451 |
|
|
|
|
|
|
|
|
|
| Consumer Non-Durables - 5.2% |
|
| 3,750 |
|
B&G Foods, Inc. |
|
|
164,250 |
|
| 950 |
|
Cal-Maine Foods, Inc. |
|
|
41,966 |
|
| 900 |
|
Carter’s, Inc. |
|
|
77,751 |
|
| 1,600 |
|
Fresh Del Monte Produce, Inc. |
|
|
97,008 |
|
| 2,900 |
|
Pinnacle Foods, Inc. |
|
|
155,005 |
|
| 2,100 |
|
Sensient Technologies Corp. |
|
|
165,018 |
|
|
|
|
|
|
|
|
|
|
|
|
|
|
|
|
700,998 |
|
|
|
|
|
|
|
|
|
| Consumer Services - 9.0% |
|
| 6,200 |
|
Bloomin’ Brands, Inc. |
|
|
111,786 |
|
| 2,625 |
|
Brinker International, Inc. |
|
|
130,016 |
|
| 1,850 |
|
Capella Education Co. |
|
|
162,430 |
|
| 4,525 |
|
Cinemark Holdings, Inc. |
|
|
173,579 |
|
| 3,475 |
|
Dunkin’ Brands Group, Inc. |
|
|
182,229 |
|
| 6,250 |
|
Service Corp. International |
|
|
177,500 |
|
| 7,200 |
|
Time, Inc. |
|
|
128,520 |
|
| 925 |
|
Vail Resorts, Inc. |
|
|
149,212 |
|
|
|
|
|
|
|
|
|
|
|
|
|
|
|
|
1,215,272 |
|
|
|
|
|
|
|
|
|
| Electronic Technology - 4.7% |
|
| 3,875 |
|
MKS Instruments, Inc. |
|
|
230,175 |
|
| 2,425 |
|
Monolithic Power Systems, Inc. |
|
|
198,680 |
|
| 3,000 |
|
Power Integrations, Inc. |
|
|
203,550 |
|
|
|
|
|
|
|
|
|
|
|
|
|
|
|
|
632,405 |
|
|
|
|
|
|
|
|
|
| Energy Minerals - 1.7% |
|
| 2,750 |
|
Vermilion Energy, Inc. |
|
|
115,968 |
|
| 3,225 |
|
Western Refining, Inc. |
|
|
122,066 |
|
|
|
|
|
|
|
|
|
|
|
|
|
|
|
|
238,034 |
|
|
|
|
|
|
|
|
|
|
|
|
|
|
|
| |
|
|
|
|
| Quantity |
|
Name of Issuer |
|
Fair Value ($) |
|
| |
|
|
| Finance - 24.1% |
|
| 3,675 |
|
BankUnited, Inc. |
|
|
138,511 |
|
| 4,525 |
|
Berkshire Hills Bancorp, Inc. |
|
|
166,746 |
|
| 4,350 |
|
BlackRock Capital Investment Corp. |
|
|
30,276 |
|
| 4,900 |
|
Brixmor Property Group, Inc. |
|
|
119,658 |
|
| 3,900 |
|
Chimera Investment Corp. |
|
|
66,378 |
|
| 3,250 |
|
Columbia Banking System, Inc. |
|
|
145,210 |
|
| 6,200 |
|
Donegal Group, Inc. |
|
|
108,376 |
|
| 4,950 |
|
East West Bancorp, Inc. |
|
|
251,608 |
|
| 1,300 |
|
Equity LifeStyle Properties, Inc. |
|
|
93,730 |
|
| 1,500 |
|
Evercore Partners, Inc. |
|
|
103,050 |
|
| 7,275 |
|
Farmland Partners, Inc. |
|
|
81,189 |
|
| 3,900 |
|
Horace Mann Educators Corp. |
|
|
166,920 |
|
| 8,125 |
|
Janus Capital Group, Inc. |
|
|
107,819 |
|
| 11,900 |
|
Kingstone Cos, Inc. |
|
|
163,625 |
|
| 6,550 |
|
Legg Mason, Inc. |
|
|
195,910 |
|
| 1,000 |
|
Life Storage, Inc. |
|
|
85,260 |
|
| 2,050 |
|
Macquarie Infrastructure Co. |
|
|
167,485 |
|
| 6,700 |
|
Monogram Residential Trust, Inc. |
|
|
72,494 |
|
| 4,400 |
|
National General Holdings Corp. |
|
|
109,956 |
|
| 7,350 |
|
Old National Bancorp |
|
|
133,402 |
|
| 1,100 |
|
PacWest Bancorp |
|
|
59,884 |
|
| 8,250 |
|
Physicians Realty Trust |
|
|
156,420 |
|
| 5,825 |
|
Provident Financial Services, Inc. |
|
|
164,848 |
|
| 3,800 |
|
STORE Capital Corp. |
|
|
93,898 |
|
| 3,325 |
|
Umpqua Holdings Corp. |
|
|
62,444 |
|
| 1,700 |
|
Validus Holdings, Ltd. |
|
|
93,517 |
|
| 1,600 |
|
Wintrust Financial Corp. |
|
|
116,112 |
|
|
|
|
|
|
|
|
|
|
|
|
|
|
|
|
3,254,726 |
|
|
|
|
|
|
|
|
|
| Health Services - 3.3% |
|
| 3,875 |
|
Healthcare Services Group, Inc. |
|
|
151,784 |
|
| 4,550 |
|
HealthSouth Corp. |
|
|
187,642 |
|
| 2,725 |
|
Patterson Cos, Inc. |
|
|
111,807 |
|
|
|
|
|
|
|
|
|
|
|
|
|
|
|
|
451,233 |
|
|
|
|
|
|
|
|
|
| Health Technology - 3.1% |
|
| 1,675 |
|
PerkinElmer, Inc. |
|
|
87,351 |
|
| 2,500 |
|
STERIS, PLC |
|
|
168,475 |
|
| 1,000 |
|
Teleflex, Inc. |
|
|
161,150 |
|
|
|
|
|
|
|
|
|
|
|
|
|
|
|
|
416,976 |
|
|
|
|
|
|
|
|
|
| Industrial Services - 1.0% |
|
| 1,725 |
|
Waste Connections, Inc. |
|
|
135,568 |
|
|
|
|
|
|
|
|
|
| Non-Energy Minerals - 1.0% |
|
| 2,550 |
|
Commercial Metals Co. |
|
|
55,539 |
|
| 2,000 |
|
Potlatch Corp. |
|
|
83,300 |
|
|
|
|
|
|
|
|
|
|
|
|
|
|
|
|
138,839 |
|
|
|
|
|
|
|
|
|
| Process Industries - 7.3% |
|
| 2,400 |
|
Apogee Enterprises, Inc. |
|
|
128,544 |
|
| 1,700 |
|
Avery Dennison Corp. |
|
|
119,374 |
|
| 4,650 |
|
Huntsman Corp. |
|
|
88,722 |
|
|
|
|
| See accompanying notes to financial statements. |
|
|
|
36 |
|
SIT MUTUAL FUNDS
SEMI-ANNUAL REPORT |
|
|
|
|
|
|
|
| |
|
|
|
|
| Quantity |
|
Name of Issuer |
|
Fair Value ($) |
|
| |
|
|
|
|
| 1,200 |
|
Ingredion, Inc. |
|
|
149,952 |
|
| 1,275 |
|
Innophos Holdings, Inc. |
|
|
66,632 |
|
| 1,225 |
|
Neenah Paper, Inc. |
|
|
104,370 |
|
| 8,675 |
|
Orion Engineered Carbons SA |
|
|
163,524 |
|
| 1,700 |
|
Scotts Miracle-Gro Co. |
|
|
162,435 |
|
|
|
|
|
|
|
|
|
|
|
|
|
|
|
|
983,553 |
|
|
|
|
|
|
|
|
|
| Producer Manufacturing - 7.2% |
|
| 1,300 |
|
Applied Industrial Technologies, Inc. |
|
|
77,220 |
|
| 3,100 |
|
Atkore International Group, Inc. * |
|
|
74,121 |
|
| 1,700 |
|
Crane Co. |
|
|
122,604 |
|
| 650 |
|
Graco, Inc. |
|
|
54,008 |
|
| 1,125 |
|
Hubbell, Inc. |
|
|
131,288 |
|
| 1,875 |
|
ITT, Inc. |
|
|
72,319 |
|
| 925 |
|
Lincoln Electric Holdings, Inc. |
|
|
70,920 |
|
| 1,375 |
|
MSA Safety, Inc. |
|
|
95,329 |
|
| 1,950 |
|
Orbital ATK, Inc. |
|
|
171,074 |
|
| 675 |
|
Watsco, Inc. |
|
|
99,981 |
|
|
|
|
|
|
|
|
|
|
|
|
|
|
|
|
968,864 |
|
|
|
|
|
|
|
|
|
| Retail Trade - 2.7% |
|
| 2,825 |
|
Big Lots, Inc. |
|
|
141,843 |
|
| 1,200 |
|
Camping World Holdings, Inc. |
|
|
39,108 |
|
| 1,050 |
|
Casey’s General Stores, Inc. |
|
|
124,824 |
|
| 1,950 |
|
Cato Corp. |
|
|
58,656 |
|
|
|
|
|
|
|
|
|
|
|
|
|
|
|
|
364,431 |
|
|
|
|
|
|
|
|
|
| Technology Services - 3.4% |
|
| 1,800 |
|
Broadridge Financial Solutions, Inc. |
|
|
119,340 |
|
| 1,950 |
|
DST Systems, Inc. |
|
|
208,942 |
|
| 550 |
|
Fair Isaac Corp. |
|
|
65,571 |
|
| 1,550 |
|
ManTech International Corp. |
|
|
65,488 |
|
|
|
|
|
|
|
|
|
|
|
|
|
|
|
|
459,341 |
|
|
|
|
|
|
|
|
|
|
|
|
|
|
|
| |
|
|
|
|
| Quantity |
|
Name of Issuer |
|
Fair Value ($) |
|
| |
|
|
| Transportation - 3.1% |
|
| 1,400 |
|
Alaska Air Group, Inc. |
|
|
124,222 |
|
| 3,350 |
|
Golar LNG, Ltd. |
|
|
76,849 |
|
| 2,000 |
|
Marten Transport, Ltd. |
|
|
46,600 |
|
| 2,300 |
|
Ryder System, Inc. |
|
|
171,212 |
|
|
|
|
|
|
|
|
|
|
|
|
|
|
|
|
418,883 |
|
|
|
|
|
|
|
|
|
| Utilities - 4.0% |
|
| 2,000 |
|
Black Hills Corp. |
|
|
122,680 |
|
| 1,100 |
|
Connecticut Water Service, Inc. |
|
|
61,435 |
|
| 4,700 |
|
Covanta Holding Corp. |
|
|
73,320 |
|
| 3,775 |
|
New Jersey Resources Corp. |
|
|
134,012 |
|
| 2,350 |
|
Spire, Inc. |
|
|
151,692 |
|
|
|
|
|
|
|
|
|
|
|
|
|
|
|
|
543,139 |
|
|
|
|
|
|
|
|
|
|
| Total Common Stocks
(cost: $11,091,602) |
|
|
12,587,723 |
|
|
|
|
|
|
|
|
|
| Investment Companies - 0.6% |
|
| 2,900 |
|
Tortoise Energy Infrastructure Corp. |
|
|
89,001 |
|
|
|
|
|
|
|
|
|
| (cost: $107,796) |
|
| Short-Term Securities - 5.6% |
|
| 753,149 |
|
Fidelity Instl. Money Mkt. Govt. Fund, 0.39% |
|
|
|
|
|
|
| Total Short-Term Securities
(cost: $753,149) |
|
|
753,149 |
|
|
|
|
|
|
|
|
|
|
| Total Investments in Securities - 99.3%
(cost: $11,952,547) |
|
|
13,429,873 |
|
| Other Assets and Liabilities, net - 0.7% |
|
|
91,227 |
|
|
|
|
|
|
|
|
|
|
| Total Net Assets - 100.0% |
|
|
$13,521,100 |
|
|
|
|
|
|
|
|
| * |
Non-income producing security. |
Numeric footnotes not disclosed are not applicable to this Schedule of
Investments.
PLC — Public Limited Company
A summary of the levels
for the Fund’s investments as of December 31, 2016 is as follows (see Note 2 - significant accounting policies in the notes to financial statements):
|
|
|
|
|
|
|
|
|
|
|
|
|
| |
|
Investment in Securities |
|
| |
|
Level 1 |
|
|
Level 2 |
|
Level 3 |
|
|
|
| |
|
Quoted
Price ($) |
|
|
Other significant
observable inputs ($) |
|
Significant
unobservable inputs ($) |
|
Total ($) |
|
| Common Stocks ** |
|
|
12,587,723 |
|
|
— |
|
— |
|
|
12,587,723 |
|
| Investment Companies |
|
|
89,001 |
|
|
— |
|
— |
|
|
89,001 |
|
| Short-Term Securities |
|
|
753,149 |
|
|
— |
|
— |
|
|
753,149 |
|
|
|
|
|
|
| Total: |
|
|
13,429,873 |
|
|
— |
|
— |
|
|
13,429,873 |
|
| ** |
For equity securities categorized in a single level, refer to the Schedule of Investments for further breakdown. |
For the reporting period, there were no transfers between levels 1, 2 and 3.
|
|
|
| See accompanying notes to financial statements. |
|
|
| DECEMBER 31, 2016 |
|
37 |
|
| |
|
Sit Small Cap Growth Fund |
OBJECTIVE & STRATEGY
The objective of the Sit Small Cap Growth Fund is to maximize long-term capital appreciation. The Fund seeks to achieve its objective by
investing, under normal market conditions, at least 80% of its net assets in common stocks of companies with market capitalizations at the time of purchase of up to $3.0 billion, or up to the market capitalization of the largest company included in
the Russell 2000® Index measured at the end of the previous twelve months ($8.5 billion as of December 31, 2016).
The Adviser
invests in a diversified group of growing small companies it believes exhibit the potential for superior growth. The Adviser believes that a company’s earnings growth is the primary determinant of its potential long-term return and evaluates a
company’s potential for above average long-term earnings and revenue growth.
The Sit Small Cap Growth Fund returned +10.76% over the past six months. This compares to the
six-month return of +13.12% for the Russell 2000® Growth Index and the +18.68% return for the Russell 2000® Index.
Small
capitalization stocks rallied sharply over the past six months as a “risk on” sentiment quickly emerged within the markets, reflecting optimism that President-elect Trump’s pro-growth policies will provide an improvement in corporate
earnings, following a long period of sluggish growth. While the move up in small cap stocks has left valuations at elevated levels, it is important to emphasize that small companies have the most to gain from key elements of Mr. Trump’s
plan. Smaller companies, for example, tend to be domestic- oriented, pay high corporate tax rates, and are faced with elevated regulatory compliance costs within the U.S. A rollback in taxes and regulation could allow for a significantly improved
growth outlook for many smaller companies. Our investment staff is focusing on identifying which companies/sectors appear to be best-positioned for pro-growth policies. For example, we have increased exposure to the banking and producer
manufacturing sectors, as these are cyclical groups that should respond quickly once growth policies are implemented. In addition to these cyclical groups, the Fund continues to have significant exposure to secular growth sectors, including
technology services and health technology, which remain the heaviest sector weightings.
The Fund underperformed the Russell 2000®
Growth Index over during the second half of 2016. Relative performance was negatively by impacted by stock selection in the health services, technology services and finance sectors. The Fund’s cash position also detracted from returns, given
the strong market run-up during the period. Ultimate Software Group, Acadia Healthcare, Manhattan Associates, Envision Healthcare and Novavax were individual stocks that lagged during the second half of 2016. On the positive side, the Fund benefited
from strong stock selection in the commercial services, transportation
HYPOTHETICAL GROWTH OF $10,000
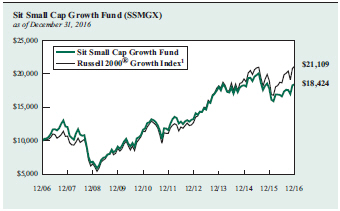
The chart above illustrates the total value of a hypothetical $10,000 investment in the Fund over the past
10 years as compared to the performance of the Russell 2000® Growth Index. Past performance does not guarantee future results. Returns include the reinvestment of distributions. The chart does not reflect the deduction of taxes that a
shareholder would pay on Fund distributions or the redemption of Fund shares.
1 Russell 2000® Growth Index is an unmanaged index
that measures the performance of those Russell 2000 Index companies with higher price-to-book ratios and higher forecasted growth values. It is not possible to invest directly in an index. This is the Fund’s primary index.
and consumer services sectors. In
terms of individual stocks, the top contributors to the Fund return during the period included Ionis Pharmaceuticals, Alaska Air Group, EMCOR Group, Arista Networks and Scotts Miracle-Gro.
Our research team remains highly focused on identifying long-term investment opportunities within the small cap universe. We appreciate
shareholders’ continued interest in the Fund.
|
|
|
|
|
| Roger J. Sit |
|
Michael J. Stellmacher |
|
|
| Kent L. Johnson |
|
Robert W. Sit |
|
|
| Portfolio Managers |
|
|
|
|
|
|
38 |
|
SIT MUTUAL FUNDS
SEMI-ANNUAL REPORT |
COMPARATIVE RATES OF RETURNS
as of December 31, 2016
|
|
|
|
|
|
|
|
|
|
|
|
|
|
|
|
| |
|
Sit
Small Cap
Growth
Fund |
|
Russell 2000®
Growth Index 1 |
|
Russell
2000®
Index 2 |
| Six Month |
|
|
|
10.76 |
% |
|
|
|
13.12 |
% |
|
|
|
18.68 |
% |
| One Year |
|
|
|
3.56 |
|
|
|
|
11.32 |
|
|
|
|
21.31 |
|
| Five Year |
|
|
|
9.68 |
|
|
|
|
13.74 |
|
|
|
|
14.46 |
|
| Ten Year |
|
|
|
6.30 |
|
|
|
|
7.76 |
|
|
|
|
7.07 |
|
| Since Inception
(7/1/94) |
|
|
|
9.98 |
|
|
|
|
7.76 |
|
|
|
|
9.45 |
|
Performance figures are historical and do not guarantee future results. Investment returns and principal value will vary, and you may have a
gain or loss when you sell shares. Current performance may be lower or higher than the performance data quoted. Contact the Fund for performance data current to the most recent month-end. Returns include changes in share price as well as
reinvestment of all dividends and capital gains. Returns do not reflect the deduction of the 2% redemption fee imposed if shares are redeemed or exchanged within 30 calendar days from their date of purchase. If imposed, the fee would reduce the
performance quoted. Returns do not reflect the deduction of taxes that a shareholder would pay on Fund distributions or the redemption of Fund shares. Management fees and administrative expenses are included in the Fund’s performance. Returns
for periods greater than one year are compounded average annual rates of return.
1 Russell 2000® Growth Index is an unmanaged
index that measures the performance of those Russell 2000 Index companies with higher price-to-book ratios and higher forecasted growth values. It is not possible to invest directly in an index.
2 Russell 2000® Index is an unmanaged index that measures the performance of the 2,000 smallest companies in the Russell 3000® Index,
an index consisting of the 3,000 largest U.S. companies based on market capitalization.
PORTFOLIO SUMMARY
|
|
|
| Net Asset Value 12/31/16: |
|
$50.41 Per Share |
| Net Asset Value 6/30/16: |
|
$45.59 Per Share |
| Total Net Assets: |
|
$86.5 Million |
| Weighted Average Market Cap: |
|
$6.6 Billion |
TOP 10 HOLDINGS
1. Ultimate Software
Group, Inc.
2. Waste Connections, Inc.
3. Ulta Salon Cosmetics & Fragrance, Inc.
4. First Republic Bank/CA
5. Skyworks Solutions, Inc.
6. Scotts Miracle-Gro Co.
7. Aspen Technology, Inc.
8. Cardtronics, PLC
9. Dunkin’ Brands Group, Inc.
10. EMCOR Group, Inc.
Based on total net assets as of
December 31, 2016. Subject to change.
FUND DIVERSIFICATION
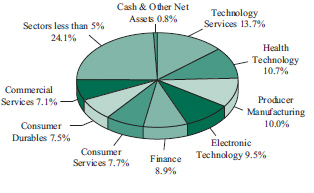
Based on total net assets as of December 31, 2016. Subject to change.
SCHEDULE OF INVESTMENTS (Unaudited)
December 31, 2016
Sit Small Cap Growth
Fund
|
|
|
|
|
|
|
| |
|
|
|
|
| Quantity |
|
Name of Issuer |
|
Fair Value ($) |
|
| |
|
|
| Common Stocks - 99.2% |
|
| Commercial Services - 7.1% |
|
| 40,100 |
|
Booz Allen Hamilton Holding Corp. |
|
|
1,446,407 |
|
| 30,525 |
|
Cardtronics, PLC * |
|
|
1,665,749 |
|
| 8,800 |
|
Deluxe Corp. |
|
|
630,168 |
|
| 11,800 |
|
ICF International, Inc. * |
|
|
651,360 |
|
| 9,300 |
|
Nautilus, Inc. * |
|
|
172,050 |
|
| 36,000 |
|
On Assignment, Inc. * |
|
|
1,589,760 |
|
|
|
|
|
|
|
|
|
|
|
|
|
|
|
|
6,155,494 |
|
|
|
|
|
|
|
|
|
| Communications - 1.8% |
|
| 8,950 |
|
SBA Communications Corp. * |
|
|
924,177 |
|
| 22,300 |
|
Shenandoah Telecommunications Co. |
|
|
608,790 |
|
|
|
|
|
|
|
|
|
|
|
|
|
|
|
|
1,532,967 |
|
|
|
|
|
|
|
|
|
| Consumer Durables - 7.5% |
|
| 23,500 |
|
Century Communities, Inc. * |
|
|
493,500 |
|
| 22,600 |
|
Ethan Allen Interiors, Inc. |
|
|
832,810 |
|
| 5,500 |
|
Polaris Industries, Inc. |
|
|
453,145 |
|
| 8,500 |
|
Snap-On, Inc. |
|
|
1,455,795 |
|
| 20,300 |
|
Take-Two Interactive Software, Inc.
* |
|
|
1,000,587 |
|
| 12,800 |
|
Tenneco, Inc. * |
|
|
799,616 |
|
| 11,200 |
|
Thor Industries, Inc. |
|
|
1,120,560 |
|
| 6,700 |
|
Tupperware Brands Corp. |
|
|
352,554 |
|
|
|
|
|
|
|
|
|
|
|
|
|
|
|
|
6,508,567 |
|
|
|
|
|
|
|
|
|
| Consumer Non-Durables - 1.2% |
|
| 10,400 |
|
B&G Foods, Inc. |
|
|
455,520 |
|
| 10,200 |
|
Pinnacle Foods, Inc. |
|
|
545,190 |
|
|
|
|
|
|
|
|
|
|
|
|
|
|
|
|
1,000,710 |
|
|
|
|
|
|
|
|
|
| Consumer Services - 7.7% |
|
| 9,900 |
|
Brinker International, Inc. |
|
|
490,347 |
|
| 3,000 |
|
Buffalo Wild Wings, Inc. * |
|
|
463,200 |
|
| 10,200 |
|
Capella Education Co. |
|
|
895,560 |
|
| 24,900 |
|
Cinemark Holdings, Inc. |
|
|
955,164 |
|
| 31,000 |
|
Dunkin’ Brands Group, Inc. |
|
|
1,625,640 |
|
| 5,900 |
|
Grand Canyon Education, Inc. * |
|
|
344,855 |
|
| 28,600 |
|
Service Corp. International |
|
|
812,240 |
|
| 6,600 |
|
Vail Resorts, Inc. |
|
|
1,064,646 |
|
|
|
|
|
|
|
|
|
|
|
|
|
|
|
|
6,651,652 |
|
|
|
|
|
|
|
|
|
| Electronic Technology - 9.5% |
|
| 18,000 |
|
Ambarella, Inc. * |
|
|
974,340 |
|
| 13,700 |
|
Arista Networks, Inc. * |
|
|
1,325,749 |
|
| 57,200 |
|
Ciena Corp. * |
|
|
1,396,252 |
|
| 15,700 |
|
MACOM Technology Solutions Holdings, Inc.
* |
|
|
726,596 |
|
| 7,075 |
|
MKS Instruments, Inc. |
|
|
420,255 |
|
| 9,200 |
|
Monolithic Power Systems, Inc. |
|
|
753,756 |
|
| 23,300 |
|
Skyworks Solutions, Inc. |
|
|
1,739,578 |
|
| 16,000 |
|
Synaptics, Inc. * |
|
|
857,280 |
|
|
|
|
|
|
|
|
|
|
|
|
|
|
|
|
8,193,806 |
|
|
|
|
|
|
|
|
|
|
|
|
|
|
|
| |
|
|
|
|
| Quantity |
|
Name of Issuer |
|
Fair Value ($) |
|
| |
|
|
| Energy Minerals - 0.9% |
|
| 20,950 |
|
Western Refining, Inc. |
|
|
792,958 |
|
|
|
|
|
|
|
|
|
| Finance - 8.9% |
|
| 6,800 |
|
Affiliated Managers Group, Inc. * |
|
|
988,040 |
|
| 6,800 |
|
East West Bancorp, Inc. |
|
|
345,644 |
|
| 18,900 |
|
First Republic Bank/CA |
|
|
1,741,446 |
|
| 26,600 |
|
Legg Mason, Inc. |
|
|
795,606 |
|
| 33,700 |
|
National General Holdings Corp. |
|
|
842,163 |
|
| 14,900 |
|
PacWest Bancorp |
|
|
811,156 |
|
| 50,400 |
|
Physicians Realty Trust |
|
|
955,584 |
|
| 2,600 |
|
SVB Financial Group * |
|
|
446,316 |
|
| 14,000 |
|
Validus Holdings, Ltd. |
|
|
770,140 |
|
|
|
|
|
|
|
|
|
|
|
|
|
|
|
|
7,696,095 |
|
|
|
|
|
|
|
|
|
| Health Services - 3.9% |
|
| 11,800 |
|
Envision Healthcare Corp. * |
|
|
746,822 |
|
| 31,500 |
|
Healthcare Services Group, Inc. |
|
|
1,233,855 |
|
| 8,450 |
|
HealthSouth Corp. |
|
|
348,478 |
|
| 12,725 |
|
Patterson Cos, Inc. |
|
|
522,107 |
|
| 13,000 |
|
Team Health Holdings, Inc. * |
|
|
564,850 |
|
|
|
|
|
|
|
|
|
|
|
|
|
|
|
|
3,416,112 |
|
|
|
|
|
|
|
|
|
| Health Technology - 10.7% |
|
| 6,700 |
|
Alexion Pharmaceuticals, Inc. * |
|
|
819,745 |
|
| 12,000 |
|
Align Technology, Inc. * |
|
|
1,153,560 |
|
| 5,400 |
|
Bio-Techne Corp. |
|
|
555,282 |
|
| 9,500 |
|
Celgene Corp. * |
|
|
1,099,625 |
|
| 2,700 |
|
DexCom, Inc. * |
|
|
161,190 |
|
| 50,100 |
|
Halozyme Therapeutics, Inc. * |
|
|
494,988 |
|
| 17,900 |
|
Ionis Pharmaceuticals, Inc. * |
|
|
856,157 |
|
| 66,000 |
|
K2M Group Holdings, Inc. * |
|
|
1,322,640 |
|
| 17,100 |
|
NxStage Medical, Inc. * |
|
|
448,191 |
|
| 8,400 |
|
PerkinElmer, Inc. |
|
|
438,060 |
|
| 15,900 |
|
STERIS, PLC |
|
|
1,071,501 |
|
| 34,800 |
|
VWR Corp. * |
|
|
871,044 |
|
|
|
|
|
|
|
|
|
|
|
|
|
|
|
|
9,291,983 |
|
|
|
|
|
|
|
|
|
| Industrial Services - 4.2% |
|
| 22,900 |
|
EMCOR Group, Inc. |
|
|
1,620,404 |
|
| 25,800 |
|
Waste Connections, Inc. |
|
|
2,027,622 |
|
|
|
|
|
|
|
|
|
|
|
|
|
|
|
|
3,648,026 |
|
|
|
|
|
|
|
|
|
| Process Industries - 3.0% |
|
| 16,200 |
|
Apogee Enterprises, Inc. |
|
|
867,672 |
|
| 18,100 |
|
Scotts Miracle-Gro Co. |
|
|
1,729,455 |
|
|
|
|
|
|
|
|
|
|
|
|
|
|
|
|
2,597,127 |
|
|
|
|
|
|
|
|
|
| Producer Manufacturing - 10.0% |
|
| 6,700 |
|
Anixter International, Inc. * |
|
|
543,035 |
|
| 22,325 |
|
Atkore International Group, Inc. * |
|
|
533,791 |
|
| 12,500 |
|
CLARCOR, Inc. |
|
|
1,030,875 |
|
| 15,800 |
|
Crane Co. |
|
|
1,139,496 |
|
| 6,500 |
|
Hubbell, Inc. |
|
|
758,550 |
|
|
|
|
| See accompanying notes to financial statements. |
|
|
|
40 |
|
SIT MUTUAL FUNDS
SEMI-ANNUAL REPORT |
|
|
|
|
|
|
|
| |
|
|
|
|
| Quantity |
|
Name of Issuer |
|
Fair Value ($) |
|
| |
|
|
|
|
| 8,100 |
|
IDEX Corp. |
|
|
729,486 |
|
| 17,700 |
|
ITT, Inc. |
|
|
682,689 |
|
| 8,300 |
|
Lincoln Electric Holdings, Inc. |
|
|
636,361 |
|
| 6,600 |
|
MSA Safety, Inc. |
|
|
457,578 |
|
| 16,800 |
|
Orbital ATK, Inc. |
|
|
1,473,864 |
|
| 8,400 |
|
Wabtec Corp. |
|
|
697,368 |
|
|
|
|
|
|
|
|
|
|
|
|
|
|
|
|
8,683,093 |
|
|
|
|
|
|
|
|
|
| Retail Trade - 3.8% |
|
| 3,400 |
|
Big Lots, Inc. |
|
|
170,714 |
|
| 8,100 |
|
Camping World Holdings, Inc. |
|
|
263,979 |
|
| 8,400 |
|
Casey’s General Stores, Inc. |
|
|
998,592 |
|
| 7,100 |
|
Ulta Salon Cosmetics & Fragrance, Inc.
* |
|
|
1,810,074 |
|
|
|
|
|
|
|
|
|
|
|
|
|
|
|
|
3,243,359 |
|
|
|
|
|
|
|
|
|
| Technology Services - 13.7% |
|
| 13,100 |
|
ANSYS, Inc. * |
|
|
1,211,619 |
|
| 31,300 |
|
Aspen Technology, Inc. * |
|
|
1,711,484 |
|
| 14,000 |
|
comScore, Inc. * |
|
|
442,120 |
|
| 10,900 |
|
DST Systems, Inc. |
|
|
1,167,935 |
|
| 18,300 |
|
Euronet Worldwide, Inc. * |
|
|
1,325,469 |
|
| 6,800 |
|
Fair Isaac Corp. |
|
|
810,696 |
|
| 12,550 |
|
GoDaddy, Inc. * |
|
|
438,622 |
|
| 25,400 |
|
Manhattan Associates, Inc. * |
|
|
1,346,962 |
|
| 33,100 |
|
Synchronoss Technologies, Inc. * |
|
|
1,267,730 |
|
| 11,500 |
|
Ultimate Software Group, Inc. * |
|
|
2,097,025 |
|
|
|
|
|
|
|
|
|
|
|
|
|
|
|
|
11,819,662 |
|
|
|
|
|
|
|
|
|
|
|
|
|
|
|
| |
|
|
|
|
| Quantity |
|
Name of Issuer |
|
Fair Value ($) |
|
| |
|
|
| Transportation - 4.1% |
|
| 16,200 |
|
Alaska Air Group, Inc. |
|
|
1,437,426 |
|
| 17,700 |
|
Echo Global Logistics, Inc. * |
|
|
443,385 |
|
| 21,800 |
|
Marten Transport, Ltd. |
|
|
507,940 |
|
| 15,000 |
|
Ryder System, Inc. |
|
|
1,116,600 |
|
|
|
|
|
|
|
|
|
|
|
|
|
|
|
|
3,505,351 |
|
|
|
|
|
|
|
|
|
| Utilities - 1.2% |
|
| 12,107 |
|
Fortis, Inc. |
|
|
373,864 |
|
| 10,100 |
|
Spire, Inc. |
|
|
651,955 |
|
|
|
|
|
|
|
|
|
|
|
|
|
|
|
|
1,025,819 |
|
|
|
|
|
|
|
|
|
|
| Total Common Stocks
(cost: $59,329,935) |
|
|
85,762,781 |
|
|
|
|
|
|
|
|
|
|
| Short-Term Securities - 1.0% |
|
|
|
|
| 877,840 |
|
Fidelity Instl. Money Mkt. Govt. Fund, 0.39% |
|
|
|
| Total Short-Term Securities
(cost: $877,840) |
|
|
877,840 |
|
|
|
|
|
|
|
|
|
|
| Total Investments in Securities - 100.2%
(cost: $60,207,775) |
|
|
86,640,621 |
|
| Other Assets and Liabilities, net - (0.2%) |
|
|
(137,976 |
) |
|
|
|
|
|
|
|
|
|
| Total Net Assets - 100.0% |
|
|
$86,502,645 |
|
|
|
|
|
|
|
|
| * |
Non-income producing security. |
Numeric footnotes not disclosed are not applicable to
this Schedule of Investments.
PLC — Public Limited Company
A summary of the levels
for the Fund’s investments as of December 31, 2016 is as follows (see Note 2 - significant accounting policies in the notes to financial statements):
|
|
|
|
|
|
|
|
|
|
|
|
|
| |
|
Investment in Securities |
|
| |
|
Level 1 |
|
|
Level 2 |
|
Level 3 |
|
|
|
| |
|
Quoted
Price ($) |
|
|
Other significant
observable inputs ($) |
|
Significant
unobservable inputs ($) |
|
Total ($) |
|
| Common Stocks ** |
|
|
85,762,781 |
|
|
— |
|
— |
|
|
85,762,781 |
|
| Short-Term Securities |
|
|
877,840 |
|
|
— |
|
— |
|
|
877,840 |
|
|
|
|
|
|
| Total: |
|
|
86,640,621 |
|
|
— |
|
— |
|
|
86,640,621 |
|
| ** |
For equity securities categorized in a single level, refer to the Schedule of Investments for further breakdown. |
For the reporting period, there were no transfers between levels 1, 2 and 3.
|
|
|
| See accompanying notes to financial statements. |
|
|
| DECEMBER 31, 2016 |
|
41 |
|
| |
|
Sit International Growth Fund |
OBJECTIVE STRATEGY
The objective of the Sit International Growth Fund is long-term growth. The Fund seeks to achieve its objective by investing at least 90% of
its net assets in common stocks of growth companies domiciled outside the United States. In selecting investments for the Fund, the Adviser begins by selecting countries or regions in which to invest by considering several factors affecting the
economy and equity market of foreign countries and regions. After the country and regional allocations are determined, the Adviser seeks industries and sectors that it believes have earnings growth prospects that are greater than the average. Within
the selected industries and sectors, the Adviser invests in foreign growth-oriented companies it believes exhibit the potential for superior growth.
For the six-month period ended December 31 2016, the Sit International Growth Fund
generated a total return of -2.21% versus total returns of +5.67% and -0.84% for the MSCI EAFE and MSCI EAFE Growth indices, respectively. An overweight in food/beverage/ tobacco stocks, an underweight position in bank stocks, and poor stock
selection within the auto sector contributed to underperformance relative to the MSCI EAFE Index. The portfolio was also negatively impacted by the strong performance of value-oriented and U.S.-exposed stocks following the surprise presidential
election victory of Donald Trump on November 8th.
Looking forward, we believe
the performance of European equities will remain choppy in response to both political and global macroeconomic events. However, investors will likely begin to anticipate diminished political risk heading into 2018 and the potential for improved
fiscal/corporate spending, implying a solid underlying bid for European stocks as we move through the year. We do not expect a “rising tide lifts all boats” scenario by any means and remain selective with regard to our sector, end market,
and company-specific exposures. Given the negative impact of a strong U.S. dollar and a myriad of other concerns, we are underweighting stocks with significant emerging market exposure and prefer companies that are either plays on domestic
secular/cyclical/niche growth, address markets where there is pent-up demand, benefit from modest inflation/rising global yields, and/or have meaningful exposure to the United States. As such, we have recently increased weightings in financial
stocks (insurance and banks) that will benefit from the potential for lower regulation and a steeper interest rate curve in the United States as well as a modestly improving banking environment in Europe. We have also been selectively pursuing other
beneficiaries of President-elect Trump’s policies in terms of lower taxes, infrastructure spending, and deregulation, while also being cognizant of the various risks associated with tax, currency, and trade issues.
Outflows from Japan equities have abated and valuations remain cheap relative to other global equity markets. However, we continue to remain
meaningfully underweight Japan given our cautious view on the economy’s long-term growth prospects. The key concern remains the ability of “Abenomics” to overcome the substantial structural challenges of a declining population, rigid
labor market, and elevated debt levels. Within our Japanese holdings, we increasingly prefer beneficiaries from a weaker yen such as exporters and multinationals that benefit from favorable currency translation as well as those leveraged to regions
where growth prospects are improving, such as the US. We round out Japanese holdings with defensive domestic
HYPOTHETICAL GROWTH OF $10,000
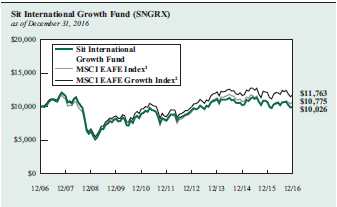
The chart above illustrates the total value of a hypothetical $10,000 investment in the Fund over the past
10 years as compared to the performance of the MSCI EAFE Index and MSCI EAFE Growth Index. The primary index used to compare the Fund’s performance was changed to the MSCI EAFE Index from the MSCI EAFE Growth Index because the Investment
Adviser believes that the MSCI EAFE Index more accurately reflects the Fund’s investment objectives and strategies. Past performance does not guarantee future results. Returns include the reinvestment of distributions. The chart does not
reflect the deduction of taxes that a shareholder would pay on Fund distributions or the redemption of Fund shares.
1 MSCI EAFE
Index (Europe, Australasia, Far East) is an unmanaged free float-adjusted market capitalization index that measures the equity market performance of developed markets, excluding the US & Canada. This is the Fund’s primary index.
2 MSCI EAFE Growth Index (Europe, Australasia, Far East) is an unmanaged free float-adjusted market capitalization index that
measures the equity market performance of growth oriented stocks of developed markets excluding the US & Canada.
consumption stocks that stand to best weather a subdued domestic growth environment. Across all holdings, we focus on names with proprietary
technologies and/or well-entrenched leading market positions, quality earnings, and strong balance sheets.
While we only expect a mild
slowdown in the economy in 2017, capital outflow concerns are likely to linger in China. Concerns on potential rising trade tensions with the incoming U.S. administration may also limit near-term upside. However, looking beyond near-term
cautiousness, we are maintaining our China Internet exposure despite its recent underperformance, as growth remains solid and the outlook is positive. We expect these stocks to outperform the market once macro concerns fade, as we have seen in the
past.
Roger J. Sit Tasha M. Murdoff
Portfolio Managers
|
|
|
|
42 |
|
SIT MUTUAL FUNDS
SEMI-ANNUAL REPORT |
COMPARATIVE RATES OF RETURNS
|
|
|
|
|
|
|
|
|
| as of December 31, 2016 |
|
|
|
|
| |
|
Sit
International
Growth
Fund |
|
MSCI EAFE
Index 1 |
|
MSCI EAFE
Growth
Index 2 |
|
| Six Month |
|
-2.21% |
|
5.67% |
|
|
-0.84% |
|
| One Year |
|
-6.66 |
|
1.00 |
|
|
-3.04 |
|
| Five Year |
|
4.72 |
|
6.53 |
|
|
6.67 |
|
| Ten Year |
|
0.03 |
|
0.75 |
|
|
1.64 |
|
| Since Inception
(11/1/91) |
|
3.48 |
|
4.93 |
|
|
3.81 |
|
Performance figures are historical and do not guarantee future results. Investment returns and principal
value will vary, and you may have a gain or loss when you sell shares. Current performance may be lower or higher than the performance data quoted. Contact the Fund for performance data current to the most recent month-end. Returns include changes
in share price as well as reinvestment of all dividends and capital gains and all fee waivers. Without the fee waivers total return and yield figures would have been lower. Returns do not reflect the deduction of the 2% redemption fee imposed if
shares are redeemed or exchanged within 30 calendar days from their date of purchase. If imposed, the fee would reduce the performance quoted. Returns do not reflect the deduction of taxes that a shareholder would pay on Fund distributions or the
redemption of Fund shares. Management fees and administrative expenses are included in the Fund’s performance. Returns for periods greater than one year are compounded average annual rates of return.
The index used to compare the Fund’s performance was changed to the MSCI EAFE Index from the MSCI EAFE Growth Index because the
Investment Adviser believes that the MSCI EAFE Index more accurately reflects the Fund’s investment objectives and strategies. It is not possible to invest directly in an index.
1 MSCI EAFE Index (Europe, Australasia, Far East) is an unmanaged free float-adjusted market capitalization index that measures the equity
market performance of developed markets, excluding the US & Canada.
2 MSCI EAFE Growth Index (Europe, Australasia, Far
East) is an unmanaged free float-adjusted market capitalization index that measures the equity market performance of growth oriented stocks of developed markets excluding the US & Canada.
|
|
|
|
|
| FUND DIVERSIFICATION - BY REGION |
| |
|
Sit Int’l
Growth Fund |
|
MSCI EAFE
Index |
| Europe |
|
64.0% |
|
60.9% |
| Asia |
|
25.3 |
|
38.4 |
| North America |
|
8.5 |
|
— |
| Africa/Middle East |
|
0.0 |
|
0.7 |
| Cash & Other Net Assets
|
|
2.2 |
|
— |
Based on total net assets as of December 31, 2016. Subject to change.
|
|
|
|
|
| PORTFOLIO SUMMARY |
|
|
|
|
|
|
| Net Asset Value 12/31/16: |
|
|
$14.09 Per Share |
|
| Net Asset Value 6/30/16: |
|
|
$14.48 Per Share |
|
| Total Net Assets: |
|
|
$19.6 Million |
|
| Weighted Average Market Cap: |
|
|
$58.9 Billion |
|
|
| TOP 10 HOLDINGS |
|
| 1. Nestle SA |
| 2. ING Groep NV |
| 3. Astellas Pharma, Inc. |
| 4. Iberdrola SA |
| 5. Siemens AG |
| 6. DS Smith, PLC |
| 7. RELX NV |
| 8. Reckitt Benckiser Group, PLC |
| 9. Diageo, PLC, ADR |
| 10. British American Tobacco, PLC
|
Based on total net assets as of December 31, 2016. Subject to change.
FUND DIVERSIFICATION
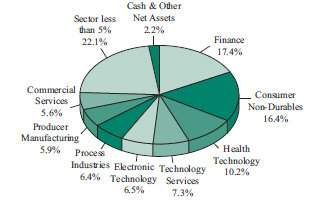
Based on total net assets as of December 31, 2016. Subject to change.
SCHEDULE OF INVESTMENTS (Unaudited)
December 31, 2016
Sit International
Growth Fund
|
|
|
|
|
|
|
| |
|
|
|
|
| Quantity |
|
Name of Issuer |
|
Fair Value ($) |
|
| |
|
|
| Common Stocks - 96.6% |
|
| Asia - 24.1% |
|
| Australia - 1.0% |
|
| 8,300 |
|
Westpac Banking Corp., ADR |
|
|
194,884 |
|
|
|
|
|
|
|
|
| China/Hong Kong - 6.5% |
|
| 32,200 |
|
AIA Group, Ltd. |
|
|
180,379 |
|
| 2,075 |
|
Alibaba Group Holding, Ltd., ADR * |
|
|
182,206 |
|
| 7,025 |
|
HSBC Holdings, PLC, ADR |
|
|
282,264 |
|
| 79,500 |
|
Techtronic Industries Co., Ltd. |
|
|
284,489 |
|
| 13,900 |
|
Tencent Holdings, Ltd. |
|
|
337,035 |
|
|
|
|
|
|
|
|
|
|
|
|
|
|
|
|
1,266,373 |
|
|
|
|
|
|
|
|
| Japan - 12.2% |
|
| 13,900 |
|
Ajinomoto Co., Inc. |
|
|
279,704 |
|
| 14,600 |
|
Asics Corp. |
|
|
290,948 |
|
| 33,700 |
|
Astellas Pharma, Inc. |
|
|
467,532 |
|
| 25,600 |
|
Daicel Corp. |
|
|
281,448 |
|
| 200 |
|
Keyence Corp. |
|
|
136,850 |
|
| 2,100 |
|
Makita Corp. |
|
|
140,320 |
|
| 49,600 |
|
Mitsubishi UFJ Financial Group, Inc., ADR |
|
|
305,536 |
|
| 3,500 |
|
Secom Co., Ltd. |
|
|
255,724 |
|
| 6,600 |
|
Suzuki Motor Corp. |
|
|
231,719 |
|
|
|
|
|
|
|
|
|
|
|
|
|
|
|
|
2,389,781 |
|
|
|
|
|
|
|
|
| Singapore - 2.4% |
|
| 1,850 |
|
Broadcom, Ltd. |
|
|
327,024 |
|
| 12,000 |
|
DBS Group Holdings, Ltd. |
|
|
143,170 |
|
|
|
|
|
|
|
|
|
|
|
|
|
|
|
|
470,194 |
|
|
|
|
|
|
|
|
| South Korea - 2.0% |
|
| 6,200 |
|
Korea Electric Power Corp. |
|
|
226,164 |
|
| 235 |
|
Samsung Electronics Co., Ltd., GDR |
|
|
174,725 |
|
|
|
|
|
|
|
|
|
|
|
|
|
|
|
|
400,889 |
|
|
|
|
|
|
|
|
| Europe - 64.0% |
|
| Belgium - 1.5% |
|
| 2,870 |
|
Anheuser-Busch InBev NV, ADR |
|
|
302,613 |
|
|
|
|
|
|
|
|
| France - 9.7% |
|
| 8,250 |
|
AXA SA |
|
|
207,973 |
|
| 4,870 |
|
BNP Paribas SA |
|
|
309,918 |
|
| 3,225 |
|
Dassault Systemes SA |
|
|
245,475 |
|
| 2,300 |
|
DBV Technologies SA * |
|
|
160,305 |
|
| 2,500 |
|
Ingenico Group SA |
|
|
199,465 |
|
| 3,825 |
|
Safran SA |
|
|
275,110 |
|
| 2,300 |
|
Schlumberger, Ltd. |
|
|
193,085 |
|
| 1,265 |
|
Unibail-Rodamco SE |
|
|
301,457 |
|
|
|
|
|
|
|
|
|
|
|
|
|
|
|
|
1,892,788 |
|
|
|
|
|
|
|
|
| Germany - 5.5% |
|
| 1,815 |
|
Allianz SE |
|
|
299,545 |
|
| 2,960 |
|
Aurelius SE & Co. |
|
|
173,063 |
|
|
|
|
|
|
|
|
| |
|
|
|
|
| Quantity |
|
Name of Issuer |
|
Fair Value ($) |
|
| |
|
|
|
|
| 1,100 |
|
Linde AG |
|
|
180,442 |
|
| 3,425 |
|
Siemens AG |
|
|
419,358 |
|
|
|
|
|
|
|
|
|
|
|
|
|
|
|
|
1,072,408 |
|
|
|
|
|
|
|
|
| Ireland - 2.5% |
|
| 2,900 |
|
CRH, PLC, ADR |
|
|
99,702 |
|
| 5,400 |
|
Medtronic, PLC |
|
|
384,642 |
|
|
|
|
|
|
|
|
|
|
|
|
|
|
|
|
484,344 |
|
|
|
|
|
|
|
|
| Netherlands - 9.6% |
|
| 1,325 |
|
ASML Holding NV |
|
|
148,665 |
|
| 3,200 |
|
Galapagos NV * |
|
|
204,945 |
|
| 34,900 |
|
ING Groep NV |
|
|
491,350 |
|
| 4,375 |
|
LyondellBasell Industries NV |
|
|
375,288 |
|
| 6,350 |
|
Mobileye NV * |
|
|
242,062 |
|
| 24,200 |
|
RELX NV |
|
|
407,042 |
|
|
|
|
|
|
|
|
|
|
|
|
|
|
|
|
1,869,352 |
|
|
|
|
|
|
|
|
| Spain - 4.0% |
|
| 66,900 |
|
Iberdrola SA |
|
|
438,055 |
|
| 10,300 |
|
Industria de Diseno Textil SA |
|
|
350,881 |
|
|
|
|
|
|
|
|
|
|
|
|
|
|
|
|
788,936 |
|
|
|
|
|
|
|
|
| Switzerland - 8.0% |
|
| 140 |
|
Interroll Holding AG |
|
|
152,607 |
|
| 7,470 |
|
Nestle SA |
|
|
535,133 |
|
| 3,325 |
|
Novartis AG |
|
|
241,806 |
|
| 1,470 |
|
Roche Holding AG |
|
|
335,090 |
|
| 1,120 |
|
Zurich Insurance Group AG |
|
|
307,798 |
|
|
|
|
|
|
|
|
|
|
|
|
|
|
|
|
1,572,434 |
|
|
|
|
|
|
|
|
| United Kingdom - 23.2% |
|
| 10,500 |
|
Ashtead Group, PLC |
|
|
204,125 |
|
| 4,875 |
|
ASOS, PLC * |
|
|
297,854 |
|
| 25,300 |
|
Babcock International Group, PLC |
|
|
296,756 |
|
| 6,790 |
|
British American Tobacco, PLC |
|
|
384,828 |
|
| 5,500 |
|
Cardtronics, PLC * |
|
|
300,135 |
|
| 22,900 |
|
Cineworld Group, PLC |
|
|
159,198 |
|
| 7,525 |
|
Coca-Cola European Partners, PLC |
|
|
236,285 |
|
| 3,050 |
|
Delphi Automotive, PLC |
|
|
205,418 |
|
| 3,750 |
|
Diageo, PLC, ADR |
|
|
389,775 |
|
| 83,000 |
|
DS Smith, PLC |
|
|
416,795 |
|
| 66,700 |
|
Greencore Group, PLC |
|
|
202,282 |
|
| 32,501 |
|
Just Eat, PLC * |
|
|
233,537 |
|
| 5,725 |
|
Nielsen Holdings, PLC |
|
|
240,164 |
|
| 4,700 |
|
Reckitt Benckiser Group, PLC |
|
|
398,130 |
|
| 4,500 |
|
Royal Dutch Shell, PLC, ADR - Class A |
|
|
244,710 |
|
| 2,200 |
|
Royal Dutch Shell, PLC, ADR - Class B |
|
|
127,534 |
|
| 3,000 |
|
STERIS, PLC |
|
|
202,170 |
|
|
|
|
|
|
|
|
|
|
|
|
|
|
|
|
4,539,696 |
|
|
|
|
|
|
|
|
|
|
|
| See accompanying notes to financial statements. |
|
|
|
44 |
|
SIT MUTUAL FUNDS
SEMI-ANNUAL REPORT |
|
|
|
|
|
|
|
| |
|
|
|
|
| Quantity |
|
Name of Issuer |
|
Fair Value ($) |
|
| |
|
|
|
| North America - 8.5% |
|
|
|
|
| Canada - 5.3% |
|
| 6,925 |
|
BCE, Inc. |
|
|
299,437 |
|
| 7,600 |
|
Gildan Activewear, Inc. |
|
|
192,812 |
|
| 10,600 |
|
Suncor Energy, Inc. |
|
|
346,514 |
|
| 2,500 |
|
Waste Connections, Inc. |
|
|
196,475 |
|
|
|
|
|
|
|
|
|
|
|
|
|
|
|
|
1,035,238 |
|
|
|
|
|
|
|
|
| United States - 3.2% |
|
| 3,675 |
|
Cognizant Technology Solutions Corp.
* |
|
|
205,910 |
|
| 3,275 |
|
Euronet Worldwide, Inc. * |
|
|
237,208 |
|
| 120 |
|
priceline.com, Inc. * |
|
|
175,927 |
|
|
|
|
|
|
|
|
|
|
|
|
|
|
|
|
619,045 |
|
|
|
|
|
|
|
|
|
|
| Total Common Stocks
(cost: $18,174,530) |
|
|
18,898,975 |
|
|
|
|
|
|
|
|
|
|
| Investment Companies - 1.2% |
|
|
|
|
| 8,700 |
|
iShares MSCI India ETF |
|
|
233,247 |
|
|
|
|
|
|
|
|
| (cost: $258,887) |
|
|
|
|
|
|
| Short-Term Securities - 1.9% |
|
|
|
|
| 366,006 |
|
Fidelity Instl. Money Mkt. Govt. Fund, 0.39% |
|
|
|
| Total Short-Term Securities
(cost: $366,006) |
|
|
366,006 |
|
|
|
|
|
|
|
|
| Total Investments in Securities - 99.7%
(cost: $18,799,423) |
|
|
19,498,228 |
|
| Other Assets and Liabilities, net - 0.3% |
|
|
66,160 |
|
|
|
|
|
|
|
|
|
|
| Total Net Assets - 100.0% |
|
|
$19,564,388 |
|
|
|
|
|
|
|
|
| * |
Non-income producing security. |
Numeric footnotes not disclosed are not applicable to this Schedule of Investments.
ADR — American Depositary Receipt
GDR — Global Depositary Receipt
PLC — Public Limited Company
|
|
|
| See accompanying notes to financial statements. |
|
|
| DECEMBER 31, 2016 |
|
45 |
SCHEDULE OF INVESTMENTS (Unaudited)
December 31, 2016
Sit International
Growth Fund (Continued)
A summary of the levels for the Fund’s investments as of December 31, 2016 is as follows (see Note 2 - significant accounting
policies in the notes to financial statements):
|
|
|
|
|
|
|
|
|
|
|
|
|
|
|
|
|
| |
|
Investment in Securities |
|
| |
|
Level 1
Quoted Price
($) |
|
|
Level 2
Other significant
observable inputs ($) |
|
|
Level 3
Significant
unobservable inputs ($) |
|
|
Total ($) |
|
| Common Stocks |
|
|
|
|
|
|
|
|
|
|
|
|
|
|
|
|
| Australia |
|
|
194,884 |
|
|
|
— |
|
|
|
— |
|
|
|
194,884 |
|
| Belgium |
|
|
302,613 |
|
|
|
— |
|
|
|
— |
|
|
|
302,613 |
|
| Canada |
|
|
1,035,238 |
|
|
|
— |
|
|
|
— |
|
|
|
1,035,238 |
|
| China/Hong Kong |
|
|
464,470 |
|
|
|
801,903 |
|
|
|
— |
|
|
|
1,266,373 |
|
| France |
|
|
193,085 |
|
|
|
1,699,703 |
|
|
|
— |
|
|
|
1,892,788 |
|
| Germany |
|
|
— |
|
|
|
1,072,408 |
|
|
|
— |
|
|
|
1,072,408 |
|
| Ireland |
|
|
484,344 |
|
|
|
— |
|
|
|
— |
|
|
|
484,344 |
|
| Japan |
|
|
305,536 |
|
|
|
2,084,245 |
|
|
|
— |
|
|
|
2,389,781 |
|
| Netherlands |
|
|
766,015 |
|
|
|
1,103,337 |
|
|
|
— |
|
|
|
1,869,352 |
|
| Singapore |
|
|
327,024 |
|
|
|
143,170 |
|
|
|
— |
|
|
|
470,194 |
|
| South Korea |
|
|
— |
|
|
|
400,889 |
|
|
|
— |
|
|
|
400,889 |
|
| Spain |
|
|
— |
|
|
|
788,936 |
|
|
|
— |
|
|
|
788,936 |
|
| Switzerland |
|
|
152,607 |
|
|
|
1,419,827 |
|
|
|
— |
|
|
|
1,572,434 |
|
| United Kingdom |
|
|
1,946,191 |
|
|
|
2,593,505 |
|
|
|
— |
|
|
|
4,539,696 |
|
| United States |
|
|
619,045 |
|
|
|
— |
|
|
|
— |
|
|
|
619,045 |
|
| Investment Companies |
|
|
233,247 |
|
|
|
— |
|
|
|
— |
|
|
|
233,247 |
|
| Short-Term Securities |
|
|
366,006 |
|
|
|
— |
|
|
|
— |
|
|
|
366,006 |
|
|
|
|
|
|
| Total: |
|
|
7,390,305 |
|
|
|
12,107,923 |
|
|
|
— |
|
|
|
19,498,228 |
|
The Fund adjusts the closing price of foreign equity securities by applying a systematic process for events
occurring after the close of the foreign exchanges. At each reporting period, this process is applied for all foreign securities and therefore all foreign securities are classified as level 2. There are no transfers between level 1 and level 2
between reporting periods as a result of applying this process. Level 1 securities of foreign issuers are primarily American Depositary Receipts (ADRs), Public Limited Companies (PLCs) or Global Depositary Receipts (GDRs). There were no transfers
into or out of level 3 during the reporting period.
|
|
|
| See accompanying notes to financial statements. |
|
|
|
46 |
|
SIT MUTUAL FUNDS
SEMI-ANNUAL REPORT |
[This page intentionally left blank.]
|
| |
|
Sit Developing Markets Growth Fund |
OBJECTIVE & STRATEGY
The objective of the Sit Developing Markets Growth Fund is to seek maximize long-term capital appreciation. The Fund seeks to achieve its
objective by investing at least 80% of its net assets in common stocks of companies domiciled or operating in a developing market. In selecting investments for the Fund, the Adviser begins by selecting countries or regions in which to invest by
considering several factors affecting the economy and equity market of foreign countries and regions. After the country and regional allocations are determined, the Adviser seeks industries and sectors that appear to have strong earnings growth
prospects. Within the selected industries and sectors, the Adviser invests in foreign growth-oriented companies it believes exhibit the potential for superior growth.
The Sit Developing Markets Growth Fund declined -0.39% for the six-month period ended
December 31, 2016, underperforming the MSCI Emerging Markets Index’s +3.38% return. Emerging markets’ performance was affected by concerns over weakness in China’s economy, debt-fueled growth in China, President-elect Donald
Trump’s possible policies on trade, and higher U.S. interest rates. China’s economy remains the engine of global growth and fears over slower economic growth impact other economies.
China’s 2017 economic growth target is about 6.5%, reinforcing a policy shift from supporting growth to pushing reforms to contain high
debt and an overheating property market. The Chinese Renminbi depreciated -7% against the U.S. dollar in 2016, and with rising depreciation expectations, capital outflow pressure continues.
India’s economy continues to show strength from consumer spending and manufacturing, but the rupee demonetization was a setback. The
demonetization affected 86% of the cash in circulation and constrained consumer spending. The NAFTA issue creates uncertainty for Mexico’s economy, as they have the highest external trade of 73% of GDP. Trump’s other potential negatives
are taxation of workers’ remittances, the building of a wall along the U.S.-Mexico border, massive deportations of Mexicans, and fiscal stimulus in the U.S. to discourage U.S. firms from investing abroad. Brazil’s economic outlook remains
tepid, with domestic demand weak and industrial production growth negative.
The software & services (Tencent), technology
hardware (Skyworks Solutions, Hon Hai), and consumer services (TAL Education) sectors helped contribute to relative outperformance. The sectors of utilities (Korea Electric Power, ENN Energy), food & staples retailing (BIM Birlesik
Magazalar, Alsea), and media (CJ CGV) had the most negative relative underperformance. The Funds underweight in telecommunication services contributed positively to allocation. However, our underweight in the materials and energy sectors hurt our
performance. Our overweight in Israel and underweight in Russia also contributed negatively. Conversely, our underweight in Mexico and overweight in Singapore had a positive impact.
In China, we have a modest overweight. We only expect a mild slowdown in the economy in 2017, but capital outflow concerns are likely to
linger. In addition, concerns on potential rising trade tensions with the incoming U.S. administration may also limit near-term upside.
HYPOTHETICAL GROWTH OF $10,000
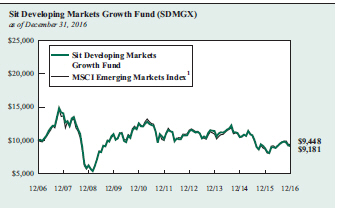
The chart above illustrates the total value of a hypothetical $10,000 investment in the Fund over the past
10 years as compared to the performance of the MSCI Emerging Markets Index. Past performance does not guarantee future results. Returns include the reinvestment of distributions. The chart does not reflect the deduction of taxes that a shareholder
would pay on Fund distributions or the redemption of Fund shares.
1 MSCI Emerging Markets Index is an unmanaged free float-adjusted
market capitalization index that measures equity market performance of emerging markets. It is not possible to invest directly in an index. This is the Fund’s primary index.
We are maintaining our China Internet
exposure, as growth remains solid and the outlook is positive. Our investment strategy in India is concentrated in consumer and financial sectors.
In Latin America, we remain underweight, especially in Mexico and Brazil. U.S. President-elect Donald Trump’s plan to renegotiate or
withdraw from the NAFTA will negatively affect Mexico’s economic growth. The industry most impacted by NAFTA by value of two-way trade with Canada and Mexico is the transportation equipment industry. We like Mexico’s consumer sector, as
private consumption remains robust, supported by workers’ remittances. In Brazil, we have turned slightly more positive on the market, but are uncertain of the country’s economic rebound from a recession. We are maintaining a defensive
strategy in Brazil, with a focus on consumer staples, exporters, and financials.
Roger J. Sit Raymond E. Sit
Portfolio Managers
|
|
|
|
48 |
|
SIT MUTUAL FUNDS
SEMI-ANNUAL REPORT |
COMPARATIVE RATES OF RETURN
|
|
|
|
|
|
|
|
|
| as of December 31, 2016 |
|
|
|
|
| |
|
Sit
Developing
Markets
Growth
Fund |
|
MSCI
Emerging
Markets
Index 1 |
|
MSCI
Emerging
Markets
Growth
Index 2 |
|
| Six Month |
|
-0.39% |
|
3.38% |
|
|
1.33% |
|
| One Year |
|
3.59 |
|
8.58 |
|
|
5.84 |
|
| Five Year |
|
-2.13 |
|
-1.21 |
|
|
0.87 |
|
| Ten Year |
|
-0.85 |
|
-0.57 |
|
|
-0.25 |
|
| Since Inception
(7/1/94) |
|
3.05 |
|
2.64 |
|
|
n/a |
|
Performance figures are historical and do not guarantee future results. Investment returns and principal value will vary, and you may have a
gain or loss when you sell shares. Current performance may be lower or higher than the performance data quoted. Contact the Fund for performance data current to the most recent month-end. Returns include changes in share price as well as
reinvestment of all dividends and capital gains. Returns do not reflect the deduction of the 2% redemption fee imposed if shares are redeemed or exchanged within 30 calendar days from their date of purchase. If imposed, the fee would reduce the
performance quoted. Returns do not reflect the deduction of taxes that a shareholder would pay on Fund distributions or the redemption of Fund shares. Management fees and administrative expenses are included in the Fund’s performance. Returns
for periods greater than one year are compounded average annual rates of return.
1 MSCI Emerging Markets Index is an unmanaged free
float-adjusted market capitalization index that measures equity market performance of emerging markets. It is not possible to invest directly in an index.
2 MSCI Emerging Markets Growth Index is an unmanaged free float-adjusted market capitalization index that measures equity market performance
of growth oriented emerging market stocks.
|
|
|
|
|
| FUND DIVERSIFICATION - BY REGION |
| |
|
Sit
Developing
Markets
Growth
Fund |
|
MSCI
Emerging
Markets
Index |
| Asia |
|
69.1% |
|
70.1% |
| Africa/Middle East |
|
11.1 |
|
9.0 |
| Latin America |
|
8.8 |
|
13.3 |
| North America |
|
4.9 |
|
— |
| Europe |
|
3.5 |
|
7.6 |
| Cash & Other Net Assets
|
|
2.6 |
|
— |
Based on total net assets as of December 31, 2016. Subject to change.
|
|
|
|
|
| PORTFOLIO SUMMARY |
|
|
|
|
|
|
| Net Asset Value 12/31/16: |
|
|
$12.18 Per Share |
|
| Net Asset Value 6/30/16: |
|
|
$12.26 Per Share |
|
| Total Net Assets: |
|
|
$6.9 Million |
|
| Weighted Average Market Cap: |
|
|
$64.2 Billion |
|
|
| TOP 10 HOLDINGS |
|
| 1. Tencent Holdings, Ltd. |
| 2. Samsung Electronics Co., Ltd. |
| 3. Naspers, Ltd. |
| 4. TAL Education Group, ADR |
| 5. Shinhan Financial Group Co., Ltd. |
| 6. iShares MSCI India ETF |
| 7. NICE Systems, Ltd., ADR |
| 8. China Construction Bank Corp. |
| 9. Taiwan Semiconductor Co. |
| 10. Alibaba Group Holding, Ltd., ADR
|
Based on total net assets as of December 31, 2016. Subject to change.
FUND DIVERSIFICATION
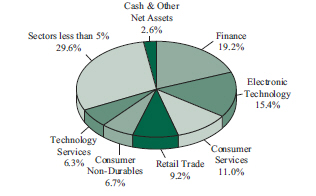
Based on total net assets as of December 31, 2016. Subject to change.
SCHEDULE OF INVESTMENTS (Unaudited)
December 31, 2016
Sit Developing
Markets Growth Fund
|
|
|
|
|
|
|
| |
|
|
|
|
| Quantity |
|
Name of Issuer |
|
Fair Value ($) |
|
| |
|
|
|
| Common Stocks - 94.1% |
|
|
|
|
| Africa/Middle East - 11.1% |
|
| Israel - 3.1% |
|
| 3,100 |
|
NICE Systems, Ltd., ADR |
|
|
213,156 |
|
|
|
|
|
|
|
|
|
| South Africa - 8.0% |
|
| 6,410 |
|
Bid Corp., Ltd. |
|
|
113,611 |
|
| 6,910 |
|
Bidvest Group, Ltd. |
|
|
90,986 |
|
| 1,800 |
|
Naspers, Ltd. |
|
|
262,785 |
|
| 3,050 |
|
Sasol, Ltd., ADR |
|
|
87,200 |
|
|
|
|
|
|
|
|
|
|
|
|
|
|
|
|
554,582 |
|
|
|
|
|
|
|
|
|
| Asia - 65.8% |
|
| China/Hong Kong - 29.7% |
|
| 14,600 |
|
AIA Group, Ltd. |
|
|
81,787 |
|
| 2,125 |
|
Alibaba Group Holding, Ltd., ADR * |
|
|
186,596 |
|
| 277,000 |
|
China Construction Bank Corp. |
|
|
212,135 |
|
| 4,600 |
|
China Life Insurance Co., Ltd., ADR |
|
|
59,202 |
|
| 50,000 |
|
China Mengniu Dairy Co., Ltd. |
|
|
95,873 |
|
| 3,300 |
|
China Mobile, Ltd., ADR |
|
|
173,019 |
|
| 750 |
|
CNOOC, Ltd., ADR |
|
|
92,970 |
|
| 120,000 |
|
CSPC Pharmaceutical Group, Ltd. |
|
|
127,773 |
|
| 1,825 |
|
Ctrip.com International, Ltd., ADR
* |
|
|
73,000 |
|
| 28,000 |
|
ENN Energy Holdings, Ltd. |
|
|
114,723 |
|
| 1,600 |
|
Hong Kong Exchanges & Clearing, Ltd. |
|
|
37,629 |
|
| 5,025 |
|
JD.com, Inc., ADR * |
|
|
127,836 |
|
| 1,350 |
|
PetroChina Co., Ltd., ADR |
|
|
99,495 |
|
| 3,350 |
|
TAL Education Group, ADR * |
|
|
235,003 |
|
| 13,900 |
|
Tencent Holdings, Ltd. |
|
|
337,035 |
|
|
|
|
|
|
|
|
|
|
|
|
|
|
|
|
2,054,076 |
|
|
|
|
|
|
|
|
|
| India - 3.4% |
|
| 1,925 |
|
HDFC Bank, Ltd., ADR |
|
|
116,809 |
|
| 3,400 |
|
Tata Motors, Ltd., ADR |
|
|
116,942 |
|
|
|
|
|
|
|
|
|
|
|
|
|
|
|
|
233,751 |
|
|
|
|
|
|
|
|
|
| Indonesia - 2.3% |
|
| 258,500 |
|
Astra International Tbk PT |
|
|
158,065 |
|
|
|
|
|
|
|
|
|
| Japan - 1.3% |
|
| 2,500 |
|
Suzuki Motor Corp. |
|
|
87,772 |
|
|
|
|
|
|
|
|
|
| Malaysia - 1.2% |
|
| 8,300 |
|
British American Tobacco Malaysia |
|
|
82,519 |
|
|
|
|
|
|
|
|
|
| Singapore - 3.6% |
|
| 675 |
|
Broadcom, Ltd. |
|
|
119,320 |
|
| 11,000 |
|
DBS Group Holdings, Ltd. |
|
|
131,239 |
|
|
|
|
|
|
|
|
|
|
|
|
|
|
|
|
250,559 |
|
|
|
|
|
|
|
|
|
| South Korea - 12.0% |
|
| 1,040 |
|
CJ CGV Co., Ltd. |
|
|
60,463 |
|
| 3,175 |
|
Korea Electric Power Corp. |
|
|
115,818 |
|
| 325 |
|
Medy-Tox, Inc. |
|
|
95,646 |
|
|
|
|
|
|
|
|
| |
|
|
|
|
| Quantity |
|
Name of Issuer |
|
Fair Value ($) |
|
| |
|
|
|
|
| 220 |
|
Samsung Electronics Co., Ltd. |
|
|
327,429 |
|
| 6,200 |
|
Shinhan Financial Group Co., Ltd. |
|
|
232,507 |
|
|
|
|
|
|
|
|
|
|
|
|
|
|
|
|
831,863 |
|
|
|
|
|
|
|
|
|
| Taiwan - 8.1% |
|
| 82,086 |
|
Cathay Financial Holding Co., Ltd. |
|
|
122,030 |
|
| 27,148 |
|
Hon Hai Precision Industry Co., Ltd., GDR |
|
|
137,912 |
|
| 13,000 |
|
President Chain Store Corp. |
|
|
92,927 |
|
| 37,482 |
|
Taiwan Semiconductor Co. |
|
|
209,946 |
|
|
|
|
|
|
|
|
|
|
|
|
|
|
|
|
562,815 |
|
|
|
|
|
|
|
|
|
| Thailand - 2.0% |
|
| 31,800 |
|
Bangkok Bank PCL |
|
|
142,945 |
|
|
|
|
|
|
|
|
|
| Turkey - 2.2% |
|
| 4,100 |
|
BIM Birlesik Magazalar A/S |
|
|
56,896 |
|
| 51,000 |
|
Kordsa Global Endustriyel Iplik A/S |
|
|
93,331 |
|
|
|
|
|
|
|
|
|
|
|
|
|
|
|
|
150,227 |
|
|
|
|
|
|
|
|
|
| Europe - 3.5% |
|
| Belgium - 2.1% |
|
| 1,350 |
|
Anheuser-Busch InBev NV, ADR |
|
|
142,344 |
|
|
|
|
|
|
|
|
| Netherlands - 1.4% |
|
| 2,625 |
|
Mobileye NV * |
|
|
100,065 |
|
|
|
|
|
|
|
|
|
| Latin America - 8.8% |
|
| Brazil - 5.7% |
|
| 29,500 |
|
Ambev SA, ADR |
|
|
144,845 |
|
| 8,343 |
|
Banco Bradesco SA |
|
|
74,337 |
|
| 3,400 |
|
Embraer SA, ADR |
|
|
65,450 |
|
| 19,000 |
|
Qualicorp SA |
|
|
112,376 |
|
|
|
|
|
|
|
|
|
|
|
|
|
|
|
|
397,008 |
|
|
|
|
|
|
|
|
|
| Chile - 1.8% |
|
| 5,500 |
|
Banco Santander Chile, ADR |
|
|
120,290 |
|
|
|
|
|
|
|
|
|
| Peru - 1.3% |
|
| 2,800 |
|
Southern Copper Corp. |
|
|
89,435 |
|
|
|
|
|
|
|
|
|
| North America - 4.9% |
|
| Mexico - 1.4% |
|
| 34,800 |
|
Alsea SAB de CV |
|
|
99,416 |
|
|
|
|
|
|
|
|
|
| United States - 3.5% |
|
| 1,800 |
|
Cognizant Technology Solutions Corp.
* |
|
|
100,854 |
|
| 800 |
|
Skyworks Solutions, Inc. |
|
|
59,728 |
|
| 1,575 |
|
Tupperware Brands Corp. |
|
|
82,877 |
|
|
|
|
|
|
|
|
|
|
|
|
|
|
|
|
243,459 |
|
|
|
|
|
|
|
|
|
|
| Total Common Stocks
(cost: $6,080,388) |
|
|
6,514,347 |
|
|
|
|
|
|
|
|
|
| Investment Companies - 3.3% |
|
| 8,400 |
|
iShares MSCI India ETF |
|
|
225,204 |
|
|
|
|
|
|
|
|
|
| (cost: $244,916) |
|
|
|
|
| See accompanying notes to financial statements. |
|
|
|
50 |
|
SIT MUTUAL FUNDS
SEMI-ANNUAL REPORT |
|
|
|
|
|
|
|
| |
|
|
|
|
| Quantity |
|
Name of Issuer |
|
Fair Value ($) |
|
| |
|
|
|
| Short-Term Securities - 2.5% |
|
|
|
|
| 173,736 |
|
Fidelity Instl. Money Mkt. Govt. Fund, 0.39% |
|
| Total Short-Term Securities
(cost: $173,736) |
|
|
173,736 |
|
|
|
|
|
|
|
|
|
|
| Total Investments in Securities - 99.9%
(cost: $6,499,040) |
|
|
6,913,287 |
|
| Other Assets and Liabilities, net - 0.1% |
|
|
10,224 |
|
|
|
|
|
|
|
|
|
|
| Total Net Assets - 100.0% |
|
|
$6,923,511 |
|
|
|
|
|
|
|
|
| * |
Non-income producing security. |
ADR — American Depositary Receipt
GDR — Global
Depositary Receipt
Numeric footnotes not disclosed are not applicable to this Schedule of Investments.
|
|
|
| See accompanying notes to financial statements. |
|
|
| DECEMBER 31, 2016 |
|
51 |
SCHEDULE OF INVESTMENTS (Unaudited)
December 31, 2016
Sit Developing
Markets Growth Fund (Continued)
A summary of the levels for the Fund’s investments as of
December 31, 2016 is as follows (see Note 2 - significant accounting policies in the notes to financial statements):
|
|
|
|
|
|
|
|
|
|
|
|
|
|
|
|
|
| |
|
Investment in Securities |
|
| |
|
Level 1
Quoted
Price ($) |
|
|
Level 2
Other significant
observable inputs ($)
|
|
|
Level 3
Significant
unobservable inputs ($)
|
|
|
Total ($)
|
|
| Common Stocks |
|
|
|
|
|
|
|
|
|
|
|
|
|
|
|
|
| Belgium |
|
|
142,344 |
|
|
|
— |
|
|
|
— |
|
|
|
142,344 |
|
| Brazil |
|
|
397,008 |
|
|
|
— |
|
|
|
— |
|
|
|
397,008 |
|
| Chile |
|
|
120,290 |
|
|
|
— |
|
|
|
— |
|
|
|
120,290 |
|
| China/Hong Kong |
|
|
1,047,121 |
|
|
|
1,006,955 |
|
|
|
— |
|
|
|
2,054,076 |
|
| India |
|
|
233,751 |
|
|
|
— |
|
|
|
— |
|
|
|
233,751 |
|
| Indonesia |
|
|
— |
|
|
|
158,065 |
|
|
|
— |
|
|
|
158,065 |
|
| Israel |
|
|
213,156 |
|
|
|
— |
|
|
|
— |
|
|
|
213,156 |
|
| Japan |
|
|
— |
|
|
|
87,772 |
|
|
|
— |
|
|
|
87,772 |
|
| Malaysia |
|
|
82,519 |
|
|
|
— |
|
|
|
— |
|
|
|
82,519 |
|
| Mexico |
|
|
99,416 |
|
|
|
— |
|
|
|
— |
|
|
|
99,416 |
|
| Netherlands |
|
|
100,065 |
|
|
|
— |
|
|
|
— |
|
|
|
100,065 |
|
| Peru |
|
|
89,435 |
|
|
|
— |
|
|
|
— |
|
|
|
89,435 |
|
| Singapore |
|
|
119,320 |
|
|
|
131,239 |
|
|
|
— |
|
|
|
250,559 |
|
| South Africa |
|
|
87,200 |
|
|
|
467,382 |
|
|
|
— |
|
|
|
554,582 |
|
| South Korea |
|
|
— |
|
|
|
831,863 |
|
|
|
— |
|
|
|
831,863 |
|
| Taiwan |
|
|
137,912 |
|
|
|
424,903 |
|
|
|
— |
|
|
|
562,815 |
|
| Thailand |
|
|
— |
|
|
|
142,945 |
|
|
|
— |
|
|
|
142,945 |
|
| Turkey |
|
|
— |
|
|
|
150,227 |
|
|
|
— |
|
|
|
150,227 |
|
| United States |
|
|
243,459 |
|
|
|
— |
|
|
|
— |
|
|
|
243,459 |
|
| Investment Companies |
|
|
225,204 |
|
|
|
— |
|
|
|
— |
|
|
|
225,204 |
|
| Short-Term Securities |
|
|
173,736 |
|
|
|
— |
|
|
|
— |
|
|
|
173,736 |
|
|
|
|
|
|
| Total: |
|
|
3,511,936 |
|
|
|
3,401,351 |
|
|
|
— |
|
|
|
6,913,287 |
|
The Fund adjusts the closing price of foreign equity securities by applying a systematic process for events
occurring after the close of the foreign exchanges. At each reporting period, this process is applied for all foreign securities and therefore all foreign securities are classified as level 2. There are no transfers between level 1 and level 2
between reporting periods as a result of applying this process. Level 1 securities of foreign issuers are primarily American Depositary Receipts (ADRs), Public Limited Companies (PLCs) or Global Depositary Receipts (GDRs). There were no transfers
into or out of level 3 during the reporting period.
|
|
|
| See accompanying notes to financial statements. |
|
|
|
52 |
|
SIT MUTUAL FUNDS
SEMI-ANNUAL REPORT |
[This page intentionally left blank.]
STATEMENTS OF ASSETS AND LIABILITIES (Unaudited)
December 31, 2016
|
|
|
|
|
|
|
|
|
|
|
|
|
| |
|
|
|
Sit |
|
Sit
Global |
| |
|
Sit |
|
Dividend |
|
Dividend |
| |
|
Balanced |
|
Growth |
|
Growth |
| |
|
Fund |
|
Fund |
|
Fund |
| ASSETS |
|
|
|
|
|
|
|
|
|
|
|
|
| Investments in securities, at identified cost |
|
|
$20,701,355 |
|
|
|
$863,912,750 |
|
|
|
$23,595,989 |
|
|
|
|
|
|
|
|
|
|
|
|
|
|
|
|
|
|
| Investments in securities, at fair value - see accompanying schedule for detail |
|
|
$24,568,577 |
|
|
|
$992,439,890 |
|
|
|
$25,804,186 |
|
| Cash in bank on demand deposit |
|
|
19 |
|
|
|
— |
|
|
|
— |
|
| Accrued interest and dividends receivable |
|
|
77,274 |
|
|
|
1,730,814 |
|
|
|
64,810 |
|
| Receivable for investment securities sold |
|
|
87,739 |
|
|
|
13,280,095 |
|
|
|
— |
|
| Receivable for Fund shares sold |
|
|
9,281 |
|
|
|
1,062,084 |
|
|
|
473 |
|
|
|
|
|
|
|
|
|
|
|
|
|
|
|
|
|
|
| Total assets |
|
|
24,742,890 |
|
|
|
1,008,512,883 |
|
|
|
25,869,469 |
|
|
|
|
|
|
|
|
|
|
|
|
|
|
|
|
|
|
| LIABILITIES |
|
|
|
|
|
|
|
|
|
|
|
|
| Payable for investment securities purchased |
|
|
90,087 |
|
|
|
11,750,385 |
|
|
|
— |
|
| Payable for Fund shares redeemed |
|
|
34,996 |
|
|
|
1,173,180 |
|
|
|
30,000 |
|
| Accrued investment management fees and advisory fees |
|
|
20,218 |
|
|
|
838,169 |
|
|
|
26,405 |
|
| Accrued 12b-1 fees (Class S) |
|
|
— |
|
|
|
13,847 |
|
|
|
627 |
|
|
|
|
|
|
|
|
|
|
|
|
|
|
|
|
|
|
| Total liabilities |
|
|
145,301 |
|
|
|
13,775,581 |
|
|
|
57,032 |
|
|
|
|
|
|
|
|
|
|
|
|
|
|
|
|
|
|
| Net assets applicable to outstanding capital stock |
|
|
$24,597,589 |
|
|
|
$994,737,302 |
|
|
|
$25,812,437 |
|
|
|
|
|
|
|
|
|
|
|
|
|
|
|
|
|
|
| Net assets consist of: |
|
|
|
|
|
|
|
|
|
|
|
|
| Capital (par value and paid-in surplus) |
|
|
$20,759,522 |
|
|
|
$857,405,810 |
|
|
|
$24,472,317 |
|
| Undistributed (distributions in excess of) net investment income (loss) |
|
|
(4,487 |
) |
|
|
85,307 |
|
|
|
(214 |
) |
| Accumulated net realized gain (loss) from security transactions and foreign currency
transactions |
|
|
(24,668 |
) |
|
|
8,719,045 |
|
|
|
(864,778 |
) |
| Unrealized appreciation (depreciation) on investments and foreign currency transactions |
|
|
3,867,222 |
|
|
|
128,527,140 |
|
|
|
2,205,112 |
|
|
|
|
|
|
|
|
|
|
|
|
|
|
|
|
|
|
|
|
|
$24,597,589 |
|
|
|
$994,737,302 |
|
|
|
$25,812,437 |
|
|
|
|
|
|
|
|
|
|
|
|
|
|
|
|
|
|
| Outstanding shares: |
|
|
|
|
|
|
|
|
|
|
|
|
| Common Shares (Class I) * |
|
|
1,176,567 |
|
|
|
59,479,901 |
|
|
|
1,680,822 |
|
|
|
|
|
|
|
|
|
|
|
|
|
|
| Common Shares (Class S) * |
|
|
— |
|
|
|
4,337,743 |
|
|
|
230,557 |
|
|
|
|
|
|
|
|
|
|
|
|
|
|
|
|
|
|
| Net assets applicable to outstanding shares: |
|
|
|
|
|
|
|
|
|
|
|
|
| Common Shares (Class I) * |
|
|
$24,597,589 |
|
|
|
$927,344,556 |
|
|
|
$22,699,959 |
|
|
|
|
|
|
|
|
|
|
|
|
|
|
| Common Shares (Class S) * |
|
|
— |
|
|
|
67,392,746 |
|
|
|
3,112,478 |
|
|
|
|
|
|
|
|
|
|
|
|
|
|
|
|
|
|
| Net asset value per share of outstanding capital stock: |
|
|
|
|
|
|
|
|
|
|
|
|
| Common Shares (Class I) * |
|
|
$20.91 |
|
|
|
$15.59 |
|
|
|
$13.51 |
|
|
|
|
|
|
|
|
|
|
|
|
|
|
| Common Shares (Class S) * |
|
|
— |
|
|
|
$15.54 |
|
|
|
$13.50 |
|
|
|
|
|
|
|
|
|
|
|
|
|
|
* Dividend Growth, Global Dividend Growth, ESG Growth and Small Cap Dividend Growth Funds offer multiple share
classes (I and S). All other Funds offer a single share class.
|
|
|
|
|
| See accompanying notes to financial statements. |
|
|
|
|
| 54 |
|
|
SIT MUTUAL FUNDS SEMI-ANNUAL REPORT |
|
|
|
|
|
|
|
|
|
|
|
|
|
|
|
|
|
|
|
|
|
|
|
|
|
|
|
|
| |
|
|
|
|
|
|
|
|
Sit |
|
|
|
|
|
|
|
|
Sit |
|
| Sit |
|
|
Sit |
|
|
Sit |
|
|
Small Cap |
|
|
Sit |
|
|
Sit |
|
|
Developing |
|
| Large Cap |
|
|
ESG |
|
|
Mid Cap |
|
|
Dividend |
|
|
Small Cap |
|
|
International |
|
|
Markets |
|
| Growth |
|
|
Growth |
|
|
Growth |
|
|
Growth |
|
|
Growth |
|
|
Growth |
|
|
Growth |
|
| Fund |
|
|
Fund |
|
|
Fund |
|
|
Fund |
|
|
Fund |
|
|
Fund |
|
|
Fund |
|
| |
|
|
|
|
|
|
|
|
|
|
|
|
|
|
|
|
|
|
|
|
|
|
|
|
|
|
| |
$72,497,273 |
|
|
|
$4,055,940 |
|
|
|
$90,542,516 |
|
|
|
$11,952,547 |
|
|
|
$60,207,775 |
|
|
|
$18,799,423 |
|
|
|
$6,499,040 |
|
| |
|
|
|
|
|
|
|
|
|
|
|
|
|
|
|
|
|
|
|
|
|
|
|
|
|
|
|
|
|
|
|
|
|
| |
$112,088,120 |
|
|
|
$4,157,604 |
|
|
|
$142,050,668 |
|
|
|
$13,429,873 |
|
|
|
$86,640,621 |
|
|
|
$19,498,228 |
|
|
|
$6,913,287 |
|
| |
— |
|
|
|
— |
|
|
|
— |
|
|
|
264,509 |
|
|
|
— |
|
|
|
2,242 |
|
|
|
753 |
|
| |
89,350 |
|
|
|
6,200 |
|
|
|
77,431 |
|
|
|
22,828 |
|
|
|
45,120 |
|
|
|
99,040 |
|
|
|
20,802 |
|
| |
599,336 |
|
|
|
— |
|
|
|
381,291 |
|
|
|
18,416 |
|
|
|
261,820 |
|
|
|
86,858 |
|
|
|
— |
|
| |
5,519 |
|
|
|
— |
|
|
|
8,101 |
|
|
|
1,377 |
|
|
|
6,361 |
|
|
|
1,030 |
|
|
|
512 |
|
| |
|
|
|
|
|
|
|
|
|
|
|
|
|
|
|
|
|
|
|
|
|
|
|
|
|
|
|
|
|
|
|
|
|
| |
112,782,325 |
|
|
|
4,163,804 |
|
|
|
142,517,491 |
|
|
|
13,737,003 |
|
|
|
86,953,922 |
|
|
|
19,687,398 |
|
|
|
6,935,354 |
|
| |
|
|
|
|
|
|
|
|
|
|
|
|
|
|
|
|
|
|
|
|
|
|
|
|
|
|
|
|
|
|
|
|
|
| |
|
|
|
|
|
|
|
|
|
|
|
|
|
|
|
|
|
|
|
|
|
|
|
|
|
|
| |
406,241 |
|
|
|
— |
|
|
|
— |
|
|
|
201,851 |
|
|
|
342,542 |
|
|
|
97,821 |
|
|
|
— |
|
| |
368,728 |
|
|
|
— |
|
|
|
370,794 |
|
|
|
— |
|
|
|
1,038 |
|
|
|
1,098 |
|
|
|
363 |
|
| |
93,657 |
|
|
|
4,275 |
|
|
|
147,773 |
|
|
|
13,439 |
|
|
|
107,697 |
|
|
|
24,091 |
|
|
|
11,480 |
|
| |
— |
|
|
|
422 |
|
|
|
— |
|
|
|
613 |
|
|
|
— |
|
|
|
— |
|
|
|
— |
|
| |
|
|
|
|
|
|
|
|
|
|
|
|
|
|
|
|
|
|
|
|
|
|
|
|
|
|
|
|
|
|
|
|
|
| |
868,626 |
|
|
|
4,697 |
|
|
|
518,567 |
|
|
|
215,903 |
|
|
|
451,277 |
|
|
|
123,010 |
|
|
|
11,843 |
|
| |
|
|
|
|
|
|
|
|
|
|
|
|
|
|
|
|
|
|
|
|
|
|
|
|
|
|
|
|
|
|
|
|
|
| |
$111,913,699 |
|
|
|
$4,159,107 |
|
|
|
$141,998,924 |
|
|
|
$13,521,100 |
|
|
|
$86,502,645 |
|
|
|
$19,564,388 |
|
|
|
$6,923,511 |
|
| |
|
|
|
|
|
|
|
|
|
|
|
|
|
|
|
|
|
|
|
|
|
|
|
|
|
|
|
|
|
|
|
|
|
| |
|
|
|
|
|
|
|
|
|
|
|
|
|
|
|
|
|
|
|
|
|
|
|
|
|
|
| |
$70,349,530 |
|
|
|
$4,086,065 |
|
|
|
$89,283,853 |
|
|
|
$12,382,618 |
|
|
|
$60,024,004 |
|
|
|
$19,901,903 |
|
|
|
$6,642,025 |
|
| |
1,924 |
|
|
|
(614 |
) |
|
|
103,445 |
|
|
|
4,177 |
|
|
|
(195,606 |
) |
|
|
1,470 |
|
|
|
(12,547 |
) |
|
1,971,398 |
|
|
|
(28,002 |
) |
|
|
1,103,414 |
|
|
|
(343,021 |
) |
|
|
241,401 |
|
|
|
(1,030,110 |
) |
|
|
(120,225 |
) |
|
39,590,847 |
|
|
|
101,658 |
|
|
|
51,508,212 |
|
|
|
1,477,326 |
|
|
|
26,432,846 |
|
|
|
691,125 |
|
|
|
414,258 |
|
| |
|
|
|
|
|
|
|
|
|
|
|
|
|
|
|
|
|
|
|
|
|
|
|
|
|
|
|
|
|
|
|
|
|
| |
$111,913,699 |
|
|
|
$4,159,107 |
|
|
|
$141,998,924 |
|
|
|
$13,521,100 |
|
|
|
$86,502,645 |
|
|
|
$19,564,388 |
|
|
|
$6,923,511 |
|
| |
|
|
|
|
|
|
|
|
|
|
|
|
|
|
|
|
|
|
|
|
|
|
|
|
|
|
|
|
|
|
|
|
|
| |
|
|
|
|
|
|
|
|
|
|
|
|
|
|
|
|
|
|
|
|
|
|
|
|
|
|
| |
3,153,272 |
|
|
|
207,160 |
|
|
|
8,830,305 |
|
|
|
954,637 |
|
|
|
1,716,058 |
|
|
|
1,388,974 |
|
|
|
568,403 |
|
| |
|
|
|
|
|
|
|
|
|
|
|
|
|
|
|
|
|
|
|
|
|
|
|
|
|
|
| |
— |
|
|
|
201,363 |
|
|
|
— |
|
|
|
270,269 |
|
|
|
— |
|
|
|
— |
|
|
|
— |
|
| |
|
|
|
|
|
|
|
|
|
|
|
|
|
|
|
|
|
|
|
|
|
|
|
|
|
|
|
|
|
|
|
|
|
| |
|
|
|
|
|
|
|
|
|
|
|
|
|
|
|
|
|
|
|
|
|
|
|
|
|
|
| |
$111,913,699 |
|
|
|
$2,109,094 |
|
|
|
$141,998,924 |
|
|
|
$10,537,909 |
|
|
|
$86,502,645 |
|
|
|
$19,564,388 |
|
|
|
$6,923,511 |
|
| |
|
|
|
|
|
|
|
|
|
|
|
|
|
|
|
|
|
|
|
|
|
|
|
|
|
|
| |
— |
|
|
|
2,050,013 |
|
|
|
— |
|
|
|
2,983,191 |
|
|
|
— |
|
|
|
— |
|
|
|
— |
|
| |
|
|
|
|
|
|
|
|
|
|
|
|
|
|
|
|
|
|
|
|
|
|
|
|
|
|
|
|
|
|
|
|
|
| |
|
|
|
|
|
|
|
|
|
|
|
|
|
|
|
|
|
|
|
|
|
|
|
|
|
|
| |
$35.49 |
|
|
|
$10.18 |
|
|
|
$16.08 |
|
|
|
$11.04 |
|
|
|
$50.41 |
|
|
|
$14.09 |
|
|
|
$12.18 |
|
| |
|
|
|
|
|
|
|
|
|
|
|
|
|
|
|
|
|
|
|
|
|
|
|
|
|
|
| |
— |
|
|
|
$10.18 |
|
|
|
— |
|
|
|
$11.04 |
|
|
|
— |
|
|
|
— |
|
|
|
— |
|
| |
|
|
|
|
|
|
|
|
|
|
|
|
|
|
|
|
|
|
|
|
|
|
|
|
|
|
STATEMENTS OF OPERATIONS (Unaudited)
Six Months Ended December 31, 2016
|
|
|
|
|
|
|
|
|
|
|
|
|
| |
|
|
|
|
|
|
|
Sit |
|
| |
|
|
|
|
Sit |
|
|
Global |
|
| |
|
Sit |
|
|
Dividend |
|
|
Dividend |
|
| |
|
Balanced |
|
|
Growth |
|
|
Growth |
|
| |
|
Fund |
|
|
Fund |
|
|
Fund |
|
| Investment income: |
|
|
|
|
|
|
|
|
|
|
|
|
| Income: |
|
|
|
|
|
|
|
|
|
|
|
|
| Dividends* |
|
$ |
156,483 |
|
|
$ |
13,459,664 |
|
|
$ |
327,808 |
|
| Interest |
|
|
106,184 |
|
|
|
25,407 |
|
|
|
1,248 |
|
|
|
|
|
|
|
|
|
|
|
|
|
|
|
|
|
|
| Total income |
|
|
262,667 |
|
|
|
13,485,071 |
|
|
|
329,056 |
|
|
|
|
|
|
|
|
|
|
|
|
|
|
|
|
|
|
| Expenses (note 4): |
|
|
|
|
|
|
|
|
|
|
|
|
| Investment management and advisory service fee |
|
|
121,719 |
|
|
|
5,131,811 |
|
|
|
161,035 |
|
| 12b-1 fees (Class S) |
|
|
— |
|
|
|
84,246 |
|
|
|
3,649 |
|
|
|
|
|
|
|
|
|
|
|
|
|
|
|
|
|
|
| Total expenses |
|
|
121,719 |
|
|
|
5,216,057 |
|
|
|
164,684 |
|
|
|
|
|
|
|
|
|
|
|
|
|
|
|
|
|
|
| Net investment income (loss) |
|
|
140,948 |
|
|
|
8,269,014 |
|
|
|
164,372 |
|
|
|
|
|
|
|
|
|
|
|
|
|
|
| Realized and unrealized gain (loss): |
|
|
|
|
|
|
|
|
|
|
|
|
| Net realized gain (loss) on investments |
|
|
52,082 |
|
|
|
32,785,403 |
|
|
|
(166,738 |
) |
| Net realized gain (loss) on foreign currency transactions |
|
|
— |
|
|
|
— |
|
|
|
(1,314 |
) |
|
|
|
|
| Net change in unrealized appreciation (depreciation) on investments and foreign currency
transactions |
|
|
596,503 |
|
|
|
21,771,318 |
|
|
|
875,368 |
|
|
|
|
|
|
|
|
|
|
|
|
|
|
|
|
|
|
| Net gain (loss) |
|
|
648,585 |
|
|
|
54,556,721 |
|
|
|
707,316 |
|
|
|
|
|
|
|
|
|
|
|
|
|
|
|
|
|
|
| Net increase (decrease) in net assets resulting from operations |
|
$ |
789,533 |
|
|
$ |
62,825,735 |
|
|
$ |
871,688 |
|
|
|
|
|
|
|
|
|
|
|
|
|
|
| |
|
|
|
|
|
|
|
|
|
|
|
|
|
| * Foreign taxes withheld on dividends received |
|
|
— |
|
|
$ |
62,186 |
|
|
$ |
9,538 |
|
| 1 |
The Fund commenced investment operations on June 30, 2016. |
|
|
|
|
|
| See accompanying notes to financial statements. |
|
|
|
|
| 56 |
|
|
SIT MUTUAL FUNDS SEMI-ANNUAL REPORT |
|
|
|
|
|
|
|
|
|
|
|
|
|
|
|
|
|
|
|
|
|
|
|
|
|
|
|
|
| |
|
|
|
|
|
|
|
|
Sit |
|
|
|
|
|
|
|
|
Sit |
|
| Sit |
|
|
Sit |
|
|
Sit |
|
|
Small Cap |
|
|
Sit |
|
|
Sit |
|
|
Developing |
|
| Large Cap |
|
|
ESG |
|
|
Mid Cap |
|
|
Dividend |
|
|
Small Cap |
|
|
International |
|
|
Markets |
|
| Growth |
|
|
Growth |
|
|
Growth |
|
|
Growth |
|
|
Growth |
|
|
Growth |
|
|
Growth |
|
| Fund |
|
|
Fund 1 |
|
|
Fund |
|
|
Fund |
|
|
Fund |
|
|
Fund |
|
|
Fund |
|
|
|
|
|
|
|
|
|
|
|
|
|
|
|
|
|
|
|
|
|
|
|
|
|
|
|
|
|
|
|
|
|
|
|
|
|
|
|
|
|
|
|
|
|
|
|
|
|
|
|
|
|
|
|
| |
$938,812 |
|
|
|
$32,292 |
|
|
|
$990,117 |
|
|
|
$131,690 |
|
|
|
$437,724 |
|
|
|
$176,154 |
|
|
|
$61,922 |
|
| |
3,206 |
|
|
|
1,433 |
|
|
|
10,618 |
|
|
|
981 |
|
|
|
2,781 |
|
|
|
947 |
|
|
|
364 |
|
| |
|
|
|
|
|
|
|
|
|
|
|
|
|
|
|
|
|
|
|
|
|
|
|
|
|
|
|
|
|
|
|
|
|
| |
942,018 |
|
|
|
33,725 |
|
|
|
1,000,735 |
|
|
|
132,671 |
|
|
|
440,505 |
|
|
|
177,101 |
|
|
|
62,286 |
|
| |
|
|
|
|
|
|
|
|
|
|
|
|
|
|
|
|
|
|
|
|
|
|
|
|
|
|
|
|
|
|
|
|
|
|
|
|
|
|
|
|
|
|
|
|
|
|
|
|
|
|
|
|
|
|
|
|
|
|
|
|
| |
586,956 |
|
|
|
25,700 |
|
|
|
897,290 |
|
|
|
67,027 |
|
|
|
636,111 |
|
|
|
155,175 |
|
|
|
74,833 |
|
| |
— |
|
|
|
2,539 |
|
|
|
— |
|
|
|
3,430 |
|
|
|
— |
|
|
|
— |
|
|
|
— |
|
| |
|
|
|
|
|
|
|
|
|
|
|
|
|
|
|
|
|
|
|
|
|
|
|
|
|
|
|
|
|
|
|
|
|
| |
586,956 |
|
|
|
28,239 |
|
|
|
897,290 |
|
|
|
70,457 |
|
|
|
636,111 |
|
|
|
155,175 |
|
|
|
74,833 |
|
| |
|
|
|
|
|
|
|
|
|
|
|
|
|
|
|
|
|
|
|
|
|
|
|
|
|
|
|
|
|
|
|
|
|
| |
355,062 |
|
|
|
5,486 |
|
|
|
103,445 |
|
|
|
62,214 |
|
|
|
(195,606 |
) |
|
|
21,926 |
|
|
|
(12,547 |
) |
| |
|
|
|
|
|
|
|
|
|
|
|
|
|
|
|
|
|
|
|
|
|
|
|
|
|
|
|
|
|
|
|
|
|
|
|
|
|
|
|
|
|
|
|
|
|
|
|
|
|
|
|
|
|
| |
4,063,119 |
|
|
|
(27,067 |
) |
|
|
1,264,987 |
|
|
|
(172,757 |
) |
|
|
210,527 |
|
|
|
(604,720 |
) |
|
|
44,122 |
|
| |
— |
|
|
|
(935 |
) |
|
|
— |
|
|
|
9 |
|
|
|
— |
|
|
|
(4,154 |
) |
|
|
239 |
|
|
|
|
|
|
|
|
|
2,553,192 |
|
|
|
101,658 |
|
|
|
6,556,577 |
|
|
|
1,285,049 |
|
|
|
8,602,331 |
|
|
|
133,056 |
|
|
|
(55,426 |
) |
| |
|
|
|
|
|
|
|
|
|
|
|
|
|
|
|
|
|
|
|
|
|
|
|
|
|
|
|
|
|
|
|
|
|
| |
6,616,311 |
|
|
|
73,656 |
|
|
|
7,821,564 |
|
|
|
1,112,301 |
|
|
|
8,812,858 |
|
|
|
(475,818 |
) |
|
|
(11,065 |
) |
| |
|
|
|
|
|
|
|
|
|
|
|
|
|
|
|
|
|
|
|
|
|
|
|
|
|
|
|
|
|
|
|
|
|
| |
$6,971,373 |
|
|
|
$79,142 |
|
|
|
$7,925,009 |
|
|
|
$1,174,515 |
|
|
|
$8,617,252 |
|
|
|
($453,892 |
) |
|
|
($23,612 |
) |
| |
|
|
|
|
|
|
|
|
|
|
|
|
|
|
|
|
|
|
|
|
|
|
|
|
|
|
|
|
|
|
|
|
|
|
|
|
|
|
|
|
|
|
|
|
|
|
|
|
|
|
|
|
|
|
|
|
|
|
|
|
| |
— |
|
|
|
$1,405 |
|
|
|
$2,218 |
|
|
|
$1,058 |
|
|
|
$1,802 |
|
|
|
$15,012 |
|
|
|
$8,210 |
|
STATEMENTS OF CHANGES IN NET
ASSETS
|
|
|
|
|
|
|
|
|
|
|
|
|
|
|
|
|
| |
|
Sit Balanced Fund |
|
|
Sit Dividend Growth Fund |
|
| |
|
Six Months Ended |
|
|
Year Ended |
|
|
Six Months Ended |
|
|
Year Ended |
|
| |
|
December 31, 2016 |
|
|
June 30, |
|
|
December 31, 2016 |
|
|
June 30, |
|
| |
|
(Unaudited) |
|
|
2016 |
|
|
(Unaudited) |
|
|
2016 |
|
| Operations: |
|
|
|
|
|
|
|
|
|
|
|
|
|
|
|
|
| Net investment income |
|
|
$140,948 |
|
|
|
$281,339 |
|
|
|
$8,269,014 |
|
|
|
$16,810,135 |
|
| Net realized gain (loss) on investments and foreign currency transactions |
|
|
52,082 |
|
|
|
405,475 |
|
|
|
32,785,403 |
|
|
|
64,500,977 |
|
| Net change in unrealized appreciation (depreciation) of investments and foreign currency
transactions |
|
|
596,503 |
|
|
|
(494,909 |
) |
|
|
21,771,318 |
|
|
|
(40,919,305 |
) |
|
|
|
|
|
|
|
|
|
|
|
|
|
|
|
|
|
| Net increase (decrease) in net assets resulting from operations |
|
|
789,533 |
|
|
|
191,905 |
|
|
|
62,825,735 |
|
|
|
40,391,807 |
|
|
|
|
|
|
|
|
|
|
|
|
|
|
|
|
|
|
|
|
|
|
|
| Distributions from: |
|
|
|
|
|
|
|
|
|
|
|
|
|
|
|
|
| Net investment income |
|
|
|
|
|
|
|
|
|
|
|
|
|
|
|
|
| Common shares (Class I) |
|
|
(206,000) |
|
|
|
(483,000 |
) |
|
|
(10,742,221 |
) |
|
|
(18,773,757 |
) |
| Common shares (Class S) |
|
|
— |
|
|
|
— |
|
|
|
(628,779 |
) |
|
|
(1,221,244 |
) |
| Net realized gains on investments |
|
|
|
|
|
|
|
|
|
|
|
|
|
|
|
|
| Common shares (Class I) |
|
|
— |
|
|
|
(1,053,969 |
) |
|
|
(60,795,025 |
) |
|
|
(106,854,655 |
) |
| Common shares (Class S) |
|
|
— |
|
|
|
— |
|
|
|
(4,229,591 |
) |
|
|
(7,776,788 |
) |
|
|
|
|
|
|
|
|
|
|
|
|
|
|
|
|
|
| Total distributions |
|
|
(206,000) |
|
|
|
(1,536,969 |
) |
|
|
(76,395,616 |
) |
|
|
(134,626,444 |
) |
|
|
|
|
|
|
|
|
|
|
|
|
|
|
|
|
|
|
|
|
|
|
| Capital share transactions: |
|
|
|
|
|
|
|
|
|
|
|
|
|
|
|
|
| Proceeds from shares sold |
|
|
|
|
|
|
|
|
|
|
|
|
|
|
|
|
| Common shares (Class I) |
|
|
1,996,278 |
|
|
|
8,592,853 |
|
|
|
75,702,644 |
|
|
|
361,580,592 |
|
| Common shares (Class S) |
|
|
— |
|
|
|
— |
|
|
|
3,273,108 |
|
|
|
4,208,565 |
|
| Reinvested distributions |
|
|
|
|
|
|
|
|
|
|
|
|
|
|
|
|
| Common shares (Class I) |
|
|
205,190 |
|
|
|
1,524,296 |
|
|
|
20,812,396 |
|
|
|
40,052,131 |
|
| Common shares (Class S) |
|
|
— |
|
|
|
— |
|
|
|
4,814,701 |
|
|
|
8,936,473 |
|
| Payments for shares redeemed |
|
|
|
|
|
|
|
|
|
|
|
|
|
|
|
|
| Common shares (Class I) |
|
|
(1,698,463) |
|
|
|
(8,230,744 |
) |
|
|
(98,686,524 |
) |
|
|
(327,488,522 |
) |
|
|
|
|
|
|
|
|
|
|
|
|
|
|
|
|
|
| Common shares (Class S) |
|
|
— |
|
|
|
— |
|
|
|
(7,473,720 |
) |
|
|
(21,609,224 |
) |
|
|
|
|
|
|
|
|
|
|
|
|
|
|
|
|
|
| Increase (decrease) in net assets from capital transactions |
|
|
503,005 |
|
|
|
1,886,405 |
|
|
|
(1,557,395 |
) |
|
|
65,680,015 |
|
|
|
|
|
|
|
|
|
|
|
|
|
|
|
|
|
|
| Total increase (decrease) in net assets |
|
|
1,086,538 |
|
|
|
541,341 |
|
|
|
(15,127,276 |
) |
|
|
(28,554,622 |
) |
|
|
|
|
|
| Net assets: |
|
|
|
|
|
|
|
|
|
|
|
|
|
|
|
|
| Beginning of period |
|
|
23,511,051 |
|
|
|
22,969,710 |
|
|
|
1,009,864,578 |
|
|
|
1,038,419,200 |
|
|
|
|
|
|
|
|
|
|
|
|
|
|
|
|
|
|
| End of period* |
|
|
$24,597,589 |
|
|
|
$23,511,051 |
|
|
|
$994,737,302 |
|
|
|
$1,009,864,578 |
|
|
|
|
|
|
|
|
|
|
|
|
|
|
|
|
|
|
|
|
|
|
|
| Capital transactions in shares: |
|
|
|
|
|
|
|
|
|
|
|
|
|
|
|
|
| Sold |
|
|
|
|
|
|
|
|
|
|
|
|
|
|
|
|
| Common shares (Class I) |
|
|
95,577 |
|
|
|
413,544 |
|
|
|
4,693,713 |
|
|
|
22,658,489 |
|
| Common shares (Class S) |
|
|
— |
|
|
|
— |
|
|
|
205,022 |
|
|
|
263,412 |
|
| Reinvested distributions |
|
|
|
|
|
|
|
|
|
|
|
|
|
|
|
|
| Common shares (Class I) |
|
|
9,844 |
|
|
|
74,586 |
|
|
|
1,321,115 |
|
|
|
2,621,435 |
|
| Common shares (Class S) |
|
|
— |
|
|
|
— |
|
|
|
306,669 |
|
|
|
587,079 |
|
| Redeemed |
|
|
|
|
|
|
|
|
|
|
|
|
|
|
|
|
| Common shares (Class I) |
|
|
(81,410) |
|
|
|
(401,816 |
) |
|
|
(6,106,942 |
) |
|
|
(20,620,329 |
) |
| Common shares (Class S) |
|
|
— |
|
|
|
— |
|
|
|
(465,753 |
) |
|
|
(1,343,328 |
) |
|
|
|
|
|
|
|
|
|
|
|
|
|
|
|
|
|
| Net increase (decrease) |
|
|
24,011 |
|
|
|
86,314 |
|
|
|
(46,176 |
) |
|
|
4,166,758 |
|
|
|
|
|
|
|
|
|
|
|
|
|
|
|
|
|
|
| * includes undistributed (distributions in excess) net investment income (loss) |
|
|
($4,487) |
|
|
|
$60,565 |
|
|
|
$85,307 |
|
|
|
$3,187,293 |
|
| |
1 |
The Fund commenced investment operations on June 30,
2016. |
|
|
|
|
|
| See accompanying notes to financial statements. |
|
|
|
|
| 58 |
|
|
SIT MUTUAL FUNDS SEMI-ANNUAL REPORT |
|
|
|
|
|
|
|
|
|
|
|
|
|
|
|
|
|
|
|
|
| Sit Global Dividend Growth Fund |
|
|
Sit Large Cap Growth Fund |
|
|
Sit ESG Growth Fund |
|
| Six Months Ended |
|
|
Year Ended |
|
|
Six Months Ended |
|
|
Year Ended |
|
|
Six Months Ended |
|
| December 31, 2016 |
|
|
June 30, |
|
|
December 31, 2016 |
|
|
June 30, |
|
|
December 31, 2016 |
|
| (Unaudited) |
|
|
2016 |
|
|
(Unaudited) |
|
|
2016 |
|
|
(Unaudited) 1 |
|
|
|
|
|
|
|
|
|
|
|
|
|
|
|
|
|
|
|
|
| |
$164,372 |
|
|
|
$375,267 |
|
|
|
$355,062 |
|
|
|
$576,725 |
|
|
|
$5,486 |
|
|
(168,052) |
|
|
|
(610,940 |
) |
|
|
4,063,119 |
|
|
|
8,600,977 |
|
|
|
(28,002) |
|
|
875,368 |
|
|
|
(170,944 |
) |
|
|
2,553,192 |
|
|
|
(10,559,412 |
) |
|
|
101,658 |
|
| |
|
|
|
|
|
|
|
|
|
|
|
|
|
|
|
|
|
|
|
871,688 |
|
|
|
(406,617 |
) |
|
|
6,971,373 |
|
|
|
(1,381,710 |
) |
|
|
79,142 |
|
| |
|
|
|
|
|
|
|
|
|
|
|
|
|
|
|
|
|
|
|
|
|
|
|
|
|
|
|
|
|
|
|
|
|
|
|
|
|
|
|
|
|
|
|
|
|
|
|
|
|
|
|
|
|
|
|
|
|
|
|
|
|
| |
(250,917) |
|
|
|
(530,057 |
) |
|
|
(571,000 |
) |
|
|
(4,260,000 |
) |
|
|
(4,383) |
|
| |
(27,083) |
|
|
|
(62,943 |
) |
|
|
— |
|
|
|
— |
|
|
|
(1,717) |
|
|
|
|
|
|
|
|
|
|
|
|
|
|
|
|
|
|
|
|
|
|
|
|
|
| |
— |
|
|
|
(1,512,966 |
) |
|
|
(7,612,702 |
) |
|
|
(28,228,978 |
) |
|
|
— |
|
| |
— |
|
|
|
(201,110 |
) |
|
|
— |
|
|
|
— |
|
|
|
— |
|
| |
|
|
|
|
|
|
|
|
|
|
|
|
|
|
|
|
|
|
| |
(278,000) |
|
|
|
(2,307,076 |
) |
|
|
(8,183,702 |
) |
|
|
(32,488,978 |
) |
|
|
(6,100) |
|
| |
|
|
|
|
|
|
|
|
|
|
|
|
|
|
|
|
|
|
|
|
|
|
|
|
|
|
|
|
|
|
|
|
|
|
|
|
|
|
|
|
|
|
|
|
|
|
|
|
|
|
|
|
|
|
|
|
|
|
|
|
|
| |
1,031,267 |
|
|
|
2,302,443 |
|
|
|
838,901 |
|
|
|
6,199,628 |
|
|
|
2,068,000 |
|
| |
216,464 |
|
|
|
181,452 |
|
|
|
— |
|
|
|
— |
|
|
|
2,017,000 |
|
|
|
|
|
|
|
|
|
|
|
|
|
|
|
|
|
|
|
|
| |
250,917 |
|
|
|
2,042,797 |
|
|
|
8,064,947 |
|
|
|
32,014,455 |
|
|
|
4,383 |
|
| |
27,083 |
|
|
|
264,053 |
|
|
|
— |
|
|
|
— |
|
|
|
1,717 |
|
|
|
|
|
|
|
|
|
|
|
|
|
|
|
|
|
|
|
|
| |
(1,439,064) |
|
|
|
(1,040,365 |
) |
|
|
(13,236,566 |
) |
|
|
(31,691,511 |
) |
|
|
— |
|
| |
|
|
|
|
|
|
|
|
|
|
|
|
|
|
|
|
|
|
| |
(61,119) |
|
|
|
(719,020 |
) |
|
|
— |
|
|
|
— |
|
|
|
(5,035) |
|
| |
|
|
|
|
|
|
|
|
|
|
|
|
|
|
|
|
|
|
|
|
|
|
|
| |
25,548 |
|
|
|
3,031,360 |
|
|
|
(4,332,718 |
) |
|
|
6,522,572 |
|
|
|
4,086,065 |
|
| |
|
|
|
|
|
|
|
|
|
|
|
|
|
|
|
|
|
|
| |
619,236 |
|
|
|
317,667 |
|
|
|
(5,545,047 |
) |
|
|
(27,348,116 |
) |
|
|
4,159,107 |
|
|
|
|
|
|
|
|
|
|
|
|
|
|
|
|
|
|
|
|
|
|
|
|
|
| |
25,193,201 |
|
|
|
24,875,534 |
|
|
|
117,458,746 |
|
|
|
144,806,862 |
|
|
|
— |
|
| |
|
|
|
|
|
|
|
|
|
|
|
|
|
|
|
|
|
|
| |
$25,812,437 |
|
|
|
$25,193,201 |
|
|
|
$111,913,699 |
|
|
|
$117,458,746 |
|
|
|
$4,159,107 |
|
| |
|
|
|
|
|
|
|
|
|
|
|
|
|
|
|
|
|
|
|
|
|
|
|
|
|
|
|
|
|
|
|
|
|
|
|
|
|
|
|
|
|
|
|
|
|
|
|
|
|
|
|
|
|
|
|
|
|
|
|
|
|
| |
77,613 |
|
|
|
164,944 |
|
|
|
22,481 |
|
|
|
145,288 |
|
|
|
206,733 |
|
| |
16,076 |
|
|
|
13,425 |
|
|
|
— |
|
|
|
— |
|
|
|
201,689 |
|
|
|
|
|
|
|
|
|
|
|
|
|
|
|
|
|
|
|
|
| |
18,768 |
|
|
|
154,832 |
|
|
|
224,089 |
|
|
|
874,234 |
|
|
|
427 |
|
| |
2,025 |
|
|
|
20,031 |
|
|
|
— |
|
|
|
— |
|
|
|
168 |
|
|
|
|
|
|
|
|
|
|
|
|
|
|
|
|
|
|
|
|
| |
(108,525) |
|
|
|
(74,696 |
) |
|
|
(354,578 |
) |
|
|
(825,719 |
) |
|
|
— |
|
| |
(4,604) |
|
|
|
(49,928 |
) |
|
|
— |
|
|
|
— |
|
|
|
(494) |
|
| |
|
|
|
|
|
|
|
|
|
|
|
|
|
|
|
|
|
|
| |
1,353 |
|
|
|
228,608 |
|
|
|
(108,008 |
) |
|
|
193,803 |
|
|
|
408,523 |
|
| |
|
|
|
|
|
|
|
|
|
|
|
|
|
|
|
|
|
|
|
|
|
|
|
| |
($214) |
|
|
|
$113,414 |
|
|
|
$1,924 |
|
|
|
$217,862 |
|
|
|
($614) |
|
STATEMENTS OF CHANGES IN NET ASSETS (Continued)
|
|
|
|
|
|
|
|
|
|
|
|
|
|
|
|
|
| |
|
Sit Mid Cap Growth Fund |
|
|
Sit Small Cap
Dividend Growth Fund |
|
| |
|
Six Months Ended
December 31, 2016
(Unaudited) |
|
|
Year Ended
June 30,
2016 |
|
|
Six Months Ended
December 31, 2016
(Unaudited) |
|
|
Year Ended
June 30,
2016 |
|
| Operations: |
|
|
|
|
|
|
|
|
|
|
|
|
|
|
|
|
| Net investment income (loss) |
|
|
$103,445 |
|
|
|
($340,217 |
) |
|
|
$62,214 |
|
|
|
$97,450 |
|
| Net realized gain (loss) on investments and foreign currency transactions |
|
|
1,264,987 |
|
|
|
3,828,112 |
|
|
|
(172,748) |
|
|
|
(178,755 |
) |
| Net change in unrealized appreciation (depreciation) of investments and foreign currency
transactions |
|
|
6,556,577 |
|
|
|
(19,621,396 |
) |
|
|
1,285,049 |
|
|
|
237,270 |
|
|
|
|
|
|
|
|
|
|
|
|
|
|
|
|
|
|
| Net increase (decrease) in net assets resulting from operations |
|
|
7,925,009 |
|
|
|
(16,133,501 |
) |
|
|
1,174,515 |
|
|
|
155,965 |
|
|
|
|
|
|
|
|
|
|
|
|
|
|
|
|
|
|
|
|
|
|
|
| Distributions from: |
|
|
|
|
|
|
|
|
|
|
|
|
|
|
|
|
| Net investment income |
|
|
|
|
|
|
|
|
|
|
|
|
|
|
|
|
| Common shares (Class I) |
|
|
— |
|
|
|
— |
|
|
|
(65,817) |
|
|
|
(59,286 |
) |
| Common shares (Class S) |
|
|
— |
|
|
|
— |
|
|
|
(17,183) |
|
|
|
(24,214 |
) |
| Net realized gains on investments |
|
|
|
|
|
|
|
|
|
|
|
|
|
|
|
|
| Common shares (Class I) |
|
|
(1,410,787) |
|
|
|
(23,213,056 |
) |
|
|
— |
|
|
|
(452 |
) |
| Common shares (Class S) |
|
|
— |
|
|
|
— |
|
|
|
— |
|
|
|
(218 |
) |
|
|
|
|
|
|
|
|
|
|
|
|
|
|
|
|
|
| Total distributions |
|
|
(1,410,787) |
|
|
|
(23,213,056 |
) |
|
|
(83,000) |
|
|
|
(84,170 |
) |
|
|
|
|
|
|
|
|
|
|
|
|
|
|
|
|
|
|
|
|
|
|
| Capital share transactions: |
|
|
|
|
|
|
|
|
|
|
|
|
|
|
|
|
| Proceeds from shares sold |
|
|
|
|
|
|
|
|
|
|
|
|
|
|
|
|
| Common shares (Class I) |
|
|
582,911 |
|
|
|
1,517,223 |
|
|
|
3,921,321 |
|
|
|
2,301,643 |
|
| Common shares (Class S) |
|
|
— |
|
|
|
— |
|
|
|
289,825 |
|
|
|
312,218 |
|
| Reinvested distributions |
|
|
|
|
|
|
|
|
|
|
|
|
|
|
|
|
| Common shares (Class I) |
|
|
1,364,195 |
|
|
|
22,382,176 |
|
|
|
62,847 |
|
|
|
57,003 |
|
| Common shares (Class S) |
|
|
— |
|
|
|
— |
|
|
|
16,956 |
|
|
|
24,085 |
|
| Payments for shares redeemed |
|
|
|
|
|
|
|
|
|
|
|
|
|
|
|
|
| Common shares (Class I) |
|
|
(5,985,523) |
|
|
|
(16,883,360 |
) |
|
|
(38,496) |
|
|
|
(338,246 |
) |
| Common shares (Class S) |
|
|
— |
|
|
|
— |
|
|
|
(186,519) |
|
|
|
(3,034 |
) |
|
|
|
|
|
|
|
|
|
|
|
|
|
|
|
|
|
| Increase (decrease) in net assets from capital transactions |
|
|
(4,038,417) |
|
|
|
7,016,039 |
|
|
|
4,065,934 |
|
|
|
2,353,669 |
|
|
|
|
|
|
|
|
|
|
|
|
|
|
|
|
|
|
| Total increase (decrease) in net assets |
|
|
2,475,805 |
|
|
|
(32,330,518 |
) |
|
|
5,157,449 |
|
|
|
2,425,464 |
|
|
|
|
|
|
| Net assets: |
|
|
|
|
|
|
|
|
|
|
|
|
|
|
|
|
| Beginning of period |
|
|
139,523,119 |
|
|
|
171,853,637 |
|
|
|
8,363,651 |
|
|
|
5,938,187 |
|
|
|
|
|
|
|
|
|
|
|
|
|
|
|
|
|
|
| End of period* |
|
|
$141,998,924 |
|
|
|
$139,523,119 |
|
|
|
$13,521,100 |
|
|
|
$8,363,651 |
|
|
|
|
|
|
|
|
|
|
|
|
|
|
|
|
|
|
|
|
|
|
|
| Capital transactions in shares: |
|
|
|
|
|
|
|
|
|
|
|
|
|
|
|
|
| Sold |
|
|
|
|
|
|
|
|
|
|
|
|
|
|
|
|
| Common shares (Class I) |
|
|
36,452 |
|
|
|
84,771 |
|
|
|
374,994 |
|
|
|
234,507 |
|
| Common shares (Class S) |
|
|
— |
|
|
|
— |
|
|
|
27,188 |
|
|
|
32,561 |
|
| Reinvested distributions |
|
|
|
|
|
|
|
|
|
|
|
|
|
|
|
|
| Common shares (Class I) |
|
|
83,899 |
|
|
|
1,427,435 |
|
|
|
5,961 |
|
|
|
5,975 |
|
| Common shares (Class S) |
|
|
— |
|
|
|
— |
|
|
|
1,616 |
|
|
|
2,522 |
|
| Redeemed |
|
|
|
|
|
|
|
|
|
|
|
|
|
|
|
|
| Common shares (Class I) |
|
|
(373,590) |
|
|
|
(928,645 |
) |
|
|
(3,721) |
|
|
|
(35,249 |
) |
| Common shares (Class S) |
|
|
— |
|
|
|
— |
|
|
|
(17,250) |
|
|
|
(304 |
) |
|
|
|
|
|
|
|
|
|
|
|
|
|
|
|
|
|
| Net increase (decrease) |
|
|
(253,239) |
|
|
|
583,561 |
|
|
|
388,788 |
|
|
|
240,012 |
|
|
|
|
|
|
|
|
|
|
|
|
|
|
|
|
|
|
| *includes undistributed (distributions in excess) net investment income (loss) |
|
|
$103,445 |
|
|
|
— |
|
|
|
$4,177 |
|
|
|
$24,963 |
|
|
|
|
|
|
| See accompanying notes to financial statements. |
|
|
|
|
| 60 |
|
|
SIT MUTUAL FUNDS SEMI-ANNUAL REPORT |
|
|
|
|
|
|
|
|
|
|
|
|
|
|
|
|
|
|
|
|
|
|
|
|
| Sit Small Cap Growth Fund |
|
|
Sit International Growth Fund |
|
|
Sit Developing Markets Growth Fund |
|
| Six Months Ended
December 31, 2016
(Unaudited) |
|
|
Year Ended
June 30,
2016 |
|
|
Six Months Ended
December 31, 2016
(Unaudited) |
|
|
Year Ended
June 30,
2016 |
|
|
Six Months Ended
December 31, 2016
(Unaudited) |
|
|
Year Ended
June 30,
2016 |
|
|
|
|
|
|
|
|
|
|
|
|
|
|
|
|
|
|
|
|
|
|
|
|
| |
($195,606) |
|
|
|
($586,514 |
) |
|
|
$21,926 |
|
|
|
$162,017 |
|
|
|
($12,547) |
|
|
|
$22,985 |
|
|
210,527 |
|
|
|
144,734 |
|
|
|
(608,874) |
|
|
|
(236,287 |
) |
|
|
44,361 |
|
|
|
(86,530 |
) |
|
8,602,331 |
|
|
|
(16,063,945 |
) |
|
|
133,056 |
|
|
|
(1,782,725 |
) |
|
|
(55,426) |
|
|
|
(1,286,835 |
) |
| |
|
|
|
|
|
|
|
|
|
|
|
|
|
|
|
|
|
|
|
|
|
|
|
|
|
|
|
|
| |
8,617,252 |
|
|
|
(16,505,725 |
) |
|
|
(453,892) |
|
|
|
(1,856,995 |
) |
|
|
(23,612) |
|
|
|
(1,350,380 |
) |
| |
|
|
|
|
|
|
|
|
|
|
|
|
|
|
|
|
|
|
|
|
|
|
|
|
|
|
|
|
|
|
|
|
|
|
|
|
|
|
|
|
|
|
|
|
|
|
|
|
|
|
|
|
|
|
|
|
|
|
|
|
|
|
|
|
|
|
|
|
|
|
|
|
|
|
| |
— |
|
|
|
— |
|
|
|
(97,000) |
|
|
|
(121,000 |
) |
|
|
(18,811) |
|
|
|
(12,000 |
) |
| |
— |
|
|
|
— |
|
|
|
— |
|
|
|
— |
|
|
|
— |
|
|
|
— |
|
| |
|
|
|
|
|
|
|
|
|
|
|
|
|
|
|
|
|
|
|
|
|
|
| |
(144,732) |
|
|
|
(8,910,218 |
) |
|
|
— |
|
|
|
(1,330,288 |
) |
|
|
— |
|
|
|
(211,867 |
) |
| |
— |
|
|
|
— |
|
|
|
— |
|
|
|
— |
|
|
|
— |
|
|
|
— |
|
| |
|
|
|
|
|
|
|
|
|
|
|
|
|
|
|
|
|
|
|
|
|
|
| |
(144,732) |
|
|
|
(8,910,218 |
) |
|
|
(97,000) |
|
|
|
(1,451,288 |
) |
|
|
(18,811) |
|
|
|
(223,867 |
) |
| |
|
|
|
|
|
|
|
|
|
|
|
|
|
|
|
|
|
|
|
|
|
|
|
|
|
|
|
|
|
|
|
|
|
|
|
|
|
|
|
|
|
|
|
|
|
|
|
|
|
|
|
|
|
|
|
|
|
|
|
|
|
|
|
|
|
|
|
|
|
|
|
|
|
|
| |
647,306 |
|
|
|
2,774,375 |
|
|
|
223,987 |
|
|
|
833,973 |
|
|
|
108,013 |
|
|
|
274,576 |
|
| |
— |
|
|
|
— |
|
|
|
— |
|
|
|
— |
|
|
|
— |
|
|
|
— |
|
|
|
|
|
|
|
| |
142,196 |
|
|
|
8,733,559 |
|
|
|
96,669 |
|
|
|
1,443,980 |
|
|
|
18,430 |
|
|
|
219,826 |
|
| |
— |
|
|
|
— |
|
|
|
— |
|
|
|
— |
|
|
|
— |
|
|
|
— |
|
| |
|
|
|
|
|
|
|
|
|
|
|
|
|
|
|
|
|
|
|
|
|
|
| |
(3,968,246) |
|
|
|
(8,698,957 |
) |
|
|
(645,038) |
|
|
|
(1,015,370 |
) |
|
|
(457,018) |
|
|
|
(815,737 |
) |
| |
— |
|
|
|
— |
|
|
|
— |
|
|
|
— |
|
|
|
— |
|
|
|
— |
|
| |
|
|
|
|
|
|
|
|
|
|
|
|
|
|
|
|
|
|
|
|
|
|
| |
(3,178,744) |
|
|
|
2,808,977 |
|
|
|
(324,382) |
|
|
|
1,262,583 |
|
|
|
(330,575) |
|
|
|
(321,335 |
) |
| |
|
|
|
|
|
|
|
|
|
|
|
|
|
|
|
|
|
|
|
|
|
|
| |
5,293,776 |
|
|
|
(22,606,966 |
) |
|
|
(875,274) |
|
|
|
(2,045,700 |
) |
|
|
(372,998) |
|
|
|
(1,895,582 |
) |
|
|
|
|
|
|
|
|
|
|
|
|
|
|
|
|
|
|
|
|
|
|
|
|
|
|
|
|
|
| |
81,208,869 |
|
|
|
103,815,835 |
|
|
|
20,439,662 |
|
|
|
22,485,362 |
|
|
|
7,296,509 |
|
|
|
9,192,091 |
|
| |
|
|
|
|
|
|
|
|
|
|
|
|
|
|
|
|
|
|
|
|
|
|
| |
$86,502,645 |
|
|
|
$81,208,869 |
|
|
|
$19,564,388 |
|
|
|
$20,439,662 |
|
|
|
$6,923,511 |
|
|
|
$7,296,509 |
|
| |
|
|
|
|
|
|
|
|
|
|
|
|
|
|
|
|
|
|
|
|
|
|
|
|
|
|
|
|
|
|
|
|
|
|
|
|
|
|
|
|
|
|
|
|
|
|
|
|
|
|
|
|
|
|
|
|
|
|
|
|
|
|
|
|
|
|
|
|
|
|
|
|
|
|
| |
13,216 |
|
|
|
51,321 |
|
|
|
15,059 |
|
|
|
51,877 |
|
|
|
8,595 |
|
|
|
21,675 |
|
| |
— |
|
|
|
— |
|
|
|
— |
|
|
|
— |
|
|
|
— |
|
|
|
— |
|
|
|
|
|
|
|
|
|
|
|
|
|
|
|
|
|
|
|
|
|
|
|
|
|
|
|
|
|
|
| |
2,793 |
|
|
|
180,036 |
|
|
|
6,876 |
|
|
|
95,946 |
|
|
|
1,517 |
|
|
|
18,458 |
|
| |
— |
|
|
|
— |
|
|
|
— |
|
|
|
— |
|
|
|
— |
|
|
|
— |
|
|
|
|
|
|
|
|
|
|
|
|
|
|
|
|
|
|
|
|
|
|
|
|
|
|
|
|
|
|
| |
(81,402) |
|
|
|
(177,213 |
) |
|
|
(44,542) |
|
|
|
(64,900 |
) |
|
|
(36,823) |
|
|
|
(67,398 |
) |
| |
— |
|
|
|
— |
|
|
|
— |
|
|
|
— |
|
|
|
— |
|
|
|
— |
|
| |
|
|
|
|
|
|
|
|
|
|
|
|
|
|
|
|
|
|
|
|
|
|
| |
(65,393) |
|
|
|
54,144 |
|
|
|
(22,607) |
|
|
|
82,923 |
|
|
|
(26,711) |
|
|
|
(27,265 |
) |
| |
|
|
|
|
|
|
|
|
|
|
|
|
|
|
|
|
|
|
|
|
|
|
|
|
|
|
|
|
| |
($195,606) |
|
|
|
— |
|
|
|
$1,470 |
|
|
|
$76,544 |
|
|
|
($12,547) |
|
|
|
$18,811 |
|
FINANCIAL HIGHLIGHTS
Per share income and capital changes for a share outstanding throughout the period. See accompanying notes to financial statements.
Sit Balanced Fund
|
|
|
|
|
|
|
|
|
|
|
|
|
|
|
|
|
|
|
|
|
|
|
|
|
| |
|
| |
|
Six Months Ended |
|
|
|
|
|
|
|
|
|
|
|
|
|
|
|
|
| |
|
December 31, 2016 |
|
|
|
|
|
Years Ended June 30, |
|
|
|
|
| |
|
(Unaudited) |
|
|
2016 |
|
|
2015 |
|
|
2014 |
|
|
2013 |
|
|
2012 |
|
| |
|
| Net Asset Value: |
|
|
|
|
|
|
|
|
|
|
|
|
|
|
|
|
|
|
|
|
|
|
|
|
| Beginning of period |
|
|
$20.40 |
|
|
|
$21.54 |
|
|
|
$21.01 |
|
|
|
$18.42 |
|
|
|
$16.97 |
|
|
|
$16.47 |
|
|
|
|
|
|
| Operations: |
|
|
|
|
|
|
|
|
|
|
|
|
|
|
|
|
|
|
|
|
|
|
|
|
| Net investment income 1 |
|
|
0.12 |
|
|
|
0.26 |
|
|
|
0.25 |
|
|
|
0.27 |
|
|
|
0.27 |
|
|
|
0.29 |
|
| Net realized and unrealized gains |
|
|
0.57 |
|
|
|
0.04 |
|
|
|
1.16 |
|
|
|
2.58 |
|
|
|
1.46 |
|
|
|
0.46 |
|
|
|
|
|
|
| Total from operations |
|
|
0.69 |
|
|
|
0.30 |
|
|
|
1.41 |
|
|
|
2.85 |
|
|
|
1.73 |
|
|
|
0.75 |
|
|
|
|
|
|
| Distributions to Shareholders: |
|
|
|
|
|
|
|
|
|
|
|
|
|
|
|
|
|
|
|
|
|
|
|
|
| From net investment income |
|
|
(0.18 |
) |
|
|
(0.45 |
) |
|
|
(0.24 |
) |
|
|
(0.26 |
) |
|
|
(0.28 |
) |
|
|
(0.25 |
) |
| From net realized gains |
|
|
— |
|
|
|
(0.99) |
|
|
|
(0.64) |
|
|
|
— |
|
|
|
— |
|
|
|
— |
|
|
|
|
|
|
| Total distributions |
|
|
(0.18 |
) |
|
|
(1.44 |
) |
|
|
(0.88 |
) |
|
|
(0.26 |
) |
|
|
(0.28 |
) |
|
|
(0.25 |
) |
|
|
|
|
|
| Net Asset Value: |
|
|
|
|
|
|
|
|
|
|
|
|
|
|
|
|
|
|
|
|
|
|
|
|
| End of period |
|
|
$20.91 |
|
|
|
$20.40 |
|
|
|
$21.54 |
|
|
|
$21.01 |
|
|
|
$18.42 |
|
|
|
$16.97 |
|
|
|
|
|
|
| Total investment return 2 |
|
|
3.37% |
|
|
|
1.47% |
|
|
|
6.86% |
|
|
|
15.58% |
|
|
|
10.26% |
|
|
|
4.61% |
|
|
|
|
|
|
| Net assets at end of period (000’s omitted) |
|
|
$24,598 |
|
|
|
$23,511 |
|
|
|
$22,970 |
|
|
|
$15,645 |
|
|
|
$13,492 |
|
|
|
$11,821 |
|
|
|
|
|
|
|
|
| Ratios: 3 |
|
|
|
|
|
|
|
|
|
|
|
|
|
|
|
|
|
|
|
|
|
|
|
|
| Expenses |
|
|
1.00% |
|
|
|
1.00% |
|
|
|
1.00% |
|
|
|
1.00% |
|
|
|
1.00% |
|
|
|
1.00% |
|
| Net investment income |
|
|
1.16% |
|
|
|
1.25% |
|
|
|
1.17% |
|
|
|
1.36% |
|
|
|
1.52% |
|
|
|
1.75% |
|
|
|
|
|
|
|
|
| Portfolio turnover rate
(excluding short-term securities) |
|
|
20.26% |
4 |
|
|
54.46% |
|
|
|
47.49% |
|
|
|
54.52% |
|
|
|
30.86% |
|
|
|
47.01% |
|
| 1 |
The net investment income per share is based on average shares outstanding for the period.
|
| 2 |
Total investment return is based on the change in net asset value of a share during the period (not
annualized) and assumes reinvestment of distributions at net asset value. |
| 3 |
Ratios are annualized for periods less than one year. In addition to fees and expenses which the Fund bears
directly, the Fund indirectly bears a pro rata share of the fees and expenses of the acquired funds in which it invests. Such indirect expenses are not included in the above reported expense ratios. |
|
|
|
|
|
|
|
|
|
|
| 62 |
|
|
SIT MUTUAL FUNDS SEMI-ANNUAL REPORT |
|
FINANCIAL HIGHLIGHTS
Per share income and capital changes for a share outstanding throughout the period. See accompanying notes to financial statements.
Sit Dividend Growth Fund
|
|
|
|
|
|
|
|
|
|
|
|
|
|
|
|
|
|
|
|
|
|
|
|
|
| |
|
| |
|
Six Months Ended |
|
|
|
|
|
|
|
|
|
|
|
|
|
|
|
|
| Class I |
|
December 31, 2016 |
|
|
|
|
|
Years Ended June 30, |
|
|
|
|
| |
|
(Unaudited) |
|
|
2016 |
|
|
2015 |
|
|
2014 |
|
|
2013 |
|
|
2012 |
|
| |
|
| Net Asset Value: |
|
|
|
|
|
|
|
|
|
|
|
|
|
|
|
|
|
|
|
|
|
|
|
|
| Beginning of period |
|
|
$15.82 |
|
|
|
$17.40 |
|
|
|
$18.69 |
|
|
|
$16.35 |
|
|
|
$14.10 |
|
|
|
$13.91 |
|
|
|
|
|
|
| Operations: |
|
|
|
|
|
|
|
|
|
|
|
|
|
|
|
|
|
|
|
|
|
|
|
|
| Net investment income 1 |
|
|
0.13 |
|
|
|
0.26 |
|
|
|
0.25 |
|
|
|
0.26 |
|
|
|
0.27 |
|
|
|
0.24 |
|
| Net realized and unrealized gains |
|
|
0.86 |
|
|
|
0.32 |
|
|
|
0.92 |
|
|
|
2.96 |
|
|
|
2.46 |
|
|
|
0.26 |
|
|
|
|
|
|
| Total from operations |
|
|
0.99 |
|
|
|
0.58 |
|
|
|
1.17 |
|
|
|
3.22 |
|
|
|
2.73 |
|
|
|
0.50 |
|
|
|
|
|
|
| Redemption fees 2 |
|
|
— |
|
|
|
— |
|
|
|
— |
|
|
|
— |
|
|
|
— |
|
|
|
— |
|
|
|
|
|
|
| Distributions to Shareholders: |
|
|
|
|
|
|
|
|
|
|
|
|
|
|
|
|
|
|
|
|
|
|
|
|
| From net investment income |
|
|
(0.18) |
|
|
|
(0.32 |
) |
|
|
(0.25 |
) |
|
|
(0.25 |
) |
|
|
(0.26 |
) |
|
|
(0.21 |
) |
| From net realized gains |
|
|
(1.04) |
|
|
|
(1.84 |
) |
|
|
(2.21 |
) |
|
|
(0.63 |
) |
|
|
(0.22 |
) |
|
|
(0.10 |
) |
|
|
|
|
|
| Total distributions. |
|
|
(1.22) |
|
|
|
(2.16 |
) |
|
|
(2.46 |
) |
|
|
(0.88 |
) |
|
|
(0.48 |
) |
|
|
(0.31 |
) |
|
|
|
|
|
| Net Asset Value: |
|
|
|
|
|
|
|
|
|
|
|
|
|
|
|
|
|
|
|
|
|
|
|
|
| End of period |
|
|
$15.59 |
|
|
|
$15.82 |
|
|
|
$17.40 |
|
|
|
$18.69 |
|
|
|
$16.35 |
|
|
|
$14.10 |
|
|
|
|
|
|
| Total investment return 3 |
|
|
6.27% |
|
|
|
3.94% |
|
|
|
6.39% |
|
|
|
20.26% |
|
|
|
19.77% |
|
|
|
3.76% |
|
|
|
|
|
|
| Net assets at end of period (000’s omitted) |
|
|
$927,345 |
|
|
|
$942,244 |
|
|
|
$955,460 |
|
|
|
$1,017,106 |
|
|
|
$920,324 |
|
|
|
$619,667 |
|
| Ratios: 4 |
|
|
|
|
|
|
|
|
|
|
|
|
|
|
|
|
|
|
|
|
|
|
|
|
| Expenses |
|
|
1.00% |
|
|
|
1.00% |
|
|
|
1.00% |
|
|
|
1.00% |
|
|
|
1.00% |
|
|
|
1.00% |
|
| Net investment income |
|
|
1.63% |
|
|
|
1.64% |
|
|
|
1.39% |
|
|
|
1.50% |
|
|
|
1.78% |
|
|
|
1.79% |
|
| Portfolio turnover rate (excluding short-term securities) |
|
|
32.11%5 |
|
|
|
75.94% |
|
|
|
57.69% |
|
|
|
44.36% |
|
|
|
26.58% |
|
|
|
26.84% |
|
| |
|
| |
|
Six Months Ended |
|
|
|
|
|
|
|
|
|
|
|
|
|
|
|
|
| Class S |
|
December 31, 2016 |
|
|
|
|
|
Years Ended June 30, |
|
|
|
|
| |
|
(Unaudited) |
|
|
2016 |
|
|
2015 |
|
|
2014 |
|
|
2013 |
|
|
2012 |
|
| |
|
| Net Asset Value: |
|
|
|
|
|
|
|
|
|
|
|
|
|
|
|
|
|
|
|
|
|
|
|
|
| Beginning of period |
|
|
$15.76 |
|
|
|
$17.34 |
|
|
|
$18.63 |
|
|
|
$16.29 |
|
|
|
$14.06 |
|
|
|
$13.87 |
|
| Operations: |
|
|
|
|
|
|
|
|
|
|
|
|
|
|
|
|
|
|
|
|
|
|
|
|
| Net investment income 1 |
|
|
0.11 |
|
|
|
0.22 |
|
|
|
0.21 |
|
|
|
0.22 |
|
|
|
0.23 |
|
|
|
0.21 |
|
| Net realized and unrealized gains |
|
|
0.86 |
|
|
|
0.32 |
|
|
|
0.91 |
|
|
|
2.96 |
|
|
|
2.44 |
|
|
|
0.26 |
|
|
|
|
|
|
| Total from operations |
|
|
0.97 |
|
|
|
0.54 |
|
|
|
1.12 |
|
|
|
3.18 |
|
|
|
2.67 |
|
|
|
0.47 |
|
|
|
|
|
|
| Redemption fees 2 |
|
|
— |
|
|
|
— |
|
|
|
— |
|
|
|
— |
|
|
|
— |
|
|
|
— |
|
|
|
|
|
|
| Distributions to Shareholders: |
|
|
|
|
|
|
|
|
|
|
|
|
|
|
|
|
|
|
|
|
|
|
|
|
| From net investment income |
|
|
(0.15) |
|
|
|
(0.28 |
) |
|
|
(0.20 |
) |
|
|
(0.21 |
) |
|
|
(0.22 |
) |
|
|
(0.18 |
) |
| From net realized gains |
|
|
(1.04) |
|
|
|
(1.84 |
) |
|
|
(2.21 |
) |
|
|
(0.63 |
) |
|
|
(0.22 |
) |
|
|
(0.10 |
) |
|
|
|
|
|
| Total distributions |
|
|
(1.19) |
|
|
|
(2.12 |
) |
|
|
(2.41 |
) |
|
|
(0.84 |
) |
|
|
(0.44 |
) |
|
|
(0.28 |
) |
|
|
|
|
|
| Net Asset Value: |
|
|
|
|
|
|
|
|
|
|
|
|
|
|
|
|
|
|
|
|
|
|
|
|
| End of period |
|
|
$15.54 |
|
|
|
$15.76 |
|
|
|
$17.34 |
|
|
|
$18.63 |
|
|
|
$16.29 |
|
|
|
$14.06 |
|
|
|
|
|
|
| Total investment return 3 |
|
|
6.16% |
|
|
|
3.68% |
|
|
|
6.13% |
|
|
|
20.02% |
|
|
|
19.39% |
|
|
|
3.53% |
|
|
|
|
|
|
| Net assets at end of period (000’s omitted) |
|
|
$67,393 |
|
|
|
$67,620 |
|
|
|
$82,959 |
|
|
|
$103,433 |
|
|
|
$134,498 |
|
|
|
$100,878 |
|
| Ratios: 4 |
|
|
|
|
|
|
|
|
|
|
|
|
|
|
|
|
|
|
|
|
|
|
|
|
| Expenses |
|
|
1.25% |
|
|
|
1.25% |
|
|
|
1.25% |
|
|
|
1.25% |
|
|
|
1.25% |
|
|
|
1.25% |
|
| Net investment income |
|
|
1.38% |
|
|
|
1.39% |
|
|
|
1.14% |
|
|
|
1.25% |
|
|
|
1.53% |
|
|
|
1.54% |
|
| Portfolio turnover rate (excluding short-term securities) |
|
|
32.11%5 |
|
|
|
75.94% |
|
|
|
57.69% |
|
|
|
44.36% |
|
|
|
26.58% |
|
|
|
26.84% |
|
| 1 |
The net investment income per share is based on average shares outstanding for the period.
|
| 2 |
Amount represents less than $0.01 per share. |
| 3 |
Total investment return is based on the change in net asset value of a share during the period (not
annualized) and assumes reinvestment of distributions at net asset value. |
| 4 |
Ratios are annualized for periods less than one year. In addition to fees and expenses which the Fund bears
directly, the Fund indirectly bears a pro rata share of the fees and expenses of the acquired funds in which it invests. Such indirect expenses are not included in the above reported expense ratios. |
FINANCIAL HIGHLIGHTS
Per share income and capital changes for a share outstanding throughout the period. See accompanying notes to financial statements.
Sit Global Dividend Growth Fund
|
|
|
|
|
|
|
|
|
|
|
|
|
|
|
|
|
|
|
|
|
|
|
|
|
| |
|
| |
|
Six Months Ended |
|
|
|
|
|
|
|
|
|
|
|
|
|
|
|
|
| Class I |
|
December 31, 2016 |
|
|
|
|
|
Years Ended June 30, |
|
|
|
|
| |
|
(Unaudited) |
|
|
2016 |
|
|
2015 |
|
|
2014 |
|
|
2013 |
|
|
2012 |
|
| |
|
| Net Asset Value: |
|
|
|
|
|
|
|
|
|
|
|
|
|
|
|
|
|
|
|
|
|
|
|
|
| Beginning of period |
|
|
$13.19 |
|
|
|
$14.80 |
|
|
|
$15.74 |
|
|
|
$14.27 |
|
|
|
$12.55 |
|
|
|
$13.26 |
|
| Operations: |
|
|
|
|
|
|
|
|
|
|
|
|
|
|
|
|
|
|
|
|
|
|
|
|
| Net investment income 1 |
|
|
0.09 |
|
|
|
0.21 |
|
|
|
0.20 |
|
|
|
0.23 |
|
|
|
0.25 |
|
|
|
0.24 |
|
| Net realized and unrealized gains (losses) |
|
|
0.38 |
|
|
|
(0.48 |
) |
|
|
0.13 |
|
|
|
2.09 |
|
|
|
1.78 |
|
|
|
(0.58 |
) |
|
|
|
|
|
| Total from operations |
|
|
0.47 |
|
|
|
(0.27 |
) |
|
|
0.33 |
|
|
|
2.32 |
|
|
|
2.03 |
|
|
|
(0.34 |
) |
|
|
|
|
|
| Redemption fees |
|
|
— |
|
|
|
— |
|
|
|
— |
|
|
|
— |
2 |
|
|
— |
2 |
|
|
— |
|
|
|
|
|
|
| Distributions to Shareholders: |
|
|
|
|
|
|
|
|
|
|
|
|
|
|
|
|
|
|
|
|
|
|
|
|
| From net investment income |
|
|
(0.15) |
|
|
|
(0.34 |
) |
|
|
(0.20 |
) |
|
|
(0.22 |
) |
|
|
(0.23 |
) |
|
|
(0.22 |
) |
| From net realized gains |
|
|
— |
|
|
|
(1.00 |
) |
|
|
(1.07 |
) |
|
|
(0.63 |
) |
|
|
(0.08 |
) |
|
|
(0.15 |
) |
|
|
|
|
|
| Total distributions |
|
|
(0.15) |
|
|
|
(1.34 |
) |
|
|
(1.27 |
) |
|
|
(0.85 |
) |
|
|
(0.31 |
) |
|
|
(0.37 |
) |
|
|
|
|
|
| Net Asset Value: |
|
|
|
|
|
|
|
|
|
|
|
|
|
|
|
|
|
|
|
|
|
|
|
|
| End of period |
|
|
$13.51 |
|
|
|
$13.19 |
|
|
|
$14.80 |
|
|
|
$15.74 |
|
|
|
$14.27 |
|
|
|
$12.55 |
|
|
|
|
|
|
| Total investment return 3 |
|
|
3.57% |
|
|
|
(1.67% |
) |
|
|
2.19% |
|
|
|
16.76% |
|
|
|
16.36% |
|
|
|
(2.44% |
) |
|
|
|
|
|
| Net assets at end of period (000’s omitted) |
|
|
$22,700 |
|
|
|
$22,333 |
|
|
|
$21,424 |
|
|
|
$21,467 |
|
|
|
$14,196 |
|
|
|
$10,421 |
|
| Ratios: 4 |
|
|
|
|
|
|
|
|
|
|
|
|
|
|
|
|
|
|
|
|
|
|
|
|
| Expenses |
|
|
1.25% |
|
|
|
1.25% |
|
|
|
1.25% |
|
|
|
1.25% |
|
|
|
1.25% |
|
|
|
1.25% |
|
| Net investment income |
|
|
1.30% |
|
|
|
1.56% |
|
|
|
1.33% |
|
|
|
1.55% |
|
|
|
1.81% |
|
|
|
1.97% |
|
| Portfolio turnover rate (excluding short-term securities) |
|
|
14.56%5 |
|
|
|
48.30% |
|
|
|
75.06% |
|
|
|
48.68% |
|
|
|
26.15% |
|
|
|
26.65% |
|
| |
|
| |
|
Six Months Ended |
|
|
|
|
|
|
|
|
|
|
|
|
|
|
|
|
| Class S |
|
December 31, 2016 |
|
|
|
|
|
Years Ended June 30, |
|
|
|
|
| |
|
(Unaudited) |
|
|
2016 |
|
|
2015 |
|
|
2014 |
|
|
2013 |
|
|
2012 |
|
| |
|
| Net Asset Value: |
|
|
|
|
|
|
|
|
|
|
|
|
|
|
|
|
|
|
|
|
|
|
|
|
| Beginning of period |
|
|
$13.18 |
|
|
|
$14.78 |
|
|
|
$15.72 |
|
|
|
$14.25 |
|
|
|
$12.54 |
|
|
|
$13.24 |
|
| Operations: |
|
|
|
|
|
|
|
|
|
|
|
|
|
|
|
|
|
|
|
|
|
|
|
|
| Net investment income 1 |
|
|
0.07 |
|
|
|
0.18 |
|
|
|
0.16 |
|
|
|
0.20 |
|
|
|
0.21 |
|
|
|
0.21 |
|
| Net realized and unrealized gains (losses) |
|
|
0.37 |
|
|
|
(0.48 |
) |
|
|
0.13 |
|
|
|
2.09 |
|
|
|
1.78 |
|
|
|
(0.57 |
) |
|
|
|
|
|
| Total from operations |
|
|
0.44 |
|
|
|
(0.30 |
) |
|
|
0.29 |
|
|
|
2.29 |
|
|
|
1.99 |
|
|
|
(0.36 |
) |
|
|
|
|
|
| Redemption fees |
|
|
— |
|
|
|
— |
|
|
|
— |
|
|
|
— |
2 |
|
|
— |
|
|
|
— |
|
|
|
|
|
|
| Distributions to Shareholders: |
|
|
|
|
|
|
|
|
|
|
|
|
|
|
|
|
|
|
|
|
|
|
|
|
| From net investment income |
|
|
(0.12) |
|
|
|
(0.30 |
) |
|
|
(0.16 |
) |
|
|
(0.19 |
) |
|
|
(0.20 |
) |
|
|
(0.19 |
) |
| From net realized gains |
|
|
— |
|
|
|
(1.00 |
) |
|
|
(1.07 |
) |
|
|
(0.63 |
) |
|
|
(0.08 |
) |
|
|
(0.15 |
) |
|
|
|
|
|
| Total distributions |
|
|
(0.12) |
|
|
|
(1.30 |
) |
|
|
(1.23 |
) |
|
|
(0.82 |
) |
|
|
(0.28 |
) |
|
|
(0.34 |
) |
|
|
|
|
|
| Net Asset Value: |
|
|
|
|
|
|
|
|
|
|
|
|
|
|
|
|
|
|
|
|
|
|
|
|
| End of period |
|
|
$13.50 |
|
|
|
$13.18 |
|
|
|
$14.78 |
|
|
|
$15.72 |
|
|
|
$14.25 |
|
|
|
$12.54 |
|
|
|
|
|
|
| Total investment return 3 |
|
|
3.38% |
|
|
|
(1.89% |
) |
|
|
2.00% |
|
|
|
16.49% |
|
|
|
16.01% |
|
|
|
(2.60% |
) |
|
|
|
|
|
| Net assets at end of period (000’s omitted) |
|
|
$3,112 |
|
|
|
$2,861 |
|
|
|
$3,451 |
|
|
|
$3,323 |
|
|
|
$3,257 |
|
|
|
$2,608 |
|
| Ratios: 4 |
|
|
|
|
|
|
|
|
|
|
|
|
|
|
|
|
|
|
|
|
|
|
|
|
| Expenses |
|
|
1.50% |
|
|
|
1.50% |
|
|
|
1.50% |
|
|
|
1.50% |
|
|
|
1.50% |
|
|
|
1.50% |
|
| Net investment income |
|
|
1.05% |
|
|
|
1.31% |
|
|
|
1.08% |
|
|
|
1.30% |
|
|
|
1.56% |
|
|
|
1.72% |
|
| Portfolio turnover rate (excluding short-term securities) |
|
|
14.56%5 |
|
|
|
48.30% |
|
|
|
75.06% |
|
|
|
48.68% |
|
|
|
26.15% |
|
|
|
26.65% |
|
| 1 |
The net investment income per share is based on average shares outstanding for the period.
|
| 2 |
Amount represents less than $0.01 per share. |
| 3 |
Total investment return is based on the change in net asset value of a share during the period (not
annualized) and assumes reinvestment of distributions at net asset value. |
| 4 |
Ratios are annualized for periods less than one year. In addition to fees and expenses which the Fund bears
directly, the Fund indirectly bears a pro rata share of the fees and expenses of the acquired funds in which it invests. Such indirect expenses are not included in the above reported expense ratios. |
|
|
|
|
|
|
|
|
|
|
| 64 |
|
|
SIT MUTUAL FUNDS SEMI-ANNUAL REPORT |
|
FINANCIAL HIGHLIGHTS
Per share income and capital changes for a share outstanding throughout the period. See accompanying notes to financial statements.
Sit Large Cap Growth Fund
|
|
|
|
|
|
|
|
|
|
|
|
|
|
|
|
|
|
|
|
|
|
|
|
|
| |
|
| |
|
Six Months Ended |
|
|
|
|
|
|
|
December 31, 2016 |
|
|
|
|
|
|
|
Years Ended June 30, |
|
|
|
|
|
|
|
|
(Unaudited) |
|
|
|
2016 |
|
|
|
2015 |
|
|
|
2014 |
|
|
|
2013 |
|
|
|
2012 |
|
| |
|
| Net Asset Value: |
|
|
|
|
|
|
|
|
|
|
|
|
|
|
|
|
|
|
|
|
|
|
|
|
| Beginning of period |
|
|
$36.02 |
|
|
|
$47.21 |
|
|
|
$52.51 |
|
|
|
$47.53 |
|
|
|
$45.53 |
|
|
|
$43.96 |
|
|
|
|
|
|
| Operations: |
|
|
|
|
|
|
|
|
|
|
|
|
|
|
|
|
|
|
|
|
|
|
|
|
| Net investment income 1 |
|
|
0.11 |
|
|
|
0.18 |
|
|
|
0.20 |
|
|
|
0.29 |
|
|
|
0.43 |
|
|
|
0.26 |
|
| Net realized and unrealized gains (losses) |
|
|
2.10 |
|
|
|
(0.42 |
) |
|
|
5.04 |
|
|
|
10.23 |
|
|
|
5.69 |
|
|
|
1.63 |
|
|
|
|
|
|
| Total from operations |
|
|
2.21 |
|
|
|
(0.24 |
) |
|
|
5.24 |
|
|
|
10.52 |
|
|
|
6.12 |
|
|
|
1.89 |
|
|
|
|
|
|
| Redemption fees 2 |
|
|
— |
|
|
|
— |
|
|
|
— |
|
|
|
— |
|
|
|
— |
|
|
|
— |
|
|
|
|
|
|
| Distributions to Shareholders: |
|
|
|
|
|
|
|
|
|
|
|
|
|
|
|
|
|
|
|
|
|
|
|
|
| From net investment income |
|
|
(0.19) |
|
|
|
(1.44 |
) |
|
|
(0.24 |
) |
|
|
(0.39 |
) |
|
|
(0.46 |
) |
|
|
(0.32 |
) |
| From net realized gains |
|
|
(2.55) |
|
|
|
(9.51 |
) |
|
|
(10.30 |
) |
|
|
(5.15 |
) |
|
|
(3.66 |
) |
|
|
— |
|
|
|
|
|
|
| Total distributions |
|
|
(2.74) |
|
|
|
(10.95 |
) |
|
|
(10.54 |
) |
|
|
(5.54 |
) |
|
|
(4.12 |
) |
|
|
(0.32 |
) |
|
|
|
|
|
| Net Asset Value: |
|
|
|
|
|
|
|
|
|
|
|
|
|
|
|
|
|
|
|
|
|
|
|
|
| End of period |
|
|
$35.49 |
|
|
|
$36.02 |
|
|
|
$47.21 |
|
|
|
$52.51 |
|
|
|
$47.53 |
|
|
|
$45.53 |
|
|
|
|
|
|
| Total investment return 3 |
|
|
6.04% |
|
|
|
(0.89% |
) |
|
|
10.62% |
|
|
|
22.92% |
|
|
|
14.18% |
|
|
|
4.39% |
|
|
|
|
|
|
| Net assets at end of period (000’s omitted) |
|
|
$111,914 |
|
|
|
$117,459 |
|
|
|
$144,807 |
|
|
|
$188,574 |
|
|
|
$196,285 |
|
|
|
$254,256 |
|
|
|
|
|
|
|
|
| Ratios: 4 |
|
|
|
|
|
|
|
|
|
|
|
|
|
|
|
|
|
|
|
|
|
|
|
|
| Expenses |
|
|
1.00% |
|
|
|
1.00% |
|
|
|
1.00% |
|
|
|
1.00% |
|
|
|
1.00% |
|
|
|
1.00% |
|
| Net investment income |
|
|
0.61% |
|
|
|
0.44% |
|
|
|
0.41% |
|
|
|
0.57% |
|
|
|
0.92% |
|
|
|
0.61% |
|
| Portfolio turnover rate (excluding short-term securities) |
|
|
7.82%5 |
|
|
|
20.05% |
|
|
|
24.04% |
|
|
|
27.34% |
|
|
|
13.42% |
|
|
|
15.06% |
|
| 1 |
The net investment income per share is based on average shares outstanding for the period.
|
| 2 |
Amount represents less than $0.01 per share. |
| 3 |
Total investment return is based on the change in net asset value of a share during the period (not
annualized) and assumes reinvestment of distributions at net asset value. |
| 4 |
Ratios are annualized for periods less than one year. In addition to fees and expenses which the Fund bears
directly, the Fund indirectly bears a pro rata share of the fees and expenses of the acquired funds in which it invests. Such indirect expenses are not included in the above reported expense ratios. |
FINANCIAL HIGHLIGHTS
Per share income and capital changes for a share outstanding throughout the period. See accompanying notes to financial statements.
Sit ESG Growth Fund
|
|
|
|
|
| |
|
Six Months Ended |
|
| Class I |
|
December 31, 2016 |
|
| |
|
(Unaudited) * |
|
|
|
| Net Asset Value: |
|
|
|
|
| Beginning of period |
|
|
$10.00 |
|
|
|
|
|
|
| Operations: |
|
|
|
|
| Net investment income 1 |
|
|
0.02 |
|
| Net realized and unrealized gains |
|
|
0.18 |
|
|
|
|
|
|
| Total from operations |
|
|
0.20 |
|
|
|
|
|
|
| Distributions to Shareholders: |
|
|
|
|
| From net investment income |
|
|
(0.02) |
|
|
|
|
|
|
| Net Asset Value: |
|
|
|
|
| End of period |
|
|
$10.18 |
|
|
|
|
|
|
| Total investment return 2 |
|
|
2.01% |
|
|
|
|
|
|
| Net assets at end of period (000’s omitted) |
|
|
$2,109 |
|
| Ratios: 3 |
|
|
|
|
| Expenses |
|
|
1.25% |
|
| Net investment income |
|
|
0.39% |
|
| Portfolio turnover rate (excluding short-term securities) |
|
|
11.87%4 |
|
|
|
|
|
|
| |
|
Six Months Ended |
|
| Class S |
|
December 31, 2016 |
|
| |
|
(Unaudited) * |
|
| Net Asset Value: |
|
|
|
|
| Beginning of period |
|
|
$10.00 |
|
|
|
|
|
|
| Operations: |
|
|
|
|
| Net investment income 1 |
|
|
0.01 |
|
| Net realized and unrealized gains |
|
|
0.18 |
|
|
|
|
|
|
| Total from operations |
|
|
0.19 |
|
|
|
|
|
|
| Distributions to Shareholders: |
|
|
|
|
| From net investment income |
|
|
(0.01) |
|
|
|
|
|
|
| Net Asset Value: |
|
|
|
|
| End of period |
|
|
$10.18 |
|
|
|
|
|
|
| Total investment return 2 |
|
|
1.88% |
|
|
|
|
|
|
| Net assets at end of period (000’s omitted) |
|
|
$2,050 |
|
| Ratios: 3 |
|
|
|
|
| Expenses |
|
|
1.50% |
|
| Net investment income |
|
|
0.14% |
|
| Portfolio turnover rate (excluding short-term securities) |
|
|
11.87%4 |
|
| * |
The Fund commenced investment operations on June 30, 2016. |
| 1 |
The net investment income per share is based on average shares outstanding for the period.
|
| 2 |
Total investment return is based on the change in net asset value of a share during the period (not
annualized) and assumes reinvestment of distributions at net asset value. |
| 3 |
Ratios are annualized for periods less than one year. In addition to fees and expenses which the Fund bears
directly, the Fund indirectly bears a pro rata share of the fees and expenses of the acquired funds in which it invests. Such indirect expenses are not included in the above reported expense ratios. |
|
|
|
|
|
|
|
|
|
|
| 66 |
|
|
SIT MUTUAL FUNDS SEMI-ANNUAL REPORT |
|
FINANCIAL HIGHLIGHTS
Per share income and capital changes for a share outstanding throughout the period. See accompanying notes to financial statements.
Sit Mid Cap Growth Fund
|
|
|
|
|
|
|
|
|
|
|
|
|
|
|
|
|
|
|
|
|
|
|
|
|
| |
|
Six Months Ended |
|
|
|
|
| |
|
December 31, 2016 |
|
|
|
|
|
Years Ended June 30, |
|
|
|
|
|
|
|
(Unaudited) |
|
|
|
2016 |
|
|
|
2015 |
|
|
|
2014 |
|
|
|
2013 |
|
|
|
2012 |
|
| |
|
| Net Asset Value: |
|
|
|
|
|
|
|
|
|
|
|
|
|
|
|
|
|
|
|
|
|
|
|
|
| Beginning of period |
|
|
$15.36 |
|
|
|
$20.22 |
|
|
|
$21.08 |
|
|
|
$17.69 |
|
|
|
$15.77 |
|
|
|
$15.88 |
|
|
|
|
|
|
| Operations: |
|
|
|
|
|
|
|
|
|
|
|
|
|
|
|
|
|
|
|
|
|
|
|
|
| Net investment income (loss) 1 |
|
|
0.01 |
|
|
|
(0.04 |
) |
|
|
(0.06 |
) |
|
|
(0.07 |
) |
|
|
(0.03 |
) |
|
|
(0.05 |
) |
| Net realized and unrealized gains (losses) |
|
|
0.87 |
|
|
|
(1.92 |
) |
|
|
1.91 |
|
|
|
4.54 |
|
|
|
2.32 |
|
|
|
(0.06 |
) |
|
|
|
|
|
| Total from operations |
|
|
0.88 |
|
|
|
(1.96 |
) |
|
|
1.85 |
|
|
|
4.47 |
|
|
|
2.29 |
|
|
|
(0.11 |
) |
|
|
|
|
|
| Redemption fees 2 |
|
|
— |
|
|
|
— |
|
|
|
— |
|
|
|
— |
|
|
|
— |
|
|
|
— |
|
|
|
|
|
|
| Distributions to Shareholders: |
|
|
|
|
|
|
|
|
|
|
|
|
|
|
|
|
|
|
|
|
|
|
|
|
| From net realized gains |
|
|
(0.16) |
|
|
|
(2.90 |
) |
|
|
(2.71 |
) |
|
|
(1.08 |
) |
|
|
(0.37 |
) |
|
|
— |
|
|
|
|
|
|
| Net Asset Value: |
|
|
|
|
|
|
|
|
|
|
|
|
|
|
|
|
|
|
|
|
|
|
|
|
| End of period |
|
|
$16.08 |
|
|
|
$15.36 |
|
|
|
$20.22 |
|
|
|
$21.08 |
|
|
|
$17.69 |
|
|
|
$15.77 |
|
|
|
|
|
|
| Total investment return 3 |
|
|
5.72% |
|
|
|
(9.97% |
) |
|
|
9.52% |
|
|
|
25.58% |
|
|
|
14.70% |
|
|
|
(0.69% |
) |
|
|
|
|
|
| Net assets at end of period (000’s omitted) |
|
|
$141,999 |
|
|
|
$139,523 |
|
|
|
$171,854 |
|
|
|
$180,276 |
|
|
|
$152,129 |
|
|
|
$144,601 |
|
|
|
|
|
|
|
|
| Ratios: 4 |
|
|
|
|
|
|
|
|
|
|
|
|
|
|
|
|
|
|
|
|
|
|
|
|
| Expenses |
|
|
1.25% |
|
|
|
1.25% |
|
|
|
1.25% |
|
|
|
1.25% |
|
|
|
1.25% |
|
|
|
1.25% |
|
| Net investment income (loss) |
|
|
0.14% |
|
|
|
(0.23% |
) |
|
|
(0.30% |
) |
|
|
(0.37% |
) |
|
|
(0.17% |
) |
|
|
(0.33% |
) |
|
|
|
|
|
|
|
| Portfolio turnover rate (excluding short-term securities) |
|
|
12.52%5 |
|
|
|
21.57% |
|
|
|
23.39% |
|
|
|
27.65% |
|
|
|
16.91% |
|
|
|
16.23% |
|
| 1 |
The net investment income (loss) per share is based on average shares outstanding for the period.
|
| 2 |
Amount represents less than $0.01 per share. |
| 3 |
Total investment return is based on the change in net asset value of a share during the period (not
annualized) and assumes reinvestment of distributions at net asset value. |
| 4 |
Ratios are annualized for periods less than one year. In addition to fees and expenses which the Fund bears
directly, the Fund indirectly bears a pro rata share of the fees and expenses of the acquired funds in which it invests. Such indirect expenses are not included in the above reported expense ratios. |
FINANCIAL HIGHLIGHTS
Per share income and capital changes for a share outstanding throughout the period. See accompanying notes to financial statements.
Sit Small Cap Dividend Growth Fund
|
|
|
|
|
|
|
|
|
|
|
|
|
| |
|
Six Months Ended |
|
|
|
|
|
Three |
|
| Class I |
|
December 31, 2016 |
|
|
Year Ended |
|
|
Months Ended |
|
| |
|
(Unaudited) |
|
|
June 30, 2016 |
|
|
June 30, 2015 * |
|
| |
|
|
|
|
|
| Net Asset Value: |
|
|
|
|
|
|
|
|
|
|
|
|
| Beginning of period |
|
|
$10.00 |
|
|
|
$9.96 |
|
|
|
$10.00 |
|
|
|
|
|
|
| Operations: |
|
|
|
|
|
|
|
|
|
|
|
|
| Net investment income 1 |
|
|
0.06 |
|
|
|
0.14 |
|
|
|
0.02 |
|
| Net realized and unrealized gains (losses) |
|
|
1.06 |
|
|
|
0.02 |
|
|
|
(0.06) |
|
|
|
|
|
|
| Total from operations |
|
|
1.12 |
|
|
|
0.16 |
|
|
|
(0.04) |
|
|
|
|
|
|
| Distributions to Shareholders: |
|
|
|
|
|
|
|
|
|
|
|
|
| From net investment income |
|
|
(0.08) |
|
|
|
(0.12) |
|
|
|
— |
|
| From net realized gains |
|
|
— |
|
|
|
— 2 |
|
|
|
— |
|
|
|
|
|
|
| Total distributions |
|
|
(0.08) |
|
|
|
(0.12) |
|
|
|
— |
|
|
|
|
|
|
| Net Asset Value: |
|
|
|
|
|
|
|
|
|
|
|
|
| End of period |
|
|
$11.04 |
|
|
|
$10.00 |
|
|
|
$9.96 |
|
|
|
|
|
|
| Total investment return 3 |
|
|
11.29% |
|
|
|
1.71% |
|
|
|
(0.40%) |
|
|
|
|
|
|
| Net assets at end of period (000’s omitted) |
|
|
$10,538 |
|
|
|
$5,777 |
|
|
|
$3,708 |
|
| Ratios: 4 |
|
|
|
|
|
|
|
|
|
|
|
|
| Expenses |
|
|
1.25% |
|
|
|
1.25% |
|
|
|
1.25% |
|
| Net investment income |
|
|
1.22% |
|
|
|
1.46% |
|
|
|
0.98% |
|
| Portfolio turnover rate (excluding short-term securities) |
|
|
6.56%5 |
|
|
|
26.43% |
|
|
|
2.63%5 |
|
|
|
|
|
|
|
|
|
|
|
|
|
|
| |
|
Six Months Ended |
|
|
|
|
|
Three |
|
| Class S |
|
December 31, 2016 |
|
|
Year Ended |
|
|
Months Ended |
|
| |
|
(Unaudited) |
|
|
June 30, 2016 |
|
|
June 30, 2015 * |
|
| |
|
| Net Asset Value: |
|
|
|
|
|
|
|
|
|
|
|
|
| Beginning of period |
|
|
$10.00 |
|
|
|
$9.96 |
|
|
|
$10.00 |
|
|
|
|
|
|
| Operations: |
|
|
|
|
|
|
|
|
|
|
|
|
| Net investment income 1 |
|
|
0.05 |
|
|
|
0.11 |
|
|
|
0.02 |
|
| Net realized and unrealized gains (losses) |
|
|
1.06 |
|
|
|
0.03 |
|
|
|
(0.06) |
|
|
|
|
|
|
| Total from operations |
|
|
1.11 |
|
|
|
0.14 |
|
|
|
(0.04) |
|
|
|
|
|
|
| Distributions to Shareholders: |
|
|
|
|
|
|
|
|
|
|
|
|
| From net investment income |
|
|
(0.07) |
|
|
|
(0.10) |
|
|
|
— |
|
| From net realized gains |
|
|
— |
|
|
|
— 2 |
|
|
|
— |
|
|
|
|
|
|
| Total distributions |
|
|
(0.07) |
|
|
|
(0.10) |
|
|
|
— |
|
|
|
|
|
|
| Net Asset Value: |
|
|
|
|
|
|
|
|
|
|
|
|
| End of period |
|
|
$11.04 |
|
|
|
$10.00 |
|
|
|
$9.96 |
|
|
|
|
|
|
| Total investment return 3 |
|
|
11.09% |
|
|
|
1.46% |
|
|
|
(0.40%) |
|
|
|
|
|
|
| Net assets at end of period (000’s omitted) |
|
|
$2,983 |
|
|
|
$2,587 |
|
|
|
$2,230 |
|
| Ratios: 4 |
|
|
|
|
|
|
|
|
|
|
|
|
| Expenses |
|
|
1.50% |
|
|
|
1.50% |
|
|
|
1.50% |
|
| Net investment income |
|
|
0.97% |
|
|
|
1.21% |
|
|
|
0.73% |
|
| Portfolio turnover rate (excluding short-term securities) |
|
|
6.56%5 |
|
|
|
26.43% |
|
|
|
2.63%5 |
|
| * |
The Fund commenced investment operations on March 31, 2015. |
| 1 |
The net investment income per share is based on average shares outstanding for the period.
|
| 2 |
Amount represents less than $0.01 per share. |
| 3 |
Total investment return is based on the change in net asset value of a share during the period (not
annualized) and assumes reinvestment of distributions at net asset value. |
| 4 |
Ratios are annualized for periods less than one year. In addition to fees and expenses which the Fund bears
directly, the Fund indirectly bears a pro rata share of the fees and expenses of the acquired funds in which it invests. Such indirect expenses are not included in the above reported expense ratios. |
|
|
|
|
|
|
|
|
|
|
| 68 |
|
|
SIT MUTUAL FUNDS SEMI-ANNUAL REPORT |
|
FINANCIAL HIGHLIGHTS
Per share income and capital changes for a share outstanding throughout the period. See accompanying notes to financial statements.
Sit Small Cap Growth Fund
|
|
|
|
|
|
|
|
|
|
|
|
|
|
|
|
|
|
|
|
|
|
|
|
|
| |
|
Six Months Ended |
|
|
|
|
|
|
|
December 31, 2016 |
|
|
|
|
|
|
|
Years Ended June 30, |
|
|
|
|
|
|
|
|
(Unaudited) |
|
|
|
2016 |
|
|
|
2015 |
|
|
|
2014 |
|
|
|
2013 |
|
|
|
2012 |
|
| |
|
| Net Asset Value: |
|
|
|
|
|
|
|
|
|
|
|
|
|
|
|
|
|
|
|
|
|
|
|
|
| Beginning of period |
|
|
$45.59 |
|
|
|
$60.10 |
|
|
|
$61.38 |
|
|
|
$50.08 |
|
|
|
$43.90 |
|
|
|
$43.86 |
|
|
|
|
|
|
| Operations: |
|
|
|
|
|
|
|
|
|
|
|
|
|
|
|
|
|
|
|
|
|
|
|
|
| Net investment loss 1 |
|
|
(0.11) |
|
|
|
(0.33 |
) |
|
|
(0.48 |
) |
|
|
(0.55 |
) |
|
|
(0.30 |
) |
|
|
(0.34 |
) |
| Net realized and unrealized gains (losses) |
|
|
5.01 |
|
|
|
(8.97 |
) |
|
|
6.26 |
|
|
|
11.85 |
|
|
|
6.48 |
|
|
|
0.38 |
|
|
|
|
|
|
| Total from operations |
|
|
4.90 |
|
|
|
(9.30 |
) |
|
|
5.78 |
|
|
|
11.30 |
|
|
|
6.18 |
|
|
|
0.04 |
|
|
|
|
|
|
| Redemption fees 2 |
|
|
— |
|
|
|
— |
|
|
|
— |
|
|
|
— |
|
|
|
— |
|
|
|
— |
|
|
|
|
|
|
| Distributions to Shareholders: |
|
|
|
|
|
|
|
|
|
|
|
|
|
|
|
|
|
|
|
|
|
|
|
|
| From net realized gains |
|
|
(0.08) |
|
|
|
(5.21 |
) |
|
|
(7.06 |
) |
|
|
— |
|
|
|
— |
|
|
|
— |
|
|
|
|
|
|
| Net Asset Value: |
|
|
|
|
|
|
|
|
|
|
|
|
|
|
|
|
|
|
|
|
|
|
|
|
| End of period |
|
|
$50.41 |
|
|
|
$45.59 |
|
|
|
$60.10 |
|
|
|
$61.38 |
|
|
|
$50.08 |
|
|
|
$43.90 |
|
|
|
|
|
|
| Total investment return 3 |
|
|
10.76% |
|
|
|
(16.00% |
) |
|
|
10.38% |
|
|
|
22.56% |
|
|
|
14.08% |
|
|
|
0.09% |
|
|
|
|
|
|
| Net assets at end of period (000’s omitted) |
|
|
$86,503 |
|
|
|
$81,209 |
|
|
|
$103,816 |
|
|
|
$99,510 |
|
|
|
$84,793 |
|
|
|
$78,202 |
|
|
|
|
|
|
|
|
| Ratios: 4 |
|
|
|
|
|
|
|
|
|
|
|
|
|
|
|
|
|
|
|
|
|
|
|
|
| Expenses |
|
|
1.50% |
|
|
|
1.50% |
|
|
|
1.50% |
|
|
|
1.50% |
|
|
|
1.50% |
|
|
|
1.50% |
|
| Net investment loss |
|
|
(0.46%) |
|
|
|
(0.65% |
) |
|
|
(0.81% |
) |
|
|
(0.94% |
) |
|
|
(0.64% |
) |
|
|
(0.82% |
) |
|
|
|
|
|
|
|
| Portfolio turnover rate (excluding short-term securities) . |
|
|
15.22%5 |
|
|
|
27.37% |
|
|
|
31.07% |
|
|
|
33.38% |
|
|
|
28.36% |
|
|
|
22.32% |
|
| 1 |
The net investment income (loss) per share is based on average shares outstanding for the period.
|
| 2 |
Amount represents less than $0.01 per share. |
| 3 |
Total investment return is based on the change in net asset value of a share during the period (not
annualized) and assumes reinvestment of distributions at net asset value. |
| 4 |
Ratios are annualized for periods less than one year. In addition to fees and expenses which the Fund bears
directly, the Fund indirectly bears a pro rata share of the fees and expenses of the acquired funds in which it invests. Such indirect expenses are not included in the above reported expense ratios. |
FINANCIAL HIGHLIGHTS
Per share income and capital changes for a share outstanding throughout the period. See accompanying notes to financial statements.
Sit International Growth Fund
|
|
|
|
|
|
|
|
|
|
|
|
|
|
|
|
|
|
|
|
|
|
|
|
|
| |
|
Six Months Ended |
|
|
|
|
|
|
|
December 31, 2016 |
|
|
|
|
|
|
|
Years Ended June 30, |
|
|
|
|
|
|
|
|
(Unaudited) |
|
|
|
2016 |
|
|
|
2015 |
|
|
|
2014 |
|
|
|
2013 |
|
|
|
2012 |
|
| |
|
| Net Asset Value: |
|
|
|
|
|
|
|
|
|
|
|
|
|
|
|
|
|
|
|
|
|
|
|
|
| Beginning of period |
|
|
$14.48 |
|
|
|
$16.92 |
|
|
|
$17.44 |
|
|
|
$15.05 |
|
|
|
$13.29 |
|
|
|
$15.16 |
|
|
|
|
|
|
| Operations: |
|
|
|
|
|
|
|
|
|
|
|
|
|
|
|
|
|
|
|
|
|
|
|
|
| Net investment income 1 |
|
|
0.02 |
|
|
|
0.12 |
|
|
|
0.09 |
|
|
|
0.28 |
|
|
|
0.20 |
|
|
|
0.22 |
|
| Net realized and unrealized gains (losses) |
|
|
(0.34) |
|
|
|
(1.47 |
) |
|
|
(0.34 |
) |
|
|
2.28 |
|
|
|
1.80 |
|
|
|
(1.86 |
) |
|
|
|
|
|
| Total from operations |
|
|
(0.32) |
|
|
|
(1.35 |
) |
|
|
(0.25 |
) |
|
|
2.56 |
|
|
|
2.00 |
|
|
|
(1.64 |
) |
|
|
|
|
|
| Redemption fees |
|
|
— |
|
|
|
— |
|
|
|
— |
|
|
|
— |
|
|
|
— |
|
|
|
— |
2 |
|
|
|
|
|
| Distributions to Shareholders: |
|
|
|
|
|
|
|
|
|
|
|
|
|
|
|
|
|
|
|
|
|
|
|
|
| From net investment income |
|
|
(0.07) |
|
|
|
(0.09 |
) |
|
|
(0.27 |
) |
|
|
(0.17 |
) |
|
|
(0.24 |
) |
|
|
(0.23 |
) |
| From net realized gains |
|
|
— |
|
|
|
(1.00 |
) |
|
|
— |
|
|
|
— |
|
|
|
— |
|
|
|
— |
|
|
|
|
|
|
| Total distributions |
|
|
(0.07) |
|
|
|
(1.09 |
) |
|
|
(0.27 |
) |
|
|
(0.17 |
) |
|
|
(0.24 |
) |
|
|
(0.23 |
) |
|
|
|
|
|
| Net Asset Value: |
|
|
|
|
|
|
|
|
|
|
|
|
|
|
|
|
|
|
|
|
|
|
|
|
| End of period |
|
|
$14.09 |
|
|
|
$14.48 |
|
|
|
$16.92 |
|
|
|
$17.44 |
|
|
|
$15.05 |
|
|
|
$13.29 |
|
|
|
|
|
|
| Total investment return 3 |
|
|
(2.21%) |
|
|
|
(8.19% |
) |
|
|
(1.35% |
) |
|
|
17.06% |
|
|
|
15.06% |
|
|
|
(10.69% |
) |
|
|
|
|
|
| Net assets at end of period (000’s omitted) |
|
|
$19,564 |
|
|
|
$20,440 |
|
|
|
$22,485 |
|
|
|
$24,127 |
|
|
|
$20,890 |
|
|
|
$19,296 |
|
|
|
|
|
|
|
|
| Ratios: 4 |
|
|
|
|
|
|
|
|
|
|
|
|
|
|
|
|
|
|
|
|
|
|
|
|
| Expenses |
|
|
1.50% |
|
|
|
1.50% |
|
|
|
1.50% |
|
|
|
1.50% |
|
|
|
1.50% |
|
|
|
1.50% |
|
| Net investment income |
|
|
0.21% |
|
|
|
0.76% |
|
|
|
0.55% |
|
|
|
1.69% |
|
|
|
1.39% |
|
|
|
1.62% |
|
|
|
|
|
|
|
|
| Portfolio turnover rate (excluding short-term securities) |
|
|
21.88%5 |
|
|
|
37.94% |
|
|
|
56.97% |
|
|
|
46.91% |
|
|
|
27.93% |
|
|
|
27.82% |
|
| 1 |
The net investment income per share is based on average shares outstanding for the period.
|
| 2 |
Amount represents less than $0.01 per share. |
| 3 |
Total investment return is based on the change in net asset value of a share during the period (not
annualized) and assumes reinvestment of distributions at net asset value. |
| 4 |
Ratios are annualized for periods less than one year. In addition to fees and expenses which the Fund bears
directly, the Fund indirectly bears a pro rata share of the fees and expenses of the acquired funds in which it invests. Such indirect expenses are not included in the above reported expense ratios. |
|
|
|
|
|
|
|
|
|
|
| 70 |
|
|
SIT MUTUAL FUNDS SEMI-ANNUAL REPORT |
|
FINANCIAL HIGHLIGHTS
Per share income and capital changes for a share outstanding throughout the period. See accompanying notes to financial statements.
Sit Developing Markets Growth Fund
|
|
|
|
|
|
|
|
|
|
|
|
|
|
|
|
|
|
|
|
|
|
|
|
|
| |
|
Six Months Ended |
|
|
|
|
|
|
|
|
|
|
|
|
|
|
|
|
|
|
|
December 31, 2016 |
|
|
|
|
|
|
|
Years Ended June 30, |
|
|
|
|
|
|
|
|
(Unaudited) |
|
|
|
2016 |
|
|
|
2015 |
|
|
|
2014 |
|
|
|
2013 |
|
|
|
2012 |
|
| |
|
| Net Asset Value: |
|
|
|
|
|
|
|
|
|
|
|
|
|
|
|
|
|
|
|
|
|
|
|
|
| Beginning of period |
|
|
$12.26 |
|
|
|
$14.77 |
|
|
|
$17.48 |
|
|
|
$16.40 |
|
|
|
$17.70 |
|
|
|
$23.24 |
|
|
|
|
|
|
| Operations: |
|
|
|
|
|
|
|
|
|
|
|
|
|
|
|
|
|
|
|
|
|
|
|
|
| Net investment income (loss) 1 |
|
|
(0.02) |
|
|
|
0.04 |
|
|
|
0.03 |
|
|
|
(0.01 |
) |
|
|
0.04 |
|
|
|
0.06 |
|
| Net realized and unrealized gains (losses) |
|
|
(0.03) |
|
|
|
(2.18 |
) |
|
|
(1.41 |
) |
|
|
2.07 |
|
|
|
0.14 |
|
|
|
(3.89 |
) |
|
|
|
|
|
| Total from operations |
|
|
(0.05) |
|
|
|
(2.14 |
) |
|
|
(1.38 |
) |
|
|
2.06 |
|
|
|
0.18 |
|
|
|
(3.83 |
) |
|
|
|
|
|
| Redemption fees |
|
|
— |
|
|
|
— |
2 |
|
|
— |
|
|
|
— |
|
|
|
— |
|
|
|
— |
2 |
|
|
|
|
|
| Distributions to Shareholders: |
|
|
|
|
|
|
|
|
|
|
|
|
|
|
|
|
|
|
|
|
|
|
|
|
| From net investment income |
|
|
(0.03) |
|
|
|
(0.02 |
) |
|
|
— |
|
|
|
(0.03 |
) |
|
|
(0.06 |
) |
|
|
(0.06 |
) |
| From net realized gains |
|
|
— |
|
|
|
(0.35 |
) |
|
|
(1.33 |
) |
|
|
(0.95 |
) |
|
|
(1.42 |
) |
|
|
(1.65 |
) |
|
|
|
|
|
| Total distributions |
|
|
(0.03) |
|
|
|
(0.37 |
) |
|
|
(1.33 |
) |
|
|
(0.98 |
) |
|
|
(1.48 |
) |
|
|
(1.71 |
) |
|
|
|
|
|
| Net Asset Value: |
|
|
|
|
|
|
|
|
|
|
|
|
|
|
|
|
|
|
|
|
|
|
|
|
| End of period |
|
|
$12.18 |
|
|
|
$12.26 |
|
|
|
$14.77 |
|
|
|
$17.48 |
|
|
|
$16.40 |
|
|
|
$17.70 |
|
|
|
|
|
|
| Total investment return 3 |
|
|
(0.39%) |
|
|
|
(14.42% |
) |
|
|
(7.64% |
) |
|
|
12.79% |
|
|
|
0.36% |
|
|
|
(16.29% |
) |
|
|
|
|
|
| Net assets at end of period (000’s omitted) |
|
|
$6,924 |
|
|
|
$7,297 |
|
|
|
$9,192 |
|
|
|
$10,808 |
|
|
|
$10,615 |
|
|
|
$11,634 |
|
|
|
|
|
|
|
|
| Ratios: 4 |
|
|
|
|
|
|
|
|
|
|
|
|
|
|
|
|
|
|
|
|
|
|
|
|
| Expenses |
|
|
2.00% |
|
|
|
2.00% |
|
|
|
2.00% |
|
|
|
2.00% |
|
|
|
2.00% |
|
|
|
2.00% |
|
| Net investment income (loss) |
|
|
(0.34%) |
|
|
|
0.31% |
|
|
|
0.16% |
|
|
|
(0.07% |
) |
|
|
0.24% |
|
|
|
0.29% |
|
|
|
|
|
|
|
|
| Portfolio turnover rate (excluding short-term securities) |
|
|
4.02%5 |
|
|
|
28.14% |
|
|
|
21.51% |
|
|
|
21.45% |
|
|
|
15.48% |
|
|
|
22.56% |
|
| 1 |
The net investment income (loss) per share is based on average shares outstanding for the period.
|
| 2 |
Amount represents less than $0.01 per share. |
| 3 |
Total investment return is based on the change in net asset value of a share during the period (not
annualized) and assumes reinvestment of distributions at net asset value. |
| 4 |
Ratios are annualized for periods less than one year. In addition to fees and expenses which the Fund bears
directly, the Fund indirectly bears a pro rata share of the fees and expenses of the acquired funds in which it invests. Such indirect expenses are not included in the above reported expense ratios. |
NOTES TO FINANCIAL STATEMENTS
Six Months Ended December 31, 2016
Sit Mutual Funds are no-load funds, and are registered under the Investment Company Act of 1940 (as amended) as diversified,
open-end management investment companies, or series thereof. The Sit Balanced, Sit Dividend Growth, Sit Global Dividend Growth, Sit ESG Growth, Sit Small Cap Dividend Growth, Sit Small Cap Growth, Sit International Growth, and Sit Developing Markets
Growth are series funds of Sit Mutual Funds, Inc.
This report covers the equity funds of the Sit Mutual Funds (the
Funds). Each fund has 10 billion authorized shares of capital stock with a par value of $0.001. The investment objective for each Fund is as follows:
|
|
|
| Fund |
|
Investment Objective |
|
|
| Balanced |
|
Long-term growth consistent with the preservation of principal and to provide regular income. |
| Dividend Growth |
|
Provide current income that exceeds the dividend yield of the S&P 500® Index and that grows over a period of years. Secondarily, maximize long-term capital
appreciation. |
| Global Dividend Growth |
|
Provide current income that exceeds the dividend yield of the MSCI World Index that grows over a period of years. Secondarily, maximize long-term capital appreciation. |
| Large Cap Growth |
|
Maximize long-term capital appreciation. |
| ESG Growth |
|
Maximize long-term capital appreciation. |
| Mid Cap Growth |
|
Maximize long-term capital appreciation. |
| Small Cap Dividend Growth |
|
Provide current income that exceeds the yield of the Russell 2000® Index and that grows over a period of years. Secondarily, maximize long-term capital appreciation. |
| Small Cap Growth |
|
Maximize long-term capital appreciation. |
| International Growth |
|
Maximize long-term growth. |
| Developing Markets Growth |
|
Maximize long-term capital appreciation. |
The Dividend Growth, Global Dividend Growth, ESG Growth and Small Cap Dividend Growth
Funds offer Class I and Class S shares. Both classes of shares have identical voting, dividend, and liquidation rights. The distribution fee differs among classes, the Class S shares have a 0.25% distribution fee, whereas Class I has no distribution
fee. Income, expenses (other than class specific expenses) and realized and unrealized gains or losses on investments are allocated to each class of shares based upon its relative net assets.
| (2) |
Significant Accounting Policies |
The Funds are investment companies and follow accounting and reporting guidance under Financial Accounting Standards Board
(“FASB”) Accounting Standards Codification (“ASC”) Topic 946, “Financial Services-Investment Companies”. The following is a summary of significant accounting policies consistently followed by the Funds in the
preparation of their financial statements in conformity with U.S. generally accepted accounting principles (“GAAP”).
Investments in Securities
Investments in securities traded on national or international securities exchanges are valued at the last reported sales price
prior to the time when assets are valued. Securities traded on the over-the-counter market are valued at the last reported sales price or if the last sales price is not available at the last reported bid price. The sale and bid prices or prices
deemed best to reflect fair value quoted by dealers who make markets in these securities are obtained from independent pricing services. Consistent with the Funds’ valuation policies and procedures, debt securities maturing in more than 60 days
are priced by an independent pricing service. The pricing service may use models that price securities based on current yields and relative security characteristics, such as coupon rate, maturity date, issuer credit quality, and prepayment speeds as
applicable. When market quotations are not readily available, or when the Adviser becomes aware that a significant event impacting the value of a security or group of securities has occurred after the closing of the exchange on which the security or
securities principally trade, but before the calculation of the daily net asset value, securities are valued at fair value as determined in good faith using procedures established by the Board of Directors. The procedures consider, among
|
|
|
|
|
|
|
|
|
|
| 72 |
|
|
SIT MUTUAL FUNDS SEMI-ANNUAL REPORT |
|
others, the following factors to determine a security’s fair value: the nature and pricing history (if any) of the
security; whether any dealer quotations for the security are available; and possible valuation methodologies that could be used to determine the fair value of the security. Debt securities of sufficient credit quality maturing in less than 60 days
when acquired, or which subsequently are within 60 days of maturity, are valued at amortized cost, which approximates fair value.
Security transactions are accounted for on the date the securities are purchased or sold. Securities gains and losses are
calculated on the identified-cost basis. Dividend income is recorded on the ex-dividend date or upon the receipt of ex-dividend notification in the case of certain foreign securities. Interest, including level-yield amortization of long-term bond
premium and discount, is recorded on the accrual basis.
Fair Value Measurements
The inputs and valuation techniques used to measure fair value of the Funds’ net assets are summarized into three levels
as described in the hierarchy below:
• Level 1 – quoted prices in active markets for identical securities. An
active market for the security is a market in which transactions occur with sufficient frequency and volume to provide pricing information on an ongoing basis. A quoted price in an active market provides the most reliable evidence of fair value.
• Level 2 – debt securities are valued based on evaluated prices received from independent pricing services or
from dealers who make markets in such securities. For corporate bonds, U.S. government and government agency obligations, and municipal securities the pricing services utilize matrix pricing which considers yield or price of bonds of comparable
quality, coupon, maturity, and type as well as dealer supplied prices. For asset-backed securities and mortgage-backed securities, the pricing services utilize matrix pricing which considers prepayment speed assumptions, attributes of the
collateral, yield or price of bonds of comparable quality, coupon, maturity, and type as well as dealer supplied prices. For foreign equities, the pricing services adjust closing prices by applying a systematic process for events occurring after the
close of the foreign exchange by utilizing such inputs as Depositary Receipts, quoted prices for similar securities, exchange rates, and certain indexes. All of these inputs are derived principally from or corroborated by observable market data. An
adjustment to any observable input that is significant to the fair value may render the measurement a Level 3 measurement.
• Level 3 – significant unobservable inputs, including the Adviser’s own assumptions in determining the fair
value of investments.
The inputs or methodology used for valuing securities are not necessarily an indication of the risk
associated with investing in those securities.
A summary of the levels for the Funds’ investments as of
December 31, 2016 is included with the Funds’ schedule of investments.
Foreign Currency Translations and Forward Foreign
Currency Contracts
The fair value of securities and other assets and liabilities denominated in foreign currencies for
Global Dividend Growth, International Growth and Developing Markets Growth Funds are translated daily into U.S. dollars at the closing rate of exchange (approximately 4:00 p.m. Eastern Time). Purchases and sales of securities, income and expenses
are translated at the exchange rate on the transaction date. Dividend and interest income includes currency exchange gains (losses) realized between the accrual and payment dates on such income. Exchange gains (losses) may also be realized between
the trade and settlement dates on security and forward contract transactions. For securities denominated in foreign currencies, the effect of changes in foreign exchange rates on realized and unrealized gains or losses is reflected as a component of
such gains or losses.
The Global Dividend Growth, International Growth and Developing Markets Growth Funds may enter into
forward foreign currency exchange contracts generally for operational purposes, but the Adviser may occasionally utilize contracts to protect against adverse exchange rate fluctuation. Any gains (losses) generated by these contracts are disclosed
separately on the statement of operations. The net U.S. dollar value of foreign currency underlying all contractual commitments held by the Funds and the resulting unrealized appreciation or depreciation is determined using foreign currency exchange
rates from an independent pricing service. The Funds are subject to the credit risk that the other party will not complete the obligations of the contract.
NOTES TO FINANCIAL STATEMENTS
Six Months Ended December 31, 2016 (Continued)
Federal Taxes
The Funds’ policy is to comply with the requirements of the Internal Revenue Code applicable to regulated investment
companies and to distribute all of their taxable income to shareholders. Therefore, no income tax provision is required. Also, in order to avoid the payment of any federal excise taxes, the Funds will distribute substantially all of their net
investment income and net realized gains on a calendar year basis.
Management has analyzed the Funds’ tax positions
taken in federal tax returns for all open tax years and has concluded that as of December 31, 2016, no provision for income tax would be required in the Funds’ financial statements. The Funds’ federal and state income and federal
excise returns for the 2013, 2014 and 2015 tax years for which the applicable statutes of limitations have not expired remain subject to examination by the Internal Revenue Service and state departments of revenue.
At December 31, 2016, the gross unrealized appreciation (depreciation) on investments and cost of securities on a tax
basis for federal income tax purposes were as follows:
|
|
|
|
|
|
|
|
|
|
|
|
|
|
|
|
|
|
|
|
|
| |
|
|
|
|
|
Net Unrealized |
|
Cost of |
| |
|
Unrealized |
|
Unrealized |
|
Appreciation |
|
Securities on a |
| |
|
Appreciation |
|
Depreciation |
|
(Depreciation) |
|
Tax Basis |
| Balanced |
|
|
|
$4,252,627 |
|
|
|
|
($385,405 |
) |
|
|
|
$3,867,222 |
|
|
|
|
$20,701,355 |
|
| Dividend Growth |
|
|
|
134,144,726 |
|
|
|
|
(5,617,586 |
) |
|
|
|
128,527,140 |
|
|
|
|
863,912,750 |
|
| Global Dividend Growth |
|
|
|
2,910,881 |
|
|
|
|
(702,684 |
) |
|
|
|
2,208,197 |
|
|
|
|
23,595,989 |
|
| Large Cap Growth |
|
|
|
40,577,529 |
|
|
|
|
(986,682 |
) |
|
|
|
39,590,847 |
|
|
|
|
72,497,273 |
|
| ESG Growth |
|
|
|
267,307 |
|
|
|
|
(165,643 |
) |
|
|
|
101,664 |
|
|
|
|
4,055,940 |
|
| Mid Cap Growth |
|
|
|
53,246,814 |
|
|
|
|
(1,738,662 |
) |
|
|
|
51,508,152 |
|
|
|
|
90,542,516 |
|
| Small Cap Dividend Growth |
|
|
|
1,730,683 |
|
|
|
|
(253,357 |
) |
|
|
|
1,477,326 |
|
|
|
|
11,952,547 |
|
| Small Cap Growth |
|
|
|
27,329,462 |
|
|
|
|
(896,616 |
) |
|
|
|
26,432,846 |
|
|
|
|
60,207,775 |
|
| International Growth |
|
|
|
1,604,826 |
|
|
|
|
(906,021 |
) |
|
|
|
698,805 |
|
|
|
|
18,799,423 |
|
| Developing Markets Growth |
|
|
|
1,141,757 |
|
|
|
|
(727,510 |
) |
|
|
|
414,247 |
|
|
|
|
6,499,040 |
|
Net investment income and net realized gains differ for financial statement and tax purposes
because of corporate actions on shares held and/or losses deferred due to “wash sale” transactions. A “wash sale” occurs when a Fund sells a security that it has acquired within a period beginning thirty days before and ending
thirty days after the date of sale (a sixty one day period). The character of distributions made during the year from net investment income or net realized gains may also differ from its ultimate characterization for tax purposes. Also, due to the
timing of dividend distributions, the fiscal year in which amounts are distributed may differ from the year that the income or realized gains (losses) were recorded by the Funds. The tax character of distributions paid during the fiscal years ended
June 30, 2016 and 2015 were as follows:
Year Ended June 30, 2016:
|
|
|
|
|
|
|
|
|
|
|
|
|
|
|
|
| |
|
|
|
Long Term |
|
|
| |
|
Ordinary Income |
|
Capital Gain |
|
Total |
| Balanced |
|
|
|
$508,889 |
|
|
|
|
$1,028,080 |
|
|
|
|
$1,536,969 |
|
| Dividend Growth (Class I) |
|
|
|
23,739,125 |
|
|
|
|
101,891,044 |
|
|
|
|
125,630,169 |
|
| Dividend Growth (Class S) |
|
|
|
1,582,606 |
|
|
|
|
7,415,541 |
|
|
|
|
8,998,147 |
|
| Global Dividend Growth (Class I) |
|
|
|
530,149 |
|
|
|
|
1,512,875 |
|
|
|
|
2,043,024 |
|
| Global Dividend Growth (Class S) |
|
|
|
62,954 |
|
|
|
|
201,098 |
|
|
|
|
264,052 |
|
| Large Cap Growth |
|
|
|
4,558,215 |
|
|
|
|
27,930,763 |
|
|
|
|
32,488,978 |
|
| Mid Cap Growth |
|
|
|
— |
|
|
|
|
23,213,056 |
|
|
|
|
23,213,056 |
|
| Small Cap Dividend Growth (Class I) |
|
|
|
59,291 |
|
|
|
|
446 |
|
|
|
|
59,738 |
|
| Small Cap Dividend Growth (Class S) |
|
|
|
24,217 |
|
|
|
|
216 |
|
|
|
|
24,432 |
|
| Small Cap Growth |
|
|
|
— |
|
|
|
|
8,910,218 |
|
|
|
|
8,910,218 |
|
| International Growth |
|
|
|
205,203 |
|
|
|
|
1,246,085 |
|
|
|
|
1,451,288 |
|
| Developing Markets Growth |
|
|
|
12,000 |
|
|
|
|
211,867 |
|
|
|
|
223,867 |
|
|
|
|
|
|
|
|
|
|
|
| 74 |
|
|
SIT MUTUAL FUNDS SEMI-ANNUAL REPORT |
|
Year Ended June 30, 2015:
|
|
|
|
|
|
|
|
|
|
|
|
|
|
|
|
| |
|
|
|
Long Term |
|
|
| |
|
Ordinary Income |
|
Capital Gain |
|
Total |
| Balanced |
|
|
|
$226,644 |
|
|
|
|
$452,434 |
|
|
|
|
$679,078 |
|
| Dividend Growth (Class I) |
|
|
|
19,006,449 |
|
|
|
|
114,151,521 |
|
|
|
|
133,157,970 |
|
| Dividend Growth (Class S) |
|
|
|
1,514,587 |
|
|
|
|
10,059,686 |
|
|
|
|
11,574,273 |
|
| Global Dividend Growth (Class I) |
|
|
|
315,934 |
|
|
|
|
1,468,820 |
|
|
|
|
1,784,754 |
|
| Global Dividend Growth (Class S) |
|
|
|
50,637 |
|
|
|
|
240,326 |
|
|
|
|
290,963 |
|
| Large Cap Growth |
|
|
|
1,318,355 |
|
|
|
|
32,548,866 |
|
|
|
|
33,867,221 |
|
| Mid Cap Growth |
|
|
|
— |
|
|
|
|
22,297,244 |
|
|
|
|
22,297,244 |
|
| Small Cap Dividend Growth (Class I) |
|
|
|
— |
|
|
|
|
— |
|
|
|
|
— |
|
| Small Cap Dividend Growth (Class S) |
|
|
|
— |
|
|
|
|
— |
|
|
|
|
— |
|
| Small Cap Growth |
|
|
|
— |
|
|
|
|
11,167,852 |
|
|
|
|
11,167,852 |
|
| International Growth |
|
|
|
354,576 |
|
|
|
|
— |
|
|
|
|
354,576 |
|
| Developing Markets Growth |
|
|
|
— |
|
|
|
|
795,509 |
|
|
|
|
795,509 |
|
As of June 30, 2016, the components of distributable earnings on a tax basis were as
follows:
|
|
|
|
|
|
|
|
|
|
|
|
|
|
|
|
| |
|
Undistributed |
|
|
|
Unrealized |
| |
|
Ordinary |
|
Accumulated |
|
Appreciation |
| |
|
Income |
|
Gain |
|
(Depreciation) |
| Balanced |
|
|
|
$60,565 |
|
|
|
|
— |
|
|
|
|
$3,273,670 |
|
| Dividend Growth |
|
|
|
3,187,293 |
|
|
|
$ |
48,194,156 |
|
|
|
|
99,519,924 |
|
| Global Dividend Growth |
|
|
|
113,414 |
|
|
|
|
— |
|
|
|
|
1,250,173 |
|
| Large Cap Growth |
|
|
|
217,862 |
|
|
|
|
5,546,908 |
|
|
|
|
37,011,728 |
|
| Mid Cap Growth |
|
|
|
— |
|
|
|
|
1,410,683 |
|
|
|
|
44,790,166 |
|
| Small Cap Dividend Growth |
|
|
|
24,963 |
|
|
|
|
— |
|
|
|
|
191,889 |
|
| Small Cap Growth |
|
|
|
— |
|
|
|
|
144,631 |
|
|
|
|
17,861,490 |
|
| International Growth |
|
|
|
76,544 |
|
|
|
|
— |
|
|
|
|
484,863 |
|
| Developing Markets Growth |
|
|
|
18,811 |
|
|
|
|
— |
|
|
|
|
469,665 |
|
Net capital loss carryovers and late year losses, if any, as of June 30, 2016, are
available to offset future realized capital gains and thereby reduce future capital gains distributions. Under the Regulated Investment Company Modernization Act of 2010 (“Act”), the Funds’ are permitted to carry forward capital
losses incurred in taxable years beginning after December 22, 2010 for an unlimited period. Any losses incurred during those future taxable years will be required to be utilized prior to any losses incurred in pre-enactment taxable years.
Additionally, post-enactment capital losses that are carried forward will retain their character as either short-term or long-term capital losses, and will not be considered exclusively short-term as under previous law. The Funds’ first fiscal
year end subject to the Modernization Act was June 30, 2012. The net capital loss carryovers post-enactment and the late year losses deferred as of June 30,2016, were as follows:
|
|
|
|
|
|
|
|
|
|
|
|
|
|
|
|
|
|
|
|
|
| |
|
Post-Enactment |
|
|
|
|
| |
|
Unlimited Period of Net |
|
Late Year |
|
Accumulated |
| |
|
Capital Loss Carryover |
|
Losses |
|
Capital and |
| |
|
Short-Term |
|
Long-Term |
|
Deferred |
|
Other Losses |
| Balanced |
|
|
|
— |
|
|
|
|
— |
|
|
|
$ |
79,701 |
|
|
|
$ |
79,701 |
|
| Global Dividend Growth |
|
|
$ |
392,798 |
|
|
|
$ |
224,357 |
|
|
|
|
— |
|
|
|
|
617,155 |
|
| Small Cap Dividend Growth |
|
|
|
169,885 |
|
|
|
|
— |
|
|
|
|
— |
|
|
|
|
169,885 |
|
| International Growth |
|
|
|
— |
|
|
|
|
— |
|
|
|
|
348,030 |
|
|
|
|
348,030 |
|
| Developing Markets Growth |
|
|
|
— |
|
|
|
|
— |
|
|
|
|
164,567 |
|
|
|
|
164,567 |
|
NOTES TO FINANCIAL STATEMENTS
Six Months Ended December 31, 2016 (Continued)
Distributions
Distributions to shareholders are recorded as of the close of business on the record date. Such distributions are payable in
cash or reinvested in additional shares of the Funds’ capital stock. Distributions from net investment income, if any, are declared and paid quarterly for the Balanced, Dividend Growth, Global Dividend Growth and Small Cap Dividend Growth Funds
and declared and paid annually for Developing Markets Growth, Small Cap Growth, International Growth, Mid Cap Growth, Large Cap Growth and ESG Growth Funds. Distributions from net realized gains, if any, will be made annually for each of the Funds.
Concentration of Investments
The Developing Markets Growth Fund may concentrate investments in countries with limited or developing capital markets which
may involve greater risks than investments in more developed markets and the prices of such investments may be volatile. The consequences of political, social or economic changes in these markets may have disruptive effects on the market prices of
the Fund’s investments and the income it generates, as well as the Fund’s ability to repatriate such amounts.
Use of
Estimates
The preparation of financial statements in conformity with U.S. generally accepted accounting principles
requires management to make certain estimates and assumptions that affect the reported amounts of assets and liabilities and disclosure of contingent assets and liabilities at the date of the financial statements and the reported results for the
respective periods. Actual results could differ from those estimates.
Guarantees and Indemnifications
Under each Fund’s organizational documents, its officers and directors are indemnified against certain liability arising
out of the performance of their duties to each Fund. In addition, certain of each Fund’s contracts with its service providers contain general indemnification clauses. Each Fund’s maximum exposure under these arrangements is unknown since
the amount of any future claims that may be made against each Fund cannot be determined and each Fund has no historical basis for predicting the likelihood of any such claims.
| (3) |
Investment Security Transactions |
The cost of purchases and proceeds from sales and maturities of investment securities, other than short-term securities, for
the six months ended December 31, 2016, were as follows:
|
|
|
|
|
|
|
|
|
|
|
|
|
|
|
|
|
| |
|
Purchases |
|
|
Proceeds |
|
|
|
|
|
|
| |
|
U.S. Government |
|
|
Other |
|
|
U.S. Government |
|
|
Other |
|
|
|
|
|
|
| Balanced |
|
|
$860,352 |
|
|
|
$4,329,770 |
|
|
|
$1,147,189 |
|
|
|
$3,237,737 |
|
| Dividend Growth |
|
|
— |
|
|
|
321,939,575 |
|
|
|
— |
|
|
|
381,418,255 |
|
| Global Dividend Growth |
|
|
— |
|
|
|
3,917,900 |
|
|
|
— |
|
|
|
3,621,155 |
|
| Large Cap Growth |
|
|
— |
|
|
|
8,921,313 |
|
|
|
— |
|
|
|
16,556,559 |
|
| ESG Growth |
|
|
— |
|
|
|
4,373,187 |
|
|
|
— |
|
|
|
371,492 |
|
| Mid Cap Growth |
|
|
— |
|
|
|
16,970,496 |
|
|
|
— |
|
|
|
18,832,321 |
|
| Small Cap Dividend Growth |
|
|
— |
|
|
|
4,369,044 |
|
|
|
— |
|
|
|
655,278 |
|
| Small Cap Growth |
|
|
— |
|
|
|
12,185,608 |
|
|
|
— |
|
|
|
15,105,027 |
|
| International Growth |
|
|
— |
|
|
|
4,374,008 |
|
|
|
— |
|
|
|
4,551,558 |
|
| Developing Markets Growth |
|
|
— |
|
|
|
510,835 |
|
|
|
— |
|
|
|
821,570 |
|
|
|
|
|
|
|
|
|
|
|
| 76 |
|
|
SIT MUTUAL FUNDS SEMI-ANNUAL REPORT |
|
| (4) |
Affiliated Fees and Transactions |
Investment Adviser
The Funds each have entered into an investment management agreement with Sit Investment Associates, Inc. (SIA), under which SIA
manages the Funds’ assets and provides research, statistical and advisory services, and pays related office rental, executive expenses and executive salaries. The current fee for investment management and advisory services is based on the
average daily net assets of the Funds at the annual rate of:
|
|
|
|
|
|
|
| Balanced |
|
|
1.00 |
% |
|
|
| Dividend Growth Class I and Class S |
|
|
1.00 |
% |
|
|
| Global Dividend Growth Class I and Class S |
|
|
1.25 |
% |
|
|
| Large Cap Growth |
|
|
1.00 |
% |
|
|
| ESG Growth Class I and Class S |
|
|
1.25 |
% |
|
|
| Mid Cap Growth |
|
|
1.25 |
% |
|
|
| Small Cap Dividend Growth Class I and Class S |
|
|
1.25 |
% |
|
|
| Small Cap Growth |
|
|
1.50 |
% |
|
|
| International Growth |
|
|
1.50 |
% |
|
|
| Developing Markets Growth |
|
|
2.00 |
% |
|
|
SIA is obligated to pay all of the Funds’ expenses (excluding extraordinary
expenses, stock transfer taxes, interest, brokerage commissions, 12b-1 fees and other transaction charges relating to investing activities).
In addition to the annual management fees, the Class S shares of Dividend Growth, Global Dividend Growth, ESG Growth and Small
Cap Dividend Growth Funds also have a 0.25% annual distribution (12b-1) fee, which is used to pay for distribution fees related to the sale and distribution of its shares.
Transactions with affiliates
The investment adviser, affiliates of the investment adviser, directors and officers of the Funds as a whole owned the
following shares as of December 31, 2016:
|
|
|
|
|
|
|
|
|
| |
|
|
|
|
% Shares |
|
|
| |
|
Shares |
|
|
Outstanding |
|
|
| Balanced |
|
|
254,333 |
|
|
21.6 |
|
|
| Dividend Growth |
|
|
1,214,266 |
|
|
1.9 |
|
|
| Global Dividend Growth |
|
|
719,226 |
|
|
37.6 |
|
|
| Large Cap Growth |
|
|
616,230 |
|
|
19.5 |
|
|
| ESG Growth |
|
|
407,327 |
|
|
99.7 |
|
|
| Mid Cap Growth |
|
|
3,852,355 |
|
|
43.6 |
|
|
| Small Cap Dividend Growth |
|
|
858,788 |
|
|
70.1 |
|
|
| Small Cap Growth |
|
|
911,770 |
|
|
53.1 |
|
|
| International Growth |
|
|
805,553 |
|
|
58.0 |
|
|
| Developing Markets Growth |
|
|
258,018 |
|
|
45.4 |
|
|
NOTES TO FINANCIAL STATEMENTS
Six Months Ended December 31, 2016 (Continued)
| (5) |
Capital Share Activity |
Short-Term Trading (Redemption) Fees
The Funds (except Balanced) charge a redemption fee equal to 2.00% of the proceeds on shares held for less than 30 calendar
days. The fee is retained by the Fund for the benefit of its long-term shareholders and accounted for as an addition to paid in capital. For the six months ended December 31, 2016, the Funds received the following redemption fees:
|
|
|
|
|
|
|
|
|
|
|
|
|
| |
|
Class I |
|
Class S
|
|
|
| Dividend Growth |
|
|
|
$947 |
|
|
|
|
— |
|
|
|
| Large Cap Growth |
|
|
|
158 |
|
|
|
|
— |
|
|
|
| Mid Cap Growth |
|
|
|
2 |
|
|
|
|
— |
|
|
|
| Small Cap Growth |
|
|
|
1,179 |
|
|
|
|
— |
|
|
|
Management has evaluated the impact of all subsequent events on the Funds through the date the financial statements were
issued, and has determined that there were no subsequent events that would require disclosure in or adjustments to the financial statements.
|
|
|
|
|
|
|
|
|
|
| 78 |
|
|
SIT MUTUAL FUNDS SEMI-ANNUAL REPORT |
|
EXPENSE EXAMPLE (Unaudited)
As a shareholder of the Funds, you incur two types of costs: (1) transaction costs,
including redemption fees and (2) ongoing costs, including management fees; and other Fund expenses. This Example is intended to help you understand your ongoing costs (in dollars) of investing in the Funds and to compare these costs with the
ongoing costs of investing in other mutual funds.
The Example is based on an investment of $1,000 invested at the beginning of the period
and held for the entire period July 1, 2016 to December 31, 2016.
Actual Expenses
The first line of the following table provides information about actual account values and actual expenses. You may use the information in this
line, together with the amount you invested, to estimate the expenses that you paid over the period. Simply divide your account value by $1,000 (for example, an $8,600 account value divided by $1,000 = 8.6), then multiply the result by the number in
the first line under the heading entitled “Expenses Paid During Period” to estimate the expenses you paid on your account during this period.
Hypothetical Example for Comparison Purposes
The second line of the table provides information about hypothetical account values and hypothetical expenses based on the Fund’s actual
expense ratio and an assumed rate of return of 5% per year before expenses, which is not the Fund’s actual return. The hypothetical account values and expenses may not be used to estimate the actual ending account balance or expenses you
paid for the period. You may use this information to compare the ongoing costs of investing in the Fund and other funds. To do so, compare this 5% hypothetical example with the 5% hypothetical examples that appear in the shareholder reports of the
other funds.
Please note that the expenses shown in the table are meant to highlight your ongoing costs only and do not reflect any
transactional costs, such as redemption fees. Therefore, the second line of the table is useful in comparing ongoing costs only, and will not help you determine the relative total costs of owning different funds. In addition, if these transactional
costs (redemption fees) were included, your costs would have been higher.
|
|
|
|
|
|
|
|
|
|
|
|
|
| |
|
|
|
|
|
|
|
Expenses |
|
| |
|
Beginning |
|
|
Ending |
|
|
Paid During |
|
| |
|
Account |
|
|
Account |
|
|
Period* |
|
| |
|
Value |
|
|
Value |
|
|
(7/1/16- |
|
| Fund |
|
(7/1/16) |
|
|
(12/31/16) |
|
|
12/31/16) |
|
|
| Balanced Fund |
|
| Actual |
|
|
$1,000 |
|
|
|
$1,033.70 |
|
|
|
$5.10 |
|
| Hypothetical |
|
|
$1,000 |
|
|
|
$1,020.05 |
|
|
|
$5.06 |
|
| |
|
|
|
|
|
|
|
|
|
|
|
|
|
| Dividend Growth Fund |
|
| Actual |
|
|
|
|
|
|
|
|
|
|
|
|
| Class I |
|
|
$1,000 |
|
|
|
$1,062.70 |
|
|
|
$5.17 |
|
| Class S |
|
|
$1,000 |
|
|
|
$1,061.60 |
|
|
|
$6.46 |
|
| Hypothetical |
|
|
|
|
|
|
|
|
|
|
|
|
| Class I |
|
|
$1,000 |
|
|
|
$1,020.05 |
|
|
|
$5.06 |
|
| Class S |
|
|
$1,000 |
|
|
|
$1,018.80 |
|
|
|
$6.33 |
|
| |
|
|
|
|
|
|
|
|
|
|
|
|
|
| Global Dividend Growth Fund |
|
| Actual |
|
|
|
|
|
|
|
|
|
|
|
|
| Class I |
|
|
$1,000 |
|
|
|
$1,035.70 |
|
|
|
$6.38 |
|
| Class S |
|
|
$1,000 |
|
|
|
$1,033.80 |
|
|
|
$7.65 |
|
| Hypothetical |
|
|
|
|
|
|
|
|
|
|
|
|
| Class I |
|
|
$1,000 |
|
|
|
$1,018.80 |
|
|
|
$6.33 |
|
| Class S |
|
|
$1,000 |
|
|
|
$1,017.55 |
|
|
|
$7.59 |
|
| |
|
|
|
|
|
|
|
|
|
|
|
|
|
| Large Cap Growth Fund |
|
| Actual |
|
|
$1,000 |
|
|
|
$1,060.40 |
|
|
|
$5.17 |
|
| Hypothetical |
|
|
$1,000 |
|
|
|
$1,020.05 |
|
|
|
$5.06 |
|
| |
|
|
|
|
|
|
|
|
|
|
|
|
|
| ESG Growth Fund |
|
| Actual |
|
|
|
|
|
|
|
|
|
|
|
|
| Class I |
|
|
$1,000 |
|
|
|
$1,020.10 |
|
|
|
$6.33 |
|
| Class S |
|
|
$1,000 |
|
|
|
$1,018.80 |
|
|
|
$7.59 |
|
| Hypothetical |
|
|
|
|
|
|
|
|
|
|
|
|
| Class I |
|
|
$1,000 |
|
|
|
$1,018.80 |
|
|
|
$6.33 |
|
| Class S |
|
|
$1,000 |
|
|
|
$1,017.55 |
|
|
|
$7.59 |
|
| |
|
|
|
|
|
|
|
|
|
|
|
|
|
| Mid Cap Growth Fund |
|
| Actual |
|
|
$1,000 |
|
|
|
$1,057.20 |
|
|
|
$6.45 |
|
| Hypothetical |
|
|
$1,000 |
|
|
|
$1,018.80 |
|
|
|
$6.33 |
|
| |
|
|
|
|
|
|
|
|
|
|
|
|
|
| Small Cap Dividend Growth Fund |
|
| Actual |
|
|
|
|
|
|
|
|
|
|
|
|
| Class I |
|
|
$1,000 |
|
|
|
$1,112.90 |
|
|
|
$6.62 |
|
| Class S |
|
|
$1,000 |
|
|
|
$1,110.90 |
|
|
|
$7.94 |
|
| Hypothetical |
|
|
|
|
|
|
|
|
|
|
|
|
| Class I |
|
|
$1,000 |
|
|
|
$1,018.80 |
|
|
|
$6.33 |
|
| Class S |
|
|
$1,000 |
|
|
|
$1,017.55 |
|
|
|
$7.59 |
|
EXPENSE EXAMPLE (Unaudited) (Continued)
|
|
|
|
|
|
|
|
|
|
|
|
|
| |
|
|
|
|
|
|
|
Expenses |
|
| |
|
Beginning |
|
|
Ending |
|
|
Paid During |
|
| |
|
Account |
|
|
Account |
|
|
Period* |
|
| |
|
Value |
|
|
Value |
|
|
(7/1/16- |
|
| Fund |
|
(7/1/16) |
|
|
(12/31/16) |
|
|
12/31/16) |
|
|
| Small Cap Growth Fund |
|
| Actual |
|
|
$1,000 |
|
|
|
$1,107.60 |
|
|
|
$7.93 |
|
| Hypothetical |
|
|
$1,000 |
|
|
|
$1,017.55 |
|
|
|
$7.59 |
|
| |
|
|
|
|
|
|
|
|
|
|
|
|
|
| International Growth Fund |
|
| Actual |
|
|
$1,000 |
|
|
|
$997.90 |
|
|
|
$7.44 |
|
| Hypothetical |
|
|
$1,000 |
|
|
|
$1,017.55 |
|
|
|
$7.59 |
|
| |
|
|
|
|
|
|
|
|
|
|
|
|
|
| Developing Markets Growth Fund |
|
| Actual |
|
|
$1,000 |
|
|
|
$996.10 |
|
|
|
$10.01 |
|
| Hypothetical |
|
|
$1,000 |
|
|
|
$1,015.04 |
|
|
|
$10.10 |
|
* Expenses are equal to the Fund’s annualized expense ratio of 1.00%, for the Balanced, Dividend Growth, Class I and
Large Cap Growth Funds; 1.25% for Dividend Growth, Class S, Global Dividend Growth, Class I, Small Cap Dividend Growth, Class I, Mid Cap Growth, and ESG Growth, Class I Funds; 1.50% for Global Dividend Growth, Class S, Small Cap Dividend Growth,
Class S, Small Cap Growth, ESG Growth, Class S and International Growth Funds; and 2.00% for Developing Markets Growth Fund, multiplied by the average account value over the period, multiplied by 183/365 (to reflect the one-half year period.)
|
|
|
|
|
|
|
|
|
|
| 80 |
|
|
SIT MUTUAL FUNDS SEMI-ANNUAL REPORT |
|
ADDITIONAL INFORMATION (Unaudited)
PROXY VOTING
Each Fund follows certain policies and procedures for voting proxies for securities held in each portfolio. A description of the
Funds’ proxy voting policies and procedures is available without charge upon request by calling the Funds at 1-800-332-5580.
Information regarding how each Fund voted proxies relating to its portfolio securities during the most recent twelve-month period ended
June 30 is available without charge upon request by calling the Funds at 1-800-332-5580, and is available on the U.S. Securities and Exchange Commission’s website at www.sec.gov.
AVAILABILITY OF QUARTERLY PORTFOLIO SCHEDULES
The Funds’ file their complete schedules of portfolio holdings with the U.S. Securities and Exchange Commission (SEC) for the first and
third quarters of each fiscal year on Form N-Q. The Funds’ Form N-Qs are available without charge upon request by calling the Funds at 1-800-332-5580 and are available on the SEC’s website at www.sec.gov. In addition, the Funds’ Form
N-Qs may be reviewed and copied at the SEC’s Public Reference Room in Washington, DC. Information on the operation of the Public Reference Room may be obtained by calling 1-202-551-8090.
RE-APPROVAL OF INVESTMENT MANAGEMENT AGREEMENTS
At their joint meeting held on October 24, 2016 the Boards of Directors of the Sit Mutual Funds unanimously approved the continuation for
another one year period the investment management agreements entered into by and between Sit Investment Associates, Inc. (“SIA”) and Sit Mid Cap Growth Fund, Inc. dated November 1, 1996; Sit Large Cap Growth Fund, Inc. dated
November 1, 1996; and Sit Mutual Funds Inc., dated November 1, 1992; (the “Agreements”).
The Boards approved the
Agreements after a lengthy discussion and consideration of various factors relating to the Boards’ selection of SIA as the investment adviser, and the Boards’ approval of the fees to be paid under the Agreements.
Investment Adviser Criteria. The Directors began their analysis by discussing their criteria for determining the quality of an
investment adviser. The Directors’ noted that their analysis is similar to that used by institutional investors in evaluating and selecting investment advisers. The Directors discussed several factors used to determine the overall quality of an
investment adviser and the nature, extent and quality of the services performed by SIA, including the following:
Investment Philosophy
and Process. The Directors considered SIA’s philosophy of managing assets. With respect to equity securities, SIA identifies growth-oriented securities issued by companies with the potential for earnings growth at a faster rate than the
general economy and market index. SIA believes that earnings growth is the primary determinant of superior long-term returns for equity securities, and invests in companies it believes exhibit above market and consistent growth as well as
conservative and cyclical growth companies. SIA’s actively managed portfolios not only concentrate on the best growth opportunities but do so at reasonable valuation levels. The Directors determined that the Stock Funds’ investment
objectives are consistent with SIA’s investment philosophy and growth style. The Directors reviewed the Stock Funds’ portfolio characteristics, and noted that SIA has consistently managed the Stock Funds in a growth style and the Directors
found no indication of style drift away from growth stocks over market cycles. The Directors noted that in years during which growth stocks have generally under-performed relative to value stocks, many funds with a stated growth style objective
actually strayed from the growth style and invested a portion of their portfolios in value stocks. This has been especially true with funds investing in international equity securities. In these instances, the Stock Funds may at times not rank
favorably in comparisons with other funds investing in value stocks because the Stock Funds were disciplined in maintaining their growth style.
The Directors discussed SIA’s consistent and well-defined investment process. With respect to equity securities, SIA utilizes a team
based top-down and bottom-up investment decision making process.
Investment Professionals. The Directors discussed the experience,
knowledge and organizational stability of SIA and its investment professionals. The Directors noted that SIA’s senior professionals are actively involved in the investment process and have significant investment industry experience.
ADDITIONAL INFORMATION (Unaudited) (Continued)
The Directors discussed the depth of SIA’s investment staff. The Directors noted that SIA has over 30 investment professionals. Given the
investment products offered by SIA and the assets under management, the Directors determined that SIA’s investment staff is well positioned to meet the current needs of its clients, including the Funds, and to accommodate growth in the number
of clients and assets under management for the near future. The Directors concluded that the depth of the investment staff, and in particular senior management and investment analysts, is actually greater than the Funds currently require at their
present asset size. The Directors noted that SIA has the resources of a $13.7 billion investment firm working for the benefit of the Fund shareholders.
Investment Performance. The Directors reviewed and discussed the Funds’ investment performance on an absolute and comparable basis
for various periods as discussed below. The Directors noted that the investment performance of the Funds has generally been competitive with indices and other funds with similar investment styles as the Funds, such as equity growth funds.
Corporate Culture. The Directors discussed SIA’s corporate values to operate under the highest ethical and professional standards.
SIA’s culture is set and practiced by senior management who insist that all professionals exhibit honesty and integrity. The Board noted that the firm’s values are evident in all of the services provided to the Funds.
Review of Specific Factors. The Directors continued their analysis by reviewing specific information on SIA and the Funds and specific
terms of the Agreements, including the following.
Investment Performance. The Directors reviewed investment performance of each
Fund for 1 month, 3 months, 6 months, year-to-date, 1 year, 5 years (as applicable), 10 years (as applicable) and since inception, both on an absolute basis and on a comparative basis to indices and mutual funds within the same investment
categories. As noted above, the Directors concluded that the investment performance of the Funds has been competitive in relation to their stated objectives and strategies on a comparable basis with funds with similar objectives and strategies.
Fees and Expenses. The Directors noted that the Funds pay SIA a monthly fee and SIA is responsible for all of the Funds’ expenses,
except interest, brokerage commissions and transaction charges, certain extraordinary expenses, and fees paid under a distribution plan adopted pursuant to Rule 12b-1 under the Investment Company Act of 1940 for Class S shares of Sit Dividend Growth
Fund, Sit Global Dividend Growth Fund, Sit Small Cap Dividend Growth Fund, and Sit ESG Growth Fund. The Directors reviewed fees paid in prior years (both before and after the voluntary waiver of fees by SIA with respect to Mid Cap Growth Fund prior
to January 1, 2011 and International Growth Fund prior to November 1, 2010) and the current fees to be paid under the Agreements.
The Directors compared each Fund’s expense ratio to the average and median expense ratios of no-load mutual funds within the same
Morningstar, Inc. investment category, the average expense ratios for load funds within the Morningstar category, and the average expense ratios for all funds within the Morningstar category. Certain of the Fund’s expense ratios were higher
than the averages, and certain of the Fund’s expense ratios were lower than the averages. The Directors noted that the Morningstar no-load categories include funds of various asset sizes, some of which are significantly larger in assets than
the Funds. The Directors found each Fund’s total expense ratio to be within an acceptable range compared to the total expense ratios of other no-load funds within the Fund’s Morningstar category. The Directors concluded that the fees paid
by the Funds are reasonable and appropriate.
The Directors reviewed the extent to which the fees to be paid under the Agreements by each
Fund may be affected by an increase in the Fund’s assets, which included reviewing each Fund’s current and historical assets and the likelihood and magnitude of future increases in the Fund’s assets. The Directors agreed that it is
appropriate that the Funds benefit from improved economies of scale as the Funds’ assets increase. However, the Directors concluded that given the amount of the Funds’ current assets and the likelihood and magnitude of future increases in
the Funds’ assets, negotiating a graduated fee structure for each Fund is unnecessary at this time since the fees to be paid under the current Agreements are reasonable and appropriate.
The Directors reviewed the expenses paid by SIA relating to the operations of the Funds, and SIA’s income with respect to the management
of the Funds for the past two calendar years. The Directors concluded that the expenses paid were appropriate.
The Directors reviewed
SIA’s investment advisory fee schedule for investment management services provided to other clients. The Directors compared the services provided to the Funds and other clients of SIA, and recognized that the Funds’ expenses are borne by
SIA
|
|
|
|
|
|
|
|
|
|
| 82 |
|
|
SIT MUTUAL FUNDS SEMI-ANNUAL REPORT |
|
ADDITIONAL INFORMATION (Unaudited) (Continued)
except as noted above. The Directors concluded that the fees paid by the Funds in relation to the fees paid by other SIA clients were
appropriate and reasonable. The Directors also concluded that SIA’s profit margin with respect to the management of the Funds was appropriate.
The Directors discussed the extent to which SIA receives benefits from the relationship with the Funds such as soft dollar arrangements by
which brokers provide research services to SIA as a result of brokerage generated by the Funds. The Board concluded that any benefits SIA receives from its relationship with the Funds are well within industry norms and are reflected in the amount of
the fees paid by the Funds to SIA and are appropriate and reasonable.
Non-Advisory Services. The Directors considered the quality
of non-advisory services which SIA provides to the Funds (and their shareholders) and the quality and depth of SIA’s non-investment personnel who provide such services. Directors concluded that the level of such services and the quality and
depth of such personnel are consistent with industry standards.
Finally, the Directors considered the compliance staff and the regulatory
history of SIA and the Funds, and concluded that both are consistent with industry standards.
Based on these conclusions, without any
single conclusion being dispositive, the Directors determined that renewal of the Agreements was in the interest of each Fund and its shareholders.
[This page intentionally left blank.]
Item 2: Code of Ethics. Not applicable to Semi-Annual Report.
Item 3: Audit Committee Financial Expert. Not applicable to Semi-Annual Report.
Item 4: Principal Accountant Fees and Services. Not applicable to Semi-Annual Report.
Item 5: Audit Committee of Listed Registrants.
Not applicable to open-end investment companies.
Item 6:
Schedule of Investments.
The schedule of investments is included as part of the report to shareholders filed under
Item 1 of this Form.
Item 7: Disclosure of Proxy Voting Policies and Procedures for Closed-End Management
Investment Companies.
Not applicable to open-end investment companies.
Item 8: Portfolio Managers of Closed-End Management Companies.
Not applicable to open-end investment companies.
Item 9:
Purchases of Equity Securities by Closed-End Management Investment Company and Affiliated Purchasers.
Not applicable
to open-end investment companies.
Item 10. Submission of Matters to a vote of Security Holders.
There have been no material changes to the procedures by which shareholders may recommend nominees to the registrant’s board of directors.
Item 11: Controls and Procedures -
(a) Based on their evaluation of the Registrant’s Disclosure Controls and Procedures as of a date within 90 days of the Filing Date, the
Registrant’s Chairman and Treasurer have determined that the Disclosure Controls and Procedures (as defined in Rule 30a-2(c) under the Act) are designed to ensure that information required to be disclosed by the Registrant is recorded,
processed, summarized and reported by the filing Date, and that information required to be disclosed in the report is communicated to the Registrant’s management, as appropriate, to allow timely decisions regarding required disclosure.
b) There were no changes in the Registrant’s internal control over financial reporting as defined in Rule 30a-3(d) under the Act) that
occurred during the Registrant’s last fiscal half-year that has materially affected, or is reasonably likely to materially affect, the Registrant’s internal control over financial reporting.
Item 12: Exhibits:
| (a) |
The following exhibits are attached to this Form N-CSR: |
(2) A separate certification
for each principal executive and principal financial officer of the registrant as required by Rule 30a-2(a) under the Act (17 CFR 270.30a-2) (certification required by Section 302 of the Sarbanes-Oxley Act of 2002).
(b) Certification required by Rule 30a-2(b) under the Act (certification required by Section 906 of the Sarbanes-Oxley Act of
2002).
SIGNATURES
Pursuant to the requirements of the Securities Exchange Act of 1934 and the Investment Company Act of 1940, the registrant has duly caused this report to be
signed on its behalf by the undersigned, thereunto duly authorized.
Sit Mutual Funds, Inc.
|
|
|
| By (Signature and Title) |
|
/s/ Paul E. Rasmussen |
|
|
Paul E. Rasmussen |
|
|
Vice President, Treasurer |
Date February 27, 2017
Pursuant to the requirements of the Securities Exchange Act of 1934 and the Investment Company Act of 1940, this report has been signed below by the following
persons on behalf of the registrant and in the capacities and on the dates indicated.
|
|
|
| By (Signature and Title) |
|
/s/ Paul E. Rasmussen |
|
|
Paul E. Rasmussen |
|
|
Vice President, Treasurer |
Date February 27, 2017
|
|
|
| By (Signature and Title) |
|
/s/ Roger J. Sit |
|
|
Roger J. Sit |
|
|
Chairman |
Date February 27, 2017