UNITED STATES
SECURITIES AND EXCHANGE COMMISSION
Washington, D.C. 20549
FORM 10-K
ANNUAL REPORT PURSUANT TO SECTION 13 OR 15(d) OF THE SECURITIES EXCHANGE ACT OF 1934 | |
For the fiscal year ended December 31, 2019
OR
TRANSITION REPORT PURSUANT TO SECTION 13 OR 15(d) OF THE SECURITIES EXCHANGE ACT OF 1934 | |
For the transition period from to | |
COMMISSION FILE NUMBER 000-19406
(Exact name of registrant as specified in its charter)
(State or other jurisdiction of incorporation or organization) | (I.R.S. Employer Identification No.) |
(Address of principal executive offices) (Zip Code)
Registrant’s telephone number, including area code: (847 ) 634-6700
Securities registered pursuant to Section 12(b) of the Act:
Title of each class | Trading Symbol(s) | Name of exchange on which registered | ||
Securities registered pursuant to Section 12(g) of the Act: None
Indicate by check mark if the registrant is a well-known seasoned issuer, as defined in Rule 405 of the Securities Act. Yes ☒ No ☐
Indicate by check mark if the registrant is not required to file reports pursuant to Section 13 or Section 15(d) of the Exchange Act. Yes ☐ No ☒
Indicate by check mark whether the registrant (1) has filed all reports required to be filed by Section 13 or 15(d) of the Securities Exchange Act of 1934 during the preceding 12 months (or for such shorter period that the registrant was required to file such reports), and (2) has been subject to such filing requirements for the past 90 days. Yes ☒ No ☐
Indicate by check mark whether the registrant has submitted electronically every Interactive Data File required to be submitted pursuant to Rule 405 of Regulation S-T (§ 232.405 of this chapter) during the preceding 12 months (or for such shorter period that the registrant was required to submit such files). Yes ☒ No ☐
Indicate by check mark whether the registrant is a large accelerated filer, an accelerated filer, a non-accelerated filer, a smaller reporting company, or an emerging growth company. See the definitions of “large accelerated filer”, “accelerated filer”, “smaller reporting company”, and “emerging growth company” in Rule 12b-2 of the Exchange Act (Check one):
☒ | Accelerated filer | ☐ | ||
Non-accelerated filer | ☐ | Smaller reporting company | ||
Emerging growth company | ||||
If an emerging growth company, indicate by check mark if the registrant has elected not to use the extended transition period for complying with any new or revised financial accounting standards provided pursuant to Section 13(a) of the Exchange Act. ☐
Indicate by check mark whether the registrant is a shell company (as defined in Rule 12b-2 of the Securities Act). Yes ☐ No ☒
The aggregate market value of the shares of Class A Common Stock held by non-affiliates of the registrant, computed by reference to the closing price of such stock as of the last business day of the registrant’s most recently completed second quarter, June 29, 2019, was $11.2 billion.
As of February 4, 2020, there were 54,008,653 shares of Class A Common Stock, par value $.01 per share, outstanding.
Documents Incorporated by Reference
Certain sections of the Registrant’s definitive proxy statement for its Annual Meeting of Stockholders to be held on May 14, 2020, are incorporated by reference into Part III of this report, as indicated herein. The definitive proxy statement shall be filed with the Securities and Exchange Commission within 120 days after the end of the fiscal year to which this Report relates.
ZEBRA TECHNOLOGIES CORPORATION AND SUBSIDIARIES
YEAR ENDED DECEMBER 31, 2019
TABLE OF CONTENTS
PAGE | |||
Item 1. | |||
Item 1A. | |||
Item 1B. | |||
Item 2. | |||
Item 3. | |||
Item 4. | |||
Item 5. | |||
Item 6. | |||
Item 7. | |||
Item 7A. | |||
Item 8. | |||
2
Item 9. | |||
Item 9A. | |||
Item 9B. | |||
Item 10. | |||
Item 11. | |||
Item 12. | |||
Item 13. | |||
Item 14. | |||
Item 15. | |||
Item 16. | |||
3
PART I
References in this document to “the Company,” “we,” “us,” or “our” refer to Zebra Technologies Corporation and its subsidiaries, unless the context specifically indicates otherwise.
Safe Harbor
Forward-looking statements contained in this filing are subject to the safe harbor created by the Private Securities Litigation Reform Act of 1995 and are highly dependent upon a variety of important factors, which could cause actual results to differ materially from those expressed or implied in such forward-looking statements. When used in this document and documents referenced, the words “anticipate,” “believe,” “intend,” “estimate,” “will,” and “expect” and similar expressions as they relate to the Company or its management are intended to identify such forward-looking statements but are not the exclusive means of identifying these statements. The forward-looking statements include, but are not limited to, the Company’s financial outlook for the first quarter and full year of 2020. These forward-looking statements are based on current expectations, forecasts and assumptions and are subject to the risks and uncertainties inherent in the Company’s industry, market conditions, general domestic and international economic conditions, and other factors. These factors include:
• | Market acceptance of the Company’s products and solution offerings and competitors’ offerings and the potential effects of technological changes, |
• | The effect of global market conditions, including North America; Europe, Middle East, and Africa; Latin America; and Asia-Pacific regions in which we do business, |
• | The impact of foreign exchange rates due to the large percentage of our sales and operations being outside the United States (“U.S.”), |
• | Our ability to control manufacturing and operating costs, |
• | Risks related to the manufacturing of the Company’s products and conducting business operations in non-U.S. countries, including the risk of depending on key suppliers who are also in non-U.S. countries, |
• | The Company’s ability to purchase sufficient materials, parts, and components to meet customer demand, particularly in light of global economic conditions, |
• | The availability of credit and the volatility of capital markets, which may affect our suppliers, customers, and ourselves, |
• | Success of integrating acquisitions, |
• | Interest rate and financial market conditions, |
• | Access to cash and cash equivalents held outside the U.S., |
• | The effect of natural disasters, man-made disasters, public health issues, and cybersecurity incidents on our business, |
• | The impact of changes in foreign and domestic governmental policies, laws, or regulations, |
• | The outcome of litigation in which the Company may be involved, particularly litigation or claims related to infringement of third-party intellectual property rights, and |
• | The outcome of any future tax matters or tax law changes. |
We encourage readers of this report to review Item 1A, “Risk Factors,” in this report for further discussion of issues that could affect the Company’s future results. We undertake no obligation, other than as may be required by law, to publicly update or revise any forward-looking statements, whether as a result of new information, future events, changed circumstances, or any other reason after the date of this report.
Item 1. | Business |
The Company
We are a global leader providing Enterprise Asset Intelligence (“EAI”) solutions in the Automatic Identification and Data Capture (“AIDC”) industry. The AIDC market consists of mobile computing, data capture, radio frequency identification devices (“RFID”), barcode printing, and other automation products and services. The Company’s solutions are proven to help our customers and end-users achieve their mission critical strategic business objectives, including improved operational efficiency, optimized workflows, increased asset utilization, improved regulatory compliance, and better customer experiences.
We design, manufacture, and sell a broad range of AIDC products, including: mobile computers, barcode scanners and imagers, RFID readers, specialty printers for barcode labeling and personal identification, real-time location systems (“RTLS”), related accessories and supplies, such as labels and other consumables, and software utilities and applications. We also provide a full range of services, including maintenance, technical support, repair, managed and professional services, including cloud-based subscriptions. End-users of our products and services include retail and e-commerce, transportation and logistics, manufacturing, healthcare, hospitality, warehouse and distribution, energy and utilities, government, public safety, and education enterprises around the world. We provide our products and services globally through a direct sales force and
4
extensive network of channel partners. We provide products and services in approximately 180 countries, with 124 facilities and approximately 8,200 employees worldwide.
Through innovative application of our technologies, we are leading an evolution of the traditional AIDC market into EAI, which encompasses solutions that sense information from enterprise assets, including packages moving through a supply chain, equipment in a factory, workers in a warehouse, and shoppers in a store. Operational data from enterprise assets, including status, location, utilization, and preferences, is then analyzed to provide actionable insights. Finally, with the benefits of mobility, these insights can be delivered to the right user at the right time to drive more effective actions. As a result, our solutions and technologies enable enterprises to “sense, analyze, and act” more effectively to improve operational effectiveness and achieve critical business objectives.
The evolution of the AIDC market is being driven by strong underlying secular trends in technology. These trends include the internet of things (“IoT”), cloud-based data analytics, and mobility, as well as artificial intelligence and automation. The IoT is enabling a proliferation of smart, connected devices. Newer solutions, which include these smart, connected devices, capture a much broader range of information than is possible with traditional AIDC solutions and communicate this information in real-time. Cloud computing and expanded data analytics are allowing enterprises to make better business decisions through improved timeliness and visibility to information and workflows. While traditional AIDC solutions sporadically capture limited amounts of data and populate static enterprise systems, EAI solutions continuously analyze real-time data from many sources to generate actionable insights. The continued rapid growth of mobile devices and applications are also significantly expanding mobile computing use cases in the enterprise. With this expanded mobility, end-users can consume or act upon dynamic enterprise data and information anytime and anywhere. Computer vision solutions, which enable the automatic extraction and understanding of useful information from a digital image or video, are also driving the expansion of intelligent automation, which leverages our sense-analyze-act framework to improve workflows with or without a human operator.
Zebra Technologies Corporation is incorporated under the laws of the State of Delaware as the successor to an Illinois corporation, Data Specialties, Inc., organized in 1969. We changed our name from Data Specialties, Inc. to Zebra Technologies Corporation on December 9, 1986. Our principal executive offices are located at 3 Overlook Point, Lincolnshire, Illinois 60069.
Acquisitions
Cortexica: On November 5, 2019, the Company acquired Cortexica Vision Systems Limited (“Cortexica”) for $7 million in cash. Additionally, we incurred $2 million of acquisition-related costs in 2019. Cortexica is a provider of computer vision-based artificial intelligence solutions primarily serving the retail industry, expanding upon the Company’s initiative to advance our solutions offerings. The operating results of Cortexica are included within the EVM segment beginning November 5, 2019.
Profitect: On May 31, 2019, the Company acquired Profitect, Inc. (“Profitect”) for total purchase consideration of $79 million, which consisted of $75 million in cash paid, net of cash acquired, and the fair value of the Company’s existing minority ownership interest in Profitect of $4 million, as remeasured upon acquisition. The Company also incurred $13 million of acquisition-related costs in 2019, primarily related to the settlement of Profitect employee stock option awards. The Profitect business is a provider of prescriptive analytics primarily serving the retail industry. In acquiring Profitect, the Company seeks to enhance its existing software solutions within the retail industry, with possible future applications in other industries. The operating results of Profitect are included within the EVM segment beginning May 31, 2019.
Temptime: On February 21, 2019, the Company acquired Temptime Corporation (“Temptime”) for $180 million in cash, net of cash acquired. Additionally, we incurred $3 million of acquisition-related costs in 2019. The Temptime business is a developer and manufacturer of temperature-monitoring labels and devices. The Company intends to expand Temptime’s product offerings within the healthcare industry, with possible future applications in other industries involving temperature-sensitive products. The operating results of Temptime are included within the AIT segment beginning February 21, 2019.
Xplore: On August 14, 2018, the Company acquired Xplore Technologies Corporation (“Xplore”) for $87 million in cash, which included $72 million for the net assets acquired, a $9 million payment of Xplore debt, as well as $6 million of other Xplore transaction-related obligations. Additionally, we incurred $8 million of acquisition-related costs in 2018 and $2 million of system integration costs in 2019. The Xplore business designs, integrates, markets and sells rugged tablets that are primarily used by industrial, government, and field service organizations. The acquisition of Xplore is intended to expand the Company’s portfolio of mobile computing devices to serve a wider range of customers. The operating results of Xplore are included within the EVM segment beginning August 14, 2018.
See Note 5, Business Acquisitions in the Notes to Consolidated Financial Statements.
Enterprise Business
5
In October 2014, the Company acquired the Enterprise business (“Enterprise”), excluding its iDEN or Integrated Digital Enhanced Network Business, from Motorola Solutions, Inc. (“MSI”) for $3.45 billion in cash.
Since closing the Enterprise acquisition, integration activities by the Company focused on creating “One Zebra” by integrating the operations of Enterprise to create a single business across all functions. Our integration priorities centered on maintaining business continuity while identifying and implementing cost synergies, operating efficiencies, and integration of functional organizations and processes, in addition to concluding MSI-provided transition service agreements (“TSAs”).
During 2017, the Company substantially completed its integration activities, including the implementation of a common enterprise resource planning system. The Company also exited the TSAs with MSI.
Operations
Our operations consist of two reportable segments: (1) Asset Intelligence & Tracking (“AIT”), primarily comprised of barcode and card printing, supplies, services, location solutions, and retail solutions; and (2) Enterprise Visibility & Mobility (“EVM”), primarily comprised of mobile computing, data capture, RFID, and services.
Asset Intelligence & Tracking
Barcode and Card Printing: We design, manufacture, and sell printers, which produce high-quality labels, wristbands, tickets, receipts, and plastic cards on demand. Our customers use our printers in a wide range of applications, including routing and tracking, patient safety, transaction processing, personal identification, and product authentication. These applications require high levels of data accuracy, speed, and reliability. They also include specialty printing for receipts and tickets for improved customer service and productivity gains. Plastic cards are used for secure, reliable personal identification (e.g. state identification cards, drivers’ licenses, and healthcare identification cards), access control (e.g. employee or student building access), and financial cards (e.g. credit, debit and ATM cards) by financial institutions. Our RFID printers and encoders are used to print and encode passive RFID labels. We offer a wide range of accessories and options for our printers, including vehicle mounts and battery chargers.
Supplies: We produce and sell stock and customized thermal labels, receipts, ribbons, plastic cards, and RFID tags suitable for use with our printers, and also wristbands which can be imaged in most commercial laser printers. We support our printing products, resellers, and end-users with an extensive line of superior quality, high-performance supplies optimized to a particular end-user’s needs. We promote the use of supplies with our printing equipment. Our supplies business also includes temperature-monitoring labels, as well as self-laminating wristbands for use in laser printers.
Services: We provide a full range of maintenance, technical support, and repair services. We also provide managed and professional services including those which help customers manage their devices and related software applications. Our offerings include cloud-based subscriptions and multiple service levels. They are typically contracted through multi-year service agreements. We provide our services directly and through our global network of partners.
Location Solutions: The Company offers a range of RTLS and services which incorporate active and passive RFID and other tracking technologies to enable users to locate, track, manage, and optimize the utilization of enterprise assets and personnel. We provide substantially all elements of the location solution, including tags, sensors, exciters, middleware software, and application software. Our location solutions are deployed primarily in manufacturing, aerospace, transportation and logistics, sports, and healthcare industries. Various sports teams utilize our Zebra MotionWorks® sports solution to track the location and movement of personnel and objects in real-time during sporting events, as well as in training and practice activities.
Retail Solutions: The Company provides a range of physical inventory management solutions with application in the retail industry, including solutions for full store physical inventories, cycle counts, and analytics. These solutions include the use of barcode scanners or RFID readers, along with connected software.
Enterprise Visibility & Mobility
Mobile Computing: We design, manufacture, and sell rugged and enterprise-grade mobile computing products and accessories in a variety of specialized form factors and designs to meet a wide variety of enterprise applications. Industrial applications include inventory management in warehouses and distribution centers; field mobility applications include field service, post and parcel, and direct store delivery; and retail and customer facing applications include e-commerce, omnichannel, mobile point of sale, inventory look-up, staff collaboration, and analytics. Our products incorporate both Android™ and Microsoft® Windows® operating systems and support local-area and wide-area voice and data communications. Our mobile computing products often incorporate barcode scanning, global position system and RFID features, and other sensory capabilities. We also provide related software tools, utilities, and applications.
6
Data Capture and RFID: We design, manufacture, and sell barcode scanners, image capture devices, and RFID readers. Our portfolio of barcode scanners includes laser scanning and imager products and form factors, including fixed, handheld, and embedded original equipment manufacturer (“OEM”) modules. The Company’s data capture products capture business-critical information by decoding barcodes and images and transmitting the resulting data to enterprise systems for analysis and timely decision making. Common applications include asset identification and tracking and workflow management in a variety of industries, including retail, transportation and logistics, manufacturing, and healthcare. Our RFID line of data capture products is focused on ultra-high frequency (“UHF”) technology. These RFID devices comply with the electronic product code (“EPC”) global Generation 2 UHF standard and similar standards around the world. We also provide related accessories.
Services: We provide a full range of maintenance, technical support, and repair services. We also provide managed and professional services that, among other things, help customers design, test, and deploy our solutions as well as manage their mobility devices, software applications and workflows. Our offerings include cloud-based subscriptions and multiple service levels. They are typically contracted through multi-year service agreements. We provide our services directly and through our global network of partners.
Our Competitive Strengths
The following are core competitive strengths that we believe enable us to differentiate ourselves from our competitors:
An industry leader focused solely on improving enterprise operations
We are a market leader in the key technologies of EAI, including mobile computing, barcode and card printing, data capture, and RFID readers. We also provide related software, services, and accessories. Our leadership position enables us to work with and support customers globally, in a variety of industries, who are focused on implementing leading-edge solutions.
High entry and switching barriers
On a global basis, we have long-standing relationships with end-users and with our extensive network of channel partners. We believe these customer relationships and our strong partner network are critical to our success and would be difficult for a new market entrant to replicate. We believe a significant portion of our products are deployed with specialized product performance and software application requirements, which could result in high switching costs.
Commitment to innovation and deep industry-specific expertise
Over time, we have developed and delivered improved, targeted end-to-end solutions for our customers. We remain committed to leveraging our technology portfolio and expertise in the industries that we service to continue to develop innovative solutions that meet the key needs of our customers.
Highly diversified business mix
We are highly diversified across business segments, end markets, geographies, and customers. Additionally, we have strong recurring business in services and supplies driven by an extensive global installed base of products.
Global reach and brand
We sell to customers directly and through our network of channel partners around the world. This global presence gives us the capability to supply our customers with products, solutions, and services no matter the location of their operations. In addition, we believe we have strong brand recognition with a reputation in the industry as a trusted and strategic partner.
Scale advantages
We believe the size and scope of our operations, including market leadership, product development investment, portfolio breadth, and global distribution, give us advantages over our competitors. We believe we have the largest installed base of products compared to other companies in our industry. These characteristics enable us to compete successfully, achieve economies of scale, and develop industry-leading solutions.
Our Business Strategies
Leverage our market leadership position and innovation to profitably grow our core business
We expect to drive revenue growth by continuing to outpace our competition in our core businesses, including mobile computing, data capture, barcode printing, and services. We expect to achieve this by leveraging our broad portfolio of solutions and product innovation and continuing to be a strategic partner to end customers. We also expect to drive growth by capitalizing on technology transitions occurring in the industry, including the transition to the Android™ operating system in mobile computing and transitions in data capture to newer technologies involving 2D and 3D imaging and RFID. This includes increased focus on market segments and geographies that offer share-gain opportunities. In addition, we plan to leverage our market-leading installed base to accelerate growth in attach-oriented products, including services, supplies, accessories, and software applications. Our global channel partner network is vital to helping us achieve these goals. As such, we will ensure that we provide the necessary value and support for our partners to be successful.
7
Drive our Enterprise Asset Intelligence vision
Our EAI vision is for every asset and worker to be connected, visible, and optimally utilized. We believe that secular technology trends, particularly in IoT, cloud computing, intelligent automation, and mobility, advance our vision and are transforming our customers’ businesses and our industry, providing us with significant new opportunities to create value for our customers and for the Company. We expect to capitalize on these trends, and in particular the proliferation of smart connected sensors and devices in our core market segments, by providing end-to-end solutions that integrate these sensors and devices with cloud-based workflows and analytics applications. We plan to continue investing in the development of computer vision and other technologies that will enable intelligent automation solutions, providing increased visibility into the enterprise, real-time, actionable information, and improved customer experiences. Our solutions will also increasingly include advanced features, functions, and user experiences to drive additional competitive differentiation.
Increase our opportunity for growth through expansion in adjacent market segments
We plan to drive growth through expansion, organically or inorganically, in adjacent market segments that share similar technology needs with our core markets. We will focus specifically on segments where our products and solutions, workflow expertise, and customer and industry relationships will enable us to provide significant value to end-users.
Enhance financial strength and flexibility
We intend to continue to improve profitability and cash flow generation through operational execution and increased productivity derived from continuous business process improvement, cost management, and focus on working capital efficiency.
Competition
We operate in a highly competitive environment. The need for companies to improve productivity and implement their strategies, as well as the secular trends around IoT, cloud computing, automation, and mobility, are some of the factors that are creating growth opportunities for established and new competitors.
Key competitive factors include the breadth and quality of products, solutions and services, price, design, product performance, durability, product and service global availability, warranty coverage, brand recognition, relationships with customers and channel partners, and Company reputation. We believe we compete effectively with respect to these factors.
Mobile Computing: Competitors in mobile computing and related services include companies that have historically served enterprises with ruggedized devices. For some applications, we compete with companies that provide tablets and smart phones. Competitors include: Datalogic, Honeywell, and Panasonic.
Data Capture and RFID: Competitors that provide a broad portfolio of barcode scanning products and related services that are suitable for most global market applications include Datalogic and Honeywell. We also compete against smaller companies that focus on limited product subsets or specific regions, including Fujian Newland and Impinj.
Barcode and Card Printing: We consider our direct competition in printing to be producers of on-demand thermal transfer and direct thermal label printing systems, RFID printer/encoders, and mobile printers. We also compete with companies engaged in the design, manufacture, and marketing of printing systems that use technologies such as ink-jet, direct marking and laser printing, as well as card printers based on ink-jet, thermal transfer, embossing, film-based systems, encoders, laser engraving, and large-scale dye sublimation printers. In addition, service bureaus, which provide centralized services, compete for end-user business and provide an alternative to our card printing solutions. Competitors include: Fargo Electronics (a unit of HID Global), Honeywell, Sato, and Toshiba TEC.
Location Solutions: We compete with a diverse group of companies marketing location solutions that are primarily based on active RFID technologies. Competitors include: Cisco, Impinj, and Stanley Healthcare.
Supplies: The supplies industry is highly fragmented with competition comprised of numerous companies of various sizes around the world.
Customers
End-users of our products are diversified across a wide variety of industries, including retail and e-commerce, transportation and logistics, manufacturing, and healthcare industries. We have had three customers that each accounted for 10% or more of our Net sales over the past three years. All three of these customers are distributors and not end-users of our products. No end-user has accounted for 10% or more of our Net sales during these years. See Note 20, Segment Information & Geographic Data in the Notes to Consolidated Financial Statements for further information.
8
Year Ended December 31, | ||||||||
2019 | 2018 | 2017 | ||||||
Customer A | 18.3 | % | 20.3 | % | 21.3 | % | ||
Customer B | 13.7 | % | 15.7 | % | 14.2 | % | ||
Customer C | 16.6 | % | 14.1 | % | 13.2 | % | ||
Sales and Marketing
Sales: We sell our products, solutions, and services primarily through distributors (two-tier distribution), value added resellers (“VARs”), independent software vendors (“ISVs”), direct marketers, and OEMs. We also sell directly to a select number of customers through our direct sales force. Distributors purchase our products and sell to VARs, ISVs and others, thereby increasing the distribution of our products globally. VARs, ISVs, OEMs, and systems integrators provide customers with a variety of hardware, accessories, software applications, and services. VARs and ISVs typically customize solutions for specific end-user applications using their industry, systems, and applications expertise. Some OEMs resell the Zebra-manufactured products under their own brands as part of their own product offering. Because these sales channels provide specific software, configuration, installation, integration, and support services to end-users within various industry segments, these relationships are highly valued by end-users and allow our products to reach customers in a wide array of industries around the world. We believe that the breadth of our distributor and channel partner network is a competitive differentiator and enhances our ability to compete. Finally, we experience some seasonality in sales, depending upon the geographic region and industry served.
Marketing: Our marketing function aligns closely with sales and product management functions to market our products and to deliver and promote solutions that address the needs of our customers and partners. Our marketing organization includes regional and channel marketing teams that interface closely with customers, partners, and sellers. Our marketing organization also includes teams that support global strategies and communications, including portfolio marketing, digital marketing, marketing operations and communications, and strategic marketing functions.
Manufacturing and Outsourcing
Final assembly of our hardware products is performed by third-parties, including electronics manufacturing services companies (“EMSs”) and joint design manufacturers (“JDMs”). Our products are currently produced in facilities primarily located in China, Mexico, and Brazil. In 2019, we commenced efforts to further diversify our product sourcing footprint to Taiwan, Vietnam, and Malaysia, thereby reducing reliance on Chinese-based manufacturing. The EMSs and JDMs produce our products to our design specifications. We maintain control over portions of the supply chain, including supplier selection and price negotiations for key components. The manufacturers purchase the components and subassemblies used in the production of our products. Our products are shipped to regional distribution centers, operated by third party logistics providers or the Company. A portion of products are reconfigured at the distribution centers through firmware downloads, packaging, and customer specific customization before they are shipped to customers. In addition, certain products are manufactured in accordance with procurement regulations and various international trade agreements and remain eligible for sale to the U.S. government. Production facilities for our supplies products are located in the U.S. and Western Europe. We also supplement our in-house production capabilities with those of third-party manufacturers to offer our supplies, principally in Asia.
Research and Development
The Company devotes significant resources to developing innovative solutions for our target markets and ensuring that our products and services maintain high levels of reliability and provide value to end-users. Research and development expenditures for the years ended 2019, 2018, and 2017 were $447 million, $444 million, and $389 million, or 10.0%, 10.5% and 10.5% of Net sales, respectively. We have approximately 2,000 engineers and innovation and design experts worldwide focused on strengthening and broadening our extensive portfolio of products and solutions.
Our Technology
Mobile Computing: Our mobile computing products incorporate a wide array of advanced technologies in rugged, ergonomic enclosures to meet the needs of specific use cases. These purpose-built devices couple hardened industry-standard operating systems with specialized hardware and software features to facilitate customers’ mission-critical applications and ensure secure data transmission. Purpose-built rugged housings ensure reliable operations for targeted use cases, surviving years of rough handling and harsh environments. Specialized features such as advanced data capture technologies, data analytics technologies, voice and video collaboration tools, and advanced battery technologies enable our customers to work more efficiently and better serve their customers. A broad portfolio of enterprise accessories further tailors mobile computers to meet a wide variety of enterprise use cases. Our mobile computers are offered with software tools and services that support application development, device configuration, and field support to facilitate smooth and rapid deployment and ensure maximum customer return on investment.
9
Data Capture and RFID: Our data capture products allow businesses to track business critical information simply, quickly, and accurately by providing critical visibility into business processes and performance and enabling real-time action in response to the information. These products include barcode scanners in a variety of form factors, including fixed and handheld scanners and standalone modules designed for integration into third-party OEM devices. Our scanners incorporate a variety of technologies including area imagers, linear imagers, lasers, and read linear, and two-dimensional barcodes. They are used in a broad range of applications, ranging from supermarket checkout to industrial warehouse optimization to patient management in hospitals. The design of these products reflects the diverse needs of these markets, with different ergonomics, multiple communication protocols, and varying levels of ruggedness.
Our RFID products include fixed readers, RFID enabled mobile computers, and RFID sleds. These utilize passive UHF to provide high speed, non-line of sight data capture from hundreds or thousands of RFID tags in near real-time. Using the EPC standard, end-users across multiple industries take advantage of RFID technology to track high-value assets, monitor shipments, and drive increased retail sales though improved inventory accuracy. We also offer mobile computers that support high frequency (“HF”) near-field communications (“NFC”) and low frequency (“LF”) radio technologies.
Barcode and Card Printing: All of the Company’s printers and print engines incorporate thermal printing technology. This technology creates an image by heating certain pixels of an electrical printhead to selectively image a ribbon or heat-sensitive substrate. Thermal printing benefits applications requiring simple and reliable operations, yet it is flexible enough to support a wide range of specialty label materials and associated inks. Our dye-sublimation thermal card printers produce full-color, photographic quality images that are well-suited for driver’s licenses, access and identification cards, transaction cards, and on-demand photographs. Many of our printers also incorporate RFID technology that can encode data into passive RFID transponders embedded in a label or card.
The Company’s printers integrate company-designed mechanisms, electrical systems, and firmware. Enclosures of metal or high-impact plastic ensure the durability of our printers. Special mechanisms optimize handling of labels, ribbons, and plastic cards. Fast, high-current electrical systems provide consistent image quality. Firmware supports serial, parallel, Ethernet, USB, Bluetooth, or 802.11 wireless communications with appropriate security protocols. Printing instructions can be received as a proprietary language such as Zebra Programming Language II (“ZPL II®”), as a print driver-provided image, or as user-defined Extensible Markup Language (“XML”). These features make our printers easy to integrate into virtually all common computer systems.
Location Solutions: Our RTLS solutions use active and passive RFID technologies, beacons, and other tracking technologies to locate, track, manage, and optimize high-value assets, equipment, and people. We offer a range of scalable RTLS technologies that generate precise, on-demand information about the physical location and status of high-valued assets. In addition, we offer a selection of RTLS infrastructure products that receive tag transmissions and provide location and motion calculations, database and system management functions and asset visibility. The flexible infrastructure supports large tag populations and coverage areas that range from small to large.
Supplies: Our supplies business includes thermal labels, receipts, ribbons, plastic cards and wristbands suitable for use with our printers, and wristbands which can be imaged in most commercial laser printers. Our wristbands incorporate multi-layer form technology to ensure trouble-free printing, wearer comfort, and reliable barcode reading, even when exposed to harsh chemical environments. We offer many thermal and RFID labels, card, and receipt materials, and matching ribbons for diverse applications that may require meeting unique or precise specifications, including chemical or abrasion resistance, extreme temperatures, exceptional image quality, or long life. Also included within our supplies business are temperature monitoring labels, which incorporate chemical indicators that are designed to change color upon exceeding predefined time and/or temperature thresholds.
Intellectual Property
We rely on a combination of trade secrets, patents, trademarks, copyrights, and contractual rights to establish and protect our innovations, and hold a large portfolio of intellectual property rights in the U.S. and other countries. As of December 31, 2019, the Company owned approximately 2,200 trademark registrations and trademark applications, and over 4,900 patents and patent applications, worldwide. We continue to actively seek to obtain patents and trademarks, whenever possible and practical, to secure intellectual property rights in our innovations.
We believe that our intellectual property will continue to provide us with a competitive advantage in our core product areas as well as provide leverage for future technologies. We also believe that we are not dependent upon any single patent or select group of patents. Our success depends more upon our extensive know-how, deep understanding of end-user processes and work-flows, innovative culture, technical leadership and marketing and sales abilities. Although we do not rely only on patents or other intellectual property rights to protect or establish our market position, we will enforce our intellectual property rights when and where appropriate.
10
Employees
As of December 31, 2019, the Company had approximately 8,200 employees. Some portions of our business, primarily in Europe, China, and India are subject to labor laws that differ significantly from those in the U.S. In Europe, for example, it is common for a works council to represent employees when discussing matters such as compensation, benefits, restructurings and layoffs. We consider our relations with our employees to be very good.
Regulatory Matters
Wireless Regulatory Matters
Our business is subject to certain wireless regulatory matters.
The use of wireless voice, data, and video communications systems requires radio spectrum, which is regulated by government agencies throughout the world. In the U.S., the Federal Communications Commission (“FCC”) and the National Telecommunications and Information Administration (“NTIA”) regulate spectrum use by non-federal entities and federal entities, respectively. Similarly, countries around the world have one or more regulatory bodies that define and implement the rules for use of the radio spectrum, pursuant to their respective national laws and international coordination under the International Telecommunications Union. We manufacture and market products in spectrum bands already made available by regulatory bodies, these include voice and data infrastructure, mobile radios, and portable or hand-held devices. Consequently, our results of operations could be positively or negatively affected by the rules and regulations adopted from time-to-time by the FCC, NTIA, or regulatory agencies in other countries. Our products operate both on licensed and unlicensed spectrum. The availability of additional radio spectrum may provide new business opportunities, and consequently, the loss of available radio spectrum may result in the loss of business opportunities. Regulatory changes in current spectrum bands may also provide opportunities or may require modifications to some products so they can continue to be manufactured and marketed.
Other Regulatory Matters
Some of our operations use substances regulated under various federal, state, local, and international laws governing the environment and worker health and safety, including those governing the discharge of pollutants into the ground, air and water, the management and disposal of hazardous substances and wastes and the cleanup of contaminated sites. Certain products are subject to various federal, state, local, and international laws governing chemical substances in electronic products. During 2019, compliance with U.S. federal, state and local, and foreign laws regulating the discharge of materials into the environment, or otherwise relating to the protection of the environment did not have a material effect on our business or results of operations.
Available Information
Our website address is www.zebra.com. The information on our website is not, and shall not be deemed to be, a part of this annual report Form 10-K or incorporated into any other filings we make with the Securities and Exchange Commission (“SEC”). Our annual report on Form 10-K, quarterly reports on Form 10-Q, current reports on Form 8-K, and any amendments to those reports, are made available free of charge on the Investor Relations page of our website as soon as reasonably practicable after we electronically file them with or furnish them to the SEC.
11
Item 1A. | Risk Factors |
Investors should carefully consider the risks, uncertainties, and other factors described below, as well as other disclosures in this report, including Management’s Discussion and Analysis of Financial Condition and Results of Operations, because they could have a material adverse effect on our business, financial condition, operating results, cash flows, and growth prospects. These risks are not the only risks we face. Our business operations could also be affected by additional factors that are not presently known to us or that we currently consider to be immaterial. No priority or significance is intended by, nor should be attached to, the order in which the risk factors appear.
General Business and Industry Risks
The Company is vulnerable to the potential difficulties associated with the increase in the complexity of our business. We have grown rapidly over the last several years through acquisition and worldwide growth. This growth has caused increased complexities in the business. We believe our future success depends in part on our ability to manage our growth and increased complexities of our business. The following factors could present difficulties to us:
• | Managing our distribution channel partners; |
• | Managing our contract manufacturing and supply chain; |
• | Manufacturing an increased number of products; |
• | Managing parties to whom we have outsourced portions of our business operations; |
• | Managing administrative and operational burdens; |
• | Managing stakeholder interests including customer, investor and employee social responsibility matters; |
• | Maintaining and improving information technology infrastructure to support growth; |
• | Managing the integration of acquisitions; |
• | Managing logistical problems common to complex, expansive operations; |
• | Managing our international operations; and |
• | Attracting, developing and retaining individuals with the requisite technical expertise to develop new technologies and introduce new products and solutions. |
Inability to consummate future acquisitions at appropriate prices could negatively impact our growth rate and stock price. Our ability to expand revenues, earnings, and cash flow depends in part upon our ability to identify and successfully acquire and integrate businesses at appropriate prices and to realize anticipated synergies. Acquisitions can be difficult to identify and consummate due to competition among prospective buyers and the need to satisfy applicable closing conditions and obtain antitrust and other regulatory approval on acceptable terms.
The Company could encounter difficulties in any acquisition it undertakes, including unanticipated integration problems and business disruption. Acquisitions could also dilute stockholder value and adversely affect operating results. We may acquire or make investments in other businesses, technologies, services, or products. An acquisition may present business issues which are new to us. The process of integrating any acquired business, technology, service, or product into our operations may result in unforeseen operating difficulties and expenditures. Integration of an acquired company also may consume considerable management time and attention, which could otherwise be available for ongoing operations and the further development of our existing business. These and other factors may result in benefits of an acquisition not being fully realized.
Acquisitions also may involve a number of risks, including:
• | Difficulties and uncertainties in retaining the customers or other business relationships from the acquired entities; |
• | The loss of key employees of acquired entities; |
• | The ability of acquired entities to fulfill their customers’ obligations; |
• | The inheritance of known, and the discovery of unknown, issues or liabilities; |
• | Pre-closing and post-closing acquisition-related earnings charges could adversely impact operating results and cash flows in any given period, and the impact may be substantially different from period to period; |
• | The failure of acquired entities to meet or exceed expected operating results or cash flows could result in impairment of goodwill or intangible assets acquired; |
• | The ability to implement internal controls and accounting systems necessary to be compliant with requirements applicable to public companies subject to SEC reporting, which could result in misstated financial reports; and |
• | Future acquisitions could result in changes such as potentially dilutive issuances of equity securities, the incurrence of debt and contingent liabilities, and goodwill impairment charges. |
12
The Company may not be able to continue to develop products or solutions to address user needs effectively in an industry characterized by ongoing change. To be successful, we must adapt to rapidly changing technological and application needs by continually improving our products, as well as introducing new products and services, to address user demands.
The Company’s industry is characterized by:
• | Evolving industry standards; |
• | Frequent new product and service introductions; |
• | Evolving distribution channels; |
• | Increasing demand for customized product and software solutions; |
• | Changing customer demands; and |
• | Changing security protocols. |
Future success will depend on our ability to effectively and economically adapt in this evolving environment. We could incur substantial costs if we must modify our business to adapt to these changes, and may even be unable to adapt to these changes.
The Company participates in a competitive industry, which may become more competitive. Competitors may be able to respond more quickly to new or emerging technology and changes in customer requirements. We face significant competition in developing and selling our products and solutions. To remain competitive, we believe we must continue to effectively and economically provide:
• | Technologically advanced systems that satisfy user demands; |
• | Superior customer service; |
• | High levels of quality and reliability; and |
• | Dependable and efficient distribution networks. |
We cannot assure we will be able to compete successfully against current or future competitors or technologies. Increased competition in mobile computing products, data capture products, radio frequency identification devices (“RFID”), printers, or supplies may result in price reductions, lower gross profit margins, and loss of market share, and could require increased spending on research and development, sales and marketing, and customer support. Some competitors may make strategic acquisitions or establish cooperative relationships with suppliers or companies that produce complementary products, which may create additional pressures on our competitive position in the marketplace.
Operational Risks
The Company has substantial operations and sells a significant portion of our products outside of the U.S. and purchases important components, including final products, from suppliers located outside the U.S. Shipments to non-U.S. customers are expected to continue to account for a material portion of Net sales. We also expect to continue the use of third-party contract manufacturing services with non-U.S. production and assembly operations for our products.
Risks associated with operations, sales, and purchases outside the United States include:
• | Fluctuating foreign currency rates could restrict sales, increase costs of purchasing, and affect collection of receivables outside of the U.S.; |
• | Volatility in foreign credit markets may affect the financial well-being of our customers and suppliers; |
• | Violations of anti-corruption laws, including the Foreign Corrupt Practices Act and the U.K. Bribery Act, could result in large fines and penalties; |
• | Adverse changes in, or uncertainty of, local business laws or practices, including the following: |
▪ | Imposition of burdensome tariffs, quotas, taxes, trade barriers, or capital flow restrictions; |
▪ | Restrictions on the export or import of technology may reduce or eliminate the ability to sell in, or purchase from, certain markets; |
▪ | Political and economic instability may reduce demand for our products or put our non-U.S. assets at risk; |
▪ | Limited intellectual property protection in certain countries may limit recourse against infringement on our products or may cause us to refrain from selling in certain geographic territories; |
▪ | Staffing may be difficult including higher than anticipated turnover; |
▪ | A government-controlled exchange rate and limitations on the convertibility of currencies, including the Chinese Yuan; |
▪ | Transportation delays and customs related delays may affect production and distribution of our products; |
▪ | Geopolitical uncertainty or turmoil could negatively affect our operations or those of our customers or suppliers; |
▪ | Effectively managing and overseeing operations that are distant and remote from corporate headquarters; and |
13
▪ | Integration and enforcement of laws varies significantly among jurisdictions and may change over time. |
Infringement by the Company or our suppliers on the proprietary rights of others could put us at a competitive disadvantage, and any related litigation could be time consuming and costly. Third parties may claim that we or our suppliers violated their intellectual property rights. To the extent of a violation of a third-party’s patent or other intellectual property right, we may be prevented from operating our business as planned, and may be required to pay damages, to obtain a license, if available, or to use a non-infringing method, if possible, to accomplish our objectives. Any of these claims, with or without merit, could result in costly litigation and divert the attention of key personnel. If such claims are successful, they could result in costly judgments or settlements. Also, as new technologies emerge, the intellectual property rights of parties in such technologies can be uncertain. As a result, our products involving such technologies may have higher risk of claims of infringement of the intellectual proprietary rights of third parties.
The inability to protect intellectual property could harm our reputation, and our competitive position may be materially damaged. Our intellectual property is valuable and provides us with certain competitive advantages. We use copyrights, patents, trademarks, trade secrets, and contracts to protect these proprietary rights. Despite these precautions, third parties may be able to copy or reproduce aspects of our intellectual property and our products or, without authorization, to misappropriate and use information we regard as trade secrets. Additionally, the intellectual property rights we obtain may not be sufficient to provide us with a competitive advantage and may be successfully challenged, invalidated, circumvented, or infringed. In any infringement litigation that the Company may undertake to protect our intellectual property, any award of monetary damages may be unlikely or very difficult to obtain, and any such award we may receive may not be commercially valuable. Furthermore, efforts to enforce or protect our proprietary rights may be ineffective and could result in the invalidation or narrowing of the scope of our intellectual property and may cause us to incur substantial litigation costs. Because of the substantial amount of discovery required in connection with intellectual property litigation, there is a risk that some of the Company’s confidential information could be compromised by disclosure during this type of litigation. Some aspects of our business and services also rely on technologies, software, and content developed by or licensed from third parties, and we may not be able to maintain our relationships with such third parties or enter into similar relationships in the future on reasonable terms or at all.
We currently use third-party and/or open source operating systems and associated application ecosystems in certain of our products. Such parties ceasing continued development of the operating systems or restricting our access to such operating systems could adversely impact our business and financial results. We are dependent on third-parties’ continued development of operating systems, software application ecosystem infrastructures, and such third-parties’ approval of our implementations of their operating systems and associated applications. If such parties cease to continue development or support of such operating systems or restrict our access to such operating systems, we would be required to change our strategy for such devices. Our financial results could be negatively impacted by a resulting shift away from the operating systems we currently use and the associated applications ecosystem could be costly and difficult. A strategy shift could increase the burden of development on the Company and potentially create a gap in our portfolio for a period of time, which could competitively disadvantage us.
Cybersecurity incidents could disrupt business operations. We rely on information technology systems throughout the Company to keep financial records, process orders, manage inventory, coordinate shipments to distributors and customers, maintain confidential and proprietary information, and other technical activities, and operate other critical functions such as internet connectivity, network communications, and email. Like many companies, we continually strive to meet industry information security standards relevant to our business. We periodically perform vulnerability assessments, remediate vulnerabilities, review log/access, perform system maintenance, manage network perimeter protection, implement and manage disaster recovery testing, and provide periodic educational sessions to our employees to foster awareness of schemes to access sensitive information. Despite our implementation of a variety of security measures, there is no assurance that such actions will be sufficient to prevent a cybersecurity incident. A cybersecurity incident could include an attempt to gain unauthorized access to digital systems for purposes of misappropriating assets or sensitive information, corrupting data, or causing operational disruption. Phishing and other types of attempts to obtain unauthorized information or access are often sophisticated and difficult to detect or defeat.
A cybersecurity incident, including deliberate attacks and unintentional events, may lead to a material disruption of our core business systems, the loss or corruption of confidential business information, and/or the disclosure of personal data that in each case could result in an adverse business impact as well as possible damage to our brand. This could also lead to a public disclosure or theft of private intellectual property and a possible loss of customer confidence.
While we have experienced and expect to continue to experience these types of threats and incidents, there have been no material incidents incurred to-date at the Company. If our core business operations, or that of one of our third-party service providers, were to be breached, this could affect the confidentiality, integrity, and availability of our systems and data. Any failure on the part of us or our third-party service providers to maintain the security of data we are required to protect, including
14
via the penetration of our network security and the misappropriation of confidential and proprietary information, could result in business disruption, damage to our reputation, financial obligations to third parties, fines, penalties, regulatory proceedings, and private litigation with potentially large costs, and also result in deterioration in our suppliers’, distributors’, and customers’ confidence in us and other competitive disadvantages, and therefore could have a material adverse effect on our business, financial condition, and results of operations. While we continue to perform security due diligence, there is always the possibility of a significant breach.
Our products that are deployed in customer environments also have the possibility of being breached, which could result in damage to a customer’s confidentiality, integrity, and availability of the customer’s data and systems. It is possible that such a breach could result in delays in, or loss of market acceptance of, our products and services; diversion of our resources; injury to our reputation; increased service and warranty expenses; and payment of damages. To date, we have had no material incidents related to the security on our products. Although we maintain insurance related to cybersecurity risks, there can be no assurance that our insurance coverage will cover the particular cyber incident at issue or that such coverage will be sufficient.
We may incur liabilities as a result of product failures due to actual or apparent design or manufacturing defects. We may be subject to product liability claims, which could include claims for property or economic damages or personal injury, in the event damages arise from our products as a result of actual or apparent design or manufacturing defects. Such design or manufacturing defects may occur not only in our own designed products, but also in components provided by third-party suppliers. We generally have insurance protection against property damage and personal injury liabilities and seek to limit such risk through product design, manufacturing quality control processes, product testing and contractual indemnification from suppliers. However, due to the growing size of the Company’s installed product base and growing number of applications in which our products can be used, an actual or alleged design or manufacturing defect could result in product recalls, customer service costs or legal costs that could have material adverse effects on our financial results.
Defects or errors in the Company’s software products could harm our reputation, result in significant cost to us, and impair our ability to market such products. Our software may contain undetected errors, defects, or bugs. Although we have not suffered significant harm from any errors, defects, or bugs to date, we may discover significant errors, defects, or bugs in the future that we may not be able to correct or correct in a timely manner. Any future errors, defects, or bugs found in our software products and related services may result in delays in, or loss of market acceptance of, our products and services; diversion of resources; injury to reputation; increased service and warranty expenses; and payment of damages.
We depend on the ongoing services of our senior management and the ability to attract and retain key personnel. The future success of the Company is substantially dependent on the continued services and contributions of senior management and other key personnel. The ability to attract, retain, and motivate highly skilled employees is important to our long-term success. Competition for skill sets in certain functions within our industry is intense and we may be unable to retain key employees or attract, assimilate, or retain other highly qualified employees in the future. Any disruption in the services of senior management or our ability to attract and retain key personnel may have a material adverse effect on our business and results of operations.
A natural disaster, widespread public health issue or man-made disaster may cause supply disruptions that could adversely affect our business and results of operations. Natural disasters or widespread public health issues may occur in the future and the Company is not able to predict to what extent or duration any such disruptions will have on our ability to maintain ordinary business operations. The Company’s operations and facilities are subject to catastrophic loss due to fire, flood, terrorism, or other natural or man-made disasters. If any of our facilities were to experience a catastrophic loss, it could disrupt our operations, delay production, shipments and revenue, and result in large expenses to repair or replace the facility. Following an interruption to our business, the Company could require substantial recovery time, experience significant expenditures to resume operations, and lose significant sales. If such a disruption were to occur, we could breach agreements, our reputation could be harmed, and our business and operating results could be adversely affected. The consequences of a natural disaster may have a material adverse effect on our business and results of operations.
Zebra could be adversely impacted by the United Kingdom’s withdrawal from the European Union. Zebra maintains its European regional headquarters and a label converting facility in the U.K. and has significant operations and sales throughout Europe. On January 31, 2020, the U.K. formally withdrew from the E.U. After withdrawal, the U.K. and E.U. entered into a transition period that is due to end on December 31, 2020. During this transition period, the U.K. will negotiate the terms of its future relationship with the E.U. Since the U.K.’s referendum in June 2016 to withdraw from the E.U., markets have been more volatile, including fluctuations in the British pound, that could adversely impact Zebra’s operating costs in the U.K. Such market volatility could also cause customers to alter or delay buying decisions that would adversely impact Zebra’s sales in the U.K. and throughout Europe. Our European business involves cross border transactions between the U.K. and the E.U. The future trade relationship between the U.K. and the E.U. could adversely impact Zebra’s operations in the region by increasing importation requirements or disrupting shipments between the E.U. to the U.K. or vice versa. The terms of the U.K.’s
15
withdrawal from the E.U. and resulting impacts to Zebra’s operations are currently uncertain and could adversely affect the Company’s financial performance.
We are exposed to risks under large, multi-year system and solutions and services contracts that may negatively impact our business. We enter into large, multi-year system and solutions and services contracts with our customers that expose us to risks, including among others: (i) technological risks, especially when contracts involve new technology; (ii) financial risks, including the accuracy of estimates inherent in projecting costs associated with large, long-term contracts and the related impact on operating results; and (iii) cybersecurity risks, especially in managed services contracts with customers that process personal data. Recovery of front-loaded costs incurred on long-term managed services contracts with customers is dependent on the continued viability of such customers. The insolvency of customers could result in a loss of anticipated future revenue attributable to that program or product, which could have an adverse impact on our profitability.
We enter into fixed-price contracts that could subject us to losses in the event we fail to properly estimate our costs. If our initial cost estimates are incorrect, we can lose money on these contracts. Because many of these contracts involve new technologies and applications and require the Company to engage subcontractors and can last multiple years, unforeseen events, such as technological difficulties, fluctuations in the price of raw materials, problems with our subcontractors or suppliers, and other cost overruns, can result in the contract pricing becoming less favorable or even unprofitable to us and have an adverse impact on our financial results. In addition, a significant increase in inflation rates could have an adverse impact on the profitability of longer-term contracts.
We utilize the services of subcontractors to perform under many of our contracts, and the inability of our subcontractors to perform in a timely and compliant manner could negatively impact our performance obligations as the prime contractor. We engage subcontractors on many of our contracts and our use of subcontractors has and may continue to increase as we expand our global solutions and services business. Our subcontractors may further subcontract performance and may supply third-party products and software. We may have disputes with our subcontractors, including disputes regarding the quality and timeliness of work performed by a subcontractor and the functionality, warranty and indemnities of products, software, and services supplied by a subcontractor. We are not always successful in passing along customer requirements to our subcontractors, and thus in some cases may be required to absorb contractual risks from our customers without corresponding back-to-back coverage from our subcontractors. Our subcontractors may not be able to acquire or maintain the quality of the materials, components, subsystems, and services they supply, or secure preferred warranty and indemnity coverage from their suppliers, which might result in greater product returns, service problems, warranty claims and costs, and regulatory compliance issues and could harm our business, financial condition, and results of operations.
We have outsourced portions of certain business operations such as repair, distribution, engineering services, and information technology services and may outsource additional business operations, which limits our control over these business operations and exposes us to additional risk as a result of the actions of our outsource partners. We are not able to directly control certain business operations that we outsource. Our outsource partners may not prioritize our business over that of their other customers and they may not meet our desired level of service, cost reductions, or other metrics. In some cases, our outsource partners’ actions may result in our being found to be in violation of laws or regulations, such as import or export regulations. As many of our outsource partners operate outside of the U.S., our outsourcing activity exposes us to information security vulnerabilities and increases our global risks. In addition, we are exposed to the financial viability of our outsource partners. Once a business activity is outsourced, we may be contractually prohibited from, or may not practically be able to, bring such activity back within the Company or move it to another outsource partner. The actions of our outsource partners could result in reputational damage to us and could negatively impact our financial results. Additionally, transitioning activities between new or existing outsource partners or across different geographies as well as insourcing activities could result in additional cost, time and management attention in order to effectively manage the transition, which could negatively impact our financial results.
Failure of our suppliers, subcontractors, distributors, resellers, and representatives to use acceptable legal or ethical business practices could negatively impact our business. It is our policy to require suppliers, subcontractors, distributors, resellers, and third-party sales representatives (“TPSRs”) to operate in compliance with applicable laws, rules, and regulations, including those regarding working conditions, employment practices, environmental compliance, anti-corruption, and trademark and copyright licensing. However, we do not control their labor and other business practices. If one of our suppliers, subcontractors, distributors, resellers, or TPSRs violates labor or other laws or implements labor or other business practices that are regarded as unethical, the shipment of finished products to us could be interrupted, orders could be canceled, relationships could be terminated, and our reputation could be damaged. If one of our suppliers or subcontractors fails to procure necessary license rights to trademarks, copyrights, or patents, legal action could be taken against us that could impact the salability of the Company’s products and expose us to financial obligations to a third-party. Any of these events could have a negative impact on our sales and results of operations.
16
We rely on third-party dealers, distributors, and resellers to sell many of our products, and their failure to effectively bring our products to market may negatively affect our results of operation and financial results. In addition to our own sales force, we offer our products through a variety of third-party dealers, distributors, and resellers who may also market other products that compete with our products. Failure of one or more of our third-party dealers, distributors, or resellers to effectively promote our products could affect our ability to bring products to market and have a negative impact on our results of operations. Any changes to our channel program may cause some of our third-party dealers, distributors, or resellers to exit the program due to modifications to the program structure, which may reduce our ability to bring products to market and could have a negative impact on our results of operations.
Some of these third-parties are smaller and more likely to be impacted by a significant decrease in available credit that could result from a weakness in the financial markets. If credit pressures or other financial difficulties result in insolvency for third-party dealers, distributors, or resellers and we are unable to successfully transition end-customers to purchase our products from other third-parties or from us directly, it may cause, and in some cases, has caused, a negative impact on our financial results.
Final assembly of certain of our products is performed by third-party electronics manufacturers. We may be dependent on these third-party electronics manufacturers as a sole-source of supply for the manufacture of such products. A failure by such manufacturers to provide manufacturing services to us as we require, or any disruption in such manufacturing services up to and including a catastrophic shut-down, may adversely affect our business results. Because we rely on these third-party electronics manufacturers to manufacture our products, we may incur increased business continuity risks. We are not able to exercise direct control over the assembly or related operations of certain of our products. If these third-party manufacturers experience business difficulties or fail to meet our manufacturing needs, then we may be unable to satisfy customer product demands, lose sales, and be unable to maintain customer relationships. Longer production lead times may result in shortages of certain products and inadequate inventories during periods of unanticipated higher demand. Without such third parties continuing to manufacture our products, we may have no other means of final assembly of certain of our products until we are able to secure the manufacturing capability at another facility or develop an alternative manufacturing facility. This transition could be costly and time consuming. From time to time we may diversify our product sourcing footprint, similar to the actions we are currently taking with our efforts to reduce our reliance on Chinese-based manufacturing, which may result in additional costs.
Our future operating results depend on our ability to purchase a sufficient amount of materials, parts, and components, as well as services and software to meet the demands of customers. We source some of our components from sole source suppliers. Any disruption to our suppliers or significant increase in the price of supplies could have a negative impact on our results of operations. Our ability to meet customers’ demands depends, in part, on our ability to obtain in a timely manner an adequate delivery of quality materials, parts, and components, as well as services and software from our suppliers. In addition, certain supplies are available only from a single source or limited sources and we may not be able to diversify sources in a timely manner. If demand for our products or services increases from our current expectations or if suppliers are unable or unwilling to meet our demand for other reasons, including as a result of natural disasters, public health issues, severe weather conditions, or financial issues, we could experience an interruption in supplies or a significant increase in the price of supplies that could have a negative impact on our business. We have experienced shortages in the past that have negatively impacted our results of operations and may experience such shortages in the future. Credit constraints at our suppliers could cause us to accelerate payment of accounts payable by us, impacting our cash flow.
In addition, our current contracts with certain suppliers may be canceled or not extended by such suppliers and, therefore, not afford us with sufficient protection against a reduction or interruption in supplies. Moreover, in the event any of these suppliers breach their contracts with us, our legal remedies associated with such a breach may be insufficient to compensate us for any damages it may suffer.
Financial and Market Risks
The impact of changes in customs duties and trade policies in the United States and corresponding actions by other countries in which the Company does business could adversely affect our financial performance. The U.S. government has imposed customs duties on various imports from China that are intended to address trade imbalances. These actions will result in increased customs duties and will likely result in the renegotiation of some U.S. trade agreements. In response to such actions, China has instituted customs duties on certain U.S. goods. Other governments could also institute customs duties on U.S. goods similar to China’s actions in response to the U.S. government’s customs duties. The Company currently imports a significant percentage of our products into the U.S. and China, and an increase in customs duties with respect to these imports could negatively impact the Company’s financial performance. The Company commenced efforts to diversify its product sourcing footprint in order to reduce its reliance on Chinese-based manufacturing and mitigate the impacts of related customs duties. Failure to effectively manage transition activities associated with product sourcing diversification may negatively impact our results of operations and financial performance. Such customs duties also may cause the U.S.’ trading partners, other than
17
China, to take actions with respect to U.S. imports or U.S. investment activities in their respective countries. Any potential changes in trade policies in the U.S. and the potential corresponding actions by other countries in which the Company does business could adversely affect the Company’s financial performance.
Taxing authority challenges may lead to tax payments exceeding current reserves. We are subject to, and may become subject to, ongoing tax examinations in various jurisdictions. As a result, we may record incremental tax expense based on expected outcomes of such matters. In addition, we may adjust previously reported tax reserves based on expected results of these examinations. Such adjustments could result in an increase or decrease to the Company’s effective tax rate and cash flows. Future changes in tax law in various jurisdictions around the world and income tax holidays could have a material impact on our effective tax rate, foreign rate differential, future income tax expense, and cash flows.
Forecasting our estimated annual effective tax rate is complex and subject to uncertainty, and there may be material differences between our forecasted and actual tax rates. Forecasts of our income tax position and effective tax rate are complex, subject to uncertainty and periodic updates because our income tax position for each year combines the effects of a mix of profits earned and losses incurred by us in various tax jurisdictions with a broad range of income tax rates, as well as changes in the valuation of deferred tax assets and liabilities, the impact of various accounting rules and changes to these rules, the results of examinations by various tax authorities, and the impact of any acquisition, business combination, disposition or other reorganization, or financing transaction.
As a multinational corporation, we conduct our business in many countries and are subject to taxation in many jurisdictions. The taxation of our business is subject to the application of multiple, and sometimes conflicting, tax laws and regulations, as well as multinational tax conventions. Many countries have recently adopted, or are considering the adoption of, revisions to their respective tax laws based on the on-going reports issued by the Organization for Economic Co-operation and Development (“OECD”)/G20 Base Erosion and Profit Shifting (“BEPS”) Project, which could materially impact our tax liability due to our organizational structure and significant operations outside of the U.S. Our effective tax rate is highly dependent upon the geographic distribution of our worldwide earnings or losses resulting from our structure and operating model, the tax regulations and tax holidays in each geographic region, and the availability of tax credits and carry-forwards. The application of tax laws and regulations is subject to legal and factual interpretation, judgment, and uncertainty. Tax laws themselves are subject to change as a result of changes in fiscal policy, changes in legislation, and the evolution of regulations and court rulings. Consequently, taxing authorities may impose tax assessments or judgments against us that could materially impact our tax liability and/or our effective income tax rate.
Economic conditions and financial market disruptions may adversely affect our business and results of operations. Adverse economic conditions or reduced information technology spending may negatively impact our business. General disruption of financial markets and a related general economic downturn could adversely affect our business and financial condition through a reduction in demand for our products by our customers. If a slowdown were severe enough, it could require further impairment testing and write-downs of goodwill and other intangible assets. Cost reduction actions may be necessary and might lead to restructuring charges. A tightening of financial credit could adversely affect our customers, suppliers, outsourced manufacturers, and channel partners (e.g., distributors and resellers) from obtaining adequate credit for the financing of significant purchases. An economic downturn could also result in a decrease in or cancellation of orders for our products and services; negatively impacting the ability to collect accounts receivable on a timely basis; result in additional reserves for uncollectible accounts receivable; and require additional reserves for inventory obsolescence. Higher volatility and fluctuations in foreign exchange rates for the U.S. Dollar against currencies such as the Euro, the British Pound, the Chinese Yuan, and the Brazilian Real could negatively impact product sales, margins, and cash flows.
It is important that we are able to obtain many different types of insurance, and if we are not able to obtain insurance or exhaust our coverage, we may be forced to retain the risk. We have many types of insurance coverage and are also self-insured for some risks and obligations. While the cost and availability of most insurance is stable, there are still certain types and levels of insurance that remain difficult to obtain, such as professional liability insurance, which is expensive to obtain for the amount of coverage often requested by certain customers. As we grow our global solutions and services business, we are being asked to obtain higher amounts of professional liability insurance, which could result in higher costs to do business. Natural disasters and certain risks arising from securities claims, professional liability, and public liability are potential self-insured events that could negatively impact our financial results. In addition, while we maintain insurance for certain risks, the amount of our insurance coverage may not be adequate to cover all claims or liabilities, and we may be forced to bear substantial costs from an accident, incident, or claim.
Our indebtedness could adversely affect our business. As of December 31, 2019, we had $1.3 billion of outstanding debt, gross of unamortized discounts and debt issuance costs. Our indebtedness could have important consequences, including the following:
18
• | We may experience difficulty in satisfying our obligations with respect to our existing indebtedness or future indebtedness; |
• | Our ability to obtain additional financing for working capital, capital expenditures, acquisitions, or general corporate purposes may be impaired; |
• | We plan to use a substantial portion of cash flow from operations to pay interest and principal on our indebtedness, which may reduce the funds available for other purposes, such as acquisitions and capital expenditures; |
• | We may be at a competitive disadvantage with reduced flexibility in planning for, or responding to, changing conditions in the industry, including increased competition; and |
• | We may be more vulnerable to economic downturns and adverse developments in the business. |
We expect to fund our expenses and to pay the principal and interest on our indebtedness from cash flow from operations. Our ability to meet our expenses and to pay principal and interest on our indebtedness when due depends on our future performance and ability to collect cash from our customers, which will be affected by financial, business, economic, and other factors. We will not be able to control many of these factors, such as economic conditions in the markets where we operate and pressure from competitors.
If our business does not generate sufficient cash flows from operations or if future borrowings are not available to us in an amount sufficient to enable us to pay our indebtedness or to fund our other liquidity needs, we may need to refinance all or a portion of our indebtedness on or before the maturity thereof, sell assets, reduce or delay capital investments, or seek to raise additional capital, any of which could have a material adverse effect on our operations. In addition, we may not be able to effect any of these actions, if necessary, on commercially reasonable terms or at all. Our ability to restructure or refinance our indebtedness will depend on the condition of the capital and debt markets and our financial condition at such time. Any refinancing of our indebtedness could be at higher interest rates and may require us to comply with more onerous covenants, which could further restrict business operations. The terms of anticipated or future debt instruments may limit or prevent us from taking any of these actions. In addition, any failure to make scheduled payments of interest and/or principal on outstanding indebtedness would likely result in a reduction of our credit rating, which could harm our ability to access additional capital on commercially reasonable terms or at all. Our inability to generate sufficient cash flow to satisfy our debt service obligations, or to refinance or restructure our obligations on commercially reasonable terms or at all, would have an adverse effect, which could be material, on our business, financial condition and results of operations, as well as on our ability to satisfy the obligations in respect of our indebtedness.
Our use of derivative financial instruments to reduce interest rate risk may result in added volatility in our operating results. We do not hold or issue derivative financial instruments for trading purposes. However, we do utilize derivative financial instruments to reduce interest rate risk associated with our indebtedness. To manage variable interest rate risk, we entered into forward interest rate swap agreements, which will effectively convert a portion of our indebtedness into a fixed rate loan. Under generally accepted accounting principles, changes in the fair values of the swap contracts are reflected in our Consolidated Statements of Operations as a component of “Other, net” if not hedged. The associated impact on our quarterly operating results is directly related to changes in prevailing interest rates. If interest rates increase, we would have a non-cash gain on the swaps, and vice versa in the event of a decrease in interest rates. Consequently, these swaps introduce additional volatility to our operating results.
Legal and Regulatory Risks
We could be adversely impacted by changes in accounting standards and subjective assumptions, estimates, and judgments by management related to complex accounting matters. Generally accepted accounting principles and related accounting pronouncements, implementation guidelines, and interpretations with regard to a wide range of matters that are relevant to our businesses, including, but not limited to, revenue recognition, asset impairment, business acquisition purchase price allocations, impairment of goodwill and other intangible assets, inventories, tax matters, and litigation and other contingent liabilities are highly complex and involve many subjective assumptions, estimates, and judgments. Changes in these rules or their interpretation or changes in underlying assumptions, estimates, or judgments could significantly change our reported or expected financial performance or financial condition. New accounting guidance may also require systems and other changes that could increase our operating costs and/or change our financial statements.
Laws and regulations relating to the handling of personal data may result in increased costs, legal claims, or fines against the Company. As part of our operations, the Company collects, uses, stores, and transfers personal data of third parties and employees in and across various jurisdictions. The governing bodies in such jurisdictions have adopted or are considering adopting laws and regulations regarding the collection, use, transfer, storage, and disclosure of personal data obtained from third parties and employees; for example, the General Data Protection Regulation effective May 2018. These laws may result in burdensome or inconsistent requirements affecting the collection, use, storage, transfer, and disclosure of our third-party and employee personal data. Compliance may require changes in services, business practices, or internal systems that result in
19
increased costs, lower revenue, reduced efficiency, or greater difficulty in competing with foreign-based firms. Failure to comply with existing or new rules may result in claims against the Company or significant penalties or orders to stop the alleged noncompliant activity.
The unfavorable outcome of any pending or future litigation, arbitration, or administrative action could have a material adverse effect on our financial condition or results of operations. From time to time we are a party to litigation, arbitration, or administrative actions. Our financial results and reputation could be negatively impacted by unfavorable outcomes to any pending or future litigation or administrative actions, including those related to the Foreign Corrupt Practices Act, the U.K. Bribery Act, or other anti-corruption laws. There can be no assurances as to the favorable outcome of any litigation or administrative proceedings. In addition, it can be very costly to defend litigation or administrative proceedings and these costs could negatively impact our financial results.
We are subject to a wide range of product regulatory and safety, consumer, worker safety, and environmental laws. Our operations and the products we manufacture and/or sell are subject to a wide range of product regulatory and safety, consumer, worker safety, and environmental laws and regulations. Compliance with such existing or future laws and regulations could subject us to future costs or liabilities, impact our production capabilities, constrict our ability to sell, expand or acquire facilities, restrict what products and services we can offer, and generally impact our financial performance. Some of these laws are environmental and relate to the use, disposal, remediation, emission and discharge of, and exposure to hazardous substances. These laws often impose liability and can require parties to fund remedial studies or actions regardless of fault. We continue to incur disposal costs and have ongoing remediation obligations. Environmental laws have tended to become more stringent over time and any new obligations under these laws could have a negative impact on our operations or financial performance.
Laws focused on the energy efficiency of electronic products and accessories; recycling of both electronic products and packaging; reducing or eliminating certain hazardous substances in electronic products; and the transportation of batteries continue to expand significantly. Laws pertaining to accessibility features of electronic products, standardization of connectors and power supplies, the transportation of lithium-ion batteries, and other aspects are also proliferating. There are also demanding and rapidly changing laws around the globe related to issues such as product safety, radio interference, radio frequency radiation exposure, medical related functionality, and consumer and social mandates pertaining to use of wireless or electronic equipment. These laws, and changes to these laws, could have a substantial impact on whether we can offer certain products, solutions, and services, and on what capabilities and characteristics our products or services can or must include.
These laws impact our products and negatively affect our ability to manufacture and sell products competitively. We expect these trends to continue. In addition, we anticipate that we will see increased demand to meet voluntary criteria related to reduction or elimination of certain constituents from products, increasing energy efficiency, and providing additional accessibility.
Item 1B. | Unresolved Staff Comments |
None.
Item 2. | Properties |
Our corporate headquarters are located in Lincolnshire, Illinois; a northern suburb of Chicago. We also operate manufacturing, production and warehousing, administrative, research, and sales facilities in other U.S. and international locations.
As of December 31, 2019, the Company owned three laboratory and warehouse facilities located in the U.S., U.K., and Canada.
As of December 31, 2019, the Company had a total of 121 leased facilities with locations spread globally; 35 of which are located in the U.S. and 86 are located in other countries. See Note 13, Leases in the Notes to Consolidated Financial Statements for further details related to the Company’s lease arrangements.
We generally consider the productive capacity of our facilities to be adequate and sufficient for our requirements. The extent of utilization of each manufacturing facility varies throughout the year.
Item 3. | Legal Proceedings |
See Note 14, Commitments and Contingencies in the Notes to Consolidated Financial Statements.
20
Item 4. | Mine Safety Disclosures |
Not applicable.
21
PART II
Item 5. | Market for Registrant’s Common Equity, Related Stockholder Matters and Issuer Purchases of Equity Securities |
Stock Information
Our Class A Common Stock is traded on the NASDAQ Stock Market, LLC under the symbol “ZBRA”.
As of February 4, 2020, the last reported price for the Company’s Class A Common Stock was $247.87 per share, and there were 112 registered stockholders of record for Zebra’s Class A Common Stock.
Dividend Policy
Since our initial public offering in 1991, we have not declared any cash dividends or distributions on our capital stock. We currently do not anticipate paying any cash dividends in the foreseeable future.
Treasury Shares
The following table sets forth information with respect to repurchases of the Company’s common stock for the three months ended December 31, 2019.
Period | Total Number of Shares Purchased | Average Price Paid per Share | Total Number of Shares Purchased as Part of Publicly Announced Plans or Programs (1) | Approximate Dollar Value of Shares that May Yet Be Purchased Under the Plans or Programs (in millions) (1) | ||||||||||
September 29, 2019 - October 26, 2019 | 136,824 | $ | 196.15 | 136,824 | $ | 953 | ||||||||
October 27, 2019 - November 23, 2019 | — | — | — | 953 | ||||||||||
November 24, 2019 - December 31, 2019 | — | — | — | 953 | ||||||||||
Total | 136,824 | $ | 196.15 | 136,824 | $ | 953 | ||||||||
(1) | On July 30, 2019, the Company announced that its Board of Directors authorized a share repurchase program for up to an aggregate amount of $1 billion of its outstanding shares of common stock. The share repurchase program supersedes the Company’s prior share repurchase program, which was authorized in November 2011 and under which the Company had not repurchased any shares. Repurchases may be effected from time to time through open market purchases, including pursuant to a pre-set trading plan meeting the requirements of Rule 10b5-1(c) of the Securities Exchange Act of 1934. As of December 31, 2019, the remaining amount authorized for repurchases under the program, which does not have a stated expiration date, was approximately $953 million. |
22
Stock Performance Graph
The following graph compares the cumulative total stockholder return, calculated on a dividend-reinvested basis, in Zebra Technologies Corporation Class A Common Stock, the RDG Technology Composite, and the NASDAQ Composite Market Index for the five years ended December 31, 2019. The comparison assumes that $100 was invested in each of the Company’s Class A Common Stock, the RDG Technology Composite and the NASDAQ Composite Market Index as of the market close on December 31, 2014. Note that historic stock price performance is not necessarily indicative of future stock price performance.
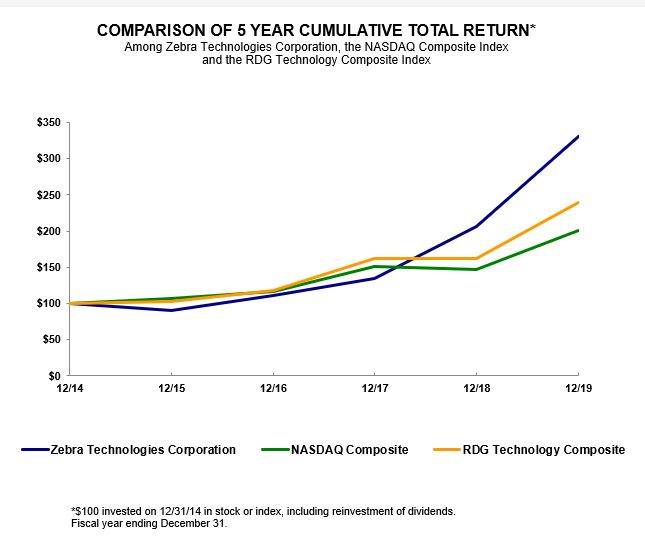
Value at each year-end of $100 initial investment made on December 31, 2014 | ||||||||||||||||||||||||
12/14 | 12/15 | 12/16 | 12/17 | 12/18 | 12/19 | |||||||||||||||||||
Zebra Technologies Corporation | $ | 100.00 | $ | 89.98 | $ | 110.79 | $ | 134.09 | $ | 205.70 | $ | 329.98 | ||||||||||||
RDG Technology Composite | $ | 100.00 | $ | 103.42 | $ | 118.01 | $ | 161.58 | $ | 162.31 | $ | 238.96 | ||||||||||||
NASDAQ Composite | $ | 100.00 | $ | 106.96 | $ | 116.45 | $ | 150.96 | $ | 145.67 | $ | 200.49 | ||||||||||||
23
Item 6. | Selected Financial Data |
FIVE YEAR SUMMARY OF SELECTED CONSOLIDATED FINANCIAL DATA
(In millions, except shares and per share amounts)
Year Ended December 31, | ||||||||||||||||||||
Consolidated Statements of Operations (1) | 2019 | 2018 | 2017 | 2016 | 2015 | |||||||||||||||
Net sales | $ | 4,485 | $ | 4,218 | $ | 3,722 | $ | 3,574 | $ | 3,650 | ||||||||||
Gross profit | 2,100 | 1,981 | 1,710 | 1,642 | 1,644 | |||||||||||||||
Net income (loss) | $ | 544 | $ | 421 | $ | 17 | $ | (137 | ) | $ | (158 | ) | ||||||||
Basic earnings (loss) per share | $ | 10.08 | $ | 7.86 | $ | 0.33 | $ | (2.65 | ) | $ | (3.10 | ) | ||||||||
Diluted earnings (loss) per share | $ | 9.97 | $ | 7.76 | $ | 0.32 | $ | (2.65 | ) | $ | (3.10 | ) | ||||||||
Weighted average shares outstanding: | ||||||||||||||||||||
Basic | 53,991,249 | 53,591,655 | 53,021,761 | 51,579,112 | 50,996,297 | |||||||||||||||
Diluted | 54,594,417 | 54,299,812 | 53,688,832 | 51,579,112 | 50,996,297 | |||||||||||||||
December 31, | ||||||||||||||||||||
Consolidated Balance Sheets (1) | 2019 (2) | 2018 | 2017 | 2016 | 2015 | |||||||||||||||
Cash and cash equivalents | $ | 30 | $ | 44 | $ | 62 | $ | 156 | $ | 192 | ||||||||||
Total Assets | 4,711 | 4,339 | 4,275 | 4,632 | 5,040 | |||||||||||||||
Long-term liabilities | 1,468 | 1,703 | 2,441 | 2,891 | 3,252 | |||||||||||||||
Total Stockholders’ Equity | 1,839 | 1,335 | 834 | 792 | 893 | |||||||||||||||
(1) | Includes the Cortexica, Profitect, Temptime, and Xplore businesses, effective upon their respective dates of acquisition during 2019 and 2018. See Note 5, Business Acquisitions in the Notes to Consolidated Financial Statements for further details related to these acquisitions. |
(2) | Reflects the Company’s adoption of Accounting Standards Codification (“ASC”) Topic 842, Leases (“ASC 842”). See Note 2, Significant Accounting Policies for additional information related to the Company’s adoption of ASC 842. |
24
Item 7. | Management’s Discussion and Analysis of Financial Condition and Results of Operations |
This section generally discusses fiscal 2019 and 2018 items and year-over-year comparisons between 2019 and 2018. Discussions of 2017 items and year-to-year comparisons between 2018 and 2017 are not included herein. Refer to “Management’s Discussion and Analysis of Financial Condition and Results of Operations” in Part II, Item 7 of the Company’s Annual Report on Form 10-K for the fiscal year ended December 31, 2018 for this discussion.
Overview
Zebra Technologies Corporation and its subsidiaries (“Zebra” or the “Company”) is a global leader respected for innovative Enterprise Asset Intelligence (“EAI”) solutions in the automatic identification and data capture solutions industry. We design, manufacture, and sell a broad range of products that capture and move data, including: mobile computers; barcode scanners and imagers; radio frequency identification device (“RFID”) readers; specialty printers for barcode labeling and personal identification; real-time location systems (“RTLS”); related accessories and supplies, such as self-adhesive labels and other consumables; and software utilities and applications. We also provide a full range of services, including maintenance, technical support, and repair, managed and professional services, including cloud-based subscriptions. End-users of our products and services include those in the retail and e-commerce, transportation and logistics, manufacturing, healthcare, hospitality, warehouse and distribution, energy and utilities, government and education enterprises around the world. We provide products and services in approximately 180 countries, with 124 facilities and approximately 8,200 employees worldwide.
Our customers have traditionally benefited from proven solutions that increase productivity and improve efficiency and asset utilization. The Company is poised to drive, and capitalize on, the evolution of the data capture industry into the broader EAI industry, based on important technology trends like the Internet of Things (“IoT”), ubiquitous mobility, automation and cloud computing. EAI solutions offer additional benefits to our customers including real-time, data-driven insights that improve operational visibility and drive workflow optimization.
Segments
The Company’s operations consist of two reportable segments: Asset Intelligence & Tracking (“AIT”) and Enterprise Visibility & Mobility (“EVM”).
The AIT segment is an industry leader in barcode printing and asset tracking technologies. Its major product lines include barcode and card printers, supplies, services, location solutions, and retail solutions. Industries served include retail and e-commerce, transportation and logistics, manufacturing, healthcare, and other end markets within the following regions: North America; Europe, Middle East, and Africa (“EMEA”); Asia-Pacific; and Latin America.
The EVM segment is an industry leader in automatic information and data capture solutions. Its major product lines include mobile computing, data capture, RFID, and services. Industries served include retail and e-commerce, transportation and logistics, manufacturing, healthcare, and other end markets within the following regions: North America; EMEA; Asia-Pacific; and Latin America.
Geographic Information
For the year ended December 31, 2019, the Company generated $4.5 billion of Net sales, of which approximately 50.4% were attributable to North America; approximately 32.6% were attributable to EMEA; and approximately 17.0% were attributable to other foreign locations. Relative Net sales attributable to each region is comparable with the prior year period.
Acquisitions and Integration
Acquisitions are accounted for under the acquisition method of accounting for business combinations, with results included in the Company’s operating results beginning on each respective acquisition date. Recent acquisitions contributed 1.9% to the current year consolidated Net sales growth.
On November 5, 2019, the Company acquired Cortexica Vision Systems Limited (“Cortexica”), a provider of computer vision-based artificial intelligence solutions primarily serving the retail industry, for $7 million in cash. Additionally, we incurred approximately $2 million of acquisition-related costs in 2019, which primarily included third-party transaction and advisory fees and are reflected within Acquisition and integration costs on the Consolidated Statements of Operations. The operating results of Cortexica are included within the EVM segment.
On May 31, 2019, the Company acquired Profitect, Inc. (“Profitect”), a provider of prescriptive analytics primarily serving the retail industry. The Company’s total purchase consideration was $79 million, which consisted of $75 million in cash paid, net of cash acquired, and the fair value of the Company’s existing minority ownership interest in Profitect of $4 million, as
25
remeasured upon acquisition. Included within Other, net on the Consolidated Statements of Operations is a $4 million gain resulting from the remeasurement of the Company’s previously held ownership interest in Profitect. Additionally, we incurred $13 million of acquisition-related costs in 2019, which primarily consisted of payments to settle Profitect employee stock option awards, as well as third party transaction and advisory fees. Those acquisition-related costs are included within Acquisition and integration costs on the Consolidated Statements of Operations. The operating results of Profitect are included within the EVM segment.
On February 21, 2019, the Company acquired Temptime Corporation (“Temptime”), a developer and manufacturer of temperature-monitoring labels and devices. In connection with this acquisition, the Company paid $180 million in cash, net of cash acquired. Additionally, we incurred $3 million of acquisition-related costs in 2019, which primarily included third-party transaction and advisory fees and are reflected within Acquisition and integration costs on the Consolidated Statements of Operations. The operating results of Temptime are included within the AIT segment.
On August 14, 2018, the Company completed its tender offer to acquire all outstanding common stock of Xplore Technologies Corporation (“Xplore”) for $6.00 per share. In connection with this acquisition, the Company paid $87 million in cash, which included $72 million for the net assets acquired, a $9 million payment of Xplore debt, as well as $6 million of other Xplore transaction-related obligations. Additionally, we incurred $8 million of acquisition-related costs in 2018, which primarily included third-party transaction and advisory fees, and $2 million of system integration costs in 2019. These costs are reflected within Acquisition and integration costs on the Consolidated Statements of Operations. The operating results of Xplore are included within the EVM segment.
On October 27, 2014, the Company acquired the Enterprise business from Motorola Solutions, Inc. (“MSI”) and began integration activities focused on creating “One Zebra”. Our integration priorities centered on maintaining business continuity while identifying and implementing cost synergies, operating efficiencies, and integration of functional organizations and processes, in addition to concluding MSI-provided transition service agreements (“TSAs”). During 2017, the Company substantially completed its integration activities associated with the Enterprise acquisition, including the implementation of a common enterprise resource planning system and exiting the TSAs.
Restructuring Programs
In the fourth quarter of 2019, the Company committed to certain organizational changes designed to generate operational efficiencies (collectively referred to as the “2019 Productivity Plan”), which are incremental to the Company’s 2017 exit and restructuring program (the “2017 Productivity Plan”). The organizational design changes under the 2019 Productivity Plan will principally occur within the North America and EMEA regions, relate primarily to employee severance and related benefits, and are expected to be substantially completed in fiscal 2020. Exit and restructuring charges for the 2019 Productivity Plan were $8 million for the year ended December 31, 2019. Estimated remaining costs to be incurred in fiscal 2020 under the 2019 Productivity Plan are expected to be up to $10 million.
The 2017 Productivity Plan, focused on organizational design changes, process improvements, and automation, built upon the exit and restructuring initiatives specific to the October 2014 Enterprise acquisition (the “Acquisition Plan”). The Company substantially completed all initiatives under the 2017 Productivity Plan and the Acquisition Plan in fiscal 2018 and 2017, respectively. Exit and restructuring charges relating to the 2017 Productivity Plan were $2 million, $11 million and $12 million for fiscal 2019, 2018 and 2017, respectively. Exit and restructuring charges relating to the Acquisition Plan were $4 million for fiscal 2017. Cumulative costs associated with the 2017 Productivity Plan and the Acquisition Plan were $25 million and $69 million, respectively, and primarily consisted of severance and related benefits and lease exit costs.
When reviewing the Company’s results, our Chief Operating Decision Maker does not include Exit and restructuring costs in the operating results of our segments; as such, these costs are reported as a component of Corporate.
See Note 9, Exit and Restructuring Costs in the Notes to Consolidated Financial Statements.
Impact of U.S. Tax Reform
Enacted on December 22, 2017, the Tax Cut and Jobs Act (“the Act”) reduced the U.S. federal corporate tax rate from 35% to 21%, requiring companies to pay a one-time transition tax on earnings of certain foreign subsidiaries that were previously tax deferred. Based on current operations, the Company is subject to the Global Intangible Low-Taxed Income, Base Erosion Anti-Avoidance Tax, and the Deduction for Foreign-Derived Intangible Income provisions of the Act, for which we recorded income tax expense of $12 million and $10 million for the years ended December 31, 2019 and 2018, respectively. We are not currently subject to the new limitations which defer U.S. interest deductions in excess of 30% of adjusted taxable income. However, the application of the interest limitation may apply in the future, depending on changes in the Company’s business model. Additionally, the Company is no longer able to deduct performance-based compensation for its covered employees which
26
exceeds the limitation under amended Internal Revenue Code Section 162(m). These impacts are included in the calculation of the Company’s effective tax rate.
During 2017, the Company provisionally recognized an income tax expense of $72 million associated with the Act, comprised of a one-time transition tax of $37 million and $35 million remeasurement of its net U.S. deferred tax assets based on the federal statutory rate of 21%.
During 2018, the Company finalized its analysis of the Act, including the one-time transition tax and measurement of net deferred tax assets, and recorded a $3 million income tax benefit as a result of differences between its final analysis and provisional analysis from the prior year. The final analysis included both federal and state tax effects based on legislative pronouncements through December 31, 2018. The Company also utilized a total of $28 million of available net operating losses, research and development credits, alternative minimum tax credits, and foreign tax credits, in order to substantially reduce its cash payments for the one-time transition tax.
During 2019, there were no retroactive law changes that impacted the 2018 reassessment.
See Note 16, Income Taxes in the Notes to Consolidated Financial Statements for further information.
Other Developments
In 2019, the Company incurred $5 million related to efforts to diversify its product sourcing footprint, to include sourcing products from Taiwan, Vietnam, and Malaysia, thereby reducing its reliance on Chinese-based manufacturing and the impacts of related customs duties (“tariffs”) on U.S. imports from China. These costs are primarily reflected within Operating expense on the Consolidated Statements of Operations. The Company anticipates incurring additional one-time operating costs of up to $25 million by the middle of fiscal year 2020 as well as incremental equipment purchases of approximately $10 million to $15 million. As a result of these actions, along with certain U.S. pricing actions and based on current economic and operating conditions, the Company expects to substantially mitigate the ongoing financial impacts of Chinese tariffs.
In December 2019, a strain of the coronavirus surfaced in Wuhan, China. In January 2020, a broad number of governmental and commercial efforts commenced to contain the spread of the virus in China. As a result, many of our supply chain partners in China temporarily suspended or modified their business operations beyond the normal Chinese Lunar New Year shutdown. As of February 10, 2020, operations have resumed, to varying degrees, at many of our supply chain partners. The situation is complex and rapidly-evolving. We are not yet able to fully ascertain its impact on our results of operations, either with respect to its impact on our manufacturing operations in China or with respect to its impact on our sales to customers in China. Our current expectation is the coronavirus outbreak could have a negative impact to our sales of between $0 and $50 million. This expectation is based solely on facts as we understand them to be today. The impact could be significantly greater if the coronavirus outbreak were to develop in a manner that is significantly worse than our current expectations.
27
Results of Operations: Year Ended 2019 versus 2018 and Year Ended 2018 versus 2017
Consolidated Results of Operations
(amounts in millions, except percentages)
Year Ended December 31, | Percent Change 2019 vs 2018 | Percent Change 2018 vs 2017 | |||||||||||||||
2019 | 2018 | 2017 | |||||||||||||||
Net sales | $ | 4,485 | $ | 4,218 | $ | 3,722 | 6.3 | % | 13.3 | % | |||||||
Gross profit | 2,100 | 1,981 | 1,710 | 6.0 | % | 15.8 | % | ||||||||||
Gross margin | 46.8 | % | 47.0 | % | 45.9 | % | (20) bps | 110 bps | |||||||||
Operating expenses | 1,408 | 1,371 | 1,388 | 2.7 | % | (1.2 | )% | ||||||||||
Operating income | $ | 692 | $ | 610 | $ | 322 | 13.4 | % | 89.4 | % | |||||||
Net sales to customers by geographic region were as follows (amounts in millions, except percentages):
Year Ended December 31, | Percent Change 2019 vs 2018 | Percent Change 2018 vs 2017 | |||||||||||||||
2019 | 2018 | 2017 | |||||||||||||||
North America | $ | 2,261 | $ | 2,041 | $ | 1,798 | 10.8 | % | 13.5 | % | |||||||
EMEA | 1,462 | 1,409 | 1,221 | 3.8 | % | 15.4 | % | ||||||||||
Asia-Pacific | 518 | 520 | 468 | (0.4 | )% | 11.1 | % | ||||||||||
Latin America | 244 | 248 | 235 | (1.6 | )% | 5.5 | % | ||||||||||
Total Net sales | $ | 4,485 | $ | 4,218 | $ | 3,722 | 6.3 | % | 13.3 | % | |||||||
Operating expenses are summarized below (amounts in millions, except percentages):
Year Ended December 31, | As a Percentage of Net sales | |||||||||||||||||||
2019 | 2018 | 2017 | 2019 | 2018 | 2017 | |||||||||||||||
Selling and marketing | $ | 503 | $ | 483 | $ | 448 | 11.2 | % | 11.5 | % | 12.0 | % | ||||||||
Research and development | 447 | 444 | 389 | 10.0 | % | 10.5 | % | 10.5 | % | |||||||||||
General and administrative | 323 | 328 | 301 | 7.2 | % | 7.8 | % | 8.1 | % | |||||||||||
Amortization of intangible assets | 103 | 97 | 184 | NM | NM | NM | ||||||||||||||
Acquisition and integration costs | 22 | 8 | 50 | NM | NM | NM | ||||||||||||||
Exit and restructuring costs | 10 | 11 | 16 | NM | NM | NM | ||||||||||||||
Total Operating expenses | $ | 1,408 | $ | 1,371 | $ | 1,388 | 31.4 | % | 32.5 | % | 37.3 | % | ||||||||
Consolidated Organic Net sales growth:
Year Ended December 31, | |||||
2019 | 2018 | ||||
Reported GAAP Consolidated Net sales growth | 6.3 | % | 13.3 | % | |
Adjustments: | |||||
Impact of foreign currency translations (1) | 1.1 | % | (1.6 | )% | |
Impact of acquisitions (2) | (1.9 | )% | (0.6 | )% | |
Consolidated Organic Net sales growth | 5.5 | % | 11.1 | % | |
Consolidated Organic Net sales growth is a non-GAAP financial measure. See the Non-GAAP Measures section at the end of this item.
(1) | Operating results reported in U.S. Dollars are affected by foreign currency exchange rate fluctuations. Foreign currency translation impact represents the difference in results that are attributable to fluctuations in the currency exchange rates used to convert the results for businesses where the functional currency is not the U.S. Dollar. This impact is calculated by translating the current period results at the currency exchange rates used in the comparable prior year period, inclusive of the Company’s foreign currency hedging program. |
28
(2) | For purposes of computing Organic Net sales, amounts directly attributable to business acquisitions are excluded for twelve months following their respective acquisition dates. |
2019 compared to 2018
Net sales increased $267 million or 6.3% compared with the prior year, reflecting growth in the North America and EMEA regions. Excluding the effects of acquisitions and unfavorable foreign currency changes, the increase in Consolidated Organic Net sales was 5.5%, primarily due to higher sales of mobile computing products and support services, which were partially offset by lower sales of data capture products.
Gross margin decreased to 46.8% in the current period compared to 47.0% in the prior year period. AIT gross margin was slightly lower compared to the prior period, while EVM gross margin was unchanged.
Operating expenses for the years ended December 31, 2019 and 2018 were $1,408 million and $1,371 million, or 31.4% and 32.5% of Net sales, respectively. As a percentage of Net sales, operating costs continue to trend favorably, reflecting continued operating leverage improvement. The current year Operating expenses include higher acquisition-related costs and costs associated with the diversification of the Company’s product sourcing footprint, partially offset by lower incentive-based compensation costs. The prior year Operating expenses included a $13 million legal settlement cost.
Operating income was $692 million for the current year compared to $610 million for the prior year. The increase was primarily due to higher Net sales and Gross profit, which were partially offset by higher Operating expenses.
Total Other expenses, net was $94 million for the current year, compared to $86 million for the prior year. The current year benefited from lower interest expense due to lower outstanding debt levels and lower amortization of debt issuance costs. The current year also included a $19 million loss on interest rate swaps, $7 million of debt refinancing costs as well as $3 million in investment gains. The prior year included $10 million in investment gains, an $8 million gain on interest rate swaps as well as $7 million of debt refinancing costs.
The Company recognized income tax expense of $54 million and $103 million for the years ended December 31, 2019 and 2018, respectively. The Company’s effective tax rates were 9.0% and 19.7% as of December 31, 2019 and 2018, respectively. The decrease in the effective tax rate compared to the prior year was primarily due to favorable changes in uncertain income tax positions.
Results of Operations by Segment
The following commentary should be read in conjunction with the financial results of each operating business segment as detailed in Note 20, Segment Information & Geographic Data in the Notes to Consolidated Financial Statements. To the extent applicable, segment results exclude purchase accounting adjustments, amortization of intangible assets, acquisition and integration costs, impairment of goodwill and other intangibles, exit and restructuring costs, and product sourcing diversification costs.
Asset Intelligence & Tracking Segment (“AIT”)
(amounts in millions, except percentages)
Year Ended December 31, | Percent Change 2019 vs 2018 | Percent Change 2018 vs 2017 | |||||||||||||||
2019 | 2018 | 2017 | |||||||||||||||
Net sales | $ | 1,479 | $ | 1,423 | $ | 1,311 | 3.9 | % | 8.5 | % | |||||||
Gross profit | 736 | 710 | 640 | 3.7 | % | 10.9 | % | ||||||||||
Gross margin | 49.8 | % | 49.9 | % | 48.8 | % | (10) bps | 110 bps | |||||||||
Operating expenses | 381 | 385 | 366 | (1.0 | )% | 5.2 | % | ||||||||||
Operating income | $ | 355 | $ | 325 | $ | 274 | 9.2 | % | 18.6 | % | |||||||
AIT Organic Net sales growth:
29
December 31, | |||||
2019 | 2018 | ||||
AIT Reported GAAP Net sales growth | 3.9 | % | 8.5 | % | |
Adjustments: | |||||
Impact of foreign currency translations(1) | 1.0 | % | (1.5 | )% | |
Impact of acquisition(2) | (2.7 | )% | — | % | |
AIT Organic Net sales growth | 2.2 | % | 7.0 | % | |
AIT Organic Net sales growth is a non-GAAP financial measure. See the Non-GAAP Measures section at the end of this item.
(1) | Operating results reported in U.S. Dollars are affected by foreign currency exchange rate fluctuations. Foreign currency translation impact represents the difference in results that are attributable to fluctuations in the currency exchange rates used to convert the results for businesses where the functional currency is not the U.S. Dollar. This impact is calculated by translating the current period results at the currency exchange rates used in the comparable prior year period, inclusive of the Company’s foreign currency hedging program. |
(2) | For purposes of computing Organic Net sales, amounts directly attributable to the Temptime acquisition are excluded for twelve months following the February 21, 2019 acquisition date. |
2019 compared to 2018
Net sales for AIT increased $56 million or 3.9% compared to the prior year, including the impacts of the Temptime acquisition and unfavorable foreign currency changes. AIT Organic Net Sales growth of 2.2% was primarily due to increases in printing products, support services, and supplies.
Gross margin decreased to 49.8% in the current year compared to 49.9% for the prior year, primarily due to the unfavorable impacts of Chinese import tariffs and foreign currency changes, partially offset by favorable product mix.
Operating income increased 9.2% due to higher Net sales, Gross profit, and lower Operating expenses.
Enterprise Visibility & Mobility Segment (“EVM”)
(amounts in millions, except percentages)
Year Ended December 31, | Percent Change 2019 vs 2018 | Percent Change 2018 vs 2017 | |||||||||||||||
2019 | 2018 | 2017 | |||||||||||||||
Net sales | $ | 3,006 | $ | 2,795 | $ | 2,414 | 7.5 | % | 15.8 | % | |||||||
Gross profit | 1,371 | 1,274 | 1,073 | 7.6 | % | 18.7 | % | ||||||||||
Gross margin | 45.6 | % | 45.6 | % | 44.4 | % | 0 bps | 120 bps | |||||||||
Operating expenses | 888 | 870 | 772 | 2.1 | % | 12.7 | % | ||||||||||
Operating income | $ | 483 | $ | 404 | $ | 301 | 19.6 | % | 34.2 | % | |||||||
EVM Organic Net sales growth:
December 31, | |||||
2019 | 2018 | ||||
EVM Reported GAAP Net sales growth | 7.5 | % | 15.8 | % | |
Adjustments: | |||||
Impact of foreign currency translations (1) | 1.1 | % | (1.6 | )% | |
Impact of acquisitions (2) | (1.4 | )% | (0.8 | )% | |
EVM Organic Net sales growth | 7.2 | % | 13.4 | % | |
EVM Organic Net sales growth is a non-GAAP financial measure. See the Non-GAAP Measures section at the end of this item.
(1) | Operating results reported in U.S. Dollars are affected by foreign currency exchange rate fluctuations. Foreign currency translation impact represents the difference in results that are attributable to fluctuations in the |
30
currency exchange rates used to convert the results for businesses where the functional currency is not the U.S. Dollar. This impact is calculated by translating the current period results at the currency exchange rates used in the comparable prior year period, inclusive of the Company’s foreign currency hedging program.
(2) | For purposes of computing Organic Net sales, amounts directly attributable to the Xplore, Profitect, and Cortexica acquisitions are excluded for twelve months following their respective acquisition dates. |
2019 compared to 2018
Net sales for EVM increased $211 million or 7.5% compared to the prior year, including the impacts of acquisitions and unfavorable foreign currency changes. EVM Organic Net Sales growth of 7.2% was primarily attributable to higher mobile computing product sales and support services, which were partially offset by lower sales of data capture products.
Gross margin was 45.6% in both the current and prior year periods, as the unfavorable impacts of product and business mix, Chinese import tariffs, and foreign currency changes collectively offset operational efficiencies.
Operating income for the current year increased 19.6% due to higher Net sales and Gross profit, which were partially offset by higher Operating expenses.
Critical Accounting Policies and Estimates
Management prepared the consolidated financial statements of the Company under accounting principles generally accepted in the U.S. The application of these principles requires the use of estimates, judgments, and assumptions which affect the amounts reported in our consolidated financial statements. We believe that our estimates, judgments, and assumptions are reasonable based upon available information. Our more significant estimates and assumptions include those related to the recognition and measurement of income tax assets and liabilities, development of reporting unit fair values as part of our annual goodwill impairment testing, and the measurement of variable consideration and allocation of transaction price to performance obligations in revenue transactions. See Note 2, Significant Accounting Policies in the Notes to Consolidated Financial Statements for additional discussion of these as well as other accounting policies.
New Accounting Pronouncements
Effective January 1, 2019, the Company adopted a new accounting standard related to leases. See Note 2, Significant Accounting Policies in the Notes to Consolidated Financial Statements for further information on this and other accounting pronouncements.
Liquidity and Capital Resources
The primary factors that influence our liquidity include the amount and timing of our revenues, cash collections from our customers, cash payments to our suppliers, capital expenditures, repatriation of foreign cash and investments, acquisitions, and share repurchases. Management believes that our existing capital resources, inclusive of available borrowing capacity on debt and other financing facilities, and funds generated from operations are sufficient to meet anticipated capital requirements and service our indebtedness. The following table summarizes our cash flow activities for the years indicated (in millions):
Year Ended December 31, | $ Change 2019 vs 2018 | $ Change 2018 vs 2017 | |||||||||||||||||
2019 | 2018 | 2017 | |||||||||||||||||
Cash flow (used in) provided by: | |||||||||||||||||||
Operating activities | $ | 685 | $ | 785 | $ | 478 | $ | (100 | ) | $ | 307 | ||||||||
Investing activities | (335 | ) | (137 | ) | (51 | ) | (198 | ) | (86 | ) | |||||||||
Financing activities | (365 | ) | (661 | ) | (517 | ) | 296 | (144 | ) | ||||||||||
Effect of exchange rates on cash balances | 1 | (5 | ) | (4 | ) | 6 | (1 | ) | |||||||||||
Net change in cash and cash equivalents | $ | (14 | ) | $ | (18 | ) | $ | (94 | ) | $ | 4 | $ | 76 | ||||||
2019 vs. 2018
The change in our cash and cash equivalents balance during the current year is reflective of the following:
• | Cash flow provided by operating activities decreased by $100 million compared to the prior year. The decrease was primarily due to timing of vendor payments, timing of accounts receivable collections, as well as higher income tax and incentive compensation payments, which were partially offset by higher net income, reduced inventory levels, and lower cash payments for interest. |
• | The increase in net cash used in investing activities was primarily driven by business acquisitions. |
31
• | The decrease in cash used in financing activities was primarily due to lower net debt repayments in the current year, including amounts borrowed to fund acquisitions, partially offset by repurchases of common shares in the current year. |
Company Debt
The following table shows the carrying value of the Company’s debt (in millions):
December 31, | |||||||
2019 | 2018 | ||||||
Term Loan A | $ | 917 | $ | 608 | |||
Term Loan B | — | 445 | |||||
Revolving Credit Facility | 103 | 408 | |||||
Receivables Financing Facilities | 266 | 139 | |||||
Total debt | 1,286 | 1,600 | |||||
Less: Debt issuance costs | (6 | ) | (5 | ) | |||
Less: Unamortized discounts | (3 | ) | (4 | ) | |||
Less: Current portion of debt | (197 | ) | (157 | ) | |||
Total long-term debt | $ | 1,080 | $ | 1,434 | |||
Credit Facilities
The Company’s debt includes borrowings under Term Loan A and a multi-currency Revolving Credit Facility, both maturing in 2024. Borrowings under the facilities bear interest at a variable rate plus an applicable margin, for which the Company has entered into interest rate swap contracts to manage interest rate exposure. All borrowings under the credit facilities as of December 31, 2019 were denominated in U.S. Dollars, except for €92 million in Euro-denominated borrowings under the Revolving Credit Facility. The average interest rates as of December 31, 2019 for Term Loan A and the Revolving Credit Facility were 3.01% and 1.25%, respectively. Interest is paid for each instrument on a monthly basis. The Company is required to prepay certain amounts in the event of certain circumstances or transactions. Also, the Company may make prepayments against Term Loan A, in whole or in part, without premium or penalty.
During the third quarter of 2019, the Company amended the terms of its credit facilities, which included increasing its borrowing under Term Loan A from $608 million to $1 billion and increasing its borrowing capacity under the Revolving Credit Facility from $800 million to $1 billion, while extending the maturities of each of these instruments to August 2024. In conjunction with increasing its borrowing capacity under Term Loan A and the Revolving Credit Facility, the Company made a payment of $445 million to extinguish Term Loan B. This debt refinancing reduces the Company’s future interest cost while meeting anticipated capital requirements.
During the second quarter of 2018, the Company amended the terms of its credit facilities, which included the replacement of existing Term Loan A with a new Term Loan A of $670 million, increasing the borrowing capacity under the Revolving Credit Facility from $500 million to $800 million, and entering into a partial debt extinguishment of $300 million on Term Loan B.
See Note 12, Long-Term Debt in the Notes to Consolidated Financial Statements for further details related to the Company’s credit facilities and refinancing activities.
Receivables Financing Facilities
In December 2017, the Company entered into a Receivables Financing Facility with a financial institution that has a borrowing limit of up to $180 million. As collateral, the Company pledges a perfected first-priority security interest in its domestically originated accounts receivables. In May 2019, the Company entered into an Additional Receivables Financing Facility which allows for additional borrowings of up to $100 million, increasing the Company’s total borrowing capacity to $280 million, using receivables as collateral. Both facilities are accounted for as secured borrowings and bear interest at a variable rate. As of December 31, 2019, the facilities had an average interest rate of 2.60% and the Company’s Consolidated Balance Sheets included $545 million of receivables that were pledged, of which $266 million had been borrowed against. All borrowings under the facilities were denominated in U.S. Dollars. The Receivable Financing Facility will mature on March 29, 2021 and the Additional Receivables Financing Facility will mature on May 18, 2020.
Both the Revolving Credit Facility and Receivables Financing Facilities include terms and conditions that limit the incurrence of additional borrowings and require that certain financial ratios be maintained at designated levels. As of December 31, 2019, the Company was in compliance with all debt covenants.
32
See Note 12, Long-Term Debt in the Notes to Consolidated Financial Statements for further details.
Receivables Factoring
In addition to the Company’s borrowing arrangements described above, the Company has Receivables Factoring arrangements. The first arrangement was entered into in December 2018, and a second arrangement was entered into in September 2019 under similar terms as the first. Under the Receivables Factoring arrangements, the Company sells certain EMEA-originated receivables to banks in exchange for cash without maintaining a beneficial interest in the receivables sold. At any time, the banks’ purchase of eligible receivables is subject to a maximum of $125 million of uncollected receivables. The Company services the receivables on behalf of the banks, but otherwise maintains no significant continuing involvement with respect to the receivables. Transactions under the Receivables Factoring arrangements are accounted for as sales under Accounting Standards Codification Topic 860, Transfers and Servicing of Financial Assets with related cash flows reflected in operating cash flows. $60 million and $33 million of uncollected receivables were sold and removed from the Company’s Consolidated Balance Sheets as of December 31, 2019 and 2018, respectively. The Company may enter into additional Receivables Factoring arrangements in the future in order to provide additional liquidity.
See Note 19, Accounts Receivable Factoring in the Notes to Consolidated Financial Statements for further details.
Share Repurchases
On July 30, 2019, the Company announced that its Board of Directors authorized a share repurchase program for up to an aggregate amount of $1 billion of its outstanding shares of common stock. The new share repurchase program supersedes the Company’s prior share repurchase program, which was authorized in November 2011. The new share repurchase program does not have a stated expiration date. The level of the Company’s repurchases depends on a number of factors, including its financial condition, capital requirements, cash flows, results of operations, future business prospects and other factors management may deem relevant. The timing, volume and nature of repurchases are subject to market conditions, applicable securities laws and other factors and may be amended, suspended or discontinued at any time. Repurchases may be effected from time to time through open market purchases, including pursuant to a pre-set trading plan meeting the requirements of Rule 10b5-1(c) of the Securities Exchange Act of 1934. During the year ended December 31, 2019 the Company repurchased 237,886 shares of common stock for $47 million.
Cash and Cash Equivalents
Included in the Company’s Cash and cash equivalents are amounts held by foreign subsidiaries. The Company had $26 million and $39 million of foreign cash and cash equivalents included in the Company’s total cash positions of $30 million and $44 million as of December 31, 2019 and 2018, respectively.
Contractual Obligations
Zebra’s contractual obligations as of December 31, 2019 were as follows (in millions):
Payments due by period | |||||||||||||||||||
Total | Less than 1 year | 1-3 years | 3-5 years | More than 5 years | |||||||||||||||
Operating lease obligations(1) | $ | 152 | $ | 36 | $ | 54 | $ | 35 | $ | 27 | |||||||||
Deferred compensation liability(2) | 24 | 2 | 1 | 1 | 20 | ||||||||||||||
Debt principal payments | 1,286 | 197 | 155 | 934 | — | ||||||||||||||
Interest payments(3) | 146 | 40 | 69 | 37 | — | ||||||||||||||
Purchase obligations(4) | 365 | 365 | — | — | — | ||||||||||||||
Total | $ | 1,973 | $ | 640 | $ | 279 | $ | 1,007 | $ | 47 | |||||||||
(1) | Includes leases of facilities, distribution centers, and sales and administrative offices that are classified as operating leases. The contractual obligations above include future minimum payments, including payments for those periods where renewal options are reasonably certain to be exercised. |
(2) | Includes payments related to obligations under our deferred compensation plan. The deferred compensation plan allows certain members of management and other highly-compensated employees to defer receipt of a portion of their compensation. The amount in “More than 5 Years” includes the remaining total balance under the deferred compensation plan to be paid to participants who have not terminated employment, since we cannot estimate the timings of those terminations and withdrawals. |
(3) | Includes payments related to interest on the Company’s debt, as well as related settlements of interest rate swap agreements. These payments are estimated based on applicable interest rates and margins along with the balance of |
33
outstanding debt as of December 31, 2019. Future interest payments may increase or decrease based upon fluctuations in market rates and/or the Company’s borrowing levels.
(4) | Purchase obligations are for purchases made in the normal course of business to meet operational requirements, primarily raw materials and finished goods. Purchase obligations included in the table above are based on quarterly forecasted component and manufacturing requirements and typically provide for fulfillment within agreed upon lead-times and/or commercially standard lead-times for products. The Company does not have contractual obligations related to take-or-pay arrangements. |
Uncertain tax benefits of $10 million have been excluded from the table above because we cannot reliably estimate the period of cash settlement, if any, with the respective taxing authorities. See Note 16, Income Taxes in the Notes to Consolidated Financial Statements for further information.
Non-GAAP Measures
The Company has provided reconciliations of the supplemental non-GAAP financial measures, as defined under the rules of the Securities and Exchange Commission, presented herein to the most directly comparable financial measures calculated and presented in accordance with GAAP.
These supplemental non-GAAP financial measures – Consolidated Organic Net sales growth, AIT Organic Net sales growth, and EVM Organic Net sales growth – are presented because our management evaluates our financial results both including and excluding the effects of business acquisitions and foreign currency translation, as applicable. Management believes that the supplemental non-GAAP financial measures presented provide additional perspective and insights when analyzing the core operating performance of our business from period to period and trends in our historical operating results. These supplemental non-GAAP financial measures should not be considered superior to, as a substitute for, or as an alternative to, and should be considered in conjunction with the GAAP financial measures presented.
34
Item 7A. | Quantitative and Qualitative Disclosures About Market Risk |
Market risk is the sensitivity of income to changes in interest rates, commodity prices, and foreign currency changes. Zebra is primarily exposed to the following types of market risk: interest rates and foreign currency.
Interest Rate Risk
We are exposed to interest rate volatility with regard to existing debt issuances. Primary exposures include the London Inter-bank Offered Rate (“LIBOR”). From time to time, we use interest rate derivative contracts, including interest rate swaps, to mitigate our exposure from interest rate changes on existing debt and future debt issuances, thereby reducing the volatility of our financing costs and, based on current and projected market conditions, achieve a desired proportion of fixed versus floating-rate debt. Generally, under these swaps, we agree with a counterparty to exchange floating-rate for fixed-rate interest amounts with an agreed upon notional amount.
The United Kingdom’s Financial Conduct Authority, which regulates LIBOR, announced in 2017 that it intends to phase out LIBOR by the end of 2021. Some of the Company’s contracts with respect to its borrowings and interest rate swap contracts already contain comparable alternative reference rates that would automatically take effect upon the phasing out of LIBOR. For certain other contracts that do not already contain sufficient alternative reference rate provisions, the Company anticipates negotiating comparable replacement reference rates with its counterparties.
As of December 31, 2019, we had approximately $1.3 billion of debt outstanding under our debt facilities, which bears interest determined by reference to a variable rate index. A one percentage point increase or decrease in interest rates would increase or decrease annual interest expense by approximately $5 million. This exposure includes the impact of associated forward interest rate swaps outstanding as of December 31, 2019. Refer to Note 11, Derivative Instruments in the Notes to Consolidated Financial Statements for further discussion of these risk mitigation activities. Exposure to variable interest may increase or decrease, to the extent that the Company’s borrowings under its Revolving Credit Facility or Receivables Financing Facilities increase or decrease, respectively.
Foreign Exchange Risk
We provide products and services in approximately 180 countries throughout the world and, therefore, at times are exposed to risk based on movements in foreign exchange rates. On occasion, we invoice customers in their local currency and have a resulting foreign currency denominated revenue transaction and accounts receivable. We also purchase certain raw materials and other items in foreign currencies. We manage these risks using derivative financial instruments. See Note 11, Derivative Instruments in the Notes to Consolidated Financial Statements for further discussions of hedging activities.
We are exposed to fluctuations in foreign currency exchange rates, primarily with respect to the Euro, British Pound Sterling, Czech Koruna, Brazilian Real and Chinese Yuan. A one percentage point increase or decrease in exchange rates relative to the U.S. Dollar would increase or decrease our pre-tax income by approximately $1 million. This amount is inclusive of the impact of associated derivative contracts. We enter into foreign currency forward contracts to hedge against the effect of exchange rate fluctuations on the Consolidated Balance Sheets of certain entities with exposures denominated in foreign currencies. These transactions are typically one month in maturity and are not designated as hedges.
35
Item 8. | Financial Statements and Supplementary Data |
INDEX TO CONSOLIDATED FINANCIAL STATEMENTS
Page | |
Financial Statements | |
36
Report of Independent Registered Public Accounting Firm
To the Shareholders and the Board of Directors of Zebra Technologies Corporation
Opinion on the Financial Statements
We have audited the accompanying consolidated balance sheets of Zebra Technologies Corporation and subsidiaries (the “Company”) as of December 31, 2019 and 2018, the related consolidated statements of operations, comprehensive income, stockholders’ equity, and cash flows for each of the three years in the period ended December 31, 2019, and the related notes and financial statement schedule listed in the Index at Item 15 (collectively referred to as the “consolidated financial statements”). In our opinion, the consolidated financial statements present fairly, in all material respects, the financial position of the Company at December 31, 2019 and 2018, and the results of its operations and its cash flows for each of the three years in the period ended December 31, 2019, in conformity with U.S. generally accepted accounting principles.
We also have audited, in accordance with the standards of the Public Company Accounting Oversight Board (United States) (PCAOB), the Company's internal control over financial reporting as of December 31, 2019, based on criteria established in Internal Control-Integrated Framework issued by the Committee of Sponsoring Organizations of the Treadway Commission (2013 framework) and our report dated February 13, 2020 expressed an unqualified opinion thereon.
Basis for Opinion
These financial statements are the responsibility of the Company’s management. Our responsibility is to express an opinion on the Company’s financial statements based on our audits. We are a public accounting firm registered with the PCAOB and are required to be independent with respect to the Company in accordance with the U.S. federal securities laws and the applicable rules and regulations of the Securities and Exchange Commission and the PCAOB.
We conducted our audits in accordance with the standards of the PCAOB. Those standards require that we plan and perform the audit to obtain reasonable assurance about whether the financial statements are free of material misstatement, whether due to error or fraud. Our audits included performing procedures to assess the risks of material misstatement of the financial statements, whether due to error or fraud, and performing procedures that respond to those risks. Such procedures included examining, on a test basis, evidence regarding the amounts and disclosures in the financial statements. Our audits also included evaluating the accounting principles used and significant estimates made by management, as well as evaluating the overall presentation of the financial statements. We believe that our audits provide a reasonable basis for our opinion.
Critical Audit Matters
The critical audit matter communicated below is a matter arising from the current period audit of the financial statements that was communicated or required to be communicated to the audit committee that: (1) relates to accounts or disclosures that are material to the financial statements and (2) involved our especially challenging, subjective, or complex judgments. The communication of the critical audit matter does not alter in any way our opinion on the consolidated financial statements, taken as a whole, and we are not, by communicating the critical audit matter below, providing a separate opinion on the critical audit matter or on the accounts or disclosures to which it relates.
Accounting for Income Taxes
Description of the Matter | As discussed in Note 16 of the financial statements, the Company earns a significant amount of its operating income across multiple jurisdictions and the Company’s organizational structure and transactional flows are designed to reflect strategic and operational business imperatives that change over time. As the Company operates in a multinational tax environment and incurs income tax obligations in a number of jurisdictions, complexities and uncertainties can arise in the application of complex tax regulations to the Company’s multinational operations. Auditing the application of taxation legislation to the Company’s affairs is inherently complex, highly specialized and requires judgment. These factors impact the Company’s estimation of tax exposures, valuation allowances and income tax provisions. |
37
How We Addressed the Matter in Our Audit | We obtained an understanding, evaluated the design and tested the operating effectiveness of controls over the Company’s identification of and accounting for the tax impact of changes in the business or significant changes in tax laws. This included controls over the Company’s evaluation of tax law changes, the evaluation of cross-jurisdictional transactions and the Company’s tax technical assessment over those changes and/or transactions. We involved our tax professionals in the Company’s major operating jurisdictions to assist in the evaluation of the Company’s tax obligations. We evaluated the Company’s transactional flows to assess whether they aligned with the Company’s strategic and operational shifts. We made inquiries of management and inspected internally - and externally-prepared documentation to understand current disputes and uncertain tax positions. We assessed the completeness of the tax matters identified and evaluated the Company’s assessment regarding the related status, potential exposure and risk of loss. We assessed the consistency of assumptions used in estimating provisions for key tax exposures and evaluated the adequacy of the Company’s disclosures of tax and ongoing tax matters. |
/s/ Ernst & Young LLP
We have served as the Company’s auditor since 2005.
Chicago, Illinois
February 13, 2020
38
ZEBRA TECHNOLOGIES CORPORATION AND SUBSIDIARIES
CONSOLIDATED BALANCE SHEETS
(In millions, except share data)
December 31, | |||||||
2019 | 2018 | ||||||
Assets | |||||||
Current assets: | |||||||
Cash and cash equivalents | $ | $ | |||||
Accounts receivable, net of allowances for doubtful accounts of $2 million and $3 million as of December 31, 2019 and 2018, respectively | |||||||
Inventories, net | |||||||
Income tax receivable | |||||||
Prepaid expenses and other current assets | |||||||
Total Current assets | |||||||
Property, plant and equipment, net | |||||||
Right-of-use lease asset | — | ||||||
Goodwill | |||||||
Other intangibles, net | |||||||
Deferred income taxes | |||||||
Other long-term assets | |||||||
Total Assets | $ | $ | |||||
Liabilities and Stockholders' Equity | |||||||
Current liabilities: | |||||||
Current portion of long-term debt | $ | $ | |||||
Accounts payable | |||||||
Accrued liabilities | |||||||
Deferred revenue | |||||||
Income taxes payable | |||||||
Total Current liabilities | |||||||
Long-term debt | |||||||
Long-term lease liabilities | — | ||||||
Deferred income taxes | |||||||
Long-term deferred revenue | |||||||
Other long-term liabilities | |||||||
Total Liabilities | |||||||
Stockholders’ Equity: | |||||||
Preferred stock, $.01 par value; authorized 10,000,000 shares; none issued | |||||||
Class A common stock, $.01 par value; authorized 150,000,0000 shares; issued 72,151,857 shares | |||||||
Additional paid-in capital | |||||||
Treasury stock at cost, 18,148,925 and 18,280,673 shares as of December 31, 2019 and 2018, respectively | ( | ) | ( | ) | |||
Retained earnings | |||||||
Accumulated other comprehensive loss | ( | ) | ( | ) | |||
Total Stockholders’ Equity | |||||||
Total Liabilities and Stockholders’ Equity | $ | $ | |||||
See accompanying Notes to Consolidated Financial Statements.
39
ZEBRA TECHNOLOGIES CORPORATION AND SUBSIDIARIES
CONSOLIDATED STATEMENTS OF OPERATIONS
(In millions, except share data)
Year Ended December 31, | |||||||||||
2019 | 2018 | 2017 | |||||||||
Net sales | |||||||||||
Tangible products | $ | $ | $ | ||||||||
Services and software | |||||||||||
Total Net sales | |||||||||||
Cost of sales: | |||||||||||
Tangible products | |||||||||||
Services and software | |||||||||||
Total Cost of sales | |||||||||||
Gross profit | |||||||||||
Operating expenses: | |||||||||||
Selling and marketing | |||||||||||
Research and development | |||||||||||
General and administrative | |||||||||||
Amortization of intangible assets | |||||||||||
Acquisition and integration costs | |||||||||||
Exit and restructuring costs | |||||||||||
Total Operating expenses | |||||||||||
Operating income | |||||||||||
Other expenses: | |||||||||||
Foreign exchange loss | ( | ) | ( | ) | ( | ) | |||||
Interest expense, net | ( | ) | ( | ) | ( | ) | |||||
Other, net | ( | ) | |||||||||
Total Other expenses, net | ( | ) | ( | ) | ( | ) | |||||
Income before income tax | |||||||||||
Income tax expense | |||||||||||
Net income | $ | $ | $ | ||||||||
Basic earnings per share | $ | $ | $ | ||||||||
Diluted earnings per share | $ | $ | $ | ||||||||
See accompanying Notes to Consolidated Financial Statements.
40
ZEBRA TECHNOLOGIES CORPORATION AND SUBSIDIARIES
CONSOLIDATED STATEMENTS OF COMPREHENSIVE INCOME
(In millions)
Year Ended December 31, | |||||||||||
2019 | 2018 | 2017 | |||||||||
Net income | $ | $ | $ | ||||||||
Other comprehensive income (loss), net of tax: | |||||||||||
Changes in unrealized gains and losses on anticipated sales hedging transactions | ( | ) | ( | ) | |||||||
Changes in unrealized gains and losses on forward interest rate swap hedging transactions | |||||||||||
Foreign currency translation adjustment | ( | ) | |||||||||
Comprehensive income | $ | $ | $ | ||||||||
See accompanying Notes to Consolidated Financial Statements.
41
ZEBRA TECHNOLOGIES CORPORATION AND SUBSIDIARIES
CONSOLIDATED STATEMENTS OF STOCKHOLDERS’ EQUITY
(In millions, except share data)
Class A Common Stock Shares | Class A Common Stock Amount | Additional Paid-in Capital | Treasury Stock | Retained Earnings | Accumulated Other Comprehensive Loss | Total | |||||||||||||||||||||
Balance at December 31, 2016 | $ | $ | $ | ( | ) | $ | $ | ( | ) | $ | |||||||||||||||||
Cumulative effect of change in accounting principle | — | — | — | ( | ) | — | |||||||||||||||||||||
Issuance of treasury shares upon exercise of stock options, purchases under stock purchase plan and grants of restricted stock awards, net of cancellations | — | — | — | — | |||||||||||||||||||||||
Shares withheld related to net share settlement | ( | ) | — | — | ( | ) | — | — | ( | ) | |||||||||||||||||
Share-based compensation | — | — | — | — | — | ||||||||||||||||||||||
Net income | — | — | — | — | — | ||||||||||||||||||||||
Changes in unrealized gains and losses on anticipated sales hedging transactions (net of income taxes) | — | — | — | — | — | ( | ) | ( | ) | ||||||||||||||||||
Changes in unrealized gains and losses on forward interest rate swap hedging transactions (net of income taxes) | — | — | — | — | — | ||||||||||||||||||||||
Foreign currency translation adjustment | — | — | — | — | — | ||||||||||||||||||||||
Balance at December 31, 2017 | $ | $ | $ | ( | ) | $ | $ | ( | ) | $ | |||||||||||||||||
Cumulative effect of change in accounting principle | — | — | — | — | — | ||||||||||||||||||||||
Issuance of treasury shares upon exercise of stock options, purchases under stock purchase plan and grants of restricted stock awards, net of cancellations | — | ( | ) | — | — | ||||||||||||||||||||||
Shares withheld related to net share settlement | ( | ) | — | — | ( | ) | — | — | ( | ) | |||||||||||||||||
Share-based compensation | — | — | — | — | — | ||||||||||||||||||||||
Net income | — | — | — | — | — | ||||||||||||||||||||||
Changes in unrealized gains and losses on anticipated sales hedging transactions (net of income taxes) | — | — | — | — | |||||||||||||||||||||||
Changes in unrealized gains and losses on forward interest rate swap hedging transactions (net of income taxes) | — | — | — | — | — | ||||||||||||||||||||||
Foreign currency translation adjustment | — | — | — | — | — | ( | ) | ( | ) | ||||||||||||||||||
Balance at December 31, 2018 | $ | $ | $ | ( | ) | $ | $ | ( | ) | $ | |||||||||||||||||
Issuance of treasury shares upon exercise of stock options, purchases under stock purchase plan and grants of restricted stock awards, net of cancellations | — | ( | ) | — | — | ||||||||||||||||||||||
Shares withheld related to net share settlement | ( | ) | — | — | ( | ) | — | — | ( | ) | |||||||||||||||||
Share-based compensation | — | — | — | — | — | ||||||||||||||||||||||
Repurchase of common stock | ( | ) | — | — | ( | ) | — | — | ( | ) | |||||||||||||||||
Net income | — | — | — | — | — | ||||||||||||||||||||||
Changes in unrealized gains and losses on anticipated sales hedging transactions (net of income taxes) | — | — | — | — | — | ( | ) | ( | ) | ||||||||||||||||||
Foreign currency translation adjustment | — | — | — | — | — | ||||||||||||||||||||||
Balance at December 31, 2019 | $ | $ | $ | ( | ) | $ | $ | ( | ) | $ | |||||||||||||||||
See accompanying Notes to Consolidated Financial Statements.
42
ZEBRA TECHNOLOGIES CORPORATION AND SUBSIDIARIES
CONSOLIDATED STATEMENTS OF CASH FLOWS
(In millions)
Year Ended December 31, | |||||||||||
2019 | 2018 | 2017 | |||||||||
Cash flows from operating activities: | |||||||||||
Net income | $ | $ | $ | ||||||||
Adjustments to reconcile net income to net cash provided by operating activities: | |||||||||||
Depreciation and amortization | |||||||||||
Investment (gain) loss | ( | ) | ( | ) | |||||||
Amortization of debt issuance costs and discounts | |||||||||||
Share-based compensation | |||||||||||
Debt extinguishment costs | |||||||||||
Deferred income taxes | ( | ) | ( | ) | |||||||
Unrealized loss (gain) on forward interest rate swaps | ( | ) | ( | ) | |||||||
Other, net | |||||||||||
Changes in operating assets and liabilities: | |||||||||||
Accounts receivable, net | ( | ) | ( | ) | |||||||
Inventories, net | ( | ) | ( | ) | |||||||
Other assets | ( | ) | ( | ) | |||||||
Accounts payable | ( | ) | ( | ) | |||||||
Accrued liabilities | ( | ) | |||||||||
Deferred revenue | |||||||||||
Income taxes | ( | ) | |||||||||
Other operating activities | ( | ) | ( | ) | ( | ) | |||||
Net cash provided by operating activities | |||||||||||
Cash flows from investing activities: | |||||||||||
Acquisition of businesses, net of cash acquired | ( | ) | ( | ) | |||||||
Purchases of property, plant and equipment | ( | ) | ( | ) | ( | ) | |||||
Proceeds from the sale of long-term investments | |||||||||||
Purchases of long-term investments | ( | ) | ( | ) | ( | ) | |||||
Net cash used in investing activities | ( | ) | ( | ) | ( | ) | |||||
Cash flows from financing activities: | |||||||||||
Proceeds from issuance of long-term debt | |||||||||||
Payments of long term-debt | ( | ) | ( | ) | ( | ) | |||||
Payments of debt extinguishment costs | ( | ) | ( | ) | ( | ) | |||||
Payments of debt issuance costs and discounts | ( | ) | ( | ) | ( | ) | |||||
Payments for repurchases of common stock | ( | ) | |||||||||
Payments of taxes related to net settlements of equity awards, net of proceeds from exercise of stock options and stock purchase plan purchases | ( | ) | ( | ) | |||||||
Unremitted cash collections from servicing factored receivables | |||||||||||
Net cash used in financing activities | ( | ) | ( | ) | ( | ) | |||||
Effect of exchange rate changes on cash | ( | ) | ( | ) | |||||||
Net decrease in cash and cash equivalents | ( | ) | ( | ) | ( | ) | |||||
Cash and cash equivalents at beginning of year | |||||||||||
Cash and cash equivalents at end of year | $ | $ | $ | ||||||||
Supplemental disclosures of cash flow information: | |||||||||||
Income taxes paid | $ | $ | $ | ||||||||
Interest paid | $ | $ | $ | ||||||||
See accompanying Notes to Consolidated Financial Statements.
43
ZEBRA TECHNOLOGIES CORPORATIONAND SUBSIDIARIES
NOTES TO CONSOLIDATED FINANCIAL STATEMENTS
Note 1 Description of Business
Note 2 Significant Accounting Policies
Principles of Consolidation
These accompanying consolidated financial statements were prepared in accordance with accounting principles generally accepted in the United States and include the accounts of Zebra and its wholly owned subsidiaries. All significant intercompany accounts and transactions have been eliminated in consolidation.
Fiscal Calendar
The Company’s fiscal year is a 52-week period ending on December 31. Interim fiscal quarters end on a Saturday and generally include 13 weeks of operating activity. During the 2019 fiscal year, the Company’s quarter end dates were March 30, June 29, September 28 and December 31.
Use of Estimates
These consolidated financial statements were prepared using estimates and assumptions that affect the reported amounts of assets and liabilities and disclosure of contingent assets and liabilities as of the date of the consolidated financial statements and the reported amounts of revenues and expenses during the reporting period. Examples of accounting estimates include: cash flow projections and other valuation assumptions included in business acquisition purchase price allocations as well as annual goodwill impairment testing; the measurement of variable consideration and allocation of transaction price to performance obligations in revenue transactions; inventory and product warranty reserves; useful lives of our tangible and intangible assets; and the recognition and measurement of income tax assets and liabilities. The Company bases its estimates on historical experience and on various other assumptions that the Company believes to be reasonable under the circumstances. Actual results could differ from those estimates.
Cash and Cash Equivalents
Cash consists primarily of deposits with banks. In addition, the Company considers highly liquid short-term investments with original maturities of less than three months to be cash equivalents. These highly liquid short-term investments are readily convertible to known amounts of cash and are so near their maturity that they present insignificant risk of a change in value because of changes in interest rates.
Accounts Receivable and Allowance for Doubtful Accounts
Inventories
Inventories are stated at the lower of a moving-average cost (which approximates cost on a first-in, first-out basis) and net realizable value. Manufactured inventory cost includes materials, labor, and manufacturing overhead. Purchased inventory cost also includes internal purchasing overhead costs. Raw material inventories largely consist of supplies used in repair operations.
Provisions are made to reduce excess and obsolete inventories to their estimated net realizable values. Inventory provisions are based on forecasted demand, experience with specific customers, the age and nature of the inventory, and the ability to redistribute inventory to other programs or to rework into other consumable inventory.
Property, Plant and Equipment
44
Property, plant and equipment is stated at cost. Depreciation is computed primarily using the straight-line method over the estimated useful lives of the various classes of property, plant and equipment, which are 30 years for buildings and range from 3 to 10 years for all other asset categories. Leasehold improvements are amortized using the straight-line method over the shorter of the lease term or 10 years.
Leases
The Company recognizes Right-of-Use (“ROU”) assets and lease liabilities for its lease commitments with terms greater than one year. Contractual options to extend or terminate lease agreements are reflected in the lease term when they are reasonably certain to be exercised.
The initial measurements of new ROU assets and lease liabilities are based on the present value of future lease payments over the lease term as of the commencement date. In determining future lease payments, the Company has elected not to separate lease and non-lease components. As the Company’s lease arrangements do not provide an implicit interest rate, we apply the Company’s incremental borrowing rate based on the information available at the commencement date in determining the present value of future lease payments. Relevant information used in determining the Company’s incremental borrowing rate includes the duration of the lease, transaction currency of the lease, and the Company’s credit risk relative to risk-free market rates.
The Company’s ROU assets also include any initial direct costs incurred and exclude lease incentives. The Company’s lease agreements do not contain any material residual value guarantees or restrictive covenants.
All leases of the Company are classified as operating leases, with lease expense being recognized on a straight-line basis.
Income Taxes
The Company accounts for income taxes under the liability method in accordance with Accounting Standards Codification (“ASC”) 740 Topic, Income Taxes. Accordingly, deferred income taxes are provided for the future tax consequences attributable to differences between the carrying amounts of assets and liabilities for financial reporting and income tax purposes. Deferred tax assets and liabilities are measured using tax rates in effect for the year in which those temporary differences are expected to be recovered or settled. A valuation allowance is established when necessary to reduce deferred tax assets to the amount that is more likely than not to be realized. The Company recognizes the benefit of tax positions when it is more likely than not to be sustained on its technical merits. The Company recognizes interest and penalties related to income tax matters as part of income tax expense. The Company has elected consolidated tax filings in certain of its jurisdictions which may allow the group to offset one member’s income with losses of other members in the current period and on a carryover basis. The income tax effects of non-inventory intra-entity asset transfers are recognized in the period in which the transfer occurs. The Company classifies its balance sheet accounts by applying jurisdictional netting principles for locations where consolidated tax filing elections are in place.
The Tax Cut and Jobs Act (“the Act”, or “U.S. Tax Reform”), enacted on December 22, 2017, contains the Global Intangible Low-Taxed Income (“GILTI”), Base Erosion Anti-Avoidance Tax (“BEAT”), and Deduction for Foreign-Derived Intangible Income (“FDII”) provisions, which relate to the taxation of certain foreign income and are effective for tax years beginning on or after January 1, 2018. The Company recognizes its GILTI, BEAT, and FDII inclusions, when applicable, as a charge to tax expense in the year included in its U.S. tax return.
The effects of changes in tax rates and laws on deferred tax balances are recorded in the period of enactment as a component of income tax expense within continuing operations, even if they relate to items recorded within accumulated other comprehensive income (loss) (“AOCI”). The Company elected to not reclassify the tax effects of these changes associated with the Act from AOCI to retained earnings. Such tax effects are released into earnings when the underlying portfolio of assets or liabilities giving rise to the AOCI position are fully derecognized.
Goodwill
Goodwill is not amortized, rather it is tested annually for impairment, or more frequently if an event occurs or circumstances change that would more likely than not reduce the fair value of a reporting unit below its carrying value. Our annual impairment testing consists of comparing the estimated fair value of each reporting unit to its carrying value. If the carrying value of a reporting unit exceeds its estimated fair value, goodwill would be considered to be impaired and reduced to its implied fair value. We estimate the fair value of reporting units with valuation techniques, including both the income and market approaches. The income approach requires management to estimate a number of factors for each reporting unit, including projected future operating results, economic projections, anticipated future cash flows and discount rates. The market approach estimates fair value using comparable marketplace fair value data from within a comparable industry group.
45
Fair value determinations require judgment and are sensitive to changes in underlying assumptions, estimates, as well as market factors. Estimating the fair value of reporting units requires that we make a number of assumptions and estimates regarding our long-term growth and cash flow expectations as well as overall industry and economic conditions. These estimates and assumptions include, but are not limited to, projections of revenue and income growth rates, capital investments, competitive and customer trends, appropriate peer group selection, market-based discount rates and other market factors.
We performed our annual goodwill impairment testing in the fourth quarter of 2019 using a quantitative approach which did not result in any impairments. See Note 6, Goodwill and Other Intangibles for additional information. We believe our fair value estimates are reasonable. If actual financial results differ materially from current estimates or there are significant negative changes in market factors beyond our control, there could be an impairment of goodwill in the future.
Other Intangible Assets
Impairment of Long-Lived Assets and Long-Lived Assets to be Disposed of
The Company accounts for long-lived assets in accordance with the provisions of ASC Topic 360, Property, Plant and Equipment, which requires that long-lived assets and certain identifiable intangibles be reviewed for impairment whenever events or changes in circumstances indicate that the carrying amount of an asset may not be recoverable. Recoverability of assets to be held and used is measured by a comparison of the carrying amount of an asset to the sum of the undiscounted cash flows expected to result from the use and the eventual disposition of the asset. If such assets are impaired, the impairment to be recognized is the excess of the carrying amount over the fair value. Assets to be disposed of are reported at the lower of the carrying amount or fair value less costs to sell.
Investments in Securities
Revenue Recognition
Revenues are primarily comprised of sales of hardware, services, and supplies. The Company also generates revenues from its solutions and software offerings, primarily licenses and maintenance. Our service offerings are principally product repair and maintenance service contracts, which typically occur over time, and professional services such as installation, integration and provisioning, which typically occur in the early stages of a project. The average life of repair and maintenance service contracts is approximately three years. Professional service arrangements range in duration from a day to several weeks or months. We recognize revenues when we transfer control of promised goods or services to our customers in an amount that reflects the consideration to which we expect to receive, which includes estimates of variable consideration, in exchange for those goods or services. We are typically the principal in all elements of our transactions and record Net sales and Cost of sales on a gross basis.
Research and Development Costs
Research and development (“R&D”) costs are expensed as incurred, and include:
• | Salaries, benefits, and other R&D personnel related costs; |
• | Consulting and other outside services used in the R&D process; |
• | Engineering supplies; |
• | Engineering related information systems costs; and |
• | Allocation of building and related costs. |
Advertising
Warranties
46
In general, the Company provides warranty coverage of one year on mobile computers, printers and batteries. Advanced data capture products are warrantied from one to five years , depending on the product. Thermal printheads are warrantied for six months and battery-based products, such as location tags, are covered by a 90 -day warranty. A provision for warranty expense is adjusted quarterly based on historical and expected warranty experience.
Contingencies
The Company establishes a liability for loss contingencies when the loss is both probable and estimable. In addition, for some matters for which a loss is probable or reasonably possible, an estimate of the amount of loss or range of loss is not possible, and we may be unable to estimate the possible loss or range of losses that could potentially result from the application of non-monetary remedies.
Fair Value of Financial Instruments
Fair value is the price that would be received to sell an asset or paid to transfer a liability in an orderly transaction between market participants at the measurement date. Our financial assets and liabilities that require recognition and fair value measurement under the accounting guidance generally include our employee deferred compensation plan investments, foreign currency forwards, and interest rate swaps. In accordance with ASC Topic 815, Derivatives and Hedging (“ASC 815”), we recognize derivative instruments and hedging activities as either assets or liabilities on the Consolidated Balance Sheets and measure them at fair value. Gains and losses resulting from changes in fair value are accounted for depending on the use of the derivative and whether it is designated and qualifies for hedge accounting. See Note 11, Derivative Instruments for additional information on the Company’s derivatives and hedging activities.
The Company utilizes foreign currency forwards to hedge certain foreign currency exposures and interest rate swaps to hedge a portion of the variability in future cash flows on debt. We use broker quotations or market transactions, in either the listed or over-the-counter markets, to value our foreign currency exchange contracts and relevant observable market inputs at quoted intervals, such as forward yield curves and the Company’s own credit risk to value our interest rate swaps.
The Company’s securities held for its deferred compensation plans are measured at fair value using quoted prices in active markets for identical assets. If active markets for identical assets are not available to determine fair value, then we use quoted prices for similar assets or inputs that are observable either directly or indirectly.
Share-Based Compensation
Foreign Currency Translation
The balance sheet accounts of the Company’s subsidiaries that have not designated the U.S. Dollar as its functional currency are translated into U.S. Dollars using the period-end exchange rate, and statement of earnings items are translated using the average exchange rate for the period. The resulting translation gains or losses are recorded in Stockholders’ equity as a cumulative translation adjustment, which is a component of AOCI within the Consolidated Balance Sheets.
Acquisitions
We account for acquired businesses using the acquisition method of accounting. This method requires that the purchase price be allocated to the identifiable assets acquired and liabilities assumed at their estimated fair values. The excess of the purchase price over the identifiable assets acquired and liabilities assumed is recorded as goodwill.
The estimates used to determine the fair values of long-lived assets, such as intangible assets, can be complex and require judgment. We use information available to us to make fair value determinations and engage independent valuation specialists, when necessary, to assist in the fair value determinations of significant acquired long-lived assets. While we use our best estimates and assumptions as a part of the purchase price allocation process, our estimates are inherently uncertain and subject to refinement during the measurement period, which is up to one year after the acquisition date. Critical estimates in valuing certain intangible assets include, but are not limited to, future expected cash flows from revenues and operating activities, customer attrition rates, and discount rates. Management’s estimates of fair value are based upon assumptions believed to be reasonable, but due to the inherent uncertainty during the measurement period, we may record adjustments to the fair value of assets acquired and liabilities assumed with a corresponding adjustment to goodwill.
47
Recently Adopted Accounting Pronouncements
On January 1, 2019, the Company adopted ASC Topic 842, Leases (“ASC 842”), which increases the transparency and comparability of organizations by recognizing ROU assets and lease liabilities on the Consolidated Balance Sheets and disclosing key quantitative and qualitative information about leasing arrangements. The principal difference from previous guidance is that the ROU assets and lease liabilities arising from operating leases were not previously recognized on the Consolidated Balance Sheet. Results for reporting periods beginning after January 1, 2019 are reported under ASC 842, while prior period amounts are not adjusted and continue to be reported in accordance with our historic accounting under ASC Topic 840, Leases (“ASC 840”). In transition, we elected a number of practical expedients, including the election to not reassess existing or expired contracts to determine if such contracts contain a lease or if the lease classification would differ, as well as the election to not separate lease and non-lease components for arrangements where the Company is a lessee.
The impact of the adoption of ASC 842 to the Company’s Consolidated Balance Sheets as of January 1, 2019 was as follows (in millions):
As Reported December 31, 2018 | Adjustment | As Adjusted January 1, 2019 | |||||||||
Assets: | |||||||||||
Prepaid expenses and other current assets(1) | $ | $ | ( | ) | $ | ||||||
Right-of-use assets | — | ||||||||||
Liabilities: | |||||||||||
Accrued liabilities(2) | |||||||||||
Long-term lease liabilities | — | ||||||||||
Other long-term liabilities(1) | ( | ) | |||||||||
(1) Reflects an adjustment related to prepaid and accrued rent balances, which are included in the measurement of ROU assets.
(2) Reflects the current portion of the lease liabilities.
As a result of the transition, there was no impact to the Company’s Consolidated Statements of Operations or Cash Flows for the year ended December 31, 2019, compared to what would have been reported in accordance with ASC 840.
In August 2018, the FASB issued ASU 2018-15, Intangibles - Goodwill and Other - Internal-Use Software (Subtopic 350-40): Customer’s Accounting for Implementation Costs Incurred in a Cloud Computing Arrangement That Is a Service Contract. This ASU clarifies existing guidance related to implementation costs incurred in cloud computing arrangements, including the recognition, subsequent measurement, and financial statement presentation of such costs. The standard was early adopted prospectively by the Company during the second quarter of 2019 and did not have a material impact to the Company’s consolidated financial statements or disclosures.
Recently Issued Accounting Pronouncements Not Yet Adopted
In June 2016, the FASB issued ASU 2016-13, Financial Instruments-Credit Losses (Topic 326) - Measurement of Credit Losses on Financial Instruments. The ASU requires the measurement and recognition of expected credit losses for financial assets held at amortized cost. It replaces the existing incurred loss impairment model with an expected loss methodology, which will result in more timely recognition of credit losses. With respect to the Company’s financial assets, including trade receivables and contract assets, a cumulative effect transition approach will be applied. The standard will be effective for the Company in the first quarter of 2020. Management has assessed the impact of the ASU and determined, based on current operations, that it will not have a material impact to the Company’s consolidated financial statements or disclosures.
Note 3 Revenues
On January 1, 2018, the Company adopted ASC Topic 606, Revenue from Contracts with Customers (“ASC 606”), applying the modified retrospective method to those contracts which were not completed as of January 1, 2018. Results for reporting periods beginning after January 1, 2018 are presented under ASC 606, while prior period amounts are not adjusted and continue to be reported in accordance with our historic accounting under ASC Topic 605, Revenue Recognition (“ASC 605”). The adoption of ASC 606 did not have a material effect on the Company’s consolidated financial statements or results of operations.
The Company recognizes revenue to depict the transfer of goods or services to a customer at an amount that reflects the consideration which it expects to receive for providing those goods or services. To determine total expected consideration, the Company estimates elements of variable consideration, which primarily include product rights of return, rebates, price
48
protection and other incentives. These estimates are developed using the expected value or the most likely amount method and are reviewed and updated, as necessary, at each reporting period. Revenues, inclusive of variable consideration, are recognized to the extent it is probable that a significant reversal in cumulative revenues recognized will not occur in future periods.
We enter into contract arrangements that may include various combinations of tangible products, services, solution and software offerings, which are generally capable of being distinct and accounted for as separate performance obligations. We evaluate whether two or more contracts should be combined and accounted for as a single contract and whether the combined or single contract has more than one performance obligation. This evaluation requires judgment, and the decision to combine a group of contracts or separate the combined or single contract into multiple distinct performance obligations may impact the amount of revenue recorded in a reporting period. We deem performance obligations to be distinct if the customer can benefit from the product or service on its own or together with readily available resources (“capable of being distinct”) and if the transfer of products or services is separately identifiable from other promises in the contract (“distinct within the context of the contract”).
For contract arrangements that include multiple performance obligations, we allocate the total transaction price to each performance obligation in an amount based on the estimated relative standalone selling prices for each performance obligation. In general, standalone selling prices are observable for tangible products and software licenses, while standalone selling prices for professional services, repair and maintenance services, and solutions are developed with an expected cost-plus margin or residual approach. When the residual approach cannot be applied, regional pricing, marketing strategies and business practices are evaluated to derive the estimated standalone selling price using a cost-plus margin methodology.
The Company recognizes revenue for each performance obligation upon transfer of control of the promised goods or services. Control is deemed to have been transferred when the customer has the ability to direct the use of and has obtained substantially all of the remaining benefits from the goods and services. The determination of whether control transfers at a point in time or over time requires judgment and includes consideration of the following : 1) the customer simultaneously receives and consumes the benefits provided as the Company performs its promises; 2) the Company’s performance creates or enhances an asset that is under control of the customer; 3) the Company’s performance does not create an asset with an alternative use to the Company; and 4) the Company has an enforceable right to payment for its performance completed to date. Substantially all revenue for tangible products and perpetual or term software licenses is recognized at a point in time, which is generally upon shipment, transfer of control and risks of ownership to the customer, and the Company having contractual right to payment. Revenue for services and Company-hosted software license and maintenance agreements, as well as solutions, is predominantly recognized over time.
Assuming all other criteria for revenue recognition have been met, for products and services sold on a standalone basis, revenue is generally recognized upon shipment and by using an output method or time-based method, respectively. In cases where a bundle of products and services are delivered to the customer, judgment is required to select the method of progress which best reflects the transfer of control.
Disaggregation of Revenue
The following table presents our Net sales disaggregated by product category for each of our segments, Asset Intelligence & Tracking (“AIT”) and Enterprise Visibility & Mobility (“EVM”), for the years ended December 31, 2019 and 2018 (in millions):
Year Ended December 31, 2019 | Year Ended December 31, 2018 | ||||||||||||||||||||||
Segment | Tangible Products | Services and Software | Total | Tangible Products | Services and Software | Total | |||||||||||||||||
AIT | $ | $ | $ | $ | $ | $ | |||||||||||||||||
EVM | |||||||||||||||||||||||
Total | $ | $ | $ | $ | $ | $ | |||||||||||||||||
In addition, refer to Note 20, Segment Information & Geographic Data for Net sales to customers by geographic region.
Contract Balances
49
Deferred revenue on the Consolidated Balance Sheets consist of payments and billings in advance of our performance. The combined short-term and long-term deferred revenue balances were $459 million and $382 million as of December 31, 2019 and 2018, respectively. The Company recognized $219 million and $181 million in revenue that was previously included in the beginning balance of deferred revenue during the years ended December 31, 2019 and 2018, respectively.
Our payment terms vary by the type and location of our customer and the products or services offered. The time between invoicing and when payment is due is not significant. In instances where the timing of revenue recognition differs from the timing of invoicing, we have determined that our contracts do not include a significant financing component.
Costs to Obtain a Contract
Note 4 Inventories
The components of Inventories, net are as follows (in millions):
December 31, 2019 | December 31, 2018 | ||||||
Raw materials | $ | $ | |||||
Work in process | |||||||
Finished goods | |||||||
Total | $ | $ | |||||
Note 5 Business Acquisitions
Cortexica
On November 5, 2019, the Company acquired 100 % of the equity interests in Cortexica Vision Systems Limited (“Cortexica”), a provider of computer vision-based artificial intelligence solutions primarily for the retail industry. The purchase consideration was $7 million, which was primarily allocated to technology-related intangible assets of $4 million and goodwill of $4 million based on the estimated fair values of identifiable assets acquired and liabilities assumed. While we believe these estimates provide a reasonable basis to record the net assets acquired, the purchase price allocation is considered preliminary and subject to adjustment during the measurement period, which is up to one year from the acquisition date. Additionally, we incurred approximately $2 million of acquisition-related costs in 2019, which are included within Acquisition and integration costs on the Consolidated Statements of Operations. The goodwill, which will be non-deductible for tax purposes, has been allocated to the EVM segment and principally relates to the planned expansion of the Cortexica technologies into new markets, industries, and product offerings.
Profitect
50
On May 31, 2019, the Company acquired 100 % of the equity interests of Profitect, Inc. (“Profitect”), a provider of prescriptive analytics primarily for the retail industry. In acquiring Profitect, the Company seeks to enhance its existing software solutions within the retail industry, with possible future applications in other industries, markets and product offerings.
The Profitect acquisition was accounted for under the acquisition method of accounting for business combinations. The total purchase consideration was $79 million, which consisted of $75 million in cash paid, net of cash on-hand, and the fair value of the Company’s existing ownership interest in Profitect of $4 million, as remeasured upon acquisition. This remeasurement resulted in a $4 million gain reflected within Other, net on the Consolidated Statements of Operations. Additionally, we incurred $13 million of acquisition-related costs in 2019, which primarily consisted of payments to settle Profitect employee stock option awards, as well as third party transaction and advisory fees. Those acquisition-related costs are included within Acquisition and integration costs on the Consolidated Statements of Operations.
The Company utilized estimated fair values as of May 31, 2019 to allocate the total purchase consideration to the net tangible and intangible assets acquired and liabilities assumed. The fair value of the net assets acquired was based on a number of estimates and assumptions as well as customary valuation procedures and techniques, principally the excess earnings methodology. While we believe these estimates provide a reasonable basis to record the net assets acquired, the purchase price allocation is considered preliminary and subject to adjustment during the measurement period, which is up to one year from the acquisition date. The primary fair value estimates considered preliminary include identifiable intangible assets and income tax-related items.
The preliminary purchase price allocation to assets acquired and liabilities assumed was as follows (in millions):
Identifiable intangible assets | $ | ||
Other assets acquired | |||
Deferred tax liabilities | ( | ) | |
Other liabilities assumed | ( | ) | |
Net Assets Acquired | $ | ||
Goodwill on acquisition | |||
Total purchase consideration | $ | ||
The $54 million of goodwill, which will be non-deductible for tax purposes, has been allocated to the EVM segment and principally relates to the planned expansion of the Profitect software offerings and technologies into current and new markets, industries and product offerings.
The preliminary purchase price allocation to identifiable intangible assets acquired was:
Fair Value (in millions) | Useful Life (in years) | ||||
Technology and patents | $ | ||||
Customer and other relationships | |||||
Total identifiable intangible assets | $ | ||||
Temptime
On February 21, 2019, the Company acquired 100 % of the equity interests of Temptime Corporation (“Temptime”), a developer and manufacturer of temperature-monitoring labels and devices. The Company intends to expand Temptime’s product offerings within the healthcare industry, with possible future applications in other industries involving temperature-sensitive products.
The Temptime acquisition was accounted for under the acquisition method of accounting for business combinations. The Company paid $180 million in cash, net of cash on-hand, to acquire Temptime. Additionally, we incurred $3 million of acquisition-related costs in 2019, which primarily included third-party transaction and advisory fees that are included within Acquisition and integration costs on the Consolidated Statements of Operations.
The Company utilized estimated fair values as of February 21, 2019 to allocate the total consideration paid to the net tangible and intangible assets acquired and liabilities assumed. The fair value of the net assets acquired was based on a number of estimates and assumptions as well as customary valuation procedures and techniques, including the relief from royalty and excess earnings methodologies. While we believe these estimates provide a reasonable basis to record the net assets acquired, the purchase price allocation is considered preliminary and subject to adjustment during the measurement period, which is up to one year from the acquisition date. The primary fair value estimates considered preliminary are income tax-related items.
The preliminary purchase price allocation to assets acquired and liabilities assumed was as follows (in millions):
51
Inventory | $ | ||
Property, plant and equipment | |||
Identifiable intangible assets | |||
Other assets acquired | |||
Deferred tax liabilities | ( | ) | |
Other liabilities assumed | ( | ) | |
Net Assets Acquired | $ | ||
Goodwill on acquisition | |||
Total purchase consideration | $ | ||
The $73 million of goodwill, which will be non-deductible for tax purposes, has been allocated to the AIT segment and principally relates to the planned expansion of its product offerings and technologies into current and new markets and industries.
The preliminary purchase price allocation to identifiable intangible assets acquired was:
Fair Value (in millions) | Useful Life (in years) | ||||
Customer and other relationships | $ | ||||
Technology and patents | |||||
Trade Names | |||||
Total identifiable intangible assets | $ | ||||
Xplore
On August 14, 2018, the Company acquired Xplore Technologies Corporation (“Xplore”). The Xplore business designs, integrates, markets and sells rugged tablets that are primarily used by industrial, government, and field service organizations. The acquisition of Xplore is intended to expand the Company’s portfolio of mobile computing devices to serve a wider range of customers.
The Xplore acquisition was accounted for under the acquisition method of accounting for business combinations. The Company paid $72 million in cash, net of cash on-hand, to acquire Xplore.
The final purchase price allocation to assets acquired and liabilities assumed was as follows (in millions):
Accounts receivable | $ | ||
Inventory | |||
Identifiable intangible assets | |||
Other assets acquired | |||
Debt | ( | ) | |
Accounts payable | ( | ) | |
Deferred revenues | ( | ) | |
Other liabilities assumed | ( | ) | |
Net Assets Acquired | $ | ||
Goodwill on acquisition | |||
Total consideration | $ | ||
At closing, in connection with the acquisition, the Company also made a $9 million payment of Xplore debt and $6 million in payments of other Xplore transaction-related obligations. Additionally, we incurred $8 million of acquisition-related costs in 2018, which primarily included third-party transaction and advisory fees, and we incurred $2 million of system integration costs in 2019. These costs are reflected within Acquisition and integration costs on the Consolidated Statements of Operations.
The $29 million of goodwill, which will be non-deductible for tax purposes, has been allocated to the EVM segment and principally relates to the planned expansion of the Xplore product offerings into current and new markets.
52
Included within the final purchase price allocation are measurement period adjustments relating to facts and circumstances existing as of the acquisition date, primarily an increase to deferred tax assets and a corresponding decrease to goodwill of $6 million, which were recorded during 2019. The Xplore purchase price allocation was finalized in the second quarter of 2019.
The purchase price allocation to identifiable intangible assets acquired was:
Fair Value (in millions) | Useful Life (in years) | ||||
Customer and other relationships | $ | ||||
Technology and patents | |||||
Trade names | |||||
Total identifiable intangible assets | $ | ||||
The operating results of each acquired company have been included in the Company’s Consolidated Balance Sheets and Statements of Operations beginning on their respective acquisition dates. The Company has not included unaudited proforma results, as if each of these companies had been acquired as of January 1, 2018, as doing so would not yield materially different results.
Note 6 Goodwill and Other Intangibles
Goodwill
Changes in the net carrying value amount of goodwill by segment were as follows (in millions):
AIT | EVM | Total | ||||||||||
Goodwill as of December 31, 2017 | $ | $ | $ | |||||||||
Xplore acquisition | ||||||||||||
Foreign exchange impact | ( | ) | ( | ) | ||||||||
Goodwill as of December 31, 2018 | $ | $ | $ | |||||||||
Xplore purchase price allocation adjustments | ( | ) | ( | ) | ||||||||
Temptime acquisition | ||||||||||||
Profitect acquisition | ||||||||||||
Cortexica acquisition | ||||||||||||
Foreign exchange impact | ||||||||||||
Goodwill as of December 31, 2019 | $ | $ | $ | |||||||||
See Note 5, Business Acquisitions for further details related to the Company’s acquisitions and purchase price allocation adjustments.
The Company’s goodwill balance consists of five reporting units. The majority of the goodwill relates to the acquisition of the Enterprise Business of Motorola Solutions, Inc. (“Enterprise”). The Company completed its annual goodwill impairment testing during the fourth quarter of 2019 utilizing a quantitative approach. The estimated fair value of each reporting unit exceeded its carrying value by at least 55 %. There is risk of future impairment to the extent that an individual reporting unit’s performance does not meet projections. Additionally, if our current assumptions and estimates, including projected revenues and income growth rates, terminal growth rates, competitive and consumer trends, market-based discount rates, and other market factors, are not met, or if other valuation factors outside of our control change unfavorably, the estimated fair value of our reporting units could be adversely affected, leading to a potential impairment in the future.
No events occurred during the fiscal years ended 2019, 2018, or 2017 that indicated it was more likely than not that our goodwill was impaired.
Other Intangibles, net
The balances in Other Intangibles, net consisted of the following (in millions):
53
As of December 31, 2019 | As of December 31, 2018 | ||||||||||||||||||||||
Gross Carrying Amount | Accumulated Amortization | Net | Gross Carrying Amount | Accumulated Amortization | Net | ||||||||||||||||||
Amortized intangible assets | |||||||||||||||||||||||
Technology and patents | $ | $ | ( | ) | $ | $ | $ | ( | ) | $ | |||||||||||||
Customer and other relationships | ( | ) | ( | ) | |||||||||||||||||||
Trade Names | ( | ) | ( | ) | |||||||||||||||||||
Total | $ | $ | ( | ) | $ | $ | $ | ( | ) | $ | |||||||||||||
Amortization expense was $103 million, $97 million, and $184 million for fiscal years ended 2019, 2018 and 2017, respectively.
Estimated future intangible asset amortization expense is as follows (in millions):
Year Ended December 31, | |||
2020 | $ | ||
2021 | |||
2022 | |||
2023 | |||
2024 | |||
Thereafter | |||
Total | $ | ||
Note 7 Property, Plant and Equipment
Property, plant and equipment, net is comprised of the following (in millions):
December 31, | |||||||
2019 | 2018 | ||||||
Buildings | $ | $ | |||||
Land | |||||||
Machinery and equipment | |||||||
Furniture and office equipment | |||||||
Software and computer equipment | |||||||
Leasehold improvements | |||||||
Projects in progress | |||||||
Less accumulated depreciation | ( | ) | ( | ) | |||
Property, plant and equipment, net | $ | $ | |||||
Note 8 Investments
The carrying value of the Company’s investments was $45 million and $25 million as of December 31, 2019 and 2018, respectively, which are included in Other long-term assets on the Consolidated Balances Sheets.
The Company adopted ASU 2016-01, Financial Instruments - Overall (Subtopic 825-10): Recognition and Measurement of Financial Assets and Financial Liabilities (“ASU 2016-01”) on January 1, 2018. In conjunction therewith, the Company has elected to measure equity investments without readily determinable fair values at cost, adjusted only for impairment losses or for observable changes in orderly transactions for the identical or similar investment of the same issuer for periods beginning after January 1, 2018. Prior to the adoption of ASU 2016-01, such equity investments were measured at cost, adjusted only for impairment losses.
54
Net gains (losses) related to the Company’s investments, which are included within Other, net on the Consolidated Statements of Operations, were $3 million, $10 million, and $(1 ) million during the years ended December 31, 2019, 2018, and 2017, respectively.
Note 9 Exit and Restructuring Costs
In the fourth quarter of 2019, the Company committed to certain organizational changes designed to generate operational efficiencies (collectively referred to as the “2019 Productivity Plan”), which are incremental to the Company’s 2017 exit and restructuring program (the “2017 Productivity Plan”). The organizational design changes under the 2019 Productivity Plan will principally occur within the North America and Europe, Middle East, and Africa (“EMEA”) regions, relate primarily to employee severance and related benefits, and are expected to be substantially completed in fiscal 2020. Exit and restructuring charges for the 2019 Productivity Plan were $8 million for the year ended December 31, 2019. Estimated remaining costs to be incurred in fiscal 2020 under the 2019 Productivity Plan are expected to be up to $10 million.
The 2017 Productivity Plan, focused on organizational design changes, process improvements, and automation, built upon the exit and restructuring initiatives specific to the October 2014 Enterprise acquisition (the “Acquisition Plan”). The Company substantially completed all initiatives under the 2017 Productivity Plan and the Acquisition Plan in fiscal 2018 and 2017, respectively. Exit and restructuring charges relating to the 2017 Productivity Plan were $2 million, $11 million and $12 million for fiscal 2019, 2018 and 2017, respectively. Exit and restructuring charges relating to the Acquisition Plan were $4 million for fiscal 2017. Cumulative costs associated with the 2017 Productivity Plan and the Acquisition Plan were $25 million and $69 million, respectively, and primarily consisted of severance and related benefits and lease exit costs. As of December 31, 2019, no significant obligations remain with respect to the 2017 Productivity Plan or the Acquisition Plan.
The Company’s total remaining obligations under its exit and restructuring programs as of December 31, 2019 were approximately $9 million, which are expected to be settled primarily within the next year and reflected within Accrued liabilities on the Consolidated Balance Sheets.
Note 10 Fair Value Measurements
Financial assets and liabilities are measured using inputs from three levels of the fair value hierarchy in accordance with ASC Topic 820, Fair Value Measurements. Fair value is defined as the price that would be received to sell an asset or paid to transfer a liability in an orderly transaction between market participants at the measurement date. It establishes a fair value hierarchy that prioritizes observable and unobservable inputs used to measure fair value into the following three broad levels:
Level 1: Quoted prices in active markets that are accessible at the measurement date for identical assets or liabilities. The fair value hierarchy gives the highest priority to Level 1 inputs (e.g. U.S. Treasuries and money market funds).
Level 2: Observable prices that are based on inputs not quoted in active markets but corroborated by market data.
Level 3: Unobservable inputs are used when little or no market data is available. The fair value hierarchy gives the lowest priority to Level 3 inputs.
In determining fair value, the Company utilizes valuation techniques that maximize the use of observable inputs to the extent possible. In addition, the Company considers counterparty credit risk in the assessment of fair value.
The Company’s financial assets and liabilities carried at fair value as of December 31, 2019, are classified below (in millions):
Level 1 | Level 2 | Level 3 | Total | ||||||||||||
Assets: | |||||||||||||||
Foreign exchange contracts(1) | $ | $ | $ | $ | |||||||||||
Money market investments related to the deferred compensation plan | |||||||||||||||
Total Assets at fair value | $ | $ | $ | $ | |||||||||||
Liabilities: | |||||||||||||||
Forward interest rate swap contracts(2) | $ | $ | $ | $ | |||||||||||
Liabilities related to the deferred compensation plan | |||||||||||||||
Total Liabilities at fair value | $ | $ | $ | $ | |||||||||||
55
The Company’s financial assets and liabilities carried at fair value as of December 31, 2018, are classified below (in millions):
Level 1 | Level 2 | Level 3 | Total | ||||||||||||
Assets: | |||||||||||||||
Foreign exchange contracts(1) | $ | $ | $ | $ | |||||||||||
Forward interest rate swap contracts(2) | |||||||||||||||
Money market investments related to the deferred compensation plan | |||||||||||||||
Total Assets at fair value | $ | $ | $ | $ | |||||||||||
Liabilities: | |||||||||||||||
Liabilities related to the deferred compensation plan | $ | $ | $ | $ | |||||||||||
Total Liabilities at fair value | $ | $ | $ | $ | |||||||||||
(1) | The fair value of the foreign exchange contracts is calculated as follows: |
a. | Fair value of regular forward contracts associated with forecasted sales hedges is calculated using the year-end exchange rate adjusted for current forward points. |
b. | Fair value of hedges against net assets is calculated at the year-end exchange rate adjusted for current forward points unless the hedge has been traded but not settled at year end (Level 2). If this is the case, the fair value is calculated at the rate at which the hedge is being settled (Level 1). |
(2) |
Note 11 Derivative Instruments
In the normal course of business, the Company is exposed to global market risks, including the effects of changes in foreign currency exchange rates and interest rates. The Company uses derivative instruments to manage its exposure to such risks and may elect to designate certain derivatives as hedging instruments under ASC 815. The Company formally documents all relationships between designated hedging instruments and hedged items as well as its risk management objectives and strategies for undertaking hedge transactions. The Company does not hold or issue derivatives for trading or speculative purposes.
In accordance with ASC 815, the Company recognizes derivative instruments as either assets or liabilities on the Consolidated Balance Sheets and measures them at fair value. The following table presents the fair value of its derivative instruments (in millions):
Asset (Liability) | |||||||||
Fair Values as of December 31, | |||||||||
Balance Sheets Classification | 2019 | 2018 | |||||||
Derivative instruments designated as hedges: | |||||||||
Foreign exchange contracts | Prepaid expenses and other current assets | $ | $ | ||||||
Total derivative instruments designated as hedges | $ | $ | |||||||
Derivative instruments not designated as hedges: | |||||||||
Foreign exchange contracts | Prepaid expenses and other current assets | $ | $ | ||||||
Forward interest rate swaps | Prepaid expenses and other current assets | ||||||||
Forward interest rate swaps | Other long-term assets | ||||||||
Forward interest rate swaps | Accrued liabilities | ( | ) | ||||||
Forward interest rate swaps | Other long-term liabilities | ( | ) | ||||||
Total derivative instruments not designated as hedges | $ | ( | ) | $ | |||||
Total net derivative (liability) asset | $ | ( | ) | $ | |||||
56
The following table presents the net (losses) gains from changes in fair values of derivatives that are not designated as hedges (in millions):
(Loss) Gain Recognized in Income | |||||||||||||
Year Ended December 31, | |||||||||||||
Statements of Operations Classification | 2019 | 2018 | 2017 | ||||||||||
Derivative instruments not designated as hedges: | |||||||||||||
Foreign exchange contracts | Foreign exchange loss | $ | ( | ) | $ | $ | ( | ) | |||||
Forward interest rate swaps | Interest expense, net | ( | ) | ||||||||||
Total (loss) gain recognized in income | $ | ( | ) | $ | $ | ( | ) | ||||||
Activities related to derivative instruments are included within Net cash provided by operating activities on the Statements of Cash Flows.
Credit and Market Risk Management
Financial instruments, including derivatives, expose the Company to counterparty credit risk of nonperformance and to market risk related to currency exchange rate and interest rate fluctuations. The Company manages its exposure to counterparty credit risk by establishing minimum credit standards, diversifying its counterparties, and monitoring its concentrations of credit. The Company’s counterparties are commercial banks with expertise in derivative financial instruments. The Company evaluates the impact of market risk on the fair value and cash flows of its derivative and other financial instruments by considering reasonably possible changes in interest rates and currency exchange rates. The Company continually monitors the creditworthiness of the customers to which it grants credit terms in the normal course of business. The terms and conditions of the Company’s credit policies are designed to mitigate concentrations of credit risk.
The Company’s master netting and other similar arrangements with the respective counterparties allow for net settlement under certain conditions, which are designed to reduce credit risk by permitting net settlement with the same counterparty. We elect to present the assets and liabilities of our derivative financial instruments, for which we have net settlement agreements in place, on a net basis on the Consolidated Balance Sheets. If the derivative financial instruments had been presented gross on the Consolidated Balance Sheets, the asset and liability positions each would have been increased by $3 million and $1 million as of December 31, 2019 and 2018, respectively.
Foreign Currency Exchange Risk Management
The Company conducts business on a multinational basis in a wide variety of foreign currencies. Exposure to market risk for changes in foreign currency exchange rates arises from Euro-denominated external revenues, cross-border financing activities between subsidiaries, and foreign currency denominated monetary assets and liabilities. The Company manages its objective of preserving the economic value of non-functional currency denominated cash flows by initially hedging transaction exposures with natural offsets to the fullest extent possible and, once these opportunities have been exhausted, through foreign exchange forward and option contracts, as deemed appropriate.
The Company manages the exchange rate risk of anticipated Euro-denominated sales by using forward contracts, which typically mature within twelve months of execution. The Company designates these derivative contracts as cash flow hedges. Unrealized gains and losses on these contracts are deferred in AOCI on the Consolidated Balance Sheets until the contract is settled and the hedged sale is realized. The realized gain or loss is then recorded as an adjustment to Net sales on the Consolidated Statement of Operations. Realized gains (losses) reclassified to Net sales were $42 million, $13 million, and $(8 ) million for the years ending December 31, 2019, 2018 and 2017, respectively. As of December 31, 2019 and 2018, the notional amounts of the Company’s foreign exchange cash flow hedges were €564 million and €496 million, respectively. The Company has reviewed its cash flow hedges for effectiveness and determined they are highly effective.
The Company uses forward contracts, which are not designated as hedging instruments, to manage its exposures related to net assets denominated in foreign currencies. These forward contracts typically mature within one month after execution. Monetary gains and losses on these forward contracts are recorded in income and are generally offset by the transaction gains and losses related to their net asset positions. The notional values and the net fair value of these outstanding contracts were as follows (in millions):
57
December 31, | |||||||
2019 | 2018 | ||||||
Notional balance of outstanding contracts: | |||||||
British Pound/U.S. Dollar | £ | £ | |||||
Euro/U.S. Dollar | € | € | |||||
British Pound/Euro | £ | £ | |||||
Canadian Dollar/U.S. Dollar | C$ | C$ | |||||
Australian Dollar/U.S. Dollar | A$ | A$ | |||||
Japanese Yen/U.S. Dollar | ¥ | ¥ | |||||
Singapore Dollar/U.S. Dollar | S$ | S$ | |||||
Mexican Peso/U.S. Dollar | Mex$ | Mex$ | |||||
Chinese Yuan/U.S. Dollar | ¥ | ¥ | |||||
South African Rand/U.S. Dollar | R | R | |||||
Net fair value of assets of outstanding contracts | $ | $ | |||||
The Company’s use of non-designated forward contracts to manage Euro currency exposure is limited, as Euro-denominated borrowings under the Revolving Credit Facility naturally hedge part of such risk. See Note 12, Long-Term Debt for further discussion of Euro-denominated borrowings.
Interest Rate Risk Management
The Company’s debt consists of borrowings under a term loan (“Term Loan A”), Revolving Credit Facility, and Receivables Financing Facilities, which bear interest at variable rates plus an applicable margin. See Note 12, Long-Term Debt for further details related to these borrowings. As a result, the Company is exposed to market risk associated with the variable interest rate payments on these borrowings.
The Company manages its exposure to changes in interest rates by utilizing interest rate swaps to hedge this exposure and to achieve a desired proportion of fixed versus floating-rate debt, based on current and projected market conditions.
In December 2017, the Company entered into a long-term forward interest rate swap agreement with a notional amount of $800 million to lock into a fixed LIBOR interest rate base for debt facilities subject to monthly interest payments. Under the terms of the agreement, $800 million in variable-rate debt will be swapped for a fixed interest rate with net settlement terms due effective starting in December 2018 and ending in December 2022. During the third quarter of 2019, the Company entered into additional long-term forward interest rate swap agreements with a total notional amount of $800 million, containing net settlements effective starting in December 2022 and ending in August 2024. The additional interest rate swap agreements effectively extend the risk management initiative of the Company to coincide with the maturities of Term Loan A and the Revolving Credit Facility, as amended. The Company’s interest rate swaps are not designated as hedges and changes in fair value are recognized immediately as Interest expense, net on the Consolidated Statements of Operations.
The Company previously had a floating-to-fixed interest rate swap, which was designated as a cash flow hedge. This swap was terminated, and hedge accounting treatment was discontinued in 2014. The Company reclassified $2 million and $2 million of losses to Interest expense, net on the Consolidated Statements of Operations during the years ended December 31, 2019 and 2018, respectively. No losses remain to be amortized as of December 31, 2019.
Note 12 Long-Term Debt
The following table shows the carrying value of the Company’s debt (in millions):
58
December 31, | |||||||
2019 | 2018 | ||||||
Term Loan A | $ | $ | |||||
Term Loan B | |||||||
Revolving Credit Facility | |||||||
Receivables Financing Facilities | |||||||
Total debt | $ | $ | |||||
Less: Debt issuance costs | ( | ) | ( | ) | |||
Less: Unamortized discounts | ( | ) | ( | ) | |||
Less: Current portion of debt | ( | ) | ( | ) | |||
Total long-term debt | $ | $ | |||||
As of December 31, 2019, the future maturities of debt, excluding debt discounts and issuance costs, are as follows (in millions):
2020 | $ | |||
2021 | ||||
2022 | ||||
2023 | ||||
2024 | ||||
Thereafter | ||||
Total future maturities of debt | $ | |||
All borrowings as of December 31, 2019 were denominated in U.S. Dollars, except for €92 million under the Revolving Credit Facility that was borrowed in Euros.
The estimated fair value of our debt approximated $1.3 billion and $1.6 billion as of December 31, 2019 and 2018, respectively. These fair value amounts, developed based on inputs classified as Level 2 within the fair value hierarchy, represent the estimated value at which the Company’s lenders could trade its debt within the financial markets and does not represent the settlement value of these long-term debt liabilities to the Company. The fair value of the long-term debt will continue to vary each period based a number of factors, including fluctuations in market interest rates as well as changes to the Company’s credit ratings.
Credit Facilities
On July 26, 2017, the Company entered into an Amended and Restated Credit Agreement which provided for the issuance of Term Loan A and increased funding available under the Revolving Credit Facility to $500 million. In conjunction therewith, the Company partially paid down and repriced Term Loan B. As part of these refinancing activities, the Company capitalized $5 million of debt issuance costs and recorded $6 million of pre-tax charges related to third-party fees for arranger, legal and other services and accelerated amortization of debt issuance costs and discounts within Other, net on the Company’s Consolidated Statements of Operations. During 2017, the Company also fully redeemed $1.1 billion of outstanding principal of other debt obligations which had a scheduled maturity in 2022. In accounting for the early termination, the Company applied debt extinguishment accounting and recognized a $65 million make whole premium and $16 million acceleration of debt issuance costs within Interest expense, net on the Company’s Consolidated Statements of Operations.
On May 31, 2018, the Company entered into Amendment No. 1 to the Amended and Restated Credit Agreement (“Amendment No. 1”). Amendment No. 1 resulted in a new Term Loan A with principal of $670 million and increased the Revolving Credit Facility from $500 million to $800 million. Also, as part of Amendment No. 1, the Company had a partial early debt extinguishment of $300 million and repricing of its Term Loan B. Amendment No. 1 resulted in $6 million of non-cash accelerated amortization of debt issuance costs and $1 million of one-time charges related to third party fees, both of which were reflected in Interest Expense, net on the Consolidated Statements of Operations. Amendment No. 1 also resulted in $2 million of third party fees for arranger, legal, and other services that were capitalized.
On August 9, 2019, the Company entered into Amendment No. 2 to the Amended and Restated Credit Agreement (“Amendment No. 2”). Amendment No. 2 increased the Company’s borrowing under Term Loan A from $608 million to $1 billion and increased the Company’s borrowing capacity under the Revolving Credit Facility from $800 million to $1 billion. Term Loan A and the Revolving Credit Facility will continue to bear interest at variable rates plus an applicable margin. The
59
maturities of Term Loan A and the Revolving Credit Facility were each extended to August 9, 2024. In conjunction with entering into Amendment No. 2, a payment of $445 million was made to fully pay off Term Loan B.
The refinancing of the Company’s debt during the third quarter of 2019 resulted in non-cash accelerated amortization of debt discount and debt issuance costs of $4 million and one-time charges of $3 million, which included certain third party fees and the accelerated amortization of losses on terminated interest rate swaps released from AOCI. These items are included in Interest Expense, net on the Consolidated Statements of Operations. Additionally, issuance costs of $6 million incurred related to this debt refinancing were capitalized and will be amortized over the remaining term of Term Loan A and the Revolving Credit Facility.
The principal on Term Loan A is due in quarterly installments, with the next quarterly installment due in July 2021 and the majority due upon its August 9, 2024 maturity. The Company may make prepayments against the amended Term Loan A, in whole or in part, without premium or penalty. The Company would be required to prepay certain outstanding amounts in the event of certain circumstances or transactions. As of December 31, 2019, the Term Loan A interest rate was 3.01 %. Interest payments are made monthly.
The Revolving Credit Facility is available for working capital and other general corporate purposes, including letters of credit. As of December 31, 2019, the Company had letters of credit totaling $5 million, which reduced funds available for borrowings under the agreement from $1 billion to $995 million. As of December 31, 2019, the Revolving Credit Facility had an average interest rate of 1.25 %. Interest payments are made monthly. All remaining principal is due upon the Revolving Credit Facility’s maturity on August 9, 2024.
Receivables Financing Facilities
In December 2017, the Company entered into a Receivables Financing Facility with a financial institution that has a borrowing limit of up to $180 million. As collateral, the Company pledges a perfected first-priority security interest in its U.S. domestically originated accounts receivable. The Company has accounted for transactions under the Receivables Financing Facility as secured borrowings. As amended during the second quarter of 2019, the Receivables Financing Facility will mature on March 29, 2021.
During the second quarter of 2019, the Company entered into an Additional Receivable Financing Facility with another financial institution, which allows for additional borrowings of up to $100 million, and thus total borrowings of up to $280 million, using U.S. domestically originated accounts receivables as collateral. The Company has also accounted for transactions under this Additional Receivables Financing Facility as secured borrowings. The Additional Receivables Financing Facility will mature on May 18, 2020.
As of December 31, 2019, the Company’s Consolidated Balance Sheets included $545 million of receivables that were pledged under the two Receivables Financing Facilities. As of December 31, 2019, $266 million had been borrowed, of which $197 million is classified as current. Borrowings under the Receivables Financing Facilities bear interest at a variable rate plus an applicable margin. As of December 31, 2019, the Receivables Financing Facilities had an average interest rate of 2.60 % and require monthly interest payments.
Both the Revolving Credit Facility and Receivables Financing Facilities include terms and conditions that limit the incurrence of additional borrowings and require that certain financial ratios be maintained at designated levels.
The Company uses interest rate swaps to manage the interest rate risk associated with its debt. See Note 11, Derivative Instruments for further information.
As of December 31, 2019, the Company was in compliance with all debt covenants.
Note 13 Leases
The Company leases certain manufacturing facilities, distribution centers, sales and administrative offices, equipment, and vehicles, which are accounted for as operating leases. Remaining lease terms are up to 13 years, with certain leases containing renewal options.
The following table presents activities associated with our operating leases during the year ended December 31, 2019 (in millions):
60
Fixed lease expenses | $ | |||
Variable lease expenses | ||||
Total lease expenses | $ | |||
Cash paid for leases | $ | |||
ROU assets obtained in exchange for lease obligations | $ | |||
Reduction of ROU assets and lease liabilities | ( | ) | ||
Net non-cash increases to ROU assets and lease liabilities | $ | |||
The variable lease expenses incurred during the year were not included in the measurement of the Company’s ROU assets and lease liabilities. Variable lease expenses consisted primarily of distribution center service costs that were based on product distribution volumes, as well as non-fixed common area maintenance, real estate taxes, and other operating costs associated with various facility leases. Expenses incurred during the year related to short term leases were not significant.
Cash payments for operating leases are included within Net cash provided by operating activities on the Consolidated Statements of Cash Flows.
ROU assets obtained in exchange for lease obligations includes new lease arrangements entered into by the Company during the year, as well as lease arrangements obtained through acquisitions. Additionally, ROU assets obtained in exchange for lease obligations include contract modifications that occurred during the year, as well as changes in assessments made during the year rendering it reasonably certain that lease renewal options will be exercised based on facts and circumstances that arose during the year.
Reductions in the Company’s ROU assets and lease liabilities were primarily related to a modification to one of the Company’s distribution center lease agreements during the fourth quarter of 2019, resulting in a reduction to fixed future lease payments. That amendment is not, however, expected to significantly affect total future lease costs, inclusive of variable lease payments.
As of December 31, 2019, the weighted average remaining term of the Company’s operating leases was approximately 6 years, and the weighted average discount rate used to measure the ROU assets and lease liabilities was approximately 6 %.
Future minimum lease payments under non-cancellable operating leases as of December 31, 2019 were as follows (in millions):
2020 | $ | |||
2021 | ||||
2022 | ||||
2023 | ||||
2024 | ||||
Thereafter | ||||
Total future minimum lease payments | $ | |||
Less: Interest | ( | ) | ||
Present value of lease liabilities | $ | |||
Reported as of December 31, 2019: | ||||
Current portion of lease liabilities | $ | |||
Long-term lease liabilities | ||||
Present value of lease liabilities | $ | |||
The current portion of lease liabilities is included within Accrued liabilities on the Consolidated Balance Sheets.
Rent expense under the Company’s operating leases during the years ended December 31, 2018 and 2017, prior to the Company’s adoption of ASC 842, was $33 million and $34 million, respectively. The Company’s total future minimum lease obligations under non-cancellable operating leases as of December 31, 2018 was comparable to those as of December 31, 2019.
61
Note 14 Commitments and Contingencies
Warranties
The following table is a summary of the Company’s accrued warranty obligations (in millions):
Year Ended December 31, | |||||||||||
Warranty Reserve | 2019 | 2018 | 2017 | ||||||||
Balance at the beginning of the year | $ | $ | $ | ||||||||
Acquisitions | |||||||||||
Warranty expense | |||||||||||
Warranties fulfilled | ( | ) | ( | ) | ( | ) | |||||
Balance at the end of the year | $ | $ | $ | ||||||||
Contingencies
The Company is subject to a variety of investigations, claims, suits, and other legal proceedings that arise from time to time in the ordinary course of business, including but not limited to, intellectual property, employment, tort, and breach of contract matters. The Company currently believes that the outcomes of such proceedings, individually and in the aggregate, will not have a material adverse impact on its business, cash flows, financial position, or results of operations. Any legal proceedings are subject to inherent uncertainties, and the Company’s view of these matters and its potential effects may change in the future.
Note 15 Share-Based Compensation
On May 17, 2018, shareholders approved the Zebra Technologies Corporation 2018 Long-Term Incentive Plan (“2018 Plan”). The 2018 Plan superseded and replaced the Zebra Technologies Corporation 2015 Long-Term Incentive Plan (“2015 Plan”) on the approval date, except that the 2015 Plan remains in effect with respect to outstanding awards under the 2015 Plan until such awards have been exercised, forfeited, canceled, expired or otherwise terminated in accordance with their terms. Together, the 2018 Plan and 2015 Plan provide for incentive compensation to the Company’s non-employee directors, officers, and employees. The awards available under the plans include stock appreciation rights, restricted stock awards, performance share awards, cash-settled stock appreciation rights, restricted stock units, performance stock units, incentive stock options, and non-qualified stock options.
The Company uses outstanding treasury shares as its source for issuing shares under the share-based compensation programs.
A summary of the equity awards available for future grants under the 2018 Plan is as follows:
Available for future grants as of December 31, 2018 | ||
Granted | ( | ) |
Available for future grants as of December 31, 2019 | ||
The compensation expense from the Company’s share-based compensation plans and associated income tax benefit, excluding the effects of excess tax benefits or shortfalls, were included in the Consolidated Statements of Operations as follows (in millions):
Year Ended December 31, | |||||||||||
Compensation costs and related income tax benefit | 2019 | 2018 | 2017 | ||||||||
Cost of sales | $ | $ | $ | ||||||||
Selling and marketing | |||||||||||
Research and development | |||||||||||
General and administration | |||||||||||
Total compensation expense | $ | $ | $ | ||||||||
Income tax benefit | $ | $ | $ | ||||||||
62
As of December 31, 2019, total unearned compensation costs related to the Company’s share-based compensation plans was $62 million, which will be amortized to expense over the weighted average remaining service period of 1.4 years.
Stock Appreciation Rights (“SARs”)
Upon exercise of SARs, the Company issues whole shares of Class A Common Stock to participants based on the difference between the fair market value of the stock at the time of exercise and the exercise price. Fractional shares are settled in cash upon exercise. The grant date fair value of SARs is expensed over the 4 -year vesting period of the related awards.
A summary of the Company’s SARs outstanding is as follows:
2019 | 2018 | 2017 | ||||||||||||||||||
SARs | SARs | Weighted- Average Exercise Price | SARs | Weighted- Average Exercise Price | SARs | Weighted- Average Exercise Price | ||||||||||||||
Outstanding at beginning of year | $ | $ | $ | |||||||||||||||||
Granted | ||||||||||||||||||||
Exercised | ( | ) | ( | ) | ( | ) | ||||||||||||||
Forfeited | ( | ) | ( | ) | ( | ) | ||||||||||||||
Expired | ( | ) | ( | ) | ||||||||||||||||
Outstanding at end of year | $ | $ | $ | |||||||||||||||||
Exercisable at end of year | $ | $ | $ | |||||||||||||||||
The fair value of share-based compensation is estimated on the date of grant using a binomial model. Volatility is based on an average of the implied volatility in the open market and the annualized volatility of the Company’s stock price over its entire stock history.
The following table shows the weighted-average assumptions used for grants of SARs, as well as the fair value of the grants based on those assumptions:
2019 | 2018 | 2017 | |||
Expected dividend yield | |||||
Forfeiture rate | |||||
Volatility | |||||
Risk free interest rate | |||||
Expected weighted-average life (in years) | |||||
Weighted-average grant date fair value of SARs granted (per underlying share) | $ | $ | $ | ||
The following table summarizes information about SARs outstanding as of December 31, 2019:
Outstanding | Exercisable | ||||||
Aggregate intrinsic value (in millions) | $ | $ | |||||
Weighted-average remaining contractual term (in years) | |||||||
The intrinsic value for SARs exercised during fiscal 2019, 2018 and 2017 was $58 million, $59 million and $14 million, respectively. The total fair value of SARs vested during fiscal 2019, 2018 and 2017 was $9 million, $12 million and $8 million, respectively.
Restricted Stock Awards (“RSAs”) and Performance Share Awards (“PSAs”)
The Company’s restricted stock grants consist of time-vested RSAs and PSAs, which hold voting rights and therefore are considered participating securities. The outstanding RSAs and PSAs are included as part of the Company’s Class A Common Stock outstanding. The RSAs and PSAs vest at each vesting date, subject to restrictions such as continuous employment, except in certain cases as set forth in each stock agreement. Upon vesting, RSAs and PSAs are released to holders and are no longer subject to restrictions. The Company’s RSAs and PSAs are expensed over the vesting period of the related award, which is
63
typically 3 years. Some awards, including those granted annually to non-employee directors, such as an equity retainer fee, vest upon grant. PSA targets are set based on certain Company-wide financial metrics. Compensation cost is calculated as the market date fair value of the Company’s Class A Common Stock on grant date multiplied by the number of shares granted, net of estimated forfeitures.
The Company also issues stock awards to non-employee directors. Each director receives an equity grant of shares annually in the month of May. The number of shares granted to each director is determined by dividing the value of the annual grant by the price of a share of the Company’s Class A Common Stock. New directors in any fiscal year earn a prorated amount. During fiscal 2019, there were 7,371 shares granted to non-employee directors compared to 7,980 and 12,488 shares granted during fiscal 2018 and 2017, respectively. The shares vest immediately upon the grant date.
A summary of information relative to the Company’s RSAs is as follows:
2019 | 2018 | 2017 | |||||||||||||||||||
Restricted Stock Awards | Shares | Weighted-Average Grant Date Fair Value | Shares | Weighted-Average Grant Date Fair Value | Shares | Weighted-Average Grant Date Fair Value | |||||||||||||||
Outstanding at beginning of year | $ | $ | $ | ||||||||||||||||||
Granted | |||||||||||||||||||||
Released | ( | ) | ( | ) | ( | ) | |||||||||||||||
Forfeited | ( | ) | ( | ) | ( | ) | |||||||||||||||
Outstanding at end of year | $ | $ | $ | ||||||||||||||||||
The fair value of each PSA granted includes assumptions around the Company’s performance goals. A summary of information relative to the Company’s PSAs is as follows:
2019 | 2018 | 2017 | |||||||||||||||||||
Performance Share Awards | Shares | Weighted-Average Grant Date Fair Value | Shares | Weighted-Average Grant Date Fair Value | Shares | Weighted-Average Grant Date Fair Value | |||||||||||||||
Outstanding at beginning of year | $ | $ | $ | ||||||||||||||||||
Granted | |||||||||||||||||||||
Released | ( | ) | ( | ) | ( | ) | |||||||||||||||
Forfeited | ( | ) | ( | ) | ( | ) | |||||||||||||||
Outstanding at end of year | $ | $ | $ | ||||||||||||||||||
Other Award Types
The Company also has cash-settled compensation awards, including cash-settled stock appreciation rights, restricted stock units and performance stock units, which are expensed over the vesting period of the related award, which is up to 4 years. Compensation cost is calculated at the fair value on grant date multiplied by the number of share-equivalents granted, and the fair value is remeasured at the end of each reporting period based on the Company’s stock price. Cash settlement is based on the fair value of share equivalents at the time of vesting, which was $6 million, $2 million and $2 million in 2019, 2018 and 2017, respectively. Share-equivalents issued under these programs totaled 17,207 , 20,393 and 45,781 in fiscal 2019, 2018 and 2017, respectively.
Non-qualified Stock Options
A summary of the Company’s non-qualified options outstanding under the Company’s 2006 Long-Term Incentive Plan is as follows:
64
2019 | 2018 | 2017 | ||||||||||||||||||
Non-qualified Options | Shares | Weighted- Average Exercise Price | Shares | Weighted- Average Exercise Price | Shares | Weighted- Average Exercise Price | ||||||||||||||
Outstanding at beginning of year | $ | $ | $ | |||||||||||||||||
Granted | ||||||||||||||||||||
Exercised | ( | ) | ( | ) | ||||||||||||||||
Forfeited | ||||||||||||||||||||
Expired | ( | ) | ||||||||||||||||||
Outstanding at end of year | $ | $ | $ | |||||||||||||||||
Exercisable at end of year | $ | $ | $ | |||||||||||||||||
The last remaining non-qualified stock options were exercised in 2018. The intrinsic value for non-qualified options exercised in fiscal 2018 and 2017 was $2 million and $8 million, respectively. Cash received from the exercise of non-qualified options was less than $1 million and approximately $5 million during fiscal 2018 and 2017, respectively. The related income tax benefit realized was $2 million and $2 million during fiscal 2018 and 2017, respectively.
Employee Stock Purchase Plan
The Zebra Technologies Corporation 2011 Employee Stock Purchase Plan (“2011 Plan”) permits eligible employees to purchase common stock at 95 % of the fair market value at the date of purchase. Employees may make purchases by cash or payroll deductions up to certain limits. The aggregate number of shares that may be purchased under the 2011 Plan is 1,500,000 shares. As of December 31, 2019, 774,186 shares were available for future purchase.
Note 16 Income Taxes
The geographical sources of income (loss) before income taxes were as follows (in millions):
Year Ended December 31, | |||||||||||
2019 | 2018 | 2017 | |||||||||
United States | $ | $ | ( | ) | $ | ( | ) | ||||
Outside United States | |||||||||||
Total | $ | $ | $ | ||||||||
Income tax expense (benefit) consisted of the following (in millions):
Year Ended December 31, | |||||||||||
2019 | 2018 | 2017 | |||||||||
Current: | |||||||||||
Federal | $ | $ | $ | ||||||||
State | ( | ) | |||||||||
Foreign | |||||||||||
Total current | $ | $ | $ | ||||||||
Deferred: | |||||||||||
Federal | ( | ) | ( | ) | |||||||
State | ( | ) | ( | ) | |||||||
Foreign | ( | ) | ( | ) | |||||||
Total deferred | $ | ( | ) | $ | $ | ( | ) | ||||
Total | $ | $ | $ | ||||||||
The Company’s effective tax rates were 9.0 %, 19.7 % and 80.7 % for the years ended December 31, 2019, 2018 and 2017, respectively.
65
A reconciliation of the U.S. federal statutory income tax rate to our actual income tax rate is provided below:
Year Ended December 31, | ||||||||
2019 | 2018 | 2017 | ||||||
Provision computed at statutory rate | % | % | % | |||||
U.S. Tax Reform - one-time transition tax | ( | ) | ||||||
Remeasurement of deferred taxes | ( | ) | ||||||
Change in valuation allowance | ( | ) | ( | ) | ||||
U.S. impact of Enterprise acquisition | ||||||||
Change in contingent income tax reserves | ( | ) | ||||||
Foreign earnings subject to U.S. taxation | ||||||||
Foreign rate differential | ( | ) | ( | ) | ( | ) | ||
Intra-entity transactions | ( | ) | ||||||
State income tax, net of federal tax benefit | ( | ) | ( | ) | ||||
Tax credits | ( | ) | ( | ) | ( | ) | ||
Equity compensation deductions | ( | ) | ( | ) | ( | ) | ||
Return to provision and other true ups | ( | ) | ( | ) | ||||
Other | ( | ) | ||||||
Provision for income taxes | % | % | % | |||||
For the year ended December 31, 2019, the Company’s effective tax rate was lower than the federal statutory rate of 21% primarily due to the favorable impacts of share-based compensation benefits, lapses of the statute of limitations on uncertain tax positions, and the generation of tax credits. These benefits were partially offset by the impacts of foreign earnings and deemed royalties taxed in the U.S.
For the year ended December 31, 2018, the Company’s effective tax rate was lower than the federal statutory rate of 21% primarily due to lower tax rates in foreign jurisdictions and the generation of tax credits. These benefits were partially offset by increases related to foreign earnings subject to U.S. taxation, the U.S. impact of the Enterprise acquisition and certain discrete items. The discrete items included the favorable impacts of reductions in valuation allowances and share-based compensation benefits, which were offset by audit settlements with the U.S. Internal Revenue Service for the fiscal years 2013, 2014, and 2015 and an increase in uncertain tax positions resulting from interpretive guidance issued during the year.
For the year ended December 31, 2017, the Company’s effective tax rate was higher than the federal statutory rate of 35%, primarily due to an increase in valuation allowance on foreign deferred tax assets, the one-time transition tax and remeasurement of net U.S. deferred tax assets under the Act, the U.S. impact of the Enterprise acquisition, and an increase in uncertain tax benefits. These expenses were partially offset by remeasurement of foreign net deferred tax assets, the benefit of lower tax rates in foreign jurisdictions, the recognition of deferred tax assets on intercompany asset transfers, the generation of tax credits and share-based compensation benefits.
The Company earns a significant amount of its operating income outside of the U.S., primarily in the United Kingdom, Singapore, and Luxembourg, with statutory rates of 19 %, 17 %, and 25 %, respectively. During 2018, the Company applied for and was granted a second extension of its incentivized tax rate by the Singapore Economic Development Board. The incentive reduces the income tax rate to 10.5 % from the statutory rate of 17 % and is effective for calendar years 2019 to 2023. The Company has committed to making additional investments in Singapore over the period 2019 to 2022; should the Company not make these investments in accordance with the agreement, any incentive benefit would have to be repaid to the Singapore tax authorities.
66
Tax effects of temporary differences that resulted in deferred tax assets and liabilities are as follows (in millions):
December 31, | |||||||
2019 | 2018 | ||||||
Deferred tax assets: | |||||||
Capitalized research expenditures | $ | $ | |||||
Deferred revenue | |||||||
Tax credits | |||||||
Net operating loss carryforwards | |||||||
Other accruals | |||||||
Inventory items | |||||||
Capitalized software costs | |||||||
Sales return/rebate reserve | |||||||
Share-based compensation expense | |||||||
Accrued bonus | |||||||
Unrealized gains and losses on securities and investments | |||||||
Valuation allowance | ( | ) | ( | ) | |||
Total deferred tax assets | $ | $ | |||||
Deferred tax liabilities: | |||||||
Depreciation and amortization | |||||||
Unrealized gains and losses on securities and investments | |||||||
Undistributed earnings | |||||||
Total deferred tax liabilities | $ | $ | |||||
Net deferred tax assets | $ | $ | |||||
In 2019, the Company reorganized its Luxembourg holding company structure which resulted in a taxable gain in Luxembourg that was offset by operating loss carryforwards. There was no net impact to the Provision for income taxes as these activities also resulted in the realization of deferred tax liabilities related to depreciation and amortization and a corresponding increase in valuation allowances.
As of December 31, 2019, the Company had approximately $410 million (tax effected) of net operating losses (“NOLs”) and approximately $29 million of credit carryforwards. Approximately $161 million of NOLs will expire beginning in 2020 through 2033, and $15 million of credits will expire beginning in 2023 through 2032, with the remaining amounts of NOLs and credit carryforwards having no expiration dates.
Impact of U.S. Tax Reform
Overview
Enacted on December 22, 2017, the Act reduced the U.S. federal corporate tax rate from 35% to 21%, requiring companies to pay a one-time transition tax on earnings of certain foreign subsidiaries that were previously tax deferred. Based on current operations, the Company is subject to the GILTI, BEAT and FDII provisions of the Act, for which we recorded income tax expense of $12 million and $10 million for the years ended December 31, 2019 and 2018, respectively. We are not currently subject to the new limitation which defers U.S. interest deductions in excess of 30% of adjusted taxable income. However, the application of the interest limitations may apply in the future, depending on changes in the Company’s business model. Additionally, the Company is no longer able to deduct performance-based compensation for its covered employees which exceeds the limitation under amended Internal Revenue Code Section 162(m). These impacts are included in the calculation of the Company’s effective tax rate.
Foreign Tax Effects
As part of the Act, the Company recognized a one-time transition tax based on its total post-1986 earnings and profits that were previously deferred from U.S. income taxes and recorded a provision related to deemed foreign inclusions through December 31, 2017 as a result of the transition tax.
As of December 31, 2019, the Company is no longer permanently reinvested with respect to its U.S. directly-owned foreign subsidiary earnings. For periods after 2017, the Company is subject to U.S. income tax on substantially all foreign earnings under the GILTI provisions of the Act, while any remaining foreign earnings are eligible for the new dividends received
67
deduction. As a result, future repatriation of earnings will no longer be subject to U.S. income tax but may be subject to currency translation gains or losses. Where required, the Company has recorded a deferred tax liability for foreign withholding taxes on current earnings. Additionally, gains and losses on any future taxable dispositions of U.S.-owned foreign affiliates continue to be subject to U.S. income tax. Thus, as a result of these changes, the assertion of permanent reinvestment is no longer applicable under current U.S. tax laws.
The Company has not recognized deferred tax liabilities in the U.S. with respect to its outside basis differences in its directly-owned foreign affiliates. It is not practicable to determine the amount of unrecognized deferred tax liabilities on these indefinitely reinvested earnings.
Performance-Based Executive Compensation
The Act amended the rules related to the exclusion of performance-based compensation under Internal Revenue Code 162(m). The Company is no longer be able to claim a deduction for compensation accrued after January 1, 2018 for any covered employee exceeding $1 million, unless the compensation is earned in relation to a binding contract in existence on November 2, 2017 (“Grandfathered Contracts”). The Company has remeasured the Section 162(m)-grandfathered deferred tax assets at 21 % for its covered employees for equity award agreements issued and executed prior to November 2, 2017. Additionally, the Company has determined that its short-term bonus plan does not qualify for the grandfathered contract provisions, and thus any associated deferred tax assets have been derecognized.
Provisional and Final Effects
During 2017, the Company provisionally recognized an income tax expense of $72 million associated with the Act, including a one-time transition tax of $37 million and $35 million remeasurement of its net U.S. deferred tax assets based on the federal statutory rate of 21%.
During 2018, the Company finalized its analysis of the Act, including the one-time transition tax and measurement of net deferred tax assets, and recorded a $3 million income tax benefit as a result of differences between its final analysis and provisional analysis from the prior year. The final analysis included both federal and state tax effects based on legislative pronouncements through December 31, 2018. The Company also utilized a total of $28 million of available net operating losses, research and development credits, alternative minimum tax credits, and foreign tax credits in order to reduce its future cash payments for the one-time transition tax.
During 2019, there were no retroactive law changes that impacted the 2018 reassessment.
Unrecognized tax benefits
A reconciliation of the beginning and ending amount of unrecognized tax benefits is as follows (in millions):
Year ended December 31, | |||||||
2019 | 2018 | ||||||
Balance at beginning of year | $ | $ | |||||
Additions for tax positions related to the current year | |||||||
Additions for tax positions related to prior years | |||||||
Reductions for tax positions related to prior years | ( | ) | ( | ) | |||
Settlements for tax positions | ( | ) | ( | ) | |||
Lapse of statutes | ( | ) | |||||
Balance at end of year | $ | $ | |||||
As of December 31, 2019 and December 31, 2018, there were $9 million and $48 million, respectively, of unrecognized tax benefits that, if recognized, would affect the annual effective tax rate. The Company is currently undergoing U.S. federal income tax audits for the tax years 2016 and 2017. Fiscal 2004 through 2018 remain open to examination by multiple foreign and U.S. state taxing jurisdictions.
In the fourth quarter of fiscal 2019, the Company settled and made payment for a tax dispute for $19 million. Additionally, the statute of limitations on the U.S. federal income tax audit years 2013, 2014 and 2015 lapsed, resulting in a total benefit of $20 million during fiscal 2019. As of December 31, 2019, no other significant uncertain tax positions are expected to be settled within the next twelve months. Due to uncertainties in any tax audit or litigation outcome, the Company’s estimates of the ultimate settlement or other uncertain tax positions may change and the actual tax benefits may differ significantly from estimates.
68
Note 17 Earnings Per Share
Basic net earnings per share is calculated by dividing net income by the weighted average number of common shares outstanding for the period. Diluted earnings per share is computed by dividing net income by the weighted average number of shares assuming dilution. Dilutive common shares outstanding is computed using the Treasury Stock method and, in periods of income, reflects the additional shares that would be outstanding if dilutive stock options were exercised for common shares during the period.
Earnings per share (in millions, except share data):
Year Ended December 31, | |||||||||||
2019 | 2018 | 2017 | |||||||||
Basic: | |||||||||||
Net income | $ | $ | $ | ||||||||
Weighted-average shares outstanding | |||||||||||
Basic earnings per share | $ | $ | $ | ||||||||
Diluted: | |||||||||||
Net income | $ | $ | $ | ||||||||
Weighted-average shares outstanding | |||||||||||
Dilutive shares | |||||||||||
Diluted weighted-average shares outstanding | |||||||||||
Diluted earnings per share | $ | $ | $ | ||||||||
Anti-dilutive options to purchase common shares are excluded from diluted earnings per share calculations. Anti-dilutive options consist primarily of SARs with an exercise price greater than the average market closing price of the Class A Common Stock. There were 47,240 , 72,856 , and 259,142 shares that were anti-dilutive for the years ended December 31, 2019, 2018, and 2017, respectively.
Note 18 Accumulated Other Comprehensive Income (Loss)
Stockholders’ equity includes certain items classified as AOCI, including:
• | Unrealized gain (loss) on anticipated sales hedging transactions relates to derivative instruments used to hedge the exposure related to currency exchange rates for forecasted Euro sales. These hedges are designated as cash flow hedges, and the Company defers income statement recognition of gains and losses until the hedged transaction occurs. See Note 11, Derivative Instruments for more details. |
• | Unrealized gain (loss) on forward interest rate swaps hedging transactions refers to the hedging of the interest rate risk exposure associated with the Company’s variable rate debt. As a result of the Company’s debt refinancing during the third quarter of 2019, remaining losses associated with terminated interest rate swaps were recognized as a component of Interest expense, net on the Consolidated Statements of Operations. See Note 12, Long-Term Debt for more details. |
• | Foreign currency translation adjustments relate to the Company’s non-U.S. subsidiary companies that have designated a functional currency other than the U.S. Dollar. The Company is required to translate the subsidiary functional currency financial statements to U.S. Dollars using a combination of historical, period-end, and average foreign exchange rates. This combination of rates creates the foreign currency translation adjustment component of AOCI. |
69
The changes in each component of AOCI during the three years ended December 31, 2019, 2018 and 2017 were as follows (in millions):
Unrealized gain (loss) on sales hedging | Unrealized gain (loss) on forward interest rate swaps | Foreign currency translation adjustments | Total | ||||||||||||
Balance at December 31, 2016 | $ | $ | ( | ) | $ | ( | ) | $ | ( | ) | |||||
Other comprehensive (loss) income before reclassifications | ( | ) | ( | ) | |||||||||||
Amounts reclassified from AOCI(1) | |||||||||||||||
Tax effect | ( | ) | |||||||||||||
Other comprehensive loss (income), net of tax | ( | ) | ( | ) | |||||||||||
Balance at December 31, 2017 | ( | ) | ( | ) | ( | ) | ( | ) | |||||||
Other comprehensive income (loss) before reclassifications | ( | ) | |||||||||||||
Amounts reclassified from AOCI(1) | ( | ) | ( | ) | |||||||||||
Tax effect | ( | ) | ( | ) | ( | ) | |||||||||
Other comprehensive income (loss), net of tax | ( | ) | |||||||||||||
Balance at December 31, 2018 | ( | ) | ( | ) | |||||||||||
Other comprehensive income before reclassifications | |||||||||||||||
Amounts reclassified from AOCI(1) | ( | ) | ( | ) | |||||||||||
Tax effect | ( | ) | |||||||||||||
Other comprehensive income (loss), net of tax | ( | ) | ( | ) | |||||||||||
Balance at December 31, 2019 | $ | $ | $ | ( | ) | $ | ( | ) | |||||||
(1) See Note 11, Derivative Instruments regarding timing of reclassifications to operating results.
Note 19 Accounts Receivable Factoring
In 2018, the Company entered into a Receivables Factoring arrangement, pursuant to which certain receivables originated from the EMEA region are sold to a bank in exchange for cash. In the third quarter of 2019, the Company entered into an additional Receivables Factoring arrangement, which provides for additional sales of EMEA-originated receivables to a bank under similar terms. Under these Receivables Factoring arrangements, the Company does not maintain any beneficial interest in the receivables sold. The banks’ purchase of eligible receivables is subject to a maximum of $125 million of uncollected receivables. The Company services the receivables on behalf of the banks, but otherwise maintains no significant continuing involvement with respect to the receivables. Transactions under the Receivables Factoring arrangements are accounted for as sales under ASC 860 with related cash flows reflected in operating cash flows. As of December 31, 2019 and December 31, 2018 there were $60 million and $33 million, respectively, of uncollected receivables that had been sold and removed from the Company’s Consolidated Balance Sheets.
In its capacity as servicer of factored receivables, the Company had $33 million of cash collections that were not yet remitted to the banks as of December 31, 2019 due to the timing of collection processing activities. These amounts, whose use is not legally restricted, are included within Accrued liabilities on the Consolidated Balance Sheets and reflected within financing activities on the Consolidated Statements of Cash Flows. No liability existed as of December 31, 2018. Changes in such unremitted cash collection liabilities are reflected within financing cash flows.
Fees incurred in connection with these arrangements were not significant.
Note 20 Segment Information & Geographic Data
Segment results
The Company’s operations consist of two reportable segments: Asset Intelligence & Tracking (“AIT”) and Enterprise Visibility & Mobility (“EVM”). The reportable segments have been identified based on the financial data utilized by the Company’s Chief Executive Officer (the chief operating decision maker or “CODM”) to assess segment performance and allocate resources
70
among the Company’s segments. The CODM reviews adjusted operating income to assess segment profitability. To the extent applicable, segment operating income excludes purchase accounting adjustments, amortization of intangible assets, acquisition and integration costs, impairment of goodwill and other intangibles, exit and restructuring costs, and product sourcing diversification costs. Segment assets are not reviewed by the Company’s CODM and therefore are not disclosed below.
Financial information by segment is presented as follows (in millions):
Year Ended December 31, | |||||||||||
2019 | 2018 | 2017 | |||||||||
Net sales: | |||||||||||
AIT | $ | $ | $ | ||||||||
EVM | |||||||||||
Total segment net sales | |||||||||||
Corporate, eliminations(1) | ( | ) | |||||||||
Total Net sales | $ | $ | $ | ||||||||
Operating income: | |||||||||||
AIT(2)(3) | $ | $ | $ | ||||||||
EVM(2)(3) | |||||||||||
Total segment operating income | |||||||||||
Corporate, eliminations(4) | ( | ) | ( | ) | ( | ) | |||||
Total Operating income | $ | $ | $ | ||||||||
(1) | Amounts included in Corporate, eliminations consist of purchase accounting adjustments related to the Enterprise Acquisition. |
(2) | During 2018, the Company revised its methodology for allocating certain operating expenses across its |
(3) | AIT and EVM segment operating income includes depreciation and share-based compensation expense. The amounts of depreciation and share-based compensation attributable expense to AIT and EVM are proportionate to each segment’s Net sales. |
(4) | To the extent applicable, amounts included in Corporate, eliminations consist of purchase accounting adjustments, amortization of intangible assets, acquisition and integration costs, impairment of goodwill and other intangibles, exit and restructuring costs, and product sourcing diversification costs. |
Sales to significant customers
Our Net sales to significant customers as a percentage of the total Company’s Net sales by segment were as follows:
Year Ended December 31, | ||||||||||||||||||||||||||
2019 | 2018 | 2017 | ||||||||||||||||||||||||
AIT | EVM | Total | AIT | EVM | Total | AIT | EVM | Total | ||||||||||||||||||
Customer A | % | % | % | % | % | % | % | % | % | |||||||||||||||||
Customer B | % | % | % | % | % | % | % | % | % | |||||||||||||||||
Customer C | % | % | % | % | % | % | % | % | % | |||||||||||||||||
All three of the above customers are distributors and not end-users. No other customer accounted for 10% or more of total Net sales during the years presented.
The Company’s three largest customers accounted for 16.8 %, 7.8 %, and 20.6 %, respectively, of accounts receivable as of December 31, 2019, and 23.0 %, 16.9 % and 14.6 %, respectively, of accounts receivable as of December 31, 2018. No other customer accounted for more than 10% of accounts receivable.
Geographic data
71
Information regarding the Company’s operations by geographic area is contained in the following tables. Net sales amounts are attributed to geographic area based on customer location.
Net sales by region was as follows (in millions):
Year Ended December 31, | |||||||||||
2019 | 2018 | 2017 | |||||||||
North America | $ | $ | $ | ||||||||
EMEA | |||||||||||
Asia-Pacific | |||||||||||
Latin America | |||||||||||
Total Net sales | $ | $ | $ | ||||||||
The United States and Germany were the only countries that accounted for more than 10% of the Company’s net sales in 2019, 2018, and 2017. Net sales during these years was as follows (in millions):
Year Ended December 31, | |||||||||||
2019 | 2018 | 2017 | |||||||||
United States | $ | $ | $ | ||||||||
Germany | |||||||||||
Other | |||||||||||
Total Net sales | $ | $ | $ | ||||||||
For the year ended December 31, 2019, the Company presented revenues by major country on the same basis as revenues by region, based on customer location. Prior to fiscal 2019, the Company presented revenues by major country based on the country where products, solutions, and services were invoiced from. Revenues by major country for the years ended December 31, 2018 and December 31, 2017 are presented above based on the location of customer, in order to conform to the same basis of presentation as the current year.
Geographic data for long-lived assets is as follows (in millions):
Year Ended December 31, | |||||||||||
2019 | 2018 | 2017 | |||||||||
North America | $ | $ | $ | ||||||||
EMEA | |||||||||||
Asia-Pacific | |||||||||||
Latin America | |||||||||||
Total long-lived assets | $ | $ | $ | ||||||||
Long-lived assets are defined by the Company as property, plant and equipment as well as ROU assets. ROU assets were recognized upon adoption of ASC 842 in 2019, prior to which, there were no long-lived assets related to leasing activities. Primarily all of the Company’s long-lived assets in the North America region are located in the United States.
Note 21 Supplementary Financial Information
72
The components of Accrued liabilities are as follows (in millions):
December 31, | |||||||
2019 | 2018 | ||||||
Accrued incentive compensation | $ | $ | |||||
Customer reserves | |||||||
Accrued payroll | |||||||
Accrued warranty | |||||||
Current portion of lease liabilities | — | ||||||
Unremitted cash collections due to banks on factored accounts receivable | |||||||
Accrued freight and duty | |||||||
Accrued other expenses | |||||||
Accrued liabilities | $ | $ | |||||
Summary of Quarterly Results of Operations (unaudited, in millions):
2019 | |||||||||||||||||||
First Quarter | Second Quarter | Third Quarter | Fourth Quarter | Total Year | |||||||||||||||
Total Net sales | $ | $ | $ | $ | $ | ||||||||||||||
Gross profit | |||||||||||||||||||
Net income | |||||||||||||||||||
Net earnings per common share: | |||||||||||||||||||
Basic earnings per share: | $ | $ | $ | $ | $ | ||||||||||||||
Diluted earnings per share: | |||||||||||||||||||
2018 | |||||||||||||||||||
First Quarter | Second Quarter | Third Quarter | Fourth Quarter | Total Year | |||||||||||||||
Net sales | $ | $ | $ | $ | $ | ||||||||||||||
Gross profit | |||||||||||||||||||
Net income | |||||||||||||||||||
Net earnings per common share: | |||||||||||||||||||
Basic earnings per share: | $ | $ | $ | $ | $ | ||||||||||||||
Diluted earnings per share: | |||||||||||||||||||
73
Item 9. | Changes in and Disagreements with Accountants on Accounting and Financial Disclosure |
None.
Item 9A. | Controls and Procedures |
Evaluation of Disclosure Controls and Procedures
We conducted an evaluation of the effectiveness of the design and operation of our disclosure controls and procedures (as defined in Rules 13a-15(e) and 15d-15(e) under the Securities Exchange Act of 1934 (the “Exchange Act”)) as of the end of the period covered by this Form 10-K. The evaluation was conducted under the supervision of our Disclosure Committee, and with the participation of management, including our Chief Executive Officer and Chief Financial Officer. Based on that evaluation, our Chief Executive Officer and Chief Financial Officer have concluded that our disclosure controls and procedures were effective to provide reasonable assurance that (i) the information required to be disclosed by us in this Form 10-K was recorded, processed, summarized and reported within the time periods specified in the SEC’s rules and forms, and (ii) information required to be disclosed by us in our reports that we file or furnish under the Exchange Act is accumulated and communicated to our management, including our principal executive and principal financial officers, or persons performing similar functions, as appropriate to allow timely decisions regarding required disclosure.
Management’s Report on Internal Control over Financial Reporting
Our management is responsible for establishing and maintaining adequate internal control over financial reporting as defined in Rules 13a-15(f) and 15d-15(f) under the Exchange Act to provide reasonable assurance regarding the reliability of our financial reporting and the preparation of financial statements for external purposes in accordance with generally accepted accounting principles. Our management assessed the effectiveness of our internal control over financial reporting as of December 31, 2019. In making this assessment, our management used the criteria set forth by the Committee of Sponsoring Organizations of the Treadway Commission in Internal Control-Integrated Framework as released in 2013. Based on this assessment and those criteria, our management believes that, as of December 31, 2019, our internal control over financial reporting is effective.
Our independent registered public accounting firm, Ernst & Young LLP, has issued an attestation report on Zebra’s internal control over financial reporting. Ernst & Young LLP’s report is included in the latter portion of this Item 9A.
Changes in Internal Control over Financial Reporting
There were no changes in the Company’s internal control over financial reporting during the fourth quarter of 2019, which were identified in connection with management’s evaluation required by paragraph (d) of Rules 13a-15 and 15d-15 under the Exchange Act, that have materially affected, or are reasonably likely to materially affect, the Company’s internal control over financial reporting.
Inherent Limitations on the Effectiveness of Controls
Our management, including our Chief Executive Officer and Chief Financial Officer, does not expect that our disclosure controls and procedures or our internal controls will prevent or detect all errors and all fraud. A control system, no matter how well conceived and operated, can provide only reasonable, not absolute, assurance that the objectives of the control system are met. Further, the design of a control system must reflect the fact that there are resource constraints, and the benefits of controls must be considered relative to their costs. Because of the inherent limitations in all control systems, no evaluation of controls can provide absolute assurance that misstatements due to error or fraud will not occur or that all control issues and instances of fraud, if any, within Zebra have been prevented or detected. These inherent limitations include the realities that judgments in decision-making can be faulty and that breakdowns can occur because of simple error or mistake. Controls can also be circumvented by the individual acts of some persons, by collusion of two or more people, or by management override of the controls. The design of any system of controls is based in part on certain assumptions about the likelihood of future events, and there can be no assurance that any design will succeed in achieving its stated goals under all potential future conditions. Projections of any evaluation of controls effectiveness to future periods are subject to risks. Over time, controls may become inadequate because of changes in conditions or deterioration in the degree of compliance with policies or procedures.
74
Report of Independent Registered Public Accounting Firm
To the Shareholders and the Board of Directors of Zebra Technologies Corporation
Opinion on Internal Control over Financial Reporting
We have audited Zebra Technologies Corporation and subsidiaries internal control over financial reporting as of December 31, 2019, based on criteria established in Internal Control-Integrated Framework issued by the Committee of Sponsoring Organizations of the Treadway Commission (2013 framework) (the COSO criteria). In our opinion, Zebra Technologies Corporation (the “Company”) maintained, in all material respects, effective internal control over financial reporting as of December 31, 2019, based on the COSO criteria.
We also have audited, in accordance with the standards of the Public Company Accounting Oversight Board (United States) (PCAOB), the consolidated balance sheets of the Zebra Technologies Corporation as of December 31, 2019 and 2018, the related consolidated statements of operations, comprehensive income, stockholders’ equity, and cash flows, for each of the three years in the period ended December 31, 2019, and the related notes and financial statement schedule listed in the Index at Item 15 and our report dated February 13, 2020 expressed an unqualified opinion thereon.
Basis for Opinion
The Company’s management is responsible for maintaining effective internal control over financial reporting and for its assessment of the effectiveness of internal control over financial reporting included in the accompanying Management’s Report on Internal Control over Financial Reporting. Our responsibility is to express an opinion on the Company’s internal control over financial reporting based on our audit. We are a public accounting firm registered with the PCAOB and are required to be independent with respect to the Company in accordance with the U.S. federal securities laws and the applicable rules and regulations of the Securities and Exchange Commission and the PCAOB.
We conducted our audit in accordance with the standards of the PCAOB. Those standards require that we plan and perform the audit to obtain reasonable assurance about whether effective internal control over financial reporting was maintained in all material respects.
Our audit included obtaining an understanding of internal control over financial reporting, assessing the risk that a material weakness exists, testing and evaluating the design and operating effectiveness of internal control based on the assessed risk, and performing such other procedures as we considered necessary in the circumstances. We believe that our audit provides a reasonable basis for our opinion.
Definition and Limitations of Internal Control Over Financial Reporting
A company’s internal control over financial reporting is a process designed to provide reasonable assurance regarding the reliability of financial reporting and the preparation of financial statements for external purposes in accordance with generally accepted accounting principles. A company’s internal control over financial reporting includes those policies and procedures that (1) pertain to the maintenance of records that, in reasonable detail, accurately and fairly reflect the transactions and dispositions of the assets of the company; (2) provide reasonable assurance that transactions are recorded as necessary to permit preparation of financial statements in accordance with generally accepted accounting principles, and that receipts and expenditures of the company are being made only in accordance with authorizations of management and directors of the company; and (3) provide reasonable assurance regarding prevention or timely detection of unauthorized acquisition, use, or disposition of the company’s assets that could have a material effect on the financial statements.
Because of its inherent limitations, internal control over financial reporting may not prevent or detect misstatements. Also, projections of any evaluation of effectiveness to future periods are subject to the risk that controls may become inadequate because of changes in conditions, or that the degree of compliance with the policies or procedures may deteriorate.
/s/Ernst & Young LLP
Chicago, Illinois
February 13, 2020
75
Item 9B. | Other Information |
Not applicable.
76
PART III
Item 10. | Directors, Executive Officers and Corporate Governance |
We have adopted a Code of Ethics for Senior Financial Officers (“Code of Ethics”) that applies to Zebra’s Chief Executive Officer, Chief Financial Officer and the Chief Accounting Officer. The Code of Ethics is posted on the Investor Relations – Governance Documents page of Zebra’s Internet web site, www.zebra.com, and is available for download. Any waiver from the Code of Ethics and any amendment to the Code of Ethics will be disclosed on such page of Zebra’s web site.
All other information in response to this item is incorporated by reference from the Proxy Statement sections entitled “Corporate Governance,” “Election of Directors,” “Committees of the Board,” “Executive Officers,” and “Delinquent Section 16(a) Reports.”
Item 11. | Executive Compensation |
The information in response to this item is incorporated by reference from the Proxy Statement sections entitled “Compensation Discussion and Analysis,” “Executive Compensation,” “Director Compensation,” “Executive Compensation – Compensation Committee Interlocks and Insider Participation” and “Compensation Committee Report.”
Item 12. | Security Ownership of Certain Beneficial Owners and Management and Related Stockholder Matters |
The information in response to this item is incorporated by reference from the Proxy Statement sections entitled “Ownership of our Common Stock” and “Executive Compensation – Equity Compensation Plan Information.”
Item 13. | Certain Relationships and Related Transactions, and Director Independence |
The information in response to this item is incorporated by reference from the Proxy Statement sections entitled “Corporate Governance – Related Party Transactions,” “Corporate Governance – Director Independence,” “Election of Directors,” and “Committees of the Board.”
Item 14. | Principal Accounting Fees and Services |
The information in response to this item is incorporated by reference from the Proxy Statement section entitled “Fees of Independent Auditors.”
77
PART IV
Item 15. | Exhibits, Financial Statements and Schedules |
Index to Consolidated Financial Statements
PAGE | |||
Index to Financial Statement Schedules
PAGE | |||
All other financial statement schedules are omitted because they are not applicable to the Company. | |||
Index to Exhibits
Incorporated by Reference | ||||||||||
Exhibit Number | Exhibit Description | Form | Exhibit Number | Filing Date or Period End Date | Filed or Furnished Within | |||||
3.1(i) | 8-K | 3.1(i) | August 16, 2012 | |||||||
3.1(ii) | 8-K | 3(ii) | January 10, 2013 | |||||||
4.1 | 10-K | 4.1 | December 31, 2017 | |||||||
4.2 | X | |||||||||
10.1 | 10-K | 10.25 | December 31, 2008 | |||||||
10.2 | 10-K | 10.3 | December 31, 2016 | |||||||
10.3 | 8-K | 10.3 | January 5, 2009 | |||||||
10.4 | 10-K | 10.6 | December 31, 2016 | |||||||
10.5 | 8-K | 10.4 | May 29, 2008 | |||||||
10.6 | 8-K | 10.2 | December 8, 2008 | |||||||
10.7 | 8-K | 10.1 | May 15, 2006 | |||||||
10.8 | 8-K | 10.1 | December 8, 2008 | |||||||
78
Incorporated by Reference | ||||||||||
Exhibit Number | Exhibit Description | Form | Exhibit Number | Filing Date or Period End Date | Filed or Furnished Within | |||||
10.9 | 10-Q | 10.1 | June 28, 2014 | |||||||
10.10 | 10-K | 10.11 | December 31, 2017 | |||||||
10.11 | S-8 | 4.1 | June 1, 2018 | |||||||
10.12 | 10-Q | 10.4 | March 29, 2008 | |||||||
10.13 | 10-Q | 10.1 | October 2, 2010 | |||||||
10.14 | 10-Q | 10.10 | April 3, 2010 | |||||||
10.15 | 10-Q | 10.11 | April 3, 2010 | |||||||
10.16 | 10-Q | 10.1 | June 30, 2012 | |||||||
10.17 | 10-Q | 10.1 | March 30, 2013 | |||||||
10.18 | 10-Q | 10.1 | April 1, 2017 | |||||||
10.19 | 10-Q | 10.2 | June 30, 2018 | |||||||
10.20 | 10-Q | 10.2 | June 29, 2019 | |||||||
10.21 | 10-Q | 10.4 | June 30, 2012 | |||||||
10.22 | 10-Q | 10.4 | March 30, 2013 | |||||||
10.23 | 10-Q | 10.2 | April 1, 2017 | |||||||
10.24 | 10-Q | 10.5 | June 30, 2018 | |||||||
10.25 | 10-Q | 10.5 | June 29, 2019 | |||||||
10.26 | 10-Q | 10.8 | April 3, 2010 | |||||||
10.27 | 8-K | 10.3 | May 20, 2011 | |||||||
10.28 | 10-Q | 10.7 | June 30, 2012 | |||||||
10.29 | 10-Q | 10.2 | March 29, 2014 | |||||||
10.30 | 10-Q | 10.3 | June 30, 2018 | |||||||
10.31 | 10-Q | 10.3 | June 29, 2019 | |||||||
10.32 | 10-Q | 10.2 | July 4, 2015 | |||||||
10.33 | 10-Q | 10.1 | June 30, 2018 | |||||||
10.34 | 10-Q | 10.1 | June 29, 2019 | |||||||
10.35 | 10-Q | 10.5 | March 30, 2013 | |||||||
79
Incorporated by Reference | ||||||||||
Exhibit Number | Exhibit Description | Form | Exhibit Number | Filing Date or Period End Date | Filed or Furnished Within | |||||
10.36 | 10-Q | 10.6 | June 30, 2018 | |||||||
10.37 | 10-Q | 10.6 | June 29, 2019 | |||||||
10.38 | 10-Q | 10.1 | July 4, 2015 | |||||||
10.39 | 10-Q | 10.4 | June 30, 2018 | |||||||
10.40 | 10-Q | 10.4 | June 29, 2019 | |||||||
10.41 | 10-Q | 10.1 | July 1, 2017 | |||||||
10.42 | 10-Q | 10.7 | June 30, 2018 | |||||||
10.43 | 10-Q | 10.1 | September 28, 2019 | |||||||
10.44 | 10-Q | 10.2 | September 28, 2019 | |||||||
10.45 | 10-K | 10.34 | December 31, 2017 | |||||||
10.46 | 10-K | 10.35 | December 31, 2017 | |||||||
10.47 | 10-K | 10.36 | December 31, 2017 | |||||||
10.48 | 10-K | 10.37 | December 31, 2017 | |||||||
10.49 | 10-K | 10.43 | December 31, 2018 | |||||||
10.50 | 10-Q | 10.3 | September 28, 2019 | |||||||
21.1 | X | |||||||||
23.1 | X | |||||||||
80
Incorporated by Reference | ||||||||||
Exhibit Number | Exhibit Description | Form | Exhibit Number | Filing Date or Period End Date | Filed or Furnished Within | |||||
31.1 | X | |||||||||
31.2 | X | |||||||||
32.1 | X | |||||||||
32.2 | X | |||||||||
101 | The following financial information from Zebra Technologies Corporation Annual Report on Form 10-K, for the year ended December 31, 2019, formatted in Inline XBRL: (i) the Consolidated Balance Sheets; (ii) the Consolidated Statements of Operations; (iii) the Consolidated Statements of Comprehensive Income; (iv) the Consolidated Statements of Stockholders’ Equity; (v) the Consolidated Statements of Cash Flows; and (vi) Notes to Consolidated Financial Statements. The instance document does not appear in the interactive data file because Inline XBRL tags are embedded in the iXBRL document. | |||||||||
104 | The cover page from the Company’s Annual Report on Form 10-K for the year ended December 31, 2019, formatted in Inline XBRL (included in Exhibit 101). | |||||||||
+ Management contract or compensatory plan or arrangement required to be filed as an exhibit to this Annual Report on Form 10-K.
Item 16. Form 10-K Summary
None.
81
SIGNATURES
Pursuant to the requirements of Section 13 or 15(d) of the Securities Exchange Act of 1934, the Registrant has duly caused this report to be signed on its behalf by the undersigned, thereunto duly authorized, on the 13th day of February 2020.
ZEBRA TECHNOLOGIES CORPORATION |
By: /s/ Anders Gustafsson |
Anders Gustafsson |
Chief Executive Officer |
Pursuant to the requirements of the Securities and Exchange Act of 1934, the report has been signed below by the following persons in the capacities and on the dates indicated.
Signature | Title | Date |
/s/ Anders Gustafsson Anders Gustafsson | Chief Executive Officer and Director (Principal Executive Officer) | February 13, 2020 |
/s/ Olivier Leonetti Olivier Leonetti | Chief Financial Officer (Principal Financial Officer) | February 13, 2020 |
/s/ Colleen M. O’Sullivan Colleen M. O’Sullivan | Vice President, Chief Accounting Officer (Principal Accounting Officer) | February 13, 2020 |
/s/ Michael A. Smith Michael A. Smith | Director and Chairman of the Board of Directors | February 13, 2020 |
/s/ Andrew K. Ludwick Andrew K. Ludwick | Director | February 13, 2020 |
/s/ Ross W. Manire Ross W. Manire | Director | February 13, 2020 |
/s/ Richard L. Keyser Richard L. Keyser | Director | February 13, 2020 |
/s/ Janice M. Roberts Janice M. Roberts | Director | February 13, 2020 |
/s/ Chirantan J. Desai Chirantan J. Desai | Director | February 13, 2020 |
/s/ Frank B. Modruson Frank B. Modruson | Director | February 13, 2020 |
82
ZEBRA TECHNOLOGIES CORPORATION AND SUBSIDIARIES
Schedule II
Valuation and Qualifying Accounts
(In millions)
Additions | ||||||||||||||||||||
Description | Balance at Beginning of Period | Charged to Costs and Expenses | Charged to Other Accounts(1) | Deductions | Balance at End of Period | |||||||||||||||
Valuation account for accounts receivable: | ||||||||||||||||||||
Year ended December 31, 2019 | $ | $ | $ | $ | $ | |||||||||||||||
Year ended December 31, 2018 | ||||||||||||||||||||
Year ended December 31, 2017 | ||||||||||||||||||||
Valuation account for deferred tax assets: | ||||||||||||||||||||
Year ended December 31, 2019 | $ | $ | $ | $ | $ | |||||||||||||||
Year ended December 31, 2018 | ||||||||||||||||||||
Year ended December 31, 2017 | ||||||||||||||||||||
(1) | This amount relates to our 2019 Luxembourg reorganization activities, which resulted in the realization of deferred tax liabilities related to depreciation and amortization and a corresponding increase in valuation allowances, with no net impact to our provision for income taxes. See Note 16, Income Taxes in the Notes to Consolidated Financial Statements for further information. |
See accompanying report of independent registered public accounting firm.
83