UNITED STATES
SECURITIES AND EXCHANGE COMMISSION
Washington, D.C. 20549
FORM
CERTIFIED SHAREHOLDER REPORT OF REGISTERED MANAGEMENT
INVESTMENT COMPANIES
| Investment Company Act file number: | 811-06342 |
| Exact name of registrant as specified in charter: | |
| Address of principal executive offices: | 1900 Market Street, Suite 200 |
| Philadelphia, PA 19103 | |
| Name and address of agent for service: | Sharon Ferrari |
| abrdn Inc. | |
| 1900 Market Street, Suite 200 | |
| Philadelphia, PA 19103 | |
| Registrant’s telephone number, including area code: | 1-800-522-5465 |
| Date of fiscal year end: | October 31 |
| Date of reporting period: | April 30, 2023 |
Item 1. Reports to Stockholders.
(a) A copy of the report transmitted to shareholders pursuant to Rule 30e-1 under the Investment Company Act of 1940 (the “1940 Act”) is filed herewith.


| 1 | Past performance is no guarantee of future results. Investment returns and principal value will fluctuate and shares, when sold, may be worth more or less than original cost. Current performance may be lower or higher than the performance quoted. Net asset value return data include investment management fees, custodial charges and administrative fees (such as Director and legal fees) and assumes the reinvestment of all distributions. |
| 2 | Assuming the reinvestment of dividends and distributions. |
| 3 | The Fund’s total return is based on the reported NAV for each financial reporting period end and may differ from what is reported on the Financial Highlights due to financial statement rounding or adjustments. |
| 4 | Blended Benchmark as defined in Total Investment Return section on Page 5. |
| abrdn Global Income Fund, Inc. | 1 |
| 2 | abrdn Global Income Fund, Inc. |
| • | Visit: https://www.abrdn.com/en-us/cefinvestorcenter |
| • | Email: Investor.Relations@abrdn.com; or |
| • | Call: 1-800-522-5465 (toll free in the U.S.). |
President
| abrdn Global Income Fund, Inc. | 3 |
| 4 | abrdn Global Income Fund, Inc. |
| abrdn Global Income Fund, Inc. | 5 |
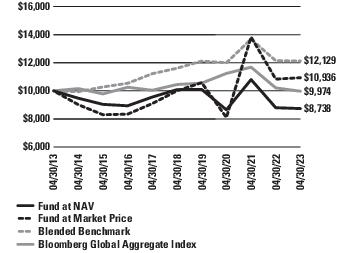
| 6 Months | 1 Year | 3 Years | 5 Years | 10 Years | |
| Net Asset Value (NAV) | 12.41% | -0.69% | 0.33% | -2.83% | -1.34% |
| Market Price | 22.65% | 0.92% | 10.52% | 1.80% | 0.90% |
| Blended Benchmark* | 9.92% | -0.14% | 0.35% | 0.87% | 1.95% |
| Bloomberg Global Aggregate Index1 | 8.92% | -2.31% | -3.91% | -0.93% | -0.03% |
| * | The blended benchmark is summarized in the table below: |
| Constituent Index | Weight |
| ICE Bank of America Merrill Lynch Australian Government Bond Index2 | 10.0% |
| ICE Bank of America Merrill Lynch New Zealand Government Bond Index3 | 5.0% |
| iBoxx Asia Government (U.S. dollar unhedged)4 | 25.0% |
| J.P. Morgan Emerging Markets Bond (EMBI) Global Diversified Index5 | 35.0% |
| ICE Bank of America Global High Yield Constrained Index6 | 25.0% |
| 1 | The Bloomberg Global Aggregate Index is a measure of global investment grade debt from 24 local currency markets. This multi-currency benchmark includes treasury, government-related, corporate and securitized fixed-rate bonds from both developed and emerging markets issuers. |
| 2 | The ICE Bank of America Merrill Lynch Australian Government Bond Index tracks the performance of AUD denominated sovereign debt publicly issued by the Australian government in its domestic market. |
| 3 | The ICE Bank of America Merrill Lynch New Zealand Government Bond Index tracks the performance of NZD denominated sovereign debt publicly issued by the New Zealand government in its domestic market. |
| 4 | The iBoxx Asia Government (U.S. dollar unhedged) tracks the performance of local currency-denominated sovereign and quasi-sovereign debt from 11 Asian countries/territories. |
| 5 | The J.P. Morgan Emerging Markets Bond (EMBI) Global Diversified Index is a comprehensive global local emerging markets index comprising liquid, fixed rate, domestic currency government bonds. |
| 6 | The ICE Bank of America Global High Yield Constrained Index contains all securities in the ICE BofA Global High Yield Index but caps issuer exposure at 2%. Index constituents are capitalization-weighted, based on their current amount outstanding, provided the total allocation to an individual issuer does not exceed 2%. Issuers that exceed the limit are reduced to 2% and the face value of each of their bonds is adjusted on a pro-rata basis. |
| 6 | abrdn Global Income Fund, Inc. |
| abrdn Global Income Fund, Inc. | 7 |
| Date | AAA/Aaa % | AA/Aa % | A % | BBB/Baa % | BB/Ba % | B % | CCC/CC/C % | D % | NR % |
| April 30, 2023 | 1.6 | 2.2 | 5.0 | 24.4 | 31.9 | 20.2 | 6.6 | 0.0 | 8.1 |
| October 31, 2022 | 1.7 | 2.6 | 4.9 | 11.9 | 34.9 | 24.1 | 6.9 | 0.2 | 13.5 |
| April 30, 2022 | 1.8 | 2.4 | 3.1 | 9.6 | 34.3 | 27.9 | 7.8 | 0.2 | 13.6 |
| (1) | For financial reporting purposes, credit quality ratings shown above reflect the lowest rating assigned by either S&P, Moody’s or Fitch if ratings differ. These rating agencies are independent, nationally recognized statistical rating organizations and are widely used. Investment grade ratings are credit ratings of BBB/Baa or higher. Below investment grade ratings are credit ratings of BB/Ba or lower. Investments designated NR are not rated by these rating agencies. Unrated investments do not necessarily indicate low credit quality. Credit quality ratings are subject to change. The Investment Manager evaluates the credit quality of unrated investments based upon, but not limited to, credit ratings for similar investments. |
| Date | Developed Markets % | Investment Grade Developing Markets % | Sub-Investment Grade Developing Markets % |
| April 30, 2023 | 51.2 | 21.6 | 27.2 |
| October 31, 2022 | 51.3 | 22.2 | 26.5 |
| April 30, 2022 | 49.8 | 19.7 | 30.5 |
| Date | Developed Markets % | Investment Grade Developing Markets % | Sub-Investment Grade Developing Markets % |
| April 30, 2023 | 77.3 | 13.9 | 8.8 |
| October 31, 2022 | 82.8 | 12.8 | 4.4 |
| April 30, 2022 | 77.8 | 15.1 | 7.1 |
| 8 | abrdn Global Income Fund, Inc. |
| Date | Under 3 Years % | 3 to 5 Years % | 5 to 10 Years % | 10 Years & Over % |
| April 30, 2023 | 28.4 | 17.0 | 35.1 | 19.5 |
| October 31, 2022 | 26.0 | 17.4 | 35.0 | 21.6 |
| April 30, 2022 | 20.3 | 17.4 | 34.6 | 26.1 |
| * | Modified duration is a measure of the sensitivity of the price of a bond to the fluctuations in interest rates. |
| abrdn Global Income Fund, Inc. | 9 |
| Apr–23 | Oct–22 | Apr-22 | ||
| Australia | 90 day Bank Bills | 3.68% | 3.09% | 0.70% |
| 10 yr bond | 0.00% | 3.14% | 1.83% | |
| currency local per 1USD | $1.51 | $1.56 | $1.41 | |
| New Zealand | 90 day Bank Bills | 5.56% | 4.10% | 1.97% |
| 10 yr bond | 4.09% | 1.72% | 3.64% | |
| currency local per 1USD | $1.62 | $1.72 | $1.54 | |
| Malaysia | 3-month T-Bills | 2.85% | 2.71% | 1.80% |
| 10 yr bond | 3.73% | 4.37% | 4.38% | |
| currency local per 1USD | RM4.46 | RM4.37 | RM4.35 | |
| India | 3-month T-Bills | 6.78% | 6.42% | 4.04% |
| 10 yr bond | 7.11% | 7.45% | 7.14% | |
| currency local per 1USD | ₹81.84 | ₹82.78 | ₹76.44 | |
| Indonesia | 3 months deposit rate | 3.94% | 3.55% | 3.26% |
| 10 yr bond | 6.51% | 7.51% | 6.97% | |
| currency local per 1USD | Rp14,670.00 | Rp15,597.50 | Rp14,497.00 | |
| Russia | Zero Cpn 3m | 7.23% | 7.48% | 13.09% |
| 10 yr bond | 15.99% | 15.99% | 15.99% | |
| currency local per 1USD | ₽80.20 | ₽61.70 | ₽70.83 | |
| USD Denominated Bonds | Mexico | 5.28% | 6.48% | 5.00% |
| Indonesia | 4.44% | 23.20% | 4.01% | |
| Argentina | 23.20% | 23.20% | 23.20% | |
| Romania | 4.95% | 5.49% | 3.45% |
| 10 | abrdn Global Income Fund, Inc. |
| abrdn Global Income Fund, Inc. | 11 |
| 12 | abrdn Global Income Fund, Inc. |
| abrdn Global Income Fund, Inc. | 13 |
| 14 | abrdn Global Income Fund, Inc. |
| abrdn Global Income Fund, Inc. | 15 |
| 16 | abrdn Global Income Fund, Inc. |
| abrdn Global Income Fund, Inc. | 17 |
| At April 30, 2023, the Fund held the following forward foreign currency contracts: |
| Purchase Contracts Settlement Date* | Counterparty | Currency Purchased | Amount Purchased | Currency Sold | Amount Sold | Fair Value | Unrealized Appreciation/ (Depreciation) | |
| Chinese Renminbi/United States Dollar | ||||||||
| 05/19/2023 | Morgan Stanley & Co. | CNY | 17,905,483 | USD | 2,612,704 | $ 2,589,982 | $ (22,722) | |
| 05/24/2023 | UBS AG | CNY | 17,905,483 | USD | 2,605,870 | 2,591,036 | (14,834) | |
| Indonesian Rupiah/United States Dollar | ||||||||
| 06/26/2023 | Citibank N.A. | IDR | 31,055,400,000 | USD | 2,077,285 | 2,116,437 | 39,152 | |
| Singapore Dollar/United States Dollar | ||||||||
| 05/19/2023 | Citibank N.A. | SGD | 5,428,895 | USD | 4,068,009 | 4,070,695 | 2,686 | |
| South Korean Won/United States Dollar | ||||||||
| 06/15/2023 | UBS AG | KRW | 3,476,568,000 | USD | 2,672,932 | 2,606,028 | (66,904) | |
| $13,974,178 | $(62,622) | |||||||
| Sale Contracts Settlement Date* | Counterparty | Currency Purchased | Amount Purchased | Currency Sold | Amount Sold | Fair Value | Unrealized Appreciation/ (Depreciation) | |
| United States Dollar/British Pound | ||||||||
| 05/19/2023 | Deutsche Bank AG | USD | 1,261,792 | GBP | 1,010,674 | $ 1,270,623 | $ (8,831) | |
| United States Dollar/Chinese Renminbi | ||||||||
| 05/24/2023 | Morgan Stanley & Co. | USD | 2,613,512 | CNY | 17,905,483 | 2,591,036 | 22,476 | |
| United States Dollar/Euro | ||||||||
| 05/19/2023 | JPMorgan Chase Bank N.A. | USD | 122,764 | EUR | 111,100 | 122,534 | 230 | |
| 05/19/2023 | Morgan Stanley & Co. | USD | 4,435,580 | EUR | 4,056,933 | 4,474,459 | (38,879) | |
| $8,458,652 | $(25,004) | |||||||
| Unrealized appreciation on forward foreign currency exchange contracts | $ 64,544 | |||||||
| Unrealized depreciation on forward foreign currency exchange contracts | $(152,170) | |||||||
| * | Certain contracts with different trade dates and like characteristics have been shown net. |
| At April 30, 2023, the Fund held the following centrally cleared interest rate swaps: |
| Currency | Notional Amount | Expiration Date | Counterparty | Receive (Pay) Floating Rate | Floating Rate Index | Fixed Rate | Frequency of Paid Payments Made | Premiums Paid (Received) | Value | Unrealized Appreciation/ (Depreciation) |
| USD | 7,350,000 | 03/17/2033 | UBS AG | Receive | 12-month SOFR | 3.38% | Annually | $- | $ (114,932) | $ (114,932) |
| USD | 5,000,000 | 03/17/2030 | UBS AG | Receive | 12-month SOFR | 3.46% | Annually | - | (62,649) | (62,649) |
| USD | 5,000,000 | 03/17/2032 | UBS AG | Receive | 12-month SOFR | 3.40% | Annually | - | (74,769) | (74,769) |
| $- | $(252,350) | $(252,350) | ||||||||
| 18 | abrdn Global Income Fund, Inc. |
| Assets | |
| Investments, at value (cost $71,685,447) | $ 63,083,415 |
| Short-term investments, at value (cost $4,507,657) | 4,507,657 |
| Foreign currency, at value (cost $270,793) | 240,302 |
| Cash | 13,194 |
| Cash at broker for interest rate swaps | 894,626 |
| Cash at broker for forward foreign currency contracts | 60,000 |
| Receivable for investments sold | 169,401 |
| Interest and dividends receivable | 1,163,358 |
| Receivable for common shares issued | 223,158 |
| Unrealized appreciation on forward foreign currency exchange contracts | 64,544 |
| Variation margin receivable for centrally cleared swaps | 191,254 |
| Prepaid expenses in connection with the at-the-market stock offering (Note 5) | 129,341 |
| Prepaid expenses in connection with the shelf registration (Note 5) | 51,235 |
| Prepaid expenses in connection with revolving credit facility (Note 7) | 36,785 |
| Prepaid expenses | 3,884 |
| Total assets | 70,832,154 |
| Liabilities | |
| Revolving credit facility payable (Note 7) | 17,350,000 |
| Payable for investments purchased | 465,473 |
| Unrealized depreciation on forward foreign currency exchange contracts | 152,170 |
| Interest payable on bank loan | 72,419 |
| Investment management fees payable (Note 3) | 37,170 |
| Cash collateral due to broker | 10,000 |
| Investor relations fees payable (Note 3) | 9,275 |
| Administration fees payable (Note 3) | 7,148 |
| Deferred foreign capital gains tax (Note 2j) | 1,656 |
| Other accrued expenses | 86,787 |
| Total liabilities | 18,192,098 |
| Net Assets | $52,640,056 |
| Composition of Net Assets | |
| Common stock (par value $0.001 per share) (Note 5) | $ 12,789 |
| Paid-in capital in excess of par | 75,889,462 |
| Distributable accumulated loss | (23,262,195) |
| Net Assets | $52,640,056 |
| Net asset value per share based on 12,788,980 shares issued and outstanding | $ 4.12(a) |
| (a) | The NAV shown above differs from the traded NAV on April 30, 2023 due to financial statement rounding and/or financial statement adjustments. |
| abrdn Global Income Fund, Inc. | 19 |
| Net Investment Income | |
| Investment Income: | |
| Interest and amortization of discount and premium (net of foreign withholding taxes of $6,615) | $ 2,199,575 |
| Total investment income | 2,199,575 |
| Expenses: | |
| Investment management fee (Note 3) | 216,869 |
| Directors' fees and expenses | 96,026 |
| Independent auditors’ fees and expenses | 44,328 |
| Administration fee (Note 3) | 41,705 |
| Bank loan fees and expenses | 36,909 |
| Investor relations fees and expenses (Note 3) | 27,470 |
| Reports to shareholders and proxy solicitation | 21,191 |
| Custodian’s fees and expenses | 17,735 |
| Transfer agent’s fees and expenses | 13,498 |
| Insurance expense | 7,633 |
| Legal fees and expenses | 7,053 |
| Miscellaneous | 20,703 |
| Total operating expenses, excluding interest expense | 551,120 |
| Interest expense (Note 7) | 477,951 |
| Total operating expenses before reimbursed/waived expenses | 1,029,071 |
| Less: Investor relations fee waiver (Note 3) | (15,090) |
| Net expenses | 1,013,981 |
| Net Investment Income/(Loss) | 1,185,594 |
| Net Realized/Unrealized Gain/(Loss) from Investments and Foreign Currency Related Transactions: | |
| Net realized gain/(loss) from: | |
| Investment transactions (including $(287) capital gains tax) | (1,443,511) |
| Interest rate swaps | 1,033 |
| Forward foreign currency exchange contracts | (472,651) |
| Foreign currency transactions | (26,918) |
| (1,942,047) | |
| Net change in unrealized appreciation/(depreciation) on: | |
| Investments (including change in deferred capital gains tax of $1,361) | 4,166,436 |
| Interest rate swaps | (252,350) |
| Forward foreign currency exchange contracts | 525,918 |
| Foreign currency translation | 1,266,768 |
| 5,706,772 | |
| Net realized and unrealized gain from investments, interest rate swaps, forward foreign currency exchange contracts and foreign currencies | 3,764,725 |
| Change in Net Assets Resulting from Operations | $4,950,319 |
| 20 | abrdn Global Income Fund, Inc. |
| For the Six-Month Period Ended April 30, 2023 (unaudited) | For the Year Ended October 31, 2022 | |
| Increase/(Decrease) in Net Assets: | ||
| Operations: | ||
| Net investment income | $ 1,185,594 | $ 2,459,102 |
| Net realized loss from investments, interest rate swaps, forward foreign currency exchange contracts and foreign currency transactions | (1,942,047) | (4,489,942) |
| Net change in unrealized appreciation/(depreciation) on investments, interest rate swaps, forward foreign currency exchange contracts and foreign currency translation | 5,706,772 | (13,883,934) |
| Net increase/(decrease) in net assets resulting from operations | 4,950,319 | (15,914,774) |
| Distributions to Shareholders From: | ||
| Distributable earnings | (5,036,229) | (1,030,650) |
| Return of capital | – | (7,146,830) |
| Net decrease in net assets from distributions | (5,036,229) | (8,177,480) |
| Proceeds from at-the-market offering resulting in the issuance of 1,771,674 and 2,114,574 shares of common stock, respectively | 8,980,220 | 12,183,264 |
| Expenses in connection with the at-the-market stock offering (Note 5) | (85,545) | (99,522) |
| Expenses in connection with the shelf offering (Note 5) | (18,149) | (17,907) |
| Reinvestment of dividends resulting in the issuance of 14,532 and 25,019 shares of common stock, respectively | 71,401 | 138,357 |
| Change in net assets from capital transactions | 8,947,927 | 12,204,192 |
| Change in net assets | 8,862,017 | (11,888,062) |
| Net Assets: | ||
| Beginning of period | 43,778,039 | 55,666,101 |
| End of period | $52,640,056 | $43,778,039 |
| abrdn Global Income Fund, Inc. | 21 |
| Cash flows from operating activities: | |
| Net increase/(decrease) in net assets resulting from operations | $ 4,950,319 |
| Adjustments to reconcile net increase in net assets resulting from operations to net cash provided by operating activities: | |
| Investments purchased | (12,768,443) |
| Investments sold and principal repayments | 9,568,365 |
| Decrease in short-term investments, excluding foreign government | 161,868 |
| Net amortization/accretion of premium (discount) | (111,329) |
| Increase in receivable for common shares sold | (211,513) |
| Increase in cash due to broker | 10,000 |
| Decrease in cash due to broker for forward foreign currency exchange contracts | (40,000) |
| Increase in interest and dividends receivable | (125,863) |
| Net change unrealized appreciation on forward foreign currency exchange contracts | (525,918) |
| Decrease in prepaid expenses | 29,284 |
| Increase in interest payable on bank loan | 17,795 |
| Increase in accrued investment management fees payable | 3,505 |
| Increase in other accrued expenses | 32,703 |
| Net change in unrealized appreciation of investments | (4,166,436) |
| Net change in unrealized appreciation on foreign currency translations | (1,266,768) |
| Net realized loss on investments transactions | 1,443,511 |
| Total Cash flows from operating activities | (2,998,920) |
| Cash flows from financing activities: | |
| Distributions paid to shareholders | (5,036,229) |
| Proceeds from stock offering | 8,980,220 |
| Proceeds from reinvestment of dividends | $ 71,401 |
| Net cash paid (received) for swap contracts | (191,254) |
| Expenses in connection with the at-the-market and shelf offering | (103,694) |
| Net cash used in financing activities | 3,720,444 |
| Effect of exchange rate on cash | (5,240) |
| Net change in cash | 716,284 |
| Unrestricted and restricted cash and foreign currency, beginning of year | 491,838 |
| Unrestricted and restricted cash and foreign currency, end of year | $ 1,208,122 |
| Supplemental disclosure of cash flow information: | |
| Cash paid for interest and fees on borrowing | 460,156 |
| 22 | abrdn Global Income Fund, Inc. |
| Reconciliation of unrestricted and restricted cash to the statements of assets and liabilities | ||
| Six-Month Period Ended April 30, 2023 (unaudited) | Year Ended October 31, 2022 | |
| Cash | $ 13,194 | $ 28,548 |
| Foreign currency, at value | 240,302 | 143,290 |
| Cash at broker for interest rate swaps | 894,626 | – |
| Cash at broker for forward foreign currency contracts | 60,000 | 320,000 |
| $1,208,122 | $491,838 |
| abrdn Global Income Fund, Inc. | 23 |
| For the Six-Months Ended April 30, |
For the Fiscal Years Ended October 31, | |||||
| 2023 (unaudited) |
2022 | 2021 | 2020 | 2019 | 2018 | |
| PER SHARE OPERATING PERFORMANCE(a): | ||||||
| Net asset value per common share, beginning of period | $3.98 | $6.28 | $6.55 | $7.83 | $7.99 | $9.17 |
| Net investment income | 0.10 | 0.25 | 0.31 | 0.32 | 0.35 | 0.44 |
| Net realized and unrealized gains/(losses) on investments, interestrate swaps, futures contracts and foreign currency transactions | 0.35 | (1.92) | 0.22 | (0.76) | 0.33 | (0.78) |
| Total from investment operations applicable to common shareholders | 0.45 | (1.67) | 0.53 | (0.44) | 0.68 | (0.34) |
| Distributions to common shareholders from: | ||||||
| Net investment income | (0.42) | (0.10) | (0.21) | (0.17) | (0.36) | (0.16) |
| Return of capital | – | (0.74) | (0.63) | (0.67) | (0.48) | (0.68) |
| Total distributions | ( |
( |
( |
( |
( |
( |
| Capital Share Transactions: | ||||||
| Impact of shelf offering | 0.11 | 0.21 | 0.04 | – | – | – |
| Net asset value per common share, end of period | $4.12 | $3.98 | $6.28 | $6.55 | $7.83 | $7.99 |
| Market price, end of period | $5.07 | $4.50 | $8.35 | $6.80 | $8.41 | $8.22 |
| Total Investment Return Based on(b): | ||||||
| Market price | 22.65% | (37.38%) | 36.38% | (8.35%) | 13.46% | 1.27% |
| Net asset value | 12.69%(c) | (26.36%) | 6.49% | (5.18%) | 8.68% | (3.81%) |
| Ratio to Average Net Assets Applicable to Common Shareholders/Supplementary Data: | ||||||
| Net assets applicable to common shareholders, end of period (000 omitted) | $52,640 | $43,778 | $55,666 | $57,148 | $68,335 | $69,693 |
| Average net assets applicable to common shareholders (000 omitted) | $49,932 | $48,635 | $58,918 | $60,738 | $69,229 | $76,372 |
| Net operating expenses, net of fee waivers | 4.10%(d) | 3.11% | 2.62% | 2.89% | 3.45% | 3.03% |
| Net operating expenses, excluding fee waivers | 4.16%(d) | 3.18% | 2.66% | 2.93% | 3.46% | 3.06% |
| Net operating expenses, excluding interest expense, net of fee waivers | 2.16%(d) | 2.25% | 2.19% | 2.11% | 2.04% | 1.89% |
| Net Investment income | 4.79%(d) | 5.06% | 4.57% | 4.63% | 4.47% | 5.04% |
| Portfolio turnover | 15%(e) | 39% | 44% | 75% | 59% | 45% |
| Revolving credit facility outstanding (000 omitted) | $ |
$ |
$ |
$ |
$ |
$ |
| Asset coverage ratio on revolving credit facility at period end | 403% | 352% | 354% | 382% | 333% | 344% |
| Asset coverage per $1,000 on revolving credit facility at periodend(f) | $ |
$ |
$ |
$ |
$ |
$ |
| (a) | Based on average shares outstanding. |
| (b) | Total investment return based on market value is calculated assuming that shares of the Fund’s common stock were purchased at the closing market price as of the beginning of the period, dividends,capital gains and other distributions were reinvested as provided for in the Fund’s dividend reinvestment plan and then sold at the closing market price per share on the last day of the period. The computation does not reflect any sales commission investors may incur in purchasing or selling shares of the Fund. The total investment return based on the net asset value is similarly computed except that the Fund’s netasset value is substituted for the closing market value. |
| (c) |
The total return shown above includes the impact of financial statement rounding of the NAV per share and/or financial statement adjustments.
|
| 24 | abrdn Global Income Fund, Inc. |
| (d) | Annualized. |
| (e) | Not annualized. |
| (f) | Asset coverage ratio is calculated by dividing net assets plus the amount of any borrowings for investment purposes by the amount of any borrowings. |
| abrdn Global Income Fund, Inc. | 25 |
April 30, 2023
| 26 | abrdn Global Income Fund, Inc. |
April 30, 2023
| abrdn Global Income Fund, Inc. | 27 |
April 30, 2023
| Investments, at Value | Level 1 – Quoted Prices |
Level 2 – Other Significant Observable Inputs |
Level 3 – Significant Unobservable Inputs |
Total |
| Assets | ||||
| Investments in Securities | ||||
| Corporate Bonds | $ – | $ 41,159,209 | $– | $ 41,159,209 |
| Government Bonds | – | 21,924,206 | – | 21,924,206 |
| Warrants | – | – | – | – |
| Short-Term Investment | 4,507,657 | – | – | 4,507,657 |
| Total Investments | $4,507,657 | $63,083,415 | $– | $67,591,072 |
| Other Financial Instruments | ||||
| Foreign Currency Exchange Contracts | $ – | $ 64,544 | $– | $ 64,544 |
| Total Assets | $4,507,657 | $63,147,959 | $– | $67,655,616 |
| Liabilities | ||||
| Other Financial Instruments | ||||
| Centrally Cleared Interest Rate Swap Agreements | $ – | $ (252,350) | $– | $ (252,350) |
| Foreign Currency Exchange Contracts | – | (152,170) | – | (152,170) |
| Total Liabilities | $ – | $ (404,520) | $– | $ (404,520) |
| 28 | abrdn Global Income Fund, Inc. |
April 30, 2023
| abrdn Global Income Fund, Inc. | 29 |
April 30, 2023
| Risk Exposure Category | |||||||
| Interest Rate Contracts |
Foreign Currency Contracts |
Credit Contracts |
Equity Contracts |
Commodity Contracts |
Other | Total | |
| Assets: | |||||||
| Unrealized appreciation on: | |||||||
| Forward Foreign Currency Exchange Contracts | $ – | $ 64,544 | $– | $– | $– | $– | $ 64,544 |
| Total | $ – | $64,544 | $– | $– | $– | $– | $ 64,544 |
| Liabilities: | |||||||
| Unrealized depreciation on: | |||||||
| Forward Foreign Currency Exchange Contracts | $ – | $ 152,170 | $– | $– | $– | $– | $ 152,170 |
| Swap Contracts | 252,350 | – | – | – | – | – | 252,350 |
| Total | $252,350 | $152,170 | $– | $– | $– | $– | $404,520 |
| 30 | abrdn Global Income Fund, Inc. |
April 30, 2023
| Gross Amounts Not Offset in the Statement of Assets and Liabilities |
Gross Amounts Not Offset in the Statement of Assets and Liabilities |
|||||||
| Gross Amounts of Assets Presented in Statement of Assets and Liabilities |
Financial Instruments |
Collateral Received |
Net Amount |
Gross Amounts of Liabilities Presented in Statement of Assets and Liabilities |
Financial Instruments |
Collateral Pledged |
Net Amount |
|
| Description | Assets | Liabilities | ||||||
| Foreign Currency Exchange Contracts | ||||||||
| Citibank N.A. | $41,838 | $– | $– | $41,838 | $– | $– | $– | $– |
| Deutsche Bank AG | – | – | – | – | 8,831 | – | – | 8,831 |
| JPMorgan Chase Bank N.A. | 230 | – | – | 230 | – | – | – | – |
| Morgan Stanley & Co. | 22,476 | (22,476) | – | – | 61,601 | (22,476) | – | 39,125 |
| UBS AG | – | – | – | – | 81,738 | – | (60,000) | 21,738 |
| Risk Exposure Category | ||||||
| Interest Rate Contracts |
Foreign Currency Contracts |
Credit Contracts |
Equity Contracts |
Commodity Contracts |
Total | |
| Realized Gain (Loss) on Derivatives Recognized as a Result of Operations: |
||||||
| Net realized gain (loss) on: | ||||||
| Forward Currency Contracts | $ – | $ (472,651) | $– | $– | $– | $ (472,651) |
| Swap Contracts | 1,033 | – | – | – | – | 1,033 |
| Total | $ 1,033 | $(472,651) | $– | $– | $– | $(471,618) |
| Net Change in Unrealized Appreciation (Depreciation) on Derivatives Recognized as a Result of Operations: |
||||||
| Net change in unrealized appreciation (depreciation) of: | ||||||
| Forward Currency Contracts | $ – | $ 525,918 | $– | $– | $– | $ 525,918 |
| Swap Contracts | (252,350) | – | – | – | – | (252,350) |
| Total | $(252,350) | $ 525,918 | $– | $– | $– | $ 273,568 |
| abrdn Global Income Fund, Inc. | 31 |
April 30, 2023
| 32 | abrdn Global Income Fund, Inc. |
April 30, 2023
| abrdn Global Income Fund, Inc. | 33 |
April 30, 2023
| 34 | abrdn Global Income Fund, Inc. |
April 30, 2023
| abrdn Global Income Fund, Inc. | 35 |
April 30, 2023
| Tax Cost of Securities |
Unrealized Appreciation |
Unrealized Depreciation |
Net Unrealized Appreciation/ (Depreciation) |
| $75,972,236 | $857,806 | $(9,578,946) | $(8,721,140) |
| 36 | abrdn Global Income Fund, Inc. |
| abrdn Global Income Fund, Inc. | 37 |
| 38 | abrdn Global Income Fund, Inc. |

(b) Not applicable.
Item 2. Code of Ethics.
This item is inapplicable to semi-annual report on Form N-CSR.
Item 3. Audit Committee Financial Expert.
This item is inapplicable to semi-annual report on Form N-CSR.
Item 4. Principal Accountant Fees and Services.
This item is inapplicable to semi-annual report on Form N-CSR.
Item 5. Audit Committee of Listed Registrants.
This item is inapplicable to semi-annual report on Form N-CSR.
Item 6. Investments.
(a) Schedule of Investments in securities of unaffiliated issuers as of close of the reporting period is included as part of the Report to Shareholders filed under Item 1 of this Form N-CSR.
(b) Not applicable.
Item 7. Disclosure of Proxy Voting Policies and Procedures for Closed-End Management Investment Companies.
This item is inapplicable to semi-annual report on Form N-CSR.
Item 8. Portfolio Managers of Closed-End Management Investment Companies.
(a) Not applicable to semi-annual report on Form N-CSR.
(b) There has been no change, as of the date of this filing, in any of the portfolio managers identified in response to paragraph (a)(1) of this Item in the registrant’s most recently filed annual report on Form N-CSR.
Item 9. Purchases of Equity Securities by Closed-End Management Investment Company and Affiliated Purchasers.
No such purchases were made by or on behalf of the Registrant during the period covered by the report.
Item 10. Submission of Matters to a Vote of Security Holders.
During the period ended April 30, 2023, there were no material changes to the procedures by which shareholders may recommend nominees to the Registrant’s Board of Directors.
Item 11. Controls and Procedures.
| (a) | The Registrant’s principal executive and principal financial officers, or persons performing similar functions, have concluded that the Registrant’s disclosure controls and procedures (as defined in Rule 30a-3(c) under the Investment Company Act of 1940 (the “Act”) (17 CFR 270.30a-3(c))) are effective, as of a date within 90 days of the filing date of the report that includes the disclosure required by this paragraph, based on the evaluation of these controls and procedures required by Rule 30a-3(b) under the Act (17 CFR 270.30a3(b)) and Rule 13a-15(b) or 15d-15(b) under the Securities Exchange Act of 1934, as amended (17 CFR 240.13a-15(b) or 240.15d15(b)). |
| (b) | There were no changes in the Registrant’s internal control over financial reporting (as defined in Rule 30a-3(d) under the Act (17 CFR 270.30a-3(d))) that occurred during the second fiscal quarter of the period covered by this report that has materially affected, or is reasonably likely to materially affect, the Registrant’s internal control over financial reporting. |
Item 12 - Disclosure of Securities Lending Activities for Closed-End Management Investment Companies
Not applicable
Item 13. Exhibits.
| (a)(1) | Not applicable. |
| (a)(2) | The certifications of the registrant as required by Rule 30a-2(a) under the Act are exhibits to this Form N-CSR. |
| (a)(3) | Any written solicitation to purchase securities under Rule 23c-1 under the 1940 Act (17 CFR 270.23c-1) sent or given during the period covered by the report by or on behalf of the registrant to 10 or more persons. Not applicable. |
| (a)(4) | Change in Registrant’s independent public accountant. Not applicable. |
| (b) | The certifications of the registrant as required by Rule 30a-2(b) under the Act are exhibits to this Form N-CSR |
SIGNATURES
Pursuant to the requirements of the Securities Exchange Act of 1934 and the Investment Company Act of 1940, the Registrant has duly caused this report to be signed on its behalf by the undersigned, thereunto duly authorized.
abrdn Global Income Fund, Inc.
| By: | /s/ Christian Pittard | |
| Christian Pittard, | ||
| Principal Executive Officer of | ||
| abrdn Global Income Fund, Inc. |
Date: July 10, 2023
Pursuant to the requirements of the Securities Exchange Act of 1934 and the Investment Company Act of 1940, this report has been signed below by the following persons on behalf of the Registrant and in the capacities and on the dates indicated.
| By: | /s/ Christian Pittard | |
| Christian Pittard, | ||
| Principal Executive Officer of | ||
| abrdn Global Income Fund, Inc. | ||
| Date: July 10, 2023 | ||
| By: | /s/ Sharon Ferrari | |
| Sharon Ferrari, | ||
| Principal Financial Officer of | ||
| abrdn Global Income Fund, Inc. | ||
Date: July 10, 2023