UNITED STATES
SECURITIES AND EXCHANGE COMMISSION
Washington, D.C. 20549
FORM 10-K
ý | ANNUAL REPORT PURSUANT TO SECTION 13 OR 15(d) OF THE SECURITIES EXCHANGE ACT OF 1934 |
For the Fiscal Year Ended November 30, 2016
or
¨ | TRANSITION REPORT PURSUANT TO SECTION 13 OR 15(d) OF THE SECURITIES EXCHANGE ACT OF 1934 |
Commission File Number: 0-19417
PROGRESS SOFTWARE CORPORATION
(Exact name of registrant as specified in its charter)
DELAWARE (State or other jurisdiction of incorporation or organization) | 04-2746201 (I.R.S. Employer Identification No.) | |
14 Oak Park
Bedford, Massachusetts 01730
(Address of Principal Executive Offices)
Telephone Number: (781) 280-4000
Securities registered pursuant to Section 12(b) of the Act:
Title of Each Class | Name of Each Exchange on Which Registered | |
Common Stock $.01 par value | The NASDAQ Global Select Market | |
Securities registered pursuant to Section 12(g) of the Act: None
Indicate by check mark if the registrant is a well-known seasoned issuer, as defined in Rule 405 of the Securities Act. Yes ý No ¨
Indicate by check mark if the registrant is not required to file reports pursuant to Section 13 or Section 15(d) of the Exchange Act. Yes ¨ No ý
Indicate by check mark whether the registrant (1) has filed all reports required to be filed by Section 13 or 15(d) of the Securities Exchange Act of 1934 during the preceding 12 months (or for such shorter period that the registrant was required to file such reports), and (2) has been subject to such filing requirements for the past 90 days. Yes ý No ¨
Indicate by check mark whether the registrant has submitted electronically and posted on its corporate Web site, if any, every Interactive Data File required to be submitted and posted pursuant to Rule 405 of Regulation S-T during the preceding 12 months (or for such shorter period that the registrant was required to submit and post such files). Yes ý No ¨
Indicate by check mark if disclosure of delinquent filers pursuant to Item 405 of Regulation S-K is not contained herein, and will not be contained, to the best of registrant’s knowledge, in definitive proxy or information statements incorporated by reference in Part III of this Form 10-K or any amendment to this Form 10-K. ¨
Indicate by check mark whether the registrant is a large accelerated filer, an accelerated filer, a non-accelerated filer, or a smaller reporting company. See definitions of “large accelerated filer,” “accelerated filer” and “smaller reporting company” in Rule 12b-2 of the Exchange Act.
Large accelerated filer | ý | Accelerated filer | ¨ | Non-accelerated filer | ¨ | Smaller reporting company | ¨ |
Indicate by check mark whether the registrant is a shell company (as defined in Rule 12b-2 of the Exchange Act).
Yes ¨ No ý
As of May 31, 2016 (the last business day of the registrant’s most recently completed second fiscal quarter), the aggregate market value of voting stock held by non-affiliates of the registrant was approximately $1,259,000,000.
As of January 23, 2017, there were 48,734,771 common shares outstanding.
Documents Incorporated By Reference
Portions of the definitive Proxy Statement in connection with the 2017 Annual Meeting of Shareholders are incorporated by reference into Part III.
PROGRESS SOFTWARE CORPORATION
FORM 10-K
FOR THE FISCAL YEAR ENDED NOVEMBER 30, 2016
INDEX
PART I | ||
Item 1. | ||
Item 1A. | ||
Item 1B. | ||
Item 2. | ||
Item 3. | ||
Item 4. | ||
PART II | ||
Item 5. | ||
Item 6. | ||
Item 7. | ||
Item 7A. | ||
Item 8. | ||
Item 9. | ||
Item 9A. | ||
Item 9B. | ||
PART III | ||
Item 10. | ||
Item 11. | ||
Item 12. | ||
Item 13. | ||
Item 14. | ||
PART IV | ||
Item 15. | ||
3
CAUTIONARY STATEMENTS
The Private Securities Litigation Reform Act of 1995 contains certain safe harbor provisions regarding forward-looking statements. This Form 10-K, and other information provided by us or statements made by our directors, officers or employees from time to time, may contain “forward-looking” statements and information, which involve risks and uncertainties. Actual future results may differ materially. Statements indicating that we “expect,” “estimate,” “believe,” “are planning” or “plan to” are forward-looking, as are other statements concerning future financial results, product offerings or other events that have not yet occurred. There are various factors that could cause actual results or events to differ materially from those anticipated by the forward-looking statements. Such factors are more fully described in Item 1A of this Form 10-K under the heading “Risk Factors.” Although we have sought to identify the most significant risks to our business, we cannot predict whether, or to what extent, any of such risks may be realized. We also cannot assure you that we have identified all possible issues which we might face. We undertake no obligation to update any forward-looking statements that we make.
PART I
Item 1. Business
Overview
We are a global leader in application development, empowering enterprises to build mission-critical business applications to succeed in an evolving business environment. With offerings spanning web, mobile and data for on-premise and cloud environments, we power businesses worldwide, promoting success one application at a time. Our solutions are used across a variety of industries.
Our products are generally sold as perpetual licenses, but certain products also use term licensing models and our cloud-based offerings use a subscription based model. More than half of our worldwide license revenue is realized through relationships with indirect channel partners, principally application partners and original equipment manufacturers (OEMs). Application partners are independent software vendors (ISVs) that develop and market applications using our technology and resell our products in conjunction with sales of their own products that incorporate our technology. OEMs are companies that embed our products into their own software products or devices.
We operate in North America and Latin America (the Americas); Europe, the Middle East and Africa (EMEA); and the Asia Pacific region, through local subsidiaries as well as independent distributors.
Fiscal Year 2016 Highlights and Recent Developments
Leadership Changes
In October 2016, Yogesh Gupta became our President and Chief Executive Officer, replacing Philip Pead, who had been our President and Chief Executive Officer since December 2012. Mr. Pead remains a member of our Board of Directors. In September 2016, Kurt Abkemeier became our Chief Financial Officer, replacing Chris Perkins, who had been our Chief Financial Officer since February 2013.
New Strategic Plan
On January 16, 2017, we announced a new strategic plan highlighted by a new product strategy and a streamlined operating approach with a tighter focus on areas of strength to more efficiently drive revenue. The key tenets of the new strategic plan are as follows:
• | Streamlined Operating Approach. In fiscal year 2017, we have begun to adapt our organization and operating principles for our core products to focus primarily on customer and partner retention and success. For certain of our products, we are also strengthening our high volume, low touch e-commerce capabilities. |
• | New Product Strategy. As part of the new strategic plan, we are undertaking a new product strategy in which we will provide the platform and tools enterprises need to build next generation applications that drive their businesses known as “Cognitive Applications.” Our platform for Cognitive Applications will make it easy for developers to build these new applications and will include: |
4
◦Our NativeScript offering, which allows developers to use JavaScript to build native applications across multiple platforms;
◦A mission-critical back-end-as-a-service platform that runs on any cloud, is secure, high-performing, and highly-scalable while supporting all modern user interfaces;
◦Automated and intuitive machine learning capabilities for accelerating the creation and delivery of Cognitive Applications;
◦Our data connectivity and integration capabilities; and
◦Our business logic and rules capabilities.
Our new product strategy replaces our prior strategy focused around our Digital Factory offering, which is a cloud-based solution combining primarily two of our products, Sitefinity and Telerik Platform. Although we are discontinuing our investment in our Digital Factory offering, Sitefinity remains a core product within our portfolio and Telerik Platform is a key part of our new product strategy.
• | Restructuring. With the adoption of our new product strategy, we are discontinuing our investment in our Digital Factory offering and re-aligning our resources consistent with our core operating approach. To that end, during the first quarter of fiscal year 2017, we began to implement restructuring efforts including the consolidation of facilities, implementation of a simplified organizational structure and a reduction of marketing and other external expenses. In addition, we began to reduce headcount by approximately 450 employees, totaling over 20% of our workforce. Initial headcount reductions commenced in the fiscal first quarter of 2017 and are expected to be substantially completed by the end of the fiscal second quarter of 2017, subject to local laws and consultation processes. After investments in our new product strategy, we expect to reduce net annual run-rate costs by approximately $20 million by the end of fiscal year 2017. |
Share Repurchase Authorization
In March 2016, our Board of Directors authorized a new $100.0 million share repurchase program, which increased the total authorization to $214.5 million. In fiscal year 2016, we repurchased and retired 3.1 million shares of common stock for $79.2 million under our Board of Directors authorized share repurchase program, leaving $135.3 million remaining under this program.
Dividend Declaration
On September 27, 2016, our Board of Directors approved the initiation of a quarterly cash dividend to our shareholders. The first quarterly dividend of $0.125 per share of common stock was paid on December 15, 2016 to shareholders of record as of the close of business on December 1, 2016. On January 11, 2017, our Board of Directors declared a quarterly dividend of $0.125 per share of common stock payable on March 15, 2017 to shareholders of record as of the close of business on March 1, 2017.
Our Business Segments
OpenEdge Business Segment
The OpenEdge business segment drives growth within OpenEdge’s large, diverse partner base by providing the product enhancements and marketing support these partners need to sell more of their existing solutions to their customers. The OpenEdge business segment is also focused on providing partners and direct end users with a clear path to develop and integrate cloud-based applications in the future. Our services organization helps partners and customers leverage their core assets and develop strategies that protect current investments, while addressing changing business requirements.
The solutions within the OpenEdge Business Segment include:
Progress OpenEdge
Progress OpenEdge is development software for building dynamic multi-language applications for secure deployment across any platform, any device, and any cloud. OpenEdge provides a unified environment comprising development tools, application servers, application management tools, an embedded relational database management system, and the capability to connect and integrate with other applications and data sources independently or with other Progress products.
5
Progress Corticon
Progress Corticon is a Business Rules Management System (BRMS) that enables applications with decision automation, decision change process and decision-related insight capabilities. Corticon helps both business and IT users to quickly create or reuse business rules as well as create, improve, collaborate on, and maintain decision logic. Corticon is a market-leading platform for automating and executing business rules.
Data Connectivity and Integration Business Segment
The Data Connectivity and Integration Business Segment (DCI) is focused on the growth of our data assets, including the data integration components of our cloud offerings. Data is at the core of every application, and with the exponential growth in the number and volume of data sources, this business segment addresses the increasingly complex challenges that organizations have in accessing and integrating that data.
The solutions within the DCI Business Segment include:
Progress DataDirect Connect
Progress DataDirect Connect software provides data connectivity using industry-standard interfaces to connect applications running on various platforms to any major database, for both corporate IT organizations and software vendors. With software components embedded in the products of over 350 software companies and in the applications of thousands of large enterprises, the DataDirect Connect product set is a global leader in the data connectivity market. The primary products, in addition to other drivers we have developed, are ODBC drivers, JDBC drivers and ADO.NET providers. They provide the capability to connect and integrate with other applications and data sources independently or with our cloud-based offerings.
Progress DataDirect Cloud
Progress DataDirect Cloud is a software-as-a-service (SaaS) based connection management service that simplifies SQL access to a broad spectrum of cloud-based data sources through a single standards-based interface. The DataDirect Cloud service executes SQL queries against the appropriate cloud data source, managing all of the complexity, API’s, and versioning for the host application. In addition to integrating with our other cloud-based offerings, it provides the capability to connect and integrate with other applications and data sources independently.
Application Development and Deployment Business Segment
The Application Development and Deployment (AppDev) business segment is focused on generating net new customers for our application development assets. Substantially all of the products within the AppDev segment were acquired in connection with our acquisition of Telerik, Inc. in December 2014. This business segment has the focus and agility of a start-up, able to react quickly to changes in this rapidly-evolving market. Having a team solely focused on this market enables us to rapidly meet the demands of developers who are seeking to increase their productivity and move toward the cloud.
The solutions within the AppDev Business Segment include:
Dev Tools
Dev Tools is a cross-platform, user experience design, quality assurance, debugging and reporting suite for next generation web, mobile, desktop and HTML5 applications. Utilizing Dev Tools enables developers to focus on business logic and not infrastructure. Included in Dev Tools are Fiddler and Kendo UI.
NativeScript
NativeScript is an open-source application development platform that enables developers to use JavaScript to build cross-platform, native iOS and Android applications.
Dev Cloud
Dev Cloud is a cloud-based application design, deployment, hosting and testing suite featuring a hybrid application development environment, backend as a service, analytics and mobile testing.
6
Telerik Platform
The Telerik Platform is a complete end-to-end application lifecycle solution that combines Dev Tools, Dev Cloud and ALM products into an integrated platform for mobile application development using any approach (web, hybrid and native).
Test Studio
Test Studio is an application lifecycle management suite for testing web, mobile and desktop applications that covers the process from idea to deployment.
Sitefinity
Sitefinity is a next-generation web content management and customer analytics platform for managing and optimizing digital experiences. Sitefinity combines superior end user experience with a high level of customization capabilities for developers.
Progress Rollbase
Progress Rollbase is application development software that allows rapid creation of SaaS business applications using point & click, drag & drop tools in a standard web browser with a minimal amount of code. Progress Rollbase applications can be deployed in any cloud or on-premise infrastructure.
Product Development
Most of our products have been developed by our internal product development staff or the internal staffs of acquired companies. We believe that the features and performance of our products are competitive with those of other available development and deployment tools and that none of the current versions of our products are approaching obsolescence. However, we believe that significant investments in new product development and continuing enhancements of our current products will be required for us to maintain our competitive position.
As of November 30, 2016, we have four primary development offices in North America, two primary development offices in EMEA and one primary development office in India. We spent $88.6 million, $88.3 million, and $63.1 million in fiscal years 2016, 2015 and 2014, respectively, on product development, including capitalized software development costs.
Customers
We market our products globally through several channels: directly to end users and indirectly to application partners (or ISVs), OEMs, and system integrators. Sales of our solutions and products through our direct sales force have historically been to business managers or IT managers in corporations and governmental agencies. We also target developers who create business applications, from individuals to teams, within enterprises of all sizes.
We also market our products through indirect channels, primarily application partners and OEMs who embed our products as part of an integrated solution. We use international distributors in certain locations where we do not have a direct presence or where it is more economically feasible for us to do so.
More than half of our license revenues are derived from indirect channels. No single customer has accounted for more than 10% of our total revenue in any of our last three fiscal years.
Application Partners
Our application partners cover a broad range of markets, offer an extensive library of business applications and are a source of follow-on revenue. We have kept entry costs, consisting primarily of the initial purchase of development licenses, low to encourage a wide variety of application partners to build applications. If an application partner succeeds in marketing its applications, we obtain follow-on revenue as the application partner licenses our deployment products to allow its application to be installed and used by customers. We offer a subscription model alternative to the traditional perpetual license model for application partners who have chosen to enable their business applications under a SaaS platform.
7
Original Equipment Manufacturers
We enter into arrangements with OEMs whereby the OEM embeds our products into its solutions, typically either software or technology devices. OEMs typically license the right to embed our products into their solutions and distribute such solutions for initial terms ranging from one to three years. Historically, a significant portion of our OEMs have renewed their agreements upon the expiration of the initial term. However, we are not assured that they will continue to renew in the future.
Sales and Marketing
We sell our products and solutions through our direct sales force and indirect channel partners. We have sold our products and solutions to enterprises in over 180 countries. Our sales and field marketing groups are organized by business segment and secondarily by region. We operate by region in North America, Latin America, EMEA and Asia Pacific. We believe this structure allows us to maintain direct contact with our customers and support their diverse market requirements. Our international operations provide focused local sales, support and marketing efforts and are able to respond directly to changes in local conditions.
In addition to our direct sales efforts, we distribute our products through systems integrators, resellers, distributors, and OEM partners in the United States and internationally. Systems integrators typically have expertise in vertical or functional markets. In some cases, they resell our products, bundling them with their broader service offerings. In other cases, they refer sales opportunities to our direct sales force for our products. Distributors sublicense our products and provide service and support within their territories. OEMs embed portions of our technology in their product offerings.
Sales personnel are responsible for developing new direct end user accounts, recruiting new indirect channel partners and new independent distributors, managing existing channel partner relationships and servicing existing customers. We actively seek to avoid conflict between the sales efforts of our application partners and our own direct sales efforts. We use our inside sales team to enhance our direct sales efforts and to generate new business and follow-on business from existing customers.
Our marketing personnel conduct a variety of marketing engagement programs designed to create demand for our products, enhance the market readiness of our products, raise the general awareness of our company and our products and solutions, generate leads for the sales organization and promote our various products. These programs include press relations, analyst relations, investor relations, digital/web marketing, marketing communications, participation in trade shows and industry conferences, and production of sales and marketing literature. We also hold global events, as well as regional user events in various locations throughout the world.
Our sales and marketing efforts with respect to certain of our products, including Dev Tools and the Telerik Platform, differ from our traditional sales and marketing efforts because the target markets are different. For these products, we have designed our marketing and sales model to be efficient for high volumes of lower-price transactions. Our marketing efforts focus on driving traffic to our websites and on generating high quality sales leads, in many cases, consisting of developer end users who download a free evaluation of our software. Our sales efforts then focus on converting these leads into paying customers through a high volume, short duration, sales process. Of particular importance to our target market, we enable our customers to buy our products in a manner convenient to them, whether by purchase order, online with a credit card or through our channel partners.
Customer Support
Our customer support staff provides telephone and Web-based support to end users, application developers and OEMs. Customers may purchase maintenance services entitling them to software updates, technical support and technical bulletins. Maintenance is generally not required with our products and is purchased at the customer's option. We provide support to customers primarily through our main regional customer support centers in Bedford, Massachusetts; Morrisville, North Carolina; Rotterdam, The Netherlands; Hyderabad, India; Melbourne, Australia; and Sofia, Bulgaria. Local technical support for specific products is provided in certain other countries as well.
Professional Services
Our global professional services organization delivers business solutions for customers through a combination of products, consulting and education. Our consulting organization offers project management, implementation services, custom development, programming and other services. Our consulting organization also provides services to Web-enable existing applications or to take advantage of the capabilities of new product releases. Our education organization offers numerous training options, from traditional instructor-led courses to advanced learning modules available via the web or on CDs.
8
Our services offerings include: application modernization; data management, managed database services; performance enhancements and tuning; and analytics/business intelligence.
Competition
The computer software industry is intensely competitive. We experience significant competition from a variety of sources with respect to all of our products. Factors affecting competition in the markets we serve include product performance in complex applications, application solutions, vendor experience, ease of integration, price, training and support.
We compete in various markets with a number of entities, such as salesforce.com, Inc., Amazon.com, Inc., Software AG, RedHat, Inc., Pivotal Software, Inc., Microsoft Corporation, Oracle Corporation and other smaller firms. Many of these vendors offer platform-as-a-service (PaaS), application development, data integration and other tools in conjunction with their CRM, web services, operating systems and relational database management systems. We believe that IBM Corporation, Microsoft Corporation and Oracle Corporation currently dominate the relational database market. We do not believe that there is a dominant vendor in the other infrastructure software markets, including application development. Some of our competitors have greater financial, marketing or technical resources than we have and/or may be able to adapt more quickly to new or emerging technologies and changes in customer requirements or to devote greater resources to the promotion and sale of their products than we can. Increased competition could make it more difficult for us to maintain our revenue and market presence.
Copyrights, Trademarks, Patents and Licenses
We rely on a combination of contractual provisions and copyright, patent, trademark and trade secret laws to protect our proprietary rights in our products. We generally distribute our products under software license agreements that grant customers a perpetual nonexclusive license to use our products and contain terms and conditions prohibiting the unauthorized reproduction or transfer of our products. We also distribute our products through various channel partners, including application partners, OEMs and system integrators. We also license our products under term or subscription arrangements. In addition, we attempt to protect our trade secrets and other proprietary information through agreements with employees, consultants and channel partners. Although we intend to protect our rights vigorously, there is no assurance that these measures will be successful.
We seek to protect the source code of our products as trade secrets and as unpublished copyrighted works. We hold numerous patents covering portions of our products. We also have several patent applications for some of our other product technologies. Where possible, we seek to obtain protection of our product names and service offerings through trademark registration and other similar procedures throughout the world.
We believe that due to the rapid pace of innovation within our industry, factors such as the technological and creative skills of our personnel are as important in establishing and maintaining a leadership position within the industry as are the various legal protections of our technology. In addition, we believe that the nature of our customers, the importance of our products to them and their need for continuing product support may reduce the risk of unauthorized reproduction, although no assurances can be made in this regard.
Business Segment and Geographical Information
Effective September 1, 2014, we began operating as three distinct business segments: OpenEdge, Data Connectivity and Integration, and Application Development and Deployment and began segment reporting for these business segments beginning in the fourth fiscal quarter of 2014. For additional information on business segments as well as geographical financial information, see Note 16 to our Consolidated Financial Statements in Item 8 of this Form 10-K.
9
Employees
As of November 30, 2016, we had 1,912 employees worldwide, including 578 in sales and marketing, 269 in customer support and services, 812 in product development and 253 in administration. On January 16, 2017, we announced that we will reduce headcount by approximately 450 employees, totaling over 20% of our workforce. Initial headcount reductions began in the fiscal first quarter of 2017 and are expected to be substantially completed by the end of the fiscal second quarter of 2017, subject to local laws and consultation processes.
None of our U.S. employees are subject to a collective bargaining agreement. Employees in certain foreign jurisdictions are represented by local workers’ councils and/or collective bargaining agreements as may be customary or required in those jurisdictions. We have experienced no work stoppages and believe our relations with employees are good.
Available Information
Our Annual Report on Form 10-K, Quarterly Reports on Form 10-Q, Current Reports on Form 8-K, including exhibits, and amendments to those reports filed or furnished pursuant to Sections 13(a) and 15(d) of the Securities Exchange Act of 1934, as amended, are available free of charge on our website at www.progress.com as soon as reasonably practicable after such reports are electronically filed with, or furnished to, the U.S. Securities and Exchange Commission. The information posted on our website is not incorporated into this Annual Report.
Our Code of Conduct is also available on our website. Additional information about this code and amendments and waivers thereto can be found below in Part III, Item 10 of this Form 10-K.
10
Item 1A. Risk Factors
We operate in a rapidly changing environment that involves certain risks and uncertainties, some of which are beyond our control. The risks described below are not the only risks we face. Additional risks and uncertainties not currently known to us or that we currently deem to be immaterial may also materially adversely affect our business, financial condition and/or operating results.
Our revenue and quarterly results may fluctuate, which could adversely affect our stock price. We have experienced, and may in the future experience, significant fluctuations in our quarterly operating results that may be caused by many factors. These factors include:
• | changes in demand for our products; |
• | introduction, enhancement or announcement of products by us or our competitors; |
• | market acceptance of our new products; |
• | the growth rates of certain market segments in which we compete; |
• | size and timing of significant orders; |
• | a high percentage of our revenue is generated in the third month of each fiscal quarter and any failure to receive, complete or process orders at the end of any quarter could cause us to fall short of our revenue targets; |
• | budgeting cycles of customers; |
• | mix of distribution channels; |
• | mix of products and services sold; |
• | mix of international and North American revenues; |
• | fluctuations in currency exchange rates; |
• | changes in the level of operating expenses; |
• | the amount of our stock-based compensation; |
• | changes in management; |
• | restructuring programs; |
• | changes in our sales force; |
• | completion or announcement of acquisitions by us or our competitors; |
• | customer order deferrals in anticipation of new products announced by us or our competitors; and |
• | general economic conditions in regions in which we conduct business. |
Revenue forecasting is uncertain, and the failure to meet our forecasts could result in a decline in our stock price. Our revenues, particularly new software license revenues, are difficult to forecast. We use a pipeline system to forecast revenues and trends in our business. Our pipeline estimates may prove to be unreliable either in a particular quarter or over a longer period of time, in part because the conversion rate of the pipeline into contracts can be difficult to estimate and requires management judgment. A variation in the conversion rate could cause us to plan or budget incorrectly and materially adversely impact our business or our planned results of operations. Furthermore, most of our expenses are relatively fixed, including costs of personnel and facilities, and are not easily reduced. Thus, an unexpected reduction in our revenue, or failure to achieve the anticipated rate of growth, would have a material adverse effect on our profitability. If our operating results do not meet our publicly stated guidance or the expectations of investors, our stock price may decline.
The addition of a subscription model to augment our traditional perpetual licensing model may negatively impact our license growth in the near term. Under a subscription model, downturns or upturns in sales may not be immediately reflected in our results of operations. Subscription pricing allows customers to use our products at a lower initial cost when compared to the sale of a perpetual license. Although the subscription model is designed to increase the number of customers who purchase our products and services and create a recurring revenue stream that is more predictable, it creates certain risks related to the timing of revenue recognition and reduced cash flows. A decline in new or renewed subscriptions in any period may not be immediately reflected in our results for that period, but may result in a decline in our revenue in future quarters. If we were to experience significant downturns in subscription sales and renewal rates, our results of operations might not reflect such downturns until future periods. Further, any increases in sales under our subscription sales model could result in decreased revenues over the short term if they are offset by a decline in sales from perpetual license customers.
We recognize a substantial portion of our revenue from sales made through third parties, including our application partners, distributors/resellers, and OEMs, and adverse developments in the businesses of these third parties or in our relationships with them could harm our revenues and results of operations. Our future results depend upon our continued successful distribution of our products through our application partner, distributor/reseller, and OEM channels. The activities of these third parties are not within our direct control. Our failure to manage our relationships with these third parties effectively could impair the success of our sales, marketing and support activities. A reduction in the sales efforts, technical capabilities or
11
financial viability of these parties, a misalignment of interest between us and them, or a termination of our relationship with a major application partner, distributor/reseller, or OEM could have a negative effect on our sales and financial results. Any adverse effect on the application partners’, distributors'/resellers', or OEMs’ businesses related to competition, pricing and other factors could also have a material adverse effect on our business, financial condition and operating results.
Weakness in the U.S. and international economies may result in fewer sales of our products and may otherwise harm our business. We are subject to the risks arising from adverse changes in global economic conditions, especially those in the U.S., Europe and Latin America. The past five years have been characterized by weak global economic conditions, tightening of credit markets and instability in the financial markets. If these conditions continue or worsen, customers may delay, reduce or forego technology purchases, both directly and through our application partners and OEMs. This could result in reductions in sales of our products, longer sales cycles, slower adoption of new technologies and increased price competition. Further, deteriorating economic conditions could adversely affect our customers and their ability to pay amounts owed to us. Any of these events would likely harm our business, results of operations, financial condition or cash flows.
Our international operations expose us to additional risks, and changes in global economic and political conditions could adversely affect our international operations, our revenue and our net income. Approximately 43% of our total revenue is generated from sales outside North America. Political and/or financial instability, oil price shocks and armed conflict in various regions of the world can lead to economic uncertainty and may adversely impact our business. If customers’ buying patterns, decision-making processes, timing of expected deliveries and timing of new projects unfavorably change due to economic or political conditions, there would be a material adverse effect on our business, financial condition and operating results.
Other potential risks inherent in our international business include:
• | longer payment cycles; |
• | credit risk and higher levels of payment fraud; |
• | greater difficulties in accounts receivable collection; |
• | varying regulatory requirements; |
• | compliance with international and local trade, labor and export control laws; |
• | compliance with U.S. laws such as the Foreign Corrupt Practices Act, and local laws prohibiting bribery and corrupt payments to government officials; |
• | restrictions on the transfer of funds; |
• | difficulties in developing, staffing, and simultaneously managing a large number of varying foreign operations as a result of distance, language, and cultural differences; |
• | reduced or minimal protection of intellectual property rights in some countries; |
• | laws and business practices that favor local competitors or prohibit foreign ownership of certain businesses; |
• | seasonal reductions in business activity during the summer months in Europe and certain other parts of the world; |
• | economic instability in emerging markets; and |
• | potentially adverse tax consequences. |
Any one or more of these factors could have a material adverse effect on our international operations, and, consequently, on our business, financial condition and operating results.
Risk Relating to the Referendum of the United Kingdom’s Membership of the European Union. The announcement of the Referendum of the United Kingdom’s (or the U.K.) Membership of the European Union (E.U.) (referred to as Brexit), advising for the exit of the United Kingdom from the European Union, resulted in significant volatility in global stock markets and currency exchange rate fluctuations that resulted in the strengthening of the U.S. dollar against foreign currencies in which we conduct business. As described elsewhere in this 10-K, we translate revenue denominated in foreign currency into U.S. dollars for our financial statements. During periods of a strengthening dollar, our reported international revenue is reduced because
foreign currencies translate into fewer U.S. dollars. The announcement of Brexit has created global economic uncertainty, which may cause our customers to closely monitor their costs and reduce their spending budget on our products and services.
The effects of Brexit will depend on any agreements the U.K. makes to retain access to E.U. markets either during a transitional period or more permanently. The measures could potentially disrupt the markets we serve and may cause us to lose customers, and employees. In addition, Brexit could lead to legal uncertainty and potentially divergent national laws and regulations as the U.K. determines which E.U. laws to replace or replicate.
Any of these effects of Brexit, among others, could materially adversely affect our business, results of operations and financial condition.
12
Fluctuations in foreign currency exchange rates could have an adverse impact on our financial condition and results of operations. Changes in the value of foreign currencies relative to the U.S. dollar have adversely affected our results of operations and financial position. During recent years, the value of the U.S. dollar strengthened in comparison to certain foreign currencies, including in Europe, Brazil and Australia. As approximately one-third of our revenue is denominated in foreign currency, our revenue results have been impacted, and we expect will continue to be impacted, by fluctuations in foreign currency exchange rates.
We seek to reduce our exposure to fluctuations in exchange rates by entering into foreign exchange forward contracts to hedge certain actual and forecasted transactions of selected currencies (mainly in Europe, Brazil, India and Australia). Our currency hedging transactions may not be effective in reducing any adverse impact of fluctuations in foreign currency exchange rates. Further, the imposition of exchange or price controls or other restrictions on the conversion of foreign currencies could have a material adverse effect on our business.
Technology and customer requirements evolve rapidly in our industry, and if we do not continue to develop new products and enhance our existing products in response to these changes, our business could be harmed. Ongoing enhancements to our product sets will be required to enable us to maintain our competitive position. We may not be successful in developing and marketing enhancements to our products on a timely basis, and any enhancements we develop may not adequately address the changing needs of the marketplace. Overlaying the risks associated with our existing products and enhancements are ongoing technological developments and rapid changes in customer requirements. Our future success will depend upon our ability to develop and introduce in a timely manner new products that take advantage of technological advances and respond to new customer requirements. We may not be successful in developing new products incorporating new technology on a timely basis, and any new products may not adequately address the changing needs of the marketplace. Failure to develop new products and product enhancements that meet market needs in a timely manner could have a material adverse effect on our business, financial condition and operating results.
We are substantially dependent on our Progress OpenEdge products. We derive a significant portion of our revenue from software license and maintenance revenue attributable to our Progress OpenEdge product set. Accordingly, our future results depend on continued market acceptance of OpenEdge. If new technologies emerge that are superior to, or more responsive to customer requirements, than OpenEdge such that we are unable to maintain OpenEdge’s competitive position within its marketplace, this will have a material adverse effect on our business, financial condition and operating results.
We announced a new strategic plan for the company that may be difficult to implement, may not be successful and could adversely impact our business and results of operations. On January 16, 2017, we announced a new strategic plan. Under the plan, we intend to provide the platform and tools enterprises need to build next generation applications that drive their businesses known as “Cognitive Applications.” Our Board of Directors has approved certain operational restructuring initiatives to reduce annual costs. Some or all of these actions may adversely affect our financial condition and operating results, and we may not be able to execute on the plan nor enhance shareholder value. The new strategic plan may also subject our business to additional risks, such as the following:
• | disruption of our business or distraction of our employees and management; |
• | difficulty recruiting, hiring, motivating and retaining talented and skilled personnel; |
• | increased stock price volatility and changes to our stock price which may be unrelated to our current results of operations; and |
• | uncertainty among our customers and prospective customers, and increased difficulty in closing sales with existing and prospective customers and delays in purchasing decisions. |
The increased emphasis on a cloud strategy may give rise to risks that could harm our business. We are devoting significant resources to the development of cloud-based technologies and service offerings where we have a limited operating history. Our cloud strategy requires continued investment in product development and cloud operations as well as a change in the way we price and deliver our products. Many of our competitors may have advantages over us due to their larger presence, larger developer network, deeper experience in the cloud-based computing market, and greater sales and marketing resources. It is uncertain whether these strategies will prove successful or whether we will be able to develop the infrastructure and business models more quickly than our competitors. Our cloud strategy may give rise to a number of risks, including the following:
• | if new or current customers desire only perpetual licenses, we may not be successful in selling subscriptions; |
• | although we intend to support our perpetual license business, the increased emphasis on a cloud strategy may raise concerns among our installed customer base; |
• | we may be unsuccessful in achieving our target pricing; |
• | our revenues might decline over the short or long term as a result of this strategy; |
13
• | our relationships with existing partners that resell perpetual licenses may be damaged; and |
• | we may incur costs at a higher than forecasted rate as we enhance and expand our cloud operations. |
We may make additional acquisitions or investments in new businesses, products or technologies that involve additional risks, which could disrupt our business or harm our financial condition, results of operations or cash flows. We may make acquisitions of businesses or investments in companies that offer complementary products, services and technologies. Any acquisitions that we do complete involve a number of risks, including the risks of assimilating the operations and personnel of acquired companies, realizing the value of the acquired assets relative to the price paid, distraction of management from our ongoing businesses and potential product disruptions associated with the sale of the acquired company’s products. In addition, an acquisition may not further our business strategy as we expected, we may not integrate an acquired company or technology as successfully as we expected or we may overpay for, or otherwise not realize the expected return on, our investments, which could adversely affect our business or operating results and potentially cause impairment to assets that we recorded as a part of an acquisition including intangible assets and goodwill. These factors could have a material adverse effect on our business, financial condition, operating results and cash flows. The consideration we pay for any future acquisitions could include our stock. As a result, future acquisitions could cause dilution to existing shareholders and to earnings per share.
The segments of the software industry in which we participate are intensely competitive, and our inability to compete effectively could harm our business. We experience significant competition from a variety of sources with respect to the marketing and distribution of our products. Many of our competitors have greater financial, marketing or technical resources than we do and may be able to adapt more quickly to new or emerging technologies and changes in customer requirements or to devote greater resources to the promotion and sale of their products than we can. Increased competition could make it more difficult for us to maintain our market presence or lead to downward pricing pressure.
In addition, the marketplace for new products is intensely competitive and characterized by low barriers to entry. For example, an increase in market acceptance of open source software may cause downward pricing pressures. As a result, new competitors possessing technological, marketing or other competitive advantages may emerge and rapidly acquire market share. In addition, current and potential competitors may make strategic acquisitions or establish cooperative relationships among themselves or with third parties, thereby increasing their ability to deliver products that better address the needs of our prospective customers. Current and potential competitors may also be more successful than we are in having their products or technologies widely accepted. We may be unable to compete successfully against current and future competitors, and our failure to do so could have a material adverse effect on our business, prospects, financial condition and operating results.
We rely on the experience and expertise of our skilled employees, and must continue to attract and retain qualified technical, marketing and managerial personnel in order to succeed. Our future success will depend in a large part upon our ability to attract and retain highly skilled technical, managerial, sales and marketing personnel. There is significant competition for such personnel in the software industry. We may not continue to be successful in attracting and retaining the personnel we require to develop new and enhanced products and to continue to grow and operate profitably.
The loss of technology licensed from third parties could adversely affect our ability to deliver our products. We utilize certain technology that we license from third parties, including software that is integrated with internally developed software and used in our products to perform key functions. This technology, or functionally similar technology, may not continue to be available on commercially reasonable terms in the future, or at all. The loss of any significant third-party technology license could cause delays in our ability to deliver our products or services until equivalent technology is developed internally or equivalent third-party technology, if available, is identified, licensed and integrated.
Privacy concerns and laws, evolving regulation of cloud computing, cross-border data transfer restrictions and other domestic or foreign regulations may limit the use and adoption of our products and solutions and adversely affect our business. Regulation related to the provision of services on the Internet is increasing, as federal, state and foreign governments continue to adopt new laws and regulations addressing data privacy and the collection, processing, storage and use of personal information. In some cases, foreign data privacy laws and regulations, such as the European Union’s Data Protection Directive, and the country-specific laws and regulations that implement that directive, also govern the processing of personal information. Further, laws are increasingly aimed at the use of personal information for marketing purposes, such as the European Union’s e-Privacy Directive, and the country-specific regulations that implement that directive. Such laws and regulations are subject to new and differing interpretations and may be inconsistent among jurisdictions. These and other requirements could reduce demand for our products and solutions or restrict our ability to store and process data or, in some cases, impact our ability to offer our products and solutions in certain locations or our customers' ability to deploy our solutions globally.
14
For example, the European Court of Justice recently invalidated the U.S.-EU Safe Harbor framework that had been in place since 2000, which allowed companies to meet certain European legal requirements for the transfer of personal data from the European Economic Area to the United States. While other adequate legal mechanisms to lawfully transfer such data remain, the invalidation of the U.S.-EU Safe Harbor framework may result in different European data protection regulators applying differing standards for the transfer of personal data, which could result in increased regulation, cost of compliance and limitations on data transfer for us and our customers. The costs of compliance with and other burdens imposed by laws, regulations and standards may limit the use and adoption of our services, reduce overall demand for our services, lead to significant fines, penalties or liabilities for noncompliance, or slow the pace at which we close sales transactions, any of which could harm our business.
Furthermore, concerns regarding data privacy may cause our customers’ customers to resist providing the data necessary to allow our customers to use our products and solutions effectively. Even the perception that the privacy of personal information is not satisfactorily protected or does not meet regulatory requirements could inhibit sales of our products or solutions, and could limit adoption of our cloud-based solutions.
If our products contain software defects or security flaws, it could harm our revenues and expose us to litigation. Our products, despite extensive testing and quality control, may contain defects or security flaws, especially when we first introduce them or when new versions are released. We may need to issue corrective releases of our software products to fix any defects or errors. The detection and correction of any security flaws can be time consuming and costly. Errors in our software products could affect the ability of our products to work with other hardware or software products, delay the development or release of new products or new versions of products, adversely affect market acceptance of our products and expose us to potential litigation. If we experience errors or delays in releasing new products or new versions of products, such errors or delays could have a material adverse effect on our revenue.
We could incur substantial cost in protecting our proprietary software technology or if we fail to protect our technology, which would harm our business. We rely principally on a combination of contract provisions and copyright, trademark, patent and trade secret laws to protect our proprietary technology. Despite our efforts to protect our proprietary rights, unauthorized parties may attempt to copy aspects of our products or to obtain and use information that we regard as proprietary. Policing unauthorized use of our products is difficult. Litigation may be necessary in the future to enforce our intellectual property rights, to protect our trade secrets or to determine the validity and scope of the proprietary rights of others. This litigation could result in substantial costs and diversion of resources, whether or not we ultimately prevail on the merits. The steps we take to protect our proprietary rights may be inadequate to prevent misappropriation of our technology; moreover, others could independently develop similar technology.
We could be subject to claims that we infringe intellectual property rights of others, which could harm our business, financial condition, results of operations or cash flows. Third parties could assert infringement claims in the future with respect to our products and technology, and such claims might be successful. This litigation could result in substantial costs and diversion of resources, whether or not we ultimately prevail on the merits. This litigation could also lead to our being prohibited from selling one or more of our products, cause reluctance by potential customers to purchase our products, or result in liability to our customers and could have a material adverse effect on our business, financial condition, operating results and cash flows.
If our security measures are breached, our products and services may be perceived as not being secure, customers may curtail or stop using our products and services, and we may incur significant legal and financial exposure. Our products and services involve the storage and transmission of our customers’ proprietary information, and security breaches could expose us to a risk of loss of this information, litigation, and potential liability. Our security measures may be breached due to the actions of outside parties, employee error, malfeasance, or otherwise, and, as a result, an unauthorized party may obtain access to our data or our customers’ data. Any such breach or unauthorized access could result in significant legal and financial exposure, increased costs to defend litigation or damage to our reputation, and a loss of confidence in the security of our products and services that could potentially have an adverse effect on our business. Because the techniques used to obtain unauthorized access, disable or degrade service, or sabotage systems change frequently and often are not recognized until launched against a target, we may be unable to anticipate these techniques or to implement adequate preventative measures. If an actual or perceived breach of our security occurs, the market perception of the effectiveness of our security measures could be harmed and we could lose customers.
We may have exposure to additional tax liabilities. As a multinational corporation, we are subject to income taxes in the U.S. and various foreign jurisdictions. Significant judgment is required in determining our global provision for income taxes and other tax liabilities. In the ordinary course of a global business, there are many intercompany transactions and calculations where the ultimate tax determination is uncertain. Our income tax returns are routinely subject to audits by tax authorities. Although we regularly assess the likelihood of adverse outcomes resulting from these examinations to determine our tax
15
estimates, a final determination of tax audits or tax disputes could have an adverse effect on our financial condition, results of operations and cash flows.
We are also subject to non-income taxes, such as payroll, sales, use, value-added, net worth, property and goods and services taxes in the U.S. and various foreign jurisdictions. We are regularly under audit by tax authorities with respect to these non-income taxes and may have exposure to additional non-income tax liabilities, which could have an adverse effect on our results of operations, financial condition and cash flows.
In addition, our future effective tax rates could be favorably or unfavorably affected by changes in tax rates, changes in the valuation of our deferred tax assets or liabilities, or changes in tax laws or their interpretation. Such changes could have a material adverse impact on our financial results.
We are required to comply with certain financial and operating covenants under our credit facility and to make scheduled debt payments as they become due; any failure to comply with those covenants or to make scheduled payments could cause amounts borrowed under the facility to become immediately due and payable or prevent us from borrowing under the facility. In December 2014, we entered into a credit facility, which consists of a $150 million term loan and a $150 million revolving loan (and may be increased by an additional $75 million in the form of revolving loans or term loans, or a combination thereof if the existing or additional lenders are willing to make such increased commitments). This facility matures in December 2019, at which time any amounts outstanding will be due and payable in full. We may wish to borrow additional amounts under the facility in the future to support our operations, including for strategic acquisitions and share repurchases.
We are required to comply with specified financial and operating covenants and to make scheduled repayments of our term loan, which may limit our ability to operate our business as we otherwise might operate it. Our failure to comply with any of these covenants or to meet any payment obligations under the facility could result in an event of default which, if not cured or waived, would result in any amounts outstanding, including any accrued interest and unpaid fees, becoming immediately due and payable. We might not have sufficient working capital or liquidity to satisfy any repayment obligations in the event of an acceleration of those obligations. In addition, if we are not in compliance with the financial and operating covenants at the time we wish to borrow funds, we will be unable to borrow funds.
Our common stock price may continue to be volatile, which could result in losses for investors. The market price of our common stock, like that of other technology companies, is volatile and is subject to wide fluctuations in response to quarterly variations in operating results, announcements of technological innovations or new products by us or our competitors, changes in financial estimates by securities analysts or other events or factors. Our stock price may also be affected by broader market trends unrelated to our performance. As a result, purchasers of our common stock may be unable at any given time to sell their shares at or above the price they paid for them.
Item 1B. Unresolved Staff Comments
As of the date of this report, we do not have any open comments from the U.S. Securities and Exchange Commission (SEC) related to our financial statements or periodic filings with the SEC.
Item 2. Properties
We own our principal administrative, sales, support, marketing, product development and distribution facilities, which are located in three buildings totaling approximately 258,000 square feet in Bedford, Massachusetts. In addition, we maintain offices in leased facilities in various other locations in North America and outside North America, including Australia, Belgium, Brazil, Bulgaria, France, Germany, India, Netherlands, Singapore, and the United Kingdom. The terms of our leases generally range from one to six years. On January 16, 2017, we announced that we are undertaking a restructuring of our operations, which will include a consolidation of certain facilities. We are in the process of identifying those facilities to consolidate.
We believe that our facilities are adequate for our current needs and that suitable additional space will be available as needed.
Item 3. Legal Proceedings
We are subject to various legal proceedings and claims, either asserted or unasserted, which arise in the ordinary course of business. While the outcome of these claims cannot be predicted with certainty, management does not believe that the outcome of any of these legal matters will have a material effect on our consolidated financial position, results of operations or cash flows.
16
Item 4. Mine Safety Disclosures
Not applicable.
PART II
Item 5. Market for Registrant’s Common Equity, Related Stockholder Matters and Issuer Purchases of Equity Securities
The following table sets forth, for the periods indicated, the range of high and low sale prices for our common stock. Our common stock trades on the NASDAQ Global Select Market under the symbol "PRGS".
Fiscal Year Ended | |||||||||||||||
November 30, 2016 | November 30, 2015 | ||||||||||||||
High | Low | High | Low | ||||||||||||
First quarter | $ | 27.11 | $ | 22.01 | $ | 27.79 | $ | 23.58 | |||||||
Second quarter | $ | 26.55 | $ | 22.57 | $ | 27.80 | $ | 25.32 | |||||||
Third quarter | $ | 29.80 | $ | 24.20 | $ | 30.57 | $ | 25.69 | |||||||
Fourth quarter | $ | 30.24 | $ | 25.55 | $ | 27.44 | $ | 21.94 | |||||||
On September 27, 2016, our Board of Directors approved the initiation of a quarterly cash dividend to Progress shareholders. The first quarterly dividend of $0.125 per share of common stock was paid on December 15, 2016 to shareholders of record as of the close of business on December 1, 2016. On January 11, 2017, our Board of Directors declared a quarterly dividend of $0.125 per share of common stock payable on March 15, 2017 to shareholders of record as of the close of business on March 1, 2017.
As of December 31, 2016, our common stock was held by approximately 182 shareholders of record.
In January 2014, our Board of Directors authorized a $100.0 million share repurchase program. In fiscal year 2014, we repurchased and retired 2.3 million shares of our common stock for $52.6 million. In fiscal year 2015, under the same authorization, we repurchased and retired 1.3 million shares for $32.9 million. In September 2015, our Board of Directors authorized a new $100.0 million share repurchase program, which increased the total authorization to $114.5 million.
In March 2016, our Board of Directors authorized a new $100.0 million share repurchase program, which increased the total authorization to $214.5 million. In fiscal year 2016, we repurchased and retired 3.1 million shares of our common stock for $79.2 million. As of November 30, 2016, there is $135.3 million remaining under this current authorization. The timing and amount of any shares repurchased will be determined by management based on its evaluation of market conditions and other factors, and the Board of Directors may choose to suspend, expand or discontinue the repurchase program at any time.
17
Stock Performance Graph and Cumulative Total Return
The graph below compares the cumulative total stockholder return on our common stock with the cumulative total return on the NASDAQ Composite Index and the NASDAQ Computer Index for each of the last five fiscal years ended November 30, 2016, assuming an investment of $100 at the beginning of such period and the reinvestment of any dividends.
Comparison of 5 Year Cumulative Total Return(1)
Among Progress Software Corporation, the NASDAQ Composite Index and the
NASDAQ Computer Index
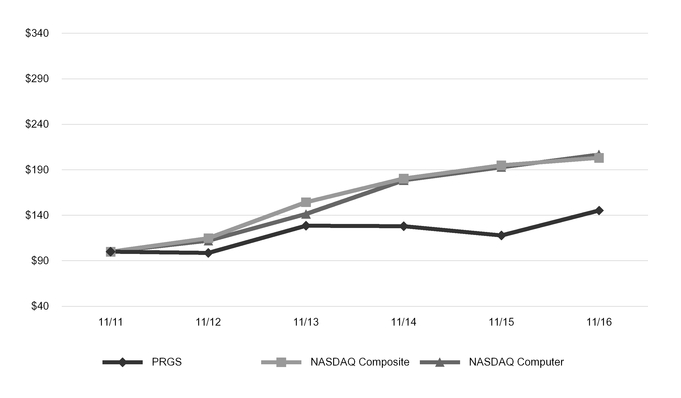
(1) $100 invested on November 30, 2011 in stock or index, including reinvestment of dividends.
November 30, | 2011 | 2012 | 2013 | 2014 | 2015 | 2016 | ||||||||||||||||||
Progress Software Corporation | $ | 100.00 | $ | 98.72 | $ | 128.57 | $ | 127.93 | $ | 117.77 | $ | 145.16 | ||||||||||||
NASDAQ Composite | 100.00 | 114.88 | 154.38 | 180.41 | 194.96 | 203.17 | ||||||||||||||||||
NASDAQ Computer | 100.00 | 112.11 | 141.32 | 178.34 | 192.86 | 206.86 | ||||||||||||||||||
18
Item 6. Selected Financial Data
The following table sets forth selected financial data for the last five fiscal years (in thousands, except per share data):
Year Ended November 30, | 2016 | 2015 | 2014 | 2013 | 2012 | |||||||||||||||
Revenue | $ | 405,341 | $ | 377,554 | $ | 332,533 | $ | 333,996 | $ | 317,612 | ||||||||||
(Loss) income from operations | (29,709 | ) | 14,754 | 80,740 | 63,740 | 67,789 | ||||||||||||||
(Loss) income from continuing operations | (55,726 | ) | (8,801 | ) | 49,458 | 39,777 | 44,954 | |||||||||||||
Net (loss) income | (55,726 | ) | (8,801 | ) | 49,458 | 74,907 | 47,444 | |||||||||||||
Basic (loss) earnings per share from continuing operations | (1.13 | ) | (0.17 | ) | 0.97 | 0.73 | 0.71 | |||||||||||||
Diluted (loss) earnings per share from continuing operations | (1.13 | ) | (0.17 | ) | 0.96 | 0.72 | 0.71 | |||||||||||||
Cash dividends declared per common share | 0.125 | — | — | — | — | |||||||||||||||
Cash, cash equivalents and short-term investments | 249,754 | 241,279 | 283,268 | 231,440 | 355,217 | |||||||||||||||
Total assets | 754,827 | 877,123 | 702,756 | 682,187 | 884,977 | |||||||||||||||
Long-term debt, including current portion | 135,000 | 144,375 | — | — | — | |||||||||||||||
Shareholders’ equity | 406,629 | 522,464 | 543,245 | 513,654 | 638,399 | |||||||||||||||
Fiscal year 2016 amounts have been impacted by a $92 million impairment charge related to the goodwill of the Application Development and Deployment reporting unit. Refer to Note 6 to the Consolidated Financial Statements in Item 8 of this Form 10-K for additional details. Fiscal years 2016 and 2015 amounts have been impacted by the acquisition of Telerik AD. Refer to Item 7, Management’s Discussion and Analysis of Financial Condition and Results of Operations, and Note 7 to the Consolidated Financial Statements for additional details. We also entered into a credit agreement during fiscal year 2015 to partially fund our acquisition of Telerik AD. Refer to Note 8 to the Consolidated Financial Statements for additional details.
Item 7. Management’s Discussion and Analysis of Financial Condition and Results of Operations
Forward-Looking Statements
Certain statements below about anticipated results and our products and markets are forward-looking statements that are based on our current plans and assumptions. Important information about the bases for these plans and assumptions and factors that may cause our actual results to differ materially from these statements is contained below and in Item 1A. “Risk Factors” of this Annual Report on Form 10-K.
Use of Constant Currency
Revenue from our international operations has historically represented more than half of our total revenue. As a result, our revenue results have been impacted, and we expect will continue to be impacted, by fluctuations in foreign currency exchange rates. For example, if the local currencies of our foreign subsidiaries weaken, our consolidated results stated in U.S. dollars are negatively impacted.
As exchange rates are an important factor in understanding period to period comparisons, we believe the presentation of revenue growth rates on a constant currency basis enhances the understanding of our revenue results and evaluation of our performance in comparison to prior periods. The constant currency information presented is calculated by translating current period results using prior period weighted average foreign currency exchange rates. These results should be considered in addition to, not as a substitute for, results reported in accordance with accounting principles generally accepted in the United States of America (GAAP).
Overview
We are a global leader in application development, empowering enterprises to build mission-critical business applications to succeed in an evolving business environment. With offerings spanning web, mobile and data for on-premise and cloud environments, we power businesses worldwide, promoting success one application at a time. Our solutions are used across a variety of industries. We operate as three distinct segments: OpenEdge, Data Connectivity and Integration, and Application Development and Deployment.
19
At the beginning of fiscal year 2015, we acquired Telerik AD, a leading provider of application development tools. Telerik enables its 1.9 million strong developer community to create compelling user experiences across cloud, web, mobile and desktop applications. Through this acquisition, we provide comprehensive cloud and on-premise platform offerings that enable developers to rapidly create applications, driven by data for any web, desktop or mobile platform.
The revenue of Telerik is being recognized ratably over the maintenance period, which is generally one year, as vendor specific objective evidence (or VSOE) of fair value cannot be established for such maintenance. As a result of acquisition accounting, the acquired deferred revenue balance was significantly reduced to reflect its fair value as of the acquisition date. However, we still incurred the associated costs to fulfill the acquired deferred revenue, which are reflected in our consolidated statement of operations. As a result, during fiscal year 2015, our expenses as a percentage of total revenue were higher than in subsequent years until this acquired deferred revenue balance was recognized. The impact of this on fiscal year 2016 was minimal.
As of October 31, 2016, we tested goodwill for impairment for each of our reporting units. Beginning in late October 2016, with the appointment of Yogesh Gupta as our new Chief Executive Officer, our Board of Directors and executive management team undertook a comprehensive review of our strategy and operations, including our expectations for fiscal year 2017 results. Based on this review, we reduced our future growth expectations with respect to the product lines within our Application Development and Deployment reporting unit. As a result, the implied fair value of goodwill was substantially lower than the carrying value of goodwill for the reporting unit and we recorded a $92.0 million goodwill impairment charge related to the Application Development and Deployment reporting unit.
During fiscal year 2016, our results were adversely impacted by decreases in sales to OpenEdge direct enterprise customers. During the past three fiscal years, our results have benefited from several large license sales to OpenEdge direct enterprise customers. These large transactions are difficult to predict as they are subject to longer sales cycles and the timing of completion is often uncertain. If we fail to complete these large transactions or if completion is delayed, our results will be adversely impacted.
In March 2016, our Board of Directors authorized a new $100.0 million share repurchase program, which increased the total authorization to $214.5 million. In fiscal year 2016, we repurchased and retired 3.1 million shares of our common stock for $79.2 million. As of November 30, 2016, there is $135.3 million remaining under this current authorization. The timing and amount of any shares repurchased will be determined by management based on its evaluation of market conditions and other factors, and the Board of Directors may choose to suspend, expand or discontinue the repurchase program at any time.
In September 2016, our Board of Directors approved the initiation of a quarterly cash dividend to Progress shareholders. The first quarterly dividend of $0.125 per share of common stock was paid on December 15, 2016 to shareholders of record as of the close of business on December 1, 2016.
On January 11, 2017, our Board of Directors declared a quarterly dividend of $0.125 per share of common stock payable on March 15, 2017 to shareholders of record as of the close of business on March 1, 2017.
We derive a significant portion of our revenue from international operations, which are primarily conducted in foreign currencies. As a result, changes in the value of these foreign currencies relative to the U.S. dollar have significantly impacted our results of operations and may impact our future results of operations. Beginning in the fourth quarter of 2014, the value of the U.S. dollar strengthened in comparison to certain foreign currencies, including in Europe, Brazil and Australia, and continued to strengthen during the first half of 2015. The U.S. dollar remained strong in comparison to foreign currencies in 2016. Since approximately one-third of our revenue is denominated in foreign currency, our revenue results have been negatively impacted, and we expect will continue to be impacted, by fluctuations in foreign currency exchange rates.
On January 16, 2017, we announced a new strategic plan. Under the plan, we intend to provide the platform and tools enterprises need to build next generation applications that drive their businesses known as “Cognitive Applications.” Our Board of Directors has approved certain operational restructuring initiatives to reduce annual costs. Some or all of these actions may adversely affect our financial condition and operating results, and we may not be able to execute on the plan nor enhance shareholder value.
We have evaluated, and expect to continue to evaluate, possible acquisitions and other strategic transactions designed to expand our business and/or add complementary products and technologies to our existing product sets. As a result, our expected uses of cash could change, our cash position could be reduced and we may incur additional debt obligations to the extent we complete additional acquisitions.
20
We believe that existing cash balances, together with funds generated from operations and amounts available under our credit facility, will be sufficient to finance our operations and meet our foreseeable cash requirements, including our newly announced quarterly cash dividend to Progress shareholders, through at least the next twelve months.
Results of Operations
Fiscal Year 2016 Compared to Fiscal Year 2015
Revenue
Fiscal Year Ended | Percentage Change | ||||||||||||
(In thousands) | November 30, 2016 | November 30, 2015 | As Reported | Constant Currency | |||||||||
Revenue | $ | 405,341 | $ | 377,554 | 7 | % | 9 | % | |||||
Total revenue increased $27.8 million, or 7%, in fiscal year 2016 as compared to fiscal year 2015. Revenue would have increased by 9% if exchange rates had been constant in fiscal year 2016 as compared to exchange rates in fiscal year 2015. The increase in revenue is primarily due to the impact of the Telerik acquisition during the first quarter of fiscal year 2015. As a result of acquisition accounting, the acquired deferred revenue balance was significantly reduced to reflect its fair value as of the acquisition date. Therefore, the reduction of the acquisition date deferred revenue had a negative impact on revenue in fiscal year 2015. However, in fiscal year 2016 we recognized revenue related to the full value of Telerik deferred revenue that was generated during fiscal years 2015 and 2016. The increase in revenue in fiscal year 2016 was also the result of an increase in license and maintenance and services revenue as further described below. Changes in prices from fiscal year 2015 to 2016 did not have a significant impact on our revenue.
License Revenue
Fiscal Year Ended | Percentage Change | ||||||||||||
(In thousands) | November 30, 2016 | November 30, 2015 | As Reported | Constant Currency | |||||||||
License | $ | 134,863 | $ | 130,250 | 4 | % | 5 | % | |||||
As a percentage of total revenue | 33 | % | 34 | % | |||||||||
Software license revenue increased $4.6 million, or 4%, in fiscal year 2016 as compared to fiscal year 2015. Software license revenue would have increased by 5% if exchange rates had been constant in fiscal year 2016 as compared to exchange rates in effect in fiscal year 2015. The increase in license revenue is primarily due to the impact of the Telerik acquisition during the first quarter of fiscal year 2015 as described above. The increase in license revenue was also due to an increase in Data Connectivity and Integration license sales, partially offset by decreases in sales to OpenEdge customers and in Corticon license sales.
Maintenance and Services Revenue
Fiscal Year Ended | Percentage Change | ||||||||||||
(In thousands) | November 30, 2016 | November 30, 2015 | As Reported | Constant Currency | |||||||||
Maintenance | $ | 238,377 | $ | 217,718 | 9 | % | 11 | % | |||||
As a percentage of total revenue | 59 | % | 58 | % | |||||||||
Professional services | $ | 32,101 | $ | 29,586 | 9 | % | 9 | % | |||||
As a percentage of total revenue | 8 | % | 8 | % | |||||||||
Total maintenance and services revenue | $ | 270,478 | $ | 247,304 | 9 | % | 11 | % | |||||
As a percentage of total revenue | 67 | % | 66 | % | |||||||||
Maintenance and services revenue increased $23.2 million in fiscal year 2016 as compared to fiscal year 2015. Both maintenance revenue and professional services revenue increased 9% compared to the prior year. The increase in maintenance
21
revenue is primarily due to the impact of the Telerik acquisition during the first quarter of fiscal year 2015 as described above. The increase in services revenue in fiscal year 2016 was also due to higher software-as-a-service (SaaS) revenue generated by our Application Development and Deployment segment compared to the prior year.
Revenue by Region
Fiscal Year Ended | Percentage Change | ||||||||||||
(In thousands) | November 30, 2016 | November 30, 2015 | As Reported | Constant Currency | |||||||||
North America | $ | 229,203 | $ | 207,566 | 10 | % | 10 | % | |||||
As a percentage of total revenue | 57 | % | 55 | % | |||||||||
EMEA | $ | 130,818 | $ | 124,171 | 5 | % | 9 | % | |||||
As a percentage of total revenue | 32 | % | 33 | % | |||||||||
Latin America | $ | 21,156 | $ | 17,594 | 20 | % | 27 | % | |||||
As a percentage of total revenue | 5 | % | 5 | % | |||||||||
Asia Pacific | $ | 24,164 | $ | 28,223 | (14 | )% | (14 | )% | |||||
As a percentage of total revenue | 6 | % | 7 | % | |||||||||
Total revenue generated in North America increased $21.6 million, and total revenue generated outside North America increased $6.2 million, in fiscal year 2016 as compared to fiscal year 2015. The increases in North America and EMEA were primarily due to the impact of the Telerik acquisition during the first quarter of fiscal year 2015 as described above. The increase in Latin America is primarily due to a multi-million dollar OpenEdge direct license transaction that was completed in the fourth quarter of fiscal 2016. The decrease in Asia Pacific is due to several large OpenEdge license transactions that occurred in the third fiscal quarter of 2015.
Total revenue generated in markets outside North America represented 43% of total revenue in fiscal year 2016 compared to 45% of total revenue in fiscal year 2015. Total revenue generated in markets outside North America would have represented 44% of total revenue if exchange rates had been constant in fiscal year 2016 as compared to the exchange rates in effect in fiscal year 2015.
Revenue by Segment
Fiscal Year Ended | ||||||||||
(In thousands) | November 30, 2016 | November 30, 2015 | Percentage Change | |||||||
OpenEdge segment | $ | 276,267 | $ | 295,934 | (7 | )% | ||||
Data Connectivity and Integration segment | 48,009 | 37,926 | 27 | % | ||||||
Application Development and Deployment segment | 81,065 | 43,694 | 86 | % | ||||||
Total revenue | $ | 405,341 | $ | 377,554 | 7 | % | ||||
Revenue in the OpenEdge segment decreased $19.7 million, or 7%, in fiscal year 2016 as compared to fiscal year 2015, primarily due to lower license sales to both our ISV partners and direct enterprise users and a large multi-year distribution agreement in 2015. Revenue in the OpenEdge segment would have decreased by 5% if exchange rates had been constant in fiscal year 2016 as compared to exchange rates in fiscal year 2015. Data Connectivity and Integration revenue increased $10.1 million, or 27%, in fiscal year 2016 as compared to fiscal year 2015, primarily in North America, due to higher license revenue resulting from renewals and expansions of distribution agreements with large OEM customers. Application Development and Deployment revenue increased $37.4 million, or 86%, year over year as a result of the impact of the Telerik acquisition during the first quarter of fiscal year 2015 as described above.
22
Cost of Software Licenses
Fiscal Year Ended | ||||||||||
(In thousands) | November 30, 2016 | November 30, 2015 | Percentage Change | |||||||
Cost of software licenses | $ | 5,456 | $ | 5,979 | (9 | )% | ||||
As a percentage of software license revenue | 4 | % | 5 | % | ||||||
As a percentage of total revenue | 1 | % | 2 | % | ||||||
Cost of software licenses consists primarily of costs of royalties, electronic software distribution costs, duplication and packaging. Cost of software licenses decreased $0.5 million, or 9%, in fiscal year 2016 as compared to fiscal year 2015, and decreased as a percentage of software license revenue from 5% to 4%. Cost of software licenses as a percentage of software license revenue varies from period to period depending upon the relative product mix.
Cost of Maintenance and Services
Fiscal Year Ended | ||||||||||
(In thousands) | November 30, 2016 | November 30, 2015 | Percentage Change | |||||||
Cost of maintenance and services | $ | 44,760 | $ | 40,933 | 9 | % | ||||
As a percentage of maintenance and services revenue | 17 | % | 17 | % | ||||||
As a percentage of total revenue | 11 | % | 11 | % | ||||||
Cost of maintenance and services consists primarily of costs of providing customer support, consulting and education. Cost of maintenance and services increased $3.8 million, or 9%, in fiscal year 2016 as compared to fiscal year 2015, and remained flat as a percentage of maintenance and services revenue year over year. The increase in cost of maintenance and services is primarily due to higher compensation-related costs as a result of an increase in headcount as compared to the prior fiscal year.
Amortization of Acquired Intangibles
Fiscal Year Ended | ||||||||||
(In thousands) | November 30, 2016 | November 30, 2015 | Percentage Change | |||||||
Amortization of acquired intangibles | $ | 15,496 | $ | 16,830 | (8 | )% | ||||
As a percentage of total revenue | 4 | % | 4 | % | ||||||
Amortization of acquired intangibles included in costs of revenue primarily represents the amortization of the value assigned to technology-related intangible assets obtained in business combinations. Amortization of acquired intangibles decreased $1.3 million, or 8%, in fiscal year 2016 as compared to fiscal year 2015. The decrease was due to the completion of amortization of certain intangible assets acquired in prior years.
Gross Profit
Fiscal Year Ended | ||||||||||
(In thousands) | November 30, 2016 | November 30, 2015 | Percentage Change | |||||||
Gross profit | $ | 339,629 | $ | 313,812 | 8 | % | ||||
As a percentage of total revenue | 84 | % | 83 | % | ||||||
Our gross profit increased $25.8 million, or 8%, in fiscal year 2016 as compared to fiscal year 2015, and our gross profit as a percentage of total revenue increased from 83% to 84% year over year. The dollar increase is primarily related to the increase of maintenance revenue. As a result of acquisition accounting, the deferred revenue balance acquired from Telerik in the first quarter of fiscal year 2015 was significantly reduced to reflect its fair value as of the acquisition date, which impacted the
23
amount of revenue recognized in fiscal year 2015. However, we were still incurring the associated costs to fulfill the acquired deferred revenue, which were reflected in our consolidated statement of operations in fiscal year 2015. As a result, our expenses as a percentage of total revenue were higher in fiscal year 2015.
Sales and Marketing
Fiscal Year Ended | ||||||||||
(In thousands) | November 30, 2016 | November 30, 2015 | Percentage Change | |||||||
Sales and marketing | $ | 121,501 | $ | 124,867 | (3 | )% | ||||
As a percentage of total revenue | 30 | % | 33 | % | ||||||
Sales and marketing expenses decreased $3.4 million, or 3%, in fiscal year 2016 as compared to fiscal year 2015, and decreased as a percentage of total revenue from 33% to 30%. The decrease in sales expenses was primarily due to lower outside services costs, largely due to our decision to end the outsourcing of our renewal maintenance business.
Product Development
Fiscal Year Ended | ||||||||||
(In thousands) | November 30, 2016 | November 30, 2015 | Percentage Change | |||||||
Product development costs | $ | 88,587 | $ | 88,250 | — | % | ||||
Capitalized product development costs | — | (1,326 | ) | (100 | )% | |||||
Total product development expense | $ | 88,587 | $ | 86,924 | 2 | % | ||||
As a percentage of total revenue | 22 | % | 23 | % | ||||||
Product development expenses increased $1.7 million, or 2%, in fiscal year 2016 as compared to fiscal year 2015, and decreased as a percentage of revenue from 23% to 22%. The increase in product development expense during the period is primarily due to higher compensation-related costs, most significantly in stock-based compensation costs, as a result of an increase in headcount as compared to the prior fiscal year. This increase was offset by the elimination of capitalized product development costs primarily as a result of our decision to replace our internally developed cloud-based mobile application development technology with technology acquired in connection with the acquisition of Telerik.
General and Administrative
Fiscal Year Ended | ||||||||||
(In thousands) | November 30, 2016 | November 30, 2015 | Percentage Change | |||||||
General and administrative | $ | 46,532 | $ | 57,294 | (19 | )% | ||||
As a percentage of total revenue | 11 | % | 15 | % | ||||||
General and administrative expenses include the costs of our finance, human resources, legal, information systems and administrative departments. General and administrative expenses decreased $10.8 million, or 19%, in fiscal year 2016 as compared to fiscal year 2015, and decreased as a percentage of revenue from 15% to 11%. The decrease was primarily due to decreased costs for external services in fiscal year 2016.
24
Impairment of Goodwill
Fiscal Year Ended | ||||||||||
(In thousands) | November 30, 2016 | November 30, 2015 | Percentage Change | |||||||
Impairment of goodwill | $ | 92,000 | $ | — | 100 | % | ||||
As a percentage of total revenue | 23 | % | — | % | ||||||
As of October 31, 2016, we tested goodwill for impairment for each of our reporting units under the two-step quantitative goodwill impairment test. Based on the first step of the goodwill impairment test, we concluded that our OpenEdge and Data Connectivity and Integration reporting units had fair values which significantly exceeded their carrying values as of the annual impairment date. With the reduced future growth expectations described in the Overview section above, our Application Development and Deployment reporting unit did not pass the first step of the impairment test. As such, we allocated the fair value of the Application Development and Deployment reporting unit to all of its assets and liabilities. Based on our analysis, the implied fair value of goodwill was substantially lower than the carrying value of goodwill for the reporting unit. As a result, we recorded a $92.0 million goodwill impairment charge related to the Application Development and Deployment reporting unit. See Note 6 to the Consolidated Financial Statements in Item 8 of this Form 10-K for additional details.
Amortization of Acquired Intangibles
Fiscal Year Ended | ||||||||||
(In thousands) | November 30, 2016 | November 30, 2015 | Percentage Change | |||||||
Amortization of acquired intangibles | $ | 12,735 | $ | 12,745 | — | % | ||||
As a percentage of total revenue | 3 | % | 3 | % | ||||||
Amortization of acquired intangibles included in operating expenses primarily represents the amortization of value assigned to intangible assets obtained in business combinations other than assets identified as purchased technology. Amortization of acquired intangibles remained flat in fiscal year 2016 as compared to fiscal year 2015.
Impairment of Intangible Assets
Fiscal Year Ended | ||||||||||
(In thousands) | November 30, 2016 | November 30, 2015 | Percentage Change | |||||||
Impairment of intangible assets | $ | 5,051 | $ | — | 100 | % | ||||
As a percentage of total revenue | 1 | % | — | % | ||||||
During fiscal year 2016, we evaluated the ongoing value of the intangible assets associated with the technology obtained in connection with the acquisition of Modulus. As a result of our decision to abandon the related assets due to a change in our expected ability to use the technology internally, we determined that the intangible assets were fully impaired. As a result, we incurred an impairment charge of $5.1 million during fiscal year 2016.
Restructuring Expenses
Fiscal Year Ended | ||||||||||
(In thousands) | November 30, 2016 | November 30, 2015 | Percentage Change | |||||||
Restructuring expenses | $ | 1,692 | $ | 12,989 | (87 | )% | ||||
As a percentage of total revenue | — | % | 3 | % | ||||||
We incurred restructuring expenses of $1.7 million in fiscal year 2016 as compared to $13.0 million in fiscal year 2015. Restructuring expenses recorded in fiscal year 2016 relate to the restructuring activities occurring in fiscal years 2016, 2015, 2014, 2013 and 2012. See Note 13 to the Consolidated Financial Statements in Item 8 of this Form 10-K for additional details,
25
including types of expenses incurred and the timing of future expenses and cash payments. See also the Liquidity and Capital Resources section of this Item 7, Management’s Discussion and Analysis of Financial Condition and Results of Operations.
Acquisition-Related Expenses
Fiscal Year Ended | ||||||||||
(In thousands) | November 30, 2016 | November 30, 2015 | Percentage Change | |||||||
Acquisition-related expenses | $ | 1,240 | $ | 4,239 | (71 | )% | ||||
As a percentage of total revenue | — | % | 1 | % | ||||||
Acquisition-related costs are expensed as incurred and include those costs incurred as a result of a business combination. These costs consist of professional service fees, including third-party legal and valuation-related fees, as well as retention fees, and earn-out payments treated as compensation expense. Acquisition-related expenses in fiscal year 2016 were minimal. Acquisition-related expenses in fiscal year 2015 resulted primarily from expenses related to the Telerik acquisition completed in the first quarter of fiscal year 2015. See Note 7 to the consolidated financial statements for additional details.
(Loss) Income from Operations
Fiscal Year Ended | ||||||||||
(In thousands) | November 30, 2016 | November 30, 2015 | Percentage Change | |||||||
(Loss) income from operations | $ | (29,709 | ) | $ | 14,754 | (301 | )% | |||
As a percentage of total revenue | (7 | )% | 4 | % | ||||||
Income from operations decreased $44.5 million, or 301%, in fiscal year 2016 as compared to fiscal year 2015. As discussed above, the decrease was primarily driven by the impairment of goodwill during fiscal year 2016 and partially offset by higher revenue during fiscal year 2016 compared to fiscal year 2015, as well as by lower expenses period over period.
(Loss) Income from Operations by Segment
Fiscal Year Ended | ||||||||||
(In thousands) | November 30, 2016 | November 30, 2015 | Percentage Change | |||||||
OpenEdge segment | $ | 203,329 | $ | 218,849 | (7 | )% | ||||
Data Connectivity and Integration segment | 35,249 | 24,107 | 46 | % | ||||||
Application Development and Deployment segment | 40,885 | 4,308 | 849 | % | ||||||
Other unallocated expenses | (309,172 | ) | (232,510 | ) | (33 | )% | ||||
Total (loss) income from operations | $ | (29,709 | ) | $ | 14,754 | (301 | )% | |||
Note that the following expenses are not allocated to our segments as we manage and report our business in these functional areas on a consolidated basis only: product development, corporate marketing, general and administration, amortization and impairment of acquired intangibles, stock-based compensation, restructuring, and acquisition-related expenses.
26
Other (Expense) Income
Fiscal Year Ended | ||||||||||
(In thousands) | November 30, 2016 | November 30, 2015 | Percentage Change | |||||||
Interest expense | $ | (4,178 | ) | $ | (3,788 | ) | 10 | % | ||
Interest income and other, net | 839 | 1,446 | (42 | )% | ||||||
Foreign currency loss | (2,232 | ) | (58 | ) | (3,748 | )% | ||||
Total other expense, net | $ | (5,571 | ) | $ | (2,400 | ) | (132 | )% | ||
As a percentage of total revenue | (1 | )% | (1 | )% | ||||||
Total other expense, net decreased $3.2 million in fiscal year 2016 as compared to fiscal year 2015 primarily due to the foreign currency loss of $2.2 million in fiscal year 2016 compared to the foreign currency loss of $0.1 million in fiscal year 2015. The change in foreign currency gains/losses is a result of movements in exchange rates and the impact during fiscal year 2016 on our intercompany receivables and payables denominated in currencies other than local currencies.
Provision for Income Taxes
Fiscal Year Ended | ||||||||||
(In thousands) | November 30, 2016 | November 30, 2015 | Percentage Change | |||||||
Provision for income taxes | $ | 20,446 | $ | 21,155 | (3 | )% | ||||
As a percentage of total revenue | 5 | % | 6 | % | ||||||
Our effective income tax rate was (58)% in fiscal year 2016 and 171% in fiscal year 2015. In fiscal year 2016 our rate was impacted unfavorably as a result of the goodwill impairment expense that is not tax deductible, partially offset by the release of the valuation allowance on state research and development tax credits described below and the out-of-period benefit described below. The decrease in the effective rate is primarily due to the jurisdictional mix of profits as a result of the acquisition of Telerik, where substantial losses were incurred in Bulgaria in fiscal year 2015 and tax effected at a 10% statutory rate and other jurisdictions’ earnings, primarily in the United States, were taxed at higher rates. The loss in Bulgaria in fiscal 2015 was primarily due to amortization expense and other purchase accounting adjustments related to the Telerik acquisition.
In addition, during the preparation of our condensed consolidated financial statements for the three months ended May 31, 2016, we identified an error in our prior year income tax provision whereby income tax expense was overstated for the year ended November 30, 2015 by $2.7 million related to our tax treatment of an intercompany gain. We determined that the error is not material to the prior year financial statements. We also concluded that recording an out-of-period correction would not be material and have therefore corrected this error by recording an out-of-period $2.7 million tax benefit in our interim financial statements for the period ended May 31, 2016.
In addition, in the fourth quarter of fiscal year 2016 we recorded a tax benefit of $2.7 million related to the release of the valuation allowance on state research and development credits.
Net (Loss) Income
Fiscal Year Ended | ||||||||||
(In thousands) | November 30, 2016 | November 30, 2015 | Percentage Change | |||||||
Net (loss) income | $ | (55,726 | ) | $ | (8,801 | ) | (533 | )% | ||
As a percentage of total revenue | (14 | )% | (2 | )% | ||||||
27
Fiscal 2015 Compared to Fiscal 2014
Revenue
Fiscal Year Ended | Percentage Change | ||||||||||||
(In thousands) | November 30, 2015 | November 30, 2014 | As Reported | Constant Currency | |||||||||
Revenue | $ | 377,554 | $ | 332,533 | 14 | % | 21 | % | |||||
Total revenue increased $45.0 million, or 14%, in fiscal year 2015 as compared to fiscal year 2014. Revenue would have increased by 21% if exchange rates had been constant in fiscal year 2015 as compared to exchange rates in fiscal year 2014. The increase in revenue in fiscal year 2015 was a result of an increase in both license and maintenance and services revenue, primarily due to the impact of our acquisitions of Telerik in December 2014 and BravePoint during the fourth fiscal quarter of 2014. Changes in prices from fiscal year 2014 to fiscal year 2015 did not have a significant impact on our revenue.
License Revenue
Fiscal Year Ended | Percentage Change | ||||||||||||
(In thousands) | November 30, 2015 | November 30, 2014 | As Reported | Constant Currency | |||||||||
License | $ | 130,250 | $ | 117,801 | 11 | % | 18 | % | |||||
As a percentage of total revenue | 34 | % | 35 | % | |||||||||
Software license revenue increased $12.4 million, or 11%, in fiscal year 2015 as compared to fiscal year 2014. Software license revenue would have increased by 18% if exchange rates had been constant in fiscal year 2015 as compared to exchange rates in effect in fiscal year 2014. The increase in license revenue was primarily in the North America and Asia Pacific regions as a result of incremental license revenue from the acquisition of Telerik. In addition to the incremental license revenue from Telerik, both OpenEdge and the Data Connectivity and Integration business segment showed strong growth in fiscal year 2015 on a constant currency basis, both to partners, as well as to direct end users.
Maintenance and Services Revenue
Fiscal Year Ended | Percentage Change | ||||||||||||
(In thousands) | November 30, 2015 | November 30, 2014 | As Reported | Constant Currency | |||||||||
Maintenance | $ | 217,718 | $ | 202,496 | 8 | % | 15 | % | |||||
As a percentage of total revenue | 58 | % | 61 | % | |||||||||
Professional services | $ | 29,586 | $ | 12,236 | 142 | % | 146 | % | |||||
As a percentage of total revenue | 8 | % | 4 | % | |||||||||
Total maintenance and services revenue | $ | 247,304 | $ | 214,732 | 15 | % | 23 | % | |||||
As a percentage of total revenue | 66 | % | 65 | % | |||||||||
Maintenance and services revenue increased $32.6 million in fiscal year 2015 as compared to fiscal year 2014. Maintenance revenue increased 8% and professional services revenue increased 142% compared to the prior year. The increase in maintenance revenue was primarily in the North America region, due in large part to the incremental revenue associated with the Telerik acquisition, as well as our strong OpenEdge maintenance renewal rate of over 90%. The increase in professional services revenue was primarily due to the impact of the BravePoint acquisition.
28
Revenue by Region
Fiscal Year Ended | Percentage Change | ||||||||||||
(In thousands) | November 30, 2015 | November 30, 2014 | As Reported | Constant Currency | |||||||||
North America | $ | 207,566 | $ | 150,716 | 38 | % | 38 | % | |||||
As a percentage of total revenue | 55 | % | 45 | % | |||||||||
EMEA | $ | 124,171 | $ | 131,335 | (5 | )% | 7 | % | |||||
As a percentage of total revenue | 33 | % | 40 | % | |||||||||
Latin America | $ | 17,594 | $ | 24,917 | (29 | )% | (8 | )% | |||||
As a percentage of total revenue | 5 | % | 7 | % | |||||||||
Asia Pacific | $ | 28,223 | $ | 25,565 | 10 | % | 22 | % | |||||
As a percentage of total revenue | 7 | % | 8 | % | |||||||||
Total revenue generated in North America increased $56.9 million, and total revenue generated outside North America decreased $11.8 million, in fiscal year 2015 as compared to fiscal year 2014. The increase in North America was primarily due to the impact of the Telerik and BravePoint acquisitions. In addition to the incremental revenue from Telerik and BravePoint, the increase in North America was due to strong OpenEdge license sales both to our partners and direct end users, growth in Data Connectivity and Integration license sales to our OEM channel, and strong maintenance renewals.
The decreases in EMEA and Latin America of 5% and 29%, respectively, were primarily due to the impact of the stronger U.S. dollar. If exchange rates had been constant in fiscal year 2015 as compared to exchange rates in effect in fiscal year 2014, revenue generated in EMEA would have increased 7% year over year, while revenue generated in Latin America would have decreased by 8%. The 10% increase in Asia Pacific was primarily due to the impact of the Telerik acquisition and revenue generated in the Asia Pacific region would have increased by 22% if exchange rates had been constant in fiscal year 2015 as compared to exchange rates in effect in fiscal year 2014.
Total revenue generated in markets outside North America represented 45% of total revenue in fiscal year 2015 compared to 55% of total revenue in fiscal year 2014. Total revenue generated in markets outside North America would have represented 48% of total revenue if exchange rates had been constant in fiscal year 2015 as compared to the exchange rates in effect in fiscal year 2014.
Revenue by Segment
Fiscal Year Ended | ||||||||||
(In thousands) | November 30, 2015 | November 30, 2014 | Percentage Change | |||||||
OpenEdge segment | $ | 295,934 | $ | 296,721 | — | % | ||||
Data Connectivity and Integration segment | 37,926 | 34,772 | 9 | % | ||||||
Application Development and Deployment segment | 43,694 | 1,040 | 4,101 | % | ||||||
Total revenue | $ | 377,554 | $ | 332,533 | 14 | % | ||||
Revenue in the OpenEdge segment decreased $0.8 million in fiscal year 2015 as compared to fiscal year 2014, due to a decrease in maintenance revenue primarily in the EMEA region as a result of the impact of the stronger U.S. dollar, partially offset by incremental services revenues as a result of the BravePoint acquisition. Revenue in the OpenEdge segment would have increased by 8% if exchange rates had been constant in fiscal year 2015 as compared to exchange rates in effect in fiscal year 2014. Data Connectivity and Integration revenue increased $3.2 million, or 9%, in fiscal year 2015 as compared to fiscal year 2014. Application Development revenue increased $42.7 million year over year as a result of the impact of the Telerik acquisition.
29
Cost of Software Licenses
Fiscal Year Ended | ||||||||||
(In thousands) | November 30, 2015 | November 30, 2014 | Percentage Change | |||||||
Cost of software licenses | $ | 5,979 | $ | 6,396 | (7 | )% | ||||
As a percentage of software license revenue | 5 | % | 5 | % | ||||||
As a percentage of total revenue | 2 | % | 2 | % | ||||||
Cost of software licenses consists primarily of costs of royalties, electronic software distribution costs, duplication and packaging. Cost of software licenses decreased $0.4 million, or 7%, in fiscal year 2015 as compared to fiscal year 2014, and remained flat as a percentage of software license revenue. Cost of software licenses as a percentage of software license revenue varies from period to period depending upon the relative product mix.
Cost of Maintenance and Services
Fiscal Year Ended | ||||||||||
(In thousands) | November 30, 2015 | November 30, 2014 | Percentage Change | |||||||
Cost of maintenance and services | $ | 40,933 | $ | 24,864 | 65 | % | ||||
As a percentage of maintenance and services revenue | 17 | % | 12 | % | ||||||
As a percentage of total revenue | 11 | % | 7 | % | ||||||
Cost of maintenance and services consists primarily of costs of providing customer support, consulting and education. Cost of maintenance and services increased $16.1 million, or 65%, in fiscal year 2015 as compared to fiscal year 2014, and increased as a percentage of maintenance and services revenue from 12% to 17%. The increase in cost of maintenance and services is primarily due to the impact of the Telerik and BravePoint acquisitions. With respect to the acquisition of Telerik, as a result of acquisition accounting, the acquired deferred revenue balance was significantly reduced to reflect its fair value as of the acquisition date. However, we are still incurring the associated costs to fulfill the acquired deferred revenue, which primarily relate to cost of maintenance and services. As a result, our expenses as a percentage of total revenue are higher than we expect they will be in future periods once this acquired deferred revenue balance is recognized.
Amortization of Acquired Intangibles
Fiscal Year Ended | ||||||||||
(In thousands) | November 30, 2015 | November 30, 2014 | Percentage Change | |||||||
Amortization of acquired intangibles | $ | 16,830 | $ | 2,999 | 461 | % | ||||
As a percentage of total revenue | 4 | % | 1 | % | ||||||
Amortization of acquired intangibles included in costs of revenue primarily represents the amortization of the value assigned to technology-related intangible assets obtained in business combinations. Amortization of acquired intangibles increased $13.8 million, or 461%, in fiscal year 2015 as compared to fiscal year 2014. The increase was due to amortization of intangible assets acquired in connection with the Modulus, BravePoint and Telerik acquisitions, partially offset by decreases due to the completion of amortization of certain intangible assets acquired in prior years.
30
Gross Profit
Fiscal Year Ended | ||||||||||
(In thousands) | November 30, 2015 | November 30, 2014 | Percentage Change | |||||||
Gross profit | $ | 313,812 | $ | 298,274 | 5 | % | ||||
As a percentage of total revenue | 83 | % | 90 | % | ||||||
Our gross profit increased $15.5 million, or 5%, in fiscal year 2015 as compared to fiscal year 2014, and our gross profit as a percentage of total revenue decreased from 90% to 83% year over year. The increase is primarily due to an increase in revenue as described above, partially offset by the increase of cost of maintenance and services, mainly due to the impact of the BravePoint acquisition, and the increase of amortization of acquired intangible assets. In addition, as a result of acquisition accounting, the deferred revenue balance acquired from Telerik was significantly reduced to reflect its fair value as of the acquisition date. However, we are still incurring the associated costs to fulfill the acquired deferred revenue, which are reflected in our consolidated statement of operations. As a result, our expenses as a percentage of total revenue are higher than we expect they will be in future periods once this acquired deferred revenue balance is recognized.
Sales and Marketing
Fiscal Year Ended | ||||||||||
(In thousands) | November 30, 2015 | November 30, 2014 | Percentage Change | |||||||
Sales and marketing | $ | 124,867 | $ | 101,496 | 23 | % | ||||
As a percentage of total revenue | 33 | % | 31 | % | ||||||
Sales and marketing expenses increased $23.4 million, or 23%, in fiscal year 2015 as compared to fiscal year 2014, and increased as a percentage of total revenue from 31% to 33%. The increase in sales expenses was primarily due to higher compensation-related costs in the sales function as a result of headcount increases primarily due to the impact of the Telerik and BravePoint acquisitions, as well as higher commissions expense due to the higher level of license revenue compared to fiscal year 2014. Marketing expenses were higher primarily due to the impact of the Telerik acquisition.
Product Development
Fiscal Year Ended | ||||||||||
(In thousands) | November 30, 2015 | November 30, 2014 | Percentage Change | |||||||
Product development costs | $ | 88,250 | $ | 63,099 | 40 | % | ||||
Capitalized product development costs | (1,326 | ) | (4,134 | ) | (68 | )% | ||||
Total product development expense | $ | 86,924 | $ | 58,965 | 47 | % | ||||
As a percentage of total revenue | 23 | % | 18 | % | ||||||
Product development expenses increased $28.0 million, or 47%, in fiscal year 2015 as compared to fiscal year 2014, and increased as a percentage of revenue from 18% to 23%. The increase was primarily due to higher compensation-related costs in the product development function as a result of headcount increases due to the impact of the Telerik acquisition. Capitalized product development costs decreased by 68% as compared to the prior fiscal year as a result of our decision to replace our internally developed cloud-based mobile application development technology with technology acquired as part of Telerik.
31
General and Administrative
Fiscal Year Ended | ||||||||||
(In thousands) | November 30, 2015 | November 30, 2014 | Percentage Change | |||||||
General and administrative | $ | 57,294 | $ | 48,292 | 19 | % | ||||
As a percentage of total revenue | 15 | % | 15 | % | ||||||
General and administrative expenses include the costs of our finance, human resources, legal, information systems and administrative departments. General and administrative expenses increased $9.0 million, or 19%, in fiscal year 2015 as compared to fiscal year 2014, and remained flat as a percentage of revenue. The increase was primarily due to higher compensation-related costs in the general and administrative function as a result of headcount increases due to the impact of the Telerik and BravePoint acquisitions.
Amortization of Acquired Intangibles
Fiscal Year Ended | ||||||||||
(In thousands) | November 30, 2015 | November 30, 2014 | Percentage Change | |||||||
Amortization of acquired intangibles | $ | 12,745 | $ | 653 | 1,852 | % | ||||
As a percentage of total revenue | 3 | % | — | % | ||||||
Amortization of acquired intangibles included in operating expenses primarily represents the amortization of value assigned to intangible assets obtained in business combinations other than assets identified as purchased technology. Amortization of acquired intangibles increased $12.1 million in fiscal year 2015 as compared to fiscal year 2014. The increase was due to amortization of intangible assets acquired with the Modulus, BravePoint and Telerik acquisitions, partially offset by decreases due to the completion of amortization of certain intangible assets acquired in prior years.
Restructuring Expenses
Fiscal Year Ended | ||||||||||
(In thousands) | November 30, 2015 | November 30, 2014 | Percentage Change | |||||||
Restructuring expenses | $ | 12,989 | $ | 2,266 | 473 | % | ||||
As a percentage of total revenue | 3 | % | 1 | % | ||||||
We incurred restructuring expenses of $13.0 million in fiscal year 2015 as compared to $2.3 million in fiscal year 2014. Restructuring expenses recorded in fiscal year 2015 relate to the restructuring activities occurring in fiscal years 2015, 2014, 2013 and 2012. See Note 13 to the Consolidated Financial Statements in Item 8 of this Form 10-K for additional details, including types of expenses incurred and the timing of future expenses and cash payments. See also the Liquidity and Capital Resources section of this Item 7, Management’s Discussion and Analysis of Financial Condition and Results of Operations.
Acquisition-Related Expenses
Fiscal Year Ended | ||||||||||
(In thousands) | November 30, 2015 | November 30, 2014 | Percentage Change | |||||||
Acquisition-related expenses | $ | 4,239 | $ | 5,862 | (28 | )% | ||||
As a percentage of total revenue | 1 | % | 2 | % | ||||||
Acquisition-related costs are expensed as incurred and include those costs incurred as a result of a business combination. These costs consist of professional service fees, including third-party legal and valuation-related fees, as well as retention fees, and earn-out payments treated as compensation expense. Acquisition-related expenses decreased in fiscal year 2015 compared to fiscal year 2014 due to the completion of earn-out provisions related to the Rollbase acquisition as of the end of the second
32
quarter of fiscal year 2015, as well as the reversal of contingent consideration provisions related to the Modulus acquisition, which was credited to the consolidated statement of operations during fiscal year 2015. The decrease was partially offset by retention bonus costs incurred in fiscal year 2015 related to the BravePoint and Telerik acquisitions. See Note 7 to the Consolidated Financial Statements for additional details.
Income from Operations
Fiscal Year Ended | ||||||||||
(In thousands) | November 30, 2015 | November 30, 2014 | Percentage Change | |||||||
Income from operations | $ | 14,754 | $ | 80,740 | (82 | )% | ||||
As a percentage of total revenue | 4 | % | 24 | % | ||||||
Income from operations decreased $66.0 million, or 82%, in fiscal year 2015 as compared to fiscal year 2014. As discussed above, the decrease was primarily the result of higher expenses resulting from acquisitions, partially offset by higher revenue during fiscal year 2015 compared to fiscal year 2014. With respect to the acquisition of Telerik, as a result of acquisition accounting, the acquired deferred revenue balance was significantly reduced to reflect its fair value as of the acquisition date. However, we are still incurring the associated costs to fulfill the acquired deferred revenue. As a result, our expenses as a percentage of total revenue are higher than we expect they will be in future periods once this acquired deferred revenue balance is recognized.
Income from Operations by Segment
Fiscal Year Ended | ||||||||||
(In thousands) | November 30, 2015 | November 30, 2014 | Percentage Change | |||||||
OpenEdge segment | $ | 218,849 | $ | 225,910 | (3 | )% | ||||
Data Connectivity and Integration segment | 24,107 | 22,464 | 7 | % | ||||||
Application Development and Deployment segment | 4,308 | (8,314 | ) | 152 | % | |||||
Other unallocated expenses | (232,510 | ) | (159,320 | ) | (46 | )% | ||||
Total income from operations | $ | 14,754 | $ | 80,740 | (82 | )% | ||||
Note that the following expenses are not allocated to our segments as we manage and report our business in these functional areas on a consolidated basis only: product development, corporate marketing, general and administration, amortization of acquired intangibles, stock-based compensation, restructuring, and acquisition-related expenses.
Other (Expense) Income
Fiscal Year Ended | ||||||||||
(In thousands) | November 30, 2015 | November 30, 2014 | Percentage Change | |||||||
Interest expense | $ | (3,788 | ) | $ | (572 | ) | 562 | % | ||
Interest income and other, net | $ | 1,446 | $ | 83 | 1,642 | % | ||||
Foreign currency loss | (58 | ) | (2,447 | ) | 98 | % | ||||
Total other (expense) income, net | $ | (2,400 | ) | $ | (2,936 | ) | 18 | % | ||
As a percentage of total revenue | (1 | )% | (1 | )% | ||||||
Total other expense decreased $0.5 million, or 18%, in fiscal year 2015 as compared to fiscal year 2014. The decrease is primarily due to the realized loss incurred of $2.6 million resulting from the sale of our auction rate securities, which is included in interest income and other, net for fiscal year 2014, partially offset by the increase in interest expense due to the new credit facility. The change in foreign currency losses is a result of movements in exchange rates and the impact in fiscal year 2015 on our intercompany receivables and payables denominated in currencies other than local currencies.
33
Provision for Income Taxes
Fiscal Year Ended | ||||||||||
(In thousands) | November 30, 2015 | November 30, 2014 | Percentage Change | |||||||
Provision for income taxes | $ | 21,155 | $ | 28,346 | (25 | )% | ||||
As a percentage of total revenue | 6 | % | 9 | % | ||||||
Our effective tax rate was 171% in fiscal year 2015 and 36% in fiscal year 2014. The increase in the effective rate is primarily due to the jurisdictional mix of profits as a result of the acquisition of Telerik, where substantial losses are being incurred in Bulgaria with a tax benefit at the 10% statutory rate and other jurisdictions' earnings, primarily in the United States, are being taxed at higher rates. The loss in Bulgaria is primarily due to amortization expense and other acquisition accounting adjustments related to the Telerik acquisition. Deferred tax liabilities have been established in acquisition accounting for the tax effect of the Telerik amortization expense and other purchase accounting adjustments.
Net (Loss) Income
Fiscal Year Ended | ||||||||||
(In thousands) | November 30, 2015 | November 30, 2014 | Percentage Change | |||||||
Net (loss) income | $ | (8,801 | ) | $ | 49,458 | (118 | )% | |||
As a percentage of total revenue | (2 | )% | 15 | % | ||||||
Liquidity and Capital Resources
Cash, Cash Equivalents and Short-Term Investments
(In thousands) | November 30, 2016 | November 30, 2015 | |||||
Cash and cash equivalents | $ | 207,036 | $ | 212,379 | |||
Short-term investments | 42,718 | 28,900 | |||||
Total cash, cash equivalents and short-term investments | $ | 249,754 | $ | 241,279 | |||
The increase in cash, cash equivalents and short-term investments of $8.5 million since the end of fiscal year 2015 was primarily due to cash inflows from operations of $102.8 million, partially offset by repurchases of common stock of $79.2 million, payments of debt principal in the amount of $9.4 million, and purchases of property and equipment of $5.8 million. Except as described below, there are no limitations on our ability to access our cash, cash equivalents and short-term investments.
Cash, cash equivalents and short-term investments held by our foreign subsidiaries was $26.8 million and $49.9 million at November 30, 2016 and 2015, respectively. This amount is considered to be permanently reinvested; as such, it is not available to fund our domestic operations. If we were to repatriate these funds, they would be subject to taxation in the U.S., but would be offset by foreign tax credits. We do not believe this has a material adverse impact on our liquidity.
Share Repurchase Program
In January 2014, our Board of Directors authorized a $100.0 million share repurchase program. In fiscal year 2014, we repurchased and retired 2.3 million shares of our common stock for $52.6 million. In fiscal year 2015, under the same authorization, we repurchased and retired 1.3 million shares for $32.9 million. In September 2015, our Board of Directors authorized a new $100.0 million share repurchase program, which increased the total authorization to $114.5 million.
In March 2016, our Board of Directors authorized a new $100.0 million share repurchase program. In fiscal year 2016, we repurchased and retired 3.1 million shares of our common stock for $79.2 million. As of November 30, 2016, there is $135.3 million remaining under this current authorization. The timing and amount of any shares repurchased will be determined by
34
management based on its evaluation of market conditions and other factors, and the Board of Directors may choose to suspend, expand or discontinue the repurchase program at any time.
Dividends
On September 27, 2016, our Board of Directors approved the initiation of a quarterly cash dividend to Progress shareholders.
The first quarterly dividend of $0.125 per share of common stock was paid on December 15, 2016 to shareholders of record
as of the close of business on December 1, 2016.
On January 11, 2017, our Board of Directors declared a quarterly dividend of $0.125 per share of common stock payable on March 15, 2017 to shareholders of record as of the close of business on March 1, 2017.
Restructuring Activities
During the fourth quarter of fiscal year 2016, our management approved, committed to and initiated plans to make strategic changes to our organization as a result of the appointment of our new Chief Executive Officer during the period. In connection with the new organizational structure, we eliminated the positions of Chief Product Officer and Chief Revenue Officer.
As part of this fourth quarter restructuring, for the fiscal year ended November 30, 2016, we incurred expenses of $1.5 million. The expenses are recorded as restructuring expenses in the consolidated statements of operations. Cash disbursements for expenses incurred to date under this restructuring are expected to be made through the fourth quarter of fiscal year 2017. As a result, the total amount of the restructuring reserve of $1.4 million is included in other accrued liabilities on the consolidated balance sheet at November 30, 2016.
In January 2017, we announced certain operational restructuring initiatives intended to significantly reduce annual costs. To execute these operational restructuring initiatives, we expect to reduce our global workforce by approximately 450 positions, totaling over 20% of our global workforce. These workforce reductions commenced in the first fiscal quarter of 2017 and are expected to be completed by the end of the second fiscal quarter of 2017, depending upon local legal requirements. These workforce reductions will occur in substantially all functional units and across all geographies in which we operate. We also expect to consolidate offices in various locations.
As a result of these workforce reductions and office consolidations, we expect to incur in the aggregate a pre-tax charge in the range of approximately $17 million to $20 million. The estimated aggregate charge consists of approximately $16 million to $17 million relating to our global workforce reduction, consisting primarily of severance and post-employment benefits, and approximately $1 million to $3 million relating to our office consolidations. We expect to record these charges primarily in the 2017 first and second fiscal quarters. Substantially all of these charges are expected to result in cash expenditures.
Credit Facility
Our credit agreement provides for a $150 million secured term loan and a $150 million secured revolving credit facility, which may be made available in U.S. Dollars and certain other currencies. The revolving credit facility may be increased by up to an additional $75 million if the existing or additional lenders are willing to make such increased commitments. We borrowed the $150 million term loan included in our credit agreement to partially fund our acquisition of Telerik. The revolving credit facility has sublimits for swing line loans up to $25.0 million and for the issuance of standby letters of credit in a face amount up to $25.0 million. We expect to use the revolving credit facility for general corporate purposes, including acquisitions of other businesses, and may also use it for working capital.
The credit facility matures on December 2, 2019, when all amounts outstanding will be due and payable in full. The revolving credit facility does not require amortization of principal. The outstanding balance of the $150 million term loan as of November 30, 2016 was $135.0 million, with $15.0 million due in the next 12 months. The term loan requires repayment of principal at the end of each fiscal quarter, beginning with the fiscal quarter ended February 28, 2015. The first eight payments were in the principal amount of $1.9 million each, the following eight payments are in the principal amount of $3.8 million each, the following three payments are in the principal amount of $5.6 million each, and the last payment is of the remaining principal amount. The term loan may be prepaid before maturity in whole or in part at our option without penalty or premium. As of November 30, 2016, the carrying value of the term loan approximates the fair value, based on Level 2 inputs (observable market prices in less than active markets), as the interest rate is variable over the selected interest period and is similar to current rates at which we can borrow funds. The average interest rate of the credit facility during the fiscal year ended November 30, 2016 was 2.22% and the interest rate as of November 30, 2016 was 2.31%.
35
Revolving loans may be borrowed, repaid and reborrowed until December 2, 2019, at which time all amounts outstanding must be repaid. As of November 30, 2016, there were no amounts outstanding under the revolving line and $0.5 million of letters of credit.
The credit facility contains customary affirmative and negative covenants, including covenants that limit or restrict our ability to, among other things, grant liens, make investments, make acquisitions, incur indebtedness, merge or consolidate, dispose of assets, pay dividends or make distributions, repurchase stock, change the nature of the business, enter into certain transactions with affiliates and enter into burdensome agreements, in each case subject to customary exceptions for a credit facility of this size and type. We are also required to maintain compliance with a consolidated fixed charge coverage ratio, a consolidated total leverage ratio and a consolidated senior secured leverage ratio. We are in compliance with these covenants as of November 30, 2016.
Cash Flows from Operating Activities
Fiscal Year Ended | |||||||||||
(In thousands) | November 30, 2016 | November 30, 2015 | November 30, 2014 | ||||||||
Net (loss) income | $ | (55,726 | ) | $ | (8,801 | ) | $ | 49,458 | |||
Non-cash reconciling items included in net (loss) income | 159,675 | 66,438 | 57,621 | ||||||||
Changes in operating assets and liabilities | (1,104 | ) | 46,903 | 615 | |||||||
Net cash flows from operating activities | $ | 102,845 | $ | 104,540 | $ | 107,694 | |||||
Cash generated from operations in fiscal year 2016 decreased by approximately $1.7 million, or 2%, as compared to fiscal year 2015. The decrease in cash generated from operations was primarily due to the year over year difference in changes in operating assets and liabilities, partially offset by higher operating income in fiscal year 2016 when excluding the impact of non-cash reconciling items included in net losses in both years. The significant non-cash reconciling items included in net loss in fiscal year 2016 include a $92 million impairment charge related to the goodwill of the Application Development and Deployment reporting unit (see Note 6 to the Consolidated Financial Statements in Item 8 of this Form 10-K for further information on the impairment charge). The significant changes in operating assets and liabilities in fiscal year 2015 as compared to fiscal year 2016 were primarily driven by an increase in total deferred revenue resulting from the acquisition of Telerik at the beginning of fiscal year 2015, as discussed below. Also, net tax payments made in fiscal year 2016 were $22.0 million, compared to $17.0 million in fiscal year 2015. In addition, our gross accounts receivable as of November 30, 2016 decreased by $1.8 million from the end of fiscal year 2015. Days sales outstanding (DSO) in accounts receivable was 50 days at the end of fiscal year 2016, compared to 52 days at the end of fiscal year 2015 and 63 days at the end of fiscal year 2014.
The decrease in cash generated from operations in fiscal year 2015 as compared to fiscal year 2014 was primarily due to lower income from operations during fiscal year 2015 as compared to fiscal year 2014 as a result of incremental costs resulting from the Telerik and BravePoint acquisitions, partially offset by changes in operating assets and liabilities mainly driven by the $37.8 million increase in our total deferred revenue from the end of fiscal year 2014 due to the acquisition of Telerik.
Cash Flows from Investing Activities
Fiscal Year Ended | |||||||||||
(In thousands) | November 30, 2016 | November 30, 2015 | November 30, 2014 | ||||||||
Net investment activity | $ | (15,216 | ) | $ | (9,552 | ) | $ | 37,784 | |||
Purchases of property and equipment | (5,786 | ) | (7,184 | ) | (7,985 | ) | |||||
Capitalized software costs | — | (1,661 | ) | (3,816 | ) | ||||||
Payments for acquisitions, net of cash acquired | — | (246,275 | ) | (24,493 | ) | ||||||
Proceeds from divestitures | — | 4,500 | 3,300 | ||||||||
Other investing activities | — | (36 | ) | 346 | |||||||
Net cash flows (used in) from investing activities | $ | (21,002 | ) | $ | (260,208 | ) | $ | 5,136 | |||
Net cash inflows and outflows of our net investment activity is primarily a result of the timing of our purchases and maturities of securities, which are classified as short-term investments, including the sale of all of our remaining ARS during the third
36
quarter of fiscal year 2014, as well as the timing of acquisitions and divestitures. In addition, we spent $5.8 million on property and equipment and capitalized software costs in fiscal year 2016 as compared to $8.8 million in the fiscal year 2015 and $11.8 million in fiscal year 2014. Most significantly, however, we did not complete any acquisitions during fiscal year 2016, whereas we acquired Telerik during the first quarter of fiscal year 2015 for a net cash amount of $246.3 million, which was funded through a combination of existing cash resources and a $150 million term loan discussed below in Cash Flows from Financing Activities, and we acquired Modulus and BravePoint during the second and fourth quarters of fiscal year 2014, respectively, for a net cash amount of $24.5 million.
Cash Flows from Financing Activities
Fiscal Year Ended | |||||||||||
(In thousands) | November 30, 2016 | November 30, 2015 | November 30, 2014 | ||||||||
Proceeds from stock-based compensation plans | $ | 9,918 | $ | 13,069 | $ | 16,488 | |||||
Repurchases of common stock | (79,188 | ) | (32,868 | ) | (52,604 | ) | |||||
Proceeds from the issuance of debt, net of payments of principle and debt issuance costs | (9,375 | ) | 142,588 | — | |||||||
Other financing activities | (3,548 | ) | (4,489 | ) | (6,116 | ) | |||||
Net cash flows from financing activities | $ | (82,193 | ) | $ | 118,300 | $ | (42,232 | ) | |||
During fiscal year 2016, we received $9.9 million from the exercise of stock options and the issuance of shares under our employee stock purchase plan, as compared to $13.1 million in fiscal year 2015 and $16.5 million is fiscal year 2014. In addition, in fiscal year 2016, we repurchased $79.2 million of our common stock, compared to repurchases of $32.9 million and $52.6 million, net of unsettled trades, in fiscal years 2015 and 2014, respectively. Most significantly, during fiscal year 2015, we received net proceeds of $142.6 million from the issuance of debt, whereas we made principal payments on this debt in the amount of $9.4 million during fiscal year 2016.
Indemnification Obligations
We include standard intellectual property indemnification provisions in our licensing agreements in the ordinary course of business. Pursuant to our product license agreements, we will indemnify, hold harmless, and agree to reimburse the indemnified party for losses suffered or incurred by the indemnified party, generally business partners or customers, in connection with certain patent, copyright or other intellectual property infringement claims by third parties with respect to our products. Other agreements with our customers provide indemnification for claims relating to property damage or personal injury resulting from the performance of services by us or our subcontractors. Historically, our costs to defend lawsuits or settle claims relating to such indemnity agreements have been insignificant. Accordingly, the estimated fair value of these indemnification provisions is immaterial.
Liquidity Outlook
We believe that existing cash balances, together with funds generated from operations and amounts available under our new credit facility, will be sufficient to finance our operations and meet our foreseeable cash requirements through at least the next twelve months. We do not contemplate a need for any foreign repatriation of the earnings which are deemed permanently reinvested. Our foreseeable cash needs include our planned capital expenditures, debt repayments, quarterly cash dividends, share repurchases, lease commitments, restructuring obligations and other long-term obligations.
37
Revenue Backlog
(In thousands) | November 30, 2016 | November 30, 2015 | |||||
Deferred revenue, primarily related to unexpired maintenance and support contracts | $ | 137,761 | $ | 134,071 | |||
Multi-year licensing arrangements (1) | 26,368 | 19,862 | |||||
Total revenue backlog | $ | 164,129 | $ | 153,933 | |||
(1) | Our backlog of orders not included on the balance sheet is not subject to our normal accounting controls for information that is either reported in or derived from our basic financial statements. Note that approximately $25.2 million and $17.7 million of the multi-year licensing arrangements as of November 30, 2016 and November 30, 2015, respectively, relate to OEM arrangements in our Data Connectivity and Integration business segment, while the remaining amount relates to arrangements in our OpenEdge business segment. |
We typically fulfill most of our software license orders within 30 days of acceptance of a purchase order. Assuming all other revenue recognition criteria have been met, we recognize software license revenue upon shipment of the product, or if delivered electronically, when the customer has the right to access the software. Because there are many elements governing when revenue is recognized, including when orders are shipped, credit approval obtained, completion of internal control processes over revenue recognition and other factors, management has some control in determining the period in which certain revenue is recognized. In addition, there is no industry standard for the definition of backlog and there may be an element of estimation in determining the amount. As such, direct comparisons with other companies may be difficult or potentially misleading.
Off-Balance Sheet Arrangements
We have no off-balance sheet arrangements as defined in Item 303(a)(4) of Regulation S-K.
Contractual Obligations
The following table details our contractual obligations as of November 30, 2016 (in thousands):
Payments Due by Period | |||||||||||||||||||
Total | Less than 1 Year | 1-3 Years | 3-5 Years | More than 5 Years | |||||||||||||||
Long-term debt: | |||||||||||||||||||
Principal payments | $ | 135,000 | $ | 15,000 | $ | 31,875 | $ | 88,125 | $ | — | |||||||||
Interest payments (1) | 7,881 | 2,992 | 4,878 | 11 | — | ||||||||||||||
Operating leases | 17,574 | 5,475 | 7,335 | 3,873 | 891 | ||||||||||||||
Purchase obligations (2) | 1,335 | 1,081 | 254 | — | — | ||||||||||||||
Unrecognized tax benefits (3) | — | — | — | — | — | ||||||||||||||
Total | $ | 161,790 | $ | 24,548 | $ | 44,342 | $ | 92,009 | $ | 891 | |||||||||
(1) | Interest on the long-term debt is due and payable monthly and is estimated using the effective interest rate as of November 30, 2016 as the interest rate is variable. See Note 8 to the Consolidated Financial Statements appearing in Item 8 of this Form 10-K for additional information. |
(2) | Represents the fixed or minimum amounts due under purchase obligations for support service agreements. |
(3) | Our other noncurrent liabilities in the consolidated balance sheet include unrecognized tax benefits and related interest and penalties. As of November 30, 2016, we had unrecognized tax benefits of $3.8 million and an additional $0.3 million for interest and penalties classified as noncurrent liabilities. At this time, we are unable to make a reasonably reliable estimate of the timing of payments in individual years in connection with these tax liabilities; therefore, such amounts are not included in the above contractual obligation table. See Note 14 to the Consolidated Financial Statements appearing in Item 8 of this Form 10-K for additional information. |
38
Critical Accounting Policies
Management’s discussion and analysis of financial condition and results of operations are based upon our consolidated financial statements which have been prepared in accordance with GAAP. We make estimates and assumptions in the preparation of our consolidated financial statements that affect the reported amounts of assets and liabilities, revenue and expenses and related disclosures of contingent assets and liabilities. We base our estimates on historical experience and various other assumptions that are believed to be reasonable under the circumstances. However, actual results may differ from these estimates.
We have identified the following critical accounting policies that require the use of significant judgments and estimates in the preparation of our consolidated financial statements. This listing is not a comprehensive list of all of our accounting policies. For further information regarding the application of these and other accounting policies, see Note 1 to the Consolidated Financial Statements appearing in Item 8 of this Form 10-K.
Revenue Recognition
We derive our revenue primarily from software licenses and maintenance and services. Our license arrangements generally contain multiple elements, including software maintenance services, consulting services, and customer education services. We do not recognize revenue until the following four basic criteria are met: (i) persuasive evidence of an arrangement exists, (ii) our product has been shipped or, if delivered electronically, the customer has the right to access the software, (iii) the fee is fixed or determinable, and (iv) collection of the fee is probable.
Evidence of an arrangement generally consists of a contract or purchase order signed by the customer. In regard to delivery, we generally ship our software electronically and do not license our software with conditions of acceptance. If an arrangement does contain conditions of acceptance, we defer recognition of the revenue until the acceptance criteria are met or the period of acceptance has passed. Services are considered delivered as the work is performed or, in the case of maintenance, over the contractual service period. We assess whether a fee is fixed or determinable at the outset of the arrangement and consider the payment terms of the transaction, including transactions that extend beyond our customary payment terms. We do not license our software with a right of return. In assessing whether the collection of the fee is probable, we consider customer credit-worthiness, a customer’s historical payment experience, economic conditions in the customer’s industry and geographic location and general economic conditions. If we do not consider collection of a fee to be probable, we defer the revenue until the fees are collected, provided all other conditions for revenue recognition have been met.
In determining when to recognize revenue from a customer arrangement, we are often required to exercise judgment regarding the application of our accounting policies to a particular arrangement. The primary judgments used in evaluating revenue recognized in each period involve: determining whether collection is probable, assessing whether the fee is fixed or determinable, and determining the fair value of the maintenance and services elements included in multiple-element software arrangements. Such judgments can materially impact the amount of revenue that we record in a given period. While we follow specific and detailed rules and guidelines related to revenue recognition, we make and use significant management judgments and estimates in connection with the revenue recognized in any reporting period, particularly in the areas described above. If management made different estimates or judgments, material differences in the timing of the recognition of revenue could occur.
In regard to software license revenues, perpetual and term license fees are recognized as revenue when the software is delivered, no significant obligations or contingencies related to the software exist, other than maintenance, and all other revenue recognition criteria are met. We generally recognize revenue for products distributed through application partners and distributors on a sell-in basis.
Revenue from maintenance is recognized ratably over the service period. Maintenance revenue is deferred until the associated license is delivered to the customer and all other criteria for revenue recognition have been met. Revenue from other services, which are primarily consulting and customer education services, is generally recognized as the services are delivered to the customer, provided all other criteria for revenue recognition have been met.
We also offer products via a SaaS model, which is a subscription based model. Subscription revenue derived from these agreements is generally recognized on a straight-line basis over the subscription term, provided persuasive evidence of an arrangement exists, access to our software has been granted to the customer, the fee for the subscription is fixed or determinable, and collection of the subscription fee is probable.
39
We generally sell our software licenses with maintenance services and, in some cases, also with consulting services. For these multiple element arrangements, we allocate revenue to the delivered elements of the arrangement using the residual method, whereby revenue is allocated to the undelivered elements based on vendor specific objective evidence (or VSOE) of fair value of the undelivered elements with the remaining arrangement fee allocated to the delivered elements and recognized as revenue assuming all other revenue recognition criteria are met. For the undelivered elements, we determine VSOE of fair value to be the price charged when the undelivered element is sold separately. We determine VSOE for maintenance sold in connection with a software license based on the amount that will be separately charged for the maintenance renewal period. Substantially all license arrangements indicate the renewal rate for which customers may, at their option, renew their maintenance agreement. We determine VSOE for consulting services by reference to the amount charged for similar engagements when a software license sale is not involved. We review services sold separately on a periodic basis and update, when appropriate, our VSOE of fair value for such maintenance and services to ensure that it reflects our recent pricing experience. If VSOE of fair value for the undelivered elements cannot be established, we defer all revenue from the arrangement until the earlier of the point at which such sufficient VSOE does exist or all elements of the arrangement have been delivered, or if the only undelivered element is maintenance, then we recognize the entire fee ratably over the maintenance period. If payment of the software license fees is dependent upon the performance of consulting services or the consulting services are essential to the functionality of the licensed software, then we recognize both the software license and consulting fees using the completed contract method.
Sales taxes collected from customers and remitted to government authorities are excluded from revenue.
Deferred revenue generally results from contractual billings for which revenue has not been recognized and consists of the unearned portion of license, maintenance, and services fees. Deferred revenue expected to be recognized as revenue more than one year subsequent to the balance sheet date is included in long-term liabilities in the consolidated balance sheets.
Allowances for Doubtful Accounts and Sales Credit Memos
We maintain an allowance for doubtful accounts for estimated losses resulting from the inability of customers to make required payments. We establish this allowance using estimates that we make based on factors such as the composition of the accounts receivable aging, historical bad debts, changes in payment patterns, changes to customer creditworthiness and current economic trends. Historically, our actual losses have been consistent with the allowances recorded. However, if we used different estimates, or if the financial condition of customers were to deteriorate, resulting in an impairment of their ability to make payments, we would require additional provisions for doubtful accounts that would increase bad debt expense.
We also record an allowance for estimates of potential sales credit memos. This allowance is determined based on an analysis of historical credit memos issued and current economic trends, and is recorded as a reduction of revenue.
Goodwill and Intangible Asset Impairment
We had goodwill and net intangible assets of $358.9 million at November 30, 2016. We evaluate goodwill and other intangible assets with indefinite useful lives, if any, for impairment annually or on an interim basis when events and circumstances arise that indicate impairment may have occurred. During the fourth quarter of fiscal year 2014, we changed the date of our annual impairment testing for goodwill from December 15 to October 31. We believe this change in accounting principle was preferable because it better aligned the timing of the annual goodwill impairment testing with our planning and budgeting process, which is a key component of the tests, and alleviates administrative burden during our year-end reporting period.
In performing our annual assessment, we may first perform a qualitative test to determine whether it is more likely than not that the fair value of a reporting unit is less than its carrying value and if necessary, perform a quantitative test. To conduct the quantitative impairment test of goodwill, we compare the fair value of a reporting unit to its carrying value. If the reporting unit’s carrying value exceeds its fair value, we record an impairment loss to the extent that the carrying value of goodwill exceeds its implied fair value. We estimate the fair values of our reporting units using discounted cash flow models or other valuation models, such as comparative transactions and market multiples. We must make assumptions about future cash flows, future operating plans, discount rates, comparable companies, market multiples, purchase price premiums and other factors in those models. Different assumptions and judgment determinations could yield different conclusions that would result in an impairment charge to income in the period that such change or determination was made.
When we evaluate potential impairments outside of our annual measurement date, judgment is required in determining whether an event has occurred that may impair the value of goodwill or intangible assets. Factors that could indicate that an impairment may exist include significant underperformance relative to plan or long-term projections, significant changes in business
40
strategy, significant negative industry or economic trends or a significant decline in our stock price for a sustained period of time.
The determination of reporting units also requires management judgment. We consider whether a reporting unit exists within a reportable segment based on the availability of discrete financial information that is regularly reviewed by segment management. Our three reporting units were OpenEdge, Data Connectivity and Integration, and Application Development and Deployment as of November 30, 2016.
During fiscal year 2016, we tested goodwill for impairment for each of our reporting units as of October 31, 2016. Our OpenEdge and Data Connectivity and Integration reporting units had fair values which significantly exceeded their carrying values as of the annual impairment date. Our Application Development and Deployment reporting unit (which includes Telerik) did not pass the first step of the impairment test. As a result, we recorded a $92.0 million goodwill impairment charge related to the Application Development and Deployment reporting unit. As of November 30, 2016, the Application Development and Deployment reporting unit had $47.0 million of goodwill remaining.
In performing the impairment analysis as of the fourth quarter of fiscal year 2016, we applied a weighting to the discounted cash flow method under the income approach (50%) and the guideline public company method (40%) and guideline transaction method (10%) under the market approach to estimate the fair value of our OpenEdge, Data Connectivity and Integration, and Application Development and Deployment reporting units. The discount rate used in the analysis was 9.8%, 12.0%, and 13.8% for the OpenEdge, Data Connectivity and Integration, and Application Development and Deployment reporting units, respectively.
We recorded no goodwill impairment losses in fiscal years 2015 or 2014.
Income Tax Accounting
We have a net deferred tax asset of $2.7 million at November 30, 2016. We record valuation allowances to reduce deferred tax assets to the amount that is more likely than not to be realized. We consider scheduled reversals of temporary differences, projected future taxable income, tax planning strategies and other matters in assessing the need for and the amount of a valuation allowance. If we were to change our assumptions or otherwise determine that we were unable to realize all or part of our net deferred tax asset in the future, an adjustment to the deferred tax asset would be charged to income in the period that such change or determination was made.
Management judgment is also required in evaluating whether a tax position taken or expected to be taken in a tax return, based on the weight of available evidence, indicates that it is more likely than not that, on an evaluation of the technical merits, the tax position will be sustained on audit, including resolution of any related appeals or litigation processes. Management judgment is also required in measuring the tax benefit as the largest amount that is more than 50% likely of being realized upon ultimate settlement. If management made different estimates or judgments, material differences in the amount accrued for uncertain tax positions would occur.
Stock-Based Compensation
We recognize stock-based compensation based on the fair value of stock-based awards, less the present value of expected dividends, measured at the date of grant. Stock-based compensation is recognized over the requisite service period, which is generally the vesting period of the award, and is adjusted each period for anticipated forfeitures.
We estimate the fair value of each stock-based award on the measurement date using either the current market price, the Black-Scholes option valuation model, or the Monte Carlo Simulation valuation model. The Black-Scholes and Monte Carlo Simulation valuation models incorporate assumptions as to the expected stock price volatility, the expected term of the option, a risk-free interest rate and a dividend yield. The expected volatility is based on the historical volatility of our stock price. The expected term is derived from historical data on employee exercises and post-vesting employment termination behavior. The risk-free interest rate is based on the yield of zero-coupon U.S. Treasury securities for the period that is commensurate with the expected option term at the time of grant. The expected dividend yield is based on our historical behavior and future expectations of dividend declarations.
41
Restructuring Charges
We periodically record restructuring charges resulting from restructuring our operations (including consolidations and/or relocations of operations), changes to our strategic plan, or managerial responses to declines in demand, increasing costs, or other market factors. The determination of restructuring charges requires management judgment and may include costs related to employee benefits, such as costs of severance and termination benefits, and estimates of costs for future lease commitments on excess facilities, net of estimated future sublease income. In determining the amount of the facilities charge, we are required to estimate such factors as future vacancy rates, the time required to sublet properties and sublease rates. These estimates are reviewed quarterly based on known real estate market conditions and the credit-worthiness of subtenants, and may result in revisions to established facility reserves.
Business Combinations
We allocate the purchase price of acquired companies to the tangible and intangible assets acquired and liabilities assumed based on their estimated fair values. The estimates used to value the net assets acquired are based in part on historical experience and information obtained from the management of the acquired company. We generally value the identifiable intangible assets acquired using a discounted cash flow model. The significant estimates used in valuing certain of the intangible assets include, but are not limited to: future expected cash flows of the asset, discount rates to determine the present value of the future cash flows, attrition rates of customers, and expected technology life cycles. We also estimate the useful lives of the intangible assets based on the expected period over which we anticipate generating economic benefit from the asset.
Our estimates of fair value are based on assumptions believed to be reasonable at that time. If management made different estimates or judgments, material differences in the fair values of the net assets acquired may result.
Recent Accounting Pronouncements
In August 2016, the Financial Accounting Standards Board (FASB) issued Accounting Standards Update No. 2016-15, Classification of Certain Cash Receipts and Cash Payments (ASU 2016-15). ASU 2016-15 is intended to add or clarify guidance on the classification of certain cash receipts and payments in the statement of cash flows and to eliminate the diversity in practice related to such classifications. The guidance in ASU 2016-15 is required for annual reporting periods beginning after December 15, 2017, with early adoption permitted. We are currently evaluating the effect that implementation of this update will have upon adoption on our consolidated statement of cash flows.
In March 2016, the FASB issued Accounting Standards Update No. 2016-09, Improvements to Employee Share-Based Payment Accounting (ASU 2016-09). ASU 2016-09 is intended to simplify various aspects of the accounting for employee share-based payment transactions, including accounting for income taxes, forfeitures, and statutory tax withholding requirements, as well as classification in the statement of cash flows. The guidance in ASU 2016-09 is required for annual reporting periods beginning after December 15, 2016, with early adoption permitted. We are currently evaluating the effect that implementation of this update will have upon adoption on our consolidated financial position and results of operations.
In February 2016, the FASB issued Accounting Standards Update No. 2016-02, Leases (ASU 2016-02), which requires lessees to record most leases on their balance sheets, recognizing a lease liability for the obligation to make lease payments and a right-to-use asset for the right to use the underlying asset for the lease term. The guidance in ASU 2016-02 is required for annual reporting periods beginning after December 15, 2018, with early adoption permitted. We currently expect that most of our operating lease commitments will be subject to the update and recognized as operating lease liabilities and right-of-use assets upon adoption. However, we are currently evaluating the effect that implementation of this update will have upon adoption on our consolidated financial position and results of operations.
In April 2015, the FASB issued Accounting Standards Update No. 2015-03, Interest - Imputation of Interest (Subtopic 835-30) Simplifying the Presentation of Debt Issuance Costs (ASU 2015-03). ASU 2015-03 requires debt issuance costs to be presented in the balance sheet as a direct deduction from the carrying value of the associated debt liability, consistent with the presentation of a debt discount. The guidance in ASU 2015-03 is required for annual reporting periods beginning after December 15, 2015, including interim periods within the reporting period. We estimate that the impact upon adoption on our consolidated balance sheets will be a reclassification of up to $1.1 million from other assets to long-term debt as of December 1, 2016.
42
In May 2014, the FASB issued Accounting Standards Update No. 2014-09, Revenue from Contracts with Customers (Topic 606) (ASU 2014-09). ASU 2014-09 outlines a single comprehensive model for entities to use in accounting for revenue arising from contracts with customers and supersedes most current revenue recognition guidance, including industry-specific guidance. This new guidance is effective for annual reporting periods (including interim reporting periods within those periods) beginning after December 15, 2016. Early adoption is not permitted. Entities have the option of using either a full retrospective or a modified approach to adopt the guidance. In July 2015, the FASB voted to defer the effective date of this ASU by one year for reporting periods beginning after December 15, 2017, with early adoption permitted as of the original effective date. As a result, the new effective date for the Company will be December 1, 2018. This update could impact the timing and amounts of revenue recognized. Management is currently assessing the impact the adoption of this ASU will have on the Company’s consolidated financial statements.
Item 7A. Quantitative and Qualitative Disclosures About Market Risk
We are exposed to a variety of risks, including changes in interest rates affecting the return on our investments and foreign currency fluctuations. We have established policies and procedures to manage our exposure to fluctuations in interest rates and foreign currency exchange rates.
Exposure to market rate risk for changes in interest rates relates to our investment portfolio. We have not used derivative financial instruments in our investment portfolio. We place our investments with high-quality issuers and have policies limiting, among other things, the amount of credit exposure to any one issuer. We seek to limit default risk by purchasing only investment-grade securities. Our investments have an average remaining maturity of less than two years or interest-rate resets of less than 60 days and are primarily fixed-rate instruments. In addition, we have classified our debt securities as available-for-sale. The available-for-sale classification reduces the consolidated statements of operations exposure to interest rate risk if such investments are held until their maturity date because changes in fair value due to market changes in interest rates are recorded on the consolidated balance sheet in accumulated other comprehensive income. Based on a hypothetical 10% adverse movement in interest rates, the potential losses in future earnings, fair value of risk-sensitive instruments and cash flows are immaterial.
We generally use forward contracts that are not designated as hedging instruments to hedge economically the impact of the variability in exchange rates on intercompany accounts receivable and loans receivable denominated in certain foreign currencies. We generally do not hedge the net assets of our international subsidiaries. All forward contracts are recorded at fair value in other current assets or other long-term liabilities on the consolidated balance sheets at the end of each reporting period and expire from 30 days to 366 days. In fiscal year 2016, realized and unrealized losses of $4.0 million from our forward contracts were recognized in foreign currency loss, net in the consolidated statements of operations. These losses were substantially offset by realized and unrealized losses and gains on the offsetting positions.
Foreign currency translation exposure from a 10% movement of currency exchange rates would have a material impact on our reported revenue and net income. Based on a hypothetical 10% adverse movement in all foreign currency exchange rates, our revenue would be adversely affected by approximately 3%, or $12 million, and our net income would be adversely affected by approximately 1%, or $1 million (excluding any offsetting positive impact from our ongoing hedging programs), although the actual effects may differ materially from the hypothetical analysis.
The table below details outstanding foreign currency forward contracts at November 30, 2016 and 2015 where the notional amount is determined using contract exchange rates (in thousands):
November 30, 2016 | November 30, 2015 | ||||||||||||||
Notional Value | Fair Value | Notional Value | Fair Value | ||||||||||||
Forward contracts to sell U.S. dollars | $ | 74,690 | $ | (6,597 | ) | $ | 76,748 | $ | (4,026 | ) | |||||
Forward contracts to purchase U.S. dollars | 1,673 | (19 | ) | 2,077 | 5 | ||||||||||
Total | $ | 76,363 | $ | (6,616 | ) | $ | 78,825 | $ | (4,021 | ) | |||||
43
Item 8. Financial Statements and Supplementary Data
REPORT OF INDEPENDENT REGISTERED PUBLIC ACCOUNTING FIRM
To the Board of Directors and Shareholders of
Progress Software Corporation
Bedford, Massachusetts
We have audited the accompanying consolidated balance sheets of Progress Software Corporation and subsidiaries (the "Company") as of November 30, 2016 and 2015, and the related consolidated statements of operations, comprehensive (loss) income, shareholders' equity, and cash flows for each of the three years in the period ended November 30, 2016. These financial statements are the responsibility of the Company's management. Our responsibility is to express an opinion on these financial statements based on our audits.
We conducted our audits in accordance with the standards of the Public Company Accounting Oversight Board (United States). Those standards require that we plan and perform the audit to obtain reasonable assurance about whether the financial statements are free of material misstatement. An audit includes examining, on a test basis, evidence supporting the amounts and disclosures in the financial statements. An audit also includes assessing the accounting principles used and significant estimates made by management, as well as evaluating the overall financial statement presentation. We believe that our audits provide a reasonable basis for our opinion.
In our opinion, such consolidated financial statements present fairly, in all material respects, the financial position of Progress Software Corporation and subsidiaries as of November 30, 2016 and 2015, and the results of their operations and their cash flows for each of the three years in the period ended November 30, 2016, in conformity with accounting principles generally accepted in the United States of America.
We have also audited, in accordance with the standards of the Public Company Accounting Oversight Board (United States), the Company's internal control over financial reporting as of November 30, 2016, based on the criteria established in Internal Control-Integrated Framework (2013) issued by the Committee of Sponsoring Organizations of the Treadway Commission and our report dated January 30, 2017 expressed an unqualified opinion on the Company's internal control over financial reporting.
/s/ Deloitte & Touche LLP
Boston, Massachusetts
January 30, 2017
44
PROGRESS SOFTWARE CORPORATION
Consolidated Balance Sheets
(In thousands, except share data) | November 30, 2016 | November 30, 2015 | |||||
Assets | |||||||
Current assets: | |||||||
Cash and cash equivalents | $ | 207,036 | $ | 212,379 | |||
Short-term investments | 42,718 | 28,900 | |||||
Total cash, cash equivalents and short-term investments | 249,754 | 241,279 | |||||
Accounts receivable (less allowances of $1,143 in 2016 and $2,193 in 2015) | 65,678 | 66,459 | |||||
Other current assets | 20,621 | 15,671 | |||||
Total current assets | 336,053 | 323,409 | |||||
Property and equipment, net | 50,105 | 54,226 | |||||
Intangible assets, net | 80,827 | 114,113 | |||||
Goodwill | 278,067 | 369,985 | |||||
Deferred tax assets | 6,601 | 10,971 | |||||
Other assets | 3,174 | 4,419 | |||||
Total assets | $ | 754,827 | $ | 877,123 | |||
Liabilities and shareholders’ equity | |||||||
Current liabilities: | |||||||
Current portion of long-term debt | 15,000 | 9,375 | |||||
Accounts payable | 12,991 | 11,188 | |||||
Accrued compensation and related taxes | 26,212 | 29,720 | |||||
Dividends payable to shareholders | 6,067 | — | |||||
Income taxes payable | 1,509 | 2,941 | |||||
Other accrued liabilities | 12,999 | 21,465 | |||||
Short-term deferred revenue | 128,960 | 125,227 | |||||
Total current liabilities | 203,738 | 199,916 | |||||
Long-term debt | 120,000 | 135,000 | |||||
Long-term deferred revenue | 8,801 | 8,844 | |||||
Deferred tax liabilities | 3,901 | 7,112 | |||||
Other noncurrent liabilities | 11,758 | 3,787 | |||||
Commitments and contingencies (Note 9) | |||||||
Shareholders’ equity: | |||||||
Preferred stock, $.01 par value; authorized, 1,000,000 shares; issued, none | — | — | |||||
Common stock, $.01 par value; authorized, 200,000,000 shares; issued and outstanding, 48,536,516 in 2016 and 50,579,539 in 2015 | 485 | 506 | |||||
Additional paid-in capital | 239,011 | 227,424 | |||||
Retained earnings | 195,694 | 319,162 | |||||
Accumulated other comprehensive loss | (28,561 | ) | (24,628 | ) | |||
Total shareholders’ equity | 406,629 | 522,464 | |||||
Total liabilities and shareholders’ equity | $ | 754,827 | $ | 877,123 | |||
See notes to consolidated financial statements.
45
PROGRESS SOFTWARE CORPORATION
Consolidated Statements of Operations
Fiscal Year Ended | |||||||||||
(In thousands, except per share data) | November 30, 2016 | November 30, 2015 | November 30, 2014 | ||||||||
Revenue: | |||||||||||
Software licenses | $ | 134,863 | $ | 130,250 | $ | 117,801 | |||||
Maintenance and services | 270,478 | 247,304 | 214,732 | ||||||||
Total revenue | 405,341 | 377,554 | 332,533 | ||||||||
Costs of revenue: | |||||||||||
Cost of software licenses | 5,456 | 5,979 | 6,396 | ||||||||
Cost of maintenance and services | 44,760 | 40,933 | 24,864 | ||||||||
Amortization of acquired intangibles | 15,496 | 16,830 | 2,999 | ||||||||
Total costs of revenue | 65,712 | 63,742 | 34,259 | ||||||||
Gross profit | 339,629 | 313,812 | 298,274 | ||||||||
Operating expenses: | |||||||||||
Sales and marketing | 121,501 | 124,867 | 101,496 | ||||||||
Product development | 88,587 | 86,924 | 58,965 | ||||||||
General and administrative | 46,532 | 57,294 | 48,292 | ||||||||
Impairment of goodwill | 92,000 | — | — | ||||||||
Amortization of acquired intangibles | 12,735 | 12,745 | 653 | ||||||||
Impairment of intangible assets | 5,051 | — | — | ||||||||
Restructuring expenses | 1,692 | 12,989 | 2,266 | ||||||||
Acquisition-related expenses | 1,240 | 4,239 | 5,862 | ||||||||
Total operating expenses | 369,338 | 299,058 | 217,534 | ||||||||
(Loss) income from operations | (29,709 | ) | 14,754 | 80,740 | |||||||
Other (expense) income: | |||||||||||
Interest expense | (4,178 | ) | (3,788 | ) | (572 | ) | |||||
Interest income and other, net | 839 | 1,446 | 83 | ||||||||
Foreign currency loss, net | (2,232 | ) | (58 | ) | (2,447 | ) | |||||
Total other expense, net | (5,571 | ) | (2,400 | ) | (2,936 | ) | |||||
(Loss) income before income taxes | (35,280 | ) | 12,354 | 77,804 | |||||||
Provision for income taxes | 20,446 | 21,155 | 28,346 | ||||||||
Net (loss) income | $ | (55,726 | ) | $ | (8,801 | ) | $ | 49,458 | |||
(Loss) earnings per share: | |||||||||||
Basic | $ | (1.13 | ) | $ | (0.17 | ) | $ | 0.97 | |||
Diluted | $ | (1.13 | ) | $ | (0.17 | ) | $ | 0.96 | |||
Weighted average shares outstanding: | |||||||||||
Basic | 49,481 | 50,391 | 50,840 | ||||||||
Diluted | 49,481 | 50,391 | 51,466 | ||||||||
Cash dividends declared per common share | $ | 0.125 | $ | — | $ | — | |||||
See notes to consolidated financial statements.
46
PROGRESS SOFTWARE CORPORATION
Consolidated Statements of Comprehensive (Loss) Income
Fiscal Year Ended | |||||||||||
(In thousands) | November 30, 2016 | November 30, 2015 | November 30, 2014 | ||||||||
Net (loss) income | $ | (55,726 | ) | $ | (8,801 | ) | $ | 49,458 | |||
Other comprehensive (loss) income, net of tax: | |||||||||||
Foreign currency translation adjustments | (3,843 | ) | (10,849 | ) | (4,484 | ) | |||||
Unrealized (loss) gain on investments, net of tax (benefit) provision of $(53) in 2016, $(30) in 2015, and $1,400 in 2014 | (90 | ) | (53 | ) | 2,417 | ||||||
Total other comprehensive (loss) income, net of tax | (3,933 | ) | (10,902 | ) | (2,067 | ) | |||||
Comprehensive (loss) income | $ | (59,659 | ) | $ | (19,703 | ) | $ | 47,391 | |||
See notes to consolidated financial statements.
47
PROGRESS SOFTWARE CORPORATION
Consolidated Statements of Shareholders’ Equity
Common Stock | Additional Paid-In Capital | Retained Earnings | Accumulated Other Comprehensive Loss | Total Shareholders' Equity | ||||||||||||||||||
(in thousands) | Number of Shares | Amount | ||||||||||||||||||||
Balance, December 1, 2013 | 51,513 | $ | 515 | $ | 204,792 | $ | 320,006 | $ | (11,659 | ) | $ | 513,654 | ||||||||||
Issuance of stock under employee stock purchase plan | 203 | 2 | 3,611 | — | — | 3,613 | ||||||||||||||||
Exercise of stock options | 690 | 7 | 12,813 | — | — | 12,820 | ||||||||||||||||
Vesting of restricted stock units | 866 | 9 | — | — | — | 9 | ||||||||||||||||
Withholding tax payments related to net issuance of restricted stock units | (289 | ) | (3 | ) | (6,604 | ) | — | — | (6,607 | ) | ||||||||||||
Tax benefit arising from employee stock purchase plan, stock options and restricted share activity | — | — | 96 | — | — | 96 | ||||||||||||||||
Stock-based compensation | — | — | 24,873 | — | — | 24,873 | ||||||||||||||||
Treasury stock repurchases and retirements | (2,306 | ) | (23 | ) | (30,310 | ) | (22,271 | ) | — | (52,604 | ) | |||||||||||
Net income | — | — | — | 49,458 | — | 49,458 | ||||||||||||||||
Other comprehensive loss | — | — | — | — | (2,067 | ) | (2,067 | ) | ||||||||||||||
Balance, November 30, 2014 | 50,677 | 507 | 209,271 | 347,193 | (13,726 | ) | 543,245 | |||||||||||||||
Issuance of stock under employee stock purchase plan | 226 | 2 | 4,429 | — | — | 4,431 | ||||||||||||||||
Exercise of stock options | 449 | 4 | 8,365 | — | — | 8,369 | ||||||||||||||||
Vesting of restricted stock units | 714 | 7 | — | — | — | 7 | ||||||||||||||||
Withholding tax payments related to net issuance of restricted stock units | (215 | ) | (3 | ) | (5,628 | ) | — | — | (5,631 | ) | ||||||||||||
Tax benefit arising from employee stock purchase plan, stock options and restricted share activity | — | 2 | 608 | — | — | 610 | ||||||||||||||||
Stock-based compensation | — | — | 24,004 | — | — | 24,004 | ||||||||||||||||
Treasury stock repurchases and retirements | (1,271 | ) | (13 | ) | (13,625 | ) | (19,230 | ) | — | (32,868 | ) | |||||||||||
Net loss | — | — | — | (8,801 | ) | — | (8,801 | ) | ||||||||||||||
Other comprehensive loss | — | — | — | — | (10,902 | ) | (10,902 | ) | ||||||||||||||
Balance, November 30, 2015 | 50,580 | 506 | 227,424 | 319,162 | (24,628 | ) | 522,464 | |||||||||||||||
48
Issuance of stock under employee stock purchase plan | 266 | 3 | 5,325 | — | — | 5,328 | ||||||||||||||||
Exercise of stock options | 260 | 2 | 4,696 | — | — | 4,698 | ||||||||||||||||
Vesting of restricted stock units and release of deferred stock units | 700 | 7 | — | — | — | 7 | ||||||||||||||||
Withholding tax payments related to net issuance of restricted stock units | (156 | ) | (2 | ) | (3,982 | ) | — | — | (3,984 | ) | ||||||||||||
Tax benefit arising from employee stock purchase plan, stock options and restricted share activity | — | — | 489 | — | — | 489 | ||||||||||||||||
Stock-based compensation | — | — | 22,541 | — | — | 22,541 | ||||||||||||||||
Dividends declared | — | — | — | (6,067 | ) | — | (6,067 | ) | ||||||||||||||
Treasury stock repurchases and retirements | (3,113 | ) | (31 | ) | (17,482 | ) | (61,675 | ) | — | (79,188 | ) | |||||||||||
Net loss | — | — | — | (55,726 | ) | — | (55,726 | ) | ||||||||||||||
Other comprehensive loss | — | — | — | — | (3,933 | ) | (3,933 | ) | ||||||||||||||
Balance, November 30, 2016 | 48,537 | $ | 485 | $ | 239,011 | $ | 195,694 | $ | (28,561 | ) | $ | 406,629 | ||||||||||
See notes to consolidated financial statements.
49
PROGRESS SOFTWARE CORPORATION
Consolidated Statements of Cash Flows
Fiscal Year Ended | |||||||||||
(In thousands) | November 30, 2016 | November 30, 2015 | November 30, 2014 | ||||||||
Cash flows from operating activities: | |||||||||||
Net (loss) income | $ | (55,726 | ) | $ | (8,801 | ) | $ | 49,458 | |||
Adjustments to reconcile net (loss) income to net cash provided by operating activities: | |||||||||||
Depreciation and amortization of property and equipment | 8,506 | 9,394 | 9,775 | ||||||||
Amortization of acquired intangibles and other | 30,815 | 32,286 | 5,521 | ||||||||
Stock-based compensation | 22,541 | 24,004 | 24,873 | ||||||||
Changes in fair value of contingent consideration obligation | — | (1,508 | ) | 89 | |||||||
Loss on sale of auction rate securities | — | — | 2,554 | ||||||||
Loss on disposal of property and equipment | 370 | 41 | 60 | ||||||||
Impairment of goodwill and long-lived assets | 97,051 | 4,962 | — | ||||||||
Deferred income taxes | 1,307 | (1,845 | ) | 15,034 | |||||||
Excess tax benefits from stock plans | (436 | ) | (1,349 | ) | (701 | ) | |||||
Allowances for bad debt and sales credits | (479 | ) | 453 | 416 | |||||||
Changes in operating assets and liabilities: | |||||||||||
Accounts receivable | 647 | 3,747 | (703 | ) | |||||||
Other assets | (3,925 | ) | 5,428 | 8,222 | |||||||
Accounts payable and accrued liabilities | (3,094 | ) | (370 | ) | (8,749 | ) | |||||
Income taxes payable | 109 | 2,481 | 710 | ||||||||
Deferred revenue | 5,159 | 35,617 | 1,135 | ||||||||
Net cash flows from operating activities | 102,845 | 104,540 | 107,694 | ||||||||
Cash flows from investing activities: | |||||||||||
Purchases of investments | (41,691 | ) | (24,178 | ) | (5,537 | ) | |||||
Sales and maturities of investments | 26,475 | 14,626 | 17,125 | ||||||||
Redemptions and sales of auction rate securities - available-for-sale | — | — | 26,196 | ||||||||
Purchases of property and equipment | (5,786 | ) | (7,184 | ) | (7,985 | ) | |||||
Capitalized software development costs | — | (1,661 | ) | (3,816 | ) | ||||||
Payments for acquisitions, net of cash acquired | — | (246,275 | ) | (24,493 | ) | ||||||
Proceeds from divestitures, net | — | 4,500 | 3,300 | ||||||||
Decrease in other noncurrent assets | — | (36 | ) | 346 | |||||||
Net cash flows (used in) from investing activities | (21,002 | ) | (260,208 | ) | 5,136 | ||||||
Cash flows from financing activities: | |||||||||||
Proceeds from stock-based compensation plans | 9,918 | 13,069 | 16,488 | ||||||||
Purchase of common stock related to withholding taxes from issuance of restricted stock units | (3,984 | ) | (5,631 | ) | (6,607 | ) | |||||
Repurchase of common stock | (79,188 | ) | (32,868 | ) | (52,604 | ) | |||||
Excess tax benefit from stock plans | 436 | 1,349 | 701 | ||||||||
Proceeds from the issuance of debt | — | 150,000 | — | ||||||||
Payment of long-term debt | (9,375 | ) | (5,625 | ) | — | ||||||
Payment of issuance costs for long-term debt | — | (1,785 | ) | — | |||||||
Payment of contingent consideration | — | (209 | ) | (210 | ) | ||||||
Net cash flows (used in) from financing activities | (82,193 | ) | 118,300 | (42,232 | ) | ||||||
Effect of exchange rate changes on cash | (4,993 | ) | (13,335 | ) | (6,334 | ) | |||||
Net (decrease) increase in cash and equivalents | (5,343 | ) | (50,703 | ) | 64,264 | ||||||
Cash and equivalents, beginning of year | 212,379 | 263,082 | 198,818 | ||||||||
Cash and equivalents, end of year | $ | 207,036 | $ | 212,379 | $ | 263,082 | |||||
50
Supplemental disclosure: | |||||||||||
Cash paid for income taxes, net of refunds of $1,379 in 2016, $2,264 in 2015, and $1,769 in 2014 | $ | 22,031 | $ | 17,036 | $ | 7,343 | |||||
Cash paid for interest | $ | 3,157 | $ | 2,725 | $ | — | |||||
Non-cash financing activity: | |||||||||||
Total fair value of restricted stock awards, restricted stock units and deferred stock units on date vested | $ | 17,213 | $ | 18,714 | $ | 20,093 | |||||
Dividends declared | $ | 6,067 | $ | — | $ | — | |||||
See notes to consolidated financial statements.
51
PROGRESS SOFTWARE CORPORATION
Notes to Consolidated Financial Statements
Note 1: Nature of Business and Summary of Significant Accounting Policies
The Company
We are a global leader in application development, empowering enterprises to build mission-critical business applications to succeed in an evolving business environment. With offerings spanning web, mobile and data for on-premise and cloud environments, we power businesses worldwide, promoting success one application at a time. Our solutions are used across a variety of industries.
Our products are generally sold as perpetual licenses, but certain products also use term licensing models and our cloud-based offerings use a subscription based model. More than half of our worldwide license revenue is realized through relationships with indirect channel partners, principally application partners and original equipment manufacturers (OEMs). Application partners are independent software vendors (ISVs) that develop and market applications using our technology and resell our products in conjunction with sales of their own products that incorporate our technology. OEMs are companies that embed our products into their own software products or devices.
We operate in North America and Latin America (the Americas); Europe, the Middle East and Africa (EMEA); and the Asia Pacific region, through local subsidiaries as well as independent distributors.
Accounting Principles
We prepare our consolidated financial statements and accompanying notes in conformity with accounting principles generally accepted in the United States of America (GAAP).
Basis of Consolidation
The consolidated financial statements include our accounts and those of our subsidiaries (all of which are wholly-owned). We eliminate all intercompany balances and transactions.
Use of Estimates
The preparation of consolidated financial statements requires management to make estimates and assumptions that affect the amounts reported in the financial statements and accompanying notes. On an on-going basis, management evaluates its estimates and records changes in estimates in the period in which they become known. These estimates are based on historical data and experience, as well as various other assumptions that management believes to be reasonable under the circumstances. The most significant estimates relate to the timing and amounts of revenue recognition, the realization of tax assets and estimates of tax liabilities, fair values of investments in marketable securities, intangible assets and goodwill valuations, the recognition and disclosure of contingent liabilities, the collectability of accounts receivable, and assumptions used to determine the fair value of stock-based compensation. Actual results could differ from those estimates.
Foreign Currency Translation
The functional currency of most of our foreign subsidiaries is the local currency in which the subsidiary operates. For foreign operations where the local currency is considered to be the functional currency, we translate assets and liabilities into U.S. dollars at the exchange rate on the balance sheet date. We translate income and expense items at average rates of exchange prevailing during each period. We accumulate translation adjustments in accumulated other comprehensive loss, a component of shareholders’ equity.
For foreign operations where the U.S. dollar is considered to be the functional currency, we remeasure monetary assets and liabilities into U.S. dollars at the exchange rate on the balance sheet date and non-monetary assets and liabilities are remeasured into U.S. dollars at historical exchange rates. We translate income and expense items at average rates of exchange prevailing during each period. We recognize remeasurement adjustments currently as a component of foreign currency loss, net in the statements of operations.
Transaction gains or losses that arise from exchange rate fluctuations on transactions denominated in a currency other than the functional currency are included in foreign currency loss, net in the statements of operations as incurred.
52
Cash Equivalents and Investments
Cash equivalents include short-term, highly liquid investments purchased with remaining maturities of three months or less. As of November 30, 2016, all of our cash equivalents were invested in money market funds.
We classify investments, state and municipal bond obligations, U.S. treasury and government agency bonds, and corporate bonds and notes, as investments available-for-sale, which are stated at fair value. We include aggregate unrealized holding gains and losses, net of taxes, on available-for-sale securities as a component of accumulated other comprehensive loss in shareholders’ equity. We include realized gains and losses in interest income and other, net on the consolidated statements of operations.
We monitor our investment portfolio for impairment on a periodic basis. In the event that the carrying value of an investment exceeds its fair value and the decline in value is determined to be other than temporary, an impairment charge is recorded and a new cost basis for the investment is established. In determining whether an other-than-temporary impairment exists, we consider the nature of the investment, the length of time and the extent to which the fair value has been less than cost, and our intent and ability to continue holding the security for a period sufficient for an expected recovery in fair value.
Allowances for Doubtful Accounts and Sales Credit Memos
We maintain an allowance for doubtful accounts for estimated losses resulting from the inability of customers to make required payments. We establish this allowance using estimates that we make based on factors such as the composition of the accounts receivable aging, historical bad debts, changes in payment patterns, changes to customer creditworthiness and current economic trends.
We also record an allowance for estimates of potential sales credit memos. This allowance is determined based on an analysis of historical credit memos issued and current economic trends, and is recorded as a reduction of revenue.
A summary of activity in the allowance for doubtful accounts is as follows (in thousands):
November 30, 2016 | November 30, 2015 | November 30, 2014 | |||||||||
Beginning balance | $ | 1,421 | $ | 1,646 | $ | 2,250 | |||||
(Credit) charge to costs and expenses | (256 | ) | 271 | 365 | |||||||
Write-offs and other | (370 | ) | (512 | ) | (949 | ) | |||||
Translation adjustments | (54 | ) | 16 | (20 | ) | ||||||
Ending balance | $ | 741 | $ | 1,421 | $ | 1,646 | |||||
A summary of activity in the allowance for sales credit memos is as follows (in thousands):
November 30, 2016 | November 30, 2015 | November 30, 2014 | |||||||||
Beginning balance | $ | 772 | $ | 946 | $ | 903 | |||||
(Credit) charge to revenue | (223 | ) | 182 | 51 | |||||||
Write-offs and other | (144 | ) | (332 | ) | (6 | ) | |||||
Translation adjustments | (3 | ) | (24 | ) | (2 | ) | |||||
Ending balance | $ | 402 | $ | 772 | $ | 946 | |||||
53
Concentrations of Credit Risk
Our financial instruments that potentially subject us to concentrations of credit risk consist primarily of cash and cash equivalents, investments, derivative instruments and trade receivables. We have cash investment policies which, among other things, limit investments to investment-grade securities. We hold our cash and cash equivalents, investments and derivative instrument contracts with high quality financial institutions and we monitor the credit ratings of those institutions. We perform ongoing credit evaluations of our customers, and the risk with respect to trade receivables is further mitigated by the diversity, both by geography and by industry, of the customer base. No single customer represented more than 10% of consolidated accounts receivable or revenue in fiscal years 2016, 2015 or 2014.
Fair Value of Financial Instruments
The carrying amount of our cash and cash equivalents, accounts receivable, accounts payable and long-term debt approximates fair value due to the short-term nature or market interest rates of these items. We base the fair value of short-term investments on quoted market prices or other relevant information generated by market transactions involving identical or comparable assets. We measure and record derivative financial instruments at fair value. See Note 4 for further discussion of financial instruments that are carried at fair value on a recurring and nonrecurring basis.
Derivative Instruments
We record all derivatives, whether designated in hedging relationships or not, on the consolidated balance sheets at fair value. We use derivative instruments to manage exposures to fluctuations in the value of foreign currencies, which exist as part of our ongoing business operations. Certain assets and forecasted transactions are exposed to foreign currency risk. Our objective for holding derivatives is to eliminate or reduce the impact of these exposures. We periodically monitor our foreign currency exposures to enhance the overall economic effectiveness of our foreign currency hedge positions. Principal currencies hedged include the euro, British pound, Brazilian real, Indian rupee, and Australian dollar. We do not enter into derivative instruments for speculative purposes, nor do we hold or issue any derivative instruments for trading purposes.
We enter into certain derivative instruments that do not qualify for hedge accounting and are not designated as hedges. Although these derivatives do not qualify for hedge accounting, we believe that such instruments are closely correlated with the underlying exposure, thus managing the associated risk. The gains or losses from changes in the fair value of such derivative instruments that are not accounted for as hedges are recognized in earnings in foreign currency loss, net in the consolidated statements of operations.
Property and Equipment
We record property and equipment at cost. We record property and equipment purchased in business combinations at fair value, which is then treated as the cost. Depreciation and amortization are computed using the straight-line method over the estimated useful lives of the related assets. Leasehold improvements are amortized on a straight-line basis over the shorter of the lease term or the useful lives of the assets. Useful lives by major asset class are as follows: computer equipment and software, 3 to 7 years; buildings and improvements, 5 to 39 years; and furniture and fixtures, 5 to 7 years. Repairs and maintenance costs are expensed as incurred.
Product Development and Internal Use Software
Expenditures for product development, other than internal use software costs, are expensed as incurred. Product development expenses primarily consist of personnel and related expenses for our product development staff, the cost of various third-party contractor fees, and allocated overhead expenses.
Software development costs associated with internal use software are incurred in three stages of development: the preliminary project stage, the application development stage, and the post-implementation stage. Costs incurred during the preliminary project and post-implementation stages are expensed as incurred. Certain internal and external qualifying costs incurred during the application development stage are capitalized as property and equipment. Internal use software is amortized on a straight-line basis over its estimated useful life of three years, beginning when the software is ready for its intended use.
During the fiscal years ended November 30, 2016, 2015, and 2014, there were $0, $1.3 million, and $4.1 million of internal use software development costs capitalized, respectively. Amortization expense related to internal use software totaled $1.0 million, $1.3 million, and $0.7 million during the fiscal years ended November 30, 2016, 2015, and 2014, respectively. During
54
the second and fourth quarters of fiscal year 2015, we incurred impairment charges of $1.5 million and $1.0 million, respectively, related to software development costs capitalized for assets no longer deployed.
Goodwill, Intangible Assets and Long-Lived Assets
Goodwill is the amount by which the cost of acquired net assets in a business combination exceeded the fair value of net identifiable assets on the date of purchase. We evaluate goodwill and other intangible assets with indefinite useful lives, if any, for impairment annually or on an interim basis when events and circumstances arise that indicate impairment may have occurred.
In performing our annual assessment, we may first perform a qualitative test and if necessary, perform a quantitative test. To conduct the quantitative impairment test of goodwill, we compare the fair value of a reporting unit to its carrying value. If the reporting unit’s carrying value exceeds its fair value, we record an impairment loss to the extent that the carrying value of goodwill exceeds its implied fair value. We estimate the fair values of our reporting units using discounted cash flow models or other valuation models, such as comparative transactions and market multiples. During fiscal year 2016, we recorded a $92.0 million goodwill impairment charge related to the Application Development and Deployment reporting unit (Note 6).
Intangible assets are comprised of purchased technology, customer-related assets, and trademarks and trade names acquired through business combinations (Note 7). All of our intangible assets are amortized using the straight-line method over their estimated useful life.
We periodically review long-lived assets (primarily property and equipment) and intangible assets with finite lives for impairment whenever events or changes in business circumstances indicate that the carrying amount of the assets may not be fully recoverable or that the useful lives of those assets are no longer appropriate. We base each impairment test on a comparison of the undiscounted cash flows to the carrying value of the asset or asset group. If impairment is indicated, we write down the asset to its estimated fair value based on a discounted cash flow analysis. During fiscal year 2016, we recorded a $5.1 million asset impairment charge, which was applicable to the intangible assets obtained in connection with our acquisition of Modulus during fiscal year 2014 (Note 6). In fiscal year 2015, we recorded impairment losses totaling $5.0 million, primarily as a result of the decision to replace existing technology with technology acquired from a business combination (Note 13). We recorded no impairment losses in fiscal year 2014.
Comprehensive Loss
The components of comprehensive loss include, in addition to net (loss) income, unrealized gains and losses on investments and foreign currency translation adjustments.
Accumulated other comprehensive loss by components, net of tax (in thousands):
Foreign Currency Translation Adjustment | Unrealized Gains (Losses) on investments | Total | |||||||||
Balance, December 1, 2014 | $ | (13,733 | ) | $ | 7 | $ | (13,726 | ) | |||
Other comprehensive (loss) before reclassifications | (10,849 | ) | (53 | ) | (10,902 | ) | |||||
Net other comprehensive loss | $ | (10,849 | ) | $ | (53 | ) | $ | (10,902 | ) | ||
Balance, December 1, 2015 | $ | (24,582 | ) | $ | (46 | ) | $ | (24,628 | ) | ||
Other comprehensive loss before reclassifications | (3,843 | ) | (90 | ) | (3,933 | ) | |||||
Net other comprehensive loss | $ | (3,843 | ) | $ | (90 | ) | $ | (3,933 | ) | ||
Balance, November 30, 2016 | $ | (28,425 | ) | $ | (136 | ) | $ | (28,561 | ) | ||
The tax effect on accumulated unrealized losses on investments was minimal as of November 30, 2016, November 30, 2015, and November 30, 2014.
55
Revenue Recognition
We derive our revenue primarily from software licenses and maintenance and services. Our license arrangements generally contain multiple elements, including software maintenance services, consulting services, and customer education services. We do not recognize revenue until the following four basic criteria are met: (i) persuasive evidence of an arrangement exists, (ii) our product has been shipped or, if delivered electronically, the customer has the right to access the software, (iii) the fee is fixed or determinable, and (iv) collection of the fee is probable.
Evidence of an arrangement generally consists of a contract or purchase order signed by the customer. In regard to delivery, we generally ship our software electronically and do not license our software with conditions of acceptance. If an arrangement does contain conditions of acceptance, we defer recognition of the revenue until the acceptance criteria are met or the period of acceptance has passed. Services are considered delivered as the work is performed or, in the case of maintenance, over the contractual service period. We assess whether a fee is fixed or determinable at the outset of the arrangement and consider the payment terms of the transaction, including transactions that extend beyond our customary payment terms. We do not license our software with a right of return. In assessing whether the collection of the fee is probable, we consider customer credit-worthiness, a customer’s historical payment experience, economic conditions in the customer’s industry and geographic location and general economic conditions. If we do not consider collection of a fee to be probable, we defer the revenue until the fees are collected, provided all other conditions for revenue recognition have been met.
In determining when to recognize revenue from a customer arrangement, we are often required to exercise judgment regarding the application of our accounting policies to a particular arrangement. The primary judgments used in evaluating revenue recognized in each period involve: determining whether collection is probable, assessing whether the fee is fixed or determinable, and determining the fair value of the maintenance and services elements included in multiple-element software arrangements. Such judgments can materially impact the amount of revenue that we record in a given period. While we follow specific and detailed rules and guidelines related to revenue recognition, we make and use significant management judgments and estimates in connection with the revenue recognized in any reporting period, particularly in the areas described above. If management made different estimates or judgments, material differences in the timing of the recognition of revenue could occur.
In regard to software license revenues, perpetual and term license fees are recognized as revenue when the software is delivered, no significant obligations or contingencies related to the software exist, other than maintenance, and all other revenue recognition criteria are met. We generally recognize revenue for products distributed through application partners and distributors on a sell-in basis.
Revenue from maintenance is recognized ratably over the service period. Maintenance revenue is deferred until the associated license is delivered to the customer and all other criteria for revenue recognition have been met. Revenue from other services, which are primarily consulting and customer education services, is generally recognized as the services are delivered to the customer, provided all other criteria for revenue recognition have been met.
We also offer products via a software-as-a-service (SaaS) model, which is a subscription based model. Subscription revenue derived from these agreements is generally recognized on a straight-line basis over the subscription term, provided persuasive evidence of an arrangement exists, access to our software has been granted to the customer, the fee for the subscription is fixed or determinable, and collection of the subscription fee is probable.
We generally sell our software licenses with maintenance services and, in some cases, also with consulting services. For these multiple element arrangements, we allocate revenue to the delivered elements of the arrangement using the residual method, whereby revenue is allocated to the undelivered elements based on vendor specific objective evidence (or VSOE) of fair value of the undelivered elements with the remaining arrangement fee allocated to the delivered elements and recognized as revenue assuming all other revenue recognition criteria are met. For the undelivered elements, we determine VSOE of fair value to be the price charged when the undelivered element is sold separately. We determine VSOE for maintenance sold in connection with a software license based on the amount that will be separately charged for the maintenance renewal period. Substantially all license arrangements indicate the renewal rate for which customers may, at their option, renew their maintenance agreement. We determine VSOE for consulting services by reference to the amount charged for similar engagements when a software license sale is not involved. We review services sold separately on a periodic basis and update, when appropriate, our VSOE of fair value for such maintenance and services to ensure that it reflects our recent pricing experience. If VSOE of fair value for the undelivered elements cannot be established, we defer all revenue from the arrangement until the earlier of the point at which such sufficient VSOE does exist or all elements of the arrangement have been delivered, or if the only undelivered element is maintenance, then we recognize the entire fee ratably over the maintenance period. If payment of the software license fees is dependent upon the performance of consulting services or the consulting services are essential to the
56
functionality of the licensed software, then we recognize both the software license and consulting fees using the completed contract method.
Sales taxes collected from customers and remitted to government authorities are excluded from revenue.
Deferred revenue generally results from contractual billings for which revenue has not been recognized and consists of the unearned portion of license, maintenance, and services fees. Deferred revenue expected to be recognized as revenue more than one year subsequent to the balance sheet date is included in long-term liabilities in the consolidated balance sheets.
Advertising Costs
Advertising costs are expensed as incurred and were $2.9 million, $2.5 million, and $1.8 million in fiscal years 2016, 2015, and 2014, respectively.
Warranty Costs
We make periodic provisions for expected warranty costs. Historically, warranty costs have been insignificant.
Stock-Based Compensation
Stock-based compensation expense reflects the fair value of stock-based awards, less the present value of expected dividends, measured at the grant date and recognized over the relevant service period. We estimate the fair value of each stock-based award on the measurement date using either the current market price of the stock, the Black-Scholes option valuation model, or the Monte Carlo Simulation valuation model. The Black-Scholes and Monte Carlo Simulation valuation models incorporate assumptions as to stock price volatility, the expected life of options or awards, a risk-free interest rate and dividend yield. We recognize stock-based compensation expense related to options and restricted stock units on a straight-line basis over the service period of the award, which is generally 4 or 5 years for options and 3 years for restricted stock units. We recognize stock-based compensation expense related to performance stock units and our employee stock purchase plan using an accelerated attribution method.
Acquisition-Related Costs
Acquisition-related costs are expensed as incurred and include those costs incurred as a result of a business combination. These costs consist of professional service fees, including third-party legal and valuation-related fees, as well as retention fees and earn-out payments treated as compensation expense. We incurred $1.2 million of acquisition-related costs, which are included in acquisition-related expenses in our consolidated statement of operations for the fiscal year ended November 30, 2016.
Restructuring Charges
Our restructuring charges are comprised primarily of costs related to property abandonment, including future lease commitments, net of any sublease income, and associated leasehold improvements; and employee termination costs related to headcount reductions. We recognize and measure restructuring liabilities initially at fair value when the liability is incurred. We incurred $1.7 million of restructuring related costs, which are included in restructuring expenses in our consolidated statement of operations for the fiscal year ended November 30, 2016.
Income Taxes
We provide for deferred income taxes resulting from temporary differences between financial and taxable income. We record valuation allowances to reduce deferred tax assets to the amount that is more likely than not to be realized.
We recognize and measure uncertain tax positions taken or expected to be taken in a tax return utilizing a two-step approach. We first determine if the weight of available evidence indicates that it is more likely than not that the tax position will be sustained on audit, including resolution of any related appeals or litigation processes. The second step is that we measure the tax benefit as the largest amount that is more likely than not to be realized upon ultimate settlement. We recognize interest and penalties related to uncertain tax positions in our provision for income taxes on our consolidated statements of operations.
57
Recent Accounting Pronouncements
In August 2016, the Financial Accounting Standards Board (FASB) issued Accounting Standards Update No. 2016-15, Classification of Certain Cash Receipts and Cash Payments (ASU 2016-15). ASU 2016-15 is intended to add or clarify guidance on the classification of certain cash receipts and payments in the statement of cash flows and to eliminate the diversity in practice related to such classifications. The guidance in ASU 2016-15 is required for annual reporting periods beginning after December 15, 2017, with early adoption permitted. We are currently evaluating the effect that implementation of this update will have upon adoption on our consolidated statement of cash flows.
In March 2016, the FASB issued Accounting Standards Update No. 2016-09, Improvements to Employee Share-Based Payment Accounting (ASU 2016-09). ASU 2016-09 is intended to simplify various aspects of the accounting for employee share-based payment transactions, including accounting for income taxes, forfeitures, and statutory tax withholding requirements, as well as classification in the statement of cash flows. The guidance in ASU 2016-09 is required for annual reporting periods beginning after December 15, 2016, with early adoption permitted. We are currently evaluating the effect that implementation of this update will have upon adoption on our consolidated financial position and results of operations.
In February 2016, the FASB issued Accounting Standards Update No. 2016-02, Leases (ASU 2016-02), which requires lessees to record most leases on their balance sheets, recognizing a lease liability for the obligation to make lease payments and a right-to-use asset for the right to use the underlying asset for the lease term. The guidance in ASU 2016-02 is required for annual reporting periods beginning after December 15, 2018, with early adoption permitted. We currently expect that most of our operating lease commitments will be subject to the update and recognized as operating lease liabilities and right-of-use assets upon adoption. However, we are currently evaluating the effect that implementation of this update will have upon adoption on our consolidated financial position and results of operations.
In April 2015, the FASB issued Accounting Standards Update No. 2015-03, Interest - Imputation of Interest (Subtopic 835-30) Simplifying the Presentation of Debt Issuance Costs (ASU 2015-03). ASU 2015-03 requires debt issuance costs to be presented in the balance sheet as a direct deduction from the carrying value of the associated debt liability, consistent with the presentation of a debt discount. The guidance in ASU 2015-03 is required for annual reporting periods beginning after December 15, 2015, including interim periods within the reporting period. We estimate that the impact upon adoption on our consolidated balance sheets will be a reclassification of up to $1.1 million from other assets to long-term debt as of December 1, 2016.
In May 2014, the FASB issued Accounting Standards Update No. 2014-09, Revenue from Contracts with Customers (Topic 606) (ASU 2014-09). ASU 2014-09 outlines a single comprehensive model for entities to use in accounting for revenue arising from contracts with customers and supersedes most current revenue recognition guidance, including industry-specific guidance. This new guidance is effective for annual reporting periods (including interim reporting periods within those periods) beginning after December 15, 2016. Early adoption is not permitted. Entities have the option of using either a full retrospective or a modified approach to adopt the guidance. In July 2015, the FASB voted to defer the effective date of this ASU by one year for reporting periods beginning after December 15, 2017, with early adoption permitted as of the original effective date. As a result, the new effective date for the Company will be December 1, 2018. This update could impact the timing and amounts of revenue recognized. Management is currently assessing the impact the adoption of this ASU will have on the Company’s consolidated financial statements.
Note 2: Cash, Cash Equivalents and Investments
A summary of our cash, cash equivalents and available-for-sale investments at November 30, 2016 is as follows (in thousands):
Amortized Cost Basis | Unrealized Gains | Unrealized Losses | Fair Value | ||||||||||||
Cash | $ | 196,863 | $ | — | $ | — | $ | 196,863 | |||||||
Money market funds | 10,173 | — | — | 10,173 | |||||||||||
State and municipal bond obligations | 32,831 | — | (107 | ) | 32,724 | ||||||||||
U.S. treasury bonds | 6,542 | — | (29 | ) | 6,513 | ||||||||||
Corporate bonds | 3,485 | — | (4 | ) | 3,481 | ||||||||||
Total | $ | 249,894 | $ | — | $ | (140 | ) | $ | 249,754 | ||||||
58
A summary of our cash, cash equivalents and available-for-sale investments at November 30, 2015 is as follows (in thousands):
Amortized Cost Basis | Unrealized Gains | Unrealized Losses | Fair Value | ||||||||||||
Cash | $ | 186,241 | $ | — | $ | — | $ | 186,241 | |||||||
Money market funds | 26,138 | — | — | 26,138 | |||||||||||
State and municipal bond obligations | 20,387 | 30 | — | 20,417 | |||||||||||
U.S. treasury bonds | 3,109 | — | (15 | ) | 3,094 | ||||||||||
U.S. government agency bonds | 1,645 | — | (4 | ) | 1,641 | ||||||||||
Corporate bonds | 3,756 | — | (8 | ) | 3,748 | ||||||||||
Total | $ | 241,276 | $ | 30 | $ | (27 | ) | $ | 241,279 | ||||||
Such amounts are classified on our consolidated balance sheets as follows (in thousands):
November 30, 2016 | November 30, 2015 | ||||||||||||||
Cash and Equivalents | Short-Term Investments | Cash and Equivalents | Short-Term Investments | ||||||||||||
Cash | $ | 196,863 | $ | — | $ | 186,241 | $ | — | |||||||
Money market funds | 10,173 | — | 26,138 | — | |||||||||||
State and municipal bond obligations | — | 32,724 | — | 20,417 | |||||||||||
U.S. treasury bonds | — | 6,513 | — | 3,094 | |||||||||||
U.S. government agency bonds | — | — | — | 1,641 | |||||||||||
Corporate bonds | — | 3,481 | — | 3,748 | |||||||||||
Total | $ | 207,036 | $ | 42,718 | $ | 212,379 | $ | 28,900 | |||||||
The fair value of debt securities by contractual maturity is as follows (in thousands):
November 30, 2016 | November 30, 2015 | ||||||
Due in one year or less | $ | 21,172 | $ | 15,945 | |||
Due after one year (1) | 21,546 | 12,955 | |||||
Total | $ | 42,718 | $ | 28,900 | |||
(1) | Includes state and municipal bond obligations, U.S. treasury and government agency bonds, and corporate bonds, which are securities representing investments available for current operations and are classified as current in the consolidated balance sheets. |
We did not hold any investments with continuous unrealized losses as of November 30, 2016 and November 30, 2015.
Note 3: Derivative Instruments
We generally use forward contracts that are not designated as hedging instruments to hedge economically the impact of the variability in exchange rates on intercompany accounts receivable and loans receivable denominated in certain foreign currencies. We generally do not hedge the net assets of our international subsidiaries. All forward contracts are recorded at fair value on the consolidated balance sheets at the end of each reporting period and expire from 30 days to 366 days. At November 30, 2016, $6.6 million was recorded in other noncurrent liabilities. At November 30, 2015, $4.0 million was recorded in other accrued liabilities. In fiscal years 2016, 2015 and 2014, realized and unrealized losses of $4.0 million, $4.6 million, and $1.5 million, respectively, from our forward contracts were recognized in foreign currency loss, net in the consolidated statements of operations. These losses were substantially offset by realized and unrealized losses and gains on the offsetting positions.
59
The table below details outstanding foreign currency forward contracts where the notional amount is determined using contract exchange rates (in thousands):
November 30, 2016 | November 30, 2015 | ||||||||||||||
Notional Value | Fair Value | Notional Value | Fair Value | ||||||||||||
Forward contracts to sell U.S. dollars | $ | 74,690 | $ | (6,597 | ) | $ | 76,748 | $ | (4,026 | ) | |||||
Forward contracts to purchase U.S. dollars | 1,673 | (19 | ) | 2,077 | 5 | ||||||||||
Total | $ | 76,363 | $ | (6,616 | ) | $ | 78,825 | $ | (4,021 | ) | |||||
Note 4: Fair Value Measurements
Recurring Fair Value Measurements
The following table details the fair value measurements within the fair value hierarchy of our financial assets at November 30, 2016 (in thousands):
Fair Value Measurements Using | |||||||||||||||
Total Fair Value | Level 1 | Level 2 | Level 3 | ||||||||||||
Assets | |||||||||||||||
Money market funds | $ | 10,173 | $ | 10,173 | $ | — | $ | — | |||||||
State and municipal bond obligations | 32,724 | — | 32,724 | — | |||||||||||
U.S. treasury bonds | 6,513 | — | 6,513 | — | |||||||||||
Corporate bonds | 3,481 | — | 3,481 | — | |||||||||||
Liabilities | |||||||||||||||
Foreign exchange derivatives | $ | (6,616 | ) | $ | — | $ | (6,616 | ) | $ | — | |||||
The following table details the fair value measurements within the fair value hierarchy of our financial assets at November 30, 2015 (in thousands):
Fair Value Measurements Using | |||||||||||||||
Total Fair Value | Level 1 | Level 2 | Level 3 | ||||||||||||
Assets | |||||||||||||||
Money market funds | $ | 26,138 | $ | 26,138 | $ | — | $ | — | |||||||
State and municipal bond obligations | 20,417 | — | 20,417 | — | |||||||||||
U.S. treasury bonds | 3,094 | — | 3,094 | — | |||||||||||
U.S. government agency bonds | 1,641 | — | 1,641 | — | |||||||||||
Corporate bonds | 3,748 | — | 3,748 | — | |||||||||||
Liabilities | |||||||||||||||
Foreign exchange derivatives | $ | (4,021 | ) | $ | — | $ | (4,021 | ) | $ | — | |||||
When developing fair value estimates, we maximize the use of observable inputs and minimize the use of unobservable inputs. When available, we use quoted market prices to measure fair value. The valuation technique used to measure fair value for our Level 1 and Level 2 assets is a market approach, using prices and other relevant information generated by market transactions involving identical or comparable assets. If market prices are not available, the fair value measurement is based on models that use primarily market based parameters including yield curves, volatilities, credit ratings and currency rates. In certain cases where market rate assumptions are not available, we are required to make judgments about assumptions market participants would use to estimate the fair value of a financial instrument.
60
The following table reflects the activity for our liabilities measured at fair value using Level 3 inputs, which relate to a contingent consideration obligation in connection with a prior acquisition, for each period presented (in thousands):
November 30, 2016 | November 30, 2015 | ||||||
Balance, beginning of year | $ | — | $ | 1,717 | |||
Acquisition date fair value of contingent consideration | — | — | |||||
Payments of contingent consideration | — | (209 | ) | ||||
Changes in fair value of contingent consideration obligation | — | (1,508 | ) | ||||
Balance, end of year | $ | — | $ | — | |||
We recorded a credit of approximately $1.5 million during the year ended November 30, 2015 due to the change in fair value of a contingent consideration obligation in connection with the acquisition of Modulus, which is included in acquisition-related expenses in our consolidated statement of operations. During the fiscal year ended November 30, 2015, the contingent consideration obligation for the acquisition of Modulus was reduced to $0 as the year one milestone was not achieved as of May 31, 2015 and the key assumption used in our valuation model was a probability of 0% that the year two milestone associated with the contingent consideration would be achieved. As of May 31, 2016, the year two milestone was not achieved.
In regard to the contingent consideration related to the acquisition of Rollbase, the contingency was relieved as of May 31, 2015 as the milestones associated with the contingent consideration were achieved as of this date. As such, the amount of the payment related to the contingent consideration was known as of May 31, 2015 and was based on actual results. We transferred the contingent earn out liability to a Level 2 fair value measurement as the value as of May 31, 2015 was based on observable inputs. The payment was made in June 2015 in the amount of $0.2 million; as such, there is no longer a liability related to the Rollbase contingent consideration.
Nonrecurring Fair Value Measurements
During fiscal years 2016 and 2015, certain assets have been measured at fair value on a nonrecurring basis using significant unobservable inputs (Level 3).
During the fourth quarter of fiscal year 2016, based on the fair value measurement, we recorded a $92.0 million goodwill impairment charge related to the Application Development and Deployment reporting unit. Refer to Note 6 for further discussion on the fair value of the goodwill related to the Application Development and Deployment reporting unit. During the third quarter of fiscal year 2016, based on the fair value measurement, we recorded a $5.1 million asset impairment charge, which was applicable to the intangible assets obtained in connection with our acquisition of Modulus during the second quarter of fiscal year 2014 (Note 6).
During the second quarter of fiscal year 2015, based on the fair value measurement, we recorded a $4.0 million asset impairment charge related to our cloud-based mobile application development technology as a result of our decision to replace our existing cloud-based mobile application development technology with technology acquired in connection with the acquisition of Telerik AD (Note 13). During the fourth quarter of fiscal year 2015, based on the fair value measurement, we recorded a $1.0 million asset impairment charge related to the abandonment of certain assets (Note 13).
The following table presents nonrecurring fair value measurements as of November 30, 2016 (in thousands):
Total Fair Value | Total Losses | ||||||
Goodwill allocated to the Application Development and Deployment reporting unit | $ | 46,965 | $ | 92,000 | |||
Intangible assets | — | 5,051 | |||||
The following table presents nonrecurring fair value measurements as of November 30, 2015 (in thousands):
Total Fair Value | Total Losses | ||||||
Long-lived assets | $ | 60 | $ | 4,962 | |||
61
The fair value measurements of intangible assets and long-lived assets were determined using an income-based valuation methodology, which incorporates unobservable inputs, including discounted expected cash flows over the remaining estimated useful life of the technology, thereby classifying the fair value as a Level 3 measurement within the fair value hierarchy. The expected cash flows include subscription fees to be collected from existing customers using the platform, offset by hosting fees and compensation related costs to be incurred over the remaining estimated useful lives.
We did not have any nonrecurring fair value measurements as of November 30, 2014.
Note 5: Property and Equipment
Property and equipment consists of the following (in thousands):
November 30, 2016 | November 30, 2015 | ||||||
Computer equipment and software | $ | 47,978 | $ | 46,183 | |||
Land, buildings and leasehold improvements | 53,291 | 53,590 | |||||
Furniture and fixtures | 7,080 | 6,889 | |||||
Capitalized software development costs | 2,955 | 2,955 | |||||
Property and equipment, gross | 111,304 | 109,617 | |||||
Less accumulated depreciation and amortization | (61,199 | ) | (55,391 | ) | |||
Property and equipment, net | $ | 50,105 | $ | 54,226 | |||
Depreciation and amortization expense related to property and equipment was $8.5 million, $9.4 million, and $9.8 million for the years ended November 30, 2016, 2015, and 2014, respectively.
Note 6: Intangible Assets and Goodwill
Intangible Assets
Intangible assets are comprised of the following significant classes (in thousands):
November 30, 2016 | November 30, 2015 | ||||||||||||||||||||||
Gross Carrying Amount | Accumulated Amortization | Net Book Value | Gross Carrying Amount | Accumulated Amortization | Net Book Value | ||||||||||||||||||
Purchased technology | $ | 109,886 | $ | (68,116 | ) | $ | 41,770 | $ | 117,151 | $ | (54,963 | ) | $ | 62,188 | |||||||||
Customer-related | 67,602 | (35,852 | ) | 31,750 | 67,602 | (25,493 | ) | 42,109 | |||||||||||||||
Trademarks and trade names | 15,140 | (7,833 | ) | 7,307 | 15,330 | (5,514 | ) | 9,816 | |||||||||||||||
Total | $ | 192,628 | $ | (111,801 | ) | $ | 80,827 | $ | 200,083 | $ | (85,970 | ) | $ | 114,113 | |||||||||
We amortize intangible assets assuming no expected residual value. Amortization expense related to these intangible assets was $28.2 million, $29.6 million and $3.7 million in fiscal years 2016, 2015 and 2014, respectively.
During the third quarter of fiscal year 2016, we evaluated the ongoing value of the intangible assets associated with the technology obtained in connection with the acquisition of Modulus. As a result of our decision to abandon the related assets due to a change in our expected ability to use the technology internally, we determined that the intangible assets were fully impaired. As a result, we incurred an impairment charge of $5.1 million in the third quarter of fiscal year 2016.
62
Future amortization expense for intangible assets as of November 30, 2016 is as follows (in thousands):
2017 | 27,426 | ||
2018 | 26,613 | ||
2019 | 25,489 | ||
2020 | 714 | ||
2021 | 585 | ||
Total | $ | 80,827 | |
Goodwill
Changes in the carrying amount of goodwill for fiscal years 2016 and 2015 are as follows (in thousands):
November 30, 2016 | November 30, 2015 | ||||||
Balance, beginning of year | $ | 369,985 | $ | 232,836 | |||
Additions | — | 137,472 | |||||
Impairment | (92,000 | ) | — | ||||
Translation adjustments | 82 | (323 | ) | ||||
Balance, end of year | $ | 278,067 | $ | 369,985 | |||
The changes in the Company's goodwill balances by reportable segment since the prior year are as follows (in thousands):
November 30, 2015 | Impairment | Translation Adjustments | November 30, 2016 | ||||||||||||
OpenEdge | $ | 211,980 | $ | — | $ | 82 | $ | 212,062 | |||||||
Data Connectivity and Integration | 19,040 | — | — | 19,040 | |||||||||||
Application Development and Deployment | 138,965 | (92,000 | ) | — | 46,965 | ||||||||||
Total goodwill | $ | 369,985 | $ | (92,000 | ) | $ | 82 | $ | 278,067 | ||||||
Impairment of Goodwill
We assess the impairment of goodwill on an annual basis and whenever events or changes in circumstances indicate that the carrying value of the asset may not be recoverable. As of October 31, 2016, we tested goodwill for impairment for each of our reporting units under the two-step quantitative goodwill impairment test.
The first step is a comparison of each reporting unit's fair value to its carrying value. If the reporting unit's fair value exceeds its carrying value, no further procedures are required. However, if a reporting unit's fair value is less than its carrying value, an impairment of goodwill may exist, requiring a second step to measure the amount of impairment loss. In the second step, the reporting unit's fair value is allocated to all of the assets and liabilities of the reporting unit, including any unrecognized intangible assets, in an analysis to calculate the implied fair value of goodwill in the same manner as if the reporting unit was being acquired in a business acquisition. If the implied fair value of goodwill is less than the recorded goodwill, an impairment charge is recorded for the difference. Our reporting units are the same as the reportable operating segments identified in Note 16.
Under the first step, the fair value of our OpenEdge, Data Connectivity and Integration, and Application Development and Deployment reporting units was determined based on a combination of the income approach, which estimates the fair value based on the future discounted cash flows, and the market approach, which estimates the fair value based on comparable market prices. The income approach uses cash flow projections that are based on management's estimates of economic and market conditions which drive key assumptions of revenue growth rates, operating margins, capital expenditures and working capital requirements. The unobservable inputs used in the calculation include the discount rate, which is based on the specific risk characteristics of each reporting unit, the weighted average cost of capital and its underlying forecast. We used both the guideline public company method and the guideline transaction method under the market approach. The guideline public company method of the market approach estimates fair value by applying performance metric multiples to the reporting unit's prior and expected operating performance. The multiples are derived from comparable publicly traded companies with similar
63
operating and investment characteristics as the reporting unit. The guideline transaction method of the market approach estimates fair value by using pricing metrics of mergers and acquisitions involving controlling interests of companies in the same or similar lines of business. If the fair value of the reporting unit derived using the income approach is significantly different from the fair value estimate using the market approach, we reevaluate its assumptions used in the two models. The fair values determined by the market approach and income approach, as described above, are weighted to determine the fair value for each reporting unit. The weighted values assigned to each reporting unit are primarily driven by two factors: 1) the number of comparable publicly traded companies used in the market approach, and 2) the similarity of the operating and investment characteristics of the reporting units to the comparable publicly traded companies used in the market approach.
In order to assess the reasonableness of the calculated reporting unit fair values, we also compare the sum of the reporting unit's fair values to our market capitalization (per share stock price times number of shares outstanding) and calculate an implied control premium (the excess of the sum of the reporting units' fair values over the market capitalization). We evaluate the reasonableness of the control premium by comparing it to control premiums of recent comparable transactions. If the implied control premium is not reasonable in light of these recent transactions, we will reevaluate its fair value estimates of the reporting units by adjusting the discount rates and/or other assumptions.
In performing the impairment analysis as of the fourth quarter of fiscal year 2016, we applied a weighting to the discounted cash flow method under the income approach (50%) and the guideline public company method (40%) and guideline transaction method (10%) under the market approach to estimate the fair value of our OpenEdge, Data Connectivity and Integration, and Application Development and Deployment reporting units. The discount rate used in the analysis was 9.8%, 12.0%, and 13.8% for the OpenEdge, Data Connectivity and Integration, and Application Development and Deployment reporting units, respectively.
Beginning in late October 2016, with the appointment of Yogesh Gupta as our new Chief Executive Officer, our Board of Directors and executive management team undertook a comprehensive review of our strategy and operations, including our expectations for fiscal year 2017 results. Based on this review, we reduced our future growth expectations with respect to the product lines within our Application Development and Deployment reporting unit.
Based on the first step of the goodwill impairment test, we concluded that our OpenEdge and Data Connectivity and Integration reporting units had fair values which significantly exceeded their carrying values as of the annual impairment date. With the reduced future growth expectations described above, our Application Development and Deployment reporting unit did not pass the first step of the impairment test. As such, we allocated the fair value of the Application Development and Deployment reporting unit to all of its assets and liabilities. Based on our analysis, the implied fair value of goodwill was substantially lower than the carrying value of goodwill for the reporting unit. As a result, we recorded a $92.0 million goodwill impairment charge related to the Application Development and Deployment reporting unit. As of November 30, 2016, the Application Development and Deployment reporting unit had $47.0 million of goodwill remaining.
The evaluation of goodwill for impairment requires significant judgment. While we believe that the assumptions used in our impairment test are reasonable, the analysis is sensitive to adverse changes used in the assumptions of the valuations. In particular, changes in the projected cash flows, the discount rate, the terminal year growth rate and market multiple assumptions could produce significantly different results for the impairment analyses. In the event of future changes in business conditions, we will be required to reassess and update our forecasts and estimates used in future impairment analyses. If the results of these analyses are lower than current estimates, a material impairment charge may result at that time.
We recorded no goodwill impairment losses in fiscal years 2015 or 2014.
64
Note 7: Business Combinations
Telerik Acquisition
On December 2, 2014, we completed the acquisition of all of the outstanding securities of Telerik AD (Telerik), a leading provider of application development tools based in Sofia, Bulgaria, for total consideration of $262.5 million. Approximately $10.5 million of the total consideration was paid to Telerik’s founders and certain other key employees in restricted stock units, subject to a vesting schedule and continued employment. Under the Securities Purchase Agreement, 10% of the total consideration was deposited into an escrow account to secure certain indemnification and other obligations of the sellers to Progress. In accordance with the agreement, the full amount of the escrow was released to the former equity holders in June 2016.
We funded the acquisition through a combination of existing cash resources and a $150 million term loan (Note 8).
The total consideration, less the fair value of the granted restricted stock units discussed above, which were considered compensation arrangements, was allocated to Telerik’s tangible assets, identifiable intangible assets and assumed liabilities based on their estimated fair values. The excess of the total consideration, less the fair value of the restricted stock units, over the tangible assets, identifiable intangible assets and assumed liabilities was recorded as goodwill. The allocation of the purchase price was completed in the fourth quarter of fiscal year 2015 upon the finalization of our valuation of identifiable intangible assets.
The following table discloses the net assets acquired in the business combination (in thousands):
Total | Weighted Average Life | ||||
Net working capital | $ | 8,222 | |||
Property, plant and equipment | 3,078 | ||||
Identifiable intangible assets | 123,100 | 5 years | |||
Deferred taxes | (9,272 | ) | |||
Deferred revenue | (7,915 | ) | |||
Other non-current liabilities | (2,732 | ) | |||
Goodwill | 137,472 | ||||
Net assets acquired | $ | 251,953 | |||
The fair value of the intangible assets was estimated using the income approach in which the after-tax cash flows are discounted to present value. The cash flows are based on estimates prepared by management, and the discount rates applied were benchmarked with reference to the implied rate of return from the transaction model as well as the weighted average cost of capital. Based on the valuation, the acquired intangible assets are comprised of purchased technology of approximately $64.8 million, customer-related of approximately $47.1 million, and trademarks and trade names of approximately $11.2 million.
We recorded the excess of the purchase price over the identified tangible and intangible assets as goodwill. Upon completion of the acquisition, we believed that the investment value of the future enhancement of our product and solution offerings created as a result of this acquisition had principally contributed to a purchase price that resulted in the recognition of $137.5 million of goodwill, which is not deductible for tax purposes.
Acquisition-related transaction costs (e.g., legal, due diligence, valuation, and other professional fees) and certain acquisition restructuring and related charges are not included as a component of consideration transferred, but are required to be expensed as incurred. During the fiscal years ended November 30, 2016 and 2015, we incurred approximately $1.1 million and $3.7 million of acquisition-related costs, respectively, which are included in acquisition-related expenses in our consolidated statement of operations.
In connection with the acquisition of Telerik, we agreed to provide retention bonuses to certain Telerik employees as an incentive for those employees to remain with Telerik for at least 1 year following the acquisition. We concluded that the retention bonuses for these individuals, which totaled approximately $2.2 million, are compensation arrangements and recognized these costs over the one-year service period. During the fiscal year ended November 30, 2015, we incurred $2.2
65
million of expense related to the retention bonuses, which are included in the acquisition-related expenses in our consolidated statement of operations discussed above. There were no additional expenses related to the retention bonuses incurred during the fiscal year ended November 30, 2016 and the entire amount accrued during fiscal year 2015 was paid in December 2015.
The operations of Telerik and the related goodwill are included in our operating results as part of the Application Development and Deployment segment from the date of acquisition. The amount of revenue of Telerik included in our consolidated statement of operations during the fiscal years ended November 30, 2016 and 2015 was $75.3 million and $41.8 million, respectively. The revenue of Telerik products and maintenance is primarily recognized ratably over the maintenance period, which is generally one year, as VSOE of fair value cannot be established for such maintenance. The amount of pretax losses of Telerik included in our consolidated statement of operations during the fiscal years ended November 30, 2016 and 2015 were $32.2 million and $54.1 million, respectively. The pretax losses include the amortization expense for fiscal years 2016 and 2015 of approximately $24.6 million related to the acquired intangible assets discussed above.
Pro Forma Information (Unaudited)
The following pro forma financial information presents the combined results of operations of Progress and Telerik as if the acquisition had occurred on December 1, 2013 after giving effect to certain pro forma adjustments. The pro forma adjustments reflected herein include only those adjustments that are directly attributable to the Telerik acquisition and factually supportable. These pro forma adjustments include (i) a decrease in revenue from Telerik due to the beginning balance of deferred revenue being adjusted to reflect the fair value of the acquired balance, (ii) a net increase in amortization expense to eliminate historical amortization of Telerik intangible assets and to record amortization expense for the $123.1 million of acquired identifiable intangible assets, (iii) stock-based compensation expense relating to the consideration paid to Telerik’s founders and certain other key employees in restricted stock units, as discussed above, (iv) a net increase in interest expense to eliminate historical interest expense of Telerik as a result of the repayment of all Telerik outstanding debt in connection with the acquisition and to record interest expense for the period presented as a result of the new credit facility entered into by Progress in connection with the acquisition, (v) acquisition-related costs, including transaction costs incurred by Progress related to the accrual of retention bonuses discussed above, and (vi) the income tax effect of the adjustments made at either the statutory tax rate of Bulgaria (10%) or the statutory tax rate of the U.S. (approximately 37%) depending on which jurisdiction the adjustment impacts.
The pro forma financial information does not reflect any adjustments for anticipated synergies resulting from the acquisition and is not necessarily indicative of the operating results that would have actually occurred had the transaction been consummated on December 1, 2013.
(In thousands, except per share data) | Pro Forma Fiscal Year Ended November 30, 2014 | ||
Revenue | $ | 367,811 | |
Net loss | $ | (30,007 | ) |
Net loss per basic and diluted share | $ | (0.59 | ) |
BravePoint Acquisition
On October 1, 2014, we acquired 100% of the capital stock of BravePoint, Inc. (BravePoint) from Chesapeake Utilities Corporation in exchange for $12.0 million in cash. BravePoint is based in Norcross, Georgia and is a leading provider of consulting, training and application development services designed to increase customers' profitability and competitiveness through the use of technology. This acquisition significantly extended our services capabilities and enhanced our ability to quickly enable our partners and customers to take greater advantage of new technologies. The acquisition was accounted for as a business combination, and accordingly, the results of operations of BravePoint are included in our operating results as part of the OpenEdge segment from the date of acquisition. We paid the purchase price in cash from available funds.
66
The allocation of the purchase price is as follows (in thousands):
Total | Life | ||||
Net working capital | $ | 2,902 | |||
Property and equipment | 735 | ||||
Other assets | 16 | ||||
Deferred revenue | (680 | ) | |||
Customer-related | 4,110 | 7 Years | |||
Trade name | 850 | 7 Years | |||
Purchased technology | 1,810 | 3 Years | |||
Goodwill | 2,257 | ||||
Net assets acquired | $ | 12,000 | |||
We recorded the excess of the purchase price over the identified tangible and intangible assets as goodwill. We believe that the investment value of the future enhancement of our product and solution offerings created as a result of this acquisition has principally contributed to a purchase price that resulted in the recognition of $2.3 million of goodwill. The goodwill is deductible for tax purposes. The allocation of the purchase price was completed in the fourth quarter of fiscal year 2014 upon the finalization of our valuation of identifiable intangible assets.
We incurred approximately $0.2 million and $1.2 million of acquisition-related costs during fiscal years 2016 and 2015, respectively, which are included in acquisition-related expenses in our consolidated statement of operations. We have not disclosed the amount of revenues and earnings of BravePoint since acquisition, nor pro forma financial information, as those amounts are not significant to our consolidated financial statements.
Modulus Acquisition
On May 13, 2014, we acquired 100% of the membership interests in Modulus LLC (Modulus), a privately held platform-as-a-service (PaaS) provider based in Cincinnati, Ohio, for $15.0 million. The purchase consideration consisted of $12.5 million in cash paid and $2.5 million of contingent consideration, payable over a two-year period, if earned. The fair value of the contingent consideration was estimated to be $1.5 million at the date of acquisition; as such, the fair value of the purchase consideration allocated to the assets acquired totaled $14.0 million.
The acquisition was accounted for as a business combination, and accordingly, the results of operations of Modulus are included in our operating results as part of our Application Development and Deployment segment from the date of acquisition. We paid the purchase price in cash from available funds.
The allocation of the purchase price is as follows (in thousands):
Total | Life | ||||
Net working capital | $ | 7 | |||
Purchased technology | 7,320 | 7 Years | |||
Customer-related | 190 | 7 Years | |||
Goodwill | 6,433 | ||||
Net assets acquired | $ | 13,950 | |||
The purchase consideration included contingent earn-out provisions payable by the Company based on the achievement of certain milestones. We determined the fair value of the contingent consideration obligations by calculating the probability-weighted earn-out payments based on the assessment of the likelihood that the milestones will be achieved. The probability-weighted earn-out payments were then discounted using a discount rate based on an internal rate of return analysis using the probability-weighted cash flows. The key assumptions as of the acquisition date related to the contingent consideration are probabilities in excess of 75% that the milestones associated with the contingent consideration will be achieved and a discount rate of 33.0%. The year one milestone was not achieved as of May 31, 2015, which was the end of the first milestone period, and the year two milestone was not achieved by the end of the second milestone period on May 31, 2016 (Note 4).
67
We recorded the excess of the purchase price over the identified tangible and intangible assets as goodwill. Upon completion of the acquisition, we believed that the investment value of the future enhancement of our product and solution offerings created as a result of this acquisition had principally contributed to a purchase price that resulted in the recognition of $6.4 million of goodwill. The goodwill is deductible for tax purposes. The allocation of the purchase price was completed in the third quarter of fiscal year 2014 upon the finalization of our valuation of identifiable intangible assets.
We recorded gains of approximately $1.5 million during fiscal year 2015 due to the change in fair value of the contingent consideration obligation, which is included in acquisition-related expenses in our consolidated statement of operations. We incurred approximately $0.3 million of acquisition-related costs during fiscal year 2014, which are included in acquisition-related expenses in our consolidated statement of operations. We have not disclosed the amount of revenues and earnings of Modulus since acquisition, nor pro forma financial information, as those amounts are not significant to our condensed consolidated financial statements.
During the third quarter of fiscal year 2016, we evaluated the ongoing value of the intangible assets associated with the technology obtained in connection with the acquisition of Modulus. As a result of our decision to abandon the related assets due to a change in our expected ability to use the technology internally, we determined that the intangible assets were fully impaired. As a result, we incurred an impairment charge of $5.1 million in the third quarter of fiscal year 2016.
Note 8: Term Loan and Line of Credit
Our credit agreement provides for a $150 million secured term loan and a $150 million secured revolving credit facility, which may be made available in U.S. Dollars and certain other currencies. The revolving credit facility may be increased by up to an additional $75 million if the existing or additional lenders are willing to make such increased commitments. We borrowed the $150 million term loan included in our credit agreement to partially fund our acquisition of Telerik, as described in Note 7. The revolving credit facility has sublimits for swing line loans up to $25.0 million and for the issuance of standby letters of credit in a face amount up to $25.0 million. We expect to use the revolving credit facility for general corporate purposes, including acquisitions of other businesses, and may also use it for working capital.
The credit facility matures on December 2, 2019, when all amounts outstanding will be due and payable in full. The revolving credit facility does not require amortization of principal. The outstanding balance of the $150 million term loan as of November 30, 2016 was $135.0 million, with $15.0 million due in the next 12 months. The term loan requires repayment of principal at the end of each fiscal quarter, beginning with the fiscal quarter ended February 28, 2015. The first eight payments were in the principal amount of $1.9 million each, the following eight payments are in the principal amount of $3.8 million each, the following three payments are in the principal amount of $5.6 million each, and the last payment is of the remaining principal amount. The term loan may be prepaid before maturity in whole or in part at our option without penalty or premium. As of November 30, 2016, the carrying value of the term loan approximates the fair value, based on Level 2 inputs (observable market prices in less than active markets), as the interest rate is variable over the selected interest period and is similar to current rates at which we can borrow funds. The average interest rate of the credit facility during the fiscal year ended November 30, 2016 was 2.22% and the interest rate as of November 30, 2016 was 2.31%.
Costs incurred to obtain our long-term debt of $1.8 million are recorded as debt issuance costs within other assets in our consolidated balance sheet as of November 30, 2016 and are being amortized over the term of the debt agreement using the effective interest rate method. Amortization expense related to debt issuance costs of $0.4 million, $0.4 million, and $0.1 million for the fiscal years ended November 30, 2016, 2015, and 2014, respectively, is recorded within interest expense in our consolidated statements of operations.
Revolving loans may be borrowed, repaid and reborrowed until December 2, 2019, at which time all amounts outstanding must be repaid. As of November 30, 2016, there were no amounts outstanding under the revolving line and $0.5 million of letters of credit.
68
As of November 30, 2016, aggregate principal payments of long-term debt for the next five years and thereafter are (in thousands):
2017 | $ | 15,000 | |
2018 | 15,000 | ||
2019 | 16,875 | ||
2020 | 88,125 | ||
Total | $ | 135,000 | |
Note 9: Commitments and Contingencies
Leasing Arrangements
We lease certain facilities and equipment under non-cancelable operating lease arrangements. Future minimum rental payments under these leases are as follows at November 30, 2016 (in thousands):
2017 | $ | 5,475 | |
2018 | 4,147 | ||
2019 | 3,188 | ||
2020 | 2,853 | ||
2021 | 1,020 | ||
Thereafter | 891 | ||
Total | $ | 17,574 | |
Our operating lease arrangements are subject to customary renewal and base rental fee escalation clauses. Total rent expense, net of sublease income which is insignificant, under operating lease arrangements was approximately $8.0 million, $8.6 million and $6.5 million in fiscal years 2016, 2015 and 2014, respectively.
Guarantees and Indemnification Obligations
We include standard intellectual property indemnification provisions in our licensing agreements in the ordinary course of business. Pursuant to our product license agreements, we will indemnify, hold harmless, and agree to reimburse the indemnified party for losses suffered or incurred by the indemnified party, generally business partners or customers, in connection with certain patent, copyright or other intellectual property infringement claims by third parties with respect to our products. Other agreements with our customers provide indemnification for claims relating to property damage or personal injury resulting from the performance of services by us or our subcontractors. Historically, our costs to defend lawsuits or settle claims relating to such indemnity agreements have been insignificant. Accordingly, the estimated fair value of these indemnification provisions is immaterial.
Legal Proceedings
We are subject to various legal proceedings and claims, either asserted or unasserted, which arise in the ordinary course of business. While the outcome of these claims cannot be predicted with certainty, management does not believe that the outcome of any of these other legal matters will have a material effect on our financial position, results of operations or cash flows.
Note 10: Shareholders’ Equity
Preferred Stock
Our Board of Directors is authorized to establish one or more series of preferred stock and to fix and determine the number and conditions of preferred shares, including dividend rates, redemption and/or conversion provisions, if any, preferences and voting rights. As of November 30, 2016, there was no preferred stock issued or outstanding.
69
Common Stock
We have 200,000,000 shares of authorized common stock, $0.01 par value per share, of which 48,536,516 were issued and outstanding at November 30, 2016.
There were 58,479 deferred stock units (DSUs) outstanding at November 30, 2016. Each DSU represents one share of our common stock and all DSU grants have been made to non-employee members of our Board of Directors. All DSUs are fully vested and do not have voting rights and can only be converted into common stock when the recipient ceases to be a member of the Board of Directors.
Common Stock Repurchases
In January 2014, our Board of Directors authorized a $100.0 million share repurchase program. In fiscal year 2014, we repurchased and retired 2.3 million shares of our common stock for $52.6 million. In fiscal year 2015, under the same authorization, we repurchased and retired 1.3 million shares for $32.9 million. In September 2015, our Board of Directors authorized a new $100.0 million share repurchase program, which increased the total authorization to $114.5 million.
In March 2016, our Board of Directors authorized a new $100.0 million share repurchase program. In fiscal year 2016, we repurchased and retired 3.1 million shares of our common stock for $79.2 million. As of November 30, 2016, there is $135.3 million remaining under this current authorization. The timing and amount of any shares repurchased will be determined by management based on its evaluation of market conditions and other factors, and the Board of Directors may choose to suspend, expand or discontinue the repurchase program at any time.
Dividends
On September 27, 2016, our Board of Directors approved the initiation of a quarterly cash dividend to Progress shareholders.
The first quarterly dividend of $0.125 per share of common stock was paid on December 15, 2016 to shareholders of record
as of the close of business on December 1, 2016.
On January 11, 2017, our Board of Directors declared a quarterly dividend of $0.125 per share of common stock payable on March 15, 2017 to shareholders of record as of the close of business on March 1, 2017.
Note 11: Stock-Based Compensation
We currently have one shareholder-approved stock plan from which we can issue stock-based awards, which was approved by our shareholders in fiscal year 2008 (2008 Plan). The 2008 Plan replaced the 1992 Incentive and Nonqualified Stock Option Plan, the 1994 Stock Incentive Plan and the 1997 Stock Incentive Plan (collectively, the “Previous Plans”). The Previous Plans solely exist to satisfy outstanding options previously granted under those plans. The 2008 Plan permits the granting of stock awards to officers, members of the Board of Directors, employees and consultants. Awards under the 2008 Plan may include nonqualified stock options, incentive stock options, grants of conditioned or restricted stock, unrestricted grants of stock, grants of stock contingent upon the attainment of performance goals, deferred stock units and stock appreciation rights. A total of 54,510,000 shares are issuable under these plans, of which 4,521,032 shares were available for grant as of November 30, 2016.
We have adopted two stock plans for which the approval of shareholders was not required: the 2002 Nonqualified Stock Plan (2002 Plan) and the 2004 Inducement Stock Plan (2004 Plan). The 2002 Plan permits the granting of stock awards to non-executive officer employees and consultants. Executive officers and members of the Board of Directors are not eligible for awards under the 2002 Plan. Awards under the 2002 Plan may include nonqualified stock options, grants of conditioned or restricted stock, unrestricted grants of stock, grants of stock contingent upon the attainment of performance goals and stock appreciation rights. A total of 9,750,000 shares are issuable under the 2002 Plan, of which 888,368 shares were available for grant as of November 30, 2016.
The 2004 Plan is reserved for persons to whom we may issue securities as an inducement to become employed by us pursuant to the rules and regulations of the NASDAQ Stock Market. Awards under the 2004 Plan may include nonqualified stock options, grants of conditioned or restricted stock, unrestricted grants of stock, grants of stock contingent upon the attainment of performance goals and stock appreciation rights. A total of 1,500,000 shares are issuable under the 2004 Plan, of which 583,021 shares were available for grant as of November 30, 2016.
Under all of our plans, the options granted generally vest within one year of the grant.
70
A summary of stock option activity under all the plans is as follows:
Shares | Weighted Average | Weighted Average Remaining Contractual Term | Aggregate Intrinsic Value (1) | |||||||||
(in thousands) | Exercise Price | (in years) | (in thousands) | |||||||||
Options outstanding, December 1, 2015 | 734 | $ | 22.35 | |||||||||
Granted | — | — | ||||||||||
Exercised | (260 | ) | 18.27 | |||||||||
Canceled | (57 | ) | 29.44 | |||||||||
Options outstanding, November 30, 2016 | 417 | $ | 24.10 | 1.71 | $ | 2,291 | ||||||
Exercisable, November 30, 2016 | 417 | $ | 24.10 | 1.71 | $ | 2,291 | ||||||
Vested or expected to vest, November 30, 2016 | 417 | $ | 24.10 | 1.71 | $ | 2,291 | ||||||
(1) | The aggregate intrinsic value was calculated based on the difference between the closing price of our stock on November 30, 2016 of $29.57 and the exercise prices for all in-the-money options outstanding. |
A summary of restricted stock units activity is as follows (in thousands, except per share data):
Number of Shares | Weighted Average Fair Value | |||||
Restricted stock units outstanding, December 1, 2015 | 1,743 | $ | 24.42 | |||
Granted | 1,257 | 26.39 | ||||
Issued | (684 | ) | 25.17 | |||
Canceled | (733 | ) | 26.08 | |||
Restricted stock units outstanding, November 30, 2016 | 1,583 | $ | 26.14 | |||
Each restricted stock unit represents one share of common stock. The restricted stock units generally vest semi-annually over a three-year period. Performance-based restricted stock units are subject to performance criteria aligned with our business plan and are earned only to the extent the performance criteria are achieved, with any awards earned being subject to subsequent time-based vesting similar to that discussed above.
The fair value of outright stock awards, restricted stock units and DSUs is equal to the closing price of our common stock on the date of grant, less the present value of expected dividends, as the employee is not entitled to dividends during the requisite service period.
In addition, during fiscal years 2014, 2015, and 2016, we granted performance-based restricted stock units that include a three-year market condition under a Long-Term Incentive Plan (“LTIP”) where the performance measurement period is three years. Vesting of the LTIP awards is based on our level of attainment of specified total shareholder return (TSR) targets relative to the percentage appreciation of a specified index of companies for the respective three year periods and is also subject to the continued employment of the grantees. In order to estimate the fair value of such awards, we used a Monte Carlo Simulation valuation model. The performance measurement period related to the LTIP awards granted during fiscal year 2014 ended as of November 30, 2016. As the level of attainment of the specified TSR target was not met, none of the LTIP awards under this grant vested.
The 1991 Employee Stock Purchase Plan (ESPP) permits eligible employees to purchase up to an aggregate of 9,450,000 shares of our common stock through accumulated payroll deductions. The ESPP has a 27-month offering period comprised of nine three-month purchase periods. The purchase price of the stock is equal to 85% of the lesser of the market value of such shares at the beginning of a 27-month offering period or the end of each three-month segment within such offering period. If the market price at any of the nine purchase periods is less than the market price on the first date of the 27 month offering period, subsequent to the purchase, the offering period is canceled and the employee is entered into a new 27 month offering period with the then current market price as the new base price. We issued 266,000 shares, 226,000 shares and 203,000 shares with weighted average purchase prices of $20.01, $19.58 and $17.84 per share, respectively, in fiscal years 2016, 2015 and
71
2014, respectively. At November 30, 2016, approximately 1,035,000 shares were available and reserved for issuance under the ESPP.
We estimated the fair value of stock options and ESPP awards granted in fiscal years 2016, 2015 and 2014 on the measurement dates using the Black-Scholes option valuation model, and LTIP awards using the Monte Carlo Simulation valuation model, with the following weighted average assumptions:
Fiscal Year Ended | ||||||||
November 30, 2016 | November 30, 2015 | November 30, 2014 | ||||||
Stock options: | ||||||||
Expected volatility | — | % | 28.0 | % | 28.4 | % | ||
Risk-free interest rate | — | % | 1.3 | % | 1.6 | % | ||
Expected life (in years) | — | 4.8 | 4.8 | |||||
Expected dividend yield | — | — | — | |||||
Employee stock purchase plan: | ||||||||
Expected volatility | 25.3 | % | 21.1 | % | 25.1 | % | ||
Risk-free interest rate | 0.62 | % | 0.5 | % | 0.3 | % | ||
Expected life (in years) | 1.6 | 1.6 | 1.6 | |||||
Expected dividend yield | — | — | — | |||||
Long-term incentive plan: | ||||||||
Expected volatility | 27.1 | % | 32.1 | % | 32.5 | % | ||
Risk-free interest rate | 1 | % | 0.9 | % | 0.7 | % | ||
Expected life (in years) | 2.7 | 2.7 | 2.9 | |||||
Expected dividend yield | — | — | — | |||||
For each stock option award, the expected life in years is based on historical exercise patterns and post-vesting termination behavior. Expected volatility is based on historical volatility of our stock, and the risk-free interest rate is based on the U.S. Treasury yield curve for the period that is commensurate with the expected life at the time of grant. The expected annual dividend yield is based on the weighted-average of the dividend yield assumptions used for options granted during the applicable period.
For each ESPP award, the expected life in years is based on the period of time between the beginning of the offering period and the date of purchase, plus an additional holding period of three months. Expected volatility is based on historical volatility of our stock, and the risk-free interest rate is based on the U.S. Treasury yield curve in effect at each purchase period. The expected annual dividend yield is based on the weighted-average of the dividend yield assumptions used for options granted during the applicable period.
Based on the above assumptions, the weighted average estimated fair value of stock options granted in fiscal years 2015 and 2014 was $6.79 and $5.95 per share, respectively. We amortize the estimated fair value of stock options to expense over the vesting period using the straight-line method. The weighted average estimated fair value for shares issued under our ESPP in fiscal years 2016, 2015 and 2014 was $7.43, $6.89 and $6.93 per share, respectively. We amortize the estimated fair value of shares issued under the ESPP to expense over the vesting period using a graded vesting model.
Total unrecognized stock-based compensation expense, net of expected forfeitures, related to unvested stock options and unvested restricted stock awards amounted to $19.5 million at November 30, 2016. These costs are expected to be recognized over a weighted average period of 1.9 years.
72
The following additional activity occurred under our plans (in thousands):
Fiscal Year Ended | |||||||||||
November 30, 2016 | November 30, 2015 | November 30, 2014 | |||||||||
Total intrinsic value of stock options on date exercised | $ | 2,017 | $ | 3,895 | $ | 4,078 | |||||
Total fair value of deferred stock units on date vested | — | 93 | 130 | ||||||||
Total fair value of restricted stock units on date vested | 17,213 | 18,621 | 19,963 | ||||||||
The following table provides the classification of stock-based compensation as reflected in our consolidated statements of operations (in thousands):
Fiscal Year Ended | |||||||||||
November 30, 2016 | November 30, 2015 | November 30, 2014 | |||||||||
Cost of maintenance and services | $ | 899 | $ | 617 | $ | 612 | |||||
Sales and marketing | 4,093 | 4,805 | 4,642 | ||||||||
Product development | 9,965 | 5,433 | 5,289 | ||||||||
General and administrative | 7,584 | 13,149 | 14,330 | ||||||||
Total stock-based compensation | $ | 22,541 | $ | 24,004 | $ | 24,873 | |||||
Income tax benefit included in the provision for income taxes from continuing operations | $ | 5,208 | $ | 5,225 | $ | 6,318 | |||||
Separation Arrangements
During fiscal year 2016, we entered into separation agreements with two executives, which entitled them to accelerated vesting of certain stock-based awards. Due to the separation and accelerated vesting, we recognized additional stock-based compensation expense of $0.3 million, of which $0.2 million was recorded as sales and marketing expense and $0.1 million was recorded as product development expense, in the consolidated statement of operations.
During fiscal year 2015, we entered into separation agreements with three executives, which entitled them to accelerated vesting of certain stock-based awards. Due to the separation and accelerated vesting, we recognized additional stock-based compensation expense of $0.3 million, of which $0.2 million was recorded as general and administrative expense and $0.1 million was recorded as sales and marketing expense, in the consolidated statement of operations.
During fiscal year 2014, we entered into separation agreements with two executives, which entitled them to accelerated vesting of certain stock-based awards. Due to the separation and accelerated vesting, we recognized additional stock-based compensation expense of $1.2 million, of which $0.7 million was recorded as sales and marketing expense and $0.5 million was recorded as general and administrative expense, in the consolidated statement of operations.
Note 12: Retirement Plan
We maintain a retirement plan covering all U.S. employees under Section 401(k) of the Internal Revenue Code. Company contributions to the plan are at the discretion of the Board of Directors and totaled approximately $2.5 million, $2.4 million and $2.1 million for fiscal years 2016, 2015 and 2014, respectively.
73
Note 13: Restructuring
The following table provides a summary of activity for all of the restructuring actions, which are detailed further below (in thousands):
Excess Facilities and Other Costs | Employee Severance and Related Benefits | Total | |||||||||
Balance, December 1, 2013 | $ | 1,184 | $ | 1,368 | $ | 2,552 | |||||
Costs incurred | 579 | 1,715 | 2,294 | ||||||||
Cash disbursements | (1,316 | ) | (1,859 | ) | (3,175 | ) | |||||
Translation adjustments and other | (31 | ) | 3 | (28 | ) | ||||||
Balance, November 30, 2014 | $ | 416 | $ | 1,227 | $ | 1,643 | |||||
Costs incurred | 5,567 | 7,422 | 12,989 | ||||||||
Cash disbursements | (690 | ) | (5,653 | ) | (6,343 | ) | |||||
Asset impairment | (4,962 | ) | — | (4,962 | ) | ||||||
Translation adjustments and other | 81 | (47 | ) | 34 | |||||||
Balance, November 30, 2015 | $ | 412 | $ | 2,949 | $ | 3,361 | |||||
Costs incurred | 319 | 1,373 | 1,692 | ||||||||
Cash disbursements | (633 | ) | (2,906 | ) | (3,539 | ) | |||||
Translation adjustments and other | 9 | 27 | 36 | ||||||||
Balance, November 30, 2016 | $ | 107 | $ | 1,443 | $ | 1,550 | |||||
2016 Restructuring
During the fourth quarter of fiscal year 2016, our management approved, committed to and initiated plans to make strategic changes to our organization as a result of the appointment of our new Chief Executive Officer during the period. In connection with the new organizational structure, we eliminated the positions of Chief Product Officer and Chief Revenue Officer.
Restructuring expenses are related to employee costs, including severance, health benefits and outplacement services (but excluding stock-based compensation).
As part of this fourth quarter restructuring, for the fiscal year ended November 30, 2016, we incurred expenses of $1.5 million. The expenses are recorded as restructuring expenses in the consolidated statements of operations.
A summary of activity for this restructuring action is as follows (in thousands):
Excess Facilities and Other Costs | Employee Severance and Related Benefits | Total | |||||||||
Balance, December 1, 2015 | $ | — | $ | — | $ | — | |||||
Costs incurred | — | 1,482 | 1,482 | ||||||||
Cash disbursements | — | (67 | ) | (67 | ) | ||||||
Balance, November 30, 2016 | $ | — | $ | 1,415 | $ | 1,415 | |||||
Cash disbursements for expenses incurred to date under this restructuring are expected to be made through the fourth quarter of fiscal year 2017. As a result, the total amount of the restructuring reserve of $1.4 million is included in other accrued liabilities on the consolidated balance sheet at November 30, 2016.
74
2015 Restructurings
During the first quarter of fiscal year 2015, we restructured our operations in connection with the acquisition of Telerik. This restructuring resulted in a reduction in redundant positions primarily within the administrative functions. This restructuring also resulted in the closing of two facilities as well as asset impairment charges for assets no longer deployed as a result of the acquisition. During the second and third quarters of fiscal year 2015, we incurred additional costs with respect to this restructuring, including reduction in redundant positions primarily within the product development function, as well as an impairment charge discussed further below.
Restructuring expenses are related to employee costs, including severance, health benefits and outplacement services (but excluding stock-based compensation), facilities costs, which include fees to terminate lease agreements and costs for unused space, net of sublease assumptions, and other costs, which include asset impairment charges.
During the second quarter of fiscal year 2015, we decided to replace our existing cloud-based mobile application development technology with technology acquired in connection with the acquisition of Telerik. Accordingly, we evaluated the ongoing value of the assets associated with this prior mobile technology and, based on this evaluation, we determined that the long-lived assets with a carrying amount of $4.0 million were no longer recoverable and were impaired and wrote them down to their estimated fair value of $0.1 million. Fair value was based on expected future cash flows using Level 3 inputs under ASC 820.
As part of this first quarter restructuring, for the fiscal year ended November 30, 2016, we incurred expenses of $0.3 million. For the fiscal year ended November 30, 2015, we incurred expenses of $7.5 million. The expenses are recorded as restructuring expenses in the consolidated statements of operations. We do not expect to incur additional material costs with respect to this restructuring.
A summary of activity for this restructuring action is as follows (in thousands):
Excess Facilities and Other Costs | Employee Severance and Related Benefits | Total | |||||||||
Balance, December 1, 2014 | $ | — | $ | — | $ | — | |||||
Costs incurred | 4,406 | 3,108 | 7,514 | ||||||||
Cash disbursements | (300 | ) | (2,801 | ) | (3,101 | ) | |||||
Asset impairment | (3,999 | ) | — | (3,999 | ) | ||||||
Translation adjustments and other | 102 | 2 | 104 | ||||||||
Balance, November 30, 2015 | $ | 209 | $ | 309 | $ | 518 | |||||
Costs incurred | 326 | (43 | ) | 283 | |||||||
Cash disbursements | (477 | ) | (267 | ) | (744 | ) | |||||
Translation adjustments and other | (1 | ) | 1 | — | |||||||
Balance, November 30, 2016 | $ | 57 | $ | — | $ | 57 | |||||
Cash disbursements for expenses incurred to date under this restructuring are expected to be made through the second quarter of fiscal year 2017. As a result, the total amount of the restructuring reserve of $0.1 million is included in other accrued liabilities on the consolidated balance sheet at November 30, 2016.
During the fourth quarter of fiscal year 2015, our management approved, committed to and initiated plans to make strategic changes to our organization to further build on the focus gained from operating under our business segment structure and to enable stronger cross-collaboration among product management, marketing and sales teams and a tighter integration of the product management and product development teams. In connection with the new organizational structure, we no longer have presidents of our three segments, as well as certain other positions within the administrative organization. Our Chief Operating Officer, appointed during fiscal year 2015, assumed responsibility for driving the operations of our three segments. The organizational changes did not result in the closing of any of our facilities.
Restructuring expenses are related to employee costs, including severance, health benefits and outplacement services (but excluding stock-based compensation), and other costs, which include charges for the abandonment of certain assets.
75
As part of this fourth quarter restructuring, for the fiscal year ended November 30, 2016, we recorded a minimal credit to restructuring expenses in the consolidated statements of operations due to changes in estimates of severance to be paid. For the fiscal year ended November 30, 2015, we incurred expenses of $4.1 million. The expenses are recorded as restructuring expenses in the consolidated statements of operations. We do not expect to incur additional material costs with respect to this restructuring.
A summary of activity for this restructuring action is as follows (in thousands):
Excess Facilities and Other Costs | Employee Severance and Related Benefits | Total | |||||||||
Balance, December 1, 2014 | $ | — | $ | — | $ | — | |||||
Costs incurred | 963 | 3,108 | 4,071 | ||||||||
Cash disbursements | — | (483 | ) | (483 | ) | ||||||
Asset impairment | (963 | ) | — | (963 | ) | ||||||
Translation adjustments and other | — | (8 | ) | (8 | ) | ||||||
Balance, November 30, 2015 | $ | — | $ | 2,617 | $ | 2,617 | |||||
Costs incurred | — | (42 | ) | (42 | ) | ||||||
Cash disbursements | — | (2,572 | ) | (2,572 | ) | ||||||
Translation adjustments and other | — | 25 | 25 | ||||||||
Balance, November 30, 2016 | $ | — | $ | 28 | $ | 28 | |||||
Cash disbursements for expenses incurred to date under this restructuring are expected to be made through the fourth quarter of fiscal year 2017. As a result, the total amount of the restructuring reserve, which is minimal, is included in other accrued liabilities on the consolidated balance sheet at November 30, 2016.
2012 - 2014 Restructurings
During fiscal years 2012, 2013, and 2014, our management approved, committed to and initiated plans to make strategic changes to our organization to provide greater focus and agility in the delivery of next generation application development, deployment and integration solutions. During each of these fiscal years, we took restructuring actions that involved the elimination of personnel and/or the closure of facilities.
Restructuring expenses are related to employee costs, including severance, health benefits and outplacement services (but excluding stock-based compensation), and facilities costs, which include fees to terminate lease agreements and costs for unused space, net of sublease assumptions.
As part of these restructuring actions, for the twelve months ended November 30, 2016, we recorded a minimal credit to restructuring expenses in the consolidated statements of operations primarily due to changes in estimates of severance to be paid. For the fiscal years ended November 30, 2015 and November 30, 2014, we incurred expenses of $1.4 million and $2.3 million, respectively. The expenses are recorded as restructuring expenses in the consolidated statements of operations. We do not expect to incur additional material costs with respect to the 2012, 2013, and 2014 restructuring actions.
76
A summary of these restructuring actions is as follows (in thousands):
Excess Facilities and Other Costs | Employee Severance and Related Benefits | Total | |||||||||
Balance, December 1, 2013 | $ | 1,184 | $ | 1,368 | $ | 2,552 | |||||
Costs incurred | 579 | 1,715 | 2,294 | ||||||||
Cash disbursements | (1,316 | ) | (1,859 | ) | (3,175 | ) | |||||
Translation adjustments and other | (31 | ) | 3 | (28 | ) | ||||||
Balance, November 30, 2014 | $ | 416 | $ | 1,227 | $ | 1,643 | |||||
Costs incurred | 198 | 1,206 | 1,404 | ||||||||
Cash disbursements | (390 | ) | (2,369 | ) | (2,759 | ) | |||||
Translation adjustments and other | (21 | ) | (40 | ) | (61 | ) | |||||
Balance, November 30, 2015 | $ | 203 | $ | 24 | $ | 227 | |||||
Costs incurred | (7 | ) | (24 | ) | (31 | ) | |||||
Cash disbursements | (156 | ) | — | (156 | ) | ||||||
Translation adjustments and other | 10 | — | 10 | ||||||||
Balance, November 30, 2016 | $ | 50 | $ | — | $ | 50 | |||||
Cash disbursements for expenses incurred to date under these restructuring actions are expected to be made through the first quarter of fiscal year 2017. As a result, the total amount of the restructuring reserve of $0.1 million is included in other accrued liabilities on the consolidated balance sheet at November 30, 2016.
Note 14: Income Taxes
The components of income before income taxes are as follows (in thousands):
Fiscal Year Ended | |||||||||||
November 30, 2016 | November 30, 2015 | November 30, 2014 | |||||||||
U.S. | $ | 78,477 | $ | 62,813 | $ | 68,882 | |||||
Foreign | (113,757 | ) | (50,459 | ) | 8,922 | ||||||
Total | $ | (35,280 | ) | $ | 12,354 | $ | 77,804 | ||||
The provision for income taxes is comprised of the following (in thousands):
Fiscal Year Ended | |||||||||||
November 30, 2016 | November 30, 2015 | November 30, 2014 | |||||||||
Current: | |||||||||||
Federal | $ | 12,934 | $ | 18,418 | $ | 7,796 | |||||
State | 3,178 | 1,526 | 765 | ||||||||
Foreign | 3,027 | 3,056 | 4,751 | ||||||||
Total current | 19,139 | 23,000 | 13,312 | ||||||||
Deferred: | |||||||||||
Federal | 6,203 | 2,199 | 14,783 | ||||||||
State | (1,963 | ) | 60 | 730 | |||||||
Foreign | (2,933 | ) | (4,104 | ) | (479 | ) | |||||
Total deferred | 1,307 | (1,845 | ) | 15,034 | |||||||
Total | $ | 20,446 | $ | 21,155 | $ | 28,346 | |||||
77
A reconciliation of the U.S. Federal statutory rate to the effective tax rate is as follows (in thousands):
Fiscal Year Ended | |||||||||||
November 30, 2016 | November 30, 2015 | November 30, 2014 | |||||||||
Tax at U.S. Federal statutory rate | $ | (12,348 | ) | $ | 4,324 | $ | 27,231 | ||||
Foreign rate differences | 7,689 | 16,945 | 1,320 | ||||||||
Effects of foreign operations included in U.S. Federal provision | (1,244 | ) | (996 | ) | (1,821 | ) | |||||
State income taxes, net | 2,977 | 1,029 | 1,227 | ||||||||
Research credits | (838 | ) | (681 | ) | (80 | ) | |||||
Domestic production activities deduction | (1,925 | ) | (1,750 | ) | (1,095 | ) | |||||
Tax-exempt interest | (76 | ) | (51 | ) | (80 | ) | |||||
Nondeductible stock-based compensation | 740 | 1,875 | 2,152 | ||||||||
Meals and entertainment | 234 | 321 | 220 | ||||||||
Compensation subject to 162(m) | — | 228 | 350 | ||||||||
Uncertain tax positions and tax settlements | (1,701 | ) | (332 | ) | (123 | ) | |||||
Prior period adjustment | (2,700 | ) | — | — | |||||||
Release of valuation allowance on state research and development credits | (2,748 | ) | — | — | |||||||
Goodwill Impairment | 32,200 | — | — | ||||||||
Other | 186 | 243 | (955 | ) | |||||||
Total | $ | 20,446 | $ | 21,155 | $ | 28,346 | |||||
During the preparation of our condensed consolidated financial statements for the three months ended May 31, 2016, we identified an error in our prior year income tax provision whereby income tax expense was overstated for the year ended November 30, 2015 by $2.7 million related to our tax treatment of an intercompany gain. We determined that the error is not material to the prior year financial statements. We also concluded that recording an out-of-period correction would not be material and therefore corrected this error by recording an out-of-period $2.7 million tax benefit in our interim financial statements for the periods ended May 31, 2016.
The components of deferred tax assets and liabilities are as follows (in thousands):
November 30, 2016 | November 30, 2015 | ||||||
Deferred tax assets: | |||||||
Accounts receivable | $ | 360 | $ | 628 | |||
Other assets | 77 | 761 | |||||
Accrued compensation | 3,267 | 3,421 | |||||
Accrued liabilities and other | 3,207 | 4,945 | |||||
Stock-based compensation | 4,377 | 4,902 | |||||
Deferred revenue | 1,325 | 798 | |||||
Tax credit and loss carryforwards | 23,167 | 29,351 | |||||
Gross deferred tax assets | 35,780 | 44,806 | |||||
Valuation allowance | (3,189 | ) | (8,160 | ) | |||
Total deferred tax assets | 32,591 | 36,646 | |||||
Deferred tax liabilities: | |||||||
Goodwill | (23,685 | ) | (21,580 | ) | |||
Deferred revenue | — | — | |||||
Depreciation and amortization | (6,206 | ) | (11,207 | ) | |||
Total deferred tax liabilities | (29,891 | ) | (32,787 | ) | |||
Total | $ | 2,700 | $ | 3,859 | |||
78
The valuation allowance primarily applies to net operating loss carryforwards and unutilized tax credits in jurisdictions or under conditions where realization is not more likely than not. The $5.0 million decrease in the valuation allowance during fiscal year 2016 primarily relates to release of the valuation allowance on state research and development tax credits and a valuation allowance on a foreign subsidiary that was liquidated during fiscal year 2016. The $1.5 million and $3.3 million decreases in the valuation allowance during fiscal years 2015 and 2014, respectively, primarily relate to foreign net operating loss carryforwards expiring unutilized.
At November 30, 2016, we have federal and foreign net operating loss carryforwards of $107.3 million expiring on various dates through 2034 and $0.8 million that may be carried forward indefinitely. In addition, we have state net operating loss carryforwards of $5.2 million expiring on various dates through 2022. At November 30, 2016, we have tax credit carryforwards of approximately $3.5 million expiring on various dates through 2031 and $2.1 million that may be carried forward indefinitely.
It is our intention to indefinitely reinvest the earnings of our non-U.S. subsidiaries. We have not provided for U.S. income taxes on the undistributed earnings of non-U.S. subsidiaries, which totaled $13.7 million as of November 30, 2016, as these earnings have been indefinitely reinvested. Any additional taxes that might be payable upon repatriation of our foreign earnings would not be significant.
As of November 30, 2016, the total amount of unrecognized tax benefits was $7.0 million, of which $3.8 million was recorded in other noncurrent liabilities on the consolidated balance sheet and $3.2 million of deferred tax assets, principally related to U.S and foreign net operating loss carry-forwards, have not been recorded.
A reconciliation of the balance of our unrecognized tax benefits is as follows (in thousands):
Fiscal Year Ended | |||||||||||
November 30, 2016 | November 30, 2015 | November 30, 2014 | |||||||||
Balance, beginning of year | $ | 4,779 | $ | 1,711 | $ | 1,022 | |||||
Tax positions related to current year | 1,106 | 107 | 849 | ||||||||
Tax positions related to a prior period | 1,638 | — | — | ||||||||
Settlements with tax authorities | (21 | ) | (39 | ) | — | ||||||
Tax positions acquired | — | 4,464 | — | ||||||||
Lapses due to expiration of the statute of limitations | (456 | ) | (1,464 | ) | (160 | ) | |||||
Balance, end of year | $ | 7,046 | $ | 4,779 | $ | 1,711 | |||||
If recognized, all amounts of unrecognized tax benefits would affect the effective tax rate.
We recognize interest and penalties related to uncertain tax positions as a component of our provision for income taxes. In fiscal years 2016, 2015, and 2014 there was a minimal amount of estimated interest and penalties recorded in the provision for income taxes. We have accrued $0.3 million and $0.4 million of estimated interest and penalties at November 30, 2016 and 2015, respectively. We do not expect any significant changes to the amount of unrecognized tax benefits in the next twelve months.
The Internal Revenue Service completed their audit of our U.S. Federal income tax return for the years ended November 30, 2013 and November 30, 2014 with no significant changes. Our Federal income tax returns have been examined or are closed by statute for all years prior to fiscal year 2015. Our state income tax returns have been examined or are closed by statute for all years prior to fiscal year 2012, and we are no longer subject to audit for those periods.
Tax authorities for certain non-U.S. jurisdictions are also examining returns, none of which are material to our consolidated balance sheets, cash flows or statements of income. With some exceptions, we are generally no longer subject to tax examinations in non-U.S. jurisdictions for years prior to fiscal year 2011.
79
Note 15: (Loss) Earnings Per Share
We compute basic earnings per share using the weighted average number of common shares outstanding. We compute diluted earnings per share using the weighted average number of common shares outstanding plus the effect of outstanding dilutive stock options, restricted stock units and deferred stock units, using the treasury stock method. The following table sets forth the calculation of basic and diluted earnings per share from continuing operations (in thousands, expect per share data):
Fiscal Year Ended | |||||||||||
November 30, 2016 | November 30, 2015 | November 30, 2014 | |||||||||
Net (loss) income | $ | (55,726 | ) | $ | (8,801 | ) | $ | 49,458 | |||
Weighted average shares outstanding | 49,481 | 50,391 | 50,840 | ||||||||
Dilutive impact from common stock equivalents | — | — | 626 | ||||||||
Diluted weighted average shares outstanding | 49,481 | 50,391 | 51,466 | ||||||||
Basic (loss) earnings per share | $ | (1.13 | ) | $ | (0.17 | ) | $ | 0.97 | |||
Diluted (loss) earnings per share | $ | (1.13 | ) | $ | (0.17 | ) | $ | 0.96 | |||
We excluded stock awards representing approximately 2,058,000 shares, 2,552,000 shares, and 355,000 shares of common stock from the calculation of diluted earnings per share in the fiscal years ended November 30, 2016, 2015 and 2014, respectively, because these awards were anti-dilutive.
Note 16: Business Segments and International Operations
Operating segments are components of an enterprise that engage in business activities for which discrete financial information is available and regularly reviewed by the chief operating decision maker in deciding how to allocate resources and assess performance. Our chief operating decision maker is our Chief Executive Officer.
The changes made to our organization during the fourth quarter of fiscal year 2016, as discussed in Note 13, did not change our determination of the three reportable segments as our organizational structure maintains the focus of the three business segments.
We do not manage our assets or capital expenditures by segment or assign other income (expense) and income taxes to segments. We manage and report such items on a consolidated company basis.
80
The following table provides revenue and contribution margin from our reportable segments and reconciles to the consolidated income from continuing operations before income taxes:
Fiscal Year Ended | |||||||||||
(In thousands) | November 30, 2016 | November 30, 2015 | November 30, 2014 | ||||||||
Segment revenue: | |||||||||||
OpenEdge | $ | 276,267 | $ | 295,934 | $ | 296,721 | |||||
Data Connectivity and Integration | 48,009 | 37,926 | 34,772 | ||||||||
Application Development and Deployment | 81,065 | 43,694 | 1,040 | ||||||||
Total revenue | 405,341 | 377,554 | 332,533 | ||||||||
Segment costs of revenue and operating expenses: | |||||||||||
OpenEdge | 72,938 | 77,085 | 70,811 | ||||||||
Data Connectivity and Integration | 12,760 | 13,819 | 12,308 | ||||||||
Application Development and Deployment | 40,180 | 39,386 | 9,354 | ||||||||
Total costs of revenue and operating expenses | 125,878 | 130,290 | 92,473 | ||||||||
Segment contribution margin: | |||||||||||
OpenEdge | 203,329 | 218,849 | 225,910 | ||||||||
Data Connectivity and Integration | 35,249 | 24,107 | 22,464 | ||||||||
Application Development and Deployment | 40,885 | 4,308 | (8,314 | ) | |||||||
Total contribution margin | 279,463 | 247,264 | 240,060 | ||||||||
Other unallocated expenses (1) | 309,172 | 232,510 | 159,320 | ||||||||
(Loss) income from operations | $ | (29,709 | ) | $ | 14,754 | $ | 80,740 | ||||
Other expense, net | $ | (5,571 | ) | $ | (2,400 | ) | $ | (2,936 | ) | ||
(Loss) income before income taxes | $ | (35,280 | ) | $ | 12,354 | $ | 77,804 | ||||
(1) The following expenses are not allocated to our segments as we manage and report our business in these functional areas on a consolidated basis only: product development, corporate marketing, administration, amortization and impairment of acquired intangibles, impairment of goodwill, stock-based compensation, restructuring, and acquisition related expenses. | |||||||||||
Our revenues are derived from licensing our products, and from related services, which consist of maintenance, hosting services, and consulting and education. Information relating to revenue from external customers by revenue type is as follows (in thousands):
Fiscal Year Ended | |||||||||||
November 30, 2016 | November 30, 2015 | November 30, 2014 | |||||||||
Software licenses | $ | 134,863 | $ | 130,250 | $ | 117,801 | |||||
Maintenance | 238,377 | 217,718 | 202,496 | ||||||||
Professional services | 32,101 | 29,586 | 12,236 | ||||||||
Total | $ | 405,341 | $ | 377,554 | $ | 332,533 | |||||
81
In the following table, revenue attributed to the United States includes sales to customers in the U.S. and sales to certain multinational organizations. Revenue from Canada, Europe, the Middle East and Africa (EMEA), Latin America and the Asia Pacific region includes sales to customers in each region plus sales from the U.S. to distributors in these regions. Information relating to revenue from external customers from different geographical areas is as follows (in thousands):
Fiscal Year Ended | |||||||||||
November 30, 2016 | November 30, 2015 | November 30, 2014 | |||||||||
United States | $ | 212,312 | $ | 193,665 | $ | 137,105 | |||||
Canada | 16,891 | 13,901 | 13,611 | ||||||||
EMEA | 130,818 | 124,171 | 131,335 | ||||||||
Latin America | 21,156 | 17,594 | 24,917 | ||||||||
Asia Pacific | 24,164 | 28,223 | 25,565 | ||||||||
Total | $ | 405,341 | $ | 377,554 | $ | 332,533 | |||||
No country outside of the U.S. accounted for more than 10% of our consolidated revenue in any year presented. Long-lived assets totaled $45.4 million, $50.3 million and $56.9 million in the U.S. and $4.7 million, $3.9 million and $2.5 million outside of the U.S. at the end of fiscal years 2016, 2015 and 2014, respectively. No individual country outside of the U.S. accounted for more than 10% of our consolidated long-lived assets.
Note 17: Selected Quarterly Financial Data (unaudited)
(in thousands, except per share data) | First Quarter | Second Quarter | Third Quarter | Fourth Quarter | |||||||||||
Fiscal year 2016: | |||||||||||||||
Revenue | $ | 89,481 | $ | 96,118 | $ | 102,018 | $ | 117,724 | |||||||
Gross profit | 73,731 | 79,883 | 84,829 | 101,186 | |||||||||||
(Loss) income from operations1 | 6,705 | 12,344 | 13,606 | (62,364 | ) | ||||||||||
Net (loss) income1 | 3,216 | 7,275 | 7,576 | (73,793 | ) | ||||||||||
Basic (loss) earnings per share | 0.06 | 0.15 | 0.16 | (1.52 | ) | ||||||||||
Diluted (loss) earnings per share | 0.06 | 0.14 | 0.15 | (1.52 | ) | ||||||||||
Fiscal year 2015: | |||||||||||||||
Revenue | $ | 81,381 | $ | 88,817 | $ | 94,637 | $ | 112,719 | |||||||
Gross profit | 63,753 | 73,071 | 79,505 | 97,483 | |||||||||||
(Loss) income from operations | (11,186 | ) | (2,735 | ) | 8,594 | 20,081 | |||||||||
Net (loss) income | (971 | ) | 5,769 | (4,126 | ) | (9,473 | ) | ||||||||
Basic (loss) earnings per share | (0.02 | ) | 0.11 | (0.08 | ) | (0.19 | ) | ||||||||
Diluted (loss) earnings per share | (0.02 | ) | 0.11 | (0.08 | ) | (0.19 | ) | ||||||||
(1) Included within the loss from operations and net loss during the fourth quarter of fiscal 2016 is a $92 million impairment charge related to the goodwill of the Application Development and Deployment reporting unit. For further discussion on the impairment of goodwill, refer to Note 6.
82
Note 18: Related Party Transactions
During fiscal year 2015, we entered into two license agreements with Emdeon Inc. (Emdeon) to provide Emdeon access to certain of our software. Philip M. Pead, our former President and Chief Executive Officer, and current member of our Board of Directors, is a member of Emdeon’s board of directors. We deployed the software and recorded revenue of $0.4 million. We also recorded $0.2 million of deferred license and maintenance revenue related to the arrangements as of November 30, 2015, which will be recorded as revenue on a straight-line basis over the respective maintenance periods of each license agreement. As Emdeon paid us the total amounts upon deployment, there is no outstanding accounts receivable balance as of November 30, 2015.
During fiscal year 2015, we also entered into two license agreements with a customer on whose board of directors one of our directors also serves. We delivered the software during the year and recorded revenue of $0.7 million. We also recorded a minimal amount of deferred maintenance revenue related to one of the arrangements, which was recorded as revenue on a straight-line basis over the remaining maintenance period.
We did not enter into any material related party transactions during fiscal year 2016.
Note 19: Subsequent Events
In January 2017, we announced certain operational restructuring initiatives intended to significantly reduce annual costs. To execute these operational restructuring initiatives, we expect to reduce our global workforce by approximately 450 positions, totaling over 20% of our global workforce. These workforce reductions began in the first fiscal quarter of 2017 and are expected to be completed by the end of the second fiscal quarter of 2017, depending upon local legal requirements. These workforce reductions will occur in substantially all functional units and across all geographies in which we operate. We also expect to consolidate offices in various locations.
As a result of these workforce reductions and office consolidations, we expect to incur in the aggregate a pre-tax charge in the range of approximately $17 million to $20 million. The estimated aggregate charge consists of approximately $16 million to $17 million relating to our global workforce reduction, consisting primarily of severance and post-employment benefits, and approximately $1 million to $3 million relating to our office consolidations. We expect to record these charges primarily in the 2017 first and second fiscal quarters. Substantially all of these charges are expected to result in cash expenditures.
83
Item 9. Changes in and Disagreements With Accountants on Accounting and Financial Disclosure
None.
Item 9A. Controls and Procedures
(a) Evaluation of disclosure controls and procedures
Our management maintains disclosure controls and procedures as defined in Rule 13a-15(e) and 15d-15(e) under the Securities and Exchange Act of 1934, as amended (the “Exchange Act”) that are designed to provide reasonable assurance that information required to be disclosed in our reports filed or submitted under the Exchange Act is processed, recorded, summarized and reported within the time periods specified in the SEC's rules and forms, and that such information is accumulated and communicated to management, including our Chief Executive Officer and Chief Financial Officer (our principal executive officer and principal financial officer, respectively), as appropriate, to allow for timely decisions regarding required disclosure.
Our management, including the Chief Executive Officer and Chief Financial Officer, carried out an evaluation of the effectiveness of our disclosure controls and procedures as of the end of the period covered by this report. Based on this evaluation, our Chief Executive Officer and Chief Financial Officer concluded that our disclosure controls and procedures were effective to ensure that the information required to be disclosed in the reports filed or submitted by us under the Securities Exchange Act of 1934 was recorded, processed, summarized and reported within the requisite time periods and that such information was accumulated and communicated to our management, including our Chief Executive Officer and Chief Financial Officer, as appropriate to allow for timely decisions regarding required disclosure.
(b) Management’s Annual Report on Internal Control Over Financial Reporting
Our management is responsible for establishing and maintaining adequate internal control over financial reporting, as such term is defined in Exchange Act Rule 13a-15(f). Because of its inherent limitations, internal control over financial reporting may not prevent or detect all misstatements. Our internal control system was designed to provide reasonable assurance to our management and board of directors regarding the preparation and fair presentation of published financial statements.
Our management assessed the effectiveness of our internal control over financial reporting as of November 30, 2016. Our assessment was based on the framework in the updated Internal Control-Integrated Framework (2013) issued by the Committee of Sponsoring Organizations of the Treadway Commission (“COSO”) on May 14, 2013. Based on our assessment we believe that as of November 30, 2016, our internal control over financial reporting is effective based on those criteria.
Deloitte & Touche LLP, our independent registered public accounting firm, which audited our consolidated financial statements, has issued an attestation report on our internal control over financial reporting, which is included in this Item 9A below.
(c) Changes in internal control over financial reporting
Our management, including our Chief Executive Officer and Chief Financial Officer, evaluated our “internal control over financial reporting” as defined in Exchange Act Rule 13a-15(f) to determine whether any changes in our internal control over financial reporting occurred during the fiscal quarter ended November 30, 2016 that materially affected, or are reasonably likely to materially affect, our internal control over financial reporting. Based on that evaluation, there were no changes in our internal control over financial reporting during the fiscal quarter ended November 30, 2016 that have materially affected, or are reasonably likely to materially affect our internal control over financial reporting.
84
(d) Report of independent registered public accounting firm
REPORT OF INDEPENDENT REGISTERED PUBLIC ACCOUNTING FIRM
To the Board of Directors and Shareholders of
Progress Software Corporation
Bedford, Massachusetts
We have audited the internal control over financial reporting of Progress Software Corporation and subsidiaries (the "Company") as of November 30, 2016, based on criteria established in Internal Control - Integrated Framework (2013) issued by the Committee of Sponsoring Organizations of the Treadway Commission. The Company's management is responsible for maintaining effective internal control over financial reporting and for its assessment of the effectiveness of internal control over financial reporting, included in the accompanying Management’s Annual Report on Internal Control Over Financial Reporting. Our responsibility is to express an opinion on the Company's internal control over financial reporting based on our audit.
We conducted our audit in accordance with the standards of the Public Company Accounting Oversight Board (United States). Those standards require that we plan and perform the audit to obtain reasonable assurance about whether effective internal control over financial reporting was maintained in all material respects. Our audit included obtaining an understanding of internal control over financial reporting, assessing the risk that a material weakness exists, testing and evaluating the design and operating effectiveness of internal control based on the assessed risk, and performing such other procedures as we considered necessary in the circumstances. We believe that our audit provides a reasonable basis for our opinion.
A company's internal control over financial reporting is a process designed by, or under the supervision of, the company's principal executive and principal financial officers, or persons performing similar functions, and effected by the company's board of directors, management, and other personnel to provide reasonable assurance regarding the reliability of financial reporting and the preparation of financial statements for external purposes in accordance with generally accepted accounting principles. A company's internal control over financial reporting includes those policies and procedures that (1) pertain to the maintenance of records that, in reasonable detail, accurately and fairly reflect the transactions and dispositions of the assets of the company; (2) provide reasonable assurance that transactions are recorded as necessary to permit preparation of financial statements in accordance with generally accepted accounting principles, and that receipts and expenditures of the company are being made only in accordance with authorizations of management and directors of the company; and (3) provide reasonable assurance regarding prevention or timely detection of unauthorized acquisition, use, or disposition of the company's assets that could have a material effect on the financial statements.
Because of the inherent limitations of internal control over financial reporting, including the possibility of collusion or improper management override of controls, material misstatements due to error or fraud may not be prevented or detected on a timely basis. Also, projections of any evaluation of the effectiveness of the internal control over financial reporting to future periods are subject to the risk that the controls may become inadequate because of changes in conditions, or that the degree of compliance with the policies or procedures may deteriorate.
In our opinion, the Company maintained, in all material respects, effective internal control over financial reporting as of November 30, 2016, based on the criteria established in Internal Control - Integrated Framework (2013) issued by the Committee of Sponsoring Organizations of the Treadway Commission.
We have also audited, in accordance with the standards of the Public Company Accounting Oversight Board (United States), the consolidated financial statements as of and for the year ended November 30, 2016, of the Company and our report dated January 30, 2017 expressed an unqualified opinion on those financial statements.
/s/ Deloitte & Touche LLP
Boston, Massachusetts
January 30, 2017
Item 9B. Other Information
Not applicable.
85
PART III
Item 10. Directors, Executive Officers and Corporate Governance
The information required by this Item 10 with respect to our directors and executive officers, including the qualifications of the members of the Audit Committee of our Board of Directors, may be found in the sections captioned, “Proposal 1-Election of Directors,” “Committees of the Board,” “Certain Relationships” and “Section 16(a) Beneficial Ownership Reporting Compliance” appearing in our definitive Proxy Statement for the 2017 Annual Meeting of Shareholders. This information is incorporated herein by reference.
Executive and Other Key Officers of the Registrant
The following table sets forth certain information regarding our executive and other key officers.
Name | Age | Position | |||
Kurt Abkemeier | 46 | Chief Financial Officer | |||
John Ainsworth | 52 | Senior Vice President, Products--Core | |||
Stephen Faberman | 47 | Chief Legal Officer | |||
Yogesh Gupta | 56 | President and Chief Executive Officer | |||
Loren Jarrett | 42 | Chief Marketing Officer | |||
Jerry Rulli | 60 | Chief Operating Officer | |||
Faris Sweis | 41 | Senior Vice President, General Manager-Dev Tools/Telerik Platform | |||
Dimitre Taslakov | 40 | Chief Talent Officer | |||
Mr. Abkemeier became Chief Financial Officer in September 2016. As Chief Financial Officer, Mr. Abkemeier is responsible for our finance and accounting, planning and budgeting and internal audit functions. Prior to joining our company, Mr. Abkemeier was Chief Financial Officer and Executive Vice President of Inteliquent, Inc., from January 2014 until September 2016. Prior to that time, Mr. Abkemeier served as the Vice President of Finance and Treasurer of Cbeyond, Inc. from June 2005 to March 2012.
Mr. Ainsworth became Senior Vice President, Products-Core in January 2017. Mr. Ainsworth is responsible for the product management, product marketing, technical support and engineering functions for all of our products other than DevTools and Telerik Platform. Prior to joining our company, Mr. Ainsworth was Senior Vice President, Engineering Services at CA Technologies, Inc., a position he assumed in April 2016. Prior to that time, Mr. Ainsworth held various senior positions within CA Technologies, Inc., which he joined through acquisition in 1994.
Mr. Faberman became Chief Legal Officer in December 2015. As Chief Legal Officer, Mr. Faberman is responsible for our legal and compliance, risk management, license compliance and business development functions. Prior to becoming Chief Legal Officer, Mr. Faberman was Senior Vice President, General Counsel. Mr. Faberman became General Counsel in December 2012 and a Senior Vice President in January 2014. Prior to that time, from October 2012 to December 2012, Mr. Faberman was Vice President, Acting General Counsel, and from January 2012 to October 2012, Mr. Faberman was Vice President, Deputy General Counsel.
Mr. Gupta became President and Chief Executive Officer in October 2016. Prior to that time, Mr. Gupta served as an advisor to various venture capital and private equity firms from October 2015 until September 2016. Prior to that time, Mr. Gupta was President and Chief Executive Officer at Kaseya, Inc., from June 2013 until July 2015, at which time, Mr. Gupta became Chairman of the Board of Directors, a position he held until October 2015. From July 2012 until June 2013, Mr. Gupta served as an advisor to various venture capital and private equity firms in several mergers and acquisitions opportunities. Mr. Gupta was previously President and Chief Executive Officer of FatWire Software from July 2007 until February 2012, prior to the acquisition of FatWire Software by Oracle Corporation.
Ms. Jarrett became Chief Marketing Officer in January 2017. As Chief Marketing Officer, Ms. Jarrett is responsible for our marketing strategy, corporate marketing, demand generation, and field marketing functions. Prior to that time, Ms. Jarrett was Chief Marketing Officer at Acquia, from 2015 until December 2016. Previously, Ms. Jarrett was Chief Marketing Officer at Kaseya, Inc. from 2013 until 2015, and Vice President, Corporate Charge Card and Loyalty Products at American Express, in 2013. Prior to that time, Ms. Jarrett was Vice President, Product Management and Strategy at Oracle Corporation from 2011
86
until 2012, and Senior Vice President of Marketing and Product Management at FatWire from 2007 until its acquisition by Oracle in 2011.
Mr. Rulli became Chief Operating Officer in July 2015. Prior to that time, Mr. Rulli was President, OpenEdge Business Unit from August 2014 when he joined us. Prior to that time, from June 2010 to May 2014, Mr. Rulli was Executive Vice President, Worldwide Sales at Iron Mountain. On January 16, 2017, we announced that Mr. Rulli’s employment with us would terminate at the end of the first quarter of fiscal year 2017.
Mr. Sweis became Senior Vice President and General Manager of Dev Tools/Telerik Platform in January 2017. As General Manager, Mr. Sweis is responsible for the sales, product management, product marketing, field marketing, technical support and engineering for our DevTools/Telerik Platform products. Prior to this role, Mr. Sweis was our Chief Transformation Officer, a position he assumed in May 2016. Mr. Sweis also became our Acting Chief Product Development Officer in August 2016. Prior to being named our Chief Transformation Officer, Mr. Sweis was Vice President, Development, a position he assumed upon acquisition of Telerik in December 2014. Prior to that time, Mr. Sweis was Chief Technology Officer at Telerik.
Mr. Taslakov became Chief Talent Officer in December 2014 upon our acquisition of Telerik. As Chief Talent Officer, Mr. Taslakov is responsible for talent and performance management, recruiting, compensation and benefits and facilities functions. Prior to the acquisition of Telerik, Mr. Taslakov was Chief Talent Officer of Telerik, a position he assumed in January 2014. Prior to that time, from November 2012 until December 2013, he was Telerik’s Chief Revenue Officer. Prior to November 2012, Mr. Taslakov was Vice President of Business Development.
Board of Directors
The following information is provided with respect to the members of our Board of Directors:
John R. Egan
Non-Executive Chairman
Managing Partner
Egan-Managed Capital
Ram Gupta
Former President and Chief Executive Officer
CAST Iron Systems, Inc.
Yogesh Gupta
President and Chief Executive Officer
Progress Software Corporation
Charles F. Kane
Strategic Advisor and Director
One Laptop per Child
David A. Krall
Strategic Advisor and Board of Directors Member
Universal Audio
Michael L. Mark
Director
Progress Software Corporation
Philip M. Pead
Former President and Chief Executive Officer
Progress Software Corporation
Code of Conduct
We have adopted a Code of Conduct that applies to all employees and directors. A copy of the Code of Conduct is publicly available on our website at www.progress.com. If we make any substantive amendments to the Code of Conduct or grant any
87
waiver, including any implicit waiver, from the Code of Conduct to our executive officers or directors, we will disclose the nature of such amendment or waiver in a Current Report on Form 8-K.
Item 11. Executive Compensation
The information required by this Item 11 with respect to director and executive compensation may be found under the headings captioned “Director Compensation,” “Compensation Discussion and Analysis” and “Executive Compensation” in our definitive Proxy Statement for the 2017 Annual Meeting of Shareholders. This information is incorporated herein by reference.
Item 12. Security Ownership of Certain Beneficial Owners and Management and Related Stockholder Matters
The information required by this Item 12 with respect to security ownership and our equity compensation plans may be found under the headings captioned “Information About Progress Software Common Stock Ownership” and “Equity Compensation Plan Information” in our definitive Proxy Statement for the 2017 Annual Meeting of Shareholders. This information is incorporated herein by reference.
Information related to securities authorized for issuance under equity compensation plans as of November 30, 2016 is as follows (in thousands, except per share data):
Plan Category | Number of Securities to be Issued Upon Exercise of Outstanding Options, Warrants and Rights | Weighted-average Exercise Price of Outstanding Options, Warrants and Rights | Number of Securities Remaining Available For Future Issuance | ||||||||
Equity compensation plans approved by shareholders (1) | 1,846 | (2) | $ | 21.57 | 5,556 | (3) | |||||
Equity compensation plans not approved by shareholders (4) | 154 | 28.40 | 1,471 | ||||||||
Total | 2,000 | $ | 24.10 | 7,027 | |||||||
(1) | Consists of the 1992 Incentive and Nonqualified Stock Option Plan, 1994 Stock Incentive Plan, 1997 Stock Incentive Plan, 2008 Stock Option and Incentive Plan and 1991 Employee Stock Purchase Plan (ESPP). |
(2) | Includes 1,583,000 restricted stock units under our 2008 Plan. Does not include purchase rights accruing under the ESPP because the purchase price (and therefore the number of shares to be purchased) will not be determined until the end of the purchase period. |
(3) | Includes 1,035,000 shares available for future issuance under the ESPP. |
(4) | Consists of the 2002 Nonqualified Stock Plan and the 2004 Inducement Plan described below. |
We have adopted two equity compensation plans, the 2002 Nonqualified Stock Plan (2002 Plan) and the 2004 Inducement Stock Plan (2004 Plan), for which the approval of shareholders was not required. We intend that the 2004 Plan be reserved for persons to whom we may issue securities as an inducement to become employed by us pursuant to the rules and regulations of NASDAQ. Executive officers and members of the Board of Directors are not eligible for awards under the 2002 Plan. An executive officer would be eligible to receive an award under the 2004 Plan only as an inducement to join us. Awards under the 2002 Plan and the 2004 Plan may include nonqualified stock options, grants of conditioned stock, unrestricted grants of stock, grants of stock contingent upon the attainment of performance goals and stock appreciation rights. A total of 11,250,000 shares are issuable under the two plans, of which, 1,471,389 shares are available for future issuance.
Item 13. Certain Relationships and Related Transactions, and Director Independence
The information required by this Item 13 may be found under the headings “Independence,” “Review of Transactions with Related Persons” and “Transactions with Related Persons” in our definitive Proxy Statement for the 2017 Annual Meeting of Shareholders. This information is incorporated herein by reference.
Item 14. Principal Accounting Fees and Services
The information required by this Item 14 may be found under the heading “Information About Our Independent Registered Public Accounting Firm” in our definitive Proxy Statement for the 2017 Annual Meeting of Shareholders. This information is incorporated herein by reference.
88
PART IV
Item 15. Exhibits, Financial Statement Schedules
(a) Documents Filed as Part of this Annual Report on Form 10-K
1. Financial Statements (included in Item 8 of this Annual Report on Form 10-K):
• | Report of Independent Registered Public Accounting Firm |
• | Consolidated Balance Sheets as of November 30, 2016 and 2015 |
• | Consolidated Statements of Operations for the years ended November 30, 2016, 2015 and 2014 |
• | Consolidated Statements of Comprehensive Loss for the years ended November 30, 2016, 2015 and 2014 |
• | Consolidated Statements of Shareholders’ Equity for the years ended November 30, 2016, 2015 and 2014 |
• | Consolidated Statements of Cash Flows for the years ended November 30, 2016, 2015 and 2014 |
• | Notes to Consolidated Financial Statements |
2. Financial Statement Schedules
Financial statement schedules are omitted as they are either not required or the information is otherwise included in the consolidated financial statements.
(b) Exhibits
Documents listed below, except for documents followed by parenthetical numbers, are being filed as exhibits. Documents followed by parenthetical numbers are not being filed herewith and, pursuant to Rule 12b-32 of the General Rules and Regulations promulgated by the SEC under the Securities Exchange Act of 1934 (the Act), reference is made to such documents as previously filed as exhibits with the SEC. Our file number under the Act is 0-19417.
89
2.1 | Securities Purchase Agreement, dated October 21, 2014, by and among Progress Software Corporation, Telerik AD, the Sellers identified therein, and the Securityholder Representative (1) |
2.2 | Plan of Domestication (2) |
3.1 | Certificate of Conversion from Non-Delaware Corporation to Delaware Corporation (3) |
3.2 | Certificate of Incorporation (4) |
3.2.1 | Certificate of Correction to Certification of Incorporation (4) |
3.3 | Amended and Restated By-Laws (5) |
4.1 | Specimen certificate for the Common Stock (6) |
10.1* | 1992 Incentive and Nonqualified Stock Option Plan (7) |
10.2* | 1994 Stock Incentive Plan (8) |
10.3* | 1997 Stock Incentive Plan, as amended and restated (9) |
10.4* | Employee Retention and Motivation Agreement as amended and restated, executed by each of the Executive Officers (other than the Chief Executive Officer) (10) |
10.5* | 2002 Nonqualified Stock Plan, as amended and restated (11) |
10.6* | 2004 Inducement Stock Plan, as amended and restated (12) |
10.7* | Progress Software Corporation 1991 Employee Stock Purchase Plan, as amended and restated (13) |
10.8* | Progress Software Corporation 2008 Stock Option and Incentive Plan, as amended and restated (14) |
10.9* | Form of Notice of Grant of Stock Options and Grant Agreement under the Progress Software Corporation 2008 Stock Option and Incentive Plan (15) |
10.10* | Progress Software Corporation Corporate Executive Bonus Plan (16) |
10.11* | Progress Software Corporation 2016 Fiscal Year Non-Employee Directors Compensation Program (17) |
10.12* | Form of Deferred Stock Unit Agreement under the Progress Software Corporation 2008 Stock Option and Incentive Plan (18) |
10.13* | Form of Non-Qualified Stock Option Agreement for Non-Employee Directors under the Progress Software Corporation 2008 Stock Option and Incentive Plan (Initial Grant) (19) |
10.14* | Form of Non-Qualified Stock Option Agreement for Non-Employee Directors under the Progress Software Corporation 2008 Stock Option and Incentive Plan (Annual Grant) (20) |
10.15* | Form of Restricted Stock Unit Agreement under the Progress Software Corporation 2008 Stock Option and Incentive Plan (21) |
10.16* | Credit Agreement, dated as of December 2, 2014, by and among Progress Software Corporation, each of the lenders party thereto, JPMorgan Chase Bank, N.A., as Administrative Agent, Wells Fargo Bank, N.A. and Citizens Bank, N.A., as Syndication Agents, and Bank of America, N.A., Citibank, N.A. and Silicon Valley Bank, as Documentation Agents, and J.P. Morgan Securities LLC, as Sole Bookrunner and Sole Lead Arranger (22) |
10.17* | Employment Agreement, dated October 10, 2016, by and between Progress Software Corporation and Yogesh Gupta (23) |
10.18* | Employee Retention and Motivation Agreement, dated as of October 10, 2016, by and between Progress Software Corporation and Yogesh Gupta (24) |
10.19* | Employment Agreement, dated September 28, 2016, by and between Progress Software Corporation and Kurt Abkemeier (25) |
21.1 | List of Subsidiaries of the Registrant |
23.1 | Consent of Deloitte & Touche LLP, Independent Registered Public Accounting Firm |
31.1 | Certification Pursuant to Section 302 of the Sarbanes-Oxley Act of 2002 - Yogesh Gupta |
31.2 | Certification Pursuant to Section 302 of the Sarbanes-Oxley Act of 2002 - Kurt Abkemeier |
32.1 | Certification Pursuant to Section 906 of the Sarbanes-Oxley Act of 2002 |
101** | The following materials from Progress Software Corporation’s Annual Report on Form 10-K for the year ended November 30, 2013, formatted in XBRL (eXtensible Business Reporting Language): (i) Consolidated Balance Sheets as of November 30, 2013 and 2012, (ii) Consolidated Statements of Income for the years ended November 30, 2013, 2012 and 2011, (iii) Consolidated Statements of Comprehensive Income for the years ended November 30, 2013, 2012 and 2011, (iv) Consolidated Statements of Shareholders’ Equity for the years ended November 30, 2013, 2012 and 2011, and (v) Consolidated Statements of Cash Flows for the years ended November 30, 2013, 2012 and 2011. |
(1) | Incorporated by reference to Exhibit 2.1 of our Current Report on Form 8-K filed on October 27, 2014. |
(2) | Incorporated by reference to Exhibit 2.1 of our Current Report on Form 8-K filed on May 14, 2015. |
90
(3) | Incorporated by reference to Exhibit 3.1 of our Current Report on Form 8-K filed on May 14, 2015. |
(4) | Incorporated by reference to Exhibit 3.2 of our Current Report on Form 8-K filed on May 14, 2015. |
(5) | Incorporated by reference to Exhibit 3.4 of our Current Report on Form 8-K filed on May 14, 2015. |
(6) | Incorporated by reference to Exhibit 4.1 of our Annual Report on Form 10-K for the year ended November 30, 2011. |
(7) | Incorporated by reference to Exhibit 10.1 of our Annual Report on Form 10-K for the year ended November 30, 2009. |
(8) | Incorporated by reference to Exhibit 10.2 of our Annual Report on Form 10-K for the year ended November 30, 2009. |
(9) | Incorporated by reference to Exhibit 10.3 of our Annual Report on Form 10-K for the year ended November 30, 2012. |
(10) | Incorporated by reference to Exhibit 10.4 of our Annual Report on Form 10-K for the year ended November 30, 2013. |
(11) | Incorporated by reference to Exhibit 10.5 of our Annual Report on Form 10-K for the year ended November 30, 2015. |
(12) | Incorporated by reference to Exhibit 10.6 of our Annual Report on Form 10-K for the year ended November 30, 2015. |
(13) | Incorporated by reference to Annex A to our definitive Proxy Statement filed April 15, 2016. |
(14) | Incorporated by reference to Annex A to our definitive Proxy Statement filed May 7, 2013. |
(15) | Incorporated by reference to Exhibit 10.9 of our Annual Report on Form 10-K for the year ended November 30, 2013. |
(16) | Incorporated by reference to Exhibit 10.10 of our Annual Report on Form 10-K for the year ended November 30, 2012. |
(17) | Incorporated by reference to Exhibit 10.1 of our Quarterly Report on Form 10-Q for the quarter ended February 29, 2016. |
(18) | Incorporated by reference to Exhibit 10.12 of our Annual Report on Form 10-K for the year ended November 30, 2013. |
(19) | Incorporated by reference to Exhibit 10.13 of our Annual Report on Form 10-K for the year ended November 30, 2013. |
(20) | Incorporated by reference to Exhibit 10.14 of our Annual Report on Form 10-K for the year ended November 30, 2013. |
(21) | Incorporated by reference to Exhibit 10.15 of our Annual Report on Form 10-K for the year ended November 30, 2014. |
(22) | Incorporated by reference to Exhibit 10.1 to our Current Report on Form 8-K filed December 5, 2014. |
(23) | Incorporated by reference to Exhibit 10.1 to Form 8-K filed on October 14, 2016. |
(24) | Incorporate by reference to Exhibit 10.2 to Form 8-K filed on October 14, 2016. |
(25) | Incorporated by reference to Exhibit 10.1 to Form 8-K filed on October 4, 2016. |
* | Management contract or compensatory plan or arrangement in which an executive officer or director of Progress Software Corporation participates. |
** | Pursuant to Rule 406T of Regulations S-T, the Interactive Data Files on Exhibit 101 hereto are deemed not filed or part of a registration statement or prospectus of Sections 11 or 12 of the Securities Act of 1933, as amended, are deemed not filed for purposes of Section 18 of the Securities and Exchange Act of 1934, as amended, and otherwise are not subject to liability under those sections. |
(c) Financial Statement Schedules
All schedules are omitted because they are not applicable or the required information is shown on the financial statements or notes hereto.
91
SIGNATURES
Pursuant to the requirements of Section 13 or 15(d) of the Securities Exchange Act of 1934, the registrant has duly caused this report to be signed on its behalf by the undersigned, thereunto duly authorized, on the 30th day of January, 2017.
PROGRESS SOFTWARE CORPORATION | |
By: | /s/ YOGESH K. GUPTA |
Yogesh K. Gupta | |
President and Chief Executive Officer | |
Pursuant to the requirements of the Securities Exchange Act of 1934, this report has been signed below by the following persons on behalf of the registrant and in the capacities and on the dates indicated.
Signature | Title | Date | ||
/s/ YOGESH K. GUPTA | President and Chief Executive Officer | January 30, 2017 | ||
Yogesh K. Gupta | (Principal Executive Officer) | |||
/s/ KURT J. ABKEMEIER | Chief Financial Officer | January 30, 2017 | ||
Kurt J. Abkemeier | (Principal Financial Officer) | |||
/s/ PAUL A. JALBERT | Vice President, Corporate Controller and Chief | January 30, 2017 | ||
Paul A. Jalbert | Accounting Officer | |||
(Principal Accounting Officer) | ||||
/s/ JOHN R. EGAN | Non-Executive Chairman | January 30, 2017 | ||
John R. Egan | ||||
/s/ RAM GUPTA | Director | January 30, 2017 | ||
Ram Gupta | ||||
/s/ CHARLES F. KANE | Director | January 30, 2017 | ||
Charles F. Kane | ||||
/s/ DAVID A. KRALL | Director | January 30, 2017 | ||
David A. Krall | ||||
/s/ MICHAEL L. MARK | Director | January 30, 2017 | ||
Michael L. Mark | ||||
/s/ PHILIP M. PEAD | Director | January 30, 2017 | ||
Philip M. Pead | ||||
92