UNITED STATES SECURITIES AND EXCHANGE COMMISSION
Washington, D.C. 20549
Form 10-K
ANNUAL REPORT PURSUANT TO SECTION 13 OR 15(d) OF THE SECURITIES EXCHANGE ACT OF 1934 | |
For the fiscal year ended December 31, 2019
or
TRANSITION REPORT PURSUANT TO SECTION 13 OR 15(d) OF THE SECURITIES EXCHANGE ACT OF 1934 | |
Commission file number: 0-19311

(Exact name of registrant as specified in its charter)
(State or other jurisdiction of incorporation or organization) | (I.R.S. Employer Identification No.) | |
(617 ) 679-2000
(Address, including zip code, and telephone number, including area code, of Registrant’s principal executive offices)
Securities registered pursuant to Section 12(b) of the Act:
Title of Each Class | Trading Symbol(s) | Name of Each Exchange Where Registered | |||
The | |||||
Securities registered pursuant to Section 12(g) of the Act:
None
Indicate by check mark if the registrant is a well-known seasoned issuer, as defined in Rule 405 of the Securities Act. Yes x No o
Indicate by check mark if the registrant is not required to file reports pursuant to Section 13 or Section 15(d) of the Act. Yes o No x
Indicate by check mark whether the registrant (1) has filed all reports required to be filed by Section 13 or 15(d) of the Securities Exchange Act of 1934 during the preceding 12 months (or for such shorter period that the registrant was required to file such reports), and (2) has been subject to such filing requirements for the past 90 days. Yes x No o
Indicate by check mark whether the registrant has submitted electronically every Interactive Data File required to be submitted pursuant to Rule 405 of Regulation S-T (§ 232.405 of this chapter) during the preceding 12 months (or for such shorter period that the registrant was required to submit such files). Yes x No o
Indicate by check mark whether the registrant is a large accelerated filer, an accelerated filer, a non-accelerated filer, a smaller reporting company, or an emerging growth company. See the definitions of “large accelerated filer,” “accelerated filer,” “smaller reporting company” and "emerging growth company" in Rule 12b-2 of the Exchange Act.
x | Accelerated filer | ☐ | ||
Non-accelerated filer | ☐ | Smaller reporting company | ||
Emerging growth company | ||||
If an emerging growth company, indicate by check mark if the registrant has elected not to use the extended transition period for complying with any new or revised financial accounting standards provided pursuant to Section 13(a) of the Exchange Act. o
Indicate by check mark whether the registrant is a shell company (as defined in Rule 12b-2 of the Act). Yes ☐ No x
The aggregate market value of the registrant’s common stock held by non-affiliates of the registrant (without admitting that any person whose shares are not included in such calculation is an affiliate) computed by reference to the price at which the common stock was last sold as of the last business day of the registrant’s most recently completed second fiscal quarter was $43,010,112,437 .
As of February 4, 2020, the registrant had 174,064,011 shares of common stock, $0.0005 par value, outstanding.
DOCUMENTS INCORPORATED BY REFERENCE
Portions of the definitive proxy statement for our 2020 Annual Meeting of Stockholders are incorporated by reference into Part III of this report.
BIOGEN INC.
ANNUAL REPORT ON FORM 10-K
For the Year Ended December 31, 2019
TABLE OF CONTENTS
Page | ||
NOTE REGARDING FORWARD-LOOKING STATEMENTS
This report contains forward-looking statements that are being made pursuant to the provisions of the Private Securities Litigation Reform Act of 1995 (the Act) with the intention of obtaining the benefits of the “Safe Harbor” provisions of the Act. These forward-looking statements may be accompanied by such words as “aim,” “anticipate,” “believe,” “could,” “estimate,” “expect,” “forecast,” "goal," “intend,” “may,” “plan,” “potential,” “possible,” “will,” “would” and other words and terms of similar meaning. Reference is made in particular to forward-looking statements regarding:
• | the anticipated amount, timing and accounting of revenues; contingent, milestone, royalty and other payments under licensing, collaboration, acquisition or divestiture agreements; tax positions and contingencies; collectability of receivables; pre-approval inventory; cost of sales; research and development costs; compensation and other selling, general and administrative expenses; amortization of intangible assets; foreign currency exchange risk; estimated fair value of assets and liabilities; and impairment assessments; |
• | expectations, plans and prospects relating to sales, pricing, growth and launch of our marketed and pipeline products; |
• | the timing, outcome and impact of administrative, regulatory, legal and other proceedings related to our patents and other proprietary and intellectual property rights, tax audits, assessments and settlements, pricing matters, sales and promotional practices, product liability and other matters; |
• | patent terms, patent term extensions, patent office actions and expected availability and period of regulatory exclusivity; |
• | the potential impact of increased product competition in the markets in which we compete, including increased competition from generics, biosimilars, prodrugs and products approved under abbreviated regulatory pathways; |
• | our plans and investments in our core and emerging growth areas, as well as implementation of our corporate strategy; |
• | the drivers for growing our business, including our plans and intention to commit resources relating to research and development programs and business development opportunities, as well as the potential benefits and results of, and the anticipated timing to complete, certain business development transactions; |
• | our ability to finance our operations and business initiatives and obtain funding for such activities; |
• | the costs and timing of potential clinical trials, filings and approvals, and the potential therapeutic scope of the development and commercialization of our and our collaborators’ pipeline products; |
• | adverse safety events involving our marketed products, generic or biosimilar versions of our marketed products or any other products from the same class as one of our products; |
• | the potential impact of healthcare reform in the United States (U.S.) and measures being taken worldwide designed to reduce healthcare costs and limit the overall level of government expenditures, including the impact of pricing actions and reduced reimbursement for our products; |
• | our manufacturing capacity, use of third-party contract manufacturing organizations, plans and timing relating to changes in our manufacturing capabilities and activities in new or existing manufacturing facilities; |
• | the impact of the continued uncertainty of the credit and economic conditions in certain countries in Europe and our collection of accounts receivable in such countries; |
• | the potential impact on our results of operations and liquidity of the United Kingdom's (U.K.) departure from the European Union (E.U.); |
• | lease commitments, purchase obligations and the timing and satisfaction of other contractual obligations; and |
• | the impact of new laws, including the Swiss Federal Act on Tax Reform and AHV Financing, regulatory requirements, judicial decisions and accounting standards. |
These forward-looking statements involve risks and uncertainties, including those that are described in Item 1A. Risk Factors included in this report and elsewhere in this report, that could cause actual results to differ materially from those reflected in such statements. You should not place undue reliance on these statements. Forward-looking statements speak only as of the date of this report. Except as required by law, we do not undertake any obligation to publicly update any forward-looking statements, whether as a result of new information, future developments or otherwise.
NOTE REGARDING COMPANY AND PRODUCT REFERENCES
References in this report to:
•“Biogen,” the “company,” “we,” “us” and “our” refer to Biogen Inc. and its consolidated subsidiaries;
• | “RITUXAN” refers to both RITUXAN (the trade name for rituximab in the U.S., Canada and Japan) and MabThera (the trade name for rituximab outside the U.S., Canada and Japan); and |
• | "ELOCTATE" refers to both ELOCTATE (the trade name for Antihemophilic Factor (recombinant), Fc Fusion Protein in the U.S., Canada and Japan) and ELOCTA (the trade name for Antihemophilic Factor (recombinant), Fc Fusion Protein in the E.U.). |
NOTE REGARDING TRADEMARKS
AVONEX®, PLEGRIDY®, RITUXAN®, RITUXAN HYCELA®, SPINRAZA®, TECFIDERA®, TYSABRI®, VUMERITY® and ZINBRYTA® are registered trademarks of Biogen.
BENEPALITM, FLIXABITM, FUMADERMTM and IMRALDITM are trademarks of Biogen.
ALPROLIX®, ELOCTATE®, ENBREL®, EYLEA®, FAMPYRATM, GAZYVA®, HUMIRA®, LUCENTIS®, OCREVUS®, REMICADE®, SkySTARTM and other trademarks referenced in this report are the property of their respective owners.
PART I
Item 1. Business
Overview
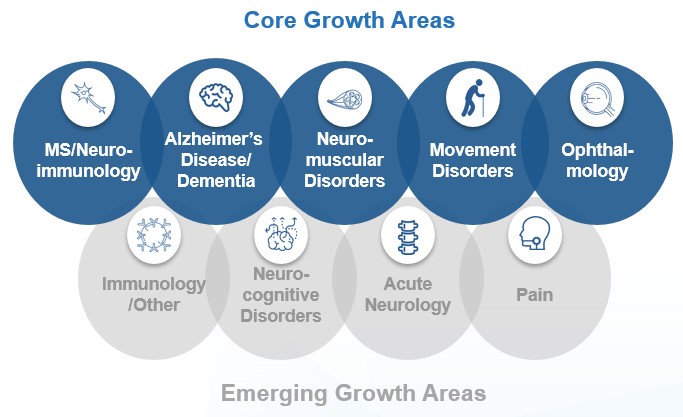
Biogen is a global biopharmaceutical company focused on discovering, developing and delivering worldwide innovative therapies for people living with serious neurological and neurodegenerative diseases as well as related therapeutic adjacencies. Our core growth areas include multiple sclerosis (MS) and neuroimmunology; Alzheimer’s disease (AD) and dementia; neuromuscular disorders, including spinal muscular atrophy (SMA) and amyotrophic lateral sclerosis (ALS); movement disorders, including Parkinson's disease; and ophthalmology. We are also focused on discovering, developing and delivering worldwide innovative therapies in our emerging growth areas of immunology; neurocognitive disorders; acute neurology; and pain. In addition, we commercialize biosimilars of advanced biologics. We support our drug discovery and development efforts through the commitment of significant resources to discovery, research and development programs and business development opportunities.
Our marketed products include TECFIDERA, AVONEX, PLEGRIDY, TYSABRI, VUMERITY and FAMPYRA for the treatment of MS; SPINRAZA for the treatment of SMA; and FUMADERM for the treatment of severe plaque psoriasis. We also have certain business and financial rights with respect to RITUXAN for the treatment of non-Hodgkin's lymphoma, chronic lymphocytic leukemia (CLL) and other conditions; RITUXAN HYCELA for the treatment of non-Hodgkin's lymphoma and CLL; GAZYVA for the treatment of CLL and follicular lymphoma; OCREVUS for the treatment of primary progressive MS (PPMS) and relapsing MS (RMS); and other potential anti-CD20 therapies pursuant to our collaboration arrangements with Genentech, Inc. (Genentech), a wholly-owned member of the Roche Group. For additional information on our collaboration arrangements with Genentech, please read Note 18, Collaborative and Other Relationships, to our consolidated financial statements included in this report.
For over two decades we have led in the research and development of new therapies to treat MS, resulting in our leading portfolio of MS treatments. Now our research is focused on additional improvements in the treatment of MS, such as the development of next generation therapies for MS, with a goal to reverse or possibly repair damage caused by the disease. We also introduced the first approved treatment for SMA and are continuing to pursue research and development for potential advancements in the treatment of SMA, including a muscle enhancement program, novel antisense oligonucleotide (ASO) drug candidates and an oral splicing modulator. We are also applying our scientific expertise to solve some of the most challenging and complex diseases, including AD, ALS, Parkinson's disease, choroideremia (CHM), X-linked retinitis pigmentosa (XLRP), systemic lupus erythematosus (SLE), cutaneous lupus erythematosus (CLE), cognitive impairment associated with schizophrenia (CIAS), stroke, epilepsy and pain.
Our innovative drug development and commercialization activities are complemented by our biosimilar business that expands access to medicines and reduce the cost burden for healthcare systems. Through Samsung Bioepis Co., Ltd. (Samsung Bioepis), our joint venture with Samsung BioLogics Co., Ltd. (Samsung BioLogics), we market and sell BENEPALI, an etanercept biosimilar referencing ENBREL, IMRALDI, an adalimumab biosimilar referencing HUMIRA, and FLIXABI, an infliximab biosimilar referencing REMICADE, in certain countries in Europe and have exclusive rights to commercialize these products in China. Additionally, we have exclusive rights to commercialize two potential ophthalmology biosimilar products, SB11 referencing LUCENTIS and SB15 referencing EYLEA, in major markets worldwide, including the U.S., Canada, Europe, Japan and Australia. For additional information on our collaboration arrangements with Samsung Bioepis, please read Note 18, Collaborative and Other Relationships, to our consolidated financial statements included in this report.
1
Key Business Developments
The following is a summary of key developments affecting our business since the beginning of 2019.
For additional information on our acquisitions, collaborative and other relationships discussed below, please read Note 2, Acquisitions, Note 3, Divestitures, Note 18, Collaborative and Other Relationships, and Note 19, Investments in Variable Interest Entities, to our consolidated financial statements included in this report.
Acquisitions, Collaborative and Other Relationships
Skyhawk Therapeutics, Inc.
In January 2019 we entered into a collaboration and research and development services agreement with Skyhawk Therapeutics, Inc. (Skyhawk) pursuant to which the companies are leveraging Skyhawk's SkySTAR technology platform with the goal of discovering innovative small molecule treatments for patients with neurological diseases, including MS and SMA. We are responsible for the development and potential commercialization of any therapies resulting from this collaboration. In October 2019 we amended this agreement to add an additional discovery program.
Nightstar Therapeutics plc
In June 2019 we completed our acquisition of all of the outstanding shares of Nightstar Therapeutics plc (NST), a clinical-stage gene therapy company focused on adeno-associated virus (AAV) treatments for inherited retinal disorders. As a result of this acquisition, we added two mid- to late-stage clinical assets, as well as preclinical programs, in ophthalmology.
Divestiture of Hillerød, Denmark Manufacturing Operations
In August 2019 we completed the sale of all of the outstanding shares of our subsidiary that owned our biologics manufacturing operations in Hillerød, Denmark to FUJIFILM Corporation (FUJIFILM).
Samsung Bioepis
In December 2019 we completed a transaction with Samsung Bioepis and secured the exclusive rights to commercialize two potential ophthalmology biosimilar products, SB11 referencing LUCENTIS and SB15 referencing EYLEA, in major markets worldwide, including the U.S., Canada, Europe, Japan and Australia. We also acquired an option to extend our existing commercial agreement with Samsung Bioepis for BENEPALI, IMRALDI and FLIXABI in Europe and obtained exclusive rights to commercialize these products in China.
BIIB080 Option Exercise
In December 2019 we exercised our option with Ionis Pharmaceuticals, Inc. (Ionis) and obtained a worldwide, exclusive, royalty-bearing license to develop and commercialize BIIB080 (tau ASO), an investigational treatment for AD.
Pfizer Inc.
In January 2020 we entered into an agreement to acquire PF-05251749, a novel CNS-penetrant small molecule inhibitor of casein kinase 1 (CK1), for the potential treatment of patients with behavioral and neurological symptoms across various psychiatric and neurological diseases from Pfizer Inc. (Pfizer). In particular, we plan to develop the Phase 1 asset for the treatment of sundowning in AD and irregular sleep wake rhythm disorder (ISWRD) in Parkinson’s disease. This transaction is subject to customary closing conditions, including the expiration of the applicable waiting period under the Hart-Scott-Rodino Antitrust Improvements Act of 1976 in the U.S. We expect this transaction to close in the first quarter of 2020.
Other Key Developments
VUMERITY
In October 2019 the U.S. Food and Drug Administration (FDA) approved VUMERITY for the treatment of RMS. The FDA approval of VUMERITY was based on a New Drug Application (NDA) submitted under the 505(b)(2) filing pathway. It included interim exposure and safety findings from EVOLVE-MS-1, an ongoing, Phase 3, single-arm, open label, two-year safety study evaluating VUMERITY in patients with relapsing remitting MS (RRMS), and data from pharmacokinetic bridging studies comparing VUMERITY and TECFIDERA to establish bioequivalence, and relied, in part, on the FDA's findings of safety and efficacy for TECFIDERA. In November 2019 VUMERITY became available in the U.S.
2
Aducanumab (Aβ mAb)
In October 2019 we and our collaboration partner Eisai Co., Ltd. (Eisai) announced that we plan to pursue regulatory approval for aducanumab, our anti-amyloid beta antibody candidate for the potential treatment of AD, in the U.S.
2019 Share Repurchase Programs
In March 2019 our Board of Directors authorized a program to repurchase up to $5.0 billion of our common stock (March 2019 Share Repurchase Program). Our March 2019 Share Repurchase Program does not have an expiration date. All share repurchases under our March 2019 Share Repurchase Program will be retired.
In December 2019 our Board of Directors authorized a program to repurchase up to $5.0 billion of our common stock (December 2019 Share Repurchase Program). Our December 2019 Share Repurchase Program does not have an expiration date. All share repurchases under our December 2019 Share Repurchase Program will be retired.
Board of Directors Update
In June 2019 stockholders elected two new independent directors, William A. Hawkins and Jesus B. Mantas, to Biogen's Board of Directors, who are each serving for a one-year term until the 2020 annual meeting of stockholders and their successors are duly elected and qualified.
Management Changes
During 2019 we announced the following management changes:
• | The appointment of Alfred Sandrock, Jr., M.D., Ph.D. as Executive Vice President, Research and Development; and |
• | The appointment of Alphonse Galdes, Ph.D., as Executive Vice President, Pharmaceutical Operations and Technology. |
For additional information on these and our other executive officers, please read the subsection entitled "Information about our Executive Officers" included in this report.
Product and Pipeline Developments
Core Growth Areas
Multiple Sclerosis and Neuroimmunology
TECFIDERA (dimethyl fumarate)
• | In May 2019, at the 71st annual meeting of the American Academy of Neurology (AAN) in Philadelphia, PA, we presented re-analyzed pooled images from the Phase 3 DEFINE and CONFIRM studies that showed that treatment with TECFIDERA significantly slowed the rate of whole brain volume loss by 35.9% during the second year of treatment compared to placebo. |
• | In September 2019, at the 35th Congress of the European Committee for Treatment and Research in MS (ECTRIMS) and 24th Annual Conference of Rehabilitation in MS in Stockholm, Sweden, we presented new 10-year results from the ongoing Phase 3 ENDORSE extension study and comparative effectiveness analyses of TECFIDERA that support the consistent, long-term benefits of treatment with TECFIDERA. |
TYSABRI (natalizumab)
• | In January 2019 the first patient was enrolled in the global Phase 3b NOVA study evaluating the efficacy and safety of extended interval dosing (EID; every six weeks) for natalizumab compared to standard interval dosing in patients with RMS. |
• | In May 2019, at the 71st annual meeting of the AAN in Philadelphia, PA, we presented updated safety analyses from the TOUCH database safety analysis evaluating EID of natalizumab (of approximately every six weeks) compared to every four-week dosing based on the TOUCH prescribing program database. |
• | In September 2019, at the 35th Congress of ECTRIMS and 24th Annual Conference of Rehabilitation in MS in Stockholm, Sweden, we presented new data from the observational, open-label, single-arm STRIVE study that support the real-world long-term effectiveness of TYSABRI in patients with early RMS, who are within three years from diagnosis and are anti-JC virus antibody negative. |
3
AVONEX (interferon beta-1a) and PLEGRIDY (peginterferon beta-1a)
• | In September 2019, at the 35th Congress of ECTRIMS and 24th Annual Conference of Rehabilitation in MS in Stockholm, Sweden, we presented new data from two real-world observational studies that provide further support that exposure to interferon beta treatment, including AVONEX and PLEGRIDY, before conception and/or during pregnancy is not expected to have an adverse effect on pregnancy or infant growth outcomes. |
• | In October 2019 the European Medicines Agency (EMA) updated the summaries of product characteristics for AVONEX and PLEGRIDY to remove pregnancy contraindications and, where clinically needed, to allow use during pregnancy and breastfeeding in women with RMS. |
VUMERITY (diroximel fumarate; DRF)
• | In May 2019, at the 71st annual meeting of the AAN in Philadelphia, PA, we presented updated safety and exploratory efficacy results from the ongoing open-label EVOLVE-MS-1 study of VUMERITY in RMS. |
• | In May 2019 we presented new interim data from the EVOLVE-MS-1 study at the annual meeting of the Consortium of Multiple Sclerosis Centers in Seattle, WA. These data indicated that VUMERITY was generally well tolerated and significantly reduced disease activity in newly diagnosed RMS patients and those previously treated with interferons or glatiramer acetate. Treatment discontinuations due to gastrointestinal events occurred at a low rate over one year. |
• | In July 2019 we and Alkermes plc announced positive topline results from EVOLVE-MS-2, a large, randomized, double-blind, five-week, Phase 3 study of VUMERITY for RMS, compared to TECFIDERA. VUMERITY was statistically superior to TECFIDERA on the study's pre-specified primary endpoint, with patients treated with VUMERITY self-reporting significantly fewer days of key gastrointestinal symptoms with intensity scores ≥ 2 on the Individual Gastrointestinal Symptom and Impact Scale, as compared to TECFIDERA (p=0.0003). |
• | In September 2019, at the 35th Congress of ECTRIMS and 24th Annual Conference of Rehabilitation in MS in Stockholm, Sweden, we presented interim data from the Phase 3 EVOLVE-MS-1 study that support the potential of VUMERITY as a novel oral fumarate. |
• | In November 2019, at the 27th Annual Meeting of the European Charcot Foundation in Italy, we presented results from the Phase 3 EVOLVE-MS-2 study demonstrating the improved patient-assessed gastrointestinal tolerability of VUMERITY compared to TECFIDERA. |
BIIB091 (BTK inhibitor)
• | In May 2019 the first participant was dosed in the Phase 1 study of BIIB091 in MS. |
• | In December 2019 dosing began for the final multiple ascending dose cohort in the Phase 1 study of BIIB091 in MS. |
Alzheimer's Disease and Dementia
Aducanumab (Aβ mAb)
• | In March 2019 we and our collaboration partner Eisai announced the decision to discontinue the global Phase 3 trials, ENGAGE and EMERGE, designed to evaluate the efficacy and safety of aducanumab in patients with mild cognitive impairment due to AD and mild AD dementia. |
• | In October 2019 we and our collaboration partner Eisai announced that we plan to pursue regulatory approval for aducanumab in the U.S. and that the Phase 3 EMERGE study met its primary endpoint showing a significant reduction in clinical decline. We believe that results from a subset of patients in the Phase 3 ENGAGE study who received sufficient exposure to high dose aducanumab support the findings from EMERGE. The decision to file is based on a new analysis, conducted in consultation with the FDA, of a larger dataset from the Phase 3 EMERGE and ENGAGE trials that were discontinued in March 2019 following a futility analysis. |
• | In December 2019, at the 12th Clinical Trials on Alzheimer's Disease annual meeting in San Diego, CA, we presented topline results from the Phase 3 EMERGE and ENGAGE trials of aducanumab. |
4
BAN2401 (Aβ mAb)
• | In May 2019 our collaboration partner Eisai dosed the first patient in the global Phase 3 study (Clarity AD) of BAN2401 in early AD. |
BIIB092 (gosuranemab)
• | In September 2019 we completed enrollment of the Phase 2 study of gosuranemab for early AD. |
Neuromuscular Disorders
SPINRAZA (nusinersen)
• | In February 2019 SPINRAZA was approved by the China National Medical Products Association for the treatment of 5q SMA. |
• | In April 2019 we presented new data illustrating the rapidly progressive nature of SMA in adults, adolescents and older children. We also presented data from the NURTURE study, highlighting the benefits of pre-symptomatic treatment and findings on the role of neurofilament as a potential biomarker for predicting motor function in SMA. These data were presented at the Muscular Dystrophy Association Clinical and Scientific Conference in Orlando, FL. |
• | In April 2019 data from CS2/CS12, an open-label study of the safety and tolerability of SPINRAZA in individuals with later-onset SMA, were published in the peer-reviewed journal Neurology, the medical journal of the AAN. The data showed that individuals with later-onset SMA, treated with SPINRAZA, regained motor function that had been previously lost and that treatment stabilized their disease activity leading to improvements in activities of daily living. |
• | In May 2019, at the 71st annual meeting of the AAN in Philadelphia, PA, we presented data from the NURTURE study that demonstrated that pre-symptomatic infants with SMA treated with SPINRAZA over three years achieved motor milestones that are more consistent with normal childhood development, as well as interim results from the ENDEAR/CHERISH/SHINE open-label extension study that showed that treatment with SPINRAZA, particularly when initiated earlier, leads to progressive motor milestone improvements and increased survival rates for individuals with infantile-onset SMA. |
• | In May 2019 The National Institute for Health and Care Excellence (NICE) in the U.K. recommended funding for SPINRAZA on the National Health Service. The positive recommendation is for the treatment of infants, children and adults with 5q SMA, including pre-symptomatic and symptomatic SMA Types 1, 2 and 3. |
• | In June and July 2019 we presented new results from the NURTURE study, adding data to the longest study of SMA in pre-symptomatic infants (n=25). The data reported, after up to 45.1 months of analysis, continued to demonstrate efficacy and safety in patients treated pre-symptomatically with SPINRAZA in comparison to the natural history of SMA. These new data also showed that patients treated with SPINRAZA had continuous improvement, with the majority of patients achieving motor milestones within timeframes consistent with normal development. These data were presented at the Cure SMA Annual SMA Conference in Anaheim, CA and the 5th Congress of the European Academy of Neurology in Oslo, Norway. |
• | In September 2019 we announced that we plan to initiate DEVOTE, a new Phase 2/3 study evaluating whether a higher dose of SPINRAZA can offer even greater efficacy in treating SMA, as well as the safety and tolerability of SPINRAZA, when administered at a higher dose. |
• | In September 2019 we presented new data further demonstrating the safety and efficacy of treatment with SPINRAZA in individuals with later-onset SMA at the 13th Congress of the European Paediatric Neurology Society in Athens, Greece. An integrated analysis from SHINE, an open-label extension study for patients with SMA who participated in prior SPINRAZA studies, found that children with later-onset SMA (Type 2 or Type 3) experienced improvements or stabilization in one or more measures of motor function for up to nearly six years, in contrast to the expected decline observed in natural history cohorts. |
• | In October 2019 the journal Neuromuscular Disorders published data from NURTURE, the first study investigating a treatment targeting the underlying cause of SMA in infants treated pre-symptomatically. Data from the NURTURE study demonstrated that infants who initiated treatment with SPINRAZA prior to the onset of clinical symptoms attained unparalleled results compared to the natural history of the disease. These published results from the NURTURE study were previously presented at the 2019 Cure SMA Annual |
5
SMA Conference in Anaheim, CA and the 5th Congress of the European Academy of Neurology in Oslo, Norway.
BIIB067 (tofersen) - ALS
• | In March 2019 the first patient was dosed in the Phase 3 VALOR study of tofersen in adults with ALS with a confirmed superdioxide dismutate 1 (SOD1) mutation. |
• | In May 2019 we presented interim results of the Phase 1/2 study of tofersen. The data demonstrated a statistically significant reduction in SOD1 protein levels and a numerical trend towards slowing of clinical decline in SOD1-ALS patients treated with tofersen compared to placebo. The data were presented at the 71st annual meeting of the AAN in Philadelphia, PA and The European Network for the Cure of ALS meeting in Tours, France. |
BIIB100 (XPO1 inhibitor) - ALS
• | In June 2019 the first patient was dosed in the Phase 1 study of BIIB100 in sporadic ALS. |
Movement Disorders
BIIB054 (cinpanemab) - Parkinson's Disease
• | In May 2019 we completed enrollment of the Phase 2 study of BIIB054 for Parkinson's disease. |
BIIB094 (ION859) - Parkinson's Disease
• | In August 2019 the first patient in the Phase 1 study of BIIB094, an ASO targeting leucine-rich repeat kinase 2 (LRRK2) for Parkinson's disease, was dosed. |
Ophthalmology
BIIB111 (timrepigene emparvovec) - CHM
• | In November 2019 we completed enrollment of the Phase 3 STAR study of timrepigene emparvovec for CHM. |
Emerging Growth Areas
Immunology
Dapirolizumab Pegol (anti-CD40L) - SLE
• | In June 2019 our collaboration partner UCB presented interim results from the Phase 2b study of dapirolizumab pegol (DZP) in patients with active SLE despite standard-of-care treatment. The primary endpoint of the study, which was to demonstrate a dose response at 24 weeks on the British Isles Lupus Assessment Group-based Composite Lupus Assessment (p=0.07), was not met. The study did demonstrate consistent and potentially meaningful improvements for the majority of clinical endpoints in patients treated with DZP compared with placebo. In addition, biomarker data demonstrated evidence of proof of biology. DZP was well tolerated and demonstrated an acceptable safety profile. The data were presented at the European Congress of Rheumatology (EULAR) 2019 in Madrid, Spain. |
BIIB059 (anti-BDCA2) - CLE/SLE
• | In May 2019 we completed enrollment of the Phase 2 LILAC study of BIIB059 for CLE and SLE. |
• | In December 2019 we announced positive top-line results from the Phase 2 LILAC study evaluating the efficacy and safety of BIIB059 in CLE and SLE. The CLE part of the study met its primary endpoint (p<0.001) by demonstrating a dose response of BIIB059 on the percent change from baseline in the Cutaneous Lupus Erythematosus Disease Area and Severity Index Activity (CLASI-A) score at week 16 in individuals with CLE. Study participants with CLE treated with 50 mg, 150 mg and 450 mg of BIIB059 experienced reductions in CLASI-A scores of 40.9% (p=0.008), 48.0% (p=0.001) and 42.5% (p=0.001), respectively, versus 14.5% with placebo. CLASI-A is a well-defined and reliable outcome measure that has been shown to detect meaningful change in CLE skin disease activity. |
The SLE part of the study also met its primary endpoint of reducing disease activity in individuals with SLE as measured by change from baseline in total active joint count at week 24 (treatment difference = -3.4 for BIIB059 450 mg versus placebo, p=0.037). Total active joint count is the total number of tender or swollen
6
joints, with joint involvement being a common symptom in people with SLE. In addition, improvements in skin disease and overall disease activity were consistently observed across multiple secondary endpoints.
Neurocognitive Disorders
BIIB104 (AMPA) - CIAS
• | In June 2019 the FDA granted BIIB104 fast track designation for CIAS. |
Acute Neurology
BIIB093 (glibenclamide IV) - Brain Contusion
• | In October 2019 we dosed the first patient in the Phase 2 study of BIIB093 for brain contusion. |
Biosimilars
Samsung Bioepis - Biogen's Joint Venture with Samsung BioLogics
• | In June 2019 we presented real-world evidence confirming the safety and efficacy of BENEPALI, IMRALDI and FLIXABI and the high adherence of patients to treatment. The data were presented at EULAR 2019 in Madrid, Spain. |
• | In October 2019 we presented new data highlighting real-world evidence confirming the safety and efficacy of IMRALDI and FLIXABI for patients with inflammatory bowel disease. These data were presented at the United European Gastroenterology Week 2019 in Barcelona, Spain. |
Genentech Relationship
Anti-CD20 Therapies
GAZYVA (obinutuzumab)
• | In June 2019 Roche announced positive topline results for NOBILITY, a Phase 2 study investigating the safety and efficacy of GAZYVA for adults with proliferative lupus nephritis. The study met its primary endpoint, showing GAZYVA, in combination with standard of care (mycophenolate mofetil or mycophenolic acid and corticosteroids), demonstrated enhanced efficacy compared to placebo plus standard of care alone in achieving complete renal response at one year. In addition, GAZYVA met key secondary endpoints showing improved overall renal responses (complete and partial renal response) and serologic markers of disease activity as compared to placebo. |
• | In September 2019 Roche announced that the FDA granted breakthrough therapy designation to GAZYVA for adults with lupus nephritis. This designation was granted based on data from the Phase 2 NOBILITY study in adult patients with proliferative lupus nephritis, as discussed above. |
Discontinued Programs
• | In August 2019 we discontinued the Phase 2b study of BG00011 (STX-100) for the potential treatment of idiopathic pulmonary fibrosis (IPF) due to safety concerns. |
• | In September 2019 we and our collaboration partner Eisai announced the decision to discontinue the global Phase 3 studies (MISSION AD1 and MISSION AD2) of the investigational oral BACE (beta amyloid cleaving enzyme) inhibitor elenbecestat (development code: E2609) in patients with early AD. |
• | In December 2019 we announced that the Phase 2 PASSPORT study investigating gosuranemab in individuals with progressive supranuclear palsy (PSP) did not meet its primary endpoint. Based on these results, we discontinued development of gosuranemab in PSP and other primary tauopathies. Safety results of the Phase 2 PASSPORT study were generally consistent with previous studies of gosuranemab. We will continue our ongoing Phase 2 TANGO study of gosuranemab for mild cognitive impairment due to AD or mild AD, given differences in disease pathology. |
7
Marketed Products
The following graph shows our revenues by product and revenues from anti-CD20 therapeutic programs for the years ended December 31, 2019, 2018 and 2017.
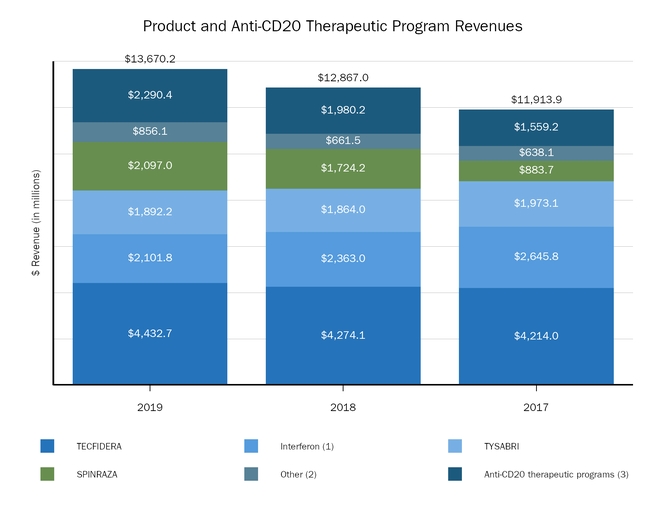
(1) | Interferon includes product revenues from AVONEX and PLEGRIDY. |
(2) | For 2019, 2018 and 2017 other includes product revenues from FAMPYRA, FUMADERM, BENEPALI and FLIXABI. For 2019 and 2018 other also includes product revenues from IMRALDI, which was launched in Europe in October 2018. For 2019 other also includes product revenues from VUMERITY, which was available in the U.S. in November 2019. For 2018 and 2017 other also includes product revenues from ZINBRYTA, which was voluntary withdrawn from the market in March 2018. For 2017 other also includes product revenues from ALPROLIX and ELOCTATE through January 31, 2017. No product revenues for ALPROLIX and ELOCTATE were recognized subsequent to February 1, 2017, the effective date of the spin-off of our hemophilia business. |
(3) | Anti-CD20 therapeutic programs include revenues from RITUXAN, RITUXAN HYCELA, GAZYVA and OCREVUS. |
Product sales for TECFIDERA, AVONEX and TYSABRI as well as our share of pre-tax profits in the U.S. for RITUXAN each accounted for more than 10% of our total revenues for the years ended December 31, 2019, 2018 and 2017. Product sales for SPINRAZA also accounted for more than 10% of our total revenues for the years ended December 31, 2019 and 2018. For additional financial information about our product and other revenues and geographic areas where we operate, please read Note 4, Revenues, and Note 24, Segment Information, to our consolidated financial statements included in this report and Item 6. Selected Financial Data and Item 7. Management's Discussion and Analysis of Financial Condition and Results of Operations included in this report. A discussion of the risks attendant to our operations is set forth in Item 1A. Risk Factors included in this report.
8
Multiple Sclerosis and Neuroimmunology
We develop, manufacture and market a number of products designed to treat patients with MS. MS is a progressive neurological disease in which the body loses the ability to transmit messages along nerve cells, leading to a loss of muscle control, paralysis and, in some cases, death. Patients with active RMS experience an uneven pattern of disease progression characterized by periods of stability that are interrupted by flare-ups of the disease after which the patient returns to a new baseline of functioning.
Our MS products and major markets are as follows:
Product | Indication | Collaborator | Major Markets | |||
 | RMS in the U.S. RRMS in the E.U. | None | U.S. France Germany Italy Japan Spain U.K. | |||
 | RMS | None | U.S. France Germany Italy Japan Spain | |||
 | RMS in the U.S. RRMS in the E.U. | None | U.S. France Germany Italy Spain U.K. | |||
 | RMS RRMS in the E.U. Crohn's disease in the U.S. | None | U.S. France Germany Italy Spain U.K. | |||
 | RMS in the U.S. | Alkermes Pharma Ireland Limited, a subsidiary of Alkermes plc (Alkermes) | U.S. | |||
 | Walking ability for patients with MS | Acorda Therapeutics, Inc. (Acorda) | France Germany | |||
Neuromuscular Disorders
SMA is characterized by loss of motor neurons in the spinal cord and lower brain stem, resulting in severe and progressive muscular atrophy and weakness. Ultimately, individuals with the most severe type of SMA can become paralyzed and have difficulty performing the basic functions of life, like breathing and swallowing. Due to a deletion or mutations in the SMN1 gene, people with SMA do not produce enough survival motor neuron (SMN) protein, which is critical to the survival of the neurons that control muscles. The severity of SMA correlates with the amount of SMN protein. People with Type 1 SMA, the most severe life-threatening form, produce very little SMN protein and do not achieve the ability to sit without support, and typically do not live beyond two years of age without respiratory support and nutritional interventions. People with Type 2 and Type 3 SMA produce greater amounts of SMN protein and have less severe, but still life-altering, forms of SMA.
9
Our SMA product and major markets are as follows:
Product | Indication | Collaborator | Major Markets | |||
 | SMA | Ionis | U.S. Brazil Canada France Germany Italy Japan Spain Turkey | |||
For additional information on our collaboration arrangements with Ionis, please read Note 18, Collaborative and Other Relationships, to our consolidated financial statements included in this report.
Biosimilars
Biosimilars are a group of biologic medicines that are similar to currently available biologic therapies known as originators. Under our agreement with Samsung Bioepis, we commercialize three anti-tumor necrosis factor (TNF) biosimilars in certain countries in Europe: BENEPALI, an etanercept biosimilar referencing ENBREL, IMRALDI, an adalimumab biosimilar referencing HUMIRA, and FLIXABI, an infliximab biosimilar referencing REMICADE. Additionally, we have exclusive rights to commercialize BENEPALI, IMRALDI and FLIXABI in China and two potential ophthalmology biosimilar products, SB11 referencing LUCENTIS and SB15 referencing EYLEA, in major markets worldwide, including the U.S., Canada, Europe, Japan and Australia.
Our current biosimilar products and major markets are as follows:
Product | Indication | Major Markets | ||
 | Rheumatoid arthritis Juvenile idiopathic arthritis Psoriatic arthritis Axial spondyloarthritis Plaque psoriasis Paediatric plaque psoriasis | France Germany Italy Spain U.K. | ||
 | Rheumatoid arthritis Juvenile idiopathic arthritis Axial spondyloarthritis Psoriatic arthritis Psoriasis Paediatric plaque psoriasis Hidradenitis suppurativa Adolescent hidradenitis suppurativa Crohn’s disease Paediatric Crohn's disease Ulcerative colitis Uveitis Paediatric Uveitis | France Germany U.K. | ||
 | Rheumatoid arthritis Crohn’s disease Paediatric Crohn’s disease Ulcerative colitis Paediatric ulcerative colitis Ankylosing spondylitis Psoriatic arthritis Psoriasis | France Germany Italy | ||
For additional information on our collaboration arrangements with Samsung Bioepis, please read Note 18, Collaborative and Other Relationships, to our consolidated financial statements included in this report.
10
Genentech Relationships
We have agreements with Genentech that entitle us to certain business and financial rights with respect to RITUXAN, RITUXAN HYCELA, GAZYVA, OCREVUS and other potential anti-CD20 therapies.
Our current anti-CD20 therapeutic programs and major markets are as follows:
Product | Indication | Major Markets | ||
 | Non-Hodgkin's lymphoma CLL Rheumatoid arthritis Two forms of ANCA-associated vasculitis Pemphigus vulgaris | U.S. Canada | ||
 | Non-Hodgkin's lymphoma CLL | U.S. | ||
 | In combination with chlorambucil for previously untreated CLL Follicular lymphoma In combination with chemotherapy followed by GAZYVA alone for previously untreated follicular lymphoma | U.S. | ||
 | RMS PPMS | U.S. Australia Germany Switzerland | ||
For additional information on our collaboration arrangements with Genentech, please read Note 1, Summary of Significant Accounting Policies, and Note 18, Collaborative and Other Relationships, to our consolidated financial statements included in this report.
Other
Product | Indication | Collaborator | Major Markets | |||
 | Moderate to severe plaque psoriasis | None | Germany | |||
11
Patient Support and Access
We interact with patients, advocacy organizations and healthcare societies in order to gain insights into unmet needs. The insights gained from these engagements help us support patients with services, programs and applications that are designed to help patients lead better lives. Among other things, we provide customer service and other related programs for our products, such as disease and product specific websites, insurance research services, financial assistance programs and the facilitation of the procurement of our marketed products.
We are dedicated to helping patients obtain access to our therapies. Our patient representatives have access to a suite of financial assistance tools. With those tools, we help patients understand their insurance coverage and, if needed, help patients compare and select new insurance options and programs. In the U.S., we have established programs that provide co-pay assistance or free marketed product for qualified uninsured or underinsured patients, based on specific eligibility criteria. We also provide charitable contributions to independent charitable organizations that assist patients with out-of-pocket expenses associated with their therapy.
Marketing and Distribution
Sales Force and Marketing
We promote our products worldwide, including in the U.S., most of the major countries of the E.U. and Japan, primarily through our own sales forces and marketing groups. In some countries, particularly in areas where we continue to expand into new geographic areas, we partner with third parties.
We and Eisai co-promote AVONEX, TYSABRI and TECFIDERA in Japan in certain settings.
RITUXAN, RITUXAN HYCELA, GAZYVA and OCREVUS are marketed by the Roche Group and its sublicensees.
We commercialize BENEPALI, IMRALDI and FLIXABI in collaboration with Samsung Bioepis in certain countries in Europe.
We focus our sales and marketing efforts on specialist physicians in private practice or at major medical centers. We use customary industry practices to market our products and to educate physicians, such as sales representatives calling on individual physicians, advertisements, professional symposia, direct mail, public relations and other methods.
Distribution Arrangements
We distribute our products in the U.S. principally through wholesale distributors of pharmaceutical products, mail order specialty distributors or shipping service providers. In other countries, the distribution of our products varies from country to country, including through wholesale distributors of pharmaceutical products and third-party distribution partners who are responsible for most marketing and distribution activities.
Eisai distributes AVONEX, TYSABRI, TECFIDERA and PLEGRIDY in India and other Asia-Pacific markets, excluding China.
RITUXAN, RITUXAN HYCELA, GAZYVA and OCREVUS are distributed by the Roche Group and its sublicensees.
We distribute BENEPALI, IMRALDI and FLIXABI in certain countries in Europe and have exclusive rights to distribute these products in China.
Our product sales to two wholesale distributors, AmerisourceBergen and McKesson, each accounted for more than 10% of our total revenues for the years ended December 31, 2019, 2018 and 2017, and on a combined basis, accounted for approximately 47%, 50% and 56% of our gross product revenues for the years ended December 31, 2019, 2018 and 2017, respectively. For additional information, please read Note 4, Revenues, to our consolidated financial statements included in this report.
Patents and Other Proprietary Rights
Patents are important to obtaining and protecting exclusive rights in our products and product candidates. We regularly seek patent protection in the U.S. and in selected countries outside the U.S. for inventions originating from our research and development efforts. In addition, we license rights to various patents and patent applications.
U.S. patents, as well as most foreign patents, are generally effective for 20 years from the date the earliest application was filed; however, U.S. patents that issue on applications filed before June 8, 1995, may be effective until 17 years from the issue date, if that is later than the 20-year date. In some cases, the patent term may be extended to recapture a portion of the term lost during regulatory review of the claimed therapeutic or, in the case of the U.S., because of U.S. Patent and Trademark Office (USPTO) delays in prosecuting the application. Specifically, in the U.S., under the Drug Price Competition and Patent Term Restoration Act of 1984, commonly known as the Hatch-Waxman Act, a patent that covers a drug approved by the FDA may be eligible for patent term extension (for up to 5 years, but not beyond a total of
12
14 years from the date of product approval) as compensation for patent term lost during the FDA regulatory review process. The duration and extension of the term of foreign patents varies, in accordance with local law. For example, supplementary protection certificates (SPCs) on some of our products have been granted in a number of European countries, compensating in part for delays in obtaining marketing approval.
Regulatory exclusivity, which may consist of regulatory data protection and market protection, also can provide meaningful protection for our products. Regulatory data protection provides to the holder of a drug or biologic marketing authorization, for a set period of time, the exclusive use of the proprietary pre-clinical and clinical data that it created at significant cost and submitted to the applicable regulatory authority to obtain approval of its product. After the applicable set period of time, third parties are then permitted to rely upon such data to file for approval of their abbreviated applications for, and to market (subject to any applicable market protection), their generic drugs and biosimilars referencing such data. Market protection provides to the holder of a drug or biologic marketing authorization the exclusive right to commercialize its product for a set period of time, thereby preventing the commercialization of another product containing the same active ingredient(s) during that period. Although the World Trade Organization's agreement on trade-related aspects of intellectual property rights (TRIPS) requires signatory countries to provide regulatory exclusivity to innovative pharmaceutical products, implementation and enforcement varies widely from country to country.
We also rely upon other forms of unpatented confidential information to remain competitive. We protect such information principally through
confidentiality agreements with our employees, consultants, outside scientific collaborators, scientists whose research we sponsor and other advisers. In the case of our employees, these agreements also provide, in compliance with relevant law, that inventions and other intellectual property conceived by such employees during their employment shall be our exclusive property.
Our trademarks are important to us and are generally covered by trademark applications or registrations in the USPTO and the patent or trademark offices of other countries. We also use trademarks licensed from third parties, such as the trademark FAMPYRA, which we license from Acorda. Trademark protection varies in accordance with local law, and continues in some countries as long as the trademark is used and in other countries as long as the trademark is registered. Trademark registrations generally are for fixed but renewable terms.
Our Patent Portfolio
The following table describes our patents in the U.S. and Europe that we currently consider of primary importance to our marketed products, including the territory, patent number, general subject matter and expected expiration dates. Except as otherwise noted, the expected expiration dates include any granted patent term extensions and issued SPCs. In some instances, there are later-expiring patents relating to our products directed to, among other things, particular forms or compositions, methods of manufacturing or use of the drug in the treatment of particular diseases or conditions. We also continue to pursue additional patents and patent term extensions in the U.S. and other territories covering various aspects of our products that may, if issued, extend exclusivity beyond the expiration of the patents listed in the table.
13
Product | Territory | Patent No. | General Subject Matter | Patent Expiration(1) | ||||
TECFIDERA | U.S. | 7,619,001 | Methods of treatment | 2020 | ||||
U.S. | 8,399,514 | Methods of treatment | 2028(2) | |||||
Europe | 1131065 | Formulations of dialkyl fumarates and their use for treating autoimmune diseases | 2024(3) | |||||
Europe | 2137537 | Methods of use | 2028(4) | |||||
AVONEX and PLEGRIDY | U.S. | 7,588,755 | Use of recombinant beta interferon for immunomodulation | 2026 | ||||
PLEGRIDY | U.S. | 7,446,173 | Polymer conjugates of interferon beta-1a | 2022 | ||||
U.S. | 8,524,660 | Methods of treatment | 2023 | |||||
U.S. | 8,017,733 | Polymer conjugates of interferon beta-1a | 2027 | |||||
Europe | 1656952 | Polymer conjugates of interferon-beta-1a and uses thereof | 2024(5) | |||||
Europe | 1476181 | Polymer conjugates of interferon-beta-1a and uses thereof | 2023(6) | |||||
TYSABRI | U.S. | 6,602,503 | Humanized recombinant antibodies; nucleic acids and host cells; processes for production; therapeutic compositions; methods of use | 2020 | ||||
U.S. | 7,807,167 | Methods of treatment | 2023 | |||||
U.S. | 9,493,567 | Methods of treatment | 2027 | |||||
Europe | 0804237 | Humanized immunoglobulins; nucleic acids; pharmaceutical compositions; medical uses | 2020(7) | |||||
Europe | 1485127 | Methods of use | 2023 | |||||
Europe | 2676967 | Methods of use | 2027 | |||||
FAMPYRA | Europe | 1732548 | Sustained-release aminopyridine compositions for increasing walking speed in patients with MS | 2025(8) | ||||
Europe | 2377536 | Sustained-release aminopyridine compositions for treating MS | 2025(9) | |||||
VUMERITY | U.S. | 8,669,281 | Compounds and pharmaceutical compositions | 2033 | ||||
U.S. | 9,090,558 | Methods of treatment | 2033 | |||||
U.S. | 10,080,733 | Crystalline forms, pharmaceutical compositions and methods of treatment | 2033 | |||||
SPINRAZA | U.S. | 7,101,993 | Oligonucleotides containing 2’-O-modified purines | 2023 | ||||
U.S. | 7,838,657 | SMA treatment via targeting of SMN2 splice site inhibitory sequences | 2027 | |||||
U.S. | 8,110,560 | SMA treatment via targeting of SMN2 splice site inhibitory sequences | 2025 | |||||
U.S. | 8,361,977 | Compositions and methods for modulation of SMN2 splicing | 2030 | |||||
U.S. | 8,980,853 | Compositions and methods for modulation of SMN2 splicing | 2030 | |||||
U.S. | 9,717,750 | Compositions and methods for modulation of SMN2 splicing | 2030 | |||||
U.S. | 9,926,559 | Compositions and methods for modulation of SMN2 splicing | 2034 | |||||
U.S. | 10,266,822 | SMA treatment via targeting of SMN2 splice site inhibitory sequences | 2025 | |||||
U.S. | 10,436,802 | Methods for Treating Spinal Muscular Atrophy | 2035 | |||||
Europe | 1910395 | Compositions and methods for modulation of SMN2 splicing | 2026(10) | |||||
Europe | 2548560 | Compositions and methods for modulation of SMN2 splicing | 2026(11) | |||||
Europe | 3305302 | Compositions and methods for modulation of SMN2 splicing | 2030 | |||||
Europe | 3308788 | Compositions and methods for modulation of SMN2 splicing | 2026 | |||||
Footnotes follow on next page.
14
(1) | In addition to patent protection, certain of our products are entitled to regulatory exclusivity in the U.S. and the E.U. expected until the dates set forth below: |
Product | Territory | Expected Expiration | ||
TECFIDERA | E.U. | 2024 | ||
PLEGRIDY | U.S. | 2026 | ||
E.U. | 2024 | |||
FAMPYRA | E.U. | 2021 | ||
SPINRAZA | U.S. | 2023 | ||
E.U. | 2029 | |||
(2) | For additional information, please read Note 20, Litigation, to our consolidated financial statements included in this report. |
(3) | This patent is subject to granted SPCs in certain European countries, which extended the patent term in those countries to 2024. |
(4) | This patent was revoked in a European opposition. This decision is being appealed. This patent is subject to granted SPCs in certain European countries, which extended the patent term in those countries to 2029. |
(5) | This patent is subject to granted SPCs in certain European countries, which extended the patent term in those countries to 2024. |
(6) | This patent is subject to granted SPCs in certain European countries, which extended the patent term in those countries to 2028. |
(7) | Reflects SPCs granted in most European countries and pediatric extension in some countries. |
(8) | This patent is subject to granted SPCs in certain European countries, which extended the patent term in those countries to 2026. |
(9) | This patent is subject to granted SPCs in certain European countries, which extended the patent term in those countries to 2026. |
(10) | This patent is subject to granted SPCs in certain European countries, which extended the patent term in those countries to 2031. |
(11) | This patent is subject to granted SPCs in certain European countries, which extended the patent term in those countries to 2031. |
The existence of patents does not guarantee our right to practice the patented technology or commercialize the patented product. Patents relating to pharmaceutical, biopharmaceutical and biotechnology products, compounds and processes, such as those that cover our existing products, compounds and processes and those that we will likely file in the future, do not always provide complete or adequate protection. Litigation, interferences, oppositions, inter partes reviews, administrative challenges or other similar types of proceedings are, have been and may in the future be necessary in some instances to determine the validity and scope of certain of our patents, regulatory exclusivities or other proprietary rights, and in other instances to determine the validity, scope or non-infringement of certain patent rights claimed by third parties to be pertinent to the manufacture, use or sale of our products. We also face challenges to our patents, regulatory exclusivities or other proprietary rights covering our products by manufacturers of generics, biosimilars, prodrugs and products approved under abbreviated regulatory pathways. A discussion of certain risks and uncertainties that may affect our patent position, regulatory exclusivities or other proprietary rights is set forth in Item 1A. Risk Factors included in this report, and a discussion of legal proceedings related to certain patents described above is set forth in Note 20, Litigation, to our consolidated financial statements included in this report.
15
Competition
Competition in the biopharmaceutical industry is intense and comes from many sources, including biotechnology and pharmaceutical companies. Many of our competitors, certain of whom have substantially greater financial, marketing, research and development and other resources than we do, are working to develop or have commercialized products similar to or competitive with those we market or are developing and have considerable experience in undertaking clinical trials and in obtaining regulatory approval to market pharmaceutical products. In addition, the commercialization of certain of our own approved products, products of our collaborators and pipeline product candidates may negatively impact future sales of our existing products.
We believe that competition and leadership in the industry is based on managerial and technological excellence and innovation as well as establishing patent and other proprietary positions through research and development. The achievement of a leadership position also depends largely upon our ability to maximize the approval, acceptance and use of products resulting from research and the availability of adequate financial resources to fund facilities, equipment, personnel, clinical testing, manufacturing and marketing. Another key aspect of remaining competitive within the industry is recruiting and retaining leading scientists and technicians. We believe that we have been successful in attracting and retaining skilled and experienced scientific personnel.
Competition among products approved for sale may be based, among other things, on patent position, product efficacy, safety, convenience/delivery devices, reliability, availability and price. In addition, early entry of a new pharmaceutical product into the market may have important advantages in gaining product acceptance and market share. Accordingly, the relative speed with which we can develop products, complete the testing and approval process and supply commercial quantities of products will have a significant impact on our competitive position.
The introduction of new products or technologies, including the development of new processes or technologies by competitors or new information about existing products or technologies, results in increased competition for our marketed products and pricing pressure on our marketed products. The development of new or improved treatment options or standards of care or cures for the diseases our products treat reduces and could eliminate the use of our products or may limit the utility and application of ongoing clinical trials for our product candidates.
We also face increased competitive pressures from the introduction of generic versions, prodrugs and biosimilars of existing products as well as products approved under abbreviated regulatory pathways. Such products are likely to be sold at substantially lower prices than branded products, which may significantly reduce both the price that we are able to charge for our products and the volume of products we sell. In addition, when a generic version of one of our products is commercialized, it may, in some cases, be automatically substituted for our product and reduce our revenues in a short period of time.
Additional information about the competition that our marketed products face is set forth below.
Multiple Sclerosis
TECFIDERA, AVONEX, PLEGRIDY, TYSABRI and VUMERITY each compete with one or more of the following products as well as generic and biosimilar versions of such products:
Competing Product | Competitor | |
AUBAGIO (teriflunomide) | Sanofi Genzyme | |
BETASERON/BETAFERON (interferon-beta-1b) | Bayer Group | |
COPAXONE (glatiramer acetate) | Teva Pharmaceuticals Industries Ltd. | |
EXTAVIA (interferon-beta-1b) | Novartis AG | |
GILENYA (fingolimod) | Novartis AG | |
GLATOPA (glatiramer acetate) | Sandoz, a division of Novartis AG | |
LEMTRADA (alemtuzumab) | Sanofi Genzyme | |
MAVENCLAD (cladribine) | EMD Serono | |
MAYZENT (siponimod) | Novartis AG | |
OCREVUS (ocrelizumab) | Genentech | |
REBIF (interferon-beta-1) | EMD Serono | |
FAMPYRA is indicated as a treatment to improve walking in adult patients with MS who have a walking disability and is the first treatment that addresses this unmet medical need with demonstrated efficacy in people with all types of MS. FAMPYRA is currently the only therapy approved to improve walking in patients with MS.
Competition in the MS market is intense. Along with us, a number of companies are working to develop additional treatments for MS that may in the future compete with our MS products. One such product that was approved in the U.S. in 2017 and in the E.U. in 2018 is OCREVUS, a treatment for RMS and PPMS that was developed by Genentech. While we have a financial interest in OCREVUS, future sales of our MS products may be adversely affected if
16
OCREVUS continues to gain market share, or if other MS products that we or our competitors are developing are commercialized. Future sales may also be negatively impacted by the introduction of generics, prodrugs of existing therapies, biosimilars of existing products or products approved under abbreviated regulatory pathways.
Spinal Muscular Atrophy
We face competition from a new gene therapy product that was approved in the U.S. in May 2019 for the treatment of SMA. Additionally, we are aware of other products in development that, if successfully developed and approved, may compete with SPINRAZA in the SMA market, including potential oral products. Future sales of SPINRAZA may be adversely affected by the commercialization of competing products.
Psoriasis
FUMADERM competes with several different types of therapies in the psoriasis market within Germany, including oral systemics such as methotrexate and cyclosporine.
Biosimilars
BENEPALI, IMRALDI and FLIXABI, the three biosimilar products we currently commercialize in certain countries in Europe for Samsung Bioepis, compete with their reference products, ENBREL, HUMIRA and REMICADE, respectively, as well as other biosimilars of those reference products.
Genentech Relationships in Other Indications
RITUXAN, RITUXAN HYCELA and GAZYVA in Oncology
RITUXAN, RITUXAN HYCELA and GAZYVA compete with a number of therapies in the oncology market, including TREANDA (bendamustine HCL), ARZERRA (ofatumumab), IMBRUVICA (ibrutinib) and ZYDELIG (idelalisib).
We also expect that over time RITUXAN HYCELA and GAZYVA will increasingly compete with RITUXAN in the oncology market. In addition, we are aware of anti-CD20 molecules, including biosimilar products, in development that if successfully developed and approved, could compete with RITUXAN, RITUXAN HYCELA and GAZYVA in the oncology market. The introduction of a biosimilar product can result in a significant reduction in net sales for the relevant product, as other manufacturers typically offer their versions at lower prices. In November 2019 and January 2020 biosimilar products referencing
RITUXAN were launched in the U.S. and this could adversely affect the pre-tax profits of our collaboration arrangements with Genentech, which could, in turn adversely affect our co-promotion profits in the U.S. in future years.
RITUXAN in Rheumatoid Arthritis
RITUXAN competes with several different types of therapies in the rheumatoid arthritis market, including, among others, traditional disease-modifying anti-rheumatic drugs such as steroids, methotrexate and cyclosporine, TNF inhibitors, ORENCIA (abatacept), ACTEMRA (tocilizumab) and XELJANZ (tofacitinib).
We are also aware of other products, including biosimilars, in development that, if approved, may compete with RITUXAN in the rheumatoid arthritis market.
Research and Development Programs
A commitment to research is fundamental to our mission. Our research efforts are focused on better understanding the underlying biology of diseases so we can discover and deliver treatments that have the potential to make a real difference in the lives of patients with high unmet medical needs. By applying our expertise in biologics and our growing capabilities in small molecule, antisense, gene therapy, gene editing and other technologies, we target specific medical needs where we believe new or better treatments are needed.
We intend to continue committing significant resources to targeted research and development opportunities where there is a significant unmet need and where a drug candidate has the potential to be highly differentiated. As part of our ongoing research and development efforts, we have devoted significant resources to conducting clinical studies to advance the development of new pharmaceutical products and technologies and to explore the utility of our existing products in treating disorders beyond those currently approved in their labels.
For additional information on our research and development expense included in our consolidated statements of income, please read Item 7. Management's Discussion and Analysis of Financial Condition and Results of Operations included in this report.
17
The table below highlights our current research and development programs that are in clinical trials and the current phase of such programs. Drug development involves a high degree of risk and investment, and the status, timing and scope of our development programs are subject to change. Important factors that could adversely affect our drug development efforts are discussed in Item 1A. Risk Factors included in this report.
Core Growth Areas | MS and Neuroimmunology | Opicinumab (anti-LINGO) - MS | Phase 2 | |||||
BIIB061 (oral remyelination) - MS | Phase 1 | |||||||
BIIB091 (BTK inhibitor) - MS | Phase 1 | |||||||
Alzheimer's Disease and Dementia | Aducanumab (Aβ mAb)* - Alzheimer's | Phase 3 | ||||||
BAN2401 (Aβ mAb)* - Alzheimer's | Phase 3 | |||||||
BIIB092 (gosuranemab) - Alzheimer's | Phase 2 | |||||||
BIIB076 (anti-tau mAb) - Alzheimer's | Phase 1 | |||||||
BIIB080 (tau ASO) - Alzheimer's | Phase 1 | |||||||
Neuromuscular Disorders, including SMA and ALS | BIIB067 (tofersen) - ALS | Phase 3 | ||||||
BIIB078 (IONIS-C9Rx)# - ALS | Phase 1 | |||||||
BIIB110 (ActRIIA/B ligand trap) - SMA | Phase 1 | |||||||
BIIB100 (XP01 inhibitor) - ALS | Phase 1 | |||||||
Movement Disorders, including Parkinson's Disease | BIIB054 (cinpanemab) - Parkinson's | Phase 2 | ||||||
BIIB094 (ION859)# - Parkinson's | Phase 1 | |||||||
Ophthalmology | BIIB111 (timrepigene emparvovec) - CHM | Phase 3 | ||||||
BIIB112 (RPGR gene therapy) - XLRP | Phase 2/3 | |||||||
Emerging Growth Areas | Immunology / Other | Dapirolizumab pegol (anti-CD40L)* - SLE | Phase 2 | |||||
BIIB059 (anti-BDCA2) - CLE/SLE | Phase 2 | |||||||
Neurocognitive Disorders | BIIB104 (AMPA) - CIAS | Phase 2 | ||||||
Acute Neurology | BIIB093 (glibenclamide IV) - LHI^ Stroke | Phase 3 | ||||||
TMS-007# - Acute Ischemic Stroke | Phase 2 | |||||||
Natalizumab - Epilepsy | Phase 2 | |||||||
BIIB093 (glibenclamide IV) - Brain Contusion | Phase 2 | |||||||
Pain | BIIB074 (vixotrigine) - Trigeminal Neuralgia | Phase 2 | ||||||
BIIB074 (vixotrigine) - Small Fiber Neuropathy | Phase 2 | |||||||
BIIB095 (Nav 1.7) - Neuropathic Pain | Phase 1 | |||||||
Biosimilars | SB11 (referencing LUCENTIS) | Phase 3 | ||||||
* Collaboration program
# Option agreement
^ Large Hemispheric Infarction (LHI)
For information about certain of our agreements with collaborators and other third parties, please read the subsection entitled Business Relationships below and Note 2, Acquisitions, Note 18, Collaborative and Other Relationships, and Note 19, Investments in Variable Interest Entities, to our consolidated financial statements included in this report.
18
Business Relationships
As part of our business strategy, we establish business relationships, including entering into licenses, joint ventures and collaborative arrangements with other companies, universities and medical research institutions, to assist in the clinical development and/or commercialization of certain of our products and product candidates and to provide support for our research programs. We also evaluate opportunities for acquiring products or rights to products and technologies that are complementary to our business from other companies, universities and medical research institutions.
Below is a brief description of certain business relationships and collaborations that expand our pipeline and provide us with certain rights to existing and potential new products and technologies. For additional information on certain of these relationships, including their ongoing financial and accounting impact on our business, please read Note 2, Acquisitions, Note 18, Collaborative and Other Relationships, and Note 19, Investments in Variable Interest Entities, to our consolidated financial statements included in this report.
Acorda Therapeutics, Inc.
We have a collaboration and license agreement with Acorda to develop and commercialize products containing fampridine, such as FAMPYRA, in markets outside the U.S. We are responsible for all regulatory activities and the future clinical development of related products in those markets.
Alkermes
We have an exclusive license and collaboration agreement with Alkermes for VUMERITY, which was approved for the treatment of RMS in the U.S. in October 2019 and became available in the U.S. in November 2019. Under this agreement, we received an exclusive, worldwide license to develop and commercialize VUMERITY.
Bristol-Myers Squibb Company
We have an exclusive license agreement with Bristol-Myers Squibb Company (BMS) for the development and potential commercialization of BIIB092 (gosuranemab), a phase 2 investigational therapy with potential in AD. Under this agreement, we received worldwide rights to gosuranemab and are responsible for the full development and potential commercialization of gosuranemab in AD.
Eisai Co., Ltd.
We have a collaboration agreement with Eisai to jointly develop and commercialize BAN2401, an Eisai product candidate for the potential treatment of AD. Eisai serves as the global operational and regulatory
lead for BAN2401 and all costs, including research, development, sales and marketing expenses, are shared equally between us and Eisai. Upon marketing approval, we and Eisai will co-promote BAN2401 and share profits equally.
We also have a collaboration agreement with Eisai to jointly develop and commercialize aducanumab (the Aducanumab Collaboration Agreement). Under the Aducanumab Collaboration Agreement, the two companies will co-promote aducanumab with a region-based profit split and we lead the ongoing development of aducanumab.
We and Eisai co-promote AVONEX, TYSABRI and TECFIDERA in Japan in certain settings and Eisai distributes AVONEX, TYSABRI, TECFIDERA and PLEGRIDY in India and other Asia-Pacific markets, excluding China.
Genentech, Inc. (Roche Group)
We have collaboration arrangements with Genentech which entitle us to certain business and financial rights with respect to RITUXAN, RITUXAN HYCELA, GAZYVA, OCREVUS and other potential anti-CD20 therapies.
Ionis Pharmaceuticals, Inc.
We have an exclusive, worldwide option and collaboration agreement with Ionis relating to the development and commercialization of antisense therapeutics for up to three gene targets. Under a separate collaboration and license agreement with Ionis, we have an exclusive, worldwide license to develop and commercialize SPINRAZA for the treatment of SMA. We also have a 10-year exclusive collaboration agreement with Ionis to develop novel ASO drug candidates for a broad range of neurological diseases, which we refer to as the 2018 Ionis Agreement.
In addition, we have research collaboration agreements with Ionis under which both companies perform discovery level research and will develop and commercialize new ASO drug candidates for the potential treatment of SMA and additional antisense or other therapeutics for the potential treatment of neurological diseases.
Neurimmune SubOne AG
We have a collaboration and license agreement with Neurimmune SubOne AG (Neurimmune) for the development and commercialization of antibodies for the potential treatment of AD, including aducanumab (as amended, the Neurimmune Agreement). We are responsible for the development, manufacturing and commercialization of all licensed products.
19
Samsung Bioepis Co., Ltd.
We and Samsung BioLogics established a joint venture, Samsung Bioepis, to develop, manufacture and market biosimilar products. We also have an agreement with Samsung Bioepis to commercialize, over a 10-year term, 3 anti-TNF biosimilar product candidates in Europe and, in the case of BENEPALI, Japan. Under this agreement, we are commercializing BENEPALI, an etanercept biosimilar referencing ENBREL, IMRALDI, an adalimumab biosimilar referencing HUMIRA, and FLIXABI, an infliximab biosimilar referencing REMICADE, in certain countries in Europe.
In December 2019 we completed a transaction with Samsung Bioepis and secured the exclusive rights to commercialize two potential ophthalmology biosimilar products, SB11 referencing LUCENTIS and SB15 referencing EYLEA, in major markets worldwide, including the U.S., Canada, Europe, Japan and Australia. We also acquired an option to extend our existing commercial agreement with Samsung Bioepis for BENEPALI, IMRALDI and FLIXABI in Europe and obtained exclusive rights to commercialize these products in China.
In addition to our joint venture and commercialization agreements with Samsung Bioepis, we license certain of our proprietary technology to Samsung Bioepis in connection with Samsung Bioepis' development, manufacture and commercialization of its biosimilar products. We also provide technical development and technology transfer services to Samsung Bioepis.
Skyhawk Therapeutics, Inc.
We have a collaboration and research and development services agreement with Skyhawk pursuant to which the companies are leveraging Skyhawk’s SkySTAR technology platform with the goal of discovering innovative small molecule treatments for patients with neurological diseases, including MS and SMA. We are responsible for the development and potential commercialization of any therapies resulting from this collaboration.
TMS Co., Ltd.
We have an exclusive option agreement with TMS Co., Ltd. (TMS) granting us the option to acquire TMS-007, a plasminogen activator with a novel mechanism of action associated with breaking down blood clots which is in Phase 2 development in Japan, and backup compounds for the treatment of stroke.
Regulatory
Our current and contemplated activities and the products, technologies and processes that result from
such activities are subject to substantial government regulation.
Regulation of Pharmaceuticals
Product Approval and Post-Approval Regulation in the U.S.
APPROVAL PROCESS
Before new pharmaceutical products may be sold in the U.S., preclinical studies and clinical trials of the products must be conducted and the results submitted to the FDA for approval. With limited exceptions, the FDA requires companies to register both pre-approval and post-approval clinical trials and disclose clinical trial results in public databases. Failure to register a trial or disclose study results within the required time periods could result in penalties, including civil monetary penalties. Clinical trial programs must establish efficacy, determine an appropriate dose and dosing regimen and define the conditions for safe use. This is a high-risk process that requires stepwise clinical studies in which the candidate product must successfully meet predetermined endpoints. The results of the preclinical and clinical testing of a product are then submitted to the FDA in the form of a Biologics License Application (BLA) or a NDA. In response to a BLA or NDA, the FDA may grant marketing approval, request additional information or deny the application if it determines the application does not provide an adequate basis for approval.
Product development and receipt of regulatory approval takes a number of years, involves the expenditure of substantial resources and depends on a number of factors, including the severity of the disease in question, the availability of suitable alternative treatments, potential safety signals observed in preclinical or clinical tests and the risks and benefits of the product as demonstrated in clinical trials. The FDA has substantial discretion in the product approval process, and it is impossible to predict with any certainty whether and when the FDA will grant marketing approval. The agency may require the sponsor of a BLA or NDA to conduct additional clinical studies or to provide other scientific or technical information about the product, and these additional requirements may lead to unanticipated delays or expenses. Furthermore, even if a product is approved, the approval may be subject to limitations based on the FDA's interpretation of the existing pre-clinical and/or clinical data.
The FDA has developed four distinct approaches intended to facilitate the development and expedite the regulatory review of therapeutically important drugs, especially when the drugs are the first available treatment or have advantages over existing
20
treatments: accelerated approval, fast track, breakthrough therapy and priority review.
• | Accelerated Approval: The FDA may grant “accelerated approval” to products that treat serious or life-threatening illnesses and that provide meaningful therapeutic benefits to patients over existing treatments. Under this pathway, the FDA may approve a product based on surrogate endpoints or clinical endpoints other than survival or irreversible morbidity. When approval is based on surrogate endpoints or clinical endpoints other than survival or morbidity, the sponsor will be required to provide the FDA with confirmatory data post-approval to verify and describe clinical benefit. Under the FDA's accelerated approval regulations, if the FDA concludes that a drug that has been shown to be effective can be safely used only if distribution or use is restricted, it may require certain post-marketing restrictions to assure safe use. In addition, for products approved under accelerated approval, sponsors may be required to submit all copies of their promotional materials, including advertisements, to the FDA at least 30 days prior to initial dissemination. The FDA may withdraw approval if, for instance, post-marketing studies fail to verify clinical benefit, it becomes clear that restrictions on the distribution of the product are inadequate to ensure its safe use or if a sponsor fails to comply with the conditions of the accelerated approval. |
• | Fast Track: The FDA may grant "fast track" status to products that treat a serious condition and have data demonstrating the potential to address an unmet medical need or a drug that has been designated as a qualified infectious disease product. |
• | Breakthrough Therapy: The FDA may grant “breakthrough therapy” status to drugs designed to treat, alone or in combination with another drug or drugs, a serious or life-threatening disease or condition and for which preliminary clinical evidence suggests a substantial improvement over existing therapies based on a clinically significant endpoint. Breakthrough therapy status entitles the sponsor to earlier and more frequent meetings with the FDA regarding the development of nonclinical and clinical data and permits the FDA to offer product development or regulatory advice for the purpose of shortening the time to product approval. Breakthrough therapy status does not guarantee that a product will be eligible for priority review and does not ensure FDA approval. |
• | Priority Review: “Priority review” only applies to applications (original or efficacy supplement) for a drug that treats a serious condition and, if approved, would provide a significant improvement in safety or effectiveness of the treatment, diagnosis or prevention of a serious condition. Priority review may also be granted for any supplement that proposes a labeling change due to studies completed in response to a written request from the FDA for pediatric studies, for an application for a drug that has been designated as a qualified infectious disease product or for any application or supplement for a drug submitted with a priority review voucher. |
In December 2016 the FDA issued a rare pediatric disease priority review voucher to us in connection with the approval of SPINRAZA.
POST-MARKETING STUDIES
Regardless of the approval pathway employed, the FDA may require a sponsor to conduct additional post-marketing studies as a condition of approval to provide data on safety and effectiveness. If a sponsor fails to conduct the required studies, the FDA may withdraw its approval. In addition, if the FDA concludes that a drug that has been shown to be effective can be safely used only if distribution or use is restricted, it can mandate post-marketing restrictions to assure safe use. In such a case, the sponsor may be required to establish rigorous systems to assure use of the product under safe conditions. These systems are usually referred to as Risk Evaluation and Mitigation Strategies (REMS). The FDA can impose financial penalties for failing to comply with certain post-marketing commitments, including REMS. In addition, any changes to an approved REMS must be reviewed and approved by the FDA prior to implementation.
ADVERSE EVENT REPORTING
We monitor information on side effects and adverse events reported during clinical studies and after marketing approval and report such information and events to regulatory agencies. Non-compliance with the FDA's safety reporting requirements may result in civil or criminal penalties. Side effects or adverse events that are reported during clinical trials can delay, impede or prevent marketing approval. Based on new safety information that emerges after approval, the FDA can mandate product labeling changes, impose a new REMS or the addition of elements to an existing REMS, require new post-marketing studies (including additional clinical trials) or suspend or withdraw approval of the product. These requirements may affect our ability to maintain marketing approval of our products or require us to
21
make significant expenditures to obtain or maintain such approvals.
APPROVAL OF CHANGES TO AN APPROVED PRODUCT
If we seek to make certain types of changes to an approved product, such as adding a new indication, making certain manufacturing changes or changing manufacturers or suppliers of certain ingredients or components, the FDA will need to review and approve such changes in advance. In the case of a new indication, we are required to demonstrate with additional clinical data that the product is safe and effective for a use other than what was initially approved. FDA regulatory review may result in denial or modification of the planned changes, or requirements to conduct additional tests or evaluations that can substantially delay or increase the cost of the planned changes.
REGULATION OF PRODUCT ADVERTISING AND PROMOTION
The FDA regulates all advertising and promotion activities and communications for products under its jurisdiction both before and after approval. Pursuant to FDA guidance, a company can make safety and efficacy claims from data either in or consistent with the label. However, physicians may prescribe legally available drugs for uses that are not described in the drug's labeling. Such off-label prescribing is common across medical specialties, and often reflect a physician's belief that the off-label use is the best treatment for patients. The FDA does not regulate the behavior of physicians in their choice of treatments, but FDA regulations do impose stringent restrictions on manufacturers' communications regarding off-label uses. Failure to comply with applicable FDA requirements may subject a company to adverse publicity, enforcement action by the FDA, corrective advertising and the full range of civil and criminal penalties available to the government.
Regulation of Combination Products
Combination products are defined by the FDA to include products comprising two or more regulated components (e.g., a biologic and a device). Biologics and devices each have their own regulatory requirements, and combination products may have additional requirements. Some of our marketed products meet this definition and are regulated under this framework and similar regulations outside the U.S., and we expect that some of our pipeline product candidates may be evaluated for regulatory approval under this framework as well.
In May 2017 new regulations governing medical devices (MDR) and in-vitro diagnostic medical devices (IVDR) entered into force in the E.U. although these
are not expected to fully apply until May 2020 with respect to the MDR regulations and May 2022 with respect to the IVDR regulations. All products covered by these regulations will be required to comply with them at the end of the transitional periods. These regulations introduce new requirements, including for clinical investigation of certain classifications of medical devices, require increased regulatory scrutiny, enhance the requirements for post market surveillance and vigilance and provide for greater transparency. These regulations also change the requirements for assessment of the medical device components of integral drug-device combination products, necessitating assessment of the device components under both the medical device and medicinal product regulatory regimes.
Product Approval and Post-Approval Regulation Outside the U.S.
We market our products in numerous jurisdictions outside the U.S. Most of these jurisdictions have product approval and post-approval regulatory processes that are similar in principle to those in the U.S. In Europe, for example, where a substantial part of our ex-U.S. efforts are focused, there are several routes for marketing approval, depending on the type of product for which approval is sought. Under the centralized procedure, a company submits a single application to the EMA. The marketing authorization application is similar to the NDA or BLA in the U.S. and is evaluated by the Committee for Medicinal Products for Human Use (CHMP), the expert scientific committee of the EMA responsible for human medicines. If the CHMP determines that the marketing authorization application fulfills the requirements for quality, safety and efficacy and that the medicine has a positive benefit risk balance, it will adopt a positive opinion recommending the granting of the marketing authorization by the European Commission (EC). The CHMP opinion is not binding, but is typically adopted by the EC. A marketing authorization application approved by the EC is valid in all member states of the E.U. The centralized procedure is required for all biological products, orphan medicinal products and new treatments for neurodegenerative disorders, and it is available for certain other products, including those which constitute a significant therapeutic, scientific or technical innovation.
In addition to the centralized procedure, the European regulatory framework includes the following options for regulatory review and approval in E.U. member states:
• | a national procedure, where the first application is made to the competent authority in one E.U. country only; |
22
• | a decentralized procedure, where applicants submit identical applications to several E.U. countries and receive simultaneous approval, if the medicine has not yet been authorized in any E.U. country; and |
• | a mutual recognition procedure, where applicants that have a medicine authorized in one E.U. country can apply for mutual recognition of this authorization in other E.U. countries. |
As in the U.S., the E.U. also has distinct approaches intended to optimize the regulatory pathways for therapeutically important drugs, including the Priority Medicines Evaluation Scheme (PRIME), accelerated assessment and conditional marketing authorization. PRIME is intended to provide additional support to medicine developers throughout the development process. Regulatory review timelines in the E.U. may be truncated under accelerated assessment for products that address an unmet medical need. In addition, conditional marketing authorizations may be granted for such products in the interest of public health, where the benefit of immediate availability outweighs the risk of less comprehensive data than normally required. Conditional marketing authorizations are valid for one year and can be renewed annually. The marketing authorization holder is required to complete specific obligations (ongoing or new studies and, in some cases, additional activities) with a view to providing comprehensive data confirming that the benefit risk balance is positive. Once comprehensive data on the product have been obtained, the marketing authorization may be converted into a standard marketing authorization.
Aside from the U.S. and E.U., there are countries in other regions where it is possible to receive an "accelerated" review whereby the national regulatory authority will commit to truncated review timelines for products that meet specific medical needs.
In the E.U. there is detailed legislation on pharmacovigilance and extensive guidance on good pharmacovigilance practices. A failure to comply with E.U. pharmacovigilance obligations may result in significant financial penalties for the marketing authorization holder.
Regardless of the approval process employed, various parties share responsibilities for the monitoring, detection and evaluation of adverse events post-approval, including national competent authorities, the EMA, the EC and the marketing authorization holder. The EMA’s Pharmacovigilance Risk Assessment Committee is responsible for assessing and monitoring the safety of human medicines and makes recommendations on product safety issues. Marketing authorization holders have
an obligation to inform regulatory agencies of any new information which may influence the evaluation of benefits and risks of the medicinal product concerned.
In the U.S., E.U. and other jurisdictions, regulatory agencies, including the FDA, conduct periodic inspections of NDA and BLA holders to assess their compliance with pharmacovigilance obligations.
Good Manufacturing Practices
Regulatory agencies regulate and inspect equipment, facilities and processes used in the manufacturing and testing of pharmaceutical and biologic products prior to approving a product. If, after receiving approval from regulatory agencies, a company makes a material change in manufacturing equipment, location or process, additional regulatory review and approval may be required. We also must adhere to current Good Manufacturing Practices (cGMP) and product-specific regulations enforced by regulatory agencies following product approval. The FDA, the EMA and other regulatory agencies also conduct periodic visits to re-inspect equipment, facilities and processes following the initial approval of a product. If, as a result of these inspections, it is determined that our equipment, facilities or processes do not comply with applicable regulations and conditions of product approval, regulatory agencies may seek civil, criminal or administrative sanctions or remedies against us, including significant financial penalties and the suspension of our manufacturing operations.
Good Clinical Practices
The FDA, the EMA and other regulatory agencies promulgate regulations and standards for designing, conducting, monitoring, auditing and reporting the results of clinical trials to ensure that the data and results are accurate and that the rights and welfare of trial participants are adequately protected (commonly referred to as current Good Clinical Practices (cGCP)). Regulatory agencies enforce cGCP through periodic inspections of trial sponsors, principal investigators and trial sites, contract research organizations (CROs) and institutional review boards. If our studies fail to comply with applicable cGCP guidelines, the clinical data generated in our clinical trials may be deemed unreliable and relevant regulatory agencies may require us to perform additional clinical trials before approving our marketing applications. Noncompliance can also result in civil or criminal sanctions. We rely on third parties, including CROs, to carry out many of our clinical trial-related activities. Failure of such third parties to comply with cGCP can likewise result in rejection of our clinical trial data or other sanctions.
23
In April 2014 the EC adopted a new Clinical Trial Regulation, which was effective in June 2014 but is not expected to apply until 2021. The regulation harmonizes the procedures for assessment and governance of clinical trials throughout the E.U. and will require that information on the authorization, conduct and results of each clinical trial conducted in the E.U. be publicly available.
Approval of Biosimilars
The Patient Protection and Affordable Care Act (PPACA) amended the Public Health Service Act (PHSA) to authorize the FDA to approve biological products, referred to as biosimilars or follow-on biologics, that are shown to be "highly similar" to previously approved biological products based upon potentially abbreviated data packages. The biosimilar must show it has no clinically meaningful differences in terms of safety and effectiveness from the reference product, and only minor differences in clinically inactive components are allowable in biosimilar products. The approval pathway for biosimilars does, however, grant a biologics manufacturer a 12-year period of exclusivity from the date of approval of its biological product before biosimilar competition can be introduced. There is uncertainty, however, as the approval framework for biosimilars originally was enacted as part of the PPACA. There have been, and there are likely to continue to be, federal legislative and administrative efforts to repeal, substantially modify or invalidate some or all of the provisions of the PPACA. If the PPACA is repealed, substantially modified or invalidated, it is unclear what, if any, impact such action would have on biosimilar regulation.
A biosimilars approval pathway has been in place in the E.U. since 2003. The EMA has issued a number of scientific and product specific biosimilar guidelines, including requirements for approving biosimilars containing monoclonal antibodies. In the E.U., biosimilars are generally approved under the centralized procedure. The approval pathway allows sponsors of a biosimilar to seek and obtain regulatory approval based in part on reliance on the clinical trial data of an innovator product to which the biosimilar has been demonstrated, through comprehensive comparability studies, to be “similar.” In many cases, this allows biosimilars to be brought to market without conducting the full complement of clinical trials typically required for novel biologic drugs.
Orphan Drug Act
Under the U.S. Orphan Drug Act, the FDA may grant orphan drug designation to drugs or biologics intended to treat a “rare disease or condition,” which generally is a disease or condition that affects fewer than 200,000 individuals in the U.S. If a product which has an orphan drug designation subsequently
receives an initial FDA approval for the indication for which it has such designation, the product is entitled to orphan exclusivity, i.e., the FDA may not approve any other applications to market the same drug for the same indication for a period of seven years following marketing approval, except in certain very limited circumstances, such as if the later product is shown to be clinically superior to the orphan product. Legislation similar to the U.S. Orphan Drug Act has been enacted in other countries to encourage the research, development and marketing of medicines to treat, prevent or diagnose rare diseases. In the E.U., medicinal products that receive and maintain an orphan designation are entitled to 10 years of market exclusivity following approval, protocol assistance and access to the centralized procedure for marketing authorization. SPINRAZA has been granted orphan drug designation in the U.S., E.U. and Japan.
Regulation Pertaining to Pricing and Reimbursement
In both domestic and foreign markets, sales of our products depend, to a significant extent, on the availability and amount of reimbursement by third-party payors, including governments, private health plans and other organizations. Substantial uncertainty exists regarding the pricing and reimbursement of our products, and drug prices continue to receive significant scrutiny. Governments may regulate coverage, reimbursement and pricing of our products to control cost or affect utilization of our products. Challenges to our pricing strategies, by either government or private stakeholders, could harm our business. The U.S. and foreign governments have enacted and regularly consider additional reform measures that affect health care coverage and costs. Private health plans may also seek to manage cost and utilization by implementing coverage and reimbursement limitations. Other payors, including managed care organizations, health insurers, pharmacy benefit managers, government health administration authorities and private health insurers, seek price discounts or rebates in connection with the placement of our products on their formularies and, in some cases, may impose restrictions on access, coverage or pricing of particular drugs based on perceived value.
Within the U.S.
• | Medicaid: Medicaid is a joint federal and state program that is administered by the states for low income and disabled beneficiaries. Under the Medicaid Drug Rebate Program, we are required to pay a rebate for each unit of product reimbursed by the state Medicaid programs. The amount of the rebate is established by law and is adjusted upward if the average manufacturer price (AMP) increases more than inflation |
24
(measured by the Consumer Price Index - Urban). The rebate amount is calculated each quarter based on our report of current AMP and best price for each of our products to the Centers for Medicare & Medicaid Services (CMS). The requirements for calculating AMP and best price are complex. We are required to report any revisions to AMP or best price previously reported within a certain period, which revisions could affect our rebate liability for prior quarters. In addition, if we fail to provide information timely or we are found to have knowingly submitted false information to the government, the statute governing the Medicaid Drug Rebate Program provides for civil monetary penalties.
• | Medicare: Medicare is a federal program that is administered by the federal government. The program covers individuals age 65 and over as well as those with certain disabilities. Medicare Part B generally covers drugs that must be administered by physicians or other health care practitioners, are provided in connection with certain durable medical equipment or are certain oral anti-cancer drugs and certain oral immunosuppressive drugs. Medicare Part B pays for such drugs under a payment methodology based on the average sales price (ASP) of the drugs. Manufacturers, including us, are required to provide ASP information to the CMS on a quarterly basis. The manufacturer-submitted information is used to calculate Medicare payment rates. If a manufacturer is found to have made a misrepresentation in the reporting of ASP, the governing statute provides for civil monetary penalties. |
Medicare Part D provides coverage to enrolled Medicare patients for self-administered drugs (i.e., drugs that are not administered by a physician). Medicare Part D is administered by private prescription drug plans approved by the U.S. government. Each drug plan establishes its own Medicare Part D formulary for prescription drug coverage and pricing, which the drug plan may modify from time-to-time. The prescription drug plans negotiate pricing with manufacturers and pharmacies, and may condition formulary placement on the availability of manufacturer discounts. In addition, manufacturers, including us, are required to provide to the CMS a discount of up to 70% on brand name prescription drugs utilized by Medicare Part D beneficiaries when those beneficiaries reach the coverage gap in their drug benefits.
• | Federal Agency Discounted Pricing: Our products are subject to discounted pricing when purchased by federal agencies via the Federal |
Supply Schedule (FSS). FSS participation is required for our products to be covered and reimbursed by the Veterans Administration (VA), Department of Defense, Coast Guard and Public Health Service (PHS). Coverage under Medicaid, Medicare and the PHS pharmaceutical pricing program is also conditioned upon FSS participation. FSS pricing is intended not to exceed the price that we charge our most-favored non-federal customer for a product. In addition, prices for drugs purchased by the VA, Department of Defense (including drugs purchased by military personnel and dependents through the TriCare retail pharmacy program), Coast Guard and PHS are subject to a cap on pricing equal to 76% of the non-federal average manufacturer price (non-FAMP). An additional discount applies if non-FAMP increases more than inflation (measured by the Consumer Price Index - Urban). In addition, if we fail to provide information timely or we are found to have knowingly submitted false information to the government, the governing statute provides for civil monetary penalties.
• | 340B Discounted Pricing: To maintain coverage of our products under the Medicaid Drug Rebate Program and Medicare Part B, we are required to extend significant discounts to certain covered entities that purchase products under Section 340B of the PHS pharmaceutical pricing program. Purchasers eligible for discounts include hospitals that serve a disproportionate share of financially needy patients, community health clinics and other entities that receive certain types of grants under the PHSA. For all of our products, we must agree to charge a price that will not exceed the amount determined under statute (the “ceiling price”) when we sell outpatient drugs to these covered entities. In addition, we may, but are not required to, offer these covered entities a price lower than the 340B ceiling price. The 340B discount formula is based on AMP and is generally similar to the level of rebates calculated under the Medicaid Drug Rebate Program. |
Outside the U.S.
Outside the U.S., our products are paid for by a variety of payors, with governments being the primary source of payment. Governments may determine or influence reimbursement of products and may also set prices or otherwise regulate pricing. Negotiating prices with governmental authorities can delay commercialization of our products. Governments may use a variety of cost-containment measures to control the cost of products, including price cuts, mandatory rebates, value-based pricing and reference pricing (i.e., referencing prices in other countries and using
25
those reference prices to set a price). Budgetary pressures in many countries are continuing to cause governments to consider or implement various cost-containment measures, such as price freezes, increased price cuts and rebates and expanded generic substitution and patient cost-sharing.
Regulation Pertaining to Sales and Marketing
We are subject to various federal and state laws pertaining to health care “fraud and abuse,” including anti-kickback laws and false claims laws. Anti-kickback laws generally prohibit a prescription drug manufacturer from soliciting, offering, receiving or paying any remuneration to generate business, including the purchase or prescription of a particular drug. Although the specific provisions of these laws vary, their scope is generally broad and there may be no regulations, guidance or court decisions that clarify how the laws apply to particular industry practices. There is therefore a possibility that our practices might be challenged under anti-kickback or similar laws. False claims laws prohibit anyone from knowingly and willingly presenting, or causing to be presented, for payment to third-party payors (including Medicare and Medicaid), claims for reimbursed drugs or services that are false or fraudulent, claims for items or services not provided as claimed or claims for medically unnecessary items or services. Our activities relating to the sale and marketing of our products may be subject to scrutiny under these laws. Violations of fraud and abuse laws may be punishable by criminal or civil sanctions, including fines and civil monetary penalties, and exclusion from federal health care programs (including Medicare and Medicaid). In the U.S., federal and state authorities are paying increased attention to enforcement of these laws within the pharmaceutical industry and private individuals have been active in alleging violations of the laws and bringing suits on behalf of the government under the federal civil False Claims Act. If we were subject to allegations concerning, or were convicted of violating, these laws, our business could be harmed.
Laws and regulations have been enacted by the federal government and various states to regulate the sales and marketing practices of pharmaceutical manufacturers. The laws and regulations generally limit financial interactions between manufacturers and health care providers or require disclosure to the government and public of such interactions. The laws include federal “sunshine” provisions. The sunshine provisions apply to pharmaceutical manufacturers with products reimbursed under certain government programs and require those manufacturers to disclose annually to the federal government (for re-disclosure to the public) certain payments made to physicians and certain other healthcare practitioners or to teaching hospitals. State laws may also require
disclosure of pharmaceutical pricing information and marketing expenditures. Many of these laws and regulations contain ambiguous requirements. Given the lack of clarity in laws and their implementation, our reporting actions could be subject to the penalty provisions of the pertinent federal and state laws and regulations. Outside the U.S., other countries have implemented requirements for disclosure of financial interactions with healthcare providers and additional countries may consider or implement such laws.
Other Regulations
Foreign Anti-Corruption
We are subject to various federal and foreign laws that govern our international business practices with respect to payments to government officials. Those laws include the U.S. Foreign Corrupt Practices Act (FCPA), which prohibits U.S. companies and their representatives from paying, offering to pay, promising to pay or authorizing the payment of anything of value to any foreign government official, government staff member, political party or political candidate for the purpose of obtaining or retaining business or to otherwise obtain favorable treatment or influence a person working in an official capacity. In many countries, the health care professionals we regularly interact with may meet the FCPA's definition of a foreign government official. The FCPA also requires public companies to make and keep books and records that accurately and fairly reflect their transactions and to devise and maintain an adequate system of internal accounting controls.
The laws to which we are subject also include the U.K. Bribery Act 2010 (Bribery Act), which proscribes giving and receiving bribes in the public and private sectors, bribing a foreign public official and failing to have adequate procedures to prevent employees and other agents from giving bribes. U.S. companies that conduct business in the U.K. generally will be subject to the Bribery Act. Penalties under the Bribery Act include significant fines for companies and criminal sanctions for corporate officers under certain circumstances.
NIH Guidelines
We seek to conduct research at our U.S. facilities in compliance with the current U.S. National Institutes of Health Guidelines for Research Involving Recombinant DNA Molecules (NIH Guidelines). By local ordinance, we are required to, among other things, comply with the NIH Guidelines in relation to our facilities in Research Triangle Park (RTP), NC and are required to operate pursuant to certain permits.
Other Laws
Our present and future business has been and will continue to be subject to various other laws and
26
regulations. Various laws, regulations and recommendations relating to data privacy and protection, safe working conditions, laboratory practices, the experimental use of animals and the purchase, storage, movement, import, export and use and disposal of hazardous or potentially hazardous substances, including radioactive compounds and infectious disease agents, used in connection with our research work are or may be applicable to our activities. Certain agreements entered into by us involving exclusive license rights may be subject to national or international antitrust regulatory control, the effect of which cannot be predicted. The extent of government regulation, which might result from future legislation or administrative action, cannot accurately be predicted.
The European Parliament and the Council of the European Union adopted a comprehensive general data privacy regulation (GDPR) in 2016 to replace the current E.U. Data Protection Directive and related country-specific legislation. The GDPR took effect in May 2018 and governs the collection and use of personal data in the E.U. The GDPR, which is wide-ranging in scope, imposes several requirements relating to the consent of the individuals to whom the personal data relates, the information provided to the individuals, the security and confidentiality of the personal data, data breach notification and the use of third-party processors in connection with the processing of the personal data. The GDPR also imposes strict rules on the transfer of personal data out of the E.U. to the U.S., provides an enforcement authority and imposes large penalties for noncompliance, including the potential for fines of up to €20.0 million or 4% of the annual global revenues of the infringer, whichever is greater.
Environmental Matters
We strive to comply in all material respects with applicable laws and regulations concerning the environment. While it is impossible to predict accurately the future costs associated with environmental compliance and potential remediation activities, compliance with environmental laws is not expected to require significant capital expenditures and has not had, and is not expected to have, a material adverse effect on our operations or competitive position.
Manufacturing
We are committed to ensuring an uninterrupted supply of medicines to patients around the world. To that end, we continually review our manufacturing capacity, capabilities, processes and facilities. We believe that our manufacturing facilities, together with the third-party contract manufacturing organizations we outsource to, currently provide sufficient capacity
for our products and to Samsung Bioepis, our joint venture that develops, manufactures and markets biosimilar products, and other strategic contract manufacturing partners. In order to support our drug development pipeline, we are expanding our large molecule production capacity by building a large-scale biologics manufacturing facility in Solothurn, Switzerland. We expect this facility to be partially operational by the end of 2020.
Manufacturing Facilities
Our drug substance manufacturing facility includes:
Facility | Drug Substance Manufactured | |
RTP, NC | AVONEX PLEGRIDY TYSABRI Other* | |
* Other includes products manufactured for contract manufacturing partners.
In addition to our drug substance manufacturing facility, we have a drug product manufacturing facility and supporting infrastructure in RTP, NC, including a parenteral facility and an oral solid dose products manufacturing facility.
The parenteral facility adds capabilities and capacity for filling biologics into vials and is principally used for filling product candidates. The oral solid dose products facility can supplement our outsourced small molecule manufacturing capabilities, including the manufacture of TECFIDERA.
We also have an oligonucleotide synthesis manufacturing facility in RTP, NC. This facility gives us the capability to manufacture ASO drugs like SPINRAZA as well as our other ASO candidates currently in our clinical pipeline.
In order to support our drug development pipeline, we are building a large-scale biologics manufacturing facility in Solothurn, Switzerland, which we expect to be partially operational by the end of 2020.
Genentech is responsible for all worldwide manufacturing activities for bulk RITUXAN, RITUXAN HYCELA and GAZYVA and has sourced the manufacture of certain bulk RITUXAN, RITUXAN HYCELA and GAZYVA requirements to a third party. Acorda supplies FAMPYRA to us pursuant to its supply agreement with Alkermes, Inc. and Ionis supplies the active pharmaceutical ingredient (API) for SPINRAZA. Alkermes currently supplies VUMERITY to us pursuant to our supply agreement with Alkermes. In October 2019 we entered into a new supply agreement and amended our license and collaboration agreement with Alkermes pursuant to which we have the election,
27
following a transition period, to manufacture VUMERITY or have manufacturing transitioned to a third party.
Third-Party Suppliers and Manufacturers
We principally use third parties to manufacture the API and the final product for our small molecule products and product candidates, including TECFIDERA and FUMADERM, and the final drug product for our large molecule products and, to a lesser extent, product candidates.
We source all of our fill-finish and the majority of final product assembly and storage operations for our products, along with a substantial part of our label and packaging operations, to a concentrated group of third-party contract manufacturing organizations. Raw materials, delivery devices, such as syringes and auto-injectors, and other supplies required for the production of our products and product candidates are procured from various third-party suppliers and manufacturers in quantities adequate to meet our needs. Continuity of supply of such raw materials, devices and supplies is assured using a strategy of dual sourcing where possible or by a risk-based inventory strategy. Our third-party service providers, suppliers and manufacturers may be subject to routine cGMP inspections by the FDA or comparable agencies in other jurisdictions and undergo assessment and certification by our quality management group.
28
Our Employees
As of December 31, 2019, we had approximately 7,400 employees worldwide.
Information about our Executive Officers (as of February 6, 2020)
Officer | Current Position | Age | Year Joined Biogen | |||
Michel Vounatsos | Chief Executive Officer | 58 | 2016 | |||
Susan H. Alexander | Executive Vice President, Chief Legal Officer and Secretary | 63 | 2006 | |||
Jeffrey D. Capello | Executive Vice President and Chief Financial Officer | 55 | 2017 | |||
Alphonse Galdes, Ph.D. | Executive Vice President, Pharmaceutical Operations and Technology | 67 | 1995 | |||
Ginger Gregory, Ph.D. | Executive Vice President and Chief Human Resources Officer | 52 | 2017 | |||
Chirfi Guindo | Executive Vice President, Global Product Strategy and Commercialization | 54 | 2017 | |||
Daniel Karp | Executive Vice President, Corporate Development | 42 | 2018 | |||
Robin C. Kramer | Vice President, Chief Accounting Officer | 54 | 2018 | |||
Alfred W. Sandrock, Jr., M.D., Ph.D. | Executive Vice President, Research and Development | 62 | 1998 | |||
Michel Vounatsos | |
Experience | |
Mr. Vounatsos has served as our Chief Executive Officer and as a member of our Board of Directors since January 2017. Prior to that, from April 2016 to December 2016, Mr. Vounatsos served as our Executive Vice President, Chief Commercial Officer. Prior to joining Biogen, Mr. Vounatsos spent 20 years at Merck & Co., Inc. (Merck), a pharmaceutical company, where he most recently served as President, Primary Care, Customer Business Line and Merck Customer Centricity. In this role, he led Merck’s global primary care business unit, a role which encompassed Merck’s cardiology-metabolic, general medicine, women’s health and biosimilars groups and developed and instituted a strategic framework for enhancing the company’s relationships with key constituents, including the most significant providers, payors and retailers and the world’s largest governments. Mr. Vounatsos previously held leadership positions across Europe and in China for Merck. Prior to that, Mr. Vounatsos held management positions at Ciba-Geigy, a pharmaceutical company. Mr. Vounatsos currently serves on the advisory board of Tsinghua University School of Pharmaceutical Sciences, on the Supervisory Board of Liryc, the Electrophysiology and Heart Modeling Institute at the University of Bordeaux, on the board of directors of N-Lorem Foundation and as a member of the MIT Presidential CEO Advisory Board. | |
Education | |
l | Universite Victor Segalen, Bordeaux II, France, C.S.C.T. Certificate in Medicine |
l | HEC School of Management - Paris, M.B.A. |
Susan H. Alexander | |
Experience | |
Ms. Alexander has served as our Executive Vice President, Chief Legal Officer and Secretary since April 2018. Prior to that, Ms. Alexander served as our Executive Vice President, Chief Legal, Corporate Services and Secretary from March 2017 to March 2018, as our Executive Vice President, Chief Legal Officer and Secretary from December 2011 to March 2017 and as our Executive Vice President, General Counsel and Corporate Secretary from 2006 to December 2011. Prior to joining Biogen, Ms. Alexander served as the Senior Vice President, General Counsel and Corporate Secretary of PAREXEL International Corporation, a biopharmaceutical services company, from 2003 to January 2006. From 2001 to 2003 Ms. Alexander served as General Counsel of IONA Technologies, a software company. From 1995 to 2001 Ms. Alexander served as Counsel at Cabot Corporation, a specialty chemicals and performance materials company. Prior to that, Ms. Alexander was a partner at the law firms of Hinckley, Allen & Snyder and Fine & Ambrogne. | |
Public Company Boards | |
l | Invacare Corporation, a medical and healthcare product company |
Education | |
l | Wellesley College, B.A. |
l | Boston University School of Law, J.D. |
29
Jeffrey D. Capello | |
Experience | |
Mr. Capello has served as our Executive Vice President and Chief Financial Officer since December 2017 and served as our Chief Accounting Officer from July 2018 to November 2018. Prior to joining Biogen, Mr. Capello served as the Chief Financial Officer of Beacon Health Options, Inc., a behavioral health company, with responsibility for finance, human resources, information technology, real estate and procurement from October 2016 until November 2017. From July 2015 until September 2016 Mr. Capello was the founder and Chief Executive Officer of Monomoy Advisors, which focuses on helping companies drive shareholder value. From July 2014 until June 2015 Mr. Capello served as the Executive Vice President and Chief Financial Officer of Ortho-Clinical Diagnostics, an in-vitro diagnostics company that was acquired by the Carlyle Group from Johnson & Johnson, with responsibility for global finance and business development. From March 2010 to December 2013 Mr. Capello served as Chief Financial Officer and Executive Vice President of Boston Scientific Corporation (Boston Scientific), a medical device company, where he was responsible for the worldwide management of Boston Scientific’s finance, information systems, business development and corporate strategy functions. Mr. Capello joined Boston Scientific in June 2008 and served as Senior Vice President and Chief Accounting Officer until March 2010. From 2006 to 2008 he was the Senior Vice President and Chief Financial Officer with responsibilities for global finance and business development at PerkinElmer, Inc. (PerkinElmer), a life sciences tool company. Previously, he served as PerkinElmer’s Vice President of Finance, Corporate Controller, Treasurer and Chief Accounting Officer from 2001 to 2006. Prior to his tenure at PerkinElmer, Mr. Capello was a Partner at PricewaterhouseCoopers LLP, both in the U.S. and in the Netherlands. | |
Education | |
l | University of Vermont, B.S. Business Administration |
l | Harvard Business School, M.B.A. |
Alphonse Galdes, Ph.D. | |
Experience | |
Dr. Galdes has served as our Executive Vice President, Pharmaceutical Operations and Technology since September 2019. Since joining Biogen in 1995, Dr. Galdes has held several senior executive positions, including most recently as Senior Vice President, Asset Development and Portfolio Management from November 2015 to September 2019 and Senior Vice President, Technical Development from October 2010 to November 2015. Dr. Galdes was a Rhodes Scholar at Oxford University and performed post-doctoral research work at the Department of Biological Chemistry at Harvard Medical School. | |
Education | |
l | University of Malta, B.Sc. Chemistry and Biology |
l | University of Malta, M.Sc. Biochemistry |
l | Oxford University, Ph.D. Biochemistry |
Ginger Gregory, Ph.D. | |
Experience | |
Dr. Gregory has served as our Executive Vice President and Chief Human Resources Officer since July 2017. Prior to joining Biogen, Dr. Gregory served as Executive Vice President and Chief Human Resources Officer at Shire PLC, a global specialty biopharmaceutical company, from February 2014 to April 2017. Prior to that, Dr. Gregory held executive-level human resources positions for several multinational companies across a variety of industries, including Dunkin’ Brands Group Inc., a restaurant holding company, where she served as Chief Human Resource Officer, Novartis AG, a pharmaceutical company, where she was the division head of Human Resources for Novartis Vaccines and Diagnostics, Novartis Consumer Health and Novartis Institutes of BioMedical Research and Novo Nordisk A/S, a pharmaceutical company, where she served as Senior Vice President, Corporate People & Organization at the company’s headquarters in Copenhagen, Denmark. Earlier in her career, Dr. Gregory held a variety of human resources generalist and specialist positions at BMS, a pharmaceutical company, and served as a consultant with Booz Allen & Hamilton, an information technology consulting company, in the area of organization change and effectiveness. | |
Education | |
l | University of Massachusetts, B.A. Psychology |
l | The George Washington University, Ph.D. Psychology |
30
Chirfi Guindo | |
Experience | |
Mr. Guindo has served as our Executive Vice President, Global Product Strategy and Commercialization since February 2019. Prior to that, Mr. Guindo served as our Executive Vice President and Head of Global Marketing, Market Access and Customer Innovation from November 2017 to February 2019. Prior to joining Biogen, Mr. Guindo spent 27 years in the global pharmaceutical industry and has held several leadership positions at Merck, a pharmaceutical company, in Canada, the U.S., France, Africa and the Netherlands. He worked in several disciplines including Finance, Sales & Marketing, General Management and Global Strategy/Product Development in specialty, acute and hospital care. Most recently Mr. Guindo was Vice President and Managing Director and President and Managing Director of Merck Canada from October 2014 to November 2017. From January 2011 to October 2014, he was Vice President and General Manager, Global HIV Franchise at Merck. | |
Education | |
l | Ecole Central de Paris (France), Engineering |
l | Stern School of Business, New York University, M.B.A. Finance/Economics |
Daniel Karp | |
Experience | |
Mr. Karp has served as our Executive Vice President, Corporate Development since June 2018. Prior to joining Biogen, Mr. Karp held a number of positions of increasing responsibility at Pfizer, a biopharmaceutical company, including as Vice President, Worldwide Business Development and Head of Business Development for Worldwide Research and Development from May 2016 to June 2018, as Vice President, Worldwide Business Development and BD Lead for Pfizer Vaccines, Oncology and Consumer Healthcare from January 2014 to May 2016, as Senior Director, Worldwide Business Development from December 2010 to December 2013, as Director, Worldwide Business Development from January 2008 to December 2010, as Senior Manager, Worldwide Business Development from May 2007 to December 2007 and as Manager, U.S. Business Development from July 2006 to April 2007. Prior to that, Mr. Karp held roles in healthcare and life sciences strategy consulting. | |
Education | |
l | Duke University, B.S. Biology |
l | Wharton School of the University of Pennsylvania, M.B.A. |
Robin C. Kramer | |
Experience | |
Ms. Kramer has served as our Vice President, Chief Accounting Officer since November 2018. Prior to joining Biogen, Ms. Kramer served as the Senior Vice President and Chief Accounting Officer of Hertz Global Holdings, Inc., a car rental company, from May 2014 to November 2018. Prior to that, Ms. Kramer was an audit partner at Deloitte & Touche LLP (Deloitte), a professional services firm, from 2007 to 2014, including serving in Deloitte's National Office Accounting Standards and Communications Group from 2007 to 2010. From 2005 to 2007 Ms. Kramer served as Chief Accounting Officer of Fisher Scientific International, Inc., a laboratory supply and biotechnology company, and from 2004 to 2005 Ms. Kramer served as Director, External Reporting, Accounting and Control for the Gillette Company, a personal care company. Ms. Kramer also held partner positions in the public accounting firms of Ernst & Young LLP and Arthur Anderson LLP. Ms. Kramer is a licensed certified public accountant (CPA) in Massachusetts. She is a member of the Massachusetts Society of CPAs and the American Institute of CPAs and served as a Board Member for the Massachusetts State Board of Accountancy from September 2011 to December 2015. | |
Education | |
l | Salem State University, B.B.A. Accounting |
31
Alfred W. Sandrock, Jr., M.D., Ph.D. | |
Experience | |
Dr. Sandrock has served as our Executive Vice President, Research and Development since September 2019. Prior to that, Dr. Sandrock served as our Chief Medical Officer from October 2017 to January 2020, as our Executive Vice President, Chief Medical Officer Neurology and Neurodegeneration from October 2015 to October 2017, as our Chief Medical Officer and Group Senior Vice President from April 2013 to October 2015 and as our Chief Medical Officer and Senior Vice President of Development Sciences from February 2012 to April 2013. Prior to that, Dr. Sandrock held several other senior executive positions since joining Biogen in 1998, including Senior Vice President of Neurology Research and Development and Vice President of Clinical Development, Neurology. | |
Public Company Boards | |
l | Neurocrine Biosciences, Inc., a life sciences company |
Education | |
l | Stanford University, B.A. Human Biology |
l | Harvard Medical School, M.D. |
l | Harvard University, Ph.D. Neurobiology |
l | Massachusetts General Hospital, internship in Medicine, residency and chief residency in Neurology and clinical fellowship in Neuromuscular Disease and Clinical Neurophysiology (electromyography) |
Available Information
Our principal executive offices are located at 225 Binney Street, Cambridge, MA 02142 and our telephone number is (617) 679-2000. Our website address is www.biogen.com. We make available free of charge through the Investors section of our website our Annual Reports on Form 10-K, Quarterly Reports on Form 10-Q, Current Reports on Form 8-K and all amendments to those reports as soon as reasonably practicable after such material is electronically filed with or furnished to the U.S. Securities and Exchange Commission (SEC). We include our website address in this report only as an inactive textual reference and do not intend it to be an active link to our website. The contents of our website are not incorporated into this report.
32
Item 1A. Risk Factors
We are substantially dependent on revenues from our products.
Our revenues depend upon continued sales of our products, as well as the financial rights we have in our anti-CD20 therapeutic programs, and, unless we develop, acquire rights to and/or commercialize new products and technologies, we will be substantially dependent on sales from our products and our financial rights in our anti-CD20 therapeutic programs for many years. Additionally, a significant portion of our revenues are concentrated on sales of our products in increasingly competitive markets. Any of the following negative developments relating to any of our products or any of our anti-CD20 therapeutic programs may adversely affect our revenues and results of operations or could cause a decline in our stock price:
• | safety or efficacy issues; |
• | our ability to maintain a positive reputation among patients, healthcare providers and others, which may be impacted by our pricing and reimbursement decisions; |
• | the introduction or greater acceptance of competing products, including generics, biosimilars, prodrugs and products approved under abbreviated regulatory pathways; |
• | limitations and additional pressures on product pricing or price increases, including those resulting from governmental or regulatory requirements, increased competition or changes in, or implementation of, reimbursement policies and practices of payors and other third parties; or |
• | adverse legal, administrative, regulatory or legislative developments. |
SPINRAZA has been approved by, among others, the FDA, the EC and the Japanese Ministry of Health, Labor and Welfare, and is in the early stages of commercial launch in certain markets. In addition to risks associated with new product launches and the other factors described in these Risk Factors, our ability to successfully commercialize SPINRAZA may be adversely affected due to:
• | the introduction of a new gene therapy product that was approved in the U.S. in May 2019 for the treatment of SMA, and other products in development that, if successfully developed and approved, may compete with SPINRAZA in the SMA market, including potential oral products; |
• | our limited marketing experience within certain SMA markets, which may impact our ability to develop additional relationships with the associated medical and scientific community; and |
• | the lack of readiness of healthcare providers within certain SMA markets to treat patients with SMA. |
Sales of our products depend, to a significant extent, on adequate coverage, pricing and reimbursement from third-party payors, which are subject to increasing and intense pressure from political, social, competitive and other sources. Our inability to obtain and maintain adequate coverage, or a reduction in pricing or reimbursement, could have an adverse effect on our business, reputation, revenues and results of operations, could curtail or eliminate our ability to adequately fund research and development programs for the discovery and commercialization of new products or could cause a decline or volatility in our stock price.
Sales of our products depend, to a significant extent, on the availability and extent of adequate coverage, pricing and reimbursement from government health administration authorities, private health insurers and other organizations. When a new pharmaceutical product is approved, the availability of government and private reimbursement for that product may be uncertain, as is the pricing and amount for which that product will be reimbursed.
Pricing and reimbursement for our products may be adversely affected by a number of factors, including:
• | changes in, and implementation of, federal, state or foreign government regulations or private third-party payors’ reimbursement policies; |
• | pressure by employers on private health insurance plans to reduce costs; |
• | consolidation and increasing assertiveness of payors, including managed care organizations, health insurers, pharmacy benefit managers, government health administration authorities, private health insurers and other organizations, seeking price discounts or rebates in connection with the placement of our |
33
products on their formularies and, in some cases, the imposition of restrictions on access or coverage of particular drugs or pricing determined based on perceived value; and
• | our value-based contracting program pursuant to which we aim to tie the pricing of our products to their clinical values by either aligning price to patient outcomes or adjusting price for patients who discontinue therapy for any reason, including efficacy or tolerability concerns. |
Our ability to set the price for our products varies significantly from country to country and as a result so can the price of our products. Certain countries set prices by reference to the prices in other countries where our products are marketed. Thus, our inability to obtain and maintain adequate prices in a particular country may not only limit the revenues from our products within that country but may also adversely affect our ability to secure acceptable prices in existing and potential new markets. This may create the opportunity for third-party cross-border trade or influence our decision to sell or not to sell a product, thus adversely affecting our geographic expansion plans and revenues.
Drug prices are under significant scrutiny in the markets in which our products are prescribed. We expect drug pricing and other health care costs to continue to be subject to intense political and societal pressures on a global basis. In addition, competition from current and future competitors may negatively impact our ability to maintain pricing and our market share. New products or treatments brought to market by our competitors could cause revenues for our products to decrease due to potential price reductions and lower sales volumes.
Payors, including managed care organizations, health insurers, pharmacy benefit managers, government health administration authorities, private health insurers and other organizations, increasingly seek ways to reduce their costs. Many payors continue to adopt benefit plan changes that shift a greater portion of prescription costs to patients. Such measures include more limited benefit plan designs, higher patient co-pay or co-insurance obligations and limitations on patients' use of commercial manufacturer co-pay payment assistance programs (including through co-pay accumulator adjustment or maximization programs). Payors also increasingly seek price discounts or rebates in connection with the placement of our products on their formularies or those they manage and control costs by imposing restrictions on access to or usage of our products, such as by requiring prior authorization or step therapy. Significant consolidation in the health insurance industry has resulted in a few large insurers and pharmacy benefit managers exerting greater pressure in pricing and usage negotiations with drug manufacturers, significantly increasing discounts and rebates required of manufacturers and limiting patient access and usage. Further consolidation among insurers, pharmacy benefit managers and other payors would increase the negotiating leverage such entities have over us and other drug manufacturers. Ultimately, additional discounts, rebates, coverage or plan changes, restrictions or exclusions as described above could have a material adverse effect on sales of our affected products.
Our failure to obtain or maintain adequate coverage, pricing or reimbursement for our products could have an adverse effect on our business, reputation, revenues and results of operations, could curtail or eliminate our ability to adequately fund research and development programs for the discovery and commercialization of new products or could cause a decline or volatility in our stock price.
If we are unable to obtain and maintain adequate protection for our data, intellectual property and other proprietary rights, our business may be harmed.
Our success depends in part on our ability to obtain and defend patent and other intellectual property rights that are important to the commercialization of our products and product candidates. The degree of patent protection afforded to our products and processes in the U.S. and in other important markets remains uncertain and depends, in part, upon decisions of the patent offices, courts, administrative bodies and lawmakers in these countries. We may fail to successfully obtain or preserve patent protection for the technologies incorporated into our products and processes, or the protection we obtain may not be of sufficient breadth and degree to protect our commercial interests in all countries where we conduct business. Under the Hatch-Waxman Act, a manufacturer may file an Abbreviated New Drug Application, seeking approval of a generic copy of an approved innovator product, or a NDA under Section 505(b)(2) of the Federal Food, Drug and Cosmetic Act, which may be for a new or improved version of the original innovator product. The manufacturers are allowed to rely on the safety and efficacy data of the innovator's product, may not need to conduct clinical trials, can market a competing version of a product after the expiration or loss of patent exclusivity or the expiration or loss of regulatory exclusivity and often charge significantly lower prices. Upon the expiration or loss of patent protection or the expiration or loss of regulatory exclusivity for a product, a major portion of revenues for that product may be reduced in a short period of time. When others exploit our inventions, the expected benefit from them are reduced. Furthermore, our products may be determined to
34
infringe patents or other intellectual property rights held by third parties, which could result in financial, legal, business or reputational harm to us.
We also rely on regulatory exclusivity for protection of our products. Implementation and enforcement of regulatory exclusivity, which may consist of regulatory data protection and market protection, varies widely from country to country. Failure to qualify for regulatory exclusivity, or failure to obtain or maintain the extent or duration of such protections that we expect in each of the markets for our products due to challenges, changes or interpretations in the law or otherwise, could affect our revenues for our products or our decision on whether to market our products in a particular country or countries or could otherwise have an adverse impact on our results of operations.
Litigation, interferences, oppositions, inter partes reviews, administrative challenges or other similar types of proceedings are, have been and may in the future be necessary in some instances to determine the validity and scope of certain of our patents, regulatory exclusivities or other proprietary rights, and in other instances to determine the validity, scope or non-infringement of certain patent rights claimed by third parties to be pertinent to the manufacture, use or sale of our products. We also face challenges to our patent and regulatory protections covering our products by third parties, including manufacturers of generics and biosimilars that may choose to launch or attempt to launch their products before the expiration of our patent or regulatory exclusivity. Litigation, interference, oppositions, inter partes reviews, administrative challenges or other similar types of proceedings are unpredictable and are often protracted, expensive and distracting to management. Negative outcomes of such proceedings adversely affect the validity and scope of our patent or other proprietary rights. Settlements of Hatch-Waxman litigation typically result in reducing the period of patent protection, accelerating reduction in revenue from affected products. Adverse outcomes in intellectual property litigation also could hinder our ability to manufacture and market our products, require us to seek a license for the infringed product or technology or result in the assessment of significant monetary damages against us that may exceed amounts, if any, accrued in our financial statements. An adverse determination in a judicial or administrative proceeding or a failure to obtain necessary licenses could prevent us from manufacturing or selling our products. Furthermore, payments under any licenses that we are able to obtain would reduce our profits derived from the covered products and services. Any of these circumstances could result in financial, business or reputational harm to us or could cause a decline or volatility in our stock price.
Our long-term success depends upon the successful development of new products and additional indications for existing products.
Our long-term viability and growth will depend upon the successful development of additional indications for our existing products as well as the successful development of new products and technologies from our research and development activities, our biosimilars joint venture with Samsung BioLogics or licenses or acquisitions from third parties.
Product development is very expensive and involves a high degree of uncertainty and risk. Only a small number of research and development programs result in the commercialization of a product. Furthermore, the development of novel approaches for the treatment of diseases, including development efforts in new modalities such as those based on the ASO platform and gene therapy, may present additional challenges and risks, including obtaining regulatory approval from the FDA and other regulatory agencies that have limited experience with the development of such therapies. In addition, clinical trial data are subject to differing interpretations and, even if we view data as sufficient to support the safety, effectiveness and/or approval of an investigational therapy, regulatory authorities may disagree and may require additional data, may limit the scope of the approval or may deny approval altogether. Consequently, it may be difficult to predict the time and cost of product development of novel approaches for the treatment of diseases.
In addition, success in preclinical work or early stage clinical trials does not ensure that later stage or larger scale clinical trials will be successful. Clinical trials may indicate that our product candidates lack efficacy, have harmful side effects, result in unexpected adverse events or raise other concerns that may significantly reduce the likelihood of regulatory approval. This may result in terminated programs, significant restrictions on use and safety warnings in an approved label, adverse placement within the treatment paradigm or significant reduction in the commercial potential of the product candidate.
Even if we could successfully develop new products or indications, we may make a strategic decision to discontinue development of a product candidate or indication if, for example, we believe commercialization will be difficult relative to the standard of care or other opportunities in our pipeline.
35
If we fail to compete effectively, our business and market position would suffer.
The biopharmaceutical industry and the markets in which we operate are intensely competitive. We compete in the marketing and sale of our products, the development of new products and processes, the acquisition of rights to new products with commercial potential and the hiring and retention of personnel. We compete with biotechnology and pharmaceutical companies that have a greater number of products on the market and in the product pipeline, substantially greater financial, marketing and research and development and other resources and other technological or competitive advantages. One or more of our competitors may benefit from significantly greater sales and marketing capabilities, may develop products that are accepted more widely than ours or may receive patent protection that dominates, blocks or adversely affects our product development or business.
Our products are also susceptible to increasing competition in many markets from generics, biosimilars, prodrugs and products approved under abbreviated regulatory pathways. Generic versions of drugs, biosimilars, prodrugs and products approved under abbreviated regulatory pathways are likely to be sold at substantially lower prices than branded products. Accordingly, the introduction of such products, as well as other lower-priced competing products, may significantly reduce both the price that we are able to charge for our products and the volume of products we sell, which will negatively impact our revenues. In addition, when a generic version of one of our products is commercialized, it may, in some cases, be automatically substituted for our product and reduce our revenues in a short period of time.
In the MS market, we face intense competition as the number of products and competitors continues to expand. Due to our significant reliance on sales of our MS products, including TECFIDERA, our business could be harmed if we are unable to successfully compete in the MS market. More specifically, our ability to compete, maintain and grow our share in the MS market may be adversely affected due to a number of factors, including:
• | the introduction of more efficacious, safer, less expensive or more convenient alternatives to our MS products, including our own products and products of our collaborators; |
• | the introduction of biosimilars, follow-on products, generic versions of branded MS products, prodrugs or products approved under abbreviated regulatory pathways, which would be significantly less costly than our products to bring to market and would be offered for sale at lower prices, and could result in a significant percentage of the sales of our products being lost to such biosimilars, follow-on products, generic versions of branded MS products, prodrugs or products approved under abbreviated regulatory pathways; |
• | the off-label use by physicians of therapies indicated for other conditions to treat MS patients; |
• | patient dynamics, including the size of the patient population and our ability to attract and maintain new and current patients to our therapies; |
• | damage to physician and patient confidence in any of our MS products, generic or biosimilars of our MS products or any other product from the same class as one of our products, or to our sales and reputation as a result of label changes or adverse experiences or events that may occur with patients treated with our MS products or generic or biosimilars of our MS products; |
• | inability to obtain appropriate pricing and reimbursement for our MS products compared to our competitors in key international markets; or |
• | our ability to obtain and maintain patent, data or market exclusivity for our MS products. |
In the SMA market, we face competition from a new gene therapy product that was approved in the U.S. in May 2019 for the treatment of SMA. Additionally, we are aware of other products in development that, if successfully developed and approved, may compete with SPINRAZA in the SMA market, including potential oral products. Future sales of SPINRAZA may be adversely affected by the commercialization of competing products.
Our business may be adversely affected if we do not successfully execute or realize the anticipated benefits of our strategic and growth initiatives.
The successful execution of our strategic and growth initiatives may depend upon internal development projects, commercial initiatives, external opportunities, which may include the acquisition, partnering and in-licensing of products, technologies and companies or the entry into strategic alliances and collaborations, or the disposition of certain of our assets or operations.
36
While we believe we have a number of promising programs in our pipeline, failure or delay of internal development projects to advance or difficulties in executing on our commercial initiatives could impact our current and future growth, resulting in additional reliance on external development opportunities for growth.
Supporting the further development of our existing products and potential new products in our pipeline will require significant capital expenditures and management resources, including investments in research and development, sales and marketing, manufacturing capabilities and other areas of our business. We have in the past made, and may continue to make, significant operating and capital expenditures for potential new products in our pipeline prior to regulatory approval with no assurance that such investment will be recouped, which may adversely affect our financial condition, business and operations.
The availability of high quality, fairly valued external product development is limited and the opportunity for their acquisition is highly competitive. As such, we are not certain that we will be able to identify suitable candidates for acquisition or if we will be able to reach agreement. Furthermore, if we decide to dispose of certain of our assets or operations, we are not certain that we will be able to identify a suitable counterparty or if we will be able to reach agreement.
We may fail to initiate or complete transactions for many reasons and we may not be able to achieve the full strategic and financial benefits expected to result from transactions, or the benefits may be delayed or not occur at all. We may also face additional costs or liabilities in completed transactions that were not contemplated prior to completion.
Any failure in the execution of a transaction, in the integration of an acquired asset or business or in achieving expected synergies could result in slower growth, higher than expected costs, the recording of asset impairment charges and other actions which could adversely affect our business, financial condition and results of operations.
Successful preclinical work or early stage clinical trials does not ensure success in later stage trials, regulatory approval or commercial viability of a product.
Positive results in a clinical trial may not be replicated in subsequent or confirmatory trials. Additionally, success in preclinical work or early stage clinical trials does not ensure that later stage or larger scale clinical trials will be successful or that regulatory approval will be obtained. In addition, even if later stage clinical trials are successful, regulatory authorities may delay or decline approval of our product candidates. Regulatory authorities may disagree with our view of the data, require additional studies or disagree with our trial design or endpoints. Regulatory authorities may also fail to approve the facilities or processes used to manufacture a product candidate, our dosing or delivery methods or companion devices. Regulatory authorities may grant marketing approval that is more restricted than anticipated. These restrictions may include limiting indications to narrow patient populations and the imposition of safety monitoring, educational requirements and risk evaluation and mitigation strategies. The occurrence of any of these events could result in significant costs and expenses, have an adverse effect on our business, financial condition and results of operations and cause our stock price to decline or experience periods of volatility.
Even if we are able to successfully develop new products or indications, sales of new products or products with additional indications may not meet investor expectations. We may also make a strategic decision to discontinue development of a product candidate or indication if, for example, we believe commercialization will be difficult relative to the standard of care or other opportunities in our pipeline.
Clinical trials and the development of biopharmaceutical products is a lengthy and complex process. If we fail to adequately manage our clinical activities, our clinical trials or potential regulatory approvals may be delayed or denied.
Conducting clinical trials is a complex, time-consuming and expensive process. Our ability to complete clinical trials in a timely fashion depends on a number of key factors. These factors include protocol design, regulatory and institutional review board approval, patient enrollment rates and compliance with cGCP. If we or our third-party clinical trial providers or third-party CROs do not successfully carry out these clinical activities, our clinical trials or the potential regulatory approval of a product candidate may be delayed or be unsuccessful.
We have opened clinical trial sites and are enrolling patients in a number of countries where our experience is limited. In most cases, we use the services of third parties to carry out our clinical trial related activities and rely on such parties to accurately report their results. Our reliance on third parties for these activities may impact our ability to control the timing, conduct, expense and quality of our clinical trials. One CRO has responsibility for a substantial portion of our activities and reporting related to our clinical trials. If this CRO does not adequately perform, many of our trials may be affected. We may need to replace our CROs. Although we believe there are a number of other CROs
37
we could engage to continue these activities, the replacement of an existing CRO may result in the delay of the affected trials or otherwise adversely affect our efforts to obtain regulatory approvals and commercialize our product candidates.
Adverse safety events or restrictions on use and safety warnings for our products can negatively affect our business, product sales and stock price.
Adverse safety events involving our marketed products, generic or biosimilar versions of our marketed products or any other products from the same class as one of our products may have a negative impact on our business. Discovery of safety issues with our products could create product liability and could cause additional regulatory scrutiny and requirements for additional labeling or safety monitoring, withdrawal of products from the market and the imposition of fines or criminal penalties. Adverse safety events may also damage physician, patient and/or investor confidence in our products and our reputation. Any of these could result in liabilities, loss of revenues, material write-offs of inventory, material impairments of intangible assets, goodwill and fixed assets, material restructuring charges or other adverse impacts on our results of operations.
Regulatory authorities are making greater amounts of stand-alone safety information directly available to the public through periodic safety update reports, patient registries and other reporting requirements. The reporting of adverse safety events involving our products or products similar to ours and public rumors about such events may increase claims against us and may also cause our product sales or stock price to decline or experience periods of volatility.
Restrictions on use or significant safety warnings that may be required to be included in the label of our products, such as the risk of developing progressive multifocal leukoencephalopathy (PML) or liver injury in the label for certain of our products, may significantly reduce expected revenues for those products and require significant expense and management time.
A breakdown or breach of our technology systems could subject us to liability or interrupt the operation of our business.
We are increasingly dependent upon technology systems and data to operate our business. Our ability to effectively manage our business depends on the security, reliability and adequacy of our technology systems and data, which includes use of cloud technologies, including Software as a Service (SaaS), Platform as a Service (PaaS) and Infrastructure as a Service (IaaS). A breakdown, invasion, corruption, destruction or breach of our technology systems, including the cloud technologies that we utilize, and/or unauthorized access to our data and information could subject us to liability or negatively impact the operation of our business. Our technology systems, including the cloud technologies that we utilize, continue to increase in multitude and complexity, making them potentially vulnerable to breakdown, malicious intrusion and random attack. Likewise, data privacy or security breaches by individuals authorized to access our technology systems, including the cloud technologies that we utilize, may pose a risk that sensitive data, including intellectual property, trade secrets or personal information belonging to us, our patients, customers or other business partners, may be exposed to unauthorized persons or to the public.
Cyber-attacks are increasing in their frequency, sophistication and intensity, and are becoming increasingly difficult to detect. They are often carried out by motivated, well-resourced, skilled and persistent actors, including nation states, organized crime groups, “hacktivists” and employees or contractors acting with malicious intent. Cyber-attacks could include the deployment of harmful malware and key loggers, ransomware, a denial-of-service attack, a malicious website, the use of social engineering and other means to affect the confidentiality, integrity and availability of our technology systems and data. Cyber-attacks could also include supply chain attacks, which could cause a delay in the manufacturing of our products or products produced for contract manufacturing. Our key business partners face similar risks and any security breach of their systems could adversely affect our security posture. In addition, our increased use of cloud technologies could heighten these and other operational risks, and any failure by cloud technology service providers to adequately safeguard their systems and prevent cyber-attacks could disrupt our operations and result in misappropriation, corruption or loss of confidential or propriety information.
While we continue to build and improve our systems and infrastructure, including our business continuity plans, there can be no assurance that our efforts will prevent breakdowns or breaches in our systems that could adversely affect our business and operations and/or result in the loss of critical or sensitive information, which could result in financial, legal, business, operational or reputational harm to us, loss of competitive advantage or loss of consumer confidence. In addition, our liability insurance may not be sufficient in type or amount to cover us against claims related to security breaches, cyber-attacks and other related breaches.
38
We depend on relationships with collaborators, joint venture partners and other third parties for revenues, and for the development, regulatory approval, commercialization and marketing of certain of our products and product candidates, which are outside of our full control.
We rely on a number of significant collaborative and other third-party relationships, including joint venture partners, for revenues, and for the development, regulatory approval, commercialization and marketing of certain of our products and product candidates. We also outsource to third parties certain aspects of our regulatory affairs and clinical development relating to our products and product candidates. Reliance on collaborative and other third-party relationships, including joint venture partners, subjects us to a number of risks, including:
• | we may be unable to control the resources our collaborators, joint venture partners or third parties devote to our programs, products or product candidates; |
• | disputes may arise under an agreement, including with respect to the achievement and payment of milestones or ownership of rights to technology developed with our collaborators, joint venture partners or other third parties, and the underlying agreement with our collaborators, joint venture partners or other third parties may fail to provide us with significant protection or may fail to be effectively enforced if the collaborators, joint ventures partners or third parties fail to perform; |
• | the interests of our collaborators, joint venture partners or third parties may not always be aligned with our interests, and such parties may not pursue regulatory approvals or market a product in the same manner or to the same extent that we would, which could adversely affect our revenues; |
• | third-party relationships, joint ventures and collaborations often require the parties to cooperate, and failure to do so effectively could adversely affect product sales, or the clinical development or regulatory approvals of products under joint control, could result in termination of the research, development or commercialization of product candidates or could result in litigation or arbitration; |
• | any failure on the part of our collaborators, joint venture partners or other third parties to comply with applicable laws, regulatory requirements and/or applicable contractual obligations in the marketing, sale and maintenance of the marketing authorization of our products or to fulfill any responsibilities our collaborators, joint venture partners or other third parties may have to protect and enforce any intellectual property rights underlying our products could have an adverse effect on our revenues as well as involve us in possible legal proceedings; and |
• | any improper conduct or actions on the part of our collaborators, joint venture partners or other third parties could subject us to civil or criminal investigations and monetary and injunctive penalties, impact the accuracy and timing of our financial reporting and/or adversely impact our ability to conduct business, our operating results and our reputation. |
Given these risks, there is considerable uncertainty regarding the success of our current and future collaborative efforts. If these efforts fail, our product development or commercialization of new products could be delayed, or revenues from products could decline and/or we may not realize the anticipated benefits of the collaboration arrangements and/or joint ventures.
Our results of operations may be adversely affected by current and potential future healthcare reforms.
In the U.S., federal and state legislatures, health agencies and third-party payors continue to focus on containing the cost of health care. Legislative and regulatory proposals, enactments to reform health care insurance programs and increasing pressure from social sources could significantly influence the manner in which our products are prescribed and purchased. For example, provisions of the PPACA have resulted in changes in the way health care is paid for by both governmental and private insurers, including increased rebates owed by manufacturers under the Medicaid Drug Rebate Program, annual fees and taxes on manufacturers of certain branded prescription drugs, the requirement that manufacturers participate in a discount program for certain outpatient drugs under Medicare Part D and the expansion of the number of hospitals eligible for discounts under Section 340B of the PHSA. These changes have had and are expected to continue to have a significant impact on our business.
We may face uncertainties as a result of federal and administrative efforts to repeal, substantially modify or invalidate some or all of the provisions of the PPACA. There is no assurance that the PPACA, as currently enacted or as amended in the future, will not adversely affect our business and financial results, and we cannot predict how future federal or state legislative or administrative changes relating to healthcare reform will affect our business.
39
The administration has also indicated an intent to address prescription drug pricing and recent Congressional hearings have brought increased public attention to the costs of prescription drugs. These actions and the uncertainty about the future of the PPACA and healthcare laws may put downward pressure on pharmaceutical pricing and increase our regulatory burdens and operating costs.
There is also significant economic pressure on state budgets that may result in states increasingly seeking to achieve budget savings through mechanisms that limit coverage or payment for our drugs. In recent years, some states have considered legislation and ballot initiatives that would control the prices of drugs, including laws to allow importation of pharmaceutical products from lower cost jurisdictions outside the U.S. and laws intended to impose price controls on state drug purchases. State Medicaid programs are increasingly requesting manufacturers to pay supplemental rebates and requiring prior authorization by the state program for use of any drug for which supplemental rebates are not being paid. Government efforts to reduce Medicaid expenses may lead to increased use of managed care organizations by Medicaid programs. This may result in managed care organizations influencing prescription decisions for a larger segment of the population and a corresponding limitation on prices and reimbursement for our products.
In the E.U. and some other international markets, the government provides health care at low cost to consumers and regulates pharmaceutical prices, patient eligibility or reimbursement levels to control costs for the government-sponsored health care system. Many countries have announced or implemented measures, and may in the future implement new or additional measures, to reduce health care costs to limit the overall level of government expenditures. These measures vary by country and may include, among other things, patient access restrictions, suspensions on price increases, prospective and possible retroactive price reductions and other recoupments and increased mandatory discounts or rebates, recoveries of past price increases and greater importation of drugs from lower-cost countries. These measures have negatively impacted our revenues and may continue to adversely affect our revenues and results of operations in the future.
Management and key personnel changes may disrupt our operations, and we may have difficulty retaining key personnel or attracting and retaining qualified replacements on a timely basis for management and other key personnel who may leave the Company.
We have experienced changes in management and other key personnel in critical functions across our organization in recent years. Changes in management and other key personnel have the potential to disrupt our business, and any such disruption could adversely affect our operations, programs, growth, financial condition or results of operations. Further, new members of management may have different perspectives on programs and opportunities for our business, which may cause us to focus on new business opportunities or reduce or change emphasis on our existing business programs.
Our success is dependent upon our ability to attract and retain qualified management and key personnel in a highly competitive environment. Qualified individuals are in high demand, and we may incur significant costs to attract them, particularly at the executive level. We may face difficulty in attracting and retaining key talent for a number of reasons, including management changes, the underperformance or discontinuation of one or more late stage programs or recruitment by competitors. We cannot ensure that we will be able to hire or retain the personnel necessary for our operations or that the loss of any such personnel will not have a material impact on our financial condition and results of operations.
If we fail to comply with the extensive legal and regulatory requirements affecting the health care industry, we could face increased costs, penalties and a loss of business.
Our activities, and the activities of our collaborators, distributors and other third-party providers, are subject to extensive government regulation and oversight both in the U.S. and in foreign jurisdictions. The FDA and comparable agencies in other jurisdictions directly regulate many of our most critical business activities, including the conduct of preclinical and clinical studies, product manufacturing, advertising and promotion, product distribution, adverse event reporting and product risk management. Our interactions in the U.S. or abroad with physicians and other health care providers that prescribe or purchase our products are also subject to government regulation designed to prevent fraud and abuse in the sale and use of products and place significant restrictions on the marketing practices of health care companies. Health care companies such as ours are facing heightened scrutiny of their relationships with health care providers from anti-corruption enforcement officials. In addition, health care companies such as ours have been the target of lawsuits and investigations alleging violations of government regulation, including claims asserting submission of incorrect pricing information, impermissible off-label promotion of pharmaceutical products, payments intended to influence the referral of health care business, submission of false claims for government reimbursement, antitrust violations or violations related to environmental matters. There is also
40
enhanced scrutiny of company-sponsored patient assistance programs, including insurance premium and co-pay assistance programs and donations to third-party charities that provide such assistance. The U.S. government has challenged some of our donations to third-party charities that provide patient assistance. If we, or our vendors or donation recipients, are found to fail to comply with relevant laws, regulations or government guidance in the operation of these programs, we could be subject to significant fines or penalties. Risks relating to compliance with laws and regulations may be heightened as we continue to expand our global operations and enter new therapeutic areas with different patient populations, which may have different product distribution methods, marketing programs or patient assistance programs from those we currently utilize or support.
Conditions and regulations governing the health care industry are subject to change, with possible retroactive effect, including:
• | new laws, regulations or judicial decisions, or new interpretations of existing laws, regulations or judicial decisions, related to health care availability, pricing or marketing practices, compliance with wage and hour laws and other employment practices, method of delivery, payment for health care products and services, compliance with health information and data privacy and security laws and regulations, tracking and reporting payments and other transfers of value made to physicians and teaching hospitals, extensive anti-bribery and anti-corruption prohibitions, product serialization and labeling requirements and used product take-back requirements; |
• | changes in the FDA and foreign regulatory approval processes that may delay or prevent the approval of new products and result in lost market opportunity; |
• | government shutdowns or relocations may result in delays to the review and approval process, slowing the time necessary for new drug candidates to be reviewed and/or approved, which may adversely affect our business; |
• | requirements that provide for increased transparency of clinical trial results and quality data, such as the EMA's clinical transparency policy, which could impact our ability to protect trade secrets and competitively-sensitive information contained in approval applications or could be misinterpreted leading to reputational damage, misperception or legal action, which could harm our business; and |
• | changes in FDA and foreign regulations that may require additional safety monitoring, labeling changes, restrictions on product distribution or use or other measures after the introduction of our products to market, which could increase our costs of doing business, adversely affect the future permitted uses of approved products or otherwise adversely affect the market for our products. |
Violations of governmental regulation may be punishable by criminal and civil sanctions against us, including fines and civil monetary penalties and exclusion from participation in government programs, including Medicare and Medicaid, as well as against executives overseeing our business. In addition to penalties for violation of laws and regulations, we could be required to repay amounts we received from government payors or pay additional rebates and interest if we are found to have miscalculated the pricing information we have submitted to the government. We cannot ensure that our compliance controls, policies and procedures will in every instance protect us from acts committed by our employees, collaborators, partners or third-party providers that would violate the laws or regulations of the jurisdictions in which we operate. Whether or not we have complied with the law, an investigation into alleged unlawful conduct could increase our expenses, damage our reputation, divert management time and attention and adversely affect our business.
41
Our sales and operations are subject to the risks of doing business internationally.
We are increasing our presence in international markets, particularly emerging markets, subjecting us to many risks that could adversely affect our business and revenues. There is no guarantee that our efforts and strategies to expand sales in international markets will succeed. Emerging market countries may be especially vulnerable to periods of global and local political, legal, regulatory and financial instability and may have a higher incidence of corruption and fraudulent business practices. Further, certain countries may require local clinical trial data as part of the drug registration process in addition to global clinical trials, which can add to overall drug development and registration timelines. We may also be required to increase our reliance on third-party agents and unfamiliar operations and arrangements previously utilized by companies we partner or collaborate with or acquire in emerging markets.
Our sales and operations are subject to the risks of doing business internationally, including:
• | less favorable intellectual property or other applicable laws; |
• | the introduction or greater acceptance of competing products, including generics, biosimilars, prodrugs and products approved under abbreviated regulatory pathways; |
• | the inability to obtain necessary foreign regulatory or pricing approvals of products in a timely manner; |
• | limitations and additional pressures on our ability to obtain and maintain product pricing or receive price increases, including those resulting from governmental or regulatory requirements; |
• | the inability to successfully complete subsequent or confirmatory clinical trials in countries where our experience is limited; |
• | longer payment and reimbursement cycles and uncertainties regarding the collectability of accounts receivable; |
• | fluctuations in foreign currency exchange rates that may adversely impact our revenues, net income and value of certain of our investments; |
• | difficulties in staffing and managing international operations; |
• | the imposition of governmental controls; |
• | diverse data privacy and protection requirements; |
• | increasingly complex standards for complying with foreign laws and regulations that may differ substantially from country to country and may conflict with corresponding U.S. laws and regulations; |
• | the far-reaching anti-bribery and anti-corruption legislation in the U.K., including the Bribery Act, and elsewhere and escalation of investigations and prosecutions pursuant to such laws; |
• | the effects of the implementation of the U.K.’s departure from the E.U., known as Brexit; |
• | compliance with complex import and export control laws; |
• | restrictions on direct investments by foreign entities and trade restrictions; |
• | greater political or economic instability; |
• | changes in tax laws; |
• | the imposition of tariffs or embargoes and other trade restrictions, including the recent tariffs imposed by the U.S. and China and the possibility of additional tariffs or other trade restrictions relating to trade between the two countries; and |
• | the impact of public health epidemics on employees and the global economy, such as the coronavirus currently impacting China and elsewhere. |
In addition, our international operations are subject to regulation under U.S. law. For example, the FCPA prohibits U.S. companies and their representatives from paying, offering to pay, promising to pay or authorizing the payment of anything of value to any foreign government official, government staff member, political party or political
42
candidate for the purpose of obtaining or retaining business or to otherwise obtain favorable treatment or influence a person working in an official capacity. In many countries, the health care professionals we regularly interact with may meet the FCPA's definition of a foreign government official. Failure to comply with domestic or foreign laws could result in various adverse consequences, including: possible delay in approval or refusal to approve a product, recalls, seizures or withdrawal of an approved product from the market, disruption in the supply or availability of our products or suspension of export or import privileges, the imposition of civil or criminal sanctions, the prosecution of executives overseeing our international operations and damage to our reputation. Any significant impairment of our ability to sell products outside of the U.S. could adversely impact our business and financial results.
We are building a large-scale biologics manufacturing facility, which will result in the incurrence of significant investment with no assurance that such investment will be recouped.
We believe we currently have sufficient large-scale manufacturing capacity to meet our near-term manufacturing requirements. However, in order to support our drug development pipeline, in 2015 we made the decision to expand our large molecule production capacity by building a large-scale biologics manufacturing facility in Solothurn, Switzerland with no assurance that the additional capacity would be required. We expect the Solothurn manufacturing facility to be partially operational by the end of 2020; however, there can be no assurance that we will be able to meet our expected timeline. If there are delays in bringing the Solothurn manufacturing facility online, we may not have sufficient large-scale manufacturing capacity to meet our long-term manufacturing requirements.
In addition, we have made significant investments in connection with the building of this manufacturing facility with no assurance that such investment will be recouped. If we are unable to adequately and timely manufacture and supply our products and product candidates or if we do not fully utilize our manufacturing facilities, our business may be harmed. Charges resulting from excess capacity would have a negative effect on our financial condition and results of operations.
Manufacturing issues could substantially increase our costs, limit supply of our products and/or reduce our revenues.
The process of manufacturing our products is complex, highly regulated and subject to numerous risks, including:
• | Risks of Reliance on Third Parties and Single Source Providers. We rely on third-party suppliers and manufacturers for many aspects of our manufacturing process for our products and product candidates. In some cases, due to the unique manner in which our products are manufactured, we rely on single source providers of raw materials and manufacturing supplies. These third parties are independent entities subject to their own unique operational and financial risks that are outside of our control. These third parties may not perform their obligations in a timely and cost-effective manner or in compliance with applicable regulations, and they may be unable or unwilling to increase production capacity commensurate with demand for our existing or future products. Finding alternative providers could take a significant amount of time and involve significant expense due to the specialized nature of the services and the need to obtain regulatory approval of any significant changes to our suppliers or manufacturing methods. We cannot be certain that we could reach agreement with alternative providers or that the FDA or other regulatory authorities would approve our use of such alternatives. |
• | Risks Relating to Compliance with cGMP. We and our third-party providers are generally required to maintain compliance with cGMP and other stringent requirements and are subject to inspections by the FDA and comparable agencies in other jurisdictions to confirm such compliance. Any delay, interruption or other issues that arise in the manufacture, fill-finish, packaging or storage of our products as a result of a failure of our facilities or the facilities or operations of third parties to pass any regulatory agency inspection could significantly impair our ability to develop and commercialize our products. Significant noncompliance could also result in the imposition of monetary penalties or other civil or criminal sanctions and damage our reputation. |
• | Global Bulk Supply Risks. We rely on our principal manufacturing facilities for the production of drug substance for our large molecule products and product candidates. Our global bulk supply of these products and product candidates depends on the uninterrupted and efficient operation of these facilities, which could be adversely affected by equipment failures, labor shortages, natural disasters, power failures, cyber-attacks and numerous other factors. In addition, we are building a large-scale biologics manufacturing facility in Solothurn, Switzerland, which we expect to be partially operational by the end of 2020. However, there can be no assurance that we will be able to meet our expected timeline. If there are delays in bring |
43
the Solothurn manufacturing facility online, we may not have sufficient large-scale manufacturing capacity to meet our long-term manufacturing requirements.
• | Risk of Product Loss. The manufacturing process for our products is extremely susceptible to product loss due to contamination, oxidation, equipment failure or improper installation or operation of equipment or vendor or operator error. Even minor deviations from normal manufacturing processes could result in reduced production yields, product defects and other supply disruptions. If microbial, viral or other contaminations are discovered in our products or manufacturing facilities, we may need to close our manufacturing facilities for an extended period of time to investigate and remediate the contaminant. |
Any adverse developments affecting our manufacturing operations or the operations of our third-party suppliers and manufacturers may result in shipment delays, inventory shortages, lot failures, product withdrawals or recalls or other interruptions in the commercial supply of our products. We may also have to take inventory write-offs and incur other charges and expenses for products that fail to meet specifications, undertake costly remediation efforts or seek more costly manufacturing alternatives. Such developments could increase our manufacturing costs, cause us to lose revenues or market share as patients and physicians turn to competing therapeutics, diminish our profitability or damage our reputation.
In addition, although we have business continuity plans to reduce the potential for manufacturing disruptions or delays and reduce the severity of a disruptive event, there is no guarantee that these plans will be adequate, which could adversely affect our business and operations.
Our success in commercializing biosimilars developed by Samsung Bioepis is subject to risks and uncertainties inherent in the development, manufacture and commercialization of biosimilars. If Samsung Bioepis is unsuccessful in the development, manufacture and commercialization of biosimilars, we may not realize the anticipated benefits of our investment in Samsung Bioepis.
Our success in commercializing biosimilars developed by Samsung Bioepis is subject to a number of risks, including:
• | Reliance on Third Parties. We are dependent on the efforts of Samsung Bioepis and other third parties over whom we have limited or no control in the development and manufacturing of biosimilars products. In addition, following the divestiture of our Hillerød, Denmark manufacturing operations, we are dependent on FUJIFILM for the manufacture of biosimilar products. If Samsung Bioepis, FUJIFILM or other third parties fail to perform successfully, we may not realize the anticipated benefits of our investment in Samsung Bioepis; |
• | Regulatory Compliance. Biosimilar products may face regulatory hurdles or delays due to the evolving and uncertain regulatory and commercial pathway of biosimilars products in certain jurisdictions; |
• | Intellectual Property and Regulatory Challenges. Biosimilar products may face extensive patent clearances, patent infringement litigation, injunctions or regulatory challenges, which could prevent the commercial launch of a product or delay it for many years or result in imposition of monetary damages, penalties or other civil sanctions and damage our reputation; |
• | Failure to Gain Market and Patient Acceptance. Market success of biosimilar products will be adversely affected if patients, physicians and/or payors do not accept biosimilar products as safe and efficacious products offering a more competitive price or other benefit over existing therapies; |
• | Ability to Provide Adequate Supply. Manufacturing biosimilars is complex. If we encounter any manufacturing or supply chain difficulties, we may be unable to meet higher than anticipated demand. In addition, following the divestiture of our Hillerød, Denmark manufacturing operations, we are dependent on FUJIFILM for the manufacture of biosimilar products. FUJIFILM may not perform their obligations in a timely and cost effective manner or in compliance with applicable regulations and may be unable or unwilling to increase production capacity commensurate with demand for our existing or future biosimilar products; |
• | Competitive Challenges. Biosimilar products face significant competition, including from innovator products and from biosimilar products offered by other companies. In some jurisdictions, local tendering processes may restrict biosimilar products from being marketed and sold in those jurisdictions. The number of competitors in a jurisdiction, the timing of approval and the ability to market biosimilar products successfully in a timely and cost-effective manner are additional factors that may impact our success and/or the success of Samsung Bioepis in this business area; and |
44
• | Legal and Regulatory Requirements. Any improper conduct or actions on the part of Samsung Bioepis or our joint venture partner, Samsung BioLogics, could damage our reputation and be distracting to management. In particular, Samsung BioLogics is currently subject to an ongoing criminal investigation, which may impact the operations of Samsung Bioepis and its business or divert the attention of the Samsung Bioepis management team from its ongoing operations and business. |
If Samsung Bioepis is unsuccessful in the development, manufacture and commercialization of biosimilar products, we may not realize the anticipated benefits of our investment in Samsung Bioepis.
In addition, as Samsung Bioepis is a privately-held entity, our ability to liquidate our investment in Samsung Bioepis may be limited and we may realize significantly less than the value of such investment.
Our operating results are subject to significant fluctuations.
Our quarterly revenues, expenses and net income (loss) have fluctuated in the past and are likely to fluctuate significantly in the future due to the risks described in these Risk Factors as well as the timing of charges and expenses that we may take. We have recorded, or may be required to record, charges that include:
• | the cost of restructurings or other initiatives to streamline our operations and reallocate resources; |
• | impairments with respect to investments, fixed assets and long-lived assets, including in-process research and development (IPR&D) and other intangible assets; |
• | inventory write-downs for failed quality specifications, charges for excess or obsolete inventory and charges for inventory write downs relating to product suspensions, expirations or recalls; |
• | changes in the fair value of contingent consideration; |
• | bad debt expenses and increased bad debt reserves; |
• | outcomes of litigation and other legal or administrative proceedings, regulatory matters and tax matters; |
• | milestone payments under license and collaboration agreements; |
• | payments in connection with acquisitions, divestitures and other business development activities; and |
• | failure to meet certain contractual commitments, including, for example, the minimum batch production commitment guarantees we have provided as part of the transaction with FUJIFILM. |
Our revenues and certain assets and liabilities are also subject to foreign currency exchange rate fluctuations due to the global nature of our operations. Although we have foreign currency forward contracts to hedge specific forecasted transactions denominated in foreign currencies, our efforts to mitigate the impact of fluctuating currency exchange rates may not be successful. As a result, currency fluctuations among our reporting currency, the U.S. dollar, and other currencies in which we do business will affect our operating results, often in unpredictable ways. Our net income may also fluctuate due to the impact of charges we may be required to take with respect to foreign currency hedge transactions. In particular, we may incur higher than expected charges from early termination of a hedge relationship.
Our operating results during any one period do not necessarily suggest the anticipated results of future periods.
Our effective tax rate fluctuates, and we may incur obligations in tax jurisdictions in excess of accrued amounts.
As a global biopharmaceutical company, we are subject to taxation in numerous countries, states and other jurisdictions. As a result, our effective tax rate is derived from a combination of applicable tax rates (including withholding taxes) in the various places that we operate. In preparing our financial statements, we estimate the amount of tax that will become payable in each of such places. Our effective tax rate may be different than experienced in the past due to numerous factors, including changes in the mix of our profitability from country to country, the results of examinations and audits of our tax filings, adjustments to the value of our uncertain tax positions, interpretations by tax authorities or other bodies with jurisdiction, the result of tax cases, changes in accounting for income taxes and changes in tax laws either prospectively or retrospectively (including by regulation). Any of these factors could cause us to experience an effective tax rate significantly different from previous periods or our current expectations.
In addition, our inability to secure or sustain acceptable arrangements with tax authorities and future changes in the tax laws, among other things, may result in tax obligations in excess of amounts accrued in our financial
45
statements.
The Tax Cuts and Jobs Act of 2017 (2017 Tax Act) resulted in significant changes to the U.S. corporate income tax system. These changes include a federal statutory rate reduction from 35% to 21%, the elimination or reduction of certain domestic deductions and credits and limitations on the deductibility of interest expense and executive compensation. The 2017 Tax Act also transitions international taxation from a worldwide system to a modified territorial system, which has the effect of subjecting certain earnings of our foreign subsidiaries and collaborations to immediate U.S. taxation as global intangible low-taxed income (GILTI) or Subpart F income, and includes base erosion prevention measures on U.S. earnings and the reduced effective tax rate on income that comes from U.S. exports, called Foreign Derived Intangible Income. These changes became effective in 2018.
The 2017 Tax Act also includes a one-time mandatory deemed repatriation tax on accumulated foreign subsidiaries' previously untaxed foreign earnings (the Transition Toll Tax). The Transition Toll Tax will be paid over an eight-year period, which started in 2018, and will not accrue interest.
Our estimates concerning the impact of the 2017 Tax Act on our accounting and on our business remain subject to developing interpretations of the provisions of the 2017 Tax Act. U.S. Treasury regulations, administrative interpretations or court decisions interpreting the 2017 Tax Act may require further adjustments and changes in our estimates, which could have a material adverse effect on our business, results of operations or financial condition.
The Swiss Federal Act on Tax Reform and AHV Financing (TRAF) will result in significant changes to the Swiss cantonal income tax system. These changes include the elimination of historic favorable cantonal tax regimes, the introduction of a patent box regime and the introduction of a research and development super deduction. The TRAF also provides for transitional rules to lessen the immediate impact of the elimination of the favorable cantonal tax regimes. These changes became effective on January 1, 2020. In response to the TRAF, each canton must enact cantonal tax reform to comply with the framework provided by the TRAF and are also expected to lower the statutory tax rate to compensate for the elimination of the historic favorable cantonal tax regimes. We will account for the impact of the TRAF and the specific cantonal tax reform changes in the period in which each canton in which we operate enacts the cantonal tax reform. Zug, a canton in which we operate, enacted cantonal tax reform in the third quarter of 2019 and Solothurn, another canton in which we operate, will hold a public referendum on the enactment of cantonal tax reform on February 9, 2020. Upon the enactment of Zug cantonal tax reform, we were required to remeasure our Swiss deferred tax assets and liabilities, to account for the elimination of the historic favorable cantonal tax regimes, the impact of the transitional rules and the change in the statutory cantonal tax rate. Further remeasurement of our Swiss deferred tax assets and liabilities could have a significant impact on our income tax provision in the period of enactment.
In addition, the enactment of some or all of the recommendations set forth or that may be forthcoming in the Organization for Economic Cooperation and Development’s project on “Base Erosion and Profit Shifting” (BEPS) by tax authorities and economic blocs in the countries in which we operate, could unfavorably impact our effective tax rate. These initiatives focus on common international principles for the entitlement to taxation of global corporate profits and minimum global tax rates.
Our investments in properties may not be fully realized.
We own or lease real estate primarily consisting of buildings that contain research laboratories, office space and manufacturing operations. For strategic or other operational reasons, we may decide to consolidate or co-locate certain aspects of our business operations or dispose of one or more of our properties, some of which may be located in markets that are experiencing high vacancy rates and decreasing property values. If we determine that the fair value of any of our owned properties is lower than their book value, we may not realize the full investment in these properties and incur significant impairment charges or additional depreciation when the expected useful lives of certain assets have been shortened due to the anticipated closing of facilities. If we decide to fully or partially vacate an owned or leased property, we may incur significant cost, including facility closing costs, employee separation and retention expenses, lease termination fees, rent expense in excess of sublease income and impairment of leasehold improvements and accelerated depreciation of assets. Any of these events may have an adverse impact on our results of operations.
Our portfolio of marketable securities is subject to market, interest and credit risk that may reduce its value.
We maintain a portfolio of marketable securities for investment of our cash. Changes in the value of our portfolio of marketable securities could adversely affect our earnings. In particular, the value of our investments may decline due to increases in interest rates, downgrades of the bonds and other securities included in our portfolio, instability in the global financial markets that reduces the liquidity of securities included in our portfolio, declines in
46
the value of collateral underlying the securities included in our portfolio and other factors. Each of these events may cause us to record charges to reduce the carrying value of our investment portfolio or sell investments for less than our acquisition cost. Although we attempt to mitigate these risks through diversification of our investments and continuous monitoring of our portfolio's overall risk profile, the value of our investments may nevertheless decline.
There can be no assurance that we will continue to repurchase shares or that we will repurchase shares at favorable prices.
From time to time our Board of Directors authorizes share repurchase programs, including our March 2019 Share Repurchase Program and our December 2019 Share Repurchase Program. The amount and timing of share repurchases are subject to capital availability and our determination that share repurchases are in the best interest of our shareholders and are in compliance with all respective laws and our agreements applicable to the repurchase of shares. Our ability to repurchase shares will depend upon, among other factors, our cash balances and potential future capital requirements for strategic transactions, our results of operations, our financial condition and other factors beyond our control that we may deem relevant. A reduction in repurchases under, or the completion of, our 2019 share repurchase programs could have a negative effect on our stock price. We can provide no assurance that we will repurchase shares at favorable prices, if at all.
We may not be able to access the capital and credit markets on terms that are favorable to us.
We may seek access to the capital and credit markets to supplement our existing funds and cash generated from operations for working capital, capital expenditure and debt service requirements and other business initiatives. The capital and credit markets have experienced extreme volatility and disruption in the past, which leads to uncertainty and liquidity issues for both borrowers and investors. In the event of adverse capital and credit market conditions, we may be unable to obtain capital or credit market financing on favorable terms. Changes in credit ratings issued by nationally recognized credit rating agencies could also adversely affect our cost of financing and the market price of our securities.
Our indebtedness could adversely affect our business and limit our ability to plan for or respond to changes in our business.
Our indebtedness, together with our significant contingent liabilities, including milestone and royalty payment obligations, could have important consequences to our business; for example, such obligations could:
• | increase our vulnerability to general adverse economic and industry conditions; |
• | limit our ability to access capital markets and incur additional debt in the future; |
• | require us to dedicate a substantial portion of our cash flow from operations to payments on our indebtedness, thereby reducing the availability of our cash flow for other purposes, including business development efforts, research and development and mergers and acquisitions; and |
• | limit our flexibility in planning for, or reacting to, changes in our business and the industry in which we operate, thereby placing us at a competitive disadvantage compared to our competitors that have less debt. |
Our business involves environmental risks, which include the cost of compliance and the risk of contamination or injury.
Our business and the business of several of our strategic partners involve the controlled use of hazardous materials, chemicals, biologics and radioactive compounds. Although we believe that our safety procedures for handling and disposing of such materials comply with state, federal and foreign standards, there will always be the risk of accidental contamination or injury. If we were to become liable for an accident, or if we were to suffer an extended facility shutdown, we could incur significant costs, damages and penalties that could harm our business. Manufacturing of our products and product candidates also requires permits from government agencies for water supply and wastewater discharge. If we do not obtain appropriate permits, including permits for sufficient quantities of water and wastewater, we could incur significant costs and limits on our manufacturing volumes that could harm our business.
The illegal distribution and sale by third parties of counterfeit or unfit versions of our products or stolen products could have a negative impact on our reputation and business.
Third parties might illegally distribute and sell counterfeit or unfit versions of our products, which do not meet our rigorous manufacturing, distribution and testing standards. A patient who receives a counterfeit or unfit drug may
47
be at risk for a number of dangerous health consequences. Our reputation and business could suffer harm as a result of counterfeit or unfit drugs sold under our brand name. In addition, inventory that is stolen from warehouses, plants or while in-transit, and that is subsequently improperly stored and sold through unauthorized channels, could adversely impact patient safety, our reputation and our business.
The increasing use of social media platforms presents new risks and challenges.
Social media is increasingly being used to communicate about our products and the diseases our therapies are designed to treat. Social media practices in the biopharmaceutical industry continue to evolve and regulations relating to such use are not always clear. This evolution creates uncertainty and risk of noncompliance with regulations applicable to our business. For example, patients may use social media channels to comment on the effectiveness of a product or to report an alleged adverse event. When such disclosures occur, there is a risk that we fail to monitor and comply with applicable adverse event reporting obligations or we may not be able to defend the company or the public's legitimate interests in the face of the political and market pressures generated by social media due to restrictions on what we may say about our products. There is also a risk of inappropriate disclosure of sensitive information or negative or inaccurate posts or comments about us on any social networking website. If any of these events were to occur or we otherwise fail to comply with applicable regulations, we could incur liability, face overly restrictive regulatory actions or incur other harm to our business.
Some of our collaboration agreements contain change in control provisions that may discourage a third party from attempting to acquire us.
Some of our collaboration agreements include change in control provisions that could reduce the potential acquisition price an acquirer is willing to pay or discourage a takeover attempt that could be viewed as beneficial to shareholders. Upon a change in control, some of these provisions could trigger reduced milestone, profit or royalty payments to us or give our collaboration partner rights to terminate our collaboration agreement, acquire operational control or force the purchase or sale of the programs that are the subject of the collaboration.
Item 1B. Unresolved Staff Comments
None.
Item 2. Properties
Below is a summary of our owned and leased properties as of December 31, 2019.
Massachusetts
In Cambridge, MA we own approximately 508,000 square feet of real estate space, consisting of a building that houses a research laboratory and a cogeneration plant totaling approximately 263,000 square feet and a building that contains research, development and quality laboratories totaling approximately 245,000 square feet.
In addition, we lease a total of approximately 1,157,000 square feet in Massachusetts, which is summarized as follows:
• | 800,000 square feet in Cambridge, MA, which is comprised of offices for our corporate headquarters and other administrative and development functions and laboratories, of which 289,000 square feet is subleased by multiple companies for general office space, laboratories and manufacturing facilities; and |
• | 357,000 square feet of office space in Weston, MA, of which 174,000 square feet is subleased through the remaining term of our lease agreement. |
Our Massachusetts lease agreements expire at various dates through the year 2028.
North Carolina
In RTP, NC we own approximately 1,022,000 square feet of real estate space, which is summarized as follows:
• | 357,000 square feet of laboratory and office space; |
• | 188,000 square foot multi-purpose facility, including an ASO manufacturing suite and administrative space; |
• | 175,000 square feet related to a large-scale biologics manufacturing facility; |
• | 105,000 square feet related to a small-scale biologics manufacturing facility; |
48
• | 84,000 square feet of warehouse space and utilities; |
• | 70,000 square feet related to a parenteral fill-finish facility; and |
• | 43,000 square feet related to a large-scale purification facility. |
In addition, we lease approximately 40,000 square feet of warehouse space in Durham, NC.
Switzerland
In order to support our drug development pipeline, we are building a large-scale biologics manufacturing facility in Solothurn, Switzerland. We expect this facility to be partially operational by the end of 2020. Upon completion, the facility will include 393,000 square feet related to a large-scale biologics manufacturing facility, 290,000 square feet of warehouse, utilities and support space and 51,000 square feet of administrative space.
Other International
We lease office space in Baar, Switzerland, our international headquarters; the U.K.; Germany; France; Denmark and numerous other countries. Our international lease agreements expire at various dates through the year 2030.
Item 3. Legal Proceedings
For a discussion of legal matters as of December 31, 2019, please read Note 20, Litigation, to our consolidated financial statements included in this report, which is incorporated into this item by reference.
Item 4. Mine Safety Disclosures
Not applicable.
49
PART II
Item 5. Market for Registrant’s Common Equity, Related Stockholder Matters and Issuer Purchases of Equity Securities
Market and Stockholder Information
Our common stock trades on The Nasdaq Global Select Market under the symbol “BIIB.” As of February 4, 2020, there were approximately 540 shareholders of record of our common stock.
Dividends
We have not paid cash dividends since our inception. While we historically have not paid cash dividends and do not have a current intention to pay cash dividends, we continually review our capital allocation strategies, including, among other things, payment of cash dividends, share repurchases and acquisitions.
Issuer Purchases of Equity Securities
The following table summarizes our common stock repurchase activity during the fourth quarter of 2019:
Period | Total Number of Shares Purchased (#) | Average Price Paid per Share ($) | Total Number of Shares Purchased as Part of Publicly Announced Programs (#) | Approximate Dollar Value of Shares That May Yet Be Purchased Under Our Programs ($ in millions) | |||||||||
October 2019 | 3,215,407 | $ | 238.71 | 3,215,407 | $ | 2,604.7 | |||||||
November 2019 | 1,550,825 | $ | 292.01 | 1,550,825 | $ | 2,151.8 | |||||||
December 2019 | 2,928,634 | $ | 297.99 | 2,928,634 | $ | 6,279.1 | |||||||
Total | 7,694,866 | $ | 272.01 | ||||||||||
In December 2019 our Board of Directors authorized our December 2019 Share Repurchase Program, which is a program to repurchase up to $5.0 billion of our common stock. Our December 2019 Share Repurchase Program does not have an expiration date. All share repurchases under our December 2019 Share Repurchase Program will be retired. We did not repurchase shares of our common stock under our December 2019 Share Repurchase Program during the year ended December 31, 2019.
In March 2019 our Board of Directors authorized our March 2019 Share Repurchase Program, which is a program to repurchase up to $5.0 billion of our common stock. Our March 2019 Share Repurchase Program does not have an expiration date. All share repurchases under our March 2019 Share Repurchase Program will be retired. Under our March 2019 Share Repurchase Program, we repurchased and retired approximately 14.7 million shares of our common stock at a cost of approximately $3.7 billion during the year ended December 31, 2019.
In August 2018 our Board of Directors authorized a program to repurchase up to $3.5 billion of our common stock (2018 Share Repurchase Program), which was completed as of June 30, 2019. All share repurchases under our 2018 Share Repurchase Program were retired. Under our 2018 Share Repurchase Program, we repurchased and retired approximately 8.9 million shares of our common stock at a cost of approximately $2.1 billion during the year ended December 31, 2019.
50
Performance Graph
The performance graph below compares the five-year cumulative total stockholder return on our common stock, the Nasdaq Pharmaceutical Index, the S&P 500 Index and the Nasdaq Biotechnology Index.
On February 1, 2017, we completed the spin-off of our hemophilia business, Bioverativ Inc. (Bioverativ), as an independent, publicly traded company. In connection with the spin-off, each Biogen shareholder received one share of Bioverativ common stock for every two shares of Biogen common stock they owned. For additional information on the spin-off of our hemophilia business, please read Note 3, Hemophilia Spin-Off, to our consolidated financial statements included in our Annual Report on Form 10-K for the year ended December 31, 2018 (2018 Form 10-K).
The performance graph below assumes the investment of $100.00 on December 31, 2014, in our common stock and each of the three indexes, with dividends being reinvested. Our stock prices have been adjusted for the effect of the spin-off of our hemophilia business. The five-year cumulative total stockholder return for Biogen does not reflect the reinvestment by Biogen shareholders of the distribution they received in connection with the spin-off of our hemophilia business or any subsequent increase or decrease in value of Bioverativ stock subsequent to the spin-off.
The stock price performance in the graph below is not necessarily indicative of future price performance.
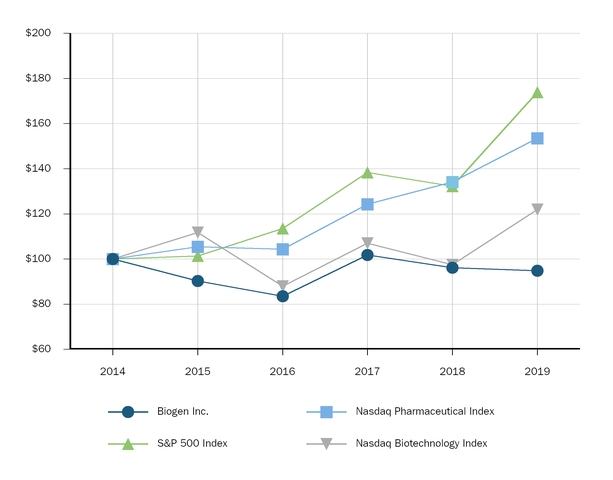
2014 | 2015 | 2016 | 2017 | 2018 | 2019 | |||||||
Biogen Inc. | $100.00 | $90.25 | $83.54 | $101.74 | $96.11 | $94.77 | ||||||
Nasdaq Pharmaceutical Index | $100.00 | $105.43 | $104.29 | $124.23 | $134.11 | $153.57 | ||||||
S&P 500 Index | $100.00 | $101.38 | $113.51 | $138.29 | $132.23 | $173.86 | ||||||
Nasdaq Biotechnology Index | $100.00 | $111.77 | $87.91 | $106.95 | $97.47 | $121.94 | ||||||
The information included under the heading Performance Graph is “furnished” and not “filed” for purposes of Section 18 of the Securities Exchange Act, or otherwise subject to the liabilities of that section, nor shall it be deemed to be “soliciting material” subject to Regulation 14A or incorporated by reference in any filing under the Securities Act of 1933 or the Securities Exchange Act of 1934.
51
Item 6. Selected Financial Data
BIOGEN INC. AND SUBSIDIARIES
SELECTED FINANCIAL DATA
Our results of operations are summarized as follows: | |||||||||||||||||||
For the Years Ended December 31, | |||||||||||||||||||
2019 | 2018 | 2017 | 2016 | 2015 | |||||||||||||||
(In millions, except per share amounts) | |||||||||||||||||||
Results of Operations (1) | |||||||||||||||||||
Product revenues, net (2) | $ | 11,379.8 | $ | 10,886.8 | $ | 10,354.7 | $ | 9,817.9 | $ | 9,188.5 | |||||||||
Revenues from anti-CD20 therapeutic programs | 2,290.4 | 1,980.2 | 1,559.2 | 1,314.5 | 1,339.2 | ||||||||||||||
Other revenues | 707.7 | 585.9 | 360.0 | 316.4 | 236.1 | ||||||||||||||
Total revenues | 14,377.9 | 13,452.9 | 12,273.9 | 11,448.8 | 10,763.8 | ||||||||||||||
Total cost and expenses (3) | 7,335.3 | 7,564.3 | 6,928.1 | 6,297.1 | 5,872.8 | ||||||||||||||
Income from operations | 7,042.6 | 5,888.6 | 5,345.8 | 5,151.7 | 4,891.0 | ||||||||||||||
Other income (expense), net | 83.3 | 11.0 | (217.0 | ) | (218.7 | ) | (123.7 | ) | |||||||||||
Income before income tax expense and equity in loss of investee, net of tax | 7,125.9 | 5,899.6 | 5,128.8 | 4,933.0 | 4,767.3 | ||||||||||||||
Income tax expense (4) | 1,158.0 | 1,425.6 | 2,458.7 | 1,237.3 | 1,161.6 | ||||||||||||||
Equity in loss of investee, net of tax | 79.4 | — | — | — | 12.5 | ||||||||||||||
Net income | 5,888.5 | 4,474.0 | 2,670.1 | 3,695.7 | 3,593.2 | ||||||||||||||
Net income (loss) attributable to noncontrolling interests, net of tax (5) | — | 43.3 | 131.0 | (7.1 | ) | 46.2 | |||||||||||||
Net income attributable to Biogen Inc. | $ | 5,888.5 | $ | 4,430.7 | $ | 2,539.1 | $ | 3,702.8 | $ | 3,547.0 | |||||||||
Diluted Earnings Per Share (6) | |||||||||||||||||||
Diluted earnings per share attributable to Biogen Inc. | $ | 31.42 | $ | 21.58 | $ | 11.92 | $ | 16.93 | $ | 15.34 | |||||||||
Weighted-average shares used in calculating diluted earnings per share attributable to Biogen Inc. | 187.4 | 205.3 | 213.0 | 218.8 | 231.2 | ||||||||||||||
Our financial condition is summarized as follows: | |||||||||||||||||||
As of December 31, | |||||||||||||||||||
(In millions) | 2019 | 2018 | 2017 | 2016 | 2015 | ||||||||||||||
Financial Condition (1) | |||||||||||||||||||
Cash, cash equivalents and marketable securities | $ | 5,884.0 | $ | 4,913.9 | $ | 6,746.3 | $ | 7,724.5 | $ | 6,188.9 | |||||||||
Total assets | $ | 27,234.3 | $ | 25,288.9 | $ | 23,652.6 | $ | 22,876.8 | $ | 19,504.8 | |||||||||
Notes payable, less current portion (7) | $ | 4,459.0 | $ | 5,936.5 | $ | 5,935.0 | $ | 6,512.7 | $ | 6,521.5 | |||||||||
Total Biogen Inc. shareholders’ equity (6) | $ | 13,343.2 | $ | 13,039.6 | $ | 12,612.8 | $ | 12,140.1 | $ | 9,372.8 | |||||||||
In addition to the following notes, the financial data included within the tables above should be read in conjunction with our consolidated financial statements and related notes and Item 7. Management’s Discussion and Analysis of Financial Condition and Results of Operations included in this report and our previously filed Annual Reports on Form 10-K.
(1) | On February 1, 2017, we completed the spin-off of our hemophilia business. Our consolidated results of operations and financial condition reflect the financial results of our hemophilia business for all periods through January 31, 2017. |
(2) | Product revenues, net reflect the impact of the following product launches: |
• | Commercial sales of VUMERITY in the U.S. began in the fourth quarter of 2019. |
52
• | Commercial sales of SPINRAZA in the U.S. began in the fourth quarter of 2016 and in rest of world markets beginning in the first quarter of 2017. |
• | Under our collaboration agreement with AbbVie Inc. (AbbVie), we began to recognize revenues on sales of ZINBRYTA to third parties in the E.U. in the third quarter of 2016. In March 2018 we and AbbVie announced the voluntary worldwide withdrawal of ZINBRYTA for RMS. |
• | Under our commercial agreement with Samsung Bioepis, we began to recognize revenues on sales of BENEPALI and FLIXABI to third parties in certain countries in Europe in the first and third quarters of 2016, respectively, and began to recognize revenues on sales of IMRALDI to third parties in certain countries in Europe in the fourth quarter of 2018. |
• | We stopped recognizing revenues from ALPROLIX and ELOCTATE effective February 1, 2017, upon the completion of the spin-off of our hemophilia business. |
(3) | Total cost and expenses included the following charges: |
• | Pre-tax research and development expenses related to upfront and milestone payments made upon entering into strategic agreements or achievement of specified development milestones totaling $253.8 million, $602.7 million, $494.0 million, $167.6 million and $158.2 million in 2019, 2018, 2017, 2016 and 2015, respectively. |
• | Impairment charges related to certain acquired intangible assets totaling $215.9 million, $366.1 million, $359.4 million and $12.2 million in 2019, 2018, 2017 and 2016, respectively. For additional information, please read Note 6, Intangible Assets and Goodwill, to our consolidated financial statements included in this report. |
• | Pre-tax research and development expenses of $486.2 million in 2018 related to the 2018 Ionis Agreement. For additional information on our collaboration arrangements with Ionis, please read Note 18, Collaborative and Other Relationships, to our consolidated financial statements included in this report. |
• | Pre-tax charges to acquired IPR&D totaling $112.5 million and $120.0 million in 2018 and 2017, respectively, for upfront payments made upon the closing of our asset purchase transactions, as the underlying assets had not yet reached technological feasibility. |
• | Pre-tax charge of $454.8 million in 2016 related to our January 2017 settlement and license agreement with Forward Pharma A/S (Forward Pharma). |
• | Pre-tax restructuring and other exit-related costs totaling $1.5 million, $12.0 million, $0.9 million, $103.6 million and $93.4 million in 2019, 2018, 2017, 2016 and 2015, respectively. |
(4) | Income tax expense included the following activities: |
• | Income tax expense in 2019 reflects a benefit of approximately $205.0 million related to an internal reorganization of certain intellectual property rights and the impact of the enactment of a new taxing regime in the country and certain cantons of Switzerland, which we refer to as Swiss Tax Reform, offset by a $68.9 million tax expense related to the divestiture of our subsidiary that owned our Hillerød, Denmark manufacturing operations. For additional information, please read Note 16, Income Taxes, to our consolidated financial statements included in this report. |
• | Income tax expense in 2018 reflects a net increase to expense of approximately $125.0 million recognized upon finalization of our estimates related to the Transition Toll Tax, the remeasurement of our deferred tax assets and liabilities, the impact of electing to record deferred taxes on GILTI and other aspects of the 2017 Tax Act. For additional information, please read Note 16, Income Taxes, to our consolidated financial statements included in this report. |
• | Income tax expense in 2017 includes a $1,173.6 million estimate pursuant to SEC Staff Accounting Bulletin No. 118. Our estimate included $989.6 million associated with the Transition Toll Tax and $184.0 million related to the impact of remeasuring our deferred tax balances to reflect the new federal statutory rate and other changes to U.S. tax law. |
(5) | Net income (loss) attributable to noncontrolling interests, net of tax included the following activities: |
• | Pre-tax charges of $50.0 million and $150.0 million for the years ended December 31, 2018 and 2017, respectively, for payments made under the terms of the Neurimmune Agreement in exchange for reductions in the previously negotiated royalty rates payable on products developed under the Neurimmune Agreement, including royalties payable on potential commercial sales of aducanumab. |
• | A pre-tax charge of $60.0 million for the year ended December 31, 2015, for a milestone payment due to Neurimmune upon the enrollment of the first patient in a Phase 3 study of aducanumab. |
For additional information on our collaboration arrangement with Neurimmune, please read Note 19, Investments in Variable Interest Entities, to our consolidated financial statements included in this report.
(6) | Total Biogen Inc. shareholders' equity reflects the repurchase of approximately 63.4 million shares of our common stock at a cost of approximately $17.6 billion between December 31, 2015 and December 31, 2019: |
53
• | During 2019 we repurchased and retired approximately 14.7 million and 8.9 million shares of our common stock at a cost of approximately $3.7 billion and $2.1 billion under our March 2019 Share Repurchase Program and our 2018 Share Repurchase Program, respectively. |
• | During 2018 we repurchased and retired approximately 4.3 million and 10.5 million shares of our common stock at a cost of approximately $1.4 billion and $3.0 billion under our 2018 Share Repurchase Program and a program authorized by our Board of Directors in July 2016 for the repurchase of up to $5.0 billion of our common stock (2016 Share Repurchase Program), respectively. |
• | During 2017 we repurchased and retired approximately 3.7 million shares of our common stock at a cost of approximately $1.0 billion under our 2016 Share Repurchase Program. |
• | During 2017 we repurchased approximately 1.2 million shares of our common stock at a cost of $365.4 million under a program authorized by our Board of Directors in February 2011 for the repurchase of up to 20.0 million shares of our common stock. |
• | During 2016 we repurchased and retired approximately 3.3 million shares of our common stock at a cost of approximately $1.0 billion under our 2016 Share Repurchase Program. |
• | During 2015 we repurchased and retired approximately 16.8 million shares of our common stock at a cost of $5.0 billion under a program authorized by our Board of Directors in May 2015 for the repurchase of up to $5.0 billion of our common stock. |
(7) | Notes payable, less current portion reflect: |
• | Our 2017 repayment of our 6.875% Senior Notes that were issued in 2008 with an aggregate principal amount of $550.0 million; and |
• | The issuance of our senior unsecured notes for an aggregate principal amount of $6.0 billion in September 2015. |
54
Item 7. Management’s Discussion and Analysis of Financial Condition and Results of Operations
The following discussion should be read in conjunction with our consolidated financial statements and the accompanying notes beginning on page F-1 of this report.
For our discussion of the year ended December 31, 2018, compared to the year ended December 31, 2017, please read Item 7. Management's Discussion and Analysis of Financial Condition and Results of Operations located in our 2018 Form 10-K.
Executive Summary
Introduction
Biogen is a global biopharmaceutical company focused on discovering, developing and delivering worldwide innovative therapies for people living with serious neurological and neurodegenerative diseases as well as related therapeutic adjacencies. Our core growth areas include MS and neuroimmunology; AD and dementia; neuromuscular disorders, including SMA and ALS; movement disorders, including Parkinson's disease; and ophthalmology. We are also focused on discovering, developing and delivering worldwide innovative therapies in our emerging growth areas of immunology; neurocognitive disorders; acute neurology; and pain. In addition, we commercialize biosimilars of advanced biologics. We support our drug discovery and development efforts through the commitment of significant resources to discovery, research and development programs and business development opportunities.
Our marketed products include TECFIDERA, AVONEX, PLEGRIDY, TYSABRI, VUMERITY and FAMPYRA for the treatment of MS; SPINRAZA for the treatment of SMA; and FUMADERM for the treatment of severe plaque psoriasis. We also have certain business and financial rights with respect to RITUXAN for the treatment of non-Hodgkin's lymphoma, CLL and other conditions; RITUXAN HYCELA for the treatment of non-Hodgkin's lymphoma and CLL; GAZYVA for the treatment of CLL and follicular lymphoma; OCREVUS for the treatment of PPMS and RMS; and other potential anti-CD20 therapies pursuant to our collaboration arrangements with Genentech. For additional information on our collaboration arrangements with Genentech, please read Note 18, Collaborative and Other Relationships, to our consolidated financial statements included in this report.
Our innovative drug development and commercialization activities are complemented by our biosimilar products that expand access to medicines
and reduce the cost burden for healthcare systems. Through Samsung Bioepis, our joint venture with Samsung BioLogics Co., Ltd., we market and sell BENEPALI, an etanercept biosimilar referencing ENBREL, IMRALDI, an adalimumab biosimilar referencing HUMIRA, and FLIXABI, an infliximab biosimilar referencing REMICADE, in certain countries in Europe and have exclusive rights to commercialize these products in China. Additionally, we have exclusive rights to commercialize two potential ophthalmology biosimilar products, SB11 referencing LUCENTIS and SB15 referencing EYLEA, in major markets worldwide, including the U.S., Canada, Europe, Japan and Australia. For additional information on our collaboration arrangements with Samsung Bioepis, please read Note 18, Collaborative and Other Relationships, to our consolidated financial statements included in this report.
Our revenues depend upon continued sales of our products, as well as the financial rights we have in our anti-CD20 therapeutic programs, and, unless we develop, acquire rights to and/or commercialize new products and technologies, we will be substantially dependent on sales from our products and our financial rights in our anti-CD20 therapeutic programs for many years.
In the longer term, our revenue growth will depend upon the successful clinical development, regulatory approval and launch of new commercial products as well as additional indications for our existing products, our ability to obtain and maintain patents and other rights related to our marketed products, assets originating from our research and development efforts and/or successful execution of external business development opportunities.
Business Environment
The biopharmaceutical industry and the markets in which we operate are intensely competitive. Many of our competitors are working to develop or have commercialized products similar to those we market or are developing and have considerable experience in undertaking clinical trials and in obtaining regulatory approval to market pharmaceutical products. In addition, the commercialization of certain of our own approved products, products of our collaborators and pipeline product candidates may negatively impact future sales of our existing products.
Our products continue to face increasing competitive pressures from the introduction of generic versions, prodrugs and biosimilars of existing products as well as products approved under abbreviated regulatory pathways. Such products are likely to be sold at substantially lower prices than branded products, which may significantly reduce both the price that we are able to charge for our products and the volume of products we sell. In addition, when
55
a generic version of one of our products is commercialized, it may, in some cases, be automatically substituted for our product and reduce our revenues in a short period of time.
Sales of our products depend, to a significant extent, on the availability and extent of adequate coverage, pricing and reimbursement from government health administration authorities, private health insurers and other organizations. When a new pharmaceutical product is approved, the availability of government and private reimbursement for that product may be uncertain, as is the pricing and amount for which that product will be reimbursed.
Drug prices are under significant scrutiny in the markets in which our products are prescribed. We expect drug pricing and other health care costs to continue to be subject to intense political and societal pressures on a global basis.
Our failure to obtain or maintain adequate coverage, pricing or reimbursement for our products could have an adverse effect on our business, reputation, revenues and results of operations, could curtail or eliminate our ability to adequately fund research and development programs for the discovery and commercialization of new products or could cause a decline or volatility in our stock price.
In addition to the impact of competition, pricing actions and other measures being taken worldwide designed to reduce healthcare costs and limit the overall level of government expenditures, our sales and operations could also be affected by other risks of doing business internationally, including the impact of foreign currency exchange fluctuations, changes in intellectual property legal protections and changes in trade regulations and procedures as well as the impact of the continued uncertainty of the credit and economic conditions in certain countries in Europe.
For additional information on our competition and pricing risks that could negatively impact our product sales, please read Item 1A. Risk Factors and Item 7A. Quantitative and Qualitative Disclosures About Market Risk included in this report.
Brexit
In June 2016 the U.K. electorate voted in a referendum to voluntarily depart from the E.U., known as Brexit. In March 2017 the U.K. government formally notified the European Council of its intention to leave the E.U. and began to negotiate the terms of its withdrawal and outline the future relationship between the U.K. and the E.U. upon exit, which occurred on January 31, 2020. Following the U.K.’s departure, there is now a transition period during which existing arrangements will remain in place until the end of 2020, allowing detailed discussions on the future relationship between the U.K. and the E.U. to take place.
The potential impact on our results of operations and liquidity resulting from Brexit remains unclear. The actual effects of Brexit will depend upon many factors and significant uncertainty remains with respect to the future relationship between the U.K. and the E.U. The final outcome of the discussions during the transition period may impact certain of our research, commercial and general business operations in the U.K. and the E.U., including the approval and supply of our products.
Compliance with any resulting regulatory mandates may prove challenging and the macroeconomic impact on our sales and consolidated results of operations from these developments remains unknown. We do not, however, expect Brexit to have a material impact on our consolidated results of operations as approximately 3.5%, 3.3% and 3.2% of our total product revenues in 2019, 2018 and 2017, respectively, were derived from U.K. sales.
We have implemented measures to meet E.U. legal and regulatory requirements and to continue to modify our business operations to prepare for the finalization of the terms of the U.K.'s separation from the E.U. However, we cannot predict the direction Brexit-related developments will take nor the impact of those developments on our European operations and the economies of the markets where we operate. Therefore, we will continue to monitor for developments in this area and assess any potential impact on our business and results of operations.
56
Financial Highlights
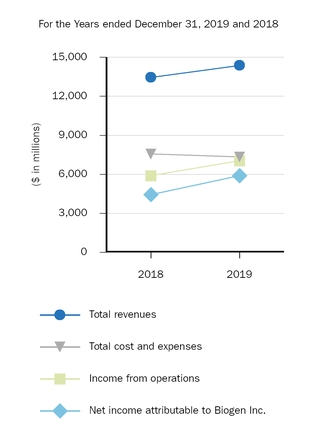
Diluted earnings per share attributable to Biogen Inc. were $31.42 for 2019, representing an increase of 45.6% over $21.58 in the same period in 2018.
As described below under Results of Operations, our net income and diluted earnings per share attributable to Biogen Inc. for the year ended December 31, 2019, compared to the year ended December 31, 2018, reflects the following:
• | Total revenues were $14,377.9 million for 2019, representing an increase of 6.9% over $13,452.9 million in 2018. |
• | Product revenues, net totaled $11,379.8 million for 2019, representing an increase of 4.5% over $10,886.8 million in 2018. This increase was primarily due to a 21.6% increase in revenues from SPINRAZA and a 35.4% increase in revenues from our biosimilar business. Product revenues, net, compared to the same period in 2018, further reflects the unfavorable impact of foreign currency exchange of $53.0 million. |
• | Revenues from anti-CD20 therapeutic programs totaled $2,290.4 million for 2019, representing an increase of 15.7% over $1,980.2 million in 2018. This increase was primarily due to an increase in royalty revenues on sales of OCREVUS. |
• | Other revenues totaled $707.7 million for 2019, representing an increase of 20.8% over $585.9 million in 2018. This increase was primarily due to higher revenues from our manufacturing and supply agreement with Bioverativ, partially offset by lower revenues from other contract manufacturing agreements. |
• | Total cost and expenses totaled $7,335.3 million for 2019, representing a decrease of 3.0% from $7,564.3 million in 2018. This decrease was primarily due to: |
◦ | a 12.2% decrease in research and development expense, primarily due to the $482.6 million net charge recognized in 2018 upon the closing of the 2018 Ionis Agreement; |
◦ | a 34.4% decrease in amortization and impairment of acquired intangible assets, primarily due to the $366.1 million impairment charges recognized in 2018, which lowered amortization expense in subsequent periods, partially offset by the $215.9 million impairment charges recognized in 2019; and |
◦ | a net change in (gain) loss on fair value remeasurement of contingent consideration, primarily due to the gain recognized on the remeasurement of our continent consideration obligation related to the Phase 2b study of BG00011 for the potential treatment of IPF. |
This decrease was partially offset by:
◦ | a 12.7% increase in selling, general and administrative expenses, primarily due to increased commercial and medical investments as well as the timing of spend on selling, general and administrative expense; and |
◦ | a 7.7% increase in cost of sales, primarily due to our sales in 2019 to Bioverativ of hemophilia-related inventory on hand as of December 31, 2018, and an increase in sales of products within our biosimilar business. |
• | Net income attributable to Biogen Inc. was favorably impacted by a decrease in our effective tax rate to 16.3% for the year ended December 31, 2019, from 24.2% for 2018, due in part to an internal reorganization of certain intellectual property rights, the impact of Swiss Tax Reform and the 2018 unfavorable impacts of U.S. Tax Reform. |
57
As described below under Financial Condition, Liquidity and Capital Resources:
• | We generated $7,078.6 million of net cash flows from operations for 2019, which were primarily driven by earnings. |
• | Cash, cash equivalents and marketable securities totaled approximately $5,884.0 million as of December 31, 2019. |
• | We repurchased and retired approximately 23.6 million shares of our common stock at a cost of approximately $5.8 billion during 2019 under our March 2019 Share Repurchase Program and our 2018 Share Repurchase Program. |
Acquisitions, Collaborative and Other Relationships
For additional information on our acquisitions, collaborative and other relationships discussed below, please read Note 2, Acquisitions, Note 3, Divestitures, Note 18, Collaborative and Other Relationships, and Note 19, Investments in Variable Interest Entities, to our consolidated financial statements included in this report.
Skyhawk Therapeutics, Inc.
In January 2019 we entered into a collaboration and research and development services agreement with Skyhawk pursuant to which the companies are leveraging Skyhawk's SkySTAR technology platform with the goal of discovering innovative small molecule treatments for patients with neurological diseases, including MS and SMA. In connection with this agreement, we made an upfront payment of $74.0 million to Skyhawk. We are responsible for the development and potential commercialization of any therapies resulting from this collaboration. In October 2019 we amended this agreement to add an additional discovery program. In connection with this amendment, we made a payment to Skyhawk of $15.0 million.
Acquisition of Nightstar Therapeutics plc
In June 2019 we completed our acquisition of all of the outstanding shares of NST, a clinical-stage gene therapy company focused on AAV treatments for inherited retinal disorders. As a result of this acquisition, we added two mid- to late-stage clinical assets, as well as preclinical programs, in ophthalmology. These assets include BIIB111, which is in Phase 3 development for the potential treatment of CHM, a rare, degenerative, X-linked inherited retinal disorder that leads to blindness and currently has no approved treatments, and BIIB112 (RPGR gene therapy), which is in Phase 2/3 development for the potential treatment of XLRP, which is a rare inherited retinal disease with no currently approved treatments.
Under the terms of the acquisition, we paid NST shareholders $25.50 in cash for each issued and outstanding NST share, which totaled $847.6 million.
Divestiture of Hillerød, Denmark Manufacturing Operations
In August 2019 we completed the sale of all of the outstanding shares of our subsidiary that owned our biologics manufacturing operations in Hillerød, Denmark to FUJIFILM. Upon the closing of this transaction, we received approximately $881.9 million in cash, which may be adjusted based on other contractual terms. In addition, we sold to FUJIFILM $41.8 million of raw materials that were remaining at the Hillerød facility on the closing date of this transaction.
Samsung Bioepis
In December 2019 we completed a transaction with Samsung Bioepis and secured the exclusive rights to commercialize two potential ophthalmology biosimilar products, SB11 referencing LUCENTIS and SB15 referencing EYLEA, in major markets worldwide, including the U.S., Canada, Europe, Japan and Australia. We also acquired an option to extend our existing commercial agreement with Samsung Bioepis for BENEPALI, IMRALDI and FLIXABI in Europe and obtained exclusive rights to commercialize these products in China. In connection with this transaction, we made an upfront payment of $100.0 million to Samsung Bioepis.
BIIB080 Option Exercise
In December 2019 we exercised our option with Ionis and obtained a worldwide, exclusive, royalty-bearing license to develop and commercialize BIIB080, an investigational treatment for AD.
Pfizer Inc.
In January 2020 we entered into an agreement to acquire PF-05251749, a novel CNS-penetrant small molecule inhibitor of CK1, for the potential treatment of patients with behavioral and neurological symptoms across various psychiatric and neurological diseases from Pfizer. In particular, we plan to develop the Phase 1 asset for the treatment of sundowning in AD and ISWRD in Parkinson’s disease. This transaction is subject to customary closing conditions, including the expiration of the applicable waiting period under the Hart-Scott-Rodino Antitrust Improvements Act of 1976 in the U.S. We expect this transaction to close in the first quarter of 2020.
58
Other Key Developments
VUMERITY
In October 2019 the FDA approved VUMERITY for the treatment of RMS. Under the terms of the license and collaboration agreement with Alkermes, we made milestone payments totaling $155.0 million to Alkermes following the FDA's approval of VUMERITY. In November 2019 VUMERITY became available in the U.S.
Aducanumab
In October 2019 we and our collaboration partner Eisai announced that we plan to pursue regulatory approval for aducanumab in the U.S. and that the Phase 3 EMERGE study met its primary endpoint showing a significant reduction in clinical decline. We believe that results from a subset of patients in the Phase 3 ENGAGE study who received sufficient exposure to high dose aducanumab support findings from EMERGE. The decision to file is based on a new analysis, conducted in consultation with the FDA, of a larger dataset from the Phase 3 EMERGE and ENGAGE trials that were discontinued in March 2019 following a futility analysis.
For additional information on our plans to file for regulatory approval for aducanumab, please read the
subsection entitled "Financial Condition, Liquidity and Capital Resources" included below.
Elenbecestat
In September 2019 we and our collaboration partner Eisai announced the decision to discontinue the global Phase 3 studies (MISSION AD1 and MISSION AD2) of the investigational oral BACE inhibitor elenbecestat in patients with early AD.
2019 Share Repurchase Programs
In March 2019 our Board of Directors authorized our March 2019 Share Repurchase Program, which is a program to repurchase up to $5.0 billion of our common stock. Our March 2019 Share Repurchase Program does not have an expiration date. All share repurchases under our March 2019 Share Repurchase Program will be retired.
In December 2019 our Board of Directors authorized our December 2019 Share Repurchase Program, which is a program to repurchase up to $5.0 billion of our common stock. Our December 2019 Share Repurchase Program does not have an expiration date. All share repurchases under our December 2019 Share Repurchase Program will be retired.
Results of Operations
Revenues
Revenues are summarized as follows:
For the Years Ended December 31, | % Change | ||||||||||||||||
2019 compared to 2018 | 2018 compared to 2017 | ||||||||||||||||
(In millions, except percentages) | 2019 | 2018 | 2017 | ||||||||||||||
Product revenues, net: | |||||||||||||||||
United States | $ | 6,713.8 | $ | 6,800.5 | $ | 7,017.1 | (1.3 | )% | (3.1 | )% | |||||||
Rest of world | 4,666.0 | 4,086.3 | 3,337.6 | 14.2 | % | 22.4 | % | ||||||||||
Total product revenues, net | 11,379.8 | 10,886.8 | 10,354.7 | 4.5 | % | 5.1 | % | ||||||||||
Revenues from anti-CD20 therapeutic programs | 2,290.4 | 1,980.2 | 1,559.2 | 15.7 | % | 27.0 | % | ||||||||||
Other revenues | 707.7 | 585.9 | 360.0 | 20.8 | % | 62.8 | % | ||||||||||
Total revenues | $ | 14,377.9 | $ | 13,452.9 | $ | 12,273.9 | 6.9 | % | 9.6 | % | |||||||
59
Product Revenues
Product revenues are summarized as follows:
For the Years Ended December 31, | % Change | ||||||||||||||||
2019 compared to 2018 | 2018 compared to 2017 | ||||||||||||||||
(In millions, except percentages) | 2019 | 2018 | 2017 | ||||||||||||||
Multiple Sclerosis (MS): | |||||||||||||||||
TECFIDERA | $ | 4,432.7 | $ | 4,274.1 | $ | 4,214.0 | 3.7 | % | 1.4 | % | |||||||
Interferon* | 2,101.8 | 2,363.0 | 2,645.8 | (11.1 | )% | (10.7 | )% | ||||||||||
TYSABRI | 1,892.2 | 1,864.0 | 1,973.1 | 1.5 | % | (5.5 | )% | ||||||||||
VUMERITY | 5.5 | — | — | ** | ** | ||||||||||||
FAMPYRA | 97.1 | 92.7 | 91.6 | 4.7 | % | 1.2 | % | ||||||||||
ZINBRYTA | — | 1.4 | 52.7 | (100.0 | )% | (97.3 | )% | ||||||||||
Subtotal: MS product revenues | 8,529.3 | 8,595.2 | 8,977.2 | (0.8 | )% | (4.3 | )% | ||||||||||
Spinal Muscular Atrophy: | |||||||||||||||||
SPINRAZA | 2,097.0 | 1,724.2 | 883.7 | 21.6 | % | 95.1 | % | ||||||||||
Biosimilars: | |||||||||||||||||
BENEPALI | 486.2 | 485.2 | 370.8 | 0.2 | % | 30.9 | % | ||||||||||
IMRALDI | 184.0 | 16.7 | — | 1,001.8 | % | ** | |||||||||||
FLIXABI | 68.1 | 43.2 | 9.0 | 57.6 | % | 380.0 | % | ||||||||||
Subtotal: Biosimilar product revenues | 738.3 | 545.1 | 379.8 | 35.4 | % | 43.5 | % | ||||||||||
Other: | |||||||||||||||||
FUMADERM | 15.2 | 22.3 | 39.6 | (31.8 | )% | (43.7 | )% | ||||||||||
Hemophilia: | |||||||||||||||||
ELOCTATE | — | — | 48.4 | ** | ** | ||||||||||||
ALPROLIX | — | — | 26.0 | ** | ** | ||||||||||||
Subtotal: Hemophilia product revenues | — | — | 74.4 | ** | ** | ||||||||||||
Total product revenues, net | $ | 11,379.8 | $ | 10,886.8 | $ | 10,354.7 | 4.5 | % | 5.1 | % | |||||||
* Interferon includes AVONEX and PLEGRIDY.
** Percentage not meaningful.
60
Multiple Sclerosis
TECFIDERA
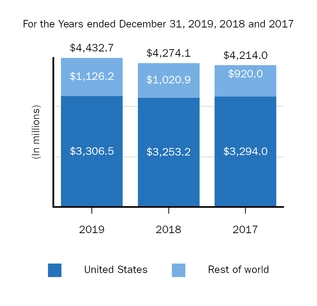
For 2019 compared to 2018, the 1.6% increase in U.S. TECFIDERA revenues was primarily due to a slight net price increase, offset by a small decrease in unit sales volume.
For 2019 compared to 2018, the 10.3% increase in rest of world TECFIDERA revenues was primarily due to increases in unit sales volume of 14%, primarily related to our European and Japanese markets, and the favorable impact of foreign currency exchange of $16.5 million, partially offset by pricing reductions in certain European countries.
In February 2020 the U.S. Patent Trial and Appeal Board (PTAB) decided that our U.S. Patent No. 8,399,514 (the ‘514 Patent) is patentable. The ‘514 Patent covers treatment of MS with 480 mg of dimethyl fumarate per day as provided for in our TECFIDERA label. This decision may be appealed.
The ‘514 Patent has also been challenged pursuant to the Hatch-Waxman Act in the U.S. District Courts of Delaware (the Delaware action) and West Virginia (the West Virginia action). We are awaiting a decision in the Delaware action and the trial in the West Virginia action is ongoing. If we receive an adverse judgment in either U.S. District Court action, we will appeal but we may face generic competition while our appeal is pending.
We will face TECFIDERA generic competition if an adverse PTAB or U.S. District Court decision is reached on appeal. In addition, we have entered into settlement agreements with some of the defendants in the Delaware action and we now anticipate TECFIDERA generic competition before the ‘514 Patent expires in February 2028. Generic competition
is expected to have an adverse impact on our TECFIDERA sales and our results of operations. For additional information, please read Note 20, Litigation, to our consolidated financial statements included in this report.
We anticipate an increase in TECFIDERA demand in rest of world in 2020, compared to 2019, notwithstanding the increasing competition from additional treatments for MS. We expect volume growth in our rest of world markets to offset volume declines in the U.S.
Interferon
AVONEX and PLEGRIDY
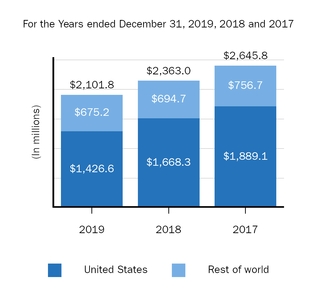
For 2019 compared to 2018, the 14.5% decrease in U.S. Interferon revenues was primarily due to a decrease in Interferon unit sales volumes of 13%, which was primarily attributable to patients transitioning to other MS therapies and a net price decrease.
For 2019 compared to 2018, the 2.8% decrease in rest of world Interferon revenues was primarily due to pricing reductions in certain European countries.
We expect that Interferon revenues will continue to decline in both the U.S. and rest of world markets in 2020, compared to 2019, as a result of increasing competition from our other MS products as well as other treatments for MS, including biosimilars, and pricing reductions in certain European markets.
AVONEX
For 2019, 2018 and 2017 U.S. AVONEX revenues totaled $1,202.1 million, $1,420.2 million and $1,593.6 million, respectively.
61
For 2019, 2018 and 2017 rest of world AVONEX revenues totaled $463.8 million, $495.3 million and $557.9 million, respectively.
PLEGRIDY
For 2019, 2018 and 2017 U.S. PLEGRIDY revenues totaled $224.5 million, $248.1 million and $295.5 million, respectively.
For 2019, 2018 and 2017 rest of world PLEGRIDY revenues totaled $211.4 million, $199.4 million and $198.8 million, respectively.
TYSABRI
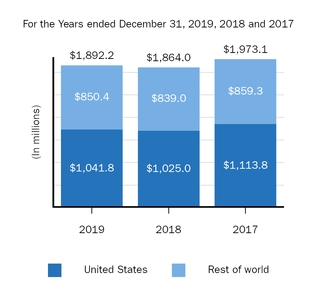
For 2019 compared to 2018, the 1.6% increase in U.S. TYSABRI revenues was primarily due to price increases, partially offset by a decrease in unit sales volumes of 4%.
For 2019 compared to 2018, the 1.4% increase in rest of world TYSABRI revenues was primarily due to an increase in unit sales volumes of 3%.
We anticipate TYSABRI demand to be stable on a global basis in 2020, compared to 2019, with expected volume declines in the U.S. due to increasing competition from additional treatments for MS, including OCREVUS, offset by volume growth in our rest of world markets, net of price reductions in certain rest of world countries.
Spinal Muscular Atrophy
SPINRAZA
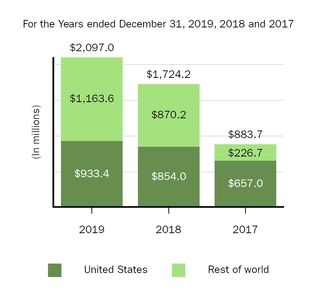
For 2019 compared to 2018, the 9.3% increase in U.S. SPINRAZA revenues was primarily due to increases in unit sales volume of 9%.
For 2019 compared to 2018, the 33.7% increase in rest of world SPINRAZA revenues was primarily due to an increase in unit sales volumes of 69%, partially offset by the unfavorable impact of foreign currency exchange of $43.5 million.
We expect that the rate at which SPINRAZA revenues will grow will moderate in 2020, compared to 2019, primarily due to a lower rate of new patient starts combined with the impact of loading dose dynamics as patients transition to dosing once every four months.
We face competition from a new gene therapy product that was approved in the U.S. in May 2019 for the treatment of SMA. Additionally, we are aware of other products in development that, if successfully developed and approved, may compete with SPINRAZA in the SMA market, including potential oral products. Future sales of SPINRAZA may be adversely affected by the commercialization of competing products.
For additional information on our collaboration arrangements with Ionis, please read Note 18, Collaborative and Other Relationships, to our consolidated financial statements included in this report.
62
Biosimilars
BENEPALI, IMRALDI and FLIXABI
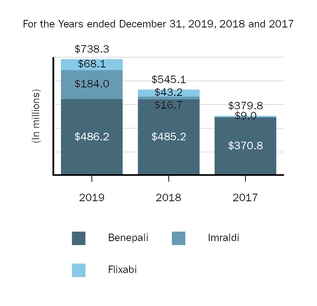
For 2019 compared to 2018, the 35.4% increase in biosimilar revenues was primarily due to the launch of IMRALDI in the fourth quarter of 2018, partially offset by the unfavorable impact of foreign currency exchange of $27.8 million.
In 2020 we expect strong revenue growth for our biosimilars business, primarily driven by the continued launch of IMRALDI in Europe, partially offset by price reductions in certain European countries.
In December 2019 we completed a transaction with Samsung Bioepis and secured the exclusive rights to commercialize two potential ophthalmology biosimilars, SB11 referencing LUCENTIS and SB15 referencing EYLEA, in major markets worldwide, including the U.S., Canada, Europe, Japan and Australia. We also acquired an option to extend our existing commercial agreement with Samsung Bioepis for BENEPALI, IMRALDI and FLIXABI in Europe and obtained exclusive rights to commercialize these products in China.
For additional information on our collaboration arrangements with Samsung Bioepis, please read Note 18, Collaborative and Other Relationships, to our consolidated financial statements included in this report.
Revenues from Anti-CD20 Therapeutic Programs
Genentech Inc. (Roche Group)
Our share of RITUXAN, including RITUXAN HYCELA, and GAZYVA collaboration operating profits in the U.S. and other revenues from anti-CD20 therapeutic programs are summarized in the table below. For purposes of this discussion we refer to RITUXAN and RITUXAN HYCELA collectively as RITUXAN.
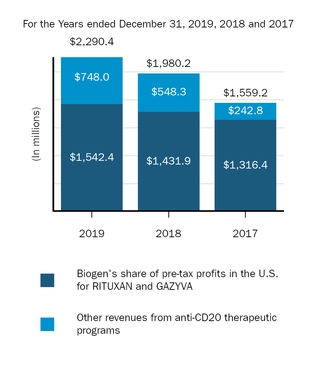
Biogen’s Share of Pre-tax Profits in the U.S. for RITUXAN and GAZYVA
The following table provides a summary of amounts comprising our share of pre-tax profits in the U.S. for RITUXAN and GAZYVA:
For the Years Ended December 31, | |||||||||||
(In millions) | 2019 | 2018 | 2017 | ||||||||
Product revenues, net | $ | 4,747.4 | $ | 4,484.3 | $ | 4,206.9 | |||||
Cost and expenses | 622.7 | 669.6 | 755.2 | ||||||||
Pre-tax profits in the U.S. | $ | 4,124.7 | $ | 3,814.7 | $ | 3,451.7 | |||||
Biogen's share of pre-tax profits | $ | 1,542.4 | $ | 1,431.9 | $ | 1,316.4 | |||||
Our share of RITUXAN annual pre-tax co-promotion profits in the U.S. in excess of $50.0 million decreased to 37.5% from 39% in the third quarter of 2017 as gross sales of GAZYVA in the U.S.
63
for the preceding 12-month period exceeded $150.0 million.
For 2019 compared to 2018, the increase in U.S. product revenues, net was primarily due to increased net sales of RITUXAN in the U.S. of 5.0%, which reflects an increase in unit sales volume of 3%, and selling price increases, partially offset by higher rates in discounts and allowances.
The increase in U.S. product revenues, net over 2018 also reflects an increase in GAZYVA unit sales volume of 21%.
For 2019 compared to 2018, the decrease in collaboration costs and expenses was primarily due to lower cost of sales and lower selling and marketing costs on RITUXAN and lower Branded Pharmaceutical Drug fee expenses for RITUXAN and GAZYVA.
We are aware of anti-CD20 molecules, including biosimilar products, in development that if successfully developed and approved, could compete with RITUXAN and GAZYVA in the oncology market. The introduction of a biosimilar product can result in a significant reduction in net sales for the relevant product, as other manufacturers typically offer their versions at lower prices. In November 2019 and January 2020 biosimilar products referencing RITUXAN were launched in the U.S. and this could adversely affect the pre-tax profits of our collaboration arrangements with Genentech, which could, in turn, adversely affect our co-promotion profits in the U.S. in future years.
Other Revenues from Anti-CD20 Therapeutic Programs
Other revenues from anti-CD20 therapeutic programs consist of royalty revenues on sales of OCREVUS and our share of pre-tax co-promotion profits from RITUXAN in Canada.
For 2019 compared to 2018, the increase in other revenues from anti-CD20 therapeutic programs was primarily due to the sales growth of OCREVUS. Royalty revenues recognized on sales of OCREVUS for the years ended December 31, 2019, 2018 and 2017, totaled $687.5 million, $478.3 million and $159.3 million, respectively.
OCREVUS royalty revenues are based on our estimates from third party and market research data of OCREVUS sales occurring during the corresponding period. Differences between actual and estimated royalty revenues will be adjusted for in the period in which they become known, which is expected to be the following quarter.
In March 2017 the FDA approved OCREVUS for the treatment of RMS and PPMS. Pursuant to the terms of our collaboration arrangements with Genentech, we receive a tiered royalty on U.S. net sales from 13.5% and increasing up to 24% if annual net sales exceed $900.0 million. There will be a 50% reduction to these royalties if a biosimilar to OCREVUS is approved in the U.S.
In addition, we receive a gross 3% royalty on net sales of OCREVUS outside the U.S., with the royalty period lasting 11 years from the first commercial sale of OCREVUS on a country-by-country basis. OCREVUS has been approved for the treatment of RMS and PPMS in the E.U. and certain other countries.
The commercialization of OCREVUS does not impact the percentage of the co-promotion profits we receive for RITUXAN or GAZYVA. Genentech is solely responsible for development and commercialization of OCREVUS and funding future costs. Genentech cannot develop OCREVUS in CLL, non-Hodgkin's lymphoma or rheumatoid arthritis.
For additional information on our relationship with Genentech, including information regarding the pre-tax profit-sharing formula and its impact on future revenues from anti-CD20 therapeutic programs, please read Note 18, Collaborative and Other Relationships, to our consolidated financial statements included in this report.
Other Revenues
Other revenues are summarized as follows:
For The Years Ended December 31, | % Change | ||||||||||||||||
2019 compared to 2018 | 2018 compared to 2017 | ||||||||||||||||
(In millions, except percentages) | 2019 | 2018 | 2017 | ||||||||||||||
Revenues from collaborative and other relationships | $ | 106.2 | $ | 87.8 | $ | 36.5 | 21.0 | % | 140.5 | % | |||||||
Other royalty and corporate revenues | 601.5 | 498.1 | 323.5 | 20.8 | % | 54.0 | % | ||||||||||
Total other revenues | $ | 707.7 | $ | 585.9 | $ | 360.0 | 20.8 | % | 62.8 | % | |||||||
64
Revenues from Collaborative and Other Relationships
Revenues from collaborative and other relationships primarily include revenues from our technical development services and manufacturing agreements with Samsung Bioepis and royalty revenues on biosimilar products from Samsung Bioepis.
Following the divestiture of our Hillerød, Denmark manufacturing operations in August 2019, FUJIFILM assumed responsibility for the manufacture of clinical and commercial quantities of bulk drug substance of biosimilar products for Samsung Bioepis. We no longer recognize revenues for the manufacturing completed after the divestiture date under our technical development services and manufacturing agreements with Samsung Bioepis.
For the years ended December 31, 2019 and 2018, we recognized $106.2 million and $96.4 million, respectively, related to the services described above provided to Samsung Bioepis.
For additional information on our collaborative and other relationships, including revenues recognized under our technical development services and manufacturing agreements with Samsung Bioepis, please read Note 18, Collaborative and Other Relationships, to our consolidated financial statements included in this report.
Other Royalty and Corporate Revenues
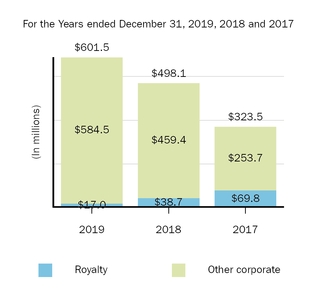
We receive royalties from net sales on products related to patents that we have out-licensed and we record other corporate revenues primarily from amounts earned under contract manufacturing agreements.
For 2019 compared to 2018, the increase in other royalty and corporate revenues was primarily due to $383.2 million in revenues recognized in 2019 under the manufacturing and supply agreement with Bioverativ entered into in connection with the spin-off of our hemophilia business, compared to $206.7 million recognized in 2018. The increase in Bioverativ revenues in 2019 over the prior year period was due to our sales in 2019 of hemophilia-related inventory on hand as of December 31, 2018. The increase in corporate revenues was partially offset by the reduction in royalty revenues due to the expiration of certain of our patents and a reduction in revenues from contract manufacturing agreements, other than Bioverativ, as discussed above.
Reserves for Discounts and Allowances
Revenues from product sales are recorded net of reserves established for applicable discounts and allowances, including those associated with the implementation of pricing actions in certain international markets where we operate.
These reserves are based on estimates of the amounts earned or to be claimed on the related sales and are classified as reductions of accounts receivable (if the amount is payable to our customer) or a liability (if the amount is payable to a party other than our customer). These estimates reflect our historical experience, current contractual and statutory requirements, specific known market events and trends, industry data and forecasted customer buying and payment patterns. Actual amounts may ultimately differ from our estimates. If actual results vary, we adjust these estimates, which could have an effect on earnings in the period of adjustment.
65
Reserves for discounts, contractual adjustments and returns that reduced gross product revenues are summarized as follows:
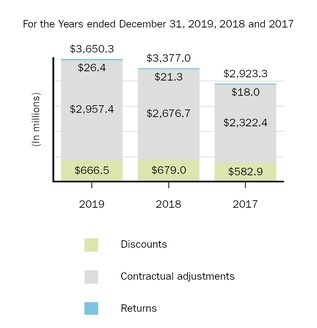
For the years ended December 31, 2019, 2018 and 2017, reserves for discounts and allowances as a percentage of gross product revenues were 24.3%, 23.7% and 22.0%, respectively.
Discounts
Discounts include trade term discounts and wholesaler incentives.
For 2019 compared to 2018, discounts were relatively consistent.
Contractual Adjustments
Contractual adjustments primarily relate to Medicaid and managed care rebates, co-payment assistance (copay), VA and PHS discounts, specialty pharmacy program fees and other government rebates or applicable allowances.
For 2019 compared to 2018, the increase in contractual adjustments was primarily due to higher managed care rebates and governmental rebates in the U.S. as well as higher governmental rebates and allowances in the rest of world, due in part to an increase in SPINRAZA sales volumes worldwide.
Returns
Product return reserves are established for returns made by wholesalers. In accordance with contractual terms, wholesalers are permitted to return product for reasons such as damaged or expired product. The majority of wholesaler returns are due to product expiration. Provisions for product returns are recognized in the period the related revenue is recognized, resulting in a reduction to product sales.
For 2019 compared to 2018, return reserves were relatively consistent.
For additional information on our revenue reserves, please read Note 4, Revenues, to our consolidated financial statements included in this report.
66
Cost and Expenses
A summary of total cost and expenses is as follows:
For the Years Ended December 31, | % Change | ||||||||||||||||
2019 compared to 2018 | 2018 compared to 2017 | ||||||||||||||||
(In millions, except percentages) | 2019 | 2018 | 2017 | ||||||||||||||
Cost of sales, excluding amortization and impairment of acquired intangible assets | $ | 1,955.4 | $ | 1,816.3 | $ | 1,630.0 | 7.7 | % | 11.4 | % | |||||||
Research and development | 2,280.6 | 2,597.2 | 2,253.6 | (12.2 | )% | 15.2 | % | ||||||||||
Selling, general and administrative | 2,374.7 | 2,106.3 | 1,933.9 | 12.7 | % | 8.9 | % | ||||||||||
Amortization and impairment of acquired intangible assets | 489.9 | 747.3 | 814.7 | (34.4 | )% | (8.3 | )% | ||||||||||
Collaboration profit (loss) sharing | 241.6 | 185.0 | 112.3 | 30.6 | % | 64.7 | % | ||||||||||
Loss on divestiture of Hillerød, Denmark manufacturing operations | 55.3 | — | — | ** | ** | ||||||||||||
(Gain) loss on fair value remeasurement of contingent consideration | (63.7 | ) | (12.3 | ) | 62.7 | 417.9 | % | (119.6 | )% | ||||||||
Acquired in-process research and development | — | 112.5 | 120.0 | (100.0 | )% | (6.3 | )% | ||||||||||
Restructuring charges | 1.5 | 12.0 | 0.9 | (87.5 | )% | ** | |||||||||||
Total cost and expenses | $ | 7,335.3 | $ | 7,564.3 | $ | 6,928.1 | (3.0 | )% | 9.2 | % | |||||||
** Percentage not meaningful.
Cost of Sales, Excluding Amortization and Impairment of Acquired Intangible Assets (Cost of Sales)
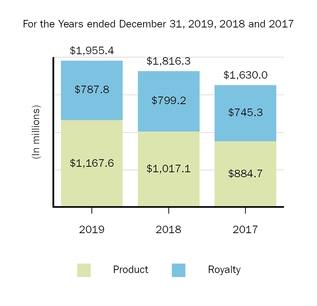
Cost of sales, as a percentage of total revenues, were 13.6%, 13.5% and 13.3% for the years ended December 31, 2019, 2018 and 2017, respectively.
Product Cost of Sales
For 2019 compared to 2018, the increase in product cost of sales was primarily due to our sale in 2019 to Bioverativ of hemophilia-related inventory on hand as of December 31, 2018, with a cost basis totaling $184.5 million pursuant to the terms of the manufacturing and supply agreement with Bioverativ
entered into in connection with the spin-off of our hemophilia business.
Additionally, the increase in product cost of sales was attributable to an increase in sales of products within our biosimilar business and an increase in inventory amounts written down as a result of excess, obsolescence, unmarketability or other reasons, partially offset by lower cost of sales from our contract manufacturing agreements, except Bioverativ, as discussed above.
Inventory amounts written down as a result of excess, obsolescence, unmarketability or other reasons totaled $52.2 million, $41.9 million and $76.9 million for the years ended December 31, 2019, 2018 and 2017, respectively.
Royalty Cost of Sales
For 2019 compared to 2018, the decrease in royalty cost of sales was primarily due to a decrease in royalties payable on sales of TYSABRI resulting from the expiration of certain third party royalties, partially offset by increased royalties payable on higher sales of SPINRAZA and IMRALDI.
67
Research and Development
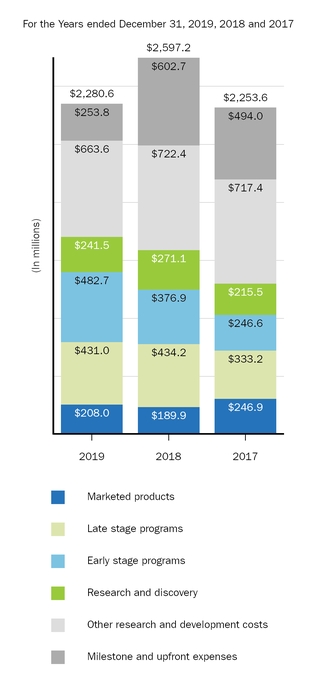
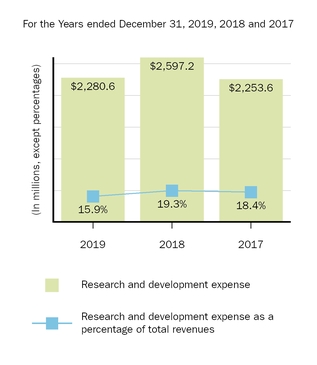
We support our drug discovery and development efforts through the commitment of significant resources to discovery, research and development programs and business development opportunities.
A significant amount of our research and development costs consist of indirect costs incurred in support of overall research and development activities and non-specific programs, including activities that benefit multiple programs, such as management costs, as well as depreciation, information technology and facility-based expenses. These costs are considered other research and development costs in the table above and are not allocated to a specific program or stage.
Research and development expense incurred in support of our marketed products includes costs associated with product lifecycle management activities including, if applicable, costs associated with the development of new indications for existing products. Late stage programs are programs in Phase 3 development or in registration stage. Early stage programs are programs in Phase 1 or Phase 2 development. Research and discovery represents costs incurred to support our discovery research and translational science efforts. Costs are reflected in the development stage based upon the program status when incurred. Therefore, the same program could be reflected in different development stages in the same year. For several of our programs, the research and development activities are part of our collaborative and other relationships. Our costs reflect our share of the total costs incurred.
68
For 2019 compared to 2018, the decrease in research and development expense was primarily due to a decrease in milestone and upfront expenses and a decrease in other research and development costs. These decreases were partially offset by increases in costs incurred in connection with our early stage programs and marketed products.
We intend to continue committing significant resources to targeted research and development opportunities where there is a significant unmet need and where a drug candidate has the potential to be highly differentiated.
Milestone and Upfront Expenses
Research and development expense for 2019 includes:
• | $63.0 million charge to research and development expense upon the completion of a transaction with Samsung Bioepis to secure the exclusive rights to commercialize two potential ophthalmology biosimilar products; |
• | $45.0 million charge to research and development expense upon the exercise of our option to obtain a worldwide, exclusive, royalty-bearing license from Ionis to develop and commercialize BIIB080; and |
• | $46.5 million charge to research and development expense consisting of a $38.5 million charge upon the entering into a collaboration and research and development services agreement with Skyhawk and an approximately $8.0 million charge upon entering into an amendment to this agreement to add an additional discovery program. |
Research and development expense for 2018 includes:
• | $486.2 million net charge to research and development expense upon the closing of the 2018 Ionis Agreement; and |
• | $35.0 million charge to research and development expense upon the exercise of our option to obtain a worldwide, exclusive, royalty-bearing license from Ionis to develop and commercialize tofersen in ALS. |
These payments are classified as research and development expense as the programs they relate to had not achieved regulatory approval as of the payment date.
For additional information about these collaboration arrangements, please read Note 18, Collaborative and Other Relationships, to our consolidated financial statements included in this report.
Early Stage Programs
For 2019 compared to 2018, the increase in spending related to our early stage programs was primarily due to an increase in costs associated with:
• | gosuranemab in PSP and AD pursuant to our license agreement with BMS; |
• | cinpanemab in Parkinson's disease; |
• | BIIB112 in XLRP; |
• | BIIB104 in CIAS; |
• | BIIB078 (IONIS-C9Rx) in ALS; |
• | BIIB091 in MS; |
• | BIIB110 (ActRIIA/B ligand trap) in SMA; and |
• | our decision in September 2019 to discontinue the Phase 2b study of BG00011 for the potential treatment of IPF, for which we incurred a one-time close out charge of approximately $10.0 million. |
These increases were partially offset by a decrease in costs associated with:
• | the development of vixotrigine (BIIB074) in trigeminal neuralgia (TGN); |
• | tofersen in ALS, which was advanced to a late stage program in the first quarter of 2019; |
• | our decision in December 2018 to discontinue development of BIIB087, an investigational AAV-based gene therapy for the potential treatment of X-linked retinoschisis, and BIIB088, an investigational AAV-based gene therapy for the potential treatment of XLRP, upon the termination of our collaboration agreement with Applied Genetic Technologies Corporation; and |
• | BIIB093 in LHI, which was advanced to a late stage program in the third quarter of 2018. |
Late Stage Programs
For 2019 compared to 2018, the decrease in spending associated with our late stage programs was primarily due to a decrease in spending related to the discontinuation of the global Phase 3 trials, ENGAGE and EMERGE, of aducanumab, net of Eisai reimbursement. This decrease was partially offset by increases in spending related to:
• | our share of the termination costs of approximately $48.0 million resulting from the decision to discontinue the global Phase 3 studies of elenbecestat in AD; |
• | BAN2401 in early AD pursuant to our collaboration arrangement with Eisai, which was advanced to a late stage program in the first quarter of 2019; |
69
• | tofersen in ALS, which was advanced to a late stage program in the first quarter of 2019; |
• | BIIB093 in LHI, which was advanced to a late stage program in the third quarter of 2018; and |
• | BIIB111 in CHM. |
Selling, General and Administrative
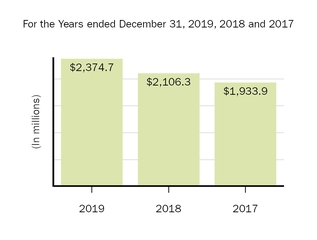
For 2019 compared to 2018, the increase in selling, general and administrative expenses was primarily due to increased commercial and medical investments as well as the timing of spend on selling, general and administrative expense.
In 2020 we expect selling, general and administrative costs, including increases in headcount and other commercial infrastructure, to significantly increase as we support pre-launch activities associated with the potential regulatory approval of aducanumab.
Amortization and Impairment of Acquired Intangible Assets
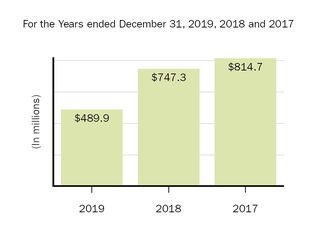
Our amortization expense is based on the economic consumption and impairment of intangible assets. Our most significant intangible assets are related to our TYSABRI, AVONEX, SPINRAZA, VUMERITY and TECFIDERA (rest of world) products
and other programs acquired through business combinations.
Amortization and impairment of acquired intangible assets for the year ended December 31, 2019, was impacted by the 2019 impairment charges of $215.9 million related to certain IPR&D assets associated with the Phase 2b study of BG00011 for the potential treatment of IPF, which was discontinued in the third quarter of 2019.
Amortization and impairment of acquired intangible assets for the year ended December 31, 2018, was impacted by the 2018 impairment charges of $189.3 million related to certain IPR&D assets associated with our vixotrigine program and $176.8 million related to our intangible assets associated with our U.S. license to Forward Pharma's intellectual property, including Forward Pharma's intellectual property related to TECFIDERA.
Amortization of acquired intangible assets, excluding impairment charges, totaled $274.0 million, $381.2 million and $455.3 million for the years ended December 31, 2019, 2018 and 2017, respectively.
For 2019 compared to 2018, the decrease in amortization of acquired intangible assets, excluding impairment charges, was primarily due to a lower rate of amortization for acquired intangible assets, primarily due to prior year impairments.
We monitor events and expectations regarding product performance. If new information indicates that the assumptions underlying our most recent analysis are substantially different than those utilized in our current estimates, our analysis would be updated and may result in a significant change in the anticipated lifetime revenues of the relevant products. The occurrence of an adverse event could substantially increase the amount of amortization expense related to our acquired intangible assets as compared to previous periods or our current expectations, which may result in a significant negative impact on our future results of operations.
IPR&D related to Business Combinations
IPR&D represents the fair value assigned to research and development assets that we acquired as part of a business combination and had not yet reached technological feasibility at the date of acquisition. We review amounts capitalized as acquired IPR&D for impairment annually, as of October 31, and whenever events or changes in circumstances indicate to us that the carrying value of the assets might not be recoverable.
BG00011
70
During the third quarter of 2019 we discontinued the Phase 2b study of BG00011 for the potential treatment of IPF due to safety concerns. As a result, we recognized an impairment charge of approximately $215.9 million during the third quarter of 2019 to reduce the fair value of the IPR&D intangible asset to zero. We also adjusted the value of our contingent consideration obligations related to this asset resulting in a gain of $61.2 million in the third quarter of 2019.
Vixotrigine
During the third quarter of 2018 we completed a Phase 2b study of vixotrigine for the potential treatment of painful lumbosacral radiculopathy (PLSR). The study did not meet its primary or secondary efficacy endpoints and we discontinued development of vixotrigine for the potential treatment of PLSR. As a result, we recognized an impairment charge of approximately $60.0 million during the third quarter of 2018 to reduce the fair value of the related IPR&D intangible asset to zero.
In addition, we delayed the initiation of the Phase 3 studies of vixotrigine for the potential treatment of TGN as we awaited the outcome of ongoing interactions with the FDA regarding the design of the Phase 3 studies, a more detailed review of the data from the Phase 2b study of vixotrigine for the potential treatment of PLSR and insights from the Phase 2 study of vixotrigine for the potential treatment of small fiber neuropathy. We reassessed the fair value of the TGN program using reduced expected lifetime revenues, higher expected clinical development costs and lower cumulative probability of success. As a result of that reassessment, we recognized an impairment charge of $129.3 million during the third quarter of 2018 to reduce the fair value of the TGN IPR&D intangible asset to $41.8 million.
The TGN program has experienced numerous delays in development in the periods since we acquired the program and the fair value of this asset is not significantly in excess of carrying value. In addition, we are currently testing vixotrigine in another mid-stage clinical trial, in a different neuropathic pain indication, for which we also have an IPR&D asset. Data from that trial is expected in the first half of 2020. This data may affect the economic value of vixotrigine and the IPR&D assets for one or both programs could be impaired if assumptions used in determining their fair value change.
Overall, the value of our acquired IPR&D assets is dependent upon several variables, including estimates of future revenues and the effects of competition, our ability to secure sufficient pricing in a competitive market, our ability to confirm safety and
efficacy based on data from clinical trials and regulatory feedback, the level of anticipated development costs and the probability and timing of successfully advancing a particular research program from one clinical trial phase to the next. We are continually reevaluating our estimates concerning these and other variables, including our life cycle management strategies, research and development priorities and development risk, changes in program and portfolio economics and related impact of foreign currency exchange rates and economic trends and evaluating industry and company data regarding the productivity of clinical research and the development process. Changes in our estimates and prioritization of these programs may result in a significant change to our valuation of our IPR&D assets.
TECFIDERA License Rights
In January 2017 we entered into a settlement and license agreement among Biogen Swiss Manufacturing GmbH, Biogen International Holding Ltd., Forward Pharma and certain related parties, which was effective as of February 1, 2017. Pursuant to this agreement, we obtained U.S. and rest of world licenses to Forward Pharma's intellectual property, including Forward Pharma's intellectual property related to TECFIDERA. In exchange, we paid Forward Pharma $1.25 billion in cash, of which $795.2 million was recorded within intangible assets in the first quarter of 2017.
We had an intellectual property dispute with Forward Pharma in the U.S. concerning intellectual property related to TECFIDERA.
In March 2017 the U.S. intellectual property dispute was decided in our favor. Forward Pharma appealed to the U.S. Court of Appeals for the Federal Circuit. We evaluated the recoverability of the U.S. asset acquired from Forward Pharma and recorded a $328.2 million impairment charge in the first quarter of 2017 to adjust the carrying value of the acquired U.S. asset to fair value reflecting the impact of the developments in the U.S. legal dispute and continued to amortize the remaining net book value of the U.S. intangible asset in our consolidated statements of income utilizing an economic consumption model. The U.S. Court of Appeals for the Federal Circuit upheld the USPTO's March 2017 ruling and in January 2019 denied Forward Pharma’s petition for rehearing. We evaluated the recoverability of the U.S. asset based upon these most recent developments and recorded a $176.8 million impairment charge in the fourth quarter of 2018 to reduce the remaining net book value of the U.S. asset to zero.
We have an intellectual property dispute with Forward Pharma in the E.U. concerning intellectual property related to TECFIDERA.
71
In March 2018 the European Patent Office (EPO) revoked Forward Pharma’s European Patent No. 2 801 355. Forward Pharma has filed an appeal to the Technical Boards of Appeal of the EPO and a hearing has been set for June 2020. Based upon our assessment of this ruling, we continue to amortize the remaining net book value of the rest of world intangible asset in our consolidated statements of income utilizing an economic consumption model. The remaining net book value of the TECFIDERA rest of world intangible asset as of December 31, 2019, was $36.1 million.
For additional information on the dispute with Forward Pharma in the E.U., please read Note 20, Litigation, to our consolidated financial statements included in this report.
For additional information on the amortization and impairment of acquired intangible assets, please read Note 6, Intangible Assets and Goodwill, to our consolidated financial statements included in this report.
Collaboration Profit (Loss) Sharing
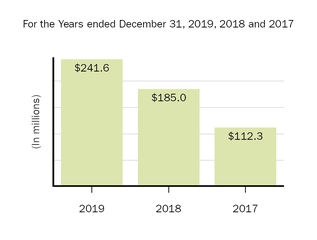
Collaboration profit (loss) sharing primarily includes Samsung Bioepis' 50% share of the profit or loss related to our biosimilars commercial agreement with Samsung Bioepis.
For 2019, 2018 and 2017 we recognized a net profit-sharing expense of $241.6 million, $187.4 million and $111.0 million, respectively, to reflect Samsung Bioepis’ 50% sharing of the net collaboration profits. The increases in profit-sharing expense for the comparative periods were primarily due to increased collaboration profits resulting from increased biosimilar sales.
For additional information on our collaboration arrangements with Samsung Bioepis, please read Note 18, Collaborative and Other Relationships, to our consolidated financial statements included in this report.
Loss on Divestiture of Hillerød, Denmark Manufacturing Operations
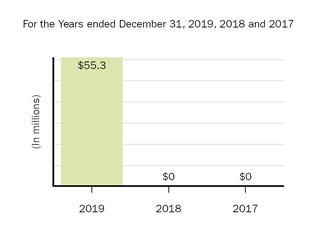
Divestiture of Hillerød, Denmark Manufacturing Operations
In August 2019 we completed the sale of all of the outstanding shares of our subsidiary that owned our biologics manufacturing operations in Hillerød, Denmark to FUJIFILM. Upon the closing of this transaction, we received approximately $881.9 million in cash, which may be adjusted based on other contractual terms, which are discussed below. We determined that the operations disposed of in this transaction did not meet the criteria to be classified as discontinued operations under the applicable guidance.
As part of this transaction, we have provided FUJIFILM with certain minimum batch production commitment guarantees. There is a risk that the minimum contractual batch production commitments will not be met. Based upon current estimates we expect to incur an adverse commitment obligation of approximately $74.0 million associated with such guarantees and have accrued for this obligation. We may adjust this estimate based upon changes in business conditions, which may result in the increase or reduction of this adverse commitment obligation in subsequent periods. We also may be obligated to indemnify FUJIFILM for liabilities that existed relating to certain business activities incurred prior to the closing of this transaction.
In addition, we may earn certain contingent payments based on future manufacturing activities at the Hillerød facility. For the disposition of a business, our policy is to recognize contingent consideration when the consideration is realizable. We currently believe the probability of earning these payments is remote and therefore we did not include these contingent payments in our calculation of the fair value of the operations.
72
As part of this transaction, we entered into certain manufacturing services agreements with FUJIFILM pursuant to which FUJIFILM will use the Hillerød facility to produce commercial products for us, such as TYSABRI, as well as other third-party products.
In connection with this transaction, we recognized a total net loss of approximately $164.4 million in our consolidated statements of income. This loss included a pre-tax loss of $95.5 million, which was recorded in loss on divestiture of Hillerød, Denmark manufacturing operations. The loss recognized was based on exchange rates and business conditions on the closing date of this transaction, and included costs to sell our Hillerød, Denmark manufacturing operations of approximately $11.2 million and our estimate of the fair value of an adverse commitment of approximately $114.0 million associated with the guarantee of future minimum batch production at the Hillerød facility. The value of this adverse commitment was determined using a probability-weighted estimate of future manufacturing activity. We also recorded a tax expense of $68.9 million related to this transaction. During the fourth quarter of 2019 we recorded a $40.2 million reduction in our estimate of the future minimum batch commitment utilizing our current manufacturing forecast, which reflects the impact of forecasted aducanumab batches, resulting in a reduction in the pre-tax loss on divestiture from $95.5 million to $55.3 million.
Our estimate of the fair value of the adverse commitment is a Level 3 measurement and is based on forecasted batch production at the Hillerød facility.
For additional information on the divestiture of our Hillerød, Denmark manufacturing operations, please read Note 3, Divestitures, to our consolidated financial statements included in this report.
(Gain) Loss on Fair Value Remeasurement of Contingent Consideration
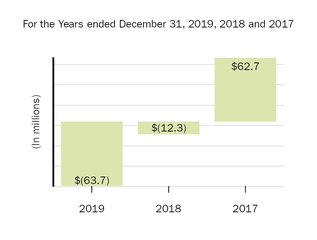
Consideration payable for certain of our business combinations includes future payments that are contingent upon the occurrence of a particular event or events. We record an obligation for such contingent consideration payments at fair value on the acquisition date. We then revalue our contingent consideration obligations each reporting period. Changes in the fair value of our contingent consideration obligations, other than changes due to payments, are recognized as a (gain) loss on fair value remeasurement of contingent consideration in our consolidated statements of income.
The gain on fair value remeasurement of contingent consideration for 2019 was primarily due to the discontinuation of the Phase 2b study of BG00011 for the potential treatment of IPF, partially offset by changes in the probability and expected timing of achievement of certain developmental milestones, a decrease in interest rates used to revalue our contingent consideration liabilities and the passage of time.
The gain on fair value remeasurement of contingent consideration for 2018 was primarily due to delays in the expected timing of achievement of milestones related to our vixotrigine program for the potential treatment of TGN and an increase in discount rates used to revalue our contingent consideration liabilities, partially offset by the passage of time.
The loss on fair value remeasurement of contingent consideration for 2017 was primarily due to the increase in the probability of achieving certain developmental milestones based upon the progression of the underlying clinical programs.
For additional information on our IPR&D intangible assets related to our discontinued BG00011 program for the potential treatment of IPF and our vixotrigine program for the potential treatment of TGN, please read Note 6, Intangible Assets and Goodwill, to our consolidated financial statements included in this report.
73
Acquired In-Process Research and Development
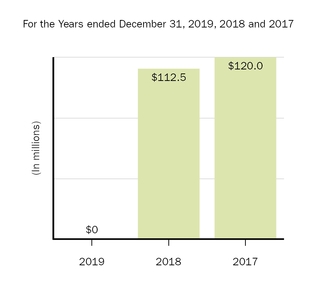
BIIB110 Acquisition
In July 2018 we acquired BIIB110 and ALG-802 from AliveGen Inc. (AliveGen). BIIB110 and ALG-802 represent novel ways of targeting the myostatin pathway. In connection with the closing of this transaction, we made an upfront payment of $27.5 million to AliveGen, which was recorded as acquired IPR&D in our consolidated statements of income as BIIB110 has not yet reached technological feasibility.
BIIB104 Acquisition
In April 2018 we acquired BIIB104 from Pfizer. BIIB104 is a first-in-class, Phase 2b AMPA receptor potentiator for CIAS. In connection with the closing of this transaction, we made an upfront payment of $75.0 million to Pfizer, which was recorded as acquired IPR&D in our consolidated statements of income as BIIB104 has not yet reached technological feasibility.
BIIB100 Acquisition
In January 2018 we acquired BIIB100 from Kayropharm Therapeutics Inc. (Karyopharm). BIIB100 is a Phase 1 investigational oral compound for the treatment of certain neurological and neurodegenerative diseases, primarily in ALS. In connection with the closing of this transaction, we made an upfront payment of $10.0 million to Karyopharm, which was recorded as acquired IPR&D in our consolidated statements of income as BIIB100 has not yet reached technological feasibility.
BIIB093 Acquisition
In May 2017 we acquired BIIB093 from Remedy Pharmaceuticals Inc. (Remedy). In connection with the closing of this transaction, we made an upfront payment of $120.0 million to Remedy, which was
recorded as acquired IPR&D in our consolidated statements of income as BIIB093 had not yet reached technological feasibility.
For additional information on our acquisitions of BIIB110, BIIB104, BIIB100 and BIIB093, please read Note 2, Acquisitions, to our consolidated financial statements included in this report.
Other Income (Expense), Net
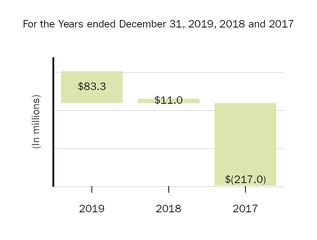
Effective January 1, 2018, other income (expense) reflects the recognition of net gains (losses) recorded in relation to changes in the fair value of our strategic investments following our adoption of Accounting Standards Update (ASU) No. 2016-01, Financial Instruments - Overall (Subtopic 825-10): Recognition and Measurement of Financial Assets and Financial Liabilities. Prior to the adoption of this standard, we recognized changes in fair value of our strategic investment in accumulated other comprehensive income (loss), net. Changes in the fair value of our strategic investments could have a significant impact on our results of operations in any given period.
For 2019 compared to 2018, the change in other income (expense), net primarily reflects net gains totaling $204.7 million recognized on our investments related to our holdings in equity and debt securities, compared to net gains totaling $119.5 million in 2018. The net gains recognized during the year ended December 31, 2019, primarily reflect an increase in the fair value in our investment in Ionis common stock from December 31, 2018, partially offset by the net loss recognized on our sale of a portion of our investment in Ionis common stock during the second and third quarters of 2019 reflecting the decrease in the fair value of the shares sold from March 31, 2019.
Proceeds from our sale of a portion of our investment in Ionis common stock during the year ended December 31, 2019, totaled approximately
74
$382.0 million. The original cost basis upon acquisition in June 2018 for the shares sold during the year ended December 31, 2019, totaled approximately $312.5 million.
Net gains recognized on our investments related to our holdings in equity and debt securities for the year ended December 31, 2019, also reflects an increase in the fair value of an investment in a non-marketable equity security from December 31, 2018, that was realized for a net gain of approximately $87.7 million upon sale in the second quarter of 2019.
Income Tax Provision
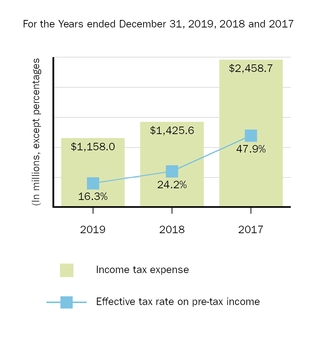
Our effective tax rate fluctuates from year to year due to the global nature of our operations. The factors that most significantly impact our effective tax rate include changes in tax laws, variability in the allocation of our taxable earnings among multiple jurisdictions, the amount and characterization of our research and development expenses, the levels of certain deductions and credits, acquisitions and licensing transactions.
For the year ended December 31, 2019, as compared to 2018, the decrease in our effective tax rate was primarily due to the combination of the internal reorganization of certain intellectual property rights and the impact of Swiss Tax Reform. This decrease was partially offset by a $68.9 million tax expense related to the divestiture of our subsidiary that owned our Hillerød, Denmark manufacturing operations. We also had a higher effective tax rate in 2018 resulting from the unfavorable effects of the 2017 Tax Act and our sale of inventory, the tax effect of which had been included within prepaid taxes at
January 1, 2018, at a higher effective tax rate than the 2018 statutory tax rate.
For additional information on the divestiture of our Hillerød, Denmark manufacturing operations, please read Note 3, Divestitures, to our consolidated financial statements included in this report.
Accounting for Uncertainty in Income Taxes
For additional information on our uncertain tax positions and income tax rate reconciliation for 2019, 2018 and 2017, please read Note 16, Income Taxes, to our consolidated financial statements included in this report.
Equity in Loss of Investee, Net of Tax
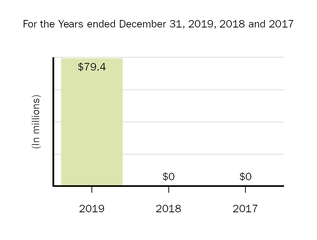
In February 2012 we entered into a joint venture agreement with Samsung BioLogics, establishing an entity, Samsung Bioepis, to develop, manufacture and market biosimilar products.
In June 2018 we exercised our option under our joint venture agreement to increase our ownership percentage in Samsung Bioepis from approximately 5% to approximately 49.9%. The share purchase transaction was completed in November 2018 and, upon closing, we paid 759.5 billion South Korean won ($676.6 million) to Samsung BioLogics. As of December 31, 2019, our ownership percentage remained at approximately 49.9%
We recognize our share of the results of operations related to our investment in Samsung Bioepis under the equity method of accounting one quarter in arrears when the results of the entity become available, which is reflected as equity in income (loss) of investee, net of tax in our consolidated statements of income. During 2015, as our share of losses exceeded the carrying value of our investment, we suspended recognizing additional losses. In the first quarter of 2019 we restarted recognizing our share of Samsung Bioepis' income (losses), and we began recognizing amortization on
75
certain basis differences resulting from our November 2018 investment.
Our joint venture partner, Samsung BioLogics, is currently subject to an ongoing criminal investigation that we continue to monitor. While this investigation could impact the operations of Samsung Bioepis and its business, we have assessed the value of our investment in Samsung Bioepis and continue to believe that the fair value of the investment is in excess of its net book value.
For the year ended December 31, 2019, equity in loss of investee, net of tax reflects our share of losses totaling $1.2 million and amortization of basis differences totaling $78.2 million.
For additional information on our collaboration arrangements with Samsung Bioepis, please read Note 18, Collaborative and Other Relationships, to our consolidated financial statements included in this report.
Noncontrolling Interests, Net of Tax
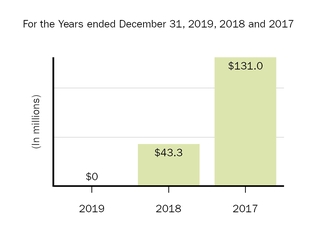
For 2018 net income attributable to noncontrolling interests, net of tax, was primarily related to a $50.0 million pre-tax payment made to Neurimmune to reduce the previously negotiated royalty rates payable on products developed under the Neurimmune Agreement, including royalties payable on potential commercial sales of aducanumab, by 5%.
For 2017 net income attributable to noncontrolling interests, net of tax, was primarily related to a $150.0 million pre-tax payment made to Neurimmune to reduce the previously negotiated royalty rates payable on products developed under the Neurimmune Agreement, including royalties payable on potential commercial sales of aducanumab, by 15%.
For additional information on our collaboration arrangement with Neurimmune, please read Note 19, Investments in Variable Interest Entities, to our consolidated financial statements included in this report.
76
Financial Condition, Liquidity and Capital Resources
Our financial condition is summarized as follows:
As of December 31, | % Change | |||||||||
(In millions, except percentages) | 2019 | 2018 | 2019 compared to 2018 | |||||||
Financial assets: | ||||||||||
Cash and cash equivalents | $ | 2,913.7 | $ | 1,224.6 | 137.9 | % | ||||
Marketable securities — current | 1,562.2 | 2,313.4 | (32.5 | )% | ||||||
Marketable securities — non-current | 1,408.1 | 1,375.9 | 2.3 | % | ||||||
Total cash, cash equivalents and marketable securities | $ | 5,884.0 | $ | 4,913.9 | 19.7 | % | ||||
Borrowings: | ||||||||||
Current portion of notes payable | $ | 1,495.8 | $ | — | ** | |||||
Notes payable | 4,459.0 | 5,936.5 | (24.9 | )% | ||||||
Total borrowings | $ | 5,954.8 | $ | 5,936.5 | 0.3 | % | ||||
Working Capital: | ||||||||||
Current assets | $ | 8,381.8 | $ | 7,640.9 | 9.7 | % | ||||
Current liabilities | (4,863.8 | ) | (3,295.2 | ) | 47.6 | % | ||||
Total working capital | $ | 3,518.0 | $ | 4,345.7 | (19.0 | )% | ||||
** Percentage not meaningful.
For the year ended December 31, 2019, certain significant cash flows were as follows:
• | $7.1 billion in net cash flows provided by operating activities, net of: |
◦ | $1.1 billion in total net payments for income taxes; and |
◦ | $74.0 million upfront payment made to Skyhawk upon entering into a collaboration and research and development services agreement; |
• | $5.9 billion used for share repurchases; |
• | $923.7 million in proceeds received on the divestiture of our Hillerød, Denmark manufacturing operations, including the sale of raw materials that were remaining at the Hillerød facility on the closing date of this transaction; |
• | $744.4 million payment made for our acquisition of NST, net of cash acquired; |
• | $479.3 million in proceeds received on sales of strategic investments; |
• | $514.5 million used for purchases of property, plant and equipment; |
• | $300.0 million for the final contingent payment made to former shareholders of Fumapharm AG and holders of their rights; and |
• | $155.0 million in payments made to Alkermes following the FDA's approval of VUMERITY. |
For the year ended December 31, 2018, certain significant cash flows were as follows:
• | $6.2 billion in net cash flows provided by operating activities, net of: |
◦ | $1.0 billion in total net payments for income taxes; and |
◦ | $375.0 million in an upfront payment made to Ionis upon the closing of the 2018 Ionis Agreement and a $162.1 million expense reflecting the premium paid for the purchase of Ionis common stock; |
• | $4.4 billion used for share repurchases; |
• | $1.5 billion in contingent payments made to former shareholders of Fumapharm AG and holders of their rights; |
• | $770.6 million used for purchases of property, plant and equipment; |
• | $676.6 million payment made to Samsung BioLogics upon the closing of the share purchase transaction increasing our ownership percentage in Samsung Bioepis to approximately 49.9%; |
• | $462.9 million payment made to Ionis reflecting the fair value of the Ionis common stock purchased upon the closing the 2018 Ionis Agreement; and |
• | $112.5 million in payments made for the acquisitions of BIIB100, BIIB104 and BIIB110. |
77
Overview
We have historically financed our operating and capital expenditures primarily through cash flows earned through our operations. We expect our operating expenditures, particularly those related to research and development, clinical trials, commercialization of new products and international expansion to continue to grow. However, we expect to continue funding our current and planned operating requirements principally through our cash flows from operations, as well as our existing cash resources. We believe that our existing funds, when combined with cash generated from operations and our access to additional financing resources, if needed, are sufficient to satisfy our operating, working capital, strategic alliance, milestone payment, capital expenditure and debt service requirements for the foreseeable future. In addition, we may choose to opportunistically return cash to shareholders and pursue other business initiatives, including acquisition and licensing activities. We may, from time to time, also seek additional funding through a combination of new collaborative agreements, strategic alliances and additional equity and debt financings or from other sources should we identify a significant new opportunity.
Aducanumab
In October 2019 we and our collaboration partner Eisai announced that we plan to pursue regulatory approval for aducanumab in the U.S. We plan to actively commit funds to developing our commercialization program for aducanumab so that we would be in a position to launch aducanumab if we receive regulatory approval. If we do not receive regulatory approval or are unable to successfully commercialize aducanumab, our financial condition, business and operations may be adversely affected.
For additional information on certain risks that could negatively impact our financial position or future results of operations, please read Item 1A. Risk Factors and Item 7A. Quantitative and Qualitative Disclosures About Market Risk included in this report.
Cash, Cash Equivalents and Marketable Securities
Until required for another use in our business, we typically invest our cash reserves in bank deposits, certificates of deposit, commercial paper, corporate notes, U.S. and foreign government instruments, overnight reverse repurchase agreements and other interest-bearing marketable debt instruments in accordance with our investment policy. It is our policy to mitigate credit risk in our cash reserves and marketable securities by maintaining a well-diversified portfolio that limits the amount of exposure as to institution, maturity and investment type.
As of December 31, 2019, we had cash, cash equivalents and marketable securities totaling approximately $5.9 billion compared to approximately $4.9 billion as of December 31, 2018. The net increase in cash, cash equivalents and marketable securities at December 31, 2019, from December 31, 2018, was primarily due to cash flows from operations, cash received upon the divestiture of our Hillerød, Denmark manufacturing operations, net proceeds from marketable securities and proceeds from sales of strategic investments, partially offset by cash used for share repurchases, cash used for our acquisition of NST, net purchases of property, plant and equipment, contingent payments made to former shareholders of Fumapharm AG and holders of their rights and upfront and milestone payments made to Alkermes and Skyhawk.
Investments and other assets in our consolidated balance sheet as of December 31, 2019 and 2018, includes the carrying value of our investment in Samsung Bioepis of $580.2 million and $680.6 million, respectively. As Samsung Bioepis is a privately-held entity, our ability to liquidate our investment in Samsung Bioepis may be limited and we may realize significantly less than the value of such investment. Investments in other assets, as of December 31, 2019 and 2018, also includes the fair value of our investment in Ionis common stock of $329.6 million and $563.8 million, respectively, which is subject to certain holding period restrictions.
For additional information on our acquisition of NST, please read Note 2, Acquisitions, to our consolidated financial statements included in this report. For additional information on the divestiture of our Hillerød, Denmark manufacturing operations, please read Note 3, Divestitures, to our consolidated financial statements included in this report. For additional information on our collaboration arrangements with Ionis, Samsung Bioepis, Alkermes and Skyhawk, please read Note 18, Collaborative and Other Relationships, to our consolidated financial statements included in this report.
Borrowings
The following is a summary of our principal indebtedness as of December 31, 2019:
• | $1.5 billion aggregate principal amount of 2.90% Senior Notes due September 15, 2020; |
• | $1.0 billion aggregate principal amount of 3.625% Senior Notes due September 15, 2022; |
• | $1.75 billion aggregate principal amount of 4.05% Senior Notes due September 15, 2025; and |
78
• | $1.75 billion aggregate principal amount of 5.20% Senior Notes due September 15, 2045. |
These Senior Notes were issued at discount and are amortized as additional interest expense over the period from issuance through maturity.
For a summary of the fair values of our outstanding borrowings as of December 31, 2019 and 2018, please read Note 7, Fair Value Measurements, to our consolidated financial statements included in this report.
2015 Credit Facility
In August 2015 we entered into a $1.0 billion, five-year senior unsecured revolving credit facility under which we were permitted to draw funds for working capital and general corporate purposes. The terms of the revolving credit facility included a financial covenant that required us not to exceed a maximum consolidated leverage ratio. As of December 31, 2019, we had no outstanding borrowings and were in compliance with all covenants under this facility. This credit facility was replaced with the new revolving credit facility entered into in January 2020, as discussed below.
2020 Credit Facility
In January 2020 we entered into a $1.0 billion, five-year senior unsecured revolving credit facility under which we are permitted to draw funds for working capital and general corporate purposes. The terms of the revolving credit facility include a financial covenant that requires us not to exceed a maximum consolidated leverage ratio. This revolving credit facility replaced the revolving credit facility entered into in August 2015.
Working Capital
Working capital is defined as current assets less current liabilities. The change in working capital at December 31, 2019, from December 31, 2018, reflects an increase in total current assets of $740.9 million and an increase in total current liabilities of $1,568.6 million.
The net increase in total current assets was primarily driven by an increase in net cash, cash equivalents and marketable securities, as described above, offset by a decrease in inventory resulting from our sale of hemophilia-related inventory to Bioverativ.
The net increase in total current liabilities was primarily due to the reclassification of $1.5 billion of our Senior Notes to current liabilities from notes payable, as these Senior Notes are due within one year. This increase was partially offset by a reduction in accrued expenses and other.
The net decrease in accrued expenses and other was primarily related to a decrease in the accrual of contingent payments related to FUMADERM and TECFIDERA and a decrease in the accrual for construction in progress, partially offset by the accrual of the $100.0 million upfront payment to Samsung Bioepis, which was paid in January 2020.
Share Repurchase Programs
In December 2019 our Board of Directors authorized our December 2019 Share Repurchase Program, which is a program to repurchase up to $5.0 billion of our common stock. Our December 2019 Share Repurchase Program does not have an expiration date. All share repurchases under our December 2019 Share Repurchase Program will be retired. We did not repurchase shares of our common stock under our December 2019 Share Repurchase Program during the year ended December 31, 2019.
In March 2019 our Board of Directors authorized our March 2019 Share Repurchase Program, which is a program to repurchase up to $5.0 billion of our common stock. Our March 2019 Share Repurchase Program does not have an expiration date. All share repurchases under our March 2019 Share Repurchase Program will be retired. Under our March 2019 Share Repurchase Program, we repurchased and retired approximately 14.7 million shares of our common stock at a cost of approximately $3.7 billion during the year ended December 31, 2019.
In August 2018 our Board of Directors authorized our 2018 Share Repurchase Program, which was a program to repurchase up to $3.5 billion of our common stock. Our 2018 Share Repurchase Program was completed as of June 30, 2019. All share repurchases under our 2018 Share Repurchase Program were retired. Under our 2018 Share Repurchase Program, we repurchased and retired approximately 8.9 million and 4.3 million shares of our common stock at a cost of approximately $2.1 billion and $1.4 billion during the years ended December 31, 2019 and 2018, respectively.
In July 2016 our Board of Directors authorized our 2016 Share Repurchase Program, which was a program to repurchase up to $5.0 billion of our common stock. Our 2016 Share Repurchase Program was completed as of June 30, 2018. All share repurchases under our 2016 Share Repurchase Program were retired. Under our 2016 Share Repurchase Program, we repurchased and retired approximately 10.5 million and 3.7 million shares of our common stock at a cost of approximately $3.0 billion and $1.0 billion during the years ended December 31, 2018 and 2017, respectively.
79
Cash Flows
The following table summarizes our cash flow activity:
For the Years Ended December 31, | % Change | ||||||||||||||||
2019 compared to 2018 | 2018 compared to 2017 | ||||||||||||||||
(In millions, except percentages) | 2019 | 2018 | 2017 | ||||||||||||||
Net cash flows provided by operating activities | $ | 7,078.6 | $ | 6,187.7 | $ | 4,551.0 | 14.4 | % | 36.0 | % | |||||||
Net cash flows provided by (used in) investing activities | $ | 470.5 | $ | (2,046.3 | ) | $ | (2,963.1 | ) | (123.0 | )% | (30.9 | )% | |||||
Net cash flows used in financing activities | $ | (5,860.4 | ) | $ | (4,472.0 | ) | $ | (2,380.0 | ) | 31.0 | % | 87.9 | % | ||||
Operating Activities
Cash flows from operating activities represent the cash receipts and disbursements related to all of our activities other than investing and financing activities. We expect cash provided from operating activities will continue to be our primary source of funds to finance operating needs and capital expenditures for the foreseeable future.
Operating cash flow is derived by adjusting our net income for:
• | non-cash operating items such as depreciation and amortization, impairment charges, unrealized gain (loss) on strategic investments, acquired IPR&D and share-based compensation; |
• | changes in operating assets and liabilities which reflect timing differences between the receipt and payment of cash associated with transactions and when they are recognized in results of operations; and |
• | changes in the fair value of contingent payments associated with our acquisitions of businesses and payments related to collaborations. |
For 2019 compared to 2018, net cash flows provided by operating activities increased primarily due to higher net income.
Investing Activities
For 2019 compared to 2018, the increase in net cash flows provided by investing activities was primarily due to a decrease in contingent payments made to former shareholders of Fumapharm AG and holders of their rights, the proceeds received upon the divestiture of our Hillerød, Denmark manufacturing operations, the proceeds received on our sales of strategic investments and the $462.9 million payment made to Ionis reflecting the fair value of the Ionis common stock purchased upon the closing of the 2018 Ionis Agreement in the prior year comparative period. This increase was partially offset by a decrease in net proceeds related to marketable securities, the cash used for our acquisition of NST and $155.0 million in milestone payments made to Alkermes following the FDA's approval of VUMERITY, which was recorded as an intangible asset during the fourth quarter of 2019.
Financing Activities
For 2019 compared to 2018, the increase in net cash flows used in financing activities was primarily due to an increase in cash used for share repurchases.
80
Contractual Obligations and Off-Balance Sheet Arrangements
Contractual Obligations
The following table summarizes our contractual obligations as of December 31, 2019, excluding amounts related to uncertain tax positions, funding commitments, contingent development, regulatory and commercial milestone payments, contingent payments and contingent consideration related to our business combinations, as described below.
Payments Due by Period | |||||||||||||||||||
(In millions) | Total | Less than 1 Year | 1 to 3 Years | 3 to 5 Years | After 5 Years | ||||||||||||||
Non-cancellable operating leases (1), (2) | $ | 372.3 | $ | 60.6 | $ | 105.9 | $ | 89.3 | $ | 116.5 | |||||||||
Long-term debt obligations (3) | 8,792.2 | 1,730.8 | 1,387.2 | 323.8 | 5,350.4 | ||||||||||||||
Purchase and other obligations (4) | 1,013.6 | 266.1 | 183.0 | 329.4 | 235.1 | ||||||||||||||
Defined benefit obligation | 102.5 | — | — | — | 102.5 | ||||||||||||||
Total contractual obligations | $ | 10,280.6 | $ | 2,057.5 | $ | 1,676.1 | $ | 742.5 | $ | 5,804.5 | |||||||||
(1) | We lease properties and equipment for use in our operations. Amounts reflected within the table above detail future minimum rental commitments under non-cancelable operating leases as of December 31 for each of the periods presented. In addition to the minimum rental commitments, these leases may require us to pay additional amounts for taxes, insurance, maintenance and other operating expenses. |
(2) | Obligations are presented net of sublease income expected to be received for the vacated small-scale biologics manufacturing facility in Cambridge, MA, the vacated portion of our Weston, MA facility and other facilities throughout the world. |
(3) | Long-term debt obligations are related to our Senior Notes, including principal and interest payments. |
(4) | Purchase and other obligations primarily include $697.0 million related to the remaining payments on the Transition Toll Tax, contractual commitments to our suppliers, $52.0 million in contractual commitments for the construction of our large-scale biologics manufacturing facility in Solothurn, Switzerland and $8.3 million related to the fair value of net liabilities on derivative contracts. |
Royalty Payments
TYSABRI
In 2013 we acquired from Elan Pharma International Ltd. (Elan), an affiliate of Elan Corporation plc, full ownership of all remaining rights to TYSABRI that we did not already own or control. Under the acquisition agreement, we are obligated to make contingent payments to Elan of 18% on annual worldwide net commercial sales up to $2.0 billion and
25% on annual worldwide net commercial sales that exceed $2.0 billion. Royalty payments to Elan and other third parties are recognized as cost of sales in our consolidated statements of income. Elan was acquired by Perrigo Company plc (Perrigo) in December 2013 and Perrigo subsequently sold its rights to these payments to a third-party effective January 2017.
SPINRAZA
In 2016 we exercised our option to develop and commercialize SPINRAZA from Ionis. Under our agreement with Ionis, we make royalty payments to Ionis on annual worldwide net commercial sales of SPINRAZA using a tiered royalty rate between 11% and 15%, which are recorded as cost of sales in our consolidated statements of income. For additional information on our collaboration arrangements with Ionis, please read Note 18, Collaborative and Other Relationships, to our consolidated financial statements included in this report.
VUMERITY
In October 2019 the FDA approved VUMERITY for the treatment of RMS. Under our agreement with Alkermes, we make royalty payments to Alkermes on worldwide net commercial sales of VUMERITY using a royalty rate of 15%, which are recorded as cost of sales in our consolidated statements of income. Royalties payable on net commercial sales of VUMERITY are subject, under certain circumstances, to tiered minimum annual payment requirements for a period of five years following FDA approval. For additional information on our collaboration arrangement with Alkermes, please read Note 18, Collaborative and Other Relationships, to our consolidated financial statements included in this report.
81
Contingent Consideration related to Business Combinations
In connection with our acquisitions of Convergence Pharmaceuticals Holdings Limited (Convergence) and Biogen International Neuroscience GmbH (BIN), we agreed to make additional payments based upon the achievement of certain milestone events.
As the acquisitions of Convergence and BIN occurred after January 1, 2009, we recognized the contingent consideration liabilities associated with these transactions at their fair value on the acquisition date and revalue the remaining obligations each reporting period. We may pay up to approximately $735.0 million in remaining milestones related to these acquisitions.
Fumapharm AG
In 2006 we acquired Fumapharm AG. As part of this acquisition we acquired FUMADERM and TECFIDERA (together, the Fumapharm Products). We were required to make contingent payments to former shareholders of Fumapharm AG and holders of their rights based on the attainment of certain cumulative sales levels of Fumapharm Products and the level of total net sales of Fumapharm Products in the prior 12-month period, as defined in the acquisition agreement, until such time as the cumulative sales level reached $20.0 billion, at which time no further contingent payments were due. During the first quarter of 2019 we paid the final $300.0 million contingent payment as we achieved the $20.0 billion cumulative sales level related to the Fumapharm Products in the fourth quarter of 2018.
Contingent Development, Regulatory and Commercial Milestone Payments
Based on our development plans as of December 31, 2019, we could make potential future milestone payments to third parties of up to approximately $6.8 billion, including approximately $1.2 billion in development milestones, approximately $1.4 billion in regulatory milestones and approximately $4.2 billion in commercial milestones, as part of our various collaborations, including licensing and development programs. Payments under these agreements generally become due and payable upon achievement of certain development, regulatory or commercial milestones. Because the achievement of these milestones was not considered probable as of December 31, 2019, such contingencies have not been recorded in our financial statements. Amounts related to contingent milestone payments are not considered contractual obligations as they are contingent on the successful achievement of certain development, regulatory or commercial milestones.
Provided various development, regulatory or commercial milestones are achieved, we anticipate that we may pay approximately $430.0 million of milestone payments in 2020, including $75.0 million upon the regulatory filing with the FDA for approval of aducanumab and $100.0 million if aducanumab is launched in the U.S.
Other Funding Commitments
As of December 31, 2019, we have several ongoing clinical studies in various clinical trial stages. Our most significant clinical trial expenditures are to CROs. The contracts with CROs are generally cancellable, with notice, at our option. We recorded accrued expenses of approximately $24.0 million in our consolidated balance sheet for expenditures incurred by CROs as of December 31, 2019. We have approximately $514.0 million in cancellable future commitments based on existing CRO contracts as of December 31, 2019.
As part of the sale of our Hillerød, Denmark manufacturing operations to FUJIFILM, we have provided FUJIFILM with certain minimum batch production commitment guarantees. There is a risk that the minimum contractual batch production commitments will not be met. Based upon current estimates we expect to incur an adverse commitment obligation of approximately $74.0 million associated with such guarantees and have accrued for this obligation. We may adjust this estimate based upon changes in business conditions, which may result in the increase or reduction of this adverse commitment obligation in subsequent periods.
Tax Related Obligations
We exclude liabilities pertaining to uncertain tax positions from our summary of contractual obligations as we cannot make a reliable estimate of the period of cash settlement with the respective taxing authorities. As of December 31, 2019, we have $136.9 million of net liabilities associated with uncertain tax positions.
As of December 31, 2019 and 2018, we have accrued income tax liabilities of $697.0 million under the Transition Toll Tax. Of the amounts accrued as of December 31, 2019, no amounts are expected to be paid within one year due to an approximately $87.0 million carryforward of taxes paid in relation to the company's 2017 tax return. The Transition Toll Tax will be paid over an eight-year period, which started in 2018, and will not accrue interest. For additional information on the Transition Toll Tax, please read Note 16, Income Taxes, to our consolidated financial statements included in this report.
82
Other Off-Balance Sheet Arrangements
We do not have any relationships with entities often referred to as structured finance or special purpose entities that were established for the purpose of facilitating off-balance sheet arrangements. As such, we are not exposed to any financing, liquidity, market or credit risk that could arise if we had engaged in such relationships. We consolidate variable interest entities if we are the primary beneficiary.
New Accounting Standards
For a discussion of new accounting standards and their expected impact on our consolidated financial statements or disclosures, please read Note 1, Summary of Significant Accounting Policies, to our consolidated financial statements included in this report.
Legal Matters
For a discussion of legal matters as of December 31, 2019, please read Note 20, Litigation, to our consolidated financial statements included in this report.
Critical Accounting Policies and Estimates
The preparation of our consolidated financial statements, which have been prepared in accordance with accounting principles generally accepted in the U.S. (U.S. GAAP), requires us to make estimates, judgments and assumptions that may affect the reported amounts of assets, liabilities, equity, revenues and expenses and related disclosure of contingent assets and liabilities. On an ongoing basis we evaluate our estimates, judgments and methodologies. We base our estimates on historical experience and on various other assumptions that we believe are reasonable, the results of which form the basis for making judgments about the carrying values of assets, liabilities and equity and the amount of revenues and expenses. Actual results may differ from these estimates. Other significant accounting policies are outlined in Note 1, Summary of Significant Accounting Policies, to our consolidated financial statements included in this report.
Revenue Recognition
We recognize revenues when our customer obtains control of promised goods or services, in an amount that reflects the consideration which we expect to receive in exchange for those goods or services. We recognize revenues following the five-step model prescribed under Financial Accounting Standards Board (FASB) Accounting Standards Codification 606, Revenue from Contracts with
Customers: (i) identify contract(s) with a customer; (ii) identify the performance obligations in the contract; (iii) determine the transaction price; (iv) allocate the transaction price to the performance obligations in the contract; and (v) recognize revenues when (or as) we satisfy the performance obligation.
Product Revenues
In the U.S., we sell our products primarily to wholesale distributors and specialty pharmacy providers. In other countries, we sell our products primarily to wholesale distributors, hospitals, pharmacies and other third-party distribution partners. These customers subsequently resell our products to health care providers and patients. In addition, we enter into arrangements with health care providers and payors that provide for government-mandated or privately-negotiated discounts and allowances related to our products.
Product revenues are recognized when the customer obtains control of our product, which occurs at a point in time, typically upon delivery to the customer. We expense incremental costs of obtaining a contract as and when incurred if the expected amortization period of the asset that we would have recognized is one year or less or the amount is immaterial.
Reserves for Discounts and Allowances
Product revenues are recorded net of reserves established for applicable discounts and allowances that are offered within contracts with our customers, health care providers or payors, including those associated with the implementation of pricing actions in certain of the international markets in which we operate. Our process for estimating reserves established for these variable consideration components do not differ materially from our historical practices.
Product revenue reserves, which are classified as a reduction in product revenues, are generally characterized in the following categories: discounts, contractual adjustments and returns.
These reserves are based on estimates of the amounts earned or to be claimed on the related sales and are classified as reductions of accounts receivable (if the amount is payable to our customer) or a liability (if the amount is payable to a party other than our customer). Our estimates of reserves established for variable consideration are calculated based upon a consistent application of our methodology utilizing the expected value method. These estimates reflect our historical experience, current contractual and statutory requirements, specific known market events and trends, industry data and forecasted customer buying and payment patterns. The transaction price, which includes
83
variable consideration reflecting the impact of discounts and allowances, may be subject to constraint and is included in the net sales price only to the extent that it is probable that a significant reversal of the amount of cumulative revenues recognized will not occur in a future period. Actual amounts may ultimately differ from our estimates. If actual results vary, we adjust these estimates, which could have an effect on earnings in the period of adjustment.
In addition to discounts, rebates and product returns, we also maintain certain customer service contracts with distributors and other customers in the distribution channel that provide us with inventory management, data and distribution services, which are generally reflected as a reduction of revenues. To the extent we can demonstrate a separable benefit and fair value for these services we classify these payments in selling, general and administrative expenses.
For additional information on our revenues, please read Note 4, Revenues, to our consolidated financial statements included in this report.
Acquired Intangible Assets, including IPR&D
When we purchase a business, the acquired IPR&D is measured at fair value, capitalized as an intangible asset and tested for impairment at least annually, as of October 31, until commercialization, after which time the IPR&D is amortized over its estimated useful life. If we acquire an asset or group of assets that do not meet the definition of a business under applicable accounting standards, the acquired IPR&D is expensed on its acquisition date. Future costs to develop these assets are recorded to research and development expense as they are incurred.
We have acquired, and expect to continue to acquire, intangible assets through the acquisition of biotechnology companies or through the consolidation of variable interest entities. These intangible assets primarily consist of technology associated with human therapeutic products and IPR&D product candidates. When significant identifiable intangible assets are acquired, we generally engage an independent third-party valuation firm to assist in determining the fair values of these assets as of the acquisition date. Management will determine the fair value of less significant identifiable intangible assets acquired. Discounted cash flow models are typically used in these valuations, and these models require the use of significant estimates and assumptions including but not limited to:
• | estimating the timing of and expected costs to complete the in-process projects; |
• | projecting regulatory approvals; |
• | estimating future cash flows from product sales resulting from completed products and in process projects; and |
• | developing appropriate discount rates and probability rates by project. |
We believe the fair values assigned to the intangible assets acquired are based upon reasonable estimates and assumptions given available facts and circumstances as of the acquisition dates.
If these projects are not successfully developed, the sales and profitability of the company may be adversely affected in future periods. Additionally, the value of the acquired intangible assets may become impaired. No assurance can be given that the underlying assumptions used to estimate expected project sales, development costs or profitability, or the events associated with such projects, will transpire as estimated.
Impairment and Amortization of Long-lived Assets and Accounting for Goodwill
Long-lived Assets Other than Goodwill
Long-lived assets to be held and used include property, plant and equipment as well as intangible assets, including IPR&D and trademarks. Property, plant and equipment are reviewed for impairment whenever events or changes in circumstances indicate that the carrying amount of the assets may not be recoverable. We review our intangible assets with indefinite lives for impairment annually, as of October 31, and whenever events or changes in circumstances indicate that the carrying value of an asset may not be recoverable.
When performing our impairment assessment, we calculate the fair value using the same methodology as described above under Acquired Intangible Assets, including IPR&D. If the carrying value of our acquired IPR&D exceeds its fair value, then the intangible asset is written down to its fair value. Changes in the estimates and assumptions used in determining the fair value of our acquired IPR&D could result in an impairment. Impairments are recorded within amortization and impairment of acquired intangible assets in our consolidated statements of income. Assets that have previously been impaired, including our vixotrigine program for the treatment of neuropathic pain, such as TGN, could become further impaired in the future.
Our most significant intangible assets are our acquired and in-licensed rights and patents. Acquired and in-licensed rights and patents primarily relate to our acquisition of all remaining rights to TYSABRI from
84
Elan and obtaining the fair value of the U.S. and rest of world licenses to Forward Pharma’s intellectual property, including Forward Pharma’s intellectual property related to TECFIDERA. We amortize the intangible assets related to our TYSABRI, AVONEX, SPINRAZA, VUMERITY and TECFIDERA (rest of world) products using the economic consumption method based on revenues generated from the products underlying the related intangible assets. An analysis of the anticipated lifetime revenues of TYSABRI, AVONEX, SPINRAZA, VUMERITY and TECFIDERA (rest of world) is performed annually during our long-range planning cycle and whenever events or changes in circumstances would significantly affect the anticipated lifetime revenues of our TYSABRI, AVONEX, SPINRAZA, VUMERITY or TECFIDERA (rest of world) products.
For additional information on the impairment charges related to our long-lived assets during 2019, 2018 and 2017, please read Note 6, Intangible Assets and Goodwill, to our consolidated financial statements included in this report.
Goodwill
Goodwill relates largely to amounts that arose in connection with the merger of Biogen, Inc. and IDEC Pharmaceuticals Corporation in 2003 and amounts that were paid in connection with the acquisition of Fumapharm AG. Our goodwill balances represent the difference between the purchase price and the fair value of the identifiable tangible and intangible net assets when accounted for using the purchase method of accounting.
We assess our goodwill balance within our single reporting unit annually, as of October 31, and whenever events or changes in circumstances indicate the carrying value of goodwill may not be recoverable to determine whether any impairment in this asset may exist and, if so, the extent of such impairment. We compare the fair value of our reporting unit to its carrying value. If the carrying value of the net assets assigned to the reporting unit exceeds the fair value of our reporting unit, we would record an impairment loss equal to the difference.
We completed our required annual impairment test in the fourth quarters of 2019, 2018 and 2017 and determined in each of those periods that the carrying value of goodwill was not impaired. In each year, the fair value of our reporting unit, which includes goodwill, was significantly in excess of the carrying value of our reporting unit.
Contingent Consideration
We record contingent consideration resulting from a business combination at its fair value on the acquisition date. Each reporting period thereafter, we
revalue the remaining obligations and record increases or decreases in their fair value as an adjustment to contingent consideration expense in our consolidated statements of income. Changes in the fair value of our contingent consideration obligations can result from changes to one or multiple inputs, including adjustments to the discount rates and achievement and timing of any cumulative sales-based and development milestones or changes in the probability of certain clinical events and changes in the assumed probability associated with regulatory approval. These fair value measurements represent Level 3 measurements as they are based on significant inputs not observable in the market.
Significant judgment is employed in determining the appropriateness of these assumptions as of the acquisition date and for each subsequent period. Accordingly, changes in assumptions described above, could have a material impact on the amount of contingent consideration expense we record in any given period.
Income Taxes
We prepare and file income tax returns based on our interpretation of each jurisdiction’s tax laws and regulations. In preparing our consolidated financial statements, we estimate our income tax liability in each of the jurisdictions in which we operate by estimating our actual current tax expense together with assessing temporary differences resulting from differing treatment of items for tax and financial reporting purposes. These differences result in deferred tax assets and liabilities, which are included in our consolidated balance sheets. Upon our election in the fourth quarter of 2018 to record deferred taxes for GILTI, we have included amounts related to U.S. GILTI taxes within temporary difference. Significant management judgment is required in assessing the realizability of our deferred tax assets. In performing this assessment, we consider whether it is more likely than not that some portion or all of the deferred tax assets will not be realized. The ultimate realization of deferred tax assets is dependent upon the generation of future taxable income during the periods in which those temporary differences become deductible. In making this determination, under the applicable financial accounting standards, we are allowed to consider the scheduled reversal of deferred tax liabilities, projected future taxable income and the effects of tax planning strategies. In the event that actual results differ from our estimates, we adjust our estimates in future periods and we may need to establish a valuation allowance, which could materially impact our consolidated financial position and results of operations.
We account for uncertain tax positions using a “more-likely-than-not” threshold for recognizing and
85
resolving uncertain tax positions. We evaluate uncertain tax positions on a quarterly basis and consider various factors including, but not limited to, changes in tax law, the measurement of tax positions taken or expected to be taken in tax returns, the effective settlement of matters subject to audit, information obtained during in process audit activities and changes in facts or circumstances related to a tax position. We adjust the level of the liability to reflect any subsequent changes in the relevant facts surrounding the uncertain positions. Our liabilities for uncertain tax positions can be relieved only if the contingency becomes legally extinguished, through either payment to the taxing authority or the expiration of the statute of limitations, the recognition of the benefits associated with the position meet the “more-likely-than-not” threshold or the liability becomes effectively settled through the examination process. We consider matters to be effectively settled once the taxing authority has completed all of its required or expected examination procedures, including all appeals and administrative reviews, we have no plans to appeal or litigate any aspect of the tax position and we believe that it is highly unlikely that the taxing authority would examine or re-examine the related tax position. We also accrue for potential interest and penalties related to unrecognized tax benefits in income tax expense.
Item 7A. Quantitative and Qualitative Disclosures About Market Risk
We are subject to certain risks that may affect our results of operations, cash flows and fair values of assets and liabilities, including volatility in foreign currency exchange rates, interest rate movements, pricing pressures worldwide and weak economic conditions in the foreign markets in which we operate. We manage the impact of foreign currency exchange rates and interest rates through various financial instruments, including derivative instruments such as foreign currency forward contracts, interest rate lock contracts and interest rate swap contracts. We do not enter into financial instruments for trading or speculative purposes. The counterparties to these contracts are major financial institutions, and there is no significant concentration of exposure with any one counterparty.
Foreign Currency Exchange Risk
Our results of operations are subject to foreign currency exchange rate fluctuations due to the global nature of our operations. As a result, our consolidated financial position, results of operations and cash flows can be affected by market fluctuations in foreign currency exchange rates, primarily with respect to the Euro, British pound sterling, Canadian dollar, Swiss franc, Japanese yen and South Korean won.
While the financial results of our global activities are reported in U.S. dollars, the functional currency for most of our foreign subsidiaries is their respective local currency. Fluctuations in the foreign currency exchange rates of the countries in which we do business will affect our operating results, often in ways that are difficult to predict. In particular, as the U.S. dollar strengthens versus other currencies, the value of the non-U.S. revenues will decline when reported in U.S. dollars. The impact to net income as a result of a strengthening U.S. dollar will be partially mitigated by the value of non-U.S. expenses, which will also decline when reported in U.S. dollars. As the U.S. dollar weakens versus other currencies, the value of the non-U.S. revenues and expenses will increase when reported in U.S. dollars.
We have established revenue and operating expense hedging and balance sheet risk management programs to protect against volatility of future foreign currency cash flows and changes in fair value caused by volatility in foreign currency exchange rates.
During the second quarter of 2018 the International Practices Task Force of the Center for Audit Quality categorized Argentina as a country with a projected three-year cumulative inflation rate greater than 100%, which indicated that Argentina’s economy is highly inflationary. This categorization did not have a material impact on our results of operations or financial position as of December 31, 2019, and is not expected to have a material impact on our results of operations or financial position in the future.
Revenue and Operating Expense Hedging Program
Our foreign currency hedging program is designed to mitigate, over time, a portion of the impact resulting from volatility in exchange rate changes on revenues and operating expenses. We use foreign currency forward contracts to manage foreign currency risk, with the majority of our forward contracts used to hedge certain forecasted revenue and operating expense transactions denominated in foreign currencies in the next 15 months. We do not engage in currency speculation. For a more detailed disclosure of our revenue and operating expense hedging program, please read Note 9, Derivative Instruments, to our consolidated financial statements included in this report.
Our ability to mitigate the impact of foreign currency exchange rate changes on revenues and net income diminishes as significant foreign currency exchange rate fluctuations are sustained over extended periods of time. In particular, devaluation or significant deterioration of foreign currency exchange rates are difficult to mitigate and likely to negatively impact earnings. The cash flows from these contracts
86
are reported as operating activities in our consolidated statements of cash flows.
Balance Sheet Risk Management Hedging Program
We also use forward contracts to mitigate the foreign currency exposure related to certain balance sheet items. The primary objective of our balance sheet risk management program is to mitigate the exposure of foreign currency denominated net monetary assets and liabilities of foreign affiliates. In these instances, we principally utilize currency forward contracts. We have not elected hedge accounting for the balance sheet related items. The cash flows from these contracts are reported as operating activities in our consolidated statements of cash flows.
The following quantitative information includes the impact of currency movements on forward contracts used in our revenue, operating expense and balance sheet hedging programs. As of December 31, 2019 and 2018, a hypothetical adverse 10% movement in foreign currency exchange rates compared to the U.S. dollar across all maturities would result in a hypothetical decrease in the fair value of forward contracts of approximately $265.0 million and $290.0 million, respectively. The estimated fair value change was determined by measuring the impact of the hypothetical exchange rate movement on outstanding forward contracts. Our use of this methodology to quantify the market risk of such instruments is subject to assumptions and actual impact could be significantly different. The quantitative information about market risk is limited because it does not take into account all foreign currency operating transactions.
Net Investment Hedge Program
Our net investment hedging program is designed to mitigate currency fluctuations between the U.S. dollar and South Korean won as a result of exercising our option to increase our ownership percentage in Samsung Bioepis to approximately 49.9%. We entered into foreign currency forward contracts to manage the foreign currency risk with our forward contracts used to hedge changes in the spot rate over the next 10 months. As of December 31, 2019 and 2018, a hypothetical adverse 10% movement would result in a hypothetical decrease in fair value of approximately $43.0 million and $64.0 million, respectively. The estimated fair value was determined by measuring the impact of the hypothetical spot rate movement on outstanding forward contracts.
Interest Rate Risk
Our investment portfolio includes cash equivalents and short-term investments. The fair value of our marketable securities is subject to change as a result of potential changes in market
interest rates. The potential change in fair value for interest rate sensitive instruments has been assessed on a hypothetical 100 basis point adverse movement across all maturities. As of December 31, 2019 and 2018, we estimate that such hypothetical 100 basis point adverse movement would result in a hypothetical loss in fair value of approximately $21.0 million and $19.0 million, respectively, to our interest rate sensitive instruments. The fair values of our investments were determined using third-party pricing services or other market observable data.
To achieve a desired mix of fixed and floating interest rate debt, we entered into interest rate swap contracts during 2015 for certain of our fixed-rate debt. These derivative contracts effectively converted a fixed-rate interest coupon to a floating-rate LIBOR-based coupon over the life of the respective note. As of December 31, 2019 and 2018, a 100 basis-point adverse movement (increase in LIBOR) would increase annual interest expense by approximately $6.8 million.
Pricing Pressure
Governments in certain international markets in which we operate have implemented measures, and may in the future implement new or additional measures, to reduce health care costs to limit the overall level of government expenditures. These measures vary by country and may include, among other things, patient access restrictions, suspensions on price increases, prospective and possible retroactive price reductions and other recoupments and increased mandatory discounts or rebates, recoveries of past price increases and greater importation of drugs from lower-cost countries. In addition, certain countries set prices by reference to the prices in other countries where our products are marketed. Thus, our inability to obtain and maintain adequate prices in a particular country may adversely affect our ability to secure acceptable prices in existing and potential new markets, which may limit market growth. The continued implementation of pricing actions throughout Europe may also lead to higher levels of parallel trade.
In the U.S., federal and state legislatures, health agencies and third-party payors continue to focus on containing the cost of health care. Legislative and regulatory proposals, enactments to reform health care insurance programs and increasing pressure from social sources could significantly influence the way our products are prescribed and purchased. It is possible that additional federal health care reform measures will be adopted in the future, which could result in increased pricing pressure and reduced reimbursement for our products and otherwise have an adverse impact on our consolidated financial position or results of operations. There is also
87
significant economic pressure on state budgets that may result in states increasingly seeking to achieve budget savings through mechanisms that limit coverage or payment for our drugs. Managed care organizations are also continuing to seek price discounts and, in some cases, impose restrictions on the coverage of certain drugs.
Our products are also susceptible to increasing competition in many markets from generic versions, biosimilars and prodrugs of existing products as well as products approved under abbreviated regulatory pathways. Such products are likely to be sold at substantially lower prices than branded products. Accordingly, the introduction of such products, as well as other lower-priced competing products, may significantly reduce both the price that we are able to charge for our products and the volume of products we sell, which will negatively impact our revenues. In addition, when a generic version of one of our products is commercialized, it may, in some cases, be automatically substituted for our product and reduce our revenues in a short period of time.
Credit Risk
We are subject to credit risk from our accounts receivable related to our product sales. The majority of our accounts receivable arise from product sales in the U.S. and Europe with concentrations of credit risk limited due to the wide variety of customers and markets using our products, as well as their dispersion across many different geographic areas. Our accounts receivable are primarily due from wholesale and other third-party distributors, public hospitals, pharmacies and other government entities. We monitor the financial performance and creditworthiness of our customers so that we can properly assess and respond to changes in their credit profile. We operate in certain countries where weakness in economic conditions can result in extended collection periods. We continue to monitor these conditions, including the volatility associated with international economies and the relevant financial markets, and assess their possible impact on our business. To date, we have not experienced any significant losses with respect to the collection of our accounts receivable.
We believe that our allowance for doubtful accounts was adequate as of December 31, 2019 and 2018. However, if significant changes occur in the availability of government funding or the reimbursement practices of these or other governments, we may not be able to collect on amounts due to us from customers in such countries and our results of operations could be adversely affected.
Item 8. Financial Statements and Supplementary Data
The information required by this Item 8 is contained on pages F-1 through F-82 of this report and is incorporated herein by reference.
Item 9. Changes in and Disagreements with Accountants on Accounting and Financial Disclosure
None.
Item 9A. Controls and Procedures
Disclosure Controls and Procedures and Internal Control over Financial Reporting
Controls and Procedures
We have carried out an evaluation, under the supervision and with the participation of our management, including our principal executive officer and principal financial officer, of the effectiveness of the design and operation of our disclosure controls and procedures (as defined in Rules 13a-15(e) and 15d-15(e) under the Securities Exchange Act of 1934, as amended), as of December 31, 2019. Based upon that evaluation, our principal executive officer and principal financial officer concluded that, as of the end of the period covered by this report, our disclosure controls and procedures are effective in ensuring that (a) the information required to be disclosed by us in the reports that we file or submit under the Securities Exchange Act is recorded, processed, summarized and reported within the time periods specified in the SEC’s rules and forms and (b) such information is accumulated and communicated to our management, including our principal executive officer and principal financial officer, as appropriate to allow timely decisions regarding required disclosure. In designing and evaluating our disclosure controls and procedures, our management recognized that any controls and procedures, no matter how well designed and operated, can provide only reasonable assurance of achieving the desired control objectives, and our management necessarily was required to apply its judgment in evaluating the cost-benefit relationship of possible controls and procedures.
Changes in Internal Control over Financial Reporting
There were no changes in our internal control over financial reporting during the quarter ended December 31, 2019, that have materially affected, or are reasonably likely to materially affect, our internal control over financial reporting.
88
Management’s Annual Report on Internal Control over Financial Reporting
Our management is responsible for establishing and maintaining adequate internal control over our financial reporting. Internal control over financial reporting is defined in Rules 13a-15(f) and 15d-15(f) under the Securities Exchange Act as a process designed by, or under the supervision of, a company’s principal executive and principal financial officers and effected by a company’s board of directors, management and other personnel to provide reasonable assurance regarding the reliability of financial reporting and the preparation of financial statements for external purposes in accordance with U.S. GAAP. Our internal control over financial reporting includes those policies and procedures that:
• | pertain to the maintenance of records that, in reasonable detail, accurately and fairly reflect our transactions and dispositions of our assets; |
• | provide reasonable assurance that transactions are recorded as necessary to permit preparation of financial statements in accordance with U.S. GAAP, and that our receipts and expenditures are being made only in accordance with authorizations of our management and directors; and |
• | provide reasonable assurance regarding prevention or timely detection of unauthorized acquisition, use or disposition of our assets that could have a material effect on our financial statements. |
Because of its inherent limitations, internal control over financial reporting may not prevent or detect misstatements. Projections of any evaluation of effectiveness to future periods are subject to the risk that controls may become inadequate because of changes in conditions, or that the degree of compliance with the policies or procedures may deteriorate.
Our management assessed the effectiveness of our internal control over financial reporting as of December 31, 2019. In making this assessment, management used the criteria set forth by the Committee of Sponsoring Organizations of the Treadway Commission (COSO) in its 2013 Internal Control — Integrated Framework.
Based on our assessment, our management has concluded that, as of December 31, 2019, our internal control over financial reporting is effective based on those criteria.
The effectiveness of our internal control over financial reporting as of December 31, 2019, has been audited by PricewaterhouseCoopers LLP, an
89
PART III
Item 10. Directors, Executive Officers and Corporate Governance
The information concerning our executive officers is set forth under the heading Information about our Executive Officers in Item 1 of this report. The text of our code of business conduct, which includes the code of ethics that applies to our principal executive officer, principal financial officer, principal accounting officer or controller, and persons performing similar functions, is posted on our website, www.biogen.com, under the “Corporate Governance” subsection of the “Investors” section of the site. We intend to make all required disclosures regarding any amendments to, or waivers from, provisions of our code of business conduct at the same location of our website.
The response to the remainder of this item is incorporated by reference from the discussion responsive thereto in the sections entitled “Proposal 1 - Election of Directors,” “Corporate Governance at Biogen” and “Miscellaneous - Stockholder Proposals” contained in the proxy statement for our 2020 annual meeting of stockholders.
Item 11. Executive Compensation
The response to this item is incorporated by reference from the discussion responsive thereto in the sections entitled “Executive Compensation Matters” and “Corporate Governance at Biogen” contained in the proxy statement for our 2020 annual meeting of stockholders.
Item 12. Security Ownership of Certain Beneficial Owners and Management and Related Stockholder Matters
The response to this item is incorporated by reference from the discussion responsive thereto in the sections entitled “Stock Ownership” and “Equity Compensation Plan Information” contained in the proxy statement for our 2020 annual meeting of stockholders.
Item 13. Certain Relationships and Related Transactions, and Director Independence
The response to this item is incorporated by reference from the discussion responsive thereto in the sections entitled “Certain Relationships and Related Person Transactions” and “Corporate Governance at Biogen” contained in the proxy statement for our 2020 annual meeting of stockholders.
Item 14. Principal Accountant Fees and Services
The response to this item is incorporated by reference from the discussion responsive thereto in the section entitled “Proposal 2 - Ratification of the Selection of our Independent Registered Public Accounting Firm” contained in the proxy statement for our 2020 annual meeting of stockholders.
90
PART IV
Item 15. Exhibits and Financial Statement Schedules
a. (1) Consolidated Financial Statements:
The following financial statements are filed as part of this report:
Financial Statements | Page Number | |
Consolidated Statements of Income | F-2 | |
Consolidated Statements of Comprehensive Income | F-3 | |
Consolidated Balance Sheets | F-4 | |
Consolidated Statements of Cash Flows | F-5 | |
Consolidated Statements of Equity | F-6 | |
Notes to Consolidated Financial Statements | F-9 | |
Report of Independent Registered Public Accounting Firm | F-80 | |
Certain totals may not sum due to rounding.
(2) Exhibits
The exhibits listed on the Exhibit Index beginning on page 92, which is incorporated herein by reference, are filed or furnished as part of this report or are incorporated into this report by reference.
(3) Financial Statement Schedules
Schedules are omitted because they are not applicable, or are not required, or because the information is included in the consolidated financial statements and notes thereto.
Item 16. Form 10-K Summary
Not applicable.
91
EXHIBIT INDEX
Exhibit No. | Description | |
2.1† | ||
2.2 | ||
3.1 | ||
3.2 | ||
3.3 | ||
4.1 | ||
4.2 | ||
4.3 | ||
4.4+ | ||
10.1 | ||
10.2 | ||
10.3† | ||
10.4† | ||
10.5 | ||
10.6* | ||
10.7* | ||
10.8* | ||
10.9* | ||
10.10* | ||
10.11* | ||
10.12* | ||
92
Exhibit No. | Description | |
10.13* | ||
10.14* | ||
10.15* | ||
10.16* | ||
10.17* | ||
10.18* | ||
10.19* | ||
10.20* | ||
10.21* | ||
10.22* | ||
10.23* | ||
10.24* | ||
10.25* | ||
10.26* | ||
10.27* | ||
10.28* | ||
10.29* | ||
10.30* | ||
10.31* | ||
10.32* | ||
10.33* | ||
10.34* | ||
93
Exhibit No. | Description | |
10.35* | ||
10.36* | ||
10.37* | ||
10.38* | ||
10.39* | ||
10.40* | ||
21+ | ||
23+ | ||
31.1+ | ||
31.2+ | ||
32.1++ | ||
101++ | The following materials from Biogen Inc.’s Annual Report on Form 10-K for the year ended December 31, 2019, formatted in iXBRL (Inline Extensible Business Reporting Language): (i) the Consolidated Statements of Income, (ii) the Consolidated Statements of Comprehensive Income, (iii) the Consolidated Balance Sheets, (iv) the Consolidated Statements of Cash Flows, (v) the Consolidated Statements of Equity and (vi) Notes to Consolidated Financial Statements. | |
* | Management contract or compensatory plan or arrangement. |
† | Confidential treatment has been granted or requested with respect to portions of this exhibit. |
+ | Filed herewith. |
++ | Furnished herewith. |
94
SIGNATURES
Pursuant to the requirements of Section 13 or 15(d) of the Securities Exchange Act of 1934, the registrant has duly caused this report to be signed on its behalf by the undersigned, thereunto duly authorized.
BIOGEN INC. | |
By: | /S/ MICHEL VOUNATSOS |
Michel Vounatsos | |
Chief Executive Officer | |
Date: February 6, 2020
95
Pursuant to the requirements of the Securities Exchange Act of 1934, this report has been signed below by the following persons on behalf of the registrant and in the capacities and on the dates indicated.
Name | Capacity | Date | ||
/S/ MICHEL VOUNATSOS | Director and Chief Executive Officer (principal executive officer) | February 6, 2020 | ||
Michel Vounatsos | ||||
/S/ JEFFREY D. CAPELLO | Executive Vice President and Chief Financial Officer (principal financial officer) | February 6, 2020 | ||
Jeffrey D. Capello | ||||
/S/ ROBIN C. KRAMER | Vice President, Chief Accounting Officer (principal accounting officer) | February 6, 2020 | ||
Robin C. Kramer | ||||
/S/ STELIOS PAPADOPOULOS | Director and Chairman of the Board of Directors | February 6, 2020 | ||
Stelios Papadopoulos | ||||
/S/ ALEXANDER J. DENNER | Director | February 6, 2020 | ||
Alexander J. Denner | ||||
/S/ CAROLINE D. DORSA | Director | February 6, 2020 | ||
Caroline D. Dorsa | ||||
/S/ WILLIAM A. HAWKINS | Director | February 6, 2020 | ||
William A. Hawkins | ||||
/S/ NANCY L. LEAMING | Director | February 6, 2020 | ||
Nancy L. Leaming | ||||
/S/ JESUS B. MANTAS | Director | February 6, 2020 | ||
Jesus B. Mantas | ||||
/S/ RICHARD C. MULLIGAN | Director | February 6, 2020 | ||
Richard C. Mulligan | ||||
/S/ ROBERT W. PANGIA | Director | February 6, 2020 | ||
Robert W. Pangia | ||||
/S/ BRIAN S. POSNER | Director | February 6, 2020 | ||
Brian S. Posner | ||||
/S/ ERIC K. ROWINSKY | Director | February 6, 2020 | ||
Eric K. Rowinsky | ||||
/S/ LYNN SCHENK | Director | February 6, 2020 | ||
Lynn Schenk | ||||
/S/ STEPHEN A. SHERWIN | Director | February 6, 2020 | ||
Stephen A. Sherwin | ||||
96
BIOGEN INC. AND SUBSIDIARIES
CONSOLIDATED FINANCIAL STATEMENTS
Page Number | ||
Consolidated Statements of Income | F-2 | |
Consolidated Statements of Comprehensive Income | F-3 | |
Consolidated Balance Sheets | F-4 | |
Consolidated Statements of Cash Flows | F-5 | |
Consolidated Statements of Equity | F-6 | |
Notes to Consolidated Financial Statements | F-9 | |
Report of Independent Registered Public Accounting Firm | F-80 | |
F- 1
BIOGEN INC. AND SUBSIDIARIES
CONSOLIDATED STATEMENTS OF INCOME
(In millions, except per share amounts)
For the Years Ended December 31, | |||||||||||
2019 | 2018 | 2017 | |||||||||
Revenues: | |||||||||||
Product, net | $ | $ | $ | ||||||||
Revenues from anti-CD20 therapeutic programs | |||||||||||
Other | |||||||||||
Total revenues | |||||||||||
Cost and expenses: | |||||||||||
Cost of sales, excluding amortization and impairment of acquired intangible assets | |||||||||||
Research and development | |||||||||||
Selling, general and administrative | |||||||||||
Amortization and impairment of acquired intangible assets | |||||||||||
Collaboration profit (loss) sharing | |||||||||||
Loss on divestiture of Hillerød, Denmark manufacturing operations | |||||||||||
(Gain) loss on fair value remeasurement of contingent consideration | ( | ) | ( | ) | |||||||
Acquired in-process research and development | |||||||||||
Restructuring charges | |||||||||||
Total cost and expenses | |||||||||||
Income from operations | |||||||||||
Other income (expense), net | ( | ) | |||||||||
Income before income tax expense and equity in loss of investee, net of tax | |||||||||||
Income tax expense | |||||||||||
Equity in loss of investee, net of tax | |||||||||||
Net income | |||||||||||
Net income (loss) attributable to noncontrolling interests, net of tax | |||||||||||
Net income attributable to Biogen Inc. | $ | $ | $ | ||||||||
Net income per share: | |||||||||||
Basic earnings per share attributable to Biogen Inc. | $ | $ | $ | ||||||||
Diluted earnings per share attributable to Biogen Inc. | $ | $ | $ | ||||||||
Weighted-average shares used in calculating: | |||||||||||
Basic earnings per share attributable to Biogen Inc. | |||||||||||
Diluted earnings per share attributable to Biogen Inc. | |||||||||||
See accompanying notes to these consolidated financial statements.
F- 2
BIOGEN INC. AND SUBSIDIARIES
CONSOLIDATED STATEMENTS OF COMPREHENSIVE INCOME
(In millions)
For the Years Ended December 31, | |||||||||||
2019 | 2018 | 2017 | |||||||||
Net income attributable to Biogen Inc. | $ | $ | $ | ||||||||
Other comprehensive income: | |||||||||||
Unrealized gains (losses) on securities available for sale: | |||||||||||
Unrealized gains (losses) recognized during the period, net of tax | ( | ) | ( | ) | |||||||
Less: reclassification adjustment for (gains) losses included in net income, net of tax | ( | ) | |||||||||
Unrealized gains (losses) on securities available for sale, net of tax | ( | ) | |||||||||
Unrealized gains (losses) on cash flow hedges: | |||||||||||
Unrealized gains (losses) recognized during the period, net of tax | ( | ) | |||||||||
Less: reclassification adjustment for (gains) losses included in net income, net of tax | ( | ) | |||||||||
Unrealized gains (losses) on cash flow hedges, net of tax | ( | ) | ( | ) | |||||||
Gains (losses) on net investment hedges: | |||||||||||
Gains (losses) recognized during the period, net of tax | |||||||||||
Less: reclassification adjustment for (gains) losses included in net income, net of tax | ( | ) | ( | ) | |||||||
Gains (losses) on net investment hedges, net of tax | |||||||||||
Unrealized gains (losses) on pension benefit obligation, net of tax | ( | ) | ( | ) | |||||||
Currency translation adjustment | ( | ) | |||||||||
Total other comprehensive income (loss), net of tax | |||||||||||
Comprehensive income attributable to Biogen Inc. | |||||||||||
Comprehensive income (loss) attributable to noncontrolling interests, net of tax | ( | ) | |||||||||
Comprehensive income | $ | $ | $ | ||||||||
See accompanying notes to these consolidated financial statements.
F- 3
BIOGEN INC. AND SUBSIDIARIES
CONSOLIDATED BALANCE SHEETS
(In millions, except per share amounts)
As of December 31, | |||||||
2019 | 2018 | ||||||
ASSETS | |||||||
Current assets: | |||||||
Cash and cash equivalents | $ | $ | |||||
Marketable securities | |||||||
Accounts receivable, net | |||||||
Due from anti-CD20 therapeutic programs | |||||||
Inventory | |||||||
Other current assets | |||||||
Total current assets | |||||||
Marketable securities | |||||||
Property, plant and equipment, net | |||||||
Operating lease assets | |||||||
Intangible assets, net | |||||||
Goodwill | |||||||
Deferred tax asset | |||||||
Investments and other assets | |||||||
Total assets | $ | $ | |||||
LIABILITIES AND EQUITY | |||||||
Current liabilities: | |||||||
Current portion of notes payable | $ | $ | |||||
Taxes payable | |||||||
Accounts payable | |||||||
Accrued expenses and other | |||||||
Total current liabilities | |||||||
Notes payable | |||||||
Deferred tax liability | |||||||
Long-term operating lease liabilities | |||||||
Other long-term liabilities | |||||||
Total liabilities | |||||||
Commitments and contingencies | |||||||
Equity: | |||||||
Biogen Inc. shareholders’ equity | |||||||
Preferred stock, par value $0.001 per share | |||||||
Common stock, par value $0.0005 per share | |||||||
Additional paid-in capital | |||||||
Accumulated other comprehensive loss | ( | ) | ( | ) | |||
Retained earnings | |||||||
Treasury stock, at cost; 23.8 million and 23.8 million shares, respectively | ( | ) | ( | ) | |||
Total Biogen Inc. shareholders’ equity | |||||||
Noncontrolling interests | ( | ) | ( | ) | |||
Total equity | |||||||
Total liabilities and equity | $ | $ | |||||
See accompanying notes to these consolidated financial statements.
F- 4
BIOGEN INC. AND SUBSIDIARIES
CONSOLIDATED STATEMENTS OF CASH FLOWS
(In millions)
For the Years Ended December 31, | |||||||||||
2019 | 2018 | 2017 | |||||||||
Cash flows from operating activities: | |||||||||||
Net income | $ | $ | $ | ||||||||
Adjustments to reconcile net income to net cash flows from operating activities: | |||||||||||
Depreciation, amortization and impairments | |||||||||||
Acquired in-process research and development | |||||||||||
Share-based compensation | |||||||||||
Deferred income taxes | |||||||||||
Contingent consideration | ( | ) | ( | ) | |||||||
Loss on divestiture of Hillerød, Denmark manufacturing operations | |||||||||||
Other | ( | ) | |||||||||
Changes in operating assets and liabilities, net: | |||||||||||
Accounts receivable | ( | ) | ( | ) | |||||||
Due from anti-CD20 therapeutic programs | ( | ) | ( | ) | |||||||
Inventory | ( | ) | ( | ) | ( | ) | |||||
Accrued expenses and other current liabilities | ( | ) | |||||||||
Income tax assets and liabilities | |||||||||||
Other liabilities | ( | ) | ( | ) | ( | ) | |||||
Net cash flows provided by operating activities | |||||||||||
Cash flows from investing activities: | |||||||||||
Proceeds from sales and maturities of marketable securities | |||||||||||
Purchases of marketable securities | ( | ) | ( | ) | ( | ) | |||||
Contingent consideration related to Fumapharm AG acquisition | ( | ) | ( | ) | ( | ) | |||||
Acquisition of Nightstar Therapeutics plc, net of cash acquired | ( | ) | |||||||||
Proceeds from divestiture of Hillerød, Denmark manufacturing operations | |||||||||||
Acquired in-process research and development | ( | ) | ( | ) | |||||||
Purchases of property, plant and equipment | ( | ) | ( | ) | ( | ) | |||||
Acquisitions of intangible assets | ( | ) | ( | ) | ( | ) | |||||
Purchase of Ionis Pharmaceuticals, Inc. stock | ( | ) | |||||||||
Investment in Samsung Bioepis | ( | ) | |||||||||
Proceeds from sales of strategic investments | |||||||||||
Other | ( | ) | |||||||||
Net cash flows provided by (used in) investing activities | ( | ) | ( | ) | |||||||
Cash flows from financing activities: | |||||||||||
Purchases of treasury stock | ( | ) | ( | ) | ( | ) | |||||
Net contribution (distribution) to noncontrolling interests | ( | ) | ( | ) | |||||||
Repayments of borrowings | ( | ) | ( | ) | |||||||
Net cash contribution to Bioverativ, Inc. | ( | ) | |||||||||
Contingent consideration payments | ( | ) | ( | ) | |||||||
Other | ( | ) | ( | ) | |||||||
Net cash flows used in financing activities | ( | ) | ( | ) | ( | ) | |||||
Net increase (decrease) in cash and cash equivalents | ( | ) | ( | ) | |||||||
Effect of exchange rate changes on cash and cash equivalents | ( | ) | |||||||||
Cash and cash equivalents, beginning of the year | |||||||||||
Cash and cash equivalents, end of the year | $ | $ | $ | ||||||||
See accompanying notes to these consolidated financial statements.
F- 5
BIOGEN INC. AND SUBSIDIARIES
CONSOLIDATED STATEMENTS OF EQUITY
(In millions)
Preferred stock | Common stock | Additional paid-in capital | Accumulated other comprehensive loss | Retained earnings | Treasury stock | Total Biogen Inc. shareholders’ equity | Noncontrolling interests | Total equity | ||||||||||||||||||||||||||||||||||||
Shares | Amount | Shares | Amount | Shares | Amount | |||||||||||||||||||||||||||||||||||||||
Balance, December 31, 2018 | $ | $ | $ | $ | ( | ) | $ | ( | ) | $ | ( | ) | $ | $ | ( | ) | $ | |||||||||||||||||||||||||||
Net income | ||||||||||||||||||||||||||||||||||||||||||||
Other comprehensive income (loss), net of tax | ( | ) | ||||||||||||||||||||||||||||||||||||||||||
Capital contribution by noncontrolling interest | ||||||||||||||||||||||||||||||||||||||||||||
Repurchase of common stock pursuant to the March 2019 Share Repurchase Program, at cost | ( | ) | ( | ) | ( | ) | ( | ) | ||||||||||||||||||||||||||||||||||||
Retirement of common stock pursuant to the March 2019 Share Repurchase Program, at cost | ( | ) | ( | ) | ( | ) | ||||||||||||||||||||||||||||||||||||||
Repurchase of common stock pursuant to the 2018 Share Repurchase Program, at cost | ( | ) | ( | ) | ( | ) | ( | ) | ||||||||||||||||||||||||||||||||||||
Retirement of common stock pursuant to the 2018 Share Repurchase Program, at cost | ( | ) | ( | ) | ( | ) | ||||||||||||||||||||||||||||||||||||||
Issuance of common stock under stock option and stock purchase plans | ||||||||||||||||||||||||||||||||||||||||||||
Issuance of common stock under stock award plan | ( | ) | ( | ) | ( | ) | ||||||||||||||||||||||||||||||||||||||
Compensation related to share-based payments | ||||||||||||||||||||||||||||||||||||||||||||
Balance, December 31, 2019 | $ | $ | $ | $ | ( | ) | $ | ( | ) | $ | ( | ) | $ | $ | ( | ) | $ | |||||||||||||||||||||||||||
See accompanying notes to these consolidated financial statements.
F- 6
BIOGEN INC. AND SUBSIDIARIES
CONSOLIDATED STATEMENTS OF EQUITY - (Continued)
(In millions)
Preferred stock | Common stock | Additional paid-in capital | Accumulated other comprehensive loss | Retained earnings | Treasury stock | Total Biogen Inc. shareholders’ equity | Noncontrolling interests | Total equity | ||||||||||||||||||||||||||||||||||||
Shares | Amount | Shares | Amount | Shares | Amount | |||||||||||||||||||||||||||||||||||||||
Balance, December 31, 2017 | $ | $ | $ | $ | ( | ) | $ | ( | ) | $ | ( | ) | $ | $ | ( | ) | $ | |||||||||||||||||||||||||||
Net income | ||||||||||||||||||||||||||||||||||||||||||||
Other comprehensive income (loss), net of tax | ( | ) | ||||||||||||||||||||||||||||||||||||||||||
Capital contribution by noncontrolling interests | ||||||||||||||||||||||||||||||||||||||||||||
Distribution to noncontrolling interests | ( | ) | ( | ) | ||||||||||||||||||||||||||||||||||||||||
Repurchase of common stock pursuant to the 2018 Share Repurchase Program, at cost | ( | ) | ( | ) | ( | ) | ( | ) | ||||||||||||||||||||||||||||||||||||
Retirement of common stock pursuant to the 2018 Share Repurchase Program, at cost | ( | ) | ( | ) | ( | ) | ||||||||||||||||||||||||||||||||||||||
Repurchase of common stock pursuant to the 2016 Share Repurchase Program, at cost | ( | ) | ( | ) | ( | ) | ( | ) | ||||||||||||||||||||||||||||||||||||
Retirement of common stock pursuant to the 2016 Share Repurchase Program, at cost | ( | ) | ( | ) | ( | ) | ||||||||||||||||||||||||||||||||||||||
Issuance of common stock under stock option and stock purchase plans | ||||||||||||||||||||||||||||||||||||||||||||
Issuance of common stock under stock award plan | ( | ) | ( | ) | ( | ) | ||||||||||||||||||||||||||||||||||||||
Compensation related to share-based payments | ||||||||||||||||||||||||||||||||||||||||||||
Adoption of new accounting guidance | ||||||||||||||||||||||||||||||||||||||||||||
Balance, December 31, 2018 | $ | $ | $ | $ | ( | ) | $ | ( | ) | $ | ( | ) | $ | $ | ( | ) | $ | |||||||||||||||||||||||||||
See accompanying notes to these consolidated financial statements.
F- 7
BIOGEN INC. AND SUBSIDIARIES
CONSOLIDATED STATEMENTS OF EQUITY - (Continued)
(In millions)
Preferred stock | Common stock | Additional paid-in capital | Accumulated other comprehensive loss | Retained earnings | Treasury stock | Total Biogen Inc. shareholders’ equity | Noncontrolling interests | Total equity | ||||||||||||||||||||||||||||||||||||
Shares | Amount | Shares | Amount | Shares | Amount | |||||||||||||||||||||||||||||||||||||||
Balance, December 31, 2016 | $ | $ | $ | $ | ( | ) | $ | ( | ) | $ | ( | ) | $ | $ | ( | ) | $ | |||||||||||||||||||||||||||
Net income | ||||||||||||||||||||||||||||||||||||||||||||
Other comprehensive income, net of tax | ||||||||||||||||||||||||||||||||||||||||||||
Capital contribution to noncontrolling interests | ||||||||||||||||||||||||||||||||||||||||||||
Distribution to noncontrolling interests | ( | ) | ( | ) | ||||||||||||||||||||||||||||||||||||||||
Repurchase of common stock pursuant to the 2016 Share Repurchase Program, at cost | ( | ) | ( | ) | ( | ) | ( | ) | ||||||||||||||||||||||||||||||||||||
Retirement of common stock pursuant to the 2016 Share Repurchase Program, at cost | ( | ) | ( | ) | ( | ) | ||||||||||||||||||||||||||||||||||||||
Repurchase of common stock pursuant to the 2011 Share Repurchase Program, at cost | ( | ) | ( | ) | ( | ) | ( | ) | ||||||||||||||||||||||||||||||||||||
Issuance of common stock under stock option and stock purchase plans | ||||||||||||||||||||||||||||||||||||||||||||
Issuance of common stock under stock award plan | ( | ) | ( | ) | ( | ) | ( | ) | ||||||||||||||||||||||||||||||||||||
Compensation related to share-based payments | ||||||||||||||||||||||||||||||||||||||||||||
Hemophilia spin-off adjustment | ( | ) | ( | ) | ( | ) | ||||||||||||||||||||||||||||||||||||||
Tax benefit | ||||||||||||||||||||||||||||||||||||||||||||
Balance, December 31, 2017 | $ | $ | $ | $ | ( | ) | $ | ( | ) | $ | ( | ) | $ | $ | ( | ) | $ | |||||||||||||||||||||||||||
See accompanying notes to these consolidated financial statements.
F- 8
1. Summary of Significant Accounting Policies
References in these notes to "Biogen," the "company," "we," "us" and "our" refer to Biogen Inc. and its consolidated subsidiaries.
Business Overview
Biogen is a global biopharmaceutical company focused on discovering, developing and delivering worldwide innovative therapies for people living with serious neurological and neurodegenerative diseases as well as related therapeutic adjacencies. Our core growth areas include multiple sclerosis (MS) and neuroimmunology; Alzheimer’s disease (AD) and dementia; neuromuscular disorders, including spinal muscular atrophy (SMA) and amyotrophic lateral sclerosis (ALS); movement disorders, including Parkinson's disease; and ophthalmology. We are also focused on discovering, developing and delivering worldwide innovative therapies in our emerging growth areas of immunology; neurocognitive disorders; acute neurology; and pain. In addition, we commercialize biosimilars of advanced biologics. We support our drug discovery and development efforts through the commitment of significant resources to discovery, research and development programs and business development opportunities.
Our marketed products include TECFIDERA, AVONEX, PLEGRIDY, TYSABRI, VUMERITY and FAMPYRA for the treatment of MS; SPINRAZA for the treatment of SMA; and FUMADERM for the treatment of severe plaque psoriasis. We also have certain business and financial rights with respect to RITUXAN for the treatment of non-Hodgkin's lymphoma, chronic lymphocytic leukemia (CLL) and other conditions; RITUXAN HYCELA for the treatment of non-Hodgkin's lymphoma and CLL; GAZYVA for the treatment of CLL and follicular lymphoma; OCREVUS for the treatment of primary progressive MS (PPMS) and relapsing MS (RMS); and other potential anti-CD20 therapies pursuant to our collaboration arrangements with Genentech, Inc. (Genentech), a wholly-owned member of the Roche Group. For additional information on our collaboration arrangements with Genentech, please read Note 18, Collaborative and Other Relationships, to these consolidated financial statements.
Our innovative drug development and commercialization activities are complemented by our biosimilar business that expands access to medicines and reduce the cost burden for healthcare systems. Through Samsung Bioepis Co., Ltd. (Samsung Bioepis), our joint venture with Samsung BioLogics Co., Ltd. (Samsung BioLogics), we market and sell BENEPALI, an etanercept biosimilar referencing ENBREL, IMRALDI, an adalimumab biosimilar referencing HUMIRA, and FLIXABI, an infliximab biosimilar referencing REMICADE, in certain countries in Europe and have exclusive rights to commercialize these products in China. Additionally, we have exclusive rights to commercialize two potential ophthalmology biosimilar products, SB11 referencing LUCENTIS and SB15 referencing EYLEA, in major markets worldwide, including the U.S., Canada, Europe, Japan and Australia. For additional information on our collaboration arrangements with Samsung Bioepis, please read Note 18, Collaborative and Other Relationships, to these consolidated financial statements.
Consolidation
Our consolidated financial statements reflect our financial statements, those of our wholly-owned subsidiaries and those of certain variable interest entities where we are the primary beneficiary. For consolidated entities where we own or are exposed to less than 100 % of the economics, we record net income (loss) attributable to noncontrolling interests in our consolidated statements of income equal to the percentage of the economic or ownership interest retained in such entities by the respective noncontrolling parties. Intercompany balances and transactions are eliminated in consolidation.
In determining whether we are the primary beneficiary of a variable interest entity, we apply a qualitative approach that determines whether we have both (1) the power to direct the economically significant activities of the entity and (2) the obligation to absorb losses of, or the right to receive benefits from, the entity that could potentially be significant to that entity. These considerations impact the way we account for our existing collaborative relationships and other arrangements. We continuously assess whether we are the primary beneficiary of a variable interest entity as changes to existing relationships or future transactions may result in us consolidating or deconsolidating one or more of our collaborators or partners.
F- 9
BIOGEN INC. AND SUBSIDIARIES
NOTES TO CONSOLIDATED FINANCIAL STATEMENTS — (Continued)
Use of Estimates
The preparation of our consolidated financial statements requires us to make estimates, judgments and assumptions that may affect the reported amounts of assets, liabilities, equity, revenues and expenses and related disclosure of contingent assets and liabilities. On an ongoing basis we evaluate our estimates, judgments and methodologies. We base our estimates on historical experience and on various other assumptions that we believe are reasonable, the results of which form the basis for making judgments about the carrying values of assets, liabilities and equity and the amount of revenues and expenses. Actual results may differ from these estimates.
Revenue Recognition
In May 2014 the Financial Accounting Standards Board (FASB) issued Accounting Standards Update (ASU) No. 2014-09, Revenue from Contracts with Customers (Topic 606), which supersedes all existing revenue recognition requirements, including most industry specific guidance. This standard requires a company to recognize revenues when it transfers goods or services to customers in an amount that reflects the consideration that the company expects to receive for those goods or services. This standard became effective for us on January 1, 2018, and was adopted using the modified retrospective method. The adoption of this standard as of January 1, 2018, did not change our revenue recognition.
We recognize revenues when our customer obtains control of promised goods or services, in an amount that reflects the consideration which we expect to receive in exchange for those goods or services. We recognize revenues following the five-step model prescribed under the FASB Accounting Standards Codification (ASC) 606, Revenue from Contracts with Customers: (i) identify contract(s) with a customer; (ii) identify the performance obligations in the contract; (iii) determine the transaction price; (iv) allocate the transaction price to the performance obligations in the contract; and (v) recognize revenues when (or as) we satisfy the performance obligation.
Product Revenues
In the United States (U.S.), we sell our products primarily to wholesale distributors and specialty pharmacy providers. In other countries, we sell our products primarily to wholesale distributors, hospitals, pharmacies and other third-party distribution partners. These customers subsequently resell our products to health care providers and patients. In addition, we enter into arrangements with health care providers and payors that provide for government-mandated or privately-negotiated discounts and allowances related to our products.
Product revenues are recognized when the customer obtains control of our product, which occurs at a point in time, typically upon delivery to the customer. We expense incremental costs of obtaining a contract as and when incurred if the expected amortization period of the asset that we would have recognized is one year or less or the amount is immaterial.
Reserves for Discounts and Allowances
Product revenues are recorded net of reserves established for applicable discounts and allowances that are offered within contracts with our customers, health care providers or payors, including those associated with the implementation of pricing actions in certain of the international markets in which we operate. Our process for estimating reserves established for these variable consideration components do not differ materially from our historical practices.
Product revenue reserves, which are classified as a reduction in product revenues, are generally characterized in the following categories: discounts, contractual adjustments and returns.
These reserves are based on estimates of the amounts earned or to be claimed on the related sales and are classified as reductions of accounts receivable (if the amount is payable to our customer) or a liability (if the amount is payable to a party other than our customer). Our estimates of reserves established for variable consideration are calculated based upon a consistent application of our methodology utilizing the expected value method. These estimates reflect our historical experience, current contractual and statutory requirements, specific known market events and trends, industry data and forecasted customer buying and payment patterns. The transaction price, which includes variable consideration reflecting the impact of discounts and allowances, may be subject to constraint and is included in the net sales price only to the extent that it is probable that a significant reversal of the amount of the cumulative revenues recognized will not occur in a future period. Actual amounts may ultimately differ from our estimates. If actual results vary, we adjust these estimates, which could have an effect on earnings in the period of adjustment.
F- 10
BIOGEN INC. AND SUBSIDIARIES
NOTES TO CONSOLIDATED FINANCIAL STATEMENTS — (Continued)
Discounts include trade term discounts and wholesaler incentives. Trade term discounts and wholesaler incentives primarily relate to estimated obligations for credits to be granted to wholesalers for remitting payment on their purchases within established incentive periods and credits to be granted to wholesalers for compliance with various contractually-defined inventory management practices, respectively. We determine these reserves based on our historical experience, including the timing of customer payments.
Contractual adjustments primarily relate to Medicaid and managed care rebates, co-payment (copay) assistance, Veterans Administration (VA) and Public Health Service (PHS) discounts, specialty pharmacy program fees and other governmental rebates or applicable allowances.
• | Medicaid rebates relate to our estimated obligations to states under established reimbursement arrangements. Rebate accruals are recorded in the same period the related revenue is recognized, resulting in a reduction of product revenue and the establishment of a liability which is included in other current liabilities. Our liability for Medicaid rebates consists of estimates for claims that a state will make for the current quarter, claims for prior quarters that have been estimated for which an invoice has not been received, invoices received for claims from the prior quarters that have not been paid and an estimate of potential claims that will be made for inventory that exists in the distribution channel at period end. |
• | Governmental rebates or chargebacks, including VA and PHS discounts, represent our estimated obligations resulting from contractual commitments to sell products to qualified healthcare providers at prices lower than the list prices we charge to wholesalers which provide those products. The wholesaler charges us for the difference between what the wholesaler pays for the products and the ultimate selling price to the qualified healthcare providers. Rebate and chargeback reserves are established in the same period as the related revenue is recognized, resulting in a reduction in product revenue and accounts receivable. Chargeback amounts are generally determined at the time of resale to the qualified healthcare provider from the wholesaler, and we generally issue credits for such amounts within a few weeks of the wholesaler notifying us about the resale. Our reserves for VA, PHS and chargebacks consist of amounts that we expect to issue for inventory that exists at the wholesalers that we expect will be sold to qualified healthcare providers and chargebacks that wholesalers have claimed for which we have not issued a credit. |
• | Managed care rebates represent our estimated obligations to third parties, primarily pharmacy benefit managers. Rebate accruals are recorded in the same period the related revenue is recognized, resulting in a reduction of product revenue and the establishment of a liability which is included in accrued expenses and other current liabilities. These rebates result from performance-based goals, formulary position and price increase limit allowances (price protection). The calculation of the accrual for these rebates is based on an estimate of the customer’s buying patterns and the resulting applicable contractual rebate rate(s) to be earned over a contractual period. |
• | Copay assistance represents financial assistance to qualified patients, assisting them with prescription drug co-payments required by insurance. The calculation of the accrual for copay is based on an estimate of claims and the cost per claim that we expect to receive associated with inventory that exists in the distribution channel at period end. |
• | Other governmental rebates, non-U.S. pharmaceutical taxes or applicable allowances primarily relate to mandatory rebates and discounts in international markets where government-sponsored healthcare systems are the primary payors for healthcare. |
Product returns are established for returns expected to be made by wholesalers and are recorded in the period the related revenue is recognized, resulting in a reduction to product revenues. In accordance with contractual terms, wholesalers are permitted to return product for reasons such as damaged or expired product. The majority of wholesaler returns are due to product expiration. Expired product return reserves are estimated through a comparison of historical return data to their related sales on a production lot basis. Historical rates of return are determined for each product and are adjusted for known or expected changes in the marketplace specific to each product.
In addition to discounts, rebates and product returns, we also maintain certain customer service contracts with distributors and other customers in the distribution channel that provide us with inventory management, data and distribution services, which are generally reflected as a reduction of revenues. To the extent we can demonstrate a
F- 11
BIOGEN INC. AND SUBSIDIARIES
NOTES TO CONSOLIDATED FINANCIAL STATEMENTS — (Continued)
separable benefit and fair value for these services we classify these payments in selling, general and administrative expenses.
Revenues from Anti-CD20 Therapeutic Programs
Our collaboration with Genentech is within the scope of ASC 808, Collaborative Agreements, which provides guidance on the presentation and disclosure of collaborative arrangements. For purposes of this footnote we refer to RITUXAN and RITUXAN HYCELA collectively as RITUXAN.
Our share of the pre-tax co-promotion profits on RITUXAN and GAZYVA and royalty revenues on the sale of OCREVUS resulted from an exchange of a license. As we do not have future performance obligations under the license or collaboration agreement, revenues are recognized as the underlying sales occur.
Revenues from anti-CD20 therapeutic programs consist of:
(i) | our share of pre-tax profits and losses in the U.S. for RITUXAN and GAZYVA; and |
(ii) | other revenues from anti-CD20 therapeutic programs, which primarily consist of our share of pre-tax co-promotion profits on RITUXAN in Canada and royalty revenues on sales of OCREVUS. |
Pre-tax co-promotion profits on RITUXAN and GAZYVA are calculated and paid to us by Genentech in the U.S. Pre-tax co-promotion profits on RITUXAN are calculated and paid to us by the Roche Group in Canada. Pre-tax co-promotion profits consist of U.S. and Canadian net sales to third-party customers less applicable costs to manufacture, third-party royalty expenses, distribution, selling and marketing expenses and joint development expenses incurred by Genentech and the Roche Group. Our share of the pre-tax profits on RITUXAN and GAZYVA in the U.S. and pre-tax co-promotion profits on RITUXAN in Canada include estimates that are based on information received from Genentech and Roche. These estimates are subject to change and actual results may differ.
For additional information on our relationship with Genentech, please read Note 18, Collaborative and Other Relationships, to these consolidated financial statements.
Other Revenues
Royalty Revenues
We receive royalty revenues on sales by our licensees of products covered under patents that we own. We do not have future performance obligations under these license arrangements. We record these revenues based on estimates of the sales that occurred during the relevant period as a component of other revenues. The relevant period estimates of sales are based on interim data provided by licensees and other third parties and analysis of historical royalties that have been paid to us, adjusted for any changes in facts and circumstances, as appropriate. Differences between actual and estimated royalty revenues are adjusted for in the period in which they become known, typically the following quarter. Historically, adjustments have not been material when compared to actual amounts paid by licensees.
Collaborative and Other Relationships
We have a number of significant collaborative and other third-party relationships for revenues and for the development, regulatory approval, commercialization and marketing of certain of our products and product candidates. Where we are the principal on sales transactions with third parties, we recognize revenues, cost of sales and operating expenses on a gross basis in their respective lines in our consolidated statements of income. Where we are not the principal on sales transactions with third parties, we record our share of the revenues, cost of sales and operating expenses on a net basis in collaborative and other relationships included in other revenues in our consolidated statements of income.
Our development and commercialization arrangements with Genentech and Samsung Bioepis represent collaborative arrangements as each party is an active participant in one or more joint operating activities and is exposed to significant risks and rewards of these arrangements. These arrangements resulted from an exchange of a license and utilize the sales and usage based royalty exception. Therefore, revenues relating to royalties or profit-sharing amounts received are recognized as the underlying sales occur.
For additional information on our collaboration arrangements with Genentech and Samsung Bioepis, please read Note 18, Collaborative and Other Relationships, to these consolidated financial statements.
F- 12
BIOGEN INC. AND SUBSIDIARIES
NOTES TO CONSOLIDATED FINANCIAL STATEMENTS — (Continued)
Other Corporate Revenues
We record other corporate revenues primarily from amounts earned under contract manufacturing agreements. Revenues under contract manufacturing agreements are recognized when the customer obtains control of the product, which may occur at a point in time or over time depending on the terms and conditions of the agreement.
We have certain financial assets and liabilities recorded at fair value which have been classified as Level 1, 2 or 3 within the fair value hierarchy as described in the accounting standards for fair value measurements.
• | Level 1 — Fair values are determined utilizing quoted prices (unadjusted) in active markets for identical assets or liabilities that we have the ability to access; |
• | Level 2 — Fair values are determined by utilizing quoted prices for identical or similar assets and liabilities in active markets or other market observable inputs such as interest rates, yield curves, foreign currency spot rates and option pricing valuation models; and |
• | Level 3 — Prices or valuations that require inputs that are both significant to the fair value measurement and unobservable. |
The majority of our financial assets have been classified as Level 2. Our financial assets (which include our cash equivalents, marketable debt securities and certain of our marketable equity securities, derivative contracts and plan assets for deferred compensation) have been initially valued at the transaction price and subsequently valued, at the end of each reporting period, utilizing third-party pricing services or option pricing valuation models. The pricing services utilize industry standard valuation models, including both income and market-based approaches and observable market inputs to determine value. These observable market inputs include reportable trades, benchmark yields, credit spreads, broker/dealer quotes, bids, offers, current spot rates and other industry and economic events.
We validate the prices provided by our third-party pricing services by understanding the models used, obtaining market values from other pricing sources and analyzing pricing data in certain instances. The option pricing valuation models use assumptions within the model, including the term, stock price volatility, constant maturity risk-free interest rate and dividend yield. After completing our validation procedures, we did not adjust or override any fair value measurements provided by our pricing services as of December 31, 2019 and 2018.
Other Assets and Liabilities
The carrying amounts reflected in our consolidated balance sheets for current accounts receivable, due from anti-CD20 therapeutic programs, other current assets, accounts payable and accrued expenses and other, approximate fair value due to their short-term maturities.
Cash and Cash Equivalents
We consider only those investments that are highly liquid, readily convertible to cash and that mature within three months from date of purchase to be cash equivalents. As of December 31, 2019 and 2018, cash equivalents were comprised of money market funds, commercial paper, overnight reverse repurchase agreements and other debt securities with maturities less than 90 days from the date of purchase.
Accounts Receivable
The majority of our accounts receivable arise from product sales and primarily represent amounts due from our wholesale and other third-party distributors, public hospitals, pharmacies and other government entities and have standard payment terms that generally require payment within 30 to 90 days.
We do not adjust our receivables for the effects of a significant financing component at contract inception if we expect to collect the receivables in one year or less from the time of sale.
In countries where we have experienced a pattern of payments extending beyond our contractual payment term and we expect to collect receivables greater than one year from the time of sale, we have assessed whether the customer has a significant financing component and discounted our receivables and reduced related revenues over the period of time that we estimate those amounts will be paid using the country’s market-based borrowing rate for such period. The related receivables are classified at the time of sale as non-current assets. We accrete interest
F- 13
BIOGEN INC. AND SUBSIDIARIES
NOTES TO CONSOLIDATED FINANCIAL STATEMENTS — (Continued)
income on these receivables, which is recorded as a component of other income (expense), net in our consolidated statements of income.
We provide reserves against accounts receivable for estimated losses that may result from a customer's inability to pay. Amounts determined to be uncollectible are charged or written-off against the reserve.
Concentration of Credit Risk
Financial instruments that potentially subject us to concentrations of credit risk include cash and cash equivalents, investments, derivatives and accounts receivable. We attempt to minimize the risks related to cash and cash equivalents and investments by investing in a broad and diverse range of financial instruments as previously defined by us. We have established guidelines related to credit ratings and maturities intended to safeguard principal balances and maintain liquidity. Our investment portfolio is maintained in accordance with our investment policy, which defines allowable investments, specifies credit quality standards and limits the credit exposure of any single issuer. We minimize credit risk resulting from derivative instruments by choosing only highly rated financial institutions as counterparties.
Concentrations of credit risk with respect to receivables, which are typically unsecured, are somewhat mitigated due to the wide variety of customers and markets using our products, as well as their dispersion across many different geographic areas. We monitor the financial performance and creditworthiness of our customers so that we can properly assess and respond to changes in their credit profile. We continue to monitor these conditions and assess their possible impact on our business.
Marketable Securities and Other Investments
Marketable Debt Securities
Available-for-sale marketable debt securities are recorded at fair market value and unrealized gains and losses are included in accumulated other comprehensive income (loss) in equity, net of related tax effects, unless the security has experienced a credit loss, we have determined that we have the intent to sell the security or we have determined that it is more likely than not that we will have to sell the security before its expected recovery. Realized gains and losses are reported in other income (expense), net, on a specific identification basis.
Marketable Equity Securities and Venture Capital Funds
Our marketable equity securities are recorded at fair market value and, beginning January 1, 2018, unrealized gains and losses are included in other income (expense), net in our consolidated statements of income. Prior to January 1, 2018, unrealized gains and losses were included in accumulated other comprehensive income (loss) in equity, net of related tax effects. Our marketable equity securities represent investments in publicly traded equity securities and are included in investments and other assets in our consolidated balance sheets.
Our investments in venture capital funds are recorded at net asset value, which approximates fair value, and, beginning January 1, 2018, unrealized gains and losses are included in other income (expense), net in our consolidated statements of income. Prior to January 1, 2018, these investments were accounted for under the cost method of accounting. The underlying investments of the venture capital funds in which we invest are in equity securities of certain biotechnology companies and are included in investments and other assets in our consolidated balance sheets.
Non-Marketable Equity Securities
We also invest in equity securities of companies whose securities are not publicly traded and where fair value is not readily available. These investments are recorded using either the equity method of accounting or the cost minus impairment adjusted for changes in observable prices, depending on our ownership percentage and other factors that suggest we have significant influence. We monitor these investments to evaluate whether any increase or decline in their value has occurred, based on the implied value of recent company financings, public market prices of comparable companies and general market conditions. These investments are included in investments and other assets in our consolidated balance sheets.
Evaluating Marketable Debt Securities for Other-than-Temporary Impairments
We conduct periodic reviews to identify and evaluate each investment that has an unrealized loss, in accordance with the meaning of other-than-temporary impairment. An unrealized loss exists when the current fair
F- 14
BIOGEN INC. AND SUBSIDIARIES
NOTES TO CONSOLIDATED FINANCIAL STATEMENTS — (Continued)
value of an individual security is less than its amortized cost basis. Unrealized losses on available-for-sale debt securities that are determined to be temporary, and not related to credit loss, are recorded, net of tax, in accumulated other comprehensive income.
For available-for-sale debt securities with unrealized losses, management performs an analysis to assess whether we intend to sell or whether we would more likely than not be required to sell the security before the expected recovery of the amortized cost basis. Where we intend to sell a security, or may be required to do so, the security’s decline in fair value is deemed to be other-than-temporary and the full amount of the unrealized loss is reflected in earnings as an impairment loss.
Regardless of our intent to sell a security, we perform additional analysis on all securities with unrealized losses to evaluate losses associated with the creditworthiness of the security. Credit losses are identified where we do not expect to receive cash flows sufficient to recover the amortized cost basis of a security.
Equity Method of Accounting
In circumstances where we have the ability to exercise significant influence over the operating and financial policies of a company in which we have an investment, we utilize the equity method of accounting for recording investment activity. In assessing whether we exercise significant influence, we consider the nature and magnitude of our investment, the voting and protective rights we hold, any participation in the governance of the other company and other relevant factors such as the presence of a collaborative or other business relationship. Under the equity method of accounting, we record in our consolidated statements of income our share of income or loss of the other company. If our share of losses exceeds the carrying value of our investment, we will suspend recognizing additional losses and will continue to do so unless we commit to providing additional funding.
Inventory
Inventories are stated at the lower of cost or net realizable value with cost based on the first-in, first-out method. We classify our inventory costs as long-term when we expect to utilize the inventory beyond our normal operating cycle and include these costs in investments and other assets in our consolidated balance sheets. Inventory that can be used in either the production of clinical or commercial products is expensed as research and development costs when identified for use in a clinical manufacturing campaign.
Capitalization of Inventory Costs
We capitalize inventory costs associated with our products prior to regulatory approval, when, based on management’s judgment, future commercialization is considered probable and the future economic benefit is expected to be realized. We consider numerous attributes in evaluating whether the costs to manufacture a particular product should be capitalized as an asset. We assess the regulatory approval process and where the particular product stands in relation to that approval process, including any known safety or efficacy concerns, potential labeling restrictions and other impediments to approval. We evaluate our anticipated research and development initiatives and constraints relating to the product and the indication in which it will be used. We consider our manufacturing environment including our supply chain in determining logistical constraints that could hamper approval or commercialization. We consider the shelf life of the product in relation to the expected timeline for approval and we consider patent related or contract issues that may prevent or delay commercialization. We also base our judgment on the viability of commercialization, trends in the marketplace and market acceptance criteria. Finally, we consider the reimbursement strategies that may prevail with respect to the product and assess the economic benefit that we are likely to realize. We expense previously capitalized costs related to pre-approval inventory upon a change in such judgment, due to, among other potential factors, a denial or significant delay of approval by necessary regulatory bodies.
Obsolescence and Unmarketable Inventory
At each reporting period we review our inventories for excess or obsolescence and write-down obsolete or otherwise unmarketable inventory to its estimated net realizable value. If the actual net realizable value is less than that estimated by us, or if it is determined that inventory utilization will further diminish based on estimates of demand, additional inventory write-downs may be required. Additionally, our products are subject to strict quality control and monitoring that we perform throughout the manufacturing process. In the event that certain batches or units of product no longer meet quality specifications, we will record a charge to cost of sales to write-down any unmarketable inventory to its estimated net realizable value. In all cases, product inventory is carried at the lower of
F- 15
BIOGEN INC. AND SUBSIDIARIES
NOTES TO CONSOLIDATED FINANCIAL STATEMENTS — (Continued)
cost or its estimated net realizable value. Amounts written-down due to unmarketable inventory are charged to cost of sales.
Property, Plant and Equipment
Property, plant and equipment are carried at cost, subject to reviews for impairment whenever events or changes in circumstances indicate that the carrying amount of the asset may not be recoverable. The cost of normal, recurring or periodic repairs and maintenance activities related to property, plant and equipment are expensed as incurred. The cost for planned major maintenance activities, including the related acquisition or construction of assets, is capitalized if the repair will result in future economic benefits.
Interest costs incurred during the construction of major capital projects are capitalized until the underlying asset is ready for its intended use, at which point the interest costs are amortized as depreciation expense over the life of the underlying asset. We also capitalize certain direct and incremental costs associated with the validation effort required for licensing by regulatory agencies of new manufacturing equipment for the production of a commercially approved drug. These costs primarily include direct labor and material and are incurred in preparing the equipment for its intended use. The validation costs are either amortized over the life of the related equipment or expensed as cost of sales when the product produced in the validation process is sold.
In addition, we capitalize certain internal use computer software development costs. If the software is an integral part of production assets, these costs are included in machinery and equipment and are amortized on a straight-line basis over the estimated useful lives of the related software, which generally range from three to five years.
We generally depreciate or amortize the cost of our property, plant and equipment using the straight-line method over the estimated useful lives of the respective assets, which are summarized as follows:
Asset Category | Useful Lives |
Land | Not depreciated |
Buildings | 15 to 40 years |
Leasehold Improvements | Lesser of the useful life or the term of the respective lease |
Furniture and Fixtures | 5 to 7 years |
Machinery and Equipment | 5 to 20 years |
Computer Software and Hardware | 3 to 5 years |
When we dispose of property, plant and equipment, we remove the associated cost and accumulated depreciation from the related accounts in our consolidated balance sheets and include any resulting gain or loss in our consolidated statements of income.
Leases
In February 2016 the FASB issued ASU No. 2016-02, Leases (Topic 842), a new standard issued to increase transparency and comparability among organizations related to their leasing activities. This standard established a right-of-use model that requires all lessees to recognize right-of-use assets and lease liabilities on their balance sheet that arise from leases as well as provide disclosures with respect to certain qualitative and quantitative information related to a company's leasing arrangements to meet the objective of allowing users of financial statements to assess the amount, timing and uncertainty of cash flows arising from leases.
The FASB subsequently issued the following amendments to ASU 2016-02 that have the same effective date and transition date: ASU No. 2018-01, Leases (Topic 842): Land Easement Practical Expedient for Transition to Topic 842, ASU No. 2018-10, Codification Improvements to Topic 842, Leases, ASU No. 2018-11, Leases (Topic 842): Targeted Improvements, ASU No. 2018-20, Narrow-Scope Improvement for Lessors, and ASU No. 2019-01, Leases (Topic 842): Codification Improvements. We adopted these amendments with ASU 2016-02 (collectively, the new leasing standards) effective January 1, 2019.
We adopted the new leasing standards using the modified retrospective transition approach, as of January 1, 2019, with no restatement of prior periods or cumulative adjustment to retained earnings. Upon adoption, we elected the package of transition practical expedients, which allowed us to carry forward prior conclusions related to whether any expired or existing contracts are or contain leases, the lease classification for any expired or existing leases and initial direct costs for existing leases. We also elected the practical expedient to not reassess certain land
F- 16
BIOGEN INC. AND SUBSIDIARIES
NOTES TO CONSOLIDATED FINANCIAL STATEMENTS — (Continued)
easements and made an accounting policy election to not recognize leases with an initial term of 12 months or less within our consolidated balance sheets and to recognize those lease payments on a straight-line basis in our consolidated statements of income over the lease term. Upon adoption of the new leasing standards we recognized an operating lease asset of approximately $463.0 million and a corresponding operating lease liability of approximately $526.0 million, which are included in our consolidated balance sheets. The adoption of the new leasing standards did not have an impact on our consolidated statements of income.
We determine if an arrangement is a lease at contract inception. Operating lease assets represent our right to use an underlying asset for the lease term and operating lease liabilities represent our obligation to make lease payments arising from the lease. Operating lease assets and liabilities are recognized at the commencement date of the lease based upon the present value of lease payments over the lease term. When determining the lease term, we include options to extend or terminate the lease when it is reasonably certain that we will exercise that option.
We use the implicit rate when readily determinable and use our incremental borrowing rate when the implicit rate is not readily determinable based upon the information available at the commencement date in determining the present value of the lease payments. Our incremental borrowing rate is determined using a secured borrowing rate for the same currency and term as the associated lease.
The lease payments used to determine our operating lease assets may include lease incentives, stated rent increases and escalation clauses linked to rates of inflation when determinable and are recognized in our operating lease assets in our consolidated balance sheets. Our lease agreements may include both lease and non-lease components, which we account for as a single lease component when the payments are fixed. Variable payments included in the lease agreement are expensed as incurred. For certain equipment leases, such as vehicles, we apply a portfolio approach to effectively account for the operating lease assets and liabilities.
Our operating leases are reflected in operating lease assets, accrued expenses and other and in long-term operating lease liabilities in our consolidated balance sheets. Lease expense for minimum lease payments is recognized on a straight-line basis over the lease term.
We also have real estate lease agreements which are subleased to third parties. Operating leases for which we are the sublessor are included in accrued expenses and other and other long-term liabilities in our consolidated balance sheets. We recognize sublease income on a straight-line basis over the lease term in our consolidated statements of income.
For additional information on the adoption of the new leasing standards, please read Note 11, Leases, to these consolidated financial statements.
Intangible Assets
Our intangible assets consist of completed technology (comprised of acquired and in-licensed rights and patents, developed technology, out-licensed patents), in-process research and development (IPR&D) acquired after January 1, 2009, trademarks and trade names. Our intangible assets are recorded at fair value at the time of their acquisition and are stated in our consolidated balance sheets net of accumulated amortization and impairments, if applicable.
Intangible assets related to acquired and in-licensed rights and patents, developed technology and out-licensed patents are amortized over their estimated useful lives using the economic consumption method if anticipated future revenues can be reasonably estimated. The straight-line method is used when revenues cannot be reasonably estimated. Amortization is recorded within amortization and impairment of acquired intangible assets in our consolidated statements of income.
Acquired and in-licensed rights and patents primarily relate to our acquisition of all remaining rights to TYSABRI from Elan Pharma International Ltd. (Elan), an affiliate of Elan Corporation, plc. Acquired and in-licensed rights and patents also include our rest of world license to Forward Pharma A/S' (Forward Pharma) intellectual property, including Forward Pharma's intellectual property related to TECFIDERA, and other amounts related to our other marketed products and other programs acquired through business combinations. Developed technology primarily relates to our AVONEX product, which was recorded in connection with the merger of Biogen, Inc. and IDEC Pharmaceuticals Corporation in 2003. We amortize the intangible assets related to our TYSABRI, AVONEX, SPINRAZA, VUMERITY and TECFIDERA (rest of world) products using the economic consumption method based on revenues generated from the products underlying the related intangible assets. An analysis of the anticipated
F- 17
BIOGEN INC. AND SUBSIDIARIES
NOTES TO CONSOLIDATED FINANCIAL STATEMENTS — (Continued)
lifetime revenues of our TYSABRI, AVONEX, SPINRAZA, VUMERITY and TECFIDERA (rest of world) products is performed annually during our long-range planning cycle and whenever events or changes in circumstances would significantly affect the anticipated lifetime revenues of our TYSABRI, AVONEX, SPINRAZA, VUMERITY and TECFIDERA (rest of world) products.
Intangible assets related to trademarks, trade names and IPR&D prior to commercialization are not amortized because they have indefinite lives; however, they are subject to review for impairment. We review our intangible assets with indefinite lives for impairment annually, as of October 31, and whenever events or changes in circumstances indicate that the carrying value of an asset may not be recoverable.
Acquired In-process Research and Development (IPR&D)
Acquired IPR&D represents the fair value assigned to research and development assets that have not reached technological feasibility. The value assigned to acquired IPR&D is determined by estimating the costs to develop the acquired technology into commercially viable products, estimating the resulting revenues from the projects and discounting the net cash flows to present value. The revenues and costs projections used to value acquired IPR&D are, as applicable, reduced based on the probability of success of developing a new drug. Additionally, the projections consider the relevant market sizes and growth factors, expected trends in technology and the nature and expected timing of new product introductions by us and our competitors. The rates utilized to discount the net cash flows to their present value are commensurate with the stage of development of the projects and uncertainties in the economic estimates used in the projections. Upon the acquisition of IPR&D, we complete an assessment of whether our acquisition constitutes the purchase of a single asset or a group of assets. We consider multiple factors in this assessment, including the nature of the technology acquired, the presence or absence of separate cash flows, the development process and stage of completion, quantitative significance and our rationale for entering into the transaction.
If we acquire a business as defined under applicable accounting standards, then the acquired IPR&D is capitalized as an intangible asset. If we acquire an asset or group of assets that do not meet the definition of a business under applicable accounting standards, then the acquired IPR&D is expensed on its acquisition date. Future costs to develop these assets are recorded to research and development expense as they are incurred.
When performing our impairment assessment, we calculate the fair value using the same methodology as described above. If the carrying value of our acquired IPR&D exceeds its fair value, then the intangible asset is written down to its fair value. Changes in estimates and assumptions used in determining the fair value of our acquired IPR&D could result in an impairment. Impairments are recorded within amortization and impairment of acquired intangible assets in our consolidated statements of income. Assets that have been previously impaired, including our vixotrigine (BIIB074) program for the potential treatment of neuropathic pain, such as trigeminal neuralgia (TGN), could become further impaired in the future.
Goodwill
Goodwill represents the difference between the purchase price and the fair value of the identifiable tangible and intangible net assets when accounted for using the purchase method of accounting. Goodwill is not amortized, but is reviewed for impairment. Goodwill is reviewed for impairment annually, as of October 31, and whenever events or changes in circumstances indicate that the carrying value of the goodwill may not be recoverable.
We compare the fair value of our reporting unit to its carrying value. If the carrying value of the net assets assigned to the reporting unit exceeds the fair value of our reporting unit, we would record an impairment loss equal to the difference. As described in Note 24, Segment Information, to these consolidated financial statements, we operate in one operating segment, which is our only reporting unit.
Impairment of Long-Lived Assets
Long-lived assets to be held and used, including property, plant and equipment, and definite-lived intangible assets are reviewed for impairment whenever events or changes in circumstances indicate that the carrying amount of the assets or asset group may not be recoverable.
Determination of recoverability is based on an estimate of undiscounted future cash flows resulting from the use of the asset and its eventual disposition. In the event that such cash flows are not expected to be sufficient to recover the carrying amount of the assets, the assets are written-down to their fair values. Long-lived assets to be disposed of are carried at fair value less costs to sell.
F- 18
BIOGEN INC. AND SUBSIDIARIES
NOTES TO CONSOLIDATED FINANCIAL STATEMENTS — (Continued)
Contingent Consideration
The consideration for our acquisitions often includes future payments that are contingent upon the occurrence of a particular event or events. We record an obligation for such contingent payments at fair value on the acquisition date. We estimate the fair value of contingent consideration obligations through valuation models that incorporate probability-adjusted assumptions related to the achievement of the milestones and thus likelihood of making related payments. We revalue our contingent consideration obligations each reporting period. Changes in the fair value of our contingent consideration obligations are recognized in our consolidated statements of income. Changes in the fair value of the contingent consideration obligations can result from changes to one or multiple inputs, including adjustments to the discount rates, changes in the amount or timing of expected expenditures associated with product development, changes in the amount or timing of cash flows and reserves associated with products upon commercialization, changes in the assumed achievement or timing of any cumulative sales-based and development milestones, changes in the probability of certain clinical events and changes in the assumed probability associated with regulatory approval.
Discount rates in our valuation models represent a measure of the credit risk associated with settling the liability. The period over which we discount our contingent obligations is based on the current development stage of the product candidates, our specific development plan for that product candidate adjusted for the probability of completing the development step and when the contingent payments would be triggered. In estimating the probability of success, we utilize data regarding similar milestone events from several sources, including industry studies and our own experience. These fair value measurements are based on significant inputs not observable in the market. Significant judgment is employed in determining the appropriateness of these assumptions as of the acquisition date and for each subsequent period.
Derivative Instruments and Hedging Activities
Cash Flow and Fair Value Derivative Instruments
We recognize all derivative instruments as either assets or liabilities at fair value in our consolidated balance sheets. Changes in the fair value of our derivative instruments are recognized each period in current earnings or accumulated other comprehensive income (loss), depending on whether the derivative instrument is designated as part of a hedge transaction and, if so, the type of hedge transaction. We classify the cash flows from these instruments in the same category as the cash flows from the hedged items. We do not hold or issue derivative instruments for trading or speculative purposes.
We assess at inception and on an ongoing basis, whether the derivative instruments that are used in hedging transactions are highly effective in offsetting the changes in cash flows or fair values of the hedged items. We exclude the forward points portion of the derivative instruments used in a hedging transaction from the effectiveness test and record the fair value gain or loss related to this portion each period in our consolidated statements of income in the same line as the underlying hedged item. If we determine that a forecasted transaction is no longer probable of occurring, we discontinue hedge accounting for the affected portion of the hedge instrument, and any related unrealized gain or loss on the contract is recognized in current earnings.
Net Investment Derivative Instruments
We are exposed to the impact of foreign exchange fluctuations on our investment in the equity of Samsung Bioepis, which is denominated in a currency other than the U.S. dollar, and could adversely impact the U.S. dollar value of this investment. Using derivative instruments, we have hedged our net investment position to mitigate the effects of foreign exchange fluctuations. We recognize these designated net investment hedges as either assets or liabilities, at fair value, in our consolidated balance sheets. We hedge the changes in the spot exchange rate in accumulated other comprehensive income (loss) and exclude changes to the forward rate and amortize the forward points in other income (expense), net in our consolidated statements of income over the term of the contract. We classify the cash flows from these instruments in the same category as the cash flows from the hedged items.
For additional information on our derivative instruments and hedging activities, please read Note 9, Derivative Instruments, to these consolidated financial statements.
Translation of Foreign Currencies
The functional currency for most of our foreign subsidiaries is their local currency. For our non-U.S. subsidiaries that transact in a functional currency other than the U.S. dollar, assets and liabilities are translated at current rates of exchange at the balance sheet date. Income and expense items are translated at the average foreign currency
F- 19
BIOGEN INC. AND SUBSIDIARIES
NOTES TO CONSOLIDATED FINANCIAL STATEMENTS — (Continued)
exchange rates for the period. Adjustments resulting from the translation of the financial statements of our foreign operations into U.S. dollars are excluded from the determination of net income and are recorded in accumulated other comprehensive income, a separate component of equity. For subsidiaries where the functional currency of the assets and liabilities differ from the local currency, non-monetary assets and liabilities are translated at the rate of exchange in effect on the date assets were acquired while monetary assets and liabilities are translated at current rates of exchange as of the balance sheet date. Income and expense items are translated at the average foreign currency rates for the period. Translation adjustments of these subsidiaries are included in other income (expense), net in our consolidated statements of income.
Royalty Cost of Sales
Accounting for Share-Based Compensation
Our share-based compensation programs grant awards that have included stock options, restricted stock units that vest based on stock performance known as market stock units (MSUs), performance-vested restricted stock units that settle in cash (CSPUs), time-vested restricted stock units (RSUs), performance-vested restricted stock units that can be settled in cash or shares of our common stock (PUs) at the sole discretion of the Compensation and Management Development Committee of our Board of Directors, performance-vested stock units that settle in stock or cash (PSUs) and shares issued under our employee stock purchase plan (ESPP). Compensation expense is recognized based on the estimated fair value of the awards at grant date. We recognize compensation expense for the number of awards expected to vest after taking into consideration an estimate of award forfeitures over the requisite service period, which is generally the vesting period. Where awards are made with non-substantive vesting periods (for instance, where a portion of the award vests upon retirement eligibility), we estimate and recognize expense based on the period from the grant date to the date the employee becomes retirement eligible.
The fair values of our MSUs are estimated using a lattice model with a Monte Carlo simulation. We apply an accelerated attribution method to recognize share-based compensation expense over the applicable service period for our MSUs. The probability of actual shares expected to be earned is considered in the grant date valuation, therefore the expense is not adjusted to reflect the actual units earned.
The fair values of our RSUs are based on the market value of our stock on the date of grant. Compensation expense for RSUs is recognized straight-line over the applicable service period.
We apply an accelerated attribution method to recognize share-based compensation expense when accounting for our CSPUs, PUs and PSUs that settle in cash, and the fair value of the liability is remeasured at the end of each reporting period through expected settlement. Compensation expense associated with CSPUs, PUs and PSUs that settle in cash are based upon the stock price and the number of units expected to be earned after assessing the probability that certain performance criteria will be met and the targeted payout level associated with the performance criteria expected to be achieved. Cumulative adjustments are recorded each quarter to reflect changes in the stock price and estimated outcome of the performance-related conditions until the date results are determined and settled. If performance criteria are not met or not expected to be met, any compensation expense previously recognized to date associated with the awards will be reversed.
The fair values of PSUs that settle in stock are based upon the stock price on the date of grant. Compensation expense is recognized for the number of units expected to be earned after assessing the probability that certain performance criteria will be met and the targeted payout level associated with the performance criteria expected to be achieved. Cumulative adjustments are recorded each quarter to reflect the estimated outcome of the performance-related conditions until the date results are determined and settled. If performance criteria are not met or not expected to be met, any compensation expense previously recognized to date associated with the awards will be reversed.
F- 20
BIOGEN INC. AND SUBSIDIARIES
NOTES TO CONSOLIDATED FINANCIAL STATEMENTS — (Continued)
Research and Development Expenses
Research and development expenses consist of expenses incurred in performing research and development activities, which include compensation and benefits, facilities and overhead expenses, clinical trial expenses and fees paid to contract research organizations (CROs), clinical supply and manufacturing expenses, write-offs of inventory that was previously capitalized in anticipation of product launch and determined to no longer be realizable and other outside expenses and upfront fees and milestones paid to third-party collaborators. Research and development expenses are expensed as incurred. Upfront and milestone payments made to third-party collaborators are expensed as incurred up to the point of regulatory approval. Milestone payments made upon regulatory approval are capitalized and amortized over the remaining useful life of the related product. Payments we make for research and development services prior to the services being rendered are recorded as prepaid assets in our consolidated balance sheets and are expensed as the services are provided. We also accrue the costs of ongoing clinical trials associated with programs that have been terminated or discontinued for which there is no future economic benefit at the time the decision is made to terminate or discontinue the program.
From time to time, we enter into development agreements in which we share expenses with a collaborative partner. We record payments received from our collaborative partners for their share of the development costs as a reduction of research and development expense, except as discussed in Note 18, Collaborative and Other Relationships, to these consolidated financial statements. Because an initial indication has been approved for both RITUXAN and GAZYVA, expenses incurred by Genentech in the ongoing development of RITUXAN and GAZYVA are not recorded as research and development expense, but rather reduce our share of profits recorded as a component of revenues from anti-CD20 therapeutic programs.
For collaborations with commercialized products, if we are the principal, we record revenues and the corresponding operating costs in their respective line items in our consolidated statements of income. If we are not the principal, we record operating costs as a reduction of revenue.
Selling, General and Administrative Expenses
Selling, general and administrative expenses are primarily comprised of compensation and benefits associated with sales and marketing, finance, human resources, legal, information technology and other administrative personnel, outside marketing, advertising and legal expenses and other general and administrative costs.
Advertising costs are expensed as incurred. For the years ended December 31, 2019, 2018 and 2017, advertising costs totaled $79.2 million, $90.2 million and $75.2 million, respectively.
Income Taxes
The provision for income taxes includes federal, state, local and foreign taxes. Income taxes are accounted for under the asset and liability method. Deferred tax assets and liabilities are recognized for the estimated future tax consequences of temporary differences between the financial statement carrying amounts and their respective tax bases. Deferred tax assets and liabilities are measured using enacted tax rates expected to apply to taxable income in the year in which the temporary differences are expected to be recovered or settled. We evaluate the realizability of our deferred tax assets and establish a valuation allowance when it is more likely than not that all or a portion of deferred tax assets will not be realized. We recognize deferred taxes associated with our global intangible low-taxed income (GILTI) tax calculations.
The income tax consequences from the intra-entity transfers of inventory within our consolidated group, both current and deferred, are recorded as a prepaid tax or deferred charge and recognized through our consolidated statements of income when the inventory is sold to a third party.
In October 2016 the FASB issued ASU No. 2016-16, Income Taxes (Topic 740): Intra-Entity Transfer of Assets Other Than Inventory. This standard eliminates the deferral of the tax effects of intra-entity asset transfers other than inventory. As a result, the income tax consequences from the intra-entity transfer of an asset other than inventory and associated changes to deferred taxes will be recognized when the transfer occurs.
We adopted this standard on January 1, 2018, using the modified retrospective method, through a cumulative-effect adjustment to retained earnings as of that date. Upon adoption, we recognized additional net deferred tax assets of approximately $0.5 billion, offset by a corresponding net increase to retained earnings of approximately $0.5 billion. In the fourth quarter of 2018, when we elected to begin recognizing deferred taxes on the GILTI tax calculation, we recorded an additional deferred tax liability of $0.4 billion with a corresponding reduction to
F- 21
BIOGEN INC. AND SUBSIDIARIES
NOTES TO CONSOLIDATED FINANCIAL STATEMENTS — (Continued)
our retained earnings as these differences are related to intra-entity transactions. We will recognize incremental deferred income tax expense thereafter as these deferred tax assets and liabilities are utilized.
We account for uncertain tax positions using a “more-likely-than-not” threshold for recognizing and resolving uncertain tax positions. We evaluate uncertain tax positions on a quarterly basis and consider various factors including, but not limited to, changes in tax law, the measurement of tax positions taken or expected to be taken in tax returns, the effective settlement of matters subject to audit, information obtained during in process audit activities and changes in facts or circumstances related to a tax position. We also accrue for potential interest and penalties related to unrecognized tax benefits in income tax expense.
Contingencies
We are currently involved in various claims and legal proceedings. Loss contingency provisions are recorded if the potential loss from any claim, asserted or unasserted, or legal proceeding is considered probable and the amount can be reasonably estimated or a range of loss can be determined. These accruals represent management’s best estimate of probable loss. Disclosure also is provided when it is reasonably possible that a loss will be incurred or when it is reasonably possible that the amount of a loss will exceed the recorded provision. On a quarterly basis, we review the status of each significant matter and assess its potential financial exposure. Significant judgment is required in both the determination of probability and as to whether an exposure is reasonably estimable. Because of uncertainties related to these matters, accruals are based only on the best information available at the time. As additional information becomes available, we reassess the potential liability related to pending claims and litigation and may change our estimates.
Earnings per Share
Basic earnings per share is computed by dividing undistributed net income attributable to Biogen Inc. by the weighted-average number of common shares outstanding during the period. Diluted earnings per share is computed based on the treasury method by dividing net income by the weighted-average number of common shares outstanding during the period plus potentially dilutive common equivalent shares outstanding.
New Accounting Pronouncements
From time to time, new accounting pronouncements are issued by the FASB or other standard setting bodies that we adopt as of the specified effective date. Unless otherwise discussed below, we do not believe that the adoption of recently issued standards have or may have a material impact on our consolidated financial statements or disclosures.
Leases
In February 2016 the FASB issued the new leasing standards to increase transparency and comparability among organizations related to their leasing activities. For additional information on the adoption of the new leasing standards, please read the section titled Lease above, and Note 11, Leases, to these consolidated financial statements.
Credit Losses
In June 2016 the FASB issued ASU No. 2016-13, Financial Instruments - Credit Losses (Topic 326): Measurement of Credit Losses on Financial Instruments. The FASB subsequently issued amendments to ASU 2016-13, which have the same effective date and transition date of January 1, 2020. These standards require that credit losses be reported using an expected losses model rather than the incurred losses model that is currently used, and establishes additional disclosures related to credit risks. For available-for-sale debt securities with unrealized losses, these standards now require allowances to be recorded instead of reducing the amortized cost of the investment. These standards limit the amount of credit losses to be recognized for available-for-sale debt securities to the amount by which carrying value exceeds fair value and requires the reversal of previously recognized credit losses if fair value increases.
Based on the composition of our investment portfolio, accounts receivable and other financial assets, current market conditions and historical credit loss activity, the adoption of these standards are not expected to have a material impact on our consolidated financial position and results of operations and related disclosures.
F- 22
BIOGEN INC. AND SUBSIDIARIES
NOTES TO CONSOLIDATED FINANCIAL STATEMENTS — (Continued)
Debt Securities
In March 2017 the FASB issued ASU No. 2017-08, Receivables - Nonrefundable Fees and Other Costs (Subtopic 310-20): Premium Amortization on Purchased Callable Debt Securities. This standard amends the amortization period for certain purchased callable debt securities held at a premium by shortening the amortization period to the earliest call date. This standard became effective for us on January 1, 2019, and was adopted using a modified retrospective transition approach. The adoption of this standard did not result in a significant adjustment to our marketable debt securities.
Fair Value Measurements
In August 2018 the FASB issued ASU No. 2018-13, Fair Value Measurement (Topic 820): Disclosure Framework - Changes to the Disclosure Requirements for Fair Value Measurement. This standard modifies certain disclosure requirements on fair value measurements. This standard became effective for us on January 1, 2020. The adoption of this standard will not have a material impact on our disclosures.
Derivative Instruments and Hedging Activities
In October 2018 the FASB issued ASU No. 2018-16, Derivatives and Hedging (Topic 815): Inclusion of the Secured Overnight Financing Rate (SOFR) Overnight Index Swap (OIS) Rate as a Benchmark Interest Rate for Hedge Accounting Purposes. This standard permits use of the OIS rate based on the SOFR as a U.S. benchmark interest rate for hedge accounting purposes under ASC 815, Derivatives and Hedging. This standard became effective for us on January 1, 2019, and did not have an impact on our consolidated results of operations or financial position.
Collaborative Arrangements
In November 2018 the FASB issued ASU No. 2018-18, Collaborative Arrangements (Topic 808): Clarifying the Interaction between Topic 808 and Topic 606. This standard makes targeted improvements for collaborative arrangements as follows:
• | Clarifies that certain transactions between collaborative arrangement participants should be accounted for as revenue under ASC 606, Revenue from Contracts with Customers, when the collaborative arrangement participant is a customer in the context of a unit of account. In those situations, all the guidance in ASC 606 should be applied, including recognition, measurement, presentation and disclosure requirements; |
• | Adds unit-of-account guidance to ASC 808, Collaborative Arrangements, to align with the guidance in ASC 606 (that is, a distinct good or service) when an entity is assessing whether the collaborative arrangement or a part of the arrangement is within the scope of ASC 606; and |
• | Precludes a company from presenting transactions with collaborative arrangement participants that are not directly related to sales to third parties with revenue recognized under ASC 606 if the collaborative arrangement participant is not a customer. |
This standard became effective for us on January 1, 2020. A retrospective transition approach is required for either all contracts or only for contracts that are not completed at the date of initial application of ASC 606, with a cumulative adjustment to opening retained earnings, as of January 1, 2018. The adoption of this standard did not have a material impact on our consolidated financial position, results of operations and related disclosures.
2. Acquisitions
Acquisition of Nightstar Therapeutics plc
In June 2019 we completed our acquisition of all of the outstanding shares of Nightstar Therapeutics plc (NST), a clinical-stage gene therapy company focused on adeno-associated virus treatments for inherited retinal disorders. As a result of this acquisition, we added two mid- to late-stage clinical assets, as well as preclinical programs, in ophthalmology. These assets include BIIB111 (timrepigene emparvovec), which is in Phase 3 development for the potential treatment of choroideremia, a rare, degenerative, X-linked inherited retinal disorder that leads to blindness and currently has no approved treatments, and BIIB112 (RPGR gene therapy), which is in Phase 2/3 development for the potential treatment of X-linked retinitis pigmentosa, which is a rare inherited retinal disease with no currently approved treatments.
F- 23
BIOGEN INC. AND SUBSIDIARIES
NOTES TO CONSOLIDATED FINANCIAL STATEMENTS — (Continued)
Under the terms of the acquisition, we paid NST shareholders $25.50 in cash for each issued and outstanding NST share, which totaled $847.6 million. In addition, we paid $4.6 million in cash for equity compensation, which is attributable to pre-combination services and is reflected as a component of the total purchase price paid. The fair value of equity compensation attributable to the post-combination service period was $26.2 million, of which $18.4 million was recognized as a charge to selling, general and administrative expense with the remaining $7.8 million as a charge to research and development expense in our consolidated statements of income. These amounts were associated with the accelerated vesting of stock options previously granted to NST employees and were fully paid in cash as of June 30, 2019. We funded this acquisition through available cash and accounted for it as an acquisition of a business.
We finalized purchase accounting for this acquisition in the fourth quarter of 2019. The following table summarizes the fair values of the separately identifiable assets acquired and liabilities assumed:
(In millions) | |||
Cash and cash equivalents | $ | ||
Marketable securities | |||
In-process research and development intangible assets | |||
Goodwill | |||
Deferred tax liability | ( | ) | |
Other, net | |||
Total purchase price | $ | ||
The fair value of the IPR&D programs acquired was determined through a probability adjusted discounted cash flow analysis utilizing a discount rate of 12.5 %. This valuation was primarily driven by the value associated with BIIB111. The fair value associated with BIIB111 was $480.0 million. We have recorded an additional IPR&D asset related to BIIB112 of $220.0 million. Some of the more significant assumptions utilized in our asset valuations included the estimated net cash flows for each year for each asset or product, including net revenues, cost of sales, research and development and other operating expenses, the potential regulatory and commercial success risks, competitive trends impacting the asset and each cash flow stream as well as other factors. These fair value measurements were based on significant inputs not observable in the market and thus represent Level 3 fair value measurements.
We have recognized goodwill in relation to the fair value associated with NST workforce's expertise and early research in retinal disorders. We also recognized goodwill in relation to the establishment of a deferred tax liability for the acquired IPR&D intangible assets, which have no tax basis. This deferred tax liability is net of the related impacts on the deferred taxes for GILTI. Goodwill that is tax deductible for GILTI purposes is approximately $35.5 million.
Pro forma results of operations as a result of this acquisition have not been presented as this acquisition is not material to our consolidated statements of income. Subsequent to June 7, 2019, the acquisition date, our results of operations include the results of operations of NST.
BIIB100 Acquisition
In January 2018 we acquired BIIB100 (XP01 inhibitor) from Karyopharm Therapeutics Inc. (Karyopharm). BIIB100 is a Phase 1 investigational oral compound for the treatment of certain neurological and neurodegenerative diseases, primarily in ALS. BIIB100 is a novel therapeutic candidate that works by inhibiting a protein known as XPO1, with the goal of reducing inflammation and neurotoxicity, along with increasing neuroprotective responses.
We accounted for this transaction as an asset acquisition as the value being acquired primarily relates to a single asset. In connection with the closing of this transaction, we made an upfront payment of $10.0 million to Karyopharm, which was recorded as acquired IPR&D in our consolidated statements of income as BIIB100 had not yet reached technological feasibility. We may also pay Karyopharm up to $207.0 million in additional milestone payments as well as tiered royalties on potential net commercial sales in the mid-single digit to low-teen percentages.
F- 24
BIOGEN INC. AND SUBSIDIARIES
NOTES TO CONSOLIDATED FINANCIAL STATEMENTS — (Continued)
BIIB104 Acquisition
In April 2018 we acquired BIIB104 (AMPA) from Pfizer Inc. (Pfizer). BIIB104 is a first-in-class, Phase 2b ready AMPA receptor potentiator for cognitive impairment associated with schizophrenia. AMPA receptors mediate fast excitatory synaptic transmission in the central nervous system, a process which can be disrupted in a number of neurological and psychiatric diseases, including schizophrenia.
We accounted for this transaction as an asset acquisition as the value being acquired primarily relates to a single asset. In connection with the closing of this transaction, we made an upfront payment of $75.0 million to Pfizer, which was recorded as acquired IPR&D in our consolidated statements of income as BIIB104 had not yet reached technological feasibility. We may also pay Pfizer up to $515.0 million in additional development and commercialization milestone payments as well as tiered royalties on potential net commercial sales in the low to mid-teen percentages.
TMS Co., Ltd.
In June 2018 we entered into an exclusive option agreement with TMS Co., Ltd. (TMS) granting us the option to acquire TMS-007, a plasminogen activator with a novel mechanism of action associated with breaking down blood clots, which is in Phase 2 development in Japan, and backup compounds for the treatment of stroke. In exchange for the purchase option, we made a $4.0 million upfront payment to TMS, which was recorded as research and development expense in our consolidated statements of income as TMS-007 had not yet reached technological feasibility.
If we exercise the purchase option, we will make an additional payment of $18.0 million upon closing of the asset acquisition, which will be recorded as acquired IPR&D expense in our consolidated statements of income as TMS-007 will not have reached technological feasibility at that time. In addition, we may pay TMS up to $335.0 million in additional development and commercialization milestone payments as well as tiered royalties on potential net commercial sales in the high-single digit to low-teen percentages. If we exercise the purchase option, consummation of the asset acquisition may be subject to the expiration of the applicable waiting period under the Hart-Scott-Rodino Antitrust Improvements Act of 1976 in the U.S.
BIIB110 Acquisition
In July 2018 we acquired BIIB110 (ActRIIA/B ligand trap) and ALG-802 from AliveGen Inc. (AliveGen). BIIB110 and ALG-802 represent novel ways of targeting the myostatin pathway. We initially plan to study BIIB110 in multiple neuromuscular indications, including SMA and ALS.
We accounted for this transaction as an asset acquisition as the value being acquired primarily relates to a single asset. In connection with the closing of this transaction, we made an upfront payment of $27.5 million to AliveGen, which was recorded as acquired IPR&D in our consolidated statements of income as BIIB110 had not yet reached technological feasibility. We may also pay AliveGen up to $535.0 million in additional development and commercialization milestones.
BIIB093 Acquisition
In May 2017 we acquired BIIB093 (glibencamide IV) from Remedy Pharmaceuticals Inc. (Remedy). BIIB093 is in a Phase 3 study for large hemispheric infarction (LHI), a severe form of ischemic stroke where brain swelling (cerebral edema) often leads to a disproportionately large share of stroke-related morbidity and mortality. The U.S. Food and Drug Administration (FDA) granted BIIB093 orphan drug designation for severe cerebral edema in patients with acute ischemic stroke. The FDA has also granted BIIB093 fast track designation.
We are responsible for the future development and commercialization of BIIB093 and Remedy may share in the cost of development for the target indication for BIIB093 in LHI stroke.
F- 25
BIOGEN INC. AND SUBSIDIARIES
NOTES TO CONSOLIDATED FINANCIAL STATEMENTS — (Continued)
3. Divestitures
Divestiture of Hillerød, Denmark Manufacturing Operations
In August 2019 we completed the sale of all of the outstanding shares of our subsidiary that owned our biologics manufacturing operations in Hillerød, Denmark to FUJIFILM Corporation (FUJIFILM). Upon the closing of this transaction, we received approximately $881.9 million in cash, which may be adjusted based on other contractual terms, which are discussed below. We determined that the operations disposed of in this transaction did not meet the criteria to be classified as discontinued operations under the applicable guidance.
As part of this transaction, we have provided FUJIFILM with certain minimum batch production commitment guarantees. There is a risk that the minimum contractual batch production commitments will not be met. Based upon current estimates we expect to incur an adverse commitment obligation of approximately $74.0 million associated with such guarantees and have accrued for this obligation. We may adjust this estimate based upon changes in business conditions, which may result in the increase or reduction of this adverse commitment obligation in subsequent periods. We also may be obligated to indemnify FUJIFILM for liabilities that existed relating to certain business activities incurred prior to the closing of this transaction.
In addition, we may earn certain contingent payments based on future manufacturing activities at the Hillerød facility. For the disposition of a business, our policy is to recognize contingent consideration when the consideration is realizable. We currently believe the probability of earning these payments is remote and therefore we did not include these contingent payments in our calculation of the fair value of the operations.
As part of this transaction, we entered into certain manufacturing services agreements with FUJIFILM pursuant to which FUJIFILM will use the Hillerød facility to produce commercial products for us, such as TYSABRI, as well as other third-party products.
In connection with this transaction, we recognized a total net loss of approximately $164.4 million in our consolidated statements of income. This loss included a pre-tax loss of $95.5 million, which was recorded in loss on divestiture of Hillerød, Denmark manufacturing operations. The loss recognized was based on exchange rates and business conditions on the closing date of this transaction, and included costs to sell our Hillerød, Denmark manufacturing operations of approximately $11.2 million and our estimate of the fair value of an adverse commitment of approximately $114.0 million associated with the guarantee of future minimum batch production at the Hillerød facility. The value of this adverse commitment was determined using a probability-weighted estimate of future manufacturing activity. We also recorded a tax expense of $68.9 million related to this transaction. During the fourth quarter of 2019 we recorded a $40.2 million reduction in our estimate of the future minimum batch commitment utilizing our current manufacturing forecast, which reflects the impact of forecasted aducanumab batches, resulting in a reduction in the pre-tax loss on divestiture from $95.5 million to $55.3 million.
In addition, we sold to FUJIFILM $41.8 million of raw materials that were remaining at the Hillerød facility on the closing date of this transaction. These materials were sold at cost, which approximates fair value.
Our estimate of the fair value of the adverse commitment is a Level 3 measurement and is based on forecasted batch production at the Hillerød facility.
F- 26
BIOGEN INC. AND SUBSIDIARIES
NOTES TO CONSOLIDATED FINANCIAL STATEMENTS — (Continued)
4. Revenues
Product Revenues
Revenues by product are summarized as follows:
For the Years Ended December 31, | |||||||||||||||||||||||||||||||||||
2019 | 2018 | 2017 | |||||||||||||||||||||||||||||||||
(In millions) | United States | Rest of World | Total | United States | Rest of World | Total | United States | Rest of World | Total | ||||||||||||||||||||||||||
Multiple Sclerosis (MS): | |||||||||||||||||||||||||||||||||||
TECFIDERA | $ | $ | $ | $ | $ | $ | $ | $ | $ | ||||||||||||||||||||||||||
Interferon* | |||||||||||||||||||||||||||||||||||
TYSABRI | |||||||||||||||||||||||||||||||||||
VUMERITY | |||||||||||||||||||||||||||||||||||
FAMPYRA | |||||||||||||||||||||||||||||||||||
ZINBRYTA | |||||||||||||||||||||||||||||||||||
Subtotal: MS Product Revenues | |||||||||||||||||||||||||||||||||||
Spinal Muscular Atrophy: | |||||||||||||||||||||||||||||||||||
SPINRAZA | |||||||||||||||||||||||||||||||||||
Biosimilars: | |||||||||||||||||||||||||||||||||||
BENEPALI | |||||||||||||||||||||||||||||||||||
IMRALDI | |||||||||||||||||||||||||||||||||||
FLIXABI | |||||||||||||||||||||||||||||||||||
Subtotal: Biosimilar product revenues | |||||||||||||||||||||||||||||||||||
Other: | |||||||||||||||||||||||||||||||||||
FUMADERM | |||||||||||||||||||||||||||||||||||
Hemophilia: | |||||||||||||||||||||||||||||||||||
ELOCTATE | |||||||||||||||||||||||||||||||||||
ALPROLIX | |||||||||||||||||||||||||||||||||||
Subtotal: Hemophilia product revenues | |||||||||||||||||||||||||||||||||||
Total product revenues | $ | $ | $ | $ | $ | $ | $ | $ | $ | ||||||||||||||||||||||||||
*Interferon includes AVONEX and PLEGRIDY.
We recognized revenues from two wholesalers accounting for 30 % and 17 % of gross product revenues in 2019, 32 % and 18 % of gross product revenues in 2018 and 34 % and 21 % of gross product revenues in 2017, respectively.
As of December 31, 2019, two wholesale distributors individually accounted for approximately 24.1 % and 13.9 % of net accounts receivable associated with our product sales, as compared to 27.7 % and 15.6 % as of December 31, 2018, respectively.
F- 27
BIOGEN INC. AND SUBSIDIARIES
NOTES TO CONSOLIDATED FINANCIAL STATEMENTS — (Continued)
An analysis of the change in reserves for discounts and allowances is summarized as follows:
(In millions) | Discounts | Contractual Adjustments | Returns | Total | |||||||||||
2019 | |||||||||||||||
Beginning balance | $ | $ | $ | $ | |||||||||||
Current provisions relating to sales in current year | |||||||||||||||
Adjustments relating to prior years | ( | ) | ( | ) | |||||||||||
Payments/returns relating to sales in current year | ( | ) | ( | ) | ( | ) | ( | ) | |||||||
Payments/returns relating to sales in prior years | ( | ) | ( | ) | ( | ) | ( | ) | |||||||
Ending balance | $ | $ | $ | $ | |||||||||||
(In millions) | Discounts | Contractual Adjustments | Returns | Total | |||||||||||
2018 | |||||||||||||||
Beginning balance | $ | $ | $ | $ | |||||||||||
Current provisions relating to sales in current year | |||||||||||||||
Adjustments relating to prior years | ( | ) | ( | ) | ( | ) | ( | ) | |||||||
Payments/returns relating to sales in current year | ( | ) | ( | ) | ( | ) | ( | ) | |||||||
Payments/returns relating to sales in prior years | ( | ) | ( | ) | ( | ) | ( | ) | |||||||
Ending balance | $ | $ | $ | $ | |||||||||||
(In millions) | Discounts | Contractual Adjustments | Returns | Total | |||||||||||
2017 | |||||||||||||||
Beginning balance | $ | $ | $ | $ | |||||||||||
Current provisions relating to sales in current year | |||||||||||||||
Adjustments relating to prior years | ( | ) | ( | ) | |||||||||||
Payments/returns relating to sales in current year | ( | ) | ( | ) | ( | ) | ( | ) | |||||||
Payments/returns relating to sales in prior years | ( | ) | ( | ) | ( | ) | ( | ) | |||||||
Ending balance | $ | $ | $ | $ | |||||||||||
The total reserves above, which are included in our consolidated balance sheets, are summarized as follows:
As of December 31, | |||||||
(In millions) | 2019 | 2018 | |||||
Reduction of accounts receivable | $ | $ | |||||
Component of accrued expenses and other | |||||||
Total revenue-related reserves | $ | $ | |||||
Revenues from Anti-CD20 Therapeutic Programs
Revenues from anti-CD20 therapeutic programs are summarized in the table below. For purposes of this footnote we refer to RITUXAN and RITUXAN HYCELA collectively as RITUXAN.
For the Years Ended December 31, | |||||||||||
(In millions) | 2019 | 2018 | 2017 | ||||||||
Biogen's share of pre-tax profits in the U.S. for RITUXAN and GAZYVA, including the reimbursement of selling and development expenses | $ | $ | $ | ||||||||
Other revenues from anti-CD20 therapeutic programs | |||||||||||
Total revenues from anti-CD20 therapeutic programs | $ | $ | $ | ||||||||
Approximately 16 %, 15 % and 13 % of our total revenues in 2019, 2018 and 2017, respectively, are derived from our collaboration arrangements with Genentech. For additional information on our collaboration arrangements with Genentech, please read Note 18, Collaborative and Other Relationships, to these consolidated financial statements.
F- 28
BIOGEN INC. AND SUBSIDIARIES
NOTES TO CONSOLIDATED FINANCIAL STATEMENTS — (Continued)
Other Revenues
Other revenues are summarized as follows:
For the Years Ended December 31, | |||||||||||
(In millions) | 2019 | 2018 | 2017 | ||||||||
Revenues from collaborative and other relationships: | |||||||||||
(Loss) profit earned under our 50% share of the co-promotion losses on ZINBRYTA in the U.S. with AbbVie Inc. | $ | $ | ( | ) | $ | ( | ) | ||||
Revenues earned under our technical development services and manufacturing service agreements and royalty revenues on biosimilar products with Samsung Bioepis | |||||||||||
Revenues earned under manufacturing services agreement on shipments of ELOCTA and ALPROLIX to Swedish Orphan Biovitrum AB (Sobi) and royalties from Sobi on sales of ELOCTA and ALPROLIX | |||||||||||
Other royalty and corporate revenues: | |||||||||||
Royalty | |||||||||||
Other corporate | |||||||||||
Total other revenues | $ | $ | $ | ||||||||
Other corporate revenues primarily reflect amounts earned under contract manufacturing agreements with our strategic customers, including Bioverativ Inc. (Bioverativ). During the years ended December 31, 2019, 2018 and 2017, we recognized $383.2 million, $206.7 million and $64.8 million, respectively, in revenues under the manufacturing and supply agreement with Bioverativ entered into in connection with the spin-off of our hemophilia business.
During the third quarter of 2019 we amended our agreement with a contract manufacturing customer. Under the amended agreement, we will license certain of our manufacturing-related intellectual property to the customer. We will be eligible to receive $500.0 million in a series of three payments. The first payment is due upon a regulatory achievement related to the customer's product manufactured using our manufacturing-related intellectual property, with subsequent payments payable upon the first and second anniversaries of the regulatory achievement. We expect the regulatory achievement to occur in 2020. If we earn this payment, we expect to allocate the consideration between the license for the manufacturing-related intellectual property and the manufacturing product supply services.
For additional information on our collaboration arrangements with AbbVie Inc. (AbbVie) and Samsung Bioepis, please read Note 18, Collaborative and Other Relationships, to these consolidated financial statements.
5. Inventory
The components of inventory are summarized as follows:
As of December 31, | |||||||
(In millions) | 2019 | 2018 | |||||
Raw materials | $ | $ | |||||
Work in process | |||||||
Finished goods | |||||||
Total inventory | $ | $ | |||||
Balance Sheet Classification: | |||||||
Inventory | $ | $ | |||||
Investments and other assets | |||||||
Total inventory | $ | $ | |||||
F- 29
BIOGEN INC. AND SUBSIDIARIES
NOTES TO CONSOLIDATED FINANCIAL STATEMENTS — (Continued)
During 2019 we sold to Bioverativ hemophilia-related inventory on hand as of December 31, 2018, with a cost basis totaling $184.5 million pursuant to the terms of the manufacturing and supply agreement with Bioverativ entered into in connection with the spin-off of our hemophilia business.
Long-term inventory, which primarily consists of work in process, is included in investments and other assets in our consolidated balance sheets.
Inventory amounts written down as a result of excess, obsolescence, unmarketability or other reasons are charged to cost of sales, and totaled $52.2 million, $41.9 million and $76.9 million for the years ended December 31, 2019, 2018 and 2017, respectively.
Divestiture of Hillerød, Denmark Manufacturing Operations
In August 2019 we completed the sale of all of the outstanding shares of our subsidiary that owned our biologics manufacturing operations in Hillerød, Denmark to FUJIFILM. This transaction included the sale of $14.0 million of work in process inventory.
In addition, we sold to FUJIFILM approximately $41.8 million of raw materials that were remaining at the Hillerød facility on the closing date of this transaction. These materials were sold at cost, which approximates fair value.
For additional information on the divestiture of our Hillerød, Denmark manufacturing operations, please read Note 3, Divestitures, to these consolidated financial statements.
6. Intangible Assets and Goodwill
Intangible Assets
Intangible assets, net of accumulated amortization, impairment charges and adjustments are summarized as follows:
As of December 31, 2019 | As of December 31, 2018 | ||||||||||||||||||||||||
(In millions) | Estimated Life | Cost | Accumulated Amortization | Net | Cost | Accumulated Amortization | Net | ||||||||||||||||||
Completed technology | 4-28 years | $ | $ | ( | ) | $ | $ | $ | ( | ) | $ | ||||||||||||||
In-process research and development | Indefinite until commercialization | ||||||||||||||||||||||||
Trademarks and trade names | Indefinite | ||||||||||||||||||||||||
Total intangible assets | $ | $ | ( | ) | $ | $ | $ | ( | ) | $ | |||||||||||||||
Amortization and Impairments
Amortization and impairments of acquired intangible assets totaled $489.9 million, $747.3 million and $814.7 million for the years ended December 31, 2019, 2018 and 2017, respectively. Amortization of acquired intangible assets, excluding impairment charges, totaled $274.0 million, $381.2 million and $455.3 million for the years ended December 31, 2019, 2018 and 2017, respectively. The decrease in amortization of acquired intangible assets, excluding impairment charges, over the three years was primarily due to a lower rate of amortization for acquired intangible assets, primarily due to prior year impairments.
For the year ended December 31, 2019, amortization and impairments of acquired intangible assets reflects the impact of a $215.9 million impairment charge to reduce the fair value of IPR&D assets associated with BG00011 (STX-100) to zero, as discussed below.
Amortization and impairments of acquired intangible assets for the year ended December 31, 2018, reflects the impact of impairment charges related to certain IPR&D assets associated with our vixotrigine program totaling $189.3 million, as discussed below.
Amortization and impairments of acquired intangible assets for the years ended December 31, 2018 and 2017, reflect the impact of impairment charges of $176.8 million and $328.2 million, respectively, related to our intangible
F- 30
BIOGEN INC. AND SUBSIDIARIES
NOTES TO CONSOLIDATED FINANCIAL STATEMENTS — (Continued)
assets associated with our U.S. license to Forward Pharma's intellectual property, including Forward Pharma's intellectual property related to TECFIDERA.
Completed Technology
Completed technology primarily relates to our acquisition of all remaining rights to TYSABRI from Elan. The net book value of the TYSABRI asset as of December 31, 2019, was $1.8 billion.
Completed technology also includes $155.0 million in milestone payments made to Alkermes Pharma Ireland Limited, a subsidiary of Alkermes plc (Alkermes), following the approval of VUMERITY in the U.S. in October 2019, technology related to our AVONEX product, which we recorded in connection with the merger of Biogen, Inc. and IDEC Pharmaceuticals Corporation in 2003, our rest of world license to Forward Pharma's intellectual property, including Forward Pharma's intellectual property related to TECFIDERA, as discussed below, and other amounts related to our other marketed products and other programs acquired through business combinations.
TECFIDERA License Rights
In January 2017 we entered into a settlement and license agreement among Biogen Swiss Manufacturing GmbH, Biogen International Holding Ltd., Forward Pharma and certain related parties, which was effective as of February 1, 2017. Pursuant to this agreement, we obtained U.S. and rest of world licenses to Forward Pharma's intellectual property, including Forward Pharma's intellectual property related to TECFIDERA. In exchange, we paid Forward Pharma $1.25 billion in cash, of which $795.2 million was recorded within intangible assets in the first quarter of 2017.
We had an intellectual property dispute with Forward Pharma in the U.S. concerning intellectual property related to TECFIDERA.
In March 2017 the U.S. intellectual property dispute was decided in our favor. Forward Pharma appealed to the U.S. Court of Appeals for the Federal Circuit. We evaluated the recoverability of the U.S. asset acquired from Forward Pharma and recorded a $328.2 million impairment charge in the first quarter of 2017 to adjust the carrying value of the acquired U.S. asset to fair value reflecting the impact of the developments in the U.S. legal dispute and continued to amortize the remaining net book value of the U.S. intangible asset in our consolidated statements of income utilizing an economic consumption model. The U.S. Court of Appeals for the Federal Circuit upheld the U.S. Patent and Trademark Office’s March 2017 ruling and in January 2019 denied Forward Pharma's petition for rehearing. We evaluated the recoverability of the U.S. asset based upon these most recent developments and recorded a $176.8 million impairment charge in the fourth quarter of 2018 to reduce the remaining net book value of the U.S. asset to zero.
We have an intellectual property dispute with Forward Pharma in the European Union (E.U.) concerning intellectual property related to TECFIDERA.
In March 2018 the European Patent Office (EPO) revoked Forward Pharma’s European Patent No. 2 801 355. Forward Pharma has filed an appeal to the Technical Boards of Appeal of the EPO and a hearing has been set for June 2020. Based upon our assessment of this ruling, we continue to amortize the remaining net book value of the rest of world intangible asset in our consolidated statements of income utilizing an economic consumption model. The remaining net book value of the TECFIDERA rest of world intangible asset as of December 31, 2019, was $36.1 million.
For additional information on the dispute with Forward Pharma in the E.U., please read Note 20, Litigation, to these consolidated financial statements.
IPR&D Related to Business Combinations
IPR&D represents the fair value assigned to research and development assets that we acquired as part of a business combination and had not yet reached technological feasibility at the date of acquisition. Upon commercialization, we will determine the estimated useful life and amortize these amounts based upon an economic consumption method. The carrying value associated with our IPR&D assets as of December 31, 2019 and 2018, relates to the various IPR&D programs we acquired in connection with our acquisitions of NST, Convergence Pharmaceuticals Holdings Limited (Convergence), Stromedix Inc. (Stromedix) and Biogen International Neuroscience GmbH (BIN) in 2019, 2015, 2012 and 2010, respectively. IPR&D balances include adjustments related to foreign currency exchange rate fluctuations.
F- 31
BIOGEN INC. AND SUBSIDIARIES
NOTES TO CONSOLIDATED FINANCIAL STATEMENTS — (Continued)
An analysis of anticipated lifetime revenues and anticipated development costs is performed annually during our long-range planning cycle, which was most recently updated in the second quarter of 2019. This analysis is based upon certain assumptions that we evaluate on a periodic basis, including anticipated future product sales, the expected impact of changes in the amount of development costs and the probabilities of our programs succeeding, the introduction of new products by our competitors and changes in our commercial and pipeline product candidates.
In connection with our acquisition of NST in June 2019, we acquired IPR&D programs with an estimated fair value of $700.0 million. For additional information on our acquisition of NST, please read Note 2, Acquisitions, to these consolidated financial statements.
BG00011
During the third quarter of 2019 we discontinued the Phase 2b study of BG00011 for the potential treatment of idiopathic pulmonary fibrosis (IPF) due to safety concerns. As a result, we recognized an impairment charge of approximately $215.9 million during the third quarter of 2019 to reduce the fair value of the IPR&D intangible asset to zero. We also adjusted the value of our contingent consideration obligations related to this asset resulting in a gain of $61.2 million in the third quarter of 2019.
Vixotrigine
During the third quarter of 2018 we completed a Phase 2b study of vixotrigine for the potential treatment of painful lumbosacral radiculopathy (PLSR). The study did not meet its primary or secondary efficacy endpoints and we discontinued development of vixotrigine for the potential treatment of PLSR. As a result, we recognized an impairment charge of approximately $60.0 million during the third quarter of 2018 to reduce the fair value of the related IPR&D intangible asset to zero.
In addition, we delayed the initiation of the Phase 3 studies of vixotrigine for the potential treatment of TGN as we awaited the outcome of ongoing interactions with the FDA regarding the design of the Phase 3 studies, a more detailed review of the data from the Phase 2b study of vixotrigine for the potential treatment of PLSR and insights from the Phase 2 study of vixotrigine for the potential treatment of small fiber neuropathy. We reassessed the fair value of the TGN program using reduced expected lifetime revenues, higher expected clinical development costs and lower cumulative probability of success. As a result of that reassessment, we recognized an impairment charge of $129.3 million during the third quarter of 2018 to reduce the fair value of the TGN IPR&D intangible asset to $41.8 million.
The IPR&D impairment charges were included in amortization and impairment of acquired intangible assets and the gain resulting from the remeasurement of our contingent consideration obligation was recorded in (gain) loss on fair value remeasurement of contingent consideration in our consolidated statements of income. The fair value of the intangible assets and contingent consideration obligations were based on a probability-adjusted discounted cash flow calculation using Level 3 fair value measurements and inputs including estimated revenues, costs and probabilities of success.
Estimated Future Amortization of Intangible Assets
Our most recent long-range planning cycle was completed in the second quarter of 2019. Based upon this most recent analysis, the estimated future amortization of acquired intangible assets for the next five years is expected to be as follows:
(In millions) | As of December 31, 2019 | ||
2020 | $ | ||
2021 | |||
2022 | |||
2023 | |||
2024 | |||
F- 32
BIOGEN INC. AND SUBSIDIARIES
NOTES TO CONSOLIDATED FINANCIAL STATEMENTS — (Continued)
Goodwill
The following table provides a roll forward of the changes in our goodwill balance:
As of December 31, | |||||||
(In millions) | 2019 | 2018 | |||||
Goodwill, beginning of year | $ | $ | |||||
Increase to goodwill | |||||||
Elimination of goodwill allocated to Hillerød, Denmark manufacturing operations | ( | ) | |||||
Other | ( | ) | |||||
Goodwill, end of year | $ | $ | |||||
The increase to goodwill during 2019 was related to our acquisition of NST. For additional information on our acquisition of NST, please read Note 2, Acquisitions, to these consolidated financial statements.
The increase to goodwill during 2018 was related to $1.2 billion in contingent milestones achieved (exclusive of $119.9 million in tax benefits) and payable to the former shareholders of Fumapharm AG and holders of their rights. In the fourth quarter of 2018 we achieved the $20.0 billion cumulative sales level threshold and accrued the final contingent payment of $300.0 million related to FUMADERM and TECFIDERA (together, the Fumapharm Products), which was paid in the first quarter of 2019.
The elimination of goodwill represents an allocation based upon the relative fair value of our Hillerød, Denmark manufacturing operations at the divestiture date. In connection with the divestiture of our Hillerød, Denmark manufacturing operations, our remaining goodwill was reviewed for impairment, and based upon this review, no impairments were recognized. For additional information on the divestiture of our Hillerød, Denmark manufacturing operations, please read Note 3, Divestitures, to these consolidated financial statements.
As of December 31, 2019, we had no accumulated impairment losses related to goodwill.
7. Fair Value Measurements
The tables below present information about our assets and liabilities that are regularly measured and carried at fair value and indicate the level within the fair value hierarchy of the valuation techniques we utilized to determine such fair value:
As of December 31, 2019 (In millions) | Total | Quoted Prices in Active Markets (Level 1) | Significant Other Observable Inputs (Level 2) | Significant Unobservable Inputs (Level 3) | |||||||||||
Assets: | |||||||||||||||
Cash equivalents | $ | $ | $ | $ | |||||||||||
Marketable debt securities: | |||||||||||||||
Corporate debt securities | |||||||||||||||
Government securities | |||||||||||||||
Mortgage and other asset backed securities | |||||||||||||||
Marketable equity securities | |||||||||||||||
Derivative contracts | |||||||||||||||
Plan assets for deferred compensation | |||||||||||||||
Total | $ | $ | $ | $ | |||||||||||
Liabilities: | |||||||||||||||
Derivative contracts | $ | $ | $ | $ | |||||||||||
Contingent consideration obligations | |||||||||||||||
Total | $ | $ | $ | $ | |||||||||||
F- 33
BIOGEN INC. AND SUBSIDIARIES
NOTES TO CONSOLIDATED FINANCIAL STATEMENTS — (Continued)
As of December 31, 2018 (In millions) | Total | Quoted Prices in Active Markets (Level 1) | Significant Other Observable Inputs (Level 2) | Significant Unobservable Inputs (Level 3) | |||||||||||
Assets: | |||||||||||||||
Cash equivalents | $ | $ | $ | $ | |||||||||||
Marketable debt securities: | |||||||||||||||
Corporate debt securities | |||||||||||||||
Government securities | |||||||||||||||
Mortgage and other asset backed securities | |||||||||||||||
Marketable equity securities | |||||||||||||||
Derivative contracts | |||||||||||||||
Plan assets for deferred compensation | |||||||||||||||
Total | $ | $ | $ | $ | |||||||||||
Liabilities: | |||||||||||||||
Derivative contracts | $ | $ | $ | $ | |||||||||||
Contingent consideration obligations | |||||||||||||||
Total | $ | $ | $ | $ | |||||||||||
There have been no changes in valuation techniques or transfers between fair value measurement levels during the years ended December 31, 2019 and 2018. The fair value of Level 2 instruments classified as cash equivalents, marketable debt securities and our marketable equity security investment in Ionis Pharmaceuticals, Inc. (Ionis) were determined through third-party pricing services or an option pricing valuation model. For additional information on our collaboration arrangements with Ionis, please read Note 18, Collaborative and Other Relationships, to these consolidated financial statements. For a description of our validation procedures related to prices provided by third-party pricing services and our option pricing valuation model, please read Note 1, Summary of Significant Accounting Policies - Fair Value Measurements, to these consolidated financial statements.
Debt Instruments
The fair values of our debt instruments, which are Level 2 liabilities, are summarized as follows:
As of December 31, | |||||||
(In millions) | 2019 | 2018 | |||||
2.900% Senior Notes due September 15, 2020 | $ | $ | |||||
3.625% Senior Notes due September 15, 2022 | |||||||
4.050% Senior Notes due September 15, 2025 | |||||||
5.200% Senior Notes due September 15, 2045 | |||||||
Total | $ | $ | |||||
Contingent Consideration Obligations
In connection with our acquisitions of Convergence, Stromedix and BIN in 2015, 2012 and 2010, respectively, we agreed to make additional payments based upon the achievement of certain milestone events. The following table provides a roll forward of the fair values of our contingent consideration obligations, which includes Level 3 measurements:
As of December 31, | |||||||
(In millions) | 2019 | 2018 | |||||
Fair value, beginning of year | $ | $ | |||||
Changes in fair value | ( | ) | ( | ) | |||
Payments and other | ( | ) | |||||
Fair value, end of year | $ | $ | |||||
As of December 31, 2019 and 2018, approximately $197.7 million and $265.0 million, respectively, of the fair value of our total contingent consideration obligations was reflected as a component of other long-term liabilities in
F- 34
BIOGEN INC. AND SUBSIDIARIES
NOTES TO CONSOLIDATED FINANCIAL STATEMENTS — (Continued)
our consolidated balance sheets with the remaining balance reflected as a component of accrued expenses and other.
For the year ended December 31, 2019, changes in the fair value of our contingent consideration obligations were primarily due to the discontinuation of the Phase 2b study of BG00011 for the potential treatment of IPF resulting in a reduction of our contingent consideration obligations of $61.2 million, partially offset by changes in the probability and expected timing of achievement of certain developmental milestones, a decrease in interest rates used to revalue our contingent consideration liabilities and the passage of time.
For the year ended December 31, 2018, changes in the fair value of our contingent consideration obligations were primarily due to delays in the expected timing of achievement of milestones related to the TGN program and an increase in discount rates used to revalue our contingent consideration liabilities, partially offset by the passage of time. For the year ended December 31, 2018, payments and other reflects an $81.5 million milestone payment made to the former shareholders of Stromedix.
The fair values of the contingent consideration liabilities were based on a probability-adjusted discounted cash flow calculation using Level 3 fair value measurements and inputs including estimated revenues and probabilities of success. For additional information on the valuation techniques and inputs utilized in the valuation of our financial assets and liabilities, please read Note 1, Summary of Significant Accounting Policies, to these consolidated financial statements.
Convergence Pharmaceuticals Holdings Limited
In connection with our acquisition of Convergence in February 2015 we recorded a contingent consideration obligation of $274.5 million. As of December 31, 2019 and 2018, the fair value of this contingent consideration obligation was $244.6 million and $246.6 million, respectively. Our most recent valuation was determined based upon net cash flow projections of $400.0 million, probability weighted and discounted using a rate of 2.1 %, which is a measure of the credit risk associated with settling the liability.
For 2019 compared to 2018, the net decrease in our contingent consideration obligation was primarily due to changes in the expected timing and probabilities of success related to the achievement of certain developmental milestones, partially offset by a decrease in discount rates used to revalue our contingent consideration liabilities and the passage of time. Accrued expenses and other in our consolidated balances sheets include $148.5 million as we expect to make the payment within one year.
Stromedix Inc.
In connection with our acquisition of Stromedix in March 2012 we recorded a contingent consideration obligation of $122.2 million. During the third quarter of 2019 we discontinued the Phase 2b study of BG00011 for the potential treatment of IPF due to safety concerns. As a result, we adjusted the fair value of this contingent consideration obligation to zero, resulting in a gain of $61.2 million in the third quarter of 2019. As of December 31, 2018, the fair value of this contingent consideration obligation was $83.0 million.
Biogen Idec International Neuroscience GmbH
In connection with our acquisition of BIN in December 2010 we recorded a contingent consideration obligation of $81.2 million. As of December 31, 2019 and 2018, the fair value of this contingent consideration obligation was $101.5 million and $80.2 million, respectively. Our most recent valuation was determined based upon net cash outflow projections of $335.0 million, probability weighted and discounted using a rate of 2.3 %, which is a measure of the credit risk associated with settling the liability.
For 2019 compared to 2018, the net increase in our contingent consideration obligation was primarily due to changes in the expected timing and probabilities of success related to the achievement of certain developmental milestones, a decrease in discount rates used to revalue our contingent consideration liabilities and the passage of time. No amounts are reflected as a current liability in our consolidated balance sheets at December 31, 2019, as we do not expect to make a payment in the next year.
Acquired IPR&D
The fair values of the acquired IPR&D assets were based on a probability-adjusted discounted cash flow calculation using Level 3 fair value measurements and inputs including estimated revenues and probabilities of success. These assets are tested for impairment annually until commercialization, after which time the acquired
F- 35
BIOGEN INC. AND SUBSIDIARIES
NOTES TO CONSOLIDATED FINANCIAL STATEMENTS — (Continued)
IPR&D will be amortized over its estimated useful life using the economic consumption method. In connection with our acquisition of Stromedix, we recognized a $219.2 million acquired IPR&D intangible asset. During the third quarter of 2019 we discontinued the Phase 2b study of BG00011 for the potential treatment of IPF due to safety concerns and recognized an impairment charge of $215.9 million to reduce the fair value of the IPR&D intangible asset to zero. In connection with our acquisition of Convergence we recognized a $424.6 million acquired IPR&D intangible asset. During the third quarter of 2018 we recognized impairment charges related to certain IPR&D assets associated with our vixotrigine program totaling $189.3 million. For additional information on our IPR&D intangible assets, including a discussion of our most significant assumptions, please read Note 6, Intangible Assets and Goodwill, to these consolidated financial statements.
8. Financial Instruments
The following table summarizes our financial assets with maturities of less than 90 days from the date of purchase included in cash and cash equivalents in our consolidated balance sheets:
As of December 31, | |||||||
(In millions) | 2019 | 2018 | |||||
Commercial paper | $ | $ | |||||
Overnight reverse repurchase agreements | |||||||
Money market funds | |||||||
Short-term debt securities | |||||||
Total | $ | $ | |||||
The carrying values of our commercial paper, including accrued interest, overnight reverse repurchase agreements, money market funds and our short-term debt securities approximate fair value due to their short-term maturities.
Marketable equity securities gains (losses) are recorded in other income (expense), net in our consolidated statements of income. The following tables summarize our marketable debt and equity securities, classified as available for sale:
As of December 31, 2019 (In millions) | Amortized Cost | Gross Unrealized Gains | Gross Unrealized Losses | Fair Value | |||||||||||
Corporate debt securities | |||||||||||||||
Current | $ | $ | $ | $ | |||||||||||
Non-current | |||||||||||||||
Government securities | |||||||||||||||
Current | |||||||||||||||
Non-current | ( | ) | |||||||||||||
Mortgage and other asset backed securities | |||||||||||||||
Current | |||||||||||||||
Non-current | ( | ) | |||||||||||||
Total marketable debt securities | $ | $ | $ | ( | ) | $ | |||||||||
Marketable equity securities, non-current | $ | $ | $ | ( | ) | $ | |||||||||
F- 36
BIOGEN INC. AND SUBSIDIARIES
NOTES TO CONSOLIDATED FINANCIAL STATEMENTS — (Continued)
As of December 31, 2018 (In millions) | Amortized Cost | Gross Unrealized Gains | Gross Unrealized Losses | Fair Value | |||||||||||
Corporate debt securities | |||||||||||||||
Current | $ | $ | $ | ( | ) | $ | |||||||||
Non-current | ( | ) | |||||||||||||
Government securities | |||||||||||||||
Current | ( | ) | |||||||||||||
Non-current | ( | ) | |||||||||||||
Mortgage and other asset backed securities | |||||||||||||||
Current | |||||||||||||||
Non-current | ( | ) | |||||||||||||
Total marketable debt securities | $ | $ | $ | ( | ) | $ | |||||||||
Marketable equity securities, non-current | $ | $ | $ | ( | ) | $ | |||||||||
Summary of Contractual Maturities: Available-for-Sale Debt Securities
The estimated fair value and amortized cost of our marketable debt securities available-for-sale by contractual maturity are summarized as follows:
As of December 31, 2019 | As of December 31, 2018 | ||||||||||||||
(In millions) | Estimated Fair Value | Amortized Cost | Estimated Fair Value | Amortized Cost | |||||||||||
Due in one year or less | $ | $ | $ | $ | |||||||||||
Due after one year through five years | |||||||||||||||
Due after five years | |||||||||||||||
Total marketable debt securities | $ | $ | $ | $ | |||||||||||
The average maturity of our marketable debt securities available-for-sale as of December 31, 2019 and 2018, were 14 months and 12 months, respectively.
Proceeds from Marketable Debt Securities
The proceeds from maturities and sales of marketable debt securities and resulting realized gains and losses are summarized as follows:
For the Years Ended December 31, | |||||||||||
(In millions) | 2019 | 2018 | 2017 | ||||||||
Proceeds from maturities and sales | $ | $ | $ | ||||||||
Realized gains | $ | $ | $ | ||||||||
Realized losses | $ | $ | $ | ||||||||
Realized losses for the year ended December 31, 2019, primarily relate to sales of corporate bonds, agency mortgage-backed securities and other asset-backed securities. Realized losses for the year ended December 31, 2018, primarily relate to sales of corporate bonds, agency mortgage-backed securities and other asset-backed securities. Realized losses for the year ended December 31, 2017, primarily relate to impairments recognized on certain of our available-for-sale marketable debt securities, sales of agency mortgage-backed securities, corporate bonds and government securities.
Strategic Investments
As of December 31, 2019 and 2018, our strategic investment portfolio was comprised of investments totaling $393.9 million and $676.3 million, respectively, which are included in investments and other assets in our consolidated balance sheets.
Our strategic investment portfolio includes investments in equity securities of certain biotechnology companies, which are reflected within our disclosures included in Note 7, Fair Value Measurements, to these consolidated financial statements, venture capital funds where the underlying investments are in equity securities of certain biotechnology companies and non-marketable equity securities.
F- 37
BIOGEN INC. AND SUBSIDIARIES
NOTES TO CONSOLIDATED FINANCIAL STATEMENTS — (Continued)
Our investments in equity securities include shares of Ionis common stock acquired in June 2018. This investment is classified as a Level 2 marketable security due to certain holding period restrictions and is remeasured each reporting period and carried at fair value. The effect of the holding period restrictions on our investment in Ionis common stock valuation are estimated using an option pricing valuation model. The most significant assumptions within the model are the term of the restrictions and the stock price volatility, which is based upon historical volatility of similar companies. We also use a constant maturity risk-free interest rate to match the remaining term of the restrictions on our investment in Ionis common stock and a dividend yield of zero based upon the fact that Ionis and similar companies generally have not historically granted cash dividends. The remainder of our investments in equity securities of certain publicly-traded biotechnology companies are regularly measured and carried at fair value and classified as Level 1.
The decrease in our strategic investment portfolio for the year ended December 31, 2019, primarily reflects our sale of a portion of our investment in Ionis common stock for approximately $382.0 million as well as our sale of our investment in a non-marketable equity security, partially offset by an increase in the fair value of our remaining investment in Ionis common stock.
For additional information on the June 2018 investment in Ionis common stock, please read Note 18, Collaborative and Other Relationships, to these consolidated financial statements.
Samsung Bioepis
In June 2018 we exercised our option under our joint venture agreement with Samsung BioLogics to increase our ownership percentage in Samsung Bioepis from approximately 5 % to approximately 49.9 %. The share purchase transaction was completed in November 2018 and, upon closing, we paid 759.5 billion South Korean won ($676.6 million) to Samsung BioLogics.
As of December 31, 2019 and 2018, the carrying value of our investment in Samsung Bioepis totaled 670.8 billion South Korean won ($580.2 million) and 759.5 billion South Korean won ($680.6 million), respectively, which is classified as a component of investments and other assets within our consolidated balance sheets.
For additional information on our collaboration arrangements with Samsung Bioepis, please read Note 18, Collaborative and Other Relationships, to these consolidated financial statements.
9. Derivative Instruments
Foreign Currency Forward Contracts - Hedging Instruments
Due to the global nature of our operations, portions of our revenues and operating expenses are recorded in currencies other than the U.S. dollar. The value of revenues and operating expenses measured in U.S. dollars is therefore subject to changes in foreign currency exchange rates. In order to mitigate these changes, we use foreign currency forward contracts to lock in exchange rates associated with a portion of our forecasted international revenues and operating expenses.
Foreign currency forward contracts in effect as of December 31, 2019 and 2018, had durations of 1 to 15 months and 1 to 12 months, respectively. These contracts have been designated as cash flow hedges and unrealized gains or losses on the portion of these foreign currency forward contracts that are included in the effectiveness test are reported in accumulated other comprehensive income (loss) (referred to as AOCI in the tables below). Realized gains and losses of such contracts are recognized in revenues when the sale of product in the currency being hedged is recognized and in operating expenses when the expense in the currency being hedged is recorded. We recognize all cash flow hedge reclassifications from accumulated other comprehensive income and fair value changes of excluded portions in the same line item in our consolidated statements of income that has been impacted by the hedged item.
F- 38
BIOGEN INC. AND SUBSIDIARIES
NOTES TO CONSOLIDATED FINANCIAL STATEMENTS — (Continued)
The notional value of foreign currency forward contracts that were entered into to hedge forecasted revenues and operating expenses is summarized as follows:
Notional Amount As of December 31, | |||||||
Foreign Currency: (In millions) | 2019 | 2018 | |||||
Euro | $ | $ | |||||
British pound sterling | |||||||
Swiss francs | |||||||
Japanese yen | |||||||
Canadian dollar | |||||||
Total foreign currency forward contracts | $ | $ | |||||
The pre-tax portion of the fair value of these foreign currency forward contracts that were included in accumulated other comprehensive income (loss) in total equity reflected net gains of $0.5 million as of December 31, 2019, net gains of $27.3 million as of December 31, 2018, and net losses of $113.0 million as of December 31, 2017. We expect the net gains of $0.5 million to be settled over the next 15 months, of which $2.4 million of these gains are expected to be settled over the next 12 months, with any amounts in accumulated other comprehensive income (loss) to be reported as an adjustment to revenues or operating expenses. We consider the impact of our and our counterparties’ credit risk on the fair value of the contracts as well as the ability of each party to execute its contractual obligations. As of December 31, 2019 and 2018, credit risk did not change the fair value of our foreign currency forward contracts.
The following tables summarize the effect of foreign currency forward contracts designated as hedging instruments in our consolidated statements of income:
For the Years Ended December 31, | ||||||||||||||||||
Net Gains/(Losses) Reclassified from AOCI into Operating Income (in millions) | Net Gains/(Losses) Recognized in Operating Income (in millions) | |||||||||||||||||
Location | 2019 | 2018 | Location | 2019 | 2018 | |||||||||||||
Revenues | $ | $ | ( | ) | Revenues | $ | $ | |||||||||||
Operating expenses | $ | ( | ) | $ | Operating expenses | $ | $ | ( | ) | |||||||||
For the Years Ended December 31, | ||||||||||
Net Gains/(Losses) Reclassified from AOCI into Operating Income (in millions) | Net Gains/(Losses) Recognized Directly into Net Income (in millions) | |||||||||
Location | 2017 | Location | 2017 | |||||||
Revenues | $ | ( | ) | Other income (expense) | $ | |||||
Operating expenses | $ | Other income (expense) | $ | ( | ) | |||||
Interest Rate Contracts - Hedging Instruments
We have entered into interest rate lock contracts or interest rate swap contracts on certain borrowing transactions to manage our exposure to interest rate changes and to reduce our overall cost of borrowing.
Interest Rate Swap Contracts
In connection with the issuance of our 2.90 % Senior Notes, as described in Note 12, Indebtedness, to these consolidated financial statements, we entered into interest rate swaps with an aggregate notional amount of $675.0 million, which expire on September 15, 2020. The interest rate swap contracts are designated as hedges of the fair value changes in our 2.90 % Senior Notes attributable to changes in interest rates. The carrying value of our 2.90 % Senior Notes as of December 31, 2019 and 2018, includes approximately $2.3 million and $14.5 million, respectively, related to changes in the fair value of these interest rate swap contracts. Since the specific terms and notional amount of the swaps match the debt being hedged, it is assumed to be a highly effective hedge and all changes in the fair value of the swaps are recorded as a component of our 2.90 % Senior Notes with no net impact recorded in income. Any net interest payments made or received on the interest rate swap contracts are recorded as a component of interest expense in our consolidated statements of income.
F- 39
BIOGEN INC. AND SUBSIDIARIES
NOTES TO CONSOLIDATED FINANCIAL STATEMENTS — (Continued)
Net Investment Hedges - Hedging Instruments
In February 2012 we entered into a joint venture agreement with Samsung BioLogics, establishing an entity, Samsung Bioepis, to develop, manufacture and market biosimilar products. In June 2018 we exercised our option under our joint venture agreement to increase our ownership percentage in Samsung Bioepis from approximately 5 % to approximately 49.9 %. The share purchase transaction was completed in November 2018 and, upon closing, we paid 759.5 billion South Korean won ($676.6 million) to Samsung BioLogics. Our investment in the equity of Samsung Bioepis is exposed to the currency fluctuations in the South Korean won.
In order to mitigate these currency fluctuations between the U.S. dollar and South Korean won, we have entered into foreign currency forward contracts. Foreign currency forward contracts in effect as of December 31, 2019, had remaining durations of 10 months. These contracts have been designated as net investment hedges. We recognize changes in the spot exchange rate in accumulated other comprehensive income (loss). The pre-tax portion of the fair value of these foreign currency forward contracts that were included in accumulated other comprehensive income (loss) in total equity reflected net losses of $1.5 million and $3.8 million as of December 31, 2019 and 2018, respectively. We exclude fair value changes related to the forward rate from our hedging relationship and will amortize the forward points in other income (expense), net in our consolidated statements of income over the term of the contract. The pre-tax portion of the fair value of the forward points that were included in accumulated other comprehensive income (loss) in total equity reflected gains of $2.9 million and $7.3 million as of December 31, 2019 and 2018, respectively.
The following table summarizes the effect of our net investment hedges in our consolidated financial statements:
For the Years Ended December 31, | ||||||||||||||||||||||||||||
Net Gains/(Losses) Recognized in Other Comprehensive Income (Effective Portion) (in millions) | Net Gains/(Losses) Recognized in Other Comprehensive Income (Amounts Excluded from Effectiveness Testing) (in millions) | Net Gains/(Losses) Recognized in Net Income (Amounts Excluded from Effectiveness Testing) (in millions) | ||||||||||||||||||||||||||
Location | 2019 | 2018 | Location | 2019 | 2018 | Location | 2019 | 2018 | ||||||||||||||||||||
Gains (losses) on net investment hedge | $ | $ | ( | ) | Gains (losses) on net investment hedge | $ | $ | Other income (expense) | $ | $ | ||||||||||||||||||
For additional information on our collaboration arrangements with Samsung Bioepis, please read Note 18, Collaborative and Other Relationships, to these consolidated financial statements.
Foreign Currency Forward Contracts - Other Derivative Instruments
We also enter into other foreign currency forward contracts, usually with durations of one month or less, to mitigate the foreign currency risk related to certain balance sheet positions. We have not elected hedge accounting for these transactions.
The aggregate notional amount of these outstanding foreign currency contracts as of December 31, 2019 and 2018, were $793.8 million and $735.1 million, respectively. Net losses of $5.9 million and net gains of $2.0 million and $4.5 million related to these contracts were recorded as a component of other income (expense), net, for the years ended December 31, 2019, 2018 and 2017, respectively.
Summary of Derivative Instruments
While certain of our derivative instruments are subject to netting arrangements with our counterparties, we do not offset derivative assets and liabilities in our consolidated balance sheets. The amounts in the table below would not be substantially different if the derivative assets and liabilities were offset.
F- 40
BIOGEN INC. AND SUBSIDIARIES
NOTES TO CONSOLIDATED FINANCIAL STATEMENTS — (Continued)
The following table summarizes the fair value and presentation in our consolidated balance sheets of our outstanding derivative instruments, including those designated as hedging instruments:
(In millions) | Balance Sheet Location | Fair Value As of December 31, 2019 | Fair Value As of December 31, 2018 | |||||||
Cash Flow Hedging Instruments: | ||||||||||
Asset derivative instruments | Other current assets | $ | $ | |||||||
Liability derivative instruments | Accrued expenses and other | $ | $ | |||||||
Other long-term liabilities | $ | $ | ||||||||
Net Investment Hedging Instruments: | ||||||||||
Asset derivative instruments | Other current assets | $ | $ | |||||||
Fair Value Hedging Instruments | ||||||||||
Liability derivative instruments | Accrued expenses and other | $ | $ | |||||||
Other long-term liabilities | $ | $ | ||||||||
Other Derivative Instruments: | ||||||||||
Asset derivative instruments | Other current assets | $ | $ | |||||||
Liability derivative instruments | Accrued expenses and other | $ | $ | |||||||
10. Property, Plant and Equipment
Property, plant and equipment are recorded at historical cost, net of accumulated depreciation. Components of property, plant and equipment, net are summarized as follows:
As of December 31, | |||||||
(In millions) | 2019 | 2018 | |||||
Land | $ | $ | |||||
Buildings | |||||||
Leasehold improvements | |||||||
Machinery and equipment | |||||||
Computer software and hardware | |||||||
Furniture and fixtures | |||||||
Construction in progress | |||||||
Total cost | |||||||
Less: accumulated depreciation | ( | ) | ( | ) | |||
Total property, plant and equipment, net | $ | $ | |||||
Depreciation expense totaled $190.6 million, $269.4 million and $266.3 million for 2019, 2018 and 2017, respectively.
For 2019, 2018 and 2017 we capitalized interest costs related to construction in progress totaling approximately $68.8 million, $54.0 million and $30.7 million, respectively. The increase in capitalized interest costs is primarily due to the construction of our large-scale biologics manufacturing facility in Solothurn, Switzerland, as discussed below.
Solothurn, Switzerland Manufacturing Facility
In order to support our drug development pipeline, we are building a large-scale biologics manufacturing facility in Solothurn, Switzerland. We expect this facility to be partially operational by the end of 2020. Upon completion, the facility will include 393,000 square feet related to a large-scale biologics manufacturing facility, 290,000 square feet of warehouse, utilities and support space and 51,000 square feet of administrative space. As of December 31, 2019 and 2018, we had approximately $1.9 billion and $1.6 billion, respectively, capitalized as construction in progress related to this facility.
F- 41
BIOGEN INC. AND SUBSIDIARIES
NOTES TO CONSOLIDATED FINANCIAL STATEMENTS — (Continued)
Divestiture of Hillerød, Denmark Manufacturing Operations
In August 2019 we completed the sale of all of the outstanding shares of our subsidiary that owned our biologics manufacturing operations in Hillerød, Denmark to FUJIFILM. This transaction included $631.5 million of property, plant and equipment, which was primarily comprised of $312.5 million for buildings and $287.3 million for machinery and equipment. For additional information on the divestiture of our Hillerød, Denmark manufacturing operations, please read Note 3, Divestitures, to these consolidated financial statements.
11. Leases
We lease real estate, including laboratory and office space, and certain equipment.
Our leases have remaining lease terms ranging from less than one year to ten years . Certain leases include one or more options to renew, exercised at our sole discretion, with renewal terms that can extend the lease term from one year to six years .
In addition, we sublease certain real estate to third parties. Our sublease portfolio consists of operating leases, with remaining lease terms ranging from less than one year to nine years . Our subleases do not include an option to renew as they are coterminous with our operating leases.
All of our leases qualify as operating leases. The following table summarizes the presentation in our consolidated balance sheets of our operating leases:
(In millions) | Balance sheet location | As of December 31, 2019 | |||
Assets: | |||||
Operating lease assets | Operating lease assets | $ | |||
Liabilities | |||||
Current operating lease liabilities | Accrued expenses and other | $ | |||
Non-current operating lease liabilities | Long-term operating lease liabilities | ||||
Total operating lease liabilities | $ | ||||
The following table summarizes the effect of lease costs in our consolidated statements of income:
For the year ended December 31, | |||||
(In millions) | Income Statement Location | 2019 | |||
Operating lease cost | Research and development | $ | |||
Selling, general and administrative | |||||
Variable lease cost | Research and development | ||||
Selling, general and administrative | |||||
Sublease income | Selling, general and administrative | ( | ) | ||
Other (income) expense, net | ( | ) | |||
Net lease cost | $ | ||||
F- 42
BIOGEN INC. AND SUBSIDIARIES
NOTES TO CONSOLIDATED FINANCIAL STATEMENTS — (Continued)
Variable lease cost primarily related to operating expenses, taxes and insurance associated with our operating leases. As these costs are generally variable in nature, they are not included in the measurement of the operating lease asset and related lease liability.
The minimum lease payments for the next five years and thereafter is expected to be as follows:
(In millions) | As of December 31, 2019 | ||
2020 | $ | ||
2021 | |||
2022 | |||
2023 | |||
2024 | |||
Thereafter | |||
Total lease payments | $ | ||
Less: interest | |||
Present value of operating lease liabilities | $ | ||
Under the prior lease accounting guidance minimum rental commitments under non-cancelable leases, net of income from subleases, for each of the five years and total thereafter as of December 31, 2018, were as follows:
(In millions) | 2019 | 2020 | 2021 | 2022 | 2023 | Thereafter | Total | ||||||||||||||||||||
Minimum lease payments | $ | $ | $ | $ | $ | $ | $ | ||||||||||||||||||||
Less: income from subleases(1) | ( | ) | ( | ) | ( | ) | ( | ) | ( | ) | ( | ) | ( | ) | |||||||||||||
Net minimum lease payments | $ | $ | $ | $ | $ | $ | $ | ||||||||||||||||||||
(1) | Represents sublease income expected to be received for the vacated manufacturing facility in Cambridge, MA, the vacated portion of our Weston, MA facility and other facilities throughout the world. |
The weighted average remaining lease term and weighted average discount rate of our operating leases are as follows:
As of December 31, 2019 | ||
Weighted average remaining lease term in years | ||
Weighted average discount rate | % | |
Supplemental disclosure of cash flow information related to our operating leases included in cash flows provided by operating activities in our consolidated statements of cash flows is as follows:
For the year ended December 31, | |||
(In millions) | 2019 | ||
Cash paid for amounts included in the measurement of lease liabilities | $ | ||
Operating lease assets obtained in exchange for lease obligations | $ | ||
F- 43
BIOGEN INC. AND SUBSIDIARIES
NOTES TO CONSOLIDATED FINANCIAL STATEMENTS — (Continued)
12. Indebtedness
Our indebtedness is summarized as follows:
As of December 31, | |||||||
(In millions) | 2019 | 2018 | |||||
Current portion: | |||||||
2.900% Senior Notes due September 15, 2020 | $ | $ | |||||
Current portion of notes payable | $ | $ | |||||
Non-current portion: | |||||||
2.900% Senior Notes due September 15, 2020 | |||||||
3.625% Senior Notes due September 15, 2022 | |||||||
4.050% Senior Notes due September 15, 2025 | |||||||
5.200% Senior Notes due September 15, 2045 | |||||||
Non-current portion of notes payable | $ | $ | |||||
2015 Senior Notes
The following is a summary of our principal indebtedness as of December 31, 2019:
• | $ |
• | $ |
• | $ |
• | $ |
The costs associated with these offerings of approximately $47.5 million have been recorded as a reduction to the carrying amount of the debt in our consolidated balance sheets. These costs along with the discounts will be amortized as additional interest expense using the effective interest rate method over the period from issuance through maturity.
These notes are senior unsecured obligations. These Senior Notes may be redeemed at our option at any time at 100 % of the principal amount plus accrued interest and a specified make-whole amount. These Senior Notes contain a change of control provision that may require us to purchase the notes at a price equal to 101 % of the principal amount plus accrued and unpaid interest to the date of purchase under certain circumstances.
In connection with the 2.90 % Senior Notes offering due in 2020, we entered into interest rate swap contracts. The carrying value of the 2.90 % Senior Notes as of December 31, 2019 and 2018, includes approximately $2.3 million and $14.5 million, respectively, related to changes in the fair value of these contracts. For additional information on our interest rate contracts, please read Note 9, Derivative Instruments, to these consolidated financial statements.
2015 Credit Facility
In August 2015 we entered into a $1.0 billion, five -year senior unsecured revolving credit facility under which we were permitted to draw funds for working capital and general corporate purposes. The terms of the revolving credit facility included a financial covenant that required us not to exceed a maximum consolidated leverage ratio. As of December 31, 2019, we had no outstanding borrowings and were in compliance with all covenants under this facility.
In January 2020 we entered into a new $1.0 billion, five -year senior unsecured revolving credit facility that replaced the credit facility entered into in August 2015. For additional information, please read Note 26, Subsequent Events, to these consolidated financial statements.
F- 44
BIOGEN INC. AND SUBSIDIARIES
NOTES TO CONSOLIDATED FINANCIAL STATEMENTS — (Continued)
Debt Maturity
The total gross payments due under our debt arrangements are as follows:
(In millions) | As of December 31, 2019 | ||
2020 | $ | ||
2021 | |||
2022 | |||
2023 | |||
2024 | |||
2025 and thereafter | |||
Total | $ | ||
The fair value of our debt is disclosed in Note 7, Fair Value Measurements, to these consolidated financial statements.
13. Equity
Preferred Stock
We have 8.0 million shares of Preferred Stock authorized, of which 1.75 million shares are authorized as Series A, 1.0 million shares are authorized as Series X junior participating and 5.25 million shares are undesignated. Shares may be issued without a vote or action of shareholders from time to time in classes or series with the designations, powers, preferences and the relative, participating, optional or other special rights of the shares of each such class or series and any qualifications, limitations or restrictions thereon as set forth in the instruments governing such shares. Any such Preferred Stock may rank prior to common stock as to dividend rights, liquidation preference or both, and may have full or limited voting rights and may be convertible into shares of common stock. No shares of Preferred Stock were issued and outstanding during 2019, 2018 and 2017.
Common Stock
The following table describes the number of shares authorized, issued and outstanding of our common stock as of December 31, 2019, 2018 and 2017:
As of December 31, 2019 | As of December 31, 2018 | As of December 31, 2017 | ||||||||||||||||||||||||
(In millions) | Authorized | Issued | Outstanding | Authorized | Issued | Outstanding | Authorized | Issued | Outstanding | |||||||||||||||||
Common stock | ||||||||||||||||||||||||||
Share Repurchases
In December 2019 our Board of Directors authorized a program to repurchase up to $5.0 billion of our common stock (December 2019 Share Repurchase Program). Our December 2019 Share Repurchase Program does not have an expiration date. All share repurchases under our December 2019 Share Repurchase Program will be retired. We did not repurchase shares of our common stock under our December 2019 Share Repurchase Program during the year ended December 31, 2019.
In March 2019 our Board of Directors authorized a program to repurchase up to $5.0 billion of our common stock (March 2019 Share Repurchase Program). Our March 2019 Share Repurchase Program does not have an expiration date. All share repurchases under our March 2019 Share Repurchase Program will be retired. Under our March 2019 Share Repurchase Program, we repurchased and retired approximately 14.7 million shares of our common stock at a cost of approximately $3.7 billion during the year ended December 31, 2019.
In August 2018 our Board of Directors authorized a program to repurchase up to $3.5 billion of our common stock (2018 Share Repurchase Program), which was completed as of June 30, 2019. All share repurchases under our 2018 Share Repurchase Program were retired. Under our 2018 Share Repurchase Program, we repurchased and retired approximately 8.9 million and 4.3 million shares of our common stock at a cost of approximately $2.1 billion and $1.4 billion during the years ended December 31, 2019 and 2018, respectively.
In July 2016 our Board of Directors authorized a program to repurchase up to $5.0 billion of our common stock (2016 Share Repurchase Program), which was completed as of June 30, 2018. All share repurchases under our
F- 45
BIOGEN INC. AND SUBSIDIARIES
NOTES TO CONSOLIDATED FINANCIAL STATEMENTS — (Continued)
2016 Share Repurchase Program were retired. Under our 2016 Share Repurchase Program, we repurchased and retired approximately 10.5 million and 3.7 million shares of common stock at a cost of approximately $3.0 billion and $1.0 billion during the years ended December 31, 2018 and 2017, respectively.
Amounts paid to repurchase shares in excess of their par value are allocated between additional paid-in capital and retained earnings, with payments in excess of our additional paid-in-capital balance recorded as a reduction to retained earnings.
Accumulated Other Comprehensive Income (Loss)
The following tables summarize the changes in accumulated other comprehensive income (loss), net of tax by component:
(In millions) | Unrealized Gains (Losses) on Securities Available for Sale, net of tax | Unrealized Gains (Losses) on Cash Flow Hedges, net of tax | Gains (Losses) on Net Investment Hedge, Net of Tax | Unfunded Status of Postretirement Benefit Plans, net of tax | Currency Translation Adjustments | Total | |||||||||||||||||
Balance, December 31, 2018 | $ | ( | ) | $ | $ | $ | ( | ) | $ | ( | ) | $ | ( | ) | |||||||||
Other comprehensive income (loss) before reclassifications | ( | ) | |||||||||||||||||||||
Amounts reclassified from accumulated other comprehensive income (loss) | ( | ) | ( | ) | ( | ) | ( | ) | |||||||||||||||
Net current period other comprehensive income (loss) | ( | ) | ( | ) | |||||||||||||||||||
Balance, December 31, 2019 | $ | $ | $ | $ | ( | ) | $ | ( | ) | $ | ( | ) | |||||||||||
(In millions) | Unrealized Gains (Losses) on Securities Available for Sale, net of tax | Unrealized Gains (Losses) on Cash Flow Hedges, net of tax | Gains (Losses) on Net Investment Hedge, Net of Tax | Unfunded Status of Postretirement Benefit Plans, net of tax | Currency Translation Adjustments | Total | |||||||||||||||||
Balance, December 31, 2017 | $ | ( | ) | $ | ( | ) | $ | $ | ( | ) | $ | ( | ) | $ | ( | ) | |||||||
Amounts reclassified, net of tax, upon adoption of ASU 2016-01 | |||||||||||||||||||||||
Balance, January 1, 2018 | ( | ) | ( | ) | ( | ) | ( | ) | ( | ) | |||||||||||||
Other comprehensive income (loss) before reclassifications | ( | ) | ( | ) | |||||||||||||||||||
Amounts reclassified from accumulated other comprehensive income (loss) | ( | ) | |||||||||||||||||||||
Net current period other comprehensive income (loss) | ( | ) | ( | ) | |||||||||||||||||||
Balance, December 31, 2018 | $ | ( | ) | $ | $ | $ | ( | ) | $ | ( | ) | $ | ( | ) | |||||||||
F- 46
BIOGEN INC. AND SUBSIDIARIES
NOTES TO CONSOLIDATED FINANCIAL STATEMENTS — (Continued)
(In millions) | Unrealized Gains (Losses) on Securities Available for Sale, net of tax | Unrealized Gains (Losses) on Cash Flow Hedges, net of tax | Gains (Losses) on Net Investment Hedge, Net of Tax | Unfunded Status of Postretirement Benefit Plans, net of tax | Currency Translation Adjustments | Total | |||||||||||||||||
Balance, December 31, 2016 | $ | ( | ) | $ | $ | $ | ( | ) | $ | ( | ) | $ | ( | ) | |||||||||
Other comprehensive income (loss) before reclassifications | ( | ) | ( | ) | ( | ) | ( | ) | |||||||||||||||
Amounts reclassified from accumulated other comprehensive income (loss) | |||||||||||||||||||||||
Net current period other comprehensive income (loss) | ( | ) | ( | ) | |||||||||||||||||||
Balance, December 31, 2017 | $ | ( | ) | $ | ( | ) | $ | $ | ( | ) | $ | ( | ) | $ | ( | ) | |||||||
The following table summarizes the amounts reclassified from accumulated other comprehensive income:
(In millions) | Income Statement Location | Amounts Reclassified from Accumulated Other Comprehensive Income | ||||||||||||
For the Years Ended December 31, | ||||||||||||||
2019 | 2018 | 2017 | ||||||||||||
Gains (losses) on securities available for sale | Other income (expense) | $ | $ | ( | ) | $ | ( | ) | ||||||
Income tax benefit (expense) | ( | ) | ||||||||||||
Gains (losses) on cash flow hedges | Revenues | ( | ) | ( | ) | |||||||||
Operating expenses | ( | ) | ||||||||||||
Other income (expense) | ||||||||||||||
Income tax benefit (expense) | ( | ) | ||||||||||||
Gains (losses) on net investment hedge | Other Income (expense) | |||||||||||||
Total reclassifications, net of tax | $ | $ | ( | ) | $ | ( | ) | |||||||
14. Earnings per Share
Basic and diluted earnings per share are calculated as follows:
For the Years Ended December 31, | |||||||||||
(In millions) | 2019 | 2018 | 2017 | ||||||||
Numerator: | |||||||||||
Net income attributable to Biogen Inc. | $ | $ | $ | ||||||||
Denominator: | |||||||||||
Weighted average number of common shares outstanding | |||||||||||
Effect of dilutive securities: | |||||||||||
Stock options and employee stock purchase plan | |||||||||||
Time-vested restricted stock units | |||||||||||
Market stock units | |||||||||||
Performance stock units settled in stock | |||||||||||
Dilutive potential common shares | |||||||||||
Shares used in calculating diluted earnings per share | |||||||||||
Amounts excluded from the calculation of net income per diluted share because their effects were anti-dilutive were insignificant.
F- 47
BIOGEN INC. AND SUBSIDIARIES
NOTES TO CONSOLIDATED FINANCIAL STATEMENTS — (Continued)
Earnings per share for the years ended December 31, 2019, 2018 and 2017, reflects, on a weighted average basis, the repurchase of approximately 23.6 million shares, 14.8 million shares and 3.7 million shares of our common stock, respectively, under our March 2019, 2018 and 2016 Share Repurchase Programs.
15. Share-Based Payments
Share-Based Compensation Expense
The following table summarizes share-based compensation expense included in our consolidated statements of income:
For the Years Ended December 31, | |||||||||||
(In millions) | 2019 | 2018 | 2017 | ||||||||
Research and development | $ | $ | $ | ||||||||
Selling, general and administrative | |||||||||||
Subtotal | |||||||||||
Capitalized share-based compensation costs | ( | ) | ( | ) | ( | ) | |||||
Share-based compensation expense included in total cost and expenses | |||||||||||
Income tax effect | ( | ) | ( | ) | ( | ) | |||||
Share-based compensation expense included in net income attributable to Biogen Inc. | $ | $ | $ | ||||||||
The following table summarizes share-based compensation expense associated with each of our share-based compensation programs:
For the Years Ended December 31, | |||||||||||
(In millions) | 2019 | 2018 | 2017 | ||||||||
Market stock units | $ | $ | $ | ||||||||
Time-vested restricted stock units | |||||||||||
Cash settled performance units | |||||||||||
Performance units | |||||||||||
Performance stock units settled in stock | |||||||||||
Performance stock units settled in cash | |||||||||||
Employee stock purchase plan | |||||||||||
NST stock options | |||||||||||
Subtotal | |||||||||||
Capitalized share-based compensation costs | ( | ) | ( | ) | ( | ) | |||||
Share-based compensation expense included in total cost and expenses | $ | $ | $ | ||||||||
As of December 31, 2019, unrecognized compensation cost related to unvested share-based compensation was approximately $210.4 million, net of estimated forfeitures. We expect to recognize the cost of these unvested awards over a weighted-average period of 1.9 years.
Share-Based Compensation Plans
We have three share-based compensation plans pursuant to which awards are currently being made: (i) the Biogen Inc. 2006 Non-Employee Directors Equity Plan (2006 Directors Plan); (ii) the Biogen Inc. 2017 Omnibus Equity Plan (2017 Omnibus Equity Plan); and (iii) the Biogen Inc. 2015 Employee Stock Purchase Plan (2015 ESPP).
Directors Plan
In May 2006 our shareholders approved the 2006 Directors Plan for share-based awards to our directors. Awards granted from the 2006 Directors Plan may include stock options, shares of restricted stock, RSUs, stock appreciation rights and other awards in such amounts and with such terms and conditions as may be determined by a committee of our Board of Directors, subject to the provisions of the 2006 Directors Plan. We have reserved a total of 1.6 million shares of common stock for issuance under the 2006 Directors Plan. The 2006 Directors Plan
F- 48
BIOGEN INC. AND SUBSIDIARIES
NOTES TO CONSOLIDATED FINANCIAL STATEMENTS — (Continued)
provides that awards other than stock options and stock appreciation rights will be counted against the total number of shares reserved under the plan in a 1.5-to-1 ratio. In June 2015 our shareholders approved an amendment to extend the term of the 2006 Directors Plan until June 2025.
Omnibus Plan
In June 2017 our shareholders approved the 2017 Omnibus Equity Plan for share-based awards to our employees. Awards granted from the 2017 Omnibus Equity Plan may include stock options, shares of restricted stock, RSUs, performance shares, stock appreciation rights and other awards in such amounts and with such terms and conditions as may be determined by a committee of our Board of Directors, subject to the provisions of the 2017 Omnibus Equity Plan. Shares of common stock available for grant under the 2017 Omnibus Equity Plan consist of 8.0 million shares reserved for this purpose, plus shares of common stock that remained available for grant under our 2008 Omnibus Equity Plan as of June 7, 2017, or that could again become available for grant if outstanding awards under the 2008 Omnibus Equity Plan as of June 7, 2017, are cancelled, surrendered or terminated in whole or in part. The 2017 Omnibus Equity Plan provides that awards other than stock options and stock appreciation rights will be counted against the total number of shares available under the plan in a 1.5-to-1 ratio.
We have not made any awards pursuant to the 2008 Omnibus Equity Plan since our shareholders approved the 2017 Omnibus Equity Plan, and do not intend to make any awards pursuant to the 2008 Omnibus Equity Plan in the future, except that unused shares under the 2008 Omnibus Equity Plan have been carried over for use under the 2017 Omnibus Equity Plan.
Stock Options
We currently do not grant stock options to our employees or directors. Outstanding stock options previously granted to our employees and directors generally have a 10-year term and vest over a period of between one and four years, provided the individual continues to serve at Biogen through the vesting dates. Options granted under all plans are exercisable at a price per share not less than the fair market value of the underlying common stock on the date of grant. As of December 31, 2019, all outstanding options were exercisable.
The following table summarizes our stock option activity:
Shares | Weighted Average Exercise Price | |||||
Outstanding at December 31, 2018 | $ | |||||
Granted | $ | |||||
Exercised | ( | ) | $ | |||
Cancelled | $ | |||||
Outstanding at December 31, 2019 | $ | |||||
The total intrinsic values of options exercised in 2019, 2018 and 2017 totaled $4.2 million, $4.0 million and $3.4 million, respectively. The aggregate intrinsic values of options outstanding as of December 31, 2019, totaled $2.9 million. The weighted average remaining contractual term for options outstanding as of December 31, 2019, was 0.2 years.
The following table summarizes the amount of tax benefit realized for stock options and cash received from the exercise of stock options:
For the Years Ended December 31, | |||||||||||
(In millions) | 2019 | 2018 | 2017 | ||||||||
Tax benefit realized for stock options | $ | $ | $ | ||||||||
Cash received from the exercise of stock options | $ | $ | $ | ||||||||
Market Stock Units (MSUs)
MSUs awarded to employees prior to 2014 vested in four equal annual increments beginning on the first anniversary of the grant date. Participants may ultimately earn between 0 % and 150 % of the target number of units granted based on actual stock performance.
F- 49
BIOGEN INC. AND SUBSIDIARIES
NOTES TO CONSOLIDATED FINANCIAL STATEMENTS — (Continued)
MSUs awarded to employees in 2014 and thereafter vest in three equal annual increments beginning on the first anniversary of the grant date, and participants may ultimately earn between 0 % and 200 % of the target number of units granted based on actual stock performance.
The vesting of these awards is subject to the respective employee’s continued employment. The number of MSUs granted represents the target number of units that are eligible to be earned based on the attainment of certain market-based criteria involving our stock price. The number of MSUs earned is calculated at each annual anniversary from the date of grant over the respective vesting periods, resulting in multiple performance periods. Accordingly, additional MSUs may be issued or currently outstanding MSUs may be cancelled upon final determination of the number of awards earned.
The following table summarizes our MSU activity:
Shares | Weighted Average Grant Date Fair Value | |||||
Unvested at December 31, 2018 | $ | |||||
Granted (a) | $ | |||||
Vested | ( | ) | $ | |||
Forfeited | ( | ) | $ | |||
Unvested at December 31, 2019 | $ | |||||
(a) | MSUs granted during 2019 include awards granted in conjunction with our annual awards made in February 2019 and MSUs granted in conjunction with the hiring of employees. These grants reflect the target number of shares eligible to be earned at the time of grant. MSUs granted in 2019 also reflect an adjustment based upon the final performance multiplier in relation to shares granted in 2018, 2017 and 2016. |
We value grants of MSUs using a lattice model with a Monte Carlo simulation. This valuation methodology utilizes several key assumptions, the 30 calendar day average closing stock price on the date of grant for MSUs, expected volatility of our stock price, risk-free rates of return and expected dividend yield.
The assumptions used in our valuation are summarized as follows:
For the Years Ended December 31, | |||||
2019 | 2018 | 2017 | |||
Expected dividend yield | |||||
Range of expected stock price volatility | 31.2% - 33.6% | 27.5% - 32.4% | 33.0% - 35.6% | ||
Range of risk-free interest rates | 2.46% - 2.53% | 1.9% - 2.3% | 0.9% - 1.6% | ||
30 calendar day average stock price on grant date | $228.59 - $331.18 | $279.47 - $346.76 | $263.18 - $267.88 | ||
Weighted-average per share grant date fair value | $ | $ | $ | ||
The fair values of MSUs vested in 2019, 2018 and 2017 totaled $32.5 million, $26.9 million and $31.4 million, respectively.
Cash Settled Performance Units (CSPUs)
CSPUs awarded to employees vest in three equal annual increments beginning on the first anniversary of the grant date. The vesting of these awards is subject to the respective employee’s continued employment with such awards settled in cash. The number of CSPUs granted represents the target number of units that are eligible to be earned based on the attainment of certain performance measures established at the beginning of the performance period, which ends on December 31 of each year. Participants may ultimately earn between 0 % and 200 % of the target number of units granted based on the degree of actual performance metric achievement. Accordingly, additional CSPUs may be issued or currently outstanding CSPUs may be cancelled upon final determination of the number of units earned. CSPUs are classified as liability awards and will be settled in cash based on the 30 calendar day average closing stock price through each vesting date, once the actual vested and earned number of units is known. Since no shares are issued, these awards do not dilute equity.
F- 50
BIOGEN INC. AND SUBSIDIARIES
NOTES TO CONSOLIDATED FINANCIAL STATEMENTS — (Continued)
The following table summarizes our CSPU activity:
Shares | ||
Unvested at December 31, 2018 | ||
Granted | ||
Vested | ( | ) |
Forfeited | ( | ) |
Unvested at December 31, 2019 | ||
The cash paid in settlement of CSPUs vested in 2019, 2018 and 2017 totaled $10.6 million, $15.1 million and $16.6 million, respectively.
Performance-vested Restricted Stock Units (PUs)
PUs are granted to certain employees in the form of RSUs that may be settled in cash or shares of our common stock at the sole discretion of the Compensation and Management Development Committee of our Board of Directors. These awards are structured and accounted for the same way as the CSPUs, and vest in three equal annual increments beginning on the first anniversary of the grant date. The number of PUs granted represents the target number of units that are eligible to be earned based on the attainment of certain performance measures established at the beginning of the performance period, which ends on December 31 of each year. Participants may ultimately earn between 0 % and 200 % of the target number of units granted based on the degree of actual performance metric achievement. Accordingly, additional PUs may be issued or currently outstanding PUs may be cancelled upon final determination of the number of units earned. PUs settling in cash are based on the 30 calendar day average closing stock price through each vesting date once the actual vested and earned number of units is known.
The following table summarizes our PU activity:
Shares | ||
Unvested at December 31, 2018 | ||
Granted | ||
Vested | ( | ) |
Forfeited | ( | ) |
Unvested at December 31, 2019 | ||
All PUs that vested in 2019, 2018 and 2017 were settled in cash totaling $10.4 million, $17.0 million and $11.5 million, respectively.
Performance Stock Units (PSUs)
PSUs Settled in Stock
During the first quarter of 2018 we began granting awards for performance-vested RSUs that will settle in stock. PSUs awarded to employees have a three-year performance period and vest on the third anniversary of the grant date. The vesting of these awards is subject to the respective employee’s continued employment. The number of PSUs granted represents the target number of units that are eligible to be earned based on the achievement of cumulative three-year performance measures established at the beginning of the performance period, which ends on December 31 of the third year of the performance period.
Participants may ultimately earn between 0 % and 200 % of the target number of PSUs granted based on the degree of achievement of the applicable performance metric. Accordingly, additional PSUs may be issued or currently outstanding PSUs may be cancelled upon final determination of the number of units earned.
F- 51
BIOGEN INC. AND SUBSIDIARIES
NOTES TO CONSOLIDATED FINANCIAL STATEMENTS — (Continued)
The following table summarizes our PSUs that settle in stock activity:
Shares | Weighted Average Grant Date Fair Value | |||||
Unvested at December 31, 2018 | $ | |||||
Granted (a) | $ | |||||
Vested | $ | |||||
Forfeited | ( | ) | $ | |||
Unvested at December 31, 2019 | $ | |||||
(a) | PSUs settled in stock granted in 2019 include awards granted in conjunction with our annual awards made in February 2019 and PSUs granted in conjunction with the hiring of employees. These grants reflect the target number of shares eligible to be earned at the time of grant. |
PSUs Settled in Cash
During the first quarter of 2018 we began granting awards for performance-vested restricted stock units that will settle in cash. PSUs awarded to employees have three performance periods and vest on the third anniversary of the grant date. The vesting of these awards is subject to the respective employee’s continued employment. The number of PSUs granted represents the target number of units that are eligible to be earned based on the achievement of three annual performance measures established when the performance objectives are defined, which will be at the beginning of each year and will end on December 31 of such year.
Participants may ultimately earn between 0 % and 200 % of the target number of PSUs granted based on the degree of achievement of the applicable performance metric. Accordingly, additional PSUs may be issued or currently outstanding PSUs may be cancelled upon final determination of the number of units earned. PSUs are classified as liability awards and will be settled in cash based on the 30 calendar day average closing stock price through the vesting date, once the actual vested and earned number of PSUs is determined. Since no shares are issued, these awards do not dilute equity.
The following table summarizes our PSUs that settle in cash activity:
Shares | ||
Unvested at December 31, 2018 | ||
Granted (a) | ||
Vested | ( | ) |
Forfeited | ( | ) |
Unvested at December 31, 2019 | ||
(a) | PSUs settled in cash granted in 2019 include awards granted in conjunction with our annual awards made in February 2019 and PSUs granted in conjunction with the hiring of employees. These grants reflect the target number of shares eligible to be earned at the time of grant. |
Time-Vested Restricted Stock Units (RSUs)
RSUs awarded to employees generally vest no sooner than one-third per year over three years on the anniversary of the date of grant, or upon the third anniversary of the date of the grant, provided the employee remains continuously employed with us, except as otherwise provided in the plan. Shares of our common stock will be delivered to the employee upon vesting, subject to payment of applicable withholding taxes. RSUs awarded to directors for service on our Board of Directors vest on the first anniversary of the date of grant, provided in each case that the director continues to serve on our Board of Directors through the vesting date. Shares of our common stock will be delivered to the director upon vesting and are not subject to any withholding taxes.
F- 52
BIOGEN INC. AND SUBSIDIARIES
NOTES TO CONSOLIDATED FINANCIAL STATEMENTS — (Continued)
The following table summarizes our RSU activity:
Shares | Weighted Average Grant Date Fair Value | |||||
Unvested at December 31, 2018 | $ | |||||
Granted (a) | $ | |||||
Vested | ( | ) | $ | |||
Forfeited | ( | ) | $ | |||
Unvested at December 31, 2019 | $ | |||||
(a) | RSUs granted in 2019 primarily represent RSUs granted in conjunction with our annual awards made in February 2019 and awards made in conjunction with the hiring of new employees. RSUs granted in 2019 also include approximately |
RSUs granted in 2018 and 2017 had weighted average grant date fair values of $316.32 and $293.41 , respectively.
The fair values of RSUs vested in 2019, 2018 and 2017 totaled $131.5 million, $111.7 million and $100.0 million, respectively.
Employee Stock Purchase Plan (ESPP)
In June 2015 our shareholders approved the 2015 ESPP. The maximum aggregate number of shares of our common stock that may be purchased under the 2015 ESPP is 6.2 million.
The following table summarizes our ESPP activity:
For the Years Ended December 31, | |||||||||||
(In millions, except share amounts) | 2019 | 2018 | 2017 | ||||||||
Shares issued under the 2015 ESPP | |||||||||||
Cash received under the 2015 ESPP | $ | $ | $ | ||||||||
16. Income Taxes
Income Tax Expense
Income before income tax provision and the income tax expense consist of the following:
For the Years Ended December 31, | |||||||||||
(In millions) | 2019 | 2018 | 2017 | ||||||||
Income before income taxes (benefit): | |||||||||||
Domestic | $ | $ | $ | ||||||||
Foreign | |||||||||||
Total | $ | $ | $ | ||||||||
Income tax expense (benefit): | |||||||||||
Current: | |||||||||||
Federal | $ | $ | $ | ||||||||
State | |||||||||||
Foreign | |||||||||||
Total | |||||||||||
Deferred: | |||||||||||
Federal | $ | $ | ( | ) | $ | ||||||
State | ( | ) | ( | ) | |||||||
Foreign | ( | ) | ( | ) | |||||||
Total | |||||||||||
Total income tax expense | $ | $ | $ | ||||||||
F- 53
BIOGEN INC. AND SUBSIDIARIES
NOTES TO CONSOLIDATED FINANCIAL STATEMENTS — (Continued)
2017 Tax Act
The Tax Cuts and Jobs Act of 2017 (2017 Tax Act) resulted in significant changes to the U.S. corporate income tax system. These changes include a federal statutory rate reduction from 35 % to 21 %, the elimination or reduction of certain domestic deductions and credits and limitations on the deductibility of interest expense and executive compensation. The 2017 Tax Act also transitions international taxation from a worldwide system to a modified territorial system, which has the effect of subjecting certain earnings of our foreign subsidiaries and collaborations to immediate U.S. taxation as GILTI or Subpart F income, and includes base erosion prevention measures on U.S. earnings and the reduced effective tax rate on income that comes from U.S. exports, called Foreign Derived Intangible Income. These changes became effective in 2018.
During the fourth quarter of 2017 we recognized within our provision for income taxes a $1.2 billion estimate pursuant to the U.S. Securities and Exchange Commission Staff Accounting Bulletin No. 118. Our estimate included an amount of $989.6 million associated with a one-time mandatory deemed repatriation tax on accumulated foreign subsidiaries' previously untaxed foreign earnings (the Transition Toll Tax), as discussed below, and $184.0 million related to the impact of remeasuring our deferred tax balances to reflect the new federal statutory rate and other changes to U.S. tax law.
During the year ended December 31, 2018, we recognized a net reduction of $34.6 million in our estimated Transition Toll Tax, an expense of $12.7 million to remeasure our deferred tax balances, an expense of $135.8 million related to establishing deferred taxes for GILTI and an expense of $11.0 million to reflect other aspects of the 2017 Tax Act.
Transition Toll Tax
The 2017 Tax Act eliminated the deferral of U.S. income tax on the historical unrepatriated earnings by imposing the Transition Toll Tax. The Transition Toll Tax was assessed on our share of our foreign corporations' accumulated foreign earnings that were not previously taxed. Earnings in the form of cash and cash equivalents were taxed at a rate of 15.5 % and all other earnings were taxed at a rate of 8.0 %.
As of December 31, 2019 and 2018, we have accrued income tax liabilities of $697.0 million under the Transition Toll Tax. Of the amounts accrued as of December 31, 2019, no amounts are expected to be paid within one year due to an approximately $87.0 million carryforward of taxes paid in relation to the company's 2017 tax return. The Transition Toll Tax will be paid over an eight--year period, which started in 2018, and does not accrue interest.
Unremitted Earnings
At December 31, 2019, we considered our earnings not to be permanently reinvested outside the U.S. and therefore recorded deferred tax liabilities associated with an estimate of the total withholding taxes expected as a result of our repatriation of earnings. Other than for earnings, we are permanently reinvested for book/tax basis differences of approximately $1.5 billion as of December 31, 2019, primarily arising through the impacts of purchase accounting. These permanently reinvested basis differences could reverse through sales of the foreign subsidiaries, as well as various other events, none of which were considered probable as of December 31, 2019. The residual U.S. tax liability, if these differences reverse, would be between $0.3 billion and $0.4 billion as of December 31, 2019.
Article 20 Procedure of ZINBRYTA
In 2017 the European Medicines Agency initiated a review (referred to as an Article 20 Procedure) of ZINBRYTA following the report of a case of fatal fulminant liver failure, as well as four cases of serious liver injury. As a result of the Article 20 Procedure of ZINBRYTA, for the year ended December 31, 2017, we recognized a net impairment charge on certain tax assets related to ZINBRYTA reflected within income tax expense of $48.8 million. This charge reflected the write-off of $142.6 million related to prepaid taxes, which was partially offset by the recognition of an unrecorded deferred tax benefit of $93.8 million. For additional information on our collaboration arrangement with AbbVie, please read Note 18, Collaborative and Other Relationships, to these consolidated financial statements.
F- 54
BIOGEN INC. AND SUBSIDIARIES
NOTES TO CONSOLIDATED FINANCIAL STATEMENTS — (Continued)
Deferred Tax Assets and Liabilities
Significant components of our deferred tax assets and liabilities are summarized as follows:
As of December 31, | |||||||
(In millions) | 2019 | 2018 | |||||
Deferred tax assets: | |||||||
Tax credits | $ | $ | |||||
Inventory, other reserves and accruals | |||||||
Intangibles, net | |||||||
Net operating loss | |||||||
Share-based compensation | |||||||
Other | |||||||
Valuation allowance | ( | ) | ( | ) | |||
Total deferred tax assets | $ | $ | |||||
Deferred tax liabilities: | |||||||
Purchased intangible assets | $ | ( | ) | $ | ( | ) | |
GILTI | ( | ) | ( | ) | |||
Tax credits | ( | ) | ( | ) | |||
Depreciation, amortization and other | ( | ) | ( | ) | |||
Total deferred tax liabilities | $ | ( | ) | $ | ( | ) | |
In addition to deferred tax assets and liabilities, we have recorded prepaid tax and deferred charges related to intra-entity sales of inventory. As of December 31, 2019 and 2018, the total deferred charges and prepaid taxes were $243.8 million and $239.2 million, respectively.
Tax Rate
A reconciliation between the U.S. federal statutory tax rate and our effective tax rate is summarized as follows:
For the Years Ended December 31, | ||||||||
2019 | 2018 | 2017 | ||||||
Statutory rate | % | % | % | |||||
State taxes | ||||||||
Taxes on foreign earnings | ( | ) | ( | ) | ( | ) | ||
Credits and net operating loss utilization | ( | ) | ( | ) | ( | ) | ||
Purchased intangible assets | ||||||||
Divestiture of Denmark manufacturing operations | ||||||||
Internal reorganization of certain intellectual property rights | ( | ) | ||||||
GILTI | ||||||||
Other permanent items | ||||||||
U.S. tax reform | ||||||||
Swiss tax reform | ( | ) | ||||||
Manufacturing deduction | ( | ) | ||||||
Impairment of ZINBRYTA related tax assets | ||||||||
Other | ( | ) | ||||||
Effective tax rate | % | % | % | |||||
Changes in Tax Rate
For the year ended December 31, 2019, as compared to 2018, the decrease in our effective tax rate was primarily due to the combination of the internal reorganization of certain intellectual property rights and the impact of the enactment of a new taxing regime in the country and certain cantons of Switzerland. This decrease was partially offset by a $68.9 million tax expense related to the divestiture of our subsidiary that owned our Hillerød, Denmark manufacturing operations. We also had a higher effective tax rate in 2018 resulting from the unfavorable effects of
F- 55
BIOGEN INC. AND SUBSIDIARIES
NOTES TO CONSOLIDATED FINANCIAL STATEMENTS — (Continued)
the 2017 Tax Act and our sale of inventory, the tax effect of which had been included within prepaid taxes at January 1, 2018, at a higher effective tax rate than the 2018 statutory tax rate.
Although we are recognizing a loss on the divestiture of our Hillerød, Denmark manufacturing operations, the divestiture required us to write-off certain deferred tax assets and resulted in a taxable gain in certain jurisdictions.
As a result of the internal reorganization of certain intellectual property rights, we recorded a deferred tax asset of $754.1 million and a deferred tax liability of $603.3 million as of December 31, 2019.
For the year ended December 31, 2018, as compared to 2017, the decrease in our effective tax rate was primarily due to the enactment of the 2017 Tax Act. The effects of an overall reduction in the federal statutory rate in the U.S. were partially offset by the elimination of the manufacturing deduction, the imposition of the GILTI tax on international earnings, our recording of deferred taxes on GILTI in 2018, limits on the deductibility of certain benefits on executive compensation and a reduction in the tax benefit associated with the Orphan Drug Credit, all resulting from the 2017 Tax Act, and a change in accounting rules related to recording the tax impacts of intra-entity transactions.
Tax Attributes
As of December 31, 2019, we had net operating losses and general business credit carry forwards for federal income tax purposes of approximately $0.7 million and $1.3 million, respectively, which begin to expire in 2022. Additionally, for state income tax purposes, we had net operating loss carry forwards of approximately $4.6 million that begin to expire in 2020. For state income tax purposes, we had research and investment credit carry forwards of approximately $133.8 million that begin to expire in 2020. For foreign income tax purposes, we had $1,773.8 million of net operating loss carryforwards that begin to expire in 2025.
In assessing the realizability of our deferred tax assets, we have considered whether it is more likely than not that some portion or all of the deferred tax assets will not be realized. The ultimate realization of deferred tax assets is dependent upon the generation of future taxable income during the periods in which those temporary differences become deductible. In making this determination, under the applicable financial reporting standards, we are allowed to consider the scheduled reversal of deferred tax liabilities, projected future taxable income and tax planning strategies. Based upon the level of historical taxable income and income tax liability and projections for future taxable income over the periods in which the deferred tax assets are utilizable, we believe it is more likely than not that we will realize the net benefits of the deferred tax assets of our wholly owned subsidiaries. In the event that actual results differ from our estimates or we adjust our estimates in future periods, we may need to establish a valuation allowance, which could materially impact our consolidated financial position and results of operations.
Accounting for Uncertainty in Income Taxes
A reconciliation of the beginning and ending amount of our unrecognized tax benefits is summarized as follows:
For the Years Ended December 31, | |||||||||||
(In millions) | 2019 | 2018 | 2017 | ||||||||
Balance at January 1, | $ | $ | $ | ||||||||
Additions based on tax positions related to the current period | |||||||||||
Additions for tax positions of prior periods | |||||||||||
Reductions for tax positions of prior periods | ( | ) | ( | ) | ( | ) | |||||
Statute expirations | ( | ) | ( | ) | ( | ) | |||||
Settlement refund (payment) | |||||||||||
Balance at December 31, | $ | $ | $ | ||||||||
Our 2017 activity reflects a refund received from a state related to the settlement of an uncertain tax position.
We and our subsidiaries are routinely examined by various taxing authorities. We file income tax returns in various U.S. states and in U.S. federal and other foreign jurisdictions. With few exceptions, we are no longer subject to U.S. federal tax examination for years before 2013 or state, local or non-U.S. income tax examinations for years before 2012.
The U.S. Internal Revenue Service and other national tax authorities routinely examine our intercompany transfer pricing with respect to intellectual property related transactions and it is possible that they may disagree with one or more positions we have taken with respect to such valuations.
F- 56
BIOGEN INC. AND SUBSIDIARIES
NOTES TO CONSOLIDATED FINANCIAL STATEMENTS — (Continued)
Included in the balance of unrecognized tax benefits as of December 31, 2019, 2018 and 2017, are $122.7 million, $109.1 million and $64.3 million (net of the federal benefit on state issues), respectively, of unrecognized tax benefits that, if recognized, would affect the effective income tax rate in future periods.
We recognize potential interest and penalties related to unrecognized tax benefits in income tax expense. In 2019, 2018 and 2017 we recognized a net interest expense of $4.7 million, $2.2 million and $4.8 million, respectively. We have accrued $20.0 million and $13.8 million for the payment of interest and penalties as of December 31, 2019 and 2018, respectively.
Accounting for Uncertainty in Income Taxes
On February 1, 2017, in connection with the spin-off of our hemophilia business, we distributed all of the then outstanding shares of Bioverativ common stock to Biogen shareholders pursuant to a separation agreement. In March 2018 Bioverativ was acquired by Sanofi S.A. (Sanofi) and is now an indirect wholly-owned subsidiary of Sanofi. The spin-off of our hemophilia business was intended to qualify for tax-free treatment to Biogen and its shareholders under the Internal Revenue Code. Our 2017 tax return remains open to audit. Bioverativ and Sanofi agreed to indemnify us for certain potential liabilities that may arise.
Federal and State Uncertain Tax Positions
It is reasonably possible that we will adjust the value of our uncertain tax positions related to certain transfer pricing, collaboration matters and other issues as we receive additional information from various taxing authorities, including reaching settlements with such authorities.
We estimate that it is reasonably possible that our gross unrecognized tax benefits, exclusive of interest, could decrease by up to approximately $75.0 million in the next 12 months as a result of various audit closures, settlements and expiration of the statute of limitations.
17. Other Consolidated Financial Statement Detail
Supplemental Cash Flow Information
Supplemental disclosure of cash flow information for the years ended December 31, 2019, 2018 and 2017, is as follows:
For the Years Ended December 31, | |||||||||||
(In millions) | 2019 | 2018 | 2017 | ||||||||
Cash paid during the year for: | |||||||||||
Interest | $ | $ | $ | ||||||||
Income taxes | $ | $ | $ | ||||||||
Non-cash Operating, Investing and Financing Activity
In the fourth quarter of 2018 we accrued $300.0 million upon reaching $20.0 billion in total cumulative sales of the Fumapharm Products, which was paid in the first quarter of 2019. In the fourth quarter of 2017 we accrued $600.0 million upon reaching $15.0 billion and $16.0 billion in total cumulative sales of the Fumapharm Products, which was paid in the first quarter of 2018. These amounts, net of tax benefit, were accounted for as increases to goodwill in accordance with the accounting standard applicable to business combinations when we acquired Fumapharm AG.
In connection with the construction of our large-scale biologics manufacturing facility in Solothurn, Switzerland, we accrued charges related to processing equipment and engineering services of approximately $50.0 million and $100.0 million in our consolidated balance sheets as of December 31, 2019 and 2018, respectively. For additional information on the construction of our manufacturing facility in Solothurn, Switzerland, please read Note 10, Property, Plant and Equipment, to these consolidated financial statements.
F- 57
BIOGEN INC. AND SUBSIDIARIES
NOTES TO CONSOLIDATED FINANCIAL STATEMENTS — (Continued)
Other Income (Expense), Net
Components of other income (expense), net, are summarized as follows:
For the Years Ended December 31, | |||||||||||
(In millions) | 2019 | 2018 | 2017 | ||||||||
Interest income | $ | $ | $ | ||||||||
Interest expense | ( | ) | ( | ) | ( | ) | |||||
Gain (loss) on investments, net | ( | ) | |||||||||
Foreign exchange gains (losses), net | ( | ) | ( | ) | |||||||
Other, net | ( | ) | ( | ) | ( | ) | |||||
Total other income (expense), net | $ | $ | $ | ( | ) | ||||||
Gain (loss) on investments, net, as reflected in the table above, relate to debt securities, equity securities of certain biotechnology companies, venture capital funds where the underlying investments are in equity securities of certain biotechnology companies and non-marketable equity securities.
The following table summarizes our gain (loss) on investments, net that relates to our equity securities held as of December 31, 2019, 2018 and 2017:
For the Years Ended December 31, | |||||||||||
(In millions) | 2019 | 2018 | 2017 | ||||||||
Net gains (losses) recognized during the period on equity securities | $ | $ | $ | ( | ) | ||||||
Less: Net gains (losses) recognized during the period on equity securities sold during the period | $ | $ | ( | ) | $ | ||||||
Unrealized gains (losses) recognized during the period on equity securities held as of December 31 | $ | $ | $ | ( | ) | ||||||
Accrued Expenses and Other
Accrued expenses and other consists of the following:
As of December 31, | |||||||
(In millions) | 2019 | 2018 | |||||
Revenue-related reserves for discounts and allowances | $ | $ | |||||
Employee compensation and benefits | |||||||
Collaboration expenses | |||||||
Royalties and licensing fees | |||||||
Current portion of contingent consideration obligations | |||||||
Construction in progress | |||||||
Other | |||||||
Total accrued expenses and other | $ | $ | |||||
Other Long-term Liabilities
Other long-term liabilities were $1,348.9 million and $1,389.4 million as of December 31, 2019 and 2018, respectively, and include accrued income taxes totaling $803.3 million and $791.4 million, respectively.
18. Collaborative and Other Relationships
In connection with our business strategy, we have entered into various collaboration agreements that provide us with rights to develop, produce and market products using certain know-how, technology and patent rights maintained by our collaborative partners. Terms of the various collaboration agreements may require us to make milestone payments upon the achievement of certain product research and development objectives and pay royalties on future sales, if any, of commercial products resulting from the collaboration.
F- 58
BIOGEN INC. AND SUBSIDIARIES
NOTES TO CONSOLIDATED FINANCIAL STATEMENTS — (Continued)
Depending on the collaborative arrangement, we may record funding receivable or payable balances with our collaboration partners, based on the nature of the cost-sharing mechanism and activity within the collaboration. Our significant collaborative arrangements are discussed below.
Genentech, Inc. (Roche Group)
We have certain business and financial rights with respect to RITUXAN for the treatment of non-Hodgkin's lymphoma, CLL and other conditions; RITUXAN HYCELA for the treatment of non-Hodgkin's lymphoma and CLL; GAZYVA for the treatment of CLL and follicular lymphoma; OCREVUS for the treatment of PPMS and RMS; and other potential anti-CD20 therapies pursuant to our collaboration arrangements with Genentech, a wholly-owned member of the Roche Group. For purposes of this footnote we refer to RITUXAN and RITUXAN HYCELA collectively as RITUXAN.
Our collaboration arrangements will continue in effect until we mutually agree to terminate the collaboration, except that if we undergo a change in control, as defined in our collaboration agreement, Genentech has the right to present an offer to buy the rights to RITUXAN and we must either accept Genentech’s offer or purchase Genentech’s rights on the same terms as its offer. Genentech will also be deemed concurrently to have purchased our rights to any other anti-CD20 products in development in exchange for a royalty and our rights to GAZYVA in exchange for the compensation described in the table below. Our collaboration with Genentech was created through a contractual arrangement and not through a joint venture or other legal entity.
RITUXAN
Genentech and its affiliates are responsible for the worldwide manufacture of RITUXAN, as well as all development and commercialization activities as follows:
U.S.
We have co-exclusively licensed our rights to develop, commercialize and market RITUXAN in the U.S.
Canada
We have co-exclusively licensed our rights to develop, commercialize and market RITUXAN in Canada.
GAZYVA
The Roche Group and its sub-licensees maintain sole responsibility for the development, manufacture and commercialization of GAZYVA in the U.S. We recognize our share of the development and commercialization expenses of GAZYVA as a reduction of our share of pre-tax profits in revenues from anti-CD20 therapeutic programs.
Commercialization of GAZYVA impacts our percentage of the co-promotion profits for RITUXAN, as summarized in the table below.
OCREVUS
In March 2017 the FDA approved OCREVUS for the treatment of RMS and PPMS. Pursuant to the terms of our collaboration arrangements with Genentech, we receive a tiered royalty on U.S. net sales from 13.5 % and increasing up to 24 % if annual net sales exceed $900.0 million. There will be a 50 % reduction to these royalties if a biosimilar to OCREVUS is approved in the U.S.
In addition, we receive a gross 3 % royalty on net sales of OCREVUS outside the U.S., with the royalty period lasting 11 years from the first commercial sale of OCREVUS on a country-by-country basis. OCREVUS has been approved for the treatment of RMS and PPMS in the E.U. and certain other countries.
The commercialization of OCREVUS does not impact the percentage of the co-promotion profits we receive for RITUXAN or GAZYVA. Genentech is solely responsible for development and commercialization of OCREVUS and funding future costs. Genentech cannot develop OCREVUS in CLL, non-Hodgkin's lymphoma or rheumatoid arthritis. OCREVUS royalty revenues were based on our estimates from third party and market research data of OCREVUS sales occurring during the corresponding period. Differences between actual and estimated royalty revenues will be adjusted for in the period in which they become known, which is expected to be the following quarter.
F- 59
BIOGEN INC. AND SUBSIDIARIES
NOTES TO CONSOLIDATED FINANCIAL STATEMENTS — (Continued)
Profit-sharing Formulas
RITUXAN Profit Share
Our current pretax co-promotion profit-sharing formula for RITUXAN provides for a 30 % share on the first $50.0 million of co-promotion operating profits earned each calendar year. Our share of annual co-promotion profits in excess of $50.0 million varies, as summarized in the table below, upon the following events:
Until GAZYVA First Non-CLL FDA Approval | % | |
After GAZYVA First Non-CLL FDA Approval until First GAZYVA Threshold Date | % | |
After First GAZYVA Threshold Date until Second GAZYVA Threshold Date | % | |
After Second GAZYVA Threshold Date | % | |
First Non-CLL GAZYVA FDA Approval means the FDA’s first approval of GAZYVA in an indication other than CLL.
First GAZYVA Threshold Date means the earlier of (i) the date of the First Non-CLL GAZYVA FDA approval if U.S. gross sales of GAZYVA for the preceding consecutive 12-month period were at least $150.0 million or (ii) the first day of the calendar quarter after the date of the First Non-CLL GAZYVA FDA Approval that U.S. gross sales of GAZYVA within any consecutive 12-month period have reached $150.0 million.
Second GAZYVA Threshold Date means the first day of the calendar quarter after U.S. gross sales of GAZYVA within any consecutive 12-month period have reached $500.0 million. The Second GAZYVA Threshold Date can be achieved regardless of whether GAZYVA has been approved in a non-CLL indication.
In addition, should the FDA approve an anti-CD20 product other than OCREVUS or GAZYVA that is acquired or developed by Genentech and subject to the collaboration agreement, our share of the co-promotion operating profits would be between 30 % and 37.5 % based on certain events.
GAZYVA Profit Share
Our current pretax profit-sharing formula for GAZYVA provides for a 35 % share on the first $50.0 million of operating profits earned each calendar year. Our share of annual profits in excess of $50.0 million varies, as summarized in the table below, upon the following events:
Until First GAZYVA Threshold Date | % | |
After First GAZYVA Threshold Date until Second GAZYVA Threshold Date | % | |
After Second GAZYVA Threshold Date | % | |
Our share of GAZYVA operating profits in 2019 and 2018 was 37.5 %. In 2017 our share of operating profits on GAZYVA was 35 %.
In November 2017 the FDA approved GAZYVA in combination with chemotherapy, followed by GAZYVA alone, for people with previously untreated advanced follicular lymphoma.
Revenues from Anti-CD20 Therapeutic Programs
Revenues from anti-CD20 therapeutic programs are summarized as follows:
For the Years Ended December 31, | |||||||||||
(In millions) | 2019 | 2018 | 2017 | ||||||||
Biogen's share of pre-tax profits in the U.S. for RITUXAN and GAZYVA, including the reimbursement of selling and development expenses | $ | $ | $ | ||||||||
Other revenues from anti-CD20 therapeutic programs | |||||||||||
Total revenues from anti-CD20 therapeutic programs | $ | $ | $ | ||||||||
F- 60
BIOGEN INC. AND SUBSIDIARIES
NOTES TO CONSOLIDATED FINANCIAL STATEMENTS — (Continued)
Prior to regulatory approval, we record our share of the expenses incurred by the collaboration for the development of anti-CD20 products in research and development expense in our consolidated statements of income. After an anti-CD20 product is approved, we record our share of the development expenses related to that product as a reduction of our share of pre-tax profits in revenues from anti-CD20 therapeutic programs.
Ionis Pharmaceuticals, Inc.
SPINRAZA
In January 2012 we entered into a collaboration and license agreement with Ionis pursuant to which we have an exclusive, worldwide license to develop and commercialize SPINRAZA for the treatment of SMA. SPINRAZA was approved for the treatment of SMA in the U.S., E.U. and Japan in December 2016, June 2017 and July 2017, respectively.
For the years ended December 31, 2019, 2018 and 2017, we recognized product revenues of $2,097.0 million, $1,724.2 million and $883.7 million, respectively, on our sales of SPINRAZA. Under our agreement with Ionis, we make royalty payments to Ionis on annual worldwide net sales of SPINRAZA using a tiered royalty rate between 11 % and 15 %, which are recognized in cost of sales within our consolidated statements of income. Royalty cost of sales related to sales of SPINRAZA for the years ended December 31, 2019, 2018 and 2017, totaled $293.0 million, $238.0 million and $112.4 million, respectively.
During 2017 we made milestone payments to Ionis totaling $150.0 million related to the marketing approvals discussed above, which were capitalized in intangible assets, net in our consolidated balance sheets.
Antisense Therapeutics
In December 2012 we entered into an agreement with Ionis for the development and commercialization of up to three gene targets.
Under this agreement, Ionis is responsible for global development of any product candidate through the completion of a Phase 2 trial and we will provide advice on the clinical trial design and regulatory strategy. We have an option to license the product candidate until completion of the Phase 2 trial. If we exercise our option, we will pay a license fee of up to $70.0 million to Ionis and assume global development, regulatory and commercialization responsibilities. Ionis is eligible to receive up to $130.0 million in additional milestone payments upon the achievement of certain regulatory milestones as well as royalties on future sales if we successfully develop the product candidate after option exercise.
Upon entering into this agreement, we made an upfront payment of $30.0 million to Ionis and agreed to make potential additional payments, prior to licensing, of up to $10.0 million based on the development of the selected product candidate as well as a mark-up of the cost estimate of the Phase 1 and Phase 2 trials. During 2015 we recognized this $10.0 million developmental milestone upon the selection of BIIB080 (tau ASO), which is currently in Phase 1 development for the potential treatment of AD.
In December 2019 we exercised our option with Ionis and obtained a worldwide, exclusive, royalty-bearing license to develop and commercialize BIIB080. In connection with the option exercise, we made a payment of $45.0 million to Ionis, which was recorded as research and development expense in our consolidated statements of income. Future payments may include additional milestone payments of up to $155.0 million and royalties on future sales of in the low- to mid-teens if we successfully develop the product candidate after option exercise.
2018 Ionis Agreement
In June 2018 we closed a 10 -year exclusive collaboration agreement with Ionis to develop novel antisense oligonucleotide (ASO) drug candidates for a broad range of neurological diseases (2018 Ionis Agreement) for a total payment of $1.0 billion, consisting of an upfront payment of $375.0 million and the purchase of approximately 11.5 million shares of Ionis common stock at a cost of $625.0 million.
Upon closing, we recorded $50.9 million of the $375.0 million upfront payment as prepaid services in our consolidated balance sheets and recognized the remaining $324.1 million as research and development expense in our consolidated statements of income. The amount recorded as prepaid services represented the value of the employee resources committed to the arrangement to provide research and discovery services over the term of the agreement.
F- 61
BIOGEN INC. AND SUBSIDIARIES
NOTES TO CONSOLIDATED FINANCIAL STATEMENTS — (Continued)
The 11.5 million shares of Ionis common stock were purchased at a premium to their fair value at the transaction closing date. The premium consisted of acquiring the shares at a price above the fair value based on the trailing 10-day weighted-average close price prior to entering into the 2018 Ionis Agreement in April 2018 and the effect of certain holding period restrictions. We recorded an asset of $462.9 million in investments and other assets in our consolidated balance sheets reflecting the fair value of the common stock as of the purchase date and a charge of $162.1 million to research and development expense in our consolidated statements of income in the second quarter of 2018 reflecting the premium paid for the common stock.
Our investment in Ionis common stock is remeasured each reporting period. Changes in the fair value of our investment in Ionis common stock, including the effect of the holding period restrictions, are reflected in other income (expense), net in our consolidated statements of income. For additional information on the fair value of our investment in Ionis common stock, please read Note 7, Fair Value Measurements, to these consolidated financial statements.
We have the option to license therapies arising out of this agreement and will be responsible for the development and commercialization of such therapies. We may pay development milestones to Ionis of up to $125.0 million or $270.0 million for each program, depending on the indication plus an annual license fee, as well as royalties on potential net commercial sales.
During the year ended December 31, 2019, we incurred milestones of $30.0 million related to the advancement of neurological targets identified under this agreement.
2017 SMA Collaboration Agreement
In December 2017 we entered into a collaboration agreement with Ionis to identify new ASO drug candidates for the potential treatment of SMA. Under this agreement, we have the option to license therapies arising out of this collaboration and will be responsible for their development and commercialization of such therapies.
Upon entering into this agreement, we made a $25.0 million upfront payment to Ionis and we may pay Ionis up to $260.0 million in additional development and regulatory milestone payments if new drug candidates advance to marketing approval. Upon commercialization, we may also pay Ionis up to $800.0 million in additional performance-based milestone payments and tiered royalties on potential net sales of such therapies.
2013 Long-term Strategic Research Agreement
In September 2013 we entered into a six -year research collaboration agreement with Ionis under which both companies collaborate to perform discovery level research and subsequent development and commercialization activities of antisense or other therapeutics for the potential treatment of neurological diseases. Under this agreement, Ionis performs research on a set of neurological targets identified within the agreement.
Ionis is eligible to receive milestone payments, license fees and royalty payments for all product candidates developed through this collaboration, with the specific amount dependent upon the modality of the product candidate advanced by us under the terms of the agreement.
For non-ALS antisense product candidates, Ionis is responsible for global development through the completion of a Phase 2 trial and we provide advice on the clinical trial design and regulatory strategy. For ALS antisense product candidates, we are responsible for global development, clinical trial design and regulatory strategy. We have an option to license a product candidate until completion of the Phase 2 trial. If we exercise our option, we will pay Ionis up to a $70.0 million license fee and assume global development, regulatory and commercialization responsibilities. Ionis could receive additional milestone payments upon the achievement of certain regulatory milestones of up to $130.0 million, plus additional amounts related to the cost of clinical trials conducted by Ionis under the collaboration, and royalties on future sales if we successfully develop the product candidate after option exercise.
In December 2018 we exercised our option with Ionis and obtained a worldwide, exclusive, royalty-bearing license to develop and commercialize BIIB067 (tofersen), an investigational treatment for ALS with superoxide dismutase 1 (SOD1) mutations. In connection with the option exercise, we made a payment of $35.0 million to Ionis, which was recorded as research and development in our consolidated statements of income. Future payments may include potential post-licensing milestone payments of up to $55.0 million and royalties in the low to mid-teen percentages on potential annual worldwide net sales. We are solely responsible for the costs and expenses related to the development, manufacturing and commercialization of tofersen following the option exercise.
F- 62
BIOGEN INC. AND SUBSIDIARIES
NOTES TO CONSOLIDATED FINANCIAL STATEMENTS — (Continued)
During the years ending December 31, 2019, 2018 and 2017, we incurred milestones of $20.0 million, $18.0 million and $12.0 million, respectively, related to the advancement of programs under this agreement, which were recorded as research and development expense in our consolidated statements of income.
Eisai Co., Ltd.
BAN2401 and Elenbecestat Collaboration
We have a collaboration agreement with Eisai Co., Ltd. (Eisai) to jointly develop and commercialize BAN2401, a monoclonal antibody that targets amyloid beta aggregates for the potential treatment of AD, and elenbecestat, the oral BACE (base amyloid cleaving enzyme) inhibitor (the BAN2401 and Elenbecestat Collaboration).
In September 2019 we and Eisai announced the decision to discontinue the global Phase 3 studies (MISSION AD1 and MISSION AD2) of elenbecestat in early AD. As a result of this decision, in the third quarter of 2019, we accrued approximately $48.0 million related to our share of the termination of various clinical trials and research and development contracts incurred under the BAN2401 and Elenbecestat Collaboration.
Eisai serves as the global operational and regulatory lead for BAN2401 and all costs, including research, development, sales and marketing expenses, are shared equally between us and Eisai. Upon marketing approval we and Eisai will co-promote BAN2401 and share profits equally. In addition, the BAN2401 and Elenbecestat Collaboration provides both parties with certain rights and obligations in the event of a change in control of either party.
The BAN2401 and Elenbecestat Collaboration also provided Eisai with an option to jointly develop and commercialize aducanumab, our anti-amyloid beta antibody candidate for early AD (Aducanumab Option), and an option to jointly develop and commercialize one of our anti-tau monoclonal antibodies (Anti-Tau Option). In October 2017 Eisai exercised its Aducanumab Option and we entered into a new collaboration agreement for the joint development and commercialization of aducanumab (Aducanumab Collaboration Agreement). Eisai has not yet exercised its Anti-Tau Option.
Under the Aducanumab Collaboration Agreement, the two companies will continue to jointly develop BAN2401 in accordance with the BAN2401 and Elenbecestat Collaboration; however, we are no longer required to pay Eisai any milestone payments for products containing BAN2401 and we are no longer entitled to any potential development and commercial milestone payments from Eisai in relation to aducanumab.
A summary of development and sales and marketing expenses related to the BAN2401 and Elenbecestat Collaboration is as follows:
For the Years Ended December 31, | |||||||||||
(In millions) | 2019 | 2018 | 2017 | ||||||||
Total development expense incurred by the collaboration related to the advancement of BAN2401 and Elenbecestat | $ | $ | $ | ||||||||
Biogen's share of BAN2401 and Elenbecestat development expense reflected in research and development expense in our consolidated statements of income | $ | $ | $ | ||||||||
Total sales and marketing expense incurred by the collaboration | $ | $ | $ | ||||||||
Biogen's share of BAN2401 and Elenbecestat sales and marketing expense reflected in selling, general and administrative expense in our consolidated statements of income | $ | $ | $ | ||||||||
Aducanumab Collaboration Agreement
Under the Aducanumab Collaboration Agreement, the two companies will co-promote aducanumab with a region-based profit split and we lead the ongoing development of aducanumab.
In March 2019, based on a pre-specified futility analysis, we discontinued the global Phase 3 trials, EMERGE and ENGAGE, designed to evaluate the efficacy and safety of aducanumab in patients with early AD. A new analysis of a larger dataset from these trials, conducted in consultation with the FDA, showed that the Phase 3 EMERGE
F- 63
BIOGEN INC. AND SUBSIDIARIES
NOTES TO CONSOLIDATED FINANCIAL STATEMENTS — (Continued)
study met its pre-specified primary and secondary endpoints. In October 2019 we and Eisai announced that we plan to pursue regulatory approval for aducanumab in the U.S.
For the period through March 31, 2018, we were responsible for 100% of development costs incurred by the collaboration for the advancement of aducanumab (aducanumab development expense). For the period April 1, 2018 through December 31, 2018, Eisai reimbursed us for 15 % of aducanumab development expense incurred and beginning January 1, 2019, is reimbursing us for 45 % of aducanumab development expense incurred.
In the first quarter of 2019, as a result of the decision to discontinue the Phase 3 EMERGE and ENGAGE trials following the futility analysis, we accrued and subsequently paid approximately $45.0 million related to the termination of various clinical trials and research and development contracts net of the expected 45 % Eisai reimbursement of development costs incurred under the Aducanumab Collaboration Agreement.
Upon commercialization, both companies will co-promote aducanumab with a region-based profit split. We will receive a 55 % share of the potential profits (losses) in the U.S., a 68.5 % share of the potential profits (losses) in the E.U. and a 20 % share of the potential profits (losses) in Japan and Asia, excluding China and South Korea. The two companies will continue to share equally in the potential profits (losses) in rest of world markets. Sales and marketing expense incurred before commercialization are shared in proportion to the same region-based profit split that will be utilized to co-promote aducanumab.
A summary of development and sales and marketing expenses related to the Aducanumab Collaboration Agreement is as follows:
For the Years Ended December 31, | |||||||||||
(In millions) | 2019 | 2018 | 2017 | ||||||||
Total aducanumab development expense | $ | $ | $ | ||||||||
Biogen's share of aducanumab development expense reflected in research and development expense in our consolidated statements of income | $ | $ | $ | ||||||||
Total aducanumab sales and marketing expense incurred by the collaboration | $ | $ | $ | ||||||||
Biogen's share of aducanumab sales and marketing expense reflected in selling, general and administrative expense in our consolidated statements of income | $ | $ | $ | ||||||||
In addition, we and Eisai co-promote AVONEX, TYSABRI and TECFIDERA in Japan in certain settings and Eisai distributes AVONEX, TYSABRI, TECFIDERA and PLEGRIDY in India and other Asia-Pacific markets, excluding China.
Anti-Tau Option
Eisai may exercise the Anti-Tau Option after completion of the Phase 1 clinical trial of such anti-tau monoclonal antibody. If Eisai exercises its Anti-Tau Option, we will receive an upfront payment from Eisai and will be entitled to additional development and commercial milestone payments.
Alkermes
In November 2017 we entered into an exclusive license and collaboration agreement with Alkermes for VUMERITY, a novel fumarate for the treatment of RMS. In October 2019 the FDA approved VUMERITY in the U.S. for the treatment of RMS. In November 2019 VUMERITY became available in the U.S.
Under this agreement, we received an exclusive, worldwide license to develop and commercialize VUMERITY and we pay Alkermes a royalty of 15 % on worldwide net commercial sales of VUMERITY. Royalties payable on net commercial sales of VUMERITY are subject, under certain circumstances, to tiered minimum annual payment requirements for a period of five years following FDA approval.
Alkermes is eligible to receive royalties in the high-single digits to sub-teen double digits of annual net commercial sales upon successful development and commercialization of new product candidates, other than VUMERITY, developed under the exclusive license from Alkermes.
Upon entering into this agreement, we made a $28.0 million upfront payment to Alkermes representing our share of VUMERITY development costs already incurred in 2017. Beginning in 2018 we became responsible for all
F- 64
BIOGEN INC. AND SUBSIDIARIES
NOTES TO CONSOLIDATED FINANCIAL STATEMENTS — (Continued)
development expenses related to VUMERITY. In December 2017 we also recognized a $50.0 million expense, which was paid to Alkermes in 2018, enabling the continuation of the agreement to develop VUMERITY. Both the $28.0 million upfront payment and $50.0 million continuation payment were recorded as research and development expense in our consolidated financial statements during the year ended December 31, 2017.
During the fourth quarter of 2019, following the FDA's approval of VUMERITY, we paid Alkermes $155.0 million in milestone payments, which were recorded in intangible assets in our consolidated balance sheets and will be amortized over the useful life of the product. For the years ended December 31, 2019, 2018 and 2017, we recorded $53.5 million, $68.7 million and $80.3 million, respectively, in research and development expense in our consolidated statements of income related to this collaboration.
Alkermes currently supplies VUMERITY to us pursuant to a supply agreement with Alkermes. In October 2019 we entered into a new supply agreement and amended our license and collaboration agreement with Alkermes pursuant to which we have the election, following a transition period, to manufacture VUMERITY or have manufacturing transitioned to a third party in exchange for an increase in the royalty rate on worldwide net commercial sales of VUMERITY that is manufactured by us or our designee.
Bristol-Myers Squibb Company
In June 2017 we completed an exclusive license agreement with Bristol-Myers Squibb Company (BMS) for the development and potential commercialization of BIIB092 (gosuranemab), an antibody targeting tau, the protein that forms the deposits, or tangles, in the brain associated with AD.
Under this agreement, we received worldwide rights to gosuranemab and are responsible for the full development and potential commercialization of gosuranemab in AD and progressive supranuclear palsy (PSP).
In December 2019 we announced that the Phase 2 PASSPORT study investigating gosuranemab in individuals with PSP did not meet its primary endpoint. Based on these results, we discontinued development of gosuranemab in PSP and other primary tauopathies. We will continue our ongoing Phase 2 TANGO study of gosuranemab for mild cognitive impairment due to AD or mild AD, given differences in disease pathology.
Upon entering into this agreement, we made an upfront payment of $300.0 million to BMS and assumed all remaining obligations to the former shareholders of iPierian, Inc. (iPierian) related to BMS’s acquisition of iPierian in 2014. In June 2017 we recognized a $60.0 million developmental milestone payable to the former shareholders of iPierian upon dosing of the first patient in the Phase 2 PASSPORT study of gosuranemab for PSP. Both the $300.0 million upfront payment and the $60.0 million developmental milestone payment were recorded as research and development expense in our consolidated statements of income for the year ended December 31, 2017.
We may pay BMS up to $360.0 million in additional milestone payments, and potential royalties, and we may pay the former shareholders of iPierian up to $370.0 million in remaining milestone payments as well as potential royalties on net commercial sales.
For the years ended December 31, 2019 and 2018, we recorded $144.0 million and $97.0 million, respectively, in research and development expense in our consolidated statements of income related to this collaboration.
Acorda Therapeutics, Inc.
In June 2009 we entered into a collaboration and license agreement with Acorda Therapeutics, Inc. (Acorda) to develop and commercialize products containing fampridine, such as FAMPYRA, in markets outside the U.S. We are responsible for all regulatory activities and the future clinical development of related products in those markets.
Under this agreement, we pay tiered royalties based on the level of ex-U.S. net sales and we may pay potential milestone payments based on the successful achievement of certain regulatory and commercial milestones, which would be capitalized as intangible assets upon achievement of the milestones and amortized utilizing an economic consumption model. The next expected milestone would be $15.0 million, due if ex-U.S. net sales reach $100.0 million over a period of four consecutive quarters. Royalty payments are recognized in cost of sales within our consolidated statements of income.
In connection with the collaboration and license agreement, we also entered into a supply agreement with Acorda for the commercial supply of FAMPYRA. This agreement is a sublicense arrangement of an existing
F- 65
BIOGEN INC. AND SUBSIDIARIES
NOTES TO CONSOLIDATED FINANCIAL STATEMENTS — (Continued)
agreement between Acorda and Alkermes Inc., who acquired Elan Drug Technologies, the original party to the license with Acorda.
For the years ending December 31, 2019, 2018 and 2017, total cost of sales related to royalties and commercial supply of FAMPYRA reflected in our consolidated statements of income were $42.0 million, $36.5 million and $34.0 million, respectively.
AbbVie Inc.
We have a collaboration agreement with AbbVie for the development and commercialization of ZINBRYTA, which was approved for the treatment of RMS in the U.S. in May 2016 and in the E.U. in July 2016. The collaboration began selling ZINBRYTA in the third quarter of 2016. In March 2018 we and AbbVie announced the voluntary worldwide withdrawal of ZINBRYTA for RMS.
Under this agreement, we and AbbVie conducted ZINBRYTA co-promotion activities in the U.S., E.U. and Canadian territories, where development and commercialization costs and profits were shared equally.
We were responsible for manufacturing and research and development activities and recorded these activities within their respective lines in our consolidated statements of income, net of any reimbursement of research and development expenditures received from AbbVie. For the years ended December 31, 2019, 2018 and 2017, the collaboration incurred $0.6 million, $32.4 million and $39.9 million for research and development activities, respectively, for which we recognized $0.3 million, $16.2 million and $19.9 million, respectively, in our consolidated statements of income.
Co-promotion Profits and Losses
In the U.S., AbbVie recognized revenues on sales to third parties and we recognized our 50 % share of the co-promotion profits or losses as a component of total revenues in our consolidated statements of income.
Our share of the co-promotion losses on ZINBRYTA in the U.S. for the year ended December 31, 2019, was immaterial. For the years ended December 31, 2018 and 2017, we recognized a net reduction in revenues from collaborative and other relationships, a component of other revenues, of $8.6 million and $16.9 million, respectively, to reflect our share of the overall net losses within the collaboration for each of those years.
Other Research and Discovery Arrangements
These arrangements may include the potential for future milestone payments based on the achievement of certain clinical and commercial development payable over a period of several years.
Skyhawk Therapeutics, Inc.
In January 2019 we entered into a collaboration and research and development services agreement with Skyhawk Therapeutics, Inc. (Skyhawk) pursuant to which the companies are leveraging Skyhawk's SkySTAR technology platform with the goal of discovering innovative small molecule treatments for patients with neurological diseases, including MS and SMA. We are responsible for the development and potential commercialization of any therapies resulting from this collaboration and we may also pay Skyhawk up to a total of approximately $2.4 billion in additional milestone payments as well as potential royalties on net commercial sales.
In connection with this agreement, we made an upfront payment of $74.0 million to Skyhawk, of which $38.5 million was recorded as research and development expense in our consolidated statements of income and $35.5 million was recorded as prepaid research and development expenditures within investments and other assets in our consolidated balance sheets and will be expensed as the services are provided. In October 2019 we amended this agreement to add an additional discovery program. In connection with this amendment, we made a payment to Skyhawk of $15.0 million, of which approximately $8.0 million was recorded as research and development and approximately $7.0 million was recorded as prepaid research and development expenditures within investments and other assets in our consolidated balance sheets.
Other
For the years ended December 31, 2019, 2018 and 2017, we entered into several research, discovery and other related arrangements that resulted in $30.6 million, $22.0 million and $10.0 million, respectively, recorded as research and development expense in our consolidated statements of income.
F- 66
BIOGEN INC. AND SUBSIDIARIES
NOTES TO CONSOLIDATED FINANCIAL STATEMENTS — (Continued)
Samsung Bioepis Co., Ltd.
Joint Venture Agreement
In February 2012 we entered into a joint venture agreement with Samsung BioLogics, establishing an entity, Samsung Bioepis, to develop, manufacture and market biosimilar products. Samsung BioLogics contributed 280.5 billion South Korean won (approximately $250.0 million) for an 85 % stake in Samsung Bioepis and we contributed 49.5 billion South Korean won (approximately $45.0 million) for the remaining 15 % ownership interest. In June 2018 we exercised our option under our joint venture agreement to increase our ownership percentage in Samsung Bioepis from approximately 5 %, which reflected the effect of previous equity financings in which we did not participate, to approximately 49.9 %. The share purchase transaction was completed in November 2018 and, upon closing, we paid 759.5 billion South Korean won ($676.6 million) to Samsung BioLogics. As of December 31, 2019, our ownership percentage remained at approximately 49.9 %.
We recognize our share of the results of operations related to our investment in Samsung Bioepis under the equity method of accounting one quarter in arrears when the results of the entity become available, which is reflected as equity in income (loss) of investee, net of tax in our consolidated statements of income. During 2015, as our share of losses exceeded the carrying value of our initial investment, we suspended recognizing additional losses. In the first quarter of 2019 we restarted recognizing our share of Samsung Bioepis' income (losses), and we began recognizing amortization on certain basis differences resulting from our November 2018 investment.
Upon investment, the equity method of accounting requires us to identify and allocate differences between the fair value of our investment and the carrying value of our interest in the underlying net assets of the investee. These basis differences are amortized over their economic life. The total basis difference was approximately $675 million, consisting of approximately $115 million attributed to inventory, approximately $615 million attributed to developed technology and approximately $170 million attributed to IPR&D. A deferred tax liability of $225 million was established for the acquired assets that had no tax basis. The basis differences related to inventory and developed technology will be amortized, net of tax, over their estimated useful lives of 1.5 years and 15 years, respectively, one quarter in arrears.
Our joint venture partner, Samsung BioLogics, is currently subject to an ongoing criminal investigation that we continue to monitor. While this investigation could impact the operations of Samsung Bioepis and its business, we have assessed the value of our investment in Samsung Bioepis and continue to believe that the fair value of the investment is in excess of its net book value.
For the year ended December 31, 2019, we recognized losses on our investment of $79.4 million. These losses reflect our share of losses totaling $1.2 million and amortization of basis differences totaling $78.2 million.
As of December 31, 2019 and 2018, the carrying value of our investment in Samsung Bioepis totaled 670.8 billion South Korean won ($580.2 million) and 759.5 billion South Korean won ($680.6 million), respectively, which is classified as a component of investments and other assets within our consolidated balance sheets.
2019 Transaction
In December 2019 we completed a transaction with Samsung Bioepis and secured the exclusive rights to commercialize two potential ophthalmology biosimilar products, SB11 referencing LUCENTIS and SB15 referencing EYLEA, in major markets worldwide, including the U.S., Canada, Europe, Japan and Australia. Samsung Bioepis will be responsible for development and will supply both products to us.
In connection with this transaction, we made an upfront payment of $100.0 million to Samsung Bioepis in January 2020, of which $63.0 million was recorded as research and development expense in our consolidated statements of income and $37.0 million was recorded as an intangible asset in our consolidated balance sheets. Additionally, we may pay Samsung Bioepis up to $210.0 million in additional development, regulatory and sales-based milestones, including a $15.0 million development milestone that we may pay in 2020.
We also acquired an option to extend the term of our current European commercial agreement for BENEPALI, IMRALDI and FLIXABI by an additional five years, subject to payment of an option exercise fee of $60.0 million, and obtained exclusive rights to commercialize these products in China.
F- 67
BIOGEN INC. AND SUBSIDIARIES
NOTES TO CONSOLIDATED FINANCIAL STATEMENTS — (Continued)
2013 Commercial Agreement
In December 2013 pursuant to our rights under the joint venture agreement with Samsung BioLogics, we entered into an agreement with Samsung Bioepis to commercialize, over a 10-year term, 3 anti-tumor necrosis factor (TNF) biosimilar product candidates in Europe and in the case of BENEPALI, Japan. As discussed above, we have an option to extend this agreement by an additional five years. Under this agreement, we have made upfront and clinical development milestone payments totaling $46.0 million, which were recorded as research and development expense in our consolidated statements of income as the programs they relate to had not achieved regulatory approval. We also agreed to make additional milestone payments of $25.0 million upon regulatory approval in the E.U. for each of the three anti-TNF biosimilar product candidates. IMRALDI, an adalimumab biosimilar referencing HUMIRA, FLIXABI, an infliximab biosimilar referencing REMICADE, and BENEPALI, an etanercept biosimilar referencing ENBREL, received regulatory approval in the E.U. in August 2017, May 2016 and January 2016, respectively, and we capitalized the related milestone payments totaling $75.0 million as intangible assets, net in our consolidated balance sheets.
In April 2018 we and Samsung Bioepis announced an agreement with AbbVie related to the commercialization of IMRALDI. Under the terms of the agreement, AbbVie granted us and Samsung Bioepis patent licenses for the use and sale of IMRALDI in Europe, on a country-by-country basis, and we make royalty payments to AbbVie on behalf of Samsung Bioepis. We began to recognize revenues on sales of IMRALDI to third parties in Europe in the fourth quarter of 2018.
We reflect revenues on sales of BENEPALI, IMRALDI and FLIXABI to third parties in product revenues, net in our consolidated statements of income and record the related cost of revenues and sales and marketing expenses in our consolidated statements of income to their respective line items when these costs are incurred. Royalty payments to AbbVie on sales of IMRALDI are recognized in cost of sales within our consolidated statements of income.
We share 50 % of the profit or loss related to our commercial agreement with Samsung Bioepis, which is recognized in collaboration profit (loss) sharing in our consolidated statements of income. For the years ended December 31, 2019, 2018 and 2017, we recognized a net profit-sharing expense of $241.6 million, $187.4 million and $111.0 million, respectively, to reflect Samsung Bioepis' 50 % sharing of the net collaboration profits.
Other Services
Simultaneous with the formation of Samsung Bioepis, we also entered into a technical development services agreement, a manufacturing agreement and a license agreement with Samsung Bioepis.
Under the technical development services agreement, we provide Samsung Bioepis technical development and technology transfer services, which include, but are not limited to, cell culture development, purification process development, formulation development and analytical development.
Under the manufacturing agreement, we manufacture clinical and commercial quantities of bulk drug substance of biosimilar products for Samsung Bioepis pursuant to contractual terms.
Following the divestiture of our Hillerød, Denmark manufacturing operations in August 2019 FUJIFILM assumed responsibility for the manufacture of clinical and commercial quantities of bulk drug substance of biosimilar products for Samsung Bioepis. We no longer recognize revenues for the manufacturing completed after the divestiture date under the technical development services and manufacturing agreements with Samsung Bioepis. For additional information on the divestiture of our Hillerød, Denmark manufacturing operations, please read Note 3, Divestitures, to these consolidated financial statements.
Under the license agreement, we granted Samsung Bioepis an exclusive license to use, develop, manufacture and commercialize biosimilar products created by Samsung Bioepis using Biogen product-specific technology. In exchange, we receive single digit royalties on all biosimilar products developed and commercialized by Samsung Bioepis.
For the years ended December 31, 2019, 2018 and 2017, we recognized $106.2 million, $96.4 million and $42.7 million, respectively, in revenues under the license, technical development services and manufacturing agreements, which is reflected in revenues from collaborative and other relationships, as a component of other revenues in our consolidated statements of income.
F- 68
BIOGEN INC. AND SUBSIDIARIES
NOTES TO CONSOLIDATED FINANCIAL STATEMENTS — (Continued)
Amounts receivable from Samsung Bioepis related to the agreements discussed above were $85.0 million and $116.9 million as of December 31, 2019 and 2018, respectively. Amounts payable to Samsung Bioepis as of December 31, 2019, consisted of the $100.0 million upfront payment related to the 2019 transaction we completed in December 31, 2019, as discussed above. Amounts payable to Samsung Bioepis as of December 31, 2018, were $31.5 million.
19. Investments in Variable Interest Entities
Consolidated Variable Interest Entities
Our consolidated financial statements include the financial results of variable interest entities in which we are the primary beneficiary. The following are our significant variable interest entities.
Neurimmune SubOne AG
We have a collaboration and license agreement with Neurimmune SubOne AG (Neurimmune) for the development and commercialization of antibodies for the potential treatment of AD, including aducanumab, our anti-amyloid beta antibody candidate for the potential treatment of AD (as amended, the Neurimmune Agreement). We are responsible for the development, manufacturing and commercialization of all licensed products. This agreement is effective for the longer of the duration of certain patents relating to a licensed product or 12 years from the first commercial sale of any product using such a licensed compound.
We consolidate the results of Neurimmune as we determined that we are the primary beneficiary of Neurimmune because we have the power through the collaboration to direct the activities that most significantly impact the entity’s economic performance and we are required to fund 100% of the research and development costs incurred in support of the collaboration.
In October 2017 we amended the terms of the Neurimmune Agreement and made a $150.0 million payment to Neurimmune in exchange for a 15 % reduction in the previously negotiated royalty rates payable on products developed under the Neurimmune Agreement, including royalties payable on potential commercial sales of aducanumab. In May 2018 we made an additional $50.0 million payment to Neurimmune to further reduce the previously negotiated royalty rates payable on products developed under the Neurimmune Agreement, including royalties payable on potential commercial sales of aducanumab, by an additional 5 %. Our royalty rates payable on products developed under the Neurimmune Agreement, including royalty rates payable on potential commercial sales of aducanumab, now range from the high single digits to sub-teens. As we consolidate the results of Neurimmune, we treated these payments as distributions and recognized them as charges to noncontrolling interests in the fourth quarter of 2017 and the second quarter of 2018, as applicable.
Additionally, under the terms of the Neurimmune Agreement, we would be required to pay Neurimmune a milestone payment of $75.0 million upon the regulatory filing with the FDA for approval of aducanumab and a milestone payment of $100.0 million if aducanumab is launched in the U.S.
Research and development costs for which we reimburse Neurimmune are reflected in research and development expense in our consolidated statements of income. During the years ending December 31, 2019, 2018 and 2017, amounts reimbursed were immaterial.
The assets and liabilities of Neurimmune are not significant to our consolidated financial position or results of operations as it is a research and development organization. We have provided no financing to Neurimmune other than previously contractually required amounts.
Under the Aducanumab Collaboration Agreement, Eisai had an option to share in the benefit and cost associated with the royalty reductions discussed above; however, Eisai did not elect to share in the benefit and cost with respect to either the October 2017 or May 2018 royalty reductions, which will impact the amount of profits (losses) on potential commercial sales of aducanumab to be shared with Eisai. For additional information on our collaboration arrangements with Eisai, please read Note 18, Collaborative and Other Relationships, to these consolidated financial statements.
F- 69
BIOGEN INC. AND SUBSIDIARIES
NOTES TO CONSOLIDATED FINANCIAL STATEMENTS — (Continued)
Unconsolidated Variable Interest Entities
We have relationships with various variable interest entities that we do not consolidate as we lack the power to direct the activities that significantly impact the economic success of these entities. These relationships include investments in certain biotechnology companies and research collaboration agreements.
As of December 31, 2019 and 2018, the carrying value of our investments in certain biotechnology companies representing potential unconsolidated variable interest entities totaled $22.7 million and $28.7 million, respectively. Our maximum exposure to loss related to these variable interest entities is limited to the carrying value of our investments.
20. Litigation
We are currently involved in various claims and legal proceedings, including the matters described below. For information as to our accounting policies relating to claims and legal proceedings, including use of estimates and contingencies, please read Note 1, Summary of Significant Accounting Policies, to these consolidated financial statements.
With respect to some loss contingencies, an estimate of the possible loss or range of loss cannot be made until management has further information, including, for example, (i) which claims, if any, will survive dispositive motion practice; (ii) information to be obtained through discovery; (iii) information as to the parties' damages claims and supporting evidence; (iv) the parties’ legal theories; and (v) the parties' settlement positions.
The claims and legal proceedings in which we are involved also include challenges to the scope, validity or enforceability of the patents relating to our products, pipeline or processes, and challenges to the scope, validity or enforceability of the patents held by others. These include claims by third parties that we infringe their patents. An adverse outcome in any of these proceedings could result in one or more of the following and have a material impact on our business or consolidated results of operations and financial position: (i) loss of patent protection; (ii) inability to continue to engage in certain activities; and (iii) payment of significant damages, royalties, penalties and/or license fees to third parties.
Loss Contingencies
IMRALDI Patent Litigation
In September 2018 Fresenius Kabi Deutschland GmbH (Fresenius Kabi) commenced proceedings for damages and injunctive relief against Biogen France SAS in the Tribunal de Grande Instance de Paris, alleging that IMRALDI, the adalimumab biosimilar product of Samsung Bioepis UK Limited that Biogen has commercialized in Europe, infringes the French counterpart of European Patent No. 3 148 510 (the '510 Patent), which was issued in June 2018 and expires in May 2035. No hearing on the merits has been scheduled.
In October 2018 Fresenius Kabi commenced preliminary injunction proceedings against Biogen (Denmark) Manufacturing ApS and Biogen Denmark A/S in Denmark's Maritime and Commercial High Court alleging infringement of Danish Utility Models. In June 2019 the Danish court denied Fresenius Kabi's request for a preliminary injunction and Fresenius Kabi has appealed that decision.
In November 2018 Fresenius Kabi commenced infringement proceedings for damages and injunctive relief against Biogen Italia S.R.L. in the District Court of Milan relating to the Italian counterpart of the ‘510 Patent, and against Biogen GmbH in the Düsseldorf Regional Court relating to the German counterpart of the ‘510 Patent. In Italy, Fresenius Kabi has surrendered the Italian counterpart of the ‘510 Patent and has moved to dismiss its infringement action. A hearing in the proceeding in Germany has not yet been set but is expected to occur after a decision on our pending opposition to the ‘510 patent in the EPO.
In July 2019 Gedeon Richter PLC (Gedeon Richter) commenced proceedings against Biogen GmbH in the Düsseldorf Regional Court alleging infringement of the German counterpart of European Patent No. 3 212 667 (the
F- 70
BIOGEN INC. AND SUBSIDIARIES
NOTES TO CONSOLIDATED FINANCIAL STATEMENTS — (Continued)
'667 Patent), which was issued in September 2018 and expires in October 2035, and seeking damages and injunctive relief. A hearing has been set for November 2020.
In July 2019 Biogen Idec Ltd. (Biogen UK) and Samsung Bioepis UK Limited filed an action in the United Kingdom Patents Court to revoke the United Kingdom (U.K.) counterpart of the '667 Patent. In January 2020 the U.K. court revoked the patent.
In August 2019 Biogen B.V. (Netherlands) and Samsung Bioepis UK Limited filed an action in the District Court of the Hague, Netherlands to revoke the Dutch counterpart of the '667 Patent. Gedeon Richter filed a separate action for infringement in the same court and a hearing in both cases has been set for May 2020.
An estimate of the possible loss or range of loss in the pending IMRALDI patent litigation described above cannot be made at this time.
Qui Tam Litigation
In July 2015 a qui tam action filed by Michael Bawduniak on behalf of the U.S. and certain states was unsealed by the U.S. District Court for the District of Massachusetts. The action alleges sales and promotional activities in violation of the federal False Claims Act and state law counterparts and seeks single and treble damages, civil penalties, interest, attorneys’ fees and costs. No trial date has been set. The U.S. has not made an intervention decision. An estimate of the possible loss or range of loss cannot be made at this time.
Dispute with Former Convergence Shareholders
In November and December 2019 Shareholder Representative Services LLC, on behalf of the former shareholders of Convergence, sent us correspondence asserting claims of $200.0 million for alleged breach of the contract under which we acquired Convergence. We dispute the claims.
Other Matters
Petition for Inter Partes Review
In July 2018 Mylan Pharmaceuticals, Inc. (Mylan) filed a petition that was granted by the U.S. Patent Trial and Appeal Board (PTAB) for inter partes review of our U.S. Patent No. 8,399,514 (the '514 Patent), which covers treatment of MS with 480 mg of dimethyl fumarate per day as provided for in our TECFIDERA label. Sawai USA, Inc. and Sawai Pharmaceutical Co. Ltd. were later joined as petitioners, but in January 2020 the PTAB terminated their involvement in the proceeding. A hearing on Mylan’s petition was held in November 2019 and on February 5, 2020, the PTAB issued a final written decision upholding the patentability of the ‘514 Patent.
Hatch-Waxman Act Litigation relating to TECFIDERA Orange-Book Listed Patents
In 2017, 2018 and 2019 we filed patent infringement proceedings relating to TECFIDERA Orange-Book listed patents pursuant to the Drug Price Competition and Patent Term Restoration Act of 1984, commonly known as the Hatch-Waxman Act, against Accord Healthcare Inc., Alkem Laboratories Ltd., Amneal Pharmaceuticals LLC, Aurobindo Pharma U.S.A., Inc., Cipla Limited, Glenmark Pharmaceuticals Ltd., Graviti Pharmaceuticals Pvt. Ltd., Hetero USA, Inc., Lupin Atlantis Holdings SA, Macleods Pharmaceuticals, Ltd., MSN Laboratories Pvt. Ltd., Pharmathen S.A., Prinston Pharmaceutical Inc., Sandoz Inc., Sawai USA, Inc., Shipla Medicare Limited, Slayback Pharma LLC, Torrent Pharmaceuticals Ltd., TWi Pharmaceuticals, Inc., Windlas Healthcare Pvt. Ltd. and Zydus Pharmaceuticals (USA) Inc. (the Delaware Defendants) in the U.S. District Court for the District of Delaware (the Delaware Court) and against Mylan in the U.S. District Court for the Northern District of West Virginia. The litigation against Aurobindo Pharma U.S.A., Inc., Glenmark Pharmaceuticals Ltd. and Sawai USA was dismissed in the fourth quarter of 2019.
A trial against the remaining Delaware Defendants was held in the Delaware Court in December 2019 and we are awaiting a decision.
A trial is ongoing in the West Virginia action against Mylan.
We have entered into settlement agreements with some of the Delaware Defendants and we now anticipate market entry of a generic product equivalent to TECFIDERA before the ‘514 Patent expires in February 2028.
In December 2018 we filed an action under the Hatch-Waxman Act against Banner Life Sciences LLC (Banner) for infringement of our U.S. Patent No. 7,619,001 (the ‘001 patent) expiring on June 20, 2020, and claiming treatment of MS with dimethyl fumarate or methyl hydrogen fumarate or a combination thereof. In January 2020 the
F- 71
BIOGEN INC. AND SUBSIDIARIES
NOTES TO CONSOLIDATED FINANCIAL STATEMENTS — (Continued)
Delaware Court entered judgment that Banner’s drug product does not infringe the ‘001 patent. We have appealed the decision.
European Patent Office Oppositions
In 2016 the EPO revoked our European patent number 2 137 537 (the '537 Patent), which covers the treatment of MS with 480 mg of dimethyl fumarate as provided for in our TECFIDERA label. We have appealed to the Technical Boards of Appeal of the EPO and a hearing has been set for March 2020.
In March 2018 the EPO revoked Forward Pharma’s European Patent No. 2 801 355, which expires in October 2025. Forward Pharma has filed an appeal to the Technical Boards of Appeal of the EPO and a hearing has been set for June 2020. For additional information regarding this matter, please read Note 6, Intangible Assets and Goodwill, to these consolidated financial statements.
TYSABRI Patent Revocation Matters
In November 2017 Bioeq GMBH, affiliated with the Polpharma Group, brought an action in the Polish Patent Office seeking to revoke Polish Patent Number 215263 (the Polish '263 Patent), corresponding to our European Patent Number 1 485 127 (the E.U. '127 Patent) and covering administration of natalizumab (TYSABRI) to treat MS. The Polish '263 Patent expires in February 2023. No hearing on the merits has been set in this matter.
Swiss Pharma International AG, also affiliated with the Polpharma Group, filed actions in the District Court of the Hague, Netherlands (January 2016), the German Patents Court (March 2016) and the Commercial Court of Rome (November 2017) seeking to invalidate the Dutch, German and Italian counterparts, respectively, of the E.U. '127 Patent, which also cover administration of natalizumab (TYSABRI) to treat MS and expire in February 2023. The Dutch and German counterparts were ruled invalid. The decision in the Dutch action was affirmed on appeal and a hearing has been set for July 2020 in our appeal in the German action. No date for a hearing on the merits has been set in the Italian action.
'755 Patent Litigation
In May 2010 Biogen MA Inc. (formerly Biogen Idec MA Inc.) filed a complaint in the U.S. District Court for the District of New Jersey alleging infringement by Bayer Healthcare Pharmaceuticals Inc. (Bayer) (manufacturer, marketer and seller of BETASERON and manufacturer of EXTAVIA), EMD Serono, Inc. (EMD Serono) (manufacturer, marketer and seller of REBIF), Pfizer (co-marketer of REBIF) and Novartis Pharmaceuticals Corp. (Novartis) (marketer and seller of EXTAVIA) of our U.S. Patent No. 7,588,755 ('755 Patent), which claims the use of interferon beta for immunomodulation or treating a viral condition, viral disease, cancers or tumors. The complaint seeks monetary damages, including lost profits and royalties.
Bayer, Pfizer, Novartis and EMD Serono all filed counterclaims seeking declaratory judgments of patent invalidity and non-infringement and seeking monetary relief in the form of costs and attorneys' fees. Bayer had previously filed a complaint against us in the same court, on May 27, 2010, seeking a declaratory judgment that it does not infringe the '755 Patent and that the '755 Patent is invalid, and seeking monetary relief in the form of attorneys' fees, costs and expenses.
In September 2018 the trial court entered judgment against EMD Serono and Pfizer that the '755 Patent is infringed and valid and ordered a new trial on damages. EMD Serono and Pfizer filed an appeal in the U.S. Court of Appeals for the Federal Circuit and oral argument is scheduled for March 2020. The trial court has not yet scheduled the new damages trial or a trial against Bayer and Novartis.
Government Matters
We have learned that state and U.S. governmental authorities are investigating our sales and promotional practices and have received related subpoenas. We are cooperating with the investigation.
We have received subpoenas and other requests from the U.S. government for documents and information relating to our relationship with non-profit organizations that assist patients taking drugs sold by Biogen and the government has challenged some of our contributions to these organizations. We are cooperating with the investigation and have participated in preliminary discussions with the government regarding potential resolution of aspects of the matter. We have accrued the amount of our best estimate of the minimum probable loss in this matter.
F- 72
BIOGEN INC. AND SUBSIDIARIES
NOTES TO CONSOLIDATED FINANCIAL STATEMENTS — (Continued)
Tax Matter
In the second quarter of 2018 the State Treasury of Goias, Brazil issued tax assessments for the period 2013 through February 2018 relating to tax on the circulation of goods and totaling approximately $70.0 million including interest and penalties. We dispute the assessments and have filed defenses with the Administrative Court of Appeals for the State of Goias, which are pending. We have not formed an opinion that an unfavorable outcome of the dispute is either probable or remote.
Product Liability and Other Legal Proceedings
We are also involved in product liability claims and other legal proceedings generally incidental to our normal business activities. While the outcome of any of these proceedings cannot be accurately predicted, we do not believe the ultimate resolution of any of these existing matters would have a material adverse effect on our business or financial condition.
21. Commitments and Contingencies
Royalty Payments
TYSABRI
In 2013 we acquired from Elan full ownership of all remaining rights to TYSABRI that we did not already own or control. Under the acquisition agreement, we are obligated to make contingent payments to Elan of 18 % on annual worldwide net commercial sales up to $2.0 billion and 25 % on annual worldwide net commercial sales that exceed $2.0 billion. Royalty payments to Elan and other third parties are recognized as cost of sales in our consolidated statements of income. Elan was acquired by Perrigo Company plc (Perrigo) in December 2013 and Perrigo subsequently sold its rights to these payments to a third-party effective January 2017.
SPINRAZA
In 2016 we exercised our option to develop and commercialize SPINRAZA from Ionis. Under our agreement with Ionis, we make royalty payments to Ionis on annual worldwide net commercial sales of SPINRAZA using a tiered royalty rate between 11 % and 15 %, which are recorded as cost of sales in our consolidated statements of income. For additional information on our collaboration arrangements with Ionis, please read Note 18, Collaborative and Other Relationships, to these consolidated financial statements.
VUMERITY
In October 2019 the FDA approved VUMERITY for the treatment of RMS. Under our agreement with Alkermes, we make royalty payments to Alkermes on worldwide net commercial sales of VUMERITY using a royalty rate of 15 %, which are recorded as cost of sales in our consolidated statements of income. Royalties payable on net commercial sales of VUMERITY are subject, under certain circumstances, to tiered minimum annual payment requirements for a period of five years following FDA approval. For additional information on our collaboration arrangement with Alkermes, please read Note 18, Collaborative and Other Relationships, to these consolidated financial statements.
Contingent Consideration related to Business Combinations
In connection with our acquisitions of Convergence and BIN, we agreed to make additional payments based upon the achievement of certain milestone events.
As the acquisitions of Convergence and BIN occurred after January 1, 2009, we recognized the contingent consideration liabilities associated with these transactions at their fair value on the acquisition date and revalue the remaining obligations each reporting period. We may pay up to approximately $735.0 million in remaining milestones related to these acquisitions.
Fumapharm AG
In 2006 we acquired Fumapharm AG. As part of this acquisition we acquired the Fumapharm Products. We were required to make contingent payments to former shareholders of Fumapharm AG and holders of their rights based on the attainment of certain cumulative sales levels of Fumapharm Products and the level of total net sales of Fumapharm Products in the prior 12-month period, as defined in the acquisition agreement, until such time as the cumulative sales level reached $20.0 billion, at which time no further contingent payments were due. During the first
F- 73
BIOGEN INC. AND SUBSIDIARIES
NOTES TO CONSOLIDATED FINANCIAL STATEMENTS — (Continued)
quarter of 2019 we paid the final $300.0 million contingent payment as we achieved the $20.0 billion cumulative sales levels related to the Fumapharm Products in the fourth quarter of 2018.
Contingent Development, Regulatory and Commercial Milestone Payments
Based on our development plans as of December 31, 2019, we could make potential future milestone payments to third parties of up to approximately $6.8 billion, including approximately $1.2 billion in development milestones, approximately $1.4 billion in regulatory milestones and approximately $4.2 billion in commercial milestones, as part of our various collaborations, including licensing and development programs. Payments under these agreements generally become due and payable upon achievement of certain development, regulatory or commercial milestones. Because the achievement of these milestones was not considered probable as of December 31, 2019, such contingencies have not been recorded in our financial statements. Amounts related to contingent milestone payments are not considered contractual obligations as they are contingent on the successful achievement of certain development, regulatory or commercial milestones.
Provided various development, regulatory or commercial milestones are achieved, we anticipate that we may pay approximately $430.0 million of milestone payments in 2020, including $75.0 million upon the regulatory filing with the FDA for approval of aducanumab and $100.0 million if aducanumab is launched in the U.S.
Other Funding Commitments
As of December 31, 2019, we have several ongoing clinical studies in various clinical trial stages. Our most significant clinical trial expenditures are to CROs. The contracts with CROs are generally cancellable, with notice, at our option. We recorded accrued expenses of approximately $24.0 million in our consolidated balance sheet for expenditures incurred by CROs as of December 31, 2019. We have approximately $514.0 million in cancellable future commitments based on existing CRO contracts as of December 31, 2019.
As part of the sale of our Hillerød, Denmark manufacturing operations to FUJIFILM, we have provided FUJIFILM with certain minimum batch production commitment guarantees. There is a risk that the minimum contractual batch production commitments will not be met. Based upon current estimates we expect to incur an adverse commitment obligation of approximately $74.0 million associated with such guarantees and have accrued for this obligation. We may adjust this estimate based upon changes in business conditions, which may result in the increase or reduction of this adverse commitment obligation in subsequent periods.
Tax Related Obligations
We exclude liabilities pertaining to uncertain tax positions from our summary of contractual obligations as we cannot make a reliable estimate of the period of cash settlement with the respective taxing authorities. As of December 31, 2019, we have $136.9 million of net liabilities associated with uncertain tax positions.
As of December 31, 2019 and 2018, we have accrued income tax liabilities of $697.0 million under the Transition Toll Tax. Of the amounts accrued as of December 31, 2019, no amounts are expected to be paid within one year due to an approximately $87.0 million carryforward of taxes paid in relation to the company's 2017 tax return. The Transition Toll Tax will be paid over an eight-year period, which started in 2018, and will not accrue interest. For additional information on the Transition Toll Tax, please read Note 16, Income Taxes, to these consolidated financial statements.
Solothurn, Switzerland Manufacturing Facility
In order to support our drug development pipeline, we are building a large-scale biologics manufacturing facility in Solothurn, Switzerland. We expect this facility to be partially operational by the end of 2020. As of December 31, 2019, we had contractual commitments of approximately $52.0 million related to the construction of this facility.
22. Guarantees
As of December 31, 2019 and 2018, we did not have significant liabilities recorded for guarantees.
We enter into indemnification provisions under our agreements with other companies in the ordinary course of business, typically with business partners, contractors, clinical sites and customers. Under these provisions, we generally indemnify and hold harmless the indemnified party for losses suffered or incurred by the indemnified party as a result of our activities. These indemnification provisions generally survive termination of the underlying agreement. The maximum potential amount of future payments we could be required to make under these
F- 74
indemnification provisions is unlimited. However, to date we have not incurred material costs to defend lawsuits or settle claims related to these indemnification provisions. As a result, the estimated fair value of these agreements is minimal. Accordingly, we have no liabilities recorded for these agreements as of December 31, 2019 and 2018.
23. Employee Benefit Plans
We sponsor various retirement and pension plans. Our estimates of liabilities and expenses for these plans incorporate a number of assumptions, including expected rates of return on plan assets and interest rates used to discount future benefits.
401(k) Savings Plan
We maintain a 401(k) Savings Plan, which is available to substantially all regular employees in the U.S. over the age of 21 . Participants may make voluntary contributions. We make matching contributions according to the 401(k) Savings Plan’s matching formula. All matching contributions and participant contributions vest immediately. The 401(k) Savings Plan also holds certain transition contributions on behalf of participants who previously participated in the Biogen, Inc. Retirement Plan. The expense related to our 401(k) Savings Plan primarily consists of our matching contributions.
Expense related to our 401(k) Savings Plan totaled $44.8 million, $42.2 million and $42.6 million for the years ended December 31, 2019, 2018 and 2017, respectively.
Deferred Compensation Plan
We maintain a non-qualified deferred compensation plan, known as the Supplemental Savings Plan (SSP), which allows a select group of management employees in the U.S. to defer a portion of their compensation. The SSP also provides certain credits to highly compensated U.S. employees that are paid by the company. These credits are known as the Restoration Match. The deferred compensation amounts are accrued when earned. Such deferred compensation is distributable in cash in accordance with the rules of the SSP. Deferred compensation amounts under such plan as of December 31, 2019 and 2018, totaled approximately $114.6 million and $109.3 million, respectively, and are included in other long-term liabilities in our consolidated balance sheets. The SSP also holds certain transition contributions on behalf of participants who previously participated in the Biogen, Inc. Retirement Plan. The Restoration Match and participant contributions vest immediately. Distributions to participants can be either in one lump sum payment or annual installments as elected by the participants.
Pension Plans
Our retiree benefit plans include defined benefit plans for employees in our affiliates in Switzerland and Germany as well as other insignificant defined benefit plans in certain other countries where we maintain an operating presence.
Our Swiss plan is a government-mandated retirement fund that provides employees with a minimum investment return. The minimum investment return is determined annually by the Swiss government and was 1.00 % in 2019, 2018 and 2017. Under the Swiss plan, both we and certain of our employees with annual earnings in excess of government determined amounts are required to make contributions into a fund managed by an independent investment fiduciary. Employer contributions must be in an amount at least equal to the employee’s contribution. Minimum employee contributions are based on the respective employee’s age, salary and gender. As of December 31, 2019 and 2018, the Swiss plan had an unfunded net pension obligation of $42.9 million and $48.6 million, respectively, and plan assets that totaled $127.1 million and $93.1 million, respectively. In 2019, 2018 and 2017 we recognized expense totaling $14.7 million, $14.8 million and $12.3 million, respectively, related to our Swiss plan, of which $1.2 million, $1.3 million and $1.1 million, respectively, was included in other income (expense), net.
The obligations under the German plans are unfunded and totaled $59.6 million and $45.3 million as of December 31, 2019 and 2018, respectively. Net periodic pension cost related to the German plans totaled $5.1 million, $5.3 million and $5.2 million for the years ended December 31, 2019, 2018 and 2017, respectively, of which $1.4 million, $1.5 million and $1.4 million, respectively, was included in other income (expense), net.
24. Segment Information
We operate as one operating segment, focused on discovering, developing and delivering worldwide innovative therapies for people living with serious neurological and neurodegenerative diseases as well as related therapeutic
F- 75
BIOGEN INC. AND SUBSIDIARIES
NOTES TO CONSOLIDATED FINANCIAL STATEMENTS — (Continued)
adjacencies. Our Chief Executive Officer (CEO), as the chief operating decision-maker, manages and allocates resources to the operations of our company on a total company basis. Our research and development organization is responsible for the research and discovery of new product candidates and supports development and registration efforts for potential future products. Our pharmaceutical, operations and technology organization manages the development of the manufacturing processes, clinical trial supply, commercial product supply, distribution, buildings and facilities. Our commercial organization is responsible for U.S. and international development of our commercial products. The company is also supported by corporate staff functions. Managing and allocating resources on a total company basis enables our CEO to assess the overall level of resources available and how to best deploy these resources across functions, therapeutic areas and research and development projects that are in line with our long-term company-wide strategic goals. Consistent with this decision-making process, our CEO uses consolidated, single-segment financial information for purposes of evaluating performance, forecasting future period financial results, allocating resources and setting incentive targets.
Enterprise-wide disclosures about product revenues, other revenues and long-lived assets by geographic area are presented below. Revenues are primarily attributed to individual countries based on location of the customer or licensee.
Geographic Information
The following tables contain certain financial information by geographic area:
December 31, 2019 (In millions) | U.S. | Europe | Asia | Other | Total | ||||||||||||||
Product revenues from external customers | $ | $ | $ | $ | $ | ||||||||||||||
Revenues from anti-CD20 therapeutic programs | $ | $ | $ | $ | $ | ||||||||||||||
Other revenues from external customers | $ | $ | $ | $ | $ | ||||||||||||||
Long-lived assets | $ | $ | $ | $ | $ | ||||||||||||||
December 31, 2018 (In millions) | U.S. | Europe | Asia | Other | Total | ||||||||||||||
Product revenues from external customers | $ | $ | $ | $ | $ | ||||||||||||||
Revenues from anti-CD20 therapeutic programs | $ | $ | $ | $ | $ | ||||||||||||||
Other revenues from external customers | $ | $ | $ | $ | $ | ||||||||||||||
Long-lived assets | $ | $ | $ | $ | $ | ||||||||||||||
December 31, 2017 (In millions) | U.S. | Europe | Asia | Other | Total | ||||||||||||||
Product revenues from external customers | $ | $ | $ | $ | $ | ||||||||||||||
Revenues from anti-CD20 therapeutic programs | $ | $ | $ | $ | $ | ||||||||||||||
Other revenues from external customers | $ | $ | $ | $ | $ | ||||||||||||||
Long-lived assets | $ | $ | $ | $ | $ | ||||||||||||||
Other
As of December 31, 2019, 2018 and 2017, approximately $2,028.8 million, $1,748.5 million and $1,215.7 million, respectively, of our long-lived assets were related to the construction of our large-scale biologics manufacturing facility in Solothurn, Switzerland.
In August 2019 we completed the sale of all of the outstanding shares of our subsidiary that owned our biologics manufacturing operations in Hillerød, Denmark to FUJIFILM. As of December 31, 2018 and 2017, approximately $646.5 million and $707.1 million, respectively, of our long-lived assets were related to our manufacturing facility in Hillerød, Denmark.
For additional information on our large-scale biologics manufacturing facility in Solothurn, Switzerland, please read Note 10, Property, Plant and Equipment, to these consolidated financial statements. For additional information on the divestiture of our Hillerød, Denmark manufacturing operations, please read Note 3, Divestitures, to these consolidated financial statements.
F- 76
BIOGEN INC. AND SUBSIDIARIES
NOTES TO CONSOLIDATED FINANCIAL STATEMENTS — (Continued)
25. Quarterly Financial Data (Unaudited)
(In millions, except per share amounts) | First Quarter | Second Quarter | Third Quarter | Fourth Quarter | Total Year | ||||||||||||||
2019 | |||||||||||||||||||
Product revenues, net | $ | $ | $ | $ | $ | ||||||||||||||
Revenues from anti-CD20 therapeutic programs | $ | $ | $ | $ | $ | ||||||||||||||
Other revenues | $ | $ | $ | $ | $ | ||||||||||||||
Total revenues | $ | $ | $ | $ | $ | ||||||||||||||
Gross profit (1) | $ | $ | $ | $ | $ | ||||||||||||||
Net income (a) | $ | $ | $ | $ | $ | ||||||||||||||
Net income attributable to Biogen Inc. (a) | $ | $ | $ | $ | $ | ||||||||||||||
Net income per share: | |||||||||||||||||||
Basic earnings per share attributable to Biogen Inc. | $ | $ | $ | $ | $ | ||||||||||||||
Diluted earnings per share attributable to Biogen Inc. | $ | $ | $ | $ | $ | ||||||||||||||
Weighted-average shares used in calculating: | |||||||||||||||||||
Basic earnings per share attributable to Biogen Inc. | |||||||||||||||||||
Diluted earnings per share attributable to Biogen Inc. | |||||||||||||||||||
(In millions, except per share amounts) | First Quarter | Second Quarter | Third Quarter | Fourth Quarter | Total Year | ||||||||||||||
2018 | |||||||||||||||||||
Product revenues, net | $ | $ | $ | $ | $ | ||||||||||||||
Revenues from anti-CD20 therapeutic programs | $ | $ | $ | $ | $ | ||||||||||||||
Other revenues | $ | $ | $ | $ | $ | ||||||||||||||
Total revenues | $ | $ | $ | $ | $ | ||||||||||||||
Gross profit (1) | $ | $ | $ | $ | $ | ||||||||||||||
Net income (b) | $ | $ | $ | $ | $ | ||||||||||||||
Net income attributable to Biogen Inc. (b) | $ | $ | $ | $ | $ | ||||||||||||||
Net income per share: | |||||||||||||||||||
Basic earnings per share attributable to Biogen Inc. | $ | $ | $ | $ | $ | ||||||||||||||
Diluted earnings per share attributable to Biogen Inc. | $ | $ | $ | $ | $ | ||||||||||||||
Weighted-average shares used in calculating: | |||||||||||||||||||
Basic earnings per share attributable to Biogen Inc. | |||||||||||||||||||
Diluted earnings per share attributable to Biogen Inc. | |||||||||||||||||||
(a) | Net income and net income attributable to Biogen Inc. for 2019 include: |
• | Pre-tax gains (losses) related to changes in the fair value of our strategic investments of $ |
F- 77
BIOGEN INC. AND SUBSIDIARIES
NOTES TO CONSOLIDATED FINANCIAL STATEMENTS — (Continued)
• | Impairment charges related to certain intangible assets of $ |
• | A total net loss in our consolidated statements of income of approximately $ |
• | An expense of $ |
• | Losses (gains) related to the adjustments to the fair values of our contingent consideration obligations of $ |
• | A payment of $ |
• | A payment of $ |
(b) | Net income and net income attributable to Biogen Inc. for 2018 include: |
• | Pre-tax (losses) gains related to changes in the fair value of our strategic investments of $( |
• | Pre-tax charges to acquired IPR&D of $ |
• | Pre-tax research and development expenses for the second quarter of $ |
• | Pre-tax charge to noncontrolling interests of $ |
• | Impairment charges related to certain intangible assets of $ |
• | Losses (gains) related to the adjustments to the fair values of our contingent consideration obligations of $( |
F- 78
BIOGEN INC. AND SUBSIDIARIES
NOTES TO CONSOLIDATED FINANCIAL STATEMENTS — (Continued)
respectively. For additional information, please read Note 7, Fair Value Measurements, to these consolidated financial statements.
• | Net increase to income tax expense of $ |
• | An upfront payment of $ |
26. Subsequent Events
Pfizer Inc.
In January 2020 we entered into an agreement to acquire PF-05251749, a novel CNS-penetrant small molecule inhibitor of casein kinase 1, for the potential treatment of patients with behavioral and neurological symptoms across various psychiatric and neurological diseases from Pfizer. In particular, we plan to develop the Phase 1 asset for the treatment of sundowning in AD and irregular sleep wake rhythm disorder in Parkinson’s disease. In connection with the closing of this transaction, we will make an upfront payment of $75.0 million to Pfizer, which will be recorded as acquired IPR&D in our consolidated statements of income as PF-05251749 has not yet reached technological feasibility. We may also pay Pfizer up to $635.0 million in potential additional development and commercialization milestone payments, as well as tiered royalties in the high single digits to sub-teens.
This transaction will be accounted for as an asset acquisition and is subject to customary closing conditions, including the expiration of the applicable waiting period under the Hart-Scott-Rodino Antitrust Improvements Act of 1976 in the U.S. We expect the transaction to close in the first quarter of 2020.
2020 Credit Facility
In January 2020 we entered into a $1.0 billion, five -year senior unsecured revolving credit facility under which we are permitted to draw funds for working capital and general corporate purposes. The terms of the revolving credit facility include a financial covenant that requires us not to exceed a maximum consolidated leverage ratio. This revolving credit facility replaced the revolving credit facility entered into in August 2015.
F- 79
REPORT OF INDEPENDENT REGISTERED PUBLIC ACCOUNTING FIRM
To the Board of Directors and Shareholders of Biogen Inc.
Opinions on the Financial Statements and Internal Control over Financial Reporting
We have audited the accompanying consolidated balance sheets of Biogen Inc. and its subsidiaries (the “Company”) as of December 31, 2019 and 2018, and the related consolidated statements of income, comprehensive income, equity and cash flows for each of the three years in the period ended December 31, 2019, including the related notes (collectively referred to as the “consolidated financial statements”). We also have audited the Company's internal control over financial reporting as of December 31, 2019, based on criteria established in Internal Control - Integrated Framework (2013) issued by the Committee of Sponsoring Organizations of the Treadway Commission ("COSO").
In our opinion, the consolidated financial statements referred to above present fairly, in all material respects, the financial position of the Company as of December 31, 2019 and 2018, and the results of its operations and its cash flows for each of the three years in the period ended December 31, 2019, in conformity with accounting principles generally accepted in the United States of America. Also in our opinion, the Company maintained, in all material respects, effective internal control over financial reporting as of December 31, 2019, based on criteria established in Internal Control - Integrated Framework (2013) issued by the COSO.
Changes in Accounting Principles
As discussed in Note 1 to the consolidated financial statements, the Company changed the manner in which it accounts for leases in 2019 and the manner in which it accounts for income taxes for intra-entity transfers of assets other than inventory in 2018.
Basis for Opinions
The Company's management is responsible for these consolidated financial statements, for maintaining effective internal control over financial reporting, and for its assessment of the effectiveness of internal control over financial reporting, included in Management’s Annual Report on Internal Control over Financial Reporting appearing under Item 9A. Our responsibility is to express opinions on the Company’s consolidated financial statements and on the Company's internal control over financial reporting based on our audits. We are a public accounting firm registered with the Public Company Accounting Oversight Board (United States) (PCAOB) and are required to be independent with respect to the Company in accordance with the U.S. federal securities laws and the applicable rules and regulations of the Securities and Exchange Commission and the PCAOB.
We conducted our audits in accordance with the standards of the PCAOB. Those standards require that we plan and perform the audits to obtain reasonable assurance about whether the consolidated financial statements are free of material misstatement, whether due to error or fraud, and whether effective internal control over financial reporting was maintained in all material respects.
Our audits of the consolidated financial statements included performing procedures to assess the risks of material misstatement of the consolidated financial statements, whether due to error or fraud, and performing procedures that respond to those risks. Such procedures included examining, on a test basis, evidence regarding the amounts and disclosures in the consolidated financial statements. Our audits also included evaluating the accounting principles used and significant estimates made by management, as well as evaluating the overall presentation of the consolidated financial statements. Our audit of internal control over financial reporting included obtaining an understanding of internal control over financial reporting, assessing the risk that a material weakness exists, and testing and evaluating the design and operating effectiveness of internal control based on the assessed risk. Our audits also included performing such other procedures as we considered necessary in the circumstances. We believe that our audits provide a reasonable basis for our opinions.
F- 80
Definition and Limitations of Internal Control over Financial Reporting
A company’s internal control over financial reporting is a process designed to provide reasonable assurance regarding the reliability of financial reporting and the preparation of financial statements for external purposes in accordance with generally accepted accounting principles. A company’s internal control over financial reporting includes those policies and procedures that (i) pertain to the maintenance of records that, in reasonable detail, accurately and fairly reflect the transactions and dispositions of the assets of the company; (ii) provide reasonable assurance that transactions are recorded as necessary to permit preparation of financial statements in accordance with generally accepted accounting principles, and that receipts and expenditures of the company are being made only in accordance with authorizations of management and directors of the company; and (iii) provide reasonable assurance regarding prevention or timely detection of unauthorized acquisition, use, or disposition of the company’s assets that could have a material effect on the financial statements.
Because of its inherent limitations, internal control over financial reporting may not prevent or detect misstatements. Also, projections of any evaluation of effectiveness to future periods are subject to the risk that controls may become inadequate because of changes in conditions, or that the degree of compliance with the policies or procedures may deteriorate.
Critical Audit Matters
The critical audit matter communicated below is a matter arising from the current period audit of the consolidated financial statements that was communicated or required to be communicated to the audit committee and that (i) relates to accounts or disclosures that are material to the consolidated financial statements and (ii) involved our especially challenging, subjective, or complex judgments. The communication of critical audit matters does not alter in any way our opinion on the consolidated financial statements, taken as a whole, and we are not, by communicating the critical audit matter below, providing a separate opinion on the critical audit matter or on the accounts or disclosures to which it relates.
Reserves for Medicaid and Managed Care Rebates
As described in Notes 1 and 4 to the consolidated financial statements, the Company recognized revenue from product sales net of reserves, including Medicaid and managed care rebates. Within Accrued expenses and other, total contractual adjustments amounted to $1,027.3 million as of December 31, 2019. This balance primarily includes provisions for Medicaid and managed care rebates in the U.S. Medicaid rebates relate to the Company’s estimated obligations to states under established reimbursement arrangements. The Company’s liability for Medicaid rebates consists of estimates for claims that a state will make for the current quarter, claims for prior quarters that have been estimated for which an invoice has not been received, invoices received for claims from the prior quarters that have not been paid, and an estimate of potential claims that will be made for inventory that exists in the distribution channel at period end. Managed care rebates represent the Company’s obligations to third parties, primarily pharmacy benefit managers. Managed care rebates result from performance-based goals, formulary position and price increase limit allowances (price protection). The calculation of the accrual of the managed care rebate is based on an estimate of the customer’s buying patterns and the resulting applicable contractual rebate rate(s) to be earned over a contractual period. As disclosed by management, the Medicaid and managed care estimates reflect historical experience, current contractual and statutory requirements, specific known market events and trends, industry data and forecasted customer buying and payment patterns.
The principal considerations for our determination that performing procedures relating to reserves for Medicaid and managed care rebates is a critical audit matter are there was significant judgment by management due to the significant measurement uncertainty involved in developing these reserves, as the reserves are based on assumptions developed using historical experience, current contractual requirements, specific known market events and payment patterns. This in turn led to a high degree of auditor judgment, subjectivity and effort in applying procedures related to these assumptions.
Addressing the matter involved performing procedures and evaluating audit evidence in connection with forming our overall opinion on the consolidated financial statements. These procedures included testing the effectiveness of controls relating to the reserves for Medicaid and managed care rebates, including controls over the assumptions used to estimate these rebate reserves. These procedures also included, among others, (i) developing an independent estimate of the rebate reserves by utilizing third party data related to product demand, data related to price changes, the terms of the specific rebate programs, the historical trend of actual rebate claims paid and
F- 81
consideration of contractual requirement changes and market events; (ii) comparing the independent estimate to management’s estimate, and (iii) testing rebate claims paid by the Company, including evaluating the claims for consistency with the contractual terms of the Company’s rebate agreements.
/s/PricewaterhouseCoopers LLP
Boston, Massachusetts
February 6, 2020
We have served as the Company's auditor since 2003.
F- 82