UNITED STATES
SECURITIES AND EXCHANGE COMMISSION
WASHINGTON, D.C. 20549
____________________________________
FORM 10-K
_____________________________________
ANNUAL REPORT PURSUANT TO SECTION 13 OR 15(d) OF THE SECURITIES EXCHANGE ACT OF 1934 | |
For the Fiscal Year Ended December 31, 2019
-OR-
TRANSITION REPORT FILED PURSUANT TO SECTION 13 OR 15(d) OF THE SECURITIES EXCHANGE ACT OF 1934 | |
Commission file number 1-12291

(Exact name of registrant as specified in its charter)
(State or other jurisdiction of incorporation or organization) | (I.R.S. Employer Identification No.) | |
(Address of principal executive offices) | (Zip Code) | ||
Registrant's telephone number, including area code: | ||
Securities registered pursuant to Section 12(b) of the Act: | ||
Title of Each Class | Trading Symbol(s) | Name of Each Exchange on Which Registered |
Securities registered pursuant to Section 12(g) of the Act: None
Indicate by check mark if the Registrant is a well-known seasoned issuer, as defined in Rule 405 of the Securities Act. Yes ☒ No ☐
Indicate by check mark if the Registrant is not required to file reports pursuant to Section 13 or Section 15 (d) of the Act. Yes ☐ No ☒
Indicate by check mark whether the registrant (1) has filed all reports required to be filed by Section 13 or 15(d) of the Securities Exchange Act of 1934 during the preceding 12 months (or for such shorter period that the registrant was required to file such reports), and (2) has been subject to such filing requirements for the past 90 days. Yes ☒ No ☐
Indicate by check mark whether the registrant has submitted electronically every Interactive Data File required to be submitted pursuant to Rule 405 of Regulation S-T (§232.405 of this chapter) during the preceding 12 months (or for such shorter period that the registrant was required to submit such files). Yes ☒ No ☐
Indicate by check mark whether the registrant is a large accelerated filer, an accelerated filer, a non-accelerated filer, a smaller reporting company, or an emerging growth company. See the definitions of “large accelerated filer,” “accelerated filer,” “smaller reporting company,” and “emerging growth company” in Rule 12b-2 of the Exchange Act.
☒ | Accelerated filer | ☐ | Smaller reporting company | Emerging growth company | Non-accelerated filer | ☐ | |||
If an emerging growth company, indicate by check mark if the registrant has elected not to use the extended transition period for complying with any new or revised financial accounting standards provided pursuant to Section 13(a) of the Exchange Act. ☐
Indicate by check mark whether the Registrant is a shell company (as defined in Rule 12b-2 of the Exchange Act). Yes ☐ No ☒
The aggregate market value of the voting and non-voting common equity held by non-affiliates on June 28, 2019, the last business day of the Registrant's most recently completed second fiscal quarter (based on the adjusted closing sale price of $16.38 of the Registrant's Common Stock, as reported by the New York Stock Exchange on such date) was approximately $10.87 billion.
The number of shares outstanding of Registrant's Common Stock, par value $0.01 per share, on February 20, 2020 was 664,036,935 .
DOCUMENTS INCORPORATED BY REFERENCE
Portions of Registrant's Proxy Statement for its 2020 annual meeting of stockholders are incorporated by reference in Parts II and III
The AES Corporation Fiscal Year 2019 Form 10-K
Table of Contents
PART IV - ITEM 15. EXHIBITS AND FINANCIAL STATEMENT SCHEDULE | |
1 | 2019 Annual Report | |
Glossary of Terms
The following terms and abbreviations appear in the text of this report and have the definitions indicated below:
Adjusted EPS | Adjusted Earnings Per Share, a non-GAAP measure |
Adjusted PTC | Adjusted Pre-tax Contribution, a non-GAAP measure of operating performance |
AES | The Parent Company and its subsidiaries and affiliates |
AFUDC | Allowance for Funds Used During Construction |
AOCL | Accumulated Other Comprehensive Loss |
ASC | Accounting Standards Codification |
ASEP | National Authority of Public Services in Panama |
BACT | Best Available Control Technology |
BART | Best Available Retrofit Technology |
BOT | Build, Operate and Transfer |
BTA | Best Technology Available |
CAA | U.S. Clean Air Act |
CAMMESA | Wholesale Electric Market Administrator in Argentina |
CCGT | Combined Cycle Gas Turbine |
CCR | Coal Combustion Residuals, which includes bottom ash, fly ash and air pollution control wastes generated at coal-fired generation plant sites |
CDPQ | La Caisse de dépôt et placement du Quebéc |
CEN | Coordinador Electrico Nacional in Chile |
CEO | Chief Executive Officer |
CFE | Federal Electricity Commission in Mexico |
CHP | Combined Heat and Power |
CO2 | Carbon Dioxide |
COSO | Committee of Sponsoring Organizations of the Treadway Commission |
CPI | U.S. Consumer Price Index |
CPP | U.S. Clean Power Plan |
CREG | Regulatory commission of energy and gas in Colombia |
CRES | Competitive Retail Electric Service |
CSAPR | U.S. Cross-State Air Pollution Rule |
CTNG | Compañia Transmisora del Norte Grande |
CWA | U.S. Clean Water Act |
DG Comp | Directorate-General for Competition of the European Commission |
DMR | Distribution Modernization Rider |
DP&L | The Dayton Power & Light Company |
DPL | DPL Inc. |
DPP | Dominican Power Partners |
EPA | U.S. Environmental Protection Agency |
EPC | Engineering, Procurement, and Construction |
ERCOT | Electric Reliability Council of Texas |
ESP | Electric Security Plan |
EU | European Union |
EURIBOR | Euro Inter Bank Offered Rate |
EUSGU | Electric Utility Steam Generating Unit |
EVN | Electricity of Vietnam |
FERC | U.S. Federal Energy Regulatory Commission |
FGD | Flue gas desulphurization |
FONINVEMEM | Fund for the Investment Needed to Increase the Supply of Electricity in the Wholesale Market in Argentina |
FPA | U.S. Federal Power Act |
FX | Foreign Exchange |
GAAP | Generally Accepted Accounting Principles in the United States |
GDPR | EU General Data Protection Regulation |
GHG | Greenhouse Gas |
GILTI | Global Intangible Low Taxed Income |
GRIDCO | Grid Corporation of Odisha Ltd. |
GWh | Gigawatt Hours |
HLBV | Hypothetical Liquidation Book Value |
IDEM | Indiana Department of Environmental Management |
ITC | Imputed Tax Credit |
IPALCO | IPALCO Enterprises, Inc. |
IPL | Indianapolis Power & Light Company |
IPP | Independent Power Producers |
I-SEM | Integrated Single Electricity Market in Ireland |
ISO | Independent System Operator |
IURC | Indiana Utility Regulatory Commission |
LIBOR | London Inter Bank Offered Rate |
2 | 2019 Annual Report | |
LNG | Liquefied Natural Gas |
MISO | Midcontinent Independent System Operator, Inc. |
MRE | Energy Reallocation Mechanism |
MW | Megawatts |
MWh | Megawatt Hours |
NAAQS | U.S. National Ambient Air Quality Standards |
NCI | Noncontrolling Interest |
NCRE | Non-Conventional Renewable Energy |
NEK | Natsionalna Elektricheska Kompania (state-owned electricity public supplier in Bulgaria) |
NEPCO | State-owned National Electric Power Company in Jordan |
NERC | North American Electric Reliability Corporation |
NM | Not Meaningful |
NOV | Notice of Violation |
NOX | Nitrogen Dioxide |
NPDES | National Pollutant Discharge Elimination System |
NSPS | New Source Performance Standards |
O&M | Operations and Maintenance |
OERC | Orissa Electricity Regulatory Commission in India |
ONS | National System Operator in Brazil |
OPGC | Odisha Power Generation Corporation, Ltd. |
OTC Policy | Statewide Water Quality Control Policy on the Use of Coastal and Estuarine Waters for Power Plant Cooling |
OVEC | Ohio Valley Electric Corporation, an electric generating company in which DP&L has a 4.9% interest |
Parent Company | The AES Corporation |
PCU | Performance Cash Units |
Pet Coke | Petroleum Coke |
PJM | PJM Interconnection, LLC |
PPA | Power Purchase Agreement |
PREPA | Puerto Rico Electric Power Authority |
PSD | Prevention of Significant Deterioration |
PSU | Performance Stock Unit |
PUCO | The Public Utilities Commission of Ohio |
PURPA | U.S. Public Utility Regulatory Policies Act |
QF | Qualifying Facility |
RMRR | Routine Maintenance, Repair and Replacement |
RSU | Restricted Stock Unit |
RTO | Regional Transmission Organization |
SADI | Argentine Interconnected System |
SBU | Strategic Business Unit |
SCE | Southern California Edison |
SEC | U.S. Securities and Exchange Commission |
SEN | Sistema Electrico Nacional in Chile |
SIC | Central Interconnected Electricity System in Chile |
SIN | National Interconnected System in Colombia |
SING | Northern Interconnected Electricity System in Chile |
SIP | State Implementation Plan |
SNE | National Secretary of Energy in Panama |
SO2 | Sulfur Dioxide |
SSO | Standard Service Offer |
SWRCB | California State Water Resources Board |
TCJA | U.S. Tax Cuts and Jobs Act |
U.S. | United States |
UK | United Kingdom |
USD | United States Dollar |
VAT | Value Added Tax |
VIE | Variable Interest Entity |
Vinacomin | Vietnam National Coal-Mineral Industries Holding Corporation Ltd. |
YPF | Argentina state-owned gas company |
3 | 2019 Annual Report | |
PART I
In this Annual Report the terms “AES,” “the Company,” “us,” or “we” refer to The AES Corporation and all of its subsidiaries and affiliates, collectively. The terms “The AES Corporation” and “Parent Company” refer only to the parent, publicly held holding company, The AES Corporation, excluding its subsidiaries and affiliates.
Forward-Looking Information
In this filing we make statements concerning our expectations, beliefs, plans, objectives, goals, strategies, and future events or performance. Such statements are “forward-looking statements” within the meaning of the Private Securities Litigation Reform Act of 1995. Although we believe that these forward-looking statements and the underlying assumptions are reasonable, we cannot assure you that they will prove to be correct.
Forward-looking statements involve a number of risks and uncertainties, and there are factors that could cause actual results to differ materially from those expressed or implied in our forward-looking statements. Some of those factors (in addition to others described elsewhere in this report and in subsequent securities filings) include:
• | the economic climate, particularly the state of the economy in the areas in which we operate and the state of the economy in China, which impacts demand for electricity in many of our key markets, including the fact that the global economy faces considerable uncertainty for the foreseeable future, which further increases many of the risks discussed in this Form 10-K; |
• | changes in inflation, demand for power, interest rates and foreign currency exchange rates, including our ability to hedge our interest rate and foreign currency risk; |
• | changes in the price of electricity at which our generation businesses sell into the wholesale market and our utility businesses purchase to distribute to their customers, and the success of our risk management practices, such as our ability to hedge our exposure to such market price risk; |
• | changes in the prices and availability of coal, gas and other fuels (including our ability to have fuel transported to our facilities) and the success of our risk management practices, such as our ability to hedge our exposure to such market price risk, and our ability to meet credit support requirements for fuel and power supply contracts; |
• | changes in and access to the financial markets, particularly changes affecting the availability and cost of capital in order to refinance existing debt and finance capital expenditures, acquisitions, investments and other corporate purposes; |
• | our ability to fulfill our obligations, manage liquidity and comply with covenants under our recourse and non-recourse debt, including our ability to manage our significant liquidity needs and to comply with covenants under our senior secured credit facility and other existing financing obligations; |
• | our ability to receive funds from our subsidiaries by way of dividends, fees, interest, loans or otherwise; |
• | changes in our or any of our subsidiaries' corporate credit ratings or the ratings of our or any of our subsidiaries' debt securities or preferred stock, and changes in the rating agencies' ratings criteria; |
• | our ability to purchase and sell assets at attractive prices and on other attractive terms; |
• | our ability to compete in markets where we do business; |
• | our ability to operate power generation, distribution and transmission facilities, including managing availability, outages and equipment failures; |
• | our ability to manage our operational and maintenance costs and the performance and reliability of our generating plants, including our ability to reduce unscheduled down times; |
• | our ability to enter into long-term contracts, which limit volatility in our results of operations and cash flow, such as PPAs, fuel supply, and other agreements and to manage counterparty credit risks in these agreements; |
• | variations in weather, especially mild winters and cooler summers in the areas in which we operate, the occurrence of difficult hydrological conditions for our hydropower plants, as well as hurricanes and other storms and disasters, wildfires and low levels of wind or sunlight for our wind and solar facilities; |
• | the performance of our contracts by our contract counterparties, including suppliers or customers; |
• | severe weather and natural disasters; |
4 | 2019 Annual Report | |
• | our ability to raise sufficient capital to fund development projects or to successfully execute our development projects; |
• | the success of our initiatives in renewable energy projects and energy storage projects; |
• | the availability of government incentives or policies that support the development of renewable energy generation projects; |
• | our ability to keep up with advances in technology; |
• | changes in number of customers or in customer usage; |
• | the operations of our joint ventures and equity method investments that we do not control; |
• | our ability to achieve reasonable rate treatment in our utility businesses; |
• | changes in laws, rules and regulations affecting our international businesses, particularly in developing countries; |
• | changes in laws, rules and regulations affecting our utilities businesses, including, but not limited to, regulations which may affect competition, the ability to recover net utility assets and other potential stranded costs by our utilities; |
• | changes in law resulting from new local, state, federal or international energy legislation and changes in political or regulatory oversight or incentives affecting our wind business and solar projects, our other renewables projects and our initiatives in GHG reductions and energy storage, including government policies or tax incentives; |
• | changes in environmental laws, including requirements for reduced emissions, GHG legislation, regulation, and/or treaties and CCR regulation and remediation; |
• | changes in tax laws, including U.S. tax reform, and challenges to our tax positions; |
• | the effects of litigation and government and regulatory investigations; |
• | the performance of our acquisitions; |
• | our ability to maintain adequate insurance; |
• | decreases in the value of pension plan assets, increases in pension plan expenses, and our ability to fund defined benefit pension and other postretirement plans at our subsidiaries; |
• | losses on the sale or write-down of assets due to impairment events or changes in management intent with regard to either holding or selling certain assets; |
• | changes in accounting standards, corporate governance and securities law requirements; |
• | our ability to maintain effective internal controls over financial reporting; |
• | our ability to attract and retain talented directors, management and other personnel; |
• | cyber-attacks and information security breaches; and |
• | data privacy. |
These factors, in addition to others described elsewhere in this Form 10-K, including those described under Item 1A.—Risk Factors and in subsequent securities filings, should not be construed as a comprehensive listing of factors that could cause results to vary from our forward-looking information.
We undertake no obligation to publicly update or revise any forward-looking statements, whether as a result of new information, future events, or otherwise. If one or more forward-looking statements are updated, no inference should be drawn that additional updates will be made with respect to those or other forward-looking statements.
ITEM 1. BUSINESS
Item 1.—Business is an outline of our strategy and our businesses by SBU, including key financial drivers. Additional items that may have an impact on our businesses are discussed in Item 1A.—Risk Factors and Item 3.—Legal Proceedings.
Executive Summary
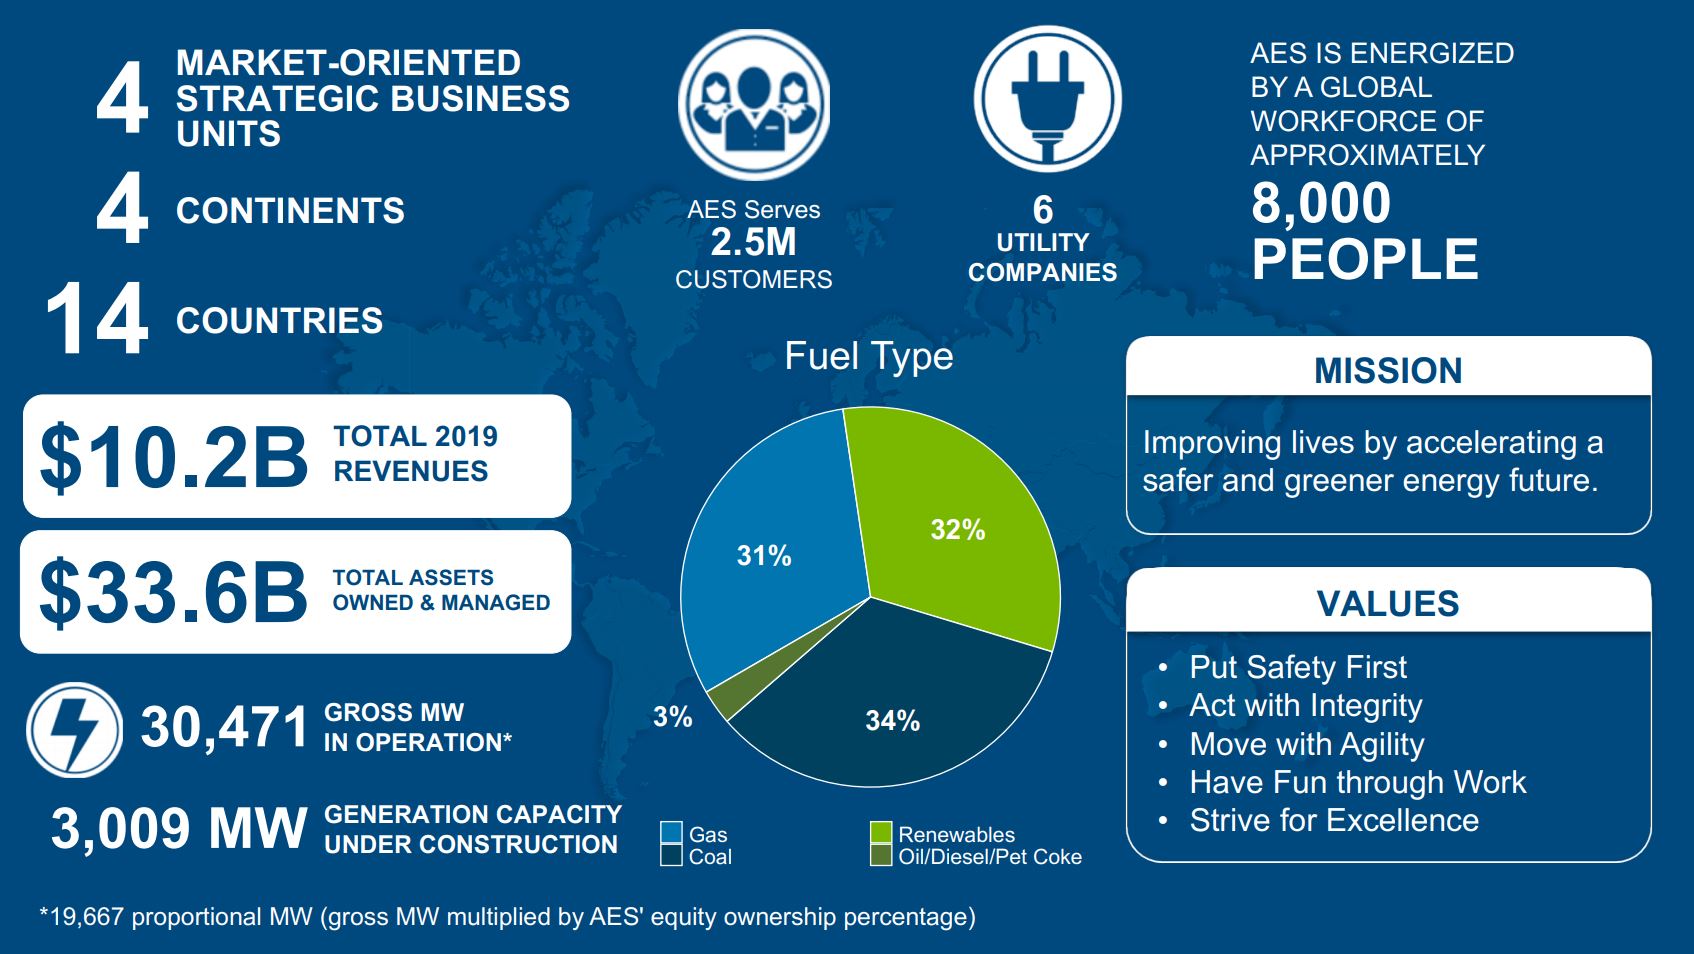
Incorporated in 1981, AES is a power generation and utility company, providing affordable, sustainable energy through our diverse portfolio of renewable and thermal generation facilities and distribution businesses. Our mission is to improve lives by accelerating a safer and greener energy future. We do this by leveraging our unique electricity
5 | 2019 Annual Report | |
platforms and the knowledge of our people to provide the energy and infrastructure solutions our customers need. Our people share a passion to help meet the world's current and increasing energy needs, while providing communities and countries the opportunity for economic growth through the availability of reliable, affordable electric power.
Our Strategy
AES is leading the energy transition by investing in sustainable growth and innovative solutions to deliver superior results. We are taking advantage of favorable trends in clean power generation, transmission and distribution, and LNG infrastructure.
Through our presence in key growth markets, we are well-positioned to benefit from the global transition toward a more sustainable power generation mix. Our robust backlog of projects under construction or under signed PPAs continues to increase, driven by our focus on select markets where we can take advantage of our global scale and synergies with our existing businesses. In 2019, we signed long-term PPAs for 2.8 GW, representing 9% of our existing capacity, and we are on pace to sign 2 to 3 GW of new PPAs annually through 2022.
We are enhancing some of our current contracts by extending existing PPAs and adding renewable energy. We call this approach Green Blend and Extend. With this strategy, we leverage our existing platforms, contracts and relationships to grow our business, while meeting our customers' energy needs on a reliable and sustainable basis. We are negotiating new long-term renewable PPAs with existing customers, which preserves the value of thermal contracts and creates incremental value with long-term contracted renewables. Customers receive carbon-free energy at less than the marginal cost of thermal power, enabling them to meet their sustainability goals and affordable energy needs. We are executing on this strategy in Chile and Mexico and see significant potential additional opportunities in those markets, as well as in the United States.
We are facilitating access to reliable and affordable cleaner energy through our LNG import terminals, allowing the displacement of the use of heavy fuel oil and diesel. We have two LNG regasification terminals in Central America and the Caribbean, with a total of 150 TBTU of LNG storage capacity. These terminals were built to supply not only the gas for our co-located combined cycle plants, but also to meet the growing demand for natural gas in the region. In order to meet this demand, we are expanding our capacity in the Dominican Republic by adding a second storage tank with 50 TBTU of additional capacity and we recently completed construction of a pipeline that will transport natural gas from our LNG terminal to several power plants in the country.
6 | 2019 Annual Report | |
We are replicating our success with LNG infrastructure in the Dominican Republic and Panama by developing a similar project, on a larger scale, in Vietnam. This project will have 480 TBTU of LNG storage capacity co-located with 2.2 GW of combined cycle plants. The project will have substantial excess LNG capacity to help meet demand for natural gas in Vietnam and the power plants will have 20-year contracts with the Government of Vietnam.
At our utilities, we are accelerating growth through grid modernization and infrastructure investments to replace outdated networks. During the year, Indianapolis Power & Light filed a $1.2 billion seven-year plan with the Indiana Utility Regulatory Commission. We see similar growth opportunities at Dayton Power & Light in Ohio.
We are developing and deploying innovative solutions such as battery-based energy storage, digital customer interfaces and energy management. These solutions are scalable and capital light, allowing us to work with our customers to deliver results that meet their requirements.
As a result of executing on our strategy, we are targeting a 50% reduction in carbon intensity by 2022 and a 70% reduction by 2030, both off a 2016 base. Further, we intend to reduce our coal-fired generation below 30% of our total generation volume by year-end 2020 and below 10% by 2030 (based on the expected portfolio as of year-end, adjusted for any announced asset sales at that time).
Strategic Highlights
In 2019, we achieved significant milestones on our strategic objectives, including:
Sustainable Growth
• | As of December 31, 2019, our backlog of 6,145 MW includes: |
◦ | 3,009 MW under construction and coming on-line through 2021; and |
◦ | 3,136 MW of renewables signed under long-term PPAs |
• | We completed construction of 2,181 MW of new projects, including: |
◦ | 1,320 MW OPGC 2 plant in India; and |
◦ | 861 MW of solar, wind and energy storage globally |
• | We finalized a joint venture in the Dominican Republic to expand our LNG capacity by 50 TBTU |
• | We received approval from the Government of Vietnam to develop the 2.2 GW Son My 2 combined cycle gas turbine (CCGT) power plant |
Innovative Solutions
• | Our joint venture with Siemens, Fluence, is the global leader in the fast-growing energy storage market, which is expected to increase from 6 GW of installed capacity in 2017, to more than 40 GW by 2022 |
◦ | Fluence has been awarded or delivered 1.7 GW of projects, including 961 MW awarded in 2019 |
• | We announced the merger of Simple Energy to form Uplight, which is the market leader in providing cloud-based digital energy solutions in the U.S. |
• | We formed a 10-year strategic alliance with Google to develop and implement solutions to enable broad adoption of clean energy |
Superior Results
• | Following our efforts to strengthen our balance sheet, our Parent Company credit rating was upgraded to investment grade (BBB-) by Fitch and our BB+ credit rating was raised to Positive outlook by S&P |
• | We are executing on $100 million in annual run rate cost savings from digital initiatives, including utilizing data and technology for maintenance, outage prevention, inspection and procurement, to be realized by 2022 |
Overview
Generation
We currently own and/or operate a generation portfolio of 30,471 MW, including generation from our one integrated utility, IPL. Our generation fleet is diversified by fuel type. See discussion below under Fuel Costs.
Performance drivers of our generation businesses include types of electricity sales agreements, plant reliability and flexibility, availability of generation capacity to meet contracted sales, fuel costs, seasonality, weather variations and economic activity, fixed-cost management, and competition.
7 | 2019 Annual Report | |
Contract Sales — Most of our generation businesses sell electricity under medium- or long-term contracts ("contract sales") or under short-term agreements in competitive markets ("short-term sales"). Our medium-term contract sales have terms of two to five years, while our long-term contracts have terms of more than five years.
Contracts requiring fuel to generate energy, such as natural gas or coal, are structured to recover variable costs, including fuel and variable O&M costs, either through direct or indexation-based contractual pass-throughs or tolling arrangements. When the contract does not include a fuel pass-through, we typically hedge fuel costs or enter into fuel supply agreements for a similar contract period (see discussion below under Fuel Costs). These contracts also help us to fund a significant portion of the total capital cost of the project through long-term non-recourse project-level financing.
Certain contracts include capacity payments that cover projected fixed costs of the plant, including fixed O&M expenses, debt service, and a return on capital invested. In addition, most of our contracts require that the majority of the capacity payments be denominated in the currency matching our fixed costs.
Contracts that do not have significant fuel cost or do not contain a capacity payment are structured based on long-term spot prices with some negotiated pass-through costs, allowing us to recover expected fixed and variable costs as well as provide a return on investment.
These contracts are intended to reduce exposure to the volatility of fuel and electricity prices by linking the business's revenues and costs. We generally structure our business to eliminate or reduce foreign exchange risk by matching the currency of revenue and expenses, including fixed costs and debt. Our project debt may consist of both fixed and floating rate debt for which we typically hedge a significant portion of our exposure. Some of our contracted businesses also receive a regulated market-based capacity payment, which is discussed in more detail in the Short-Term Sales section below.
Thus, these contracts, or other related commercial arrangements, significantly mitigate our exposure to changes in power and, as applicable, fuel prices, currency fluctuations and changes in interest rates. In addition, these contracts generally provide for a recovery of our fixed operating expenses and a return on our investment, as long as we operate the plant to the reliability and efficiency standards required in the contract.
Short-Term Sales — Our other generation businesses sell power and ancillary services under short-term contracts with average terms of less than two years, including spot sales, directly in the short-term market or at regulated prices. The short-term markets are typically administered by a system operator to coordinate dispatch. Short-term markets generally operate on merit order dispatch, where the least expensive generation facilities, based upon variable cost or bid price, are dispatched first and the most expensive facilities are dispatched last. The short-term price is typically set at the marginal cost of energy or bid price (the cost of the last plant required to meet system demand). As a result, the cash flows and earnings associated with these businesses are more sensitive to fluctuations in the market price for electricity. In addition, many of these wholesale markets include markets for ancillary services to support the reliable operation of the transmission system. Across our portfolio, we provide a wide array of ancillary services, including voltage support, frequency regulation and spinning reserves.
Many of the short-term markets in which we operate include regulated capacity markets. These capacity markets are intended to provide additional revenue based upon availability without reliance on the energy margin from the merit order dispatch. Capacity markets are typically priced based on the cost of a new entrant and the system capacity relative to the desired level of reserve margin (generation available in excess of peak demand). Our generating facilities selling in the short-term markets typically receive capacity payments based on their availability in the market.
Plant Reliability and Flexibility — Our contract and short-term sales provide incentives to our generation plants to optimally manage availability, operating efficiency and flexibility. Capacity payments under contract sales are frequently tied to meeting minimum standards. In short-term sales, our plants must be reliable and flexible to capture peak market prices and to maximize market-based revenues. In addition, our flexibility allows us to capture ancillary service revenue while meeting local market needs.
Fuel Costs — For our thermal generation plants, fuel is a significant component of our total cost of generation. For contract sales, we often enter into fuel supply agreements to match the contract period, or we may financially hedge our fuel costs. Some of our contracts include indexation for fuels. In those cases, we seek to match our fuel supply agreements to the indexation. For certain projects, we have tolling arrangements where the power offtaker is responsible for the supply and cost of fuel to our plants.
8 | 2019 Annual Report | |
In short-term sales, we sell power at market prices that are generally reflective of the market cost of fuel at the time, and thus procure fuel supply on a short-term basis, generally designed to match up with our market sales profile. Since fuel price is often the primary determinant for power prices, the economics of projects with short-term sales are often subject to volatility of relative fuel prices. For further information regarding commodity price risk please see Item 7A.—Quantitative and Qualitative Disclosures about Market Risk in this Form 10-K.
31% of the capacity of our generation plants are fueled by natural gas. Generally, we use gas from local suppliers in each market. A few exceptions to this are AES Gener in Chile, where we purchase imported gas from third parties, and our plants in the Dominican Republic and Panama, where we import LNG to utilize in the local market.
34% of the capacity of our generation fleet is coal-fired. In the U.S., most of our coal-fired plants are supplied from domestic coal. At our non-U.S. generation plants, and at our plants in Hawaii and Puerto Rico, we source coal internationally. Across our fleet, we utilize our global sourcing program to maximize the purchasing power of our fuel procurement.
32% of the capacity of our generation plants are fueled by renewables, including hydro, solar, wind, energy storage, biomass and landfill gas, which do not have significant fuel costs.
3% of the capacity of our generation fleet utilizes pet coke, diesel or oil for fuel. We source oil and diesel locally at prices linked to international markets. We largely source pet coke from Mexico and the U.S.
Seasonality, Weather Variations and Economic Activity — Our generation businesses are affected by seasonal weather patterns and, therefore, operating margin is not generated evenly throughout the year. Additionally, weather variations, including temperature, solar and wind resources, and hydrological conditions, may also have an impact on generation output at our renewable generation facilities. In competitive markets for power, local economic activity can also have an impact on power demand and short-term prices for power.
Fixed-Cost Management — In our businesses with long-term contracts, the majority of the fixed O&M costs are recovered through the capacity payment. However, for all generation businesses, managing fixed costs and reducing them over time is a driver of business performance.
Competition — For our businesses with medium- or long-term contracts, there is limited competition during the term of the contract. For short-term sales, plant dispatch and the price of electricity are determined by market competition and local dispatch and reliability rules.
Utilities
AES' six utility businesses distribute power to 2.5 million people in two countries. AES' two utilities in the U.S. also include generation capacity totaling 4,102 MW. Our utility businesses consist of IPL and DP&L in the U.S. and four utilities in El Salvador.
IPL, our fully integrated utility, and DP&L, our transmission and distribution regulated utility, operate as the sole distributors of electricity within their respective jurisdictions. IPL owns and operates all of the facilities necessary to generate, transmit and distribute electricity. DP&L owns and operates all of the facilities necessary to transmit and distribute electricity. At our distribution business in El Salvador, we face limited competition due to significant barriers to enter the market. According to El Salvador's regulation, large regulated customers have the option of becoming unregulated users and requesting service directly from generation or commercialization agents.
In general, our utilities sell electricity directly to end-users, such as homes and businesses, and bill customers directly. Key performance drivers for utilities include the regulated rate of return and tariff, seasonality, weather variations, economic activity and reliability of service. Revenue from utilities is classified as regulated on the Consolidated Statements of Operations.
Regulated Rate of Return and Tariff — In exchange for the right to sell or distribute electricity in a service territory, our utility businesses are subject to government regulation. This regulation sets the framework for the prices ("tariffs") that our utilities are allowed to charge customers for electricity and establishes service standards that we are required to meet.
Our utilities are generally permitted to earn a regulated rate of return on assets, determined by the regulator based on the utility's allowed regulatory asset base, capital structure and cost of capital. The asset base on which the utility is permitted a return is determined by the regulator, within the framework of applicable local laws, and is based on the amount of assets that are considered used and useful in serving customers. Both the allowed return
9 | 2019 Annual Report | |
and the asset base are important components of the utility's earning power. The allowed rate of return and operating expenses deemed reasonable by the regulator are recovered through the regulated tariff that the utility charges to its customers.
The tariff may be reviewed and reset by the regulator from time to time depending on local regulations, or the utility may seek a change in its tariffs. The tariff is generally based upon usage level and may include a pass-through of costs that are not controlled by the utility, such as the costs of fuel (in the case of integrated utilities) and/or the costs of purchased energy, to the customer. Components of the tariff that are directly passed through to the customer are usually adjusted through a summary regulatory process or an existing formula-based mechanism. In some regulatory regimes, customers with demand above an established level are unregulated and can choose to contract directly with the utility or with other retail energy suppliers and pay non-bypassable fees, which are fees to the distribution company for use of its distribution system.
The regulated tariff generally recognizes that our utility businesses should recover certain operating and fixed costs, as well as manage uncollectible amounts, quality of service and technical and non-technical losses. Utilities, therefore, need to manage costs to the levels reflected in the tariff, or risk non-recovery of costs or diminished returns.
Seasonality, Weather Variations, and Economic Activity — Our utility businesses are generally affected by seasonal weather patterns and, therefore, operating margin is not generated evenly throughout the year. Additionally, weather variations may also have an impact based on the number of customers, temperature variances from normal conditions, and customers' historic usage levels and patterns. Retail sales, after adjustments for weather variations, are also affected by changes in local economic activity, energy efficiency and distributed generation initiatives, as well as the number of retail customers.
Reliability of Service — Our utility businesses must meet certain reliability standards, such as duration and frequency of outages. Those standards may be explicit, with defined performance incentives or penalties, or implicit, where the utility must operate to meet customer and/or regulator expectations.
Development and Construction
We develop and construct new generation facilities. For our utility business, new plants may be built or existing plants retrofitted in response to customer needs or to comply with regulatory developments. The projects are developed subject to regulatory approval that permits recovery of our capital cost and a return on our investment. For our generation businesses, our priority for development is in key growth markets, where we can leverage our global scale and synergies with our existing businesses by adding renewable energy. We make the decision to invest in new projects by evaluating the strategic fit, project returns and financial profile against a fair risk-adjusted return for the investment and against alternative uses of capital, including corporate debt repayment.
In some cases, we enter into long-term contracts for output from new facilities prior to commencing construction. To limit required equity contributions from The AES Corporation, we also seek non-recourse project debt financing and other sources of capital, including partners, when it is commercially attractive. We typically contract with a third party to manage construction, although our construction management team supervises the construction work and tracks progress against the project's budget and the required safety, efficiency and productivity standards.
Segments
The segment reporting structure uses the Company's management reporting structure as its foundation to reflect how the Company manages the business internally. It is organized by geographic regions, which provides a socio-political-economic understanding of our business.
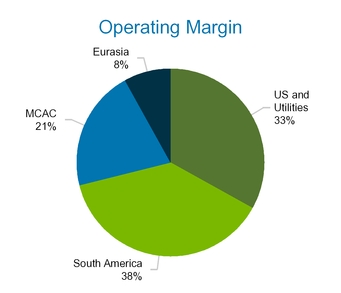
We are organized into four market-oriented SBUs: US and Utilities (United States, Puerto Rico and El Salvador); South America (Chile, Colombia, Argentina and Brazil); MCAC (Mexico, Central America and the Caribbean); and Eurasia (Europe and Asia) — which are led by our SBU Presidents. We have two lines of business: generation and utilities. Each of our SBUs participates in our first business line, generation, in which we own and/or operate power plants to generate and sell power to customers, such as utilities, industrial users, and other intermediaries. Our US and Utilities SBU participates in our second business line, utilities, in which we own and/or operate utilities to generate or purchase, distribute, transmit and sell electricity to end-user customers in the residential, commercial, industrial and governmental sectors within a defined service area. In certain circumstances, our utilities also generate and sell electricity on the wholesale market.
10 | 2019 Annual Report | |
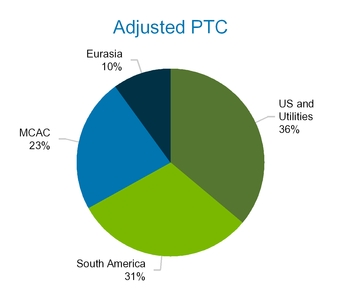
We measure the operating performance of our SBUs using Adjusted PTC, a non-GAAP measure. The Adjusted PTC by SBU for the year ended December 31, 2019 is shown below. The percentages for Adjusted PTC are the contribution by each SBU to the gross metric, i.e., the total Adjusted PTC by SBU, before deductions for Corporate. See Item 7.—Management's Discussion and Analysis of Financial Condition and Results of Operations—SBU Performance Analysis of this Form 10-K for reconciliation and definitions of Adjusted PTC.
For financial reporting purposes, the Company's corporate activities and certain other investments are reported within "Corporate and Other" because they do not require separate disclosure. See Item 7.—Management's Discussion and Analysis of Financial Condition and Results of Operations and Note 18—Segment and Geographic Information included in Item 8.—Financial Statements and Supplementary Data of this Form 10-K for further discussion of the Company's segment structure.
11 | 2019 Annual Report
(1) Non-GAAP measure. See Item 7.—Management’s Discussion and Analysis of Financial Condition and Results of Operations—SBU Performance Analysis—Non-GAAP Measures for reconciliation and definition. | |
12 | 2019 Annual Report | |
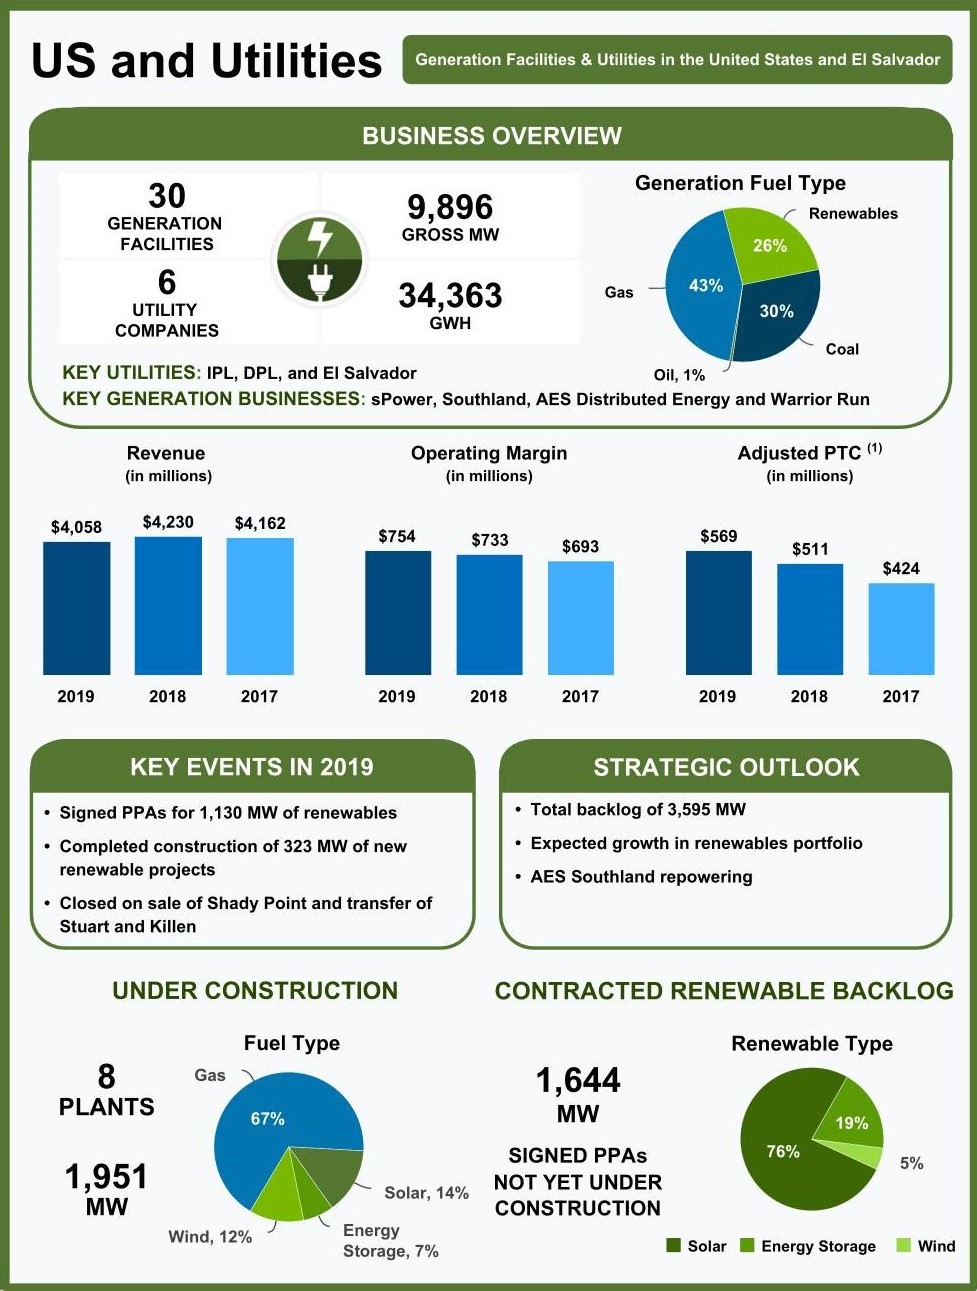
US and Utilities SBU
Our US and Utilities SBU has 30 generation facilities, two utilities in the United States, and four utilities in El Salvador.
Generation — Operating installed capacity of our US and Utilities SBU totals 9,896 MW. IPALCO (IPL's parent), DP&L, and DPL Inc. (DP&L's parent) are all SEC registrants, and as such, follow the public filing requirements of the Securities Exchange Act of 1934. The following table lists our US and Utilities SBU generation facilities:
Business | Location | Fuel | Gross MW | AES Equity Interest | Year Acquired or Began Operation | Contract Expiration Date | Customer(s) | |||||||||
Bosforo (1) | El Salvador | Solar | 100 | 50 | % | 2018-2019 | 2043-2044 | CAESS, EEO, CLESA, DEUSEM | ||||||||
AES Nejapa | El Salvador | Landfill Gas | 6 | 100 | % | 2011 | 2035 | CAESS | ||||||||
Moncagua | El Salvador | Solar | 3 | 100 | % | 2015 | 2035 | EEO | ||||||||
El Salvador Subtotal | 109 | |||||||||||||||
Southland—Alamitos | US-CA | Gas | 1,200 | 100 | % | 1998 | 2020 | Southern California Edison | ||||||||
sPower OpCo A (1) | US-Various | Solar | 1,101 | 26 | % | 2017-2019 | 2028-2046 | Various | ||||||||
Southland—Redondo Beach | US-CA | Gas | 876 | 100 | % | 1998 | 2020 | EDF Energy Services, LLC, Clean Power Alliance of Southern California | ||||||||
AES Puerto Rico | US-PR | Coal | 524 | 100 | % | 2002 | 2027 | Puerto Rico Electric Power Authority | ||||||||
Southland—Huntington Beach | US-CA | Gas | 236 | 100 | % | 1998 | 2020 | Southern California Edison | ||||||||
Buffalo Gap II (2) | US-TX | Wind | 233 | 100 | % | 2007 | ||||||||||
AES Distributed Energy (AES DE) (2) | US-Various | Solar | 214 | 100 | % | 2015-2019 | 2029-2042 | Utility, Municipality, Education, Non-Profit | ||||||||
Energy Storage | 4 | |||||||||||||||
Hawaii | US-HI | Coal | 206 | 100 | % | 1992 | 2022 | Hawaiian Electric Co. | ||||||||
Warrior Run | US-MD | Coal | 205 | 100 | % | 2000 | 2030 | Potomac Edison | ||||||||
Buffalo Gap III (2) | US-TX | Wind | 170 | 100 | % | 2008 | ||||||||||
sPower OpCo A (1) | US-Various | Wind | 140 | 26 | % | 2017 | 2036 | Various | ||||||||
sPower OpCo B (1) | US-Various | Solar | 126 | 50 | % | 2019 | 2039-2044 | Various | ||||||||
Buffalo Gap I (2) | US-TX | Wind | 115 | 100 | % | 2006 | 2021 | Direct Energy | ||||||||
Laurel Mountain | US-WV | Wind | 98 | 100 | % | 2011 | ||||||||||
Mountain View I & II | US-CA | Wind | 65 | 100 | % | 2008 | 2021 | Southern California Edison | ||||||||
Mountain View IV | US-CA | Wind | 49 | 100 | % | 2012 | 2032 | Southern California Edison | ||||||||
Lawa'i (AES DE) (2) | US-HI | Solar | 20 | 100 | % | 2018 | 2043 | Kaua'i Island Utility Cooperative | ||||||||
Energy Storage | 20 | |||||||||||||||
Kekaha (AES DE) (2) | US-HI | Solar | 14 | 100 | % | 2019 | 2045 | Kaua'i Island Utility Cooperative | ||||||||
Energy Storage | 14 | |||||||||||||||
Ilumina | US-PR | Solar | 24 | 100 | % | 2012 | 2032 | Puerto Rico Electric Power Authority | ||||||||
Laurel Mountain ES | US-WV | Energy Storage | 16 | 100 | % | 2011 | ||||||||||
AES Gilbert (Salt River) | US-AZ | Energy Storage | 10 | 100 | % | 2019 | 2039 | Salt River Project Agricultural Improvement & Power District | ||||||||
Warrior Run ES | US-MD | Energy Storage | 5 | 100 | % | 2016 | ||||||||||
United States Subtotal | 5,685 | |||||||||||||||
5,794 | ||||||||||||||||
_____________________________
(1) | Unconsolidated entity, accounted for as an equity affiliate. |
(2) | AES owns these assets together with third-party tax equity investors with variable ownership interests. The tax equity investors receive a portion of the economic attributes of the facilities, including tax attributes, that vary over the life of the projects. The proceeds from the issuance of tax equity are recorded as noncontrolling interest in the Company's Consolidated Balance Sheets. |
13 | 2019 Annual Report | |
Utilities — The following table lists our utilities and their generation facilities.
Business | Location | Approximate Number of Customers Served as of 12/31/2019 | GWh Sold in 2019 | Fuel | Gross MW | AES Equity Interest | Year Acquired or Began Operation | |||||||||||
CAESS | El Salvador | 614,000 | 2,111 | 75 | % | 2000 | ||||||||||||
CLESA | El Salvador | 422,000 | 964 | 80 | % | 1998 | ||||||||||||
DEUSEM | El Salvador | 84,000 | 143 | 74 | % | 2000 | ||||||||||||
EEO | El Salvador | 322,000 | 623 | 89 | % | 2000 | ||||||||||||
El Salvador Subtotal | 1,442,000 | 3,841 | ||||||||||||||||
DPL (1) | US-OH | 526,000 | 14,439 | Coal | 129 | 100 | % | 2011 | ||||||||||
IPL (2) | US-IN | 508,000 | 16,083 | Coal/Gas/Oil/Energy Storage | 3,973 | 70 | % | 2001 | ||||||||||
United States Subtotal | 1,034,000 | 30,522 | 4,102 | |||||||||||||||
2,476,000 | 34,363 | |||||||||||||||||
_____________________________
(1) | DPL's GWh sold in 2019 represent DP&L's (DPL's subsidiary) total transmission and distribution sales. DPL's wholesale revenues and DP&L's Standard Service Offer (SSO) utility revenues, which are sales to utility customers who use DP&L to source their electricity through a competitive bid process, were 3,913 GWh in 2019. DPL's other primary subsidiary, AES Ohio Generation, LLC, owns an undivided interest in Conesville Unit 4. In October 2018, the co-owner of Conesville Unit 4 announced that the plant will be retired by May 2020. DP&L also owns a 4.9% equity ownership in OVEC, an electric generating company. OVEC has two plants in Cheshire, Ohio and Madison, Indiana with a combined generation capacity of approximately 2,109 MW. DP&L’s share of this generation is approximately 103 MW. |
(2) | CDPQ owns direct and indirect interests in IPALCO which total approximately 30%. AES owns 85% of AES US Investments and AES US Investments owns 82.35% of IPALCO. IPL plants: Georgetown, Harding Street, Petersburg and Eagle Valley. 20 MW of IPL total is considered a transmission asset. In December 2019, IPL announced it would be retiring Petersburg Unit 1 in June 2021 and Petersburg Unit 2 in June 2023, a total of 630 MW. IPL issued an all-source Request for Proposal in December 2019 in order to competitively procure replacement capacity. |
Under construction — The following table lists our plants under construction in the US and Utilities SBU:
Business | Location | Fuel | Gross MW | AES Equity Interest | Expected Date of Commercial Operations | |||||||
AES Distributed Energy (AES DE) | US-Various | Solar | 100 | 100 | % | 1H 2020-1H 2021 | ||||||
Energy Storage | 49 | 100 | % | 1H 2020-1H 2021 | ||||||||
Prevailing Winds (Basin Electric) (sPower) | US-SD | Wind | 200 | 50 | % | 1H 2020 | ||||||
Southland Repowering (1) | US-CA | Gas | 1,299 | 100 | % | 1H 2020 | ||||||
Na Pua Makani | US-HI | Wind | 28 | 100 | % | 1H 2020 | ||||||
Highlander (sPower) | US-VA | Solar | 75 | 50 | % | 2H 2020 | ||||||
East Line Solar (sPower) | US-AZ | Solar | 100 | 50 | % | 2H 2020 | ||||||
Alamitos Energy Center | US-CA | Energy Storage | 100 | 100 | % | 1H 2021 | ||||||
1,951 | ||||||||||||
_____________________________
(1) | Project achieved commercial operations in February 2020. |
The majority of projects under construction have executed long-term PPAs or, as applicable, have been assigned tariffs through a regulatory process.
14 | 2019 Annual Report | |
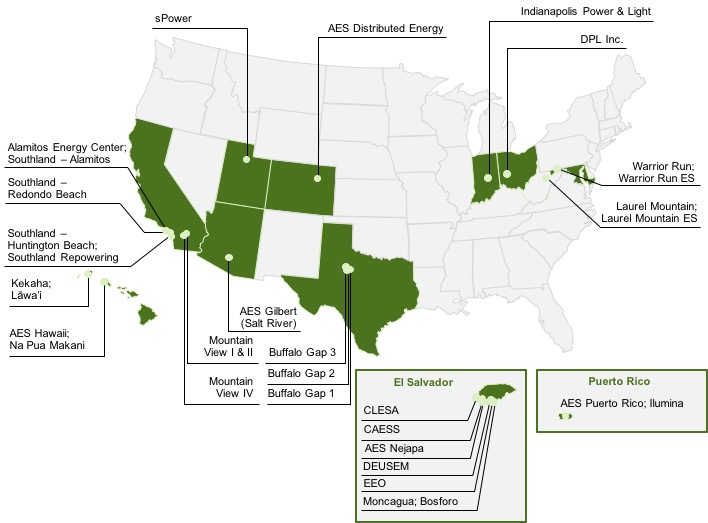
The following map illustrates the locations of our US and Utilities facilities:
US and Utilities Businesses
IPL
Business Description — IPL is an integrated utility that is engaged primarily in generating, transmitting, distributing and selling electric energy to retail customers in the city of Indianapolis and neighboring areas within the state of Indiana and is subject to regulatory authority—see Regulatory Framework and Market Structure below. IPL has an exclusive right to provide electric service to the customers in its service area, covering about 528 square miles with an estimated population of approximately 955,000 people. IPL owns and operates four generating stations, all within the state of Indiana. IPL’s largest generating station, Petersburg, is coal-fired. The second largest station, Harding Street, uses natural gas and fuel oil to power combustion turbines. In addition, IPL operates a 20 MW battery-based energy storage unit at Harding Street, which provides frequency response. The third station, Eagle Valley, is a CCGT natural gas plant. IPL took operational control and commenced commercial operations of this CCGT in April 2018. The fourth station, Georgetown, is a small peaking station that uses natural gas to power combustion turbines. In addition, IPL helps meet its customers' energy needs with long-term contracts for the purchase of 96 MW of solar-generated electricity and 300 MW of wind-generated electricity.
Key Financial Drivers — IPL's financial results are driven primarily by retail demand, weather, and maintenance costs. In addition, IPL's financial results are likely to be driven by many factors, including, but not limited to:
• | regulatory outcomes; |
• | the passage of new legislation, implementation of regulations or other changes in regulation; and |
• | the timely recovery of capital expenditures. |
15 | 2019 Annual Report | |
Regulatory Framework and Market Structure — IPL is subject to comprehensive regulation by the IURC with respect to its services and facilities, retail rates and charges, the issuance of long-term securities, and certain other matters. The regulatory authority of the IURC over IPL's business is typical of regulation generally imposed by state public utility commissions. The IURC sets tariff rates for electric service provided by IPL. The IURC considers all allowable costs for ratemaking purposes, including a fair return on assets used and useful to providing service to customers.
IPL's tariff rates consist of basic rates and approved charges. In addition, IPL's rates include various adjustment mechanisms, including, but not limited to: (i) a rider to reflect changes in fuel and purchased power costs to meet IPL's retail load requirements, (ii) a rider to reflect changes in ongoing RTO costs, and (iii) a rider for the timely recovery of demand side management energy efficiency program costs. These components function somewhat independently of one another, but the overall structure of IPL's rates is subject to review at the time of any review of IPL's basic rates and charges. Additionally, IPL's rider recoveries are reviewed through recurring filings.
On October 31, 2018, the IURC issued an order approving an uncontested settlement agreement to increase IPL's annual revenues by $44 million, or 3% (the "2018 Rate Order"). This revenue increase primarily includes recovery through rates of costs associated with the CCGT at Eagle Valley, completed in the first half of 2018, and other construction projects. New base rates and charges became effective on December 5, 2018. The order also provides customers with approximately $50 million in benefits, including tax reform benefits associated with the TCJA, over a two-year period through a rate adjustment mechanism beginning in March 2019.
IPL is one of many transmission system owner members in MISO, an RTO which maintains functional control over the combined transmission systems of its members and manages one of the largest energy and ancillary services markets in the U.S. MISO operates on a merit order dispatch, considering transmission constraints and other reliability issues to meet the total demand in the MISO region. IPL offers electricity in the MISO day-ahead and real-time markets.
Development Strategy — IPL's construction program is composed of capital expenditures necessary for prudent utility operations and compliance with environmental regulations, along with discretionary investments designed to replace aging equipment or improve overall performance.
Senate Enrolled Act 560, the Transmission, Distribution, and Storage System Improvement Charge ("TDSIC") statute provides for cost recovery outside of a base rate proceeding for new or replacement electric and gas transmission, distribution, and storage projects that a public utility undertakes for the purposes of safety, reliability, system modernization, or economic development. Provisions of the TDSIC statute require that requests for recovery include a seven-year plan of eligible investments. Once a plan is approved by the IURC, eighty percent of eligible costs can be recovered using a periodic rate adjustment mechanism, referred to as a TDSIC mechanism. Recoverable costs include a return on, and of, the investment, including AFUDC, post-in-service carrying charges, operation and maintenance expenses, depreciation and property taxes. The remaining twenty percent of recoverable costs are deferred for future recovery in the public utility’s next general rate case. The TDSIC mechanism is capped at an annual increase of two percent of total retail revenues.
In July 2019, IPL filed a petition with the IURC seeking approval of a seven-year TDSIC Plan for eligible transmission, distribution and storage system improvements totaling $1.2 billion from 2020 through 2027. An IURC order is expected in the first quarter of 2020. After such order is issued, IPL will file a petition to set the rider rates and begin TDSIC recovery, which is expected to occur in the second half of 2020.
Integrated Resource Plan — In December 2019, IPL filed its Integrated Resource Plan ("IRP"), which describes IPL's Preferred Resource Portfolio for meeting its generation capacity needs for serving its retail customers over the next several years. IPL's Preferred Resource Portfolio is IPL's reasonable least cost option and provides a cleaner and more diverse generation mix for customers. The IRP includes the retirement of 630 MW of coal-fired generation by 2023. Based on extensive modeling, IPL has determined that the cost of operating Petersburg Units 1 and 2 exceeds the value customers receive compared to alternative resources. Retirement of these units allows the company to cost-effectively diversify the portfolio and transition to cheaper and cleaner resources while maintaining a reliable system.
IPL issued an all-source Request for Proposal on December 20, 2019, in order to competitively procure replacement capacity by June 1, 2023, which is the first year IPL is expected to have a capacity shortfall. Current modeling indicates that a combination of wind, solar, storage, and energy efficiency would be the lowest reasonable
16 | 2019 Annual Report | |
cost option for the replacement capacity, but IPL will assess the type, size, and location of resources after bids are received.
DPL
Business Description — DPL is an energy holding company whose principal subsidiaries include DP&L and AES Ohio Generation, LLC, both of which operate in Ohio. DP&L is a utility company that transmits and distributes electricity to retail customers in a 6,000 square mile area of West Central Ohio and is subject to regulatory authority—see Regulatory Framework and Market Structure below. DP&L has the exclusive right to provide transmission and distribution services to its customers, and procures retail SSO electric service on behalf of residential, commercial, industrial and governmental customers through a competitive bid auction process. AES Ohio Generation owns an undivided interest in Conesville Unit 4, a coal-fired generating unit, and sells all of its energy and capacity into the wholesale market. The Conesville facility is planned to close in May 2020. AES Ohio Generation has systematically been exiting its generation business in recent years. In May 2018 AES Ohio Generation retired its Stuart and Killen facilities and completed the transfer of these facilities to a third party in December 2019.
Key Financial Drivers — DPL's financial results are primarily driven by regulatory outcomes and customer growth within our service territory. In addition, DPL's financial results are likely to be driven by many factors, including, but not limited to:
• | the passage of new legislation, new regulations or other changes in regulation; |
• | timely recovery of transmission and distribution expenditures; and |
• | exiting remaining generation assets currently owned by AES Ohio Generation. |
Regulatory Framework and Market Structure — DP&L is regulated by the PUCO for its distribution services and facilities, retail rates and charges, reliability of service, compliance with renewable energy portfolio requirements, energy efficiency program requirements, and certain other matters. The PUCO maintains jurisdiction over the delivery of electricity, standard service offer ("SSO"), and other retail electric services.
Electric customers within Ohio are permitted to purchase power under contract from a CRES provider or from their local utility under SSO rates. The SSO generation supply is provided by third parties through a competitive bid process. Ohio utilities have the exclusive right to provide transmission and distribution services in their state-certified territories. While Ohio allows customers to choose retail generation providers, DP&L is required to provide retail generation service at SSO rates to any customer that has not signed a contract with a CRES provider or as a provider of last resort in the event of a CRES provider default. SSO rates are subject to rules and regulations of the PUCO and are established through a competitive bid process for the supply of power to SSO customers.
DP&L's distribution rates are regulated by the PUCO and are established through a traditional cost-based rate-setting process. DP&L is permitted to recover its costs of providing distribution service as well as earn a regulated rate of return on assets, determined by the regulator, based on the utility's allowed regulated asset base, capital structure and cost of capital. DP&L's retail rates include various adjustment mechanisms including, but not limited to, the timely recovery of costs incurred related to power purchased through the competitive bid process, participation in the PJM RTO, severe storm damage, and energy efficiency. DP&L's wholesale transmission and distribution rates are regulated by FERC.
DP&L is a member of PJM, an RTO that operates the transmission systems owned by utilities operating in all or parts of a multi-state region, including Ohio. PJM also administers the day-ahead and real-time energy markets, ancillary services market and forward capacity market for its members.
In September 2018, DP&L received an order from the PUCO establishing new base distribution rates for DP&L (“the order”), which became effective October 1, 2018. The order approved, without modification, a stipulation and recommendation previously filed by DP&L, along with various intervening parties, with the PUCO staff. The order established a revenue requirement of $248 million for DP&L's electric service base distribution rates, which reflects an increase to distribution revenues of $30 million per year. In addition, the order authorized DP&L to collect from customers costs related to qualified investments through a Distribution Investment Rider, changed the Decoupling Rider to reduce variability from the impact of weather and demand, partially resolved regulatory issues related to the TCJA, and authorized DP&L to defer certain vegetation management costs for future collection.
Ohio law requires utilities to provide their customers a default generation service, known as an SSO, which can be in the form of an electric security plan ("ESP") or a market rate offer ("MRO"), submitted for approval to the PUCO. The PUCO approved DP&L’s Electric Security Plan (“ESP 3”) for a six-year period beginning on November
17 | 2019 Annual Report | |
1, 2017. The ESP 3 established a Distribution Modernization Rider (“DMR”) with an initial three-year term to collect $105 million in revenue per year through October 2020 to pay debt obligations at DPL and DP&L and position DP&L to modernize and/or maintain its transmission and distribution infrastructure, as well as additional riders to collect several types of ongoing costs and incremental investment.
On November 21, 2019 the PUCO issued an order modifying the ESP 3 by removing the DMR. As a result, DP&L made a filing which requested to revert DP&L to the ESP rates that were in effect prior to the ESP 3 (the “ESP 1 Rates”) and to maintain several riders from ESP 3. Effective December 18, 2019, the PUCO partially approved this request including authorizing the collection of a Rate Stability Charge ("RSC") of approximately $79 million per year, but disallowing the Regulatory Compliance Rider, Uncollectible Rider, Distribution Investment Rider, which had authorized DP&L to timely recover qualified investments in its distribution network, and the Decoupling Rider, which was designed to eliminate the impacts of weather and other changes in customer demand.
Separate from the ESP process, in the first quarter of 2020, DP&L filed a separate petition seeking authority to record regulatory assets to accrue revenues that would have otherwise been collected under the ESP 3 through the Decoupling Rider. The outcome of this petition is unknown at this time.
Development Strategy — Planned construction projects primarily relate to new investments in and upgrades to DPL's transmission and distribution system. Capital projects are subject to continuing review and are revised in light of changes in financial and economic conditions, load forecasts, legislative and regulatory developments, and changing environmental standards, among other factors.
DP&L is projecting to spend an estimated $621 million on capital projects from 2020 through 2022. DP&L expects to finance this construction with a combination of cash on hand, short-term financing, long-term debt and cash flows from operations.
In December 2018, DP&L filed a Distribution Modernization Plan with the PUCO proposing to invest $576 million in capital projects over the next 20 years, which includes leveraging technologies to modernize and improve the sustainability of the grid, and enhancing customer experience and security, as well as to allow DP&L to leverage and integrate distributed energy resources into its grid, including community solar, energy storage, microgrids and electric vehicle charging infrastructure. A decision on this filing from the PUCO is still pending.
Non-renewable U.S. Generation
Business Description — In the U.S., we own a diversified generation portfolio. The principal markets and locations where we are engaged in the generation and supply of electricity (energy and capacity) are the California Independent System Operator ("CAISO"), PJM, and Hawaii. AES Southland, operating in the CAISO, is our most significant generation business.
Many of our non-renewable U.S. generation plants provide baseload operations and are required to maintain a guaranteed level of availability. Any change in availability has a direct impact on financial performance. Some plants are eligible for availability bonuses if they meet certain requirements. Coal and natural gas are used as the primary fuels. Coal prices are set by market factors internationally, while natural gas prices are generally set domestically. Price variations for these fuels can change the composition of generation costs and energy prices in our generation businesses.
Many of these generation businesses have entered into long-term PPAs with utilities or other offtakers. Some businesses with PPAs have mechanisms to recover fuel costs from the offtaker, including an energy payment partially based on the market price of fuel. When market price fluctuations in fuel are borne by the offtaker, revenue may change as fuel prices fluctuate, but the variable margin or profitability should remain consistent. These businesses often have an opportunity to increase or decrease profitability from payments under their PPAs depending on such items as plant efficiency and availability, heat rate, ability to buy coal at lower costs through AES' global sourcing program, and fuel flexibility.
Several of our non-renewable generation businesses in the U.S. currently operate as QFs, including Hawaii and Warrior Run, as defined under the PURPA. These businesses entered into long-term contracts with electric utilities that had a mandatory obligation to purchase power from QFs at the utility's avoided cost (i.e., the likely costs for both energy and capital investment that would have been incurred by the purchasing utility if that utility had to provide its own generating capacity or purchase it from another source). To be a QF, a cogeneration facility must produce electricity and useful thermal energy for an industrial or commercial process or heating or cooling applications in certain proportions to the facility's total energy output and meet certain efficiency standards. To be a
18 | 2019 Annual Report | |
QF, a small power production facility must generally use a renewable resource as its energy input and meet certain size criteria.
Our non-QF generation businesses in the U.S. currently operate as Exempt Wholesale Generators as defined under the EPAct of 1992. These businesses, subject to approval of FERC, have the right to sell power at market-based rates, either directly to the wholesale market or to a third-party offtaker such as a power marketer or utility/industrial customer. Under the FPA and FERC's regulations, approval from FERC to sell wholesale power at market-based rates is generally dependent upon a showing to FERC that the seller lacks market power in generation and transmission, that the seller and its affiliates cannot erect other barriers to market entry and that there is no opportunity for abusive transactions involving regulated affiliates of the seller.
The U.S. wholesale electricity market consists of multiple distinct regional markets that are subject to both federal regulation, as implemented by FERC, and regional regulation as defined by rules designed and implemented by the RTOs, non-profit corporations that operate the regional transmission grid and maintain organized markets for electricity. These rules, for the most part, govern such items as the determination of the market mechanism for setting the system marginal price for energy and the establishment of guidelines and incentives for the addition of new capacity. See Item 1A.—Risk Factors for additional discussion on U.S. regulatory matters.
AES Southland
Business Description — AES Southland is one of the largest generation operators in California by aggregate installed capacity. With an installed gross capacity of 2,312 MW at the end of 2019, AES Southland accounts for approximately 3% of the state's installed capacity and 8% of the peak demand in SCE's territory. The three coastal power plants comprising AES Southland are in areas that are critical for local reliability and play an important role in integrating the increasing amounts of renewable generation resources in California.
At the end of 2019, five of the twelve Southland generation units were retired to support the construction efforts of the combined cycle re-powering project, in anticipation of reaching COD in early 2020. The remaining AES once-through cooling ("OTC") generating units in California will be shutdown and permanently retired by December 31, 2020 unless the California State Water Resources Board ("SWRCB") extends the OTC Policy compliance date for these units to maintain electrical system reliability. On January 23, 2020, the Statewide Advisory Committee on Cooling Water Intake Structures ("SACCWIS") adopted a recommendation to present to the SWRCB to extend the OTC compliance dates for AES Huntington Beach and AES Alamitos until December 31, 2023 and AES Redondo Beach until December 31, 2021. The SWRCB is expected to act on the SACCWIS recommendation in the summer of 2020. See United States Environmental and Land-Use Legislation and Regulations—Cooling Water Intake for further discussion of AES Southland’s plans regarding the OTC Policy.
Southland projects AES Huntington Beach, LLC, AES Alamitos, LLC and AES Redondo Beach are contracted through Resource Adequacy Purchase Agreements (the “RAPAs”), through December 31, 2020. Under the RAPAs, as approved by the California Public Utilities Commission, these generating stations provide resource adequacy capacity, and have no obligation to produce or sell any energy to the RAPA counterparty. However, the generating stations are required to bid energy into the California ISO markets. Compensation under these RAPAs is dependent on the availability of the AES Southland units in the California ISO market. Failure to achieve the minimum availability target would result in an assessed penalty.
Re-powering — In November 2014, AES Southland was awarded 20-year contracts by SCE to provide 1,284 MW of combined cycle gas-fired generation and 100 MW of interconnected battery-based energy storage. The agreements for the combined cycle gas-fired generation were amended in 2019 and capacity was increased to 1,299 MW. The contracts are resource adequacy agreements with annual energy put options. If AES Southland exercises the annual put option, all capacity, energy and ancillary services will be sold to SCE in exchange for a fixed monthly fee that covers fixed operating cost, debt service, and return on capital. In addition, SCE will reimburse variable costs and provide the natural gas. If the annual put option is not elected, Southland can sell energy and ancillary services for the coming year to other market counterparties rather than under the agreements with SCE.
In April 2017, the California Energy Commission unanimously approved the licenses for the new combined cycle projects at AES Alamitos and AES Huntington Beach. In June 2017, AES closed the financing of $2.0 billion, funded with a combination of non-recourse debt and AES equity. The construction of this new capacity started in 2017 and commercial operation of the combined cycle gas-fired capacity projects was reached in early February 2020. Commercial operation of the energy storage capacity is expected in 2021.
19 | 2019 Annual Report | |
Key Financial Drivers — AES Southland's availability is one of the most important drivers of operations along with market demand and prices for gas and electricity.
AES Hawaii
AES Hawaii receives a fuel payment from its offtaker under a PPA expiring in 2022, which is based on a fixed rate indexed to the Gross National Product Implicit Price Deflator. Since the fuel payment is not directly linked to market prices for fuel, the risk arising from fluctuations in market prices for coal is borne by AES Hawaii. AES Hawaii has entered into fixed-price coal purchase commitments through the second quarter of 2020 and plans to seek additional fuel purchase commitments to manage fuel price risk after December 2020.
Key Financial Drivers — AES Hawaii's financial results are driven by fuel costs and outages. The Company has entered into long-term fuel contracts to mitigate the risks associated with fluctuating prices. In addition, major maintenance requiring units to be off-line is performed during periods when power demand is typically lower. The Hawaii Public Utilities Commission continues to oversee the local utilities' compliance with the renewable portfolio standards established by the State of Hawaii, mandating 100% of Hawaii's generation to be from renewable resources by 2045.
Puerto Rico
Business Description — AES Puerto Rico owns and operates a coal-fired cogeneration plant and a solar plant of 524 MW and 24 MW, respectively, representing approximately 8% of the installed capacity in Puerto Rico. Both plants are fully contracted through long-term PPAs with PREPA expiring in 2027 and 2032, respectively. AES Puerto Rico receives a capacity payment based on the plant’s twelve month rolling average availability, receiving the full payment when the availability is 90% or higher. See Item 7.—Management's Discussion and Analysis of Financial Condition and Results of Operations—Key Trends and Uncertainties—Macroeconomic and Political—Puerto Rico for further discussion of the long-term PPA with PREPA.
Key Financial Drivers — Financial results are driven by many factors, including, but not limited to:
• | improved operational performance; and |
• | plant availability. |
Regulatory Framework and Market Structure — Puerto Rico has a single electric grid managed by PREPA, a state-owned entity that provides virtually all of the electric power consumed in Puerto Rico and generates, transmits and distributes electricity to 1.5 million customers. The Puerto Rico Energy Bureau is the main regulatory body. The bureau approves wholesale and retail rates, sets efficiency and interconnection standards, and oversees PREPA's compliance with Puerto Rico's renewable portfolio standard.
Puerto Rico's electricity is 97% produced by thermal plants (38% from petroleum, 40% from natural gas, 19% from coal).
U.S. Renewables
AES' U.S. renewables platform comprises AES Distributed Energy, sPower and other renewable assets in the U.S. AES Distributed Energy develops, constructs and sells electricity generated by photovoltaic solar energy systems and wind turbine energy systems, as well as energy storage systems, to public sector, utility, and non-profit entities through PPAs. Generation capacity of the systems owned and/or operated by AES Distributed Energy is 286 MW across the U.S. with another 149 MW under construction. sPower, an AES equity affiliate, owns and/or operates 156 utility and distributed electrical generation systems with a capacity of 1,367 MW across the U.S. sPower continues actively buying, developing and constructing renewable assets in the U.S.
Excluding sPower wind plants, AES has 730 MW of wind capacity in the U.S., located in California, Texas and West Virginia. Mountain View I & II, Mountain View IV and Buffalo Gap I sell under long-term PPAs through which the energy price on the entire production of these facilities is guaranteed. Laurel Mountain, Buffalo Gap II and Buffalo Gap III are exposed to the volatility of energy prices and their revenue may change materially as energy prices fluctuate in their respective markets of operations. Laurel Mountain Wind also operates 16 MW of battery energy storage that is sold into the PJM market as regulation energy.
AES manages the U.S. renewables portfolio as part of its broader investments in the U.S. A portion of solar projects, including at sPower, and the majority of wind projects have been financed with tax equity structures. Under these tax equity structures, the tax equity investors receive a portion of the economic attributes of the facilities,
20 | 2019 Annual Report | |
including tax attributes that vary over the life of the projects. Based on certain liquidation provisions of the tax equity structures, this could result in variability to earnings attributable to AES compared to the earnings reported at the facilities.
Key Financial Drivers — The financial results of the U.S. wind platform are primarily driven by increased production due to more efficient turbines, faster and less turbulent wind and reduced turbine outages. In addition, PJM and ERCOT power prices impact financial results for the wind projects that are operating without long-term contracts for all or some of their capacity. The financial results of the U.S. solar platform are primarily driven by the amount of sunshine hours available at the facilities, cell maintenance and growth in projects.
Development Strategy — sPower has a development pipeline that includes 1,577 MW of projects for which long-term PPAs have been signed. The budget for construction of the projects currently under construction and the contracted projects is over $1.86 billion. AES Distributed Energy has a development pipeline that includes 476 MW of projects for which long-term PPAs have been signed or, as applicable, tariffs have been assigned through a regulatory process. The U.S. wind platform is reviewing opportunities to repower older existing projects and adding energy storage where feasible. The budget for construction of the projects currently under construction and the contracted projects is over $1 billion.
U.S. Environmental Regulation
For information on compliance with environmental regulations see Item 1.—United States Environmental and Land-Use Legislation and Regulations.
El Salvador
Business Description — AES El Salvador is the majority owner of four of the five distribution companies operating in El Salvador (CAESS, CLESA, EEO and DEUSEM). AES El Salvador's territory covers 80% of the country and accounted for 3,841 GWh of the wholesale market energy sales during 2019. AES El Salvador is also a 50% owner and operator of Bosforo, a 100 MW solar farm that became fully operational at the end of 2019. The energy produced by this solar farm is fully contracted by AES' utilities in El Salvador.
In addition, AES El Salvador offers customers non-regulated services such as energy trading, electromechanical construction, O&M of electrical assets, EPC, pole rental, and tax collection for municipalities.
Key Financial Drivers — Financial results are driven by many factors, including, but not limited to:
• | improved operational performance; |
• | variability in energy demand driven by weather; and |
• | fuel oil prices impact energy tariff prices, which affect cash flow due to a three month delay in the passthrough of energy costs to the tariffs charged to customers. |
Regulatory Framework and Market Structure — El Salvador's national electric market is composed of generation, distribution, transmission and marketing businesses, a market and system operator and regulatory agencies. The operation of the transmission system and the wholesale market is based on production costs with a marginal economic model that rewards efficiency and allows investors to have guaranteed profits, while end users receive affordable rates. The energy sector is governed by the General Electricity Law, which establishes two regulatory entities responsible for monitoring its compliance:
• | The National Energy Council is the highest authority on energy policy and strategy, and the coordinating body for the different energy sectors. One of its main objectives is to promote investment in non-conventional renewable sources to diversify the energy matrix. |
• | The General Superintendence of Electricity and Telecommunications regulates the market and sets consumer prices, and, jointly with the distribution companies in El Salvador, developed the tariff calculation applicable from 2018 until 2022. The next tariff calculation is scheduled for 2022, and will be effective starting 2023. |
El Salvador has a national electric grid that interconnects directly with Guatemala and Honduras, allowing transactions with all Central American countries. The sector has approximately 1,689 MW of installed capacity, composed of thermal (42%), hydroelectric (33%), geothermal (10%), biomass (9%) and solar (6%) generation plants.
Development Strategy — In order to explore new business opportunities, in 2018 AES El Salvador created
21 | 2019 Annual Report | |
AES Soluciones, an LED public lighting service provider and the main commercial and industrial solar photovoltaic EPC provider in the country. AES Next is also the O&M services provider for the Bosforo project.
22 | 2019 Annual Report

(1) Non-GAAP measure. See Item 7.—Management’s Discussion and Analysis of Financial Condition and Results of Operations—SBU Performance Analysis—Non-GAAP Measures for reconciliation and definition. | |
23 | 2019 Annual Report | |
South America SBU
Our South America SBU has generation facilities in four countries — Chile, Colombia, Argentina and Brazil. AES Gener is a publicly traded company in Chile and owns all of our assets in Chile, AES Chivor in Colombia and TermoAndes in Argentina, as detailed below. AES has a 66.7% ownership interest in AES Gener and this business is consolidated in our financial statements. Tietê is a publicly traded company in Brazil. AES controls and consolidates Tietê through its 24% economic interest.
Operating installed capacity of our South America SBU totals 12,568 MW, of which 32%, 28%, 8%, and 32% are located in Argentina, Chile, Colombia and Brazil, respectively. The following table lists our South America SBU generation facilities:
Business | Location | Fuel | Gross MW | AES Equity Interest | Year Acquired or Began Operation | Contract Expiration Date | Customer(s) | |||||||||
Chivor | Colombia | Hydro | 1,000 | 67 | % | 2000 | 2020-2037 | Various | ||||||||
Castilla | Colombia | Solar | 21 | 67 | % | 2019 | 2034 | Ecopetrol | ||||||||
Tunjita | Colombia | Hydro | 20 | 67 | % | 2016 | ||||||||||
Colombia Subtotal | 1,041 | |||||||||||||||
Gener - Chile (1) | Chile | Coal/Hydro/Diesel/Solar/Wind/Biomass | 1,617 | 67 | % | 2000 | 2020-2040 | Various | ||||||||
Guacolda (2) | Chile | Coal | 763 | 33 | % | 2000 | 2020-2032 | Various | ||||||||
Electrica Angamos | Chile | Coal | 558 | 67 | % | 2011 | 2026-2037 | Minera Escondida, Minera Spence, Quebrada Blanca | ||||||||
Cochrane | Chile | Coal | 550 | 40 | % | 2016 | 2030-2037 | SQM, Sierra Gorda, Quebrada Blanca | ||||||||
Cochrane ES | Chile | Energy Storage | 20 | 40 | % | 2016 | ||||||||||
Electrica Angamos ES | Chile | Energy Storage | 20 | 67 | % | 2011 | ||||||||||
Norgener ES (Los Andes) | Chile | Energy Storage | 12 | 67 | % | 2009 | ||||||||||
Chile Subtotal | 3,540 | |||||||||||||||
TermoAndes (3) | Argentina | Gas/Diesel | 643 | 67 | % | 2000 | 2020 | Various | ||||||||
AES Gener Subtotal | 5,224 | |||||||||||||||
Alicura | Argentina | Hydro | 1,050 | 100 | % | 2000 | ||||||||||
Paraná-GT | Argentina | Gas/Diesel | 870 | 100 | % | 2001 | ||||||||||
San Nicolás | Argentina | Coal/Gas/Oil | 675 | 100 | % | 1993 | ||||||||||
Guillermo Brown (4) | Argentina | Gas/Diesel | 576 | — | % | 2016 | ||||||||||
Cabra Corral | Argentina | Hydro | 102 | 100 | % | 1995 | Various | |||||||||
Ullum | Argentina | Hydro | 45 | 100 | % | 1996 | Various | |||||||||
Sarmiento | Argentina | Gas/Diesel | 33 | 100 | % | 1996 | ||||||||||
El Tunal | Argentina | Hydro | 10 | 100 | % | 1995 | Various | |||||||||
Argentina Subtotal | 3,361 | |||||||||||||||
Tietê (5) | Brazil | Hydro | 2,658 | 24 | % | 1999 | 2029 | Various | ||||||||
Alto Sertão II | Brazil | Wind | 386 | 24 | % | 2017 | 2033-2035 | Various | ||||||||
Guaimbe | Brazil | Solar | 150 | 24 | % | 2018 | 2037 | CCEE | ||||||||
AGV Solar | Brazil | Solar | 75 | 24 | % | 2019 | 2039 | Various | ||||||||
Boa Hora | Brazil | Solar | 69 | 24 | % | 2019 | 2035 | CCEE | ||||||||
Drogaria Araujo | Brazil | Solar | 5 | 24 | % | 2019 | 2029 | Drogaria Araujo | ||||||||
Tietê Subtotal | 3,343 | |||||||||||||||
Uruguaiana | Brazil | Gas | 640 | 46 | % | 2000 | ||||||||||
Brazil Subtotal | 3,983 | |||||||||||||||
12,568 | ||||||||||||||||
_____________________________
(1) | Gener - Chile plants: Alfalfal, Andes Solar, Laguna Verde, Laja, Los Cururos, Maitenes, Norgener 1, Norgener 2, Queltehues, Ventanas 1, Ventanas 2, Ventanas 3, Ventanas 4 and Volcán. |
(2) | Guacolda is comprised of five coal-fired units under Guacolda Energia S.A., an unconsolidated entity for which the results of operations are reflected in Net equity in earnings of affiliates. The Company's ownership in Guacolda is held through AES Gener, a 67%-owned consolidated subsidiary. AES Gener owns 50% of Guacolda, resulting in an AES effective ownership in Guacolda of 33%. |
(3) | TermoAndes is located in Argentina, but is connected to both the SEN in Chile and the SADI in Argentina. |
(4) | AES operates this facility through management or O&M agreements and to date owns no equity interest in the business. |
(5) | Tietê plants: Água Vermelha, Bariri, Barra Bonita, Caconde, Euclides da Cunha, Ibitinga, Limoeiro, Mogi-Guaçu, Nova Avanhandava, Promissão, Sao Joaquim and Sao Jose. |
24 | 2019 Annual Report | |
Under construction — The following table lists our plants under construction in the South America SBU:
Business | Location | Fuel | Gross MW | AES Equity Interest | Expected Date of Commercial Operations | |||||||
McDonalds | Brazil | Solar | 5 | 24 | % | 2H 2020 | ||||||
Farmácias São João | Brazil | Solar | 3 | 24 | % | 2H 2020 | ||||||
Brazil Community Solar | Brazil | Solar | 2 | 24 | % | 2H 2020 | ||||||
Brazil Subtotal | 10 | |||||||||||
Vientos Bonaerenses (1) | Argentina | Wind | 100 | 100 | % | 1H 2020 | ||||||
Vientos Neuquinos | Argentina | Wind | 100 | 100 | % | 1H 2020 | ||||||
Argentina Subtotal | 200 | |||||||||||
Alto Maipo (2) | Chile | Hydro | 531 | 62 | % | 2H 2020 | ||||||
Los Olmos | Chile | Wind | 110 | 67 | % | 1H 2020 | ||||||
Mesamávida | Chile | Wind | 67 | 67 | % | 2H 2021 | ||||||
Andes Solar 2 | Chile | Solar | 80 | 67 | % | 1H 2020 | ||||||
Alfalfal Virtual Reservoir | Chile | Energy Storage | 10 | 67 | % | 1H 2020 | ||||||
Chile Subtotal | 798 | |||||||||||
1,008 | ||||||||||||
_____________________________
(1) | Project achieved commercial operations in February 2020. |
(2) | Alto Maipo is the largest project in construction in the Chilean market. When completed, it will include 75 km of tunnels, two power houses and 17 km of transmission lines. |
The majority of projects under construction have executed mid- to long-term PPAs.
In June 2018, the Company completed the sale of its entire 17% ownership interest in Eletropaulo, a distribution business in Brazil. Prior to its sale, Eletropaulo was accounted for as an equity method investment and its results of operations and financial position were reported as discontinued operations in the consolidated financial statements for all periods presented.
25 | 2019 Annual Report | |
The following map illustrates the location of our South America facilities:
South America Businesses
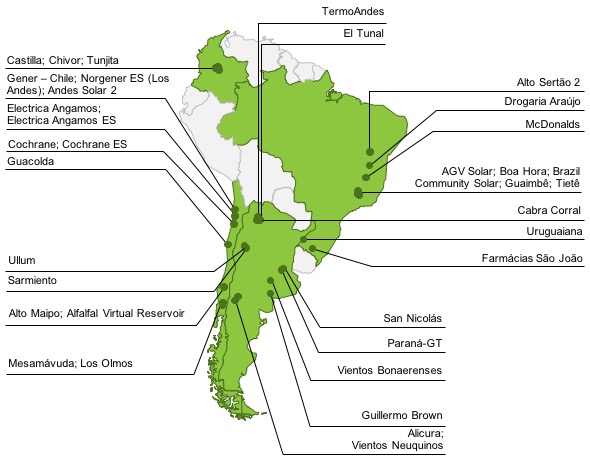
Chile
Business Description — In Chile, through AES Gener, we are engaged in the generation and supply of electricity (energy and capacity) in the SEN—see Regulatory Framework and Market Structure below. AES Gener is the second largest generation operator in Chile in terms of installed capacity with 3,488 MW, excluding energy storage, and has a market share of approximately 13% as of December 31, 2019.
AES Gener owns a diversified generation portfolio in Chile in terms of geography, technology, customers and fuel source. AES Gener's plants are located near the principal electricity consumption centers, including Santiago, Valparaiso and Antofagasta. AES Gener's diverse generation portfolio provides flexibility for the management of contractual obligations with regulated and unregulated customers, provides backup energy to the spot market and facilitates operations under a variety of market and hydrological conditions.
AES Gener's Green Blend and Extend strategy aims to reduce carbon intensity and incorporate renewable energy to extend our existing conventional PPAs. This strategy de-links our PPAs from legacy fossil resources, grows our renewable energy portfolio and delivers a competitive, reliable energy solution. In line with the "green blend and extend" strategy, AES Gener has committed to not build additional coal-based power plants and to advance the development of new renewable projects, including the implementation of technological innovations that will provide greater flexibility and reliability to the system.
AES Gener currently has long-term contracts, with an average remaining term of approximately 10 years, with regulated distribution companies and unregulated customers, such as mining and industrial companies. In general, these long-term contracts include pass-through mechanisms for fuel costs along with price indexations to U.S. CPI.
In addition to energy payments, AES Gener also receives capacity payments to compensate for availability during periods of peak demand. The grid operator, CEN, annually determines the capacity requirements for each power plant. The capacity price is fixed semiannually by the National Energy Commission and indexed to the CPI and other relevant indices.
26 | 2019 Annual Report | |
Key Financial Drivers — Hedge strategy at AES Gener limits volatility to the underlying financial drivers. In addition, financial results are likely to be driven by many factors, including, but not limited to:
• | dry hydrology scenarios; |
• | forced outages; |
• | changes in current regulatory rulings altering the ability to pass through or recover certain costs; |
• | fluctuations of the Chilean peso; |
• | tax policy changes; |
• | legislation promoting renewable energy and/or more restrictive regulations on thermal generation assets; and |
• | market price risk when re-contracting. |
Regulatory Framework and Market Structure — The Chilean electricity industry is divided into three business segments: generation, transmission and distribution. Private companies operate in all three segments, and generators can enter into PPAs to sell energy to regulated and unregulated customers, as well as to other generators in the spot market.
Chile operates in a single power market, referred to as the SEN, which is managed by the grid operator CEN. Prior to November 2017, Chile had two main power systems, the SIC and SING, largely as a result of its geographic shape and size, which were merged to form the SEN. The SEN has an installed capacity of 25,206 MW, and represents 99% of the installed generation capacity of the country.
CEN coordinates all generation and transmission companies in the SEN. CEN minimizes the operating costs of the electricity system, while maximizing service quality and reliability requirements. CEN dispatches plants in merit order based on their variable cost of production, allowing for electricity to be supplied at the lowest available cost. In the south-central region of the SEN (former SIC), thermoelectric generation is required to fulfill demand not satisfied by hydroelectric, solar and wind output and is critical to provide reliable and dependable electricity supply under dry hydrological conditions in the highest demand area of the SEN. In the northern region of the SEN (former SING), which includes the Atacama Desert, thermoelectric capacity represents the majority of installed capacity. The fuels used for thermoelectric generation, mainly coal, diesel and LNG, are indexed to international prices. In 2019, the generation installed capacity in the Chilean market was composed of 52% thermoelectric, 26% hydroelectric, 11% solar, 9% wind and 2% other fuel sources.
Hydroelectric plants represent a significant portion of the system's installed capacity. Precipitation and snow melt impact hydrological conditions in Chile. Rain occurs principally from June to August and snow melt occurs from September to December. These factors affect dispatch of the system's hydroelectric and thermoelectric generation plants, thereby influencing spot market prices.
The Ministry of Energy has primary responsibility for the Chilean electricity system directly or through the National Energy Commission and the Superintendency of Electricity and Fuels.
All generators can sell energy through contracts with regulated distribution companies or directly to unregulated customers. Unregulated customers are customers whose connected capacity is higher than 5 MW. Customers with connected capacity between 0.5 MW and 5.0 MW can opt for regulated or unregulated contracts for a minimum period of four years. By law, both regulated and unregulated customers are required to purchase all electricity under contracts. Generators may also sell energy to other power generation companies on a short-term basis at negotiated prices outside the spot market. Electricity prices in Chile are denominated in USD, although payments are made in Chilean pesos.
The Chilean government has announced an initiative to phase out coal power plants by 2040 and achieve carbon neutrality by 2050. In June 2019, AES Gener and the Chilean Ministry of Energy signed an agreement to cease operations of AES Gener's oldest coal-fired units, Ventanas units 1 and 2, built in 1964 and 1977, respectively. The agreement outlines a path to gradually phase out coal assets from the system in a manner that mitigates potential adverse impacts on the grid. Executing this agreement depends on the development of regulatory changes to create a new Strategic Reserve Operational State (ERE) in the capacity payment, which is currently pending. Both Ventanas units are expected to remain connected to the grid and maintained in ERE for five years, and will receive 60% of the current capacity payments.
Environmental Regulation — In March 2019, a new decontamination plan for the Ventanas region was approved. We are currently implementing the requirements defined by the plan which will impact our Ventanas and
27 | 2019 Annual Report | |
Guacolda businesses.
Chilean law requires all electricity generators to supply a certain portion of their total contractual obligations with NCREs. Generation companies are able to meet this requirement by building NCRE generation capacity (wind, solar, biomass, geothermal and small hydroelectric technology) or purchasing NCREs from qualified generators. Non-compliance with the NCRE requirements will result in fines. AES Gener currently fulfills the NCRE requirements by utilizing AES Gener's solar and biomass power plants and by purchasing NCREs from other generation companies. At present, AES Gener is in the process of negotiating additional NCRE supply contracts to meet future requirements.
Since 2017, emissions of particulate matter, SO2, NOx and CO2 are monitored for plants with an installed capacity over 50 MW; these emissions are taxed. In the case of CO2, the tax is equivalent to $5 per ton emitted. PPAs originating from the SING have clauses allowing the Company to pass the green tax costs to unregulated customers. Distribution PPAs originating from the SIC do not allow for the pass through of these costs.
Development Strategy — AES Gener is committed to reducing the coal intensity of the Chilean power grid and plans to increase the renewable energy capacity in its portfolio. As part of this commitment, and in addition to the 531 MW hydroelectric generation that Alto Maipo will deliver to the system, AES Gener purchased the 110 MW Los Cururos wind farm and its substation in northern Chile and has started construction on various solar and wind farms across Chile to supply agreements with its main mining customers in execution of the new Green Blend and Extend strategy. In addition, AES Gener broke ground on its Virtual Reservoir Energy Storage pilot project next to the existing Alfalfal I run-of-river hydro plant close to Santiago, Chile.
AES Gener executes its Green Blend and Extend strategy by integrating renewable energy sources into its portfolio, and by providing contracting options that contain a mix of both renewable and nonrenewable solutions.
Colombia
Business Description — We operate in Colombia through AES Chivor, a subsidiary of AES Gener, which owns a hydroelectric plant with an installed capacity of 1,000 MW and Tunjita, a 20 MW run-of-river hydroelectric plant, both located approximately 160 km east of Bogota, as well as Castilla, a 21 MW solar facility. AES Chivor’s installed capacity accounted for approximately 6% of system capacity at the end of 2019. AES Chivor is dependent on hydrological conditions, which influence generation and spot prices of non-contracted generation in Colombia.
AES Chivor's commercial strategy aims to execute contracts with commercial and industrial customers and bid in public tenders mainly with distribution companies in order to reduce margin volatility with proper portfolio risk management. The remaining energy generated by our portfolio is sold to the spot market, including ancillary services. Additionally, AES Chivor receives reliability payments for maintaining the plant's availability during periods of power scarcity, such as adverse hydrological conditions, in order to prevent power shortages.
Key Financial Drivers — Hydrological conditions largely influence Chivor's power generation. Maintaining the appropriate contract level, while maximizing revenue through the sale of excess generation, is key to Chivor's results of operations. In addition to hydrology, financial results are driven by many factors, including, but not limited to:
• | forced outages; |
• | fluctuations of the Colombian peso; and |
• | spot market prices. |
Regulatory Framework and Market Structure — Electricity supply in Colombia is concentrated in one main system, the SIN, which encompasses one-third of Colombia's territory, providing electricity to 97% of the country's population. The SIN's installed capacity, primarily hydroelectric (69%) and thermal (31%), totaled 17,365 MW as of December 31, 2019. The marked seasonal variations in Colombia's hydrology result in price volatility in the short-term market. In 2019, 80% of total energy demand was supplied by hydroelectric plants.
The electricity sector in Colombia operates under a competitive market framework for the generation and sale of electricity, and a regulated framework for transmission and distribution of electricity. The distinct activities of the electricity sector are governed by Colombian laws and CREG, the Colombian regulating entity for energy and gas. Other government entities have a role in the electricity industry, including the Ministry of Mines and Energy, which defines the government's policy for the energy sector; the Public Utility Superintendency of Colombia, which is in charge of overseeing utility companies; and the Mining and Energy Planning Unit, which is in charge of expansion of the generation and transmission network.
28 | 2019 Annual Report | |
The generation sector is organized on a competitive basis with companies selling their generation in the wholesale market at the short-term price or under bilateral contracts with other participants, including distribution companies, generators and traders, and unregulated customers at freely negotiated prices. The National Dispatch Center dispatches generators in merit order based on bid offers in order to ensure that demand will be satisfied by the lowest cost combination of available generating units.
In the third quarter of 2019, the Ministry of Mines and Energy published the final resolution for the renewable energy auction in Colombia. The auction allocates 15-year energy contracts for 4.4 TW/h of energy demand to reach commercial operation between 2022 and 2023. AES Chivor participated in the auction process and was awarded 255 MW of renewable generation.
Argentina
Business Description — AES operates plants in Argentina totaling 4,004 MW, representing 10% of the country's total installed capacity. AES owns a diversified generation portfolio in Argentina in terms of geography, technology and fuel source. AES Argentina's plants are placed in strategic locations within the country in order to provide energy to the spot market and customers, making use of wind, hydro and thermal plants.
AES primarily sells its energy in the wholesale electricity market where prices are largely regulated. In 2019, approximately 93% of the energy was sold in the wholesale electricity market and 7% was sold under contract sales made by TermoAndes.
Key Financial Drivers — Financial results are driven by many factors, including, but not limited to:
• | forced outages; |
• | exposure to fluctuations of the Argentine peso; |
• | changes in hydrology; |
• | timely collection of FONINVEMEM installments and outstanding receivables (see Regulatory Framework and Market Structure below); and |
• | natural gas prices and availability for contracted generation. |
Regulatory Framework and Market Structure — Argentina has one main power system, the SADI, which serves 96% of the country. As of December 31, 2019, the installed capacity of the SADI totaled 39,704 MW. The SADI's installed capacity is composed primarily of thermoelectric generation (62%) and hydroelectric generation (27%).
Thermoelectric generation in the SADI is primarily natural gas. However, scarcity of natural gas during winter periods (June to August) due to transport constraints result in the use of alternative fuels, such as oil and coal. The SADI is also highly reliant on hydroelectric plants. Hydrological conditions impact reservoir water levels and largely influence the dispatch of the system's hydroelectric and thermoelectric generation plants and, therefore, influence market costs. Precipitation in Argentina occurs principally from June to August.
The Argentine regulatory framework divides the electricity sector into generation, transmission and distribution. The wholesale electric market is comprised of generation companies, transmission companies, distribution companies and large customers who are permitted to trade electricity. Generation companies can sell their output in the spot market or under PPAs. CAMMESA manages the electricity market and is responsible for dispatch coordination. The Electricity National Regulatory Agency is in charge of regulating public service activities and the Secretariat of Energy regulates system framework and grants concessions or authorizations for sector activities. In Argentina, there is a tolling scheme in which the regulator establishes prices for electricity and defines fuel reference prices. As a result, our businesses are particularly sensitive to changes in regulation.
The Argentine electric market is an "average cost" system. Generators are compensated for fixed costs and non-fuel variable costs plus a rate of return, under prices denominated in USD. Generation companies can buy fuel directly from producers or from CAMMESA.
Long-term USD-denominated PPAs have been awarded to develop 9.1 GW of new thermal and renewable capacity through the execution of competitive auctions. During 2019, the government has continued to increase end user prices to reduce subsidies and decrease system deficit. By December 2019, distribution companies recovered an average 58% of the total cost of the system.
AES Argentina contributed certain accounts receivable to fund the construction of new power plants under FONINVEMEM agreements. These receivables accrue interest and are collected in monthly installments over 10
29 | 2019 Annual Report | |
years once the related plants begin to operate. AES Argentina participated in three FONINVEMEM funds related to operational plants under which payments are being received. AES Argentina will receive a pro rata ownership interest in these plants once the accounts receivables have been fully repaid. FONINVEMEM I and II installments were fully repaid in February 2020 and the ownership interests in Termoeléctrica San Martín and Termoeléctrica Manuel Belgrano power plants are subject to agreement between the government and all generators that participated in the funds. FONINVEMEM III installments continue being collected since Termoeléctrica Guillermo Brown commenced operations in April 2016. See Item 7.—Management's Discussion and Analysis of Financial Condition and Results of Operations—Capital Resources and Liquidity—Long-Term Receivables and Note 7.—Financing Receivables in Item 8.—Financial Statements and Supplementary Data of this Form 10-K for further discussion of receivables in Argentina.
In 2018 and 2019, the Argentine peso devalued against the USD by approximately 51% and 37%, respectively, and Argentina’s economy continued to be highly inflationary. In September 2019, currency controls were established to control the devaluation of the Argentine peso and keep Argentine central bank reserves at acceptable levels for the next government of Argentina.
Development Strategy — Vientos Bonaerenses, a 100 MW wind farm in Buenos Aires province, reached COD in February 2020. A second 100 MW wind facility under construction in Neuquén province is expected to come online by mid-2020. From that total, 80 MW will be sold to CAMMESA with a PPA under the RenovAr (public auction) program and 120 MW will be sold to commercial and industrial clients. Currently, 800 MW of renewable greenfield projects are in early stages of development. These projects could be used to participate in private PPAs or public auctions.
Brazil
Business Description — Tietê has a portfolio of 12 hydroelectric power plants in the state of São Paulo with total installed capacity of 2,658 MW. These hydroelectric plants operate under a 30-year concession expiring in 2029. Over the past two years, Tietê acquired and developed two solar power complexes in the state of São Paulo, which are fully contracted with 20-year PPAs and together account for 294 MW of installed capacity. Tietê represents approximately 11% of the total generation capacity in the state of São Paulo. Tietê also owns Alto Sertão II, a wind complex located in the state of Bahia, with an installed capacity of 386 MW and subject to 20-year PPAs expiring between 2033 and 2035.
AES owns 24% of Tietê and is the controlling shareholder and manages and consolidates this business. Tietê aims to contract most of its physical guarantee requirements and sell the remaining portion in the spot market. The commercial strategy is reassessed periodically according to changes in market conditions, hydrology and other factors. Tietê generally sells available energy through medium-term bilateral contracts.
Uruguaiana is a 640 MW gas-fired combined cycle power plant located in the town of Uruguaiana in the state of Rio Grande do Sul. AES manages and has a 46% economic interest in the plant. The plant's operations have been largely suspended due to the unavailability of gas. Uruguaiana continues to work toward securing gas on a long-term basis.
Key Financial Drivers — The electricity market in Brazil is highly dependent on hydroelectric generation, therefore electricity pricing is driven by hydrology. Plant availability is also a significant financial driver as in times of high hydrology, AES is more exposed to the spot market. Tietê's financial results are driven by many factors, including, but not limited to:
• | hydrology, impacting quantity of energy generated in MRE (see Regulatory Framework and Market Structure below for further information); |
• | growth in demand for energy; |
• | market price risk when re-contracting; |
• | asset management; |
• | cost management; and |
• | ability to execute on its growth strategy. |
Regulatory Framework and Market Structure — In Brazil, the Ministry of Mines and Energy determines the maximum amount of energy a generation plant can sell, called physical guarantee, representing the long-term average expected energy production of the plant. Under current rules, physical guarantee energy can be sold to distribution companies through long-term regulated auctions or under unregulated bilateral contracts with large
30 | 2019 Annual Report | |
consumers or energy trading companies.
Brazil has installed capacity of 170 GW, which is primarily hydroelectric (64%) and renewables (19%). Operation is centralized and controlled by the national operator, ONS, and regulated by ANEEL. The ONS dispatches generators based on their marginal cost of production and on the risk of system rationing. Key variables for the dispatch decision are forecasted hydrological conditions, reservoir levels, electricity demand, fuel prices and thermal generation availability.
In case of unfavorable hydrology, the ONS will reduce hydroelectric dispatch to preserve reservoir levels and increase dispatch of thermal plants to meet demand. The consequences of unfavorable hydrology are (i) higher energy spot prices due to higher energy production costs by thermal plants and (ii) the need for hydro plants to purchase energy in the spot market to fulfill their contractual obligations.
A mechanism known as the MRE was created under ONS to share hydrological risk across MRE hydro generators. If the hydro plants generate less than the total MRE physical guarantee, the hydro generators may need to purchase energy in the short-term market. When total hydro generation is higher than the total MRE physical guarantee, the surplus is proportionally shared among its participants and they may sell the excess energy on the spot market.
Development Strategy — Tietê's strategy is to grow by adding renewable capacity to its generation platform through acquisition or greenfield projects. Tietê has signed a purchase option for 582 MW of greenfield wind power projects in the state of Bahia, which is being exercised as the company secures long-term PPAs. The first phase (155 MW) will be developed in 2020 through a joint venture with Unipar Carbocloro for a 20-year PPA starting in 2022. The second phase (167 MW) will be 100% developed by Tietê also in 2020, for a 15-year PPA with Anglo American starting in 2022. Tietê is seeking other long-term PPA's to fulfill the remaining 260 MW.
Under the current terms of the 2018 legal agreement in connection with Tietê's concession with the state government, Tietê is required to increase its capacity in the state of São Paulo by an additional 81 MW by October 2024.
31 | 2019 Annual Report
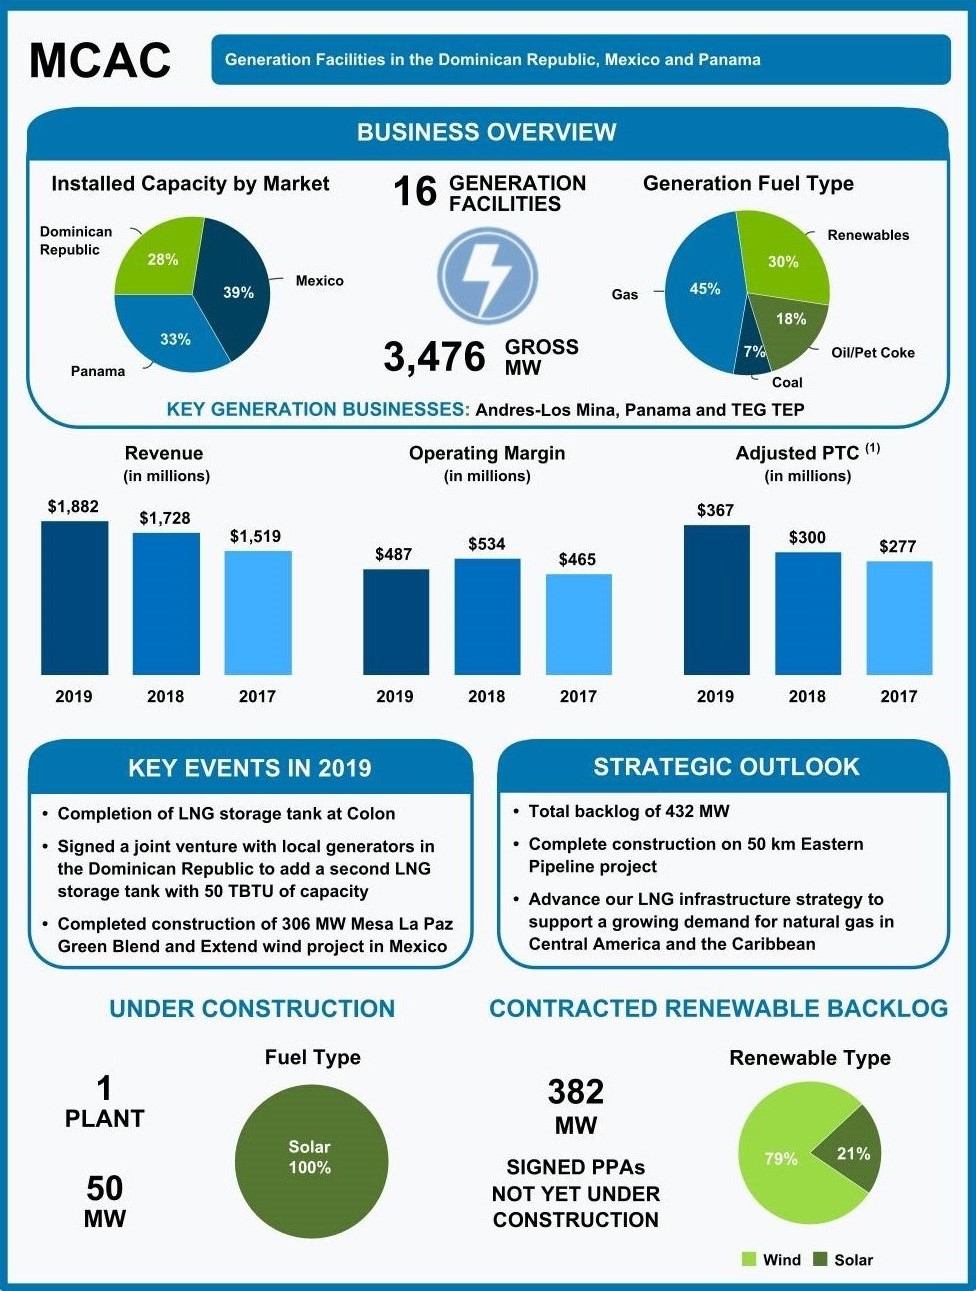
(1) Non-GAAP measure. See Item 7.—Management’s Discussion and Analysis of Financial Condition and Results of Operations—SBU Performance Analysis—Non-GAAP Measures for reconciliation and definition. | |
32 | 2019 Annual Report | |
MCAC SBU
Our MCAC SBU has a portfolio of generation facilities, including renewable energy, in three countries, with a total capacity of 3,476 MW.
Generation — The following table lists our MCAC SBU generation facilities:
Business | Location | Fuel | Gross MW | AES Equity Interest | Year Acquired or Began Operation | Contract Expiration Date | Customer(s) | |||||||||
DPP (Los Mina) | Dominican Republic | Gas | 358 | 85 | % | 1996 | 2022-2024 | Andres, CDEEE, Non-Regulated Users | ||||||||
Andres (1) | Dominican Republic | Gas | 319 | 85 | % | 2003 | 2020-2022 | Ede Norte, Ede Este, Ede Sur, Non-Regulated Users | ||||||||
Itabo | Dominican Republic | Coal | 260 | 43 | % | 2000 | 2022-2024 | Ede Norte, Ede Este, Ede Sur, Non-Regulated Users | ||||||||
Andres ES | Dominican Republic | Energy Storage | 10 | 85 | % | 2017 | ||||||||||
Los Mina DPP ES | Dominican Republic | Energy Storage | 10 | 85 | % | 2017 | ||||||||||
Dominican Republic Subtotal | 957 | |||||||||||||||
Merida III | Mexico | Gas/Diesel | 505 | 75 | % | 2000 | 2025 | Comision Federal de Electricidad | ||||||||
Mesa La Paz (2) | Mexico | Wind | 306 | 50 | % | 2019 | 2045 | Fuentes de Energia Peñoles | ||||||||
Termoelectrica del Golfo (TEG) | Mexico | Pet Coke | 275 | 99 | % | 2007 | 2027 | CEMEX | ||||||||
Termoelectrica del Penoles (TEP) | Mexico | Pet Coke | 275 | 99 | % | 2007 | 2027 | Peñoles | ||||||||
Mexico Subtotal | 1,361 | |||||||||||||||
Colon (3) | Panama | Gas | 381 | 50 | % | 2018 | 2028 | ENSA, Edemet, Edechi | ||||||||
Bayano | Panama | Hydro | 260 | 49 | % | 1999 | 2030 | ENSA, Edemet, Edechi, Other | ||||||||
Changuinola | Panama | Hydro | 223 | 90 | % | 2011 | 2030 | AES Panama | ||||||||
Chiriqui-Esti | Panama | Hydro | 120 | 49 | % | 2003 | 2030 | ENSA, Edemet, Edechi, Other | ||||||||
Estrella del Mar I | Panama | Heavy Fuel Oil | 72 | 49 | % | 2015 | 2020 | ENSA, Edemet, Edechi | ||||||||
Chiriqui-Los Valles | Panama | Hydro | 54 | 49 | % | 1999 | 2030 | ENSA, Edemet, Edechi, Other | ||||||||
Chiriqui-La Estrella | Panama | Hydro | 48 | 49 | % | 1999 | 2030 | ENSA, Edemet, Edechi, Other | ||||||||
Panama Subtotal | 1,158 | |||||||||||||||
3,476 | ||||||||||||||||
_____________________________
(1) | Plant also includes an adjacent regasification facility, as well as a 70 TBTU LNG storage tank. |
(2) | Unconsolidated entity, accounted for as an equity affiliate. |
(3) | Plant also includes an adjacent regasification facility, as well as an 80 TBTU LNG storage tank in operation since August 2019. |
Under construction — The following table lists our plants under construction in the MCAC SBU:
Business | Location | Fuel | Gross MW | AES Equity Interest | Expected Date of Commercial Operations | |||||||
Bayasol | Dominican Republic | Solar | 50 | 85 | % | 2H 2020 | ||||||
The project under construction has executed a 25-year PPA with Peñoles.
33 | 2019 Annual Report | |
The following map illustrates the location of our MCAC facilities:
MCAC Businesses
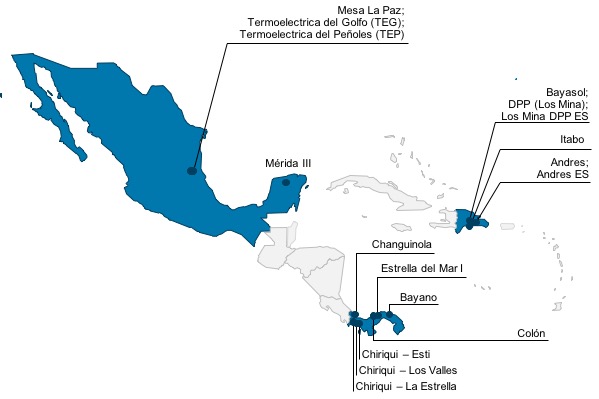
Dominican Republic
Business Description — AES Dominicana consists of three operating subsidiaries: Itabo, Andres and Los Mina. With a total of 957 MW of installed capacity, AES provides 20% of the country's capacity and supplies approximately 39% of energy demand via these generation facilities. 869 MW is mostly contracted until 2022 with government-owned distribution companies and large customers.
AES has a strategic partnership with the Estrella and Linda Groups ("Estrella-Linda"), a consortium of two leading Dominican industrial groups that manage a diversified business portfolio.
Itabo is 42.5% owned by AES. Itabo owns and operates two thermal power generation units with a total of 260 MW of installed capacity.
Andres and Los Mina are owned 85% by AES. Andres owns and operates a combined cycle natural gas turbine, an energy storage solution and generation capacity of 329 MW as well as the only LNG import terminal in the country, with 160,000 cubic meters of storage capacity. Los Mina owns and operates a combined cycle with two natural gas turbines, an energy storage solution and generation capacity of 368 MW.
AES Dominicana has a long-term LNG purchase contract through 2023 for 33.6 trillion btu/year with a price linked to NYMEX Henry Hub. The LNG contract terms allow delivery to various markets in Latin America. These plants capitalize on the competitively-priced LNG contract by selling power where the market is dominated by fuel oil-based generation. Andres has a long-term contract to sell re-gasified LNG to industrial users within the Dominican Republic using compression technology to transport it within the country, thereby capturing demand from industrial and commercial customers.
Key Financial Drivers — Financial results are driven by many factors, including, but not limited to:
• | changes in spot prices due to fluctuations in commodity prices (since fuel is a pass-through cost under the PPAs, any variation in oil prices will impact spot sales for both Andres and Itabo); |
• | contracting levels and the extent of capacity awarded; |
• | supply shortages in the near term (next two to three years) may provide opportunities for short-term upside, but new generation came online in 2019; and |
34 | 2019 Annual Report | |
• | additional sales derived from domestic natural gas demand are expected to continue providing income and growth based on the entry of future projects and the fees from the infrastructure service. |
Regulatory Framework and Market Structure — The Dominican Republic energy market is a decentralized industry consisting of generation, transmission and distribution businesses. Generation companies can earn revenue through short- and long-term PPAs, ancillary services, and a competitive wholesale generation market. All generation, transmission and distribution companies are subject to and regulated by the General Electricity Law.
Two main agencies are responsible for monitoring compliance with the General Electricity Law:
• | The National Energy Commission drafts and coordinates the legal framework and regulatory legislation. They propose and adopt policies and procedures to implement best practices, support the proper functioning and development of the energy sector, and promote investment. |
• | The Superintendence of Electricity's main responsibilities include monitoring compliance with legal provisions, rules, and technical procedures governing generation, transmission, distribution and commercialization of electricity. They monitor behavior in the electricity market in order to avoid monopolistic practices. In addition to the two agencies responsible for monitoring compliance with the General Electricity Law, the Ministry of Industry and Commerce supervises commercial and industrial activities in the Dominican Republic as well as the fuels and natural gas commercialization to end users. |
The Dominican Republic has one main interconnected system with 4,904 MW of installed capacity, composed of thermal (77%), hydroelectric (15%), wind (5%), solar (2%) and biomass (1%).
Development Strategy — AES will continue to expand its gas business and incorporate partners directly in gas infrastructure projects. AES partnered with Energas in a joint venture to develop and operate the 50 km Eastern Pipeline, which reached commercial operations in February 2020. The joint venture will also develop a new LNG facility, additional storage, regasification and truck loading capacity. This will allow AES to reach new clients who have converted, or are in the process of converting, to natural gas as a fuel source.
Panama
Business Description — AES owns and operates five hydroelectric plants totaling 705 MW of generation capacity, and two thermoelectric power plants, Estrella del Mar I and Colon, totaling 453 MW of generation capacity, altogether representing 31% of the total installed capacity in Panama. In 2019, Colon's LNG regasification facility and 180,000 cubic meters storage tank were completed and became operational.
The majority of our hydroelectric plants in Panama are based on run-of-river technology, with the exception of the 260 MW Bayano plant. Hydrological conditions have an important influence on profitability. Variations in hydrology can result in an excess or a shortfall in energy production relative to our contractual obligations. Hydro generation is generally in a shortfall position during the dry season from January through May, while thermal assets are expected to be in a long position as their behavior is opposite and complementary to hydro generation.
Our hydro and thermal assets are mainly contracted through medium- to long-term PPAs with distribution companies. A small volume of our hydro plants are contracted with unregulated users. Our hydro assets in Panama have PPAs with distribution companies up to December 2030 for a total contracted capacity of 350 MW. Our thermal assets in Panama have PPAs with distribution companies for a total contracted capacity of 430 MW, of which 80 MW will expire between June and August 2020 and 350 MW will expire in August 2028.
Key Financial Drivers — Financial results are driven by many factors, including, but not limited to:
• | changes in hydrology which impacts commodity prices and exposes the business to variability in the cost of replacement power; |
• | fluctuations in commodity prices, mainly oil and natural gas, affect the cost of thermal generation and spot prices; |
• | constraints imposed by the capacity of transmission lines connecting the west side of the country with the load, keeping surplus power trapped during the wet season; and |
• | country demand as GDP growth is expected to remain strong over the short and medium term. |
Regulatory Framework and Market Structure — The Panamanian power sector is composed of three distinct operating business units: generation, distribution and transmission. Generators can enter into short-term and long-term PPAs with distributors or unregulated consumers. In addition, generators can enter into alternative supply
35 | 2019 Annual Report | |
contracts with each other. Outside of PPAs, generators may buy and sell energy in the short-term market. Generators can only contract up to their firm capacity.
Three main agencies are responsible for monitoring compliance with the General Electricity Law:
• | The SNE has the responsibilities of planning, supervising and controlling policies of the energy sector within Panama. With these responsibilities, the SNE proposes laws and regulations to the executive agencies that regulate the procurement of energy and hydrocarbons for the country. |
• | The regulator of public services, known as the ASEP, is an autonomous agency of the government. ASEP is responsible for the control and oversight of public services, including electricity, the transmission and distribution of natural gas utilities, and the companies that provide such services. |
• | The National Dispatch Center implements the economic dispatch of electricity in the wholesale market. The National Dispatch Center's objectives are to minimize the total cost of generation and maintain the reliability and security of the electric power system. Short-term power prices are determined on an hourly basis by the last dispatched generating unit. Physical generation of energy is determined by the National Dispatch Center regardless of contractual arrangements. |
Panama's current total installed capacity is 3,682 MW, composed of hydroelectric (48%), thermal (40%), wind (7%) and solar (5%) generation.
Development Strategy — Given our LNG facility’s excess capacity in Panama, the company will develop natural gas supply solutions for third parties such as power generators and industrial and commercial customers. This strategy will support a growing demand for natural gas in the region and will contribute to the AES mission for a greener energy future by reducing carbon dioxide emissions as a result of using LNG.
In addition to investing in LNG infrastructure, AES is investing in renewable projects within the region. This will increase complementary non-hydro renewable assets in the system and contribute to the reduction of hydrological risk in Panama.
Mexico
Business Description — AES has 1,361 MW of installed capacity in Mexico. The TEG and TEP pet coke-fired plants, located in Tamuin, San Luis Potosi, supply power to their offtakers under long-term PPAs expiring in 2027 with a 90% availability guarantee. TEG and TEP secure their fuel under a long-term contract.
Merida is a CCGT, located on Mexico's Yucatan Peninsula. Merida sells power to the CFE under a capacity and energy based long-term PPA through 2025. Additionally, the plant purchases natural gas and diesel under a long-term contract with one of the CFE’s subsidiaries, the cost of which is then passed through to the CFE under the terms of the PPA.
Eólica Mesa La Paz, a 306 MW wind project developed under a joint venture with Grupo Bal, achieved commercial operations in December 2019. Starting in 2020, Mesa La Paz will sell power under a long-term PPA expiring in 2045.
Key Financial Drivers — Financial results are driven by many factors, including, but not limited to:
• | as the companies are fully contracted, improved operational performance provides additional benefits, including performance incentives and/or excess energy sales; and |
• | changes in the methodology to calculate spot energy prices or Locational Marginal Prices, which impacts the excess energy sales to the CFE (see Regulatory Framework and Market Structure below) in (i) TEG and TEP under self-supply scheme, and (ii) Mesa La Paz under the New Market Rules. |
Regulatory Framework and Market Structure — Mexico has a single electric grid, the National Electricity System, covering all of Mexico's territory through the Interconnected National Electricity, Baja California and Southern Baja California Systems. The market comprises generation, transmission, distribution and commercialization segments.
Three main agencies, in addition to the Ministry of Energy, are responsible for monitoring compliance with the Electric Industry Law:
• | The Energy Regulatory Commission is responsible for the establishment of directives, orders, methodologies and standards to regulate the electric and fuel markets. |
36 | 2019 Annual Report | |
• | The National Center for Energy Control, as ISO, is responsible for managing the wholesale electricity market, transmission and distribution infrastructure, planning the network developments, guaranteeing open access to network infrastructure, executing competitive mechanisms to cover regulated demand, and setting transmission charges. |
• | The CFE owns the transmission and distribution grids and it is also the country's basic supplier. CFE is the offtaker for IPP generators, and together with its own power units has more than 50% of the current generation market share. |
Mexico has an installed capacity totaling 76 GW with a generation mix comprising of thermal (71%), hydroelectric (17%), wind (6%), and other fuel sources (6%).
Development Strategy — AES has partnered in a joint venture with Grupo BAL to co-invest in power and related infrastructure projects in Mexico, focusing on renewable and natural gas generation.
37 | 2019 Annual Report
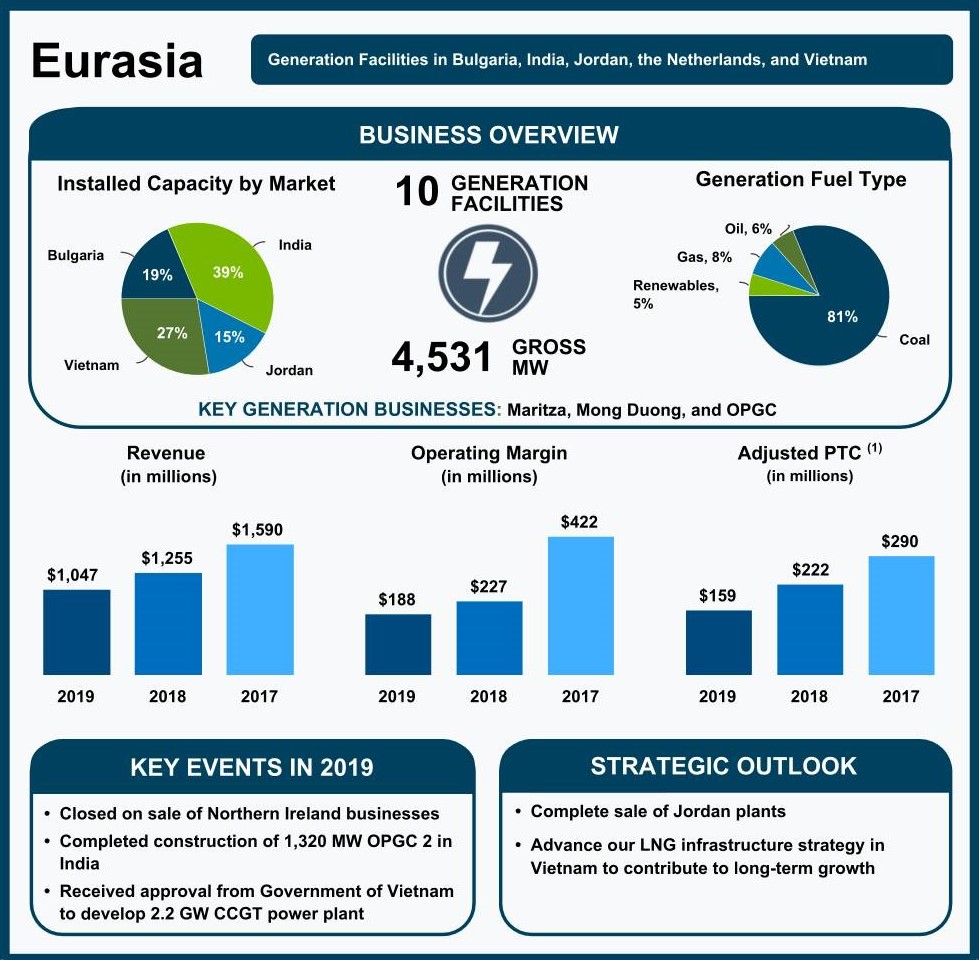
(1) Non-GAAP measure. See Item 7.—Management’s Discussion and Analysis of Financial Condition and Results of Operations—SBU Performance Analysis—Non-GAAP Measures for reconciliation and definition. | |
38 | 2019 Annual Report | |
Eurasia SBU
Generation — Our Eurasia SBU has generation facilities in five countries with total operating installed capacity of 4,531 MW. The following table lists our Eurasia SBU generation facilities:
Business | Location | Fuel | Gross MW | AES Equity Interest | Year Acquired or Began Operation | Contract Expiration Date | Customer(s) | |||||||||
Maritza | Bulgaria | Coal | 690 | 100 | % | 2011 | 2026 | Electricity Security Fund | ||||||||
St. Nikola | Bulgaria | Wind | 156 | 89 | % | 2010 | 2025 | Electricity Security Fund | ||||||||
Bulgaria Subtotal | 846 | |||||||||||||||
OPGC 2 (1) | India | Coal | 1,320 | 49 | % | 2019 | 2048 | GRID Corporation Ltd. | ||||||||
OPGC 1 (1) | India | Coal | 420 | 49 | % | 1998 | 2026 | GRID Corporation Ltd. | ||||||||
Delhi ES | India | Energy Storage | 10 | 60 | % | 2019 | ||||||||||
India Subtotal | 1,750 | |||||||||||||||
Amman East (2) | Jordan | Gas | 381 | 37 | % | 2009 | 2033 | National Electric Power Company | ||||||||
IPP4 (2) | Jordan | Heavy Fuel Oil | 250 | 36 | % | 2014 | 2039 | National Electric Power Company | ||||||||
AM Solar (2) | Jordan | Solar | 52 | 36 | % | 2019 | 2039 | National Electric Power Company | ||||||||
Jordan Subtotal | 683 | |||||||||||||||
Netherlands ES | Netherlands | Energy Storage | 10 | 100 | % | 2015 | ||||||||||
Netherlands Subtotal | 10 | |||||||||||||||
Mong Duong 2 | Vietnam | Coal | 1,242 | 51 | % | 2015 | 2040 | EVN | ||||||||
Vietnam Subtotal | 1,242 | |||||||||||||||
4,531 | ||||||||||||||||
_____________________________
(1) | Unconsolidated entity, accounted for as an equity affiliate. |
(2) | Entered into an agreement to sell these businesses in 2019. |
In June 2019, the Company completed the sale of its entire 100% interest in the Kilroot coal and oil-fired plant and energy storage facility and the Ballylumford gas-fired plant in the United Kingdom.
39 | 2019 Annual Report | |
The following map illustrates the location of our Eurasia facilities:
Eurasia Businesses
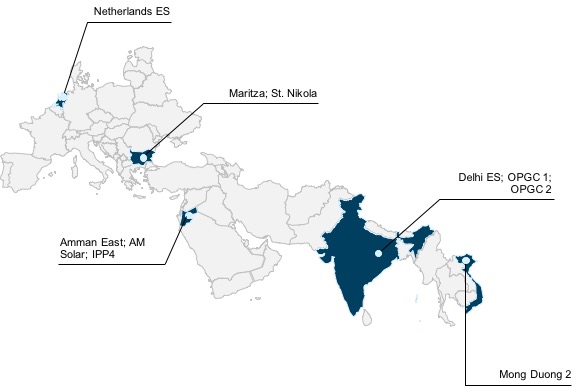
Vietnam
Business Description — Mong Duong 2 is a 1,242 MW gross coal-fired plant located in the Quang Ninh Province of Vietnam and was constructed under a BOT service concession agreement expiring in 2040. This is the first and largest coal-fired BOT plant using pulverized coal-fired boiler technology in Vietnam. The BOT company has a PPA with EVN and a Coal Supply Agreement with Vinacomin, both expiring in 2040.
Key Financial Drivers — Financial results are driven by many factors, including, but not limited to, the operating performance and availability of the facility.
Regulatory Framework and Market Structure — The Ministry of Industry and Trade in Vietnam is primarily responsible for formulating a program to restructure the power industry, developing the electricity market, and promulgating electricity market regulations. The fuel supply is owned by the government through Vinacomin, a state-owned entity, and Petro Vietnam.
The Vietnam power market is divided into three regions (North, Central and South), with total installed capacity of approximately 48 GW. The fuel mix in Vietnam is composed primarily of hydropower at 35% and coal at 38%. EVN, the national utility, owns 58% of installed generation capacity.
The government is in the process of realigning EVN-owned companies into three different independent operations in order to create a competitive power market. The first stage of this realignment was the implementation of the Competitive Electricity Market, which has been in operation since 2012. The second stage was the introduction of the Electricity Wholesale Market, which has been in operation since the beginning of 2019. The third and final stage impacts the Electricity Retail Market, which will undergo similar reforms after 2022. BOT power plants will not directly participate in the power market; alternatively, a single buyer will bid the tariff on the power pool on their behalf.
Development Strategy — In Vietnam, we continue to advance the development of our Son My LNG terminal project, which has a design capacity of up to 9.6 million metric tonnes per annum, and Son My 2 CCGT 2,250 MW project. In October 2019, we received formal approval as a government-mandated investor in the Son My LNG terminal project in partnership with PetroVietnam Gas. In November 2019, we received formal approval as the government-mandated investor with 100% equity ownership in the Son My 2 CCGT project and executed a statutory memorandum of understanding with Vietnam’s Ministry of Industry and Trade to continue developing the
40 | 2019 Annual Report | |
project under Vietnam’s Build-Operate-Transfer legal framework. The Son My 2 CCGT will utilize the Son My LNG terminal and be its anchor customer.
Bulgaria
Business Description — Our Maritza plant is a 690 MW lignite fuel thermal power plant. Maritza's entire power output is contracted with NEK, the state-owned electricity supplier and producer and trading company. Maritza is contracted under a 15-year PPA that expires in May 2026. Maritza has been collecting receivables from NEK in a timely manner since 2016. However, NEK's liquidity position remains subject to political conditions and regulatory changes in Bulgaria.
The DG Comp is reviewing NEK’s PPA with Maritza pursuant to the European Commission’s state aid rules. Maritza believes that its PPA is legal and in compliance with all applicable laws. For additional details see Key Trends and Uncertainties in Item 7.— Management’s Discussion and Analysis of Financial Condition and Results of Operations in this Form 10-K.
AES also owns an 89% economic interest in the St. Nikola wind farm with 156 MW of installed capacity. The power output of St. Nikola is sold to customers operating on the liberalized electricity market and the plant receives additional revenue per the terms of an October 2018 Contract for Premium with the state-owned Electricity Security Fund.
Key Financial Drivers — Financial results are driven by many factors, including, but not limited to:
• | regulatory changes in the Bulgaria power market; |
• | results of the DG Comp review; |
• | availability of the operating units; |
• | the level of wind resources for St. Nikola; |
• | spot market price volatility beyond the level of compensation through the Contract for Premium for St. Nikola; and |
• | NEK's ability to meet the payment terms of the PPA contract with Maritza. |
Regulatory Framework and Market Structure — The electricity sector in Bulgaria allows both regulated and competitive segments. NEK acts as a single buyer and seller for all regulated transactions on the market. Electricity outside the regulated market trades on one of the platforms of the Independent Bulgarian Electricity Exchange day-ahead market, intra-day market or bilateral contracts market. Bulgaria is working with the European Commission on a model that will allow the gradual phase-out of regulated energy prices starting in July 2020.
Bulgaria’s power sector is supported by a diverse generation mix, universal access to the grid, and numerous cross-border connections in neighboring countries. In addition, it plays an important role in the energy balance in the Balkan region.
Bulgaria has 12 GW of installed capacity enabling the country to meet and exceed domestic demand and export energy. Installed capacity is primarily thermal (40%) and nuclear (36%).
Environmental Regulation — Best Available Techniques Reference Document for Large Combustion Plants, the new EU environmental standards regulating emissions from the combustion of solid fuels for large combustion plants, was enacted in August 2017 and applies to Maritza. Impacted power plants are required to either meet the new standards or be granted a derogation by August 2021. Maritza requested such derogation from the Bulgarian environmental authorities in 2018, and expects to receive a response in 2020. If derogation is not received Maritza would seek to pass through the compliance costs to NEK pursuant to the PPA.
Jordan
Business Description — In Jordan, AES has a 37% controlling interest in Amman East, a 381 MW oil/gas-fired plant fully contracted with the national utility under a 25-year PPA expiring in 2033, a 36% controlling interest in the IPP4 plant, a 250 MW oil/gas-fired peaker plant, fully contracted with the national utility until 2039, and a 36% controlling interest in a 52 MW solar plant, fully contracted with the national utility under a 20-year PPA expiring in 2039. We consolidate the results in our operations as we have a controlling interest in these businesses.
Regulatory Framework and Market Structure — The Jordan electricity transmission market is a single-buyer model with the state-owned NEPCO responsible for transmission. NEPCO generally enters into long-term PPAs with IPPs to fulfill energy procurement requests from distribution utilities. The sector is prioritizing renewable energy
41 | 2019 Annual Report | |
development, with 2,200 MW of renewable energy installed capacity expected by the end of 2020, 1,300 MW of which is already connected to the grid.
India
Business Description — OPGC I is a 420 MW coal-fired generation facility located in the state of Odisha. OPGC I has a 30-year PPA with GRIDCO Limited, a state utility, expiring in 2026. OPGC II is a 1,320 MW coal-fired generation facility with 75% of its installed capacity contracted with GRIDCO for a period of four years through 2023, and 100% for the next 25 years through 2048. A separate trading arrangement has been negotiated for the remaining 25% of capacity to be sold in the trading market by GRIDCO on behalf of OPGC. OPGC is an unconsolidated entity and its results are reported as Net equity in earnings of affiliates on our Consolidated Statements of Operations.
Key Financial Drivers — Financial results are driven by many factors, including, but not limited to:
• | operating performance of the facility; |
• | regulatory and environmental policy changes; |
• | tariff determination by the OERC; and |
• | PPA provisions and energy trading. |
Regulatory Framework and Market Structure — In India, the power sector is comprised of state and central government-owned and privately-owned generation and distribution utilities. Electricity is sold to state utilities mostly under long-term PPAs and about 10% of electricity is sold in the short-term market, for example, traded on an energy exchange or through competitively bid bilateral contracts. The tariffs are fixed on a yearly basis by the Electricity Regulatory Commissions Central / State(s) for the long-term PPAs or determined through a competitive bidding process. OERC regulates the electricity purchase process for the distribution licensees, including the price at which the electricity from generating companies shall be procured for supply within the state of Odisha. OERC also facilitates intrastate transmission and wheeling of electricity. The electricity regulatory commissions are guided by the Electricity Act, National Electricity Policy, National Electricity Plan and Tariff Policy issued by the Government of India.
The power sector in India is composed of coal, gas, hydroelectric, renewable and nuclear energy. Total installed capacity as of December 31, 2019 was 365 GW, of which 63% is thermal generation. Renewable energy is adding capacity at a rapid pace and currently represents 23% of the total installed capacity. The remaining capacity is hydro (12%) and nuclear (2%).
Environmental Regulation — The Ministry of Environment, Forest and Climate Change in India has amended the Environment (Protection) Rules to require stricter emission limits for thermal power plants by the end of 2021. As a result of this amendment, Selective Catalytic Rectifier and Flue Gas Desulphurization systems are required to be installed in the existing OPGC units to comply with the new NOX and SO2 emissions limits, which will necessitate substantial investment by OPGC. We believe the cost of complying with the new environmental regulations for particulate matters, water consumption, SOx and NOx limits will be a pass-through in the OERC prescribed tariff regulations for both the existing and expansion units.
Development Strategy — India is a high-growth market for renewables and battery energy storage. AES owns and operates a test 10 MW battery energy storage system ("BESS") in Delhi city, located inside a substation of Tata Power Delhi Distribution Limited ("TPDDL"). The BESS is integrated with the TPDDL distribution system and provides various frequency regulation services. Discussions for commercial opportunities with TPDDL will commence early next year.
42 | 2019 Annual Report
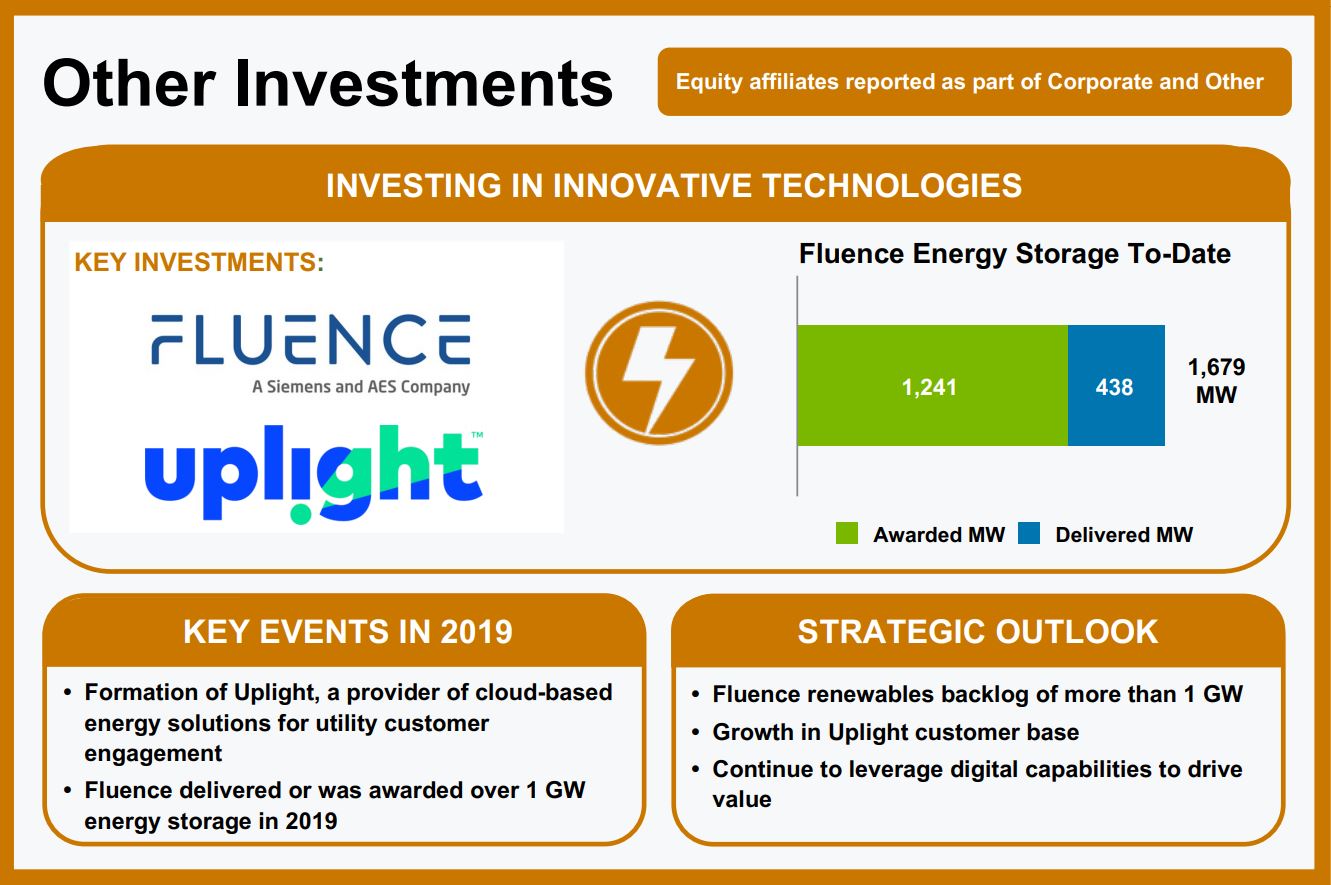
Other Investments
These investments are unconsolidated entities and their results are reported as Net equity in earnings of affiliates on our Consolidated Statements of Operations.
Fluence
Business Description — Fluence, AES' joint venture with Siemens, is a global energy storage technology and services company aligned with the AES strategy of becoming less carbon intensive. Fluence represents the combination of two global leaders in utility-scale, battery-based energy storage, bringing together the AES Advancion and Siemens Siestorage platforms, the capabilities and expertise of the two partners, and the global sales presence of Siemens.
Key Financial Drivers — Fluence's financial results are driven by the growth in its product revenue and an efficient cost structure that is expected to benefit from increased scale. Fluence’s pipeline of potential projects is global, with over 50% being located outside the U.S.
Regulatory Framework and Market Structure — The grid-connected energy storage sector is expanding rapidly with over 5 GW of projects publicly announced in 2019. By incorporating energy storage across the electric power network, utilities and communities around the world will optimize their infrastructure investments, increase network flexibility and resiliency, and accelerate cost-effective integration of renewable electricity generation. Fluence is positioned to be a leading participant in this growth, accounting for approximately 20% of the storage market across their target markets in 2019.
Uplight
Business Description — The Company holds an equity interest in Uplight as part of its digitization and growth strategy. Uplight offers a comprehensive digital platform for utility customer engagement. Uplight provides software and services to more than 80 of the world’s leading electric and gas utilities, principally in the U.S., with the mission of motivating and enabling energy users and providers to transition to a clean energy ecosystem. Uplight's solutions
43 | 2019 Annual Report | |
form a unified, end-to-end customer energy experience system that delivers innovative energy efficiency, demand response, and clean energy solutions quickly. Utility and energy company leaders rely on Uplight and its customer-focused digital energy experiences to improve customer satisfaction, reduce service costs, increase revenue, and reduce carbon emissions.
Key Financial Drivers — Uplight's financial results are driven by the rate of growth of new customers and the extension of additional services to existing customers. Revenue growth primarily drives its financial results, given the relative significance of fixed operating costs.
Development Strategy — AES' collaboration with Uplight is designed to create value for Uplight, AES and their respective customers. IPL and DP&L have implemented Uplight's consumer engagement solutions in support of energy efficiency and demand response programs. AES and Uplight are now working together to develop community solar, e-mobility and advanced consumer and industrial offerings, with plans for future deployment of the Uplight platform in Latin America.
Environmental and Land-Use Regulations
The Company faces certain risks and uncertainties related to numerous environmental laws and regulations, including existing and potential GHG legislation or regulations, and actual or potential laws and regulations pertaining to water discharges, waste management (including disposal of coal combustion residuals), and certain air emissions, such as SO2, NOX, particulate matter, mercury and other hazardous air pollutants. Such risks and uncertainties could result in increased capital expenditures or other compliance costs which could have a material adverse effect on certain of our U.S. or international subsidiaries, and our consolidated results of operations. For further information about these risks, see Item 1A.—Risk Factors—Our operations are subject to significant government regulation and our business and results of operations could be adversely affected by changes in the law or regulatory schemes; Several of our businesses are subject to potentially significant remediation expenses, enforcement initiatives, private party lawsuits and reputational risk associated with CCR; Our businesses are subject to stringent environmental laws, rules and regulations; and Concerns about GHG emissions and the potential risks associated with climate change have led to increased regulation and other actions that could impact our businesses in this Form 10-K. For a discussion of the laws and regulations of individual countries within each SBU where our subsidiaries operate, see discussion within Item 1.—Business of this Form 10-K under the applicable SBUs.
Many of the countries in which the Company does business have laws and regulations relating to the siting, construction, permitting, ownership, operation, modification, repair and decommissioning of, and power sales from electric power generation or distribution assets. In addition, international projects funded by the International Finance Corporation, the private sector lending arm of the World Bank, or many other international lenders are subject to World Bank environmental standards or similar standards, which tend to be more stringent than local country standards. The Company often has used advanced generation technologies in order to minimize environmental impacts, such as combined fluidized bed boilers and advanced gas turbines, and environmental control devices such as flue gas desulphurization for SO2 emissions and selective catalytic reduction for NOx emissions.
Environmental laws and regulations affecting electric power generation and distribution facilities are complex, change frequently and have become more stringent over time. The Company has incurred and will continue to incur capital costs and other expenditures to comply with these environmental laws and regulations. The Company may be required to make significant capital or other expenditures to comply with these regulations. There can be no assurance that the businesses operated by the subsidiaries of the Company will be able to recover any of these compliance costs from their counterparties or customers such that the Company's consolidated results of operations, financial condition and cash flows would not be materially affected.
Various licenses, permits and approvals are required for our operations. Failure to comply with permits or approvals, or with environmental laws, can result in fines, penalties, capital expenditures, interruptions or changes to our operations. Certain subsidiaries of the Company are subject to litigation or regulatory action relating to environmental permits or approvals. See Item 3.—Legal Proceedings in this Form 10-K for more detail with respect to environmental litigation and regulatory action.
44 | 2019 Annual Report | |
United States Environmental and Land-Use Legislation and Regulations
In the United States, the CAA and various state laws and regulations regulate emissions of air pollutants, including SO2, NOX, particulate matter, GHGs, mercury and other hazardous air pollutants. Certain applicable rules are discussed in further detail below.
CSAPR — CSAPR addresses the "good neighbor" provision of the CAA, which prohibits sources within each state from emitting any air pollutant in an amount which will contribute significantly to any other state’s nonattainment, or interference with maintenance of, any NAAQS. The CSAPR required significant reductions in SO2 and NOX emissions from power plants in many states in which subsidiaries of the Company operate. The Company is required to comply with the CSAPR in several states, including Ohio, Indiana and Maryland. The CSAPR is implemented, in part, through a market-based program under which compliance may be achievable through the acquisition and use of emissions allowances created by the EPA. The Company complies with CSAPR through operation of existing controls and purchases of allowances on the open market, as needed.
On October 26, 2016, the EPA published a final rule to update the CSAPR to address the 2008 ozone NAAQS ("CSAPR Update Rule"). The CSAPR Update Rule finds that NOx ozone season emissions in 22 states (including Indiana, Maryland and Ohio) affect the ability of downwind states to attain and maintain the 2008 ozone NAAQS, and, accordingly, the EPA issued federal implementation plans that both updated existing CSAPR NOx ozone season emission budgets for electric generating units within these states and implemented these budgets through modifications to the CSAPR NOx ozone season allowance trading program. Implementation started in the 2017 ozone season (May-September 2017). Affected facilities began to receive fewer ozone season NOx allowances in 2017, resulting in the need to purchase additional allowances. Additionally, on September 13, 2019, the D.C. Circuit remanded a portion of October 2016 CSAPR Update Rule to EPA. While the Company's additional CSAPR compliance costs to date have been immaterial, the future availability of and cost to purchase allowances to meet the emission reduction requirements is uncertain at this time, but it could be material if certain facilities will need to purchase additional allowances based on reduced allocations.
New Source Review ("NSR") — The NSR requirements under the CAA impose certain requirements on major emission sources, such as electric generating stations, if changes are made to the sources that result in a significant increase in air emissions. Certain projects, including power plant modifications, are excluded from these NSR requirements, if they meet the RMRR exclusion of the CAA. There is ongoing uncertainty, and significant litigation, regarding which projects fall within the RMRR exclusion. Over the past several years, the EPA has filed suits against coal-fired power plant owners and issued NOVs to a number of power plant owners alleging NSR violations. See Item 3.—Legal Proceedings in this Form 10-K for more detail with respect to environmental litigation and regulatory action, including an NOV issued by the EPA against IPL concerning NSR and prevention of significant deterioration issues under the CAA.
If NSR requirements are imposed on any of the power plants owned by the Company's subsidiaries, the results could have a material adverse impact on the Company's business, financial condition and results of operations.
Regional Haze Rule — The EPA's "Regional Haze Rule" is intended to reduce haze and protect visibility in designated federal areas, and sets guidelines for determining BART at affected plants and how to demonstrate "reasonable progress" toward eliminating man-made haze by 2064. The Regional Haze Rule required states to consider five factors when establishing BART for sources, including the availability of emission controls, the cost of the controls and the effect of reducing emission on visibility in Class I areas (including wilderness areas, national parks and similar areas). The statute would require compliance within five years after the EPA approves the relevant SIP or issues a federal implementation plan, although individual states may impose more stringent compliance schedules. In September 2017, the EPA published a final rule affirming the continued validity of the EPA's previous determination allowing states to rely on the CSAPR to satisfy BART requirements. All of the Company’s facilities that are subject to BART comply by meeting the requirements of CSAPR.
The second phase of the Regional Haze Rule began in 2019. States must submit regional haze plans for this second implementation period in 2021 to demonstrate reasonable progress towards reducing visibility impairment in Class I areas. States may need to require additional emissions controls for visibility impairing pollutants, including on BART sources, during the second implementation period. We currently cannot predict the impact of this second implementation period, if any, on any of our Company’s U.S. subsidiaries.
National Ambient Air Quality Standards ("NAAQS") — Under the CAA, the EPA sets NAAQS for six principal
45 | 2019 Annual Report | |
pollutants considered harmful to public health and the environment, including ozone, particulate matter, NOx and SO2, which result from coal combustion. Areas meeting the NAAQS are designated "attainment areas" while those that do not meet the NAAQS are considered "nonattainment areas." Each state must develop a plan to bring nonattainment areas into compliance with the NAAQS, which may include imposing operating limits on individual plants. The EPA is required to review NAAQS at five-year intervals.
Based on the current and potential future ambient air standards, certain of the states in which the Company's subsidiaries operate have determined or will be required to determine whether certain areas within such states meet the NAAQS. Some of these states may be required to modify their State Implementation Plans to detail how the states will attain or maintain their attainment status. As part of this process, it is possible that the applicable state environmental regulatory agency or the EPA may require reductions of emissions from our generating stations to reach attainment status for ozone, fine particulate matter, NOx or SO2. The compliance costs of the Company's U.S. subsidiaries could be material.
Beginning January 1, 2017, IPL Petersburg has been required to meet reduced SO2 limits established in a final rule published by IDEM in 2015 in accordance with a new one-hour SO2 NAAQS of 75 parts per billion. Improvements to the existing FGD systems at IPL’s Petersburg station were required to meet the emission limits imposed by the rule. The IURC approved IPL’s request for NAAQS SO2 compliance at its Petersburg generation station with 80% of qualifying costs recovered through a rate adjustment mechanism and the remainder recorded as a regulatory asset for recovery in a subsequent rate case. The approved capital cost of the NAAQS SO2 compliance plan is approximately $29 million. On August 15, 2018, the EPA proposed to approve Indiana’s State Implementation Plan addressing attainment of the 2010 SO2 standard for certain locations including those of IPL's Petersburg Generating Stations.
Greenhouse Gas Emissions — In January 2011, the EPA began regulating GHG emissions from certain stationary sources, including pre-construction permitting program for certain new construction or major modifications, known as the PSD. If future modifications to our U.S.-based businesses' sources become subject to PSD for other pollutants, it may trigger GHG BACT requirements and the cost of compliance with such requirements may be material.
On October 23, 2015, the EPA's rule establishing NSPS for new electric generating units became effective establishing CO2 emissions standards for newly constructed coal-fueled electric generating plants, which reflects the partial capture and storage of CO2 emissions from the plants. The EPA also promulgated NSPS applicable to modified and reconstructed electric generating units, which will serve as a floor for future BACT determinations for such units. The NSPS could have an impact on the Company's plans to construct and/or modify or reconstruct electric generating units in some locations. On December 20, 2018, the EPA published proposed revisions to the final NSPS for new, modified and reconstructed coal-fired electric utility steam generating units proposing that the Best System of Emissions Reduction for these units is highly efficient generation that would be equivalent to supercritical steam conditions for larger units and sub-critical steam conditions for smaller units, and not partial carbon capture and sequestration, as was finalized in the 2015 final NSPS. The EPA did not include revisions for natural-gas combined cycle or simple cycle units in the December 20, 2018 proposal. Challenges to the GHG NSPS are being held in abeyance at this time.
On October 23, 2015, the EPA finalized CO2 emission rules for existing power plants under Clean Air Act Section 111(d) (called the CPP). The CPP provided for interim emissions performance rates that must be achieved beginning in 2022 and final emissions performance rates that must be achieved starting in 2030. On February 9, 2016, the U.S. Supreme Court issued orders staying implementation of the CPP pending resolution of challenges to the rule. On July 8, 2019, the EPA published a final rule to repeal the CPP. On August 31, 2018, the EPA published in the Federal Register proposed Emission Guidelines for Greenhouse Gas Emissions from Existing Electric Utility Generating Units, known as the Affordable Clean Energy (ACE) Rule. In addition, the EPA proposed associated revisions to implementing regulations and the New Source Review program. On July 8, 2019, the EPA published the final ACE Rule along with associated revisions to implementing regulations. The final ACE Rule replaces the CPP and determines that heat rate improvement measures are the Best System of Emissions Reductions for existing coal-fired electric generating units, including units at IPL Petersburg in Indiana and AES Warrior Run in Maryland. On September 17, 2019, the D.C. Circuit granted motions to dismiss as moot legal challenges to the CPP and challenges to EPA's denial of reconsideration of the CPP. The final ACE rule requires that the State of Indiana and the State of Maryland, respectively, develop a State Plan to establish CO2 emission limits for designated facilities, within three years. Impacts remain largely uncertain pending the development of the State Plans.
46 | 2019 Annual Report | |
On November 4, 2019, the U.S. announced that it had officially notified the U.N. that the U.S. will withdraw from the Paris Agreement. The U.S. will officially be able to withdraw on November 4, 2020. As such, there is some uncertainty with respect to the impact of GHG rules on IPL. The GHG BACT requirements will not apply at least until we construct a new major source or make a major modification of an existing major source, and the NSPS will not require us to comply with an emissions standard until we construct a new electric generating unit. We do not have any planned major modifications of an existing source or plans to construct a new major source at this time which are expected to be subject to these regulations. Furthermore, the EPA, states and other utilities are still evaluating potential impacts of the GHG regulations in our industry. In light of these uncertainties, we cannot predict the impact of the EPA’s current and future GHG regulations on our consolidated results of operations, cash flows, and financial condition, but it could be material.
Due to the future uncertainty of these regulations and associated litigation, we cannot at this time determine the impact on our operations or consolidated financial results, but we believe the cost to comply with the ACE, should it be upheld and implemented in its current or a substantially similar form, could be material. The GHG NSPS remains in effect at this time, and, absent further action from the EPA that rescinds or substantively revises the NSPS, it could impact any Company plans to construct and/or modify or reconstruct electric generating units in some locations, which may have a material impact on our business, financial condition or results of operations.
Cooling Water Intake — The Company's facilities are subject to a variety of rules governing water use and discharge. In particular, the Company's U.S. facilities are subject to the CWA Section 316(b) rule issued by the EPA that seeks to protect fish and other aquatic organisms by requiring existing steam electric generating facilities to utilize the BTA for cooling water intake structures. On August 15, 2014, the EPA published its final standards to protect fish and other aquatic organisms drawn into cooling water systems at large power plants. These standards require certain subject facilities to choose among seven BTA options to reduce fish impingement. In addition, facilities that withdraw at least 125 million gallons per day for cooling purposes must conduct studies to assist permitting authorities to determine which site-specific controls, if any, are required to reduce entrainment. It is possible that this decision-making process, which includes permitting and public input, could result in the need to install closed-cycle cooling systems (closed-cycle cooling towers), or other technology. Finally, the standards require that new units added to an existing facility to increase generation capacity are required to reduce both impingement and entrainment. It is not yet possible to predict the total impacts of this final rule at this time, including any challenges to such final rule and the outcome of any such challenges. However, if additional capital expenditures are necessary, they could be material.
AES Southland's current plan is to comply with the SWRCB OTC Policy by shutting down and permanently retiring all existing generating units at AES Alamitos, AES Huntington Beach and AES Redondo Beach that utilize OTC by December 31, 2020, the compliance date included in the OTC Policy. New air-cooled combined cycle gas turbine generators and battery energy storage systems will be constructed at the AES Alamitos and AES Huntington Beach generating stations, and there is currently no plan to replace the OTC generating units at the AES Redondo Beach generating station. The execution of the implementation plan for compliance with the SWRCB's OTC Policy is entirely dependent on the Company's ability to execute on long-term power purchase agreements to support project financing of the replacement generating units at AES Alamitos and AES Huntington Beach. The SWRCB is currently reviewing the implementation plan and latest information on OTC generating unit retirement dates and new generation availability to evaluate the impact on electrical system reliability, which could result in the extension of OTC compliance dates for specific units.
The Company’s California subsidiaries have signed 20-year term power purchase agreements with Southern California Edison for the new generating capacity which have been approved by the California Public Utilities Commission. Construction of new generating capacity began in June 2017 at AES Huntington Beach and July 2017 at AES Alamitos. Construction at both sites is on schedule and required the following OTC units to retire earlier than December 31, 2020 to provide interconnection capacity and/or emissions credits prior to startup of the new generating units:
• | Redondo Beach Unit 7 - September 30, 2019 |
• | Huntington Beach Unit 1 - December 31, 2019 |
• | Alamitos Units 1, 2, and 6 - December 31, 2019 |
The remaining AES OTC generating units in California will be shutdown and permanently retired by December 31, 2020 unless the SWRCB extends the OTC Policy compliance date for these units to maintain electrical system reliability. On January 23, 2020 the Statewide Advisory Committee on Cooling Water Intake Structures (SACCWIS)
47 | 2019 Annual Report | |
adopted a recommendation to present to the SWRCB to extend the OTC compliance dates for AES Huntington Beach and AES Alamitos until December 31, 2023 and AES Redondo Beach until December 31, 2021. The SWRCB is expected to act on the SACCWIS recommendation in the summer of 2020.
Power plants are required to comply with the more stringent of state or federal requirements. At present, the California state requirements are more stringent and have earlier compliance dates than the federal EPA requirements, and are therefore applicable to the Company's California assets.
Challenges to the federal EPA's rule were filed and consolidated in the U.S. Court of Appeals for the Second Circuit, although implementation of the rule was not stayed while the challenges proceeded. On July 23, 2018, the U.S. Court of Appeals for the Second Circuit upheld the rule. The Second Circuit later denied a petition by environmental groups for rehearing. The Company anticipates that compliance with CWA Section 316(b) regulations and associated costs could have a material impact on our consolidated financial condition or results of operations.
Water Discharges — On June 29, 2015, the EPA and the U.S. Army Corps of Engineers ("the agencies") published a final rule defining federal jurisdiction over waters of the United States. This rule, which initially became effective on August 28, 2015, could expand or otherwise change the number and types of waters or features subject to federal permitting. However, the agencies engaged in a two-step process to repeal the 2015 "Waters of the U.S." rule and replace it with a newly promulgated rule called the "Navigable Waters Protection" rule. The agencies completed the first step on October 22, 2019 by publishing the final rule repealing the 2015 “Waters of the United States” rule. In step two, the agencies proposed a revised definition of waters of the United States on December 11, 2018 and released the prepublication version of the final "Navigable Waters Protection" rule on January 23, 2020. It is too early to determine whether the newly promulgated "Navigable Waters Protection" rule may have a material impact on our business, financial condition or results of operations.
Certain of the Company's U.S.-based businesses are subject to National Pollutant Discharge Elimination System ("NPDES") permits that regulate specific industrial waste water and storm water discharges to the waters of the United States under the CWA.
On August 28, 2012, the IDEM issued NPDES permits that set new water quality-based effluent discharge limits for the IPL Harding Street and Petersburg facilities with full compliance ultimately required by September 29, 2017. The deadline for Petersburg to commission a portion of the treatment system was subsequently extended to April 11, 2018.
On November 3, 2015, the EPA published its final ELG rule to reduce toxic pollutants discharged into waters of the U.S. by steam-electric power plants through technology applications. These effluent limitations for existing and new sources include dry handling of fly ash, closed-loop or dry handling of bottom ash and more stringent effluent limitations for flue gas de-sulfurization wastewater. The required compliance time lines for existing sources was to be established between November 1, 2018 and December 31, 2023. On September 18, 2017, the EPA published a final rule delaying certain compliance dates of the ELG rule for two years while it administratively reconsiders the rule. IPL Petersburg has installed a dry bottom ash handling system in response to the CCR rule described below and wastewater treatment systems in response to the NPDES permits described above in advance of the ELG compliance date. Other U.S. businesses already include dry handling of fly ash and bottom ash and do not generate flue gas de-sulfurization wastewater. On April 12, 2019, the U.S. Court of Appeals for the Fifth Circuit vacated and remanded portions of the EPA's 2015 ELG Rule related to legacy wastewaters and combustions residual leachate. On November 22, 2019, the EPA published proposed revisions to the ELG rule specifically for flue gas desulfurization wastewater and bottom ash transport water. It is too early to determine whether the outcome of the decision or current or future revisions to the ELG rule might have a material impact on our business, financial condition and results of operations.
Selenium Rule — In June 2016, the EPA published the final national chronic aquatic life criterion for the pollutant Selenium in fresh water. NPDES permits may be updated to include Selenium water quality based effluent limits based on a site-specific evaluation process which includes determining if there is a reasonable potential to exceed the revised final Selenium water quality standards for the specific receiving water body utilizing actual and/or project discharge information for the generating facilities. As a result, it is not yet possible to predict the total impacts of this final rule at this time, including any challenges to such final rule and the outcome of any such challenges. However, if additional capital expenditures are necessary, they could be material. IPL would seek recovery of these capital expenditures; however, there is no guarantee it would be successful in this regard.
Waste Management — In the course of operations, the Company's facilities generate solid and liquid waste materials requiring eventual disposal or processing. With the exception of coal combustion residuals ("CCR"), the
48 | 2019 Annual Report | |
wastes are not usually physically disposed of on our property, but are shipped off site for final disposal, treatment or recycling. CCR, which consists of bottom ash, fly ash and air pollution control wastes, is disposed of at some of our coal-fired power generation plant sites using engineered, permitted landfills. Waste materials generated at our electric power and distribution facilities may include asbestos, CCR, oil, scrap metal, rubbish, small quantities of industrial hazardous wastes such as spent solvents, tree and land clearing wastes and polychlorinated biphenyl contaminated liquids and solids. The Company endeavors to ensure that all of its solid and liquid wastes are disposed of in accordance with applicable national, regional, state and local regulations. On October 19, 2015, an EPA rule regulating CCR under the Resource Conservation and Recovery Act as nonhazardous solid waste became effective. The rule established nationally applicable minimum criteria for the disposal of CCR in new and currently operating landfills and surface impoundments, including location restrictions, design and operating criteria, groundwater monitoring, corrective action and closure requirements and post-closure care. The primary enforcement mechanisms under this regulation would be actions commenced by the states and private lawsuits. On December 16, 2016, the Water Infrastructure Improvements for the Nation Act ("WIN Act") was signed into law. This includes provisions to implement the CCR rule through a state permitting program, or if the state chooses not to participate, a possible federal permit program. The EPA has indicated that it will implement a phased approach to amending the CCR Rule. In July 2018, the EPA published final CCR Rule Amendments (Phase One, Part One) in the Federal Register. In August 2018, the U.S. Court of Appeals for the District of Columbia issued a decision in certain CCR litigation matters, which may result in additional revisions to the CCR rule. In October 2018, some environmental groups filed a Petition for Review challenging EPA's final CCR rule amendments (Phase One, Part One) which have since been remanded without vacatur to the EPA. On August 14, 2019, the EPA published the amendments to the CCR rule; the amendments relate to the CCR rule's criteria for determining beneficial use and the regulation of CCR piles, among other revisions. On December 2, 2019, the EPA published additional proposed amendments to the CCR rule titled "A Holistic Approach to Closure Part A: Deadline to Initiate Closure". On December 19, 2019, the EPA issued a prepublication version of a proposed rule to establish a federal CCR permit program that would operate in states without approved CCR permit programs. If this rule is finalized before Indiana or Puerto Rico establishes a state-level CCR permit program, AES CCR units in those locations could eventually be required to apply for a federal CCR permit from EPA.
The CCR rule, current or proposed amendments to the CCR rule, the results of groundwater monitoring data or the outcome of CCR-related litigation could have a material impact on our business, financial condition and results of operations. IPL would seek recovery of any resulting expenditures; however, there is no guarantee we would be successful in this regard.
On January 2, 2020, Puerto Rico Senate Bill 1221 was signed by the Puerto Rico Governor into law and became effective as Act 5-2020. Act 5-2020 prohibits the disposal and unencapsulated beneficial use of CCR, places restrictions on storage of CCR in Puerto Rico, and requires the Puerto Rico Department of Natural and Environmental Resources to develop implementation regulations. As such, it is not yet possible to determine whether this might have a material impact on our business, financial condition and results of operations.
Comprehensive Environmental Response, Compensation and Liability Act of 1980 — This act, also known as "Superfund," may be the source of claims against certain of the Company's U.S. subsidiaries from time to time. There is ongoing litigation at a site known as the South Dayton Landfill where a group of companies already recognized as potentially responsible parties ("PRPs") have sued DP&L and other unrelated entities seeking a contribution toward the costs of assessment and remediation. DP&L is actively opposing such claims. In 2003, DP&L received notice that the EPA considers DP&L to be a potentially responsible party at the Tremont City landfill Superfund site. The EPA has taken no further action with respect to DP&L since 2003 regarding the Tremont City landfill. On October 16, 2019, DP&L received a special notice that the EPA considers DP&L, along with other parties, to be a PRP for the clean-up of hazardous substances at a third-party landfill known as the Tremont City Barrel Site, located near Dayton, Ohio. The Company is unable to determine whether there will be any liability, or the size of any liability that may ultimately be assessed against DP&L at these three sites, but any such liability could be material to DP&L.
International Environmental Regulations
For a discussion of the material environmental regulations applicable to the Company's businesses located outside of the U.S., see Environmental Regulation under the discussion of the various countries in which the Company's subsidiaries operate in Business—Our Organization and Segments, above.
49 | 2019 Annual Report | |
Customers
We sell to a wide variety of customers. No individual customer accounted for 10% or more of our 2019 total revenue. In our generation business, we own and/or operate power plants to generate and sell power to wholesale customers such as utilities and other intermediaries. Our utilities sell to end-user customers in the residential, commercial, industrial and governmental sectors in a defined service area.
Executive Officers
The following individuals are our executive officers:
Bernerd Da Santos, 56 years old, has served as Executive Vice President and Chief Operating Officer since December 2017. Previously, Mr. Da Santos held several positions at AES, including Chief Operating Officer and Senior Vice President from 2014 to 2017, Chief Financial Officer, Global Finance Operations from 2012 to 2014, Chief Financial Officer of Global Utilities from 2011 to 2012, Chief Financial Officer of Latin America and Africa from 2009 to 2011, Chief Financial Officer of Latin America from 2007 to 2009, Managing Director of Finance for Latin America from 2005 to 2007, and VP and Controller of La Electricidad de Caracas ("EDC") (Venezuela). Prior to joining AES in 2000, Mr. Da Santos held a number of financial leadership positions at EDC. Mr. Da Santos is a member of the boards of AES Gener, Companhia Brasiliana de Energia, AES Tietê, Compañia de Alumbrado Electrico de San Salvador, Empresa Electrica de Oriente, Compañia de Alumbrado Electrico de Santa Ana, and Indianapolis Power & Light. Mr. Da Santos holds a bachelor's degree with Cum Laude distinction in Business Administration and Public Administration from Universidad José Maria Vargas, a bachelor's degree with Cum Laude distinction in Business Management and Finance, and an MBA with Cum Laude distinction from Universidad José Maria Vargas.
Paul L. Freedman, 49 years old, has served as Senior Vice President and General Counsel since February 2018 and as Corporate Secretary since October 2018. Prior to assuming his current position, Mr. Freedman served as Chief of Staff to the Chief Executive Officer from April 2016 to February 2018, Assistant General Counsel from 2014 to 2016, General Counsel, North America Generation, from 2011 to 2014, Senior Corporate Counsel from 2010 to 2011 and Counsel 2007 to 2010. Mr. Freedman is a member of the Boards of IPALCO, AES U.S. Investments, DP&L, the Business Council for International Understanding, and the Coalition for Integrity. Prior to joining AES, Mr. Freedman was Chief Counsel for credit programs at the U.S. Agency for International Development and he previously worked as an associate at the law firms of White & Case and Freshfields. Mr. Freedman received a B.A. from Columbia University and a J.D. from the Georgetown University Law Center.
Andrés R. Gluski, 62 years old, has been President, Chief Executive Officer and a member of our Board of Directors since September 2011 and is a member of the Innovation and Technology Committee. Prior to assuming his current position, Mr. Gluski served as Executive Vice President and Chief Operating Officer of the Company since March 2007. Prior to becoming the Chief Operating Officer of AES, Mr. Gluski was Executive Vice President and the Regional President of Latin America from 2006 to 2007. Mr. Gluski was Senior Vice President for the Caribbean and Central America from 2003 to 2006, Chief Executive Officer of EDC from 2002 to 2003 and Chief Executive Officer of AES Gener (Chile) in 2001. Prior to joining AES in 2000, Mr. Gluski was Executive Vice President and Chief Financial Officer of EDC, Executive Vice President of Banco de Venezuela (Grupo Santander), Vice President for Santander Investment, and Executive Vice President and Chief Financial Officer of CANTV (subsidiary of GTE). Mr. Gluski has also worked with the International Monetary Fund in the Treasury and Latin American Departments and served as Director General of the Ministry of Finance of Venezuela. From 2013 to 2016, Mr. Gluski served on President Obama's Export Council. Mr. Gluski is a member of the Board of Waste Management and Fluence. Mr. Gluski is also Chairman of the Americas Society/Council of the Americas, and Director of the Edison Electric Institute. Mr. Gluski is a magna cum laude graduate of Wake Forest University and holds an M.A. and a Ph.D. in Economics from the University of Virginia.
Lisa Krueger, 56 years old, has served as Senior Vice President and President of the US and Utilities SBU since September 2018. Prior to joining AES, Ms. Krueger served as an energy consultant from July 2017 to August 2018, Chief Commercial Officer of Cogentrix Energy Power Management, LLC, the portfolio management company of Carlyle Power Partners, from January 2017 to June 2017, and President and Chief Executive Officer of Essential Power, LLC from March 2014 to June 2017. Ms. Krueger also served as Vice President - Sustainable Development of First Solar, one of the world’s largest photovoltaic manufacturers and system integrators, where she led the development and implementation of various domestic and internal strategic plans focused on market and business development and served as the President of First Solar Electric. Prior to First Solar, Ms. Krueger held a variety of
50 | 2019 Annual Report | |
executive level positions with Dynegy, Inc., including Vice President - Enterprise Risk Control, Vice President - Northeast Commercial Operations, Vice President - Origination and Retail Operations, and Vice President, Environmental, Health & Safety. She also held a variety of leadership roles at Illinois Power, including positions in transmission planning and system operations, generation planning and system operations, and environmental, health & safety. Ms. Krueger has a Bachelor of Science degree in Chemical Engineering from the Missouri University of Science and Technology and an MBA from the Jones Graduate School of Business at Rice University.
Tish Mendoza, 44 years old, has served as Senior Vice President, Global Human Resources and Internal Communications and Chief Human Resources Officer since 2015. Prior to assuming her current position, Ms. Mendoza was the Vice President of Human Resources, Global Utilities from 2011 to 2012 and Vice President of Global Compensation, Benefits and HRIS, including Executive Compensation, from 2008 to 2011 and acted in the same capacity as the Director of the function from 2006 to 2008. Ms. Mendoza is a member of the boards of AES Chivor S.A., DP&L, and AES Distributed Energy and sits on AES' compensation and benefits committees. Prior to joining AES, Ms. Mendoza was Vice President of Human Resources for a product company in the Treasury Services division of JP Morgan Chase and Vice President of Human Resources and Compensation and Benefits at Vastera, Inc, a former technology and managed services company. Ms. Mendoza earned certificates in Leadership and Human Resource Management, and a bachelor's degree in Business Administration and Human Resources.
Leonardo Moreno, 40 years old, has served as Senior Vice President, Corporate Strategy and Investments and Chief Commercial Officer since March 2019. Previously, Mr. Moreno also served as Senior Vice President, Corporate Strategy and Investments and Chief Risk Officer from May 2017, the Chief Financial Officer, Europe SBU from May 2015 to April 2017 and as a Managing Director on AES’ Mergers & Acquisitions team from January 2012 to April 2015. Since joining AES in 2006, Mr. Moreno has served in various positions throughout the Company. Mr. Moreno is a member of the boards of DP&L, AES Tietê and AES Distributed Energy. Prior to joining AES, Mr. Moreno worked for Ernst & Young. Mr. Moreno has a degree in Business Administration from Universidade Federal de Minas Gerais, Brazil and has completed executive business and leadership programs at the Harvard Business School, London Business School, Georgetown University and the University of Virginia.
Julian Nebreda, 53 years old, has served as Senior Vice President and President of the South America SBU since October 2018. Prior to assuming his current position, Mr. Nebreda served as the President of the AES Brazil SBU from April 2016 to October 2018, and the President of the Europe SBU from June 2009 to April 2016. Prior to June 2009, Mr. Nebreda held several senior positions, such as Vice President for Central America and Caribbean, Chief Executive Officer of EDC and President of AES Dominicana, in Santo Domingo, Dominican Republic. Mr. Nebreda serves as Chairman of the Board of AES Gener and AES Tietê. Before joining AES, Mr. Nebreda has held positions in the public and private sectors, namely he served as Counsellor to the Executive Director from Panama and Venezuela at the Inter-American Development Bank. Mr. Nebreda earned a law degree from Universidad Católica Andrés Bello in Caracas, Venezuela. He also earned a Master of Laws in Common Law with a Fulbright Fellowship and a Master of Laws in Securities and Financial Regulations, both from Georgetown University.
Gustavo Pimenta, 41 years old, has served as Executive Vice President and Chief Financial Officer since January 2019. Prior to assuming his current position, Mr. Pimenta served as Deputy Chief Financial Officer from February 2018 to December 2018, Chief Financial Officer for the MCAC SBU from December 2014 to February 2018 and as Chief Financial Officer of AES Brazil from 2013 to December 2014. Prior to joining AES in 2009, Mr. Pimenta held various positions at Citigroup, including Vice President of Strategy and M&A in London and New York City. Mr. Pimenta is a member of the boards of IPALCO, AES Gener and sPower. Mr. Pimenta received a Bachelor’s degree in Economics from Universidade Federal de Minas Gerais and a Master’s degree in Economics and Finance from Fundação Getulio Vargas. He also participated in development programs in Finance, Strategy and Risk Management at New York University, University of Virginia’s Darden School of Business and Georgetown University.
Juan Ignacio Rubiolo, 43 years old, has served Senior Vice President and President of the MCAC SBU since March 2018. Previously Mr. Rubiolo served as the Chief Executive Officer of AES Mexico from 2014 to March 2018 and as a Vice President on the Commercial team of the MCAC SBU from 2013 to 2014. Mr. Rubiolo joined AES in 2001 and has worked in AES businesses in the Philippines, Argentina, Mexico, Panama, and the Dominican Republic. Mr. Rubiolo serves on the boards of AES Gener, Itabo, AES Andres, and AES Panama. Mr. Rubiolo has a Science Degree in Business from the Universidad Austral of Argentina, a Master of Project Management from the Quebec University in Canada and has completed the executive business and leadership program at the University of Virginia.
51 | 2019 Annual Report | |
How to Contact AES and Sources of Other Information
Our principal offices are located at 4300 Wilson Boulevard, Arlington, Virginia 22203. Our telephone number is (703) 522-1315. Our website address is http://www.aes.com. Our annual reports on Form 10-K, quarterly reports on Form 10-Q and current reports on Form 8-K and any amendments to such reports filed pursuant to Section 13(a) or Section 15(d) of the Securities Exchange Act of 1934 (the "Exchange Act") are posted on our website. After the reports are filed with, or furnished to the SEC, they are available from us free of charge. Material contained on our website is not part of and is not incorporated by reference in this Form 10-K. The SEC maintains an internet website that contains the reports, proxy and information statements and other information that we file electronically with the SEC at www.sec.gov.
Our CEO and our CFO have provided certifications to the SEC as required by Section 302 of the Sarbanes-Oxley Act of 2002. These certifications are included as exhibits to this Annual Report on Form 10-K.
Our CEO provided a certification pursuant to Section 303A of the New York Stock Exchange Listed Company Manual on April 24, 2019.
Our Code of Business Conduct ("Code of Conduct") and Corporate Governance Guidelines have been adopted by our Board of Directors. The Code of Conduct is intended to govern, as a requirement of employment, the actions of everyone who works at AES, including employees of our subsidiaries and affiliates. Our Ethics and Compliance Department provides training, information, and certification programs for AES employees related to the Code of Conduct. The Ethics and Compliance Department also has programs in place to prevent and detect criminal conduct, promote an organizational culture that encourages ethical behavior and a commitment to compliance with the law, and to monitor and enforce AES policies on corruption, bribery, money laundering and associations with terrorists groups. The Code of Conduct and the Corporate Governance Guidelines are located in their entirety on our website. Any person may obtain a copy of the Code of Conduct or the Corporate Governance Guidelines without charge by making a written request to: Corporate Secretary, The AES Corporation, 4300 Wilson Boulevard, Arlington, VA 22203. If any amendments to, or waivers from, the Code of Conduct or the Corporate Governance Guidelines are made, we will disclose such amendments or waivers on our website.
ITEM 1A. RISK FACTORS
You should consider carefully the following risks, along with the other information contained in or incorporated by reference in this Form 10-K. Additional risks and uncertainties also may adversely affect our business and operations, including those discussed in Item 7.—Management's Discussion and Analysis of Financial Condition and Results of Operations in this Form 10-K. If any of the following events actually occur, our business, financial results and financial condition could be materially adversely affected.
We routinely encounter and address risks, some of which may cause our future results to be materially different than we presently anticipate. The categories of risk we have identified in Item 1A.—Risk Factors of this Form 10-K include the following:
• | risks associated with our operations; |
• | risks associated with governmental regulation and laws; and |
• | risks related to our indebtedness and financial condition. |
These risk factors should be read in conjunction with Item 7.—Management's Discussion and Analysis of Financial Condition and Results of Operations and the Consolidated Financial Statements and related notes included elsewhere in this report.
Risks Associated with our Operations
The operation of power generation, distribution and transmission facilities involves significant risks.
We are in the business of generating and distributing electricity, which involves certain risks that can adversely affect financial and operating performance, including:
• | changes in the availability of our generation facilities or distribution systems due to increases in scheduled and unscheduled plant outages, equipment failure, failure of transmission systems, labor disputes, disruptions in fuel supply, poor hydrologic and wind conditions, inability to comply with regulatory or permit |
52 | 2019 Annual Report | |
requirements, or catastrophic events such as fires, floods, storms, hurricanes, earthquakes, dam failures, tsunamis, explosions, terrorist acts, cyber attacks or other similar occurrences; and
• | changes in our operating cost structure, including, but not limited to, increases in costs relating to gas, coal, oil and other fuel; fuel transportation; purchased electricity; operations, maintenance and repair; environmental compliance, including the cost of purchasing emissions offsets and capital expenditures to install environmental emission equipment; transmission access; and insurance. |
Our businesses require reliable transportation sources (including related infrastructure such as roads, ports and rail), power sources and water sources to access and conduct operations. The availability and cost of this infrastructure affects capital and operating costs and levels of production and sales. Limitations, or interruptions in this infrastructure or at the facilities of our subsidiaries, including as a result of third parties intentionally or unintentionally disrupting this infrastructure or the facilities of our subsidiaries, could impede their ability to produce electricity. This could have a material adverse effect on our businesses' results of operations, financial condition and prospects.
In addition, a portion of our generation facilities were constructed many years ago. Older generating equipment may require significant capital expenditures for maintenance. The equipment at our plants, whether old or new, is also likely to require periodic upgrading, improvement or repair, and replacement equipment or parts may be difficult to obtain in circumstances where we rely on a single supplier or a small number of suppliers. The inability to obtain replacement equipment or parts may impact the ability of our plants to perform and could, therefore, have a material impact on our business and results of operations. Breakdown or failure of one of our operating facilities may prevent the facility from performing under applicable power sales agreements which, in certain situations, could result in termination of a power purchase or other agreement or incurrence of a liability for liquidated damages and/or other penalties.
Power generation involves hazardous activities, including acquiring, transporting and unloading fuel, operating large pieces of rotating equipment and delivering electricity to transmission and distribution systems. In addition to natural risks, such as earthquakes, floods, lightning, hurricanes and wind, hazards, such as fire, explosion, collapse and machinery failure, are inherent risks in our operations which may occur as a result of inadequate internal processes, technological flaws, human error or actions of third parties or other external events. The control and management of these risks depend upon adequate development and training of personnel and on the existence of operational procedures, preventative maintenance plans and specific programs supported by quality control systems which reduce, but do not eliminate, the possibility of the occurrence and impact of these risks.
The hazards described above, along with other safety hazards associated with our operations, can cause significant personal injury or loss of life, severe damage to and destruction of property, plant and equipment, contamination of, or damage to, the environment and suspension of operations. The occurrence of any one of these events may result in our being named as a defendant in lawsuits asserting claims for substantial damages, environmental cleanup costs, personal injury and fines and/or penalties.
We do a significant amount of business outside the United States, including in developing countries, which presents significant risks.
A significant amount of our revenue is generated outside the United States and a significant portion of our international operations is conducted in developing countries. Part of our growth strategy is to expand our business in certain developing countries in which AES has an existing presence. We believe these countries may have higher growth rates and offer greater opportunities, with potentially higher returns than in some more developed countries. International operations, particularly the operation, financing and development of projects in developing countries, entail significant risks and uncertainties, including, without limitation:
• | economic, social and political instability in any particular country or region; |
• | adverse changes in currency exchange rates; |
• | government restrictions on converting currencies or repatriating funds; |
• | unexpected changes in foreign laws and regulations or in trade, monetary, fiscal or environmental policies; |
• | high inflation and monetary fluctuations; |
• | restrictions on imports of solar panels, wind turbines, coal, oil, gas or other raw materials required by our generation businesses to operate; |
• | threatened or consummated expropriation or nationalization of our assets by foreign governments; |
53 | 2019 Annual Report | |
• | unexpected delays in permitting and governmental approvals; |
• | unexpected changes or instability affecting our strategic partners in developing countries; |
• | risks relating to the failure to comply with the U.S. Foreign Corrupt Practices Act, UK Bribery Act or other anti-bribery laws applicable to our operations, including, among other things, cost and disruption in responding to allegations or investigations (regardless of ultimate finding), civil and/or criminal fines, criminal prosecution of individuals, revocation or suspension of permits and/or licenses, civil litigation, reputational damage, loss in share price, and loss of business; |
• | unwillingness of governments and their agencies, similar organizations or other counterparties to honor their contracts; |
• | unwillingness of governments, government agencies, courts or similar bodies to enforce contracts that are economically advantageous to subsidiaries of the Company and less beneficial to counterparties, against such counterparties, whether such counterparties are governments or private parties; |
• | inability to obtain access to fair and equitable political, regulatory, administrative and legal systems; |
• | adverse changes in government tax policy; |
• | potentially adverse tax consequences of operating in multiple jurisdictions; and |
• | difficulties in enforcing our contractual rights or enforcing judgments or obtaining a favorable result in local jurisdictions. |
Any of these factors, by itself or in combination with others, could materially and adversely affect our business, results of operations and financial condition.
Our operations may experience volatility in revenues and operating margin caused by regulatory and economic difficulties, political instability and currency devaluations. This volatility reduces the predictability and enhances the uncertainty associated with cash flows from these businesses.
Our businesses may incur substantial costs and liabilities and be exposed to price volatility as a result of risks associated with the wholesale electricity markets.
Some of our businesses sell or buy electricity in the spot markets when they operate at levels that differ from their power sales agreements or retail load obligations or when they do not have any powers sales agreements. Our businesses may also buy electricity in the wholesale spot markets. As a result, we are exposed to the risks of rising and falling prices in those markets. The open market wholesale prices for electricity can be volatile and generally reflect the variable cost of the source generation which could include renewable sources at near zero pricing or thermal sources subject to fluctuating cost of fuels such as coal, natural gas or oil derivative fuels in addition to other factors described below. Consequently, any changes in the generation supply stack and cost of coal, natural gas, or oil derivative fuels may impact the open market wholesale price of electricity.
Volatility in market prices for fuel and electricity may result from, among other things:
• | plant availability in the markets generally; |
• | availability and effectiveness of transmission facilities owned and operated by third parties; |
• | competition; |
• | seasonality; |
• | hydrology and other weather conditions; |
• | illiquid markets; |
• | transmission, transportation constraints, inefficiencies and/or availability; |
• | renewables source contribution to the supply stack; |
• | new entrants; |
• | increased adoption of distributed generation; |
• | energy efficiency and demand side resources; |
• | available supplies of coal, natural gas, and crude oil and refined products; |
• | generating unit performance; |
• | natural disasters, terrorism, wars, embargoes, and other catastrophic events; |
• | energy, market and environmental regulation, legislation and policies; |
54 | 2019 Annual Report | |
• | general economic conditions globally as well as in areas where we operate that impact demand and energy consumption; and |
• | bidding behavior and market bidding rules. |
Wholesale power prices are declining in many markets and this could have a material adverse effect on our operations and opportunities for future growth.
The wholesale prices offered for electricity have declined significantly in recent years in many markets in which the Company has businesses. This price decline is due to a variety of factors, including the increased penetration of renewable generation resources, low-priced natural gas and demand side management. The levelized cost of electricity from new solar and wind generation sources has dropped substantially in recent years as solar panel costs and wind turbine costs have declined, while wind and solar capacity factors have increased. These renewable resources have no fuel costs and very low operational costs. In many instances, energy from these facilities are bid into the wholesale spot market at a price of zero or close to zero during certain times of the day, driving down the clearing price for all generators selling power in the relevant spot market. Also, in many markets, new PPAs have been awarded for renewable generation at prices significantly lower than the prices being awarded just a few years ago.
This trend of declining wholesale prices could continue and could have a material adverse impact on the financial performance of our existing generation assets to the extent they currently sell power into the spot market or will seek to sell power into the spot market once their PPAs expire. The trend of declining prices can also make it more difficult for us to obtain attractive prices under new long-term PPAs for any new generation facilities we may seek to develop. As a result, the trend can have an adverse impact on our opportunities for new investments.
Adverse economic developments in China could have a negative impact on demand for electricity in many of our markets.
The Chinese market has been driving global materials demand and pricing for commodities over the past decade. Many of these commodities are produced in areas that are also our key markets for the sale of electricity. After experiencing rapid growth for more than a decade, China’s economy has experienced decreasing foreign and domestic demand, weak investment, factory overcapacity and oversupply in the property market, and has experienced a significant slowdown in recent years. U.S. tariffs are also expected to have a negative impact on China's economic growth. In addition, the outbreak of the Coronavirus is a rapidly developing situation in China that has adversely impacted economic activity and conditions in China. In particular, efforts to control the spread of the Coronavirus have led to shutdowns of manufacturing facilities and disrupted supply chains. The extent of such impact is unknown at this time. Continued slowing in China’s economic growth, demand for commodities and/or material changes in policy could result in lower economic growth and lower demand for electricity in our key markets, which could have a material adverse effect on our results of operations, financial condition and prospects.
55 | 2019 Annual Report | |
We may not have adequate risk mitigation and/or insurance coverage for liabilities.
Power generation, distribution and transmission involves hazardous activities. We may become exposed to significant liabilities for which we may not have adequate risk mitigation and/or insurance coverage. Furthermore, through AGIC, AES’ captive insurance company, we take certain insurance risk on our businesses. We maintain an amount of insurance protection that we believe is customary, but there can be no assurance that our insurance will be sufficient or effective under all circumstances and against all hazards or liabilities to which we may be subject. Our insurance does not cover every potential risk associated with our operations. Adequate coverage at reasonable rates is not always obtainable. In particular, the availability of insurance for coal-fired generation assets has decreased as certain insurers have opted to discontinue or limit offering insurance for such assets. Certain insurers have also withdrawn from insuring hydroelectric assets following significant losses in that business class. For these reasons, as well as the cyclical nature of the insurance markets, we cannot provide assurance that insurance coverage will continue to be available in the amounts or on terms similar to those presently available to us. In addition, insurance may not fully cover the liability or the consequences of any business interruptions such as natural catastrophes, equipment failure or labor dispute. The occurrence of a significant adverse event not fully or partially covered by insurance could have a material adverse effect on our business, results or operations, financial condition, and prospects.
We may not be able to enter into long-term contracts that reduce volatility in our results of operations.
Many of our generation plants conduct business under long-term sales and supply contracts, which helps these businesses to manage risks by reducing the volatility associated with power and input costs and providing a stable revenue and cost structure. In these instances, we rely on power sales contracts with one or a limited number of customers for the majority of, and in some cases all of, the relevant plant's output and revenues over the term of the power sales contract. The remaining terms of the power sales contracts of our generation plants range from one to more than 20 years. In many cases, we also limit our exposure to fluctuations in fuel prices by entering into long-term contracts for fuel with a limited number of suppliers. In these instances, the cash flows and results of operations are dependent on the continued ability of customers and suppliers to meet their obligations under the relevant power sales contract or fuel supply contract, respectively. Some of our long-term power sales agreements are at prices above current spot market prices and some of our long-term fuel supply contracts are at prices below current market prices. The loss of significant power sales contracts or fuel supply contracts, or the failure by any of the parties to such contracts that prevents us from fulfilling our obligations thereunder, could adversely impact our strategy by resulting in costs that exceed revenue, which could have a material adverse impact on our business, results of operations and financial condition. In addition, depending on market conditions and regulatory regimes, it may be difficult for us to secure long-term contracts, either where our current contracts are expiring or for new development projects. The inability to enter into long-term contracts could require many of our businesses to purchase inputs at market prices and sell electricity into spot markets, which may not be favorable.
We have sought to reduce counterparty credit risk under our long-term contracts in part by entering into power sales contracts with utilities or other customers of strong credit quality and by obtaining guarantees from certain sovereign governments of the customer's obligations. However, many of our customers do not have, or have failed to maintain, an investment-grade credit rating, and our generation business cannot always obtain government guarantees and if they do, the government does not always have an investment grade credit rating. We have also sought to reduce our credit risk by locating our plants in different geographic areas in order to mitigate the effects of regional economic downturns; however, there can be no assurance that our efforts to mitigate this risk will be successful.
Competition is increasing and could adversely affect us.
The power production markets in which we operate are characterized by numerous strong and capable competitors, many of whom may have extensive and diversified developmental or operating experience (including both domestic and international) and financial resources similar to, or greater than, ours. Further, in recent years, the power production industry has been characterized by strong and increasing competition with respect to both obtaining power sales agreements and acquiring existing power generation assets. In certain markets, these factors have caused reductions in prices contained in new power sales agreements and, in many cases, have caused higher acquisition prices for existing assets through competitive bidding practices. The evolution of competitive electricity markets and the development of highly efficient gas-fired power plants and renewables such as wind and solar have also caused, and could continue to cause, price pressure in certain power markets where we sell or
56 | 2019 Annual Report | |
intend to sell power. In addition, the introduction of low-cost disruptive technologies or the entry of non-traditional competitors into our sector and markets could adversely affect our ability to compete, which could have a material adverse effect on our businesses, operating results and financial condition.
Supplier and/or customer concentration may expose the Company to significant financial credit or performance risks.
We often rely on a single contracted supplier or a small number of suppliers for the provision of fuel, transportation of fuel and other services required for the operation of some of our facilities. If these suppliers cannot perform, we would seek to meet our fuel requirements by purchasing fuel at market prices, exposing us to market price volatility and the risk that fuel and transportation may not be available during certain periods at any price, which could adversely impact the profitability of the affected business and our results of operations, and could result in a breach of agreements with other counterparties, including, without limitation, offtakers or lenders. Further, our suppliers may source certain materials from China or other areas impacted by Coronavirus, which may cause delays and/or disruptions to our development projects or operations.
At times, we rely on a single customer or a few customers to purchase all or a significant portion of a facility's output, in some cases under long-term agreements that account for a substantial percentage of the anticipated revenue from a given facility. Counterparties to these agreements may breach or may be unable to perform their obligations, due to bankruptcy, insolvency, financial distress or other factors. Furthermore, in the event of a bankruptcy or similar insolvency-type proceeding, our counterparty can seek to reject our existing PPA under the U.S. Bankruptcy Code or similar bankruptcy laws, including those in Puerto Rico. We may not be able to enter into replacement agreements on terms as favorable as our existing agreements, or at all. If we were unable to enter into replacement PPAs, these businesses may have to sell power at market prices. A breach by a counterparty of a PPA or other agreement could also result in the breach of other agreements, including, without limitation, the debt documents of the affected business.
The financial performance of our facilities is dependent on the credit quality of, and continued performance by, suppliers and customers. Any failure of a supplier or customer to fulfill its contractual obligations to The AES Corporation or our subsidiaries could have a material adverse effect on our financial results.
Our businesses will need to continue to adapt to technological change and we may incur significant expenditures to adapt to these changes.
Emerging technologies may be superior to, or may not be compatible with, some of our existing technologies, investments and infrastructure, and may require us to make significant expenditures to remain competitive, or may result in the obsolescence of certain of our operating assets. Our future success will depend, in part, on our ability to anticipate and successfully adapt to technological changes, to offer services and products that meet customer demands and evolving industry standards.
Technological changes that could impact our businesses include:
• | technologies that change the utilization of electric generation, transmission and distribution assets, including the expanded cost-effective utilization of distributed generation (e.g., rooftop solar and community solar projects), and energy storage technology; |
• | advances in distributed and local power generation and energy storage that reduce the demand for large-scale renewable electricity generation and/or impact our customers’ ability to perform under long-term agreements; and |
• | more cost-effective batteries for energy storage, advances in solar or wind technology, and advances in alternative fuels and other alternative energy sources. |
Emerging technologies may also allow new competitors to more effectively compete in our markets or disintermediate the services we provide our customers, including traditional utility and centralized generation services. If we incur significant expenditures in adapting to technological changes, fail to adapt to significant technological changes, fail to obtain access to important new technologies, fail to recover a significant portion of any remaining investment in obsolete assets, or if implemented technology fails to operate as intended, our businesses, operating results and financial condition could be materially adversely affected.
57 | 2019 Annual Report | |
Cyber-attacks and data security breaches could harm our business.
Our business is heavily reliant on electronic systems and network technologies to operate our generation, transmission and distribution infrastructure. We also use various financial, accounting and other infrastructure systems. Our infrastructure may be targeted by nation states, hacktivists, criminals, insiders or terrorist groups. Such an attack, by hacking, malware or other means, may interrupt our operations, cause property damage, affect our ability to control our infrastructure assets, cause the release of sensitive customer information or limit communications with third parties. Any loss or corruption of confidential or proprietary data through such breach may:
• | impact our operations and strategic objectives; |
• | impact our customer and vendor relationships; |
• | result in substantial revenue loss; |
• | expose us to legal claims and/or regulatory investigations and proceedings; |
• | require extensive repair and restoration costs for additional security measures to avert future cyber-attacks; and |
• | impair our reputation and limit our competitiveness for future opportunities. |
In addition, a breach of our financial and accounting systems could impact our ability to correctly record, process and report financial information.
We have implemented measures to help prevent unauthorized access to our systems and facilities, including certain measures to comply with mandatory regulatory reliability standards. To date, cyber-attacks have not had a material impact on our operations or financial results. We continue to assess potential threats and vulnerabilities and make investments to address them, including global monitoring of networks and systems, identifying and implementing new technology, improving user awareness through employee security training, and updating our security policies as well as those for third-party providers.
We cannot guarantee the extent to which our security measures will prevent future cyber-attacks and security breaches or that our insurance coverage will adequately cover any losses we may experience. Furthermore, we do not control certain of joint ventures or our equity method investments and cannot guarantee that their efforts will be successful.
Certain of our businesses are sensitive to variations in weather and hydrology.
Our businesses are affected by variations in general weather patterns and unusually severe weather. Our businesses forecast electric sales based on best available information and expectations for weather, which represents a long-term historical average. While we also consider possible variations in normal weather patterns and potential impacts on our facilities and our businesses, there can be no assurance that such planning can prevent these impacts, which can adversely affect our business. Generally, demand for electricity peaks in winter and summer. Typically, when winters are warmer than expected and summers are cooler than expected, demand for energy is lower, resulting in less demand for electricity than forecasted. Significant variations from normal weather where our businesses are located could have a material impact on our results of operations.
Changes in weather can also affect the production of electricity at power generation facilities, including, but not limited to, our wind and solar facilities. For example, the level of wind resource affects the revenue produced by wind generation facilities. Because the levels of wind and solar resources are variable and difficult to predict, our results of operations for individual wind and solar facilities specifically, and our results of operations generally, may vary significantly from period to period, depending on the level of available resources. To the extent that resources are not available at planned levels, the financial results from these facilities may be less than expected. In addition, we are dependent upon hydrological conditions prevailing from time to time in the broad geographic regions in which our hydroelectric generation facilities are located. Changes in temperature, precipitation and snow pack conditions also could affect the amount and timing of hydroelectric generation.
To the extent that hydrological conditions result in droughts or other conditions negatively affect our hydroelectric generation business, such as has happened in Panama in 2019, our results of operations can be materially adversely affected. Additionally, our contracts in certain markets where hydroelectric facilities are prevalent may require us to purchase power in the spot markets when our facilities are unable to operate (or operate at lower than anticipated levels) and the price of such spot power may increase substantially in times of low hydrology.
58 | 2019 Annual Report | |
Severe weather and natural disasters may present significant risks to our business.
Weather conditions directly influence the demand for electricity and natural gas and other fuels and affect the price of energy and energy-related commodities. In addition, severe weather and natural disasters, such as hurricanes, floods, tornadoes, icing events, earthquakes, dam failures and tsunamis can be destructive and could prevent us from operating our business in the normal course by causing power outages and property damage, reducing revenue, affecting the availability of fuel and water, causing injuries and loss of life, and requiring us to incur additional costs, for example, to restore service and repair damaged facilities, to obtain replacement power and to access available financing sources. Our power plants could be placed at greater risk of damage should changes in the global climate produce unusual variations in temperature and weather patterns, resulting in more intense, frequent and extreme weather events, including heatwaves, fewer cold temperature extremes, abnormal levels of precipitation resulting in river and coastal urban floods in North America or reduced water availability and increased flooding across Central and South America, and changes in coast lines due to sea level change.
Depending on the nature and location of the facilities and infrastructure affected, any such incident also could cause catastrophic fires; releases of natural gas, natural gas odorant, or other greenhouse gases; explosions, spills or other significant damage to natural resources or property belonging to third parties; personal injuries, health impacts or fatalities; or present a nuisance to impacted communities. Such incidents that do not directly affect our facilities may impact our business partners, supply chains and transportation, which could negatively impact construction projects and our ability to provide electricity and natural gas to our customers.
A disruption or failure of electric generation, transmission or distribution systems or natural gas production, transmission, storage or distribution systems in the event of a hurricane, tornado or other severe weather event, or otherwise, could prevent us from operating our business in the normal course and could result in any of the adverse consequences described above. At our businesses where cost recovery is available, recovery of costs to restore service and repair damaged facilities is or may be subject to regulatory approval, and any determination by the regulator not to permit timely and full recovery of the costs incurred.
Any of the foregoing could have a material adverse effect on our business, financial condition, results of operations, reputation and prospects.
Our development projects are subject to substantial uncertainties.
Certain of our subsidiaries and affiliates are in various stages of developing and constructing power plants. Some but not all of these power plant projects have signed long-term contracts or made similar arrangements for the sale of electricity. Successful completion of the development of these projects depends upon overcoming substantial risks, including, but not limited to, risks relating to siting, financing, engineering and construction, permitting, governmental approvals, commissioning delays, or the potential for termination of the power sales contract as a result of a failure to meet certain milestones. For additional information regarding our projects under construction see Item 1.—Business—Our Organization and Segments included in this Form 10-K.
In certain cases, our subsidiaries may enter into obligations in the development process even though the subsidiaries have not yet secured financing, power purchase arrangements, or other important elements for a successful project. For example, our subsidiaries may instruct contractors to begin the construction process or seek to procure equipment even where they do not have financing, a PPA or critical permits in place (or conversely, to enter into a PPA, procurement agreement or other agreement without financing in place). If the project does not proceed, our subsidiaries may remain obligated for certain liabilities even though the project will not proceed. Development is inherently uncertain and we may forgo certain development opportunities and we may undertake significant development costs before determining that we will not proceed with a particular project. We believe that capitalized costs for projects under development are recoverable; however, there can be no assurance that any individual project will be completed and reach commercial operation. If these development efforts are not successful, we may abandon a project under development and write off the costs incurred in connection with such project. At the time of abandonment, we would expense all capitalized development costs incurred in connection therewith and could incur additional losses associated with any related contingent liabilities.
59 | 2019 Annual Report | |
We do not control certain aspects of our joint ventures or our equity method investments.
We have invested in some joint ventures in which our subsidiaries share operational, management, investment and/or other control rights with our joint venture partners. In many cases, we may exert influence over the joint venture pursuant to a management contract, by holding positions on the board of the joint venture company or on management committees and/or through certain limited governance rights, such as rights to veto significant actions. However, we do not always have this type of influence over the project or business in every instance and we may be dependent on our joint venture partners or the management team of the joint venture to operate, manage, invest or otherwise control such projects or businesses. Our joint venture partners or the management team of our joint ventures may not have the level of experience, technical expertise, human resources, management and other attributes necessary to operate these projects or businesses optimally, and they may not share our business priorities. In some joint venture agreements in which we do have majority control of the voting securities, we have entered into shareholder agreements granting minority rights to the other shareholders.
The approval of joint venture partners also may be required for us to receive distributions of funds from jointly owned entities or to transfer our interest in projects or businesses. The control or influence exerted by our joint venture partners may result in operational management and/or investment decisions that are different from the decisions our subsidiaries would make if they operated independently and could impact the profitability and value of these joint ventures. In addition, in the event that a joint venture partner becomes insolvent or bankrupt or is otherwise unable to meet its obligations to the joint venture or its share of liabilities at the joint venture, we may be subject to joint and several liability for these joint ventures, which means that we may be responsible for meeting certain obligations of the joint ventures, should our joint venture partner be unable to do so, if and to the extent provided for in our governing documents or applicable law.
In addition, we are generally dependent on the management team of our equity method investments to operate and control such projects or businesses. While we may exert influence pursuant to having positions on the boards of such investments and/or through certain limited governance rights, such as rights to veto significant actions, we do not always have this type of influence in every instance and the scope and impact of such influence may be limited. The management teams of our equity method investments may not have the level of experience, technical expertise, human resources, management and other attributes necessary to operate these projects or businesses optimally, and they may not share our business priorities, which could have a material adverse effect on value of such investments as well as our growth, business, financial condition, results of operations and prospects.
Our renewable energy projects and other initiatives face considerable uncertainties, including development, operational, and regulatory challenges.
Wind, solar, and energy storage projects are subject to substantial risks. Some of these business lines are dependent upon favorable regulatory incentives to support continued investment, and there is significant uncertainty about the extent to which such favorable regulatory incentives will be available in the future.
Furthermore, production levels for our wind and solar projects may be dependent upon adequate wind or sunlight resulting in volatility in production levels and profitability. For example, for our wind projects, wind resource estimates are based on historical experience when available and on wind resource studies conducted by an independent engineer. These wind resource estimates are not expected to reflect actual wind energy production in any given year, but long-term averages of a resource.
As a result, these types of renewable energy projects face considerable risk, including the risk that favorable regulatory regimes expire or are adversely modified. In addition, because certain of these projects depend on technology outside of our expertise in generation and utility businesses, there are risks associated with our ability to develop and manage such projects profitably. Furthermore, at the development or acquisition stage, because of our more limited experience with the relevant technologies, our ability to predict actual performance results may be hindered and the projects may not perform as predicted. There are also risks associated with the fact that some of these projects exist in markets where long-term fixed-price contracts for the major cost and revenue components may be unavailable, which in turn may result in these projects having relatively high levels of volatility. These projects can be capital-intensive and generally are designed with a view to obtaining third-party financing, which may be difficult to obtain. As a result, these capital constraints may reduce our ability to develop these projects or obtain third-party financing for these projects.
60 | 2019 Annual Report | |
Government incentives and policies that support the development of renewable energy generation projects could change at any time.
AES’ U.S. renewable energy generation growth strategy depends in part on federal, state and local government policies and incentives that support the development, financing, ownership and operation of renewable energy generation projects. These policies and incentives include investment tax credits, production tax credits, accelerated depreciation, renewable portfolio standards, feed-in-tariffs and similar programs, renewable energy credit mechanisms, and tax exemptions. If these policies and incentives are changed or eliminated, or AES is unable to use them, it could result in a material adverse impact on AES’ U.S. renewable growth opportunities, including fewer future PPAs or lower prices for the sale of power in future PPAs, decreased revenues, reduced economic returns on certain project company investments, increased financing costs, and/or difficulty obtaining financing.
Our financial position and results of operations may fluctuate significantly due to fluctuations in currency exchange rates experienced at our foreign operations.
Our exposure to currency exchange rate fluctuations results primarily from the translation exposure associated with the preparation of the Consolidated Financial Statements, as well as from transaction exposure associated with transactions in currencies other than an entity's functional currency. While the Consolidated Financial Statements are reported in U.S. dollars, the financial statements of several of our subsidiaries outside the United States are prepared using the local currency as the functional currency and translated into U.S. dollars by applying appropriate exchange rates. As a result, fluctuations in the exchange rate of the U.S. dollar relative to the local currencies where our subsidiaries outside the United States report could cause significant fluctuations in our results. In addition, while our expenses with respect to foreign operations are generally denominated in the same currency as corresponding sales, we have transaction exposure to the extent receipts and expenditures are not denominated in the subsidiary's functional currency. Moreover, the costs of doing business abroad may increase as a result of adverse exchange rate fluctuations. Our financial position and results of operations could be affected by fluctuations in the value of a number of currencies.
We may not be adequately hedged against our exposure to changes in commodity prices or interest rates.
We routinely enter into contracts to hedge a portion of our purchase and sale commitments for electricity, fuel requirements and other commodities to lower our financial exposure related to commodity price fluctuations. As part of this strategy, we routinely utilize fixed price or indexed forward physical purchase and sales contracts, futures, financial swaps, and option contracts traded in the over-the-counter markets or on exchanges. We also enter into contracts which help us manage our interest rate exposure. However, we may not cover the entire exposure of our assets or positions to market price or interest rate volatility, and the coverage will vary over time. Furthermore, the risk management practices we have in place may not always perform as planned. In particular, if prices of commodities or interest rates significantly deviate from historical prices or interest rates or if the price or interest rate volatility or distribution of these changes deviates from historical norms, our risk management practices may not protect us from significant losses. As a result, fluctuating commodity prices or interest rates may negatively impact our financial results to the extent we have unhedged or inadequately hedged positions. In addition, certain types of economic hedging activities may not qualify for hedge accounting under U.S. GAAP, resulting in increased volatility in our net income. The Company may also suffer losses associated with "basis risk," which is the difference in performance between the hedge instrument and the underlying exposure (usually the pricing node of the generation facility). Furthermore, there is a risk that the current counterparties to these arrangements may fail or are unable to perform part or all of their obligations under these arrangements, while we seek to protect against that by utilizing strong credit requirements and exchange trades, these protections may not fully cover the exposure in the event of a counterparty default.
For our businesses with PPA pricing that does not completely pass through our fuel costs, the businesses attempt to manage the exposure through flexible fuel purchasing and timing of entry and terms of our fuel supply agreements; however, these risk management efforts may not be successful and the resulting commodity exposure could have a material impact on these businesses and/or our results of operations.
We may not be able to attract and retain skilled people.
Our operating success and ability to carry out growth initiatives depends, in part, on our ability to retain
61 | 2019 Annual Report | |
executives and to attract and retain additional qualified personnel who have experience in our industry and in operating a company of our size and complexity, including people in our foreign businesses. The inability to attract and retain qualified personnel could have a material adverse effect on our business, because of the difficulty of promptly finding qualified replacements.
Our utilities businesses may be negatively affected by a lack of growth or slower growth in the number of customers or in customer usage.
Customer growth and customer usage in our utilities businesses are affected by a number of factors outside our control, such as mandated energy efficiency measures, demand side management requirements, and economic and demographic conditions, such as population changes, job and income growth, housing starts, new business formation and the overall level of economic activity. A lack of growth, or a decline, in the number of customers or in customer demand for electricity may cause us to fail to fully realize the anticipated benefits from significant investments and expenditures and could have a material adverse effect on our growth, business, financial condition, results of operations and prospects.
Some of our subsidiaries participate in defined benefit pension plans and their net pension plan obligations may require additional significant contributions.
We have 28 defined benefit plans, five at U.S. subsidiaries and the remaining plans at foreign subsidiaries, which cover substantially all of the employees at these subsidiaries. Pension costs are based upon a number of actuarial assumptions, including an expected long-term rate of return on pension plan assets, the expected life span of pension plan beneficiaries and the discount rate used to determine the present value of future pension obligations. Any of these assumptions could prove to be incorrect, resulting in a shortfall of pension plan assets compared to pension obligations under the pension plan. We periodically evaluate the value of the pension plan assets to ensure that they will be sufficient to fund the respective pension obligations. Our exposure to market volatility is mitigated to some extent due to the fact that the asset allocations in our largest plans include a significant weighting of investments in fixed income securities that are generally less volatile than investments in equity securities. Future downturns in the debt and/or equity markets, or the inaccuracy of any of our significant assumptions underlying the estimates of our subsidiaries' pension plan obligations, could result in an increase in pension expense and future funding requirements, which may be material. Our subsidiaries that participate in these plans are responsible for satisfying the funding requirements required by law in their respective jurisdictions for any shortfall of pension plan assets as compared to pension obligations under the pension plan. Satisfying such funding requirements may necessitate additional cash contributions to the pension plans that could adversely affect the Parent Company and our subsidiaries' liquidity. For additional information regarding the funding position of the Company's pension plans, see Item 7.—Management's Discussion and Analysis of Financial Condition and Results of Operations—Critical Accounting Policies and Estimates—Pension and Other Postretirement Plans and Note 15.—Benefit Plans included in Item 8.—Financial Statements and Supplementary Data included in this Form 10-K.
Impairment of goodwill or long-lived assets would negatively impact our consolidated results of operations and net worth.
As of December 31, 2019, the Company had approximately $1.1 billion of goodwill, which represented approximately 3% of the total assets on its Consolidated Balance Sheets. Goodwill is not amortized, but is evaluated for impairment at least annually, or more frequently if impairment indicators are present. We may be required to evaluate the potential impairment of goodwill outside of the required annual evaluation process if we experience situations, including but not limited to: deterioration in general economic conditions, or our operating or regulatory environment; increased competitive environment; lower forecasted revenue; increase in fuel costs, particularly when we are unable to pass through the impact to customers; increase in environmental compliance costs; negative or declining cash flows; loss of a key contract or customer, particularly when we are unable to replace it on equally favorable terms; developments in our strategy; divestiture of a significant component of our business; or adverse actions or assessments by a regulator. For example, during the annual goodwill impairment test performed as of October 1, 2019, the Company determined that the fair value of its Gener reporting unit exceeded its carrying value by 3%. Therefore, Gener's $868 million goodwill balance was considered to be "at risk" for impairment as of December 31, 2019, largely due to the Chilean Government's announcement to phase out coal generation by 2040, and a decline in long-term energy prices. See Item 7.—Management's Discussion and Analysis of Financial Condition and Results of Operations—Key Trends and Uncertainties—Impairments. These types of events and the resulting analyses could result in goodwill impairment, which could substantially affect our results of
62 | 2019 Annual Report | |
operations for those periods. Additionally, goodwill may be impaired if our acquisitions do not perform as expected. See the risk factor Our acquisitions may not perform as expected for further discussion.
Long-lived assets are initially recorded at fair value and are amortized or depreciated over their estimated useful lives. Long-lived assets are evaluated for impairment only when impairment indicators, similar to those described above for goodwill, are present, whereas goodwill is also evaluated for impairment on an annual basis.
Any of the foregoing could have a material adverse effect on our business, financial condition, results of operations, and prospects.
Our acquisitions may not perform as expected.
Historically, acquisitions have been a significant part of our growth strategy. We may continue to grow our business through acquisitions. Although acquired businesses may have significant operating histories, we will have a limited or no history of owning and operating many of these businesses and possibly limited or no experience operating in the country or region where these businesses are located. Some of these businesses may have been government owned and some may be operated as part of a larger integrated utility prior to their acquisition. If we were to acquire any of these types of businesses, there can be no assurance that:
• | we will be successful in transitioning them to private ownership; |
• | such businesses will perform as expected; |
• | integration or other one-time costs will not be greater than expected; |
• | we will not incur unforeseen obligations or liabilities; |
• | such businesses will generate sufficient cash flow to support the indebtedness incurred to acquire them or the capital expenditures needed to develop them; or |
• | the rate of return from such businesses will justify our decision to invest capital to acquire them. |
Risks associated with Governmental Regulation and Laws
Our operations are subject to significant government regulation and our business and results of operations could be adversely affected by changes in the law or regulatory schemes.
Our ability to predict, influence or respond appropriately to changes in law or regulatory schemes, including any ability to obtain expected or contracted increases in electricity tariff or contract rates or tariff adjustments for increased expenses, could adversely impact our results of operations or our ability to meet publicly announced projections or analysts' expectations. Furthermore, changes in laws or regulations or changes in the application or interpretation of regulatory provisions in jurisdictions where we operate, particularly at our utilities where electricity tariffs are subject to regulatory review or approval, could adversely affect our business, including, but not limited to:
• | changes in the determination, definition or classification of costs to be included as reimbursable or pass-through costs to be included in the rates we charge our customers, including but not limited to costs incurred to upgrade our power plants to comply with more stringent environmental regulations; |
• | changes in the determination of what is an appropriate rate of return on invested capital or a determination that a utility's operating income or the rates it charges customers are too high, resulting in a reduction of rates or consumer rebates; |
• | changes in the definition or determination of controllable or non-controllable costs; |
• | adverse changes in tax law; |
• | changes in law or regulation which limit or otherwise affect the ability of our counterparties (including sovereign or private parties) to fulfill their obligations (including payment obligations) to us or our subsidiaries; |
• | changes in environmental law which impose additional costs or limit the dispatch of our generating facilities within our subsidiaries; |
• | changes in the definition of events which may or may not qualify as changes in economic equilibrium; |
• | changes in the timing of tariff increases; |
• | other changes in the regulatory determinations under the relevant concessions; |
• | other changes related to licensing or permitting which affect our ability to conduct business; or |
63 | 2019 Annual Report | |
• | other changes that impact the short- or long-term price-setting mechanism in the markets where we operate. |
Any of the above events may result in lower operating margins for the affected businesses, which can adversely affect our business.
In many countries where we conduct business, the regulatory environment is constantly changing and it may be difficult to predict the impact of the regulations on our businesses. The impacts described above could also result from our (or our subsidiaries') efforts to comply with European Market Infrastructure Regulation, which includes regulations related to the trading, reporting and clearing of derivatives. It is also possible that additional similar regulations may be passed in other jurisdictions where we conduct business. Any of these outcomes could have a material adverse effect on the Company.
Several of our businesses are subject to potentially significant remediation expenses, enforcement initiatives, private party lawsuits and reputational risk associated with CCR.
CCR, which consists of bottom ash, fly ash and air pollution control wastes generated at our current and former coal-fired generation plant sites, is currently handled and/or has been handled in the past in the following ways: placement in onsite CCR ponds; disposal and beneficial use in onsite and offsite permitted, engineered landfills; use in various beneficial use applications, including encapsulated uses and structural fill; and used in permitted offsite mine reclamation. CCR currently remains onsite at several of our facilities, including in CCR ponds. The U.S. EPA's final CCR rule, which became effective in October 2015, regulates CCR as nonhazardous solid waste and establishes national minimum criteria for existing and new CCR landfills and existing and new CCR ponds, including location restrictions, design and operating criteria, groundwater monitoring, corrective action and closure requirements and post-closure care. On December 16, 2016, President Obama signed the WIN Act into law, which includes provisions to implement the CCR rule through a state permitting program, or if the state chooses not to participate, a possible federal permit program. The primary enforcement mechanisms under this regulation could be actions commenced by U.S. EPA, states, or territories, and private lawsuits. Compliance with the U.S. federal CCR rule; amendments to the federal CCR rule; or federal, state, territory, or foreign rules or programs addressing CCR may require us to incur substantial costs. In addition, the Company and our businesses may face CCR-related lawsuits in the United States and/or internationally that may expose us to unexpected potential liabilities. Furthermore, CCR-related litigation may also expose us to unexpected costs. In addition, CCR, and its production at several of our facilities, have been the subject of significant interest from environmental non-governmental organizations and have received national and local media attention. The direct and indirect effects of such media attention, and the demands of responding to and addressing it, may divert management time and attention. Any of the foregoing could have a material adverse effect on our business, financial condition, results of operations, reputation and prospects.
Our business in the United States is subject to the provisions of various laws and regulations administered in whole or in part by FERC and NERC, including PURPA, the FPA, and the EPAct 2005. Actions by FERC, NERC and by state utility commissions can have a material effect on our operations.
The AES Corporation is a registered electric holding company under the U.S. Public Utility Holding Company Act of 2005 ("PUHCA 2005") as enacted as part of the EPAct 2005. PUHCA 2005 eliminated many of the restrictions that had been in place under the U.S. Public Utility Holding Company Act of 1935, while continuing to provide FERC and state utility commissions with enhanced access to the books and records of certain utility holding companies. PUHCA 2005 also creates additional potential challenges and opportunities. By removing some barriers to mergers and other potential combinations, the creation of large, geographically dispersed utility holding companies is more likely. These entities may have enhanced financial strength and therefore an increased ability to compete with us in the U.S. market.
Other parts of the EPAct 2005 allow FERC to remove the PURPA purchase/sale obligations from utilities if there are adequate opportunities to sell into competitive markets. FERC has exercised this power with a rebuttable presumption that utilities located within the control areas of MISO, PJM, ISO New England, Inc., the New York Independent System Operator, Inc., and ERCOT are not required to purchase or sell power from or to QFs above a certain size. Additionally, FERC has the power to remove the purchase/sale obligations of individual utilities on a case-by-case basis. While these changes do not affect existing contracts, certain of our QFs that have had sales
64 | 2019 Annual Report | |
contracts expire are now facing a more difficult market environment and that is likely to continue for other AES QFs with existing contracts that will expire over time.
In accordance with Congressional mandates in the EPAct 1992 and the EPAct 2005, FERC has strongly encouraged competition in wholesale electric markets. Increased competition may have the effect of lowering our operating margins. Among other steps, FERC has encouraged RTOs and ISOs to develop demand response bidding programs as a mechanism for responding to peak electric demand. These programs may reduce the value of generation assets. Similarly, FERC is encouraging the construction of new transmission infrastructure in accordance with provisions of EPAct 2005. Although new transmission lines may increase market opportunities, they may also increase the competition in our existing markets.
FERC has civil penalty authority over violations of any provision of Part II of the FPA, which concerns wholesale generation or transmission, as well as any rule or order issued thereunder. The FPA also provides for the assessment of criminal fines and imprisonment for violations under the FPA. This penalty authority was enhanced in EPAct 2005. As a result, FERC is authorized to assess a maximum penalty authority established by statute and such penalty authority has been and will continue to be adjusted periodically to account for inflation. With this expanded enforcement authority, violations of the FPA and FERC's regulations could potentially have more serious consequences than in the past.
Pursuant to EPAct 2005, the NERC has been certified by FERC as the Electric Reliability Organization ("ERO") to develop mandatory and enforceable electric system reliability standards applicable throughout the U.S. to improve the overall reliability of the electric grid. These standards are subject to FERC review and approval. Once approved, the reliability standards may be enforced by FERC independently, or, alternatively, by the ERO and regional reliability organizations with responsibility for auditing, investigating and otherwise ensuring compliance with reliability standards, subject to FERC oversight. Violations of NERC reliability standards are subject to FERC's penalty authority under the FPA and EPAct 2005.
Our utility businesses in the U.S. face significant regulation by their respective state utility commissions. The regulatory discretion is reasonably broad in both Indiana and Ohio and includes regulation as to services and facilities, the valuation of property, the construction, purchase, or lease of electric generating facilities, the classification of accounts, rates of depreciation, the increase or decrease in retail rates and charges, the issuance of certain securities, the acquisition and sale of some public utility properties or securities and certain other matters. These businesses face the risk of unexpected or adverse regulatory action which could have a material adverse effect on our results of operations, financial condition, and cash flows. See Item 1.—Business—US and Utilities SBU for further information on the regulation faced by our U.S. utilities.
Our businesses are subject to stringent environmental laws, rules and regulations.
Our businesses are subject to stringent environmental laws and regulations by many federal, regional, state and local authorities, international treaties and foreign governmental authorities. These laws and regulations generally concern emissions into the air, effluents into the water, use of water, wetlands preservation, remediation of contamination, waste disposal, endangered species and noise regulation. Failure to comply with such laws and regulations or to obtain or comply with any associated environmental permits could result in fines or other sanctions. For example, in recent years, the EPA has issued notices of violation ("NOVs") to a number of coal-fired generating plants alleging wide-spread violations of the new source review and prevention of significant deterioration provisions of the CAA. The EPA has brought suit against and obtained settlements with many companies for allegedly making major modifications to a coal-fired generating units without proper permit approvals and without installing best available control technology. The primary focus of these NOVs has been emissions of SO2 and NOx and the EPA has imposed fines and required companies to install improved pollution control technologies to reduce such emissions. In addition, state regulatory agencies and non-governmental environmental organizations have pursued civil lawsuits against power plants in situations that have resulted in judgments and/or settlements requiring the installation of expensive pollution controls or the accelerated retirement of certain electric generating units.
Furthermore, Congress and other domestic and foreign governmental authorities have either considered or implemented various laws and regulations to restrict or tax certain emissions, particularly those involving air emissions and water discharges. These laws and regulations have imposed, and proposed laws and regulations could impose in the future, additional costs on the operation of our power plants. See the various descriptions of these laws and regulations contained in Item 1.—Business—Environmental and Land-Use Regulations of this Form 10-K.
65 | 2019 Annual Report | |
We have incurred and will continue to incur significant capital and other expenditures to comply with these and other environmental laws and regulations. Changes in, or new development of, environmental restrictions may force us to incur significant expenses or expenses that may exceed our estimates. There can be no assurance that we would be able to recover all or any increased environmental costs from our customers or that our business, financial condition, including recorded asset values or results of operations, would not be materially and adversely affected by such expenditures or any changes in domestic or foreign environmental laws and regulations.
Concerns about GHG emissions and the potential risks associated with climate change have led to increased regulation and other actions that could impact our businesses.
International, federal and various regional and state authorities regulate GHG emissions and have created financial incentives to reduce them. In 2019, the Company's subsidiaries operated businesses that had total CO2 emissions of approximately 55 million metric tonnes, approximately 23 million of which were emitted by our U.S. businesses (both figures are ownership adjusted). The Company uses CO2 emission estimation methodologies supported by "The Greenhouse Gas Protocol" reporting standard on GHG emissions. For existing power generation plants, CO2 emissions data are either obtained directly from plant continuous emission monitoring systems or calculated from actual fuel heat inputs and fuel type CO2 emission factors. The estimated annual CO2 emissions from fossil fuel-fired electric power generation facilities of the Company's subsidiaries that are in construction or development and have received the necessary air permits for commercial operations are approximately 7 million metric tonnes (ownership adjusted). This overall estimate is based on a number of projections and assumptions that may prove to be incorrect, such as the forecasted dispatch, anticipated plant efficiency, fuel type, CO2 emissions rates and our subsidiaries' achieving completion of such construction and development projects. However, it is certain that the projects under construction or development when completed will increase emissions of our portfolio and therefore could increase the risks associated with regulation of GHG emissions. Because there is significant uncertainty regarding these estimates, actual emissions from these projects under construction or development may vary substantially from these estimates.
There currently is no U.S. federal legislation imposing mandatory GHG emission reductions (including for CO2) that affects our electric power generation facilities; however, in 2015, the EPA promulgated a rule establishing New Source Performance Standards for CO2 emissions for newly constructed and modified/reconstructed fossil-fueled EUSGUs larger than 25 MW and in 2018 proposed revisions to the rule. In 2019, the EPA promulgated the Affordable Clean Energy (ACE) Rule replacing the EPA's 2015 Clean Power Plan (CPP), which was revoked in 2019. The ACE Rule establishes heat rate improvement measures as the best system of emissions reductions for existing coal-fired electric generating units. These actions have been challenged in court and the current Administration has announced plans to significantly amend or rescind the rules. In 2010, the EPA adopted regulations pertaining to GHG emissions that require new and existing sources of GHG emissions to potentially obtain new source review permits from the EPA prior to construction or modification. In 2016, the U.S. Supreme Court ruled that such permitting would only be required if such sources also must obtain a new source review permit for increases in other regulated pollutants.
For further discussion of the regulation of GHG emissions, including the U.S. Supreme Court's issued order staying implementation of the CPP, and the EPA's proposal to rescind the CPP, see Item 1.—Business—Environmental and Land-Use Regulations—United States Environmental and Land-Use Legislation and Regulations—Greenhouse Gas Emissions above.
In December 2015, the Parties to the United Nations Framework Convention on Climate Change convened for the 21st Conference of the Parties and the resulting Paris Agreement established a long-term goal of keeping the increase in global average temperature well below 2°C above pre-industrial levels. We anticipate that the Paris Agreement will continue the trend toward efforts to de-carbonize the global economy and to further limit GHG emissions. On November 4, 2019, the U.S. announced that it had officially notified the U.N. that the U.S. will withdraw from the Paris Agreement as soon as November 4, 2020.
The impact of GHG regulation on our operations will depend on a number of factors, including among others, the degree and timing of GHG emissions reductions required under any such legislation or regulation, the cost of emissions reduction equipment and the price and availability of offsets, the extent to which market based compliance options are available, the extent to which our subsidiaries would be entitled to receive GHG emissions allowances without having to purchase them in an auction or on the open market and the impact of such legislation or regulation on the ability of our subsidiaries to recover costs incurred through rate increases or otherwise. The costs of compliance could be substantial.
66 | 2019 Annual Report | |
Our non-utility, generation subsidiaries seek to pass on any costs arising from CO2 emissions to contract counterparties. Likewise, our utility subsidiaries seek to pass on any costs arising from CO2 emissions to customers. However, there can be no assurance that we will effectively pass such costs onto the contract counterparties or customers, respectively, or that the cost and burden associated with any dispute over which party bears such costs would not be burdensome and costly.
In addition to government regulators, many groups, including politicians, environmentalists, the investor community and other private parties have expressed increasing concern about GHG emissions. New regulation, such as the initiatives in Chile and the Puerto Rico Energy Public Policy Act, may adversely affect our operations. See Item 7.—Management's Discussion and Analysis of Financial Condition and Results of Operations—Key Trends and Uncertainties—Decarbonization Initiatives. Responding to these decarbonization initiatives may present challenges to our business. We may be unable to develop our renewables platform as quickly as anticipated. Further, we may be unable to dispose of coal-fired generation assets at anticipated prices, the estimated useful lives of these assets may decrease, and the value of such assets may be impaired. These initiatives could also result in the early retirement of coal-fired generation facilities, which could result in stranded costs if regulators disallow full recovery of investments.
Negative public perception of our GHG emissions could have an adverse effect on our relationships with third parties, our ability to attract additional customers, our business development opportunities, and our ability to access finance and insurance for our coal-fired generation assets.
In addition, plaintiffs previously brought tort lawsuits against the Company because of its subsidiaries' GHG emissions. While these lawsuits were dismissed, future similar lawsuits may prevail or result in damages awards or other relief. We may also be subject to risks associated with the impact on weather conditions. See Certain of our businesses are sensitive to variations in weather and hydrology and Severe weather and natural disasters may present significant risks to our business and adversely affect our financial results within this section for more information. If any of the foregoing risks materialize, costs may increase or revenues may decrease and there could be a material adverse effect on our electric power generation businesses and on our consolidated results of operations, financial condition,cash flows and reputation.
Concerns about data privacy have led to increased regulation and other actions that could impact our businesses.
In the ordinary course of business, we collect and retain sensitive information, including personal identification information about customers and employees, customer energy usage and other information. The theft, damage or improper disclosure of sensitive electronic data collected by us can subject us to penalties for violation of applicable privacy laws, subject us to claims from third parties, require compliance with notification and monitoring regulations, and harm our reputation. The EU GDPR applies to the processing of personal information collected from individuals located in the EU, creates additional compliance obligations and significantly increases fines for noncompliance. Furthermore, the California Consumer Privacy Act ("CCPA") has recently introduced new requirements that have broad effect, the impact of which is uncertain at this time. Any actual or perceived failure to comply with the GDPR, the CCPA, the General Data Privacy Law in Brazil or other data privacy laws or regulations, or related contractual or other obligations, or any perceived privacy rights violation, could lead to investigations, claims, and proceedings by governmental entities and private parties, damages for contract breach, and other significant costs, penalties, and other liabilities, as well as harm to our reputation and market position. In addition, any actual or perceived failure on the part of one of our equity affiliates could result in a decrease in the value of our investment as well as harm to our reputation and future business prospects.
Tax legislation initiatives or challenges to our tax positions could adversely affect our results of operations and financial condition.
Our subsidiaries have operations in the U.S. and various non-U.S. jurisdictions. As such, we are subject to the tax laws and regulations of the U.S. federal, state and local governments and of many non-U.S. jurisdictions. From time to time, legislative measures may be enacted that could adversely affect our overall tax positions regarding income or other taxes. There can be no assurance that our effective tax rate or tax payments will not be adversely affected by these legislative measures.
The TCJA enacted December 22, 2017 introduced significant changes to current U.S. federal tax law. These changes are complex and are subject to additional guidance to be issued by the U.S. Treasury and the Internal Revenue Service. In addition, the reaction to the federal tax changes by the individual states is evolving. Our
67 | 2019 Annual Report | |
interpretations and assumptions around U.S. tax reform may evolve in future periods as further administrative guidance and regulations are issued, which may materially affect our effective tax rate or tax payments. For further details, please see Item 7.—Management's Discussion and Analysis of Financial Condition and Results of Operations—Key Trends and Uncertainties in this Form 10-K.
Additionally, longstanding international tax norms that determine how and where cross-border international trade is subjected to tax are evolving. The Organization for Economic Cooperation and Development, in coordination with the G8 and G20, through its Base Erosion and Profit Shifting project introduced a series of recommendations that many tax jurisdictions have adopted, or may adopt in the future, as law. As these and other tax laws, related regulations and double-tax conventions change, our financial results could be materially impacted. Given the unpredictability of these possible changes and their potential interdependency, it is very difficult to assess whether the overall effect of such potential tax changes would be cumulatively positive or negative for our earnings and cash flow, but such changes could adversely impact our results of operations.
U.S. federal, state and local, as well as non-U.S., tax laws and regulations are extremely complex and subject to varying interpretations. There can be no assurance that our tax positions will be sustained if challenged by relevant tax authorities and if not sustained, there could be a material impact on our results of operations.
We and our affiliates are subject to material litigation and regulatory proceedings.
We and our affiliates are parties to material litigation and regulatory proceedings. See Item 3.— Legal Proceedings below. There can be no assurances that the outcome of such matters will not have a material adverse effect on our consolidated financial position.
Risks Related to our Indebtedness and Financial Condition
We have a significant amount of debt, a large percentage of which is secured, that could adversely affect our business and our ability to fulfill our obligations.
As of December 31, 2019, we had approximately $20 billion of outstanding indebtedness on a consolidated basis. All outstanding borrowings, if any, under The AES Corporation's senior secured credit facility and secured term loan are secured by certain of our assets, including the pledge of capital stock of many of The AES Corporation's directly held subsidiaries. Most of the debt of The AES Corporation's subsidiaries is secured by substantially all of the assets of those subsidiaries. Since we have such a high level of debt, a substantial portion of cash flow from operations must be used to make payments on this debt. Furthermore, since a significant percentage of our assets are used to secure this debt, this reduces the amount of collateral available for future secured debt or credit support and reduces our flexibility in operating these secured assets. This high level of indebtedness and related security could have other important consequences to us and our investors, including:
• | making it more difficult to satisfy debt service and other obligations at the holding company and/or individual subsidiaries; |
• | increasing our vulnerability to general adverse industry and economic conditions, including but not limited to adverse changes in foreign exchange rates, interest rates and commodity prices; |
• | reducing available cash flow to fund other corporate purposes and grow our business; |
• | limiting our flexibility in planning for, or reacting to, changes in our business and the industry; |
• | placing us at a competitive disadvantage to our competitors that are not as highly leveraged; and |
• | limiting, along with the financial and other restrictive covenants relating to such indebtedness, among other things, our ability to borrow additional funds as needed or take advantage of business opportunities as they arise, pay cash dividends or repurchase common stock. |
The agreements governing our indebtedness, including the indebtedness of our subsidiaries, limit, but do not prohibit the incurrence of additional indebtedness. If we were to become more leveraged, the risks described above would increase. Further, our actual cash requirements in the future may be greater than expected. Accordingly, our cash flows may not be sufficient to repay at maturity all of the outstanding debt as it becomes due and, in that event, we may not be able to borrow money, sell assets, raise equity or otherwise raise funds on acceptable terms or at all to refinance our debt as it becomes due. In addition, our ability to refinance existing or future indebtedness will depend on the capital markets and our financial condition at such time. Any refinancing of our debt could come at higher interest rates or may require us to comply with onerous covenants, which could restrict our business
68 | 2019 Annual Report | |
operations. See Note 11.—Debt included in Item 8.—Financial Statements and Supplementary Data of this Form 10-K for a schedule of our debt maturities.
The AES Corporation is a holding company and its ability to make payments on its outstanding indebtedness is dependent upon the receipt of funds from its subsidiaries by way of dividends, fees, interest, loans or otherwise.
The AES Corporation is a holding company with no material assets other than the stock of its subsidiaries. Almost all of The AES Corporation's cash flow is generated by the operating activities of its subsidiaries. Therefore, The AES Corporation's ability to make payments on its indebtedness and to fund its other obligations is dependent not only on the ability of its subsidiaries to generate cash, but also on the ability of the subsidiaries to distribute cash to it in the form of dividends, fees, interest, tax sharing payments, loans or otherwise.
Our subsidiaries face various restrictions in their ability to distribute cash. Most of the subsidiaries are obligated, pursuant to loan agreements, indentures or non-recourse financing arrangements, to satisfy certain restricted payment covenants or other conditions before they may make distributions to The AES Corporation. Business performance and local accounting and tax rules may also limit dividend distributions. Subsidiaries in foreign countries may also be prevented from distributing funds to The AES Corporation as a result of foreign governments restricting the repatriation of funds or the conversion of currencies.
The AES Corporation's subsidiaries are separate and distinct legal entities and, unless they have expressly guaranteed any of The AES Corporation's indebtedness, have no obligation, contingent or otherwise, to pay any amounts due pursuant to such debt or to make any funds available whether by dividends, fees, loans or other payments.
Existing and potential future defaults by subsidiaries or affiliates could adversely affect The AES Corporation.
We attempt to finance our domestic and foreign projects primarily under loan agreements and related documents that, except as noted below, require the loans to be repaid solely from the project's revenues and provide that the repayment of the loans (and interest thereon) is secured solely by the capital stock, physical assets, contracts and cash flow of that project subsidiary or affiliate. This type of financing is usually referred to as non-recourse debt or "non-recourse financing." In some non-recourse financings, The AES Corporation has explicitly agreed to undertake certain limited obligations and contingent liabilities, most of which by their terms will only be effective or will be terminated upon the occurrence of future events. These obligations and liabilities take the form of guarantees, indemnities, letters of credit, letter of credit reimbursement agreements and agreements to pay, in certain circumstances, the project lenders or other parties.
As of December 31, 2019, we had approximately $20 billion of outstanding indebtedness on a consolidated basis, of which approximately $3.4 billion was recourse debt of The AES Corporation and approximately $16.7 billion was non-recourse debt. In addition, we have outstanding guarantees, indemnities, letters of credit, and other credit support commitments which are further described in this Form 10-K in Item 7.—Management's Discussion and Analysis of Financial Condition and Results of Operations—Capital Resources and Liquidity—Parent Company Liquidity.
Some of our subsidiaries are currently in default with respect to all or a portion of their outstanding indebtedness. The total debt classified as current in our Consolidated Balance Sheets related to such defaults was $325 million as of December 31, 2019. While the lenders under our non-recourse financings generally do not have direct recourse to The AES Corporation (other than to the extent of any credit support given by The AES Corporation), defaults thereunder can still have important consequences for The AES Corporation, including, without limitation:
• | reducing The AES Corporation's receipt of subsidiary dividends, fees, interest payments, loans and other sources of cash since the project subsidiary will typically be prohibited from distributing cash to The AES Corporation during the pendency of any default; |
• | under certain circumstances, triggering The AES Corporation's obligation to make payments under any financial guarantee, letter of credit or other credit support which The AES Corporation may have provided to or on behalf of such subsidiary; |
• | triggering defaults in The AES Corporation's outstanding debt. For example, The AES Corporation's senior secured credit facility, secured term loan, and outstanding senior notes include events of default for certain |
69 | 2019 Annual Report | |
bankruptcy related events involving material subsidiaries. In addition, The AES Corporation's senior secured credit facility includes certain events of default relating to accelerations of outstanding material debt of material subsidiaries or any subsidiaries that in the aggregate constitute a material subsidiary; or
• | foreclosure on the assets that are pledged under the non-recourse loans, resulting in write-downs of assets and eliminating any and all potential future benefits derived from those assets. |
None of the projects that are currently in default are owned by subsidiaries that individually or in the aggregate meet the applicable standard of materiality in The AES Corporation's senior secured credit facility or other debt agreements in order for such defaults to trigger an event of default or permit acceleration under such indebtedness. However, as a result of future mix of distributions, write-down of assets, dispositions and other matters that affect our financial position and results of operations, it is possible that one or more of these subsidiaries, individually or in the aggregate, could fall within the applicable standard of materiality and thereby upon an acceleration of such subsidiary's debt, trigger an event of default and possible acceleration of the indebtedness under The AES Corporation's senior secured credit facility or other indebtedness of The AES Corporation.
The AES Corporation has significant cash requirements and limited sources of liquidity.
The AES Corporation requires cash primarily to fund:
• | principal repayments of debt; |
• | interest; |
• | acquisitions; |
• | construction and other project commitments; |
• | other equity commitments, including business development investments; |
• | equity repurchases and/or cash dividends on our common stock; |
• | taxes; and |
• | Parent Company overhead costs. |
The AES Corporation's principal sources of liquidity are:
• | dividends and other distributions from its subsidiaries; |
• | proceeds from debt and equity financings at the Parent Company level; and |
• | proceeds from asset sales. |
For a more detailed discussion of The AES Corporation's cash requirements and sources of liquidity, please see Item 7.—Management's Discussion and Analysis of Financial Condition and Results of Operations—Capital Resources and Liquidity in this Form 10-K.
While we believe that these sources will be adequate to meet our obligations at the Parent Company level for the foreseeable future, this belief is based on a number of material assumptions, which could prove incorrect, including, without limitation, assumptions about our ability to access the capital or commercial lending markets, the operating and financial performance of our subsidiaries, exchange rates, our ability to sell assets, and the ability of our subsidiaries to pay dividends and other distributions. There can be no assurance that these sources will be available when needed or that our actual cash requirements will not be greater than expected. In addition, our cash flow may not be sufficient to repay at maturity the entire principal outstanding under our credit facility, term loan, and our debt securities and we may have to refinance such obligations. There can be no assurance that we will be successful in obtaining such refinancing on terms acceptable to us or at all and any of these events could have a material effect on us.
Our ability to grow our business depends on our ability to raise capital on favorable terms.
From time to time, we rely on access to capital markets as a source of liquidity for capital requirements not satisfied by operating cash flows. Our ability to arrange for financing on either a recourse or non-recourse basis and the costs of such capital are dependent on numerous factors, some of which are beyond our control, including:
• | general economic and capital market conditions; |
• | the availability of bank credit; |
• | the financial condition, performance and prospects of The AES Corporation in general and/or that of any subsidiary requiring the financing; |
70 | 2019 Annual Report | |
• | the financial condition, performance and prospects of other companies in our industry or with similar financial circumstances; and |
• | changes in tax and securities laws which are conducive to raising capital. |
Should access to capital not be available to us, we may have to sell assets or decide not to build new plants, or expand or improve existing facilities, either of which would affect our future growth, results of operations or financial condition.
Difficulty raising sufficient capital to fund development projects in less developed economies could affect our growth strategy.
Part of our growth strategy is to develop businesses in less developed economies where the return on our investment may be greater than projects in more developed economies. Commercial lending institutions sometimes refuse to provide non-recourse project financing in certain less developed economies, and in these situations we have sought and may continue to seek direct or indirect (through credit support or guarantees) project financing from a limited number of multilateral or bilateral international financial institutions or agencies. As a precondition to making such project financing available, the lending institutions may also require governmental guarantees for certain project and sovereign-related risks. There can be no assurance, however, that project financing from the international financial agencies or that governmental guarantees will be available when needed, and if they are not, we may have to abandon the relevant project or invest more of our own funds, which may not be in line with our investment objectives and would leave less funds for other projects.
A downgrade in the credit ratings of The AES Corporation or its subsidiaries could adversely affect our access to the capital markets, increase our interest costs and/or adversely affect our liquidity and cash flow.
If any of the credit ratings of the The AES Corporation and its subsidiaries were to be downgraded, our ability to raise capital on favorable terms could be impaired and our borrowing costs could increase. In addition, the recent downgrade in the credit ratings of DPL Inc. and DP&L may impact the cost of refinancing their respective debt securities as they come due. Furthermore, depending on The AES Corporation's credit ratings and the trading prices of its equity and debt securities, counterparties may no longer be as willing to accept general unsecured commitments by The AES Corporation to provide credit support. Accordingly, with respect to both new and existing commitments, The AES Corporation may be required to provide some other form of assurance, such as a letter of credit and/or collateral, to backstop or replace any credit support by The AES Corporation. There can be no assurance that such counterparties will accept such guarantees or that AES could arrange such further assurances in the future. In addition, to the extent The AES Corporation is required and able to provide letters of credit or other collateral to such counterparties, it will limit the amount of credit available to The AES Corporation to meet its other liquidity needs.
The market price of our common stock may be volatile.
The market price and trading volumes of our common stock could fluctuate substantially in the future. Factors that could affect the price of our common stock include, among other factors, general conditions in our industry and the power markets in which we participate, environmental and economic developments, and general credit and capital markets conditions, as well as developments specific to us, including risks that could result in revenue and earnings volatility, failing to meet our publicly announced guidance or other risk factors described in Item 1A.—Risk Factors and key trends and other matters described in Item 7.—Management's Discussion and Analysis of Financial Conditions and Results of Operations.
ITEM 1B. UNRESOLVED STAFF COMMENTS
None.
ITEM 2. PROPERTIES
We maintain offices in many places around the world, generally pursuant to the provisions of long- and short-term leases, none of which we believe are material. With a few exceptions, our facilities, which are described in Item 1—Business of this Form 10-K, are subject to mortgages or other liens or encumbrances as part of the project's related finance facility. In addition, the majority of our facilities are located on land that is leased. However, in a few instances, no accompanying project financing exists for the facility, and in a few of these cases, the land interest may not be subject to any encumbrance and is owned outright by the subsidiary or affiliate.
71 | 2019 Annual Report | |
ITEM 3. LEGAL PROCEEDINGS
The Company is involved in certain claims, suits and legal proceedings in the normal course of business. The Company has accrued for litigation and claims when it is probable that a liability has been incurred and the amount of loss can be reasonably estimated. The Company believes, based upon information it currently possesses and taking into account established reserves for estimated liabilities and its insurance coverage, that the ultimate outcome of these proceedings and actions is unlikely to have a material adverse effect on the Company's consolidated financial statements. It is reasonably possible, however, that some matters could be decided unfavorably to the Company and could require the Company to pay damages or make expenditures in amounts that could be material, but cannot be estimated as of December 31, 2019.
In December 2001, Grid Corporation of Odisha (“GRIDCO”) served a notice to arbitrate pursuant to the Indian Arbitration and Conciliation Act of 1996 on the Company, AES Orissa Distribution Private Limited (“AES ODPL”), and Jyoti Structures (“Jyoti”) pursuant to the terms of the shareholders agreement between GRIDCO, the Company, AES ODPL, Jyoti and the Central Electricity Supply Company of Orissa Ltd. (“CESCO”), an affiliate of the Company. In the arbitration, GRIDCO asserted that a comfort letter issued by the Company in connection with the Company's indirect investment in CESCO obligates the Company to provide additional financial support to cover all of CESCO's financial obligations to GRIDCO. GRIDCO appeared to be seeking approximately $189 million in damages, plus undisclosed penalties and interest, but a detailed alleged damage analysis was not filed by GRIDCO. The Company counterclaimed against GRIDCO for damages. In June 2007, a 2-to-1 majority of the arbitral tribunal rendered its award rejecting GRIDCO's claims and holding that none of the respondents, the Company, AES ODPL, or Jyoti, had any liability to GRIDCO. The respondents' counterclaims were also rejected. A majority of the tribunal later awarded the respondents, including the Company, some of their costs relating to the arbitration. GRIDCO filed challenges of the tribunal's awards with the local Indian court. GRIDCO's challenge of the costs award has been dismissed by the court, but its challenge of the liability award remains pending. A hearing on the liability award has not taken place to date. The Company believes that it has meritorious defenses to the claims asserted against it and will defend itself vigorously in these proceedings; however, there can be no assurances that it will be successful in its efforts.
Pursuant to their environmental audit, AES Sul and AES Florestal discovered 200 barrels of solid creosote waste and other contaminants at a pole factory that AES Florestal had been operating. The conclusion of the audit was that a prior operator of the pole factory, Companhia Estadual de Energia (“CEEE”), had been using those contaminants to treat the poles that were manufactured at the factory. On their initiative, AES Sul and AES Florestal communicated with Brazilian authorities and CEEE about the adoption of containment and remediation measures. In March 2008, the State Attorney of the state of Rio Grande do Sul, Brazil filed a public civil action against AES Sul, AES Florestal and CEEE seeking an order requiring the companies to mitigate the contaminated area located on the grounds of the pole factory and an indemnity payment of approximately R$6 million ($1 million). In October 2011, the State Attorney filed a request for an injunction ordering the defendant companies to contain and remove the contamination immediately. The court granted injunctive relief on October 18, 2011, but determined that only CEEE was required to perform the removal work. In May 2012, CEEE began the removal work in compliance with the injunction. The case is now awaiting judgment. The removal costs are estimated to be approximately R$29 million ($7 million), and there could be additional remediation costs which cannot be estimated at this time. In June 2016, the Company sold AES Sul to CPFL Energia S.A. and as part of the sale, AES Guaiba, a holding company of AES Sul, retained the potential liability relating to this matter. The Company believes that there are meritorious defenses to the claims asserted against it and will defend itself vigorously in these proceedings; however, there can be no assurances that it will be successful in its efforts.
In January 2015, DPL received NOVs from the EPA alleging violations of opacity at Stuart and Killen Stations, and in October 2015, IPL received a similar NOV alleging violations at Petersburg Station. In February 2017, the EPA issued a second NOV for DPL Stuart Station, alleging violations of opacity in 2016. On May 31, 2018, Stuart and Killen Stations were retired, and on December 20, 2019, they were transferred to an unaffiliated third-party purchaser, along with the associated environmental liabilities. In October 2015, IPL received a similar NOV alleging violations at Petersburg Station. In addition, in February 2016, IPL received an NOV from the EPA alleging violations of NSR and other CAA regulations, the Indiana SIP, and the Title V operating permit at Petersburg Station. It is too early to determine whether the NOVs could have a material impact on our business, financial condition or results of our operations. IPL would seek recovery of any operating or capital expenditures, but not fines or penalties, related to air pollution control technology to reduce regulated air emissions; however, there can be no assurances that IPL would be successful in this regard.
72 | 2019 Annual Report | |
In September 2015, AES Southland Development, LLC and AES Redondo Beach, LLC filed a lawsuit against the California Coastal Commission (the “CCC”) over the CCC's determination that the site of AES Redondo Beach included approximately 5.93 acres of CCC-jurisdictional wetlands. The CCC has asserted that AES Redondo Beach has improperly installed and operated water pumps affecting the alleged wetlands in violation of the California Coastal Act and Redondo Beach Local Coastal Program and has ordered AES Redondo Beach to restore the site. Additional potential outcomes of the CCC determination could include an order requiring AES Redondo Beach to fund a wetland mitigation project and/or pay fines or penalties. AES Redondo Beach believes that it has meritorious arguments and intends to vigorously prosecute such lawsuit, but there can be no assurances that it will be successful.
In October 2015, Ganadera Guerra, S.A. (“GG”) and Constructora Tymsa, S.A. (“CT”) filed separate lawsuits against AES Panama in the local courts of Panama. The claimants allege that AES Panama profited from a hydropower facility (La Estrella) being partially located on land owned initially by GG and currently by CT, and that AES Panama must pay compensation for its use of the land. The damages sought from AES Panama are approximately $685 million (GG) and $100 million (CT). In October 2016, the court dismissed GG's claim because of GG's failure to comply with a court order requiring GG to disclose certain information. GG has refiled its lawsuit. Also, there are ongoing administrative proceedings concerning whether AES Panama is entitled to acquire an easement over the land and whether AES Panama can continue to occupy the land. AES Panama believes it has meritorious defenses and claims and will assert them vigorously; however, there can be no assurances that it will be successful in its efforts.
In January 2017, the Superintendencia del Medio Ambiente (“SMA”) issued a Formulation of Charges asserting that Alto Maipo is in violation of certain conditions of the Environmental Approval Resolution (“RCA”) governing the construction of Alto Maipo’s hydropower project, for, among other things, operating vehicles at unauthorized times and failing to mitigate the impact of water infiltration during tunnel construction (“Infiltration Water”). In February 2017, Alto Maipo submitted a compliance plan (“Compliance Plan”) to the SMA which, if approved by the agency, would resolve the matter without materially impacting construction of the project. In April 2018, the SMA approved the Compliance Plan (“April 2018 Approval”). Among other things, the Compliance Plan as approved by the SMA requires Alto Maipo to obtain from the Environmental Evaluation Service (“SEA”) a definitive interpretation of the RCA’s provisions concerning the authorized times to operate certain vehicles. In addition, Alto Maipo must obtain the SEA’s final approval concerning the control, discharge, and treatment of Infiltration Water. Alto Maipo continues to seek the relevant final approvals from the SEA. In May 2018, three lawsuits were filed with the Environmental Court of Santiago (“ECS”) challenging the April 2018 Approval. Alto Maipo does not believe that there are grounds to challenge the April 2018 Approval. The ECS has not decided the lawsuits to date. In July 2019, a separate lawsuit was filed in the Court of Appeals of Santiago (“CAS”) seeking emergency relief to invalidate the April 2018 Approval. Alto Maipo believes there is no merit to the lawsuit, which remains pending. Furthermore, in September 2019, a petition was filed in the CAS requesting an order stopping certain construction works immediately. The CAS rejected the petition. If Alto Maipo complies with the requirements of the Compliance Plan, and if the above-referenced lawsuits are dismissed, the Formulation of Charges will be discharged without penalty. Otherwise, Alto Maipo could be subject to penalties, and the construction of the project could be negatively impacted. Alto Maipo will pursue its interests vigorously in these matters; however, there can be no assurances that it will be successful in its efforts.
In June 2017, Alto Maipo terminated one of its contractors, Constructora Nuevo Maipo S.A. (“CNM”), given CNM’s stoppage of tunneling works, its failure to produce a completion plan, and its other breaches of contract. Also, Alto Maipo drew $73 million under letters of credit (“LC Funds”) in connection with its termination of CNM. Alto Maipo is pursuing arbitration against CNM to recover excess completion costs and other damages totaling at least $236 million (net of the LC Funds) relating to CNM’s breaches (“First Arbitration”). CNM denies liability and seeks a declaration that its termination was wrongful, damages that it alleges result from that termination, and other relief. CNM alleges that it is entitled to damages ranging from $70 million to $170 million (which include the LC Funds) plus interest and costs, based on various scenarios. Alto Maipo has contested these submissions. The evidentiary hearing in the First Arbitration took place May 20-31, 2019. Post-hearing briefs were submitted in September 2019. One of the three arbitrators on the arbitral Tribunal has been replaced. The new Tribunal has determined not to repeat the May 2019 evidentiary hearing and has scheduled closing arguments for June 10-11, 2020. Also, in August 2018, CNM purported to initiate a separate arbitration against AES Gener and the Company (“Second Arbitration”). In the Second Arbitration, CNM seeks to pierce Alto Maipo’s corporate veil and appears to seek an award holding AES Gener and the Company jointly and severally liable to pay any alleged net amounts that are found to be due to CNM in the First Arbitration or otherwise. The Second Arbitration has been consolidated into the First Arbitration. The arbitral Tribunal has bifurcated the Second Arbitration to determine in the first instance the
73 | 2019 Annual Report | |
jurisdictional objections raised by AES Gener and the Company to CNM’s piercing claims. The hearing on the jurisdictional objections will take place in or around October 2020. Each of Alto Maipo, AES Gener, and the Company believes it has meritorious claims and/or defenses and will pursue its interests vigorously; however, there can be no assurances that each will be successful in its efforts.
In October 2017, the Maritime Prosecution Office from Valparaíso issued a ruling alleging responsibility by AES Gener for the presence of coal waste on Ventanas beach, and proposed a fine before the Maritime Governor, of approximately $380,000. AES Gener submitted its statement of defense, denying the allegations. An evidentiary stage was concluded and then re-opened by order of the Maritime Governor on February 5, 2019 to allow AES Gener a six-month period to present reports and other evidence to challenge the grounds of the ruling. In September 2019, this period was extended for an additional six months, in order to allow the execution of a field test in the bay of Ventanas. AES Gener believes that it has meritorious defenses to the allegations; however, there are no assurances that it will be successful in defending this action.
In February 2018, Tau Power B.V. and Altai Power LLP (collectively, “AES Claimants”) initiated arbitration against the Republic of Kazakhstan (“ROK”) for the ROK’s failure to pay approximately $75 million (“Return Transfer Payment”) for the return of two hydropower plants (“HPPs”) pursuant to a concession agreement. The ROK has responded by denying liability and asserting purported counterclaims concerning the annual payment provisions in the concession agreement, a bonus allegedly due for the 1997 takeover of the HPPs, and dividends paid by the HPPs. The ROK seeks to recover the Return Transfer Payment (which is in an escrow account maintained by a third party) and appears to be seeking over $500 million on its counterclaims. The AES Claimants believe that the ROK’s defenses and counterclaims are without merit and have contested the ROK’s submissions on these issues. An arbitrator was appointed to decide the case. The final evidentiary hearing took place July 22-26, 2019. The parties are awaiting the arbitrator’s decision. The AES Claimants will pursue their case and assert their defenses vigorously; however, there can be no assurances that they will be successful in their efforts.
In December 2018, a lawsuit was filed in Dominican Republic civil court against the Company, AES Puerto Rico, and three other AES affiliates. The lawsuit purports to be brought on behalf of over 100 Dominican claimants, living and deceased, and appears to seek relief relating to CCRs that were delivered to the Dominican Republic in 2004. The lawsuit generally alleges that the CCRs caused personal injuries and deaths and demands $476 million in alleged damages. The lawsuit does not identify, or provide any supporting information concerning, the alleged injuries of the claimants individually. Nor does the lawsuit provide any information supporting the demand for damages or explaining how the quantum was derived. The relevant AES companies believe that they have meritorious defenses to the claims asserted against them and will defend themselves vigorously in this proceeding; however, there can be no assurances that they will be successful in their efforts.
In February 2019, a separate lawsuit was filed in Dominican Republic civil court against the Company, AES Puerto Rico, two other AES affiliates, and an unaffiliated company and its principal. The lawsuit purports to be brought on behalf of over 200 Dominican claimants, living and deceased, and appears to seek relief relating to CCRs that were delivered to the Dominican Republic in 2003 and 2004. The lawsuit generally alleges that the CCRs caused personal injuries and deaths and demands $900 million in alleged damages. The lawsuit does not identify, or provide any supporting information concerning, the alleged injuries of the claimants individually. Nor does the lawsuit provide any information supporting the demand for damages or explaining how the quantum was derived. The relevant AES companies believe that they have meritorious defenses to the claims asserted against them and will defend themselves vigorously in this proceeding; however, there can be no assurances that they will be successful in their efforts.
In March 2019, the Puerto Rico Department of Natural and Environmental Resources (“DNER”) issued an Administrative Order, which later amended (collectively, the “DNER Order”), alleging that AES Puerto Rico, LP (“AES Puerto Rico”) failed to comply with certain DNER requests for documents and information, that AES Puerto Rico has contaminated groundwater in excess of certain state water quality standards, and requesting AES Puerto Rico to submit a corrective/remedial action plan for DNER’s review and approval, among others. The DNER Order also proposes an administrative fine of $160,000. In April 2019, AES Puerto Rico timely filed its response to the DNER Order contesting the alleged violations and the proposed fine and also moved to dismiss the case. The Hearing Examiner assigned to the case denied AES Puerto Rico’s request for dismissal. In October 2019, the Hearing Examiner granted DNER's request to postpone the filing of the prehearing report and scheduling of the prehearing conference. The parties are currently discussing a potential resolution of the Order. AES Puerto Rico believes that it has meritorious defenses, but there are no assurances that it will be successful in defending this action should it proceed to a hearing.
74 | 2019 Annual Report | |
In October 2019, the Superintendency of the Environment (the "SMA") notified AES Gener of certain alleged breaches associated with the environmental permit of the Ventanas Complex, initiating a sanctioning process through Exempt Resolution N° 1 / ROL D-129-2019. The alleged charges include exceeding generation limits, failing to reduce emissions during episodes of poor air quality, exceeding limits on discharges to the sea, and exceeding noise limits. As the charges are currently classified, the maximum fine is approximately $6.5 million. On October 14, 2019, the SMA notified AES Gener of other alleged breaches at the Guacolda Complex under Exempt Resolution N° 1 / ROL D-146-2019. These allegations include failure to comply with all measures to mitigate atmospheric emissions, failure to comply with mitigation measures to avoid solid fuel discharges to the sea, failure to perform temperature monitoring in intake and water discharge at Unit 3, and a one-day exceedance of the seawater discharge limits. As the Guacolda charges are currently classified, the maximum fine is approximately $4 million. For each complex, additional fines are possible if the SMA determines that non-compliance resulted in an economic benefit. AES Gener has submitted proposed "Compliance Programs" to the SMA for the Ventanas Complex and the Guacolda Complex, respectively. If these submissions are approved by the SMA and satisfactorily fulfilled by AES Gener, the process would be concluded without sanctions and not generate further action.
ITEM 4. MINE SAFETY DISCLOSURES
Not applicable.
75 | 2019 Annual Report | |
PART II
ITEM 5. MARKET FOR REGISTRANT'S COMMON EQUITY, RELATED STOCKHOLDER MATTERS AND ISSUER PURCHASES OF EQUITY SECURITIES
Recent Sales of Unregistered Securities
None.
Purchases of Equity Securities by the Issuer and Affiliated Purchasers
Stock Repurchase Program — The Board authorization permits the Parent Company to repurchase stock through a variety of methods, including open market repurchases and/or privately negotiated transactions. There can be no assurances as to the amount, timing or prices of repurchases, which may vary based on market conditions and other factors. The Stock Repurchase Program does not have an expiration date and can be modified or terminated by the Board of Directors at any time. The cumulative repurchase from the commencement of the Stock Repurchase Program in July 2010 through December 31, 2019 is 154.3 million shares at a total cost of $1.9 billion, at an average price per share of $12.12 (including a nominal amount of commissions). As of December 31, 2019, $264 million remained available for repurchase under the Stock Repurchase Program. No repurchases were made by The AES Corporation of its common stock in 2019, 2018, and 2017.
Market Information
Our common stock is traded on the New York Stock Exchange under the symbol "AES."
Dividends
The Parent Company commenced a quarterly cash dividend in the fourth quarter of 2012. The Parent Company has increased this dividend annually and the quarterly per-share cash dividends for the last three years are displayed below.
Commencing the fourth quarter of | 2019 | 2018 | 2017 | |||
Cash dividend | $0.1433 | $0.1365 | $0.13 | |||
The fourth quarter 2019 cash dividend is to be paid in the first quarter of 2020. There can be no assurance the AES Board will declare a dividend in the future or, if declared, the amount of any dividend. Our ability to pay dividends will also depend on receipt of dividends from our various subsidiaries across our portfolio.
Under the terms of our senior secured credit facility, which we entered into with a commercial bank syndicate, we have limitations on our ability to pay cash dividends and/or repurchase stock. Our subsidiaries' ability to declare and pay cash dividends to us is also subject to certain limitations contained in the project loans, governmental provisions and other agreements to which our subsidiaries are subject. See the information contained under Item 12.—Security Ownership of Certain Beneficial Owners and Management and Related Stockholder Matters—Securities Authorized for Issuance under Equity Compensation Plans of this Form 10-K.
Holders
As of February 20, 2020, there were approximately 3,856 record holders of our common stock.
76 | 2019 Annual Report | |
Performance Graph
THE AES CORPORATION
PEER GROUP INDEX/STOCK PRICE PERFORMANCE

Source: Bloomberg
We have selected the Standard and Poor's ("S&P") 500 Utilities Index as our peer group index. The S&P 500 Utilities Index is a published sector index comprising the 28 electric and gas utilities included in the S&P 500.
The five year total return chart assumes $100 invested on December 31, 2014 in AES Common Stock, the S&P 500 Index and the S&P 500 Utilities Index. The information included under the heading Performance Graph shall not be considered "filed" for purposes of Section 18 of the Securities Exchange Act of 1934 or incorporated by reference in any filing under the Securities Act of 1933 or the Securities Exchange Act of 1934.
ITEM 6. SELECTED FINANCIAL DATA
The following table presents our selected financial data as of the dates and for the periods indicated. This data should be read together with Item 7.—Management's Discussion and Analysis of Financial Condition and Results of Operations and the Consolidated Financial Statements and the notes thereto included in Item 8.—Financial Statements and Supplementary Data of this Form 10-K. The selected financial data for each of the years in the five year period ended December 31, 2019 have been derived from our audited Consolidated Financial Statements. Prior period amounts have been restated to reflect discontinued operations in all periods presented. Our historical results are not necessarily indicative of our future results.
Acquisitions, disposals, reclassifications and changes in accounting principles affect the comparability of information included in the tables below. Please refer to the Notes to the Consolidated Financial Statements included in Item 8.—Financial Statements and Supplementary Data of this Form 10-K for further explanation of the effect of such activities. Please also refer to Item 1A.—Risk Factors of this Form 10-K and Note 28—Risks and Uncertainties to the Consolidated Financial Statements included in Item 8.—Financial Statements and Supplementary Data of this Form 10-K for certain risks and uncertainties that may cause the data reflected herein not to be indicative of our future financial condition or results of operations.
77 | 2019 Annual Report | |
Selected Financial Data
2019 | 2018 | 2017 | 2016 | 2015 | |||||||||||||||
Statement of Operations Data for the Years Ended December 31: | (in millions, except per share amounts) | ||||||||||||||||||
Revenue | $ | 10,189 | $ | 10,736 | $ | 10,530 | $ | 10,281 | $ | 11,260 | |||||||||
Income (loss) from continuing operations (1) | 477 | 1,349 | (148 | ) | 191 | 682 | |||||||||||||
Income (loss) from continuing operations attributable to The AES Corporation, net of tax | 302 | 985 | (507 | ) | (20 | ) | 318 | ||||||||||||
Income (loss) from discontinued operations attributable to The AES Corporation, net of tax (2) | 1 | 218 | (654 | ) | (1,110 | ) | (12 | ) | |||||||||||
Net income (loss) attributable to The AES Corporation | $ | 303 | $ | 1,203 | $ | (1,161 | ) | $ | (1,130 | ) | $ | 306 | |||||||
Per Common Share Data | |||||||||||||||||||
Basic earnings (loss) per share: | |||||||||||||||||||
Income (loss) from continuing operations attributable to The AES Corporation common stockholders, net of tax | $ | 0.46 | $ | 1.49 | $ | (0.77 | ) | $ | (0.04 | ) | $ | 0.46 | |||||||
Income (loss) from discontinued operations attributable to The AES Corporation common stockholders, net of tax | — | 0.33 | (0.99 | ) | (1.68 | ) | (0.01 | ) | |||||||||||
Net income (loss) attributable to The AES Corporation common stockholders | $ | 0.46 | $ | 1.82 | $ | (1.76 | ) | $ | (1.72 | ) | $ | 0.45 | |||||||
Diluted earnings (loss) per share: | |||||||||||||||||||
Income (loss) from continuing operations attributable to The AES Corporation common stockholders, net of tax | $ | 0.45 | $ | 1.48 | $ | (0.77 | ) | $ | (0.04 | ) | $ | 0.46 | |||||||
Income (loss) from discontinued operations attributable to The AES Corporation common stockholders, net of tax | — | 0.33 | (0.99 | ) | (1.68 | ) | (0.02 | ) | |||||||||||
Net income (loss) attributable to The AES Corporation common stockholders | $ | 0.45 | $ | 1.81 | $ | (1.76 | ) | $ | (1.72 | ) | $ | 0.44 | |||||||
Dividends Declared Per Common Share | $ | 0.55 | $ | 0.53 | $ | 0.49 | $ | 0.45 | $ | 0.41 | |||||||||
Cash Flow Data for the Years Ended December 31: | |||||||||||||||||||
Net cash provided by operating activities | $ | 2,466 | $ | 2,343 | $ | 2,504 | $ | 2,897 | $ | 2,136 | |||||||||
Net cash used in investing activities | (2,721 | ) | (505 | ) | (2,599 | ) | (2,136 | ) | (2,128 | ) | |||||||||
Net cash provided by (used in) financing activities | (86 | ) | (1,643 | ) | 43 | (747 | ) | 28 | |||||||||||
Total increase (decrease) in cash, cash equivalents and restricted cash | (431 | ) | 215 | (172 | ) | 9 | (10 | ) | |||||||||||
Cash, cash equivalents and restricted cash, ending | 1,572 | 2,003 | 1,788 | 1,960 | 1,951 | ||||||||||||||
Balance Sheet Data at December 31: | |||||||||||||||||||
Total assets | $ | 33,648 | $ | 32,521 | $ | 33,112 | $ | 36,124 | $ | 36,545 | |||||||||
Non-recourse debt (noncurrent) | 14,914 | 13,986 | 13,176 | 13,731 | 12,184 | ||||||||||||||
Non-recourse debt (noncurrent)—Discontinued operations | — | — | — | 758 | 772 | ||||||||||||||
Recourse debt (noncurrent) | 3,391 | 3,650 | 4,625 | 4,671 | 4,966 | ||||||||||||||
Redeemable stock of subsidiaries | 888 | 879 | 837 | 782 | 538 | ||||||||||||||
Retained earnings (accumulated deficit) | (692 | ) | (1,005 | ) | (2,276 | ) | (1,146 | ) | 143 | ||||||||||
The AES Corporation stockholders' equity | 2,996 | 3,208 | 2,465 | 2,794 | 3,149 | ||||||||||||||
_____________________________
(1) | Includes pre-tax gains on sales of business interests of $28 million, $984 million, $29 million, and $29 million for the years ended December 31, 2019, 2018, 2016, and 2015, respectively, and pre-tax losses of $52 million for the year ended December 31, 2017; pre-tax impairment expense of $185 million, $208 million, $537 million, $1.1 billion, and $602 million for the years ended December 31, 2019, 2018, 2017, 2016, and 2015, respectively; other-than-temporary impairment of equity method investments of $92 million and $147 million for the years ended December 31, 2019 and 2018; income tax expense of $194 million and $675 million related to the one-time transition tax on foreign earnings, and income tax benefit of $77 million and expense of $39 million related to the remeasurement of deferred tax assets and liabilities to the lower corporate tax rate for the years ended December 31, 2018 and 2017, respectively; and net equity in losses of affiliates, primarily at Guacolda, of $172 million, for the year ended December 31, 2019. See Note 25—Held-for-Sale and Dispositions, Note 22—Asset Impairment Expense, Note 8—Investments in and Advances to Affiliates and Note 23—Income Taxes included in Item 8.—Financial Statements and Supplementary Data of this Form 10-K for further information. |
(2) | Includes gain on sale of $199 million and loss on deconsolidation of $611 million related to Eletropaulo for the years ended December 31, 2018 and 2017, respectively, and impairment expense of $382 million and loss on sale of $737 million related to Sul for the year ended December 31, 2016. See Note 24—Discontinued Operations included in Item 8.—Financial Statements and Supplementary Data of this Form 10-K for further information. |
78 | 2019 Annual Report | |
ITEM 7. MANAGEMENT'S DISCUSSION AND ANALYSIS OF FINANCIAL CONDITION AND RESULTS OF OPERATIONS
Executive Summary
In 2019, AES achieved significant milestones towards its strategic objectives, including investing in sustainable growth and innovative solutions to deliver superior results. We completed construction of 2.2 GW of new projects and signed long-term PPAs for 2.8 GW of renewable capacity. Fluence, our joint venture with Siemens, maintained its leading global market share with 1.1 GW of projects delivered or awarded in 2019. We announced the merger of Simple Energy into Uplight and formed a 10-year strategic alliance with Google to develop and implement solutions to enable broad adoption of clean energy. Finally, following our efforts to reduce recourse debt, our Parent Company's credit rating was upgraded to investment grade by Fitch. See Overview of our Strategy included in Item 1.—Business of this Form 10-K for further information.
Compared with last year, diluted earnings per share from continuing operations decreased $1.03, from $1.48 to $0.45. This decrease was largely driven by prior year net gains on dispositions of Masinloc, Electrica Santiago and CTNG transmission lines, lower generation in Argentina and Chile and higher impairments in the current year, and the impact on margin from the sale of businesses in prior periods. These decreases were partially offset by current year contributions from new businesses, lower losses on extinguishment of debt in 2019, and prior year income tax expense to finalize the impact of the TCJA.
Adjusted EPS, a non-GAAP measure, increased $0.12, from $1.24 to $1.36, reflecting higher contributions from new businesses, including U.S. renewables and the Colon combined cycle facility in Panama, a lower effective tax rate, and lower Parent Company interest in 2019, partially offset by the impact on margin from the sale of businesses in prior periods.
79 | 2019 Annual Report | |
Review of Consolidated Results of Operations
Years Ended December 31, | 2019 | 2018 | 2017 | % Change 2019 vs. 2018 | % Change 2018 vs. 2017 | ||||||||||||
(in millions, except per share amounts) | |||||||||||||||||
Revenue: | |||||||||||||||||
US and Utilities SBU | $ | 4,058 | $ | 4,230 | $ | 4,162 | -4 | % | 2 | % | |||||||
South America SBU | 3,208 | 3,533 | 3,252 | -9 | % | 9 | % | ||||||||||
MCAC SBU | 1,882 | 1,728 | 1,519 | 9 | % | 14 | % | ||||||||||
Eurasia SBU | 1,047 | 1,255 | 1,590 | -17 | % | -21 | % | ||||||||||
Corporate and Other | 46 | 41 | 35 | 12 | % | 17 | % | ||||||||||
Eliminations | (52 | ) | (51 | ) | (28 | ) | 2 | % | 82 | % | |||||||
Total Revenue | 10,189 | 10,736 | 10,530 | -5 | % | 2 | % | ||||||||||
Operating Margin: | |||||||||||||||||
US and Utilities SBU | 754 | 733 | 693 | 3 | % | 6 | % | ||||||||||
South America SBU | 873 | 1,017 | 862 | -14 | % | 18 | % | ||||||||||
MCAC SBU | 487 | 534 | 465 | -9 | % | 15 | % | ||||||||||
Eurasia SBU | 188 | 227 | 422 | -17 | % | -46 | % | ||||||||||
Corporate and Other | 39 | 58 | 23 | -33 | % | NM | |||||||||||
Eliminations | 8 | 4 | — | 100 | % | NM | |||||||||||
Total Operating Margin | 2,349 | 2,573 | 2,465 | -9 | % | 4 | % | ||||||||||
General and administrative expenses | (196 | ) | (192 | ) | (215 | ) | 2 | % | -11 | % | |||||||
Interest expense | (1,050 | ) | (1,056 | ) | (1,170 | ) | -1 | % | -10 | % | |||||||
Interest income | 318 | 310 | 244 | 3 | % | 27 | % | ||||||||||
Loss on extinguishment of debt | (169 | ) | (188 | ) | (68 | ) | -10 | % | NM | ||||||||
Other expense | (80 | ) | (58 | ) | (58 | ) | 38 | % | — | % | |||||||
Other income | 145 | 72 | 120 | NM | -40 | % | |||||||||||
Gain (loss) on disposal and sale of business interests | 28 | 984 | (52 | ) | -97 | % | NM | ||||||||||
Asset impairment expense | (185 | ) | (208 | ) | (537 | ) | -11 | % | -61 | % | |||||||
Foreign currency transaction gains (losses) | (67 | ) | (72 | ) | 42 | -7 | % | NM | |||||||||
Other non-operating expense | (92 | ) | (147 | ) | — | -37 | % | NM | |||||||||
Income tax expense | (352 | ) | (708 | ) | (990 | ) | -50 | % | -28 | % | |||||||
Net equity in earnings (losses) of affiliates | (172 | ) | 39 | 71 | NM | -45 | % | ||||||||||
INCOME (LOSS) FROM CONTINUING OPERATIONS | 477 | 1,349 | (148 | ) | -65 | % | NM | ||||||||||
Loss from operations of discontinued businesses, net of income tax expense of $0, $2, and $21, respectively | — | (9 | ) | (18 | ) | -100 | % | -50 | % | ||||||||
Gain (loss) from disposal of discontinued businesses, net of income tax expense of $0, $44, and $0, respectively | 1 | 225 | (611 | ) | -100 | % | NM | ||||||||||
NET INCOME (LOSS) | 478 | 1,565 | (777 | ) | -69 | % | NM | ||||||||||
Less: Income from continuing operations attributable to noncontrolling interests and redeemable stock of subsidiaries | (175 | ) | (364 | ) | (359 | ) | -52 | % | 1 | % | |||||||
Less: Loss (income) from discontinued operations attributable to noncontrolling interests | — | 2 | (25 | ) | -100 | % | NM | ||||||||||
NET INCOME (LOSS) ATTRIBUTABLE TO THE AES CORPORATION | $ | 303 | $ | 1,203 | $ | (1,161 | ) | -75 | % | NM | |||||||
AMOUNTS ATTRIBUTABLE TO THE AES CORPORATION COMMON STOCKHOLDERS: | |||||||||||||||||
Income (loss) from continuing operations, net of tax | $ | 302 | $ | 985 | $ | (507 | ) | -69 | % | NM | |||||||
Income (loss) from discontinued operations, net of tax | 1 | 218 | (654 | ) | -100 | % | NM | ||||||||||
NET INCOME (LOSS) ATTRIBUTABLE TO THE AES CORPORATION | $ | 303 | $ | 1,203 | $ | (1,161 | ) | -75 | % | NM | |||||||
Net cash provided by operating activities | $ | 2,466 | $ | 2,343 | $ | 2,504 | 5 | % | -6 | % | |||||||
Components of Revenue, Cost of Sales and Operating Margin — Revenue includes revenue earned from the sale of energy from our utilities and the production and sale of energy from our generation plants, which are classified as regulated and non-regulated, respectively, on the Consolidated Statements of Operations. Revenue also includes the gains or losses on derivatives associated with the sale of electricity.
Cost of sales includes costs incurred directly by the businesses in the ordinary course of business. Examples include electricity and fuel purchases, operations and maintenance costs, depreciation and amortization expenses, bad debt expense and recoveries, and general administrative and support costs (including employee-related costs directly associated with the operations of the business). Cost of sales also includes the gains or losses on derivatives (including embedded derivatives other than foreign currency embedded derivatives) associated with the purchase of electricity or fuel.
Operating margin is defined as revenue less cost of sales.
80 | 2019 Annual Report | |
Consolidated Revenue and Operating Margin
Year Ended December 31, 2019 Compared to Year Ended December 31, 2018
Revenue
(in millions)
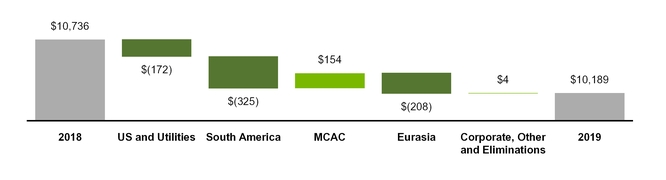
Consolidated Revenue — Revenue decreased $547 million, or 5%, in 2019 compared to 2018. Excluding the unfavorable FX impact of $133 million, primarily in South America, this decrease was driven by:
• | $229 million in South America primarily driven by lower generation and prices in Argentina and lower contract sales and generation in Chile; |
• | $173 million in Eurasia primarily due to the sales of the Masinloc power plant in March 2018 and the Northern Ireland businesses in June 2019; and |
• | $172 million in US and Utilities primarily driven by the closure of generation facilities at DPL in the first half of 2018 and Shady Point in May 2019, and lower energy prices and sales due to higher temperatures and other favorable market conditions present in 2018 as compared to 2019 at Southland, partially offset by price increases due to the 2018 rate orders at IPL and DPL and an increase in energy pass-through costs in El Salvador. |
These unfavorable impacts were partially offset by an increase of $156 million in MCAC driven by the commencement of operations at the Colon combined cycle facility in Panama in September 2018.
Operating Margin
(in millions)

Consolidated Operating Margin — Operating margin decreased $224 million, or 9%, in 2019 compared to 2018. Excluding the unfavorable impact of FX of $46 million, primarily in South America, this decrease was driven by:
• | $107 million in South America primarily due to the drivers discussed above; |
• | $46 million in MCAC due to the outage at Changuinola as a result of upgrading the tunnel lining and lower hydrology in Panama as compared to the prior year, partially offset by the business interruption insurance |
81 | 2019 Annual Report | |
recoveries at the Andres facility in Dominican Republic, higher contract sales at Panama, and the commencement of operations at the Colon combined cycle facility in Panama; and
• | $31 million in Eurasia primarily due to the drivers discussed above, partially offset by lower depreciation at the Jordan plants due to their classification as held-for-sale. |
These unfavorable impacts were partially offset by a $21 million increase in US and Utilities mostly driven by the 2018 rate orders at IPL and DPL, partially offset by the lost margin from the sale and closure of generation facilities at Shady Point and DPL, and increased rock ash disposal at Puerto Rico.
Year Ended December 31, 2018 Compared to Year Ended December 31, 2017
Revenue
(in millions)
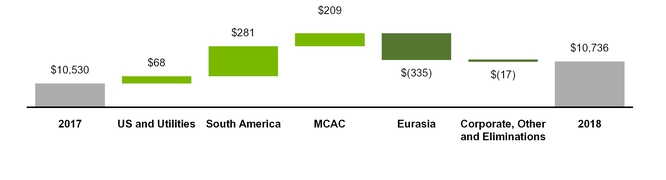
Consolidated Revenue — Revenue increased $206 million, or 2%, in 2018 compared to 2017. Excluding the unfavorable FX impact of $52 million, primarily in South America partially offset by Eurasia, this increase was driven by:
• | $357 million in South America primarily due to higher contract sales and prices in Colombia and the commencement of new PPAs at Angamos and Cochrane in Chile, as well as higher capacity prices in Argentina resulting from market reforms enacted in 2017; |
• | $215 million in MCAC primarily due to to the commencement of operations at the Colon combined cycle facility as well as improved hydrology at Panama, higher pass-through fuel prices in Mexico, higher contracted energy sales due to commencement of operations at the Los Mina combined cycle facility in June 2017, and higher spot prices in the Dominican Republic; and |
• | $68 million in US and Utilities driven primarily by higher market energy sales at Southland, higher regulated rates commencing in November 2017 at DPL, higher wholesale volume due to the new CCGT coming online as well as higher retail demand at IPL, and higher prices due to tariff reset and higher energy prices in El Salvador, partially offset by the sale and closure of several generation facilities at DPL. |
These favorable impacts were partially offset by decreases of $366 million in Eurasia due to the sale of the Masinloc power plant in March 2018, as well as the sale of the Kazakhstan CHPs and expiration of the Kazakhstan HPP concession agreement in 2017.
82 | 2019 Annual Report | |
Operating Margin
(in millions)

Consolidated Operating Margin — Operating margin increased $108 million, or 4%, in 2018 compared to 2017. Excluding the favorable impact of FX of $8 million, primarily driven by Eurasia, this increase was driven by:
• | $154 million in South America primarily due to the drivers discussed above and the absence of maintenance costs for planned outages in 2018 versus maintenance performed in Q3 2017 at Gener Chile; |
• | $70 million in MCAC primarily due to drivers discussed above; and |
• | $40 million in US and Utilities mostly due to the drivers discussed above and the favorable impact of a one time reduction in the ARO liability at DPL's closed plants, Stuart and Killen. |
These favorable impacts were partially offset by a decrease of $204 million in Eurasia due to the drivers discussed above.
See Item 7.—Management's Discussion and Analysis of Financial Condition and Results of Operations—SBU Performance Analysis of this Form 10-K for additional discussion and analysis of operating results for each SBU.
Consolidated Results of Operations — Other
General and administrative expenses
General and administrative expenses include expenses related to corporate staff functions and initiatives, executive management, finance, legal, human resources and information systems, as well as global development costs.
General and administrative expenses increased $4 million, or 2%, to $196 million for 2019 compared to $192 million for 2018, with no material drivers.
General and administrative expenses decreased $23 million, or 11%, to $192 million for 2018 compared to $215 million for 2017, primarily due to reduced people costs, professional fees and business development activity.
Interest expense
Interest expense decreased $6 million, or 1%, to $1,050 million for 2019, compared to $1,056 million for 2018 primarily due to the reduction of debt mainly at the Parent Company and DPL, reduced interest rates on refinanced debt at DPL, and favorable foreign currency translation at Tietê, partially offset by lower capitalized interest due to the commencement of operations at Colon facility in September 2018, a decrease in AFUDC for the Eagle Valley CCGT project at IPL, and the loss of hedge accounting at Alto Maipo in 2018, which resulted in favorable unrealized mark-to-market adjustments recognized within interest expense.
Interest expense decreased $114 million, or 10%, to $1,056 million for 2018, compared to $1,170 million for 2017 primarily due to the reduction of debt at the Parent Company, favorable impacts from interest rate swaps in Chile, and increased capitalized interest at Alto Maipo.
Interest income
Interest income increased $8 million, or 3%, to $318 million for 2019, compared to $310 million for 2018 primarily in South America driven by a higher average interest rate on CAMMESA receivables.
83 | 2019 Annual Report | |
Interest income increased $66 million, or 27%, to $310 million for 2018, compared to $244 million for 2017 primarily due to higher interest rates and increased long-term receivables as a result of the adoption of the new revenue recognition standard in 2018.
Loss on extinguishment of debt
Loss on extinguishment of debt decreased $19 million, or 10%, to $169 million for 2019, compared to $188 million for 2018. This decrease was primarily due to losses of $171 million at the Parent Company resulting from the redemption of senior notes in 2018 compared to losses of $45 million at DPL, $31 million at Mong Duong, $29 million at Gener, $28 million at Colon, and $24 million at Cochrane in 2019 resulting from the redemption or refinancing of senior notes.
Loss on extinguishment of debt increased $120 million to $188 million for 2018, compared to $68 million for 2017. This increase was primarily due to higher losses at the Parent Company of $79 million from the redemption of senior notes in 2018 and a 2017 gain on early retirement of debt at AES Argentina of $65 million, partially offset by lower losses at other subsidiaries of $24 million in 2018.
See Note 11—Debt included in Item 8.—Financial Statements and Supplementary Data of this Form 10-K for further information.
Other income
Other income increased $73 million, to $145 million for 2019, compared to $72 million for 2018 primarily due to gains on insurance recoveries associated with property damage at the Andres facility and upgrading the tunnel lining at Changuinola. These increases were partially offset by a gain on remeasurement of contingent liabilities for projects in Hawaii in 2018.
Other income decreased $48 million, or 40%, to $72 million for 2018, compared to $120 million for 2017 primarily due to the 2017 favorable settlement of legal proceedings at Uruguaiana related to YPF's breach of the parties’ gas supply agreement and a decrease in AFUDC in the US and Utilities SBU. These decreases were partially offset by a gain on remeasurement of contingent liabilities for projects in Hawaii in 2018.
Other expense
Other expense increased $22 million, or 38%, to $80 million for 2019, compared to $58 million for 2018 primarily due to losses recognized at commencement of sales-type leases at Distributed Energy and the loss on disposal of assets at Changuinola associated with upgrading the tunnel lining in 2019. This was partially offset by the loss on disposal of assets resulting from damage associated with a lightning incident at the Andres facility in the Dominican Republic in 2018.
Other expense remained flat at $58 million for 2018 as compared to 2017 primarily due to a loss resulting from damage associated with a lightning incident at the Andres facility in the Dominican Republic in 2018 and higher non-service pension and other postretirement costs in 2018. This was offset by the 2017 write-off of water rights for projects that were no longer being pursued in the South America SBU and a loss on disposal of assets at DPL as a result of the decision to close the coal-fired and diesel-fired generating units at Stuart and Killen.
See Note 21—Other Income and Expense included in Item 8.—Financial Statements and Supplementary Data of this Form 10-K for further information.
Gain (loss) on disposal and sale of business interests
Gain on disposal and sale of business interests decreased to $28 million for 2019, as compared to $984 million for 2018 primarily due to the 2018 gains on sale of Masinloc of $772 million, CTNG of $126 million, and Electrica Santiago of $70 million.
Gain on disposal and sale of business interests was $984 million for 2018 as compared to a loss of $52 million for 2017, primarily due to the 2018 gains on sale discussed above, and the 2017 losses on sales of Kazakhstan CHPs and HPPs of $49 million and $33 million, respectively, partially offset by the 2017 recognition of a $23 million gain related to the expiration of a contingency at Masinloc.
See Note 25—Held-For-Sale and Dispositions included in Item 8.—Financial Statements and Supplementary Data of this Form 10-K for further information.
84 | 2019 Annual Report | |
Goodwill impairment expense
There were no goodwill impairments for the years ended December 31, 2019, 2018, or 2017.
See Note 9—Goodwill and Other Intangible Assets included in Item 8.—Financial Statements and Supplementary Data of this Form 10-K for further information.
Asset impairment expense
Asset impairment expense decreased $23 million, or 11%, to $185 million for 2019, compared to $208 million for 2018. This decrease was primarily driven by $115 million as a result of an impairment analysis performed at Kilroot and Ballylumford upon meeting the held-for-sale criteria in 2019 and $60 million at Hawaii due to a decrease in the economic useful life of the coal-fired asset, compared to prior year impairments of $157 million at Shady Point due to an unfavorable economic outlook creating uncertainty around future cash flows and $37 million at Nejapa due to the landfill owner's failure to perform improvements necessary to continue extracting gas.
Asset impairment expense decreased $329 million, or 61%, to $208 million for 2018, compared to $537 million for 2017 mainly driven by 2017 impairments of $186 million recognized in Kazakhstan due to the classification of the CHPs and HPPs as held-for-sale and $296 million in the U.S. as a result of the decision to sell the DPL peaker assets and a decline in forward pricing at Laurel Mountain, partially offset by a 2018 impairment of $157 million due to decreased future cash flows and the decision to sell Shady Point.
See Note 22—Asset Impairment Expense included in Item 8.—Financial Statements and Supplementary Data of this Form 10-K for further information.
Foreign currency transaction gains (losses)
Foreign currency transaction gains (losses) in millions were as follows:
Years Ended December 31, | 2019 | 2018 | 2017 | ||||||||
Argentina (1) | $ | (73 | ) | $ | (71 | ) | $ | 1 | |||
Corporate | (1 | ) | 11 | 3 | |||||||
Other | 7 | (12 | ) | 38 | |||||||
Total (2) | $ | (67 | ) | $ | (72 | ) | $ | 42 | |||
_____________________________
(1) | Primarily associated with the peso-denominated energy receivable indexed to the USD through the FONINVEMEM agreement which is considered a foreign currency derivative. See Note 7—Financing Receivables included in Item 8.—Financial Statements and Supplementary Data of this Form 10-K for further information. |
(2) | Includes losses of $31 million, gains of $23 million, and losses of $21 million on foreign currency derivative contracts for the years ended December 31, 2019, 2018 and 2017, respectively. |
The Company recognized net foreign currency transaction losses of $67 million for the year ended December 31, 2019, primarily driven by unrealized losses on foreign currency derivatives related to government receivables in Argentina and unrealized losses associated with the devaluation of long-term receivables denominated in the Argentine peso.
The Company recognized net foreign currency transaction losses of $72 million for the year ended December 31, 2018, primarily due to the devaluation of long-term receivables denominated in Argentine pesos, partially offset by gains at the Parent Company related to foreign currency derivatives.
The Company recognized net foreign currency transaction gains of $42 million for the year ended December 31, 2017 primarily driven by transactions associated with VAT activity in Mexico, the amortization of frozen embedded derivatives in the Philippines, and appreciation of the Euro in Bulgaria. These gains were partially offset by foreign currency derivative losses in Colombia due to a change in functional currency.
Other non-operating expense
Other non-operating expense was $92 million in 2019 due to the other-than-temporary impairment of the OPGC equity method investment as a result of the estimated market value of the Company's investment and other negative developments impacting future expected cash flows at the investee.
Other non-operating expense was $147 million in 2018 primarily due to the $144 million other-than-temporary impairment of the Guacolda equity method investment as a result of increased renewable generation in Chile lowering energy prices and impacting the ability of Guacolda to re-contract its existing PPAs after they expire.
There were no significant other non-operating expenses in 2017.
85 | 2019 Annual Report | |
See Note 8—Investments in and Advances to Affiliates included in Item 8.—Financial Statements and Supplementary Data of this Form 10-K for further information.
Income tax expense
Income tax expense decreased $356 million to $352 million in 2019 as compared to $708 million for 2018. The Company's effective tax rate was 35% for both years ended December 31, 2019 and 2018.
The 2019 effective tax rate was impacted by the nondeductible losses on the sale of the Company's entire 100% interest in the Kilroot coal and oil-fired plant and energy storage facility and the Ballylumford gas-fired plant in the United Kingdom and associated asset impairments during the second quarter. Further impacting the 2019 effective tax rate were the effects of the Argentine peso devaluation to tax expense, as well as to pretax income for nondeductible unrealized losses on foreign currency derivatives related to government receivables in Argentina. The 2018 effective tax rate was impacted by the increase in the Staff Accounting Bulletin No.118 ("SAB 118") adjustment with respect to the estimate of the one-time transition tax and deferred tax remeasurement under the TCJA. This impact was partially offset by the impact of the sale of the Company’s entire 51% equity interest in Masinloc. See Note 25— Held-for-Sale and Dispositions and Note 23—Income Taxes included in Item 8.—Financial Statements and Supplementary Data of this Form 10-K for details and impacts of the sales.
Income tax expense decreased $282 million to $708 million in 2018 as compared to $990 million for 2017. The Company's effective tax rates were 35% and 128% for the years ended December 31, 2018 and 2017, respectively.
The net decrease in the 2018 effective tax rate was primarily due to greater 2017 impacts related to U.S. tax reform one-time transition tax and remeasurement of deferred tax assets, relative to the 2018 U.S. tax reform impact to adjust the provisional estimate recorded under SAB 118, which provides SEC guidance on the application of the accounting standards for the initial enactment impacts of the TCJA. This net decrease was also attributable to the impact of the sale of the Company's entire 51% equity interest in Masinloc, offset by taxation of our foreign subsidiaries under U.S. GILTI rules.
Our effective tax rate reflects the tax effect of significant operations outside the U.S., which are generally taxed at rates different than the U.S. statutory rate. Foreign earnings may be taxed at rates higher than the U.S. corporate rate of 21% and are also subject to current U.S. taxation under the GILTI rules introduced by the TCJA. A future proportionate change in the composition of income before income taxes from foreign and domestic tax jurisdictions could impact our periodic effective tax rate. The Company also benefits from reduced tax rates in certain countries as a result of satisfying specific commitments regarding employment and capital investment. See Note 23—Income Taxes included in Item 8.—Financial Statements and Supplementary Data of this Form 10-K for additional information regarding these reduced rates.
Net equity in earnings (losses) of affiliates
Net equity in earnings of affiliates decreased $211 million to losses of $172 million in 2019, compared to earnings of $39 million in 2018. This was primarily driven by a $158 million decrease in earnings due to a long-lived asset impairment at Guacolda, a $19 million decrease in earnings at OPGC due to a contract termination charge, and a $20 million decrease in earnings at sPower due to the impairment of certain development projects.
Net equity in earnings of affiliates decreased $32 million, or 45%, to $39 million for 2018, compared to $71 million for 2017 primarily due to losses at Fluence, which was formed in the first quarter of 2018, decreased income at Guacolda, and larger gains on projects that achieved commercial operations in 2017 than in 2018 at sPower, which was purchased in the third quarter of 2017.
See Note 8—Investments In and Advances to Affiliates included in Item 8.—Financial Statements and Supplementary Data of this Form 10-K for further information.
Net income (loss) from discontinued operations
Net loss from discontinued operations was $1 million for the year ended December 31, 2019. Net income from discontinued operations was $216 million for the year ended December 31, 2018 primarily due to the after-tax gain on sale of Eletropaulo of $199 million recognized in the second quarter of 2018 and the recognition of a $26 million deferred gain upon liquidation of Borsod in October 2018.
Net loss from discontinued operations was $629 million for the year ended December 31, 2017 primarily due to the after-tax loss on deconsolidation of Eletropaulo of $611 million recognized in the fourth quarter of 2017. The
86 | 2019 Annual Report | |
remaining loss was due to a loss contingency recognized by our equity affiliate, partially offset by the income from operations of Eletropaulo prior to the date of deconsolidation.
See Note 24—Discontinued Operations included in Item 8.—Financial Statements and Supplementary Data of this Form 10-K for further information.
Net income attributable to noncontrolling interests and redeemable stock of subsidiaries
Net income attributable to noncontrolling interests and redeemable stock of subsidiaries decreased $187 million, or 52%, to $175 million in 2019, compared to $362 million in 2018. This decrease was primarily due to:
• | Prior year gains on sales of Electrica Santiago and CTNG in Chile; |
• | Lower earnings in Chile primarily due to current year long-lived asset impairment at Guacolda, losses on extinguishment of debt and lower contracted energy sales and prices; |
• | HLBV allocation of losses to noncontrolling interests at Distributed Energy as a result of renewable projects reaching COD in 2019; and |
• | Lower earnings in Panama primarily due to lower hydrology and the outage at Changuinola as a result of upgrading the tunnel lining. |
These decreases were partially offset by:
• | Prior year other-than-temporary impairment of Guacolda. |
Net income attributable to noncontrolling interests and redeemable stock of subsidiaries decreased $22 million, or 6%, to $362 million in 2018, compared to $384 million in 2017. This decrease was primarily due to:
• | Other-than-temporary impairment of Guacolda; |
• | Favorable impact of a legal settlement at Uruguaiana in 2017; and |
• | Lower earnings due to deconsolidation of Eletropaulo in November 2017 and the sale of Masinloc in March 2018. |
These decreases were partially offset by:
• | Gains on sales of Electrica Santiago and CTNG in Chile; |
• | Higher earnings in Colombia primarily due to higher contract sales and prices; and |
• | Higher earnings in Vietnam due to the adoption of the new revenue recognition standard. |
Net income attributable to The AES Corporation
Net income attributable to The AES Corporation decreased $900 million, or 75%, to $303 million in 2019, compared to $1,203 million in 2018. This decrease was primarily due to:
• | Prior year gains on the sales of Masinloc, Eletropaulo (reflected within discontinued operations), CTNG and Electrica Santiago, net of tax; |
• | Current year long-lived asset impairments at Guacolda, Hawaii, Kilroot and Ballylumford, and other-than-temporary impairment at OPGC; |
• | Current year loss on sale at Kilroot and Ballylumford; |
• | Current year losses on extinguishment of debt at DPL, AES Gener, Mong Duong and Colon; |
• | Current year losses recognized at commencement of sales-type leases at Distributed Energy; |
• | The impact of sold businesses in our Eurasia SBU; |
• | Lower margins at Argentina and Chile, primarily due to lower generation; and |
• | Lower margins at Changuinola, driven by the outage as a result of upgrading the tunnel lining and lower hydrology in Panama. |
These decreases were partially offset by:
• | Prior year income tax expense to finalize the initial impact of U.S. tax reform enacted in December 2017; |
• | Prior year loss on extinguishment of debt at the Parent Company; |
• | Prior year long-lived asset impairments at Shady Point and Nejapa, and other-than-temporary impairment at Guacolda; |
87 | 2019 Annual Report | |
• | Current year gains on insurance proceeds associated with the lightning incident at the Andres facility in 2018 and the Changuinola tunnel leak; |
• | Current year gain on sale of a portion of our interest in sPower’s operating assets and gain on disposal of Stuart and Killen at DPL; and |
• | Higher earnings at our US and Utilities SBU, primarily as a result of renewable projects that came online in the current year. |
Net income attributable to The AES Corporation increased $2,364 million to $1,203 million in 2018, compared to a loss of $1,161 million in 2017. This increase was primarily due to:
• | Gains on the sales of Masinloc, Eletropaulo (reflected within discontinued operations), CTNG, and Electrica Santiago in 2018, and losses on the sales of Kazakhstan CHPs and HPPs in 2017; |
• | Loss on deconsolidation of Eletropaulo (reflected within discontinued operations) in 2017; |
• | Impact of U.S. tax reform enacted in December 2017; |
• | Asset impairments at DPL, Laurel Mountain and in Kazakhstan in 2017; |
• | Lower interest expense at the Parent Company and Gener; and |
• | Higher margins at our South America, MCAC and US and Utilities SBUs. |
These increases were partially offset by:
• | Higher tax expense in 2018 due to the new GILTI rules in the U.S.; |
• | Asset impairment at Shady Point and other-than-temporary impairment of Guacolda; |
• | Higher losses on extinguishment of debt; |
• | Foreign exchange losses in 2018 primarily due to the devaluation of the Argentine peso and foreign currency gains in 2017; |
• | Favorable impact of a legal settlement at Uruguaiana in 2017; and |
• | Lower margins at our Eurasia SBU as a result of the sales of Masinloc and Kazakhstan. |
SBU Performance Analysis
Segments
We are organized into four market-oriented SBUs: US and Utilities (United States, Puerto Rico and El Salvador); South America (Chile, Colombia, Argentina and Brazil); MCAC (Mexico, Central America and the Caribbean); and Eurasia (Europe and Asia).
Non-GAAP Measures
Adjusted Operating Margin, Adjusted PTC and Adjusted EPS are non-GAAP supplemental measures that are used by management and external users of our Consolidated Financial Statements such as investors, industry analysts and lenders.
For the year ended December 31, 2019, the Company changed the definitions of Adjusted PTC and Adjusted EPS to exclude gains and losses recognized at commencement of sales-type leases. We believe these transactions are economically similar to sales of business interests and excluding these gains or losses better reflects the underlying business performance of the Company.
Adjusted Operating Margin
We define Adjusted Operating Margin as Operating Margin, adjusted for the impact of NCI, excluding (a) unrealized gains or losses related to derivative transactions; (b) benefits and costs associated with dispositions and acquisitions of business interests, including early plant closures; and (c) costs directly associated with a major restructuring program, including, but not limited to, workforce reduction efforts, relocations and office consolidation. The allocation of HLBV earnings to noncontrolling interests is not adjusted out of Adjusted Operating Margin. See Review of Consolidated Results of Operations for definitions of Operating Margin and cost of sales.
The GAAP measure most comparable to Adjusted Operating Margin is Operating Margin. We believe that Adjusted Operating Margin better reflects the underlying business performance of the Company. Factors in this determination include the impact of NCI, where AES consolidates the results of a subsidiary that is not wholly
88 | 2019 Annual Report | |
owned by the Company, as well as the variability due to unrealized gains or losses related to derivative transactions and strategic decisions to dispose of or acquire business interests. Adjusted Operating Margin should not be construed as an alternative to Operating Margin, which is determined in accordance with GAAP.
Reconciliation of Adjusted Operating Margin (in millions) | Years Ended December 31, | ||||||||||
2019 | 2018 | 2017 | |||||||||
Operating Margin | $ | 2,349 | $ | 2,573 | $ | 2,465 | |||||
Noncontrolling interests adjustment (1) | (670 | ) | (686 | ) | (689 | ) | |||||
Unrealized derivative losses | 11 | 19 | (5 | ) | |||||||
Disposition/acquisition losses | 15 | 21 | 22 | ||||||||
Restructuring costs (2) | — | 1 | 22 | ||||||||
Total Adjusted Operating Margin | $ | 1,705 | $ | 1,928 | $ | 1,815 | |||||
_____________________________
(1) | The allocation of HLBV earnings to noncontrolling interests is not adjusted out of Adjusted Operating Margin. |
(2) | In February 2018, the Company announced a reorganization as a part of its ongoing strategy to simplify its portfolio, optimize its cost structure and reduce its carbon intensity. |

Adjusted PTC
We define Adjusted PTC as pre-tax income from continuing operations attributable to The AES Corporation excluding gains or losses of the consolidated entity due to (a) unrealized gains or losses related to derivative transactions and equity securities; (b) unrealized foreign currency gains or losses; (c) gains, losses, benefits and costs associated with dispositions and acquisitions of business interests, including early plant closures, and gains and losses recognized at commencement of sales-type leases; (d) losses due to impairments; (e) gains, losses and costs due to the early retirement of debt; and (f) costs directly associated with a major restructuring program, including, but not limited to, workforce reduction efforts, relocations and office consolidation. Adjusted PTC also includes net equity in earnings of affiliates on an after-tax basis adjusted for the same gains or losses excluded from consolidated entities.
Adjusted PTC reflects the impact of NCI and excludes the items specified in the definition above. In addition to the revenue and cost of sales reflected in Operating Margin, Adjusted PTC includes the other components of our Consolidated Statement of Operations, such as general and administrative expenses in the Corporate segment, as well as business development costs, interest expense and interest income, other expense and other income, realized foreign currency transaction gains and losses, and net equity in earnings of affiliates.
The GAAP measure most comparable to Adjusted PTC is income from continuing operations attributable to The AES Corporation. We believe that Adjusted PTC better reflects the underlying business performance of the Company and is the most relevant measure considered in the Company's internal evaluation of the financial performance of its segments. Factors in this determination include the variability due to unrealized gains or losses related to derivative transactions or equity securities remeasurement, unrealized foreign currency gains or losses, losses due to impairments and strategic decisions to dispose of or acquire business interests, retire debt or implement restructuring initiatives, which affect results in a given period or periods. In addition, Adjusted PTC represents the business performance of the Company before the application of statutory income tax rates and tax adjustments, including the effects of tax planning, corresponding to the various jurisdictions in which the Company
89 | 2019 Annual Report | |
operates. Given its large number of businesses and complexity, the Company concluded that Adjusted PTC is a more transparent measure that better assists investors in determining which businesses have the greatest impact on the Company's results.
Adjusted PTC should not be construed as an alternative to income from continuing operations attributable to The AES Corporation, which is determined in accordance with GAAP.
Reconciliation of Adjusted PTC (in millions) | Years Ended December 31, | ||||||||||
2019 | 2018 | 2017 | |||||||||
Income (loss) from continuing operations, net of tax, attributable to The AES Corporation | $ | 302 | $ | 985 | $ | (507 | ) | ||||
Income tax expense attributable to The AES Corporation | 250 | 563 | 828 | ||||||||
Pre-tax contribution | 552 | 1,548 | 321 | ||||||||
Unrealized derivative and equity securities losses (gains) | 113 | 33 | (3 | ) | |||||||
Unrealized foreign currency losses (gains) | 36 | 51 | (59 | ) | |||||||
Disposition/acquisition losses (gains) | 12 | (934 | ) | 123 | |||||||
Impairment expense | 406 | 307 | 542 | ||||||||
Loss on extinguishment of debt | 121 | 180 | 62 | ||||||||
Restructuring costs (1) | — | — | 31 | ||||||||
Total Adjusted PTC | $ | 1,240 | $ | 1,185 | $ | 1,017 | |||||
_____________________________
(1) | In February 2018, the Company announced a reorganization as a part of its ongoing strategy to simplify its portfolio, optimize its cost structure and reduce its carbon intensity. |
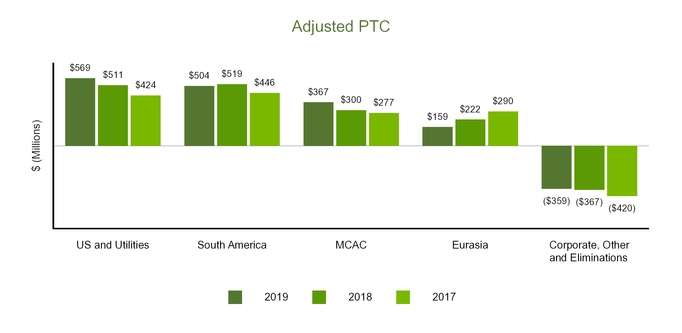
Adjusted EPS
We define Adjusted EPS as diluted earnings per share from continuing operations excluding gains or losses of both consolidated entities and entities accounted for under the equity method due to (a) unrealized gains or losses related to derivative transactions and equity securities; (b) unrealized foreign currency gains or losses; (c) gains, losses, benefits and costs associated with dispositions and acquisitions of business interests, including early plant closures, the tax impact from the repatriation of sales proceeds, and gains and losses recognized at commencement of sales-type leases; (d) losses due to impairments; (e) gains, losses and costs due to the early retirement of debt; (f) costs directly associated with a major restructuring program, including, but not limited to, workforce reduction efforts, relocations and office consolidation; and (g) tax benefit or expense related to the enactment effects of 2017 U.S. tax law reform and related regulations and any subsequent period adjustments related to enactment effects.
The GAAP measure most comparable to Adjusted EPS is diluted earnings per share from continuing operations. We believe that Adjusted EPS better reflects the underlying business performance of the Company and is considered in the Company's internal evaluation of financial performance. Factors in this determination include the variability due to unrealized gains or losses related to derivative transactions or equity securities
90 | 2019 Annual Report | |
remeasurement, unrealized foreign currency gains or losses, losses due to impairments and strategic decisions to dispose of or acquire business interests, retire debt or implement restructuring initiatives, which affect results in a given period or periods. Adjusted EPS should not be construed as an alternative to diluted earnings per share from continuing operations, which is determined in accordance with GAAP.
The Company reported a loss from continuing operations of $0.77 per share for the year ended December 31, 2017. For purposes of measuring diluted loss per share under GAAP, common stock equivalents were excluded from weighted average shares as their inclusion would be anti-dilutive. However, for purposes of computing Adjusted EPS, the Company has included the impact of anti-dilutive common stock equivalents. The table below reconciles the weighted average shares used in GAAP diluted loss per share to the weighted average shares used in calculating the non-GAAP measure of Adjusted EPS. No reconciliation is necessary for the years ended December 31, 2019 and 2018 as the Company reported income from continuing operations.
Reconciliation of Denominator Used For Adjusted Earnings Per Share | Year Ended December 31, 2017 | ||||||||||
(in millions, except per share data) | Loss | Shares | $ per share | ||||||||
GAAP DILUTED LOSS PER SHARE | |||||||||||
Loss from continuing operations attributable to The AES Corporation common stockholders | $ | (507 | ) | 660 | $ | (0.77 | ) | ||||
EFFECT OF ANTI-DILUTIVE SECURITIES | |||||||||||
Restricted stock units | — | 2 | 0.01 | ||||||||
NON-GAAP DILUTED LOSS PER SHARE | $ | (507 | ) | 662 | $ | (0.76 | ) | ||||
Reconciliation of Adjusted EPS | Years Ended December 31, | |||||||||||
2019 | 2018 | 2017 | ||||||||||
Diluted earnings (loss) per share from continuing operations | $ | 0.45 | $ | 1.48 | $ | (0.76 | ) | |||||
Unrealized derivative and equity securities losses | 0.17 | (1) | 0.05 | — | ||||||||
Unrealized foreign currency losses (gains) | 0.05 | (2) | 0.09 | (3) | (0.10 | ) | ||||||
Disposition/acquisition losses (gains) | 0.02 | (4) | (1.41 | ) | (5) | 0.19 | (6) | |||||
Impairment expense | 0.61 | (7) | 0.46 | (8) | 0.82 | (9) | ||||||
Loss on extinguishment of debt | 0.18 | (10) | 0.27 | (11) | 0.09 | (12) | ||||||
Restructuring costs | — | — | 0.05 | |||||||||
U.S. Tax Law Reform Impact | (0.01 | ) | 0.18 | (13) | 1.08 | (14) | ||||||
Less: Net income tax expense (benefit) | (0.11 | ) | (15) | 0.12 | (16) | (0.29 | ) | (17) | ||||
Adjusted EPS | $ | 1.36 | $ | 1.24 | $ | 1.08 | ||||||
_____________________________
(1) | Amount primarily relates to unrealized derivative losses in Argentina of $89 million, or $0.13 per share, mainly associated with foreign currency derivatives on government receivables. |
(2) | Amount primarily relates to unrealized FX losses in Argentina of $25 million, or $0.04 per share, mainly associated with the devaluation of long-term receivables denominated in Argentine pesos, and unrealized FX losses at the Parent Company of $12 million, or $0.02 per share, mainly associated with intercompany receivables denominated in Euro. |
(3) | Amount primarily relates to unrealized FX losses of $22 million, or $0.03 per share, associated with the devaluation of long-term receivables denominated in Argentine pesos, and unrealized FX losses of $14 million, or $0.02 per share, on intercompany receivables denominated in Euro and British pounds at the Parent Company. |
(4) | Amount primarily relates to losses recognized at commencement of sales-type leases at Distributed Energy of $36 million, or $0.05 per share, and loss on sale of Kilroot and Ballylumford of $31 million, or $0.05 per share; partially offset by gain on sale of a portion of our interest in sPower’s operating assets of $28 million, or $0.04 per share, gain on disposal of Stuart and Killen at DPL of $20 million, or $0.03 per share, and gain on sale of ownership interest in Simple Energy as part of the Uplight merger of $12 million, or $0.02 per share. |
(5) | Amount primarily relates to gain on sale of Masinloc of $772 million, or $1.16 per share, gain on sale of CTNG of $86 million, or $0.13 per share, gain on sale of Electrica Santiago of $36 million, or $0.05 per share, gain on remeasurement of contingent consideration at AES Oahu of $32 million, or $0.05 per share, gain on sale related to the Company's contribution of AES Advancion energy storage to the Fluence joint venture of $23 million, or $0.03 per share, and realized derivative gains associated with the sale of Eletropaulo of $21 million, or $0.03 per share; partially offset by loss on disposal of the Beckjord facility and additional shutdown costs related to Stuart and Killen at DPL of $21 million, or $0.03 per share. |
(6) | Amount primarily relates to loss on sale of Kazakhstan CHPs of $49 million, or $0.07 per share, realized derivative losses associated with the sale of Sul of $38 million, or $0.06 per share, loss on sale of Kazakhstan HPPs of $33 million, or $0.05 per share, and costs associated with early plant closures at DPL of $24 million, or $0.04 per share; partially offset by gain on Masinloc contingent consideration of $23 million, or $0.03 per share, and gain on sale of Miami Fort and Zimmer of $13 million, or $0.02 per share. |
(7) | Amount primarily relates to asset impairments at Kilroot and Ballylumford of $115 million, or $0.17 per share, and Hawaii of $60 million, or $0.09 per share; impairments at our Guacolda and sPower equity affiliates, impacting equity earnings by $105 million, or $0.16 per share, and $21 million, or $0.03 per share, respectively; and other-than-temporary impairment of OPGC of $92 million, or $0.14 per share. |
(8) | Amount primarily relates to asset impairments at Shady Point of $157 million, or $0.24 per share, and Nejapa of $37 million, or $0.06 per share, and other-than-temporary impairment of Guacolda of $96 million, or $0.14 per share. |
(9) | Amount primarily relates to asset impairments at Kazakhstan CHPs of $94 million, or $0.14 per share, Kazakhstan HPPs of $92 million, or $0.14 per share, Laurel Mountain of $121 million, or $0.18 per share, DPL of $175 million, or $0.27 per share, and Kilroot of $37 million, or $0.05 per share. |
(10) | Amount primarily relates to losses on early retirement of debt at DPL of $45 million, or $0.07 per share, AES Gener of $35 million, or $0.05 per share, Mong Duong of $17 million, or $0.03 per share, and Colon of $14 million, or $0.02 per share. |
(11) | Amount primarily relates to loss on early retirement of debt at the Parent Company of $171 million, or $0.26 per share. |
91 | 2019 Annual Report | |
(12) | Amount primarily relates to losses on early retirement of debt at the Parent Company of $92 million, or $0.14 per share, AES Gener of $20 million, or $0.02 per share, and IPALCO of $9 million, or $0.01 per share; partially offset by a gain on early retirement of debt at AES Argentina of $65 million, or $0.10 per share. |
(13) | Amount relates to a SAB 118 charge to finalize the provisional estimate of one-time transition tax on foreign earnings of $194 million, or $0.29 per share, partially offset by a SAB 118 income tax benefit to finalize the provisional estimate of remeasurement of deferred tax assets and liabilities to the lower corporate tax rate of $77 million, or $0.11 per share. |
(14) | Amount relates to a one-time transition tax on foreign earnings of $675 million, or $1.02 per share, and the remeasurement of deferred tax assets and liabilities to the lower corporate tax rate of $39 million, or $0.06 per share. |
(15) | Amount primarily relates to the income tax benefits associated with the impairments at OPGC of $23 million, or $0.03 per share, Guacolda of $13 million, or $0.02 per share, Hawaii of $13 million, or $0.02 per share, and Kilroot and Ballylumford of $11 million, or $0.02 per share, and income tax benefits associated with losses on early retirement of debt of $24 million, or $0.04 per share; partially offset by an adjustment to income tax expense related to 2018 gains on sales of business interests, primarily Masinloc, of $25 million, or $0.04 per share. |
(16) | Amount primarily relates to the income tax expense under the GILTI provision associated with the gains on sales of business interests, primarily Masinloc, of $97 million, or $0.15 per share, and income tax expense associated with gains on sale of CTNG of $36 million, or $0.05 per share, and Electrica Santiago of $13 million, or $0.02 per share; partially offset by income tax benefits associated with the loss on early retirement of debt at the Parent Company of $36 million, or $0.05 per share, and income tax benefits associated with the impairment at Shady Point of $33 million, or $0.05 per share. |
(17) | Amount primarily relates to the income tax benefits associated with asset impairments of $148 million, or $0.22 per share. |
US and Utilities SBU
The following table summarizes Operating Margin, Adjusted Operating Margin and Adjusted PTC (in millions) for the periods indicated:
For the Years Ended December 31, | 2019 | 2018 | 2017 | $ Change 2019 vs. 2018 | % Change 2019 vs. 2018 | $ Change 2018 vs. 2017 | % Change 2018 vs. 2017 | |||||||||||||||||||
Operating Margin | $ | 754 | $ | 733 | $ | 693 | $ | 21 | 3 | % | $ | 40 | 6 | % | ||||||||||||
Adjusted Operating Margin (1) | 659 | 678 | 623 | (19 | ) | -3 | % | 55 | 9 | % | ||||||||||||||||
Adjusted PTC (1) | 569 | 511 | 424 | 58 | 11 | % | 87 | 21 | % | |||||||||||||||||
_____________________________
(1) | A non-GAAP financial measure, adjusted for the impact of NCI. See SBU Performance Analysis—Non-GAAP Measures for definition and Item 1.—Business for the respective ownership interest for key businesses. |
Fiscal year 2019 versus 2018
Operating Margin increased $21 million, or 3%, which was driven primarily by the following (in millions):
Increase at IPL primarily driven by higher retail rates following the 2018 rate order, partially offset by lower volumes due to unfavorable weather and higher maintenance expense related to distribution line clearance | $ | 59 | |
Increase at DPL due to the 2018 distribution rate order, including the decoupling rider which is designed to eliminate the impacts of weather and demand, partially offset by changes to DPL's ESP | 22 | ||
Decrease due to the sale and closure of generation facilities at Shady Point and DPL, including cost recoveries from DPL's joint owners of Stuart and Killen | (47 | ) | |
Increase of rock ash disposal in Puerto Rico | (23 | ) | |
Other | 10 | ||
Total US and Utilities SBU Operating Margin Increase | $ | 21 | |
Adjusted Operating Margin decreased $19 million primarily due to the drivers above, adjusted for NCI and excluding unrealized gains and losses on derivatives and costs and benefits associated with early plant closures.
Adjusted PTC increased $58 million, primarily driven by an increase in earnings attributable to AES as a result of contributions from new renewable projects and lower interest expense at DPL, partially offset by the decrease in Adjusted Operating Margin described above and a decrease in AFUDC for the Eagle Valley CCGT project at IPL.
92 | 2019 Annual Report | |
Fiscal year 2018 versus 2017
Operating Margin increased $40 million, or 6%, which was driven primarily by the following (in millions):
Increase at DPL primarily due to higher regulated rates following the approval of the 2017 ESP and the 2018 distribution rate order and favorable weather | $ | 35 | |
Increase at DPL driven by a one-time credit to depreciation expense, primarily as a result of a reduction in the ARO liability at DPL's closed plants, Stuart and Killen | 32 | ||
Increase at IPL due to higher wholesale margins driven by Eagle Valley coming online and higher retail margins due to favorable weather | 23 | ||
Increase at Southland driven by higher market energy sales, partially offset by a decrease in capacity sales and lower ancillary services due to the expiration of long-term agreements | 12 | ||
Decrease at Hawaii primarily due to higher coal prices and lower gain on valuation of MTM commodity swaps | (24 | ) | |
Decrease at IPL due to higher maintenance expense due to increased current year outages | (21 | ) | |
Impact of the sale and closure of generation plants at DPL | (12 | ) | |
Other | (5 | ) | |
Total US and Utilities SBU Operating Margin Increase | $ | 40 | |
Adjusted Operating Margin increased $55 million primarily due to the drivers above, adjusted for a $24 million unrealized loss on coal derivatives in Hawaii, partially offset by restructuring charges in the prior year.
Adjusted PTC increased $87 million, primarily driven by the increase in Adjusted Operating Margin described above, as well as an increase in the Company's share of earnings at Distributed Energy due to new solar project growth, lower interest expense, and the HLBV allocation of noncontrolling interest earnings at Buffalo Gap, partially offset by lower allowance for equity funds used during construction at IPALCO.
South America SBU
The following table summarizes Operating Margin, Adjusted Operating Margin and Adjusted PTC (in millions) for the periods indicated:
For the Years Ended December 31, | 2019 | 2018 | 2017 | $ Change 2019 vs. 2018 | % Change 2019 vs. 2018 | $ Change 2018 vs. 2017 | % Change 2018 vs. 2017 | |||||||||||||||||||
Operating Margin | $ | 873 | $ | 1,017 | $ | 862 | $ | (144 | ) | -14 | % | $ | 155 | 18 | % | |||||||||||
Adjusted Operating Margin (1) | 499 | 612 | 500 | (113 | ) | -18 | % | 112 | 22 | % | ||||||||||||||||
Adjusted PTC (1) | 504 | 519 | 446 | (15 | ) | -3 | % | 73 | 16 | % | ||||||||||||||||
_____________________________
(1) | A non-GAAP financial measure, adjusted for the impact of NCI. See SBU Performance Analysis—Non-GAAP Measures for definition and Item 1.—Business for the respective ownership interest for key businesses. |
Fiscal year 2019 versus 2018
Operating Margin decreased $144 million, or 14%, which was driven primarily by the following (in millions):
Decrease in Argentina primarily driven by lower generation and lower energy and capacity prices as defined by resolution 1/2019, which modified generators' remuneration schemes | $ | (59 | ) |
Decrease due to the depreciation of the Colombian peso and Brazilian real against the USD, offset by savings in fixed costs as a result of the depreciation of the Argentine peso | (38 | ) | |
Decrease in Chile primarily due to lower contracted energy sales and lower efficient plant availability, partially offset by lower spot prices on energy purchases | (30 | ) | |
Decrease due to the sale of Electrica Santiago and the transmission lines in 2018 | (21 | ) | |
Decrease in Chile primarily due to higher fixed costs associated with IT initiatives and realized FX losses related to forward instruments, partially offset by savings on employee expenses | (11 | ) | |
Decrease in Tietê primarily driven by lower spot sales and prices, partially offset by higher contracted energy sales | (10 | ) | |
Increase in Colombia due to higher spot prices primarily driven by drier system hydrology | 30 | ||
Increase in Tietê due to new solar plants in operation | 10 | ||
Other | (15 | ) | |
Total South America SBU Operating Margin Decrease | $ | (144 | ) |
Adjusted Operating Margin decreased $113 million primarily due to the drivers above, adjusted for NCI.
Adjusted PTC decreased $15 million, mainly driven by the decrease in Adjusted Operating Margin described above, partially offset by realized FX gains in Argentina and Chile in 2019 as compared to losses in 2018, and higher equity earnings in 2019 related to better operating results at Guacolda.
93 | 2019 Annual Report | |
Fiscal year 2018 versus 2017
Operating Margin increased $155 million, or 18%, which was driven primarily by the following (in millions):
Increase in Argentina mainly related to higher capacity prices resulting from market reforms enacted in 2017 and lower fixed costs primarily due to the devaluation of the Argentine peso | $ | 71 | |
Increase in Colombia mainly related to higher contract pricing in 2018 and higher generation | 64 | ||
Margin on new PPAs in Chile at Gener, Angamos and Cochrane | 50 | ||
Lower fixed costs at Gener associated with planned maintenance performed in Q3 2017 | 21 | ||
Impact of the sale of Electrica Santiago | (38 | ) | |
Lower contract sales to distribution companies in Chile, net of higher revenue associated with a contract termination | (24 | ) | |
Other | 11 | ||
Total South America SBU Operating Margin Increase | $ | 155 | |
Adjusted Operating Margin increased $112 million primarily due to the drivers above, adjusted for NCI.
Adjusted PTC increased $73 million, mainly due to the increase in Adjusted Operating Margin described above and lower interest in Chile, partially offset by a $28 million decrease associated with a gain recognized in the prior year from the settlement of a legal dispute with YPF at Uruguaiana, higher interest expense in Brazil, lower equity earnings in Chile and higher realized foreign currency losses in Argentina.
MCAC SBU
The following table summarizes Operating Margin, Adjusted Operating Margin and Adjusted PTC (in millions) for the periods indicated:
For the Years Ended December 31, | 2019 | 2018 | 2017 | $ Change 2019 vs. 2018 | % Change 2019 vs. 2018 | $ Change 2018 vs. 2017 | % Change 2018 vs. 2017 | |||||||||||||||||||
Operating Margin | $ | 487 | $ | 534 | $ | 465 | $ | (47 | ) | -9 | % | $ | 69 | 15 | % | |||||||||||
Adjusted Operating Margin (1) | 352 | 391 | 358 | (39 | ) | -10 | % | 33 | 9 | % | ||||||||||||||||
Adjusted PTC (1) | 367 | 300 | 277 | 67 | 22 | % | 23 | 8 | % | |||||||||||||||||
_____________________________
(1) | A non-GAAP financial measure, adjusted for the impact of NCI. See SBU Performance Analysis—Non-GAAP Measures for definition and Item 1.—Business for the respective ownership interest for key businesses. |
Fiscal year 2019 versus 2018
Operating Margin decreased $47 million, or 9%, which was driven primarily by the following (in millions):
Lower availability due to the outage of Changuinola for the tunnel lining upgrade | $ | (123 | ) |
Lower availability driven by lower hydrology in Panama | (40 | ) | |
Decrease in Dominican Republic due to lower energy prices | (18 | ) | |
Lower energy costs and business interruption insurance recovered due to the lightning incident at the Andres facility in 2018 | 45 | ||
Higher contract sales at Panama mainly driven by contract renewals at higher prices | 41 | ||
Higher sales at Panama driven by the commencement of operations at the Colon combined cycle facility in September 2018 | 40 | ||
Increase in Mexico due to pension plan pass-through adjustment | 12 | ||
Other | (4 | ) | |
Total MCAC SBU Operating Margin Decrease | $ | (47 | ) |
Adjusted Operating Margin decreased $39 million primarily due to the drivers above, adjusted for NCI.
Adjusted PTC increased $67 million, mainly driven by the insurance recoveries associated with property damage at Andres and Changuinola, partially offset by a decrease in Adjusted Operating Margin described above.
94 | 2019 Annual Report | |
Fiscal year 2018 versus 2017
Operating Margin increased $69 million, or 15%, which was driven primarily by the following (in millions):
Increase in Dominican Republic due to higher spot prices | $ | 32 | |
Higher contracted energy sales in Panama mainly driven by the commencement of operations at the Colon combined cycle facility in September 2018 | 21 | ||
Higher availability driven by improved hydrology in Panama | 17 | ||
Higher contracted energy sales in Dominican Republic mainly driven by the commencement of operations at the Los Mina combined cycle facility in June 2017 and lower forced maintenance outages | 12 | ||
Decrease in Mexico due to pension plan pass-through adjustments and higher fuel costs | (8 | ) | |
Other | (5 | ) | |
Total MCAC SBU Operating Margin Increase | $ | 69 | |
Adjusted Operating Margin increased $33 million primarily due to the drivers above, adjusted for NCI.
Adjusted PTC increased $23 million, mainly driven by the increase in Adjusted Operating Margin as described above, partially offset by lower capitalized interest due to project completions in Panama and Dominican Republic and lower foreign currency gains in Mexico.
Eurasia SBU
The following table summarizes Operating Margin, Adjusted Operating Margin and Adjusted PTC (in millions) for the periods indicated:
For the Years Ended December 31, | 2019 | 2018 | 2017 | $ Change 2019 vs. 2018 | % Change 2019 vs. 2018 | $ Change 2018 vs. 2017 | % Change 2018 vs. 2017 | |||||||||||||||||||
Operating Margin | $ | 188 | $ | 227 | $ | 422 | $ | (39 | ) | -17 | % | $ | (195 | ) | -46 | % | ||||||||||
Adjusted Operating Margin (1) | 148 | 194 | 306 | (46 | ) | -24 | % | (112 | ) | -37 | % | |||||||||||||||
Adjusted PTC (1) | 159 | 222 | 290 | (63 | ) | -28 | % | (68 | ) | -23 | % | |||||||||||||||
_____________________________
(1) | A non-GAAP financial measure, adjusted for the impact of NCI. See SBU Performance Analysis—Non-GAAP Measures for definition and Item 1.—Business for the respective ownership interest for key businesses. |
Fiscal year 2019 versus 2018
Operating Margin decreased $39 million, or 17%, which was driven primarily by the following (in millions):
Impact of sold businesses Kilroot and Ballylumford | $ | (46 | ) |
Impact of the sale of the Masinloc power plant in March 2018 | (24 | ) | |
Lower depreciation at the Jordan plants due to their classification as held-for-sale | 20 | ||
Other | 11 | ||
Total Eurasia SBU Operating Margin Decrease | $ | (39 | ) |
Adjusted Operating Margin decreased $46 million due to the drivers above, adjusted for NCI.
Adjusted PTC decreased $63 million, driven primarily by the decrease in Adjusted Operating Margin discussed above, as well as a decrease in earnings at OPGC and the sale of Elsta, our equity affiliate in the Netherlands.
Fiscal year 2018 versus 2017
Including favorable FX impacts of $8 million, Operating Margin decreased $195 million, or 46%, which was driven primarily by the following (in millions):
Impact of the sale of the Masinloc power plant in March 2018 | $ | (122 | ) |
Impact of the sale of the Kazakhstan CHPs and the expiration of HPP concession in 2017 | (36 | ) | |
Decrease in Vietnam due to adoption of the new revenue recognition standard in 2018 and higher maintenance costs | (33 | ) | |
Other | (4 | ) | |
Total Eurasia SBU Operating Margin Decrease | $ | (195 | ) |
Adjusted Operating Margin decreased $112 million, primarily due to the drivers above, adjusted for NCI.
Adjusted PTC decreased $68 million, primarily driven by the decrease in Adjusted Operating Margin discussed above, partially offset by the positive impact in Vietnam due to increased interest income from the higher financing component of contract consideration as a result of adoption of the new revenue recognition standard in 2018.
95 | 2019 Annual Report | |
Key Trends and Uncertainties
During 2020 and beyond, we expect to face the following challenges at certain of our businesses. Management expects that improved operating performance at certain businesses, growth from new businesses, and global cost reduction initiatives may lessen or offset their impact. If these favorable effects do not occur, or if the challenges described below and elsewhere in this section impact us more significantly than we currently anticipate, or if volatile foreign currencies and commodities move more unfavorably, then these adverse factors (or other adverse factors unknown to us) may impact our operating margin, net income attributable to The AES Corporation and cash flows. We continue to monitor our operations and address challenges as they arise. For the risk factors related to our business, see Item 1.—Business and Item 1A.—Risk Factors of this Form 10-K.
Macroeconomic and Political
The macroeconomic and political environments in some countries where our subsidiaries conduct business have changed during 2019. This could result in significant impacts to tax laws and environmental and energy policies. Additionally, we operate in multiple countries and as such are subject to volatility in exchange rates at the subsidiary level. See Item 7A.—Quantitative and Qualitative Disclosures About Market Risk for further information.
Argentina — In the run up to the 2019 Presidential elections, the Argentine peso devalued significantly and the government of Argentina imposed capital controls and announced a restructuring of Argentina’s debt payments. Restrictions on the flow of capital have limited the availability of international credit, and economic conditions in Argentina have further deteriorated, triggering additional devaluation of the Argentine peso and a deterioration of the country’s risk profile.
On October 27, 2019, Alberto Fernández was elected president. The entering administration has started evaluating measures to respond to the Argentine economic crisis. On February 27, 2020, the Secretariat of Energy passed Resolution No. 31/2020 that includes the denomination of tariffs in local currency indexed by local inflation, and reductions in capacity payments received by generators. These regulatory changes are expected to have a negative impact on our financial results.
Although the situation remains unresolved, it has not had a material impact on our current exposures to date, and payments on the long-term receivables for the FONINVEMEM Agreements are current. For further information, see Note 7—Financing Receivables included in Item 8.—Financial Statements and Supplementary Data of this Form 10-K.
Chile — In October 2019, Chile saw significant protests associated with economic conditions resulting in the declaration of a state of emergency in several major cities.
In November 2019, the Chilean government enacted Law 21,185 that establishes a Stabilization Fund for regulated energy prices. Historically, the government updated the prices for regulated energy contracts every six months to reflect the indexation the contracts have to exchange rates and commodities prices. The new law freezes regulated prices and does not allow the pass-through of these contractual indexation updates to customers beyond the pricing in effect at July 1, 2019, until new lower-cost renewable contracts are incorporated into pricing in 2023. Consequently, costs incurred in excess of the July 1, 2019 price will be accumulated and borne by generators. AES Gener has deferred collection of approximately $30 million of revenue at year end. It is expected such amounts deferred will be fully repaid to generators prior to December 31, 2027. In addition, the Chilean energy ministry has not yet released regulations pursuant to this law; therefore, certain aspects of the impact of Law 21,185 are uncertain at this time.
Other initiatives to address the concerns of the protesters, including potential constitutional amendments, are under consideration by Congress and could result in regulatory changes that may affect our results of operations in Chile.
Puerto Rico — Our subsidiaries in Puerto Rico have a long-term PPA with state-owned PREPA, which has been facing economic challenges that could result in a material adverse effect on our business in Puerto Rico.
The Puerto Rico Oversight, Management, and Economic Stability Act (“PROMESA”) was enacted to create a structure for exercising federal oversight over the fiscal affairs of U.S. territories and created procedures for adjusting debt accumulated by the Puerto Rico government and, potentially, other territories (“Title III”). PROMESA also expedites the approval of key energy projects and other critical projects in Puerto Rico.
96 | 2019 Annual Report | |
PROMESA allowed for the establishment of an Oversight Board with broad powers of budgetary and financial control over Puerto Rico. The Oversight Board filed for bankruptcy on behalf of PREPA under Title III in July 2017. As a result of the bankruptcy filing, AES Puerto Rico and AES Ilumina’s non-recourse debt of $287 million and $33 million, respectively, continue to be in default and are classified as current as of December 31, 2019. The Company is in compliance with its debt payment obligations as of December 31, 2019.
The Company's receivable balances in Puerto Rico as of December 31, 2019 totaled $74 million, of which $20 million was overdue. Despite the Title III protection, PREPA has been making substantially all of its payments to the generators in line with historical payment patterns.
On January 2, 2020, the Governor of Puerto Rico signed a bill that prohibits the disposal and unencapsulated beneficial use of coal combustion residuals in Puerto Rico. Prior to this bill's approval, the Company had put in place arrangements to dispose or beneficially use its coal ash and combustion residual outside of Puerto Rico.
Significant earthquakes and subsequent aftershocks hit Puerto Rico in late December 2019 and January 2020. These events did not result in damage to our assets in Puerto Rico. We expect that AES Puerto Rico will continue to play a critical role in ensuring reliability for customers.
Considering the information available as of the filing date, Management believes the carrying amount of our long-lived assets in Puerto Rico of $538 million is recoverable as of December 31, 2019.
Reference Rate Reform — In July 2017, the UK Financial Conduct Authority announced that it intends to phase out LIBOR by the end of 2021. In the U.S., the Alternative Reference Rate Committee at the Federal Reserve identified the Secured Overnight Financing Rate ("SOFR") as its preferred alternative rate for LIBOR; alternative reference rates in other key markets are under development. AES holds a substantial amount of debt and derivative contracts referencing LIBOR as an interest rate benchmark. Although the full impact of the reform remains unknown, we have begun to engage with AES counterparties to discuss specific action items to be undertaken in order to prepare for amendments when they become due.
United States Tax Law Reform
Federal Taxes — In December 2017, the United States enacted the TCJA. The legislation significantly revised the U.S. corporate income tax system by, among other things, lowering the corporate income tax rate, introducing new limitations on interest expense deductions, subjecting foreign earnings in excess of an allowable return to current U.S. taxation, and adopting a semi-territorial corporate tax system. These changes impacted our 2018 and 2019 effective tax rates and may materially impact our effective tax rate in future periods. Furthermore, we anticipate that growth in our U.S. businesses and higher U.S. tax expense may fully utilize our remaining net operating loss carryforwards in the near term, which could lead to material cash tax payments in the United States. Our interpretation of the TCJA may change as the U.S. Treasury and the Internal Revenue Service issue additional guidance. Such changes may be material. For example, the Company anticipates that regulations proposed in 2019 related to the GILTI high-tax exception will be finalized in and made effective for 2020. Our 2020 tax rate will be materially impacted if such final regulations are not issued in 2020. Our interim tax rates may also be impacted if such regulations are finalized later in 2020.
State Taxes — The reactions of the individual states to federal tax reform are still evolving. Most states will assess whether and how the federal changes will be incorporated into their state tax legislation. As we expect higher taxable income in the future at the federal level, this may also lead to higher state taxable income. Our current state tax provisions predominantly have full valuation allowances against state net operating losses. These positions will be re-assessed in the future as state tax law evolves and may result in material changes in position.
Decarbonization Initiatives
Several initiatives have been announced by regulators and offtakers in recent years, with the intention of reducing GHG emissions generated by the energy industry. Our strategy of shifting towards clean energy platforms, including renewable energy, energy storage, LNG and modernized grids is designed to position us for continued growth while reducing our carbon intensity. The shift to renewables has caused certain customers to migrate to other low-carbon energy solutions and this trend may continue. Certain of our contracts contain clauses designed to compensate for early contract terminations, but we cannot guarantee full recovery. Although the Company cannot currently estimate the financial impact of these decarbonization initiatives, new legislative or regulatory programs further restricting carbon emissions could require material capital expenditures, result in a reduction of the estimated useful life of certain coal facilities, or have other material adverse effects on our financial results. For further discussion of our strategy of shifting towards clean energy platforms see Item 1—Executive Summary.
97 | 2019 Annual Report | |
Chilean Decarbonization Plan — The Chilean government has announced an initiative to phase out coal power plants by 2040 and achieve carbon neutrality by 2050. On June 4, 2019, AES Gener signed an agreement with the Chilean government to cease the operation of two coal units for a total of 322 MW as part of the phase-out. Under the agreement, Ventanas 1 (114 MW) will cease operation in November 2022 and Ventanas 2 (208 MW) in May 2024. These units will remain connected to the grid as “strategic operating reserve” for up to five years after ceasing operations, will receive a reduced capacity payment and will be dispatched, if necessary, to ensure the electric system’s reliability. See Item 1—Business—South America SBU—Chile for further discussion. Considering the information available as of the filing date, Management believes the carrying amount of our coal-fired long-lived assets in Chile of $2.8 billion is recoverable as of December 31, 2019.
Puerto Rico Energy Public Policy Act — On April 11, 2019, the Governor of Puerto Rico signed the Puerto Rico Energy Public Policy Act (“the Act”) establishing guidelines for grid efficiency and eliminating coal as a source for electricity generation by January 1, 2028. The Act supports the accelerated deployment of renewables through the Renewable Portfolio Standard and the conversion of coal generating facilities to other fuel sources, with compliance targets of 40% by 2025, 60% by 2040, and 100% by 2050. AES Puerto Rico’s long-term PPA with PREPA expires November 30, 2027. Unless the Act is amended or a waiver from its provisions is obtained, AES Puerto Rico will need to convert fuel sources to continue operating. PREPA and AES Puerto Rico have begun discussing conversion options, but any plan would be subject to lender and regulatory approval, including that of the Oversight Board that filed for bankruptcy on behalf of PREPA. We considered the Act an indicator of impairment for the long-lived assets at AES Puerto Rico in the second quarter; however, the carrying value of the asset group was recoverable. See Impairments for further information.
For further information about the risks associated with decarbonization initiatives, see Item 1A.—Risk Factors—Concerns about GHG emissions and the potential risks associated with climate change have led to increased regulation and other actions that could impact our businesses included in this Form 10-K.
Regulatory
Maritza PPA Review — The DG Comp continues to review whether Maritza’s PPA with NEK is compliant with the European Commission’s state aid rules. Although no formal investigation has been launched by DG Comp to date, Maritza has engaged in discussions with the DG Comp case team and representatives of Bulgaria to discuss the agency’s review. In the near term, Maritza expects that it will engage in discussions with Bulgaria to attempt to reach a negotiated resolution concerning DG Comp’s review. The anticipated discussions could involve a range of potential outcomes, including but not limited to termination of the PPA and payment of some level of compensation to Maritza. Any negotiated resolution would be subject to mutually acceptable terms, lender consent, and DG Comp approval. At this time, we cannot predict the outcome of the anticipated discussions between Maritza and Bulgaria, nor can we predict how DG Comp might resolve its review if the discussions fail to result in an agreement concerning the review. Maritza believes that its PPA is legal and in compliance with all applicable laws, and it will take all actions necessary to protect its interests, whether through negotiated agreement or otherwise. However, there can be no assurances that this matter will be resolved favorably; if it is not, there could be a material adverse impact on Maritza’s and the Company’s respective financial statements.
Considering the information available as of the filing date, Management believes the carrying value of our long-lived assets at Maritza of approximately $1.1 billion is recoverable as of December 31, 2019.
DP&L Rate Case — On November 21, 2019, the PUCO issued an order modifying DP&L's ESP by removing the DMR. Effective December 18, 2019, the PUCO partially approved DP&L's subsequent request to revert to the prior ESP rates and maintain several other riders that were previously in effect; however, certain of those riders were disallowed. In the first quarter of 2020, DP&L filed a separate petition seeking authority to record regulatory assets to accrue revenues that would have otherwise been collected under the ESP through the Decoupling Rider. The outcome of this petition is unknown at this time. See Item 1.—Business—US and Utilities SBU—DPL of this Form 10-K for further information.
Foreign Exchange
We operate in multiple countries and as such are subject to volatility in exchange rates at varying degrees at the subsidiary level and between our functional currency, the USD, and currencies of the countries in which we operate. In 2018 and 2019, there was a significant devaluation in the Argentine peso against the USD, which had an impact on our 2018 and 2019 results. Continued material devaluation of the Argentine peso against the USD could
98 | 2019 Annual Report | |
have an impact on our future results. The Argentine economy continues to be considered highly inflationary under U.S. GAAP; as such, all of our Argentine businesses are reported using the USD as the functional currency. For additional information, refer to Item 7A.—Quantitative and Qualitative Disclosures About Market Risk.
Changuinola Tunnel Leak
In early 2019, the Company confirmed loss of water in specific tunnel sections of the Changuinola power plant, a 223 MW hydroelectric power facility in Panama. As a result, about one third of the tunnel, or 1.6 kilometers, required upgraded lining to ensure long-term performance of the facility. The upgrade to the lining was completed and the affected units were placed back in service in January 2020. See Note 21—Other Income and Expense included included in Item 8.—Financial Statements and Supplementary Data, and Other Income and Expense included in Item 7.— Management’s Discussion and Analysis of Financial Condition and Results of Operations of this Form 10-K for further information.
Impairments
Long-lived Assets and Equity Affiliates — During the year ended December 31, 2019, the Company recognized asset and other-than-temporary impairment expenses of $277 million. See Note 8—Investments In and Advances To Affiliates and Note 22—Asset Impairment Expense included in Item 8.—Financial Statements and Supplementary Data of this Form 10-K for further information. After recognizing these impairment expenses, the carrying value of our investments in equity affiliates and long-lived assets that were assessed for impairment in 2019 totaled $892 million at December 31, 2019.
Events or changes in circumstances that may necessitate recoverability tests and potential impairments of long-lived assets may include, but are not limited to, adverse changes in the regulatory environment, unfavorable changes in power prices or fuel costs, increased competition due to additional capacity in the grid, technological advancements, declining trends in demand, evolving industry expectations to transition away from fossil fuel sources for generation, or an expectation it is more likely than not the asset will be disposed of before the end of its estimated useful life.
Goodwill — The Company considers a reporting unit at risk of impairment when its fair value does not exceed its carrying amount by more than 10%. During the annual goodwill impairment test performed as of October 1, 2019, the Company determined that the fair value of its Gener reporting unit exceeded its carrying value by 3%. Therefore, Gener's $868 million goodwill balance was considered to be "at risk" as of December 31, 2019, largely due to the Chilean Government's announcement to phase out coal generation by 2040, and a decline in long-term energy prices.
Through 2028, Gener’s plants remain largely contracted, with most of its PPAs expiring between 2029 and 2042. The Company utilized the income approach in deriving the fair value of the Gener reporting unit, which included estimated cash flows based on the estimated useful lives of the underlying generating asset class. These cash flows were discounted using a weighted average cost of capital of 7%, which was determined based on the Capital Asset Pricing Model. See Item 7.—Critical Accounting Policies and Estimates—Fair Value of Nonfinancial Assets and Liabilities and Note 9—Goodwill and Other Intangible Assets included in Item 8.—Financial Statements and Supplementary Data of this Form 10-K for further information.
The Company monitors its reporting units at risk of impairment for interim impairment indicators, and believes that the estimates and assumptions used in the calculations are reasonable as of December 31, 2019. Should the fair value of any of the Company’s reporting units fall below its carrying amount because of reduced operating performance, market declines, changes in the discount rate, regulatory changes, or other adverse conditions, goodwill impairment charges may be necessary in future periods.
Capital Resources and Liquidity
Overview
As of December 31, 2019, the Company had unrestricted cash and cash equivalents of $1 billion, of which $13 million was held at the Parent Company and qualified holding companies. The Company had $400 million in short-term investments, held primarily at subsidiaries, and restricted cash and debt service reserves of $543 million. The Company also had non-recourse and recourse aggregate principal amounts of debt outstanding of $16.7 billion and $3.4 billion, respectively. Of the $1.9 billion of our current non-recourse debt, $1.5 billion was presented as such
99 | 2019 Annual Report | |
because it is due in the next twelve months and $320 million relates to debt considered in default due to covenant violations. None of the defaults are payment defaults, but are instead technical defaults triggered by failure to comply with other covenants or other conditions contained in the non-recourse debt documents due to the bankruptcy of the offtaker.
We expect current maturities of non-recourse debt to be repaid from net cash provided by operating activities of the subsidiary to which the debt relates, through opportunistic refinancing activity, or some combination thereof. We have $5 million of recourse debt which matures within the next twelve months. From time to time, we may elect to repurchase our outstanding debt through cash purchases, privately negotiated transactions or otherwise when management believes that such securities are attractively priced. Such repurchases, if any, will depend on prevailing market conditions, our liquidity requirements and other factors. The amounts involved in any such repurchases may be material.
We rely mainly on long-term debt obligations to fund our construction activities. We have, to the extent available at acceptable terms, utilized non-recourse debt to fund a significant portion of the capital expenditures and investments required to construct and acquire our electric power plants, distribution companies and related assets. Our non-recourse financing is designed to limit cross-default risk to the Parent Company or other subsidiaries and affiliates. Our non-recourse long-term debt is a combination of fixed and variable interest rate instruments. Debt is typically denominated in the currency that matches the currency of the revenue expected to be generated from the benefiting project, thereby reducing currency risk. In certain cases, the currency is matched through the use of derivative instruments. The majority of our non-recourse debt is funded by international commercial banks, with debt capacity supplemented by multilaterals and local regional banks.
Given our long-term debt obligations, the Company is subject to interest rate risk on debt balances that accrue interest at variable rates. When possible, the Company will borrow funds at fixed interest rates or hedge its variable rate debt to fix its interest costs on such obligations. In addition, the Company has historically tried to maintain at least 70% of its consolidated long-term obligations at fixed interest rates, including fixing the interest rate through the use of interest rate swaps. These efforts apply to the notional amount of the swaps compared to the amount of related underlying debt. Presently, the Parent Company's only material unhedged exposure to variable interest rate debt relates to drawings of $180 million under its senior secured credit facility. On a consolidated basis, of the Company's $20.4 billion of total gross debt outstanding as of December 31, 2019, approximately $3.3 billion bore interest at variable rates that were not subject to a derivative instrument which fixed the interest rate. Brazil holds $1.1 billion of our floating rate non-recourse exposure as we have no ability to fix local debt interest rates efficiently.
In addition to utilizing non-recourse debt at a subsidiary level when available, the Parent Company provides a portion, or in certain instances all, of the remaining long-term financing or credit required to fund development, construction or acquisition of a particular project. These investments have generally taken the form of equity investments or intercompany loans, which are subordinated to the project's non-recourse loans. We generally obtain the funds for these investments from our cash flows from operations, proceeds from the sales of assets and/or the proceeds from our issuances of debt, common stock and other securities. Similarly, in certain of our businesses, the Parent Company may provide financial guarantees or other credit support for the benefit of counterparties who have entered into contracts for the purchase or sale of electricity, equipment, or other services with our subsidiaries or lenders. In such circumstances, if a business defaults on its payment or supply obligation, the Parent Company will be responsible for the business' obligations up to the amount provided for in the relevant guarantee or other credit support. At December 31, 2019, the Parent Company had provided outstanding financial and performance-related guarantees or other credit support commitments to or for the benefit of our businesses, which were limited by the terms of the agreements, of approximately $865 million in aggregate (excluding those collateralized by letters of credit and other obligations discussed below).
As a result of the Parent Company's split rating, some counterparties may be unwilling to accept our general unsecured commitments to provide credit support. Accordingly, with respect to both new and existing commitments, the Parent Company may be required to provide some other form of assurance, such as a letter of credit, to backstop or replace our credit support. The Parent Company may not be able to provide adequate assurances to such counterparties. To the extent we are required and able to provide letters of credit or other collateral to such counterparties, this will reduce the amount of credit available to us to meet our other liquidity needs. At December 31, 2019, we had $342 million in letters of credit outstanding provided under our unsecured credit facility, and $19 million in letters of credit outstanding provided under our senior secured credit facility. These letters of credit operate to guarantee performance relating to certain project development and construction activities and
100 | 2019 Annual Report | |
business operations. During the year ended December 31, 2019, the Company paid letter of credit fees ranging from 1% to 3% per annum on the outstanding amounts.
We expect to continue to seek, where possible, non-recourse debt financing in connection with the assets or businesses that we or our affiliates may develop, construct or acquire. However, depending on local and global market conditions and the unique characteristics of individual businesses, non-recourse debt may not be available on economically attractive terms or at all. If we decide not to provide any additional funding or credit support to a subsidiary project that is under construction or has near-term debt payment obligations and that subsidiary is unable to obtain additional non-recourse debt, such subsidiary may become insolvent, and we may lose our investment in that subsidiary. Additionally, if any of our subsidiaries lose a significant customer, the subsidiary may need to withdraw from a project or restructure the non-recourse debt financing. If we or the subsidiary choose not to proceed with a project or are unable to successfully complete a restructuring of the non-recourse debt, we may lose our investment in that subsidiary.
Many of our subsidiaries depend on timely and continued access to capital markets to manage their liquidity needs. The inability to raise capital on favorable terms, to refinance existing indebtedness or to fund operations and other commitments during times of political or economic uncertainty may have material adverse effects on the financial condition and results of operations of those subsidiaries. In addition, changes in the timing of tariff increases or delays in the regulatory determinations under the relevant concessions could affect the cash flows and results of operations of our businesses.
Long-Term Receivables
As of December 31, 2019, the Company had approximately $109 million of accounts receivable classified as Other noncurrent assets. These noncurrent receivables mostly consist of accounts receivable in Argentina and Chile that, pursuant to amended agreements or government resolutions, have collection periods that extend beyond December 31, 2020, or one year from the latest balance sheet date. The majority of Argentine receivables have been converted into long-term financing for the construction of power plants. Noncurrent receivables in Chile pertain to revenues recognized on regulated energy contracts that were impacted by the Stabilization Fund created by the Chilean government. See Note 7—Financing Receivables included in Item 8.—Financial Statements and Supplementary Data, Item 1.—Business—South America SBU—Argentina—Regulatory Framework and Market Structure, and Item 7.—Management's Discussion and Analysis of Financial Condition and Results of Operation—Key Trends and Uncertainties—Macroeconomic and Political—Chile of this Form 10-K for further information.
As of December 31, 2019, the Company had approximately $1.4 billion of loans receivable primarily related to a facility constructed under a BOT contract in Vietnam. This loan receivable represents contract consideration related to the construction of the facility, which was substantially completed in 2015, and will be collected over the 25-year term of the plant's PPA. See Note 20—Revenue included in Item 8.—Financial Statements and Supplementary Data of this Form 10-K for further information.
Cash Sources and Uses
The primary sources of cash for the Company in the year ended December 31, 2019 were debt financings, cash flows from operating activities, and sales of short-term investments. The primary uses of cash in the year ended December 31, 2019 were repayments of debt, capital expenditures, and purchases of short-term investments.
The primary sources of cash for the Company in the year ended December 31, 2018 were debt financings, cash flows from operating activities, proceeds from the sales of business interests, and sales of short-term investments. The primary uses of cash in the year ended December 31, 2018 were repayments of debt, capital expenditures, and purchases of short-term investments.
The primary sources of cash for the Company in the year ended December 31, 2017 were debt financings, sales of short-term investments, and cash flows from operating activities. The primary uses of cash in the year ended December 31, 2017 were repayments of debt, purchases of short-term investments, and capital expenditures.
101 | 2019 Annual Report | |
A summary of cash-based activities are as follows (in millions):
Year Ended December 31, | |||||||||||
Cash Sources: | 2019 | 2018 | 2017 | ||||||||
Issuance of non-recourse debt | $ | 5,828 | $ | 1,928 | $ | 3,222 | |||||
Net cash provided by operating activities | 2,466 | 2,343 | 2,504 | ||||||||
Borrowings under the revolving credit facilities | 2,026 | 1,865 | 2,156 | ||||||||
Sale of short-term investments | 666 | 1,302 | 3,540 | ||||||||
Proceeds from the sale of business interests, net of cash and restricted cash sold | 178 | 2,020 | 108 | ||||||||
Insurance proceeds | 150 | 17 | 15 | ||||||||
Issuance of recourse debt | — | 1,000 | 1,025 | ||||||||
Other | 137 | 218 | 123 | ||||||||
Total Cash Sources | $ | 11,451 | $ | 10,693 | $ | 12,693 | |||||
Cash Uses: | |||||||||||
Repayments of non-recourse debt | $ | (4,831 | ) | $ | (1,411 | ) | $ | (2,360 | ) | ||
Capital expenditures | (2,405 | ) | (2,121 | ) | (2,177 | ) | |||||
Repayments under the revolving credit facilities | (1,735 | ) | (2,238 | ) | (1,742 | ) | |||||
Purchase of short-term investments | (770 | ) | (1,411 | ) | (3,310 | ) | |||||
Repayments of recourse debt | (450 | ) | (1,933 | ) | (1,353 | ) | |||||
Distributions to noncontrolling interests | (427 | ) | (340 | ) | (424 | ) | |||||
Dividends paid on AES common stock | (362 | ) | (344 | ) | (317 | ) | |||||
Contributions and loans to equity affiliates | (324 | ) | (145 | ) | (89 | ) | |||||
Acquisitions of business interests, net of cash and restricted cash acquired | (192 | ) | (66 | ) | (609 | ) | |||||
Payments for financed capital expenditures | (146 | ) | (275 | ) | (179 | ) | |||||
Payments for financing fees | (126 | ) | (39 | ) | (100 | ) | |||||
Other | (114 | ) | (155 | ) | (205 | ) | |||||
Total Cash Uses | $ | (11,882 | ) | $ | (10,478 | ) | $ | (12,865 | ) | ||
Net increase (decrease) in Cash, Cash Equivalents, and Restricted Cash | $ | (431 | ) | $ | 215 | $ | (172 | ) | |||
Consolidated Cash Flows
The following table reflects the changes in operating, investing, and financing cash flows for the comparative twelve month periods (in millions):
December 31, | $ Change | |||||||||||||||||||
Cash flows provided by (used in): | 2019 | 2018 | 2017 | 2019 vs. 2018 | 2018 vs. 2017 | |||||||||||||||
Operating activities | $ | 2,466 | $ | 2,343 | $ | 2,504 | $ | 123 | $ | (161 | ) | |||||||||
Investing activities | (2,721 | ) | (505 | ) | (2,599 | ) | (2,216 | ) | 2,094 | |||||||||||
Financing activities | (86 | ) | (1,643 | ) | 43 | 1,557 | (1,686 | ) | ||||||||||||
Operating Activities
Fiscal Year 2019 versus 2018
Net cash provided by operating activities increased $123 million for the year ended December 31, 2019, compared to December 31, 2018.
102 | 2019 Annual Report | |
Operating Cash Flows
(in millions)
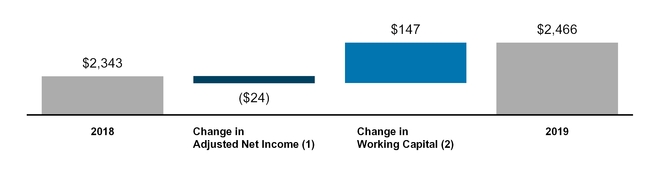
(1) | The change in adjusted net income is defined as the variance in net income, net of the total adjustments to net income as shown on the Consolidated Statements of Cash Flows in Item 8.—Financial Statements and Supplementary Data of this Form 10-K. |
(2) | The change in working capital is defined as the variance in total changes in operating assets and liabilities as shown on the Consolidated Statements of Cash Flows in Item 8.—Financial Statements and Supplementary Data of this Form 10-K. |
Amounts included in the chart above include the results of discontinued operations, where applicable. |
• | Adjusted net income decreased $24 million primarily due to lower margins at our South America and MCAC SBUs. These impacts were partially offset by the current year gains on insurance recoveries associated with the lightning incident at the Andres facility in 2018 and the Changuinola tunnel leak, and higher margins at our US and Utilities SBU. |
• | Working capital requirements decreased $147 million, primarily due to higher collections of overdue receivables from distribution companies in the Dominican Republic, higher collections of insurance receivables at Andres, and lower supplier payments and VAT recoveries at Gener. These impacts were partially offset by a decrease in income tax liabilities at Argentina as a result of lower operating margin and income tax rates, and higher supplier payments and prior year collections at Puerto Rico. |
Fiscal Year 2018 versus 2017
Net cash provided by operating activities decreased $161 million for the year ended December 31, 2018, compared to December 31, 2017.
Operating Cash Flows
(in millions)
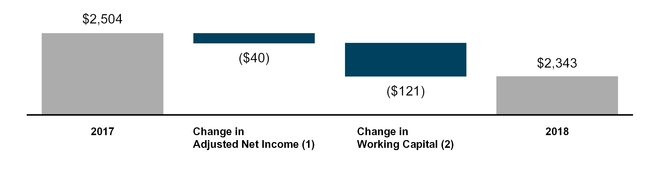
(1) | The change in adjusted net income is defined as the variance in net income, net of the total adjustments to net income as shown on the Consolidated Statements of Cash Flows in Item 8.—Financial Statements and Supplementary Data of this Form 10-K. |
(2) | The change in working capital is defined as the variance in total changes in operating assets and liabilities as shown on the Consolidated Statements of Cash Flows in Item 8.—Financial Statements and Supplementary Data of this Form 10-K. |
Amounts included in the chart above include the results of discontinued operations, where applicable. |
103 | 2019 Annual Report | |
• | Adjusted net income decreased $40 million primarily due to lower margins at our Eurasia SBU and a 2017 favorable impact at Uruguaiana as a result of a legal settlement. These impacts were partially offset by higher margins in 2018 at our South America, MCAC and US and Utilities SBUs. |
• | Working capital requirements increased $121 million, primarily due to higher insurance receivables at Andres, deconsolidation of Eletropaulo, lower collections at Los Mina and Itabo, and the timing of payments on coal purchases at Gener. These impacts were partially offset by the collections on the construction performance obligation from the offtaker at Vietnam, higher CAMMESA collections at Alicura, and the timing of payments on coal purchases at Puerto Rico. |
Investing Activities
Fiscal Year 2019 versus 2018
Net cash used in investing activities increased $2.2 billion for the year ended December 31, 2019 compared to December 31, 2018.
Investing Cash Flows
(in millions)
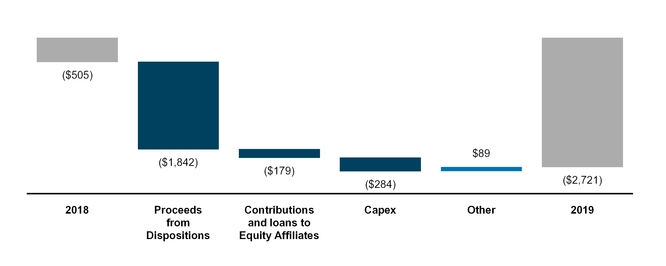
• | Proceeds from dispositions decreased $1.8 billion, primarily due to the sales of Masinloc, Electrica Santiago, CTNG, Eletropaulo, and the DPL Peaker assets in 2018; partially offset by the sale of a portion of our interest in a portfolio of sPower’s operating assets and the sale of the Kilroot and Ballylumford plants in the United Kingdom in 2019. |
• | Contributions and loans to equity affiliates increased $179 million, primarily due to project funding requirements at sPower. |
• | Capital expenditures increased $284 million, discussed further below. |
104 | 2019 Annual Report | |
Capital Expenditures
(in millions)

• | Growth expenditures increased $130 million, primarily due to higher investments in solar projects at Distributed Energy and renewable energy projects in Argentina; partially offset by a decrease in payments for the Southland re-powering projects. |
• | Maintenance expenditures increased $173 million, primarily at Andres as a result of the steam turbine lightning damage, at DPL from storm damages, and at Changuinola due to the upgrade of the tunnel lining. |
• | Environmental expenditures decreased $19 million, primarily at IPALCO due to lower spending for NAAQS, NPDES and CCR rule compliance. |
Fiscal Year 2018 versus 2017
Net cash used in investing activities decreased $2.1 billion for the year ended December 31, 2018 compared to December 31, 2017.
Investing Cash Flows
(in millions)
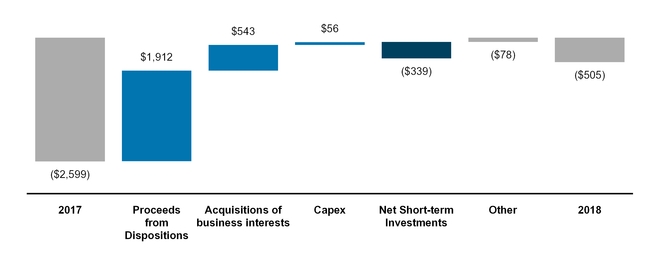
• | Proceeds from dispositions increased by $1.9 billion, primarily due to the sales of Masinloc, Electrica Santiago, Eletropaulo, CTNG and the DPL Peaker assets in 2018, partially offset by the sale of the Kazakhstan CHPs in 2017 and transaction costs incurred for the Beckjord sale. |
• | Payments for the acquisitions of business interests decreased by $543 million, primarily due to the acquisitions of sPower and Alto Sertão II in 2017. |
• | Cash resulting from net purchases of short-term investments decreased by $339 million, primarily due to the sale of Eletropaulo. |
105 | 2019 Annual Report | |
• | Capital expenditures decreased $56 million, discussed further below. |
Capital Expenditures
(in millions)
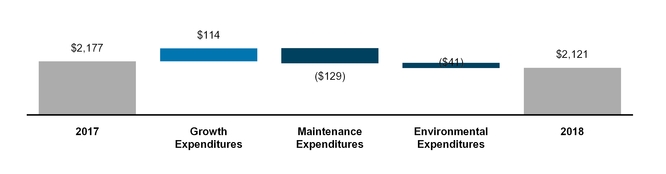
• | Growth expenditures increased $114 million, primarily due to higher spending for the Southland re-powering project; partially offset by lower spending resulting from the completion of the Colon project and the completion of the combined cycle project at Los Mina. |
• | Maintenance expenditures decreased $129 million, primarily due to the deconsolidation of Eletropaulo in Q4 2017. |
• | Environmental expenditures decreased $41 million, primarily at IPALCO due to lower spending for NPDES compliance. |
Financing Activities
Fiscal Year 2019 versus 2018
Net cash used in financing activities decreased $1.6 billion for the year ended December 31, 2019 compared to December 31, 2018.
Financing Cash Flows
(in millions)
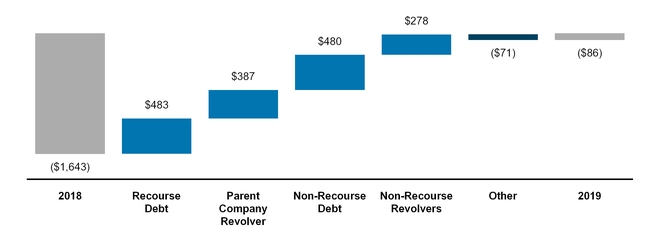
See Note 11—Debt in Item 8.—Financial Statements and Supplementary Data of this Form 10-K for more information regarding significant debt transactions.
• | The $483 million impact from recourse debt activity is primarily due to higher net repayments of Parent Company debt in the prior year. |
• | The $387 million impact from Parent Company revolver transactions is primarily from higher repayments in the prior year, and higher borrowings in 2019 for general corporate cash management activities. |
106 | 2019 Annual Report | |
• | The $480 million impact from non-recourse debt transactions is primarily due to net issuances at Gener, Alto Maipo and DPL, which were partially offset by net repayments at Tietê, and lower net issuances in 2018 at IPALCO. |
• | The $278 million impact from non-recourse revolver transactions is primarily due to higher net borrowings at DPL and prior year net repayments at IPALCO. |
Fiscal Year 2018 versus 2017
Net cash used in financing activities decreased $1.7 billion for the year ended December 31, 2018 compared to December 31, 2017.
Financing Cash Flows
(in millions)
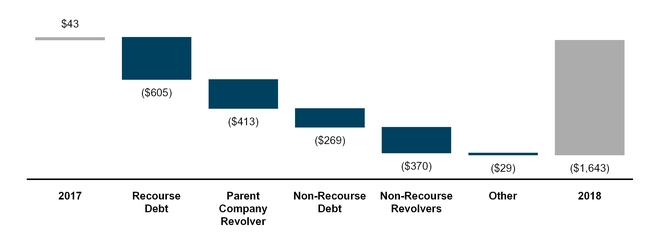
See Note 11—Debt in Item 8.—Financial Statements and Supplementary Data of this Form 10-K for more information regarding significant debt transactions.
• | The $605 million impact from recourse debt activity is primarily due to higher net repayments of Parent Company debt. |
• | The $413 million impact from Parent Company revolver transactions is primarily from lower borrowings for general corporate cash management activities. |
• | The $269 million impact from non-recourse debt transactions is primarily due to lower net issuances at AES Argentina, Tietê, Colon, Alto Maipo, U.S. Generation and Los Mina, which were partially offset by 2017 net repayments at Gener and IPALCO. |
• | The $370 million impact from non-recourse revolver transactions is primarily due to higher net repayments at IPALCO and Gener. |
Parent Company Liquidity
The following discussion is included as a useful measure of the liquidity available to The AES Corporation, or the Parent Company, given the non-recourse nature of most of our indebtedness. Parent Company Liquidity as outlined below is a non-GAAP measure and should not be construed as an alternative to Cash and cash equivalents, which is determined in accordance with GAAP. Parent Company Liquidity may differ from similarly titled measures used by other companies. The principal sources of liquidity at the Parent Company level are dividends and other distributions from our subsidiaries, including refinancing proceeds, proceeds from debt and equity financings at the Parent Company level, including availability under our credit facility, and proceeds from asset sales. Cash requirements at the Parent Company level are primarily to fund interest and principal repayments of debt, construction commitments, other equity commitments, common stock repurchases, acquisitions, taxes, Parent Company overhead and development costs, and dividends on common stock.
The Company defines Parent Company Liquidity as cash available to the Parent Company plus available borrowings under existing credit facility plus cash at qualified holding companies. The cash held at qualified holding
107 | 2019 Annual Report | |
companies represents cash sent to subsidiaries of the Company domiciled outside of the U.S. Such subsidiaries have no contractual restrictions on their ability to send cash to the Parent Company. Parent Company Liquidity is reconciled to its most directly comparable U.S. GAAP financial measure, Cash and cash equivalents, at the periods indicated as follows (in millions):
December 31, 2019 | December 31, 2018 | ||||||
Consolidated cash and cash equivalents | $ | 1,029 | $ | 1,166 | |||
Less: Cash and cash equivalents at subsidiaries | (1,016 | ) | (1,142 | ) | |||
Parent and qualified holding companies' cash and cash equivalents | 13 | 24 | |||||
Commitments under Parent Company credit facilities | 1,000 | 1,100 | |||||
Less: Letters of credit under the credit facilities | (19 | ) | (78 | ) | |||
Less: Borrowings under the credit facilities | (180 | ) | — | ||||
Borrowings available under Parent Company credit facilities | 801 | 1,022 | |||||
Total Parent Company Liquidity | $ | 814 | $ | 1,046 | |||
The Company utilizes its Parent Company credit facility for short-term cash needs to bridge the timing of distributions from its subsidiaries throughout the year. We expect that the Parent Company credit facilities' borrowings will be repaid by the end of the year.
The Parent Company paid dividends of $0.55 per share to its common stockholders during the year ended December 31, 2019. While we intend to continue payment of dividends and believe we will have sufficient liquidity to do so, we can provide no assurance that we will continue to pay dividends, or if continued, the amount of such dividends.
Recourse Debt
Our total recourse debt was $3.4 billion and $3.7 billion at December 31, 2019 and 2018, respectively. See Note 11—Debt in Item 8.—Financial Statements and Supplementary Data of this Form 10-K for additional detail.
We believe that our sources of liquidity will be adequate to meet our needs for the foreseeable future. This belief is based on a number of material assumptions, including, without limitation, assumptions about our ability to access the capital markets, the operating and financial performance of our subsidiaries, currency exchange rates, power market pool prices, and the ability of our subsidiaries to pay dividends. In addition, our subsidiaries' ability to declare and pay cash dividends to us (at the Parent Company level) is subject to certain limitations contained in loans, governmental provisions and other agreements. We can provide no assurance that these sources will be available when needed or that the actual cash requirements will not be greater than anticipated. We have met our interim needs for shorter-term and working capital financing at the Parent Company level with our senior secured credit facility. See Item 1A.—Risk Factors—The AES Corporation is a holding company and its ability to make payments on its outstanding indebtedness, including its public debt securities, is dependent upon the receipt of funds from its subsidiaries by way of dividends, fees, interest, loans or otherwise, of this Form 10-K.
Various debt instruments at the Parent Company level, including our senior secured credit facility, contain certain restrictive covenants. The covenants provide for, among other items, limitations on other indebtedness; liens, investments and guarantees; limitations on dividends, stock repurchases and other equity transactions; restrictions and limitations on mergers and acquisitions, sales of assets, leases, transactions with affiliates and off-balance sheet and derivative arrangements; maintenance of certain financial ratios; and financial and other reporting requirements. As of December 31, 2019, we were in compliance with these covenants at the Parent Company level.
Non-Recourse Debt
While the lenders under our non-recourse debt financings generally do not have direct recourse to the Parent Company, defaults thereunder can still have important consequences for our results of operations and liquidity, including, without limitation:
• | reducing our cash flows as the subsidiary will typically be prohibited from distributing cash to the Parent Company during the time period of any default; |
• | triggering our obligation to make payments under any financial guarantee, letter of credit or other credit support we have provided to or on behalf of such subsidiary; |
• | causing us to record a loss in the event the lender forecloses on the assets; and |
• | triggering defaults in our outstanding debt at the Parent Company. |
108 | 2019 Annual Report | |
For example, our senior secured credit facility and outstanding debt securities at the Parent Company include events of default for certain bankruptcy-related events involving material subsidiaries. In addition, our revolving credit agreement at the Parent Company includes events of default related to payment defaults and accelerations of outstanding debt of material subsidiaries.
Some of our subsidiaries are currently in default with respect to all or a portion of their outstanding indebtedness. The total non-recourse debt classified as current in the accompanying Consolidated Balance Sheets amounts to $1.9 billion. The portion of current debt related to such defaults was $320 million at December 31, 2019, all of which was non-recourse debt related to two subsidiaries — AES Puerto Rico and AES Ilumina. An additional $5 million of debt in default exists at the subsidiary AES Jordan Solar which was classified as a current held-for-sale liability at December 31, 2019. None of the defaults are payment defaults, but are instead technical defaults triggered by failure to comply with other covenants or other conditions contained in the non-recourse debt documents due to the bankruptcy of the offtaker. See Note 11—Debt in Item 8.—Financial Statements and Supplementary Data of this Form 10-K for additional detail.
None of the subsidiaries that are currently in default are subsidiaries that met the applicable definition of materiality under the Parent Company's debt agreements as of December 31, 2019, in order for such defaults to trigger an event of default or permit acceleration under the Parent Company's indebtedness. However, as a result of additional dispositions of assets, other significant reductions in asset carrying values or other matters in the future that may impact our financial position and results of operations or the financial position of the individual subsidiary, it is possible that one or more of these subsidiaries could fall within the definition of a "material subsidiary" and thereby trigger an event of default and possible acceleration of the indebtedness under the Parent Company's outstanding debt securities. A material subsidiary is defined in the Parent Company's senior secured credit facility as any business that contributed 20% or more of the Parent Company's total cash distributions from businesses for the four most recently completed fiscal quarters. As of December 31, 2019, none of the defaults listed above individually or in the aggregate resulted in or is at risk of triggering a cross-default under the recourse debt of the Parent Company.
Contractual Obligations and Parent Company Contingent Contractual Obligations
A summary of our contractual obligations, commitments and other liabilities as of December 31, 2019 is presented below and excludes any businesses classified as discontinued operations or held-for-sale (in millions):
Contractual Obligations | Total | Less than 1 year | 1-3 years | 3-5 years | More than 5 years | Other | Footnote Reference(4) | |||||||||||||||||||||||
Debt obligations (1) | $ | 20,448 | — | $ | 1,888 | — | $ | 3,160 | — | $ | 3,661 | — | $ | 11,739 | $ | — | 11 | |||||||||||||
Interest payments on long-term debt (2) | 6,255 | 784 | 1,381 | 1,034 | 3,056 | — | n/a | |||||||||||||||||||||||
Finance lease obligations | 139 | 4 | 8 | 8 | 119 | — | 14 | |||||||||||||||||||||||
Operating lease obligations | 595 | 29 | 54 | 52 | 460 | — | 14 | |||||||||||||||||||||||
Electricity obligations | 7,622 | 699 | 915 | 898 | 5,110 | — | 12 | |||||||||||||||||||||||
Fuel obligations | 7,039 | 1,385 | 1,842 | 1,211 | 2,601 | — | 12 | |||||||||||||||||||||||
Other purchase obligations | 5,624 | 1,551 | 1,261 | 1,067 | 1,745 | — | 12 | |||||||||||||||||||||||
Other long-term liabilities reflected on AES' consolidated balance sheet under GAAP (3) | 546 | — | 230 | 81 | 219 | 16 | n/a | |||||||||||||||||||||||
Total | $ | 48,268 | $ | 6,340 | $ | 8,851 | $ | 8,012 | $ | 25,049 | $ | 16 | ||||||||||||||||||
_____________________________
(1) | Includes recourse and non-recourse debt presented on the Consolidated Balance Sheet. These amounts exclude finance lease liabilities which are included in the finance lease category. |
(2) | Interest payments are estimated based on final maturity dates of debt securities outstanding at December 31, 2019 and do not reflect anticipated future refinancing, early redemptions or new debt issuances. Variable rate interest obligations are estimated based on rates as of December 31, 2019. |
(3) | These amounts do not include current liabilities on the Consolidated Balance Sheet except for the current portion of uncertain tax obligations. Noncurrent uncertain tax obligations are reflected in the "Other" column of the table above as the Company is not able to reasonably estimate the timing of the future payments. In addition, these amounts do not include: (1) regulatory liabilities (See Note 10—Regulatory Assets and Liabilities), (2) contingencies (See Note 13—Contingencies), (3) pension and other postretirement employee benefit liabilities (see Note 15—Benefit Plans), (4) derivatives and incentive compensation (See Note 6—Derivative Instruments and Hedging Activities) or (5) any taxes (See Note 23—Income Taxes) except for uncertain tax obligations, as the Company is not able to reasonably estimate the timing of future payments. See the indicated notes to the Consolidated Financial Statements included in Item 8 of this Form 10-K for additional information on the items excluded. |
(4) | For further information see the note referenced below in Item 8.—Financial Statements and Supplementary Data of this Form 10-K. |
109 | 2019 Annual Report | |
The following table presents our Parent Company's contingent contractual obligations as of December 31, 2019:
Contingent contractual obligations | Amount (in millions) | Number of Agreements | Maximum Exposure Range for Each Agreement (in millions) | |||||
Guarantees and commitments | $ | 853 | 37 | $0 — 157 | ||||
Letters of credit under the unsecured credit facility | 342 | 11 | $1 — 296 | |||||
Letters of credit under the senior secured credit facility | 19 | 28 | $0 — 4 | |||||
Asset sale related indemnities (1) | 12 | 1 | $12 | |||||
Total | $ | 1,226 | 77 | |||||
_____________________________
(1) | Excludes normal and customary representations and warranties in agreements for the sale of assets (including ownership in associated legal entities) where the associated risk is considered to be nominal. |
We have a diverse portfolio of performance-related contingent contractual obligations. These obligations are designed to cover potential risks and only require payment if certain targets are not met or certain contingencies occur. The risks associated with these obligations include change of control, construction cost overruns, subsidiary default, political risk, tax indemnities, spot market power prices, sponsor support and liquidated damages under power sales agreements for projects in development, in operation and under construction. In addition, we have an asset sale program through which we may have customary indemnity obligations under certain assets sale agreements. While we do not expect that we will be required to fund any material amounts under these contingent contractual obligations beyond 2019, many of the events which would give rise to such obligations are beyond our control. We can provide no assurance that we will be able to fund our obligations under these contingent contractual obligations if we are required to make substantial payments thereunder.
Critical Accounting Policies and Estimates
The Consolidated Financial Statements of AES are prepared in conformity with U.S. GAAP, which requires the use of estimates, judgments, and assumptions that affect the reported amounts of assets and liabilities at the date of the financial statements and the reported amounts of revenue and expenses during the periods presented. AES' significant accounting policies are described in Note 1—General and Summary of Significant Accounting Policies to the Consolidated Financial Statements included in Item 8 of this Form 10-K.
An accounting estimate is considered critical if the estimate requires management to make assumptions about matters that were highly uncertain at the time the estimate was made, different estimates reasonably could have been used, or the impact of the estimates and assumptions on financial condition or operating performance is material.
Management believes that the accounting estimates employed are appropriate and the resulting balances are reasonable; however, actual results could materially differ from the original estimates, requiring adjustments to these balances in future periods. Management has discussed these critical accounting policies with the Audit Committee, as appropriate. Listed below are the Company's most significant critical accounting estimates and assumptions used in the preparation of the Consolidated Financial Statements.
Income Taxes — We are subject to income taxes in both the U.S. and numerous foreign jurisdictions. Our worldwide income tax provision requires significant judgment and is based on calculations and assumptions that are subject to examination by the Internal Revenue Service and other taxing authorities. Certain of the Company's subsidiaries are under examination by relevant taxing authorities for various tax years. The Company regularly assesses the potential outcome of these examinations in each tax jurisdiction when determining the adequacy of the provision for income taxes. Accounting guidance for uncertainty in income taxes prescribes a more likely than not recognition threshold. Tax reserves have been established, which the Company believes to be adequate in relation to the potential for additional assessments. Once established, reserves are adjusted only when there is more information available or when an event occurs necessitating a change to the reserves. While the Company believes that the amounts of the tax estimates are reasonable, it is possible that the ultimate outcome of current or future examinations may be materially different than the reserve amounts.
Because we have a wide range of statutory tax rates in the multiple jurisdictions in which we operate, any changes in our geographical earnings mix could materially impact our effective tax rate. Furthermore, our tax position could be adversely impacted by changes in tax laws, tax treaties or tax regulations, or the interpretation or enforcement thereof and such changes may be more likely or become more likely in view of recent economic trends in certain of the jurisdictions in which we operate.
110 | 2019 Annual Report | |
In accordance with SAB 118, the Company made reasonable estimates of the impacts of U.S. tax reform on its 2017 financial results, and recorded adjustments to those estimates in 2018 as analysis was completed. As of December 31, 2018, our analysis of the one-time impacts of the TCJA was complete under SAB 118. However, in the first quarter of 2019, the U.S. Treasury Department issued final regulations on the one-time transition tax which included changes from the proposed regulations issued in 2018.
In addition, no taxes have been recorded on undistributed earnings for certain of our non-U.S. subsidiaries to the extent such earnings are considered to be indefinitely reinvested in the operations of those subsidiaries. Should the earnings be remitted as dividends, the Company may be subject to additional foreign withholding and state income taxes.
Deferred tax assets and liabilities are recognized for the future tax consequences attributable to differences between the financial statement carrying amounts of the existing assets and liabilities, and their respective income tax bases. The Company establishes a valuation allowance when it is more likely than not that all or a portion of a deferred tax asset will not be realized. The Company has elected to treat GILTI as an expense in the period in which the tax is accrued. Accordingly, no deferred tax assets or liabilities are recorded related to GILTI.
Sales of Noncontrolling Interests — Sales of noncontrolling interests are recognized within stockholders' equity. Effective January 1, 2018, the Company adopted ASU No. 2017-05, Other Income—Gains and Losses from the Derecognition of Nonfinancial Assets, which clarified the accounting for the sale of business interests as either the sale of nonfinancial assets or the sale of businesses. Among other things, under the newly adopted guidance fewer transactions are expected to meet the definition of a business under the scope of ASC 810 and will fall under the scope of the sale of nonfinancial assets.
Prior to January 1, 2018, the accounting for a sale of noncontrolling interests was dependent on whether the sale was considered a sale of in-substance real estate, where the gain (loss) on sale would be recognized in earnings rather than within stockholders' equity. In-substance real estate is composed of land plus improvements and integral equipment. The determination of whether property, plant and equipment is integral equipment is based on the significance of the costs to remove the equipment from its existing location (including the cost of repairing damage resulting from the removal), combined with the decrease in the fair value of the equipment as a result of those removal activities. When the combined total of removal costs and the decrease in fair value of the equipment exceeds 10% of the fair value of the equipment, the equipment is considered integral equipment. The accounting standards specifically identify power plants as an example of in-substance real estate. Where the consolidated entity in which noncontrolling interests have been sold contains in-substance real estate, management estimates the extent to which the total fair value of the assets of the entity is represented by the in-substance real estate and whether significant value exists beyond the in-substance real estate. This estimation considers all qualitative and quantitative factors relevant for each sale and, where appropriate, includes making quantitative estimates about the fair value of the entity and its identifiable assets and liabilities (including any favorable or unfavorable contracts) by analogy to the accounting standards on business combinations. As such, these estimates may require significant judgment and assumptions, similar to the critical accounting estimates discussed below for impairments and fair value.
Impairments — Our accounting policies on goodwill and long-lived assets are described in detail in Note 1—General and Summary of Significant Accounting Policies, included in Item 8 of this Form 10-K. The Company makes considerable judgments in its impairment evaluations of goodwill and long-lived assets, starting with determining if an impairment indicator exists. Events that may result in an impairment analysis being performed include, but are not limited to: adverse changes in the regulatory environment, unfavorable changes in power prices or fuel costs, increased competition due to additional capacity in the grid, technological advancements, declining trends in demand, evolving industry expectations to transition away from fossil fuel sources for generation, or an expectation it is more likely than not that the asset will be disposed of before the end of its previously estimated useful life. The Company exercises judgment in determining if these events represent an impairment indicator requiring the computation of the fair value of goodwill and/or the recoverability of long-lived assets. The fair value determination is typically the most judgmental part in an impairment evaluation. Please see Fair Value below for further detail.
As part of the impairment evaluation process, management analyzes the sensitivity of fair value to various underlying assumptions. The level of scrutiny increases as the gap between fair value and carrying amount decreases. Changes in any of these assumptions could result in management reaching a different conclusion regarding the potential impairment, which could be material. Our impairment evaluations inherently involve
111 | 2019 Annual Report | |
uncertainties from uncontrollable events that could positively or negatively impact the anticipated future economic and operating conditions.
Further discussion of the impairment charges recognized by the Company can be found within Note 9—Goodwill and Other Intangible Assets and Note 22—Asset Impairment Expense to the Consolidated Financial Statements included in Item 8 of this Form 10-K.
Depreciation — Depreciation, after consideration of salvage value and asset retirement obligations, is computed using the straight-line method over the estimated useful lives of the assets, which are determined on a composite or component basis. The Company considers many factors in its estimate of useful lives, including expected usage, physical deterioration, technological changes, existence and length of off-take agreements, and laws and regulations, among others. In certain circumstances, these estimates involve significant judgment and require management to forecast the impact of relevant factors over an extended time horizon.
Useful life estimates are continually evaluated for appropriateness as changes in the relevant factors arise, including when a long-lived asset group is tested for recoverability. Depreciation studies are performed periodically for assets subject to composite depreciation. Any change to useful lives is considered a change in accounting estimate and is made on a prospective basis.
Fair Value — For information regarding the fair value hierarchy, see Note 1—General and Summary of Significant Accounting Policies included in Item 8 of this Form 10-K.
Fair Value of Financial Instruments — A significant number of the Company's financial instruments are carried at fair value with changes in fair value recognized in earnings or other comprehensive income each period. Investments are generally fair valued based on quoted market prices or other observable market data such as interest rate indices. The Company's investments are primarily certificates of deposit and mutual funds. Derivatives are valued using observable data as inputs into internal valuation models. The Company's derivatives primarily consist of interest rate swaps, foreign currency instruments, and commodity and embedded derivatives. Additional discussion regarding the nature of these financial instruments and valuation techniques can be found in Note 5—Fair Value included in Item 8 of this Form 10-K.
Fair Value of Nonfinancial Assets and Liabilities — Significant estimates are made in determining the fair value of long-lived tangible and intangible assets (i.e., property, plant and equipment, intangible assets and goodwill) during the impairment evaluation process. In addition, the majority of assets acquired and liabilities assumed in a business combination and asset acquisitions by VIEs are required to be recognized at fair value under the relevant accounting guidance.
The Company may engage an independent valuation firm to assist management with the valuation. The Company generally utilizes the income approach to value nonfinancial assets and liabilities, specifically a Discounted Cash Flow ("DCF") model to estimate fair value by discounting cash flow forecasts, adjusted to reflect market participant assumptions, to the extent necessary, at an appropriate discount rate.
Management applies considerable judgment in selecting several input assumptions during the development of our cash flow forecasts. Examples of the input assumptions that our forecasts are sensitive to include macroeconomic factors such as growth rates, industry demand, inflation, exchange rates, power prices, and commodity prices. Whenever appropriate, management obtains these input assumptions from observable market data sources (e.g., Economic Intelligence Unit) and extrapolates the market information if an input assumption is not observable for the entire forecast period. Many of these input assumptions are dependent on other economic assumptions, which are often derived from statistical economic models with inherent limitations such as estimation differences. Further, several input assumptions are based on historical trends which often do not recur. It is not uncommon that different market data sources have different views of the macroeconomic factor expectations and related assumptions. As a result, macroeconomic factors and related assumptions are often available in a narrow range; however, in some situations these ranges become wide and the use of a different set of input assumptions could produce significantly different budgets and cash flow forecasts.
A considerable amount of judgment is also applied in the estimation of the discount rate used in the DCF model. To the extent practical, inputs to the discount rate are obtained from market data sources (e.g., Bloomberg). The Company selects and uses a set of publicly traded companies from the relevant industry to estimate the discount rate inputs. Management applies judgment in the selection of such companies based on its view of the
112 | 2019 Annual Report | |
most likely market participants. It is reasonably possible that the selection of a different set of likely market participants could produce different input assumptions and result in the use of a different discount rate.
Accounting for Derivative Instruments and Hedging Activities — We enter into various derivative transactions in order to hedge our exposure to certain market risks. We primarily use derivative instruments to manage our interest rate, commodity, and foreign currency exposures. We do not enter into derivative transactions for trading purposes. See Note 6—Derivative Instruments and Hedging Activities included in Item 8 of this Form 10-K for further information on the classification.
The fair value measurement standard requires the Company to consider and reflect the assumptions of market participants in the fair value calculation. These factors include nonperformance risk (the risk that the obligation will not be fulfilled) and credit risk, both of the reporting entity (for liabilities) and of the counterparty (for assets). Due to the nature of the Company's interest rate swaps, which are typically associated with non-recourse debt, credit risk for AES is evaluated at the subsidiary level rather than at the Parent Company level. Nonperformance risk on the Company's derivative instruments is an adjustment to the initial asset/liability fair value position that is derived from internally developed valuation models that utilize observable market inputs.
As a result of uncertainty, complexity, and judgment, accounting estimates related to derivative accounting could result in material changes to our financial statements under different conditions or utilizing different assumptions. As a part of accounting for these derivatives, we make estimates concerning nonperformance, volatilities, market liquidity, future commodity prices, interest rates, credit ratings (both ours and our counterparty's), and future exchange rates. Refer to Note 5—Fair Value included in Item 8 of this Form 10-K for additional details.
The fair value of our derivative portfolio is generally determined using internal and third party valuation models, most of which are based on observable market inputs, including interest rate curves and forward and spot prices for currencies and commodities. The Company derives most of its financial instrument market assumptions from market efficient data sources (e.g., Bloomberg, Reuters and Platt's). In some cases, where market data is not readily available, management uses comparable market sources and empirical evidence to derive market assumptions to determine a financial instrument's fair value. In certain instances, the published curve may not extend through the remaining term of the contract and management must make assumptions to extrapolate the curve. Specifically, where there is limited forward curve data with respect to foreign exchange contracts, beyond the traded points the Company utilizes the interest rate differential approach to construct the remaining portion of the forward curve. Additionally, in the absence of quoted prices, we may rely on "indicative pricing" quotes from financial institutions to input into our valuation model for certain of our foreign currency swaps. These indicative pricing quotes do not constitute either a bid or ask price and therefore are not considered observable market data. For individual contracts, the use of different valuation models or assumptions could have a material effect on the calculated fair value.
Regulatory Assets — Management continually assesses whether regulatory assets are probable of future recovery by considering factors such as applicable regulatory changes, recent rate orders applicable to other regulated entities, and the status of any pending or potential deregulation legislation. If future recovery of costs ceases to be probable, any asset write-offs would be required to be recognized in operating income.
Consolidation — The Company enters into transactions impacting the Company's equity interests in its affiliates. In connection with each transaction, the Company must determine whether the transaction impacts the Company's consolidation conclusion by first determining whether the transaction should be evaluated under the variable interest model or the voting model. In determining which consolidation model applies to the transaction, the Company is required to make judgments about how the entity operates, the most significant of which are whether (i) the entity has sufficient equity to finance its activities, (ii) the equity holders, as a group, have the characteristics of a controlling financial interest, and (iii) whether the entity has non-substantive voting rights.
If the entity is determined to be a variable interest entity, the most significant judgment in determining whether the Company must consolidate the entity is whether the Company, including its related parties and de facto agents, collectively have power and benefits. If AES is determined to have power and benefits, the entity will be consolidated by AES.
Alternatively, if the entity is determined to be a voting model entity, the most significant judgments involve determining whether the non-AES shareholders have substantive participating rights. The assessment of shareholder rights and whether they are substantive participating rights requires significant judgment since the rights provided under shareholders' agreements may include selecting, terminating, and setting the compensation of
113 | 2019 Annual Report | |
management responsible for implementing the subsidiary's policies and procedures, and establishing operating and capital decisions of the entity, including budgets, in the ordinary course of business. On the other hand, if shareholder rights are only protective in nature (referred to as protective rights), then such rights would not overcome the presumption that the owner of a majority voting interest shall consolidate its investee. Significant judgment is required to determine whether minority rights represent substantive participating rights or protective rights that do not affect the evaluation of control. While both represent an approval or veto right, a distinguishing factor is the underlying activity or action to which the right relates.
Pension and Other Postretirement Plans — The Company recognizes a net asset or liability reflecting the funded status of pension and other postretirement plans with current-year changes in actuarial gains or losses recognized in AOCL, except for those plans at certain of the Company's regulated utilities that can recover portions of their pension and postretirement obligations through future rates. The valuation of the Company's benefit obligation, fair value of plan assets, and net periodic benefit costs requires various estimates and assumptions, the most significant of which include the discount rate and expected return on plan assets. These assumptions are reviewed by the Company on an annual basis. Refer to Note 1—General and Summary of Significant Accounting Policies included in Item 8 of this Form 10-K for further information.
Revenue Recognition — The Company recognizes revenue to depict the transfer of energy, capacity, and other services to customers in an amount that reflects the consideration to which we expect to be entitled. In applying the revenue model, we determine whether the sale of energy, capacity, and other services represent a single performance obligation based on the individual market and terms of the contract. Generally, the promise to transfer energy and capacity represent a performance obligation that is satisfied over time and meets the criteria to be accounted for as a series of distinct goods or services. Progress toward satisfaction of a performance obligation is measured using output methods, such as MWhs delivered or MWs made available, and when we are entitled to consideration in an amount that corresponds directly to the value of our performance completed to date, we recognize revenue in the amount to which we have the right to invoice. For further information regarding the nature of our revenue streams and our critical accounting policies affecting revenue recognition, see Note 1—General and Summary of Significant Accounting Policies included in Item 8 of this Form 10-K.
Leases — The Company recognizes operating and finance right-of-use assets and lease liabilities on the Consolidated Balance Sheets for most leases with an initial term of greater than 12 months. Lease liabilities and their corresponding right-of-use assets are recorded based on the present value of lease payments over the expected lease term. Our subsidiaries’ incremental borrowing rates are used in determining the present value of lease payments when the implicit rate is not readily determinable. Certain adjustments to the right-of-use asset may be required for items such as prepayments, lease incentives, or initial direct costs. For further information regarding the nature of our leases and our critical accounting policies affecting leases, see Note 1—General and Summary of Significant Accounting Policies included in Item 8 of this Form 10-K.
New Accounting Pronouncements
See Note 1—General and Summary of Significant Accounting Policies included in Item 8 of this Form 10-K for further information about new accounting pronouncements adopted during 2019 and accounting pronouncements issued, but not yet effective.
ITEM 7A. QUANTITATIVE AND QUALITATIVE DISCLOSURES ABOUT MARKET RISK
Overview Regarding Market Risks
Our businesses are exposed to and proactively manage market risk. Our primary market risk exposure is to the price of commodities, particularly electricity, oil, natural gas, coal, and environmental credits. In addition, our businesses are exposed to lower electricity prices due to increased competition, including from renewable sources such as wind and solar, as a result of lower costs of entry and lower variable costs. We operate in multiple countries and as such are subject to volatility in exchange rates at varying degrees at the subsidiary level and between our functional currency, the USD, and currencies of the countries in which we operate. We are also exposed to interest rate fluctuations due to our issuance of debt and related financial instruments.
The disclosures presented in this Item 7A are based upon a number of assumptions; actual effects may differ. The safe harbor provided in Section 27A of the Securities Act of 1933 and Section 21E of the Exchange Act shall apply to the disclosures contained in this Item 7A. For further information regarding market risk, see Item 1A.—Risk
114 | 2019 Annual Report | |
Factors, Our financial position and results of operations may fluctuate significantly due to fluctuations in currency exchange rates experienced at our foreign operations; Wholesale power prices are declining in many markets and this could have a material adverse effect on our operations and opportunities for future growth; We may not be adequately hedged against our exposure to changes in commodity prices or interest rates; and Certain of our businesses are sensitive to variations in weather and hydrology of this 2019 Form 10-K.
Commodity Price Risk
Although we prefer to hedge our exposure to the impact of market fluctuations in the price of electricity, fuels, and environmental credits, some of our generation businesses operate under short-term sales or under contract sales that leave an unhedged exposure on some of our capacity or have imperfect fuel pass-throughs. These businesses subject our operational results to the volatility of prices for electricity, fuels, and environmental credits in competitive markets. We employ risk management strategies to hedge our financial performance against the effects of fluctuations in energy commodity prices. The implementation of these strategies can involve the use of physical and financial commodity contracts, futures, swaps, and options.
The portion of our sales and purchases that are not subject to such agreements, or contracted businesses where indexation is not perfectly matched to business drivers, will be exposed to commodity price risk. When hedging the output of our generation assets, we utilize contract sales that lock in the spread per MWh between variable costs and the price at which the electricity can be sold.
AES businesses will see changes in variable margin performance as global commodity prices shift. For 2020, we project pre-tax earnings exposure on a 10% move in commodity prices would be $15 million for power, $(5) million for natural gas, $(5) million for coal, and less than $(5) million for oil. Our estimates exclude correlation of oil with coal or natural gas. For example, a decline in oil or natural gas prices can be accompanied by a decline in coal price if commodity prices are correlated. In aggregate, the Company's downside exposure occurs with lower power, higher oil, higher natural gas, and higher coal prices. Exposures at individual businesses will change as new contracts or financial hedges are executed, and our sensitivity to changes in commodity prices generally increases in later years with reduced hedge levels at some of our businesses.
Commodity prices affect our businesses differently depending on local market characteristics and risk management strategies. Spot power prices, contract indexation provisions, and generation costs can be directly or indirectly affected by movements in the price of natural gas, oil, and coal. We have some natural offsets across our businesses such that low commodity prices may benefit certain businesses and be a cost to others. Exposures are not perfectly linear or symmetric. The sensitivities are affected by a number of local or indirect market factors. Examples of these factors include hydrology, local energy market supply/demand balances, regional fuel supply issues, regional competition, bidding strategies, and regulatory interventions such as price caps. Operational flexibility changes the shape of our sensitivities. For instance, certain power plants may limit downside exposure by reducing dispatch in low market environments. Volume variation also affects our commodity exposure. The volume sold under contracts or retail concessions can vary based on weather and economic conditions, resulting in a higher or lower volume of sales in spot markets. Thermal unit availability and hydrology can affect the generation output available for sale and can affect the marginal unit setting power prices.
In the US and Utilities SBU, the generation businesses are largely contracted but may have residual risk to the extent contracts are not perfectly indexed to the business drivers. At Southland, our primary contracts are in capacity and the business has seen incremental location value in energy revenues. This will continue through 2020 when our Southland repowering contract begins.
In the South America SBU, our business in Chile owns assets in the central and northern regions of the country and has a portfolio of contract sales in both. The majority of our PPAs include mechanisms of indexation that adjust the price of energy based on fluctuations in the price of coal, with the specific indices and timing varying by contract, in order to mitigate changes in the price of fuel. For the portion of our contracts not indexed to the price of coal, we have implemented a hedging strategy based on international coal financial instruments for up to 3 years. In Colombia, we operate under a shorter-term sales strategy and have commodity exposure to unhedged volumes. Because we own hydroelectric assets there, contracts are not indexed to fuel. Additionally, in Brazil, the hydroelectric generating facility is covered by contract sales. Under normal hydrological volatility, spot price risk is mitigated through a regulated sharing mechanism across all hydroelectric generators in the country. Under drier conditions, the sharing mechanism may not be sufficient to cover the business' contract position, and therefore it may have to purchase power at spot prices driven by the cost of thermal generation.
115 | 2019 Annual Report | |
In the MCAC SBU, our businesses have commodity exposure on unhedged volumes. Panama is highly contracted under a portfolio of PPA contract sales. To the extent hydrological inflows are greater than or less than the contract sales volume, the business will be sensitive to changes in spot power prices, which may be driven by oil and gas prices in some time periods. In the Dominican Republic, we own natural gas-fired assets contracted under a portfolio of contract sales and a coal-fired asset contracted under a single contract, and both contract and spot prices may move with commodity prices. Additionally, the contract levels do not always match our generation availability and our assets may be sellers of spot prices in excess of contract levels or a net buyer in the spot market to satisfy contract obligations.
In the Eurasia SBU, our assets operating in Vietnam and Bulgaria have minimal exposure to commodity price risk as it has no or minor merchant exposure and fuel is subject to a pass-through mechanism. In India, around one-fifth of our new facility is under a short-term commercialization agreement until 2023, when 100% of capacity will be under a long-term PPA.
Foreign Exchange Rate Risk
In the normal course of business, we are exposed to foreign currency risk and other foreign operations risks that arise from investments in foreign subsidiaries and affiliates. A key component of these risks stems from the fact that some of our foreign subsidiaries and affiliates utilize currencies other than our consolidated reporting currency, the USD. Additionally, certain of our foreign subsidiaries and affiliates have entered into monetary obligations in USD or currencies other than their own functional currencies. Certain of our foreign subsidiaries calculate and pay taxes in currencies other than their own functional currency. We have varying degrees of exposure to changes in the exchange rate between the USD and the following currencies: Argentine peso, Brazilian real, Chilean peso, Colombian peso, Dominican peso, Euro, Indian rupee, and Mexican peso. These subsidiaries and affiliates have attempted to limit potential foreign exchange exposure by entering into revenue contracts that adjust to changes in foreign exchange rates. We also use foreign currency forwards, swaps, and options where possible to manage our risk related to certain foreign currency fluctuations.
AES enters into foreign currency hedges to protect economic value of the business and minimize the impact of foreign exchange rate fluctuations to AES' portfolio. While protecting cash flows, the hedging strategy is also designed to reduce forward-looking earnings foreign exchange volatility. Due to variation of timing and amount between cash distributions and earnings exposure, the hedge impact may not fully cover the earnings exposure on a realized basis, which could result in greater volatility in earnings. The largest foreign exchange risks over a 12-month forward-looking period stem from the following currencies: Argentine peso, Brazilian real, Colombian peso, Euro, and Indian Rupee. As of December 31, 2019, assuming a 10% USD appreciation, cash distributions attributable to foreign subsidiaries exposed to movement in the exchange rate are projected to be impacted by less than $(5) million each for Brazilian real, Colombia peso, and Euro, and less than $5 million for Indian Rupee. These numbers have been produced by applying a one-time 10% USD appreciation to forecasted exposed cash distributions for 2020 coming from the respective subsidiaries exposed to the currencies listed above, net of the impact of outstanding hedges and holding all other variables constant. The numbers presented above are net of any transactional gains/losses. These sensitivities may change in the future as new hedges are executed or existing hedges are unwound. Additionally, updates to the forecasted cash distributions exposed to foreign exchange risk may result in further modification. The sensitivities presented do not capture the impacts of any administrative market restrictions or currency inconvertibility.
Interest Rate Risks
We are exposed to risk resulting from changes in interest rates as a result of our issuance of variable and fixed-rate debt, as well as interest rate swap, cap, floor, and option agreements. Decisions on the fixed-floating debt mix are made to be consistent with the risk factors faced by individual businesses or plants. Depending on whether a plant's capacity payments or revenue stream is fixed or varies with inflation, we partially hedge against interest rate fluctuations by arranging fixed- or variable-rate financing. In certain cases, particularly for non-recourse financing, we execute interest rate swap, cap, and floor agreements to effectively fix or limit interest rate exposure on the underlying financing. Most of our interest rate risk is related to non-recourse financings at our businesses.
As of December 31, 2019, the portfolio's pre-tax earnings exposure for 2020 to a one-time 100-basis-point increase in interest rates for our Argentine peso, Brazilian real, Chilean peso, Colombian peso, Euro, and USD denominated debt would be approximately $20 million on interest expense for the debt denominated in these currencies. These amounts do not take into account the historical correlation between these interest rates.
116 | 2019 Annual Report
ITEM 8. FINANCIAL STATEMENTS AND SUPPLEMENTARY DATA
REPORT OF INDEPENDENT REGISTERED PUBLIC ACCOUNTING FIRM
To the Stockholders and the Board of Directors of The AES Corporation:
Opinion on the Financial Statements
We have audited the accompanying consolidated balance sheets of The AES Corporation (the Company) as of December 31, 2019 and 2018, the related consolidated statements of operations, comprehensive income (loss), changes in equity, and cash flows for each of the three years in the period ended December 31, 2019, and the related notes and the financial statement schedule listed in the Index at Item 15(a) (collectively referred to as the “consolidated financial statements”). In our opinion, the consolidated financial statements present fairly, in all material respects, the financial position of the Company at December 31, 2019 and 2018, and the results of its operations and its cash flows for each of the three years in the period ended December 31, 2019, in conformity with U.S. generally accepted accounting principles.
We also have audited, in accordance with the standards of the Public Company Accounting Oversight Board (United States) (PCAOB), the Company’s internal control over financial reporting as of December 31, 2019, based on criteria established in Internal Control — Integrated Framework issued by the Committee of Sponsoring Organizations of the Treadway Commission (2013 framework) and our report dated February 27, 2020, expressed an unqualified opinion thereon.
Adoption of New Accounting Standards
As discussed in Note 1 to the consolidated financial statements, the Company changed its method for recognizing revenue as a result of the adoption of Accounting Standards Update (ASU) No. 2014-09, Revenue from Contracts with Customers (Topic 606), and the amendments in ASUs 2015-14, 2016-08, 2016-10, 2016-12, 2016-20, 2017-10 and 2017-13 effective January 1, 2018.
Basis for Opinion
These financial statements are the responsibility of the Company’s management. Our responsibility is to express an opinion on the Company’s financial statements based on our audits. We are a public accounting firm registered with the PCAOB and are required to be independent with respect to the Company in accordance with the U.S. federal securities laws and the applicable rules and regulations of the Securities and Exchange Commission and the PCAOB.
We conducted our audits in accordance with the standards of the PCAOB. Those standards require that we plan and perform the audit to obtain reasonable assurance about whether the financial statements are free of material misstatement, whether due to error or fraud. Our audits included performing procedures to assess the risks of material misstatement of the financial statements, whether due to error or fraud, and performing procedures that respond to those risks. Such procedures included examining, on a test basis, evidence regarding the amounts and disclosures in the financial statements. Our audits also included evaluating the accounting principles used and significant estimates made by management, as well as evaluating the overall presentation of the financial statements. We believe that our audits provide a reasonable basis for our opinion.
Critical Audit Matters
The critical audit matters communicated below are matters arising from the current period audit of the financial statements that were communicated or required to be communicated to the audit committee and that: (1) relate to accounts or disclosures that are material to the financial statements and (2) involved our especially challenging, subjective or complex judgments. The communication of critical audit matters does not alter in any way our opinion on the consolidated financial statements, taken as a whole, and we are not, by communicating the critical audit matters below, providing separate opinions on the critical audit matters or on the accounts or disclosures to which they relate.
117 | 2019 Annual Report
Impairment Evaluation of Goodwill | ||
Description of the Matter | The Company’s goodwill balance was $1,059 million at December 31, 2019, of which $868 million relates to the Gener reporting unit. As disclosed in Note 1 to the consolidated financial statements, the Company’s goodwill is tested for impairment at least annually at the reporting unit level. The goodwill impairment test at the Gener reporting unit involves the use of significant unobservable inputs to determine the fair value of the reporting unit. This estimate of fair value is compared to the carrying value of the reporting unit to determine whether goodwill is impaired. Auditing the Company's measurement of the fair value of the Gener reporting unit involved a high degree of subjectivity given the lack of observable inputs to estimate the reporting unit’s fair value. Key inputs that had a significant impact on the valuation included the prospective financial information (including the estimated growth in renewable projects, forward electricity prices and developments in the Chilean capacity market) and the discount rate, which are forward-looking and based upon expectations about future economic and market conditions. | |
How We Addressed the Matter in Our Audit | We obtained an understanding, evaluated the design and tested the operating effectiveness of controls over the Company’s goodwill impairment review process at the Gener reporting unit. For example, we tested controls over management’s review of the valuation model, the significant assumptions used to develop the estimates, and the completeness and accuracy of the data used in the valuations. To test the estimated fair value of the Company’s Gener reporting unit, we performed audit procedures that included, among others, assessing the methodologies used to develop the estimate of fair value, testing the significant assumptions discussed above, and testing the completeness and accuracy of the underlying data used by the Company in its analyses. We compared the significant assumptions used by management to current industry and economic trends as well as historical results. We assessed the historical accuracy of management’s estimates and performed sensitivity analyses of significant assumptions to evaluate the changes in the fair value of the reporting unit that would result from changes in the assumptions. We also involved a valuation specialist to assist in our evaluation of the overall methodologies and the discount rate used in the fair value estimate. | |
Evaluation of Impairment Indicators and Re-evaluation of Useful Lives | ||
Description of the Matter | At December 31, 2019, the Company's property, plant and equipment had an aggregate net carrying value of approximately $22,574 million. As disclosed in Note 1 to the consolidated financial statements, when circumstances indicate the carrying amount of long-lived assets in a held-for-use asset group may not be recoverable, the Company evaluates the assets for potential impairment, and re-evaluates the remaining useful life. These circumstances may include, but are not limited to, changes in the regulatory environment, demand, power prices or fuel costs, technological advancements, physical deterioration, or an expectation it is more likely than not that the asset will be disposed of before the end of its useful life. Auditing the Company's evaluation of impairment and estimated useful lives of coal generation assets involved significant auditor judgment considering the many geographic, regulatory and economic environments in which the Company operates. These audit procedures required an evaluation of a wide variety of circumstances for potential changes in useful lives or impairment indicators. | |
118 | 2019 Annual Report
How We Addressed the Matter in Our Audit | We obtained an understanding, evaluated the design and tested the operating effectiveness of controls over the Company’s identification of impairment indicators and estimation of useful lives (including any changes if necessary). This included management’s monitoring controls over businesses that have had been affected or are expected to be affected by the circumstances above. Other audit procedures included, among others, making inquiries of management (including personnel in operations) to understand changes in the businesses, reading industry journals and publications to independently identify changes in the regulatory environments or the geographic areas and evaluating whether management has considered identified changes, if any. We considered businesses for which current power prices are significantly less than contractual prices within Power Purchase Agreements (PPAs) that are also near expiration. We also considered the Company’s ability to re-contract certain of its coal generation assets upon the expiration of a PPA, given the most recent legislative or regulatory changes. We evaluated the Company’s analysis of the useful lives of its coal generation assets, considering the existing PPAs and the Company’s ability to use the assets subsequent to the expiration of a PPA, based on any regulatory or market changes. For projects that were still under construction, we compared the Company's actual progress to their budgets, inspected engineering reports when considered appropriate, and considered project overruns. We reviewed disaggregated financial results for deterioration in earnings performance compared to prior periods, negative cash flows from operations, and working capital deficiencies and assessed whether these would represent impairment indicators, when applicable. We also considered and assessed conditions and trends in the industry and the underlying economies and evaluated sale or disposition activities. | |
We have served as the Company's auditor since 2008.
/s/ Ernst & Young LLP
Tysons, Virginia
February 27, 2020
119
Consolidated Balance Sheets
December 31, 2019 and 2018
2019 | 2018 | ||||||
(in millions, except share and per share data) | |||||||
ASSETS | |||||||
CURRENT ASSETS | |||||||
Cash and cash equivalents | $ | $ | |||||
Restricted cash | |||||||
Short-term investments | |||||||
Accounts receivable, net of allowance for doubtful accounts of $20 and $23, respectively | |||||||
Inventory | |||||||
Prepaid expenses | |||||||
Other current assets | |||||||
Current held-for-sale assets | |||||||
Total current assets | |||||||
NONCURRENT ASSETS | |||||||
Property, Plant and Equipment: | |||||||
Land | |||||||
Electric generation, distribution assets and other | |||||||
Accumulated depreciation | ( | ) | ( | ) | |||
Construction in progress | |||||||
Property, plant and equipment, net | |||||||
Other Assets: | |||||||
Investments in and advances to affiliates | |||||||
Debt service reserves and other deposits | |||||||
Goodwill | |||||||
Other intangible assets, net of accumulated amortization of $307 and $457, respectively | |||||||
Deferred income taxes | |||||||
Loan receivable | |||||||
Other noncurrent assets | |||||||
Total other assets | |||||||
TOTAL ASSETS | $ | $ | |||||
LIABILITIES AND EQUITY | |||||||
CURRENT LIABILITIES | |||||||
Accounts payable | $ | $ | |||||
Accrued interest | |||||||
Accrued non-income taxes | |||||||
Accrued and other liabilities | |||||||
Non-recourse debt, including $337 and $479, respectively, related to variable interest entities | |||||||
Current held-for-sale liabilities | |||||||
Total current liabilities | |||||||
NONCURRENT LIABILITIES | |||||||
Recourse debt | |||||||
Non-recourse debt, including $3,872 and $2,922 respectively, related to variable interest entities | |||||||
Deferred income taxes | |||||||
Other noncurrent liabilities | |||||||
Total noncurrent liabilities | |||||||
Commitments and Contingencies (see Notes 12 and 13) | |||||||
Redeemable stock of subsidiaries | |||||||
EQUITY | |||||||
THE AES CORPORATION STOCKHOLDERS’ EQUITY | |||||||
Common stock ($0.01 par value, 1,200,000,000 shares authorized; 817,843,916 issued and 663,952,656 outstanding at December 31, 2019 and 817,203,691 issued and 662,298,096 outstanding at December 31, 2018) | |||||||
Additional paid-in capital | |||||||
Accumulated deficit | ( | ) | ( | ) | |||
Accumulated other comprehensive loss | ( | ) | ( | ) | |||
Treasury stock, at cost (153,891,260 and 154,905,595 shares at December 31, 2019 and December 31, 2018, respectively) | ( | ) | ( | ) | |||
Total AES Corporation stockholders’ equity | |||||||
NONCONTROLLING INTERESTS | |||||||
Total equity | |||||||
TOTAL LIABILITIES AND EQUITY | $ | $ | |||||
See Accompanying Notes to Consolidated Financial Statements.
120
Consolidated Statements of Operations
Years ended December 31, 2019, 2018, and 2017
2019 | 2018 | 2017 | |||||||||
(in millions, except per share amounts) | |||||||||||
Revenue: | |||||||||||
Regulated | $ | $ | $ | ||||||||
Non-Regulated | |||||||||||
Total revenue | |||||||||||
Cost of Sales: | |||||||||||
Regulated | ( | ) | ( | ) | ( | ) | |||||
Non-Regulated | ( | ) | ( | ) | ( | ) | |||||
Total cost of sales | ( | ) | ( | ) | ( | ) | |||||
Operating margin | |||||||||||
General and administrative expenses | ( | ) | ( | ) | ( | ) | |||||
Interest expense | ( | ) | ( | ) | ( | ) | |||||
Interest income | |||||||||||
Loss on extinguishment of debt | ( | ) | ( | ) | ( | ) | |||||
Other expense | ( | ) | ( | ) | ( | ) | |||||
Other income | |||||||||||
Gain (loss) on disposal and sale of business interests | ( | ) | |||||||||
Asset impairment expense | ( | ) | ( | ) | ( | ) | |||||
Foreign currency transaction gains (losses) | ( | ) | ( | ) | |||||||
Other non-operating expense | ( | ) | ( | ) | |||||||
INCOME FROM CONTINUING OPERATIONS BEFORE TAXES AND EQUITY IN EARNINGS OF AFFILIATES | |||||||||||
Income tax expense | ( | ) | ( | ) | ( | ) | |||||
Net equity in earnings (losses) of affiliates | ( | ) | |||||||||
INCOME (LOSS) FROM CONTINUING OPERATIONS | ( | ) | |||||||||
Loss from operations of discontinued businesses, net of income tax expense of $0, $2, and $21, respectively | ( | ) | ( | ) | |||||||
Gain (loss) from disposal of discontinued businesses, net of income tax expense of $0, $44, and $0, respectively | ( | ) | |||||||||
NET INCOME (LOSS) | ( | ) | |||||||||
Less: Income from continuing operations attributable to noncontrolling interests and redeemable stock of subsidiaries | ( | ) | ( | ) | ( | ) | |||||
Less: Loss (income) from discontinued operations attributable to noncontrolling interests | ( | ) | |||||||||
NET INCOME (LOSS) ATTRIBUTABLE TO THE AES CORPORATION | $ | $ | $ | ( | ) | ||||||
AMOUNTS ATTRIBUTABLE TO THE AES CORPORATION COMMON STOCKHOLDERS: | |||||||||||
Income (loss) from continuing operations, net of tax | $ | $ | $ | ( | ) | ||||||
Income (loss) from discontinued operations, net of tax | ( | ) | |||||||||
NET INCOME (LOSS) ATTRIBUTABLE TO THE AES CORPORATION | $ | $ | $ | ( | ) | ||||||
BASIC EARNINGS PER SHARE: | |||||||||||
Income (loss) from continuing operations attributable to The AES Corporation common stockholders, net of tax | $ | $ | $ | ( | ) | ||||||
Income (loss) from discontinued operations attributable to The AES Corporation common stockholders, net of tax | ( | ) | |||||||||
NET INCOME (LOSS) ATTRIBUTABLE TO THE AES CORPORATION COMMON STOCKHOLDERS | $ | $ | $ | ( | ) | ||||||
DILUTED EARNINGS PER SHARE: | |||||||||||
Income (loss) from continuing operations attributable to The AES Corporation common stockholders, net of tax | $ | $ | $ | ( | ) | ||||||
Income (loss) from discontinued operations attributable to The AES Corporation common stockholders, net of tax | ( | ) | |||||||||
NET INCOME (LOSS) ATTRIBUTABLE TO THE AES CORPORATION COMMON STOCKHOLDERS | $ | $ | $ | ( | ) | ||||||
See Accompanying Notes to Consolidated Financial Statements.
121
Consolidated Statements of Comprehensive Income (Loss)
Years ended December 31, 2019, 2018, and 2017
2019 | 2018 | 2017 | |||||||||
(in millions) | |||||||||||
NET INCOME (LOSS) | $ | $ | $ | ( | ) | ||||||
Foreign currency translation activity: | |||||||||||
Foreign currency translation adjustments, net of income tax benefit of $1, $2 and $17, respectively | ( | ) | ( | ) | ( | ) | |||||
Reclassification to earnings, net of $0 income tax for all periods | ( | ) | |||||||||
Total foreign currency translation adjustments | ( | ) | ( | ) | |||||||
Derivative activity: | |||||||||||
Change in derivative fair value, net of income tax benefit of $74, $27 and $10, respectively | ( | ) | ( | ) | ( | ) | |||||
Reclassification to earnings, net of income tax expense of $12, $24 and $1, respectively | |||||||||||
Total change in fair value of derivatives | ( | ) | |||||||||
Pension activity: | |||||||||||
Change in pension adjustments due to prior service cost, net of income tax benefit (expense) of $0, $1 and $(1), respectively | ( | ) | |||||||||
Change in pension adjustments due to net actuarial gain (loss) for the period, net of income tax benefit of $10, $1 and $6, respectively | ( | ) | ( | ) | ( | ) | |||||
Reclassification to earnings, net of income tax expense of $13, $2 and $135, respectively | |||||||||||
Total pension adjustments | |||||||||||
OTHER COMPREHENSIVE INCOME (LOSS) | ( | ) | ( | ) | |||||||
COMPREHENSIVE INCOME | |||||||||||
Less: Comprehensive income attributable to noncontrolling interests and redeemable stock of subsidiaries | ( | ) | ( | ) | ( | ) | |||||
COMPREHENSIVE INCOME (LOSS) ATTRIBUTABLE TO THE AES CORPORATION | $ | $ | $ | ( | ) | ||||||
See Accompanying Notes to Consolidated Financial Statements.
122
Consolidated Statements of Changes in Equity
Years ended December 31, 2019, 2018, and 2017
THE AES CORPORATION STOCKHOLDERS | |||||||||||||||||||||||||||||
Common Stock | Treasury Stock | Additional Paid-In Capital | Accumulated Deficit | Accumulated Other Comprehensive Loss | Noncontrolling Interests | ||||||||||||||||||||||||
(in millions) | Shares | Amount | Shares | Amount | |||||||||||||||||||||||||
Balance at December 31, 2016 | $ | $ | ( | ) | $ | $ | ( | ) | $ | ( | ) | $ | |||||||||||||||||
Net income (loss) | ( | ) | |||||||||||||||||||||||||||
Total foreign currency translation adjustment, net of income tax | ( | ) | |||||||||||||||||||||||||||
Total change in derivative fair value, net of income tax | |||||||||||||||||||||||||||||
Total pension adjustments, net of income tax | |||||||||||||||||||||||||||||
Total other comprehensive income | — | — | — | — | — | — | |||||||||||||||||||||||
Cumulative effect of a change in accounting principle (1) | |||||||||||||||||||||||||||||
Fair value adjustment (2) | ( | ) | |||||||||||||||||||||||||||
Disposition of business interests (3) | ( | ) | |||||||||||||||||||||||||||
Distributions to noncontrolling interests | ( | ) | |||||||||||||||||||||||||||
Contributions from noncontrolling interests | |||||||||||||||||||||||||||||
Dividends declared on common stock ($0.49/share) | ( | ) | |||||||||||||||||||||||||||
Issuance and exercise of stock-based compensation benefit plans, net of income tax | ( | ) | |||||||||||||||||||||||||||
Sales to noncontrolling interests | |||||||||||||||||||||||||||||
Acquisition of subsidiary shares from noncontrolling interests | ( | ) | |||||||||||||||||||||||||||
Less: Net loss attributable to redeemable stock of subsidiaries | |||||||||||||||||||||||||||||
Balance at December 31, 2017 | $ | $ | ( | ) | $ | $ | ( | ) | $ | ( | ) | $ | |||||||||||||||||
Net income | |||||||||||||||||||||||||||||
Total foreign currency translation adjustment, net of income tax | ( | ) | |||||||||||||||||||||||||||
Total change in derivative fair value, net of income tax | |||||||||||||||||||||||||||||
Total pension adjustments, net of income tax | ( | ) | |||||||||||||||||||||||||||
Total other comprehensive income (loss) | — | — | — | — | — | — | ( | ) | |||||||||||||||||||||
Cumulative effect of a change in accounting principle (1) | |||||||||||||||||||||||||||||
Fair value adjustment (2) | ( | ) | |||||||||||||||||||||||||||
Disposition of business interests (3) | ( | ) | |||||||||||||||||||||||||||
Distributions to noncontrolling interests | ( | ) | |||||||||||||||||||||||||||
Contributions from noncontrolling interests | |||||||||||||||||||||||||||||
Dividends declared on common stock ($0.53/share) | ( | ) | |||||||||||||||||||||||||||
Issuance and exercise of stock-based compensation benefit plans, net of income tax | ( | ) | |||||||||||||||||||||||||||
Sales to noncontrolling interests | ( | ) | |||||||||||||||||||||||||||
Balance at December 31, 2018 | $ | $ | ( | ) | $ | $ | ( | ) | $ | ( | ) | $ | |||||||||||||||||
Net income | |||||||||||||||||||||||||||||
Total foreign currency translation adjustment, net of income tax | ( | ) | |||||||||||||||||||||||||||
Total change in derivative fair value, net of income tax | ( | ) | ( | ) | |||||||||||||||||||||||||
Total pension adjustments, net of income tax | ( | ) | |||||||||||||||||||||||||||
Total other comprehensive loss | — | — | — | — | — | — | ( | ) | ( | ) | |||||||||||||||||||
Cumulative effect of a change in accounting principle (1) | ( | ) | |||||||||||||||||||||||||||
Fair value adjustment (2) | ( | ) | |||||||||||||||||||||||||||
Distributions to noncontrolling interests | ( | ) | |||||||||||||||||||||||||||
Contributions from noncontrolling interests | |||||||||||||||||||||||||||||
Dividends declared on common stock ($0.5528/share) | ( | ) | |||||||||||||||||||||||||||
Issuance and exercise of stock-based compensation benefit plans, net of income tax | ( | ) | |||||||||||||||||||||||||||
Sales to noncontrolling interests | ( | ) | |||||||||||||||||||||||||||
Balance at December 31, 2019 | $ | $ | ( | ) | $ | $ | ( | ) | $ | ( | ) | $ | |||||||||||||||||
(1) See Note 1—General and Summary of Significant Accounting Policies for further information .
(2) Adjustment to the carrying amount of noncontrolling interest and redeemable stock of subsidiaries to fair value.
(3) See Note 25—Held-for-Sale and Dispositions for further information.
See Accompanying Notes to Consolidated Financial Statements.
123
Consolidated Statements of Cash Flows
Years ended December 31, 2019, 2018, and 2017
2019 | 2018 | 2017 | |||||||||
OPERATING ACTIVITIES: | (in millions) | ||||||||||
Net income (loss) | $ | $ | $ | ( | ) | ||||||
Adjustments to net income (loss): | |||||||||||
Depreciation and amortization | |||||||||||
Loss (gain) on disposal and sale of business interests | ( | ) | ( | ) | |||||||
Impairment expenses | |||||||||||
Deferred income taxes | ( | ) | |||||||||
Loss on extinguishment of debt | |||||||||||
Loss on sale and disposal of assets | |||||||||||
Net loss (gain) from disposal and impairments of discontinued businesses | ( | ) | |||||||||
Loss of affiliates, net of dividends | |||||||||||
Other | |||||||||||
Changes in operating assets and liabilities: | |||||||||||
(Increase) decrease in accounts receivable | ( | ) | ( | ) | |||||||
(Increase) decrease in inventory | ( | ) | ( | ) | |||||||
(Increase) decrease in prepaid expenses and other current assets | ( | ) | |||||||||
(Increase) decrease in other assets | ( | ) | ( | ) | ( | ) | |||||
Increase (decrease) in accounts payable and other current liabilities | ( | ) | |||||||||
Increase (decrease) in income tax payables, net and other tax payables | ( | ) | ( | ) | |||||||
Increase (decrease) in other liabilities | ( | ) | |||||||||
Net cash provided by operating activities | |||||||||||
INVESTING ACTIVITIES: | |||||||||||
Capital expenditures | ( | ) | ( | ) | ( | ) | |||||
Acquisitions of business interests, net of cash and restricted cash acquired | ( | ) | ( | ) | ( | ) | |||||
Proceeds from the sale of business interests, net of cash and restricted cash sold | |||||||||||
Sale of short-term investments | |||||||||||
Purchase of short-term investments | ( | ) | ( | ) | ( | ) | |||||
Contributions and loans to equity affiliates | ( | ) | ( | ) | ( | ) | |||||
Insurance proceeds | |||||||||||
Other investing | ( | ) | ( | ) | ( | ) | |||||
Net cash used in investing activities | ( | ) | ( | ) | ( | ) | |||||
FINANCING ACTIVITIES: | |||||||||||
Borrowings under the revolving credit facilities | |||||||||||
Repayments under the revolving credit facilities | ( | ) | ( | ) | ( | ) | |||||
Issuance of recourse debt | |||||||||||
Repayments of recourse debt | ( | ) | ( | ) | ( | ) | |||||
Issuance of non-recourse debt | |||||||||||
Repayments of non-recourse debt | ( | ) | ( | ) | ( | ) | |||||
Payments for financing fees | ( | ) | ( | ) | ( | ) | |||||
Distributions to noncontrolling interests | ( | ) | ( | ) | ( | ) | |||||
Contributions from noncontrolling interests and redeemable security holders | |||||||||||
Dividends paid on AES common stock | ( | ) | ( | ) | ( | ) | |||||
Payments for financed capital expenditures | ( | ) | ( | ) | ( | ) | |||||
Other financing | |||||||||||
Net cash provided by (used in) financing activities | ( | ) | ( | ) | |||||||
Effect of exchange rate changes on cash, cash equivalents and restricted cash | ( | ) | ( | ) | |||||||
(Increase) decrease in cash, cash equivalents and restricted cash of discontinued operations and held-for-sale businesses | ( | ) | ( | ) | |||||||
Total increase (decrease) in cash, cash equivalents and restricted cash | ( | ) | ( | ) | |||||||
Cash, cash equivalents and restricted cash, beginning | |||||||||||
Cash, cash equivalents and restricted cash, ending | $ | $ | $ | ||||||||
SUPPLEMENTAL DISCLOSURES: | |||||||||||
Cash payments for interest, net of amounts capitalized | $ | $ | $ | ||||||||
Cash payments for income taxes, net of refunds | |||||||||||
SCHEDULE OF NONCASH INVESTING AND FINANCING ACTIVITIES: | |||||||||||
Refinancing of non-recourse debt at Mong Duong (see Note 11) | |||||||||||
Partial reinvestment of consideration from the sPower transaction (see Note 8) | |||||||||||
Acquisition of intangible assets | |||||||||||
Contributions to equity affiliates (see Note 8) | |||||||||||
Exchange of debentures for the acquisition of the Guaimbê Solar Complex (see Note 26) | |||||||||||
Acquisition of the remaining interest in a Distributed Energy equity affiliate (see Note 26) | |||||||||||
Dividends declared but not yet paid | |||||||||||
Conversion of Alto Maipo loans and accounts payable into equity (see Note 17) | |||||||||||
Kazakhstan Hydroelectric return share transfer payment due (see Note 25) | |||||||||||
See Accompanying Notes to Consolidated Financial Statements.
124 | Notes to Consolidated Financial Statements | December 31, 2019, 2018 and 2017 |
Notes to Consolidated Financial Statements
1. GENERAL AND SUMMARY OF SIGNIFICANT ACCOUNTING POLICIES
The AES Corporation is a holding company (the "Parent Company") that, through its subsidiaries and affiliates, (collectively, "AES" or "the Company") operates a geographically diversified portfolio of electricity generation and distribution businesses. Generally, the liabilities of individual operating entities are non-recourse to the Parent Company and are isolated to the operating entities. Most of our operating entities are structured as limited liability entities, which limit the liability of shareholders. The structure is generally the same regardless of whether a subsidiary is consolidated under a voting or variable interest model. The preparation of these consolidated financial statements is in conformity with accounting principles generally accepted in the United States of America ("U.S. GAAP").
PRINCIPLES OF CONSOLIDATION — The consolidated financial statements of the Company include the accounts of The AES Corporation and its controlled subsidiaries. Furthermore, VIEs in which the Company has an ownership interest and is the primary beneficiary, thus controlling the VIE, have been consolidated. Intercompany transactions and balances are eliminated in consolidation. Investments in entities where the Company has the ability to exercise significant influence, but not control, are accounted for using the equity method of accounting.
NONCONTROLLING INTERESTS — Noncontrolling interests are classified as a separate component of equity in the Consolidated Balance Sheets and Consolidated Statements of Changes in Equity. Additionally, net income and comprehensive income attributable to noncontrolling interests are reflected separately from consolidated net income and comprehensive income on the Consolidated Statements of Operations and Consolidated Statements of Changes in Equity. Any change in ownership of a subsidiary while the controlling financial interest is retained is accounted for as an equity transaction between the controlling and noncontrolling interests (unless the transaction qualified as a sale of in-substance real estate). Losses continue to be attributed to the noncontrolling interests, even when the noncontrolling interests' basis has been reduced to zero.
Equity securities with redemption features that are not solely within the control of the issuer are classified outside of permanent equity. Generally, initial measurement will be at fair value. Subsequent measurement and classification vary depending on whether the instrument is probable of becoming redeemable. When the equity instrument is not probable of becoming redeemable, subsequent allocation of income and dividends is classified in permanent equity. For those securities where it is probable that the instrument will become redeemable or that are currently redeemable, AES recognizes changes in the fair value at each accounting period against retained earnings or additional paid-in-capital in the absence of retained earnings, subject to the floor of the initial fair value. Further, the allocation of income and dividends, as well as the adjustment to fair value, is classified outside permanent equity. Instruments that are mandatorily redeemable are classified as a liability.
EQUITY METHOD INVESTMENTS — Investments in entities over which the Company has the ability to exercise significant influence, but not control, are accounted for using the equity method of accounting and reported in Investments in and advances to affiliates on the Consolidated Balance Sheets. The Company’s proportionate share of the net income or loss of these companies is included in Net equity in earnings (losses) of affiliates on the Consolidated Statements of Operations.
The Company utilizes the cumulative earning approach to determine whether distributions received from equity method investees are returns on investment or returns of investment. The Company discontinues the application of the equity method when an investment is reduced to zero and the Company is not otherwise committed to provide further financial support to the investee. The Company resumes the application of the equity method accounting to the extent that net income is greater than the share of net losses not previously recorded.
Upon acquiring the investment, we determine the fair value of the identifiable assets and assumed liabilities and the basis difference between each fair value and the carrying amount of the corresponding asset or liability in the financial statements of the investee. The AES share of the amortization of the basis difference is recognized in Net equity in earnings of affiliates in the Consolidated Statements of Operations over the life of the asset or liability.
The Company periodically assesses if impairment indicators exist at our equity method investments. When an impairment is observed, any excess of the carrying amount over its estimated fair value is recognized as impairment expense when the loss in value is deemed other-than-temporary and included in Other non-operating expense in the Consolidated Statements of Operations.
125 | Notes to Consolidated Financial Statements—(Continued) | December 31, 2019, 2018, and 2017 |
BUSINESS INTERESTS — Acquisitions and disposals of business interests are generally transactions pertaining to operational legal entities, which may be accounted for as a consolidated business, an asset, or an equity method investment. Losses on expected sales of business interests are limited to the impairment of long-lived assets as of the date of execution of the sales agreement, which are recognized in Asset impairment expense in the Consolidated Statements of Operations. Any additional gains/(losses) on sales, which are primarily due to reclassification of cumulative translation adjustments, are recognized in Gain (loss) on disposal and sale of business interests in the Consolidated Statements of Operations upon completion of the sale.
ALLOCATION OF EARNINGS — Certain of the Company's businesses are subject to profit-sharing arrangements where the allocation of cash distributions and the sharing of tax benefits are not based on fixed ownership percentages. These arrangements exist for certain U.S. renewable generation partnerships to designate different allocations of value among investors, where the allocations change in form or percentage over the life of the partnership. For these businesses, the Company uses the hypothetical liquidation at book value (“HLBV”) method when it is a reasonable approximation of the profit-sharing arrangement. The HLBV method calculates the proceeds that would be attributable to each partner based on the liquidation provisions of the respective operating partnership agreement if the partnership was to be liquidated at book value at the balance sheet date. Each partner’s share of income in the period is equal to the change in the amount of net equity they are legally able to claim based on a hypothetical liquidation of the entity at the end of a reporting period compared to the beginning of that period, adjusted for any capital transactions.
The HLBV method is used both to allocate the equity earnings attributable to AES when the Company accounts for the renewable business as an equity method investment and to calculate the earnings attributable to noncontrolling interest when the business is consolidated by AES. In the early months of operations of a renewable generation facility where HLBV results in a significant decrease in the hypothetical liquidation proceeds attributable to the tax equity investor due to the recognition of ITCs or other adjustments as required by the U.S. Internal Revenue Code, the Company records the impact (sometimes referred to as the ‘Day one gain’) to income in the same period.
USE OF ESTIMATES — U.S. GAAP requires the Company to make estimates and assumptions that affect the asset and liability balances reported as of the date of the consolidated financial statements, as well as the revenues and expenses recognized during the reporting period. Actual results could differ from those estimates. Items subject to such estimates and assumptions include: the carrying amount and estimated useful lives of long-lived assets; asset retirement obligations; impairment of goodwill, long-lived assets and equity method investments; valuation allowances for receivables and deferred tax assets; the recoverability of regulatory assets; regulatory liabilities; the fair value of financial instruments; the fair value of assets and liabilities acquired as business combinations or as asset acquisitions by variable interest entities; contingent consideration arising from business combinations or asset acquisitions by variable interest entities; the measurement of equity method investments or noncontrolling interest using the HLBV method for certain renewable generation partnerships; the determination of whether a sale of noncontrolling interests is considered to be a sale of in-substance real estate (as opposed to an equity transaction); pension liabilities; the incremental borrowing rates used in the determination of lease liabilities; the determination of lease and non-lease components in certain generation contracts; environmental liabilities; and potential litigation claims and settlements.
HELD-FOR-SALE DISPOSAL GROUPS— A disposal group classified as held-for-sale is reflected on the balance sheet at the lower of its carrying amount or estimated fair value less cost to sell. A loss is recognized if the carrying amount of the disposal group exceeds its estimated fair value less cost to sell. This loss is limited to the carrying value of long-lived assets until the completion of the sale, at which point, any additional loss is recognized. If the fair value of the disposal group subsequently exceeds the carrying amount while the disposal group is still held-for-sale, any impairment expense previously recognized will be reversed up to the lesser of the previously recognized expense or the subsequent excess.
Assets and liabilities related to a disposal group classified as held-for-sale are segregated in the current balance sheet in the period in which the disposal group is classified as held-for-sale. Assets and liabilities of held-for-sale disposal groups are classified as current when they are expected to be disposed of within twelve months. Transactions between the held-for-sale disposal group and businesses that are expected to continue to exist after the disposal are not eliminated to appropriately reflect the continuing operations and balances held-for-sale. See Note 25—Held-for-Sale and Dispositions for further information.
126 | Notes to Consolidated Financial Statements—(Continued) | December 31, 2019, 2018, and 2017 |
DISCONTINUED OPERATIONS — Discontinued operations reporting occurs only when the disposal of a business or a group of businesses represents a strategic shift that has (or will have) a major effect on the Company's operations and financial results. The Company reports financial results for discontinued operations separately from continuing operations to distinguish the financial impact of disposal transactions from ongoing operations. Prior period amounts in the Consolidated Statements of Operations and Consolidated Balance Sheets are retrospectively revised to reflect the businesses determined to be discontinued operations. The cash flows of businesses that are determined to be discontinued operations are included within the relevant categories within operating, investing and financing activities on the face of the Consolidated Statements of Cash Flows.
Transactions between the businesses determined to be discontinued operations and businesses that are expected to continue to exist after the disposal are not eliminated to appropriately reflect the continuing operations and balances held-for-sale. The results of discontinued operations include any gain or loss recognized on closing or adjustment of the carrying amount to fair value less cost to sell, including gains or losses associated with noncontrolling interests upon completion of the disposal transaction. Adjustments related to components previously reported as discontinued operations under prior accounting guidance are presented as discontinued operations in the current period even if the disposed-of component to which the adjustments are related would not meet the criteria for presentation as a discontinued operation under current guidance. See Note 24—Discontinued Operations for further information.
FAIR VALUE — Fair value is the price that would be received to sell an asset or paid to transfer a liability in an orderly, hypothetical transaction between market participants at the measurement date, or exit price. The Company applies the fair value measurement accounting guidance to financial assets and liabilities in determining the fair value of investments in marketable debt and equity securities, included in the Consolidated Balance Sheet line items Short-term investments and Other noncurrent assets; derivative assets, included in Other current assets and Other noncurrent assets; and, derivative liabilities, included in Accrued and other liabilities (current) and Other noncurrent liabilities. The Company applies the fair value measurement guidance to nonfinancial assets and liabilities upon the acquisition of a business or an asset acquisition by a variable interest entity, or in conjunction with the measurement of an asset retirement obligation or a potential impairment loss on an asset group, equity method investments, or goodwill.
When determining the fair value measurements for assets and liabilities required to be reflected at their fair values, the Company considers the principal or most advantageous market in which it would transact and considers assumptions that market participants would use when pricing the assets or liabilities, such as inherent risk, transfer restrictions and risk of nonperformance. The Company is prohibited from including transaction costs and any adjustments for blockage factors in determining fair value.
In determining fair value measurements, the Company maximizes the use of observable inputs and minimizes the use of unobservable inputs. Assets and liabilities are categorized within a fair value hierarchy based upon the lowest level of input that is significant to the fair value measurement:
• | Level 1: Quoted prices in active markets for identical assets or liabilities; |
• | Level 2: Inputs other than Level 1 that are observable, either directly or indirectly, such as quoted prices in active markets for similar assets or liabilities, quoted prices for identical or similar assets or liabilities in markets that are not active or other inputs that are observable or can be corroborated by observable market data for substantially the full term of the assets or liabilities; or |
• | Level 3: Unobservable inputs that are supported by little or no market activity and that are significant to the fair values of the assets or liabilities. |
Any transfers between all levels within the fair value hierarchy levels are recognized at the end of the reporting period.
CASH AND CASH EQUIVALENTS — The Company considers unrestricted cash on hand, cash balances not restricted as to withdrawal or usage, deposits in banks, certificates of deposit and short-term marketable securities with original maturities of three months or less to be cash and cash equivalents.
RESTRICTED CASH AND DEBT SERVICE RESERVES — Cash balances restricted as to withdrawal or usage, primarily via contract, are considered restricted cash.
127 | Notes to Consolidated Financial Statements—(Continued) | December 31, 2019, 2018, and 2017 |
The following table provides a summary of cash, cash equivalents, and restricted cash amounts reported on the Consolidated Balance Sheets that reconcile to the total of such amounts as shown on the Consolidated Statements of Cash Flows (in millions):
December 31, 2019 | December 31, 2018 | ||||||
Cash and cash equivalents | $ | $ | |||||
Restricted cash | |||||||
Debt service reserves and other deposits | |||||||
Cash, Cash Equivalents and Restricted Cash | $ | $ | |||||
INVESTMENTS IN MARKETABLE SECURITIES — The Company's marketable investments are primarily unsecured debentures, certificates of deposit, government debt securities and money market funds.
Short-term investments consist of marketable equity securities and debt securities with original maturities in excess of three months with remaining maturities of less than one year. Marketable debt securities where the Company has both the positive intent and ability to hold to maturity are classified as held-to-maturity and are carried at amortized cost. Remaining marketable debt securities are classified as available-for-sale or trading and are carried at fair value.
Unrealized gains or losses on available-for-sale debt securities are reflected in AOCL, a separate component of equity, and the Consolidated Statements of Operations, respectively. Unrealized gains or losses on equity investments are reported in Other income. Interest and dividends on investments are reported in Interest income and Other income, respectively. Gains and losses on sales of investments are determined using the specific identification method.
INVENTORY — Inventory primarily consists of fuel and other raw materials used to generate power, and operational spare parts and supplies used to maintain power generation and distribution facilities. Inventory is carried at lower of cost or net realizable value. Cost is the sum of the purchase price and expenditures incurred to bring the inventory to its existing location. Inventory is primarily valued using the average cost method. Generally, if it is expected fuel inventory will not be recovered through revenue earned from power generation, an impairment is recognized to reflect the fuel at market value. The carrying amount of spare parts and supplies is typically reduced only in instances where the items are considered obsolete.
LONG-LIVED ASSETS — Long-lived assets include property, plant and equipment, assets under finance leases and intangible assets subject to amortization (i.e., finite-lived intangible assets).
Property, plant and equipment — Property, plant and equipment are stated at cost, net of accumulated depreciation. The cost of renewals and improvements that extend the useful life of property, plant and equipment are capitalized.
Construction progress payments, engineering costs, insurance costs, salaries, interest and other costs directly relating to construction in progress are capitalized during the construction period, provided the completion of the construction project is deemed probable, or expensed at the time construction completion is determined to no longer be probable. The continued capitalization of such costs is subject to risks related to successful completion, including those related to government approvals, site identification, financing, construction permitting and contract compliance. Construction-in-progress balances are transferred to electric generation and distribution assets when an asset group is ready for its intended use. Government subsidies, liquidated damages recovered for construction delays, and income tax credits are recorded as a reduction to property, plant and equipment and reflected in cash flows from investing activities. Maintenance and repairs are charged to expense as incurred.
Depreciation, after consideration of salvage value and asset retirement obligations, is computed using the straight-line method over the estimated useful lives of the assets, which are determined on a composite or component basis. Capital spare parts, including rotable spare parts, are included in electric generation and
128 | Notes to Consolidated Financial Statements—(Continued) | December 31, 2019, 2018, and 2017 |
distribution assets. If the spare part is considered a component, it is depreciated over its useful life after the part is placed in service. If the spare part is deemed part of a composite asset, the part is depreciated over the composite useful life even when being held as a spare part.
Certain of the Company's subsidiaries operate under concession contracts. Certain estimates are utilized to determine depreciation expense for the subsidiaries, including the useful lives of the property, plant and equipment and the amounts to be recovered at the end of the concession contract. The amounts to be recovered under these concession contracts are based on estimates that are inherently uncertain and actual amounts recovered may differ from those estimates. These concession contracts are not within the scope of ASC 853—Service Concession Arrangements.
Intangible Assets Subject to Amortization — Finite-lived intangible assets are amortized over their useful lives which range from 1 – 50 years and are included in the Consolidated Balance Sheet line item Other intangible assets. The Company accounts for purchased emission allowances as intangible assets and records an expense when they are utilized or sold. Granted emission allowances are valued at zero.
Impairment of Long-lived Assets — When circumstances indicate the carrying amount of long-lived assets in a held-for-use asset group may not be recoverable, the Company evaluates the assets for potential impairment using internal projections of undiscounted cash flows resulting from the use and eventual disposal of the assets. Events or changes in circumstances that may necessitate a recoverability evaluation include, but are not limited to, adverse changes in the regulatory environment, unfavorable changes in power prices or fuel costs, increased competition due to additional capacity in the grid, technological advancements, declining trends in demand, or an expectation it is more likely than not that the asset will be disposed of before the end of its previously estimated useful life. If the carrying amount of the assets exceeds the undiscounted cash flows, an impairment expense is recognized for the amount by which the carrying amount of the asset group exceeds its fair value (subject to the carrying amount not being reduced below fair value for any individual long-lived asset that is determinable without undue cost and effort). An impairment expense for certain assets may be reduced by the establishment of a regulatory asset if recovery through approved rates is probable.
SERVICE CONCESSION ASSETS — Service concession assets are stated at cost, net of accumulated amortization, in accordance with ASC 853. Service concession assets represent the cost of all infrastructure to be transferred to the public-sector entity grantors at the end of the concession. These costs primarily represent construction progress payments, engineering costs, insurance costs, salaries, interest and other costs directly relating to construction of the service concession infrastructure. Government subsidies, liquidated damages recovered for construction delays and income tax credits are recorded as a reduction to Service Concession Assets. Service concession assets are amortized and recognized in earnings as a cost of goods sold as infrastructure construction revenue is recognized. Services provided under concession arrangements are recognized on a straight line basis.
DEBT ISSUANCE COSTS — Costs incurred in connection with the issuance of long-term debt are deferred and presented as a direct reduction from the face amount of that debt and amortized over the related financing period using the effective interest method. Debt issuance costs related to a line-of-credit or revolving credit facility are deferred and presented as an asset and amortized over the related financing period. Make-whole payments in connection with early debt retirements are classified as cash flows used in financing activities.
GOODWILL AND INDEFINITE-LIVED INTANGIBLE ASSETS — The Company evaluates goodwill and indefinite-lived intangible assets for impairment on an annual basis and whenever events or changes in circumstances necessitate an evaluation for impairment. The Company's annual impairment testing date is October 1st.
Goodwill — Goodwill represents the excess of the purchase price of the business acquisition over the fair value of identifiable net assets acquired. Goodwill resulting from an acquisition is assigned to the reporting units that are expected to benefit from the synergies of the acquisition. Generally, each AES business with a goodwill balance constitutes a reporting unit as they are not similar to other businesses in a segment nor are they reported to segment management together with other businesses.
Goodwill is evaluated for impairment either under the qualitative assessment option or the quantitative test option to determine the fair value of the reporting unit. If goodwill is determined to be impaired, an impairment loss measured at the amount by which the reporting unit’s carrying amount exceeds its fair value, not to exceed the carrying amount of goodwill, is recorded.
129 | Notes to Consolidated Financial Statements—(Continued) | December 31, 2019, 2018, and 2017 |
Indefinite-Lived Intangible Assets — The Company's indefinite-lived intangible assets primarily include land-use rights and water rights. Indefinite-lived intangible assets are evaluated for impairment either under the qualitative assessment option or the two-step quantitative test. If the carrying amount of an intangible asset being tested for impairment exceeds its fair value, the excess is recognized as impairment expense.
ACCOUNTS PAYABLE AND OTHER ACCRUED LIABILITIES — Accounts payable consists of amounts due to trade creditors related to the Company's core business operations. These payables include amounts owed to vendors and suppliers for items such as energy purchased for resale, fuel, maintenance, inventory and other raw materials. Other accrued liabilities include items such as income taxes, regulatory liabilities, legal contingencies and employee-related costs, including payroll, and benefits.
REGULATORY ASSETS AND LIABILITIES — The Company recognizes assets and liabilities that result from regulated ratemaking processes. Regulatory assets generally represent incurred costs which have been deferred due to the probable future recovery via customer rates. Generally, returns earned on regulatory assets are reflected in the Consolidated Statement of Operations within Interest Income. Regulatory liabilities generally represent obligations to refund customers. Management continually assesses whether regulatory assets are probable of future recovery and regulatory liabilities are probable of future payment by considering factors such as applicable regulatory changes, recent rate orders applicable to other regulated entities, and the status of any pending or potential deregulation legislation. If future recovery of costs previously deferred ceases to be probable, the related regulatory assets are written off and recognized in income from continuing operations.
PENSION AND OTHER POSTRETIREMENT PLANS — The Company recognizes in its Consolidated Balance Sheets an asset or liability reflecting the funded status of pension and other postretirement plans with current-year changes in actuarial gains or losses recognized in AOCL, except for those plans at certain of the Company's regulated utilities that can recover portions of their pension and postretirement obligations through future rates. All plan assets are recorded at fair value. AES follows the measurement date provisions of the accounting guidance, which require a year-end measurement date of plan assets and obligations for all defined benefit plans.
INCOME TAXES — Deferred tax assets and liabilities are recognized for the future tax consequences attributable to differences between the financial statement carrying amounts of the existing assets and liabilities, and their respective income tax basis. The Company establishes a valuation allowance when it is more likely than not that all or a portion of a deferred tax asset will not be realized. The Company's tax positions are evaluated under a more likely than not recognition threshold and measurement analysis before they are recognized for financial statement reporting.
Uncertain tax positions have been classified as noncurrent income tax liabilities unless expected to be paid within one year. The Company's policy for interest and penalties related to income tax exposures is to recognize interest and penalties as a component of the provision for income taxes in the Consolidated Statements of Operations.
ASSET RETIREMENT OBLIGATIONS — The Company records the fair value of a liability for a legal obligation to retire an asset in the period in which the obligation is incurred. When a new liability is recognized, the Company capitalizes the costs of the liability by increasing the carrying amount of the related long-lived asset. The liability is accreted to its present value each period and the capitalized cost is depreciated over the useful life of the related asset. Upon settlement of the obligation, the Company eliminates the liability and, based on the actual cost to retire, may incur a gain or loss.
FOREIGN CURRENCY TRANSLATION — A business's functional currency is the currency of the primary economic environment in which the business operates and is generally the currency in which the business generates and expends cash. Subsidiaries and affiliates whose functional currency is a currency other than the U.S. dollar translate their assets and liabilities into U.S. dollars at the current exchange rates in effect at the end of the fiscal period. Adjustments arising from the translation of the balance sheet of such subsidiaries are included in AOCL. The revenue and expense accounts of such subsidiaries and affiliates are translated into U.S. dollars at the average exchange rates for the period. Gains and losses on intercompany foreign currency transactions that are long-term in nature and which the Company does not intend to settle in the foreseeable future, are also recognized in AOCL. Gains and losses that arise from exchange rate fluctuations on transactions denominated in a currency
130 | Notes to Consolidated Financial Statements—(Continued) | December 31, 2019, 2018, and 2017 |
REVENUE RECOGNITION — Revenue is earned from the sale of electricity from our utilities and the production and sale of electricity and capacity from our generation facilities. Revenue is recognized upon the transfer of control of promised goods or services to customers in an amount that reflects the consideration to which we expect to be entitled in exchange for those goods or services. Revenue is recorded net of any taxes assessed on and collected from customers, which are remitted to the governmental authorities.
Utilities — Our utilities sell electricity directly to end-users, such as homes and businesses, and bill customers directly. The majority of our utility contracts have a single performance obligation, as the promises to transfer energy, capacity, and other distribution and/or transmission services are not distinct. Additionally, as the performance obligation is satisfied over time as energy is delivered, and the same method is used to measure progress, the performance obligation meets the criteria to be considered a series. Utility revenue is classified as regulated on the Consolidated Statements of Operations.
In exchange for the right to sell or distribute electricity in a service territory, our utility businesses are subject to government regulation. This regulation sets the framework for the prices (“tariffs”) that our utilities are allowed to charge customers for electricity. Since tariffs are determined by the regulator, the price that our utilities have the right to bill corresponds directly with the value to the customer of the utility's performance completed in each period. The Company also has some month-to-month contracts. Revenue under these contracts is recognized using an output method measured by the MWh delivered each month, which best depicts the transfer of goods or services to the customer, at the approved tariff.
The Company has businesses where it sells and purchases power to and from ISOs and RTOs. Our utility businesses generally purchase power to satisfy the demand of customers that is not contracted through separate PPAs. In these instances, the Company accounts for these transactions on a net hourly basis because the transactions are settled on a net hourly basis. In limited situations, a utility customer may choose to receive generation services from a third-party provider, in which case the Company may serve as a billing agent for the provider and recognize revenue on a net basis.
Generation — Most of our generation fleet sells electricity under contracts to customers such as utilities, industrial users, and other intermediaries. Our generation contracts, based on specific facts and circumstances, can have one or more performance obligations as the promise to transfer energy, capacity, and other services may or may not be distinct depending on the nature of the market and terms of the contract. As the performance obligations are generally satisfied over time and use the same method to measure progress, the performance obligations meet the criteria to be considered a series. In measuring progress toward satisfaction of a performance obligation, the Company applies the "right to invoice" practical expedient when available, and recognizes revenue in the amount to which the Company has a right to consideration from a customer that corresponds directly with the value of the performance completed to date. Revenue from generation businesses is classified as non-regulated on the Consolidated Statements of Operations.
For contracts determined to have multiple performance obligations, we allocate revenue to each performance obligation based on its relative standalone selling price using a market or expected cost plus margin approach. Additionally, the Company allocates variable consideration to one or more, but not all, distinct goods or services that form part of a single performance obligation when (1) the variable consideration relates specifically to the efforts to transfer the distinct good or service and (2) the variable consideration depicts the amount to which the Company expects to be entitled in exchange for transferring the promised good or service to the customer.
Revenue from generation contracts is recognized using an output method, as energy and capacity delivered best depicts the transfer of goods or services to the customer. Performance obligations including energy or ancillary services (such as operations and maintenance and dispatch services) are generally measured by the MWh delivered. Capacity, which is a stand-ready obligation to deliver energy when required by the customer, is measured using MWs. In certain contracts, if plant availability exceeds a contractual target, the Company may receive a performance bonus payment, or if the plant availability falls below a guaranteed minimum target, we may incur a non-availability penalty. Such bonuses or penalties represent a form of variable consideration and are estimated and recognized when it is probable that there will not be a significant reversal.
131 | Notes to Consolidated Financial Statements—(Continued) | December 31, 2019, 2018, and 2017 |
In assessing whether variable quantities are considered variable consideration or an option to acquire additional goods and services, the Company evaluates the nature of the promise and the legally enforceable rights in the contract. In some contracts, such as requirement contracts, the legally enforceable rights merely give the customer a right to purchase additional goods and services which are distinct. In these contracts, the customer's action results in a new obligation, and the variable quantities are considered an option.
When energy or capacity is sold or purchased in the spot market or to ISOs, the Company assesses the facts and circumstances to determine gross versus net presentation of spot revenues and purchases. Generally, the nature of the performance obligation is to sell surplus energy or capacity above contractual commitments, or to purchase energy or capacity to satisfy deficits. Generally, on an hourly basis, a generator is either a net seller or a net buyer in terms of the amount of energy or capacity transacted with the ISO. In these situations, the Company recognizes revenue for the hours where the generator is a net seller and cost of sales for the hours where the generator is a net buyer.
Certain generation contracts contain operating leases where capacity payments are generally considered lease elements. In such cases, the allocation between the lease and non-lease elements is made at the inception of the lease following the guidance in ASC 842.
The transaction price allocated to a construction performance obligation is recognized as revenue over time as construction activity occurs, with revenue being fully recognized upon completion of construction. These contracts may include a difference in timing between revenue recognition and the collection of cash receipts, which may be collected over the term of the entire arrangement. The timing difference could result in a significant financing component for the construction performance obligation if determined to be a material component of the transaction price. The Company accounts for a significant financing component under the effective interest rate method, recognizing a long-term receivable for the expected future payments related to the construction performance obligation in the Loan Receivable line item on the Consolidated Balance Sheets. As payments are collected from the customer over the term of the contract, consideration related to the construction performance obligation is bifurcated between the principal repayment of the long-term receivable and the related interest income, recognized in the Consolidated Statements of Operations.
Contract Balances — The timing of revenue recognition, billings, and cash collections results in accounts receivable and contract liabilities. Accounts receivable represent unconditional rights to consideration and consist of both billed amounts and unbilled amounts typically resulting from sales under long-term contracts when revenue recognized exceeds the amount billed to the customer. We bill both generation and utilities customers on a contractually agreed-upon schedule, typically at periodic intervals (e.g., monthly). The calculation of revenue earned but not yet billed is based on the number of days not billed in the month, the estimated amount of energy delivered during those days and the estimated average price per customer class for that month.
Our contract liabilities consist of deferred revenue which is classified as current or noncurrent based on the timing of when we expect to recognize revenue. The current portion of our contract liabilities is reported in Accrued and other liabilities and the noncurrent portion is reported in Other noncurrent liabilities on the Consolidated Balance Sheets.
Remaining Performance Obligations — The transaction price allocated to remaining performance obligations represents future consideration for unsatisfied (or partially unsatisfied) performance obligations at the end of the reporting period. The Company has elected to apply the optional disclosure exemptions under ASC 606. Therefore, the amount disclosed in Note 20—Revenue excludes contracts with an original length of one year or less, contracts for which we recognize revenue based on the amount we have the right to invoice for services performed, and variable consideration allocated entirely to a wholly unsatisfied performance obligation when the consideration relates specifically to our efforts to satisfy the performance obligation and depicts the amount to which we expect to be entitled. As such, consideration for energy is excluded from the amount disclosed as the variable consideration relates to the amount of energy delivered and reflects the value the Company expects to receive for the energy transferred. Estimates of revenue expected to be recognized in future periods also exclude unexercised customer options to purchase additional goods or services that do not represent material rights to the customer.
LEASES — The Company has operating and finance leases for energy production facilities, land, office space, transmission lines, vehicles and other operating equipment in which the Company is the lessee. Operating leases with an initial term of 12 months or less are not recorded on the balance sheet, but are expensed on a straight-line basis over the lease term. The Company’s leases do not contain any material residual value guarantees, restrictive covenants or subleases.
132 | Notes to Consolidated Financial Statements—(Continued) | December 31, 2019, 2018, and 2017 |
Right-of-use assets represent our right to use an underlying asset for the lease term while lease liabilities represent our obligation to make lease payments arising from the lease. Right-of-use assets and lease liabilities are recognized on commencement of the lease based on the present value of lease payments over the lease term. Generally, the rate implicit in the lease is not readily determinable; as such, we use the subsidiaries’ incremental borrowing rate based on the information available at commencement date in determining the present value of lease payments. The Company determines discount rates based on its existing credit rates of its unsecured borrowings, which are then adjusted for the appropriate lease term and currency. The right-of-use asset also includes any lease payments made and excludes lease incentives that are paid or payable to the lessee at commencement. The lease term includes the option to extend or terminate the lease if it is reasonably certain that the option will be exercised.
The Company has operating leases for certain generation contracts that contain provisions to provide capacity to a customer, which is a stand-ready obligation to deliver energy when required by the customer in which the Company is the lessor. Capacity payments are generally considered lease elements as they cover the majority of available output from a facility. The allocation of contract payments between the lease and non-lease elements is made at the inception of the lease. Lease payments from such contracts are recognized as lease revenue on a straight-line basis over the lease term, whereas variable lease payments are recognized when earned.
The Company has sales-type leases for battery energy storage systems ("BESS") in which the Company is the lessor. These arrangements allow customers the ability to determine when to charge and discharge the BESS, representing the transfer of control and constitutes the arrangement as a sales-type lease. Upon commencement of the lease, the book value of the leased asset is removed from the balance sheet and a net investment in sales-type lease is recognized based on the present value of fixed payments under the contract and the residual value of the underlying asset.
SHARE-BASED COMPENSATION — The Company grants share-based compensation in the form of stock options, restricted stock units, performance stock units, and performance cash units. The expense is based on the grant-date fair value of the equity or liability instrument issued and is recognized on a straight-line basis over the requisite service period, net of estimated forfeitures. The Company uses a Black-Scholes option pricing model to estimate the fair value of stock options granted to its employees.
GENERAL AND ADMINISTRATIVE EXPENSES — General and administrative expenses include corporate and other expenses related to corporate staff functions and initiatives, primarily executive management, finance, legal, human resources and information systems, which are not directly allocable to our business segments. Additionally, all costs associated with corporate business development efforts are classified as general and administrative expenses.
DERIVATIVES AND HEDGING ACTIVITIES — Under the accounting standards for derivatives and hedging, the Company recognizes all contracts that meet the definition of a derivative, except those designated as normal purchase or normal sale at inception, as either assets or liabilities in the Consolidated Balance Sheets and measures those instruments at fair value. See Note 5—Fair Value and Fair value in this section for additional discussion regarding the determination of fair value.
PPAs and fuel supply agreements are evaluated to assess if they contain either a derivative or an embedded derivative requiring separate valuation and accounting. Generally, these agreements do not meet the definition of a derivative, often due to the inability to be net settled. On a quarterly basis, we evaluate the markets for commodities to be delivered under these agreements to determine if facts and circumstances have changed such that the agreements could be net settled and meet the definition of a derivative.
The Company typically designates its derivative instruments as cash flow hedges if they meet the criteria specified in ASC 815, Derivatives and Hedging. The Company enters into interest rate swap agreements in order to hedge the variability of expected future cash interest payments. Foreign currency contracts are used to reduce risks arising from the change in fair value of certain foreign currency denominated assets and liabilities. The objective of these practices is to minimize the impact of foreign currency fluctuations on operating results. The Company also enters into commodity contracts to economically hedge price variability inherent in electricity sales arrangements. The objectives of the commodity contracts are to minimize the impact of variability in spot electricity prices and stabilize estimated revenue streams. The Company does not use derivative instruments for speculative purposes.
For our hedges, changes in fair value are deferred in AOCL and are recognized into earnings as the hedged transactions affect earnings. If a derivative is no longer highly effective, hedge accounting will be discontinued
133 | Notes to Consolidated Financial Statements—(Continued) | December 31, 2019, 2018, and 2017 |
prospectively. For cash flow hedges of forecasted transactions, AES estimates the future cash flows of the forecasted transactions and evaluates the probability of the occurrence and timing of such transactions.
Changes in the fair value of derivatives not designated and qualifying as cash flow hedges are immediately recognized in earnings. Regardless of when gains or losses on derivatives are recognized in earnings, they are generally classified as interest expense for interest rate and cross-currency derivatives, foreign currency transaction gains or losses for foreign currency derivatives, and non-regulated revenue or non-regulated cost of sales for commodity and other derivatives. Cash flows arising from derivatives are included in the Consolidated Statements of Cash Flows as an operating activity given the nature of the underlying risk being economically hedged and the lack of significant financing elements, except that cash flows on designated and qualifying hedges of variable-rate interest during construction are classified as an investing activity. The Company has elected not to offset net derivative positions in the financial statements.
NEW ACCOUNTING PRONOUNCEMENTS — The following table provides a brief description of recent accounting pronouncements that had an impact on the Company’s consolidated financial statements. Accounting pronouncements not listed below were assessed and determined to be either not applicable or did not have a material impact on the Company’s consolidated financial statements.
New Accounting Standards Adopted | |||
ASU Number and Name | Description | Date of Adoption | Effect on the financial statements upon adoption |
2014-09, 2015-14, 2016-08, 2016-10, 2016-12, 2016-20, 2017-10, 2017-13, Revenue from Contracts with Customers (Topic 606) | See discussion of the ASU below. | January 1, 2018 | See impact upon adoption of the standard below. |
2018-02, Income Statement — Reporting Comprehensive Income (Topic 220), Reclassification of Certain Tax Effects from AOCI | This amendment allows a reclassification of the stranded tax effects resulting from the implementation of the Tax Cuts and Jobs Act from AOCI to retained earnings at the election of the filer. Because this amendment only relates to the reclassification of the income tax effects of the Tax Cuts and Jobs Act, the underlying guidance that requires that the effect of a change in tax laws or rates be included in income from continuing operations is not affected. | January 1, 2019 | The Company has not elected to reclassify any amounts to retained earnings. The Company’s accounting policy for releasing the income tax effects from AOCI occurs on a portfolio basis. |
2017-12, Derivatives and Hedging (Topic 815): Targeted improvements to Accounting for Hedging Activities | The standard updates the hedge accounting model to expand the ability to hedge nonfinancial and financial risk components, reduce complexity, and ease certain documentation and assessment requirements. When facts and circumstances are the same as at the previous quantitative test, a subsequent quantitative effectiveness test is not required. The standard also eliminates the requirement to separately measure and report hedge ineffectiveness. For cash flow hedges, this means that the entire change in the fair value of a hedging instrument will be recorded in other comprehensive income and amounts deferred will be reclassified to earnings in the same income statement line as the hedged item. Transition method: modified retrospective with the cumulative effect adjustment recorded to the opening balance of retained earnings as of the initial application date. Prospective for presentation and disclosures. | January 1, 2019 | The adoption of this standard resulted in a $4 million decrease to accumulated deficit. |
2014-09, 2015-14, 2016-08, 2016-10, 2016-12, 2016-20, 2017-10, 2017-13, Revenue from Contracts with Customers (Topic 606) | ASC 606 was adopted by sPower on January 1, 2019. sPower was not required to adopt ASC 606 using the public adoption date, as sPower is an equity method investee that meets the definition of a public business entity only by virtue of the inclusion of its summarized financial information in the Company’s SEC filings. Under the previous revenue standard, the payment received by sPower for the transfer of Incentive Tax Credits related to projects was deferred and recognized in revenue over time. Under ASC 606, this payment is recognized at a point in time. | January 1, 2019 | The adoption of this standard resulted in a $6 million decrease to accumulated deficit attributable to the AES Corporation stockholders’ equity. |
2016-02, 2018-01, 2018-10, 2018-11, 2018-20, 2019-01, Leases (Topic 842) | See discussion of the ASU below. | January 1, 2019 | See impact upon adoption of the standard below. |
ASC 842 — Leases
On January 1, 2019, the Company adopted ASC 842 Leases and its subsequent corresponding updates (“ASC 842”). Under this standard, lessees are required to recognize assets and liabilities for most leases on the balance sheet, and recognize expenses in a manner similar to the prior accounting method. For lessors, the guidance
134 | Notes to Consolidated Financial Statements—(Continued) | December 31, 2019, 2018, and 2017 |
modifies the lease classification criteria and the accounting for sales-type and direct financing leases. The guidance eliminates previous real estate-specific provisions.
Under ASC 842, fewer of our contracts contain a lease. However, due to the elimination of the real estate-specific guidance and changes to certain lessor classification criteria, more leases qualify as sales-type leases and direct financing leases. Under these two models, a lessor derecognizes the asset and recognizes a lease receivable. According to ASC 842, the net investment in the lease includes the fair value of residual interest in the asset after the contract period as well as the present value of the fixed lease payments, but does not include any variable payments under the lease. Therefore, the net investment in the lease could be significantly different than the carrying amount of the underlying asset at lease commencement. In such circumstances, the difference between the initially recognized net investment in the lease and the carrying amount of the underlying asset is recognized as a gain/loss at lease commencement.
During the course of adopting ASC 842, the Company applied various practical expedients including:
• | The package of practical expedients (applied to all leases) that allowed lessees and lessors not to reassess: |
a. | whether any expired or existing contracts are or contain leases, |
b. | lease classification for any expired or existing leases, and |
c. | whether initial direct costs for any expired or existing leases qualify for capitalization under ASC 842. |
• | The transition practical expedient related to land easements, allowing us to carry forward our accounting treatment for land easements on existing agreements, and |
• | The transition practical expedient for lessees that allowed businesses to not separate lease and non-lease components. The Company applied the practical expedient to all classes of underlying assets when valuing right-of-use assets and lease liabilities. Contracts where the Company is the lessor were separated between the lease and non-lease components. |
The Company applied the modified retrospective method of adoption and elected to continue to apply the guidance in ASC 840 Leases to the comparative periods presented in the year of adoption. Under this transition method, the Company applied the transition provisions starting at the date of adoption. The cumulative effect of the adoption of ASC 842 on our January 1, 2019 Consolidated Balance Sheet was as follows (in millions):
Consolidated Balance Sheet | Balance at December 31, 2018 | Adjustments Due to ASC 842 | Balance at January 1, 2019 | ||||||||
Assets | |||||||||||
Other noncurrent assets | $ | $ | $ | ||||||||
Liabilities | |||||||||||
Accrued and other liabilities | |||||||||||
Other noncurrent liabilities | |||||||||||
The primary impact of adoption was due to the recognition of a right-of-use-asset and lease liability for an operating land lease in Panama associated with the Colon LNG power plant and regasification terminal.
ASC 606 — Revenue from Contracts with Customers
On January 1, 2018, the Company adopted ASU 2014-09, "Revenue from Contracts with Customers," and its subsequent corresponding updates ("ASC 606"). Under this standard, an entity shall recognize revenue to depict the transfer of promised goods or services to customers in an amount that reflects the consideration to which the entity expects to be entitled in exchange for those goods or services. The Company applied the modified retrospective method of adoption to the contracts that were not completed as of January 1, 2018. Results for reporting periods beginning January 1, 2018 are presented under ASC 606, while prior period amounts were not adjusted and continue to be reported in accordance with the previous revenue recognition standard. For contracts that were modified before January 1, 2018, the Company reflected the aggregate effect of all modifications when identifying the satisfied and unsatisfied performance obligations, determining the transaction price and allocating the transaction price.
The cumulative effect to our January 1, 2018 Consolidated Balance Sheet resulting from the adoption of ASC 606 was as follows (in millions):
135 | Notes to Consolidated Financial Statements—(Continued) | December 31, 2019, 2018, and 2017 |
Consolidated Balance Sheet | Balance at December 31, 2017 | Adjustments Due to ASC 606 | Balance at January 1, 2018 | ||||||||
Assets | |||||||||||
Other current assets | $ | $ | $ | ||||||||
Deferred income taxes | ( | ) | |||||||||
Service concession assets, net | ( | ) | |||||||||
Loan receivable | |||||||||||
Equity | |||||||||||
Accumulated deficit | ( | ) | ( | ) | |||||||
Accumulated other comprehensive loss | ( | ) | ( | ) | |||||||
Noncontrolling interest | |||||||||||
The Mong Duong II power plant in Vietnam is the primary driver of changes in revenue recognition under the new standard. This plant is operated under a build, operate, and transfer contract and will be transferred to the Vietnamese government after the completion of a 25-year PPA. Under the previous revenue recognition standard, construction costs were deferred to a service concession asset, which was expensed in proportion to revenue recognized for the construction element over the term of the PPA. Under ASC 606, construction revenue and associated costs are recognized as construction activity occurs. As construction of the plant was substantially completed in 2015, revenues and costs associated with the construction were recognized through retained earnings, and the service concession asset was derecognized. A loan receivable was recognized for the future expected payments for the construction performance obligation. As the payments for the construction performance obligation occur over a 25-year term, a significant financing element was determined to exist which is accounted for under the effective interest rate method. The other performance obligation to operate and maintain the facility is measured based on the capacity made available.
The impact to our Consolidated Balance Sheet as of December 31, 2018 resulting from the adoption of ASC 606 as compared to the previous revenue recognition standard was as follows (in millions):
December 31, 2018 | |||||||||||
Consolidated Balance Sheet | As Reported | Balances Without Adoption of ASC 606 | Adoption Impact | ||||||||
Assets | |||||||||||
Other current assets | $ | $ | $ | ||||||||
Deferred income taxes | ( | ) | |||||||||
Service concession assets, net | ( | ) | |||||||||
Loan receivable | |||||||||||
TOTAL ASSETS | |||||||||||
Equity | |||||||||||
Accumulated deficit | ( | ) | ( | ) | |||||||
Accumulated other comprehensive loss | ( | ) | ( | ) | |||||||
Noncontrolling interest | |||||||||||
TOTAL LIABILITIES AND EQUITY | |||||||||||
The impact to our Consolidated Statement of Operations for the year ended December 31, 2018 resulting from the adoption of ASC 606 as compared to the previous revenue recognition standard was as follows (in millions):
Year Ended December 31, 2018 | |||||||||||
Consolidated Statement of Operations | As Reported | Balances Without Adoption of ASC 606 | Adoption Impact | ||||||||
Total revenue | $ | $ | $ | ( | ) | ||||||
Total cost of sales | ( | ) | ( | ) | |||||||
Operating margin | ( | ) | |||||||||
Interest income | |||||||||||
Other Income | |||||||||||
Income from continuing operations before taxes and equity in earnings of affiliates | |||||||||||
INCOME FROM CONTINUING OPERATIONS | |||||||||||
NET INCOME | |||||||||||
NET INCOME ATTRIBUTABLE TO THE AES CORPORATION | |||||||||||
New Accounting Pronouncements Issued But Not Yet Effective — The following table provides a brief description of recent accounting pronouncements that could have a material impact on the Company’s consolidated financial statements once adopted. Accounting pronouncements not listed below were assessed and determined to
136 | Notes to Consolidated Financial Statements—(Continued) | December 31, 2019, 2018, and 2017 |
be either not applicable or are expected to have no material impact on the Company’s consolidated financial statements.
New Accounting Standards Issued But Not Yet Effective | |||
ASU Number and Name | Description | Date of Adoption | Effect on the financial statements upon adoption |
2019-12, Income Taxes (Topic 740): Simplifying the Accounting For Income Taxes | The standard removes certain exceptions for recognizing deferred taxes for investments, performing intraperiod allocation and calculating income taxes in interim periods. It also adds guidance to reduce complexity in certain areas, including recognizing deferred taxes for tax goodwill and allocating taxes to members of a consolidated group. Transition Method: various | January 1, 2021. Early adoption is permitted. | The Company is currently evaluating the impact of adopting the standard on its consolidated financial statements. |
2016-13, 2018-19, 2019-04, 2019-05, 2019-10, 2019-11, Financial Instruments — Credit Losses (Topic 326): Measurement of Credit Losses on Financial Instruments | See discussion of the ASU below. | January 1, 2020. Early adoption is permitted only as of January 1, 2019. | The Company will adopt the standard on January 1, 2020; see below for the evaluation of the impact of the adoption on the consolidated financial statements. |
ASU 2016-13 and its subsequent corresponding updates will update the impairment model for financial assets measured at amortized cost, known as the Current Expected Credit Loss (“CECL”) model. For trade and other receivables, held-to-maturity debt securities, loans and other instruments, entities will be required to use a new forward-looking "expected loss" model that generally will result in the earlier recognition of allowance for losses. For available-for-sale debt securities with unrealized losses, there will be no change to the measurement of credit losses, except that unrealized losses due to credit-related factors will be recognized as an allowance on the balance sheet with a corresponding adjustment to earnings in the income statement. There are various transition methods available upon adoption.
The Company is currently evaluating the impact of adopting the standard on its consolidated financial statements; however, it is expected that the new current expected credit loss model will primarily impact the calculation of the Company’s expected credit losses on $1.5 billion in gross trade accounts receivable, the $1.4 billion loan receivable at Mong Duong, $64 million in financing receivables in Argentina, and $33 million in financing receivables in Chile. The Company does not expect a material impact to result from the application of CECL on our trade accounts receivable; however, we are continuing to evaluate the potential impacts on our Mong Duong loan receivable and our financing receivables. In particular, the Company is finalizing our determination of the reasonable and supportable forecast period and the appropriate mix of relevant internal and external credit quality information for these types of financial assets, where we have no historical loss experience and limited external market data available. Estimated credit losses, if material, will be presented on the face of the balance sheet as an allowance that reduces the amortized cost basis of affected financial assets. The standard will also impact the presentation of expected credit-related losses (if any) for the Company’s $326 million of available-for-sale debt securities, which will be presented parenthetically as an allowance on the consolidated balance sheet.
2. INVENTORY
Inventory is valued primarily using the average-cost method. The following table summarizes the Company's inventory balances as of the dates indicated (in millions):
December 31, | 2019 | 2018 | ||||||
Fuel and other raw materials | $ | $ | ||||||
Spare parts and supplies | ||||||||
Total | $ | $ | ||||||
3. PROPERTY, PLANT AND EQUIPMENT
The following table summarizes the components of the electric generation and distribution assets and other property, plant and equipment (in millions) with their estimated useful lives (in years). The amounts are stated net of all prior asset impairment losses recognized.
137 | Notes to Consolidated Financial Statements—(Continued) | December 31, 2019, 2018, and 2017 |
December 31, | |||||||||
Estimated Useful Life | 2019 | 2018 | |||||||
Electric generation and distribution facilities | 5-40 | $ | $ | ||||||
Other buildings | 5-50 | ||||||||
Furniture, fixtures and equipment | 3-27 | ||||||||
Other | 5-40 | ||||||||
Total electric generation and distribution assets and other | |||||||||
Accumulated depreciation | ( | ) | ( | ) | |||||
Net electric generation and distribution assets and other | $ | $ | |||||||
The following table summarizes depreciation expense (including the amortization of assets recorded under finance leases in 2019 or capital leases in prior periods, and the amortization of asset retirement obligations) and interest capitalized during development and construction on qualifying assets for the periods indicated (in millions):
Years Ended December 31, | 2019 | 2018 | 2017 | |||||||||
Depreciation expense | $ | $ | $ | |||||||||
Interest capitalized during development and construction | ||||||||||||
The following table summarizes regulated and non-regulated generation and distribution property, plant and equipment and accumulated depreciation as of the dates indicated (in millions):
December 31, | 2019 | 2018 | ||||||
Regulated generation and distribution assets and other, gross | $ | $ | ||||||
Regulated accumulated depreciation | ( | ) | ( | ) | ||||
Regulated generation and distribution assets and other, net | ||||||||
Non-regulated generation and distribution assets and other, gross | ||||||||
Non-regulated accumulated depreciation | ( | ) | ( | ) | ||||
Non-regulated generation and distribution assets and other, net | ||||||||
Net electric generation and distribution assets and other | $ | $ | ||||||
4. ASSET RETIREMENT OBLIGATIONS
The following table presents amounts recognized related to asset retirement obligations for the periods indicated (in millions):
2019 | 2018 | |||||||
Balance at January 1 | $ | $ | ||||||
Additional liabilities incurred | ||||||||
Liabilities settled | ( | ) | ( | ) | ||||
Accretion expense | ||||||||
Change in estimated cash flows | ||||||||
Sale of plants | ( | ) | ||||||
Other | ( | ) | ||||||
Balance at December 31 | $ | $ | ||||||
The Company's asset retirement obligations include active ash landfills, water treatment basins and the removal or dismantlement of certain plants and equipment. The Company uses the cost approach to determine the initial value of ARO liabilities, which is estimated by discounting expected cash outflows to their present value using market-based rates at the initial recording of the liabilities. Cash outflows are based on the approximate future disposal costs as determined by market information, historical information or other management estimates. Subsequent downward revisions of ARO liabilities are discounted using the market-based rates that existed when the liability was initially recognized. These inputs to the fair value of the ARO liabilities are considered Level 3 inputs under the fair value hierarchy.
During the year ended December 31, 2019, the Company increased the asset retirement obligation and corresponding asset at IPL by $75 million and decreased the asset retirement obligation at DPL by $87 million. The increase at IPL reflects an increase to estimated ash pond closure costs, including groundwater remediation as required by the EPA under the Resource Conservation and Recovery Act. The decrease at DPL was attributable to a revision of the estimated liabilities resulting from the retirement of the Stuart and Killen facilities, and their subsequent transfer in December 2019.
138 | Notes to Consolidated Financial Statements—(Continued) | December 31, 2019, 2018, and 2017 |
During the year ended December 31, 2018, the $24 million increase in estimated cash flows was primarily attributable to an increase of $55 million in estimated ash pond closure costs and revised closure dates associated with an EPA rule regulating CCR at IPL and an increase in coal pile remediation costs at DPL. These were partially offset by a decrease of $32 million due to reductions in estimated closure costs associated with ash ponds and landfills at DPL resulting in a reduction to Cost of Sales on the Consolidated Statements of Operations.
5. FAIR VALUE
The fair value of current financial assets and liabilities, debt service reserves and other deposits approximate their reported carrying amounts. The estimated fair values of the Company's assets and liabilities have been determined using available market information. Because these amounts are estimates and based on hypothetical transactions to sell assets or transfer liabilities, the use of different market assumptions and/or estimation methodologies may have a material effect on the estimated fair value amounts.
Valuation Techniques — The fair value measurement accounting guidance describes three main approaches to measuring the fair value of assets and liabilities: (1) market approach, (2) income approach and (3) cost approach. The market approach uses prices and other relevant information generated from market transactions involving identical or comparable assets or liabilities. The income approach uses valuation techniques to convert future amounts to a single present value amount. The measurement is based on current market expectations of the return on those future amounts. The cost approach is based on the amount that would currently be required to replace an asset. The Company measures its investments and derivatives at fair value on a recurring basis. Additionally, in connection with annual or event-driven impairment evaluations, certain nonfinancial assets and liabilities are measured at fair value on a nonrecurring basis. These include long-lived tangible assets (i.e., property, plant and equipment), goodwill and intangible assets (e.g., sales concessions, land use rights and water rights, etc.). In general, the Company determines the fair value of investments and derivatives using the market approach and the income approach, respectively. In the nonrecurring measurements of nonfinancial assets and liabilities, all three approaches are considered; however, the value estimated under the income approach is often the most representative of fair value.
Investments — The Company's investments measured at fair value generally consist of marketable debt and equity securities. Equity securities are either measured at fair value using quoted market prices or based on comparisons to market data obtained for similar assets. Debt securities primarily consist of unsecured debentures and certificates of deposit held by our Brazilian subsidiaries. Returns and pricing on these instruments are generally indexed to the market interest rates in Brazil. Debt securities are measured at fair value based on comparisons to market data obtained for similar assets.
Derivatives — Derivatives are measured at fair value using quoted market prices or the income approach utilizing volatilities, spot and forward benchmark interest rates (such as LIBOR and EURIBOR), foreign exchange rates, credit data, and commodity prices, as applicable. When significant inputs are not observable, the Company uses relevant techniques to determine the inputs, such as regression analysis or prices for similarly traded instruments available in the market.
The Company's methodology to fair value its derivatives is to start with any observable inputs; however, in certain instances the published forward rates or prices may not extend through the remaining term of the contract and management must make assumptions to extrapolate the curve, which necessitates the use of unobservable inputs, such as proxy commodity prices or historical settlements to forecast forward prices. Specifically, where there is limited forward curve data with respect to foreign exchange contracts, beyond the traded points, the Company utilizes the interest rate differential approach to construct the remaining portion of the forward curve. Similarly, in certain instances, the spread that reflects the credit or nonperformance risk is unobservable requiring the use of proxy yield curves of similar credit quality.
To determine the fair value of a derivative, cash flows are discounted using the relevant spot benchmark interest rate. The Company then makes a credit valuation adjustment ("CVA"), as applicable, by further discounting the cash flows for nonperformance or credit risk based on the observable or estimated debt spread of the Company's subsidiary or its counterparty and the tenor of the respective derivative instrument. The CVA for potential future scenarios in which the derivative is in an asset position is based on the counterparty's credit ratings, credit default swap spreads, and debt spreads, as available. The CVA for potential future scenarios in which the derivative is in a liability position is based on the Parent Company's or the subsidiary's current debt spread. In the absence of readily obtainable credit information, the Parent Company's or the subsidiary's estimated credit rating (based on
139 | Notes to Consolidated Financial Statements—(Continued) | December 31, 2019, 2018, and 2017 |
applying a standard industry model to historical financial information and then considering other relevant information) and spreads of comparably rated entities or the respective country's debt spreads are used as a proxy. All derivative instruments are analyzed individually and are subject to unique risk exposures.
The fair value hierarchy of an asset or a liability is based on the level of significance of the input assumptions. An input assumption is considered significant if it affects the fair value by at least 10%. Assets and liabilities are classified as Level 3 when the use of unobservable inputs is significant. When the use of unobservable inputs is insignificant, assets and liabilities are classified as Level 2. Transfers between Level 3 and Level 2 result from changes in significance of unobservable inputs used to calculate the CVA.
Debt — Recourse and non-recourse debt are carried at amortized cost. The fair value of recourse debt is estimated based on quoted market prices. The fair value of non-recourse debt is estimated based upon interest rates and other features of the loan. In general, the carrying amount of variable rate debt is a close approximation of its fair value. For fixed rate loans, the fair value is estimated using quoted market prices or discounted cash flow ("DCF") analyses. The fair value of recourse and non-recourse debt excludes accrued interest at the valuation date. The fair value was determined using available market information as of December 31, 2019. The Company is not aware of any factors that would significantly affect the fair value amounts subsequent to December 31, 2019.
Nonrecurring measurements — For nonrecurring measurements derived using the income approach, fair value is generally determined using valuation models based on the principles of DCF. The income approach is most often used in the impairment evaluation of long-lived tangible assets, equity method investments, goodwill, and intangible assets. Where the use of market observable data is limited or not available for certain input assumptions, the Company develops its own estimates using a variety of techniques such as regression analysis and extrapolations. Depending on the complexity of a valuation, an independent valuation firm may be engaged to assist management in the valuation process.
For nonrecurring measurements derived using the market approach, recent market transactions involving the sale of identical or similar assets are considered. The use of this approach is limited because it is often difficult to identify sale transactions of identical or similar assets. This approach is used in impairment evaluations of certain intangible assets. Otherwise, it is used to corroborate the fair value determined under the income approach.
For nonrecurring measurements derived using the cost approach, fair value is typically based upon a replacement cost approach. This approach involves a considerable amount of judgment, which is why its use is limited to the measurement of long-lived tangible assets. Like the market approach, this approach is also used to corroborate the fair value determined under the income approach.
Fair Value Considerations — In determining fair value, the Company considers the source of observable market data inputs, liquidity of the instrument, the credit risk of the counterparty and the risk of the Company's or its counterparty's nonperformance. The conditions and criteria used to assess these factors are:
Sources of market assumptions — The Company derives most of its market assumptions from market efficient data sources (e.g., Bloomberg and Reuters). To determine fair value, where market data is not readily available, management uses comparable market sources and empirical evidence to develop its own estimates of market assumptions.
Market liquidity — The Company evaluates market liquidity based on whether the financial or physical instrument, or the underlying asset, is traded in an active or inactive market. An active market exists if the prices are fully transparent to market participants, can be measured by market bid and ask quotes, the market has a relatively large proportion of trading volume as compared to the Company's current trading volume and the market has a significant number of market participants that will allow the market to rapidly absorb the quantity of assets traded without significantly affecting the market price. Another factor the Company considers when determining whether a market is active or inactive is the presence of government or regulatory controls over pricing that could make it difficult to establish a market-based price when entering into a transaction.
Nonperformance risk — Nonperformance risk refers to the risk that an obligation will not be fulfilled and affects the value at which a liability is transferred or an asset is sold. Nonperformance risk includes, but may not be limited to, the Company or its counterparty's credit and settlement risk. Nonperformance risk adjustments are dependent on credit spreads, letters of credit, collateral, other arrangements available and the nature of master netting arrangements. The Company is party to various interest rate swaps and options; foreign currency options and forwards; and derivatives and embedded derivatives, which subject the Company to nonperformance risk. The financial and physical instruments held at the subsidiary level are generally non-recourse to the Parent Company.
140 | Notes to Consolidated Financial Statements—(Continued) | December 31, 2019, 2018, and 2017 |
Nonperformance risk on the investments held by the Company is incorporated in the fair value derived from quoted market data to mark the investments to fair value.
Recurring Measurements — The following table presents, by level within the fair value hierarchy as described in Note 1—General and Summary of Significant Accounting Policies, the Company's financial assets and liabilities that were measured at fair value on a recurring basis as of the dates indicated (in millions). For the Company's investments in marketable debt securities, the security classes presented were determined based on the nature and risk of the security and are consistent with how the Company manages, monitors and measures its marketable securities:
December 31, 2019 | December 31, 2018 | |||||||||||||||||||||||||||||||
Level 1 | Level 2 | Level 3 | Total | Level 1 | Level 2 | Level 3 | Total | |||||||||||||||||||||||||
Assets | ||||||||||||||||||||||||||||||||
DEBT SECURITIES: | ||||||||||||||||||||||||||||||||
Available-for-sale: | ||||||||||||||||||||||||||||||||
Unsecured debentures | $ | $ | $ | $ | $ | $ | $ | $ | ||||||||||||||||||||||||
Certificates of deposit | ||||||||||||||||||||||||||||||||
Total debt securities | ||||||||||||||||||||||||||||||||
EQUITY SECURITIES: | ||||||||||||||||||||||||||||||||
Mutual funds | ||||||||||||||||||||||||||||||||
Total equity securities | ||||||||||||||||||||||||||||||||
DERIVATIVES: | ||||||||||||||||||||||||||||||||
Interest rate derivatives | ||||||||||||||||||||||||||||||||
Cross-currency derivatives | ||||||||||||||||||||||||||||||||
Foreign currency derivatives | ||||||||||||||||||||||||||||||||
Commodity derivatives | ||||||||||||||||||||||||||||||||
Total derivatives — assets | ||||||||||||||||||||||||||||||||
TOTAL ASSETS | $ | $ | $ | $ | $ | $ | $ | $ | ||||||||||||||||||||||||
Liabilities | ||||||||||||||||||||||||||||||||
DERIVATIVES: | ||||||||||||||||||||||||||||||||
Interest rate derivatives | $ | $ | $ | $ | $ | $ | $ | $ | ||||||||||||||||||||||||
Cross-currency derivatives | ||||||||||||||||||||||||||||||||
Foreign currency derivatives | ||||||||||||||||||||||||||||||||
Commodity derivatives | ||||||||||||||||||||||||||||||||
Total derivatives — liabilities | ||||||||||||||||||||||||||||||||
TOTAL LIABILITIES | $ | $ | $ | $ | $ | $ | $ | $ | ||||||||||||||||||||||||
As of December 31, 2019, all AFS debt securities had stated maturities within one year. For the years ended December 31, 2019, 2018, and 2017, no other-than-temporary impairment of marketable securities were recognized in earnings or Other Comprehensive Income (Loss). Gains and losses on the sale of investments are determined using the specific-identification method. The following table presents gross proceeds from sale of AFS securities for the periods indicated (in millions):
Year Ended December 31, | 2019 | 2018 | 2017 | |||||||||
Gross proceeds from sale of AFS securities (1) | $ | $ | $ | |||||||||
_____________________________
(1) | Proceeds in the year ended December 31, 2018 include $ |
The following tables present a reconciliation of net derivative assets and liabilities measured at fair value on a recurring basis using significant unobservable inputs (Level 3) for the years ended December 31, 2019 and 2018 (presented net by type of derivative in millions). Transfers between Level 3 and Level 2 principally result from changes in the significance of unobservable inputs used to calculate the credit valuation adjustment.
141 | Notes to Consolidated Financial Statements—(Continued) | December 31, 2019, 2018, and 2017 |
Year Ended December 31, 2019 | Interest Rate | Cross Currency | Foreign Currency | Commodity | Total | ||||||||||||||
Balance at January 1 | $ | ( | ) | $ | $ | $ | $ | ||||||||||||
Total realized and unrealized gains (losses): | |||||||||||||||||||
Included in earnings | ( | ) | ( | ) | ( | ) | ( | ) | |||||||||||
Included in other comprehensive income — derivative activity | ( | ) | ( | ) | ( | ) | |||||||||||||
Included in regulatory (assets) liabilities | ( | ) | ( | ) | |||||||||||||||
Settlements | ( | ) | ( | ) | |||||||||||||||
Transfers of assets/(liabilities), net into Level 3 | ( | ) | ( | ) | ( | ) | |||||||||||||
Transfers of (assets)/liabilities, net out of Level 3 | |||||||||||||||||||
Balance at December 31 | $ | ( | ) | $ | ( | ) | $ | $ | ( | ) | $ | ( | ) | ||||||
Total gains (losses) for the period included in earnings attributable to the change in unrealized gains (losses) relating to assets and liabilities held at the end of the period | $ | $ | $ | ( | ) | $ | ( | ) | $ | ( | ) | ||||||||
Year Ended December 31, 2018 | Interest Rate | Cross Currency | Foreign Currency | Commodity | Total | ||||||||||||||
Balance at January 1 | $ | ( | ) | $ | $ | $ | $ | ||||||||||||
Total realized and unrealized gains (losses): | |||||||||||||||||||
Included in earnings | ( | ) | ( | ) | |||||||||||||||
Included in other comprehensive income — derivative activity | ( | ) | ( | ) | |||||||||||||||
Included in regulatory (assets) liabilities | |||||||||||||||||||
Settlements | ( | ) | ( | ) | ( | ) | |||||||||||||
Transfers of assets/(liabilities), net into Level 3 | ( | ) | ( | ) | |||||||||||||||
Transfers of (assets)/liabilities, net out of Level 3 | ( | ) | ( | ) | |||||||||||||||
Balance at December 31 | $ | ( | ) | $ | $ | $ | $ | ||||||||||||
Total gains (losses) for the period included in earnings attributable to the change in unrealized gains (losses) relating to assets and liabilities held at the end of the period | $ | $ | $ | ( | ) | $ | ( | ) | $ | ( | ) | ||||||||
The following table summarizes the significant unobservable inputs used for the Level 3 derivative assets (liabilities) as of December 31, 2019 (in millions, except range amounts):
Type of Derivative | Fair Value | Unobservable Input | Amount or Range (Weighted Average) | ||||||
Interest rate | $ | ( | ) | Subsidiaries’ credit spreads | 0.8% - 4.94% (3.7%) | ||||
Cross-currency | ( | ) | Subsidiaries’ credit spreads | 2.1 | % | ||||
Foreign currency: | |||||||||
Argentine peso | Argentine peso to USD currency exchange rate after one year | 61 - 495 (250) | |||||||
Commodity: | |||||||||
Other | ( | ) | |||||||
Total | $ | ( | ) | ||||||
For interest rate derivatives and foreign currency derivatives, increases (decreases) in the estimates of the Company's own credit spreads would decrease (increase) the value of the derivatives in a liability position. For foreign currency derivatives, increases (decreases) in the estimate of the above exchange rate would increase (decrease) the value of the derivative.
Nonrecurring Measurements
The Company measures fair value using the applicable fair value measurement guidance. Impairment expense is measured by comparing the fair value at the evaluation date to the then-latest available carrying amount. The following table summarizes our major categories of assets measured at fair value on a nonrecurring basis and their level within the fair value hierarchy (in millions):
Year Ended December 31, 2019 | Measurement Date | Carrying Amount (1) | Fair Value | Pre-tax Loss | |||||||||||||
Assets | Level 1 | Level 2 | Level 3 | ||||||||||||||
Long-lived assets held and used: (2) | |||||||||||||||||
Hawaii | 12/31/2019 | ||||||||||||||||
Equity method investments: | |||||||||||||||||
OPGC | 12/31/2019 | ||||||||||||||||
Dispositions and held-for-sale businesses: (3) | |||||||||||||||||
Kilroot and Ballylumford | 04/12/2019 | ||||||||||||||||
142 | Notes to Consolidated Financial Statements—(Continued) | December 31, 2019, 2018, and 2017 |
Year Ended December 31, 2018 | Measurement Date | Carrying Amount (1) | Fair Value | Pre-tax Loss | ||||||||||||||||||
Assets | Level 1 | Level 2 | Level 3 | |||||||||||||||||||
Dispositions and held-for-sale businesses: (3) | ||||||||||||||||||||||
Shady Point | 12/31/2018 | |||||||||||||||||||||
Long-lived assets held and used: (2) | ||||||||||||||||||||||
Nejapa | 12/31/2018 | $ | $ | $ | $ | $ | ||||||||||||||||
Equity method investments: | ||||||||||||||||||||||
Guacolda | 10/01/2018 | |||||||||||||||||||||
Elsta | 09/30/2018 | |||||||||||||||||||||
_____________________________
(1) | Represents the carrying values at the dates of initial measurement, before fair value adjustment. |
(2) |
(3) | Per the Company's policy, pre-tax loss is limited to the impairment of long-lived assets. Any additional loss will be recognized on completion of the sale. See Note 22—Asset Impairment Expense and Note 25—Held-for-Sale and Dispositions for further information. |
The following table summarizes the significant unobservable inputs used in the Level 3 measurement of long-lived assets held and used measured on a nonrecurring basis during the year ended December 31, 2019 (in millions, except range amounts):
December 31, 2019 | Fair Value | Valuation Technique | Unobservable Input | Range (Weighted Average) | |||||||
Long-lived assets held and used: | |||||||||||
Hawaii | $ | Discounted cash flow | Annual revenue growth | -11% to 1% (-6%) | |||||||
Pre-tax operating margin | 5% to 35% (29%) | ||||||||||
Weighted-average cost of capital | 5% to 15% | ||||||||||
Equity method investments: | |||||||||||
OPGC | Expected present value | Annual dividend growth | -27% to 41% (2%) | ||||||||
Weighted-average cost of equity | % | ||||||||||
Total | $ | ||||||||||
Financial Instruments not Measured at Fair Value in the Consolidated Balance Sheets
The following table presents (in millions) the carrying amount, fair value and fair value hierarchy of the Company's financial assets and liabilities that are not measured at fair value in the Consolidated Balance Sheets as of the periods indicated, but for which fair value is disclosed:
December 31, 2019 | |||||||||||||||||||||
Carrying Amount | Fair Value | ||||||||||||||||||||
Total | Level 1 | Level 2 | Level 3 | ||||||||||||||||||
Assets: | Accounts receivable — noncurrent (1) | $ | $ | $ | $ | $ | |||||||||||||||
Liabilities: | Non-recourse debt | ||||||||||||||||||||
Recourse debt | |||||||||||||||||||||
December 31, 2018 | |||||||||||||||||||||
Carrying Amount | Fair Value | ||||||||||||||||||||
Total | Level 1 | Level 2 | Level 3 | ||||||||||||||||||
Assets: | Accounts receivable — noncurrent (1) | $ | $ | $ | $ | $ | |||||||||||||||
Liabilities: | Non-recourse debt | ||||||||||||||||||||
Recourse debt | |||||||||||||||||||||
_____________________________
(1) | These amounts primarily relate to amounts due from CAMMESA, the administrator of the wholesale electricity market in Argentina, and amounts impacted by the Stabilization Fund enacted by the Chilean government and are included in Other noncurrent assets in the accompanying Consolidated Balance Sheets. The fair value and carrying amount of the Argentina receivables exclude VAT of $ |
143 | Notes to Consolidated Financial Statements—(Continued) | December 31, 2019, 2018, and 2017 |
6. DERIVATIVE INSTRUMENTS AND HEDGING ACTIVITIES
Volume of Activity — The following table presents the Company's maximum notional (in millions) over the remaining contractual period by type of derivative as of December 31, 2019, regardless of whether they are in qualifying cash flow hedging relationships, and the dates through which the maturities for each type of derivative range:
Interest Rate and Foreign Currency Derivatives | Maximum Notional Translated to USD | Latest Maturity | ||||
Interest Rate (LIBOR and EURIBOR) | $ | 2044 | ||||
Cross-currency swaps (Chilean Unidad de Fomento and Chilean peso) | 2029 | |||||
Foreign Currency: | ||||||
Argentine peso | 2026 | |||||
Chilean peso | 2022 | |||||
Colombian peso | 2022 | |||||
Brazilian real | 2020 | |||||
Others, primarily with weighted average remaining maturities of a year or less | 2022 | |||||
Commodity Derivatives | Maximum Notional | Latest Maturity | |||
Natural Gas (in MMBtu) | 2020 | ||||
Power (in MWhs) | 2020 | ||||
Coal (in Tons or Metric Tonnes) | 2027 | ||||
Accounting and Reporting — Assets and Liabilities — The following tables present the fair value of assets and liabilities related to the Company's derivative instruments as of the periods indicated (in millions):
Fair Value | December 31, 2019 | December 31, 2018 | ||||||||||||||||||||||
Assets | Designated | Not Designated | Total | Designated | Not Designated | Total | ||||||||||||||||||
Interest rate derivatives | $ | $ | $ | $ | $ | $ | ||||||||||||||||||
Cross-currency derivatives | ||||||||||||||||||||||||
Foreign currency derivatives | ||||||||||||||||||||||||
Commodity derivatives | ||||||||||||||||||||||||
Total assets | $ | $ | $ | $ | $ | $ | ||||||||||||||||||
Liabilities | ||||||||||||||||||||||||
Interest rate derivatives | $ | $ | $ | $ | $ | $ | ||||||||||||||||||
Cross-currency derivatives | ||||||||||||||||||||||||
Foreign currency derivatives | ||||||||||||||||||||||||
Commodity derivatives | ||||||||||||||||||||||||
Total liabilities | $ | $ | $ | $ | $ | $ | ||||||||||||||||||
December 31, 2019 | December 31, 2018 | |||||||||||||||
Fair Value | Assets | Liabilities | Assets | Liabilities | ||||||||||||
Current | $ | $ | $ | $ | ||||||||||||
Noncurrent | ||||||||||||||||
Total | $ | $ | $ | $ | ||||||||||||
144 | Notes to Consolidated Financial Statements—(Continued) | December 31, 2019, 2018, and 2017 |
As of December 31, 2019 and 2018, all derivative instruments subject to credit risk-related contingent features were in an asset position.
Years Ended December 31, | ||||||||||||
2019 | 2018 | 2017 | ||||||||||
Cash flow hedges | ||||||||||||
Gains (losses) recognized in AOCL | ||||||||||||
Interest rate derivatives | $ | ( | ) | $ | ( | ) | $ | ( | ) | |||
Cross-currency derivatives | ( | ) | ( | ) | ||||||||
Foreign currency derivatives | ( | ) | ( | ) | ( | ) | ||||||
Commodity derivatives | ||||||||||||
Total | $ | ( | ) | $ | ( | ) | $ | ( | ) | |||
Gains (losses) reclassified from AOCL to earnings | ||||||||||||
Interest rate derivatives | $ | ( | ) | $ | ( | ) | $ | ( | ) | |||
Cross-currency derivatives | ( | ) | ( | ) | ||||||||
Foreign currency derivatives | ( | ) | ( | ) | ( | ) | ||||||
Commodity derivatives | ( | ) | ( | ) | ||||||||
Total | $ | ( | ) | $ | ( | ) | $ | ( | ) | |||
Loss reclassified from AOCL to earnings due to discontinuance of hedge accounting (1) | $ | ( | ) | $ | $ | ( | ) | |||||
Gain (losses) recognized in earnings related to | ||||||||||||
Ineffective portion of cash flow hedges | $ | $ | ( | ) | $ | |||||||
Not designated as hedging instruments: | ||||||||||||
Foreign currency derivatives | ( | ) | ||||||||||
Commodity derivatives and other | ( | ) | ||||||||||
Total | $ | ( | ) | $ | $ | |||||||
_____________________________
(1) | Cash flow hedge was discontinued on a cross-currency swap in 2019 because the underlying debt was prepaid. Cash flow hedge was discontinued in 2017 because it was probable the forecasted transaction will not occur. |
AOCL is expected to decrease pre-tax income from continuing operations for the twelve months ended December 31, 2020 by $73 million, primarily due to interest rate derivatives.
7. FINANCING RECEIVABLES
Receivables with contractual maturities of greater than one year are considered financing receivables. The Company's financing receivables are primarily related to amended agreements or government resolutions that are due from CAMMESA, the administrator of the wholesale electricity market in Argentina. The following table presents financing receivables by country as of the dates indicated (in millions):
December 31, | 2019 | 2018 | ||||||
Argentina | $ | $ | ||||||
Chile | ||||||||
Other | ||||||||
Total | $ | $ | ||||||
Collection of the principal and interest on these receivables is subject to various business risks and uncertainties, including, but not limited to, the continued operation of power plants which generate cash for payments of these receivables, regulatory changes that could impact the timing and amount of collections, and economic conditions in Argentina. The Company monitors these risks, including the credit ratings of the Argentine government, on a quarterly basis to assess the collectability of these receivables. The Company accrues interest on these receivables once the recognition criteria have been met. The Company's collection estimates are based on assumptions that it believes to be reasonable, but are inherently uncertain. Actual future cash flows could differ from these estimates. The decrease in Argentina financing receivables was primarily due to planned collections and unfavorable FX impacts.
FONINVEMEM Agreements — As a result of energy market reforms in 2004 and 2010, AES Argentina entered into three agreements with the Argentine government, referred to as the FONINVEMEM Agreements, to contribute a portion of their accounts receivable into a fund for financing the construction of combined cycle and gas-fired plants. These receivables accrue interest and are collected in monthly installments over 10 years once the related plant
145 | Notes to Consolidated Financial Statements—(Continued) | December 31, 2019, 2018, and 2017 |
begins operations. In addition, AES Argentina receives an ownership interest in these newly built plants once the receivables have been fully repaid.
The FONINVEMEM receivables are denominated in Argentine pesos, but indexed to USD, which represents a foreign currency derivative. Due to differences between spot rates, used to remeasure the receivables, and discounted forward rates, used to value the foreign currency derivative, these two items will not perfectly offset over the life of the receivable. Once settled, the foreign currency derivative will offset the accumulated unrealized foreign currency losses resulting from the devaluation of the FONINVEMEM receivable. As of December 31, 2019 and 2018, the amount of the foreign currency-related derivative assets associated with the FONINVEMEM financing receivables that were excluded from the table above had a fair value of $94 million and $199 million, respectively.
The receivables under the FONINVEMEM Agreements have been actively collected since the related plants commenced operations in 2010 and 2016. In assessing the collectability of the receivables under these agreements, the Company also considers historic collection evidence in accordance with the agreements.
Other Agreements — Other agreements primarily consist of resolutions passed by the Argentine government in which AES Argentina will receive compensation for investments in new generation plants and technologies. The timing of collections depend on corresponding agreements and collectability of these receivables are assessed on an ongoing basis.
Chile
AES Gener has recorded noncurrent receivables pertaining to revenues recognized on regulated energy contracts that were impacted by the Stabilization Fund created by the Chilean government in October 2019. Historically, the government updated the prices for these contracts every six months to reflect the indexation the contracts have to exchange rates and commodities prices. The Stabilization Fund does not allow the pass-through of these contractual indexation updates to customers beyond the pricing in effect at July 1, 2019, until new lower-cost renewable contracts are incorporated into pricing in 2023. Consequently, costs incurred in excess of the July 1, 2019 price will be accumulated and borne by generators. It is expected that these noncurrent receivables will be collected prior to December 31, 2027.
8. INVESTMENTS IN AND ADVANCES TO AFFILIATES
The following table summarizes the relevant effective equity ownership interest and carrying values for the Company's investments accounted for under the equity method as of the periods indicated:
December 31, | 2019 | 2018 | 2019 | 2018 | |||||||||||
Affiliate | Country | Carrying Value (in millions) | Ownership Interest % | ||||||||||||
sPower | United States | $ | $ | % | % | ||||||||||
OPGC | India | % | % | ||||||||||||
Guacolda (1) | Chile | % | % | ||||||||||||
Uplight (2) | United States | % | % | ||||||||||||
Eólica Mesa La Paz (3) | Mexico | % | % | ||||||||||||
Gas Natural del Este | Dominican Republic | % | % | ||||||||||||
Barry (4) | United Kingdom | % | % | ||||||||||||
Other affiliates (5) | Various | ||||||||||||||
Total | $ | $ | |||||||||||||
_____________________________
(1) | The Company's ownership in Guacolda is held through AES Gener, a |
(2) | Simple Energy merged with Tendril on July 1, 2019 to form Uplight. Prior year information reported relates to Simple Energy. |
(3) | The Eólica Mesa La Paz project received funding throughout 2019 and began operations during December 2019. |
(4) | Represents a VIE in which the Company holds a variable interest, but is not the primary beneficiary. |
(5) | Includes Bosforo, Fluence, Distributed Energy equity method investments, and others. |
OPGC — In December 2019, an other-than-temporary impairment was identified at OPGC primarily due to the estimated market value of the Company's investment and other negative developments impacting future expected cash flows at the investee. A calculation of the fair value of the Company’s investment in OPGC was required to evaluate whether there was a loss in the carrying value of the investment. Based on management’s estimate of fair value of $212 million, the Company recognized an other-than-temporary impairment of $92 million in Other non-operating expense. The OPGC equity method investment is reported in the Eurasia SBU reportable segment.
Guacolda — In October 2019, Guacolda management reviewed the recoverability of the Guacolda asset group and determined the undiscounted cash flows did not exceed the carrying amount. Guacolda recognized a long-lived
146 | Notes to Consolidated Financial Statements—(Continued) | December 31, 2019, 2018, and 2017 |
asset impairment at the investee level, which negatively impacted the Company's Net equity in earnings (losses) of affiliates by $158 million. The Guacolda equity method investment is reported in the South America SBU reportable segment.
In October 2018, an other-than-temporary impairment was identified at Guacolda primarily as a result of increased renewable generation in Chile lowering energy prices, impacting management's ability to re-contract Guacolda's generation after expiration of existing PPAs. A calculation of the fair value of Gener's investment in Guacolda was required to evaluate whether there was a loss in the carrying value of the investment. Based on management's estimate of fair value of $209 million, the Company recognized an other-than-temporary impairment of $144 million in Other non-operating expense.
Gas Natural del Este — In September 2019, AES Andres completed an agreement with Energas Group to establish a joint venture for the purpose of selling natural gas and related terminal services, storage, regasification, and transportation to customers in the Dominican Republic. Gas Natural del Este, a wholly-owned subsidiary of the joint venture, acquired the Eastern Pipeline development project from AES Andres for total consideration of $55 million, resulting in a gain of $2 million. The transaction was considered a contribution of a nonfinancial asset in exchange for a noncontrolling interest in the joint venture. As the Company does not control the joint venture, it is accounted for as an equity method investment and is reported in the MCAC SBU reportable segment.
Simple Energy — On July 1, 2019, Simple Energy merged with Tendril, a previously unrelated party, to form Uplight, a new company that offers a comprehensive platform for utility customer engagement. As part of this merger, the Company contributed its ownership interest in Simple Energy and $53 million of cash in exchange for an ownership interest in the merged company. This transaction resulted in a gain on sale of $12 million and a total investment in Uplight of $98 million. As the Company does not control Uplight, it is accounted for as an equity method investment and reported as part of Corporate and Other.
In April 2018, the Company invested $35 million in Simple Energy, a provider of utility-branded marketplaces and omni-channel instant rebates, accounted for as an equity method investment.
sPower — In April 2019, the Company closed on the sale of approximately 48 % of its interest in a portfolio of sPower’s operating assets for $173 million, subject to customary purchase price adjustments, of which $58 million was retained at sPower to pay down debt. This sale resulted in a pre-tax gain on sale of business interests of $28 million. After the sale, the Company’s ownership interest in this portfolio of sPower’s operating assets decreased from 50 % to approximately 26 %. The sPower equity method investment is reported in the US and Utilities SBU reportable segment.
Distributed Energy — In December 2018, Distributed Energy acquired the remaining equity interest in a partnership holding various solar projects for consideration of $23 million. This transaction resulted in a loss of $5 million, reported in Other expense in the Consolidated Statement of Operations. The projects, previously recorded as equity method investments, have been consolidated. See Note 26—Acquisitions for further discussion.
Fluence — On January 1, 2018, Siemens and AES closed on the creation of the Fluence joint venture with each party holding a 50 % ownership interest. The Company contributed $7 million in cash and $20 million in non-cash assets from the AES Advancion energy storage development business as consideration for the transaction, and received an equity interest in Fluence with a fair value of $50 million. See Note 25—Held-for-Sale and Dispositions for further discussion. Fluence is a global energy storage technology and services company. As the Company does not control Fluence, the investment is accounted for as an equity method investment. The Fluence equity method investment is reported as part of Corporate and Other.
147 | Notes to Consolidated Financial Statements—(Continued) | December 31, 2019, 2018, and 2017 |
AES Barry Ltd. — The Company holds a 100 % ownership interest in AES Barry Ltd. ("Barry"), a dormant entity in the U.K. that disposed of its generation and other operating assets. Due to a debt agreement, no material financial or operating decisions can be made without the banks' consent, and the Company does not control Barry. As of December 31, 2019 and 2018, other long-term liabilities included $44 million and $43 million related to this debt agreement.
Summarized Financial Information — The following tables summarize financial information of the Company's 50%-or-less-owned affiliates and majority-owned unconsolidated subsidiaries that are accounted for using the equity method (in millions):
50%-or-less Owned Affiliates | Majority-Owned Unconsolidated Subsidiaries | ||||||||||||||||||||||
Years ended December 31, | 2019 | 2018 | 2017 | 2019 | 2018 | 2017 | |||||||||||||||||
Revenue | $ | $ | $ | $ | $ | $ | |||||||||||||||||
Operating margin (loss) | ( | ) | |||||||||||||||||||||
Net income (loss) | ( | ) | ( | ) | ( | ) | ( | ) | |||||||||||||||
December 31, | 2019 | 2018 | 2019 | 2018 | |||||||||||||||||||
Current assets | $ | $ | $ | $ | |||||||||||||||||||
Noncurrent assets | |||||||||||||||||||||||
Current liabilities | |||||||||||||||||||||||
Noncurrent liabilities | |||||||||||||||||||||||
Stockholders' equity | ( | ) | ( | ) | |||||||||||||||||||
9. GOODWILL AND OTHER INTANGIBLE ASSETS
Goodwill — The following table summarizes the carrying amount of goodwill by reportable segment for the years ended December 31, 2019 and 2018 (in millions):
US and Utilities | South America | MCAC | Eurasia | Total | |||||||||||||||
Balance as of December 31, 2018 | |||||||||||||||||||
Goodwill | $ | $ | $ | $ | $ | ||||||||||||||
Accumulated impairment losses | ( | ) | ( | ) | ( | ) | |||||||||||||
Net balance | |||||||||||||||||||
Balance as of December 31, 2019 | |||||||||||||||||||
Goodwill | (1) | ||||||||||||||||||
Accumulated impairment losses | ( | ) | (1) | ( | ) | ||||||||||||||
Net balance | $ | $ | $ | $ | $ | ||||||||||||||
_____________________________
(1) | Goodwill and accumulated impairment losses at the Eurasia reportable segment were reduced by $ |
148 | Notes to Consolidated Financial Statements—(Continued) | December 31, 2019, 2018, and 2017 |
Other Intangible Assets — The following table summarizes the balances comprising Other intangible assets in the accompanying Consolidated Balance Sheets (in millions) as of the periods indicated:
December 31, 2019 | December 31, 2018 | ||||||||||||||||||||||
Gross Balance | Accumulated Amortization | Net Balance | Gross Balance | Accumulated Amortization | Net Balance | ||||||||||||||||||
Subject to Amortization | |||||||||||||||||||||||
Internal-use software | $ | $ | ( | ) | $ | $ | $ | ( | ) | $ | |||||||||||||
Contracts | ( | ) | ( | ) | |||||||||||||||||||
Project development rights | ( | ) | ( | ) | |||||||||||||||||||
Contractual payment rights (1) | ( | ) | |||||||||||||||||||||
Emissions allowances (2) | |||||||||||||||||||||||
Other (3) | ( | ) | ( | ) | |||||||||||||||||||
Subtotal | ( | ) | ( | ) | |||||||||||||||||||
Indefinite-Lived Intangible Assets | |||||||||||||||||||||||
Land use rights | |||||||||||||||||||||||
Water rights | |||||||||||||||||||||||
Transmission rights | |||||||||||||||||||||||
Other | |||||||||||||||||||||||
Subtotal | |||||||||||||||||||||||
Total | $ | $ | ( | ) | $ | $ | $ | ( | ) | $ | |||||||||||||
_____________________________
(1) | Represent legal rights to receive system reliability payments from the regulator. |
(2) |
(3) | Includes management rights, sales concessions, renewable energy credits and incentives, and other individually insignificant intangible assets. |
The following tables summarize other intangible assets acquired during the periods indicated (in millions):
December 31, 2019 | Amount | Subject to Amortization/Indefinite-Lived | Weighted Average Amortization Period (in years) | Amortization Method | |||||
Internal-use software | $ | Subject to Amortization | Straight-line | ||||||
Contracts | Subject to Amortization | Straight-line | |||||||
Project development rights | Subject to Amortization | Straight-line | |||||||
Emissions allowances | Subject to Amortization | Various | As utilized | ||||||
Transmission rights | Indefinite-Lived | N/A | N/A | ||||||
Other | Various | N/A | N/A | ||||||
Total | $ | ||||||||
December 31, 2018 | Amount | Subject to Amortization/Indefinite-Lived | Weighted Average Amortization Period (in years) | Amortization Method | |||||
Internal-use software | $ | Subject to Amortization | Straight-line | ||||||
Contracts | Subject to Amortization | Straight-line | |||||||
Project development rights | Subject to Amortization | Straight-line | |||||||
Emissions allowances | Subject to Amortization | Various | As utilized | ||||||
Other | Various | N/A | N/A | ||||||
Total | $ | ||||||||
The following table summarizes the estimated amortization expense by intangible asset category for 2020 through 2024:
(in millions) | 2020 | 2021 | 2022 | 2023 | 2024 | ||||||||||||||
Internal-use software | $ | $ | $ | $ | $ | ||||||||||||||
Contracts | |||||||||||||||||||
Other | |||||||||||||||||||
Total | $ | $ | $ | $ | $ | ||||||||||||||
Intangible asset amortization expense was $45 million, $47 million and $34 million for the years ended December 31, 2019, 2018 and 2017, respectively.
149 | Notes to Consolidated Financial Statements—(Continued) | December 31, 2019, 2018, and 2017 |
10. REGULATORY ASSETS AND LIABILITIES
The Company has recorded regulatory assets and liabilities (in millions) that it expects to pass through to its customers in accordance with, and subject to, regulatory provisions as follows:
December 31, | 2019 | 2018 | Recovery/Refund Period | ||||||
Regulatory assets | |||||||||
Current regulatory assets: | |||||||||
El Salvador energy pass through costs recovery | $ | $ | Quarterly | ||||||
Other | 1 year | ||||||||
Total current regulatory assets | |||||||||
Noncurrent regulatory assets: | |||||||||
IPL and DPL defined benefit pension obligations (1) | Various | ||||||||
IPL deferred Midwest ISO costs | |||||||||
IPL environmental costs | Various | ||||||||
Other | Various | ||||||||
Total noncurrent regulatory assets | |||||||||
Total regulatory assets | $ | $ | |||||||
Regulatory liabilities | |||||||||
Current regulatory liabilities: | |||||||||
Overcollection of costs to be passed back to customers | $ | $ | |||||||
Other | Various | ||||||||
Total current regulatory liabilities | |||||||||
Noncurrent regulatory liabilities: | |||||||||
IPL and DPL accrued costs of removal and AROs | Over life of assets | ||||||||
IPL and DPL income taxes payable to customers through rates | Various | ||||||||
Other | Various | ||||||||
Total noncurrent regulatory liabilities | |||||||||
Total regulatory liabilities | $ | $ | |||||||
_____________________________
(1) | Past expenditures on which the Company earns a rate of return. |
Our regulatory assets and current regulatory liabilities primarily consist of under or overcollection of costs that are generally non-controllable, such as purchased electricity, energy transmission, fuel costs, and other sector costs. These costs are recoverable or refundable as defined by the laws and regulations in our markets. Our regulatory assets also include defined pension and postretirement benefit obligations equal to the previously unrecognized actuarial gains and losses and prior service costs that are expected to be recovered through future rates. Other current and noncurrent regulatory assets primarily consist of:
• | Undercollections on rate riders such as wholesale margin sharing and MISO costs at IPL and storm costs at DPL; |
• | Unamortized premiums reacquired or redeemed on long-term debt at IPL and DPL, which are amortized over the lives of the original issuances; and |
• | OVEC costs at DPL. |
Our noncurrent regulatory liabilities primarily consist of obligations for removal costs which do not have an associated legal retirement obligation. Our noncurrent regulatory liabilities also include deferred income taxes related to differences in income recognition between tax laws and accounting methods, which will be passed through to our regulated customers via a decrease in future retail rates. See Note 23—Income Taxes for further information.
In the accompanying Consolidated Balance Sheets the current regulatory assets and liabilities are reflected in Other current assets and Accrued and other liabilities, respectively, and the noncurrent regulatory assets and liabilities are reflected in Other noncurrent assets and Other noncurrent liabilities, respectively. All of the regulatory assets and liabilities as of December 31, 2019 and December 31, 2018 related to the US and Utilities SBU.
150 | Notes to Consolidated Financial Statements—(Continued) | December 31, 2019, 2018, and 2017 |
11. DEBT
NON-RECOURSE DEBT — The following table summarizes the carrying amount and terms of non-recourse debt at our subsidiaries as of the periods indicated (in millions):
NON-RECOURSE DEBT | Weighted Average Interest Rate | Maturity | December 31, | ||||||||
2019 | 2018 | ||||||||||
Variable Rate: | |||||||||||
Bank loans | 2020 – 2050 | $ | $ | ||||||||
Notes and bonds | 2020 – 2030 | ||||||||||
Debt to (or guaranteed by) multilateral, export credit agencies or development banks (1) | 2023 – 2033 | ||||||||||
Fixed Rate: | |||||||||||
Bank loans | 2020 – 2040 | ||||||||||
Notes and bonds | 2020 – 2079 | ||||||||||
Debt to (or guaranteed by) multilateral, export credit agencies or development banks (1) | 2023 – 2029 | ||||||||||
Other | 2061 | ||||||||||
Unamortized (discount) premium & debt issuance (costs), net | ( | ) | ( | ) | |||||||
Subtotal | $ | $ | |||||||||
Less: Current maturities (2) | ( | ) | ( | ) | |||||||
Noncurrent maturities (2) | $ | $ | |||||||||
_____________________________
(1) | Multilateral loans include loans funded and guaranteed by bilaterals, multilaterals, development banks and other similar institutions. |
(2) | Excludes $ |
The interest rate on variable rate debt represents the total of a variable component that is based on changes in an interest rate index and of a fixed component. The Company has interest rate swaps and option agreements that economically fix the variable component of the interest rates on the portion of the variable rate debt being hedged in an aggregate notional principal amount of approximately $1.8 billion on non-recourse debt outstanding at December 31, 2019.
Non-recourse debt as of December 31, 2019 is scheduled to reach maturity as shown below (in millions):
December 31, | Annual Maturities | ||
2020 | $ | ||
2021 | |||
2022 | |||
2023 | |||
2024 | |||
Thereafter | |||
Unamortized (discount) premium & debt issuance (costs), net | ( | ) | |
Total | $ | ||
As of December 31, 2019, AES subsidiaries with facilities under construction had a total of approximately $470 million of committed but unused credit facilities available to fund construction and other related costs. Excluding these facilities under construction, AES subsidiaries had approximately $1.1 billion in various unused committed credit lines to support their working capital, debt service reserves and other business needs. These credit lines can be used for borrowings, letters of credit, or a combination of these uses.
151 | Notes to Consolidated Financial Statements—(Continued) | December 31, 2019, 2018, and 2017 |
Significant transactions — During the year ended December 31, 2019, the Company's subsidiaries had the following significant debt transactions:
Subsidiary | Transaction Period | Issuances | Repayments | Gain (Loss) on Extinguishment of Debt | |||||||||
Southland (1) | Q1, Q2, Q3, Q4 | $ | $ | ( | ) | $ | ( | ) | |||||
Gener | Q1, Q2, Q4 | ( | ) | ( | ) | ||||||||
DPL (2) | Q2 | ( | ) | ( | ) | ||||||||
Tietê | Q2 | ( | ) | ( | ) | ||||||||
Mong Duong (3) | Q3 | ( | ) | ( | ) | ||||||||
Colon | Q3 | ( | ) | ( | ) | ||||||||
Cochrane | Q4 | ( | ) | ( | ) | ||||||||
TEGTEP | Q4 | ( | ) | ( | ) | ||||||||
_____________________________
(1) | Issuances relate to the June 2017 long-term non-recourse debt financing to fund the Southland re-powering construction projects, a non-recourse bridge loan in September 2019, and long-term non-recourse debt financing issued in December 2019 to settle the bridge loan. |
(2) | Includes transactions at DPL and its subsidiary, DP&L. |
(3) | Non-cash transaction via an equity affiliate. See below for further information. |
Cochrane — In November 2019, Cochrane issued $430 million aggregate principal of 5.50 % senior unsecured notes due in 2027 and entered into a $445 million 6.25 % senior secured facility agreement due in 2034. The net proceeds from the issuance and draw down were used to prepay the outstanding principal of $833 million under its variable rate notes due in 2030. As a result of these transactions, the Company recognized a loss on extinguishment of debt of $24 million.
Gener — In March 2019, Gener issued $550 million aggregate principal of 7.125 % senior unsecured notes due in 2079. The net proceeds from the issuance were used to purchase via tender offer the outstanding principal of $450 million of its 8.375 % senior unsecured notes due in 2073.
In October 2019, Gener issued $450 million aggregate principal of 6.35 % senior unsecured notes due in 2079. The net proceeds from the issuance were used to fund the acquisition of Los Cururos, purchase via tender offer $73 million and $55 million aggregate principal of its senior unsecured notes due in 2021 and 2025, respectively, and prepay the remaining outstanding principal of $119 million of its senior unsecured notes due in 2021. As a result of these transactions, the Company recognized a loss on extinguishment of debt of $29 million.
Mong Duong — In August 2019, Mong Duong refinanced $1.1 billion aggregate principal of its existing senior secured notes due in 2029 with variable interest rates ranging from LIBOR + 2.25% to LIBOR + 4.15% in exchange for a fixed rate loan with a newly formed SPV, accounted for as an equity affiliate, due in 2029 with interest rates that vary from 4.41 % to 7.18 %. This refinancing was a non-cash transaction as the SPV acquired all of the outstanding rights and obligations of the original Mong Duong lenders. As a result of these transactions, the Company recognized a loss on extinguishment of debt of $31 million.
DP&L — In June 2019, DP&L issued $425 million aggregate principal of 3.95 % First Mortgage Bonds due in 2049. The net proceeds from the issuance were used to prepay the outstanding principal of $435 million under its variable rate $445 million credit agreement due in 2022.
DPL — In April 2019, DPL issued $400 million aggregate principal of 4.35 % senior unsecured notes due in 2029. The net proceeds from the issuance were used to redeem $400 million of the $780 million aggregate principal outstanding of its 7.25 % senior unsecured notes due in 2021. As a result of these transactions, the Company recognized a loss on extinguishment of debt of $43 million.
Non-Recourse Debt Covenants, Restrictions and Defaults — The terms of the Company's non-recourse debt include certain financial and nonfinancial covenants. These covenants are limited to subsidiary activity and vary among the subsidiaries. These covenants may include, but are not limited to, maintenance of certain reserves and financial ratios, minimum levels of working capital and limitations on incurring additional indebtedness.
As of December 31, 2019 and 2018, approximately $372 million and $627 million, respectively, of restricted cash was maintained in accordance with certain covenants of the non-recourse debt agreements, and these amounts were included within Restricted cash and Debt service reserves and other deposits in the accompanying Consolidated Balance Sheets.
152 | Notes to Consolidated Financial Statements—(Continued) | December 31, 2019, 2018, and 2017 |
Various lender and governmental provisions restrict the ability of certain of the Company's subsidiaries to transfer their net assets to the Parent Company. Such restricted net assets of subsidiaries amounted to approximately $1.2 billion at December 31, 2019.
The following table summarizes the Company's subsidiary non-recourse debt in default (in millions) as of December 31, 2019. Due to the defaults, these amounts are included in the current portion of non-recourse debt:
Primary Nature of Default | December 31, 2019 | ||||||||
Subsidiary | Default | Net Assets | |||||||
AES Puerto Rico | Covenant | $ | $ | ||||||
AES Ilumina (Puerto Rico) | Covenant | ||||||||
AES Jordan Solar (1) | Covenant | ||||||||
Total | $ | ||||||||
_____________________________
(1) | Classified as current held-for-sale liability on the Consolidated Balance Sheets. |
The above defaults are not payment defaults. In Puerto Rico, the subsidiary non-recourse debt defaults were triggered by failure to comply with covenants or other requirements contained in the non-recourse debt documents due to the bankruptcy of the offtaker.
The AES Corporation's recourse debt agreements include cross-default clauses that will trigger if a subsidiary or group of subsidiaries for which the non-recourse debt is in default provides 20 % or more of the Parent Company's total cash distributions from businesses for the four most recently completed fiscal quarters. As of December 31, 2019, the Company had no defaults which resulted in or were at risk of triggering a cross-default under the recourse debt of the Parent Company. In the event the Parent Company is not in compliance with the financial covenants of its senior secured revolving credit facility, restricted payments will be limited to regular quarterly shareholder dividends at the then-prevailing rate. Payment defaults and bankruptcy defaults would preclude the making of any restricted payments.
RECOURSE DEBT — The following table summarizes the carrying amount and terms of recourse debt of the Company as of the periods indicated (in millions):
Interest Rate | Final Maturity | December 31, 2019 | December 31, 2018 | ||||||||
Senior Unsecured Note | 2021 | ||||||||||
Senior Secured Term Loan | LIBOR + 1.75% | 2022 | |||||||||
Senior Unsecured Note | 2023 | ||||||||||
Senior Unsecured Note | 2023 | ||||||||||
Drawings on secured credit facility | LIBOR + 1.75% | 2024 | |||||||||
Senior Unsecured Note | 2024 | ||||||||||
Senior Unsecured Note | 2025 | ||||||||||
Senior Unsecured Note | 2026 | ||||||||||
Senior Unsecured Note | 2027 | ||||||||||
Unamortized (discount) premium & debt issuance (costs), net | ( | ) | ( | ) | |||||||
Subtotal | $ | $ | |||||||||
Less: Current maturities | ( | ) | ( | ) | |||||||
Noncurrent maturities | $ | $ | |||||||||
The following table summarizes the principal amounts due under our recourse debt for the next five years and thereafter (in millions):
December 31, | Net Principal Amounts Due | ||
2020 | $ | ||
2021 | |||
2022 | |||
2023 | |||
2024 | |||
Thereafter | |||
Unamortized (discount) premium & debt issuance (costs), net | ( | ) | |
Total recourse debt | $ | ||
In September 2019, the Company prepaid $343 million aggregate principal of its LIBOR + 1.75% existing senior secured term loan due in 2022 and $100 million of its 4.875 % senior unsecured notes due in 2023. As a result of these transactions, the Company recognized a loss on extinguishment of debt of $5 million.
In December 2018, the Company prepaid $150 million aggregate principal of its existing senior secured term
153 | Notes to Consolidated Financial Statements—(Continued) | December 31, 2019, 2018, and 2017 |
loan due in 2022. As a result of the transaction, the Company recognized a loss on extinguishment of debt of $1 million.
In March 2018, the Company purchased via tender offers $671 million aggregate principal of its existing 5.50 % senior unsecured notes due in 2024 and $29 million of its existing 5.50 % senior unsecured notes due in 2025. As a result of these transactions, the Company recognized a loss on extinguishment of debt of $44 million.
In March 2018, the Company issued $500 million aggregate principal of 4.00 % senior notes due in 2021 and $500 million of 4.50 % senior notes due in 2023. The Company used the proceeds from these issuances to purchase via tender offer in full the $228 million balance of its 8.00 % senior notes due in 2020 and the $690 million balance of its 7.375 % senior notes due in 2021. As a result of these transactions, the Company recognized a loss on extinguishment of debt of $125 million.
Recourse Debt Covenants and Guarantees — The Company's obligations under the senior secured credit facility and senior secured term loan are, subject to certain exceptions, secured by (i) all of the capital stock of domestic subsidiaries owned directly by the Company and 65 % of the capital stock of certain foreign subsidiaries owned directly or indirectly by the Company; and (ii) certain intercompany receivables, certain intercompany notes and certain intercompany tax sharing agreements.
The senior secured credit facility and senior secured term loan are subject to mandatory prepayment under certain circumstances, including the sale of certain assets. In such a situation, the net cash proceeds from the sale must be applied pro rata to repay the term loan, if any, using 60 % of net cash proceeds, reduced to 50 % when and if the Parent Company's recourse debt to cash flow ratio is less than 5:1. The lenders have the option to waive their pro rata redemption.
The senior secured credit facility contains customary covenants and restrictions on the Company's ability to engage in certain activities, including, but not limited to, limitations on other indebtedness, liens, investments and guarantees; limitations on restricted payments such as shareholder dividends and equity repurchases; restrictions on mergers and acquisitions, sales of assets, leases, transactions with affiliates and off-balance sheet or derivative arrangements; and other financial reporting requirements.
The senior secured credit facility also contains financial covenants, evaluated quarterly, requiring the Company to maintain a minimum ratio of adjusted operating cash flow to interest charges on recourse debt of 2.5 times and a maximum ratio of recourse debt to adjusted operating cash flow of 5.75 times.
The terms of the Company's senior unsecured notes and senior secured term loan contain certain covenants including limitations on the Company's ability to incur liens or enter into sale and leaseback transactions.
12. COMMITMENTS
The Company enters into long-term contracts for construction projects, maintenance and service, transmission of electricity, operations services and purchases of electricity and fuel. In general, these contracts are subject to variable quantities or prices and are terminable only in limited circumstances. The following table shows the future minimum commitments for continuing operations under these contracts as of December 31, 2019 for 2020 through 2024 and thereafter as well as actual purchases under these contracts for the years ended December 31, 2019, 2018, and 2017 (in millions):
Actual purchases during the year ended December 31, | Electricity Purchase Contracts | Fuel Purchase Contracts | Other Purchase Contracts | ||||||||
2017 | $ | $ | $ | ||||||||
2018 | |||||||||||
2019 | |||||||||||
Future commitments for the year ending December 31, | |||||||||||
2020 | $ | $ | $ | ||||||||
2021 | |||||||||||
2022 | |||||||||||
2023 | |||||||||||
2024 | |||||||||||
Thereafter | |||||||||||
Total | $ | $ | $ | ||||||||
154 | Notes to Consolidated Financial Statements—(Continued) | December 31, 2019, 2018, and 2017 |
13. CONTINGENCIES
Guarantees and Letters of Credit — In connection with certain project financings, acquisitions and dispositions, power purchases and other agreements, the Parent Company has expressly undertaken limited obligations and commitments, most of which will only be effective or will be terminated upon the occurrence of future events. In the normal course of business, the Parent Company has entered into various agreements, mainly guarantees and letters of credit, to provide financial or performance assurance to third parties on behalf of AES businesses. These agreements are entered into primarily to support or enhance the creditworthiness otherwise achieved by a business on a stand-alone basis, thereby facilitating the availability of sufficient credit to accomplish their intended business purposes. Most of the contingent obligations relate to future performance commitments which the Company or its businesses expect to fulfill within the normal course of business. The expiration dates of these guarantees vary from less than one year to more than 15 years .
The following table summarizes the Parent Company's contingent contractual obligations as of December 31, 2019. Amounts presented in the following table represent the Parent Company's current undiscounted exposure to guarantees and the range of maximum undiscounted potential exposure. The maximum exposure is not reduced by the amounts, if any, that could be recovered under the recourse or collateralization provisions in the guarantees. There were no obligations made by the Parent Company for the direct benefit of the lenders associated with the non-recourse debt of its businesses.
Contingent Contractual Obligations | Amount (in millions) | Number of Agreements | Maximum Exposure Range for Each Agreement (in millions) | |||||
Guarantees and commitments | $ | $0 — 157 | ||||||
Letters of credit under the unsecured credit facility | $1 — 296 | |||||||
Letters of credit under the senior secured credit facility | $0 — 4 | |||||||
Asset sale related indemnities (1) | $ | |||||||
Total | $ | |||||||
_____________________________
(1) | Excludes normal and customary representations and warranties in agreements for the sale of assets (including ownership in associated legal entities) where the associated risk is considered to be nominal. |
During the year ended December 31, 2019, the Company paid letter of credit fees ranging from 1 % to 3 % per annum on the outstanding amounts of letters of credit.
Environmental — The Company periodically reviews its obligations as they relate to compliance with environmental laws, including site restoration and remediation. For the periods ended December 31, 2019 and 2018, the Company recognized liabilities of $4 million and $5 million for projected environmental remediation costs, respectively. Due to the uncertainties associated with environmental assessment and remediation activities, future costs of compliance or remediation could be higher or lower than the amount currently accrued. Moreover, where no liability has been recognized, it is reasonably possible that the Company may be required to incur remediation costs or make expenditures in amounts that could be material but could not be estimated as of December 31, 2019. In aggregate, the Company estimates the range of potential losses related to environmental matters, where estimable, to be up to $15 million. The amounts considered reasonably possible do not include amounts accrued as discussed above.
Litigation — The Company is involved in certain claims, suits and legal proceedings in the normal course of business. The Company accrues for litigation and claims when it is probable that a liability has been incurred and the amount of loss can be reasonably estimated. The Company has recognized aggregate liabilities for all claims of approximately $55 million and $53 million as of December 31, 2019 and 2018, respectively. These amounts are reported on the Consolidated Balance Sheets within Accrued and other liabilities and Other noncurrent liabilities. A significant portion of these accrued liabilities relate to regulatory matters and commercial disputes in international jurisdictions. There can be no assurance that these accrued liabilities will be adequate to cover all existing and future claims or that we will have the liquidity to pay such claims as they arise.
Where no accrued liability has been recognized, it is reasonably possible that some matters could be decided unfavorably to the Company and could require the Company to pay damages or make expenditures in amounts that could be material but could not be estimated as of December 31, 2019. The material contingencies where a loss is reasonably possible primarily include disputes with offtakers, suppliers and EPC contractors; alleged breaches of contract; alleged violation of laws and regulations; income tax and non-income tax matters with tax authorities; and regulatory matters. In aggregate, the Company estimates the range of potential losses, where estimable, related to these reasonably possible material contingencies to be between $75 million and $503 million. The amounts
155 | Notes to Consolidated Financial Statements—(Continued) | December 31, 2019, 2018, and 2017 |
considered reasonably possible do not include amounts accrued, as discussed above. These material contingencies do not include income tax-related contingencies which are considered part of our uncertain tax positions.
14. LEASES
LESSEE — Right-of-use assets are long-term by nature. The following table summarizes the amounts recognized on the Consolidated Balance Sheets related to lease asset and liability balances as of the period indicated (in millions):
Consolidated Balance Sheet Classification | December 31, 2019 | |||||
Assets | ||||||
Right-of-use assets — finance leases | Electric generation, distribution assets and other | $ | ||||
Right-of-use assets — operating leases | Other noncurrent assets | |||||
Total right-of-use assets | $ | |||||
Liabilities | ||||||
Finance lease liabilities (current) | Non-recourse debt (current liabilities) | $ | ||||
Finance lease liabilities (noncurrent) | Non-recourse debt (noncurrent liabilities) | |||||
Total finance lease liabilities | ||||||
Operating lease liabilities (current) | Accrued and other liabilities | |||||
Operating lease liabilities (noncurrent) | Other noncurrent liabilities | |||||
Total operating lease liabilities | ||||||
Total lease liabilities | $ | |||||
The following table summarizes supplemental balance sheet information related to leases as of the period indicated:
Lease Term and Discount Rate | December 31, 2019 | |
Weighted-average remaining lease term — finance leases | ||
Weighted-average remaining lease term — operating leases | ||
Weighted-average discount rate — finance leases | % | |
Weighted-average discount rate — operating leases | % | |
The following table summarizes the components of lease expense recognized in Cost of Sales on the Consolidated Statements of Operations for the year ended (in millions):
Components of Lease Cost | December 31, 2019 | ||
Operating lease cost | $ | ||
Finance lease cost: | |||
Amortization of right-of-use assets | |||
Interest on lease liabilities | |||
Short-term lease costs | |||
Variable lease cost | |||
Total lease cost | $ | ||
Operating cash outflows from operating leases included in the measurement of lease liabilities were $48 million for the twelve months ended December 31, 2019.
156 | Notes to Consolidated Financial Statements—(Continued) | December 31, 2019, 2018, and 2017 |
The following table shows the future lease payments under operating and finance leases for continuing operations together with the present value of the net lease payments as of December 31, 2019 for 2020 through 2024 and thereafter (in millions):
Maturity of Lease Liabilities | |||||||
Finance Leases | Operating Leases | ||||||
2020 | $ | $ | |||||
2021 | |||||||
2022 | |||||||
2023 | |||||||
2024 | |||||||
Thereafter | |||||||
Total | |||||||
Less: Imputed interest | ( | ) | ( | ) | |||
Present value of lease payments | $ | $ | |||||
LESSOR — Lease revenue included in the Consolidated Statements of Operations was $600 million for the twelve months ended December 31, 2019, of which $130 million was related to variable lease payments. Underlying gross assets and accumulated depreciation of operating leases included in Property, Plant and Equipment on the Consolidated Balance Sheets were $2.9 billion and $707 million, respectively, as of December 31, 2019.
The following table shows the future lease receipts as of December 31, 2019 for 2020 through 2024 and thereafter (in millions):
Future Cash Receipts for | |||||||
Sales-Type Leases | Operating Leases | ||||||
2020 | $ | $ | |||||
2021 | |||||||
2022 | |||||||
2023 | |||||||
2024 | |||||||
Thereafter | |||||||
Total | $ | ||||||
Less: Imputed interest | ( | ) | |||||
Present value of total lease receipts | $ | ||||||
The Company is constructing and operating projects that pair battery energy storage systems ("BESS") with solar energy systems, which allows the project more flexibility on when to provide energy to the grid. The Company will enter into PPAs for the full output of the facility that allow customers the ability to determine when to charge and discharge the BESS. These arrangements include both lease and non-lease elements under ASC 842, with the BESS component constituting a sales-type lease. Upon commencement of the lease, the book value of the leased asset is removed from the balance sheet and a net investment in sales-type lease is recognized based on the present value of fixed payments under the contract and the residual value of the underlying asset. Due to the variable nature of lease payments under these contracts, the Company recorded losses at commencement of sales-type leases of $36 million for the year ended December 31, 2019. These amounts are recognized in Other expense in the Consolidated Statement of Operations. See Note 21—Other Income and Expense for further information.
15. BENEFIT PLANS
Defined Contribution Plan — The Company sponsors four defined contribution plans ("the DC Plans"). Two plans cover U.S. non-union employees; one for Parent Company and certain US and Utilities SBU business employees, and one for DPL employees. The remaining two plans include union and non-union employees at IPL and union employees at DPL. The DC Plans are qualified under section 401 of the Internal Revenue Code. Most U.S. employees of the Company are eligible to participate in the appropriate plan except for those employees who are covered by a collective bargaining agreement, unless such agreement specifically provides that the employee is
157 | Notes to Consolidated Financial Statements—(Continued) | December 31, 2019, 2018, and 2017 |
considered an eligible employee under a plan. Within the DC Plans, the Company provides matching contributions in addition to other non-matching contributions. Participants are fully vested in their own contributions. The Company's contributions vest over various time periods ranging from immediate up to five years . For the years ended December 31, 2019, 2018 and 2017, costs for defined contribution plans were approximately $19 million, $21 million and $23 million, respectively.
Defined Benefit Plans — Certain of the Company's subsidiaries have defined benefit pension plans covering substantially all of their respective employees ("the DB Plans"). Pension benefits are based on years of credited service, age of the participant, and average earnings. Of the 28 active DB Plans as of December 31, 2019, five are at U.S. subsidiaries and the remaining plans are at foreign subsidiaries.
The following table reconciles the Company's funded status, both domestic and foreign, as of the periods indicated (in millions):
2019 | 2018 | |||||||||||||||
U.S. | Foreign | U.S. | Foreign | |||||||||||||
CHANGE IN PROJECTED BENEFIT OBLIGATION: | ||||||||||||||||
Benefit obligation as of January 1 | $ | $ | $ | $ | ||||||||||||
Service cost | ||||||||||||||||
Interest cost | ||||||||||||||||
Employee contributions | ||||||||||||||||
Plan amendments | ||||||||||||||||
Plan settlements | ( | ) | ||||||||||||||
Benefits paid | ( | ) | ( | ) | ( | ) | ( | ) | ||||||||
Plan combinations | ( | ) | ||||||||||||||
Divestitures | ( | ) | ||||||||||||||
Actuarial (gain) loss | ( | ) | ( | ) | ||||||||||||
Effect of foreign currency exchange rate changes | ( | ) | ( | ) | ||||||||||||
Benefit obligation as of December 31 | $ | $ | $ | $ | ||||||||||||
CHANGE IN PLAN ASSETS: | ||||||||||||||||
Fair value of plan assets as of January 1 | $ | $ | $ | $ | ||||||||||||
Actual return on plan assets | ( | ) | ||||||||||||||
Employer contributions | ||||||||||||||||
Employee contributions | ||||||||||||||||
Plan settlements | ( | ) | ||||||||||||||
Benefits paid | ( | ) | ( | ) | ( | ) | ( | ) | ||||||||
Divestitures | ( | ) | ||||||||||||||
Effect of foreign currency exchange rate changes | ( | ) | ||||||||||||||
Fair value of plan assets as of December 31 | $ | $ | $ | $ | ||||||||||||
RECONCILIATION OF FUNDED STATUS | ||||||||||||||||
Funded status as of December 31 | $ | ( | ) | $ | ( | ) | $ | ( | ) | $ | ( | ) | ||||
December 31, | 2019 | 2018 | ||||||||||||||
Amounts Recognized on the Consolidated Balance Sheets | U.S. | Foreign | U.S. | Foreign | ||||||||||||
Noncurrent assets | $ | $ | $ | $ | ||||||||||||
Accrued benefit liability—current | ( | ) | ( | ) | ||||||||||||
Accrued benefit liability—noncurrent | ( | ) | ( | ) | ( | ) | ( | ) | ||||||||
Net amount recognized at end of year | $ | ( | ) | $ | ( | ) | $ | ( | ) | $ | ( | ) | ||||
The following table summarizes the Company's U.S. and foreign accumulated benefit obligation as of the periods indicated (in millions):
December 31, | 2019 | 2018 | |||||||||||||
U.S. | Foreign | U.S. | Foreign | ||||||||||||
Accumulated Benefit Obligation | $ | $ | $ | $ | |||||||||||
Information for pension plans with an accumulated benefit obligation in excess of plan assets: | |||||||||||||||
Projected benefit obligation | $ | $ | $ | $ | |||||||||||
Accumulated benefit obligation | |||||||||||||||
Fair value of plan assets | |||||||||||||||
Information for pension plans with a projected benefit obligation in excess of plan assets: | |||||||||||||||
Projected benefit obligation | $ | $ | $ | $ | |||||||||||
Fair value of plan assets | |||||||||||||||
158 | Notes to Consolidated Financial Statements—(Continued) | December 31, 2019, 2018, and 2017 |
The following table summarizes the significant weighted average assumptions used in the calculation of benefit obligation and net periodic benefit cost, both domestic and foreign, as of the periods indicated:
December 31, | 2019 | 2018 | |||||||||||
U.S. | Foreign | U.S. | Foreign | ||||||||||
Benefit Obligation: | Discount rate | % | % | % | % | ||||||||
Rate of compensation increase | % | % | % | % | |||||||||
Periodic Benefit Cost: | Discount rate | % | % | (1) | % | % | (1) | ||||||
Expected long-term rate of return on plan assets | % | % | % | % | |||||||||
Rate of compensation increase | % | % | % | % | |||||||||
_____________________________
(1) |
The Company establishes its estimated long-term return on plan assets considering various factors, which include the targeted asset allocation percentages, historic returns, and expected future returns.
The measurement of pension obligations, costs, and liabilities is dependent on a variety of assumptions. These assumptions include estimates of the present value of projected future pension payments to all plan participants, taking into consideration the likelihood of potential future events such as salary increases and demographic experience. These assumptions may have an effect on the amount and timing of future contributions.
The assumptions used in developing the required estimates include the following key factors: discount rates, salary growth, retirement rates, inflation, expected return on plan assets, and mortality rates. The effects of actual results differing from the Company's assumptions are accumulated and amortized over future periods and, therefore, generally affect the Company's recognized expense in such future periods. Unrecognized gains or losses are amortized using the “corridor approach,” under which the net gain or loss in excess of 10% of the greater of the projected benefit obligation or the market-related value of the assets, if applicable, is amortized.
Sensitivity of the Company's pension funded status to the indicated increase or decrease in the discount rate and long-term rate of return on plan assets assumptions is shown below. Note that these sensitivities may be asymmetric and are specific to the base conditions at year-end 2019. They also may not be additive, so the impact of changing multiple factors simultaneously cannot be calculated by combining the individual sensitivities shown. The funded status as of December 31, 2019 is affected by the assumptions as of that date. Pension expense for 2019 is affected by the December 31, 2018 assumptions. The impact on pension expense from a one percentage point change in these assumptions is shown in the following table (in millions):
Increase of 1% in the discount rate | $ | ( | ) | |
Decrease of 1% in the discount rate | ||||
Increase of 1% in the long-term rate of return on plan assets | ( | ) | ||
Decrease of 1% in the long-term rate of return on plan assets | ||||
The following table summarizes the components of the net periodic benefit cost, both domestic and foreign, for the years indicated (in millions):
December 31, | 2019 | 2018 | 2017 | |||||||||||||||||||||
Components of Net Periodic Benefit Cost: | U.S. | Foreign | U.S. | Foreign | U.S. | Foreign | ||||||||||||||||||
Service cost | $ | $ | $ | $ | $ | $ | ||||||||||||||||||
Interest cost | ||||||||||||||||||||||||
Expected return on plan assets | ( | ) | ( | ) | ( | ) | ( | ) | ( | ) | ( | ) | ||||||||||||
Amortization of prior service cost | ||||||||||||||||||||||||
Amortization of net loss | ||||||||||||||||||||||||
Curtailment loss recognized | ||||||||||||||||||||||||
Settlement loss recognized | ||||||||||||||||||||||||
Total pension cost | $ | $ | $ | $ | $ | $ | ||||||||||||||||||
The following table summarizes the amounts reflected in AOCL, including AOCL attributable to noncontrolling interests, on the Consolidated Balance Sheet as of December 31, 2019, that have not yet been recognized as components of net periodic benefit cost (in millions):
December 31, 2019 | Accumulated Other Comprehensive Income (Loss) | ||||||
U.S. | Foreign | ||||||
Prior service cost | $ | ( | ) | $ | |||
Unrecognized net actuarial loss | ( | ) | ( | ) | |||
Total | $ | ( | ) | $ | ( | ) | |
159 | Notes to Consolidated Financial Statements—(Continued) | December 31, 2019, 2018, and 2017 |
The following table summarizes the Company's target allocation for 2019 and pension plan asset allocation, both domestic and foreign, as of the periods indicated:
Percentage of Plan Assets as of December 31, | |||||||||||||||
Target Allocations | 2019 | 2018 | |||||||||||||
Asset Category | U.S. | Foreign | U.S. | Foreign | U.S. | Foreign | |||||||||
Equity securities | % | % | % | % | |||||||||||
Debt securities | % | % | % | % | |||||||||||
Real estate | % | % | % | % | |||||||||||
Other | % | % | % | % | |||||||||||
Total pension assets | % | % | % | % | |||||||||||
The U.S. DB Plans seek to achieve the following long-term investment objectives:
• | maintenance of sufficient income and liquidity to pay retirement benefits and other lump sum payments; |
• | long-term rate of return in excess of the annualized inflation rate; |
• | long-term rate of return, net of relevant fees, that meets or exceeds the assumed actuarial rate; and |
• | long-term competitive rate of return on investments, net of expenses, that equals or exceeds various benchmark rates. |
The asset allocation is reviewed periodically to determine a suitable asset allocation which seeks to manage risk through portfolio diversification and takes into account the above-stated objectives, in conjunction with current funding levels, cash flow conditions, and economic and industry trends. The following table summarizes the Company's U.S. DB Plan assets by category of investment and level within the fair value hierarchy as of the periods indicated (in millions):
December 31, 2019 | December 31, 2018 | |||||||||||||||||||||||||||||||
U.S. Plans | Level 1 | Level 2 | Level 3 | Total | Level 1 | Level 2 | Level 3 | Total | ||||||||||||||||||||||||
Equity securities (2): | Mutual funds | $ | $ | $ | $ | $ | $ | $ | $ | |||||||||||||||||||||||
Debt securities (2): | Government debt securities | — | — | — | — | 170 | — | — | 170 | |||||||||||||||||||||||
Mutual funds (1) | ||||||||||||||||||||||||||||||||
Real estate (2): | Real estate | |||||||||||||||||||||||||||||||
Other: | Cash and cash equivalents | |||||||||||||||||||||||||||||||
Total plan assets | $ | $ | $ | $ | $ | $ | $ | $ | ||||||||||||||||||||||||
_____________________________
(1) |
(2) | In 2019, the U.S. plans moved all investments except cash and cash equivalents into collective trusts; therefore, the 2019 balances under the equity securities, debt securities, and real estate categories shown above represent investments through collective trusts. The plans have chosen collective trusts for which the underlying investments are mutual funds, mutual funds for which debt securities are the primary underlying investment, or real estate in alignment with the target asset allocation. |
The investment strategy of the foreign DB Plans seeks to maximize return on investment while minimizing risk. The assumed asset allocation has less exposure to equities in order to closely match market conditions and near term forecasts. The following table summarizes the Company's foreign DB plan assets by category of investment and level within the fair value hierarchy as of the periods indicated (in millions):
December 31, 2019 | December 31, 2018 | |||||||||||||||||||||||||||||||
Foreign Plans | Level 1 | Level 2 | Level 3 | Total | Level 1 | Level 2 | Level 3 | Total | ||||||||||||||||||||||||
Equity securities: | Mutual funds | $ | $ | $ | $ | $ | $ | $ | $ | |||||||||||||||||||||||
Private equity | ||||||||||||||||||||||||||||||||
Debt securities: | Government debt securities | |||||||||||||||||||||||||||||||
Mutual funds (1) | ||||||||||||||||||||||||||||||||
Real estate: | Real estate | |||||||||||||||||||||||||||||||
Other: | Cash and cash equivalents | |||||||||||||||||||||||||||||||
Other assets | ||||||||||||||||||||||||||||||||
Total plan assets | $ | $ | $ | $ | $ | $ | $ | $ | ||||||||||||||||||||||||
_____________________________
(1) |
160 | Notes to Consolidated Financial Statements—(Continued) | December 31, 2019, 2018, and 2017 |
The following table summarizes the estimated cash flows for U.S. and foreign expected employer contributions and expected future benefit payments, both domestic and foreign (in millions):
U.S. | Foreign | |||||||
Expected employer contribution in 2020 | $ | $ | ||||||
Expected benefit payments for fiscal year ending: | ||||||||
2020 | ||||||||
2021 | ||||||||
2022 | ||||||||
2023 | ||||||||
2024 | ||||||||
2025 - 2029 | ||||||||
16. REDEEMABLE STOCK OF SUBSIDIARIES
The following table is a reconciliation of changes in redeemable stock of subsidiaries (in millions):
December 31, | 2019 | 2018 | |||||
Balance at the beginning of the period | $ | $ | |||||
Contributions from holders of redeemable stock of subsidiaries | |||||||
Net income (loss) attributable to redeemable stock of subsidiaries | ( | ) | |||||
Fair value adjustment | |||||||
Other comprehensive income (loss) attributable to redeemable stock of subsidiaries | |||||||
Balance at the end of the period | $ | $ | |||||
The following table summarizes the Company's redeemable stock of subsidiaries balances as of the periods indicated (in millions):
December 31, | 2019 | 2018 | |||||
IPALCO common stock | $ | $ | |||||
Colon quotas (1) | |||||||
IPL preferred stock | |||||||
Total redeemable stock of subsidiaries | $ | $ | |||||
_____________________________
(1) | Characteristics of quotas are similar to common stock. |
Colon — Our partner in Colon made capital contributions of $10 million and $34 million during the year ended December 31, 2019 and 2018, respectively. Any subsequent adjustments to allocate earnings and dividends to our partner, or measure the investment at fair value, will be classified as temporary equity each reporting period as it is probable that the shares will become redeemable.
17. EQUITY
Equity Transactions with Noncontrolling Interests
Distributed Energy — In 2019 and 2018, Distributed Energy, through multiple transactions, sold noncontrolling interests in multiple project companies to tax equity partners. These transactions resulted in a $133 million and $98 million increase to noncontrolling interest in 2019 and 2018, respectively. Distributed Energy is reported in the US and Utilities SBU reportable segment.
Alto Maipo — In March 2017, AES Gener completed the legal and financial restructuring of Alto Maipo. As part of this restructuring, AES indirectly acquired the 40 % ownership interest of the noncontrolling shareholder for a de minimis payment, and sold a 6.7 % interest in the project to the construction contractor. This transaction resulted in a $196 million increase to the Parent Company’s Stockholders’ Equity due to an increase in additional paid-in-capital of $229 million, offset by the reclassification of accumulated other comprehensive losses from NCI to the Parent
161 | Notes to Consolidated Financial Statements—(Continued) | December 31, 2019, 2018, and 2017 |
Company Stockholders’ Equity of $33 million. No gain or loss was recognized in net income as the sale was not considered to be a sale of in-substance real estate. After completion of the sale, the Company has an effective 62 % economic interest in Alto Maipo. As the Company maintained control of the partnership after the sale, Alto Maipo continues to be consolidated by the Company within the South America SBU reportable segment.
Dominican Republic — In September 2017, Linda Group acquired 5 % of our Dominican Republic business for $60 million, pre-tax. This transaction resulted in a net increase of $25 million to the Company’s additional paid-in-capital and noncontrolling interest, respectively. No gain or loss was recognized in net income as the sale was not considered a sale of in-substance real estate. As the Company maintained control after the sale, our businesses in the Dominican Republic continue to be consolidated by the Company within the MCAC SBU reportable segment.
The following table summarizes the net income attributable to The AES Corporation and all transfers (to) from noncontrolling interests for the periods indicated (in millions):
December 31, | ||||||||||||
2019 | 2018 | 2017 | ||||||||||
Net income (loss) attributable to The AES Corporation | $ | $ | $ | ( | ) | |||||||
Transfers from noncontrolling interest: | ||||||||||||
Increase (decrease) in The AES Corporation's paid-in capital for sale of subsidiary shares | ( | ) | ( | ) | ||||||||
Increase (decrease) in The AES Corporation's paid-in-capital for purchase of subsidiary shares | ||||||||||||
Net transfers (to) from noncontrolling interest | ( | ) | ( | ) | ||||||||
Change from net income (loss) attributable to The AES Corporation and transfers (to) from noncontrolling interests | $ | $ | $ | ( | ) | |||||||
Accumulated Other Comprehensive Loss — The changes in AOCL by component, net of tax and noncontrolling interests, for the periods indicated were as follows (in millions):
Foreign currency translation adjustment, net | Derivative gains (losses), net | Unfunded pension obligations, net | Total | ||||||||||||
Balance at December 31, 2017 | $ | ( | ) | $ | ( | ) | $ | ( | ) | $ | ( | ) | |||
Other comprehensive loss before reclassifications | ( | ) | ( | ) | ( | ) | |||||||||
Amount reclassified to earnings | ( | ) | |||||||||||||
Other comprehensive income (loss) | $ | ( | ) | $ | $ | $ | ( | ) | |||||||
Cumulative effect of a change in accounting principle | |||||||||||||||
Balance at December 31, 2018 | $ | ( | ) | $ | ( | ) | $ | ( | ) | $ | ( | ) | |||
Other comprehensive loss before reclassifications | $ | ( | ) | $ | ( | ) | $ | ( | ) | $ | ( | ) | |||
Amount reclassified to earnings | |||||||||||||||
Other comprehensive income (loss) | $ | $ | ( | ) | $ | $ | ( | ) | |||||||
Cumulative effect of a change in accounting principle | ( | ) | ( | ) | |||||||||||
Balance at December 31, 2019 | $ | ( | ) | $ | ( | ) | $ | ( | ) | $ | ( | ) | |||
162 | Notes to Consolidated Financial Statements—(Continued) | December 31, 2019, 2018, and 2017 |
Reclassifications out of AOCL are presented in the following table. Amounts for the periods indicated are in millions and those in parenthesis indicate debits to the Consolidated Statements of Operations:
Details About | December 31, | |||||||||||||
AOCL Components | Affected Line Item in the Consolidated Statements of Operations | 2019 | 2018 | 2017 | ||||||||||
Foreign currency translation adjustments, net | ||||||||||||||
Gain (loss) on disposal and sale of business interests | $ | ( | ) | $ | $ | ( | ) | |||||||
Net gain from disposal of discontinued operations | ( | ) | ||||||||||||
Net income (loss) attributable to The AES Corporation | $ | ( | ) | $ | $ | ( | ) | |||||||
Derivative gains (losses), net | ||||||||||||||
Non-regulated revenue | $ | ( | ) | $ | ( | ) | $ | |||||||
Non-regulated cost of sales | ( | ) | ( | ) | ( | ) | ||||||||
Interest expense | ( | ) | ( | ) | ( | ) | ||||||||
Gain (loss) on disposal and sale of business interests | ||||||||||||||
Foreign currency transaction gains (losses) | ( | ) | ( | ) | ||||||||||
Income from continuing operations before taxes and equity in earnings of affiliates | ( | ) | ( | ) | ( | ) | ||||||||
Income tax expense | ||||||||||||||
Net equity in earnings (losses) of affiliates | ( | ) | ||||||||||||
Income (loss) from continuing operations | ( | ) | ( | ) | ( | ) | ||||||||
Less: Income from continuing operations attributable to noncontrolling interests and redeemable stock of subsidiaries | ||||||||||||||
Net income (loss) attributable to The AES Corporation | $ | ( | ) | $ | ( | ) | $ | ( | ) | |||||
Amortization of defined benefit pension actuarial losses, net | ||||||||||||||
Non-regulated cost of sales | ||||||||||||||
General and administrative expenses | ( | ) | ||||||||||||
Other expense | ( | ) | ( | ) | ||||||||||
Gain (loss) on disposal and sale of business interests | ( | ) | ||||||||||||
Income from continuing operations before taxes and equity in earnings of affiliates | ( | ) | ( | ) | ||||||||||
Income tax expense | ||||||||||||||
Income (loss) from continuing operations | ( | ) | ( | ) | ||||||||||
Net gain (loss) from disposal of discontinued operations | ( | ) | ( | ) | ||||||||||
Net income (loss) | ( | ) | ( | ) | ( | ) | ||||||||
Less: Income from continuing operations attributable to noncontrolling interests and redeemable stock of subsidiaries | ( | ) | ||||||||||||
Add: Loss from discontinued operations attributable to noncontrolling interests | ||||||||||||||
Net income (loss) attributable to The AES Corporation | $ | ( | ) | $ | ( | ) | $ | ( | ) | |||||
Total reclassifications for the period, net of income tax and noncontrolling interests | $ | ( | ) | $ | ( | ) | $ | ( | ) | |||||
Common Stock Dividends — The Parent Company paid dividends of $0.1365 per outstanding share to its common stockholders during the first, second, third and fourth quarters of 2019 for dividends declared in December 2018, February, July and October 2019, respectively.
On December 6, 2019, the Board of Directors declared a quarterly common stock dividend of $0.1433 per share payable on February 14, 2020 to shareholders of record at the close of business on January 31, 2020.
Stock Repurchase Program — No shares were repurchased in 2019. The cumulative repurchases from the commencement of the Program in July 2010 through December 31, 2019 totaled 154.3 million shares for a total cost of $1.9 billion, at an average price per share of $12.12 (including a nominal amount of commissions). As of December 31, 2019, $264 million remained available for repurchase under the Program.
The common stock repurchased has been classified as treasury stock and accounted for using the cost method. A total of 153,891,260 and 154,905,595 shares were held as treasury stock at December 31, 2019 and 2018, respectively. Restricted stock units under the Company's employee benefit plans are issued from treasury stock. The Company has not retired any common stock repurchased since it began the Program in July 2010.
18. SEGMENTS AND GEOGRAPHIC INFORMATION
The segment reporting structure uses the Company's management reporting structure as its foundation to reflect how the Company manages the businesses internally and is mainly organized by geographic regions which provides a socio-political-economic understanding of our business. The management reporting structure is organized by four SBUs led by our President and Chief Executive Officer: US and Utilities, South America, MCAC, and Eurasia SBUs. Using the accounting guidance on segment reporting, the Company determined that its four operating segments are aligned with its four reportable segments corresponding to its SBUs.
Corporate and Other — Included in "Corporate and Other" are the results of the AES self-insurance company
163 | Notes to Consolidated Financial Statements—(Continued) | December 31, 2019, 2018, and 2017 |
and certain equity affiliates, corporate overhead costs which are not directly associated with the operations of our four reportable segments, and certain intercompany charges such as self-insurance premiums which are fully eliminated in consolidation.
The Company uses Adjusted PTC as its primary segment performance measure. Adjusted PTC, a non-GAAP measure, is defined by the Company as pre-tax income from continuing operations attributable to The AES Corporation excluding gains or losses of the consolidated entity due to (a) unrealized gains or losses related to derivative transactions and equity securities; (b) unrealized foreign currency gains or losses; (c) gains, losses, benefits and costs associated with dispositions and acquisitions of business interests, including early plant closures, and gains and losses recognized at commencement of sales-type leases; (d) losses due to impairments; (e) gains, losses and costs due to the early retirement of debt; and (f) costs directly associated with a major restructuring program, including, but not limited to, workforce reduction efforts, relocations and office consolidation. Adjusted PTC also includes net equity in earnings of affiliates on an after-tax basis adjusted for the same gains or losses excluded from consolidated entities. The Company has concluded Adjusted PTC better reflects the underlying business performance of the Company and is the most relevant measure considered in the Company's internal evaluation of the financial performance of its segments. Additionally, given its large number of businesses and complexity, the Company concluded that Adjusted PTC is a more transparent measure that better assists investors in determining which businesses have the greatest impact on the Company's results.
Revenue and Adjusted PTC are presented before inter-segment eliminations, which includes the effect of intercompany transactions with other segments except for interest, charges for certain management fees, and the write-off of intercompany balances, as applicable. All intra-segment activity has been eliminated within the segment. Inter-segment activity has been eliminated within the total consolidated results.
The following tables present financial information by segment for the periods indicated (in millions):
Total Revenue | |||||||||||
Year Ended December 31, | 2019 | 2018 | 2017 | ||||||||
US and Utilities SBU | $ | $ | $ | ||||||||
South America SBU | |||||||||||
MCAC SBU | |||||||||||
Eurasia SBU | |||||||||||
Corporate and Other | |||||||||||
Eliminations | ( | ) | ( | ) | ( | ) | |||||
Total Revenue | $ | $ | $ | ||||||||
Reconciliation from Income from Continuing Operations before Taxes and Equity in Earnings of Affiliates: | Total Adjusted PTC | ||||||||||
Year Ended December 31, | 2019 | 2018 | 2017 | ||||||||
Income from continuing operations before taxes and equity in earnings of affiliates | $ | $ | $ | ||||||||
Add: Net equity in earnings (losses) of affiliates | ( | ) | |||||||||
Less: Income from continuing operations before taxes, attributable to noncontrolling interests | ( | ) | ( | ) | ( | ) | |||||
Pre-tax contribution | |||||||||||
Unrealized derivative and equity securities losses (gains) | ( | ) | |||||||||
Unrealized foreign currency losses (gains) | ( | ) | |||||||||
Disposition/acquisition losses (gains) | ( | ) | |||||||||
Impairment expense | |||||||||||
Loss on extinguishment of debt | |||||||||||
Restructuring costs | |||||||||||
Total Adjusted PTC | $ | $ | $ | ||||||||
Total Adjusted PTC | |||||||||||
Year Ended December 31, | 2019 | 2018 | 2017 | ||||||||
US and Utilities SBU | $ | $ | $ | ||||||||
South America SBU | |||||||||||
MCAC SBU | |||||||||||
Eurasia SBU | |||||||||||
Corporate and Other | ( | ) | ( | ) | ( | ) | |||||
Eliminations | ( | ) | ( | ) | ( | ) | |||||
Total Adjusted PTC | $ | $ | $ | ||||||||
164 | Notes to Consolidated Financial Statements—(Continued) | December 31, 2019, 2018, and 2017 |
Total Assets | Depreciation and Amortization | Capital Expenditures | ||||||||||||||||||||||||||||||||||
Year Ended December 31, | 2019 | 2018 | 2017 | 2019 | 2018 | 2017 | 2019 | 2018 | 2017 | |||||||||||||||||||||||||||
US and Utilities SBU | $ | $ | $ | $ | $ | $ | $ | $ | $ | |||||||||||||||||||||||||||
South America SBU | ||||||||||||||||||||||||||||||||||||
MCAC SBU | ||||||||||||||||||||||||||||||||||||
Eurasia SBU | — | |||||||||||||||||||||||||||||||||||
Discontinued operations | ||||||||||||||||||||||||||||||||||||
Corporate and Other | ||||||||||||||||||||||||||||||||||||
Total | $ | $ | $ | $ | $ | $ | $ | $ | $ | |||||||||||||||||||||||||||
Interest Income | Interest Expense | ||||||||||||||||||||||
Year Ended December 31, | 2019 | 2018 | 2017 | 2019 | 2018 | 2017 | |||||||||||||||||
US and Utilities SBU | $ | $ | $ | $ | $ | $ | |||||||||||||||||
South America SBU | |||||||||||||||||||||||
MCAC SBU | |||||||||||||||||||||||
Eurasia SBU | |||||||||||||||||||||||
Corporate and Other | |||||||||||||||||||||||
Total | $ | $ | $ | $ | $ | $ | |||||||||||||||||
Investments in and Advances to Affiliates | Net Equity in Earnings (Losses) of Affiliates | ||||||||||||||||||||||
Year Ended December 31, | 2019 | 2018 | 2017 | 2019 | 2018 | 2017 | |||||||||||||||||
US and Utilities SBU | $ | $ | $ | $ | $ | $ | |||||||||||||||||
South America SBU | ( | ) | |||||||||||||||||||||
MCAC SBU | ( | ) | ( | ) | ( | ) | ( | ) | |||||||||||||||
Eurasia SBU | ( | ) | |||||||||||||||||||||
Corporate and Other | ( | ) | ( | ) | ( | ) | |||||||||||||||||
Total | $ | $ | $ | $ | ( | ) | $ | $ | |||||||||||||||
The following table presents information, by country, about the Company's consolidated operations for each of the three years ended December 31, 2019, 2018, and 2017, and as of December 31, 2019 and 2018 (in millions). Revenue is recorded in the country in which it is earned and assets are recorded in the country in which they are located.
Total Revenue | Property, Plant & Equipment, net | ||||||||||||||||||
Year Ended December 31, | 2019 | 2018 | 2017 | 2019 | 2018 | ||||||||||||||
United States (1) | $ | $ | $ | $ | $ | ||||||||||||||
Non-U.S.: | |||||||||||||||||||
Chile | |||||||||||||||||||
Dominican Republic | |||||||||||||||||||
El Salvador | |||||||||||||||||||
Panama | |||||||||||||||||||
Brazil | |||||||||||||||||||
Colombia | |||||||||||||||||||
Bulgaria | |||||||||||||||||||
Mexico | |||||||||||||||||||
Argentina | |||||||||||||||||||
Vietnam (2) | |||||||||||||||||||
United Kingdom (3) | |||||||||||||||||||
Jordan (4) | |||||||||||||||||||
Philippines (5) | |||||||||||||||||||
Kazakhstan | |||||||||||||||||||
Other Non-U.S. | |||||||||||||||||||
Total Non-U.S. | |||||||||||||||||||
Total | $ | $ | $ | $ | $ | ||||||||||||||
_____________________________
(1) | Includes Puerto Rico revenues of $ |
(2) | The Mong Duong II power project is operated under a build, operate and transfer contract. Future expected payments for the construction performance obligation are recognized in Loan receivable on the Consolidated Balance Sheets. See Note 20—Revenue for further information. |
(3) | The Kilroot and Ballylumford property, plant and equipment was deconsolidated upon completion of the sale in June 2019. See Note 25—Held-For-Sale and Dispositions for further information. |
(4) | The property, plant and equipment in Jordan was classified as held-for-sale as of December 31, 2019. See Note 25—Held-For-Sale and Dispositions for further information. |
(5) | The Masinloc property, plant and equipment was classified as held-for-sale as of December 31, 2017, and deconsolidated upon completion of the sale in March 2018. See Note 25—Held-For-Sale and Dispositions for further information. |
165 | Notes to Consolidated Financial Statements—(Continued) | December 31, 2019, 2018, and 2017 |
19. SHARE-BASED COMPENSATION
RESTRICTED STOCK
Restricted Stock Units — The Company issues RSUs under its long-term compensation plan. The RSUs are generally granted based upon a percentage of the participant's base salary. The units have a three-year vesting schedule and vest in one-third increments over the three-year period. In all circumstances, RSUs granted by AES do not entitle the holder the right, or obligate AES, to settle the RSU in cash or other assets of AES.
For the years ended December 31, 2019, 2018, and 2017, RSUs issued had a grant date fair value equal to the closing price of the Company's stock on the grant date. The Company does not discount the grant date fair values to reflect any post-vesting restrictions. RSUs granted to employees during the years ended December 31, 2019, 2018, and 2017 had grant date fair values per RSU of $17.53 , $10.55 and $11.93 , respectively.
The following table summarizes the components of the Company's stock-based compensation related to its employee RSUs recognized in the Company's consolidated financial statements (in millions):
December 31, | 2019 | 2018 | 2017 | |||||||||
RSU expense before income tax | $ | $ | $ | |||||||||
Tax benefit | ( | ) | ( | ) | ( | ) | ||||||
RSU expense, net of tax | $ | $ | $ | |||||||||
Total value of RSUs converted (1) | $ | $ | $ | |||||||||
Total fair value of RSUs vested | $ | $ | $ | |||||||||
_____________________________
(1) | Amount represents fair market value on the date of conversion. |
Cash was not used to settle RSUs or compensation cost capitalized as part of the cost of an asset for the years ended December 31, 2019, 2018, and 2017. As of December 31, 2019, total unrecognized compensation cost related to RSUs of $10 million is expected to be recognized over a weighted average period of approximately 1.8 years. There were no modifications to RSU awards during the year ended December 31, 2019.
A summary of the activity of RSUs for the year ended December 31, 2019 follows (RSUs in thousands):
RSUs | Weighted Average Grant Date Fair Values | Weighted Average Remaining Vesting Term | |||||||
Nonvested at December 31, 2018 | $ | ||||||||
Vested | ( | ) | |||||||
Forfeited and expired | ( | ) | |||||||
Granted | |||||||||
Nonvested at December 31, 2019 | $ | ||||||||
Vested and expected to vest at December 31, 2019 | $ | ||||||||
The Company initially recognizes compensation cost on the estimated number of instruments for which the requisite service is expected to be rendered. In 2019, AES has estimated a weighted average forfeiture rate of 11.95 % for RSUs granted in 2019. This estimate will be revised if subsequent information indicates that the actual number of instruments forfeited is likely to differ from previous estimates. Based on the estimated forfeiture rate, the Company expects to expense $10 million on a straight-line basis over a three-year period.
The following table summarizes the RSUs that vested and were converted during the periods indicated (RSUs in thousands):
Year Ended December 31, | 2019 | 2018 | 2017 | ||||||
RSUs vested during the year | |||||||||
RSUs converted during the year, net of shares withheld for taxes | |||||||||
Shares withheld for taxes | |||||||||
OTHER SHARE BASED COMPENSATION
The Company has three other share-based award programs. The Company has recorded expenses of $22 million, $20 million and $8 million for 2019, 2018 and 2017, respectively, related to these programs.
Stock options — AES grants options to purchase shares of common stock under stock option plans to non-employee directors. Under the terms of the plans, the Company may issue options to purchase shares of the Company's common stock at a price equal to 100 % of the market price at the date the option is granted. Stock options issued in 2017, 2018 and 2019 have a three-year vesting schedule and vest in one-third increments over
166 | Notes to Consolidated Financial Statements—(Continued) | December 31, 2019, 2018, and 2017 |
the three-year period. The stock options have a contractual term of 10 years. In all circumstances, stock options granted by AES do not entitle the holder the right, or obligate AES, to settle the stock option in cash or other assets of AES.
Performance Stock Units — In 2017, 2018 and 2019, the Company issued PSUs to officers under its long-term compensation plan. PSUs are stock units which include performance conditions. Performance conditions are based on the Company's Proportional Free Cash Flow targets for 2017, 2018 and 2019. The performance conditions determine the vesting and final share equivalent per PSU and can result in earning an award payout range of 0 % to 200 %, depending on the achievement. The Company believes that it is probable that the performance condition will be met and will continue to be evaluated throughout the performance period. In all circumstances, PSUs granted by AES do not entitle the holder the right, or obligate AES, to settle the stock units in cash or other assets of AES.
20. REVENUE
The following table presents our revenue from contracts with customers and other revenue for the periods indicated (in millions):
Year Ended December 31, 2019 | |||||||||||||||||||||||
US and Utilities SBU | South America SBU | MCAC SBU | Eurasia SBU | Corporate, Other and Eliminations | Total | ||||||||||||||||||
Regulated Revenue | |||||||||||||||||||||||
Revenue from contracts with customers | $ | $ | $ | $ | $ | $ | |||||||||||||||||
Other regulated revenue | |||||||||||||||||||||||
Total regulated revenue | |||||||||||||||||||||||
Non-Regulated Revenue | |||||||||||||||||||||||
Revenue from contracts with customers | ( | ) | |||||||||||||||||||||
Other non-regulated revenue (1) | ( | ) | |||||||||||||||||||||
Total non-regulated revenue | $ | ( | ) | ||||||||||||||||||||
Total revenue | $ | $ | $ | $ | $ | ( | ) | $ | |||||||||||||||
Year Ended December 31, 2018 | |||||||||||||||||||||||
US and Utilities SBU | South America SBU | MCAC SBU | Eurasia SBU | Corporate, Other and Eliminations | Total | ||||||||||||||||||
Regulated Revenue | |||||||||||||||||||||||
Revenue from contracts with customers | $ | $ | $ | $ | $ | $ | |||||||||||||||||
Other regulated revenue | |||||||||||||||||||||||
Total regulated revenue | $ | $ | |||||||||||||||||||||
Non-Regulated Revenue | |||||||||||||||||||||||
Revenue from contracts with customers | $ | ( | ) | $ | |||||||||||||||||||
Other non-regulated revenue (1) | |||||||||||||||||||||||
Total non-regulated revenue | $ | $ | ( | ) | $ | ||||||||||||||||||
Total revenue | $ | $ | $ | $ | $ | ( | ) | $ | |||||||||||||||
_____________________________
(1) | Other non-regulated revenue primarily includes lease and derivative revenue not accounted for under ASC 606. |
Contract Balances — The timing of revenue recognition, billings, and cash collections results in accounts receivable and contract liabilities. The contract liabilities from contracts with customers were $117 million and $109 million as of December 31, 2019 and December 31, 2018, respectively.
During the years ended December 31, 2019 and 2018, we recognized revenue of $13 million and $36 million, respectively, that was included in the corresponding contract liability balance at the beginning of the periods.
A significant financing arrangement exists for our Mong Duong plant in Vietnam. The plant was constructed under a build, operate, and transfer contract and will be transferred to the Vietnamese government after the completion of a 25 year PPA. The performance obligation to construct the facility was substantially completed in
167 | Notes to Consolidated Financial Statements—(Continued) | December 31, 2019, 2018, and 2017 |
2015. Approximately $1.4 billion of contract consideration related to the construction, but not yet collected through the 25 year PPA, was reflected as a loan receivable as of December 31, 2019.
Remaining Performance Obligations — The transaction price allocated to remaining performance obligations represents future consideration for unsatisfied (or partially unsatisfied) performance obligations at the end of the reporting period. As of December 31, 2019, the aggregate amount of transaction price allocated to remaining performance obligations was $12 million, primarily consisting of fixed consideration for the sale of renewable energy credits (RECs) in long-term contracts in the U.S. We expect to recognize revenue on approximately one-fifth of the remaining performance obligations in 2020 and 2021, with the remainder recognized thereafter.
21. OTHER INCOME AND EXPENSE
Other income generally includes gains on insurance recoveries in excess of property damage, gains on asset sales and liability extinguishments, favorable judgments on contingencies, gains on contract terminations, allowance for funds used during construction and other income from miscellaneous transactions. Other expense generally includes losses on asset sales and dispositions, losses on legal contingencies, defined benefit plan non-service costs, and losses from other miscellaneous transactions. The components are summarized as follows (in millions):
Year Ended December 31, | 2019 | 2018 | 2017 | |||||||||
Other Income | Gain on insurance proceeds (1) | $ | $ | $ | ||||||||
Gain on remeasurement of contingent consideration (2) | ||||||||||||
AFUDC (US Utilities) | ||||||||||||
Legal settlements (3) | ||||||||||||
Other | ||||||||||||
Total other income | $ | $ | $ | |||||||||
Other Expenses | Loss on commencement of sales-type leases (4) | |||||||||||
Loss on sale and disposal of assets (5) | ||||||||||||
Non-service pension and other postretirement costs | ||||||||||||
Allowance for other receivables | ||||||||||||
Water rights write-off | ||||||||||||
Other | ||||||||||||
Total other expense | $ | $ | $ | |||||||||
_____________________________
(1) | Associated with recoveries for property damage at the Andres facility in the Dominican Republic from a lightning incident in September 2018 and the upgrade of the tunnel lining at Changuinola. |
(2) | Related to the amendment of the Oahu purchase agreement. See Note 26 —Acquisitions for further information. |
(3) | In December 2016, the Company and YPF entered into a settlement in which all parties agreed to give up any and all legal action related to gas supply contracts that were terminated in 2008 and have been in dispute since 2009. In January 2017, the YPF board approved the agreement and paid the Company $ |
(4) | Related to losses recognized at commencement of sales-type leases at Distributed Energy. See Note 14—Leases for further information. |
(5) | Associated with a loss due to damage from a lightning incident at the Andres facility in the Dominican Republic in September 2018 and a loss associated with upgrading the tunnel lining at Changuinola in 2019. |
22. ASSET IMPAIRMENT EXPENSE
Year ended December 31, (in millions) | 2019 | 2018 | 2017 | |||||||||
Kilroot and Ballylumford | $ | $ | $ | |||||||||
Hawaii | ||||||||||||
Shady Point | ||||||||||||
Nejapa | ||||||||||||
DPL | ||||||||||||
Laurel Mountain | ||||||||||||
Kazakhstan Hydroelectric | ||||||||||||
Kazakhstan CHPs | ||||||||||||
Other | ||||||||||||
Total | $ | $ | $ | |||||||||
Hawaii — During the fourth quarter of 2019, the Company tested the recoverability of its long-lived coal-fired asset in Hawaii. Uncertainty around the ability to contract the asset upon expiration of its existing PPA resulted in management's decision to reassess the economic useful life of the generation facility. A decrease in the economic useful life was identified as an impairment indicator. The Company determined that the carrying amount was not recoverable. The asset group, consisting of property, plant and equipment and intangible assets, was determined to
168 | Notes to Consolidated Financial Statements—(Continued) | December 31, 2019, 2018, and 2017 |
have a fair value of $103 million using the income approach. As a result, the Company recognized asset impairment expense of $60 million as of December 31, 2019. Hawaii is reported in the US and Utilities SBU reportable segment.
Kilroot and Ballylumford — During the fourth quarter of 2017, the Company tested the recoverability of its long-lived assets at Kilroot, a coal and oil-fired plant in Northern Ireland, as Kilroot was not successful in bidding its coal units into the December 2017 capacity auction for the newly implemented I-SEM market. The Company determined that the carrying amount of the asset group was not recoverable. The Kilroot asset group was determined to have a fair value of $20 million using the income approach. As a result, the Company recognized asset impairment expense of $37 million during the year ended December 31, 2017, which was limited to the carrying value of the coal units.
In April 2019, the Company entered into an agreement to sell its entire 100% interest in the Kilroot coal and oil-fired plant and energy storage facility and the Ballylumford gas-fired plant in the United Kingdom. Upon meeting the held-for-sale criteria, the Company performed an impairment analysis and determined that the carrying value of the asset group of $232 million was greater than its fair value less costs to sell of $114 million. As a result, the Company recognized asset impairment expense of $115 million. The Company completed the sale of Kilroot and Ballylumford in June 2019. Prior to their sale, Kilroot and Ballylumford were reported in the Eurasia SBU reportable segment. See Note 25—Held-for-Sale and Dispositions for further information.
Shady Point — In December 2018, the Company entered into an agreement to sell Shady Point, a coal-fired generation facility in the U.S. Due first to the uncertainty around future cash flows, and then upon meeting the held-for-sale criteria, the Company performed an impairment analysis of the Shady Point asset group in the second, third and fourth quarters of 2018, resulting in the recognition of total asset impairment expense of $157 million for the year ended December 31, 2018. Using the market approach, the asset group was determined to have a fair value of $30 million as of December 31, 2018. The sale was completed in May 2019. Prior to the sale, Shady Point was reported in the US and Utilities SBU reportable segment. See Note 25—Held-for-Sale and Dispositions for further information.
Nejapa — During the fourth quarter of 2018, the Company tested the recoverability of its long-lived assets at Nejapa, a landfill gas plant in El Salvador. Decreased production as a result of the landfill owner's failure to perform improvements necessary to continue extracting gas from the landfill was identified as an impairment indicator. The Company determined that the carrying amount was not recoverable. The asset group, consisting of property, plant, and equipment and intangible assets, was determined to have a fair value of $5 million using the income approach. As a result, the Company recognized asset impairment expense of $37 million as of December 31, 2018. Nejapa is reported in the US and Utilities SBU reportable segment.
DPL — In March 2017, the Board of Directors of DPL approved the retirement of the DPL operated and co-owned Stuart coal-fired and diesel-fired generating units, and the Killen coal-fired generating unit and combustion turbine on or before June 1, 2018. The Company performed an impairment analysis and determined that the carrying amounts of the facilities were not recoverable. The Stuart and Killen asset groups were determined to have fair values of $3 million and $8 million, respectively, using the income approach. As a result, the Company recognized total asset impairment expense of $66 million. The Stuart and Killen units were retired in May 2018. Prior to their retirement, Stuart and Killen were reported in the US and Utilities SBU reportable segment.
In December 2017, DPL entered into an agreement for the sale of six of its combustion turbine and diesel-fired generation facilities and related assets ("DPL peaker assets"). Upon meeting the held-for-sale criteria, the Company performed an impairment analysis and determined that the carrying value of the asset group of $346 million was greater than its fair value less costs to sell of $237 million. As a result, the Company recognized asset impairment expense of $109 million. DPL completed the sale of the peaker assets in March 2018. Prior to their sale, the DPL peaker assets were reported in the US and Utilities SBU reportable segment. See Note 25—Held-for-Sale and Dispositions for further information.
Laurel Mountain — During the fourth quarter of 2017, the Company tested the recoverability of its long-lived assets at Laurel Mountain, a wind farm in the U.S. Impairment indicators were identified based on a decline in forward pricing. The Company determined that the carrying amount was not recoverable. The Laurel Mountain asset group was determined to have a fair value of $33 million using the income approach. As a result, the Company recognized asset impairment expense of $121 million. Laurel Mountain is reported in the US and Utilities SBU reportable segment.
169 | Notes to Consolidated Financial Statements—(Continued) | December 31, 2019, 2018, and 2017 |
Kazakhstan Hydroelectric — In April 2017, the Republic of Kazakhstan stated the concession agreements would not be extended for Shulbinsk HPP and Ust-Kamenogorsk HPP, two hydroelectric plants in Kazakhstan, and initiated the process to transfer these plants back to the government. Upon meeting the held-for-sale criteria in the second quarter of 2017, the Company performed an impairment analysis and determined the carrying value of the asset group of $190 million, which included cumulative translation losses of $100 million, was greater than its fair value less costs to sell of $92 million. As a result, the Company recognized asset impairment expense of $92 million limited to the carrying value of the long-lived assets. The Company completed the transfer of the plants in October 2017. Prior to their transfer, the Kazakhstan hydroelectric plants were reported in the Eurasia SBU reportable segment. See Note 25—Held-for-Sale and Dispositions for further information.
Kazakhstan CHPs — In January 2017, the Company entered into an agreement for the sale of Ust-Kamenogorsk CHP and Sogrinsk CHP, its combined heating and power coal plants in Kazakhstan. Upon meeting the held-for-sale criteria in the first quarter of 2017, the Company performed an impairment analysis and determined that the carrying value of the asset group of $171 million, which included cumulative translation losses of $92 million, was greater than its fair value less costs to sell of $29 million. As a result, the Company recognized asset impairment expense of $94 million limited to the carrying value of the long-lived assets. The Company completed the sale of its interest in the Kazakhstan CHP plants in April 2017. Prior to their sale, the plants were reported in the Eurasia SBU reportable segment. See Note 25—Held-for-Sale and Dispositions for further information.
23. INCOME TAXES
U.S. Tax Reform — In 2017, the U.S. enacted the Tax Cuts and Jobs Act (the “TCJA”). The TCJA significantly changed U.S. corporate income tax law. Among other changes effective in 2017, the TCJA required companies to pay a one-time tax on certain unrepatriated earnings of foreign subsidiaries. Many other changes took effect in 2018, including a limit on the deductibility of interest expense and a new regime for taxing certain earnings of foreign subsidiaries.
The Company recognized the income tax effects of the TCJA in accordance with Staff Accounting Bulletin No. 118 (“SAB 118”) which provides SEC guidance on the application of ASC 740, Income Taxes, in the reporting period in which the TCJA was signed into law. Accordingly, the Company’s 2017 financial statements reflected provisional amounts for those impacts for which the accounting under ASC 740 was incomplete, but a reasonable estimate could be determined. As of December 31, 2018, the Company's accounting for the initial impacts of the TCJA was complete under SAB 118.
For the year ended December 31, 2018 the Company increased its estimate of the one-time transition tax by $194 million to $869 million. The estimated tax expense recognized for the year ended December 31, 2017 relating to the remeasurement of deferred tax assets and liabilities from an income tax rate of 35 % to 21 %, decreased $77 million, resulting in a total remeasurement benefit of $38 million.
In 2019, the U.S. Treasury issued final regulations related to the one-time transition tax which further amended the guidance of previously proposed regulations. As a result, $17 million of tax benefit was recorded in 2019, decreasing the total one-time transition tax to $852 million. This impact was partially offset by $7 million of deferred tax remeasurement expense, decreasing the total remeasurement benefit to $31 million.
Argentine Tax Reform — In December 2017, the Argentine government enacted reforms to its income tax laws that resulted in a decrease to statutory income tax rates for our Argentine businesses from 35 % to 30 % in 2018-2019 and to 25 % for 2020 and future years. The impact of remeasuring deferred taxes to account for the enacted change in future applicable income tax rates was recognized as income tax benefit in the fourth quarter of 2017, resulting in a decrease of $21 million to consolidated income tax expense. In December 2019, the Argentine government delayed certain impacts of the 2017 reform. The corporate income tax rate for 2020 and 2021 will remain at 30 %, reducing to 25 % only from 2022. The impact of remeasuring deferred taxes for this latest change to enacted income tax rates was recognized as income tax expense of $4 million in the fourth quarter of 2019.
170 | Notes to Consolidated Financial Statements—(Continued) | December 31, 2019, 2018, and 2017 |
Income Tax Provision — The following table summarizes the expense for income taxes on continuing operations for the periods indicated (in millions):
December 31, | 2019 | 2018 | 2017 | |||||||||
Federal: | Current | $ | ( | ) | $ | $ | ||||||
Deferred | ( | ) | ||||||||||
State: | Current | ( | ) | |||||||||
Deferred | ||||||||||||
Foreign: | Current | |||||||||||
Deferred | ( | ) | ||||||||||
Total | $ | $ | $ | |||||||||
Effective and Statutory Rate Reconciliation — The following table summarizes a reconciliation of the U.S. statutory federal income tax rate to the Company's effective tax rate as a percentage of income from continuing operations before taxes for the periods indicated:
December 31, | 2019 | 2018 | 2017 | ||||||
Statutory Federal tax rate | % | % | % | ||||||
State taxes, net of Federal tax benefit | % | % | ( | )% | |||||
Taxes on foreign earnings | % | % | % | ||||||
Valuation allowance | ( | )% | ( | )% | % | ||||
Change in tax law | ( | )% | % | % | |||||
Other—net | ( | )% | ( | )% | % | ||||
Effective tax rate | % | % | % | ||||||
For 2019, the 12 % taxes on foreign earnings item includes $19 million of tax benefit associated with the Company's equity investment in Guacolda. Included in the 2019 change in tax law amount of (1 )% are the downward adjustments to the U.S. one-time transition tax expense and deferred tax remeasurement benefit resulting from the issuance of the final regulations in 2019, offset by the impact of deferred tax remeasurement expense related to the December 2019 Argentina tax law change.
For 2018, the 6 % change in tax law item relates primarily to changes in estimate under SAB 118 of the impacts of adoption of the TCJA. The Company recognized tax expense of $194 million related to revised estimates of the one-time transition tax in accordance with proposed regulations issued by the U.S. Treasury in 2018. The adjustment was due in large part to the approach the proposed regulations adopted to determine the fair value of our interests in publicly traded subsidiaries. The Company also recognized tax benefit of $77 million related to revised estimates of deferred tax remeasurement. Included in the 9 % taxes on foreign earnings item is $124 million of U.S. GILTI tax expense related to foreign subsidiaries, including the sale of our interest in Masinloc.
For 2017, the 90 % change in tax law item relates primarily to the impact of U.S. and Argentine tax reform. The impact of the U.S one-time transition tax and remeasurement of deferred taxes represents 88 % and 5 %, respectively, which is partially offset by the tax benefit resulting from Argentine tax reform representing 3 %.
Income Tax Receivables and Payables — The current income taxes receivable and payable are included in Other Current Assets and Accrued and Other Liabilities, respectively, on the accompanying Consolidated Balance Sheets. The noncurrent income taxes receivable and payable are included in Other Noncurrent Assets and Other Noncurrent Liabilities, respectively, on the accompanying Consolidated Balance Sheets. The following table summarizes the income taxes receivable and payable as of the periods indicated (in millions):
December 31, | 2019 | 2018 | ||||||
Income taxes receivable—current | $ | $ | ||||||
Income taxes receivable—noncurrent | ||||||||
Total income taxes receivable | $ | $ | ||||||
Income taxes payable—current | $ | $ | ||||||
Income taxes payable—noncurrent | ||||||||
Total income taxes payable | $ | $ | ||||||
Deferred Income Taxes — Deferred income taxes reflect the net tax effects of (a) temporary differences between the carrying amounts of assets and liabilities for financial reporting purposes and the amounts used for income tax purposes and (b) operating loss and tax credit carryforwards. These items are stated at the enacted tax rates that are expected to be in effect when taxes are actually paid or recovered.
171 | Notes to Consolidated Financial Statements—(Continued) | December 31, 2019, 2018, and 2017 |
As of December 31, 2019, the Company had federal net operating loss carryforwards for tax return purposes of approximately $0.8 billion expiring in years 2033 to 2036. The Company also had federal general business tax credit carryforwards of approximately $23 million expiring primarily from 2021 to 2039, and federal alternative minimum tax credits of approximately $8 million that may be fully recovered by 2021 under the TCJA. Additionally, the Company had state net operating loss carryforwards as of December 31, 2019 of approximately $6.9 billion expiring primarily in years 2020 to 2039. As of December 31, 2019, the Company had foreign net operating loss carryforwards of approximately $2.7 billion that expire at various times beginning in 2020 and some of which carry forward without expiration, and tax credits available in foreign jurisdictions of approximately $14 million, $12 million of which expire in 2021.
Valuation allowances decreased $44 million during 2019 to $824 million at December 31, 2019. This net decrease was primarily the result of valuation allowance activity at certain U.S. states.
Valuation allowances decreased $120 million during 2018 to $868 million at December 31, 2018. This net decrease was primarily the result of valuation allowance activity at certain of our Brazil subsidiaries and U.S. states.
The Company believes that it is more likely than not that the net deferred tax assets as shown below will be realized when future taxable income is generated through the reversal of existing taxable temporary differences and income that is expected to be generated by businesses that have long-term contracts or a history of generating taxable income.
The following table summarizes deferred tax assets and liabilities, as of the periods indicated (in millions):
December 31, | 2019 | 2018 | ||||||
Differences between book and tax basis of property | $ | ( | ) | $ | ( | ) | ||
Other taxable temporary differences | ( | ) | ( | ) | ||||
Total deferred tax liability | ( | ) | ( | ) | ||||
Operating loss carryforwards | ||||||||
Capital loss carryforwards | ||||||||
Bad debt and other book provisions | ||||||||
Tax credit carryforwards | ||||||||
Other deductible temporary differences | ||||||||
Total gross deferred tax asset | ||||||||
Less: valuation allowance | ( | ) | ( | ) | ||||
Total net deferred tax asset | ||||||||
Net deferred tax liability | $ | ( | ) | $ | ( | ) | ||
The Company considers undistributed earnings of certain foreign subsidiaries to be indefinitely reinvested outside of the U.S. Except for the one-time transition tax in the U.S., no taxes have been recorded with respect to our indefinitely reinvested earnings in accordance with the relevant accounting guidance for income taxes. Should the earnings be remitted as dividends, the Company may be subject to additional foreign withholding and state income taxes. Under the TCJA, future distributions from foreign subsidiaries will generally be subject to a federal dividends received deduction in the U.S. As of December 31, 2019, the cumulative amount of U.S. GAAP foreign un-remitted earnings upon which additional income taxes have not been provided is approximately $4 billion. It is not practicable to estimate the amount of any additional taxes which may be payable on the undistributed earnings.
Income from operations in certain countries is subject to reduced tax rates as a result of satisfying specific commitments regarding employment and capital investment. The Company's income tax benefits related to the tax status of these operations are estimated to be $26 million, $35 million and $26 million for the years ended December 31, 2019, 2018 and 2017, respectively. The per share effect of these benefits after noncontrolling interests was $0.02 , $0.04 and $0.03 for the years ended December 31, 2019, 2018 and 2017, respectively. Included in the Company's income tax benefits is the benefit related to our operations in Vietnam, which is estimated to be $13 million, $19 million and $13 million for the years ended December 31, 2019, 2018 and 2017, respectively. The per share effect of these benefits related to our operations in Vietnam after noncontrolling interest was $0.01 , $0.01 and $0.01 for the years ended December 31, 2019, 2018 and 2017, respectively.
The following table shows the income (loss) from continuing operations, before income taxes, net equity in earnings of affiliates and noncontrolling interests, for the periods indicated (in millions):
172 | Notes to Consolidated Financial Statements—(Continued) | December 31, 2019, 2018, and 2017 |
December 31, | 2019 | 2018 | 2017 | |||||||||
U.S. | $ | ( | ) | $ | ( | ) | $ | ( | ) | |||
Non-U.S. | ||||||||||||
Total | $ | $ | $ | |||||||||
Uncertain Tax Positions — Uncertain tax positions have been classified as noncurrent income tax liabilities unless they are expected to be paid within one year. The Company's policy for interest and penalties related to income tax exposures is to recognize interest and penalties as a component of the provision for income taxes in the Consolidated Statements of Operations. The following table shows the total amount of gross accrued income taxes related to interest and penalties included in the Consolidated Balance Sheets for the periods indicated (in millions):
December 31, | 2019 | 2018 | ||||||
Interest related | $ | $ | ||||||
Penalties related | ||||||||
The following table shows the expense/(benefit) related to interest and penalties on unrecognized tax benefits for the periods indicated (in millions):
December 31, | 2019 | 2018 | 2017 | |||||||||
Total expense (benefit) for interest related to unrecognized tax benefits | $ | ( | ) | $ | ( | ) | $ | |||||
Total expense for penalties related to unrecognized tax benefits | ||||||||||||
We are potentially subject to income tax audits in numerous jurisdictions in the U.S. and internationally until the applicable statute of limitations expires. Tax audits by their nature are often complex and can require several years to complete. The following is a summary of tax years potentially subject to examination in the significant tax and business jurisdictions in which we operate:
Jurisdiction | Tax Years Subject to Examination | |
Argentina | 2014-2019 | |
Brazil | 2014-2019 | |
Chile | 2016-2019 | |
Colombia | 2016-2019 | |
Dominican Republic | 2015-2019 | |
El Salvador | 2017-2019 | |
Netherlands | 2013-2019 | |
Panama | 2016-2019 | |
United Kingdom | 2016-2019 | |
United States (Federal) | 2016-2019 | |
As of December 31, 2019, 2018 and 2017, the total amount of unrecognized tax benefits was $465 million, $463 million and $348 million, respectively. The total amount of unrecognized tax benefits that would benefit the effective tax rate as of December 31, 2019, 2018 and 2017 is $448 million, $446 million and $332 million, respectively, of which $33 million, $33 million and $29 million, respectively, would be in the form of tax attributes that would warrant a full valuation allowance. Further, the total amount of unrecognized tax benefit that would benefit the effective tax rate as of 2019 would be reduced by approximately $161 million of tax expense related to remeasurement from 35 % to 21 %.
The total amount of unrecognized tax benefits anticipated to result in a net decrease to unrecognized tax benefits within 12 months of December 31, 2019 is estimated to be between $0 million and $10 million, primarily relating to statute of limitation lapses and tax exam settlements.
The following is a reconciliation of the beginning and ending amounts of unrecognized tax benefits for the periods indicated (in millions):
2019 | 2018 | 2017 | ||||||||||
Balance at January 1 | $ | $ | $ | |||||||||
Additions for current year tax positions | ||||||||||||
Additions for tax positions of prior years | ||||||||||||
Reductions for tax positions of prior years | ( | ) | ( | ) | ( | ) | ||||||
Lapse of statute of limitations | ( | ) | ( | ) | ( | ) | ||||||
Balance at December 31 | $ | $ | $ | |||||||||
The Company and certain of its subsidiaries are currently under examination by the relevant taxing authorities for various tax years. The Company regularly assesses the potential outcome of these examinations in each of the
173 | Notes to Consolidated Financial Statements—(Continued) | December 31, 2019, 2018, and 2017 |
taxing jurisdictions when determining the adequacy of the amount of unrecognized tax benefit recorded. While it is often difficult to predict the final outcome or the timing of resolution of any particular uncertain tax position, we believe we have appropriately accrued for our uncertain tax benefits. However, audit outcomes and the timing of audit settlements and future events that would impact our previously recorded unrecognized tax benefits and the range of anticipated increases or decreases in unrecognized tax benefits are subject to significant uncertainty. It is possible that the ultimate outcome of current or future examinations may exceed our provision for current unrecognized tax benefits in amounts that could be material, but cannot be estimated as of December 31, 2019. Our effective tax rate and net income in any given future period could therefore be materially impacted.
24. DISCONTINUED OPERATIONS
Due to a portfolio evaluation in the first half of 2016, management decided to pursue a strategic shift to reduce the Company's exposure to the Brazilian distribution market.
Eletropaulo — In November 2017, Eletropaulo converted its preferred shares into ordinary shares and transitioned the listing of those shares to the Novo Mercado, which is a listing segment of the Brazilian stock exchange with the highest standards of corporate governance. Upon conversion of the preferred shares into ordinary shares, AES no longer controlled Eletropaulo, but maintained significant influence over the business. As a result, the Company deconsolidated Eletropaulo. After deconsolidation, the Company's 17 % ownership interest was reflected as an equity method investment. The Company recorded an after-tax loss on deconsolidation of $611 million, which primarily consisted of $455 million related to cumulative translation losses and $243 million related to pension losses reclassified from AOCL.
In December 2017, all remaining criteria were met for Eletropaulo to qualify as a discontinued operation. Therefore, its results of operations and financial position were reported as such in the consolidated financial statements for all periods presented.
In June 2018, the Company completed the sale of its entire 17 % ownership interest in Eletropaulo through a bidding process hosted by the Brazilian securities regulator, CVM. Gross proceeds of $340 million were received at our subsidiary in Brazil, subject to the payment of taxes. Upon disposal of Eletropaulo, the Company recorded a pre-tax gain on sale of $243 million (after-tax $199 million).
Excluding the gain on sale, Eletropaulo's pre-tax loss attributable to AES was immaterial for the year ended December 31, 2018. Eletropaulo's pre-tax loss attributable to AES, including the loss on deconsolidation, for the year ended December 31, 2017 was $633 million. Prior to its classification as discontinued operations, Eletropaulo was reported in the South America SBU reportable segment.
Borsod — In 2011, Borsod, which held two coal and biomass-fired generation plants in Hungary, filed for liquidation and was deconsolidated with its historical operating results reflected in discontinued operations under prior accounting guidance. In October 2018, the liquidation was completed and the Company recognized a deferred gain of $26 million, primarily comprised of a $20 million write-off of cumulative translation balances. Prior to its liquidation, Borsod was reported in the Eurasia SBU reportable segment.
174 | Notes to Consolidated Financial Statements—(Continued) | December 31, 2019, 2018, and 2017 |
The following table summarizes the major line items constituting loss from discontinued operations for the period indicated (in millions):
December 31, | 2017 | ||
Income (loss) from discontinued operations, net of tax: | |||
Revenue — regulated | $ | ||
Cost of sales | ( | ) | |
Other income and expense items that are not major (1) | ( | ) | |
Income from operations of discontinued businesses | |||
Loss from disposal and impairments of discontinued businesses | ( | ) | |
Loss from discontinued operations | ( | ) | |
Less: Net income attributable to noncontrolling interests | ( | ) | |
Loss from discontinued operations attributable to The AES Corporation | ( | ) | |
Income tax expense | ( | ) | |
Loss from discontinued operations, net of tax | $ | ( | ) |
_____________________________
(1) | Includes a loss contingency recognized by our equity method investment in discontinued operations. |
The following table summarizes the operating and investing cash flows from discontinued operations for the period indicated (in millions):
December 31, | 2017 | ||
Cash flows provided by operating activities of discontinued operations | $ | ||
Cash flows used in investing activities of discontinued operations | ( | ) | |
25. HELD-FOR-SALE AND DISPOSITIONS
Held-for-Sale
Jordan — In February 2019, the Company entered into an agreement to sell its 36 % ownership interest in two generation plants, IPP1 and IPP4, and a solar plant in Jordan for $86 million, subject to customary post-closing adjustments, plus capital contributions to the solar project of approximately $5 million. The sale of IPP1 and IPP4 is expected to close in the first half of 2020 and the sale of the solar plant is expected to close in the second half of 2020. As of December 31, 2019, the generation plants and solar plant were classified as held-for-sale, but did not meet the criteria to be reported as discontinued operations. On a consolidated basis, the carrying value of the plants held-for-sale as of December 31, 2019 was $153 million. Pre-tax income attributable to AES was $19 million, $10 million and $11 million for the years ended December 31, 2019, 2018 and 2017, respectively. Jordan is reported in the Eurasia SBU reportable segment.
Redondo Beach — In October 2018, the Company entered into an agreement to sell land held by AES Redondo Beach, a gas-fired generating facility in California. The sale is expected to close by the end of the first quarter of 2020. As of December 31, 2019, the $24 million carrying value of the land held by Redondo Beach was classified as held-for-sale. Redondo Beach is reported in the US and Utilities SBU reportable segment.
Dispositions
Stuart and Killen — In December 2019, DPL completed the transfer of the co-owned Stuart coal-fired and diesel-fired generating units and the Killen coal-fired generating unit and combustion turbine retired in May 2018, including the associated environmental liabilities. The transfer resulted in cash expenditures of $51 million and a gain on disposal of $20 million. Prior to their transfer, Stuart and Killen were reported in the US and Utilities SBU reportable segment. See Note 22—Asset Impairment Expense for further information.
Kilroot and Ballylumford — In June 2019, the Company completed the sale of its entire interest in the Kilroot coal and oil-fired plant and energy storage facility and the Ballylumford gas-fired plant in the United Kingdom for $118 million, subject to customary post-closing adjustments, resulting in a pre-tax loss on sale of $33 million primarily due to the write-off of cumulative translation adjustments and accumulated other comprehensive income balances. The sale did not meet the criteria to be reported as discontinued operations. Prior to the sale, Kilroot and Ballylumford were reported in the Eurasia SBU reportable segment. See Note 22—Asset Impairment Expense for further information.
175 | Notes to Consolidated Financial Statements—(Continued) | December 31, 2019, 2018, and 2017 |
Shady Point — In May 2019, the Company completed the sale of Shady Point, a U.S. coal-fired generating facility, for $29 million. The sale did not meet the criteria to be reported as discontinued operations. Prior to its sale, Shady Point was reported in the US and Utilities SBU reportable segment. See Note 22—Asset Impairment Expense for further information.
CTNG — In December 2018, AES Gener completed the sale of CTNG, an entity that holds transmission lines in Chile, for $225 million, resulting in a pre-tax gain on sale of $126 million after post-closing adjustments. The sale did not meet the criteria to be reported as discontinued operations. Prior to its sale, CTNG was reported in the South America SBU reportable segment.
Electrica Santiago — In May 2018, AES Gener completed the sale of Electrica Santiago for total consideration of $287 million, resulting in a final pre-tax gain on sale of $70 million after post-closing adjustments. Electrica Santiago consisted of four gas and diesel-fired generation plants in Chile. The sale did not meet the criteria to be reported as discontinued operations. Prior to its sale, Electrica Santiago was reported in the South America SBU reportable segment.
Masinloc — In March 2018, the Company completed the sale of its entire 51 % equity interest in Masinloc for cash proceeds of $1.05 billion, resulting in a pre-tax gain on sale of $772 million after post-closing adjustments, subject to U.S. income tax. Masinloc consisted of a coal-fired generation plant in operation, a coal-fired generation plant under construction and an energy storage facility all located in the Philippines. The sale did not meet the criteria to be reported as discontinued operations. Prior to its sale, Masinloc was reported in the Eurasia SBU reportable segment.
In 2014, the Company completed the sale of 45 % of its ownership interest in Masinloc for $436 million, including $23 million of consideration that was contingent upon the achievement of certain tax restructuring efficiencies. In December 2017, the related contingency expired and the $23 million of contingent consideration was recognized as a gain in Gain (loss) on disposal and sale of business interests in the Consolidated Statement of Operations.
DPL peaker assets — In March 2018, DPL completed the sale of six of its combustion turbine and diesel-fired generation facilities and related assets ("DPL peaker assets") for total proceeds of $239 million, resulting in a loss on sale of $2 million. The sale did not meet the criteria to be reported as discontinued operations. Prior to their sale, the DPL peaker assets were reported in the US and Utilities SBU reportable segment.
Beckjord facility — In February 2018, DPL transferred its interest in Beckjord, a coal-fired generation facility retired in 2014, including its obligations to remediate the facility and its site. The transfer resulted in cash expenditures of $15 million, inclusive of disposal charges, and a loss on disposal of $12 million. Prior to the transfer, Beckjord was reported in the US and Utilities SBU reportable segment.
Advancion Energy Storage — In January 2018, the Company deconsolidated the AES Advancion energy storage development business and contributed it to the Fluence joint venture, resulting in a gain on sale of $23 million. See Note 8—Investments in and Advances to Affiliates for further discussion. Prior to the transfer, the AES Advancion energy storage development business was reported as part of Corporate and Other.
Zimmer and Miami Fort — In December 2017, DPL and AES Ohio Generation completed the sale of Zimmer and Miami Fort, two coal-fired generating plants, for net proceeds of $70 million, resulting in a gain on sale of $13 million. The sale did not meet the criteria to be reported as discontinued operations. Prior to their sale, Zimmer and Miami Fort were reported in the US and Utilities SBU reportable segment.
Kazakhstan Hydroelectric — Affiliates of the Company (the “Affiliates”) previously operated Shulbinsk HPP and Ust-Kamenogorsk HPP (the “HPPs”), two hydroelectric plants in Kazakhstan, under a concession agreement with the Republic of Kazakhstan (“RoK”). In April 2017, the RoK initiated the process to transfer these plants back to the RoK. The RoK indicated that arbitration would be necessary to determine the correct Return Share Transfer Payment ("RST") and, rather than paying the Affiliates, deposited the RST into an escrow account. In exchange, the Affiliates transferred 100 % of the shares in the HPPs to the RoK, under protest and with a full reservation of rights. The Company recorded a loss on disposal of $33 million in the fourth quarter of 2017. In February 2018, the Affiliates initiated the arbitration process in international court to recover at least $75 million of the RST placed in escrow, based on the September 30, 2017 RST calculation. As of December 31, 2019, the arbitration proceedings are ongoing, and additional losses are not considered probable at this time. However, additional losses may be incurred if some or all of the disputed consideration is not paid by the RoK via a mutually acceptable settlement, or
176 | Notes to Consolidated Financial Statements—(Continued) | December 31, 2019, 2018, and 2017 |
upon any unfavorable decision rendered by the arbiter. The transfer did not meet the criteria to be reported as discontinued operations. Prior to their transfer, the Kazakhstan HPPs were reported in the Eurasia SBU reportable segment. See Note 22—Asset Impairment Expense for further information.
Kazakhstan CHPs — In April 2017, the Company completed the sale of Ust-Kamenogorsk CHP and Sogrinsk CHP, its combined heating and power coal plants in Kazakhstan, for net proceeds of $24 million. The Company recognized a pre-tax loss on sale of $49 million, primarily related to cumulative translation losses. The sale did not meet the criteria to be reported as discontinued operations. Prior to their sale, the Kazakhstan CHP plants were reported in the Eurasia SBU reportable segment. See Note 22—Asset Impairment Expense for further information.
Excluding any impairment charge or gain/loss on sale, pre-tax income (loss) attributable to AES of disposed businesses was as follows (in millions):
Year Ended December 31, | 2019 | 2018 | 2017 | ||||||||
Kilroot and Ballylumford | $ | ( | ) | $ | $ | ||||||
Stuart and Killen (1)(2) | |||||||||||
Shady Point | ( | ) | |||||||||
Masinloc | |||||||||||
Zimmer and Miami Fort | |||||||||||
Kazakhstan Hydroelectric | |||||||||||
Other | |||||||||||
Total | $ | $ | $ | ||||||||
_____________________________
(1) | After the retirement of Stuart and Killen in 2018, the Company entered into contracts to buy back all open capacity years for the plants at prices lower than the PJM capacity revenue prices. As such, the Company continued to earn capacity margin until the plants were transferred in December 2019. |
(2) | Reductions in the asset retirement obligations for ash ponds and landfills at Stuart and Killen in 2018 resulted in a $ |
26. ACQUISITIONS
Los Cururos — In November 2019, AES Gener completed the acquisition of the Los Cururos wind farm and transmission lines in Chile from EPM Chile S.A. for total consideration of $143 million, including $5 million in working capital adjustments paid in the first quarter of 2020. The transaction was accounted for as an asset acquisition, therefore the consideration transferred, plus transaction costs, was allocated to the individual assets acquired and liabilities assumed based on their relative fair values. Any differences arising from post-closing adjustments will be allocated accordingly. Los Cururos is reported in the South America SBU reportable segment.
Distributed Energy — In December 2018, Distributed Energy acquired the outstanding noncontrolling interest in a partnership holding various solar projects from its tax equity partner for $23 million of consideration in a non-cash transaction through the assumption of debt, increasing the Company's ownership to 100 %. The partnership was previously classified as an equity method investment. The transaction was accounted for as an asset acquisition, therefore the Company remeasured the equity investment at fair value and recognized a loss of $5 million in Other expense in the Consolidated Statement of Operations. The fair value of the investment, along with the consideration transferred, plus transaction costs, was allocated to the individual assets acquired and liabilities assumed based on their relative fair values. Distributed Energy is reported in the US and Utilities SBU reportable segment.
Oahu — In November 2018, AES Oahu amended a 2017 agreement to acquire 100 % of Na Pua Makani Power Partners, a partnership designed to develop and hold a wind project in Hawaii. The fair value of the initial consideration was $53 million, of which $48 million was contingent on meeting predefined development milestones. The transaction was accounted for as an acquisition of a variable interest entity that did not meet the definition of a business, therefore the assets acquired and liabilities assumed were recorded at their fair values, which equaled the fair value of the consideration. As a result of the amendment, the Company paid $11 million in 2018 and the contingent consideration was reduced to $5 million, resulting in a $32 million gain on remeasurement of contingent consideration recorded in Other income in the Consolidated Statement of Operations. AES Oahu is reported in the US and Utilities SBU reportable segment.
Guaimbê Solar Complex — In September 2018, AES Tietê completed the acquisition of the Guaimbê Solar Complex (“Guaimbê”) from Cobra do Brasil for $152 million, comprised of the exchange of $119 million of non-convertible debentures in project financing and additional cash consideration of $33 million. The transaction was
177 | Notes to Consolidated Financial Statements—(Continued) | December 31, 2019, 2018, and 2017 |
accounted for as an asset acquisition, therefore the consideration transferred, plus transaction costs, was allocated to the individual assets acquired and liabilities assumed based on their relative fair values. Guaimbê is reported in the South America SBU reportable segment.
Alto Sertão II — In August 2017, the Company completed the acquisition of the Alto Sertão II Wind Complex (“Alto Sertão II”) from Renova Energia S.A. for $179 million, plus the assumption of $346 million of non-recourse debt. At closing, the Company made a cash payment of $143 million, which excluded holdbacks related to indemnifications. In September 2018, an additional $12 million was paid to settle a portion of the remaining indemnification liability. In the first quarter of 2018, the Company finalized the purchase price allocation related to the acquisition of Alto Sertão II. There were no significant adjustments made to the preliminary purchase price allocation recorded in the third quarter of 2017 when the acquisition was completed. The assets acquired and liabilities assumed at the acquisition date were recorded at fair value, including a contingent liability for earn-out payments of $18 million, based on the final purchase price allocation at March 31, 2018. Subsequent changes to the fair value of the earn-out payments will be reflected in earnings. Alto Sertão II is reported in the South America SBU reportable segment.
27. EARNINGS PER SHARE
Basic and diluted earnings per share are based on the weighted-average number of shares of common stock and potential common stock outstanding during the period. Potential common stock, for purposes of determining diluted earnings per share, includes the effects of dilutive RSUs and stock options. The effect of such potential common stock is computed using the treasury stock method.
The following table is a reconciliation of the numerator and denominator of the basic and diluted earnings per share computation for income from continuing operations for the years ended December 31, 2019, 2018 and 2017, where income represents the numerator and weighted-average shares represent the denominator.
Year Ended December 31, | 2019 | 2018 | 2017 | |||||||||||||||||||||||||||||
(in millions, except per share data) | Income | Shares | $ per Share | Income | Shares | $ per Share | Loss | Shares | $ per Share | |||||||||||||||||||||||
BASIC EARNINGS (LOSS) PER SHARE | ||||||||||||||||||||||||||||||||
Income (loss) from continuing operations attributable to The AES Corporation common stockholders | $ | $ | $ | $ | $ | ( | ) | $ | ( | ) | ||||||||||||||||||||||
EFFECT OF DILUTIVE SECURITIES | ||||||||||||||||||||||||||||||||
Restricted stock units | ( | ) | ( | ) | ||||||||||||||||||||||||||||
DILUTED EARNINGS (LOSS) PER SHARE | $ | $ | $ | $ | $ | ( | ) | $ | ( | ) | ||||||||||||||||||||||
The calculation of diluted earnings per share excluded stock awards which would be anti-dilutive. The calculation of diluted earnings per share excluded 2 million and 7 million stock awards outstanding for the years ended December 31, 2018 and 2017, respectively, that could potentially dilute basic earnings per share in the future.
For the year ended December 31, 2017, the calculation of diluted earnings per share also excluded 4 million outstanding restricted stock units that could potentially dilute earnings per share in the future, because their impact would be anti-dilutive given the loss from continuing operations. Had the Company generated income, 2 million potential shares of common stock related to the restricted stock units would have been included in diluted weighted-average shares outstanding.
28. RISKS AND UNCERTAINTIES
AES is a diversified power generation and utility company organized into four market-oriented SBUs. See additional discussion of the Company's principal markets in Note 18—Segments and Geographic Information. Within our four SBUs, we have two primary lines of business: generation and utilities. The generation line of business uses a wide range of fuels and technologies to generate electricity such as coal, gas, hydro, wind, solar, and biomass. Our utilities business comprises businesses that transmit, distribute, and in certain circumstances, generate power. In addition, the Company has operations in the renewables area. These efforts include projects primarily in wind, solar, and energy storage.
Operating and Economic Risks — The Company operates in several developing economies where macroeconomic conditions are typically more volatile than developed economies. Deteriorating market conditions and evolving industry expectations to transition away from fossil fuel sources for generation expose the Company to
178 | Notes to Consolidated Financial Statements—(Continued) | December 31, 2019, 2018, and 2017 |
the risk of decreased earnings and cash flows due to, among other factors, adverse fluctuations in the commodities and foreign currency spot markets, and potential changes in the estimated useful lives of our coal-fired generation assets. Additionally, credit markets around the globe continue to tighten their standards, which could impact our ability to finance growth projects through access to capital markets. Currently, the Company has an investment grade rating from Fitch of BBB-, and a below-investment grade rating from Standard & Poor's of BB+ and Moody's of Ba1. This could affect the Company's ability to finance new and/or existing development projects at competitive interest rates. As of December 31, 2019, the Company had $1 billion of unrestricted cash and cash equivalents.
During 2019, 68 % of our revenue was generated outside the U.S. and a significant portion of our international operations is conducted in developing countries. We continue to invest in several developing countries to expand our existing platform and operations. International operations, particularly the operation, financing, and development of projects in developing countries, entail significant risks and uncertainties, including, without limitation:
• | economic, social, and political instability in any particular country or region; |
• | inability to economically hedge energy prices; |
• | volatility in commodity prices; |
• | adverse changes in currency exchange rates; |
• | government restrictions on converting currencies or repatriating funds; |
• | unexpected changes in foreign laws, regulatory framework, or in trade, monetary or fiscal policies; |
• | high inflation and monetary fluctuations; |
• | restrictions on imports of solar panels, wind turbines, coal, oil, gas, or other raw materials required by our generation businesses to operate; |
• | threatened or consummated expropriation or nationalization of our assets by foreign governments; |
• | unwillingness of governments, government agencies, similar organizations, or other counterparties to honor their commitments; |
• | unwillingness of governments, government agencies, courts, or similar bodies to enforce contracts that are economically advantageous to subsidiaries of the Company and economically unfavorable to counterparties, against such counterparties, whether such counterparties are governments or private parties; |
• | inability to obtain access to fair and equitable political, regulatory, administrative, and legal systems; |
• | adverse changes in government tax policy; |
• | potentially adverse tax consequences of operating in multiple jurisdictions; and |
• | difficulties in enforcing our contractual rights, enforcing judgments, or obtaining a just result in local jurisdictions. |
Any of these factors, individually or in combination with others, could materially and adversely affect our business, results of operations, and financial condition. In addition, our Latin American operations experience volatility in revenue and earnings which have caused and are expected to cause significant volatility in our results of operations and cash flows. The volatility is caused by regulatory and economic difficulties, political instability, indexation of certain PPAs to fuel prices, and currency fluctuations being experienced in many of these countries. This volatility reduces the predictability and enhances the uncertainty associated with cash flows from these businesses.
Our inability to predict, influence or respond appropriately to changes in law or regulatory schemes, including any inability to obtain reasonable increases in tariffs or tariff adjustments for increased expenses, could adversely impact our results of operations or our ability to meet publicly announced projections or analysts' expectations. Furthermore, changes in laws or regulations or changes in the application or interpretation of regulatory provisions in jurisdictions where we operate, particularly our utility businesses where electricity tariffs are subject to regulatory review or approval, could adversely affect our business, including, but not limited to:
• | changes in the determination, definition, or classification of costs to be included as reimbursable or pass-through costs; |
• | changes in the definition or determination of controllable or noncontrollable costs; |
• | adverse changes in tax law; |
179 | Notes to Consolidated Financial Statements—(Continued) | December 31, 2019, 2018, and 2017 |
• | changes in the definition of events which may or may not qualify as changes in economic equilibrium; |
• | changes in the timing of tariff increases; |
• | other changes in the regulatory determinations under the relevant concessions; or |
• | changes in environmental regulations, including regulations relating to GHG emissions in any of our businesses. |
Any of the above events may result in lower margins for the affected businesses, which can adversely affect our results of operations.
Goodwill — The Company considers a reporting unit at risk of impairment when its fair value does not exceed its carrying amount by more than 10%. During the annual goodwill impairment test performed as of October 1, 2019, the Company determined that the fair value of its Gener reporting unit exceeded its carrying value by 3 %. Therefore, Gener's $868 million goodwill balance was considered to be "at risk" as of December 31, 2019, largely due to the Chilean Government's announcement to phase out coal generation by 2040, and a decline in long-term energy prices.
The Company monitors its reporting units at risk of impairment for interim impairment indicators, and believes that the estimates and assumptions used in the calculations are reasonable as of December 31, 2019. Should the fair value of any of the Company’s reporting units fall below its carrying amount because of reduced operating performance, market declines, changes in the discount rate, regulatory changes, or other adverse conditions, goodwill impairment charges may be necessary in future periods.
Foreign Currency Risks — AES operates businesses in many foreign countries and such operations could be impacted by significant fluctuations in foreign currency exchange rates. Fluctuations in currency exchange rate between the USD and the following currencies could create significant fluctuations in earnings and cash flows: the Argentine peso, the Brazilian real, the Chilean peso, the Colombian peso, the Dominican Republic peso, the Euro, the Indian rupee, and the Mexican peso.
Argentina — In September 2019, currency controls were established by the Argentine government in order to control the devaluation of the Argentine peso and keep Argentine central bank reserves at acceptable levels. Restrictions on the flow of capital have limited the availability of international credit, and economic conditions in Argentina have further deteriorated, triggering additional devaluation of the Argentine peso and a deterioration of the country’s risk profile.
Concentrations — Due to the geographical diversity of its operations, the Company does not have any significant concentration of customers or sources of fuel supply. Several of the Company's generation businesses rely on PPAs with one or a limited number of customers for the majority of, and in some cases all of, the relevant businesses' output over the term of the PPAs. However, no single customer accounted for 10% or more of total revenue in 2019, 2018 or 2017.
The cash flows and results of operations of our businesses depend on the credit quality of our customers and the continued ability of our customers and suppliers to meet their obligations under PPAs and fuel supply agreements. If a substantial portion of the Company's long-term PPAs and/or fuel supply were modified or terminated, the Company would be adversely affected to the extent that it would be unable to replace such contracts at equally favorable terms.
29. RELATED PARTY TRANSACTIONS
Certain of our businesses in Panama and the Dominican Republic are partially owned by governments either directly or through state-owned institutions. In the ordinary course of business, these businesses enter into energy purchase and sale transactions, and transmission agreements with other state-owned institutions which are controlled by such governments. At two of our generation businesses in Mexico, the offtakers exercise significant influence, but not control, through representation on these businesses' Boards of Directors. These offtakers are also required to hold a nominal ownership interest in such businesses. In Chile, we provide capacity and energy under contractual arrangements to our investment which is accounted for under the equity method of accounting. Additionally, the Company provides certain support and management services to several of its affiliates under various agreements.
The Company's Consolidated Statements of Operations included the following transactions with related parties for the periods indicated (in millions):
180 | Notes to Consolidated Financial Statements—(Continued) | December 31, 2019, 2018, and 2017 |
Years Ended December 31, | 2019 | 2018 | 2017 | ||||||||
Revenue—Non-Regulated | $ | $ | $ | ||||||||
Cost of Sales—Non-Regulated | |||||||||||
Interest income | |||||||||||
Interest expense | |||||||||||
The following table summarizes the balances receivable from and payable to related parties included in the Company's Consolidated Balance Sheets as of the periods indicated (in millions):
December 31, | 2019 | 2018 | |||||
Receivables from related parties | $ | $ | |||||
Accounts and notes payable to related parties (1) | |||||||
_____________________________
(1) | Includes $ |
30. SELECTED QUARTERLY FINANCIAL DATA (UNAUDITED)
Quarterly Financial Data — The following tables summarize the unaudited quarterly Condensed Consolidated Statements of Operations for the Company for 2019 and 2018 (amounts in millions, except per share data). Amounts have been restated to reflect discontinued operations in all periods presented and reflect all adjustments necessary in the opinion of management for a fair statement of the results for interim periods.
Quarter Ended 2019 | Mar 31 | Jun 30 | Sep 30 | Dec 31 | |||||||||||
Revenue | $ | $ | $ | $ | |||||||||||
Operating margin | |||||||||||||||
Income (loss) from continuing operations, net of tax (1) | ( | ) | |||||||||||||
Income from discontinued operations, net of tax | |||||||||||||||
Net income (loss) | $ | $ | $ | $ | ( | ) | |||||||||
Net income (loss) attributable to The AES Corporation | $ | $ | $ | $ | ( | ) | |||||||||
Basic earnings (loss) per share: | |||||||||||||||
Income (loss) from continuing operations attributable to The AES Corporation common stockholders, net of tax | $ | $ | $ | $ | ( | ) | |||||||||
Income from discontinued operations attributable to The AES Corporation common stockholders, net of tax | |||||||||||||||
Net income (loss) attributable to The AES Corporation common stockholders | $ | $ | $ | $ | ( | ) | |||||||||
Diluted earnings (loss) per share: | |||||||||||||||
Income (loss) from continuing operations attributable to The AES Corporation common stockholders, net of tax | $ | $ | $ | $ | ( | ) | |||||||||
Income from discontinued operations attributable to The AES Corporation common stockholders, net of tax | |||||||||||||||
Net income (loss) attributable to The AES Corporation common stockholders | $ | $ | $ | $ | ( | ) | |||||||||
Dividends declared per common share | $ | $ | $ | $ | |||||||||||
181 | Notes to Consolidated Financial Statements—(Continued) | December 31, 2019, 2018, and 2017 |
Quarter Ended 2018 | Mar 31 | Jun 30 | Sep 30 | Dec 31 | |||||||||||
Revenue | $ | $ | $ | $ | |||||||||||
Operating margin | |||||||||||||||
Income from continuing operations, net of tax (2) | |||||||||||||||
Income (loss) from discontinued operations, net of tax (3) | ( | ) | ( | ) | |||||||||||
Net income | $ | $ | $ | $ | |||||||||||
Net income attributable to The AES Corporation | $ | $ | $ | $ | |||||||||||
Basic earnings per share: | |||||||||||||||
Income from continuing operations attributable to The AES Corporation common stockholders, net of tax | $ | $ | $ | $ | |||||||||||
Income from discontinued operations attributable to The AES Corporation common stockholders, net of tax | |||||||||||||||
Net income attributable to The AES Corporation common stockholders | $ | $ | $ | $ | |||||||||||
Diluted earnings per share: | |||||||||||||||
Income from continuing operations attributable to The AES Corporation common stockholders, net of tax | $ | $ | $ | $ | |||||||||||
Income from discontinued operations attributable to The AES Corporation common stockholders, net of tax | |||||||||||||||
Net income attributable to The AES Corporation common stockholders | $ | $ | $ | $ | |||||||||||
Dividends declared per common share | $ | $ | $ | $ | |||||||||||
_____________________________
(1) | Includes pre-tax impairment expense of $ |
(2) | Includes pre-tax gains on sales of business interests of $ |
(3) | Includes gain on sale of Eletropaulo of $ |
ITEM 9. CHANGES IN AND DISAGREEMENTS WITH ACCOUNTANTS ON ACCOUNTING AND FINANCIAL DISCLOSURE
None.
ITEM 9A. CONTROLS AND PROCEDURES
Conclusion Regarding the Effectiveness of Disclosure Controls and Procedures
The Company maintains disclosure controls and procedures that are designed to ensure that information required to be disclosed in the reports that the Company files or submits under the Securities Exchange Act of 1934, as amended (the "Exchange Act") is recorded, processed, summarized and reported within the time periods specified in the SEC's rules and forms, and that such information is accumulated and communicated to the CEO and CFO, as appropriate, to allow timely decisions regarding required disclosures.
The Company carried out the evaluation required by Rules 13a-15(b) and 15d-15(b), under the supervision and with the participation of our management, including the CEO and CFO, of the effectiveness of our “disclosure controls and procedures” (as defined in the Exchange Act Rules 13a-15(e) and 15d-15(e)). Based upon this evaluation, the CEO and CFO concluded that as of December 31, 2019, our disclosure controls and procedures were effective.
Management's Report on Internal Control over Financial Reporting
Management of the Company is responsible for establishing and maintaining adequate internal control over financial reporting, as defined in Rule 13a-15(f) under the Exchange Act. The Company's internal control over financial reporting is a process designed to provide reasonable assurance regarding the reliability of financial reporting and the preparation of financial statements for external purposes in accordance with GAAP and includes those policies and procedures that:
• | pertain to the maintenance of records that in reasonable detail, accurately and fairly reflect the transactions and dispositions of the assets of the Company; |
• | provide reasonable assurance that transactions are recorded as necessary to permit preparation of financial statements in accordance with GAAP, and that receipts and expenditures of the Company are being made only in accordance with authorizations of management and directors of the Company; and |
182 | 2019 Annual Report
• | provide reasonable assurance that unauthorized acquisition, use or disposition of the Company's assets that could have a material effect on the financial statements are prevented or detected timely. |
Management, including our CEO and CFO, does not expect that our internal controls will prevent or detect all errors and all fraud. A control system, no matter how well designed and operated, can provide only reasonable, not absolute, assurance that the objectives of the control system are met. Further, the design of a control system must reflect the fact that there are resource constraints, and the benefits of controls must be considered relative to their costs. In addition, any evaluation of the effectiveness of controls is subject to risks that those internal controls may become inadequate in future periods because of changes in business conditions, or that the degree of compliance with the policies or procedures deteriorates.
Management assessed the effectiveness of our internal control over financial reporting as of December 31, 2019. In making this assessment, management used the criteria established in Internal Control—Integrated Framework issued by the Committee of Sponsoring Organizations of the Treadway Commission ("COSO") in 2013. Based on this assessment, management believes that the Company maintained effective internal control over financial reporting as of December 31, 2019.
The effectiveness of the Company's internal control over financial reporting as of December 31, 2019, has been audited by Ernst & Young LLP, an independent registered public accounting firm, as stated in their report, which appears herein.
Changes in Internal Control Over Financial Reporting:
There were no changes that occurred during the quarter ended December 31, 2019 that have materially affected, or are reasonably likely to materially affect, our internal control over financial reporting.
183 | 2019 Annual Report
REPORT OF INDEPENDENT REGISTERED PUBLIC ACCOUNTING FIRM
To the Stockholders and the Board of Directors of The AES Corporation:
Opinion on Internal Control over Financial Reporting
We have audited The AES Corporation’s internal control over financial reporting as of December 31, 2019, based on criteria established in Internal Control — Integrated Framework issued by the Committee of Sponsoring Organizations of the Treadway Commission (2013 framework) (the COSO criteria). In our opinion, The AES Corporation (the Company) maintained, in all material respects, effective internal control over financial reporting as of December 31, 2019, based on the COSO criteria.
We also have audited, in accordance with the standards of the Public Company Accounting Oversight Board (United States) (PCAOB), the consolidated balance sheets of the Company as of December 31, 2019 and 2018, the related consolidated statements of operations, comprehensive income (loss), changes in equity, and cash flows for each of the three years in the period ended December 31, 2019, and the related notes and financial statement schedule listed in the Index at Item 15(a) (collectively referred to as the “financial statements”), and our report dated February 27, 2020, expressed an unqualified opinion thereon.
Basis for Opinion
The Company’s management is responsible for maintaining effective internal control over financial reporting and for its assessment of the effectiveness of internal control over financial reporting included in the accompanying Management’s Report on Internal Control over Financial Reporting. Our responsibility is to express an opinion on the Company’s internal control over financial reporting based on our audit. We are a public accounting firm registered with the PCAOB and are required to be independent with respect to the Company in accordance with the U.S. federal securities laws and the applicable rules and regulations of the Securities and Exchange Commission and the PCAOB.
We conducted our audit in accordance with the standards of the PCAOB. Those standards require that we plan and perform the audit to obtain reasonable assurance about whether effective internal control over financial reporting was maintained in all material respects.
Our audit included obtaining an understanding of internal control over financial reporting, assessing the risk that a material weakness exists, testing and evaluating the design and operating effectiveness of internal control based on the assessed risk, and performing such other procedures as we considered necessary in the circumstances. We believe that our audit provides a reasonable basis for our opinion.
Definition and Limitations of Internal Control Over Financial Reporting
A company’s internal control over financial reporting is a process designed to provide reasonable assurance regarding the reliability of financial reporting and the preparation of financial statements for external purposes in accordance with generally accepted accounting principles. A company’s internal control over financial reporting includes those policies and procedures that (1) pertain to the maintenance of records that, in reasonable detail, accurately and fairly reflect the transactions and dispositions of the assets of the company; (2) provide reasonable assurance that transactions are recorded as necessary to permit preparation of financial statements in accordance with generally accepted accounting principles, and that receipts and expenditures of the company are being made only in accordance with authorizations of management and directors of the company; and (3) provide reasonable assurance regarding prevention or timely detection of unauthorized acquisition, use, or disposition of the company’s assets that could have a material effect on the financial statements.
Because of its inherent limitations, internal control over financial reporting may not prevent or detect misstatements. Also, projections of any evaluation of effectiveness to future periods are subject to the risk that controls may become inadequate because of changes in conditions, or that the degree of compliance with the policies or procedures may deteriorate.
/s/ Ernst & Young LLP
Tysons, Virginia
February 27, 2020
184 | 2019 Annual Report | |
ITEM 9B. OTHER INFORMATION
None.
185 | 2019 Annual Report | |
PART III
ITEM 10. DIRECTORS, EXECUTIVE OFFICERS AND CORPORATE GOVERNANCE
The following information is incorporated by reference from the Registrant's Proxy Statement for the Registrant's 2020 Annual Meeting of Stockholders which the Registrant expects will be filed on or around March 6, 2020 (the "2020 Proxy Statement"):
• | information regarding the directors required by this item found under the heading Board of Directors; |
• | information regarding AES' Code of Ethics found under the heading Additional Governance Matters - AES Code of Business Conduct and Corporate Governance Guidelines; |
• | information regarding compliance with Section 16 of the Exchange Act required by this item found under the heading Additional Governance Matters - Other Governance Information - Section 16(a) Beneficial Ownership Reporting Compliance; and |
• | information regarding AES' Financial Audit Committee found under the heading Board and Committee Governance Matters - Financial Audit Committee (the “Audit Committee”). |
Certain information regarding executive officers required by this Item is presented as a supplementary item in Part I hereof (pursuant to Instruction 3 to Item 401(b) of Regulation S-K). The other information required by this Item, to the extent not included above, will be contained in our 2020 Proxy Statement and is herein incorporated by reference.
ITEM 11. EXECUTIVE COMPENSATION
The information required by Item 402 of Regulation S-K is contained in the 2020 Proxy Statement under "Director Compensation" and "Executive Compensation" (excluding the information under the caption “Report of the Compensation Committee”) and is incorporated herein by reference.
The information required by Item 407(e)(5) of Regulation S-K is contained under the caption “Report of the Compensation Committee Report” of the Proxy Statement. Such information shall not be deemed to be “filed.”
ITEM 12. SECURITY OWNERSHIP OF CERTAIN BENEFICIAL OWNERS AND MANAGEMENT AND RELATED STOCKHOLDER MATTERS
(a) | Security Ownership of Certain Beneficial Owners and Management. |
See the information contained under the heading Security Ownership of Certain Beneficial Owners, Directors, and Executive Officers of the 2020 Proxy Statement, which information is incorporated herein by reference.
(b) | Securities Authorized for Issuance under Equity Compensation Plans. |
The following table provides information about shares of AES common stock that may be issued under AES' equity compensation plans, as of December 31, 2019:
Securities Authorized for Issuance under Equity Compensation Plans (As of December 31, 2019)
(a) | (b) | (c) | |||||||
Plan category | Number of securities to be issued upon exercise of outstanding options, warrants and rights | Weighted average exercise price of outstanding options, warrants and rights | Number of securities remaining available for future issuance under equity compensation plans (excluding securities reflected in column (a)) | ||||||
Equity compensation plans approved by security holders (1) | 8,047,487 | (2) | $ | 12.54 | 13,964,029 | ||||
Equity compensation plans not approved by security holders | — | — | — | ||||||
Total | 8,047,487 | $ | 12.54 | 13,964,029 | |||||
_____________________________
(1) | The following equity compensation plans have been approved by The AES Corporation's Stockholders: |
(A) | The AES Corporation 2003 Long Term Compensation Plan was adopted in 2003 and provided for 17,000,000 shares authorized for issuance thereunder. In 2008, an amendment to the Plan to provide an additional 12,000,000 shares was approved by AES' stockholders, bringing the total authorized shares to 29,000,000. In 2010, an additional amendment to the Plan to provide an additional 9,000,000 shares was approved by AES' stockholders, bringing the total authorized shares to 38,000,000. In 2015, an additional amendment to the Plan to provide an additional 7,750,000 shares was approved by AES' stockholders, bringing the total authorized shares to 45,750,000. The weighted average exercise price of Options outstanding under this plan included in Column (b) is $12.54 (excluding performance stock units, restricted stock units and director stock units), with 13,964,029 shares available for future issuance. |
186 | 2019 Annual Report | |
(B) | The AES Corporation Second Amended and Restated Deferred Compensation Plan for directors provided for 2,000,000 shares authorized for issuance. Column (b) excludes the Director stock units granted thereunder. In conjunction with the 2010 amendment to the 2003 Long Term Compensation Plan, ongoing award issuance from this plan was discontinued in 2010 as Director stock units will be issued from the 2003 Long Term Compensation Plan. Any remaining shares under this plan, which are not reserved for issuance under outstanding awards, are not available for future issuance and thus the amount of 142,811 shares is not included in Column (c) above. |
(2) | Includes 3,214,738 (of which 477,532 are vested and 2,737,206 are unvested) shares underlying PSU and RSU awards (assuming 2017 and 2018 PSUs median performance and 2019 PSU maximum performance), 1,654,985 shares underlying Director stock unit awards, and 3,177,764 shares issuable upon the exercise of Stock Option grants, for an aggregate number of 8,047,487 shares. |
ITEM 13. CERTAIN RELATIONSHIPS AND RELATED PARTY TRANSACTIONS, AND DIRECTOR INDEPENDENCE
The information regarding related party transactions required by this item is included in the 2020 Proxy Statement found under the headings Transactions with Related Persons and Board and Committee Governance Matters and are incorporated herein by reference.
ITEM 14. PRINCIPAL ACCOUNTANT FEES AND SERVICES
The information required by this Item 14 is included in the 2020 Proxy Statement under the headings Information Regarding The Independent Registered Public Accounting Firm, Audit Fees, Audit Related Fees, and Pre-Approval Policies and Procedures and is incorporated herein by reference.
187 | 2019 Annual Report | |
PART IV
ITEM 15. EXHIBITS AND FINANCIAL STATEMENT SCHEDULE
(a) | Financial Statements. |
Financial Statements and Schedules: | Page | |
S-2-S-7 | ||
(b) | Exhibits. |
3.1 | ||
3.2 | ||
4 | There are numerous instruments defining the rights of holders of long-term indebtedness of the Registrant and its consolidated subsidiaries, none of which exceeds ten percent of the total assets of the Registrant and its subsidiaries on a consolidated basis. The Registrant hereby agrees to furnish a copy of any of such agreements to the Commission upon request. Since these documents are not required filings under Item 601 of Regulation S-K, the Company has elected to file certain of these documents as Exhibits 4.(a)—4.(i). | |
4.(a) | ||
4.(b) | ||
4.(c) | ||
4.(d) | ||
4.(e) | ||
4.(f) | ||
4.(g) | ||
4.(h) | ||
4.(i) | ||
10.1 | The AES Corporation Profit Sharing and Stock Ownership Plan are incorporated herein by reference to Exhibit 4(c)(1) of the Registration Statement on Form S-8 (Registration No. 33-49262) filed on July 2, 1992. (P) | |
10.2 | The AES Corporation Incentive Stock Option Plan of 1991, as amended, is incorporated herein by reference to Exhibit 10.30 of the Company's Form 10-K for the year ended December 31, 1995 (SEC File No. 00019281). (P) | |
10.3 | Applied Energy Services, Inc. Incentive Stock Option Plan of 1982 is incorporated herein by reference to Exhibit 10.31 of the Registration Statement on Form S-1 (Registration No. 33-40483). (P) | |
10.4 | Deferred Compensation Plan for Executive Officers, as amended, is incorporated herein by reference to Exhibit 10.32 of Amendment No. 1 to the Registration Statement on Form S-1 (Registration No. 33-40483). (P) | |
10.5 | ||
10.6 | ||
10.7 | The AES Corporation Supplemental Retirement Plan is incorporated herein by reference to Exhibit 10.63 of the Company's Form 10-K for the year ended December 31, 1994 (SEC File No. 00019281). (P) | |
10.7A | ||
188 | 2019 Annual Report | |
10.8 | ||
10.9 | ||
10.10 | ||
10.10A | ||
10.11 | ||
10.12 | ||
10.13 | ||
10.14 | ||
10.15 | ||
10.16 | ||
10.17 | ||
10.18 | ||
10.18A | ||
10.19 | ||
10.19A | ||
10.20 | ||
10.21 | ||
10.22 | ||
10.23 | ||
10.24 | ||
10.25 | ||
10.26 | ||
10.26A | ||
10.27 | ||
10.28 | ||
10.29 | ||
189 | 2019 Annual Report | |
10.30 | ||
10.31 | ||
21.1 | ||
23.1 | ||
24 | ||
31.1 | ||
31.2 | ||
32.1 | ||
32.2 | ||
101 | The AES Corporation Annual Report on Form 10-K for the year ended December 31, 2019, formatted in Inline XBRL (Inline Extensible Business Reporting Language): (i) the Cover Page, (ii) Consolidated Balance Sheets, (iii) Consolidated Statements of Operations, (iv) Consolidated Statements of Comprehensive Income (Loss), (v) Consolidated Statements of Changes in Equity, (vi) Consolidated Statements of Cash Flows, and (vii) Notes to Consolidated Financial Statements. The instance document does not appear in the Interactive Data File because its XBRL tags are embedded within the Inline XBRL document. | |
104 | Cover Page Interactive Data File (formatted as Inline XBRL and contained in Exhibit 101) | |
(c) | Schedule |
Schedule I—Financial Information of Registrant
190 | 2019 Annual Report | |
SIGNATURES
Pursuant to the requirements of Section 13 or 15(d) of the Securities Exchange Act of 1934, as amended, the Company has duly caused this report to be signed on its behalf by the undersigned, thereunto duly authorized.
THE AES CORPORATION (Company) | ||||
Date: | February 27, 2020 | By: | /s/ ANDRÉS GLUSKI | |
Name: | Andrés Gluski | |||
President, Chief Executive Officer | ||||
Pursuant to the requirements of the Securities Exchange Act of 1934, as amended, this report has been signed below by the following persons on behalf of the Company and in the capacities and on the dates indicated.
Name | Title | Date | ||
* | President, Chief Executive Officer (Principal Executive Officer) and Director | |||
Andrés Gluski | February 27, 2020 | |||
* | Director | |||
Janet G. Davidson | February 27, 2020 | |||
* | Director | |||
Charles L. Harrington | February 27, 2020 | |||
* | Director | |||
Tarun Khanna | February 27, 2020 | |||
* | Director | |||
Holly K. Koeppel | February 27, 2020 | |||
* | Director | |||
James H. Miller | February 27, 2020 | |||
* | Director | |||
Alain Monié | February 27, 2020 | |||
* | Chairman of the Board and Lead Independent Director | |||
John B. Morse | February 27, 2020 | |||
* | Director | |||
Moises Naim | February 27, 2020 | |||
* | Director | |||
Jeffrey W. Ubben | February 27, 2020 | |||
/s/ GUSTAVO PIMENTA | Executive Vice President and Chief Financial Officer (Principal Financial Officer) | |||
Gustavo Pimenta | February 27, 2020 | |||
/s/ SHERRY L. KOHAN | Vice President and Controller (Principal Accounting Officer) | |||
Sherry L. Kohan | February 27, 2020 | |||
*By: | /s/ PAUL L. FREEDMAN | February 27, 2020 | |
Attorney-in-fact | |||
S-1 | 2019 Annual Report | |
THE AES CORPORATION AND SUBSIDIARIES
INDEX TO FINANCIAL STATEMENT SCHEDULES
Schedules other than that listed above are omitted as the information is either not applicable, not required, or has been furnished in the consolidated financial statements or notes thereto included in Item 8 hereof.
See Notes to Schedule I
S-2 | 2019 Annual Report | |
THE AES CORPORATION
SCHEDULE I CONDENSED FINANCIAL INFORMATION OF PARENT
BALANCE SHEETS
December 31, | ||||||||
2019 | 2018 | |||||||
(in millions) | ||||||||
ASSETS | ||||||||
Current Assets: | ||||||||
Cash and cash equivalents | $ | $ | ||||||
Accounts and notes receivable from subsidiaries | ||||||||
Prepaid expenses and other current assets | ||||||||
Total current assets | ||||||||
Investment in and advances to subsidiaries and affiliates | ||||||||
Office Equipment: | ||||||||
Cost | ||||||||
Accumulated depreciation | ( | ) | ( | ) | ||||
Office equipment, net | ||||||||
Other Assets: | ||||||||
Other intangible assets, net of accumulated amortization | ||||||||
Deferred financing costs, net of accumulated amortization of $5 and $4, respectively | ||||||||
Deferred income taxes | ||||||||
Other assets | ||||||||
Total other assets | ||||||||
Total assets | $ | $ | ||||||
LIABILITIES AND STOCKHOLDERS' EQUITY | ||||||||
Current Liabilities: | ||||||||
Accounts payable | $ | $ | ||||||
Accounts and notes payable to subsidiaries | ||||||||
Accrued and other liabilities | ||||||||
Senior notes payable—current portion | ||||||||
Total current liabilities | ||||||||
Long-term Liabilities: | ||||||||
Senior notes payable | ||||||||
Accounts and notes payable to subsidiaries | ||||||||
Other long-term liabilities | ||||||||
Total long-term liabilities | ||||||||
Stockholders' equity: | ||||||||
Common stock | ||||||||
Additional paid-in capital | ||||||||
Accumulated deficit | ( | ) | ( | ) | ||||
Accumulated other comprehensive loss | ( | ) | ( | ) | ||||
Treasury stock | ( | ) | ( | ) | ||||
Total stockholders' equity | ||||||||
Total liabilities and equity | $ | $ | ||||||
See Notes to Schedule I.
S-3 | 2019 Annual Report | |
THE AES CORPORATION
SCHEDULE I CONDENSED FINANCIAL INFORMATION OF PARENT
STATEMENTS OF OPERATIONS
For the Years Ended December 31, | 2019 | 2018 | 2017 | |||||||||
(in millions) | ||||||||||||
Revenue from subsidiaries and affiliates | $ | $ | $ | |||||||||
Equity in earnings of subsidiaries and affiliates | ||||||||||||
Interest income | ||||||||||||
General and administrative expenses | ( | ) | ( | ) | ( | ) | ||||||
Other income | ||||||||||||
Other expense | ( | ) | ( | ) | ||||||||
Loss on extinguishment of debt | ( | ) | ( | ) | ( | ) | ||||||
Interest expense | ( | ) | ( | ) | ( | ) | ||||||
Income (loss) before income taxes | ( | ) | ||||||||||
Income tax (expense) | ( | ) | ( | ) | ( | ) | ||||||
Net income (loss) | $ | $ | $ | ( | ) | |||||||
See Notes to Schedule I.
S-4 | 2019 Annual Report | |
THE AES CORPORATION
SCHEDULE I CONDENSED FINANCIAL INFORMATION OF PARENT
STATEMENTS OF COMPREHENSIVE INCOME (LOSS)
YEARS ENDED DECEMBER 31, 2019, 2018, AND 2017
2019 | 2018 | 2017 | |||||||||
(in millions) | |||||||||||
NET INCOME (LOSS) | $ | $ | $ | ( | ) | ||||||
Foreign currency translation activity: | |||||||||||
Foreign currency translation adjustments, net of income tax benefit of $1, $2 and $11, respectively | ( | ) | ( | ) | |||||||
Reclassification to earnings, net of $0 income tax for all periods | ( | ) | |||||||||
Total foreign currency translation adjustments, net of tax | ( | ) | |||||||||
Derivative activity: | |||||||||||
Change in derivative fair value, net of income tax benefit of $53, $16 and $13, respectively | ( | ) | ( | ) | ( | ) | |||||
Reclassification to earnings, net of income tax benefit (expense) of $(4), $(13) and $1, respectively | |||||||||||
Total change in fair value of derivatives, net of tax | ( | ) | |||||||||
Pension activity: | |||||||||||
Prior service cost for the period, net of income tax expense of $0, $1 and $1, respectively | ( | ) | |||||||||
Change in pension adjustments due to net actuarial gain (loss) for the period, net of income tax benefit (expense) of $6, $(1) and $6, respectively | ( | ) | ( | ) | |||||||
Reclassification of earnings, net of income tax expense of $13, $2 and $126, respectively | |||||||||||
Total change in unfunded pension obligation | |||||||||||
OTHER COMPREHENSIVE INCOME (LOSS) | ( | ) | ( | ) | |||||||
COMPREHENSIVE INCOME (LOSS) | $ | $ | $ | ( | ) | ||||||
See Notes to Schedule I.
S-5 | 2019 Annual Report | |
THE AES CORPORATION
SCHEDULE I CONDENSED FINANCIAL INFORMATION OF PARENT
STATEMENTS OF CASH FLOWS
For the Years Ended December 31, | 2019 | 2018 | 2017 | |||||||||
(in millions) | ||||||||||||
Net cash provided by operating activities | $ | $ | $ | |||||||||
Investing Activities: | ||||||||||||
Proceeds from the sale of business interests, net of expenses | ||||||||||||
Investment in and net advances to subsidiaries | ( | ) | ( | ) | ( | ) | ||||||
Return of capital | ||||||||||||
Additions to property, plant and equipment | ( | ) | ( | ) | ( | ) | ||||||
Net cash provided by (used in) investing activities | ( | ) | ||||||||||
Financing Activities: | ||||||||||||
(Repayments) Borrowings under the revolver, net | ( | ) | ||||||||||
Borrowings of notes payable and other coupon bearing securities | ||||||||||||
Repayments of notes payable and other coupon bearing securities | ( | ) | ( | ) | ( | ) | ||||||
Loans from (Repayments to) subsidiaries | ( | ) | ||||||||||
Proceeds from issuance of common stock | ||||||||||||
Common stock dividends paid | ( | ) | ( | ) | ( | ) | ||||||
Payments for deferred financing costs | ( | ) | ( | ) | ( | ) | ||||||
Other financing | ( | ) | ( | ) | ( | ) | ||||||
Net cash used in financing activities | ( | ) | ( | ) | ( | ) | ||||||
Effect of exchange rate changes on cash | ( | ) | ||||||||||
Increase (Decrease) in cash and cash equivalents | ( | ) | ( | ) | ||||||||
Cash and cash equivalents, beginning | ||||||||||||
Cash and cash equivalents, ending | $ | $ | $ | |||||||||
Supplemental Disclosures: | ||||||||||||
Cash payments for interest, net of amounts capitalized | $ | $ | $ | |||||||||
Cash payments (refunds) for income taxes | $ | ( | ) | $ | $ | |||||||
S-6 | 2019 Annual Report | |
THE AES CORPORATION
SCHEDULE I
NOTES TO SCHEDULE I
1. Application of Significant Accounting Principles
The Schedule I Condensed Financial Information of the Parent includes the accounts of The AES Corporation (the “Parent Company”) and certain holding companies.
ACCOUNTING FOR SUBSIDIARIES AND AFFILIATES — The Parent Company has accounted for the earnings of its subsidiaries on the equity method in the financial information.
INCOME TAXES — Positions taken on the Parent Company's income tax return which satisfy a more-likely-than-not threshold will be recognized in the financial statements. The income tax expense or benefit computed for the Parent Company reflects the tax assets and liabilities on a stand-alone basis and the effect of filing a consolidated U.S. income tax return with certain other affiliated companies as well as effects of U.S. tax law reform enacted in 2017.
ACCOUNTS AND NOTES RECEIVABLE FROM SUBSIDIARIES — Amounts have been shown in current or long-term assets based on terms in agreements with subsidiaries, but payment is dependent upon meeting conditions precedent in the subsidiary loan agreements.
2. Debt
Senior and Secured Notes and Loans Payable ($ in millions)
December 31, | ||||||||||||
Interest Rate | Maturity | 2019 | 2018 | |||||||||
Senior Unsecured Note | 2021 | |||||||||||
Senior Secured Term Loan | LIBOR + 1.75% | 2022 | ||||||||||
Senior Unsecured Note | 2023 | |||||||||||
Senior Unsecured Note | 2023 | |||||||||||
Drawings on secured credit facility | LIBOR + 1.75% | 2024 | ||||||||||
Senior Unsecured Note | 2024 | |||||||||||
Senior Unsecured Note | 2025 | |||||||||||
Senior Unsecured Note | 2026 | |||||||||||
Senior Unsecured Note | 2027 | |||||||||||
Unamortized (discounts)/premiums & debt issuance (costs) | ( | ) | ( | ) | ||||||||
Subtotal | $ | $ | ||||||||||
Less: Current maturities | ( | ) | ( | ) | ||||||||
Total | $ | $ | ||||||||||
FUTURE MATURITIES OF RECOURSE DEBT — As of December 31, 2019 scheduled maturities are presented in the following table (in millions):
December 31, | Annual Maturities | ||
2020 | $ | ||
2021 | |||
2022 | |||
2023 | |||
2024 | |||
Thereafter | |||
Unamortized (discount)/premium & debt issuance (costs) | ( | ) | |
Total debt | $ | ||
3. Dividends from Subsidiaries and Affiliates
Cash dividends received from consolidated subsidiaries were $1.0 billion, $1.9 billion and $1.2 billion for the years ended December 31, 2019, 2018, and 2017, respectively. For the years ended December 31, 2019 and 2018, $200 million and $1.2 billion, respectively, of the dividends paid to the Parent Company are derived from the sale of business interests and are classified as an investing activity for cash flow purposes. All other dividends are classified as operating activities. There were no cash dividends received from affiliates accounted for by the equity method for the years ended December 31, 2019, 2018, and 2017.
S-7 | 2019 Annual Report | |
4. Guarantees and Letters of Credit
GUARANTEES — In connection with certain project financing, acquisitions and dispositions, power purchases and other agreements, the Parent Company has expressly undertaken limited obligations and commitments, most of which will only be effective or will be terminated upon the occurrence of future events. These obligations and commitments, excluding those collateralized by letter of credit and other obligations discussed below, were limited as of December 31, 2019 by the terms of the agreements, to an aggregate of approximately $865 million, representing 38 agreements with individual exposures ranging up to $157 million. These amounts exclude normal and customary representations and warranties in agreements for the sale of assets (including ownership in associated legal entities) where the associated risk is considered to be nominal.
LETTERS OF CREDIT — At December 31, 2019, the Parent Company had $19 million in letters of credit outstanding under the senior secured credit facility, representing 28 agreements with individual exposures up to $4 million, and $342 million in letters of credit outstanding under the senior unsecured credit facility, representing 11 agreements with individual exposures ranging from $1 million to $296 million. During the year ended December 31, 2019, the Parent Company paid letter of credit fees ranging from 1 % to 3 % per annum on the outstanding amounts.