0.04380.020.0447900000031200000029220000003350000000false--12-31Q3201900008747612300000021000000200000010000000.13650.13650.130.130.13650.13650.010.01120000000012000000008172036918177839166622980966638926560.01750.02250.04158140200000000200000044000000004570000003020000001500000029600000015700000001000000012000000600000040000000000200000030000000000007000000150000006000000900000002000000013000000300000030000004400000097000000154905595153891260
0000874761
2019-01-01
2019-09-30
0000874761
2019-10-31
0000874761
2019-09-30
0000874761
2018-12-31
0000874761
us-gaap:VariableInterestEntityPrimaryBeneficiaryMember
2019-09-30
0000874761
us-gaap:VariableInterestEntityPrimaryBeneficiaryMember
2018-12-31
0000874761
2018-01-01
2018-09-30
0000874761
2018-07-01
2018-09-30
0000874761
2019-07-01
2019-09-30
0000874761
us-gaap:ElectricityGenerationMember
2019-01-01
2019-09-30
0000874761
us-gaap:ElectricDistributionMember
2019-07-01
2019-09-30
0000874761
us-gaap:ElectricityGenerationMember
2018-01-01
2018-09-30
0000874761
us-gaap:ElectricDistributionMember
2018-01-01
2018-09-30
0000874761
us-gaap:ElectricityGenerationMember
2018-07-01
2018-09-30
0000874761
us-gaap:ElectricityGenerationMember
2019-07-01
2019-09-30
0000874761
us-gaap:ElectricDistributionMember
2019-01-01
2019-09-30
0000874761
us-gaap:ElectricDistributionMember
2018-07-01
2018-09-30
0000874761
us-gaap:RetainedEarningsMember
2019-01-01
2019-03-31
0000874761
us-gaap:RetainedEarningsMember
2019-07-01
2019-09-30
0000874761
us-gaap:TreasuryStockMember
2019-07-01
2019-09-30
0000874761
us-gaap:CommonStockMember
2019-01-01
2019-03-31
0000874761
us-gaap:CommonStockMember
2019-07-01
2019-09-30
0000874761
us-gaap:AccumulatedOtherComprehensiveIncomeMember
2019-01-01
2019-03-31
0000874761
us-gaap:CommonStockMember
2019-04-01
2019-06-30
0000874761
us-gaap:RetainedEarningsMember
2019-03-31
0000874761
us-gaap:AccumulatedOtherComprehensiveIncomeMember
2019-07-01
2019-09-30
0000874761
us-gaap:TreasuryStockMember
2019-06-30
0000874761
us-gaap:NoncontrollingInterestMember
2019-07-01
2019-09-30
0000874761
us-gaap:NoncontrollingInterestMember
2019-04-01
2019-06-30
0000874761
us-gaap:TreasuryStockMember
2019-04-01
2019-06-30
0000874761
us-gaap:AdditionalPaidInCapitalMember
2019-07-01
2019-09-30
0000874761
us-gaap:RetainedEarningsMember
2019-04-01
2019-06-30
0000874761
us-gaap:TreasuryStockMember
2018-12-31
0000874761
us-gaap:NoncontrollingInterestMember
2018-12-31
0000874761
us-gaap:NoncontrollingInterestMember
2019-01-01
2019-03-31
0000874761
us-gaap:RetainedEarningsMember
2019-09-30
0000874761
us-gaap:TreasuryStockMember
2019-01-01
2019-03-31
0000874761
us-gaap:AccumulatedOtherComprehensiveIncomeMember
2019-06-30
0000874761
us-gaap:TreasuryStockMember
2019-03-31
0000874761
us-gaap:AdditionalPaidInCapitalMember
2019-04-01
2019-06-30
0000874761
us-gaap:AdditionalPaidInCapitalMember
2019-03-31
0000874761
us-gaap:CommonStockMember
2019-06-30
0000874761
us-gaap:RetainedEarningsMember
2018-12-31
0000874761
us-gaap:AdditionalPaidInCapitalMember
2019-01-01
2019-03-31
0000874761
us-gaap:AccumulatedOtherComprehensiveIncomeMember
2019-04-01
2019-06-30
0000874761
us-gaap:NoncontrollingInterestMember
2019-09-30
0000874761
us-gaap:AccumulatedOtherComprehensiveIncomeMember
2019-03-31
0000874761
us-gaap:CommonStockMember
2019-03-31
0000874761
us-gaap:AccumulatedOtherComprehensiveIncomeMember
2019-09-30
0000874761
us-gaap:AccumulatedOtherComprehensiveIncomeMember
2018-12-31
0000874761
us-gaap:NoncontrollingInterestMember
2019-03-31
0000874761
us-gaap:TreasuryStockMember
2019-09-30
0000874761
us-gaap:CommonStockMember
2019-09-30
0000874761
us-gaap:RetainedEarningsMember
2019-06-30
0000874761
us-gaap:CommonStockMember
2018-12-31
0000874761
us-gaap:NoncontrollingInterestMember
2019-06-30
0000874761
us-gaap:AdditionalPaidInCapitalMember
2018-12-31
0000874761
us-gaap:AdditionalPaidInCapitalMember
2019-06-30
0000874761
us-gaap:AdditionalPaidInCapitalMember
2019-09-30
0000874761
us-gaap:NoncontrollingInterestMember
2018-01-01
2018-03-31
0000874761
us-gaap:CommonStockMember
2017-12-31
0000874761
us-gaap:CommonStockMember
2018-07-01
2018-09-30
0000874761
us-gaap:RetainedEarningsMember
2018-07-01
2018-09-30
0000874761
us-gaap:TreasuryStockMember
2018-01-01
2018-03-31
0000874761
us-gaap:RetainedEarningsMember
2018-01-01
2018-03-31
0000874761
us-gaap:NoncontrollingInterestMember
2018-07-01
2018-09-30
0000874761
us-gaap:CommonStockMember
2018-01-01
2018-03-31
0000874761
us-gaap:TreasuryStockMember
2018-03-31
0000874761
us-gaap:AccumulatedOtherComprehensiveIncomeMember
2017-12-31
0000874761
us-gaap:TreasuryStockMember
2018-07-01
2018-09-30
0000874761
us-gaap:AccumulatedOtherComprehensiveIncomeMember
2018-07-01
2018-09-30
0000874761
us-gaap:RetainedEarningsMember
2018-04-01
2018-06-30
0000874761
us-gaap:AccumulatedOtherComprehensiveIncomeMember
2018-04-01
2018-06-30
0000874761
us-gaap:AdditionalPaidInCapitalMember
2018-01-01
2018-03-31
0000874761
us-gaap:CommonStockMember
2018-06-30
0000874761
us-gaap:CommonStockMember
2018-04-01
2018-06-30
0000874761
us-gaap:NoncontrollingInterestMember
2018-09-30
0000874761
us-gaap:TreasuryStockMember
2018-04-01
2018-06-30
0000874761
us-gaap:AdditionalPaidInCapitalMember
2018-04-01
2018-06-30
0000874761
us-gaap:AccumulatedOtherComprehensiveIncomeMember
2018-01-01
2018-03-31
0000874761
us-gaap:RetainedEarningsMember
2018-03-31
0000874761
us-gaap:CommonStockMember
2018-03-31
0000874761
us-gaap:AdditionalPaidInCapitalMember
2018-07-01
2018-09-30
0000874761
us-gaap:NoncontrollingInterestMember
2018-04-01
2018-06-30
0000874761
us-gaap:AdditionalPaidInCapitalMember
2018-06-30
0000874761
us-gaap:AdditionalPaidInCapitalMember
2018-03-31
0000874761
us-gaap:TreasuryStockMember
2017-12-31
0000874761
us-gaap:RetainedEarningsMember
2018-09-30
0000874761
us-gaap:RetainedEarningsMember
2017-12-31
0000874761
us-gaap:TreasuryStockMember
2018-09-30
0000874761
us-gaap:AdditionalPaidInCapitalMember
2018-09-30
0000874761
us-gaap:RetainedEarningsMember
2018-06-30
0000874761
us-gaap:NoncontrollingInterestMember
2018-06-30
0000874761
us-gaap:TreasuryStockMember
2018-06-30
0000874761
us-gaap:CommonStockMember
2018-09-30
0000874761
us-gaap:AccumulatedOtherComprehensiveIncomeMember
2018-06-30
0000874761
us-gaap:NoncontrollingInterestMember
2018-03-31
0000874761
us-gaap:AccumulatedOtherComprehensiveIncomeMember
2018-03-31
0000874761
us-gaap:NoncontrollingInterestMember
2017-12-31
0000874761
us-gaap:AdditionalPaidInCapitalMember
2017-12-31
0000874761
us-gaap:AccumulatedOtherComprehensiveIncomeMember
2018-09-30
0000874761
2018-01-01
2018-03-31
0000874761
2019-01-01
2019-03-31
0000874761
aes:FluenceMember
aes:NoncashMember
2019-01-01
2019-09-30
0000874761
aes:SPowerMember
2019-01-01
2019-09-30
0000874761
2018-09-30
0000874761
aes:SPowerMember
2018-01-01
2018-09-30
0000874761
2017-12-31
0000874761
aes:FluenceMember
aes:NoncashMember
2018-01-01
2018-09-30
0000874761
us-gaap:AccountingStandardsUpdate201602Member
2018-12-31
0000874761
2019-01-01
0000874761
country:AR
us-gaap:AccountingStandardsUpdate201613Member
2019-09-30
0000874761
us-gaap:AccountingStandardsUpdate201613Member
us-gaap:DebtSecuritiesMember
2019-09-30
0000874761
us-gaap:AccountingStandardsUpdate201613Member
2019-09-30
0000874761
us-gaap:AccountingStandardsUpdate201409Member
us-gaap:RetainedEarningsMember
2019-01-01
0000874761
us-gaap:AccountingStandardsUpdate201712Member
us-gaap:RetainedEarningsMember
2019-01-01
0000874761
2019-03-31
0000874761
currency:ARS
us-gaap:ForeignExchangeContractMember
2019-09-30
0000874761
us-gaap:CrossCurrencyInterestRateContractMember
2019-09-30
0000874761
us-gaap:InterestRateContractMember
2019-09-30
0000874761
us-gaap:CommodityContractMember
2019-09-30
0000874761
aes:KilrootandBallylumfordMember
aes:LongLivedAssetsHeldForSaleMember
us-gaap:FairValueInputsLevel1Member
us-gaap:EstimateOfFairValueFairValueDisclosureMember
2019-09-30
0000874761
aes:KilrootandBallylumfordMember
aes:LongLivedAssetsHeldForSaleMember
us-gaap:FairValueInputsLevel2Member
us-gaap:EstimateOfFairValueFairValueDisclosureMember
2019-09-30
0000874761
aes:KilrootandBallylumfordMember
aes:LongLivedAssetsHeldForSaleMember
us-gaap:CarryingReportedAmountFairValueDisclosureMember
2019-09-30
0000874761
aes:KilrootandBallylumfordMember
aes:LongLivedAssetsHeldForSaleMember
2019-01-01
2019-09-30
0000874761
aes:KilrootandBallylumfordMember
aes:LongLivedAssetsHeldForSaleMember
us-gaap:FairValueInputsLevel3Member
us-gaap:EstimateOfFairValueFairValueDisclosureMember
2019-09-30
0000874761
us-gaap:CrossCurrencyInterestRateContractMember
2018-01-01
2018-09-30
0000874761
aes:OthercomprehensiveincomeDerivativeactivityMember
2018-01-01
2018-09-30
0000874761
us-gaap:CrossCurrencyInterestRateContractMember
aes:OthercomprehensiveincomeDerivativeactivityMember
2018-01-01
2018-09-30
0000874761
us-gaap:CommodityContractMember
2018-01-01
2018-09-30
0000874761
us-gaap:InterestRateContractMember
2018-01-01
2018-09-30
0000874761
us-gaap:ForeignExchangeContractMember
2018-01-01
2018-09-30
0000874761
us-gaap:CommodityContractMember
2018-09-30
0000874761
us-gaap:CommodityContractMember
aes:OthercomprehensiveincomeDerivativeactivityMember
2018-01-01
2018-09-30
0000874761
us-gaap:InterestRateContractMember
2018-09-30
0000874761
us-gaap:CrossCurrencyInterestRateContractMember
2018-09-30
0000874761
us-gaap:CommodityContractMember
2017-12-31
0000874761
us-gaap:InterestRateContractMember
2017-12-31
0000874761
us-gaap:CrossCurrencyInterestRateContractMember
2017-12-31
0000874761
us-gaap:ForeignExchangeContractMember
2018-09-30
0000874761
us-gaap:InterestRateContractMember
aes:OthercomprehensiveincomeDerivativeactivityMember
2018-01-01
2018-09-30
0000874761
us-gaap:ForeignExchangeContractMember
aes:OthercomprehensiveincomeDerivativeactivityMember
2018-01-01
2018-09-30
0000874761
us-gaap:ForeignExchangeContractMember
2017-12-31
0000874761
us-gaap:ForeignExchangeContractMember
2019-01-01
2019-09-30
0000874761
us-gaap:CommodityContractMember
aes:OthercomprehensiveincomeDerivativeactivityMember
2019-01-01
2019-09-30
0000874761
us-gaap:InterestRateContractMember
2019-01-01
2019-09-30
0000874761
us-gaap:CommodityContractMember
2019-01-01
2019-09-30
0000874761
us-gaap:CrossCurrencyInterestRateContractMember
2019-01-01
2019-09-30
0000874761
us-gaap:CommodityContractMember
2018-12-31
0000874761
us-gaap:ForeignExchangeContractMember
2019-09-30
0000874761
us-gaap:ForeignExchangeContractMember
aes:OthercomprehensiveincomeDerivativeactivityMember
2019-01-01
2019-09-30
0000874761
us-gaap:ForeignExchangeContractMember
2018-12-31
0000874761
us-gaap:InterestRateContractMember
2018-12-31
0000874761
us-gaap:CrossCurrencyInterestRateContractMember
2018-12-31
0000874761
aes:OthercomprehensiveincomeDerivativeactivityMember
2019-01-01
2019-09-30
0000874761
us-gaap:InterestRateContractMember
aes:OthercomprehensiveincomeDerivativeactivityMember
2019-01-01
2019-09-30
0000874761
aes:ShadyPointMember
aes:LongLivedAssetsHeldAndUsedMember
us-gaap:CarryingReportedAmountFairValueDisclosureMember
2018-09-30
0000874761
aes:ShadyPointMember
aes:LongLivedAssetsHeldAndUsedMember
us-gaap:FairValueInputsLevel1Member
us-gaap:EstimateOfFairValueFairValueDisclosureMember
2018-09-30
0000874761
aes:ElstaMember
us-gaap:EquityMethodInvestmentsMember
us-gaap:CarryingReportedAmountFairValueDisclosureMember
2018-09-30
0000874761
aes:ElstaMember
us-gaap:EquityMethodInvestmentsMember
us-gaap:FairValueInputsLevel2Member
us-gaap:EstimateOfFairValueFairValueDisclosureMember
2018-09-30
0000874761
aes:ElstaMember
us-gaap:EquityMethodInvestmentsMember
us-gaap:FairValueInputsLevel1Member
us-gaap:EstimateOfFairValueFairValueDisclosureMember
2018-09-30
0000874761
aes:ElstaMember
us-gaap:EquityMethodInvestmentsMember
us-gaap:FairValueInputsLevel3Member
us-gaap:EstimateOfFairValueFairValueDisclosureMember
2018-09-30
0000874761
aes:ShadyPointMember
aes:LongLivedAssetsHeldAndUsedMember
us-gaap:FairValueInputsLevel2Member
us-gaap:EstimateOfFairValueFairValueDisclosureMember
2018-09-30
0000874761
aes:ShadyPointMember
aes:LongLivedAssetsHeldAndUsedMember
2018-01-01
2018-09-30
0000874761
aes:ElstaMember
us-gaap:EquityMethodInvestmentsMember
2018-01-01
2018-09-30
0000874761
aes:ShadyPointMember
aes:LongLivedAssetsHeldAndUsedMember
us-gaap:FairValueInputsLevel3Member
us-gaap:EstimateOfFairValueFairValueDisclosureMember
2018-09-30
0000874761
us-gaap:CommodityContractMember
2018-07-01
2018-09-30
0000874761
2018-06-30
0000874761
us-gaap:ForeignExchangeContractMember
2018-07-01
2018-09-30
0000874761
us-gaap:CrossCurrencyInterestRateContractMember
2018-06-30
0000874761
us-gaap:InterestRateContractMember
aes:OthercomprehensiveincomeDerivativeactivityMember
2018-07-01
2018-09-30
0000874761
us-gaap:InterestRateContractMember
2018-06-30
0000874761
us-gaap:ForeignExchangeContractMember
aes:OthercomprehensiveincomeDerivativeactivityMember
2018-07-01
2018-09-30
0000874761
us-gaap:CommodityContractMember
2018-06-30
0000874761
us-gaap:CrossCurrencyInterestRateContractMember
2018-07-01
2018-09-30
0000874761
us-gaap:InterestRateContractMember
2018-07-01
2018-09-30
0000874761
us-gaap:CommodityContractMember
aes:OthercomprehensiveincomeDerivativeactivityMember
2018-07-01
2018-09-30
0000874761
aes:OthercomprehensiveincomeDerivativeactivityMember
2018-07-01
2018-09-30
0000874761
us-gaap:ForeignExchangeContractMember
2018-06-30
0000874761
us-gaap:CrossCurrencyInterestRateContractMember
aes:OthercomprehensiveincomeDerivativeactivityMember
2018-07-01
2018-09-30
0000874761
us-gaap:EstimateOfFairValueFairValueDisclosureMember
2018-12-31
0000874761
us-gaap:EstimateOfFairValueFairValueDisclosureMember
2019-09-30
0000874761
us-gaap:CrossCurrencyInterestRateContractMember
2019-07-01
2019-09-30
0000874761
us-gaap:InterestRateContractMember
2019-07-01
2019-09-30
0000874761
us-gaap:CommodityContractMember
2019-06-30
0000874761
us-gaap:ForeignExchangeContractMember
2019-07-01
2019-09-30
0000874761
us-gaap:CommodityContractMember
2019-07-01
2019-09-30
0000874761
us-gaap:InterestRateContractMember
2019-06-30
0000874761
us-gaap:ForeignExchangeContractMember
aes:OthercomprehensiveincomeDerivativeactivityMember
2019-07-01
2019-09-30
0000874761
us-gaap:CrossCurrencyInterestRateContractMember
aes:OthercomprehensiveincomeDerivativeactivityMember
2019-07-01
2019-09-30
0000874761
us-gaap:ForeignExchangeContractMember
2019-06-30
0000874761
2019-06-30
0000874761
aes:OthercomprehensiveincomeDerivativeactivityMember
2019-07-01
2019-09-30
0000874761
us-gaap:InterestRateContractMember
aes:OthercomprehensiveincomeDerivativeactivityMember
2019-07-01
2019-09-30
0000874761
us-gaap:CrossCurrencyInterestRateContractMember
2019-06-30
0000874761
us-gaap:CommodityContractMember
aes:OthercomprehensiveincomeDerivativeactivityMember
2019-07-01
2019-09-30
0000874761
us-gaap:DerivativeMember
2018-12-31
0000874761
us-gaap:CrossCurrencyInterestRateContractMember
us-gaap:FairValueInputsLevel3Member
us-gaap:DerivativeMember
2019-09-30
0000874761
us-gaap:ForeignExchangeContractMember
us-gaap:DerivativeMember
2019-09-30
0000874761
us-gaap:FairValueInputsLevel2Member
2018-12-31
0000874761
us-gaap:FairValueInputsLevel1Member
us-gaap:DebtSecuritiesMember
2018-12-31
0000874761
us-gaap:CommodityContractMember
us-gaap:FairValueInputsLevel3Member
us-gaap:DerivativeMember
2018-12-31
0000874761
us-gaap:OtherDebtSecuritiesMember
us-gaap:AvailableforsaleSecuritiesMember
2018-12-31
0000874761
us-gaap:CrossCurrencyInterestRateContractMember
us-gaap:FairValueInputsLevel1Member
us-gaap:DerivativeMember
2018-12-31
0000874761
us-gaap:FairValueInputsLevel1Member
2018-12-31
0000874761
us-gaap:CorporateDebtSecuritiesMember
us-gaap:FairValueInputsLevel1Member
us-gaap:AvailableforsaleSecuritiesMember
2019-09-30
0000874761
us-gaap:EquityFundsMember
us-gaap:FairValueInputsLevel1Member
us-gaap:AvailableforsaleSecuritiesMember
2018-12-31
0000874761
us-gaap:CommodityContractMember
us-gaap:DerivativeMember
2019-09-30
0000874761
us-gaap:FairValueInputsLevel2Member
2019-09-30
0000874761
us-gaap:FairValueInputsLevel1Member
us-gaap:EquitySecuritiesMember
2019-09-30
0000874761
us-gaap:CommodityContractMember
us-gaap:FairValueInputsLevel2Member
us-gaap:DerivativeMember
2018-12-31
0000874761
us-gaap:InterestRateContractMember
us-gaap:DerivativeMember
2019-09-30
0000874761
us-gaap:FairValueInputsLevel3Member
us-gaap:EquitySecuritiesMember
2019-09-30
0000874761
us-gaap:MutualFundMember
us-gaap:AvailableforsaleSecuritiesMember
2019-09-30
0000874761
us-gaap:FairValueInputsLevel3Member
2018-12-31
0000874761
us-gaap:MutualFundMember
us-gaap:FairValueInputsLevel2Member
us-gaap:AvailableforsaleSecuritiesMember
2019-09-30
0000874761
us-gaap:DebtSecuritiesMember
2019-09-30
0000874761
us-gaap:EquitySecuritiesMember
2019-09-30
0000874761
us-gaap:InterestRateContractMember
us-gaap:FairValueInputsLevel1Member
us-gaap:DerivativeMember
2018-12-31
0000874761
us-gaap:FairValueInputsLevel3Member
us-gaap:DebtSecuritiesMember
2018-12-31
0000874761
us-gaap:ForeignExchangeContractMember
us-gaap:FairValueInputsLevel1Member
us-gaap:DerivativeMember
2019-09-30
0000874761
us-gaap:FairValueInputsLevel1Member
us-gaap:DerivativeMember
2019-09-30
0000874761
us-gaap:ForeignExchangeContractMember
us-gaap:DerivativeMember
2018-12-31
0000874761
us-gaap:DebtSecuritiesMember
2018-12-31
0000874761
us-gaap:FairValueInputsLevel2Member
us-gaap:DerivativeMember
2018-12-31
0000874761
us-gaap:ForeignExchangeContractMember
us-gaap:FairValueInputsLevel3Member
us-gaap:DerivativeMember
2019-09-30
0000874761
us-gaap:FairValueInputsLevel1Member
2019-09-30
0000874761
us-gaap:CrossCurrencyInterestRateContractMember
us-gaap:FairValueInputsLevel1Member
us-gaap:DerivativeMember
2018-12-31
0000874761
us-gaap:ForeignExchangeContractMember
us-gaap:FairValueInputsLevel1Member
us-gaap:DerivativeMember
2018-12-31
0000874761
us-gaap:ForeignExchangeContractMember
us-gaap:FairValueInputsLevel3Member
us-gaap:DerivativeMember
2019-09-30
0000874761
us-gaap:DerivativeMember
2019-09-30
0000874761
us-gaap:FairValueInputsLevel3Member
us-gaap:EquitySecuritiesMember
2018-12-31
0000874761
us-gaap:FairValueInputsLevel2Member
us-gaap:EquitySecuritiesMember
2018-12-31
0000874761
us-gaap:OtherDebtSecuritiesMember
us-gaap:FairValueInputsLevel3Member
us-gaap:AvailableforsaleSecuritiesMember
2018-12-31
0000874761
us-gaap:MutualFundMember
us-gaap:FairValueInputsLevel3Member
us-gaap:AvailableforsaleSecuritiesMember
2019-09-30
0000874761
us-gaap:InterestRateContractMember
us-gaap:DerivativeMember
2018-12-31
0000874761
us-gaap:CrossCurrencyInterestRateContractMember
us-gaap:DerivativeMember
2019-09-30
0000874761
us-gaap:CrossCurrencyInterestRateContractMember
us-gaap:FairValueInputsLevel1Member
us-gaap:DerivativeMember
2019-09-30
0000874761
us-gaap:FairValueInputsLevel2Member
us-gaap:DebtSecuritiesMember
2018-12-31
0000874761
us-gaap:InterestRateContractMember
us-gaap:FairValueInputsLevel2Member
us-gaap:DerivativeMember
2018-12-31
0000874761
us-gaap:CommodityContractMember
us-gaap:FairValueInputsLevel2Member
us-gaap:DerivativeMember
2018-12-31
0000874761
us-gaap:OtherDebtSecuritiesMember
us-gaap:FairValueInputsLevel2Member
us-gaap:AvailableforsaleSecuritiesMember
2018-12-31
0000874761
us-gaap:FairValueInputsLevel2Member
us-gaap:DerivativeMember
2019-09-30
0000874761
us-gaap:CrossCurrencyInterestRateContractMember
us-gaap:FairValueInputsLevel3Member
us-gaap:DerivativeMember
2018-12-31
0000874761
us-gaap:InterestRateContractMember
us-gaap:FairValueInputsLevel3Member
us-gaap:DerivativeMember
2018-12-31
0000874761
us-gaap:CommodityContractMember
us-gaap:DerivativeMember
2019-09-30
0000874761
us-gaap:OtherDebtSecuritiesMember
us-gaap:FairValueInputsLevel1Member
us-gaap:AvailableforsaleSecuritiesMember
2019-09-30
0000874761
us-gaap:CommodityContractMember
us-gaap:FairValueInputsLevel1Member
us-gaap:DerivativeMember
2019-09-30
0000874761
us-gaap:CommodityContractMember
us-gaap:FairValueInputsLevel2Member
us-gaap:DerivativeMember
2019-09-30
0000874761
us-gaap:ForeignExchangeContractMember
us-gaap:FairValueInputsLevel2Member
us-gaap:DerivativeMember
2019-09-30
0000874761
us-gaap:FairValueInputsLevel1Member
us-gaap:DerivativeMember
2018-12-31
0000874761
us-gaap:CommodityContractMember
us-gaap:FairValueInputsLevel3Member
us-gaap:DerivativeMember
2019-09-30
0000874761
us-gaap:CorporateDebtSecuritiesMember
us-gaap:FairValueInputsLevel3Member
us-gaap:AvailableforsaleSecuritiesMember
2019-09-30
0000874761
us-gaap:ForeignExchangeContractMember
us-gaap:FairValueInputsLevel1Member
us-gaap:DerivativeMember
2018-12-31
0000874761
us-gaap:CrossCurrencyInterestRateContractMember
us-gaap:FairValueInputsLevel2Member
us-gaap:DerivativeMember
2019-09-30
0000874761
us-gaap:CorporateDebtSecuritiesMember
us-gaap:AvailableforsaleSecuritiesMember
2018-12-31
0000874761
us-gaap:CrossCurrencyInterestRateContractMember
us-gaap:FairValueInputsLevel2Member
us-gaap:DerivativeMember
2019-09-30
0000874761
us-gaap:CommodityContractMember
us-gaap:DerivativeMember
2018-12-31
0000874761
us-gaap:FairValueInputsLevel1Member
us-gaap:EquitySecuritiesMember
2018-12-31
0000874761
us-gaap:ForeignExchangeContractMember
us-gaap:FairValueInputsLevel2Member
us-gaap:DerivativeMember
2018-12-31
0000874761
us-gaap:FairValueInputsLevel3Member
2019-09-30
0000874761
us-gaap:ForeignExchangeContractMember
us-gaap:FairValueInputsLevel1Member
us-gaap:DerivativeMember
2019-09-30
0000874761
us-gaap:OtherDebtSecuritiesMember
us-gaap:FairValueInputsLevel1Member
us-gaap:AvailableforsaleSecuritiesMember
2018-12-31
0000874761
us-gaap:CrossCurrencyInterestRateContractMember
us-gaap:DerivativeMember
2018-12-31
0000874761
us-gaap:OtherDebtSecuritiesMember
us-gaap:AvailableforsaleSecuritiesMember
2019-09-30
0000874761
us-gaap:EquityFundsMember
us-gaap:FairValueInputsLevel2Member
us-gaap:AvailableforsaleSecuritiesMember
2018-12-31
0000874761
us-gaap:FairValueInputsLevel3Member
us-gaap:DerivativeMember
2018-12-31
0000874761
us-gaap:InterestRateContractMember
us-gaap:FairValueInputsLevel2Member
us-gaap:DerivativeMember
2018-12-31
0000874761
us-gaap:ForeignExchangeContractMember
us-gaap:FairValueInputsLevel2Member
us-gaap:DerivativeMember
2019-09-30
0000874761
us-gaap:InterestRateContractMember
us-gaap:FairValueInputsLevel3Member
us-gaap:DerivativeMember
2019-09-30
0000874761
us-gaap:CommodityContractMember
us-gaap:FairValueInputsLevel3Member
us-gaap:DerivativeMember
2019-09-30
0000874761
us-gaap:OtherDebtSecuritiesMember
us-gaap:FairValueInputsLevel2Member
us-gaap:AvailableforsaleSecuritiesMember
2019-09-30
0000874761
us-gaap:InterestRateContractMember
us-gaap:DerivativeMember
2019-09-30
0000874761
us-gaap:ForeignExchangeContractMember
us-gaap:FairValueInputsLevel3Member
us-gaap:DerivativeMember
2018-12-31
0000874761
us-gaap:CommodityContractMember
us-gaap:DerivativeMember
2018-12-31
0000874761
us-gaap:InterestRateContractMember
us-gaap:FairValueInputsLevel1Member
us-gaap:DerivativeMember
2019-09-30
0000874761
us-gaap:InterestRateContractMember
us-gaap:FairValueInputsLevel2Member
us-gaap:DerivativeMember
2019-09-30
0000874761
us-gaap:InterestRateContractMember
us-gaap:FairValueInputsLevel2Member
us-gaap:DerivativeMember
2019-09-30
0000874761
us-gaap:CommodityContractMember
us-gaap:FairValueInputsLevel1Member
us-gaap:DerivativeMember
2019-09-30
0000874761
us-gaap:CrossCurrencyInterestRateContractMember
us-gaap:DerivativeMember
2019-09-30
0000874761
us-gaap:InterestRateContractMember
us-gaap:FairValueInputsLevel1Member
us-gaap:DerivativeMember
2018-12-31
0000874761
us-gaap:CommodityContractMember
us-gaap:FairValueInputsLevel1Member
us-gaap:DerivativeMember
2018-12-31
0000874761
us-gaap:ForeignExchangeContractMember
us-gaap:FairValueInputsLevel3Member
us-gaap:DerivativeMember
2018-12-31
0000874761
us-gaap:FairValueInputsLevel3Member
us-gaap:DebtSecuritiesMember
2019-09-30
0000874761
us-gaap:CorporateDebtSecuritiesMember
us-gaap:FairValueInputsLevel2Member
us-gaap:AvailableforsaleSecuritiesMember
2019-09-30
0000874761
us-gaap:CrossCurrencyInterestRateContractMember
us-gaap:FairValueInputsLevel3Member
us-gaap:DerivativeMember
2019-09-30
0000874761
us-gaap:CrossCurrencyInterestRateContractMember
us-gaap:FairValueInputsLevel2Member
us-gaap:DerivativeMember
2018-12-31
0000874761
us-gaap:InterestRateContractMember
us-gaap:DerivativeMember
2018-12-31
0000874761
us-gaap:OtherDebtSecuritiesMember
us-gaap:FairValueInputsLevel3Member
us-gaap:AvailableforsaleSecuritiesMember
2019-09-30
0000874761
us-gaap:InterestRateContractMember
us-gaap:FairValueInputsLevel3Member
us-gaap:DerivativeMember
2018-12-31
0000874761
us-gaap:MutualFundMember
us-gaap:FairValueInputsLevel1Member
us-gaap:AvailableforsaleSecuritiesMember
2019-09-30
0000874761
us-gaap:FairValueInputsLevel3Member
us-gaap:DerivativeMember
2019-09-30
0000874761
us-gaap:ForeignExchangeContractMember
us-gaap:DerivativeMember
2019-09-30
0000874761
us-gaap:CrossCurrencyInterestRateContractMember
us-gaap:FairValueInputsLevel3Member
us-gaap:DerivativeMember
2018-12-31
0000874761
us-gaap:EquityFundsMember
us-gaap:AvailableforsaleSecuritiesMember
2018-12-31
0000874761
us-gaap:CommodityContractMember
us-gaap:FairValueInputsLevel1Member
us-gaap:DerivativeMember
2018-12-31
0000874761
us-gaap:CrossCurrencyInterestRateContractMember
us-gaap:DerivativeMember
2018-12-31
0000874761
us-gaap:ForeignExchangeContractMember
us-gaap:DerivativeMember
2018-12-31
0000874761
us-gaap:CorporateDebtSecuritiesMember
us-gaap:FairValueInputsLevel3Member
us-gaap:AvailableforsaleSecuritiesMember
2018-12-31
0000874761
us-gaap:InterestRateContractMember
us-gaap:FairValueInputsLevel3Member
us-gaap:DerivativeMember
2019-09-30
0000874761
us-gaap:CrossCurrencyInterestRateContractMember
us-gaap:FairValueInputsLevel1Member
us-gaap:DerivativeMember
2019-09-30
0000874761
us-gaap:CommodityContractMember
us-gaap:FairValueInputsLevel3Member
us-gaap:DerivativeMember
2018-12-31
0000874761
us-gaap:CrossCurrencyInterestRateContractMember
us-gaap:FairValueInputsLevel2Member
us-gaap:DerivativeMember
2018-12-31
0000874761
us-gaap:CorporateDebtSecuritiesMember
us-gaap:FairValueInputsLevel1Member
us-gaap:AvailableforsaleSecuritiesMember
2018-12-31
0000874761
us-gaap:ForeignExchangeContractMember
us-gaap:FairValueInputsLevel2Member
us-gaap:DerivativeMember
2018-12-31
0000874761
us-gaap:FairValueInputsLevel2Member
us-gaap:EquitySecuritiesMember
2019-09-30
0000874761
us-gaap:CommodityContractMember
us-gaap:FairValueInputsLevel2Member
us-gaap:DerivativeMember
2019-09-30
0000874761
us-gaap:FairValueInputsLevel1Member
us-gaap:DebtSecuritiesMember
2019-09-30
0000874761
us-gaap:EquityFundsMember
us-gaap:FairValueInputsLevel3Member
us-gaap:AvailableforsaleSecuritiesMember
2018-12-31
0000874761
us-gaap:InterestRateContractMember
us-gaap:FairValueInputsLevel1Member
us-gaap:DerivativeMember
2019-09-30
0000874761
us-gaap:CorporateDebtSecuritiesMember
us-gaap:AvailableforsaleSecuritiesMember
2019-09-30
0000874761
us-gaap:CorporateDebtSecuritiesMember
us-gaap:FairValueInputsLevel2Member
us-gaap:AvailableforsaleSecuritiesMember
2018-12-31
0000874761
us-gaap:EquitySecuritiesMember
2018-12-31
0000874761
us-gaap:FairValueInputsLevel1Member
us-gaap:EstimateOfFairValueFairValueDisclosureMember
2018-12-31
0000874761
us-gaap:FairValueInputsLevel3Member
us-gaap:EstimateOfFairValueFairValueDisclosureMember
2018-12-31
0000874761
us-gaap:FairValueInputsLevel2Member
us-gaap:EstimateOfFairValueFairValueDisclosureMember
2018-12-31
0000874761
us-gaap:CarryingReportedAmountFairValueDisclosureMember
2018-12-31
0000874761
us-gaap:CarryingReportedAmountFairValueDisclosureMember
2019-09-30
0000874761
us-gaap:FairValueInputsLevel1Member
us-gaap:EstimateOfFairValueFairValueDisclosureMember
2019-09-30
0000874761
us-gaap:FairValueInputsLevel2Member
us-gaap:EstimateOfFairValueFairValueDisclosureMember
2019-09-30
0000874761
us-gaap:FairValueInputsLevel3Member
us-gaap:EstimateOfFairValueFairValueDisclosureMember
2019-09-30
0000874761
currency:ARS
srt:MaximumMember
us-gaap:ForeignExchangeContractMember
2019-09-30
0000874761
srt:MinimumMember
us-gaap:InterestRateContractMember
us-gaap:MeasurementInputEntityCreditRiskMember
2019-01-01
2019-09-30
0000874761
srt:WeightedAverageMember
us-gaap:InterestRateContractMember
us-gaap:MeasurementInputEntityCreditRiskMember
2019-01-01
2019-09-30
0000874761
currency:ARS
srt:WeightedAverageMember
us-gaap:ForeignExchangeContractMember
2019-09-30
0000874761
currency:ARS
srt:MinimumMember
us-gaap:ForeignExchangeContractMember
2019-09-30
0000874761
srt:MaximumMember
us-gaap:InterestRateContractMember
us-gaap:MeasurementInputEntityCreditRiskMember
2019-01-01
2019-09-30
0000874761
us-gaap:PublicUtilitiesInventoryCoalMember
2019-09-30
0000874761
srt:EnergyDomain
2019-09-30
0000874761
srt:NaturalGasPerThousandCubicFeetMember
2019-09-30
0000874761
us-gaap:ForeignExchangeContractMember
us-gaap:NondesignatedMember
2019-01-01
2019-09-30
0000874761
us-gaap:ForeignExchangeContractMember
us-gaap:CashFlowHedgingMember
2018-07-01
2018-09-30
0000874761
us-gaap:CommodityContractMember
us-gaap:CashFlowHedgingMember
2018-01-01
2018-03-31
0000874761
us-gaap:InterestRateContractMember
us-gaap:CashFlowHedgingMember
2019-07-01
2019-09-30
0000874761
us-gaap:NondesignatedMember
2019-01-01
2019-09-30
0000874761
us-gaap:NondesignatedMember
2019-07-01
2019-09-30
0000874761
us-gaap:CashFlowHedgingMember
2018-07-01
2018-09-30
0000874761
us-gaap:OtherContractMember
us-gaap:NondesignatedMember
2019-01-01
2019-09-30
0000874761
us-gaap:CashFlowHedgingMember
2019-07-01
2019-09-30
0000874761
us-gaap:CashFlowHedgingMember
2018-01-01
2018-09-30
0000874761
us-gaap:InterestRateContractMember
us-gaap:NondesignatedMember
2019-07-01
2019-09-30
0000874761
us-gaap:ForeignExchangeContractMember
us-gaap:NondesignatedMember
2019-07-01
2019-09-30
0000874761
us-gaap:CrossCurrencyInterestRateContractMember
us-gaap:CashFlowHedgingMember
2018-01-01
2018-09-30
0000874761
us-gaap:CashFlowHedgingMember
2019-01-01
2019-09-30
0000874761
us-gaap:NondesignatedMember
2018-07-01
2018-09-30
0000874761
us-gaap:OtherContractMember
us-gaap:NondesignatedMember
2018-01-01
2018-09-30
0000874761
us-gaap:CommodityContractMember
us-gaap:CashFlowHedgingMember
2019-01-01
2019-09-30
0000874761
us-gaap:CrossCurrencyInterestRateContractMember
us-gaap:CashFlowHedgingMember
2019-01-01
2019-09-30
0000874761
us-gaap:CrossCurrencyInterestRateContractMember
us-gaap:CashFlowHedgingMember
2019-07-01
2019-09-30
0000874761
us-gaap:ForeignExchangeContractMember
us-gaap:CashFlowHedgingMember
2019-01-01
2019-09-30
0000874761
us-gaap:InterestRateContractMember
us-gaap:CashFlowHedgingMember
2019-01-01
2019-09-30
0000874761
us-gaap:ForeignExchangeContractMember
us-gaap:CashFlowHedgingMember
2019-07-01
2019-09-30
0000874761
us-gaap:InterestRateContractMember
us-gaap:CashFlowHedgingMember
2018-01-01
2018-03-31
0000874761
us-gaap:OtherContractMember
us-gaap:NondesignatedMember
2019-07-01
2019-09-30
0000874761
us-gaap:InterestRateContractMember
us-gaap:CashFlowHedgingMember
2018-01-01
2018-09-30
0000874761
us-gaap:NondesignatedMember
2018-01-01
2018-09-30
0000874761
us-gaap:ForeignExchangeContractMember
us-gaap:CashFlowHedgingMember
2018-01-01
2018-09-30
0000874761
us-gaap:InterestRateContractMember
us-gaap:CashFlowHedgingMember
2018-07-01
2018-09-30
0000874761
us-gaap:CrossCurrencyInterestRateContractMember
us-gaap:CashFlowHedgingMember
2018-07-01
2018-09-30
0000874761
us-gaap:ForeignExchangeContractMember
us-gaap:NondesignatedMember
2018-01-01
2018-09-30
0000874761
us-gaap:CommodityContractMember
us-gaap:CashFlowHedgingMember
2018-01-01
2018-09-30
0000874761
us-gaap:InterestRateContractMember
us-gaap:NondesignatedMember
2018-01-01
2018-09-30
0000874761
us-gaap:CommodityContractMember
us-gaap:CashFlowHedgingMember
2019-07-01
2019-09-30
0000874761
us-gaap:OtherContractMember
us-gaap:NondesignatedMember
2018-07-01
2018-09-30
0000874761
us-gaap:CommodityContractMember
us-gaap:CashFlowHedgingMember
2018-07-01
2018-09-30
0000874761
us-gaap:InterestRateContractMember
us-gaap:NondesignatedMember
2018-07-01
2018-09-30
0000874761
us-gaap:ForeignExchangeContractMember
us-gaap:NondesignatedMember
2018-07-01
2018-09-30
0000874761
us-gaap:InterestRateContractMember
us-gaap:NondesignatedMember
2019-01-01
2019-09-30
0000874761
us-gaap:OtherCurrentAssetsMember
2018-12-31
0000874761
us-gaap:OtherNoncurrentLiabilitiesMember
2018-12-31
0000874761
us-gaap:OtherCurrentLiabilitiesMember
2019-09-30
0000874761
us-gaap:OtherNoncurrentAssetsMember
2018-12-31
0000874761
us-gaap:OtherNoncurrentLiabilitiesMember
2019-09-30
0000874761
us-gaap:OtherNoncurrentAssetsMember
2019-09-30
0000874761
us-gaap:OtherCurrentLiabilitiesMember
2018-12-31
0000874761
us-gaap:OtherCurrentAssetsMember
2019-09-30
0000874761
us-gaap:CrossCurrencyInterestRateContractMember
us-gaap:NondesignatedMember
2019-09-30
0000874761
us-gaap:NondesignatedMember
2019-09-30
0000874761
us-gaap:NondesignatedMember
2018-12-31
0000874761
us-gaap:CrossCurrencyInterestRateContractMember
us-gaap:DesignatedAsHedgingInstrumentMember
2018-12-31
0000874761
us-gaap:CommodityContractMember
us-gaap:DesignatedAsHedgingInstrumentMember
2018-12-31
0000874761
us-gaap:ForeignExchangeContractMember
us-gaap:DesignatedAsHedgingInstrumentMember
2018-12-31
0000874761
us-gaap:ForeignExchangeContractMember
us-gaap:NondesignatedMember
2019-09-30
0000874761
us-gaap:InterestRateContractMember
us-gaap:NondesignatedMember
2018-12-31
0000874761
us-gaap:ForeignExchangeContractMember
us-gaap:DesignatedAsHedgingInstrumentMember
2019-09-30
0000874761
us-gaap:InterestRateContractMember
us-gaap:DesignatedAsHedgingInstrumentMember
2019-09-30
0000874761
us-gaap:CrossCurrencyInterestRateContractMember
us-gaap:DesignatedAsHedgingInstrumentMember
2019-09-30
0000874761
us-gaap:InterestRateContractMember
us-gaap:DesignatedAsHedgingInstrumentMember
2018-12-31
0000874761
us-gaap:DesignatedAsHedgingInstrumentMember
2018-12-31
0000874761
us-gaap:CommodityContractMember
us-gaap:NondesignatedMember
2019-09-30
0000874761
us-gaap:ForeignExchangeContractMember
us-gaap:NondesignatedMember
2018-12-31
0000874761
us-gaap:CrossCurrencyInterestRateContractMember
us-gaap:NondesignatedMember
2018-12-31
0000874761
us-gaap:CommodityContractMember
us-gaap:DesignatedAsHedgingInstrumentMember
2019-09-30
0000874761
us-gaap:CommodityContractMember
us-gaap:NondesignatedMember
2018-12-31
0000874761
us-gaap:DesignatedAsHedgingInstrumentMember
2019-09-30
0000874761
us-gaap:InterestRateContractMember
us-gaap:NondesignatedMember
2019-09-30
0000874761
us-gaap:InterestRateContractMember
us-gaap:CashFlowHedgingMember
2019-09-30
0000874761
currency:BRL
us-gaap:ForeignExchangeContractMember
2019-09-30
0000874761
aes:OtherunspecifiedcurrencyDomain
us-gaap:ForeignExchangeContractMember
2019-09-30
0000874761
currency:CLF
us-gaap:CrossCurrencyInterestRateContractMember
2019-09-30
0000874761
aes:LiborandEuriborMember
us-gaap:InterestRateContractMember
2019-09-30
0000874761
currency:CLP
us-gaap:ForeignExchangeContractMember
2019-09-30
0000874761
currency:COP
us-gaap:ForeignExchangeContractMember
2019-09-30
0000874761
country:BR
2018-12-31
0000874761
country:AR
2019-09-30
0000874761
country:AR
2018-12-31
0000874761
aes:OtherEntityMember
2019-09-30
0000874761
2019-09-01
2019-09-30
0000874761
aes:SPowerMember
2019-04-18
2019-04-18
0000874761
2019-07-01
0000874761
2019-07-01
2019-07-31
0000874761
aes:SPowerMember
2019-04-18
0000874761
aes:SimpleEnergyMember
2018-04-09
2018-04-09
0000874761
aes:SPowerMember
2019-03-31
0000874761
aes:GasNaturaldelEsteMember
2019-09-01
2019-09-30
0000874761
aes:MinorityOwnedAffiliatesMember
2018-01-01
2018-09-30
0000874761
aes:MinorityOwnedAffiliatesMember
2019-01-01
2019-09-30
0000874761
aes:A4.0SeniorNotesDue2021DomainDomain
us-gaap:UnsecuredDebtMember
2018-03-31
0000874761
aes:A7.375SeniorNotesDue2021MemberMember
us-gaap:UnsecuredDebtMember
2018-03-31
0000874761
aes:A7.25SeniorNotesdue2021Domain
us-gaap:UnsecuredDebtMember
2019-09-30
0000874761
aes:A4.41SPVLoanMember
us-gaap:SeniorNotesMember
2019-09-30
0000874761
aes:LIBOR2.25SeniorNotesDueIn2029Member
us-gaap:SeniorNotesMember
2019-09-30
0000874761
aes:A4.0SeniorNotesDue2021DomainDomain
us-gaap:SeniorNotesMember
2018-03-31
0000874761
aes:A7.25SeniorNotesdue2021Domain
2019-01-01
2019-09-30
0000874761
aes:A4.5SeniorNotesDue2023DomainDomain
us-gaap:SeniorNotesMember
2018-03-31
0000874761
aes:A8.0SeniorNotesDue2020Domain
2018-01-01
2018-03-31
0000874761
aes:A7.25SeniorNotesdue2021Domain
us-gaap:SeniorNotesMember
2019-09-30
0000874761
aes:A4.875SeniorNotesDue2023MemberMember
us-gaap:UnsecuredDebtMember
aes:RecourseDebtMember
2018-01-01
2018-03-31
0000874761
aes:A4.35SeniorNotesdue2029Domain
us-gaap:SeniorNotesMember
2019-09-30
0000874761
aes:A4.875SeniorNotesDue2023MemberMember
2019-01-01
2019-09-30
0000874761
aes:A7.375SeniorNotesDue2021MemberMember
2018-01-01
2018-03-31
0000874761
aes:A7.18SPVLoanMemberMember
us-gaap:SeniorNotesMember
2019-09-30
0000874761
aes:A4.0SeniorNotesDue2021DomainDomain
us-gaap:UnsecuredDebtMember
aes:RecourseDebtMember
2018-01-01
2018-03-31
0000874761
aes:A4.5SeniorNotesDue2023DomainDomain
us-gaap:UnsecuredDebtMember
2018-03-31
0000874761
aes:A7.25SeniorNotesdue2021Domain
us-gaap:UnsecuredDebtMember
aes:NonrecourseDebtMember
2019-01-01
2019-09-30
0000874761
aes:A5.5SeniorNotesDue2024MemberMember
us-gaap:SeniorNotesMember
2018-03-31
0000874761
aes:A5.5SeniorNotesDue2025MemberMember
us-gaap:SeniorNotesMember
2018-03-31
0000874761
aes:A5.5SeniorNotesDue2025MemberMember
2018-01-01
2018-03-31
0000874761
us-gaap:VariableRateDomain
us-gaap:SeniorNotesMember
2019-09-30
0000874761
aes:A8.0SeniorNotesDue2020Domain
us-gaap:UnsecuredDebtMember
2018-03-31
0000874761
aes:A3.95SeniorNotesdue2049Domain
us-gaap:SeniorNotesMember
2019-09-30
0000874761
aes:A5.5SeniorNotesDue2024MemberMember
us-gaap:UnsecuredDebtMember
aes:RecourseDebtMember
2018-01-01
2018-03-31
0000874761
aes:A4.875SeniorNotesDue2023MemberMember
us-gaap:SeniorNotesMember
2019-09-30
0000874761
aes:A5.5SeniorNotesDue2024MemberMember
2018-01-01
2018-03-31
0000874761
us-gaap:VariableRateDomain
2019-01-01
2019-09-30
0000874761
aes:LIBOR4.15SeniorNotesDueIn2029MemberMember
us-gaap:SeniorNotesMember
aes:NonrecourseDebtMember
2019-01-01
2019-09-30
0000874761
aes:LIBOR1.75TermLoanDueIn2022Member
2019-01-01
2019-09-30
0000874761
aes:JordanMember
aes:CovenantViolationMember
2019-09-30
0000874761
country:PR
aes:CovenantViolationMember
2019-09-30
0000874761
aes:AESlluminaMember
aes:CovenantViolationMember
2019-09-30
0000874761
aes:GenerSubsidiaryMember
aes:NonrecourseDebtMember
2019-09-30
0000874761
aes:DplSubsidiaryMember
aes:NonrecourseDebtMember
2019-01-01
2019-09-30
0000874761
aes:AngamosMember
aes:NonrecourseDebtMember
2019-09-30
0000874761
aes:AltoMaipoMember
aes:NonrecourseDebtMember
2019-01-01
2019-09-30
0000874761
aes:AngamosMember
aes:NonrecourseDebtMember
2019-01-01
2019-09-30
0000874761
aes:GenerSubsidiaryMember
aes:NonrecourseDebtMember
2019-01-01
2019-09-30
0000874761
aes:AESSouthlandDomain
aes:NonrecourseDebtMember
2019-01-01
2019-03-31
0000874761
aes:DplSubsidiaryMember
aes:NonrecourseDebtMember
2019-09-30
0000874761
aes:AESTieteDomain
aes:NonrecourseDebtMember
2019-03-31
0000874761
aes:AESSouthlandDomain
aes:NonrecourseDebtMember
2019-03-31
0000874761
aes:AESTieteDomain
aes:NonrecourseDebtMember
2019-01-01
2019-03-31
0000874761
aes:AltoMaipoMember
aes:NonrecourseDebtMember
2019-09-30
0000874761
aes:LIBOR4.15SeniorNotesDueIn2029MemberMember
us-gaap:LondonInterbankOfferedRateLIBORMember
2019-01-01
2019-09-30
0000874761
aes:LIBOR2.25SeniorNotesDueIn2029Member
us-gaap:LondonInterbankOfferedRateLIBORMember
2019-01-01
2019-09-30
0000874761
aes:LIBOR1.75TermLoanDueIn2022Member
us-gaap:LondonInterbankOfferedRateLIBORMember
2019-01-01
2019-09-30
0000874761
us-gaap:SecuredDebtMember
us-gaap:FinancialStandbyLetterOfCreditMember
2019-09-30
0000874761
us-gaap:IndemnificationGuaranteeMember
2019-09-30
0000874761
srt:MaximumMember
us-gaap:IndemnificationGuaranteeMember
2019-09-30
0000874761
us-gaap:UnsecuredDebtMember
us-gaap:FinancialStandbyLetterOfCreditMember
2019-09-30
0000874761
us-gaap:GuaranteeObligationsMember
2019-09-30
0000874761
aes:LitigationMember
2019-09-30
0000874761
srt:MaximumMember
us-gaap:EnvironmentalRemediationContingencyDomain
2019-09-30
0000874761
aes:LitigationMember
2018-12-31
0000874761
srt:MaximumMember
aes:LitigationMember
2019-09-30
0000874761
srt:MinimumMember
aes:LitigationMember
2019-09-30
0000874761
us-gaap:EnvironmentalRemediationContingencyDomain
2019-09-30
0000874761
srt:MaximumMember
us-gaap:StandbyLettersOfCreditMember
2019-01-01
2019-09-30
0000874761
srt:MinimumMember
us-gaap:StandbyLettersOfCreditMember
2019-01-01
2019-09-30
0000874761
us-gaap:EnvironmentalRemediationContingencyDomain
2018-12-31
0000874761
srt:MinimumMember
us-gaap:GuaranteeObligationsMember
2019-09-30
0000874761
srt:MaximumMember
us-gaap:UnsecuredDebtMember
us-gaap:FinancialStandbyLetterOfCreditMember
2019-09-30
0000874761
srt:MaximumMember
us-gaap:SecuredDebtMember
us-gaap:FinancialStandbyLetterOfCreditMember
2019-09-30
0000874761
srt:MaximumMember
us-gaap:GuaranteeObligationsMember
2019-09-30
0000874761
srt:MinimumMember
us-gaap:SecuredDebtMember
us-gaap:FinancialStandbyLetterOfCreditMember
2019-09-30
0000874761
srt:MinimumMember
us-gaap:IndemnificationGuaranteeMember
2019-09-30
0000874761
srt:MinimumMember
us-gaap:UnsecuredDebtMember
us-gaap:FinancialStandbyLetterOfCreditMember
2019-09-30
0000874761
us-gaap:PropertySubjectToOperatingLeaseMember
2019-09-30
0000874761
aes:ColonDomain
2019-09-30
0000874761
aes:IPALCOEnterprisesInc.Member
2019-09-30
0000874761
aes:IplSubsidiaryMember
2019-09-30
0000874761
aes:IPALCOEnterprisesInc.Member
2018-12-31
0000874761
aes:ColonDomain
2018-12-31
0000874761
aes:IplSubsidiaryMember
2018-12-31
0000874761
aes:ColonDomain
2019-01-01
2019-09-30
0000874761
aes:ColonDomain
2018-01-01
2018-09-30
0000874761
us-gaap:SubsequentEventMember
2019-10-04
2019-10-04
0000874761
us-gaap:ReclassificationOutOfAccumulatedOtherComprehensiveIncomeMember
us-gaap:AccumulatedNetGainLossFromCashFlowHedgesIncludingPortionAttributableToNoncontrollingInterestMember
2019-01-01
2019-09-30
0000874761
us-gaap:ReclassificationOutOfAccumulatedOtherComprehensiveIncomeMember
us-gaap:AccumulatedDefinedBenefitPlansAdjustmentIncludingPortionAttributableToNoncontrollingInterestMember
2018-07-01
2018-09-30
0000874761
us-gaap:ReclassificationOutOfAccumulatedOtherComprehensiveIncomeMember
us-gaap:AccumulatedNetGainLossFromCashFlowHedgesIncludingPortionAttributableToNoncontrollingInterestMember
2018-01-01
2018-09-30
0000874761
us-gaap:ReclassificationOutOfAccumulatedOtherComprehensiveIncomeMember
us-gaap:AccumulatedDefinedBenefitPlansAdjustmentIncludingPortionAttributableToNoncontrollingInterestMember
2019-01-01
2019-09-30
0000874761
us-gaap:ReclassificationOutOfAccumulatedOtherComprehensiveIncomeMember
us-gaap:AccumulatedDefinedBenefitPlansAdjustmentIncludingPortionAttributableToNoncontrollingInterestMember
2019-07-01
2019-09-30
0000874761
us-gaap:ReclassificationOutOfAccumulatedOtherComprehensiveIncomeMember
us-gaap:AccumulatedNetGainLossFromCashFlowHedgesIncludingPortionAttributableToNoncontrollingInterestMember
2018-07-01
2018-09-30
0000874761
us-gaap:ReclassificationOutOfAccumulatedOtherComprehensiveIncomeMember
us-gaap:AccumulatedTranslationAdjustmentMember
2018-01-01
2018-09-30
0000874761
us-gaap:ReclassificationOutOfAccumulatedOtherComprehensiveIncomeMember
us-gaap:AccumulatedNetGainLossFromDesignatedOrQualifyingCashFlowHedgesMember
2018-07-01
2018-09-30
0000874761
us-gaap:ReclassificationOutOfAccumulatedOtherComprehensiveIncomeMember
2018-07-01
2018-09-30
0000874761
us-gaap:ReclassificationOutOfAccumulatedOtherComprehensiveIncomeMember
us-gaap:AccumulatedNetGainLossFromCashFlowHedgesIncludingPortionAttributableToNoncontrollingInterestMember
2019-07-01
2019-09-30
0000874761
us-gaap:ReclassificationOutOfAccumulatedOtherComprehensiveIncomeMember
us-gaap:AccumulatedDefinedBenefitPlansAdjustmentIncludingPortionAttributableToNoncontrollingInterestMember
2018-01-01
2018-09-30
0000874761
us-gaap:ReclassificationOutOfAccumulatedOtherComprehensiveIncomeMember
us-gaap:AccumulatedDefinedBenefitPlansAdjustmentMember
2019-01-01
2019-09-30
0000874761
us-gaap:ReclassificationOutOfAccumulatedOtherComprehensiveIncomeMember
us-gaap:AccumulatedTranslationAdjustmentMember
2019-01-01
2019-09-30
0000874761
us-gaap:ReclassificationOutOfAccumulatedOtherComprehensiveIncomeMember
us-gaap:AccumulatedDefinedBenefitPlansAdjustmentMember
2019-07-01
2019-09-30
0000874761
us-gaap:ReclassificationOutOfAccumulatedOtherComprehensiveIncomeMember
2019-07-01
2019-09-30
0000874761
us-gaap:ReclassificationOutOfAccumulatedOtherComprehensiveIncomeMember
us-gaap:AccumulatedNetGainLossFromCashFlowHedgesAttributableToNoncontrollingInterestMember
2018-07-01
2018-09-30
0000874761
us-gaap:ReclassificationOutOfAccumulatedOtherComprehensiveIncomeMember
us-gaap:AccumulatedNetGainLossFromCashFlowHedgesAttributableToNoncontrollingInterestMember
2019-01-01
2019-09-30
0000874761
us-gaap:ReclassificationOutOfAccumulatedOtherComprehensiveIncomeMember
us-gaap:AccumulatedNetGainLossFromDesignatedOrQualifyingCashFlowHedgesMember
2018-01-01
2018-09-30
0000874761
us-gaap:ReclassificationOutOfAccumulatedOtherComprehensiveIncomeMember
us-gaap:AccumulatedNetGainLossFromCashFlowHedgesAttributableToNoncontrollingInterestMember
2019-07-01
2019-09-30
0000874761
us-gaap:ReclassificationOutOfAccumulatedOtherComprehensiveIncomeMember
2019-01-01
2019-09-30
0000874761
us-gaap:ReclassificationOutOfAccumulatedOtherComprehensiveIncomeMember
us-gaap:AccumulatedTranslationAdjustmentMember
2018-07-01
2018-09-30
0000874761
us-gaap:ReclassificationOutOfAccumulatedOtherComprehensiveIncomeMember
us-gaap:AccumulatedNetGainLossFromCashFlowHedgesAttributableToNoncontrollingInterestMember
2018-01-01
2018-09-30
0000874761
us-gaap:ReclassificationOutOfAccumulatedOtherComprehensiveIncomeMember
us-gaap:AccumulatedTranslationAdjustmentMember
2019-07-01
2019-09-30
0000874761
us-gaap:ReclassificationOutOfAccumulatedOtherComprehensiveIncomeMember
us-gaap:AccumulatedDefinedBenefitPlansAdjustmentMember
2018-07-01
2018-09-30
0000874761
us-gaap:ReclassificationOutOfAccumulatedOtherComprehensiveIncomeMember
us-gaap:AccumulatedNetGainLossFromDesignatedOrQualifyingCashFlowHedgesMember
2019-01-01
2019-09-30
0000874761
us-gaap:ReclassificationOutOfAccumulatedOtherComprehensiveIncomeMember
2018-01-01
2018-09-30
0000874761
us-gaap:ReclassificationOutOfAccumulatedOtherComprehensiveIncomeMember
us-gaap:AccumulatedDefinedBenefitPlansAdjustmentMember
2018-01-01
2018-09-30
0000874761
us-gaap:ReclassificationOutOfAccumulatedOtherComprehensiveIncomeMember
us-gaap:AccumulatedNetGainLossFromDesignatedOrQualifyingCashFlowHedgesMember
2019-07-01
2019-09-30
0000874761
us-gaap:AccountingStandardsUpdate201712Member
us-gaap:AccumulatedDefinedBenefitPlansAdjustmentMember
2019-01-01
2019-09-30
0000874761
us-gaap:AccountingStandardsUpdate201712Member
us-gaap:AccumulatedTranslationAdjustmentMember
2019-01-01
2019-09-30
0000874761
us-gaap:AccumulatedDefinedBenefitPlansAdjustmentMember
2019-01-01
2019-09-30
0000874761
us-gaap:AccumulatedTranslationAdjustmentMember
2019-01-01
2019-09-30
0000874761
us-gaap:AccumulatedNetGainLossFromDesignatedOrQualifyingCashFlowHedgesMember
2019-01-01
2019-09-30
0000874761
us-gaap:AccountingStandardsUpdate201712Member
2019-01-01
2019-09-30
0000874761
us-gaap:AccountingStandardsUpdate201712Member
us-gaap:AccumulatedNetGainLossFromDesignatedOrQualifyingCashFlowHedgesMember
2019-01-01
2019-09-30
0000874761
2019-04-01
2019-06-30
0000874761
us-gaap:IntersegmentEliminationMember
2019-01-01
2019-09-30
0000874761
us-gaap:OperatingSegmentsMember
aes:CorporateOtherAndOtherEliminationsMember
2019-01-01
2019-09-30
0000874761
us-gaap:OperatingSegmentsMember
aes:CorporateOtherAndOtherEliminationsMember
2018-01-01
2018-09-30
0000874761
us-gaap:OperatingSegmentsMember
aes:MCACMember
2018-07-01
2018-09-30
0000874761
us-gaap:IntersegmentEliminationMember
2019-07-01
2019-09-30
0000874761
us-gaap:OperatingSegmentsMember
aes:CorporateOtherAndOtherEliminationsMember
2018-07-01
2018-09-30
0000874761
us-gaap:OperatingSegmentsMember
aes:MCACMember
2019-07-01
2019-09-30
0000874761
us-gaap:OperatingSegmentsMember
aes:USandUtilitiesMember
2018-01-01
2018-09-30
0000874761
us-gaap:OperatingSegmentsMember
aes:MCACMember
2018-01-01
2018-09-30
0000874761
us-gaap:OperatingSegmentsMember
aes:USandUtilitiesMember
2019-01-01
2019-09-30
0000874761
us-gaap:OperatingSegmentsMember
srt:SouthAmericaMember
2018-07-01
2018-09-30
0000874761
us-gaap:IntersegmentEliminationMember
2018-07-01
2018-09-30
0000874761
us-gaap:OperatingSegmentsMember
srt:SouthAmericaMember
2019-07-01
2019-09-30
0000874761
us-gaap:OperatingSegmentsMember
aes:MCACMember
2019-01-01
2019-09-30
0000874761
us-gaap:OperatingSegmentsMember
aes:CorporateOtherAndOtherEliminationsMember
2019-07-01
2019-09-30
0000874761
us-gaap:OperatingSegmentsMember
aes:USandUtilitiesMember
2019-07-01
2019-09-30
0000874761
us-gaap:OperatingSegmentsMember
aes:EURASIAMember
2018-01-01
2018-09-30
0000874761
us-gaap:OperatingSegmentsMember
srt:SouthAmericaMember
2019-01-01
2019-09-30
0000874761
us-gaap:OperatingSegmentsMember
aes:EURASIAMember
2019-07-01
2019-09-30
0000874761
us-gaap:OperatingSegmentsMember
srt:SouthAmericaMember
2018-01-01
2018-09-30
0000874761
us-gaap:OperatingSegmentsMember
aes:EURASIAMember
2019-01-01
2019-09-30
0000874761
us-gaap:IntersegmentEliminationMember
2018-01-01
2018-09-30
0000874761
us-gaap:OperatingSegmentsMember
aes:EURASIAMember
2018-07-01
2018-09-30
0000874761
us-gaap:OperatingSegmentsMember
aes:USandUtilitiesMember
2018-07-01
2018-09-30
0000874761
us-gaap:OperatingSegmentsMember
aes:MCACMember
2018-12-31
0000874761
us-gaap:OperatingSegmentsMember
srt:SouthAmericaMember
2019-09-30
0000874761
us-gaap:OperatingSegmentsMember
aes:CorporateOtherAndOtherEliminationsMember
2018-12-31
0000874761
us-gaap:OperatingSegmentsMember
aes:CorporateOtherAndOtherEliminationsMember
2019-09-30
0000874761
us-gaap:OperatingSegmentsMember
aes:EURASIAMember
2018-12-31
0000874761
us-gaap:OperatingSegmentsMember
srt:SouthAmericaMember
2018-12-31
0000874761
us-gaap:OperatingSegmentsMember
aes:USandUtilitiesMember
2019-09-30
0000874761
us-gaap:OperatingSegmentsMember
aes:USandUtilitiesMember
2018-12-31
0000874761
us-gaap:OperatingSegmentsMember
aes:EURASIAMember
2019-09-30
0000874761
us-gaap:OperatingSegmentsMember
aes:MCACMember
2019-09-30
0000874761
aes:NonregulatedrevenueMember
2018-01-01
2018-09-30
0000874761
aes:NonregulatedrevenueMember
aes:USandUtilitiesDomain
2019-01-01
2019-09-30
0000874761
aes:RegulatedRevenueMember
aes:EURASIAMember
2018-01-01
2018-09-30
0000874761
aes:NonregulatedrevenueMember
aes:EURASIAMember
2019-01-01
2019-09-30
0000874761
aes:RegulatedRevenueMember
aes:MCACMember
2019-01-01
2019-09-30
0000874761
aes:NonregulatedrevenueMember
2019-01-01
2019-09-30
0000874761
aes:NonregulatedrevenueMember
srt:SouthAmericaMember
2018-01-01
2018-09-30
0000874761
aes:RegulatedRevenueMember
aes:EURASIAMember
2019-01-01
2019-09-30
0000874761
aes:EURASIAMember
2019-01-01
2019-09-30
0000874761
aes:RegulatedRevenueMember
2019-01-01
2019-09-30
0000874761
aes:NonregulatedrevenueMember
srt:SouthAmericaMember
2019-01-01
2019-09-30
0000874761
aes:EURASIAMember
2018-01-01
2018-09-30
0000874761
aes:NonregulatedrevenueMember
aes:MCACMember
2018-01-01
2018-09-30
0000874761
aes:RegulatedRevenueMember
aes:CorporateOtherAndOtherEliminationsMember
2018-01-01
2018-09-30
0000874761
aes:RegulatedRevenueMember
aes:MCACMember
2018-01-01
2018-09-30
0000874761
srt:SouthAmericaMember
2019-01-01
2019-09-30
0000874761
aes:NonregulatedrevenueMember
aes:CorporateOtherAndOtherEliminationsMember
2019-01-01
2019-09-30
0000874761
aes:NonregulatedrevenueMember
aes:MCACMember
2019-01-01
2019-09-30
0000874761
aes:MCACMember
2018-01-01
2018-09-30
0000874761
aes:RegulatedRevenueMember
srt:SouthAmericaMember
2019-01-01
2019-09-30
0000874761
aes:NonregulatedrevenueMember
aes:CorporateOtherAndOtherEliminationsMember
2018-01-01
2018-09-30
0000874761
aes:RegulatedRevenueMember
2018-01-01
2018-09-30
0000874761
aes:NonregulatedrevenueMember
aes:EURASIAMember
2018-01-01
2018-09-30
0000874761
aes:RegulatedRevenueMember
srt:SouthAmericaMember
2018-01-01
2018-09-30
0000874761
aes:RegulatedRevenueMember
aes:USandUtilitiesDomain
2019-01-01
2019-09-30
0000874761
aes:NonregulatedrevenueMember
aes:USandUtilitiesDomain
2018-01-01
2018-09-30
0000874761
aes:RegulatedRevenueMember
aes:CorporateOtherAndOtherEliminationsMember
2019-01-01
2019-09-30
0000874761
aes:USandUtilitiesDomain
2019-01-01
2019-09-30
0000874761
srt:SouthAmericaMember
2018-01-01
2018-09-30
0000874761
aes:CorporateOtherAndOtherEliminationsMember
2018-01-01
2018-09-30
0000874761
aes:MCACMember
2019-01-01
2019-09-30
0000874761
aes:RegulatedRevenueMember
aes:USandUtilitiesDomain
2018-01-01
2018-09-30
0000874761
aes:CorporateOtherAndOtherEliminationsMember
2019-01-01
2019-09-30
0000874761
aes:USandUtilitiesDomain
2018-01-01
2018-09-30
0000874761
aes:USandUtilitiesDomain
2019-07-01
2019-09-30
0000874761
aes:RegulatedRevenueMember
aes:EURASIAMember
2018-07-01
2018-09-30
0000874761
aes:NonregulatedrevenueMember
aes:EURASIAMember
2019-07-01
2019-09-30
0000874761
aes:CorporateOtherAndOtherEliminationsMember
2018-07-01
2018-09-30
0000874761
aes:NonregulatedrevenueMember
aes:EURASIAMember
2018-07-01
2018-09-30
0000874761
aes:NonregulatedrevenueMember
aes:CorporateOtherAndOtherEliminationsMember
2019-07-01
2019-09-30
0000874761
aes:CorporateOtherAndOtherEliminationsMember
2019-07-01
2019-09-30
0000874761
aes:RegulatedRevenueMember
aes:CorporateOtherAndOtherEliminationsMember
2018-07-01
2018-09-30
0000874761
aes:NonregulatedrevenueMember
aes:USandUtilitiesDomain
2019-07-01
2019-09-30
0000874761
aes:RegulatedRevenueMember
srt:SouthAmericaMember
2018-07-01
2018-09-30
0000874761
aes:NonregulatedrevenueMember
aes:MCACMember
2018-07-01
2018-09-30
0000874761
aes:RegulatedRevenueMember
2019-07-01
2019-09-30
0000874761
aes:NonregulatedrevenueMember
srt:SouthAmericaMember
2018-07-01
2018-09-30
0000874761
aes:NonregulatedrevenueMember
2019-07-01
2019-09-30
0000874761
aes:NonregulatedrevenueMember
aes:USandUtilitiesDomain
2018-07-01
2018-09-30
0000874761
aes:NonregulatedrevenueMember
srt:SouthAmericaMember
2019-07-01
2019-09-30
0000874761
aes:RegulatedRevenueMember
2018-07-01
2018-09-30
0000874761
aes:RegulatedRevenueMember
aes:CorporateOtherAndOtherEliminationsMember
2019-07-01
2019-09-30
0000874761
aes:RegulatedRevenueMember
srt:SouthAmericaMember
2019-07-01
2019-09-30
0000874761
aes:NonregulatedrevenueMember
2018-07-01
2018-09-30
0000874761
aes:RegulatedRevenueMember
aes:USandUtilitiesDomain
2018-07-01
2018-09-30
0000874761
aes:RegulatedRevenueMember
aes:MCACMember
2018-07-01
2018-09-30
0000874761
aes:MCACMember
2019-07-01
2019-09-30
0000874761
aes:NonregulatedrevenueMember
aes:MCACMember
2019-07-01
2019-09-30
0000874761
aes:RegulatedRevenueMember
aes:MCACMember
2019-07-01
2019-09-30
0000874761
aes:EURASIAMember
2019-07-01
2019-09-30
0000874761
srt:SouthAmericaMember
2019-07-01
2019-09-30
0000874761
aes:NonregulatedrevenueMember
aes:CorporateOtherAndOtherEliminationsMember
2018-07-01
2018-09-30
0000874761
aes:RegulatedRevenueMember
aes:EURASIAMember
2019-07-01
2019-09-30
0000874761
aes:RegulatedRevenueMember
aes:USandUtilitiesDomain
2019-07-01
2019-09-30
0000874761
aes:EURASIAMember
2018-07-01
2018-09-30
0000874761
srt:SouthAmericaMember
2018-07-01
2018-09-30
0000874761
aes:MCACMember
2018-07-01
2018-09-30
0000874761
aes:USandUtilitiesDomain
2018-07-01
2018-09-30
0000874761
us-gaap:OtherExpenseMember
2019-07-01
2019-09-30
0000874761
us-gaap:OtherIncomeMember
2019-01-01
2019-09-30
0000874761
us-gaap:OtherExpenseMember
2018-01-01
2018-09-30
0000874761
us-gaap:OtherExpenseMember
2019-01-01
2019-09-30
0000874761
us-gaap:OtherExpenseMember
2018-07-01
2018-09-30
0000874761
us-gaap:OtherIncomeMember
2018-07-01
2018-09-30
0000874761
us-gaap:OtherIncomeMember
2019-07-01
2019-09-30
0000874761
us-gaap:OtherIncomeMember
2018-01-01
2018-09-30
0000874761
aes:ShadyPointMember
2018-09-30
0000874761
aes:KilrootandBallylumfordMember
2019-01-01
2019-09-30
0000874761
aes:ShadyPointMember
2018-07-01
2018-09-30
0000874761
aes:ShadyPointMember
2018-06-30
0000874761
aes:KilrootandBallylumfordMember
2019-09-30
0000874761
aes:ShadyPointMember
2018-01-01
2018-06-30
0000874761
aes:ShadyPointMember
2019-01-01
2019-09-30
0000874761
aes:OtherSubsidiariesMember
2019-01-01
2019-09-30
0000874761
aes:ShadyPointMember
2019-07-01
2019-09-30
0000874761
aes:OtherSubsidiariesMember
2018-07-01
2018-09-30
0000874761
aes:OtherSubsidiariesMember
2019-07-01
2019-09-30
0000874761
aes:KilrootandBallylumfordMember
2019-07-01
2019-09-30
0000874761
aes:KilrootandBallylumfordMember
2018-07-01
2018-09-30
0000874761
aes:KilrootandBallylumfordMember
2018-01-01
2018-09-30
0000874761
aes:ShadyPointMember
2018-01-01
2018-09-30
0000874761
aes:OtherSubsidiariesMember
2018-01-01
2018-09-30
0000874761
us-gaap:DisposalGroupDisposedOfBySaleNotDiscontinuedOperationsMember
aes:ElectricaSantiagoGenerESSAMember
2018-04-01
2018-06-30
0000874761
us-gaap:DisposalGroupDisposedOfBySaleNotDiscontinuedOperationsMember
aes:MasinlocSubsidiaryMember
2018-01-01
2018-03-31
0000874761
country:US
us-gaap:ChangeInAccountingEstimateTypeDomain
2018-07-01
2018-09-30
0000874761
us-gaap:DisposalGroupDisposedOfBySaleNotDiscontinuedOperationsMember
aes:ElectricaSantiagoGenerESSAMember
2018-07-01
2018-09-30
0000874761
aes:MasinlocSubsidiaryMember
2018-03-20
0000874761
country:US
us-gaap:ChangeInAccountingEstimateTypeDomain
2019-01-01
2019-03-31
0000874761
aes:EletropauloSubsidiaryMember
2018-04-01
2018-06-30
0000874761
us-gaap:DisposalGroupDisposedOfBySaleNotDiscontinuedOperationsMember
aes:DPLPeakingGenerationDomain
2018-01-01
2018-03-31
0000874761
us-gaap:DisposalGroupDisposedOfBySaleNotDiscontinuedOperationsMember
aes:BeckjordFacilityMember
2018-01-01
2018-03-31
0000874761
us-gaap:DisposalGroupDisposedOfBySaleNotDiscontinuedOperationsMember
aes:ShadyPointMember
2019-05-22
2019-05-22
0000874761
us-gaap:DisposalGroupDisposedOfBySaleNotDiscontinuedOperationsMember
aes:KilrootandBallylumfordMember
2019-06-13
0000874761
us-gaap:DisposalGroupHeldforsaleNotDiscontinuedOperationsMember
aes:RedondoBeachMember
2019-09-30
0000874761
us-gaap:DisposalGroupHeldforsaleNotDiscontinuedOperationsMember
aes:JordanMember
2019-09-30
0000874761
us-gaap:DisposalGroupHeldforsaleNotDiscontinuedOperationsMember
aes:JordanMember
2019-01-01
2019-09-30
0000874761
us-gaap:DisposalGroupDisposedOfBySaleNotDiscontinuedOperationsMember
aes:KilrootandBallylumfordMember
2019-06-13
2019-06-13
0000874761
us-gaap:DisposalGroupHeldforsaleNotDiscontinuedOperationsMember
aes:JordanMember
2018-01-01
2018-09-30
0000874761
us-gaap:DisposalGroupNotDiscontinuedOperationsMember
aes:AdvancionEnergyStorageMember
2018-01-01
2018-03-31
0000874761
us-gaap:DisposalGroupDisposedOfBySaleNotDiscontinuedOperationsMember
2018-01-01
2018-09-30
0000874761
us-gaap:DisposalGroupDisposedOfBySaleNotDiscontinuedOperationsMember
2019-01-01
2019-09-30
0000874761
us-gaap:DisposalGroupDisposedOfBySaleNotDiscontinuedOperationsMember
aes:DplSubsidiaryMember
2019-01-01
2019-09-30
0000874761
us-gaap:DisposalGroupDisposedOfBySaleNotDiscontinuedOperationsMember
aes:KilrootandBallylumfordMember
2018-07-01
2018-09-30
0000874761
us-gaap:DisposalGroupDisposedOfBySaleNotDiscontinuedOperationsMember
aes:DplSubsidiaryMember
2018-01-01
2018-09-30
0000874761
us-gaap:DisposalGroupDisposedOfBySaleNotDiscontinuedOperationsMember
2019-07-01
2019-09-30
0000874761
us-gaap:DisposalGroupDisposedOfBySaleNotDiscontinuedOperationsMember
2018-07-01
2018-09-30
0000874761
us-gaap:DisposalGroupDisposedOfBySaleNotDiscontinuedOperationsMember
aes:DplSubsidiaryMember
2018-07-01
2018-09-30
0000874761
us-gaap:DisposalGroupDisposedOfBySaleNotDiscontinuedOperationsMember
aes:KilrootandBallylumfordMember
2019-01-01
2019-09-30
0000874761
us-gaap:DisposalGroupDisposedOfBySaleNotDiscontinuedOperationsMember
aes:KilrootandBallylumfordMember
2018-01-01
2018-09-30
0000874761
us-gaap:DisposalGroupDisposedOfBySaleNotDiscontinuedOperationsMember
aes:OtherSubsidiariesMember
2018-07-01
2018-09-30
0000874761
us-gaap:DisposalGroupDisposedOfBySaleNotDiscontinuedOperationsMember
aes:KilrootandBallylumfordMember
2019-07-01
2019-09-30
0000874761
us-gaap:DisposalGroupDisposedOfBySaleNotDiscontinuedOperationsMember
aes:OtherSubsidiariesMember
2019-07-01
2019-09-30
0000874761
us-gaap:DisposalGroupDisposedOfBySaleNotDiscontinuedOperationsMember
aes:DplSubsidiaryMember
2019-07-01
2019-09-30
0000874761
us-gaap:DisposalGroupDisposedOfBySaleNotDiscontinuedOperationsMember
aes:OtherSubsidiariesMember
2019-01-01
2019-09-30
0000874761
us-gaap:DisposalGroupDisposedOfBySaleNotDiscontinuedOperationsMember
aes:OtherSubsidiariesMember
2018-01-01
2018-09-30
0000874761
aes:LosCururosMember
2019-07-01
2019-09-30
0000874761
aes:GuaimbeSolarComplexMember
2018-07-01
2018-09-30
0000874761
us-gaap:StockCompensationPlanMember
2018-01-01
2018-09-30
0000874761
us-gaap:StockCompensationPlanMember
2019-01-01
2019-09-30
0000874761
us-gaap:StockCompensationPlanMember
2018-07-01
2018-09-30
0000874761
us-gaap:StockCompensationPlanMember
2019-07-01
2019-09-30
iso4217:USD
iso4217:USD
xbrli:shares
xbrli:shares
xbrli:pure
utreg:Rate
aes:segment
aes:agreement
UNITED STATES
SECURITIES AND EXCHANGE COMMISSION
WASHINGTON, D.C. 20549
______________________________________________________________________________________________
FORM 10-Q
(Mark One)
|
| |
☒ | QUARTERLY REPORT PURSUANT TO SECTION 13 OR 15(d) OF THE SECURITIES EXCHANGE ACT OF 1934 |
For the Quarterly Period Ended September 30, 2019
or
|
| |
☐ | TRANSITION REPORT PURSUANT TO SECTION 13 OR 15(d) OF THE SECURITIES EXCHANGE ACT OF 1934 |
Commission file number 1-12291
THE AES CORPORATION
(Exact name of registrant as specified in its charter)
|
| | |
Delaware | | 54-1163725 |
(State or other jurisdiction of incorporation or organization) | | (I.R.S. Employer Identification No.) |
|
| | | |
4300 Wilson Boulevard | |
|
Arlington, | Virginia | | 22203 |
(Address of principal executive offices) | | (Zip Code) |
|
| | |
Registrant's telephone number, including area code: | (703) | 522-1315 |
|
| | |
Securities registered pursuant to Section 12(b) of the Act: |
Title of Each Class | Trading Symbol(s) | Name of Each Exchange on Which Registered |
Common Stock, par value $0.01 per share | AES | New York Stock Exchange |
______________________________________________________________________________________________
Indicate by check mark whether the registrant (1) has filed all reports required to be filed by Section 13 or 15(d) of the Securities Exchange Act of 1934 during the preceding 12 months (or for such shorter period that the registrant was required to file such reports), and (2) has been subject to such filing requirements for the past 90 days. Yes ☒ No ☐
Indicate by check mark whether the registrant has submitted electronically every Interactive Data File required to be submitted pursuant to Rule 405 of Regulation S-T (§232.405 of this chapter) during the preceding 12 months (or for such shorter period that the registrant was required to submit such files). Yes ☒ No ☐
Indicate by check mark whether the registrant is a large accelerated filer, an accelerated filer, a non-accelerated filer, a smaller reporting company, or an emerging growth company. See the definitions of “large accelerated filer”, “accelerated filer”, “smaller reporting company”, and “emerging growth company” in Rule 12b-2 of the Exchange Act.
|
| | | | | | | | | |
Large accelerated filer | ☒ | Accelerated filer | ☐ | Smaller reporting company | ☐ | Emerging growth company | ☐ | Non-accelerated filer | ☐ |
If an emerging growth company, indicate by check mark if the registrant has elected not to use the extended transition period for complying with any new or revised financial accounting standards provided pursuant to Section 13(a) of the Exchange Act. ☐
Indicate by check mark whether the registrant is a shell company (as defined in Rule 12b-2 of the Exchange Act). Yes ☐ No ☒
______________________________________________________________________________________________
The number of shares outstanding of Registrant’s Common Stock, par value $0.01 per share, on October 31, 2019 was 663,892,656.
THE AES CORPORATION
FORM 10-Q
FOR THE QUARTERLY PERIOD ENDED SEPTEMBER 30, 2019
TABLE OF CONTENTS |
| | |
| |
| | |
| |
| | |
ITEM 1. | | |
| | |
| | |
| | |
| | |
| | |
| | |
| | |
| | |
| | |
| | |
| | |
| | |
| | |
| | |
| | |
| | |
| | |
| | |
| | |
| | |
| | |
| | |
| | |
| | |
| | |
| | |
| | |
| | |
ITEM 2. | | |
| | |
| | |
| | |
| | |
| | |
| | |
| | |
ITEM 3. | | |
| | |
ITEM 4. | | |
| |
| |
| | |
ITEM 1. | | |
| | |
ITEM 1A. | | |
| | |
ITEM 2. | | |
| | |
ITEM 3. | | |
| | |
ITEM 4. | | |
| | |
ITEM 5. | | |
| | |
ITEM 6. | | |
| |
| |
GLOSSARY OF TERMS
The following terms and acronyms appear in the text of this report and have the definitions indicated below: |
| |
Adjusted EPS | Adjusted Earnings Per Share, a non-GAAP measure |
Adjusted PTC | Adjusted Pre-tax Contribution, a non-GAAP measure of operating performance |
AFS | Available For Sale |
AFUDC | Allowance for Funds Used During Construction |
AOCI | Accumulated Other Comprehensive Income |
AOCL | Accumulated Other Comprehensive Loss |
ARO | Asset Retirement Obligations |
ASC | Accounting Standards Codification |
ASU | Accounting Standards Update |
CAA | United States Clean Air Act |
CAMMESA | Wholesale Electric Market Administrator in Argentina |
CCR | Coal Combustion Residuals, which includes bottom ash, fly ash and air pollution control wastes generated at coal-fired generation plant sites. |
CO2 | Carbon Dioxide |
DMP | Distribution Modernization Plan |
DMR | Distribution Modernization Rider |
DP&L | The Dayton Power & Light Company |
DPL | DPL Inc. |
EPA | United States Environmental Protection Agency |
EPC | Engineering, Procurement and Construction |
ESP | Electric Security Plan |
EURIBOR | Euro Interbank Offered Rate |
FASB | Financial Accounting Standards Board |
FX | Foreign Exchange |
GAAP | Generally Accepted Accounting Principles in the United States |
GHG | Greenhouse Gas |
GILTI | Global Intangible Low Taxed Income |
GW | Gigawatts |
HLBV | Hypothetical Liquidation Book Value |
HPP | Hydropower Plant |
IPALCO | IPALCO Enterprises, Inc. |
IPL | Indianapolis Power & Light Company |
IURC | Indiana Utility Regulatory Commission |
LIBOR | London Interbank Offered Rate |
LNG | Liquid Natural Gas |
MMBtu | Million British Thermal Units |
MW | Megawatts |
MWh | Megawatt Hours |
NCI | Noncontrolling Interest |
NM | Not Meaningful |
NOV | Notice of Violation |
NOX | Nitrogen Oxide |
NPDES | National Pollutant Discharge Elimination System |
PPA | Power Purchase Agreement |
PREPA | Puerto Rico Electric Power Authority |
PUCO | The Public Utilities Commission of Ohio |
RSU | Restricted Stock Unit |
SBU | Strategic Business Unit |
SEC | United States Securities and Exchange Commission |
SEET | Significantly Excessive Earnings Test |
SIP | State Implementation Plan |
SO2 | Sulfur Dioxide |
TBTU | Trillion British Thermal Units |
TCJA | Tax Cuts and Jobs Act |
U.S. | United States |
USD | United States Dollar |
VAT | Value-Added Tax |
VIE | Variable Interest Entity |
PART I: FINANCIAL INFORMATION
ITEM 1. FINANCIAL STATEMENTS
THE AES CORPORATION
Condensed Consolidated Balance Sheets
(Unaudited) |
| | | | | | | |
| September 30,
2019 | | December 31,
2018 |
| (in millions, except share and per share data) |
ASSETS | | | |
CURRENT ASSETS | | | |
Cash and cash equivalents | $ | 1,145 |
| | $ | 1,166 |
|
Restricted cash | 455 |
| | 370 |
|
Short-term investments | 334 |
| | 313 |
|
Accounts receivable, net of allowance for doubtful accounts of $21 and $23, respectively | 1,503 |
| | 1,595 |
|
Inventory | 495 |
| | 577 |
|
Prepaid expenses | 72 |
| | 130 |
|
Other current assets | 856 |
| | 807 |
|
Current held-for-sale assets | 610 |
| | 57 |
|
Total current assets | 5,470 |
| | 5,015 |
|
NONCURRENT ASSETS | | | |
Property, Plant and Equipment: | | | |
Land | 442 |
| | 449 |
|
Electric generation, distribution assets and other | 25,148 |
| | 25,242 |
|
Accumulated depreciation | (8,599 | ) | | (8,227 | ) |
Construction in progress | 4,862 |
| | 3,932 |
|
Property, plant and equipment, net | 21,853 |
| | 21,396 |
|
Other Assets: | | | |
Investments in and advances to affiliates | 1,209 |
| | 1,114 |
|
Debt service reserves and other deposits | 241 |
| | 467 |
|
Goodwill | 1,059 |
| | 1,059 |
|
Other intangible assets, net of accumulated amortization of $302 and $457, respectively | 462 |
| | 436 |
|
Deferred income taxes | 135 |
| | 97 |
|
Loan receivable | 1,370 |
| | 1,423 |
|
Other noncurrent assets | 1,624 |
| | 1,514 |
|
Total other assets | 6,100 |
| | 6,110 |
|
TOTAL ASSETS | $ | 33,423 |
| | $ | 32,521 |
|
LIABILITIES AND EQUITY | | | |
CURRENT LIABILITIES | | | |
Accounts payable | $ | 1,237 |
| | $ | 1,329 |
|
Accrued interest | 236 |
| | 191 |
|
Accrued non-income taxes | 230 |
| | 250 |
|
Accrued and other liabilities | 951 |
| | 962 |
|
Non-recourse debt, including $312 and $479, respectively, related to variable interest entities | 1,882 |
| | 1,659 |
|
Current held-for-sale liabilities | 455 |
| | 8 |
|
Total current liabilities | 4,991 |
| | 4,399 |
|
NONCURRENT LIABILITIES | | | |
Recourse debt | 3,556 |
| | 3,650 |
|
Non-recourse debt, including $3,350 and $2,922 respectively, related to variable interest entities | 14,323 |
| | 13,986 |
|
Deferred income taxes | 1,198 |
| | 1,280 |
|
Other noncurrent liabilities | 3,083 |
| | 2,723 |
|
Total noncurrent liabilities | 22,160 |
| | 21,639 |
|
Commitments and Contingencies (see Note 9) | | | |
Redeemable stock of subsidiaries | 886 |
| | 879 |
|
EQUITY | | | |
THE AES CORPORATION STOCKHOLDERS’ EQUITY | | | |
Common stock ($0.01 par value, 1,200,000,000 shares authorized; 817,783,916 issued and 663,892,656 outstanding at September 30, 2019 and 817,203,691 issued and 662,298,096 outstanding at December 31, 2018) | 8 |
| | 8 |
|
Additional paid-in capital | 7,948 |
| | 8,154 |
|
Accumulated deficit | (614 | ) | | (1,005 | ) |
Accumulated other comprehensive loss | (2,335 | ) | | (2,071 | ) |
Treasury stock, at cost (153,891,260 and 154,905,595 shares at September 30, 2019 and December 31, 2018, respectively) | (1,867 | ) | | (1,878 | ) |
Total AES Corporation stockholders’ equity | 3,140 |
| | 3,208 |
|
NONCONTROLLING INTERESTS | 2,246 |
| | 2,396 |
|
Total equity | 5,386 |
| | 5,604 |
|
TOTAL LIABILITIES AND EQUITY | $ | 33,423 |
| | $ | 32,521 |
|
See Notes to Condensed Consolidated Financial Statements.
THE AES CORPORATION
Condensed Consolidated Statements of Operations
(Unaudited)
|
| | | | | | | | | | | | | | | |
| Three Months Ended September 30, | | Nine Months Ended September 30, |
| 2019 | | 2018 | | 2019 | | 2018 |
| | | | | | | |
| (in millions, except per share amounts) |
Revenue: | | | | | | | |
Regulated | $ | 799 |
| | $ | 777 |
| | $ | 2,308 |
| | $ | 2,215 |
|
Non-Regulated | 1,826 |
| | 2,060 |
| | 5,450 |
| | 5,899 |
|
Total revenue | 2,625 |
| | 2,837 |
| | 7,758 |
| | 8,114 |
|
Cost of Sales: | | | | | | | |
Regulated | (633 | ) | | (638 | ) | | (1,873 | ) | | (1,856 | ) |
Non-Regulated | (1,291 | ) | | (1,528 | ) | | (4,096 | ) | | (4,331 | ) |
Total cost of sales | (1,924 | ) | | (2,166 | ) | | (5,969 | ) | | (6,187 | ) |
Operating margin | 701 |
| | 671 |
| | 1,789 |
| | 1,927 |
|
General and administrative expenses | (41 | ) | | (43 | ) | | (136 | ) | | (134 | ) |
Interest expense | (250 | ) | | (255 | ) | | (788 | ) | | (799 | ) |
Interest income | 81 |
| | 79 |
| | 242 |
| | 231 |
|
Loss on extinguishment of debt | (65 | ) | | (11 | ) | | (126 | ) | | (187 | ) |
Other expense | (9 | ) | | (29 | ) | | (35 | ) | | (42 | ) |
Other income | 78 |
| | 10 |
| | 126 |
| | 30 |
|
Gain (loss) on disposal and sale of business interests | 16 |
| | (21 | ) | | 9 |
| | 856 |
|
Asset impairment expense | — |
| | (74 | ) | | (116 | ) | | (166 | ) |
Foreign currency transaction gains (losses) | (87 | ) | | 5 |
| | (69 | ) | | (44 | ) |
INCOME FROM CONTINUING OPERATIONS BEFORE TAXES AND EQUITY IN EARNINGS OF AFFILIATES | 424 |
| | 332 |
| | 896 |
| | 1,672 |
|
Income tax expense | (130 | ) | | (146 | ) | | (302 | ) | | (509 | ) |
Net equity in earnings of affiliates | 4 |
| | 6 |
| | 3 |
| | 31 |
|
INCOME FROM CONTINUING OPERATIONS | 298 |
| | 192 |
| | 597 |
| | 1,194 |
|
Loss from operations of discontinued businesses, net of income tax expense of $0, $0, $0, and $2, respectively | — |
| | (4 | ) | | — |
| | (9 | ) |
Gain from disposal of discontinued businesses, net of income tax expense of $0, $2, $0, and $44, respectively | — |
| | 3 |
| | 1 |
| | 199 |
|
NET INCOME | 298 |
| | 191 |
| | 598 |
| | 1,384 |
|
Less: Income from continuing operations attributable to noncontrolling interests and redeemable stock of subsidiaries | (88 | ) | | (90 | ) | | (217 | ) | | (311 | ) |
Less: Loss from discontinued operations attributable to noncontrolling interests | — |
| | — |
| | — |
| | 2 |
|
NET INCOME ATTRIBUTABLE TO THE AES CORPORATION | $ | 210 |
| | $ | 101 |
| | $ | 381 |
| | $ | 1,075 |
|
AMOUNTS ATTRIBUTABLE TO THE AES CORPORATION COMMON STOCKHOLDERS: | | | | | | | |
Income from continuing operations, net of tax | $ | 210 |
| | $ | 102 |
| | $ | 380 |
| | $ | 883 |
|
Income (loss) from discontinued operations, net of tax | — |
| | (1 | ) | | 1 |
| | 192 |
|
NET INCOME ATTRIBUTABLE TO THE AES CORPORATION | $ | 210 |
| | $ | 101 |
| | $ | 381 |
| | $ | 1,075 |
|
BASIC EARNINGS PER SHARE: | | | | | | | |
Income from continuing operations attributable to The AES Corporation common stockholders, net of tax | $ | 0.32 |
| | $ | 0.15 |
| | $ | 0.57 |
| | $ | 1.33 |
|
Income from discontinued operations attributable to The AES Corporation common stockholders, net of tax | — |
| | — |
| | — |
| | 0.29 |
|
NET INCOME ATTRIBUTABLE TO THE AES CORPORATION COMMON STOCKHOLDERS | $ | 0.32 |
| | $ | 0.15 |
| | $ | 0.57 |
| | $ | 1.62 |
|
DILUTED EARNINGS PER SHARE: | | | | | | | |
Income from continuing operations attributable to The AES Corporation common stockholders, net of tax | $ | 0.32 |
| | $ | 0.15 |
| | $ | 0.57 |
| | $ | 1.33 |
|
Income from discontinued operations attributable to The AES Corporation common stockholders, net of tax | — |
| | — |
| | — |
| | 0.29 |
|
NET INCOME ATTRIBUTABLE TO THE AES CORPORATION COMMON STOCKHOLDERS | $ | 0.32 |
| | $ | 0.15 |
| | $ | 0.57 |
| | $ | 1.62 |
|
DILUTED SHARES OUTSTANDING | 667 |
| | 665 |
| | 667 |
| | 664 |
|
See Notes to Condensed Consolidated Financial Statements.
THE AES CORPORATION
Condensed Consolidated Statements of Comprehensive Income (Loss)
(Unaudited)
|
| | | | | | | | | | | | | | | |
| Three Months Ended September 30, | | Nine Months Ended September 30, |
| 2019 | | 2018 | | 2019 | | 2018 |
| | | | | | | |
| (in millions) |
NET INCOME | $ | 298 |
| | $ | 191 |
| | $ | 598 |
| | $ | 1,384 |
|
Foreign currency translation activity: | | | | | | | |
Foreign currency translation adjustments, net of income tax benefit of $0, $2, $0 and $3, respectively | (75 | ) | | (42 | ) | | (67 | ) | | (159 | ) |
Reclassification to earnings, net of $0 income tax for all periods | — |
| | (3 | ) | | 23 |
| | (1 | ) |
Total foreign currency translation adjustments | (75 | ) | | (45 | ) | | (44 | ) | | (160 | ) |
Derivative activity: | | | | | | | |
Change in derivative fair value, net of income tax benefit (expense) of $44, $(3), $97 and $(3), respectively | (178 | ) | | 15 |
| | (375 | ) | | 32 |
|
Reclassification to earnings, net of income tax expense of $6, $7, $9 and $15, respectively | 17 |
| | 21 |
| | 36 |
| | 67 |
|
Total change in fair value of derivatives | (161 | ) | | 36 |
| | (339 | ) | | 99 |
|
Pension activity: | | | | | | | |
Change in pension adjustments due to net actuarial gain (loss) for the period, net of $0 income tax for all periods | — |
| | — |
| | 2 |
| | — |
|
Reclassification to earnings, net of income tax expense of $0, $0, $13 and $2, respectively | — |
| | 1 |
| | 27 |
| | 5 |
|
Total pension adjustments | — |
| | 1 |
| | 29 |
| | 5 |
|
OTHER COMPREHENSIVE LOSS | (236 | ) | | (8 | ) | | (354 | ) | | (56 | ) |
COMPREHENSIVE INCOME | 62 |
| | 183 |
| | 244 |
| | 1,328 |
|
Less: Comprehensive income attributable to noncontrolling interests and redeemable stock of subsidiaries | (40 | ) | | (114 | ) | | (123 | ) | | (416 | ) |
COMPREHENSIVE INCOME ATTRIBUTABLE TO THE AES CORPORATION | $ | 22 |
| | $ | 69 |
| | $ | 121 |
| | $ | 912 |
|
See Notes to Condensed Consolidated Financial Statements.
THE AES CORPORATION
Condensed Consolidated Statements of Changes in Equity
For The Nine Months Ended September 30, 2019
(Unaudited) |
| | | | | | | | | | | | | | | | | | | | | | | | | | | | | |
| Common Stock | | Treasury Stock | | Additional
Paid-In
Capital | | Accumulated
Deficit | | Accumulated
Other
Comprehensive
Loss | | Noncontrolling
Interests |
| Shares | | Amount | | Shares | | Amount | | | | |
| (in millions) |
Balance at January 1, 2019 | 817.2 |
| | $ | 8 |
| | 154.9 |
| | $ | (1,878 | ) | | $ | 8,154 |
| | $ | (1,005 | ) | | $ | (2,071 | ) | | $ | 2,396 |
|
Net income | — |
| | — |
| | — |
| | — |
| | — |
| | 154 |
| | — |
| | 81 |
|
Total foreign currency translation adjustment, net of income tax | — |
| | — |
| | — |
| | — |
| | — |
| | — |
| | 4 |
| | (5 | ) |
Total change in derivative fair value, net of income tax | — |
| | — |
| | — |
| | — |
| | — |
| | — |
| | (37 | ) | | (18 | ) |
Total pension adjustments, net of income tax | — |
| | — |
| | — |
| | — |
| | — |
| | — |
| | 1 |
| | — |
|
Total other comprehensive income (loss) | — |
| | — |
| | — |
| | — |
| | — |
| | — |
| | (32 | ) | | (23 | ) |
Cumulative effect of a change in accounting principle (1) | — |
| | — |
| | — |
| | — |
| | — |
| | 12 |
| | (4 | ) | | — |
|
Fair value adjustment (2) | — |
| | — |
| | — |
| | — |
| | (6 | ) | | — |
| | — |
| | — |
|
Distributions to noncontrolling interests | — |
| | — |
| | — |
| | — |
| | — |
| | — |
| | — |
| | (40 | ) |
Dividends declared on common stock ($0.1365/share) | — |
| | — |
| | — |
| | — |
| | (91 | ) | | — |
| | — |
| | — |
|
Issuance and exercise of stock-based compensation benefit plans, net of income tax | 0.4 |
| | — |
| | (1 | ) | | 11 |
| | (17 | ) | | — |
| | — |
| | — |
|
Sales to noncontrolling interests | — |
| | — |
| | — |
| | — |
| | (1 | ) | | — |
| | — |
| | 1 |
|
Balance at March 31, 2019 | 817.6 |
| | $ | 8 |
| | 153.9 |
| | $ | (1,867 | ) | | $ | 8,039 |
| | $ | (839 | ) | | $ | (2,107 | ) | | $ | 2,415 |
|
Net income | — |
| | — |
| | — |
| | — |
| | — |
| | 17 |
| | — |
| | 52 |
|
Total foreign currency translation adjustment, net of income tax | — |
| | — |
| | — |
| | — |
| | — |
| | — |
| | 27 |
| | 5 |
|
Total change in derivative fair value, net of income tax | — |
| | — |
| | — |
| | — |
| | — |
| | — |
| | (95 | ) | | (22 | ) |
Total pension adjustments, net of income tax | — |
| | — |
| | — |
| | — |
| | — |
| | — |
| | 28 |
| | — |
|
Total other comprehensive income (loss) | — |
| | — |
| | — |
| | — |
| | — |
| | — |
| | (40 | ) | | (17 | ) |
Cumulative effect of a change in accounting principle (1) | — |
| | — |
| | — |
| | — |
| | — |
| | (2 | ) | | — |
| | — |
|
Fair value adjustment (2) | — |
| | — |
| | — |
| | — |
| | (11 | ) | | — |
| | — |
| | — |
|
Distributions to noncontrolling interests | — |
| | — |
| | — |
| | — |
| | — |
| | — |
| | — |
| | (198 | ) |
Issuance and exercise of stock-based compensation benefit plans, net of income tax | 0.1 |
| | — |
| | — |
| | — |
| | 10 |
| | — |
| | — |
| | — |
|
Sales to noncontrolling interests | — |
| | — |
| | — |
| | — |
| | — |
| | — |
| | — |
| | 8 |
|
Balance at June 30, 2019 | 817.7 |
| | $ | 8 |
| | 153.9 |
| | $ | (1,867 | ) | | $ | 8,038 |
| | $ | (824 | ) | | $ | (2,147 | ) | | $ | 2,260 |
|
Net income | — |
| | — |
| | — |
| | — |
| | — |
| | 210 |
| | — |
| | 96 |
|
Total foreign currency translation adjustment, net of income tax | — |
| | — |
| | — |
| | — |
| | — |
| | — |
| | (54 | ) | | (21 | ) |
Total change in derivative fair value, net of income tax | — |
| | — |
| | — |
| | — |
| | — |
| | — |
| | (134 | ) | | (23 | ) |
Total pension adjustments, net of income tax | — |
| | — |
| | — |
| | — |
| | — |
| | — |
| | — |
| | — |
|
Total other comprehensive income (loss) | — |
| | — |
| | — |
| | — |
| | — |
| | — |
| | (188 | ) | | (44 | ) |
Fair value adjustment (2) | — |
| | — |
| | — |
| | — |
| | (2 | ) | | — |
| | — |
| | — |
|
Distributions to noncontrolling interests | — |
| | — |
| | — |
| | — |
| | — |
| | — |
| | — |
| | (75 | ) |
Contributions from noncontrolling interests | — |
| | — |
| | — |
| | — |
| | — |
| | — |
| | — |
| | 7 |
|
Dividends declared on common stock ($0.1365/share) | — |
| | — |
| | — |
| | — |
| | (90 | ) | | — |
| | — |
| | — |
|
Issuance and exercise of stock-based compensation benefit plans, net of income tax | 0.1 |
| | — |
| | — |
| | — |
| | 3 |
| | — |
| | — |
| | — |
|
Sales to noncontrolling interests | — |
| | — |
| | — |
| | — |
| | (1 | ) | | — |
| | — |
| | 2 |
|
Balance at September 30, 2019 | 817.8 |
| | $ | 8 |
| | 153.9 |
| | $ | (1,867 | ) | | $ | 7,948 |
| | $ | (614 | ) | | $ | (2,335 | ) | | $ | 2,246 |
|
| |
| See Note 1—Financial Statement Presentation—New Accounting Standards Adopted for further information. |
| |
| Adjustment to record the redeemable stock of Colon at fair value. |
THE AES CORPORATION
Condensed Consolidated Statements of Changes in Equity
For the Nine Months Ended September 30, 2018
(Unaudited)
|
| | | | | | | | | | | | | | | | | | | | | | | | | | | | | |
| Common Stock | | Treasury Stock | | Additional
Paid-In
Capital | | Accumulated
Deficit | | Accumulated
Other
Comprehensive
Loss | | Noncontrolling
Interests |
| Shares | | Amount | | Shares | | Amount | | | | |
| (in millions) |
Balance at January 1, 2018 | 816.3 |
| | $ | 8 |
| | 155.9 |
| | $ | (1,892 | ) | | $ | 8,501 |
| | $ | (2,276 | ) | | $ | (1,876 | ) | | $ | 2,380 |
|
Net income | — |
| | — |
| | — |
| | — |
| | — |
| | 684 |
| | — |
| | 98 |
|
Total foreign currency translation adjustment, net of income tax | — |
| | — |
| | — |
| | — |
| | — |
| | — |
| | 3 |
| | 6 |
|
Total change in derivative fair value, net of income tax | — |
| | — |
| | — |
| | — |
| | — |
| | — |
| | 44 |
| | 23 |
|
Total pension adjustments, net of income tax | — |
| | — |
| | — |
| | — |
| | — |
| | — |
| | 2 |
| | — |
|
Total other comprehensive income (loss) | — |
| | — |
| | — |
| | — |
| | — |
| | — |
| | 49 |
| | 29 |
|
Cumulative effect of a change in accounting principle (1) | — |
| | — |
| | — |
| | — |
| | — |
| | 67 |
| | 19 |
| | 81 |
|
Fair value adjustment (2) | — |
| | — |
| | — |
| | — |
| | (6 | ) | | — |
| | — |
| | — |
|
Disposition of business interests (3) | — |
| | — |
| | — |
| | — |
| | — |
| | — |
| | — |
| | (249 | ) |
Distributions to noncontrolling interests | — |
| | — |
| | — |
| | — |
| | — |
| | — |
| | — |
| | (9 | ) |
Contributions from noncontrolling interests | — |
| | — |
| | — |
| | — |
| | — |
| | — |
| | — |
| | 1 |
|
Dividends declared on common stock ($0.13/share) | — |
| | — |
| | — |
| | — |
| | (86 | ) | | — |
| | — |
| | — |
|
Issuance and exercise of stock-based compensation benefit plans, net of income tax | — |
| | — |
| | (1 | ) | | 13 |
| | (12 | ) | | — |
| | — |
| | — |
|
Sales to noncontrolling interests | — |
| | — |
| | — |
| | — |
| | — |
| | — |
| | — |
| | 1 |
|
Balance at March 31, 2018 | 816.3 |
| | $ | 8 |
| | 154.9 |
| | $ | (1,879 | ) | | $ | 8,397 |
| | $ | (1,525 | ) | | $ | (1,808 | ) | | $ | 2,332 |
|
Net income | — |
| | — |
| | — |
| | — |
| | — |
| | 290 |
| | — |
| | 128 |
|
Total foreign currency translation adjustment, net of income tax | — |
| | — |
| | — |
| | — |
| | — |
| | — |
| | (176 | ) | | 52 |
|
Total change in derivative fair value, net of income tax | — |
| | — |
| | — |
| | — |
| | — |
| | — |
| | (6 | ) | | 2 |
|
Total pension adjustments, net of income tax | — |
| | — |
| | — |
| | — |
| | — |
| | — |
| | 2 |
| | — |
|
Total other comprehensive income (loss) | — |
| | — |
| | — |
| | — |
| | — |
| | — |
| | (180 | ) | | 54 |
|
Cumulative effect of a change in accounting principle (1) | — |
| | — |
| | — |
| | — |
| | — |
| | 1 |
| | — |
| | — |
|
Fair value adjustment (2) | — |
| | — |
| | — |
| | — |
| | 1 |
| | — |
| | — |
| | — |
|
Distributions to noncontrolling interests | — |
| | — |
| | — |
| | — |
| | — |
| | — |
| | — |
| | (176 | ) |
Contributions from noncontrolling interests | — |
| | — |
| | — |
| | — |
| | — |
| | — |
| | — |
| | 4 |
|
Issuance and exercise of stock-based compensation benefit plans, net of income tax | 0.1 |
| | — |
| | — |
| | — |
| | 5 |
| | — |
| | — |
| | — |
|
Sales to noncontrolling interests | — |
| | — |
| | — |
| | — |
| | (1 | ) | | — |
| | — |
| | 6 |
|
Balance at June 30, 2018 | 816.4 |
| | $ | 8 |
| | 154.9 |
| | $ | (1,879 | ) | | $ | 8,402 |
| | $ | (1,234 | ) | | $ | (1,988 | ) | | $ | 2,348 |
|
Net income | — |
| | — |
| | — |
| | — |
| | — |
| | 101 |
| | — |
| | 86 |
|
Total foreign currency translation adjustment, net of income tax | — |
| | — |
| | — |
| | — |
| | — |
| | — |
| | (59 | ) | | 14 |
|
Total change in derivative fair value, net of income tax | — |
| | — |
| | — |
| | — |
| | — |
| | — |
| | 26 |
| | 10 |
|
Total pension adjustments, net of income tax | — |
| | — |
| | — |
| | — |
| | — |
| | — |
| | 1 |
| | — |
|
Total other comprehensive income (loss) | — |
| | — |
| | — |
| | — |
| | — |
| | — |
| | (32 | ) | | 24 |
|
Fair value adjustment (2) | — |
| | — |
| | — |
| | — |
| | 1 |
| | — |
| | — |
| | — |
|
Disposition of businesses (3) | — |
| | — |
| | — |
| | — |
| | — |
| | — |
| | — |
| | (1 | ) |
Distributions to noncontrolling interests | — |
| | — |
| | — |
| | — |
| | — |
| | — |
| | — |
| | (68 | ) |
Contributions from noncontrolling interests | — |
| | — |
| | — |
| | — |
| | — |
| | — |
| | — |
| | 1 |
|
Dividends declared on common stock ($0.13/share) | — |
| | — |
| | — |
| | — |
| | (86 | ) | | — |
| | — |
| | — |
|
Issuance and exercise of stock-based compensation benefit plans, net of income tax | 0.8 |
| | — |
| | — |
| | 1 |
| | 11 |
| | — |
| | — |
| | — |
|
Sales to noncontrolling interests | — |
| | — |
| | — |
| | — |
| | — |
| | — |
| | — |
| | 14 |
|
Balance at September 30, 2018 | 817.2 |
| | $ | 8 |
| | 154.9 |
| | $ | (1,878 | ) | | $ | 8,328 |
| | $ | (1,133 | ) | | $ | (2,020 | ) | | $ | 2,404 |
|
| |
| See Note 1—Financial Statement Presentation—New Accounting Standards Adopted for further information. |
| |
| Adjustment to record the redeemable stock of Colon at fair value. |
| |
| See Note 19—Held-for-Sale and Dispositions for further information. |
THE AES CORPORATION
Condensed Consolidated Statements of Cash Flows
(Unaudited)
|
| | | | | | | |
| Nine Months Ended
September 30, |
| 2019 | | 2018 |
| | | |
| (in millions) |
OPERATING ACTIVITIES: | | | |
Net income | $ | 598 |
| | $ | 1,384 |
|
Adjustments to net income: | | | |
Depreciation and amortization | 774 |
| | 770 |
|
Gain on disposal and sale of business interests | (9 | ) | | (856 | ) |
Impairment expenses | 116 |
| | 172 |
|
Deferred income taxes | 4 |
| | 221 |
|
Loss on extinguishment of debt | 126 |
| | 187 |
|
Loss on sale and disposal of assets | 21 |
| | 23 |
|
Net gain from disposal and impairments of discontinued businesses | — |
| | (243 | ) |
Other | 278 |
| | 207 |
|
Changes in operating assets and liabilities: | | | |
(Increase) decrease in accounts receivable | 27 |
| | (125 | ) |
(Increase) decrease in inventory | (3 | ) | | (13 | ) |
(Increase) decrease in prepaid expenses and other current assets | (17 | ) | | 15 |
|
(Increase) decrease in other assets | 1 |
| | (22 | ) |
Increase (decrease) in accounts payable and other current liabilities | (12 | ) | | (29 | ) |
Increase (decrease) in income tax payables, net and other tax payables | (124 | ) | | (61 | ) |
Increase (decrease) in other liabilities | (5 | ) | | 51 |
|
Net cash provided by operating activities | 1,775 |
| | 1,681 |
|
INVESTING ACTIVITIES: | | | |
Capital expenditures | (1,628 | ) | | (1,592 | ) |
Acquisitions of business interests, net of cash and restricted cash acquired | (56 | ) | | (66 | ) |
Proceeds from the sale of business interests, net of cash and restricted cash sold | 226 |
| | 1,796 |
|
Proceeds from the sale of assets | 23 |
| | 15 |
|
Sale of short-term investments | 524 |
| | 1,010 |
|
Purchase of short-term investments | (572 | ) | | (1,215 | ) |
Contributions and loans to equity affiliates | (258 | ) | | (101 | ) |
Other investing | 30 |
| | (37 | ) |
Net cash used in investing activities | (1,711 | ) | | (190 | ) |
FINANCING ACTIVITIES: | | | |
Borrowings under the revolving credit facilities | 1,469 |
| | 1,434 |
|
Repayments under the revolving credit facilities | (1,041 | ) | | (1,595 | ) |
Issuance of recourse debt | — |
| | 1,000 |
|
Repayments of recourse debt | (449 | ) | | (1,781 | ) |
Issuance of non-recourse debt | 3,580 |
| | 1,509 |
|
Repayments of non-recourse debt | (2,978 | ) | | (1,139 | ) |
Payments for financing fees | (69 | ) | | (32 | ) |
Distributions to noncontrolling interests | (255 | ) | | (199 | ) |
Contributions from noncontrolling interests and redeemable security holders | 15 |
| | 40 |
|
Dividends paid on AES common stock | (272 | ) | | (258 | ) |
Payments for financed capital expenditures | (126 | ) | | (186 | ) |
Other financing | (7 | ) | | 44 |
|
Net cash used in financing activities | (133 | ) | | (1,163 | ) |
Effect of exchange rate changes on cash, cash equivalents and restricted cash | (28 | ) | | (50 | ) |
(Increase) decrease in cash, cash equivalents and restricted cash of discontinued operations and held-for-sale businesses | (65 | ) | | 56 |
|
Total increase (decrease) in cash, cash equivalents and restricted cash | (162 | ) | | 334 |
|
Cash, cash equivalents and restricted cash, beginning | 2,003 |
| | 1,788 |
|
Cash, cash equivalents and restricted cash, ending | $ | 1,841 |
| | $ | 2,122 |
|
SUPPLEMENTAL DISCLOSURES: | | | |
Cash payments for interest, net of amounts capitalized | $ | 681 |
| | $ | 683 |
|
Cash payments for income taxes, net of refunds | 296 |
| | 313 |
|
SCHEDULE OF NONCASH INVESTING AND FINANCING ACTIVITIES: | | | |
Refinancing of non-recourse debt at Mong Duong (see Note 8) | 1,081 |
| | — |
|
Non-cash contributions to equity affiliates (see Notes 7 and 19) | 62 |
| | 20 |
|
Partial reinvestment of consideration from the sPower transaction (see Note 7) | 58 |
| | — |
|
Non-cash exchange of debentures for the acquisition of the Guaimbê Solar Complex (see Note 20) | — |
| | 119 |
|
Non-cash acquisition of intangible assets | — |
| | 14 |
|
See Notes to Condensed Consolidated Financial Statements.
THE AES CORPORATION
Notes to Condensed Consolidated Financial Statements
For the Three and Nine Months Ended September 30, 2019 and 2018
(Unaudited)
1. FINANCIAL STATEMENT PRESENTATION
Consolidation — In this Quarterly Report the terms “AES,” “the Company,” “us” or “we” refer to the consolidated entity, including its subsidiaries and affiliates. The terms “The AES Corporation” or “the Parent Company” refer only to the publicly held holding company, The AES Corporation, excluding its subsidiaries and affiliates. Furthermore, VIEs in which the Company has a variable interest have been consolidated where the Company is the primary beneficiary. Investments in which the Company has the ability to exercise significant influence, but not control, are accounted for using the equity method of accounting. All intercompany transactions and balances have been eliminated in consolidation.
Interim Financial Presentation — The accompanying unaudited condensed consolidated financial statements and footnotes have been prepared in accordance with GAAP, as contained in the FASB ASC, for interim financial information and Article 10 of Regulation S-X issued by the SEC. Accordingly, they do not include all the information and footnotes required by GAAP for annual fiscal reporting periods. In the opinion of management, the interim financial information includes all adjustments of a normal recurring nature necessary for a fair presentation of the results of operations, financial position, comprehensive income, changes in equity and cash flows. The results of operations for the three and nine months ended September 30, 2019, are not necessarily indicative of expected results for the year ending December 31, 2019. The accompanying condensed consolidated financial statements are unaudited and should be read in conjunction with the 2018 audited consolidated financial statements and notes thereto, which are included in the 2018 Form 10-K filed with the SEC on February 26, 2019 (the “2018 Form 10-K”).
Cash, Cash Equivalents, and Restricted Cash — The following table provides a summary of cash, cash equivalents, and restricted cash amounts reported on the Condensed Consolidated Balance Sheet that reconcile to the total of such amounts as shown on the Condensed Consolidated Statements of Cash Flows (in millions):
|
| | | | | | | |
| September 30, 2019 | | December 31, 2018 |
Cash and cash equivalents | $ | 1,145 |
| | $ | 1,166 |
|
Restricted cash | 455 |
| | 370 |
|
Debt service reserves and other deposits | 241 |
| | 467 |
|
Cash, Cash Equivalents, and Restricted Cash | $ | 1,841 |
| | $ | 2,003 |
|
New Accounting Pronouncements Adopted in 2019 — The following table provides a brief description of recent accounting pronouncements that had an impact on the Company’s consolidated financial statements. Accounting pronouncements not listed below were assessed and determined to be either not applicable or did not have a material impact on the Company’s consolidated financial statements.
|
| | | |
New Accounting Standards Adopted |
ASU Number and Name | Description | Date of Adoption | Effect on the financial statements upon adoption |
2018-02, Income Statement — Reporting Comprehensive Income (Topic 220), Reclassification of Certain Tax Effects from AOCI | This amendment allows a reclassification of the stranded tax effects resulting from the implementation of the Tax Cuts and Jobs Act from AOCI to retained earnings at the election of the filer. Because this amendment only relates to the reclassification of the income tax effects of the Tax Cuts and Jobs Act, the underlying guidance that requires that the effect of a change in tax laws or rates be included in income from continuing operations is not affected. | January 1, 2019 | The Company has not elected to reclassify any amounts to retained earnings. The Company’s accounting policy for releasing the income tax effects from AOCI occurs on a portfolio basis. |
2017-12, Derivatives and Hedging (Topic 815): Targeted improvements to Accounting for Hedging Activities | The standard updates the hedge accounting model to expand the ability to hedge nonfinancial and financial risk components, reduce complexity, and ease certain documentation and assessment requirements. When facts and circumstances are the same as at the previous quantitative test, a subsequent quantitative effectiveness test is not required. The standard also eliminates the requirement to separately measure and report hedge ineffectiveness. For cash flow hedges, this means that the entire change in the fair value of a hedging instrument will be recorded in other comprehensive income and amounts deferred will be reclassified to earnings in the same income statement line as the hedged item.
Transition method: modified retrospective with the cumulative effect adjustment recorded to the opening balance of retained earnings as of the initial application date. Prospective for presentation and disclosures. | January 1, 2019
| The adoption of this standard resulted in a $4 million decrease to accumulated deficit. |
|
| | | |
2014-09, 2015-14, 2016-08, 2016-10, 2016-12, 2016-20, 2017-10, 2017-13, Revenue from Contracts with Customers (Topic 606)
| ASC 606 was adopted by sPower on January 1, 2019. sPower was not required to adopt ASC 606 using the public adoption date, as sPower is an equity method investee that meets the definition of a public business entity only by virtue of the inclusion of its summarized financial information in the Company’s SEC filings. Under the previous revenue standard, the payment received by sPower for the transfer of Incentive Tax Credits related to projects was deferred and recognized in revenue over time. Under ASC 606, this payment is recognized at a point in time. | January 1, 2019 | The adoption of this standard resulted in a $6 million decrease to accumulated deficit attributable to the AES Corporation stockholders’ equity. |
2016-02, 2018-01, 2018-10, 2018-11, 2018-20, 2019-01, Leases (Topic 842) | See discussion of the ASU below. | January 1, 2019 | See impact upon adoption of the standard below. |
On January 1, 2019, the Company adopted ASC 842 Leases and its subsequent corresponding updates (“ASC 842”). Under this standard, lessees are required to recognize assets and liabilities for most leases on the balance sheet, and recognize expenses in a manner similar to the prior accounting method. For lessors, the guidance modifies the lease classification criteria and the accounting for sales-type and direct financing leases. The guidance eliminates previous real estate-specific provisions.
Under ASC 842, fewer of our contracts contain a lease. However, due to the elimination of the real estate-specific guidance and changes to certain lessor classification criteria, more leases qualify as sales-type leases and direct financing leases. Under these two models, a lessor derecognizes the asset and recognizes a lease receivable. According to ASC 842, the lease receivable includes the fair value of the asset after the contract period, but does not include variable payments such as margin on the sale of energy. Therefore, the lease receivable could be significantly different than the carrying amount of the underlying asset at lease commencement. In such circumstances, the difference between the initially recognized lease receivable and the carrying amount of the underlying asset is recognized as a gain/loss at lease commencement.
During the course of adopting ASC 842, the Company applied various practical expedients including:
| |
• | The package of practical expedients (applied to all leases) that allowed lessees and lessors not to reassess: |
| |
a. | whether any expired or existing contracts are or contain leases, |
| |
b. | lease classification for any expired or existing leases, and |
| |
c. | whether initial direct costs for any expired or existing leases qualify for capitalization under ASC 842. |
| |
• | The transition practical expedient related to land easements, allowing us to carry forward our accounting treatment for land easements on existing agreements, and |
| |
• | The transition practical expedient for lessees that allowed businesses to not separate lease and non-lease components. The Company applied the practical expedient to all classes of underlying assets when valuing right-of-use assets and lease liabilities. Contracts where the Company is the lessor were separated between the lease and non-lease components. |
The Company applied the modified retrospective method of adoption and elected to continue to apply the guidance in ASC 840 Leases to the comparative periods presented in the year of adoption. Under this transition method, the Company applied the transition provisions starting at the date of adoption. The cumulative effect of the adoption of ASC 842 on our January 1, 2019 Condensed Consolidated Balance Sheet was as follows (in millions):
|
| | | | | | | | | | | |
Condensed Consolidated Balance Sheet | Balance at December 31, 2018 | | Adjustments Due to ASC 842 | | Balance at January 1, 2019 |
Assets | | | | | |
Other noncurrent assets | $ | 1,514 |
| | $ | 253 |
| | $ | 1,767 |
|
Liabilities | | | | | |
Accrued and other liabilities | 962 |
| | 27 |
| | 989 |
|
Other noncurrent liabilities | 2,723 |
| | 226 |
| | 2,949 |
|
The primary impact of adoption was due to the recognition of a right-of-use-asset and lease liability for an operating land lease in Panama associated with the Colon LNG power plant and regasification terminal.
New Accounting Pronouncements Issued But Not Yet Effective — The following table provides a brief description of recent accounting pronouncements that could have a material impact on the Company’s consolidated financial statements once adopted. Accounting pronouncements not listed below were assessed and determined to be either not applicable or are expected to have no material impact on the Company’s consolidated financial statements.
|
| | | |
New Accounting Standards Issued But Not Yet Effective |
ASU Number and Name | Description | Date of Adoption | Effect on the financial statements upon adoption |
2016-13, 2018-19, 2019-04, 2019-05, Financial Instruments — Credit Losses (Topic 326): Measurement of Credit Losses on Financial Instruments | See discussion of the ASU below.
| January 1, 2020. Early adoption is permitted only as of January 1, 2019. | The Company will adopt the standard on January 1, 2020; see below for the evaluation of the impact of the adoption on the consolidated financial statements. |
ASU 2016-13 and its subsequent corresponding updates will update the impairment model for financial assets measured at amortized cost, known as the Current Expected Credit Loss (“CECL”) model. For trade and other receivables, held-to-maturity debt securities, loans and other instruments, entities will be required to use a new forward-looking "expected loss" model that generally will result in the earlier recognition of allowance for losses. For available-for-sale debt securities with unrealized losses, entities will measure credit losses as it is done today, except that unrealized losses due to credit-related factors will be recognized as an allowance on the balance sheet with a corresponding adjustment to earnings in the income statement. There are various transition methods available upon adoption.
The Company is currently evaluating the impact of adopting the standard on its consolidated financial statements; however, it is expected that the new current expected credit loss model will primarily impact the calculation of the Company’s expected credit losses on $1.5 billion in gross trade accounts receivable, the $1.4 billion loan receivable at Mong Duong, and $65 million in financing receivables in Argentina. Estimated credit losses, if material, will be presented on the face of the balance sheet as an allowance that reduces the amortized cost basis of affected financial assets. The standard will also impact the presentation of expected credit-related losses (if any) for the Company’s $265 million of available-for-sale debt securities, which will be presented parenthetically as an allowance on the consolidated balance sheet.
2. INVENTORY
The following table summarizes the Company’s inventory balances as of the periods indicated (in millions):
|
| | | | | | | |
| September 30, 2019 | | December 31, 2018 |
Fuel and other raw materials | $ | 236 |
| | $ | 300 |
|
Spare parts and supplies | 259 |
| | 277 |
|
Total | $ | 495 |
| | $ | 577 |
|
3. ASSET RETIREMENT OBLIGATION
The Company uses the cost approach to determine the initial value of ARO liabilities, which is estimated by discounting expected cash outflows to their present value using market-based rates at the initial recording of the liabilities. Cash outflows are based on the approximate future disposal costs as determined by market information, historical information or other management estimates. Subsequent downward revisions of ARO liabilities are discounted using the market-based rates that existed when the liability was initially recognized.
During the nine months ended September 30, 2019, the Company increased the asset retirement obligation and corresponding asset at IPL by $80 million. This reflects an increase to estimated ash pond closure costs, including groundwater remediation as required by the EPA under the Resource Conservation and Recovery Act.
In March 2019, the Company decreased the asset retirement obligation at DPL by $23 million, resulting in a reduction to Cost of Sales on the Condensed Consolidated Statement of Operations as the related plants are no longer in service. This decrease was due to reductions in estimated closure costs associated with ash ponds and landfills.
4. FAIR VALUE
The fair value of current financial assets and liabilities, debt service reserves and other deposits approximate their reported carrying amounts. The estimated fair values of the Company’s assets and liabilities have been determined using available market information. By virtue of these amounts being estimates and based on hypothetical transactions to sell assets or transfer liabilities, the use of different market assumptions and/or estimation methodologies may have a material effect on the estimated fair value amounts. For further information on our valuation techniques and policies, see Note 4—Fair Value in Item 8.—Financial Statements and Supplementary Data of our 2018 Form 10-K.
Recurring Measurements — The following table presents, by level within the fair value hierarchy, the Company’s financial assets and liabilities that were measured at fair value on a recurring basis as of the dates indicated (in millions). For the Company’s investments in marketable debt securities, the security classes presented are determined based on the nature and risk of the security and are consistent with how the Company manages, monitors and measures its marketable securities:
|
| | | | | | | | | | | | | | | | | | | | | | | | | | | | | | | |
| September 30, 2019 | | December 31, 2018 |
| Level 1 | | Level 2 | | Level 3 | | Total | | Level 1 | | Level 2 | | Level 3 | | Total |
Assets | | | | | | | | | | | | | | | |
DEBT SECURITIES: | | | | | | | | | | | | | | | |
Available-for-sale: | | | | | | | | | | | | | | | |
Unsecured debentures | $ | — |
| | $ | — |
| | $ | — |
| | $ | — |
| | $ | — |
| | $ | 5 |
| | $ | — |
| | $ | 5 |
|
Certificates of deposit | — |
| | 265 |
| | — |
| | 265 |
| | — |
| | 243 |
| | — |
| | 243 |
|
Total debt securities | — |
| | 265 |
| | — |
| | 265 |
| | — |
| | 248 |
| | — |
| | 248 |
|
EQUITY SECURITIES: | | | | | | | | | | | | | | | |
Mutual funds | 21 |
| | 58 |
| | — |
| | 79 |
| | 19 |
| | 49 |
| | — |
| | 68 |
|
Total equity securities | 21 |
| | 58 |
| | — |
| | 79 |
| | 19 |
| | 49 |
| | — |
| | 68 |
|
DERIVATIVES: | | | | | | | | | | | | | | | |
Interest rate derivatives | — |
| | 6 |
| | — |
| | 6 |
| | — |
| | 28 |
| | 1 |
| | 29 |
|
Cross-currency derivatives | — |
| | — |
| | — |
| | — |
| | — |
| | 6 |
| | — |
| | 6 |
|
Foreign currency derivatives | — |
| | 28 |
| | 113 |
| | 141 |
| | — |
| | 18 |
| | 199 |
| | 217 |
|
Commodity derivatives | — |
| | 31 |
| | 2 |
| | 33 |
| | — |
| | 6 |
| | 4 |
| | 10 |
|
Total derivatives — assets | — |
| | 65 |
| | 115 |
| | 180 |
| | — |
| | 58 |
| | 204 |
| | 262 |
|
TOTAL ASSETS | $ | 21 |
| | $ | 388 |
| | $ | 115 |
| | $ | 524 |
| | $ | 19 |
| | $ | 355 |
| | $ | 204 |
| | $ | 578 |
|
Liabilities | | | | | | | | | | | | | | | |
DERIVATIVES: | | | | | | | | | | | | | | | |
Interest rate derivatives | $ | — |
| | $ | 266 |
| | $ | 233 |
| | $ | 499 |
| | $ | — |
| | $ | 67 |
| | $ | 141 |
| | $ | 208 |
|
Cross-currency derivatives | — |
| | 3 |
| | 6 |
| | 9 |
| | — |
| | 5 |
| | — |
| | 5 |
|
Foreign currency derivatives | — |
| | 34 |
| | — |
| | 34 |
| | — |
| | 41 |
| | — |
| | 41 |
|
Commodity derivatives | — |
| | 20 |
| | 3 |
| | 23 |
| | — |
| | 3 |
| | — |
| | 3 |
|
Total derivatives — liabilities | — |
| | 323 |
| | 242 |
| | 565 |
| | — |
| | 116 |
| | 141 |
| | 257 |
|
TOTAL LIABILITIES | $ | — |
| | $ | 323 |
| | $ | 242 |
| | $ | 565 |
| | $ | — |
| | $ | 116 |
| | $ | 141 |
| | $ | 257 |
|
As of September 30, 2019, all AFS debt securities had stated maturities within one year. For the three and nine months ended September 30, 2019 and 2018, no other-than-temporary impairments of marketable securities were recognized in earnings or Other Comprehensive Income. Gains and losses on the sale of investments are determined using the specific-identification method. The following table presents gross proceeds from the sale of AFS securities during the periods indicated (in millions):
|
| | | | | | | | | | | | | | | |
| Three Months Ended September 30, | | Nine Months Ended September 30, |
| 2019 | | 2018 | | 2019 | | 2018 |
Gross proceeds from sale of AFS securities | $ | 193 |
| | $ | 713 |
| | $ | 517 |
| | $ | 1,127 |
|
The following tables present a reconciliation of net derivative assets and liabilities measured at fair value on a recurring basis using significant unobservable inputs (Level 3) for the three and nine months ended September 30, 2019 and 2018 (presented net by type of derivative in millions). Transfers between Level 3 and Level 2 are determined as of the end of the reporting period and principally result from changes in the significance of unobservable inputs used to calculate the credit valuation adjustment.
|
| | | | | | | | | | | | | | | | | | | |
Three Months Ended September 30, 2019 | Interest Rate | | Cross Currency | | Foreign Currency | | Commodity | | Total |
Balance at July 1 | $ | (243 | ) | | $ | — |
| | $ | 192 |
| | $ | 4 |
| | $ | (47 | ) |
Total realized and unrealized gains (losses): | | | | | | | | | |
Included in earnings | — |
| | — |
| | (54 | ) | | (2 | ) | | (56 | ) |
Included in other comprehensive income — derivative activity | (37 | ) | | — |
| | (10 | ) | | — |
| | (47 | ) |
Included in regulatory (assets) liabilities |
|
| | — |
| | — |
| | (2 | ) | | (2 | ) |
Settlements | 2 |
| | — |
| | (15 | ) | | (1 | ) | | (14 | ) |
Transfers of assets/(liabilities), net into Level 3 | — |
| | (6 | ) | | — |
| | — |
| | (6 | ) |
Transfers of (assets)/liabilities, net out of Level 3 | 45 |
| | — |
| | — |
| | — |
| | 45 |
|
Balance at September 30 | $ | (233 | ) | | $ | (6 | ) | | $ | 113 |
| | $ | (1 | ) | | $ | (127 | ) |
Total losses for the period included in earnings attributable to the change in unrealized gains (losses) relating to assets and liabilities held at the end of the period | $ | — |
| | $ | — |
| | $ | (62 | ) | | $ | (2 | ) | | $ | (64 | ) |
|
| | | | | | | | | | | | | | | | | | | |
Three Months Ended September 30, 2018 | Interest Rate | | Cross Currency | | Foreign Currency | | Commodity | | Total |
Balance at July 1 | $ | (111 | ) | | $ | — |
| | $ | 219 |
| | $ | 10 |
| | $ | 118 |
|
Total realized and unrealized gains (losses): | | | | | | | | | |
Included in other comprehensive income — derivative activity | 12 |
| | — |
| | — |
| | — |
| | 12 |
|
Included in regulatory (assets) liabilities | — |
| | — |
| | — |
| | (2 | ) | | (2 | ) |
Settlements | 3 |
| | — |
| | 2 |
| | — |
| | 5 |
|
Balance at September 30 | $ | (96 | ) | | $ | — |
| | $ | 221 |
| | $ | 8 |
| | $ | 133 |
|
Total gains for the period included in earnings attributable to the change in unrealized gains (losses) relating to assets and liabilities held at the end of the period | $ | 1 |
| | $ | — |
| | $ | 2 |
| | $ | — |
| | $ | 3 |
|
|
| | | | | | | | | | | | | | | | | | | |
Nine Months Ended September 30, 2019 | Interest Rate | | Cross Currency | | Foreign Currency | | Commodity | | Total |
Balance at January 1 | $ | (140 | ) | | $ | — |
| | $ | 199 |
| | $ | 4 |
| | $ | 63 |
|
Total realized and unrealized gains (losses): | | | | | | | | |
|
Included in earnings | (1 | ) | | — |
| | (52 | ) | | (2 | ) | | (55 | ) |
Included in other comprehensive income — derivative activity | (113 | ) | | — |
| | (10 | ) | | — |
| | (123 | ) |
Included in regulatory (assets) liabilities | — |
| | — |
| | — |
| | (3 | ) | | (3 | ) |
Settlements | 5 |
| | — |
| | (24 | ) | | — |
| | (19 | ) |
Transfers of assets/(liabilities), net into Level 3 | (32 | ) | | (6 | ) | | — |
| | — |
| | (38 | ) |
Transfers of (assets)/liabilities, net out of Level 3 | 48 |
| | — |
| | — |
| | — |
| | 48 |
|
Balance at September 30 | $ | (233 | ) | | $ | (6 | ) | | $ | 113 |
| | $ | (1 | ) | | $ | (127 | ) |
Total losses for the period included in earnings attributable to the change in unrealized gains (losses) relating to assets and liabilities held at the end of the period | $ | — |
| | $ | — |
| | $ | (69 | ) | | $ | (2 | ) | | $ | (71 | ) |
|
| | | | | | | | | | | | | | | | | | | |
Nine Months Ended September 30, 2018 | Interest Rate | | Cross Currency | | Foreign Currency | | Commodity | | Total |
Balance at January 1 | $ | (151 | ) | | $ | — |
| | $ | 240 |
| | $ | 4 |
| | $ | 93 |
|
Total realized and unrealized gains (losses): | | | | | | | | | |
Included in earnings | 28 |
| | — |
| | (3 | ) | | 1 |
| | 26 |
|
Included in other comprehensive income — derivative activity | 48 |
| | — |
| | — |
| | — |
| | 48 |
|
Included in regulatory (assets) liabilities | — |
| | — |
| | — |
| | 6 |
| | 6 |
|
Settlements | 12 |
| | — |
| | (16 | ) | | (3 | ) | | (7 | ) |
Transfers of assets/(liabilities), net into Level 3 | 1 |
| | — |
| | — |
| | — |
| | 1 |
|
Transfers of (assets)/liabilities, net out of Level 3 | (34 | ) | | — |
| | — |
| | — |
| | (34 | ) |
Balance at September 30 | $ | (96 | ) | | $ | — |
| | $ | 221 |
| | $ | 8 |
| | $ | 133 |
|
Total gains (losses) for the period included in earnings attributable to the change in unrealized gains (losses) relating to assets and liabilities held at the end of the period | $ | 32 |
| | $ | — |
| | $ | (19 | ) | | $ | 1 |
| | $ | 14 |
|
The following table summarizes the significant unobservable inputs used for Level 3 derivative assets (liabilities) as of September 30, 2019 (in millions, except range amounts):
|
| | | | | | | | | |
Type of Derivative | | Fair Value | | Unobservable Input | | Amount or Range (Weighted Average) |
Interest rate | | $ | (233 | ) | | Subsidiaries’ credit spreads | | 1.78% - 4.38% (3.9%) |
|
Cross-currency | | (6 | ) | | Subsidiaries’ credit spreads | | 2.4 | % |
Foreign currency: | | | | | | |
Argentine peso | | 113 |
| | Argentine peso to U.S. dollar currency exchange rate after one year | | 61 - 777 (408) |
|
Commodity: | | | | | | |
Other | | (1 | ) | | | | |
Total | | $ | (127 | ) | | | | |
For interest rate derivatives and foreign currency derivatives, increases (decreases) in the estimates of the Company’s own credit spreads would decrease (increase) the value of the derivatives in a liability position. For foreign currency derivatives, increases (decreases) in the estimate of the above exchange rate would increase (decrease) the value of the derivative.
Nonrecurring Measurements
The Company measures fair value using the applicable fair value measurement guidance. Impairment expense is measured by comparing the fair value at the evaluation date to the then-latest available carrying amount. The following table summarizes our major categories of assets measured at fair value on a nonrecurring basis and their level within the fair value hierarchy (in millions):
|
| | | | | | | | | | | | | | | | | | | | | |
| Measurement Date | | Carrying Amount (1) | | Fair Value | | Pre-tax Loss |
Nine Months Ended September 30, 2019 | | Level 1 | | Level 2 | | Level 3 | |
Dispositions and held-for-sale businesses: (2) | | | | | | | | | | | |
Kilroot and Ballylumford | 04/12/2019 | | $ | 232 |
| | $ | — |
| | $ | 118 |
| | $ | — |
| | $ | 115 |
|
|
| | | | | | | | | | | | | | | | | | | | | |
| Measurement Date | | Carrying Amount (1) | | Fair Value | | Pre-tax Loss |
Nine Months Ended September 30, 2018 | | Level 1 | | Level 2 | | Level 3 | |
Long-lived assets held and used: (3) | | | | | | | | | | | |
Shady Point | 09/30/2018 | | $ | 185 |
| | $ | — |
| | $ | — |
| | $ | 33 |
| | $ | 156 |
|
Equity method investments: | | | | | | | | | | | |
Elsta | 09/30/2018 | | 21 |
| | — |
| | 16 |
| | — |
| | 5 |
|
_____________________________
| |
(1) | Represents the carrying values at the dates of measurement, before fair value adjustment. |
| |
(2) | Per the Company’s policy, pre-tax loss is limited to the impairment of long-lived assets. Any additional loss will be recognized on completion of the sale. See Note 19—Held-for-Sale and Dispositions for further information. |
| |
(3) | See Note 16—Asset Impairment Expense for further information. |
Financial Instruments not Measured at Fair Value in the Condensed Consolidated Balance Sheets
The following table presents (in millions) the carrying amount, fair value and fair value hierarchy of the Company’s financial assets and liabilities that are not measured at fair value in the Condensed Consolidated Balance Sheets as of September 30, 2019 and December 31, 2018, but for which fair value is disclosed:
|
| | | | | | | | | | | | | | | | | | | | |
| | September 30, 2019 |
| | Carrying Amount | | Fair Value |
| | Total | | Level 1 | | Level 2 | | Level 3 |
Assets: | Accounts receivable — noncurrent (1) | $ | 62 |
| | $ | 128 |
| | $ | — |
| | $ | — |
| | $ | 128 |
|
Liabilities: | Non-recourse debt | 16,205 |
| | 16,334 |
| | — |
| | 14,402 |
| | 1,932 |
|
| Recourse debt | 3,561 |
| | 3,692 |
| | — |
| | 3,692 |
| | — |
|
|
| | | | | | | | | | | | | | | | | | | | |
| | December 31, 2018 |
| | Carrying Amount | | Fair Value |
| | Total | | Level 1 | | Level 2 | | Level 3 |
Assets: | Accounts receivable — noncurrent (1) | $ | 100 |
| | $ | 209 |
| | $ | — |
| | $ | — |
| | $ | 209 |
|
Liabilities: | Non-recourse debt | 15,645 |
| | 16,225 |
| | — |
| | 13,524 |
| | 2,701 |
|
| Recourse debt | 3,655 |
| | 3,621 |
| | — |
| | 3,621 |
| | — |
|
_____________________________
| |
(1) | These amounts primarily relate to amounts due from CAMMESA, the administrator of the wholesale electricity market in Argentina, and are included in Other noncurrent assets in the accompanying Condensed Consolidated Balance Sheets. The fair value and carrying amount of these receivables exclude VAT of $11 million and $16 million as of September 30, 2019 and December 31, 2018, respectively. |
5. DERIVATIVE INSTRUMENTS AND HEDGING ACTIVITIES
For further information on the Company’s derivative and hedge accounting policies, see Note 1—General and Summary of Significant Accounting Policies—Derivatives and Hedging Activities of Item 8.—Financial Statements and Supplementary Data in the 2018 Form 10-K.
Volume of Activity — The following tables present the Company’s maximum notional (in millions) over the remaining contractual period by type of derivative as of September 30, 2019, regardless of whether they are in qualifying cash flow hedging relationships, and the dates through which the maturities for each type of derivative range:
|
| | | | | | |
Interest Rate and Foreign Currency Derivatives | | Maximum Notional Translated to USD | | Latest Maturity |
Interest rate (LIBOR and EURIBOR) | | $ | 5,897 |
| | 2044 |
Cross-currency swaps (Chilean Unidad de Fomento and Chilean peso) | | 297 |
| | 2029 |
Foreign Currency: | | | | |
Argentine peso | | 32 |
| | 2026 |
Chilean peso | | 234 |
| | 2022 |
Colombian peso | | 161 |
| | 2022 |
Brazilian real | | 29 |
| | 2019 |
Others, primarily with weighted average remaining maturities of a year or less | | 180 |
| | 2021 |
|
| | | | | |
Commodity Derivatives | | Maximum Notional | | Latest Maturity |
Natural Gas (in MMBtu) | | 54 |
| | 2020 |
Power (in MWhs) | | 6 |
| | 2020 |
Coal (in Tons or Metric Tons) | | 10 |
| | 2027 |
Accounting and Reporting — Assets and Liabilities — The following tables present the fair value of assets and liabilities related to the Company’s derivative instruments as of September 30, 2019 and December 31, 2018 (in millions):
|
| | | | | | | | | | | | | | | | | | | | | | | |
Fair Value | September 30, 2019 | | December 31, 2018 |
Assets | Designated | | Not Designated | | Total | | Designated | | Not Designated | | Total |
Interest rate derivatives | $ | 6 |
| | $ | — |
| | $ | 6 |
| | $ | 29 |
| | $ | — |
| | $ | 29 |
|
Cross-currency derivatives | — |
| | — |
| | — |
| | 6 |
| | — |
| | 6 |
|
Foreign currency derivatives | 35 |
| | 106 |
| | 141 |
| | — |
| | 217 |
| | 217 |
|
Commodity derivatives | — |
| | 33 |
| | 33 |
| | — |
| | 10 |
| | 10 |
|
Total assets | $ | 41 |
| | $ | 139 |
| | $ | 180 |
| | $ | 35 |
| | $ | 227 |
| | $ | 262 |
|
Liabilities | | | | | | | | | | | |
Interest rate derivatives | $ | 489 |
| | $ | 10 |
| | $ | 499 |
| | $ | 205 |
| | $ | 3 |
| | $ | 208 |
|
Cross-currency derivatives | 9 |
| | — |
| | 9 |
| | 5 |
| | — |
| | 5 |
|
Foreign currency derivatives | 19 |
| | 15 |
| | 34 |
| | 28 |
| | 13 |
| | 41 |
|
Commodity derivatives | 1 |
| | 22 |
| | 23 |
| | — |
| | 3 |
| | 3 |
|
Total liabilities | $ | 518 |
| | $ | 47 |
| | $ | 565 |
| | $ | 238 |
| | $ | 19 |
| | $ | 257 |
|
|
| | | | | | | | | | | | | | | |
| September 30, 2019 | | December 31, 2018 |
Fair Value | Assets | | Liabilities | | Assets | | Liabilities |
Current | $ | 71 |
| | $ | 119 |
| | $ | 75 |
| | $ | 51 |
|
Noncurrent | 109 |
| | 446 |
| | 187 |
| | 206 |
|
Total | $ | 180 |
| | $ | 565 |
| | $ | 262 |
| | $ | 257 |
|
As of September 30, 2019 and December 31, 2018, all derivative instruments subject to credit risk-related contingent features were in an asset position.
Earnings and Other Comprehensive Income (Loss) — The following table presents the pre-tax gains (losses) recognized in AOCL and earnings related to all derivative instruments for the periods indicated (in millions):
|
| | | | | | | | | | | | | | | |
| Three Months Ended September 30, | | Nine Months Ended September 30, |
2019 | | 2018 | | 2019 | | 2018 |
Cash flow hedges | | | | | | | |
Gains (losses) recognized in AOCL | | | | | | | |
Interest rate derivatives | $ | (186 | ) | | $ | 26 |
| | $ | (450 | ) | | $ | 81 |
|
Cross-currency derivatives | (19 | ) | | 3 |
| | (10 | ) | | (2 | ) |
Foreign currency derivatives | (20 | ) | | (11 | ) | | (14 | ) | | (44 | ) |
Commodity derivatives | 3 |
| | — |
| | 2 |
| | — |
|
Total | $ | (222 | ) | | $ | 18 |
| | $ | (472 | ) | | $ | 35 |
|
Losses reclassified from AOCL into earnings | | | | | | | |
Interest rate derivatives | $ | (8 | ) | | $ | (12 | ) | | $ | (25 | ) | | $ | (42 | ) |
Cross-currency derivatives | (11 | ) | | (8 | ) | | (5 | ) | | (26 | ) |
Foreign currency derivatives | (4 | ) | | (8 | ) | | (15 | ) | | (9 | ) |
Commodity derivatives | — |
| | — |
| | — |
| | (5 | ) |
Total | $ | (23 | ) | | $ | (28 | ) | | $ | (45 | ) |
| $ | (82 | ) |
Loss reclassified from AOCL to earnings due to discontinuance of hedge accounting (1) | $ | — |
| | $ | — |
| | $ | 2 |
| | $ | — |
|
Gains (losses) recognized in earnings related to | | | | | | | |
Ineffective portion of cash flow hedges | $ | — |
| | $ | — |
| | $ | — |
| | $ | (3 | ) |
Not designated as hedging instruments: | | | | | | | |
Interest rate derivatives | (2 | ) | | — |
| | (6 | ) | | $ | — |
|
Foreign currency derivatives | (39 | ) | | (10 | ) | | (33 | ) | | 144 |
|
Commodity derivatives and other | (2 | ) | | 2 |
| | 2 |
| | 33 |
|
Total | $ | (43 | ) | | $ | (8 | ) | | $ | (37 | ) | | $ | 177 |
|
_____________________________
| |
(1) | Cash flow hedge was discontinued on a cross-currency swap because the underlying debt was prepaid. |
AOCL is expected to decrease pre-tax income from continuing operations for the twelve months ended September 30, 2020 by $77 million, primarily due to interest rate derivatives.
6. FINANCING RECEIVABLES
Receivables with contractual maturities of greater than one year are considered financing receivables. The Company’s financing receivables are primarily related to amended agreements or government resolutions that are due from CAMMESA, the administrator of the wholesale electricity market in Argentina. The following table presents financing receivables by country as of the dates indicated (in millions):
|
| | | | | | | |
| September 30, 2019 | | December 31, 2018 |
Argentina | $ | 65 |
| | $ | 93 |
|
Other | 8 |
| | 23 |
|
Total | $ | 73 |
| | $ | 116 |
|
Argentina — Collection of the principal and interest on these receivables is subject to various business risks and uncertainties, including, but not limited to, the operation of power plants which generate cash for payments of these receivables, regulatory changes that could impact the timing and amount of collections, and economic conditions in Argentina. The Company monitors these risks, including the credit ratings of the Argentine government, on a quarterly basis to assess the collectability of these receivables. The Company accrues interest on these receivables once the recognition criteria have been met. The Company’s collection estimates are based on assumptions that it believes to be reasonable, but are inherently uncertain. Actual future cash flows could differ from these estimates.
7. INVESTMENTS IN AND ADVANCES TO AFFILIATES
Summarized Financial Information — The following table summarizes financial information of the Company’s 50%-or-less-owned affiliates that are accounted for using the equity method (in millions):
|
| | | | | | | |
| Nine Months Ended September 30, |
50%-or-less-Owned Affiliates | 2019 | | 2018 |
Revenue | $ | 807 |
| | $ | 734 |
|
Operating margin | 87 |
| | 119 |
|
Net income (loss) | (65 | ) | | 36 |
|
Gas Natural del Este — In September 2019, AES Andres completed an agreement with Energas Group to establish a joint venture for the purpose of selling natural gas and related terminal services, storage, regasification, and transportation to customers in the Dominican Republic. Gas Natural del Este, a wholly-owned subsidiary of the
joint venture, acquired the Eastern Pipeline development project from AES Andres for total consideration of $55 million, resulting in a gain of $2 million. The transaction was considered a contribution of a nonfinancial asset in exchange for a noncontrolling interest in the joint venture. As the Company does not control the joint venture, it is accounted for as an equity method investment and is reported in the MCAC SBU reportable segment.
sPower — In April 2019, the Company closed on the sale of approximately 48% of its interest in a portfolio of sPower’s operating assets for $173 million, subject to customary purchase price adjustments, of which $58 million was used to pay down debt at sPower. This sale resulted in a pre-tax gain on sale of business interests of $28 million. After the sale, the Company’s ownership interest in this portfolio of sPower’s operating assets decreased from 50% to approximately 26%. The sPower equity method investment is reported in the US and Utilities SBU reportable segment.
Simple Energy — In April 2018, the Company invested $35 million in Simple Energy, a provider of utility-branded marketplaces and omni-channel instant rebates, accounted for as an equity method investment.
On July 1, 2019, Simple Energy merged with Tendril, a previously unrelated party, to form Uplight, a new company that offers a comprehensive platform for utility customer engagement. As part of this merger, the Company contributed its ownership interest in Simple Energy and $53 million of cash in exchange for an ownership interest in the merged company. This transaction resulted in a gain on sale of $14 million and a total investment in Uplight of $99 million. As the Company does not control Uplight, it is accounted for as an equity method investment and reported as part of Corporate and Other.
8. DEBT
Recourse Debt
In September 2019, the Company prepaid $343 million aggregate principal of its LIBOR + 1.75% existing senior secured term loan due in 2022 and $100 million of its 4.875% senior unsecured notes due in 2023. As a result of these transactions, the Company recognized a loss on extinguishment of debt of $5 million for the three and nine months ended September 30, 2019.
In March 2018, the Company purchased via tender offers $671 million aggregate principal of its existing 5.50% senior unsecured notes due in 2024 and $29 million of its existing 5.50% senior unsecured notes due in 2025. As a result of these transactions, the Company recognized a loss on extinguishment of debt of $44 million for the nine months ended September 30, 2018.
In March 2018, the Company issued $500 million aggregate principal of 4.00% senior notes due in 2021 and $500 million of 4.50% senior notes due in 2023. The Company used the proceeds from these issuances to purchase via tender offer in full the $228 million balance of its 8.00% senior notes due in 2020 and the $690 million balance of its 7.375% senior notes due in 2021. As a result of these transactions, the Company recognized a loss on extinguishment of debt of $125 million for the nine months ended September 30, 2018.
Non-Recourse Debt
During the nine months ended September 30, 2019, the Company’s subsidiaries had the following significant debt transactions: |
| | | | | | | | | | | | | | |
Subsidiary | | Transaction Period | | Issuances | | Settlements | | Loss on Extinguishment of Debt |
Southland (1) | | Q1, Q2, Q3 | | $ | 535 |
| | $ | — |
| | $ | — |
|
Gener (2) | | Q1, Q2 | | 550 |
| | (450 | ) | | (11 | ) |
DPL (3) | | Q2 | | 825 |
| | (835 | ) | | (43 | ) |
Tietê | | Q2 | | 561 |
| | (533 | ) | | (3 | ) |
Mong Duong (4) | | Q3 | | 1,120 |
| | (1,081 | ) | | (31 | ) |
Colon | | Q3 | | 610 |
| | (579 | ) | | (28 | ) |
_____________________________
| |
(1) | Issuances relate to the June 2017 long-term non-recourse debt financing to fund the Southland repowering construction projects and a September 2019 non-recourse bridge loan. |
| |
(2) | Repayments in June 2019 complete the tender offer initiated in March 2019 on existing notes. |
| |
(3) | Includes transactions at DPL and its subsidiary, DP&L. |
| |
(4) | Non-cash transaction via an equity affiliate. See below for further information. |
Mong Duong — In August 2019, Mong Duong refinanced $1.1 billion aggregate principal of its existing senior secured notes due in 2029 with variable interest rates ranging from LIBOR + 2.25% to LIBOR + 4.15% in exchange for a fixed rate loan with a newly formed SPV, accounted for as an equity affiliate, due in 2029 with interest rates that vary from 4.41% to 7.18%. This refinancing was a non-cash transaction as the SPV acquired all of the
outstanding rights and obligations of the original Mong Duong lenders. As a result of these transactions, the Company recognized a loss on extinguishment of debt of $31 million for the three and nine months ended September 30, 2019.
DP&L — In June 2019, DP&L issued $425 million aggregate principal of 3.95% First Mortgage Bonds due in 2049. The net proceeds from the issuance were used to prepay the outstanding principal of $435 million under its variable rate $445 million credit agreement due in 2022.
DPL — In April 2019, DPL issued $400 million aggregate principal of 4.35% senior unsecured notes due in 2029. The net proceeds from the issuance were used to redeem, at par, $400 million of the $780 million aggregate principal outstanding of its 7.25% senior unsecured notes due in 2021. As a result of these transactions, the Company recognized a loss on extinguishment of debt of $43 million for the nine months ended September 30, 2019.
Non-Recourse Debt in Default — The current portion of non-recourse debt includes the following subsidiary debt in default as of September 30, 2019 (in millions). |
| | | | | | | | | | |
Subsidiary | | Primary Nature of Default | | Debt in Default | | Net Assets |
AES Puerto Rico | | Covenant | | $ | 295 |
| | $ | 158 |
|
AES Ilumina (Puerto Rico) | | Covenant | | 33 |
| | 19 |
|
AES Jordan Solar (1) | | Covenant | | 13 |
| | 3 |
|
Total | | | | $ | 341 |
| | |
_____________________________
| |
(1) | Classified as current held-for-sale liability on the Condensed Consolidated Balance Sheets. |
The above defaults are not payment defaults. In Puerto Rico, the subsidiary non-recourse debt defaults were triggered by failure to comply with covenants or other requirements contained in the non-recourse debt documents due to the bankruptcy of the offtaker.
The AES Corporation’s recourse debt agreements include cross-default clauses that will trigger if a subsidiary or group of subsidiaries for which the non-recourse debt is in default provides 20% or more of the Parent Company’s total cash distributions from businesses for the four most recently completed fiscal quarters. As of September 30, 2019, the Company had no defaults which resulted in or were at risk of triggering a cross-default under the recourse debt of the Parent Company. In the event the Parent Company is not in compliance with the financial covenants of its senior secured revolving credit facility, restricted payments will be limited to regular quarterly shareholder dividends at the then-prevailing rate. Payment defaults and bankruptcy defaults would preclude the making of any restricted payments.
9. COMMITMENTS AND CONTINGENCIES
Guarantees, Letters of Credit and Commitments — In connection with certain project financings, acquisitions and dispositions, power purchases and other agreements, the Parent Company has expressly undertaken limited obligations and commitments, most of which will only be effective or will be terminated upon the occurrence of future events. In the normal course of business, the Parent Company has entered into various agreements, mainly guarantees and letters of credit, to provide financial or performance assurance to third parties on behalf of AES businesses. These agreements are entered into primarily to support or enhance the creditworthiness otherwise achieved by a business on a stand-alone basis, thereby facilitating the availability of sufficient credit to accomplish their intended business purposes. Most of the contingent obligations relate to future performance commitments which the Company or its businesses expect to fulfill within the normal course of business. The expiration dates of these guarantees vary from less than one year to more than 15 years.
The following table summarizes the Parent Company’s contingent contractual obligations as of September 30, 2019. Amounts presented in the following table represent the Parent Company’s current undiscounted exposure to guarantees and the range of maximum undiscounted potential exposure. The maximum exposure is not reduced by the amounts, if any, that could be recovered under the recourse or collateralization provisions in the guarantees.
|
| | | | | | | | | |
Contingent Contractual Obligations | | Amount (in millions) | | Number of Agreements | | Maximum Exposure Range for Individual Agreements (in millions) |
Guarantees and commitments | | $ | 633 |
| | 33 |
| | $0 — 157 |
Letters of credit under the unsecured credit facility | | 382 |
| | 10 |
| | $1 — 296 |
Letters of credit under the senior secured credit facility | | 32 |
| | 26 |
| | $0 — 15 |
Asset sale related indemnities (1) | | 12 |
| | 1 |
| | $12 |
Total | | $ | 1,059 |
| | 70 |
| | |
_____________________________
| |
(1) | Excludes normal and customary representations and warranties in agreements for the sale of assets (including ownership in associated legal entities) where the associated risk is considered to be nominal. |
During the nine months ended September 30, 2019, the Company paid letter of credit fees ranging from 1% to 3% per annum on the outstanding amounts of letters of credit.
Contingencies
Environmental — The Company periodically reviews its obligations as they relate to compliance with environmental laws, including site restoration and remediation. For the periods ended September 30, 2019 and December 31, 2018, the Company recognized liabilities of $4 million and $5 million for projected environmental remediation costs, respectively. Due to the uncertainties associated with environmental assessment and remediation activities, future costs of compliance or remediation could be higher or lower than the amount currently accrued. Moreover, where no liability has been recognized, it is reasonably possible that the Company may be required to incur remediation costs or make expenditures in amounts that could be material but could not be estimated as of September 30, 2019. In aggregate, the Company estimates the range of potential losses related to environmental matters, where estimable, to be up to $15 million. The amounts considered reasonably possible do not include amounts accrued as discussed above.
Litigation — The Company is involved in certain claims, suits and legal proceedings in the normal course of business. The Company accrues for litigation and claims when it is probable that a liability has been incurred and the amount of loss can be reasonably estimated. The Company has recognized aggregate liabilities for all claims of approximately $52 million and $53 million as of September 30, 2019 and December 31, 2018, respectively. These amounts are reported on the Condensed Consolidated Balance Sheets within Accrued and other liabilities and Other noncurrent liabilities. A significant portion of these accrued liabilities relate to regulatory matters and commercial disputes in international jurisdictions. There can be no assurance that these accrued liabilities will be adequate to cover all existing and future claims or that we will have the liquidity to pay such claims as they arise.
Where no accrued liability has been recognized, it is reasonably possible that some matters could be decided unfavorably to the Company and could require the Company to pay damages or make expenditures in amounts that could be material but could not be estimated as of September 30, 2019. The material contingencies where a loss is reasonably possible primarily include disputes with offtakers, suppliers and EPC contractors; alleged breaches of contract; alleged violation of laws and regulations; income tax and non-income tax matters with tax authorities; and regulatory matters. In aggregate, the Company estimates the range of potential losses, where estimable, related to these reasonably possible material contingencies to be between $49 million and $456 million. The amounts considered reasonably possible do not include the amounts accrued, as discussed above. These material contingencies do not include income tax-related contingencies which are considered part of our uncertain tax positions.
10. LEASES
LESSEE — The Company has operating and finance leases for energy production facilities, land, office space, transmission lines, vehicles and other operating equipment. Operating leases with an initial term of 12 months or less are not recorded on the balance sheet, but are expensed on a straight-line basis over the lease term. The Company’s leases do not contain any material residual value guarantees, restrictive covenants or subleases.
Right-of-use assets represent our right to use an underlying asset for the lease term while lease liabilities represent our obligation to make lease payments arising from the lease. Right-of-use assets and lease liabilities are recognized on commencement of the lease based on the present value of lease payments over the lease term. Generally, the rate implicit in the lease is not readily determinable, as such we use the subsidiaries’ incremental borrowing rate based on the information available at commencement date in determining the present value of lease payments. The Company determines discount rates based on its existing credit rates of its unsecured borrowings, which are then adjusted for the appropriate lease term and currency. The right-of-use asset also includes any lease payments made and excludes lease incentives that are paid or payable to the lessee at commencement. The lease term includes the option to extend or terminate the lease if it is reasonably certain that the option will be exercised.
Right-of-use assets are long term by nature. The following table summarizes the amounts recognized on the Condensed Consolidated Balance Sheets related to lease asset and liability balances as of the period indicated (in millions):
|
| | | | | | |
| | Consolidated Balance Sheet Classification | | September 30, 2019 |
Assets | | | | |
Right-of-use assets — finance leases | | Electric generation, distribution assets and other | | $ | 8 |
|
Right-of-use assets — operating leases | | Other noncurrent assets | | 300 |
|
Total right-of-use assets | | | | $ | 308 |
|
Liabilities | | | | |
Finance lease liabilities (current) | | Non-recourse debt (current liabilities) | | $ | 1 |
|
Finance lease liabilities (noncurrent) | | Non-recourse debt (noncurrent liabilities) | | 8 |
|
Total finance lease liabilities | | | | 9 |
|
Operating lease liabilities (current) | | Accrued and other liabilities | | 17 |
|
Operating lease liabilities (noncurrent) | | Other noncurrent liabilities | | 312 |
|
Total operating lease liabilities | | | | 329 |
|
Total lease liabilities | | | | $ | 338 |
|
The following table summarizes supplemental balance sheet information related to leases as of the period indicated:
|
| | |
Lease Term and Discount Rate | September 30, 2019 |
Weighted-average remaining lease term — finance leases | 16 years |
|
Weighted-average remaining lease term — operating leases | 12 years |
|
Weighted-average discount rate — finance leases | 9.15 | % |
Weighted-average discount rate — operating leases | 4.63 | % |
The following table summarizes the components of lease expense recognized in Cost of Sales on the Condensed Consolidated Statements of Operations for the period indicated (in millions):
|
| | | | | | | |
Components of Lease Cost | Three Months Ended September 30, 2019 | | Nine Months Ended September 30, 2019 |
Operating lease cost | $ | 11 |
| | $ | 38 |
|
Finance lease cost | | | |
Amortization of right-of-use assets | — |
| | 1 |
|
Interest on lease liabilities | 1 |
| | 1 |
|
Short-term lease costs | 11 |
| | 32 |
|
Total lease cost | $ | 23 |
| | $ | 72 |
|
Operating cash outflows from operating leases included in the measurement of lease liabilities were $11 million and $37 million for the three and nine months ended September 30, 2019, respectively.
The following table shows the future lease payments under operating and finance leases for continuing operations together with the present value of the net lease payments as of September 30, 2019 for the remainder of 2019 through 2023 and thereafter (in millions):
|
| | | | | | | |
| Maturity of Lease Liabilities |
| Finance Leases | | Operating Leases |
2019 | $ | 1 |
| | $ | 8 |
|
2020 | 2 |
| | 30 |
|
2021 | 1 |
| | 29 |
|
2022 | 1 |
| | 29 |
|
2023 | 1 |
| | 28 |
|
Thereafter | 9 |
| | 577 |
|
Total | 15 |
| | 701 |
|
Less: Imputed interest | (6 | ) | | (372 | ) |
Present value of lease payments | $ | 9 |
| | $ | 329 |
|
The following table shows the future minimum lease payments under operating and capital leases together with the present value of the net minimum lease payments under capital leases as of December 31, 2018 for 2019 through 2023 and thereafter (in millions) under the prior lease accounting guidance:
|
| | | | | | | |
| Future Commitments for |
December 31, | Capital Leases | | Operating Leases |
2019 | $ | 1 |
| | $ | 74 |
|
2020 | 1 |
| | 38 |
|
2021 | 1 |
| | 25 |
|
2022 | 1 |
| | 26 |
|
2023 | 1 |
| | 25 |
|
Thereafter | 7 |
| | 455 |
|
Total | $ | 12 |
| | $ | 643 |
|
Less: Imputed interest | (6 | ) | | |
Present value of total minimum lease payments | $ | 6 |
| | |
LESSOR — The Company has operating leases for certain generation contracts that contain provisions to provide capacity to a customer, which is a stand-ready obligation to deliver energy when required by the customer. Capacity payments are generally considered lease elements as they cover the majority of available output from a facility. The allocation of contract payments between the lease and non-lease elements is made at the inception of the lease. Lease payments from such contracts are recognized as lease revenue on a straight-line basis over the lease term, whereas variable lease payments are recognized when earned. Lease revenue included in the Condensed Consolidated Statements of Operations was $152 million and $460 million for the three and nine months ended September 30, 2019, of which $23 million and $59 million was related to variable lease payments. Underlying gross assets and accumulated depreciation of operating leases included in Property, Plant and Equipment on the Condensed Consolidated Balance Sheets were $3.2 billion and $1.1 billion, respectively, as of September 30, 2019.
The option to extend or terminate a lease is based on customary early termination provisions in the contract, such as payment defaults, bankruptcy, and lack of performance on energy delivery. The Company has not recognized any early terminations as of September 30, 2019. Certain leases may provide for variable lease payments based on usage or index-based (e.g., the U.S. Consumer Price Index) adjustments to lease payments.
The following table shows the future lease receipts as of September 30, 2019 for the remainder of 2019 through 2023 and thereafter (in millions):
|
| | | | | | | |
| Future Cash Receipts for |
| Sales-Type Leases | | Operating Leases |
2019 | $ | 1 |
| | $ | 128 |
|
2020 | 2 |
| | 497 |
|
2021 | 2 |
| | 469 |
|
2022 | 2 |
| | 454 |
|
2023 | 2 |
| | 390 |
|
Thereafter | 40 |
| | 1,810 |
|
Total | 49 |
| | $ | 3,748 |
|
Less: Imputed interest | (27 | ) | | |
Present value of total lease receipts | $ | 22 |
| | |
11. REDEEMABLE STOCK OF SUBSIDIARIES
The following table summarizes the Company’s redeemable stock of subsidiaries balances as of the periods indicated (in millions): |
| | | | | | | |
| September 30, 2019 | | December 31, 2018 |
IPALCO common stock | $ | 618 |
| | $ | 618 |
|
Colon quotas (1) | 208 |
| | 201 |
|
IPL preferred stock | 60 |
| | 60 |
|
Total redeemable stock of subsidiaries | $ | 886 |
| | $ | 879 |
|
_____________________________
| |
| Characteristics of quotas are similar to common stock. |
Colon — Our partner in Colon made capital contributions of $10 million and $34 million during the nine months ended September 30, 2019 and 2018, respectively. Any subsequent adjustments to allocate earnings and dividends to our partner, or measure the investment at fair value, will be classified as temporary equity each reporting period as it is probable that the shares will become redeemable.
12. EQUITY
Accumulated Other Comprehensive Loss — The following table summarizes the changes in AOCL by component, net of tax and NCI, for the nine months ended September 30, 2019 (in millions):
|
| | | | | | | | | | | | | | | |
| Foreign currency translation adjustment, net | | Unrealized derivative gains (losses), net | | Unfunded pension obligations, net | | Total |
Balance at the beginning of the period | $ | (1,721 | ) | | $ | (300 | ) | | $ | (50 | ) | | $ | (2,071 | ) |
Other comprehensive income (loss) before reclassifications | (46 | ) | | (299 | ) | | 2 |
| | (343 | ) |
Amount reclassified to earnings | 23 |
| | 33 |
| | 27 |
| | 83 |
|
Other comprehensive income (loss) | (23 | ) | | (266 | ) | | 29 |
| | (260 | ) |
Cumulative effect of a change in accounting principle | — |
| | (4 | ) | | — |
| | (4 | ) |
Balance at the end of the period | $ | (1,744 | ) | | $ | (570 | ) | | $ | (21 | ) | | $ | (2,335 | ) |
Reclassifications out of AOCL are presented in the following table. Amounts for the periods indicated are in millions and those in parentheses indicate debits to the Condensed Consolidated Statements of Operations:
|
| | | | | | | | | | | | | | | | | | |
AOCL Components | | Affected Line Item in the Condensed Consolidated Statements of Operations | | Three Months Ended September 30, | | Nine Months Ended September 30, |
| | 2019 | | 2018 | | 2019 | | 2018 |
Foreign currency translation adjustment, net | | |
| | Gain (loss) on disposal and sale of business interests | | $ | — |
| | $ | 3 |
| | $ | (23 | ) | | $ | 19 |
|
| | Net gain from disposal of discontinued operations | | — |
| | — |
| | — |
| | $ | (18 | ) |
| | Net income attributable to The AES Corporation | | $ | — |
| | $ | 3 |
| | $ | (23 | ) | | $ | 1 |
|
Derivative gains (losses), net | | | | | | | | |
| | Non-regulated revenue | | $ | — |
| | $ | (1 | ) | | $ | — |
| | $ | (6 | ) |
| | Non-regulated cost of sales | | (1 | ) | | (1 | ) | | (11 | ) | | (3 | ) |
| | Interest expense | | (8 | ) | | (11 | ) | | (23 | ) | | (38 | ) |
| | Gain (loss) on disposal and sale of business interests | | — |
| | — |
| | 1 |
| | — |
|
| | Foreign currency transaction gains (losses) | | (14 | ) | | (15 | ) | | (11 | ) | | (35 | ) |
| | Income from continuing operations before taxes and equity in earnings of affiliates | | (23 | ) | | (28 | ) | | (44 | ) | | (82 | ) |
| | Income tax expense | | 6 |
| | 7 |
| | 10 |
| | 15 |
|
| | Net equity in earnings (losses) of affiliates | | — |
| | — |
| | (2 | ) | | — |
|
| | Income from continuing operations | | (17 | ) | | (21 | ) | | (36 | ) | | (67 | ) |
| | Less: Income from continuing operations attributable to noncontrolling interests and redeemable stock of subsidiaries | | 2 |
| | 1 |
| | 3 |
| | 12 |
|
| | Net income attributable to The AES Corporation | | $ | (15 | ) | | $ | (20 | ) | | $ | (33 | ) | | $ | (55 | ) |
Amortization of defined benefit pension actuarial loss, net | | | | | | | | |
| | Other expense | | $ | — |
| | $ | (1 | ) | | $ | (1 | ) | | $ | (3 | ) |
| | Gain (loss) on disposal and sale of business interests | | — |
| | — |
| | (26 | ) | | — |
|
| | Income from continuing operations before taxes and equity in earnings of affiliates | | — |
| | (1 | ) | | (27 | ) | | (3 | ) |
| | Income from continuing operations | | — |
| | (1 | ) | | (27 | ) | | (3 | ) |
| | Net gain from disposal of discontinued operations | | — |
| | — |
| | — |
| | (2 | ) |
| | Net income | | — |
| | (1 | ) | | (27 | ) | | (5 | ) |
| | Net income attributable to The AES Corporation | | $ | — |
| | $ | (1 | ) | | $ | (27 | ) | | $ | (5 | ) |
Total reclassifications for the period, net of income tax and noncontrolling interests | | $ | (15 | ) | | $ | (18 | ) | | $ | (83 | ) | | $ | (59 | ) |
Common Stock Dividends — The Parent Company paid dividends of $0.1365 per outstanding share to its common stockholders during the first, second and third quarters of 2019 for dividends declared in December 2018, February 2019 and July 2019, respectively.
On October 4, 2019, the Board of Directors declared a quarterly common stock dividend of $0.1365 per share payable on November 15, 2019, to shareholders of record at the close of business on November 1, 2019.
13. SEGMENTS
The segment reporting structure uses the Company’s management reporting structure as its foundation to reflect how the Company manages the businesses internally and is mainly organized by geographic regions, which provides a socio-political-economic understanding of our business. The management reporting structure is organized by four SBUs led by our President and Chief Executive Officer: US and Utilities, South America, MCAC, and Eurasia SBUs. Using the accounting guidance on segment reporting, the Company determined that its four operating segments are aligned with its four reportable segments corresponding to its SBUs.
Corporate and Other — Included in “Corporate and Other” are the results of the AES self-insurance company and certain equity affiliates, corporate overhead costs which are not directly associated with the operations of our four reportable segments, and certain intercompany charges such as self-insurance premiums which are fully eliminated in consolidation.
The Company uses Adjusted PTC as its primary segment performance measure. Adjusted PTC, a non-GAAP measure, is defined by the Company as pre-tax income from continuing operations attributable to The AES Corporation excluding gains or losses of the consolidated entity due to (a) unrealized gains or losses related to derivative transactions and equity securities; (b) unrealized foreign currency gains or losses; (c) gains, losses, benefits and costs associated with dispositions and acquisitions of business interests, including early plant closures; (d) losses due to impairments; (e) gains, losses and costs due to the early retirement of debt; and (f) costs directly associated with a major restructuring program, including, but not limited to, workforce reduction efforts, relocations, and office consolidation. Adjusted PTC also includes net equity in earnings of affiliates on an after-tax basis adjusted for the same gains or losses excluded from consolidated entities. The Company has concluded that Adjusted PTC better reflects the underlying business performance of the Company and is the most relevant measure considered in the Company’s internal evaluation of the financial performance of its segments. Additionally, given its large number of businesses and complexity, the Company concluded that Adjusted PTC is a more transparent measure that better assists investors in determining which businesses have the greatest impact on the Company’s results.
Revenue and Adjusted PTC are presented before inter-segment eliminations, which includes the effect of intercompany transactions with other segments except for interest, charges for certain management fees, and the write-off of intercompany balances, as applicable. All intra-segment activity has been eliminated within the segment. Inter-segment activity has been eliminated within the total consolidated results.
The following tables present financial information by segment for the periods indicated (in millions):
|
| | | | | | | | | | | | | | | |
| Three Months Ended September 30, | | Nine Months Ended September 30, |
Total Revenue | 2019 | | 2018 | | 2019 | | 2018 |
US and Utilities SBU | $ | 1,130 |
| | $ | 1,230 |
| | $ | 3,125 |
| | $ | 3,252 |
|
South America SBU | 828 |
| | 923 |
| | 2,438 |
| | 2,664 |
|
MCAC SBU | 470 |
| | 462 |
| | 1,398 |
| | 1,276 |
|
Eurasia SBU | 197 |
| | 224 |
| | 801 |
| | 935 |
|
Corporate and Other | 14 |
| | 7 |
| | 39 |
| | 21 |
|
Eliminations | (14 | ) | | (9 | ) | | (43 | ) | | (34 | ) |
Total Revenue | $ | 2,625 |
| | $ | 2,837 |
| | $ | 7,758 |
| | $ | 8,114 |
|
|
| | | | | | | | | | | | | | | |
| Three Months Ended September 30, | | Nine Months Ended September 30, |
Total Adjusted PTC | 2019 | | 2018 | | 2019 | | 2018 |
Income from continuing operations before taxes and equity in earnings of affiliates | $ | 424 |
| | $ | 332 |
| | $ | 896 |
| | $ | 1,672 |
|
Add: Net equity in earnings of affiliates | 4 |
| | 6 |
| | 3 |
| | 31 |
|
Less: Income from continuing operations before taxes, attributable to noncontrolling interests | (124 | ) | | (116 | ) | | (304 | ) | | (409 | ) |
Pre-tax contribution | 304 |
| | 222 |
| | 595 |
| | 1,294 |
|
Unrealized derivative and equity securities losses | 69 |
| | 16 |
| | 78 |
| | 4 |
|
Unrealized foreign currency losses (gains) | 31 |
| | (7 | ) | | 49 |
| | 42 |
|
Disposition/acquisition losses (gains) | (17 | ) | | 17 |
| | (3 | ) | | (822 | ) |
Impairment expense | 1 |
| | 80 |
| | 124 |
| | 172 |
|
Loss (gain) on extinguishment of debt | 38 |
| | (1 | ) | | 95 |
| | 177 |
|
Restructuring costs | — |
| | — |
| | — |
| | 3 |
|
Total Adjusted PTC | $ | 426 |
| | $ | 327 |
| | $ | 938 |
| | $ | 870 |
|
|
| | | | | | | | | | | | | | | |
| Three Months Ended September 30, | | Nine Months Ended September 30, |
Total Adjusted PTC | 2019 | | 2018 | | 2019 | | 2018 |
US and Utilities SBU | $ | 187 |
| | $ | 167 |
| | $ | 427 |
| | $ | 363 |
|
South America SBU | 139 |
| | 128 |
| | 360 |
| | 381 |
|
MCAC SBU | 185 |
| | 81 |
| | 298 |
| | 215 |
|
Eurasia SBU | 19 |
| | 37 |
| | 114 |
| | 175 |
|
Corporate and Other | (95 | ) | | (91 | ) | | (251 | ) | | (260 | ) |
Eliminations | (9 | ) | | 5 |
| | (10 | ) | | (4 | ) |
Total Adjusted PTC | $ | 426 |
| | $ | 327 |
| | $ | 938 |
| | $ | 870 |
|
|
| | | | | | | |
Total Assets | September 30, 2019 | | December 31, 2018 |
US and Utilities SBU | $ | 12,963 |
| | $ | 12,286 |
|
South America SBU | 11,225 |
| | 10,941 |
|
MCAC SBU | 4,886 |
| | 4,462 |
|
Eurasia SBU | 3,984 |
| | 4,538 |
|
Corporate and Other | 365 |
| | 294 |
|
Total Assets | $ | 33,423 |
| | $ | 32,521 |
|
14. REVENUE
The following table presents our revenue from contracts with customers and other revenue for the periods indicated (in millions):
|
| | | | | | | | | | | | | | | | | | | | | | | |
| Three Months Ended September 30, 2019 |
| US and Utilities SBU | | South America SBU | | MCAC SBU | | Eurasia SBU | | Corporate, Other and Eliminations | | Total |
Regulated Revenue | | | | | | | | | | | |
Revenue from contracts with customers | $ | 788 |
| | $ | — |
| | $ | — |
| | $ | — |
| | $ | — |
| | $ | 788 |
|
Other regulated revenue | 11 |
| | — |
| | — |
| | — |
| | — |
| | 11 |
|
Total regulated revenue | 799 |
| | — |
| | — |
| | — |
| | — |
| | 799 |
|
Non-Regulated Revenue | | | | | | | | | | | |
Revenue from contracts with customers | 245 |
| | 822 |
| | 447 |
| | 141 |
| | (1 | ) | | 1,654 |
|
Other non-regulated revenue (1) | 86 |
| | 6 |
| | 23 |
| | 56 |
| | 1 |
| | 172 |
|
Total non-regulated revenue | 331 |
| | 828 |
| | 470 |
| | 197 |
| | — |
| | 1,826 |
|
Total revenue | $ | 1,130 |
| | $ | 828 |
| | $ | 470 |
| | $ | 197 |
| | $ | — |
| | $ | 2,625 |
|
| | | | | | | | | | | |
| Three Months Ended September 30, 2018 |
| US and Utilities SBU | | South America SBU | | MCAC SBU | | Eurasia SBU | | Corporate, Other and Eliminations | | Total |
Regulated Revenue | | | | | | | | | | | |
Revenue from contracts with customers | $ | 759 |
| | $ | — |
| | $ | — |
| | $ | — |
| | $ | — |
| | $ | 759 |
|
Other regulated revenue | 18 |
| | — |
| | — |
| | — |
| | — |
| | 18 |
|
Total regulated revenue | 777 |
| | — |
| | — |
| | — |
| | — |
| | 777 |
|
Non-Regulated Revenue | | | | | | | | | | | |
Revenue from contracts with customers | 386 |
| | 922 |
| | 440 |
| | 152 |
| | (2 | ) | | 1,898 |
|
Other non-regulated revenue (1) | 67 |
| | 1 |
| | 22 |
| | 72 |
| | — |
| | 162 |
|
Total non-regulated revenue | 453 |
| | 923 |
| | 462 |
| | 224 |
| | (2 | ) | | 2,060 |
|
Total revenue | $ | 1,230 |
| | $ | 923 |
| | $ | 462 |
| | $ | 224 |
| | $ | (2 | ) | | $ | 2,837 |
|
|
| | | | | | | | | | | | | | | | | | | | | | | |
| Nine Months Ended September 30, 2019 |
| US and Utilities SBU | | South America SBU | | MCAC SBU | | Eurasia SBU | | Corporate, Other and Eliminations | | Total |
Regulated Revenue | | | | | | | | | | | |
Revenue from contracts with customers | $ | 2,272 |
| | $ | — |
| | $ | — |
| | $ | — |
| | $ | — |
| | $ | 2,272 |
|
Other regulated revenue | 36 |
| | — |
| | — |
| | — |
| | — |
| | 36 |
|
Total regulated revenue | 2,308 |
| | — |
| | — |
| | — |
| | — |
| | 2,308 |
|
Non-Regulated Revenue | | | | | | | | | | | |
Revenue from contracts with customers | 598 |
| | 2,429 |
| | 1,331 |
| | 609 |
| | (3 | ) | | 4,964 |
|
Other non-regulated revenue (1) | 219 |
| | 9 |
| | 67 |
| | 192 |
| | (1 | ) | | 486 |
|
Total non-regulated revenue | 817 |
| | 2,438 |
| | 1,398 |
| | 801 |
| | (4 | ) | | 5,450 |
|
Total revenue | $ | 3,125 |
| | $ | 2,438 |
| | $ | 1,398 |
| | $ | 801 |
| | $ | (4 | ) | | $ | 7,758 |
|
| | | | | | | | | | | |
| Nine Months Ended September 30, 2018 |
| US and Utilities SBU | | South America SBU | | MCAC SBU | | Eurasia SBU | | Corporate, Other and Eliminations | | Total |
Regulated Revenue | | | | | | | | | | | |
Revenue from contracts with customers | $ | 2,176 |
| | $ | — |
| | $ | — |
| | $ | — |
| | $ | — |
| | $ | 2,176 |
|
Other regulated revenue | 39 |
| | — |
| | — |
| | — |
| | — |
| | 39 |
|
Total regulated revenue | 2,215 |
| | — |
| | — |
| | — |
| | — |
| | 2,215 |
|
Non-Regulated Revenue | | | | | | | | | | | |
Revenue from contracts with customers | 774 |
| | 2,661 |
| | 1,211 |
| | 701 |
| | (11 | ) | | 5,336 |
|
Other non-regulated revenue (1) | 263 |
| | 3 |
| | 65 |
| | 234 |
| | (2 | ) | | 563 |
|
Total non-regulated revenue | 1,037 |
| | 2,664 |
| | 1,276 |
| | 935 |
| | (13 | ) | | 5,899 |
|
Total revenue | $ | 3,252 |
| | $ | 2,664 |
| | $ | 1,276 |
| | $ | 935 |
| | $ | (13 | ) | | $ | 8,114 |
|
_______________________________
(1) Other non-regulated revenue primarily includes lease and derivative revenue not accounted for under ASC 606.
Contract Balances — The timing of revenue recognition, billings, and cash collections results in accounts receivable and contract liabilities. The contract liabilities from contracts with customers were $116 million and $109 million as of September 30, 2019 and December 31, 2018, respectively.
During the nine months ended September 30, 2019 and 2018, we recognized revenue of $9 million and $33 million, respectively, that was included in the corresponding contract liability balance at the beginning of the periods.
A significant financing arrangement exists for our Mong Duong plant in Vietnam. The plant was constructed under a build, operate, and transfer contract and will be transferred to the Vietnamese government after the completion of a 25 year PPA. The performance obligation to construct the facility was substantially completed in 2015. Approximately $1.4 billion of contract consideration related to the construction, but not yet collected through the 25 year PPA, was reflected as a loan receivable as of September 30, 2019.
Remaining Performance Obligations — The transaction price allocated to remaining performance obligations represents future consideration for unsatisfied (or partially unsatisfied) performance obligations at the end of the reporting period. As of September 30, 2019, the aggregate amount of transaction price allocated to remaining performance obligations was $13 million, primarily consisting of fixed consideration for the sale of renewable energy credits (RECs) in long-term contracts in the U.S. We expect to recognize revenue on approximately one-fifth of the remaining performance obligations in 2019 and 2020, with the remainder recognized thereafter.
For further information on our accounting policies concerning contract balances and remaining performance obligations, see Note 18—Revenue in Item 8.—Financial Statements and Supplementary Data of our 2018 Form 10-K.
15. OTHER INCOME AND EXPENSE
Other income generally includes gains on insurance recoveries in excess of property damage, gains on asset sales and liability extinguishments, favorable judgments on contingencies, gains on contract terminations, allowance for funds used during construction and other income from miscellaneous transactions. Other expense generally includes losses on asset sales and dispositions, losses on legal contingencies, defined benefit plan non-service costs, and losses from other miscellaneous transactions. The components are summarized as follows (in millions):
|
| | | | | | | | | | | | | | | | |
| | Three Months Ended September 30, | | Nine Months Ended September 30, |
| | 2019 | | 2018 | | 2019 | | 2018 |
Other Income | Gain on insurance proceeds (1) | $ | 73 |
| | $ | — |
| | $ | 108 |
| | $ | — |
|
| Allowance for funds used during construction (US Utilities) | 1 |
| | 1 |
| | 3 |
| | 8 |
|
| Other | 4 |
| | 9 |
| | 15 |
| | 22 |
|
| Total other income | $ | 78 |
| | $ | 10 |
| | $ | 126 |
| | $ | 30 |
|
| | | | | | | | |
Other Expense | Loss on sale and disposal of assets (2) | $ | 5 |
| | $ | 20 |
| | $ | 19 |
| | $ | 25 |
|
| Non-service pension and other postretirement costs | 4 |
| | 1 |
| | 13 |
| | 7 |
|
| Other | — |
| | 8 |
| | 3 |
| | 10 |
|
| Total other expense | $ | 9 |
| | $ | 29 |
| | $ | 35 |
| | $ | 42 |
|
_____________________________
| |
| Associated with recoveries for property damage at the Andres facility in the Dominican Republic from a lightning incident in September 2018 and the upgrade of the tunnel lining at Changuinola. |
| |
| Associated with a loss due to damage from a lightning incident at the Andres facility in the Dominican Republic in September 2018 and the disposal of tunnel lining at Changuinola in 2019. |
16. ASSET IMPAIRMENT EXPENSE
The following table presents our asset impairment expense by asset group for the periods indicated (in millions): |
| | | | | | | | | | | | | | | |
| Three Months Ended September 30, | | Nine Months Ended September 30, |
| 2019 | | 2018 | | 2019 | | 2018 |
Kilroot and Ballylumford | $ | — |
| | $ | — |
| | $ | 115 |
| | $ | — |
|
Shady Point | — |
| | 73 |
| | — |
| | 156 |
|
Other | — |
| | 1 |
| | 1 |
| | 10 |
|
Total | $ | — |
| | $ | 74 |
| | $ | 116 |
| | $ | 166 |
|
Kilroot and Ballylumford — In April 2019, the Company entered into an agreement to sell its entire 100% interest in the Kilroot coal and oil-fired plant and energy storage facility and the Ballylumford gas-fired plant in the United Kingdom. Upon meeting the held-for-sale criteria, the Company performed an impairment analysis and determined that the carrying value of the asset group of $232 million was greater than its fair value less costs to sell of $114 million. As a result, the Company recognized asset impairment expense of $115 million. The Company completed the sale of Kilroot and Ballylumford in June 2019. Prior to their sale, Kilroot and Ballylumford were reported in the Eurasia SBU reportable segment. See Note 19—Held-for-Sale and Dispositions for further information.
Shady Point — In June 2018, the Company tested the recoverability of its long-lived assets at Shady Point, a coal-fired generation facility in the U.S. due to an unfavorable economic outlook resulting in uncertainty around
future cash flows. The Company determined that the carrying amount of the asset group was not recoverable. The asset group was determined to have a fair value of $127 million using a combination of the income and market approaches. As a result, the Company recognized asset impairment expense of $83 million.
In the third quarter of 2018, as a result of updated assumptions regarding the future use of the assets, management’s expectations of future cash flows for the facility decreased. Given updated inputs, the asset group was determined to have a fair value of $55 million as of September 30, 2018 and additional impairment expense of $73 million was recognized. In December 2018, the Company entered into an agreement to sell Shady Point, which was completed in May 2019. Prior to the sale, Shady Point was reported in the US and Utilities SBU reportable segment. See Note 19—Held-for-Sale and Dispositions for further information.
17. INCOME TAXES
The Company’s provision for income taxes is based on the estimated annual effective tax rate, plus discrete items. The effective tax rates for the three and nine month periods ended September 30, 2019 were 31% and 34%, respectively. The effective tax rates for the three and nine month periods ended September 30, 2018 were 44% and 30%, respectively. The difference between the Company’s effective tax rates for the 2019 and 2018 periods and the U.S. statutory tax rate of 21% related primarily to U.S. taxes on foreign earnings, foreign tax rate differentials, the impacts of foreign currency fluctuations at certain foreign subsidiaries, and nondeductible expenses.
In the first quarter of 2019, the U.S. Treasury issued final regulations related to the TCJA one-time transition tax which further amended the guidance of the proposed regulations. As a result, we recorded $3 million of discrete tax expense in the first quarter. In the third quarter of 2018, we recorded discrete tax expense for a $33 million provisional adjustment to the one-time transition tax.
In the first quarter of 2018, the Company completed the sale of its entire 51% equity interest in Masinloc, resulting in pre-tax gain of approximately $773 million. The sale resulted in approximately $155 million of discrete tax expense in the U.S. under the new GILTI provision, which subjects the earnings of foreign subsidiaries to current U.S. taxation to the extent those earnings exceed an allowable return. See Note 19—Held-for-Sale and Dispositions for details of the sale.
In the second quarter of 2018, the Company completed the sale of Electrica Santiago for total proceeds of $287 million, resulting in a pre-tax gain on sale of $70 million after post-closing adjustments. The sale resulted in approximately $25 million of discrete tax expense. See Note 19—Held-for-Sale and Dispositions for details of the sale.
The impact of foreign currency devaluation in Argentina was approximately $11 million and $17 million of discrete tax expense for the three and nine month periods ended September 30, 2019, respectively. The same amounts for the three and nine month periods ended September 30, 2018 are $16 million and $38 million, respectively.
18. DISCONTINUED OPERATIONS
Due to a portfolio evaluation in the first half of 2016, management decided to pursue a strategic shift to reduce the Company's exposure to the Brazilian distribution market. During 2017, Eletropaulo, the Company’s remaining distribution business in Brazil, met the criteria to qualify as a discontinued operation and its results of operations were reported as such.
In June 2018, the Company completed the sale of its entire 17% ownership interest in Eletropaulo through a bidding process hosted by the Brazilian securities regulator, CVM. Gross proceeds of $340 million were received at our subsidiary in Brazil, subject to the payment of taxes. Upon disposal of Eletropaulo, the Company recorded a pre-tax gain on sale of $243 million (after-tax $199 million). Excluding the gain on sale, income from discontinued operations and cash flows from operating and investing activities of discontinued operations were immaterial for the three and nine months ended September 30, 2018. Prior to its classification as discontinued operations, Eletropaulo was reported in the South America SBU reportable segment.
19. HELD-FOR-SALE AND DISPOSITIONS
Held-for-Sale
Jordan — In February 2019, the Company entered into an agreement to sell its 36% ownership interest in two generation plants, IPP1 and IPP4, and a solar plant in Jordan for $86 million, subject to customary post-closing adjustments, plus capital contributions to the solar project of approximately $5 million. The sale of IPP1 and IPP4 is expected to close in the fourth quarter of 2019 and the sale of the solar plant is expected to close in the first quarter of 2020. As of September 30, 2019, the generation plants and solar plant were classified as held-for-sale, but did not meet the criteria to be reported as discontinued operations. On a consolidated basis, the carrying value of the plants held-for-sale as of September 30, 2019 was $131 million. Pre-tax income attributable to AES was $13 million and $8 million for the nine months ended September 30, 2019 and September 30, 2018, respectively. Jordan is reported in the Eurasia SBU reportable segment.
Redondo Beach — In October 2018, the Company entered into an agreement to sell land held by AES Redondo Beach, a gas-fired generating facility in California. The sale is expected to close by the end of the first quarter of 2020. As of September 30, 2019, the $24 million carrying value of the land held by Redondo Beach was classified as held-for-sale. Redondo Beach is reported in the US and Utilities SBU reportable segment.
Dispositions
Kilroot and Ballylumford — In June 2019, the Company completed the sale of its entire 100% interest in the Kilroot coal and oil-fired plant and energy storage facility and the Ballylumford gas-fired plant in the United Kingdom for $118 million, subject to customary post-closing adjustments, resulting in a pre-tax loss on sale of $33 million primarily due to the write-off of cumulative translation adjustments and accumulated other comprehensive income balances. The sale did not meet the criteria to be reported as discontinued operations. Prior to the sale, Kilroot and Ballylumford were reported in the Eurasia SBU reportable segment. See Note 16—Asset Impairment Expense for further information.
Shady Point — In May 2019, the Company completed the sale of Shady Point, a U.S. coal-fired generating facility, for $29 million. The sale did not meet the criteria to be reported as discontinued operations. Prior to its sale, Shady Point was reported in the US and Utilities SBU reportable segment. See Note 16—Asset Impairment Expense for further information.
Electrica Santiago — In May 2018, AES Gener completed the sale of Electrica Santiago for total consideration of $287 million, resulting in a final pre-tax gain on sale of $70 million after post-closing adjustments. Electrica Santiago consisted of four gas and diesel-fired generation plants in Chile. The sale did not meet the criteria to be reported as discontinued operations. Prior to its sale, Electrica Santiago was reported in the South America SBU reportable segment.
Stuart and Killen — In May 2018, DPL retired the co-owned Stuart coal-fired and diesel-fired generating units, and the Killen coal-fired generating unit and combustion turbine. Prior to their retirement, Stuart and Killen were reported in the US and Utilities SBU reportable segment.
Masinloc — In March 2018, the Company completed the sale of its entire 51% equity interest in Masinloc for cash proceeds of $1.05 billion, resulting in a pre-tax gain on sale of $773 million subject to U.S. income tax. Masinloc consisted of a coal-fired generation plant in operation, a coal-fired generation plant under construction, and an energy storage facility all located in the Philippines. The sale did not meet the criteria to be reported as discontinued operations. Prior to its sale, Masinloc was reported in the Eurasia SBU reportable segment.
DPL peaker assets — In March 2018, DPL completed the sale of six of its combustion turbine and diesel-fired generation facilities and related assets ("DPL peaker assets") for total proceeds of $239 million, resulting in a loss on sale of $2 million. The sale did not meet the criteria to be reported as discontinued operations. Prior to their sale, the DPL peaker assets were reported in the US and Utilities SBU reportable segment.
Beckjord facility — In February 2018, DPL transferred its interest in Beckjord, a coal-fired generation facility retired in 2014, including its obligations to remediate the facility and its site. The transfer resulted in cash expenditures of $15 million, inclusive of disposal charges, and a loss on disposal of $12 million. Prior to the transfer, Beckjord was reported in the US and Utilities SBU reportable segment.
Advancion Energy Storage — In January 2018, the Company deconsolidated the AES Advancion energy storage development business and contributed it to the Fluence joint venture, resulting in a gain on sale of $23 million. Prior to the transfer, the AES Advancion energy storage development business was reported as part of Corporate and Other.
Excluding any impairment charges or gain/loss on sale, pre-tax income (loss) attributable to AES of disposed businesses was as follows: |
| | | | | | | | | | | | | | | |
| Three Months Ended September 30, | | Nine Months Ended September 30, |
(in millions) | 2019 | | 2018 | | 2019 | | 2018 |
Kilroot and Ballylumford | $ | — |
| | $ | — |
| | $ | (1 | ) | | $ | 19 |
|
Stuart and Killen (1) | (1 | ) | | 8 |
| | 30 |
| | 38 |
|
Other | — |
| | 7 |
| | (4 | ) | | 33 |
|
Total | $ | (1 | ) | | $ | 15 |
| | $ | 25 |
| | $ | 90 |
|
(1) The Company entered into contracts to buy back all open capacity years for Stuart and Killen at prices lower than the PJM capacity revenue prices. As such, the Company continues to earn capacity margin.
20. ACQUISITIONS
Los Cururos — In September 2019, AES Gener entered into an agreement to purchase the Los Cururos wind farm and transmission lines in Chile from EPM Chile S.A. for approximately $138 million, subject to certain precedent conditions and customary purchase price adjustments. The acquisition is expected to close in the fourth quarter of 2019, and will be reported in the South America SBU reportable segment.
Guaimbê Solar Complex — In September 2018, AES Tietê completed the acquisition of the Guaimbê Solar Complex (“Guaimbê”) from Cobra do Brasil for $152 million, comprised of the exchange of $119 million of non-convertible debentures in project financing and additional cash consideration of $33 million. The transaction was accounted for as an asset acquisition, therefore the consideration transferred, plus transaction costs, were allocated to the individual assets acquired and liabilities assumed based on their relative fair values. Guaimbê is reported in the South America SBU reportable segment.
21. EARNINGS PER SHARE
Basic and diluted earnings per share are based on the weighted average number of shares of common stock and potential common stock outstanding during the period. Potential common stock, for purposes of determining diluted earnings per share, includes the effects of dilutive RSUs and stock options. The effect of such potential common stock is computed using the treasury stock method.
The following table is a reconciliation of the numerator and denominator of the basic and diluted earnings per share computation for income from continuing operations for the three and nine months ended September 30, 2019 and 2018, where income represents the numerator and weighted average shares represent the denominator.
|
| | | | | | | | | | | | | | | | | | | | | |
Three Months Ended September 30, | 2019 | | 2018 |
(in millions, except per share data) | Income | | Shares | | $ per Share | | Income | | Shares | | $ per Share |
| | | | | | | | | | | |
BASIC EARNINGS PER SHARE | | | | | | | | | | | |
Income from continuing operations attributable to The AES Corporation common stockholders | $ | 210 |
| | 664 |
| | $ | 0.32 |
| | $ | 102 |
| | 662 |
| | $ | 0.15 |
|
EFFECT OF DILUTIVE SECURITIES | | | | |
| | | | | | |
Restricted stock units | — |
| | 3 |
| | — |
| | — |
| | 3 |
| | — |
|
DILUTED EARNINGS PER SHARE | $ | 210 |
| | 667 |
| | $ | 0.32 |
| | $ | 102 |
| | 665 |
| | $ | 0.15 |
|
| | | | | | | | | | | |
| | | | | | | | | | | |
Nine Months Ended September 30, | 2019 | | 2018 |
(in millions, except per share data) | Income | | Shares | | $ per Share | | Income | | Shares | | $ per Share |
| | | | | | | | | | | |
BASIC EARNINGS PER SHARE | | | | | | | | | | | |
Income from continuing operations attributable to The AES Corporation common stockholders | $ | 380 |
| | 663 |
| | $ | 0.57 |
| | $ | 883 |
| | 661 |
| | $ | 1.33 |
|
EFFECT OF DILUTIVE SECURITIES | | | | | | | | | | | |
Stock options | — |
| | 1 |
| | — |
| | — |
| | — |
| | — |
|
Restricted stock units | — |
| | 3 |
| | — |
| | — |
| | 3 |
| | — |
|
DILUTED EARNINGS PER SHARE | $ | 380 |
| | 667 |
| | $ | 0.57 |
| | $ | 883 |
| | 664 |
| | $ | 1.33 |
|
The calculation of diluted earnings per share excluded stock awards which would be anti-dilutive. The calculation of diluted earnings per share excluded 1 million and 2 million stock awards outstanding for the three and nine months ended September 30, 2019 and 2018, respectively, that could potentially dilute basic earnings per share in the future.
ITEM 2. MANAGEMENT’S DISCUSSION AND ANALYSIS OF FINANCIAL CONDITION AND RESULTS OF OPERATIONS
The condensed consolidated financial statements included in Item 1.—Financial Statements of this Form 10-Q and the discussions contained herein should be read in conjunction with our 2018 Form 10-K.
FORWARD-LOOKING INFORMATION
The following discussion may contain forward-looking statements regarding us, our business, prospects and our results of operations that are subject to certain risks and uncertainties posed by many factors and events that could cause our actual business, prospects and results of operations to differ materially from those that may be anticipated by such forward-looking statements. Factors that could cause or contribute to such differences include, but are not limited to, those described in Item 1A.—Risk Factors and Item 7.—Management’s Discussion and Analysis of Financial Condition and Results of Operations of our 2018 Form 10-K and subsequent filings with the SEC. Readers are cautioned not to place undue reliance on these forward-looking statements which speak only as of the date of this report. We undertake no obligation to revise any forward-looking statements in order to reflect events or circumstances that may subsequently arise. If we do update one or more forward-looking statements, no inference should be drawn that we will make additional updates with respect to those or other forward-looking statements. Readers are urged to carefully review and consider the various disclosures made by us in this report and in our other reports filed with the SEC that advise of the risks and factors that may affect our business.
Overview of Our Business — We are a diversified power generation and utility company organized into the following four market-oriented SBUs: US and Utilities (United States, Puerto Rico and El Salvador); South America (Chile, Colombia, Argentina and Brazil); MCAC (Mexico, Central America and the Caribbean); and Eurasia (Europe and Asia). For additional information regarding our business, see Item 1.—Business of our 2018 Form 10-K.
We have two lines of business. The first business line is generation, where we own and/or operate power plants to generate and sell power to customers such as utilities, industrial users and other intermediaries. The second business line is utilities, where we own and/or operate utilities to generate or purchase, distribute, transmit and sell electricity to end-user customers in the residential, commercial, industrial and governmental sectors within a defined service area. In certain circumstances, our utilities also generate and sell electricity on the wholesale market. The generation lines of business are reported within all four of our SBUs and the utilities lines of business are reported within our US and Utilities SBU.
Executive Summary
Compared with last year, third quarter diluted earnings per share from continuing operations increased $0.17 to $0.32. This increase reflects contributions from new businesses, a lower effective tax rate, insurance recoveries, the prior year impairment at Shady Point and gains on sales of businesses in 2019 compared to losses in 2018, partially offset by current year unrealized foreign currency losses in Argentina and losses on debt extinguishments.
Adjusted EPS, a non-GAAP measure, increased $0.13 to $0.48, reflecting contributions from new businesses, improved results at the South America SBU, a lower effective tax rate, and insurance recoveries in 2019.
Compared with last year, year-to-date diluted earnings per share from continuing operations decreased $0.76 to $0.57. This decrease was largely driven by prior year net gains on dispositions of $0.98, lower generation in Argentina and Chile, current year unrealized foreign currency losses in Argentina, and the impact on margin from the sale of businesses in the prior period. These decreases were partially offset by higher contributions from the US and Utilities SBU and new businesses, lower tax expense, insurance recoveries, and a decrease in losses on extinguishment of debt and impairment expense.
Adjusted EPS, a non-GAAP measure, increased $0.14 to $1.02, reflecting higher contributions from the US and Utilities SBU and new businesses, insurance recoveries, and a lower effective tax rate, partially offset by the impact on margin from the sale of businesses and lower contributions from the South America SBU.
____________________________
| |
(1) | See Item 2.—Management’s Discussion and Analysis of Financial Condition and Results of Operations—SBU Performance Analysis—Non-GAAP Measures for reconciliation and definition. |
Overview of Strategic Performance
In year-to-date 2019, we continued to make substantial progress on our strategic priorities of improving our credit profile, investing in new technologies and greening our portfolio, in order to deliver attractive risk-adjusted returns to our shareholders.
| |
• | We are leveraging our leading position to capture attractive renewable growth by signing 921 MW of new PPAs during the third quarter of 2019, for a total of 1.9 GW year-to-date, bringing our backlog to 6.1 GW. |
| |
• | We formed a 10-year strategic alliance with Google to develop and implement solutions to enable broad adoption of clean energy. |
| |
• | We are completing our projects under construction as planned, with 3,030 MW currently under construction and expected to come on-line through 2021. During the third quarter of 2019, we completed 1,625 MW of new projects, including the 1,320 MW OPGC 2 plant in India and 305 MW of solar globally. |
| |
• | We received approval from the Government of Vietnam to develop the 2.2 GW Son My 2 CCGT to be co- |
located with our previously approved 480 TBTU LNG terminal.
| |
• | As a result of executing on our strategy, we continue to target a 50% reduction in carbon intensity by 2022 and a 70% reduction by 2030, both off a 2016 base. These initiatives will also reduce our coal-fired generation below 30% of our total generation volume by 2022. |
| |
• | We strengthened our balance sheet by voluntarily prepaying $443 million of recourse debt to achieve all investment grade credit metrics in the third quarter of 2019. |
| |
• | Our energy storage joint venture, Fluence, has delivered or been awarded more than 1.5 GW of capacity, including 806 MW awarded in year-to-date 2019. |
Review of Consolidated Results of Operations (unaudited)
|
| | | | | | | | | | | | | | | | | | | | | | | | | | | | | |
| Three Months Ended September 30, | | Nine Months Ended September 30, |
(in millions, except per share amounts) | 2019 | | 2018 | | $ change | | % change | | 2019 | | 2018 | | $ change | | % change |
Revenue: | | | | | | | | | | | | | | | |
US and Utilities SBU | $ | 1,130 |
| | $ | 1,230 |
| | $ | (100 | ) | | -8 | % | | $ | 3,125 |
| | $ | 3,252 |
| | $ | (127 | ) | | -4 | % |
South America SBU | 828 |
| | 923 |
| | (95 | ) | | -10 | % | | 2,438 |
| | 2,664 |
| | (226 | ) | | -8 | % |
MCAC SBU | 470 |
| | 462 |
| | 8 |
| | 2 | % | | 1,398 |
| | 1,276 |
| | 122 |
| | 10 | % |
Eurasia SBU | 197 |
| | 224 |
| | (27 | ) | | -12 | % | | 801 |
| | 935 |
| | (134 | ) | | -14 | % |
Corporate and Other | 14 |
| | 7 |
| | 7 |
| | 100 | % | | 39 |
| | 21 |
| | 18 |
| | 86 | % |
Eliminations | (14 | ) | | (9 | ) | | (5 | ) | | -56 | % | | (43 | ) | | (34 | ) | | (9 | ) | | -26 | % |
Total Revenue | 2,625 |
| | 2,837 |
| | (212 | ) | | -7 | % | | 7,758 |
| | 8,114 |
| | (356 | ) | | -4 | % |
Operating Margin: | | | | | | |
|
| | | | | | | |
|
|
US and Utilities SBU | 234 |
| | 225 |
| | 9 |
| | 4 | % | | 621 |
| | 570 |
| | 51 |
| | 9 | % |
South America SBU | 250 |
| | 250 |
| | — |
| | — | % | | 637 |
| | 754 |
| | (117 | ) | | -16 | % |
MCAC SBU | 179 |
| | 144 |
| | 35 |
| | 24 | % | | 361 |
| | 379 |
| | (18 | ) | | -5 | % |
Eurasia SBU | 32 |
| | 34 |
| | (2 | ) | | -6 | % | | 136 |
| | 175 |
| | (39 | ) | | -22 | % |
Corporate and Other | (6 | ) | | (4 | ) | | (2 | ) | | 50 | % | | 23 |
| | 32 |
| | (9 | ) | | -28 | % |
Eliminations | 12 |
| | 22 |
| | (10 | ) | | 45 | % | | 11 |
| | 17 |
| | (6 | ) | | 35 | % |
Total Operating Margin | 701 |
| | 671 |
| | 30 |
| | 4 | % | | 1,789 |
| | 1,927 |
| | (138 | ) | | -7 | % |
General and administrative expenses | (41 | ) | | (43 | ) | | 2 |
| | -5 | % | | (136 | ) | | (134 | ) | | (2 | ) | | 1 | % |
Interest expense | (250 | ) | | (255 | ) | | 5 |
| | -2 | % | | (788 | ) | | (799 | ) | | 11 |
| | -1 | % |
Interest income | 81 |
| | 79 |
| | 2 |
| | 3 | % | | 242 |
| | 231 |
| | 11 |
| | 5 | % |
Loss on extinguishment of debt | (65 | ) | | (11 | ) | | (54 | ) | | NM |
| | (126 | ) | | (187 | ) | | 61 |
| | -33 | % |
Other expense | (9 | ) | | (29 | ) | | 20 |
| | -69 | % | | (35 | ) | | (42 | ) | | 7 |
| | -17 | % |
Other income | 78 |
| | 10 |
| | 68 |
| | NM |
| | 126 |
| | 30 |
| | 96 |
| | NM |
|
Gain (loss) on disposal and sale of business interests | 16 |
| | (21 | ) | | 37 |
| | NM |
| | 9 |
| | 856 |
| | (847 | ) | | -99 | % |
Asset impairment expense | — |
| | (74 | ) | | 74 |
| | -100 | % | | (116 | ) | | (166 | ) | | 50 |
| | -30 | % |
Foreign currency transaction gains (losses) | (87 | ) | | 5 |
| | (92 | ) | | NM |
| | (69 | ) | | (44 | ) | | (25 | ) | | 57 | % |
Income tax expense | (130 | ) | | (146 | ) | | 16 |
| | -11 | % | | (302 | ) | | (509 | ) | | 207 |
| | -41 | % |
Net equity in earnings of affiliates | 4 |
| | 6 |
| | (2 | ) | | -33 | % | | 3 |
| | 31 |
| | (28 | ) | | -90 | % |
INCOME FROM CONTINUING OPERATIONS | 298 |
| | 192 |
| | 106 |
| | 55 | % | | 597 |
| | 1,194 |
| | (597 | ) | | -50 | % |
Loss from operations of discontinued businesses, net of income tax expense of $0, $0, $0, and $2, respectively | — |
| | (4 | ) | | 4 |
| | -100 | % | | — |
| | (9 | ) | | 9 |
| | -100 | % |
Gain from disposal of discontinued businesses, net of income tax expense of $0, $2, $0, and $44, respectively | — |
| | 3 |
| | (3 | ) | | -100 | % | | 1 |
| | 199 |
| | (198 | ) | | -99 | % |
NET INCOME | 298 |
| | 191 |
| | 107 |
| | 56 | % | | 598 |
| | 1,384 |
| | (786 | ) | | -57 | % |
Noncontrolling interests: | | | | | | |
|
| | | | | | | |
|
|
Less: Income from continuing operations attributable to noncontrolling interests and redeemable stock of subsidiaries | (88 | ) | | (90 | ) | | 2 |
| | -2 | % | | (217 | ) | | (311 | ) | | 94 |
| | -30 | % |
Less: Loss from discontinued operations attributable to noncontrolling interests | — |
| | — |
| | — |
| | — | % | | — |
| | 2 |
| | (2 | ) | | -100 | % |
NET INCOME ATTRIBUTABLE TO THE AES CORPORATION | $ | 210 |
| | $ | 101 |
| | $ | 109 |
| | NM |
| | $ | 381 |
| | $ | 1,075 |
| | $ | (694 | ) | | -65 | % |
AMOUNTS ATTRIBUTABLE TO THE AES CORPORATION COMMON STOCKHOLDERS: | | | | |
| |
|
| | | | | | | |
|
Income from continuing operations, net of tax | $ | 210 |
| | $ | 102 |
| | $ | 108 |
| | NM |
| | $ | 380 |
| | $ | 883 |
| | $ | (503 | ) | | -57 | % |
Income (loss) from discontinued operations, net of tax | — |
| | (1 | ) | | 1 |
| | -100 | % | | 1 |
| | 192 |
| | (191 | ) | | -99 | % |
NET INCOME ATTRIBUTABLE TO THE AES CORPORATION | $ | 210 |
| | $ | 101 |
| | $ | 109 |
| | NM |
| | $ | 381 |
| | $ | 1,075 |
| | $ | (694 | ) | | -65 | % |
Net cash provided by operating activities | $ | 761 |
| | $ | 767 |
| | $ | (6 | ) | | -1 | % | | $ | 1,775 |
| | $ | 1,681 |
| | $ | 94 |
| | 6 | % |
Components of Revenue, Cost of Sales, and Operating Margin — Revenue includes revenue earned from the sale of energy from our utilities and the production and sale of energy from our generation plants, which are classified as regulated and non-regulated, respectively, on the Condensed Consolidated Statements of Operations. Revenue also includes the gains or losses on derivatives associated with the sale of electricity.
Cost of sales includes costs incurred directly by the businesses in the ordinary course of business. Examples include electricity and fuel purchases, operations and maintenance costs, depreciation and amortization expenses, bad debt expense and recoveries, and general administrative and support costs (including employee-related costs directly associated with the operations of the business). Cost of sales also includes the gains or losses on derivatives (including embedded derivatives other than foreign currency embedded derivatives) associated with the purchase of electricity or fuel.
Operating margin is defined as revenue less cost of sales.
Consolidated Revenue and Operating Margin
Three Months Ended September 30, 2019
Revenue
(in millions)
Consolidated Revenue — Revenue decreased $212 million, or 7%, for the three months ended September 30, 2019, compared to the three months ended September 30, 2018. Excluding the unfavorable FX impact of $25 million, primarily in South America, this decrease was driven by:
| |
• | $100 million in US and Utilities mainly driven by lower energy prices and sales due to higher temperatures and other favorable market conditions present in 2018 as compared to 2019 at Southland, and the sale and closure of the Shady Point generation facility; |
| |
• | $77 million in South America mainly driven by lower generation and prices in Argentina, and lower contract sales and generation in Chile; and |
| |
• | $22 million in Eurasia mainly driven by the sale of the Northern Ireland businesses in June 2019. |
These unfavorable impacts were partially offset by an increase of $10 million in MCAC driven by the commencement of operations at the Colon combined cycle facility in Panama in September 2018.
Operating Margin
(in millions)
Consolidated Operating Margin — Operating margin increased $30 million, or 4%, for the three months ended September 30, 2019, compared to the three months ended September 30, 2018. Excluding the unfavorable FX impact of $7 million, this increase was driven by:
| |
• | $35 million in MCAC driven by business interruption insurance recoveries at the Andres facility in Dominican Republic and the commencement of operations at the Colon combined cycle facility in Panama, partially offset by the outage at Changuinola as a result of upgrading the tunnel lining; and |
| |
• | $9 million in US & Utilities primarily due to the 2018 rate order at IPL, partially offset by the sale and closure of the Shady Point generation facility. |
Nine Months Ended September 30, 2019
Revenue
(in millions)
Consolidated Revenue — Revenue decreased $356 million, or 4%, for the nine months ended September 30, 2019, compared to the nine months ended September 30, 2018. Excluding the unfavorable FX impact of $112 million, primarily in South America, this decrease was driven by:
| |
• | $150 million in South America primarily driven by lower generation and prices in Argentina and lower contract sales and generation in Chile; |
| |
• | $127 million in US and Utilities primarily driven by the closure of generation facilities at DPL and Shady Point and lower energy prices and sales due to higher temperatures and other favorable market conditions present in 2018 as compared to 2019 at Southland, partially offset by price increases due to the 2018 rate orders at IPL and DPL and an increase in energy pass-through costs at El Salvador; and |
| |
• | $102 million in Eurasia primarily due to the sales of the Masinloc power plant in March 2018 and the Northern Ireland businesses in June 2019. |
These unfavorable impacts were partially offset by an increase of $126 million in MCAC driven by the commencement of operations at the Colon combined cycle facility in Panama in September 2018.
Operating Margin
(in millions)
Consolidated Operating Margin — Operating margin decreased $138 million, or 7%, for the nine months ended September 30, 2019, compared to the nine months ended September 30, 2018. Excluding the unfavorable FX impact of $31 million, primarily in South America, this decrease was driven by:
| |
• | $93 million in South America primarily due to the drivers discussed above; |
| |
• | $33 million in Eurasia primarily due to the drivers discussed above and lower generation at Kilroot due to planned outages, partially offset by lower depreciation at the Jordan plants due to their classification as held-for-sale; and |
| |
• | $17 million in MCAC due to the outage at Changuinola as a result of upgrading the tunnel lining and lower hydrology in Panama as compared to the prior year, partially offset by the commencement of operations at the Colon combined cycle facility in Panama and business interruption insurance recoveries at the Andres facility in Dominican Republic. |
These unfavorable impacts were partially offset by an increase of $51 million in US and Utilities mostly due to the 2018 rate orders at IPL and DPL and a revision to the ARO at DPL.
See Item 2.—Management’s Discussion and Analysis of Financial Condition and Results of Operations—SBU Performance Analysis of this Form 10-Q for additional discussion and analysis of operating results for each SBU.
Consolidated Results of Operations — Other
General and administrative expenses
General and administrative expenses decreased $2 million, or 5%, to $41 million for the three months ended September 30, 2019, compared to $43 million for the three months ended September 30, 2018, and increased $2 million, or 1%, to $136 million for the nine months ended September 30, 2019, compared to $134 million for the nine months ended September 30, 2018, with no material drivers.
Interest expense
Interest expense decreased $5 million, or 2%, to $250 million for the three months ended September 30, 2019, compared to $255 million for the three months ended September 30, 2018, primarily due to the reduction of debt and reduced interest rates on refinanced debt mainly at DPL, partially offset by lower capitalized interest due to the commencement of operations at the Colon facility in September 2018 and a decrease in AFUDC for the Eagle Valley CCGT project at IPL.
Interest expense decreased $11 million, or 1%, to $788 million for the nine months ended September 30, 2019, compared to $799 million for the nine months ended September 30, 2018, primarily due to the reduction of debt mainly at the Parent Company and DPL, reduced interest rates on refinanced debt at DPL, and favorable foreign currency translation and inflation rates at Tietê, partially offset by lower capitalized interest due to the commencement of operations at Colon facility in September 2018, a decrease in AFUDC for the Eagle Valley CCGT project at IPL, and the loss of hedge accounting at Alto Maipo in 2018, which resulted in favorable unrealized mark-to-market adjustments recognized within interest expense.
Interest income
Interest income increased $2 million, or 3%, to $81 million for the three months ended September 30, 2019, compared to $79 million for the three months ended September 30, 2018, with no material drivers.
Interest income increased $11 million, or 5%, to $242 million for the nine months ended September 30, 2019, compared to $231 million for the nine months ended September 30, 2018, primarily in South America driven by higher average interest rate on CAMMESA receivables and higher short-term investments.
Loss on extinguishment of debt
Loss on extinguishment of debt increased $54 million to $65 million for the three months ended September 30, 2019, compared to $11 million for the three months ended September 30, 2018. This increase was primarily due to losses of $31 million at Mong Duong and $28 million at Colon resulting from the refinancing and redemption of senior notes in 2019 compared to losses of $7 million and $4 million at Gener and Southland, respectively, resulting from the redemption of senior notes in 2018.
Loss on extinguishment of debt decreased $61 million, or 33%, to $126 million for the nine months ended September 30, 2019, compared to $187 million for the nine months ended September 30, 2018. This decrease was primarily due to losses of $169 million at the Parent Company resulting from the redemption of senior notes in 2018 compared to losses of $45 million at DPL, $31 million at Mong Duong, and $28 million at Colon in 2019 resulting from the redemption or refinancing of senior notes.
See Note 8—Debt included in Item 1.—Financial Statements of this Form 10-Q for further information.
Other income and expense
Other income increased $68 million to $78 million for the three months ended September 30, 2019, compared to $10 million for the three months ended September 30, 2018, and increased $96 million to $126 million for the nine months ended September 30, 2019, compared to $30 million for the nine months ended September 30, 2018. This increase was primarily due to gains on insurance recoveries associated with property damage at the Andres facility and upgrading the tunnel lining at Changuinola.
Other expense decreased $20 million, or 69%, to $9 million for the three months ended September 30, 2019, compared to $29 million for the three months ended September 30, 2018. This decrease was due to a loss on disposal of assets resulting from damage associated with a lightning incident at the Andres facility in the Dominican Republic in 2018.
Other expense decreased $7 million, or 17%, to $35 million for the nine months ended September 30, 2019, compared to $42 million for the nine months ended September 30, 2018. This decrease was due to a loss on disposal of assets resulting from damage associated with a lightning incident at the Andres facility in the Dominican Republic in 2018 partially offset by the disposal of tunnel lining at Changuinola in 2019.
See Note 15—Other Income and Expense included in Item 1.—Financial Statements and Key Trends and Uncertainties included in Item 2.— Management’s Discussion and Analysis of Financial Condition and Results of Operations of this Form 10-Q for further information.
Gain (loss) on disposal and sale of business interests
Gain on disposal and sale of business interests was $16 million for the three months ended September 30, 2019, primarily due to the 2019 gain on the merger of Simple Energy to form Uplight, as compared to a loss of $21 million for the three months ended September 30, 2018, primarily due to post-closing adjustments on the gain on sale of Electrica Santiago in 2018.
Gain on disposal and sale of business interests decreased $847 million, or 99%, to $9 million for the nine months ended September 30, 2019, compared to $856 million for the nine months ended September 30, 2018, primarily due to the gains on sale of Masinloc and Electrica Santiago in 2018.
See Note 19—Held-for-Sale and Dispositions and Note 7—Investments in and Advances to Affiliates included in Item 1.—Financial Statements of this Form 10-Q for further information.
Asset impairment expense
There were no asset impairments for the three months ended September 30, 2019, compared to $74 million for the three months ended September 30, 2018. This decrease was primarily due to an impairment of $73 million due to an unfavorable economic outlook creating uncertainty around future cash flows at Shady Point in 2018.
Asset impairment expense decreased $50 million, or 30%, to $116 million for the nine months ended September 30, 2019, compared to $166 million for the nine months ended September 30, 2018. This decrease was primarily due to an impairment of $115 million as a result of Kilroot and Ballylumford being classified as held-for-sale in 2019 compared to a prior year impairment of $156 million due to an unfavorable economic outlook creating uncertainty around future cash flows at Shady Point.
See Note 16—Asset Impairment Expense included in Item 1.—Financial Statements of this Form 10-Q for further information.
Foreign currency transaction gains (losses)
|
| | | | | | | | | | | | | | | |
| Three Months Ended September 30, | | Nine Months Ended September 30, |
(in millions) | 2019 | | 2018 | | 2019 | | 2018 |
Argentina | $ | (83 | ) | | $ | (2 | ) | | $ | (69 | ) | | $ | (47 | ) |
Corporate | (10 | ) | | (2 | ) | | (9 | ) | | 17 |
|
Chile | 8 |
| | 4 |
| | 9 |
| | (11 | ) |
Other | (2 | ) | | 5 |
| | — |
| | (3 | ) |
Total (1) | $ | (87 | ) | | $ | 5 |
| | $ | (69 | ) | | $ | (44 | ) |
___________________________________________
| |
(1) | Includes $41 million of losses and $6 million of gains on foreign currency derivative contracts for the three months ended September 30, 2019 and 2018, respectively, and $24 million of losses and $37 million of gains for the nine months ended September 30, 2019 and 2018, respectively. |
The Company recognized net foreign currency transaction losses of $87 million and $69 million for the three and nine months ended September 30, 2019, respectively, primarily driven by unrealized losses on foreign currency derivatives related to government receivables in Argentina, unrealized losses associated with the devaluation of long-term receivables denominated in the Argentine peso, and unrealized losses at the Parent Company resulting from the depreciation of intercompany receivables denominated in Euro.
The Company recognized net foreign currency transaction gains of $5 million for the three months ended September 30, 2018, primarily due to unrealized gains associated with the devaluation of payables denominated in Chilean pesos at Angamos and Cochrane, partially offset by the devaluation of long-term receivables denominated in Argentine pesos.
The Company recognized net foreign currency transaction losses of $44 million for the nine months ended September 30, 2018, primarily due to the devaluation of long-term receivables denominated in Argentine pesos, partially offset by gains at the Parent Company related to foreign currency derivatives.
Income tax expense
Income tax expense decreased $16 million, or 11%, to $130 million for the three months ended September 30, 2019, compared to $146 million for the three months ended September 30, 2018. The Company’s effective tax rates were 31% and 44% for the three months ended September 30, 2019 and 2018, respectively. This net decrease was primarily due to an adjustment recorded in the third quarter of 2018 to the provisional U.S. one-time transition tax, partially offset by nondeductible unrealized losses on foreign currency derivatives related to government receivables in Argentina during the third quarter of 2019. See Note 17—Income Taxes included in Item 1.—Financial Statements of this Form 10-Q for discussion of the adjustment to the one-time transition tax.
Income tax expense decreased $207 million, or 41%, to $302 million for the nine months ended September 30, 2019, compared to $509 million for the nine months ended September 30, 2018. The Company’s effective tax rates were 34% and 30% for the nine months ended September 30, 2019 and 2018, respectively. This net increase was primarily due to the 2018 impact of the sale of the Company’s entire 51% equity interest in Masinloc, as well as the afore-mentioned 2019 nondeductible unrealized losses on foreign currency derivatives related to government receivables in Argentina. See Note 19— Held-for-Sale and Dispositions and Note 17—Income Taxes included in Item 1.—Financial Statements of this Form 10-Q for details and impacts of the sale.
Our effective tax rate reflects the tax effect of significant operations outside the U.S., which are generally taxed at rates different than the U.S. statutory rate of 21%. Furthermore, our foreign earnings may be subjected to incremental U.S. taxation under the GILTI rules. A future proportionate change in the composition of income before income taxes from foreign and domestic tax jurisdictions could impact our periodic effective tax rate.
Net equity in earnings of affiliates
Net equity in earnings of affiliates decreased $2 million, or 33%, to $4 million for the three months ended September 30, 2019, compared to $6 million for the three months ended September 30, 2018. This decrease was primarily due to decreased earnings at OPGC driven by a contract termination charge and decreased earnings at other equity affiliates compared to the third quarter of 2018, partially offset by increased earnings at sPower associated with completed projects during the third quarter and increased earnings at Guacolda.
Net equity in earnings of affiliates decreased $28 million, or 90%, to $3 million for the nine months ended September 30, 2019, compared to $31 million for the nine months ended September 30, 2018. This decrease was primarily due to decreased earnings at OPGC driven by a contract termination charge, the consolidation of certain Distributed Energy non-controlling interests in late 2018, and decreased earnings at other equity affiliates compared to 2018, partially offset by increased earnings at Guacolda.
Net income from discontinued operations
Net loss from discontinued operations was $1 million for the three months ended September 30, 2018. Net income from discontinued operations was $190 million for the nine months ended September 30, 2018, primarily due to the gain on sale of Eletropaulo in 2018.
See Note 18—Discontinued Operations included in Item 1.—Financial Statements of this Form 10-Q for further information regarding the Eletropaulo discontinued operations.
Net income attributable to noncontrolling interests and redeemable stock of subsidiaries
Net income attributable to noncontrolling interests and redeemable stock of subsidiaries decreased $2 million, or 2%, to $88 million for the three months ended September 30, 2019, compared to $90 million for the three months ended September 30, 2018. This decrease was primarily due to:
•Lower earnings at Mong Duong and Colon due to losses on extinguishment of debt; and
| |
• | HLBV allocation of losses to noncontrolling interests at Distributed Energy. |
These decreases were partially offset by:
| |
• | Higher earnings in the Dominican Republic due to gains on insurance proceeds associated with the lightning incident at the Andres facility in 2018; |
| |
• | Higher earnings at Tietê due to higher volume of energy sales and lower prices on energy purchase contracts; and |
| |
• | Prior year post-closing adjustments to the gain on sale of Electrica Santiago. |
Net income attributable to noncontrolling interests and redeemable stock of subsidiaries decreased $92 million, or 30%, to $217 million for the nine months ended September 30, 2019, compared to $309 million for the nine months ended September 30, 2018. This decrease was primarily due to:
| |
• | Prior year gain on sale of Electrica Santiago; |
| |
• | HLBV allocation of losses to noncontrolling interests at Distributed Energy; |
| |
• | Lower earnings at Mong Duong and Colon due to losses on extinguishment of debt; |
| |
• | Lower earnings in Panama primarily due to lower hydrology and the outage at Changuinola as a result of upgrading the tunnel lining. See Item 2.—Management’s Discussion and Analysis of Financial Condition and Results of Operations—Key Trends and Uncertainties—Changuinola Tunnel Leak of this Form 10-Q for further information; and |
| |
• | Lower earnings due to the sale of Masinloc in March 2018. |
These decreases were partially offset by:
| |
• | Higher earnings in the Dominican Republic due to gains on insurance proceeds associated with the lightning incident at the Andres facility in 2018. |
Net income attributable to The AES Corporation
Net income attributable to The AES Corporation increased $109 million to $210 million for the three months ended September 30, 2019, compared to $101 million for the three months ended September 30, 2018. This increase was primarily due to:
| |
• | Prior year impairment at Shady Point; |
| |
• | Current year gains on insurance proceeds associated with the lightning incident at the Andres facility in 2018 and the Changuinola tunnel lining upgrade; |
| |
• | Prior year post-closing adjustments to the gain on sale of Electrica Santiago, and current year gain on sale of our ownership interest in Simple Energy as part of the merger to form Uplight; and |
| |
• | Higher margins at our US and Utilities and MCAC SBUs. |
These increases were partially offset by:
| |
• | Current year unrealized losses on foreign currency derivatives related to government receivables in Argentina; and |
| |
• | Current year losses on extinguishment of debt at Mong Duong and Colon. |
Net income attributable to The AES Corporation decreased $694 million, or 65%, to $381 million for the nine months ended September 30, 2019, compared to $1,075 million for the nine months ended September 30, 2018. This decrease was primarily due to:
| |
• | Prior year gains on the sales of Masinloc, Eletropaulo (reflected within discontinued operations), and Electrica Santiago, net of tax; |
| |
• | Current year impairments and loss on sale at Kilroot and Ballylumford; |
| |
• | Current year losses on extinguishment of debt at DPL, Mong Duong and Colon; |
| |
• | Current year unrealized losses on foreign currency derivatives related to government receivables in Argentina; |
| |
• | The impact of sold businesses in our Eurasia SBU; and |
| |
• | Lower margins at our South America and MCAC SBUs. |
These decreases were partially offset by:
| |
• | Prior year loss on extinguishment of debt at the Parent Company; |
| |
• | Current year gains on insurance proceeds associated with the lightning incident at the Andres facility in 2018 and the Changuinola tunnel leak; |
| |
• | Prior year impairment at Shady Point; |
| |
• | Current year gain on sale of a portion of our interest in sPower’s operating assets; and |
| |
• | Higher margins at our US and Utilities SBU. |
SBU Performance Analysis
Non-GAAP Measures
Adjusted Operating Margin, Adjusted PTC and Adjusted EPS are non-GAAP supplemental measures that are used by management and external users of our condensed consolidated financial statements such as investors, industry analysts and lenders.
Adjusted Operating Margin
We define Adjusted Operating Margin as Operating Margin, adjusted for the impact of NCI, excluding (a) unrealized gains or losses related to derivative transactions; (b) benefits and costs associated with dispositions and acquisitions of business interests, including early plant closures; and (c) costs directly associated with a major restructuring program, including, but not limited to, workforce reduction efforts, relocations, and office consolidation. The allocation of HLBV earnings to noncontrolling interests is not adjusted out of Adjusted Operating Margin. See Review of Consolidated Results of Operations for the definition of Operating Margin.
The GAAP measure most comparable to Adjusted Operating Margin is Operating Margin. We believe that Adjusted Operating Margin better reflects the underlying business performance of the Company. Factors in this determination include the impact of NCI, where AES consolidates the results of a subsidiary that is not wholly owned by the Company, as well as the variability due to unrealized gains or losses related to derivative transactions and strategic decisions to dispose of or acquire business interests. Adjusted Operating Margin should not be construed as an alternative to Operating Margin, which is determined in accordance with GAAP.
|
| | | | | | | | | | | | | | | |
| Three Months Ended September 30, | | Nine Months Ended September 30, |
Reconciliation of Adjusted Operating Margin (in millions) | 2019 | | 2018 | | 2019 | | 2018 |
Operating Margin | $ | 701 |
| | $ | 671 |
| | $ | 1,789 |
| | $ | 1,927 |
|
Noncontrolling interests adjustment (1) | (194 | ) | | (160 | ) | | (491 | ) | | (502 | ) |
Unrealized derivative losses | 2 |
| | 4 |
| | — |
| | 11 |
|
Disposition/acquisition losses | 4 |
| | 7 |
| | 14 |
| | 20 |
|
Restructuring costs | — |
| | — |
| | — |
| | 3 |
|
Total Adjusted Operating Margin | $ | 513 |
| | $ | 522 |
| | $ | 1,312 |
| | $ | 1,459 |
|
_______________________
| |
(1) | The allocation of HLBV earnings to noncontrolling interests is not adjusted out of Adjusted Operating Margin. |
Adjusted PTC
We define Adjusted PTC as pre-tax income from continuing operations attributable to The AES Corporation excluding gains or losses of the consolidated entity due to (a) unrealized gains or losses related to derivative transactions and equity securities; (b) unrealized foreign currency gains or losses; (c) gains, losses, benefits and costs associated with dispositions and acquisitions of business interests, including early plant closures; (d) losses due to impairments; (e) gains, losses and costs due to the early retirement of debt; and (f) costs directly associated with a major restructuring program, including, but not limited to, workforce reduction efforts, relocations, and office consolidation. Adjusted PTC also includes net equity in earnings of affiliates on an after-tax basis adjusted for the same gains or losses excluded from consolidated entities.
Adjusted PTC reflects the impact of NCI and excludes the items specified in the definition above. In addition to the revenue and cost of sales reflected in Operating Margin, Adjusted PTC includes the other components of our income statement, such as general and administrative expenses in the Corporate segment, as well as business development costs, interest expense and interest income, other expense and other income, realized foreign currency transaction gains and losses, and net equity in earnings of affiliates.
The GAAP measure most comparable to Adjusted PTC is income from continuing operations attributable to The AES Corporation. We believe that Adjusted PTC better reflects the underlying business performance of the Company and is the most relevant measure considered in the Company’s internal evaluation of the financial performance of its segments. Factors in this determination include the variability due to unrealized gains or losses related to derivative transactions or equity securities remeasurement, unrealized foreign currency gains or losses, losses due to impairments and strategic decisions to dispose of or acquire business interests, retire debt or implement restructuring initiatives, which affect results in a given period or periods. In addition, earnings before tax represents the business performance of the Company before the application of statutory income tax rates and tax adjustments, including the effects of tax planning, corresponding to the various jurisdictions in which the Company operates. Given its large number of businesses and complexity, the Company concluded that Adjusted PTC is a more transparent measure that better assists investors in determining which businesses have the greatest impact on the Company’s results.
Adjusted PTC should not be construed as an alternative to income from continuing operations attributable to The AES Corporation, which is determined in accordance with GAAP.
|
| | | | | | | | | | | | | | | |
| Three Months Ended September 30, | | Nine Months Ended September 30, |
Reconciliation of Adjusted PTC (in millions) | 2019 | | 2018 | | 2019 | | 2018 |
Income from continuing operations, net of tax, attributable to The AES Corporation | $ | 210 |
| | $ | 102 |
| | $ | 380 |
| | $ | 883 |
|
Income tax expense attributable to The AES Corporation | 94 |
| | 120 |
| | 215 |
| | 411 |
|
Pre-tax contribution | 304 |
| | 222 |
| | 595 |
| | 1,294 |
|
Unrealized derivative and equity securities losses | 69 |
| | 16 |
| | 78 |
| | 4 |
|
Unrealized foreign currency losses (gains) | 31 |
| | (7 | ) | | 49 |
| | 42 |
|
Disposition/acquisition losses (gains) | (17 | ) | | 17 |
| | (3 | ) | | (822 | ) |
Impairment expense | 1 |
| | 80 |
| | 124 |
| | 172 |
|
Loss (gain) on extinguishment of debt | 38 |
| | (1 | ) | | 95 |
| | 177 |
|
Restructuring costs | — |
| | — |
| | — |
| | 3 |
|
Total Adjusted PTC | $ | 426 |
| | $ | 327 |
| | $ | 938 |
| | $ | 870 |
|
Adjusted EPS
We define Adjusted EPS as diluted earnings per share from continuing operations excluding gains or losses of both consolidated entities and entities accounted for under the equity method due to (a) unrealized gains or losses related to derivative transactions and equity securities; (b) unrealized foreign currency gains or losses; (c) gains, losses, benefits and costs associated with dispositions and acquisitions of business interests, including early plant closures, and the tax impact from the repatriation of sales proceeds; (d) losses due to impairments; (e) gains, losses and costs due to the early retirement of debt; (f) costs directly associated with a major restructuring program, including, but not limited to, workforce reduction efforts, relocations, and office consolidation; and (g) tax benefit or expense related to the enactment effects of 2017 U.S. tax law reform and related regulations and any subsequent period adjustments related to enactment effects.
The GAAP measure most comparable to Adjusted EPS is diluted earnings per share from continuing operations. We believe that Adjusted EPS better reflects the underlying business performance of the Company and is considered in the Company’s internal evaluation of financial performance. Factors in this determination include the variability due to unrealized gains or losses related to derivative transactions or equity securities remeasurement, unrealized foreign currency gains or losses, losses due to impairments and strategic decisions to dispose of or acquire business interests, retire debt or implement restructuring activities, which affect results in a given period or periods.
Adjusted EPS should not be construed as an alternative to diluted earnings per share from continuing operations, which is determined in accordance with GAAP.
|
| | | | | | | | | | | | | | | | |
| Three Months Ended September 30, | | Nine Months Ended September 30, | |
Reconciliation of Adjusted EPS | 2019 | | 2018 | | 2019 | | 2018 | |
Diluted earnings per share from continuing operations | $ | 0.32 |
| | $ | 0.15 |
| | $ | 0.57 |
| | $ | 1.33 |
| |
Unrealized derivative and equity securities losses | 0.10 |
| (1) | 0.02 |
| | 0.12 |
| (1) | 0.01 |
| |
Unrealized foreign currency losses | 0.05 |
| (2) | — |
| | 0.06 |
| (2) | 0.06 |
| (3) |
Disposition/acquisition losses (gains) | (0.03 | ) | (4) | 0.02 |
| | — |
|
| (1.24 | ) | (5) |
Impairment expense | — |
| | 0.12 |
| (6) | 0.19 |
| (7) | 0.26 |
| (6) |
Loss on extinguishment of debt | 0.06 |
| (8) | — |
| | 0.14 |
| (9) | 0.27 |
| (10) |
U.S. Tax Law Reform Impact | — |
| | 0.05 |
| (11) | 0.01 |
| | 0.05 |
| (11) |
Less: Net income tax expense (benefit) | (0.02 | ) | | (0.01 | ) | | (0.07 | ) | (12) | 0.14 |
| (13) |
Adjusted EPS | $ | 0.48 |
| | $ | 0.35 |
| | $ | 1.02 |
| | $ | 0.88 |
| |
_____________________________
| |
(1) | Amounts primarily relate to unrealized derivative losses in Argentina of $71 million, or $0.11 per share, and $77 million, or $0.12 per share, for the three and nine months ended September 30, 2019, respectively, mainly associated with foreign currency derivatives on government receivables. |
| |
(2) | Amounts primarily relate to unrealized FX losses in Argentina of $11 million, or $0.02 per share, and $23 million, or $0.03 per share, for the three and nine months ended September 30, 2019, respectively, mainly associated with the devaluation of long-term receivables denominated in Argentine pesos; and unrealized FX losses at the Parent Company of $18 million, or $0.03 per share, and $22 million, or $0.03 per share, for the three and nine months ended September 30, 2019, respectively, mainly associated with intercompany receivables denominated in Euro. |
| |
(3) | Amount primarily relates to unrealized FX losses in Argentina of $20 million, or $0.03 per share, mainly associated with the devaluation of long-term receivables denominated in Argentine pesos, and unrealized FX losses at the Parent Company of $9 million, or $0.01 per share, mainly associated with intercompany receivables denominated in Euro. |
| |
(4) | Amount primarily relates to gain on sale of ownership interest in Simple Energy as part of the Uplight merger of $13 million, or $0.02 per share, and realized derivative gains associated with the sale of Kilroot and Ballylumford of $7 million, or $0.01 per share. |
| |
(5) | Amount primarily relates to gain on sale of Masinloc of $773 million, or $1.16 per share, gain on sale of Electrica Santiago of $36 million, or $0.05 per share, and realized derivative gains associated with the sale of Eletropaulo of $21 million, or $0.03 per share. |
| |
(6) | Amounts primarily relate to the asset impairments at Shady Point of $73 million, or $0.11 per share, and $156 million, or $0.23 per share, for the three and nine months ended September 30, 2019, respectively. |
| |
(7) | Amount primarily relates to asset impairments at Kilroot and Ballylumford of $115 million, or $0.17 per share. |
| |
(8) | Amount primarily relates to losses on early retirement of debt at Mong Duong of $16 million, or $0.02 per share, and Colon of $14 million, or $0.02 per share. |
| |
(9) | Amount primarily relates to losses on early retirement of debt at DPL of $45 million, or $0.07 per share, Mong Duong of $16 million, or $0.02 per share, and Colon of $14 million, or $0.02 per share. |
| |
(10) | Amount primarily relates to loss on early retirement of debt at the Parent Company of $169 million, or $0.25 per share. |
| |
(11) | Amount relates to a charge to true-up the provisional estimate of U.S. tax reform of $33 million, or $0.05 per share. |
| |
(12) | Amount primarily relates to income tax benefits associated with the impairments at Kilroot and Ballylumford of $17 million, or $0.03 per share, and income tax benefits associated with losses on early retirement of debt at DPL, Mong Duong and Colon of $24 million, or $0.04 per share. |
| |
(13) | Amount primarily relates to the income tax expense under the GILTI provision associated with the gains on sales of business interests, primarily Masinloc, of $155 million, or $0.23 per share, and income tax expense associated with the gain on sale of Electrica Santiago of $19 million, or $0.03 per share; partially offset by income tax benefits associated with the loss on early retirement of debt at the Parent Company of $52 million, or $0.08 per share, and income tax benefits associated with the impairment at Shady Point of $35 million, or $0.05 per share. |
US AND UTILITIES SBU
The following table summarizes Operating Margin, Adjusted Operating Margin and Adjusted PTC (in millions) for the periods indicated:
|
| | | | | | | | | | | | | | | | | | | | | | | | | | | | | |
| Three Months Ended September 30, | | Nine Months Ended September 30, |
| 2019 | | 2018 | | $ Change | | % Change | | 2019 | | 2018 | | $ Change | | % Change |
Operating Margin | $ | 234 |
| | $ | 225 |
| | $ | 9 |
| | 4 | % | | $ | 621 |
| | $ | 570 |
| | $ | 51 |
| | 9 | % |
Adjusted Operating Margin (1) | 209 |
| | 209 |
| | — |
| | — | % | | 548 |
| | 523 |
| | 25 |
| | 5 | % |
Adjusted PTC (1) | 187 |
| | 167 |
| | 20 |
| | 12 | % | | 427 |
| | 363 |
| | 64 |
| | 18 | % |
_____________________________
| |
(1) | A non-GAAP financial measure, adjusted for the impact of NCI. See SBU Performance Analysis—Non-GAAP Measures for definition and Item 1.—Business included in our 2018 Form 10-K for the respective ownership interest for key businesses. |
Operating Margin for the three months ended September 30, 2019 increased $9 million, or 4%, which was driven primarily by the following (in millions): |
| | | |
Increase at IPL primarily due to higher retail margin driven by higher rates following the 2018 rate order | $ | 18 |
|
Decrease due to the sale and closure of the Shady Point generation facility
| (8 | ) |
Other | (1 | ) |
Total US and Utilities SBU Operating Margin Increase | $ | 9 |
|
Adjusted Operating Margin remained flat primarily due to the drivers above, adjusted for NCI and excluding costs associated with dispositions of business interests.
Adjusted PTC increased $20 million, primarily driven by an increase in the Company's share of earnings at Distributed Energy and an increase in earnings from equity affiliates driven by renewable projects that came online in third quarter of 2019 at sPower, excluding unrealized losses related to derivative contracts.
Operating Margin for the nine months ended September 30, 2019 increased $51 million, or 9%, which was driven primarily by the following (in millions): |
| | | |
Increase at IPL primarily due to higher retail margin driven by higher rates following the 2018 rate order, partially offset by higher maintenance expense due to the timing of plant outages. | $ | 45 |
|
Increase at DPL due to a credit to depreciation expense as a result of a reduction in the ARO liability at DPL's closed plants, Stuart and Killen | 23 |
|
Increase at DPL due to the 2018 distribution rate order, including the decoupling rider which is designed to eliminate the impacts of weather and demand | 22 |
|
Increase at Southland primarily due to favorable fuel prices partially offset by lower sales | 8 |
|
Decrease due to the sale and closure of generation facilities at DPL and Shady Point | (42 | ) |
Other | (5 | ) |
Total US and Utilities SBU Operating Margin Increase | $ | 51 |
|
Adjusted Operating Margin increased $25 million primarily due to the drivers above, adjusted for NCI and excluding unrealized gains and losses on derivatives.
Adjusted PTC increased $64 million, primarily driven by the increase in Adjusted Operating Margin described above, an increase in the Company's allocation of earnings at Distributed Energy, an increase in earnings from equity affiliates driven by renewable projects that came online in 2019 at sPower and lower interest expense at DPL, partially offset by a decrease in AFUDC for the Eagle Valley CCGT project at IPL.
SOUTH AMERICA SBU
The following table summarizes Operating Margin, Adjusted Operating Margin and Adjusted PTC (in millions) for the periods indicated:
|
| | | | | | | | | | | | | | | | | | | | | | | | | | | | | |
| Three Months Ended September 30, | | Nine Months Ended September 30, |
| 2019 | | 2018 | | $ Change | | % Change | | 2019 | | 2018 | | $ Change | | % Change |
Operating Margin | $ | 250 |
| | $ | 250 |
| | $ | — |
| | — | % | | $ | 637 |
| | $ | 754 |
| | $ | (117 | ) | | -16 | % |
Adjusted Operating Margin (1) | 145 |
| | 156 |
| | (11 | ) | | -7 | % | | 358 |
| | 455 |
| | (97 | ) | | -21 | % |
Adjusted PTC (1) | 139 |
| | 128 |
| | 11 |
| | 9 | % | | 360 |
| | 381 |
| | (21 | ) | | -6 | % |
_____________________________
| |
(1) | A non-GAAP financial measure, adjusted for the impact of NCI. See SBU Performance Analysis—Non-GAAP Measures for definition and Item 1.—Business included in our 2018 Form 10-K for the respective ownership interest for key businesses. |
Operating Margin for the three months ended September 30, 2019 remained flat, driven primarily by the following (in millions):
|
| | | |
Decrease in Argentina primarily driven by lower generation, and lower energy and capacity prices as defined by resolution 1/2019, which modified generators remuneration schemes | $ | (15 | ) |
Decrease in Chile primarily due to higher fixed costs mostly associated with planned maintenance at Cochrane and Ventanas plants | (9 | ) |
Increase in Colombia primarily driven by higher spot prices offset by lower sales in the spot market | 15 |
|
Other | 9 |
|
Total South America SBU Operating Margin Increase | $ | — |
|
Adjusted Operating Margin decreased $11 million due to the drivers above, adjusted for NCI.
Adjusted PTC increased $11 million, mainly driven by lower realized FX losses in Argentina mostly associated with the settlement of FX forward instruments in 2018, higher interest income primarily driven by a higher average interest rate on CAMMESA receivables in Argentina and higher equity earnings mostly related to better operating results at Guacolda. These positive impacts were partially offset by the decrease in Adjusted Operating Margin described above.
Operating Margin for the nine months ended September 30, 2019 decreased $117 million, or 16%, which was driven primarily by the following (in millions):
|
| | | |
Decrease in Argentina primarily driven by lower generation, and lower energy and capacity prices as defined by resolution 1/2019, which modified generators remuneration schemes | $ | (54 | ) |
Decrease due to the depreciation of the Colombian peso and Brazilian real against the US dollar, offset by savings in fixed costs as a result of the depreciation of the Argentine peso | (24 | ) |
Decrease in Chile primarily due to lower contracted energy sales and lower efficient plant availability partially offset by lower spot prices on energy purchases | (14 | ) |
Decrease due to the sale of Electrica Santiago and the transmission lines in 2018 | (17 | ) |
Decrease in Chile primarily due to higher fixed costs due to planned maintenance at Cochrane and Ventanas plants | (9 | ) |
Other | 1 |
|
Total South America SBU Operating Margin Decrease | $ | (117 | ) |
Adjusted Operating Margin decreased $97 million due to the drivers above, adjusted for NCI.
Adjusted PTC decreased $21 million, mainly driven by the decrease in Adjusted Operating Margin described above, partially offset by realized FX gains in Argentina and Chile in 2019 as compared to losses in 2018, the prior year write-off of water rights at Gener, and higher equity earnings in 2019 related to better operating results at Guacolda.
MCAC SBU
The following table summarizes Operating Margin, Adjusted Operating Margin and Adjusted PTC (in millions) for the periods indicated:
|
| | | | | | | | | | | | | | | | | | | | | | | | | | | | | |
| Three Months Ended September 30, | | Nine Months Ended September 30, |
| 2019 | | 2018 | | $ Change | | % Change | | 2019 | | 2018 | | $ Change | | % Change |
Operating Margin | $ | 179 |
| | $ | 144 |
| | $ | 35 |
| | 24 | % | | $ | 361 |
| | $ | 379 |
| | $ | (18 | ) | | -5 | % |
Adjusted Operating Margin (1) | 128 |
| | 106 |
| | 22 |
| | 21 | % | | 263 |
| | 282 |
| | (19 | ) | | -7 | % |
Adjusted PTC (1) | 185 |
| | 81 |
| | 104 |
| | NM |
| | 298 |
| | 215 |
| | 83 |
| | 39 | % |
_____________________________
| |
(1) | A non-GAAP financial measure, adjusted for the impact of NCI. See SBU Performance Analysis—Non-GAAP Measures for definition and Item 1.—Business included in our 2018 Form 10-K for the respective ownership interest for key businesses. |
Operating Margin for the three months ended September 30, 2019 increased $35 million, or 24%, which was driven primarily by the following (in millions):
|
| | | |
Lower energy costs and business interruption insurance recovered due to the lightning incident at the Andres facility in 2018 | $ | 48 |
|
Higher sales at Panama driven by the commencement of operations at the Colon combined cycle facility in September 2018 | 20 |
|
Higher contract sales at Panama mainly driven by contract renewals at higher prices | 13 |
|
Lower availability due to the outage of Changuinola for the tunnel lining upgrade | (37 | ) |
Lower availability driven by lower hydrology in Panama | (12 | ) |
Other | 3 |
|
Total MCAC SBU Operating Margin Increase | $ | 35 |
|
Adjusted Operating Margin increased $22 million due to the drivers above, adjusted for NCI.
Adjusted PTC increased $104 million, mainly driven by the increase in Adjusted Operating Margin described above and insurance recoveries associated with property damage at Andres and Changuinola.
Operating Margin for the nine months ended September 30, 2019 decreased $18 million, or 5%, which was driven primarily by the following (in millions):
|
| | | |
Lower availability due to the outage of Changuinola for the tunnel lining upgrade | $ | (98 | ) |
Lower availability driven by lower hydrology in Panama | (37 | ) |
Higher sales at Panama driven by the commencement of operations at the Colon combined cycle facility in September 2018 | 40 |
|
Higher contract sales at Panama mainly driven by contract renewals at higher prices | 38 |
|
Lower energy costs and business interruption insurance recovered due to the lightning incident at the Andres facility in 2018 | 37 |
|
Other | 2 |
|
Total MCAC SBU Operating Margin Decrease | $ | (18 | ) |
Adjusted Operating Margin decreased $19 million due to the drivers above, adjusted for NCI.
Adjusted PTC increased $83 million, mainly driven by the decrease in Adjusted Operating Margin described above and insurance recoveries associated with property damage at Andres and Changuinola.
EURASIA SBU
The following table summarizes Operating Margin, Adjusted Operating Margin and Adjusted PTC (in millions) for the periods indicated:
|
| | | | | | | | | | | | | | | | | | | | | | | | | | | | | |
| Three Months Ended September 30, | | Nine Months Ended September 30, |
| 2019 | | 2018 | | $ Change | | % Change | | 2019 | | 2018 | | $ Change | | % Change |
Operating Margin | $ | 32 |
| | $ | 34 |
| | $ | (2 | ) | | -6 | % | | $ | 136 |
| | $ | 175 |
| | $ | (39 | ) | | -22 | % |
Adjusted Operating Margin (1) | 26 |
| | 31 |
| | (5 | ) | | -16 | % | | 110 |
| | 152 |
| | (42 | ) | | -28 | % |
Adjusted PTC (1) | 19 |
| | 37 |
| | (18 | ) | | -49 | % | | 114 |
| | 175 |
| | (61 | ) | | -35 | % |
_____________________________
| |
(1) | A non-GAAP financial measure, adjusted for the impact of NCI. See SBU Performance Analysis—Non-GAAP Measures for definition and Item 1.—Business included in our 2018 Form 10-K for the respective ownership interest for key businesses. |
Operating Margin for the three months ended September 30, 2019 decreased $2 million, or 6%, and Adjusted Operating Margin decreased $5 million, with no material drivers.
Adjusted PTC decreased $18 million, driven by the decrease in Adjusted Operating Margin described above and a decrease in earnings at OPGC, our equity affiliate in India.
Operating Margin for the nine months ended September 30, 2019 decreased $39 million, or 22%, which was driven primarily by the following (in millions):
|
| | | |
Impact of the sale of the Masinloc power plant in March 2018 | $ | (24 | ) |
Lower generation due to outages and lower dispatch at Kilroot plant in the first half of 2019 | (24 | ) |
Loss of margin due to the sale of Kilroot and Ballylumford, coupled with Ballylumford B station closure in 2018 | (20 | ) |
Lower depreciation at the Jordan plants due to their classification as held-for-sale | 14 |
|
Other | 15 |
|
Total Eurasia SBU Operating Margin Decrease | $ | (39 | ) |
Adjusted Operating Margin decreased $42 million due to the drivers above.
Adjusted PTC decreased $61 million, driven primarily by the decrease in Adjusted Operating Margin described above, as well as a decrease in earnings at OPGC and the sale of Elsta, our equity affiliate in the Netherlands.
Key Trends and Uncertainties
During the remainder of 2019 and beyond, we expect to face the following challenges at certain of our businesses. Management expects that improved operating performance at certain businesses, growth from new businesses and global cost reduction initiatives may lessen or offset their impact. If these favorable effects do not occur, or if the challenges described below and elsewhere in this section impact us more significantly than we currently anticipate, or if volatile foreign currencies and commodities move more unfavorably, then these adverse factors (or other adverse factors unknown to us) may have a material impact on our operating margin, net income attributable to The AES Corporation, and cash flows. We continue to monitor our operations and address challenges as they arise. For the risk factors related to our business, see Item 1.—Business and Item 1A.—Risk Factors of our 2018 Form 10-K.
Macroeconomic and Political
During the past few years, some countries where our subsidiaries conduct business have experienced macroeconomic and political changes. In the event these trends continue, there could be an adverse impact on our
businesses.
United States Tax Law Reform — In light of the significant changes to the U.S. tax system enacted in 2017, the U.S. Treasury Department and Internal Revenue Service have issued numerous regulations. While certain regulations are now final, there are many regulations that are proposed and still others anticipated to be issued in proposed form. The final version of any regulations may vary from the proposed form. When final, these regulations may materially impact our effective tax rate. Certain of the proposed regulations, when final, may have retroactive effect to January 1, 2018 or January 1, 2019.
Puerto Rico — As discussed in Item 7—Management’s Discussion and Analysis of Financial Condition and Results of Operations—Key Trends and Uncertainties of the 2018 Form 10-K, our subsidiaries in Puerto Rico have a long-term PPA with state-owned PREPA, which has been facing economic challenges that could result in a material adverse effect on our business in Puerto Rico.
AES Puerto Rico and AES Ilumina’s non-recourse debt of $295 million and $33 million, respectively, continue to be in default and are classified as current as of September 30, 2019 as a result of PREPA´s bankruptcy filing in July 2017. The Company is in compliance with its debt payment obligations as of September 30, 2019.
The Company's receivable balances in Puerto Rico as of September 30, 2019 totaled $72 million, of which $21 million was overdue. Despite the Title III protection, PREPA has been making substantially all of its payments to the generators in line with historical payment patterns.
Considering the information available as of the filing date, management believes the carrying amount of our long-lived assets in Puerto Rico of $543 million is recoverable as of September 30, 2019.
Argentina — On October 27, 2019, Argentina held presidential elections in which candidate Alberto Fernández was elected president. During his political campaign, Fernández made public statements including guidelines which, if enacted, could result in a new tariff structure for the electricity sector.
Following the primary-election on August 19, 2019, in which the opposition candidate received the highest number of votes, the Argentine peso devalued significantly and the government of Argentina imposed capital controls and announced a restructuring of Argentina’s debt payments. Restrictions on the flow of capital have limited the availability of international credit and economic conditions in Argentina have further deteriorated, triggering additional devaluation of the Argentine peso and a deterioration of the country’s risk profile.
The entering administration has started evaluating solutions to the Argentine economic crisis. Although the situation remains unresolved, it has not had a material impact on our current exposures to date, and payments on the long-term receivables for the FONINVEMEM Agreements are current. For further information, see Note 6—Financing Receivables in Item 8—Financial Statements and Supplementary Data of the 2018 Form 10-K.
Chile — In October 2019, Chile saw significant protests associated with economic conditions resulting in the declaration of a state of emergency in several major cities. Current initiatives to address the concerns of the protesters are under discussion in Congress and could result in regulatory changes that may affect our results of operations in Chile.
Decarbonization Initiatives
Several initiatives have been announced by regulators and offtakers in recent years, with the intention of reducing GHG emissions generated by the energy industry. Our strategy of shifting towards clean energy platforms, including renewable energy, energy storage, LNG and modernized grids is designed to position us for continued growth while reducing our carbon intensity. The shift to renewables has caused certain customers to migrate to other low-carbon energy solutions and this trend may continue. Certain of our contracts contain clauses designed to compensate for early contract terminations, but we cannot guarantee full recovery. Although the Company cannot currently estimate the financial impact of these decarbonization initiatives, new legislative or regulatory programs further restricting carbon emissions could require material capital expenditures or result in other material adverse effects on our financial results. For further discussion of our strategy of shifting towards clean energy platforms see Overview of Strategic Performance.
Chilean Decarbonization Plan — The Chilean government has announced an initiative to phase out coal power plants by 2040 and achieve carbon neutrality by 2050. On June 4, 2019, AES Gener signed an agreement with the Chilean government to cease the operation of two coal units for a total of 322 MW as part of the phasing out. Under the agreement, Ventanas 1 (114 MW) will cease operation in November 2022 and Ventanas 2 (208 MW) in May 2024. These units will remain connected to the grid as “strategic operating reserve” for up to five years after ceasing operations, will receive a reduced capacity payment and will be dispatched, if necessary, to ensure the electric system’s reliability. Considering the information available as of the filing date, management believes the carrying amount of our coal-fired long-lived assets in Chile of $2.8 billion is recoverable as of September 30, 2019.
Puerto Rico Energy Public Policy Act — On April 11, 2019, the Governor of Puerto Rico signed the Puerto Rico Energy Public Policy Act (“the Act”) establishing guidelines for grid efficiency and eliminating coal as a source for electricity generation by January 1, 2028. The Act supports the accelerated deployment of renewables through the Renewable Portfolio Standard and the conversion of coal generating facilities to other fuel sources, with compliance targets of 40% by 2025, 60% by 2040, and 100% by 2050. AES Puerto Rico’s long-term PPA with PREPA expires November 30, 2027. PREPA and AES Puerto Rico have begun discussing conversion options for the coal plant. Various potential technologies have been identified that could comply with the Act, while also ensuring a low cost for customers. Any conversion plan would be subject to lenders and regulatory approval, including that of the Oversight Board that filed for bankruptcy on behalf of PREPA. We considered the Act an indicator of impairment for the long-lived assets at AES Puerto Rico in the second quarter; however, the carrying value of the asset group was recoverable. See Impairments for further information.
For further information about the risks associated with decarbonization initiatives, see Item 1A.—Risk Factors—Concerns about GHG emissions and the potential risks associated with climate change have led to increased regulation and other actions that could impact our businesses included in the 2018 Form 10-K.
Regulatory
DMR — On October 20, 2017, the PUCO approved DP&L’s 2017 ESP. On January 7, 2019, the Ohio Consumers' Counsel appealed to the Supreme Court of Ohio the 2017 ESP with respect to the bypassability of the Reconciliation Rider and the exclusion of the DMR from the SEET. That proceeding has been stayed pending an appeal in a related case involving another utility.
Pursuant to the 2017 ESP, on January 22, 2019, DP&L filed a request with the PUCO for a two-year extension of its DMR through October 2022, in the proposed amount of $199 million for each of the two additional years. The extension request was set at a level expected to reduce debt obligations at both DP&L and DPL and to position DP&L to make capital expenditures to maintain and modernize its electric grid. DP&L’s DMP investments are contingent upon the PUCO approving the two-year extension of its DMR.
On August 1, 2019, DP&L filed a supplemental brief with the PUCO focused on the applicability of a recent court decision involving another Ohio utility’s DMR which is similar to, but not identical to, DP&L’s DMR.
TDSIC — In 2013, Senate Enrolled Act 560, the Transmission, Distribution, and Storage System Improvement Charge ("TDSIC") statute, was signed into law. Among other provisions, this legislation provides for cost recovery outside of a base rate proceeding for new or replacement electric and gas transmission, distribution, and storage projects that a public utility undertakes for the purposes of safety, reliability, system modernization, or economic development. Provisions of the TDSIC statute require that, among other things, requests for recovery include a seven-year plan of eligible investments. Once the plan is approved by the IURC, eighty percent of eligible costs can be recovered using a periodic rate adjustment mechanism. The cost recovery mechanism is referred to as a TDSIC mechanism. Recoverable costs include a return on, and of, the investment, including AFUDC, post-in-service carrying charges, operation and maintenance expenses, depreciation and property taxes. The remaining twenty percent of recoverable costs are to be deferred for future recovery in the public utility’s next general rate case. The periodic rate adjustment mechanism is capped at an annual increase of no more than two percent of total retail revenues.
On July 24, 2019, IPL filed a petition with the IURC seeking approval of a seven-year TDSIC Plan for eligible transmission, distribution and storage system improvements totaling $1.2 billion from 2020 through 2027. An IURC order is expected in the first quarter of 2020.
Regulatory Impact of the TCJA — In September 2019, the PUCO approved a stipulation which proposed that DP&L refund eligible excess accumulated deferred income taxes associated with the TCJA and any related regulatory liability over a ten year period, for a total return to customers of $83 million, including taxes associated with the refunds.
Foreign Exchange Rates
We operate in multiple countries and as such are subject to volatility in exchange rates at varying degrees at the subsidiary level and between our functional currency, the USD, and currencies of the countries in which we operate. For additional information, refer to Item 3.—Quantitative and Qualitative Disclosures About Market Risk.
Andres
As discussed in Item 7—Management’s Discussion and Analysis of Financial Condition and Results of Operations—Key Trends and Uncertainties of the 2018 Form 10-K, on September 3, 2018, lightning affected the Andres 319 MW combined cycle natural gas facility in the Dominican Republic (“the Plant”) resulting in significant damage to its steam turbine and generator. To mitigate the impact of the reduced capacity in the local energy market, the Company installed 120 MW of rental power (gas turbines) while the Plant was out of service for repair. During September 2019, the repairs were completed and the Plant began operating in combined cycle. The Company has recovered business interruption and property damage insurance, subject to pre-defined deductibles, under its existing programs.
See Note 15—Other Income and Expense included in Item 1.—Financial Statements of this Form 10-Q for further information, and Other Income and Expense included in Item 2.—Management’s Discussion and Analysis of Financial Condition and Results of Operations of this Form 10-Q for further information.
Changuinola Tunnel Leak
As discussed in Item 7—Management’s Discussion and Analysis of Financial Condition and Results of Operations—Key Trends and Uncertainties of the 2018 Form 10-K, the Company confirmed loss of water in specific tunnel sections of the Changuinola power plant, a 223 MW hydroelectric power facility in Panama in early 2019. As a result, about one third of the tunnel, 1.6 kilometers, requires upgraded lining to ensure long-term performance of the facility. The affected units have been taken out of service, and the upgrade to the lining is expected to be completed in early 2020. As of September 30, 2019, the Company has written off $12 million corresponding to the lining that is being upgraded and capitalized $49 million of costs associated with the new lining. The Company has recovered property damage insurance, subject to pre-defined deductibles and subrogation rights, for a portion of the upgrade under its existing programs. The Company has also asserted claims against its construction contractor; however, there can be no assurance of collection and the Company continues to monitor the situation.
Considering the information available as of the filing date, management believes the carrying amount of our long-lived assets in Changuinola of $553 million is recoverable as of September 30, 2019. See Note 15—Other Income and Expense included in Item 1.—Financial Statements of this Form 10-Q for further information, and Other Income and Expense included in Item 2.— Management’s Discussion and Analysis of Financial Condition and Results of Operations of this Form 10-Q for further information.
Impairments
Long-lived Assets — During the nine months ended September 30, 2019, the Company recognized asset impairment expense of $116 million. See Note 16—Asset Impairment Expense included in Item 1.—Financial Statements of this Form 10-Q for further information. After recognizing this asset impairment expense, the carrying value of the assets, including long-lived assets, and those assets that were assessed and not impaired, totaled $500 million at September 30, 2019.
Goodwill — The Company is in the preliminary stages of performing its annual goodwill impairment test. In 2018 the goodwill at Gener was considered “at risk” due to sustained downward pressure on long-term power prices in Chile. A reporting unit is considered “at risk” for the coming year when its fair value at the October 1st measurement date is not higher than its carrying amount by 10%. Sustained downward pressure on long-term power prices in Chile could also potentially be an indicator of other than temporary impairment of certain equity method investments in future periods. The Gener goodwill balance was $868 million as of September 30, 2019. Impairments would negatively impact our consolidated results of operations and net worth. See Item 1A.—Risk Factors of the 2018 Form 10-K for further information.
Events or changes in circumstances that may necessitate recoverability tests and potential impairments of long-lived assets or goodwill may include, but are not limited to, adverse changes in the regulatory environment, unfavorable changes in power prices or fuel costs, increased competition due to additional capacity in the grid, technological advancements, declining trends in demand, or an expectation it is more likely than not the asset will be disposed of before the end of its estimated useful life.
Environmental
The Company is subject to numerous environmental laws and regulations in the jurisdictions in which it operates. The Company faces certain risks and uncertainties related to these environmental laws and regulations, including existing and potential GHG legislation or regulations, and actual or potential laws and regulations pertaining to water discharges, waste management (including disposal of coal combustion residuals) and certain air emissions, such as SO2, NOx, particulate matter, mercury and other hazardous air pollutants. Such risks and uncertainties could result in increased capital expenditures or other compliance costs which could have a material adverse effect on certain of our U.S. or international subsidiaries and our consolidated results of operations. For further information about these risks, see Item 1A.—Risk Factors—Our operations are subject to significant government regulation and our business and results of operations could be adversely affected by changes in the law or regulatory schemes; Several of our businesses are subject to potentially significant remediation expenses, enforcement initiatives, private party lawsuits and reputational risk associated with CCR; Our businesses are subject to stringent environmental laws, rules and regulations; and Concerns about GHG emissions and the potential risks associated with climate change have led to increased regulation and other actions that could impact our businesses included in the 2018 Form 10-K.
Climate Change Regulation — On July 8, 2019, the EPA published the final Affordable Clean Energy (“ACE”) Rule, along with associated revisions to implementing regulations, in addition to final revocation of the Clean Power Plan. The ACE Rule determines that heat rate improvement measures are the Best System of Emissions Reductions for existing coal-fired electric generating units. The final rule requires states with existing coal-fired
electric generating units to develop state plans to establish CO2 emission limits for designated facilities. IPL Petersburg and AES Warrior Run have coal-fired electric generating units that may be impacted by this regulation; however, the impact remains largely uncertain because state plans have not yet been developed.
Waste Management — On October 19, 2015, an EPA rule regulating CCR under the Resource Conservation and Recovery Act as nonhazardous solid waste became effective. The rule established nationally applicable minimum criteria for the disposal of CCR in new and currently operating landfills and surface impoundments, including location restrictions, design and operating criteria, groundwater monitoring, corrective action and closure requirements and post-closure care. The primary enforcement mechanisms under this regulation would be actions commenced by the states and private lawsuits. On December 16, 2016, the Water Infrastructure Improvements for the Nation Act ("WIN Act") was signed into law. This includes provisions to implement the CCR rule through a state permitting program, or if the state chooses not to participate, a possible federal permit program. The EPA has indicated that it will implement a phased approach to amending the CCR Rule. On August 14, 2019, the EPA published proposed amendments to the CCR rule relating to the CCR rule’s criteria for determining beneficial use and the regulation of CCR piles, among other revisions. On November 4, 2019, EPA signed additional amendments to the CCR Rule titled “A Holistic Approach To Closure Part A: Deadline To Initiate Closure.” The CCR rule, current or proposed amendments to the CCR rule, the results of groundwater monitoring data or the outcome of CCR-related litigation could have a material impact on our business, financial condition and results of operations.
Water Discharges — On November 3, 2015, the EPA published its final ELG rule to reduce toxic pollutants discharged into waters of the U.S. by power plants. These effluent limitations for existing and new sources include dry handling of fly ash, closed-loop or dry handling of bottom ash and more stringent effluent limitations for flue gas de-sulfurization wastewater. The required compliance time lines for existing sources was to be established between November 1, 2018 and December 31, 2023. On September 18, 2017, the EPA published a final rule delaying certain compliance dates of the ELG rule for two years while it administratively reconsiders the rule. On April 12, 2019, the U.S. Court of Appeals for the Fifth Circuit vacated and remanded portions of EPA’s 2015 ELG Rule related to legacy wastewaters and combustion residual leachate. On November 4, 2019, the EPA signed proposed revisions to the 2015 ELG rule. It is too early to determine whether this proposal or future revisions to the ELG rule will have a material impact on our business or results of operations.
Capital Resources and Liquidity
Overview — As of September 30, 2019, the Company had unrestricted cash and cash equivalents of $1.1 billion, of which $28 million was held at the Parent Company and qualified holding companies. The Company also had $334 million in short-term investments, held primarily at subsidiaries, and restricted cash and debt service reserves of $696 million. The Company also had non-recourse and recourse aggregate principal amounts of debt outstanding of $16.2 billion and $3.6 billion, respectively. Of the approximately $1.9 billion of our current non-recourse debt, $1.6 billion was presented as such because it is due in the next twelve months and $328 million relates to debt considered in default due to covenant violations. None of the defaults are payment defaults, but are instead technical defaults triggered by failure to comply with other covenants or other conditions contained in the non-recourse debt documents due to the bankruptcy of the offtaker.
We expect current maturities of non-recourse debt to be repaid from net cash provided by operating activities of the subsidiary to which the debt relates, through opportunistic refinancing activity, or some combination thereof. We have $5 million of recourse debt which matures within the next twelve months. From time to time, we may elect to repurchase our outstanding debt through cash purchases, privately negotiated transactions or otherwise when management believes that such securities are attractively priced. Such repurchases, if any, will depend on prevailing market conditions, our liquidity requirements and other factors. The amounts involved in any such repurchases may be material.
We rely mainly on long-term debt obligations to fund our construction activities. We have, to the extent available at acceptable terms, utilized non-recourse debt to fund a significant portion of the capital expenditures and investments required to construct and acquire our electric power plants, distribution companies and related assets. Our non-recourse financing is designed to limit cross-default risk to the Parent Company or other subsidiaries and affiliates. Our non-recourse long-term debt is a combination of fixed and variable interest rate instruments. Debt is typically denominated in the currency that matches the currency of the revenue expected to be generated from the benefiting project, thereby reducing currency risk. In certain cases, the currency is matched through the use of derivative instruments. The majority of our non-recourse debt is funded by international commercial banks, with debt capacity supplemented by multilaterals and local regional banks.
Given our long-term debt obligations, the Company is subject to interest rate risk on debt balances that accrue interest at variable rates. When possible, the Company will borrow funds at fixed interest rates or hedge its variable rate debt to fix its interest costs on such obligations. In addition, the Company has historically tried to maintain at least 70% of its consolidated long-term obligations at fixed interest rates, including fixing the interest rate through the use of interest rate swaps. These efforts apply to the notional amount of the swaps compared to the amount of related underlying debt. Presently, the Parent Company’s only material unhedged exposure to variable interest rate debt relates to drawings of $345 million under its senior secured credit facility. On a consolidated basis, of the Company’s $20.1 billion of total gross debt outstanding as of September 30, 2019, approximately $3.7 billion bore interest at variable rates that were not subject to a derivative instrument which fixed the interest rate. Brazil holds $1 billion of our floating rate non-recourse exposure as we have no ability to fix local debt interest rates efficiently.
In addition to utilizing non-recourse debt at a subsidiary level when available, the Parent Company provides a portion, or in certain instances all, of the remaining long-term financing or credit required to fund development, construction or acquisition of a particular project. These investments have generally taken the form of equity investments or intercompany loans, which are subordinated to the project’s non-recourse loans. We generally obtain the funds for these investments from our cash flows from operations, proceeds from the sales of assets and/or the proceeds from our issuances of debt, common stock and other securities. Similarly, in certain of our businesses, the Parent Company may provide financial guarantees or other credit support for the benefit of counterparties who have entered into contracts for the purchase or sale of electricity, equipment, or other services with our subsidiaries or lenders. In such circumstances, if a business defaults on its payment or supply obligation, the Parent Company will be responsible for the business’ obligations up to the amount provided for in the relevant guarantee or other credit support. At September 30, 2019, the Parent Company had provided outstanding financial and performance-related guarantees or other credit support commitments to or for the benefit of our businesses, which were limited by the terms of the agreements, of approximately $645 million in aggregate (excluding those collateralized by letters of credit and other obligations discussed below).
As a result of the Parent Company’s below investment grade rating, counterparties may be unwilling to accept our general unsecured commitments to provide credit support. Accordingly, with respect to both new and existing commitments, the Parent Company may be required to provide some other form of assurance, such as a letter of credit, to backstop or replace our credit support. The Parent Company may not be able to provide adequate assurances to such counterparties. To the extent we are required and able to provide letters of credit or other collateral to such counterparties, this will reduce the amount of credit available to us to meet our other liquidity needs. At September 30, 2019, we had $382 million in letters of credit outstanding provided under our unsecured credit facility and $32 million in letters of credit outstanding provided under our senior secured credit facility. These letters of credit operate to guarantee performance relating to certain project development and construction activities and business operations. During the quarter ended September 30, 2019, the Company paid letter of credit fees ranging from 1% to 3% per annum on the outstanding amounts.
We expect to continue to seek, where possible, non-recourse debt financing in connection with the assets or businesses that we or our affiliates may develop, construct or acquire. However, depending on local and global market conditions and the unique characteristics of individual businesses, non-recourse debt may not be available on economically attractive terms or at all. If we decide not to provide any additional funding or credit support to a subsidiary project that is under construction or has near-term debt payment obligations and that subsidiary is unable to obtain additional non-recourse debt, such subsidiary may become insolvent, and we may lose our investment in that subsidiary. Additionally, if any of our subsidiaries lose a significant customer, the subsidiary may need to withdraw from a project or restructure the non-recourse debt financing. If we or the subsidiary choose not to proceed with a project or are unable to successfully complete a restructuring of the non-recourse debt, we may lose our investment in that subsidiary.
Many of our subsidiaries depend on timely and continued access to capital markets to manage their liquidity needs. The inability to raise capital on favorable terms, to refinance existing indebtedness or to fund operations and other commitments during times of political or economic uncertainty may have material adverse effects on the financial condition and results of operations of those subsidiaries. In addition, changes in the timing of tariff increases or delays in the regulatory determinations under the relevant concessions could affect the cash flows and results of operations of our businesses.
Long-Term Receivables — As of September 30, 2019, the Company had approximately $73 million of accounts receivable classified as Other noncurrent assets. These noncurrent receivables mostly consist of accounts receivable in Argentina that, pursuant to amended agreements or government resolutions, have collection periods that extend beyond September 30, 2020, or one year from the latest balance sheet date. The majority of Argentine receivables have been converted into long-term financing for the construction of power plants. See Note
6—Financing Receivables in Item 1.—Financial Statements of this Form 10-Q and Item 1.—Business—South America SBU—Argentina—Regulatory Framework included in our 2018 Form 10-K for further information.
As of September 30, 2019, the Company had approximately $1.4 billion of loans receivable primarily related to a facility constructed under a build, operate, and transfer contract in Vietnam. This loan receivable represents contract consideration related to the construction of the facility, which was substantially completed in 2015, and will be collected over the 25 year term of the plant’s PPA. See Note 14—Revenue in Item 1.—Financial Statements of this Form 10-Q for further information.
Cash Sources and Uses
The primary sources of cash for the Company in the nine months ended September 30, 2019 were debt financings, cash flow from operating activities, and sales of short-term investments. The primary uses of cash in the nine months ended September 30, 2019 were repayments of debt, capital expenditures, and purchases of short-term investments.
The primary sources of cash for the Company in the nine months ended September 30, 2018 were debt financings, proceeds from sale of business interests, and cash flow from operating activities. The primary uses of cash in the nine months ended September 30, 2018 were repayments of debt, capital expenditures, and purchases of short-term investments.
A summary of cash-based activities are as follows (in millions):
|
| | | | | | | | |
| | Nine Months Ended September 30, |
Cash Sources: | | 2019 | | 2018 |
Issuance of non-recourse debt | | $ | 3,580 |
| | $ | 1,509 |
|
Net cash provided by operating activities | | 1,775 |
| | 1,681 |
|
Borrowings under the revolving credit facilities | | 1,469 |
| | 1,434 |
|
Sale of short-term investments | | 524 |
| | 1,010 |
|
Proceeds from the sale of business interests, net of cash and restricted cash sold | | 226 |
| | 1,796 |
|
Issuance of recourse debt | | — |
| | 1,000 |
|
Other | | 68 |
| | 155 |
|
Total Cash Sources | | $ | 7,642 |
| | $ | 8,585 |
|
| | | | |
Cash Uses: | | | | |
Repayments of non-recourse debt | | $ | (2,978 | ) | | $ | (1,139 | ) |
Capital expenditures | | (1,628 | ) | | (1,592 | ) |
Repayments under the revolving credit facilities | | (1,041 | ) | | (1,595 | ) |
Purchase of short-term investments | | (572 | ) | | (1,215 | ) |
Repayments of recourse debt | | (449 | ) | | (1,781 | ) |
Dividends paid on AES common stock | | (272 | ) | | (258 | ) |
Contributions and loans to equity affiliates | | (258 | ) | | (101 | ) |
Distributions to noncontrolling interests | | (255 | ) | | (199 | ) |
Payments for financed capital expenditures | | (126 | ) | | (186 | ) |
Other | | (225 | ) | | (185 | ) |
Total Cash Uses | | $ | (7,804 | ) | | $ | (8,251 | ) |
Net increase (decrease) in Cash, Cash Equivalents, and Restricted Cash | | $ | (162 | ) | | $ | 334 |
|
Consolidated Cash Flows
The following table reflects the changes in operating, investing, and financing cash flows for the comparative nine month period (in millions):
|
| | | | | | | | | | | |
| Nine Months Ended September 30, |
Cash flows provided by (used in): | 2019 | | 2018 | | $ Change |
Operating activities | $ | 1,775 |
| | $ | 1,681 |
| | $ | 94 |
|
Investing activities | (1,711 | ) | | (190 | ) | | (1,521 | ) |
Financing activities | (133 | ) | | (1,163 | ) | | 1,030 |
|
Operating Activities
Net cash provided by operating activities increased $94 million for the nine months ended September 30, 2019, compared to the nine months ended September 30, 2018.
Operating Cash Flows
(in millions)
| |
(1) | The change in adjusted net income is defined as the variance in net income, net of the total adjustments to net income as shown on the Condensed Consolidated Statements of Cash Flows in Item 1.—Financial Statements of this Form 10-Q. |
| |
(2) | The change in working capital is defined as the variance in total changes in operating assets and liabilities as shown on the Condensed Consolidated Statements of Cash Flows in Item 1.—Financial Statements of this Form 10-Q. |
| |
| Amounts included in the chart above include the results of discontinued operations, where applicable. |
| |
• | Adjusted net income increased $43 million primarily due to the current year gains on insurance proceeds associated with the lightning incident at the Andres facility in 2018 and the Changuinola tunnel leak, and higher margins at our US and Utilities SBU. These impacts were partially offset by lower margins at our South America and MCAC SBUs. |
| |
• | Working capital requirements decreased $51 million, primarily due to higher collections of overdue receivables from distribution companies in the Dominican Republic, higher collections from energy sales on the spot market at Tietê, and lower supplier payments and coal purchases at Gener. These impacts were partially offset by higher insurance receivables at Andres and a decrease in income tax liabilities at Argentina as a result of lower operating margin and income tax rates. |
Investing Activities
Net cash used in investing activities increased $1.5 billion for the nine months ended September 30, 2019, compared to the nine months ended September 30, 2018.
Investing Cash Flows
(in millions)
| |
• | Proceeds from dispositions decreased $1.6 billion, primarily due to the sales of Masinloc, Eletropaulo, Electrica Santiago and the DPL Peaker assets in 2018; partially offset by the sale of the Kilroot and Ballylumford plants in the United Kingdom and the sale of a portion of our interest in a portfolio of sPower’s operating assets in 2019. |
| |
• | Contributions and loans to equity affiliates increased $157 million, primarily due to project funding requirements at sPower. |
| |
• | Cash used for short-term investing activities decreased $157 million, primarily due to the prior year purchases of non-convertible debentures at Tietê to provide project financing for the construction of the Guaimbê Solar Complex. |
| |
• | Capital expenditures increased $36 million, discussed further below. |
Capital Expenditures
(in millions)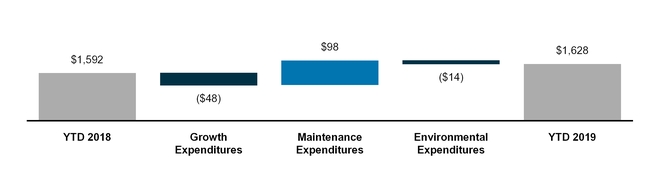
| |
• | Growth expenditures decreased $48 million, primarily due to a decrease in payments for the Southland repowering projects; partially offset by higher investments in solar projects at Distributed Energy. |
| |
• | Maintenance expenditures increased $98 million, primarily at Andres as a result of the steam turbine lightning damage and at Changuinola due to the upgrade of the tunnel lining. |
| |
• | Environmental expenditures decreased $14 million, primarily due to the completion of the ash pond and NPDES projects at IPALCO in the prior year. |
Financing Activities
Net cash used in financing activities decreased $1,030 million for the nine months ended September 30, 2019, compared to the nine months ended September 30, 2018.
Financing Cash Flows
(in millions)
See Note 8—Debt in Item 1—Financial Statements of this Form 10-Q for more information regarding significant debt transactions.
| |
• | The $332 million impact from recourse debt activity is primarily due to higher net repayments of Parent Company debt in the prior year. |
| |
• | The $537 million impact from parent revolver transactions is primarily due to higher net borrowings in 2019 for general corporate cash management activities. |
| |
• | The $232 million impact from non-recourse debt transactions is primarily due to net issuances at Gener, Alto Maipo and DPL, which were partially offset by net repayments at Tietê. |
| |
• | The $53 million impact from non-recourse revolver transactions is primarily due to higher net borrowings at DPL, Andres and IPALCO, which were partially offset by net repayments at Gener. |
Parent Company Liquidity
The following discussion is included as a useful measure of the liquidity available to The AES Corporation, or the Parent Company, given the non-recourse nature of most of our indebtedness. Parent Company Liquidity as outlined below is a non-GAAP measure and should not be construed as an alternative to cash and cash equivalents, which is determined in accordance with GAAP. Parent Company Liquidity may differ from similarly titled measures used by other companies. The principal sources of liquidity at the Parent Company level are dividends and other distributions from our subsidiaries, including refinancing proceeds, proceeds from debt and equity financings at the Parent Company level, including availability under our credit facility, and proceeds from asset sales. Cash requirements at the Parent Company level are primarily to fund interest and principal repayments of debt, construction commitments, other equity commitments, common stock repurchases, acquisitions, taxes, Parent Company overhead and development costs, and dividends on common stock.
The Company defines Parent Company Liquidity as cash available to the Parent Company plus available borrowings under existing credit facility plus cash at qualified holding companies. The cash held at qualified holding companies represents cash sent to subsidiaries of the Company domiciled outside of the U.S. Such subsidiaries have no contractual restrictions on their ability to send cash to the Parent Company. Parent Company Liquidity is reconciled to its most directly comparable GAAP financial measure, cash and cash equivalents, at the periods indicated as follows (in millions):
|
| | | | | | | |
| September 30, 2019 | | December 31, 2018 |
Consolidated cash and cash equivalents | $ | 1,145 |
| | $ | 1,166 |
|
Less: Cash and cash equivalents at subsidiaries | (1,117 | ) | | (1,142 | ) |
Parent Company and qualified holding companies’ cash and cash equivalents | 28 |
| | 24 |
|
Commitments under Parent Company credit facility | 1,100 |
| | 1,100 |
|
Less: Letters of credit under the credit facility | (32 | ) | | (78 | ) |
Less: Borrowings under the credit facility | (345 | ) | | — |
|
Borrowings available under Parent Company credit facility | 723 |
| | 1,022 |
|
Total Parent Company Liquidity | $ | 751 |
| | $ | 1,046 |
|
The Company utilizes its Parent Company credit facility for short term cash needs to bridge the timing of distributions from its subsidiaries throughout the year. We expect that the Parent Company credit facilities’ borrowings will be repaid by the end of year.
The Parent Company paid dividends of $0.1365 per share to its common stockholders during the first, second and third quarters of 2019 for dividends declared in December 2018, and February and July 2019, respectively. While we intend to continue payment of dividends, and believe we will have sufficient liquidity to do so, we can provide no assurance that we will continue to pay dividends, or if continued, the amount of such dividends.
Recourse Debt
Our total recourse debt was $3.6 billion and $3.7 billion as of September 30, 2019 and December 31, 2018, respectively. See Note 8—Debt in Item 1.—Financial Statements of this Form 10-Q and Note 10—Debt in Item 8.—Financial Statements and Supplementary Data of our 2018 Form 10-K for additional detail.
We believe that our sources of liquidity will be adequate to meet our needs for the foreseeable future. This belief is based on a number of material assumptions, including, without limitation, assumptions about our ability to access the capital markets, the operating and financial performance of our subsidiaries, currency exchange rates, power market pool prices, and the ability of our subsidiaries to pay dividends. In addition, our subsidiaries’ ability to declare and pay cash dividends to us (at the Parent Company level) is subject to certain limitations contained in loans, governmental provisions and other agreements. We can provide no assurance that these sources will be available when needed or that the actual cash requirements will not be greater than anticipated. We have met our interim needs for shorter-term and working capital financing at the Parent Company level with our senior secured credit facility. See Item 1A.—Risk Factors—The AES Corporation is a holding company and its ability to make payments on its outstanding indebtedness, including its public debt securities, is dependent upon the receipt of
funds from its subsidiaries by way of dividends, fees, interest, loans or otherwise of the Company’s 2018 Form 10-K for additional information.
Various debt instruments at the Parent Company level, including our senior secured credit facility, contain certain restrictive covenants. The covenants provide for, among other items, limitations on other indebtedness, liens, investments and guarantees; limitations on dividends, stock repurchases and other equity transactions; restrictions and limitations on mergers and acquisitions, sales of assets, leases, transactions with affiliates and off-balance sheet and derivative arrangements; maintenance of certain financial ratios; and financial and other reporting requirements. As of September 30, 2019, we were in compliance with these covenants at the Parent Company level.
Non-Recourse Debt
While the lenders under our non-recourse debt financings generally do not have direct recourse to the Parent Company, defaults thereunder can still have important consequences for our results of operations and liquidity, including, without limitation:
| |
• | reducing our cash flows as the subsidiary will typically be prohibited from distributing cash to the Parent Company during the time period of any default; |
| |
• | triggering our obligation to make payments under any financial guarantee, letter of credit or other credit support we have provided to or on behalf of such subsidiary; |
| |
• | causing us to record a loss in the event the lender forecloses on the assets; and |
| |
• | triggering defaults in our outstanding debt at the Parent Company. |
For example, our senior secured credit facility and outstanding debt securities at the Parent Company include events of default for certain bankruptcy-related events involving material subsidiaries. In addition, our revolving credit agreement at the Parent Company includes events of default related to payment defaults and accelerations of outstanding debt of material subsidiaries.
Some of our subsidiaries are currently in default with respect to all or a portion of their outstanding indebtedness. The total non-recourse debt classified as current in the accompanying Condensed Consolidated Balance Sheets amounts to $1.9 billion. The portion of current debt related to such defaults was $328 million at September 30, 2019, all of which was non-recourse debt related to two subsidiaries — AES Puerto Rico and AES Ilumina. An additional $13 million of debt in default exists at the subsidiary AES Jordan Solar which was classified as a current held-for-sale liability at September 30, 2019. See Note 8—Debt in Item 1.—Financial Statements of this Form 10-Q for additional detail.
None of the subsidiaries that are currently in default are subsidiaries that met the applicable definition of materiality under the Parent Company’s debt agreements as of September 30, 2019, in order for such defaults to trigger an event of default or permit acceleration under the Parent Company’s indebtedness. However, as a result of additional dispositions of assets, other significant reductions in asset carrying values or other matters in the future that may impact our financial position and results of operations or the financial position of the individual subsidiary, it is possible that one or more of these subsidiaries could fall within the definition of a “material subsidiary” and thereby trigger an event of default and possible acceleration of the indebtedness under the Parent Company’s outstanding debt securities. A material subsidiary is defined in the Parent Company’s senior secured credit facility as any business that contributed 20% or more of the Parent Company’s total cash distributions from businesses for the four most recently ended fiscal quarters. As of September 30, 2019, none of the defaults listed above individually or in the aggregate results in or is at risk of triggering a cross-default under the recourse debt of the Parent Company.
Critical Accounting Policies and Estimates
The condensed consolidated financial statements of AES are prepared in conformity with U.S. GAAP, which requires the use of estimates, judgments and assumptions that affect the reported amounts of assets and liabilities at the date of the financial statements and the reported amounts of revenue and expenses during the periods presented.
Leases — Under the accounting standard for leases, the Company recognizes operating and finance right-of-use assets and lease liabilities on the Consolidated Balance Sheets for most leases with an initial term of greater than 12 months. Lease liabilities and their corresponding right-of-use assets are recorded based on the present value of lease payments over the expected lease term. Our subsidiaries’ incremental borrowing rates are used in determining the present value of lease payments when the implicit rate is not readily determinable. Certain adjustments to the right-of-use asset may be required for items such as prepayments, lease incentives or initial
direct costs. For further information regarding the nature of our leases and our critical accounting policies effecting leases, see Note 10—Leases included in Item 1.—Financial Statements of this Form 10-Q.
The Company’s significant accounting policies are described in Note 1—General and Summary of Significant Accounting Policies of our 2018 Form 10-K. The Company’s critical accounting estimates are described in Item 7.—Management’s Discussion and Analysis of Financial Condition and Results of Operations in the 2018 Form 10-K. An accounting estimate is considered critical if the estimate requires management to make an assumption about matters that were highly uncertain at the time the estimate was made, different estimates reasonably could have been used, or if changes in the estimate that would have a material impact on the Company’s financial condition or results of operations are reasonably likely to occur from period to period. Management believes that the accounting estimates employed are appropriate and resulting balances are reasonable; however, actual results could differ from the original estimates, requiring adjustments to these balances in future periods. The Company has reviewed and determined that these remain as critical accounting policies as of and for the nine months ended September 30, 2019.
ITEM 3. QUANTITATIVE AND QUALITATIVE DISCLOSURES ABOUT MARKET RISK
Overview Regarding Market Risks — Our businesses are exposed to and proactively manage market risk. Our primary market risk exposure is to the price of commodities, particularly electricity, oil, natural gas, coal and environmental credits. In addition, our businesses are exposed to lower electricity prices due to increased competition, including from renewable sources such as wind and solar, as a result of lower costs of entry and lower variable costs. We operate in multiple countries and as such, are subject to volatility in exchange rates at varying degrees at the subsidiary level and between our functional currency, the U.S. dollar, and currencies of the countries in which we operate. We are also exposed to interest rate fluctuations due to our issuance of debt and related financial instruments.
The disclosures presented in this Item 3 are based upon a number of assumptions; actual effects may differ. The safe harbor provided in Section 27A of the Securities Act of 1933 and Section 21E of the Exchange Act shall apply to the disclosures contained in this Item 3. For further information regarding market risk, see Item 1A.—Risk Factors, Our financial position and results of operations may fluctuate significantly due to fluctuations in currency exchange rates experienced at our foreign operations, Wholesale power prices are declining in many markets and this could have a material adverse effect on our operations and opportunities for future growth, We may not be adequately hedged against our exposure to changes in commodity prices or interest rates, and Certain of our businesses are sensitive to variations in weather and hydrology of the 2018 Form 10-K.
Commodity Price Risk — Although we prefer to hedge our exposure to the impact of market fluctuations in the price of electricity, fuels and environmental credits, some of our generation businesses operate under short-term sales or under contract sales that leave an unhedged exposure on some of our capacity or through imperfect fuel pass-throughs. These businesses subject our operational results to the volatility of prices for electricity, fuels and environmental credits in competitive markets. We employ risk management strategies to hedge our financial performance against the effects of fluctuations in energy commodity prices. The implementation of these strategies can involve the use of physical and financial commodity contracts, futures, swaps and options.
The portion of our sales and purchases that are not subject to such agreements or contracted businesses where indexation is not perfectly matched to business drivers will be exposed to commodity price risk. When hedging the output of our generation assets, we utilize contract sales that lock in the spread per MWh between variable costs and the price at which the electricity can be sold.
AES businesses will see changes in variable margin performance as global commodity prices shift. For 2019, we project pre-tax earnings exposure on a 10% move in commodity prices would be less than $5 million for U.S. power, less than $5 million for natural gas, less than $5 million for oil, and less than $(5) million for coal. Our estimates exclude correlation of oil with coal or natural gas. For example, a decline in oil or natural gas prices can be accompanied by a decline in coal price if commodity prices are correlated. In aggregate, the Company’s downside exposure occurs with lower power, lower oil, higher natural gas, and higher coal prices. Exposures at individual businesses will change as new contracts or financial hedges are executed, and our sensitivity to changes in commodity prices generally increases in later years with reduced hedge levels at some of our businesses.
Commodity prices affect our businesses differently depending on the local market characteristics and risk management strategies. Spot power prices, contract indexation provisions and generation costs can be directly or indirectly affected by movements in the price of natural gas, oil and coal. We have some natural offsets across our businesses such that low commodity prices may benefit certain businesses and be a cost to others. Exposures are not perfectly linear or symmetric. The sensitivities are affected by a number of local or indirect market factors. Examples of these factors include hydrology, local energy market supply/demand balances, regional fuel supply
issues, regional competition, bidding strategies and regulatory interventions such as price caps. Operational flexibility changes the shape of our sensitivities. For instance, certain power plants may limit downside exposure by reducing dispatch in low market environments. Volume variation also affects our commodity exposure. The volume sold under contracts or retail concessions can vary based on weather and economic conditions resulting in a higher or lower volume of sales in spot markets. Thermal unit availability and hydrology can affect the generation output available for sale and can affect the marginal unit setting power prices.
In the US and Utilities SBU, the generation businesses are largely contracted, but may have residual risk to the extent contracts are not perfectly indexed to the business drivers. At Southland, our primary contracts are in capacity and it has seen incremental location value in energy revenues; this will continue until 2020 when our Southland repowering project and contract begin.
In the South America SBU, our business in Chile owns assets in the central and northern regions of the country and has a portfolio of contract sales in both. In the central region, the contract sales generally cover the efficient generation from our coal-fired and hydroelectric assets. Any residual spot price risk will primarily be driven by the amount of hydrological inflows. In the case of low hydroelectric generation, spot price exposure is capped by the ability to dispatch our diesel assets, the price of which depends on fuel pricing at the time required. Under normal hydrology conditions, coal-firing generation sets the price. However, when there are spikes in price due to lower hydrology and higher demand, gas or oil-linked fuels generally set power prices. In Colombia, we operate under a shorter-term sales strategy and have commodity exposure to unhedged volumes. Because we own hydroelectric assets there, contracts are not indexed to fuel. Additionally, in Brazil, the hydroelectric generating facility is covered by contract sales. Under normal hydrological volatility, spot price risk is mitigated through a regulated sharing mechanism across all hydroelectric generators in the country. Under drier conditions, the sharing mechanism may not be sufficient to cover the business' contract position, and therefore it may have to purchase power at spot prices driven by the cost of thermal generation.
In the MCAC SBU, our businesses have commodity exposure on unhedged volumes. Panama is highly contracted under a portfolio of fixed volume contract sales. To the extent hydrological inflows are greater than or less than the contract sales volume, the business will be sensitive to changes in spot power prices which may be driven by oil prices in some time periods. In the Dominican Republic, we own natural gas-fired assets contracted under a portfolio of contract sales and a coal-fired asset contracted with a single contract, and both contract and spot prices may move with commodity prices. Additionally, the contract levels do not always match our generation availability and our assets may be sellers of spot prices in excess of contract levels or a net buyer in the spot market to satisfy contract obligations.
In the Eurasia SBU, our Mong Duong business has minimal exposure to commodity price risk as it has no merchant exposure and fuel is subject to a pass-through mechanism.
Foreign Exchange Rate Risk — In the normal course of business, we are exposed to foreign currency risk and other foreign operations risks that arise from investments in foreign subsidiaries and affiliates. A key component of these risks stems from the fact that some of our foreign subsidiaries and affiliates utilize currencies other than our consolidated reporting currency, the USD. Additionally, certain of our foreign subsidiaries and affiliates have entered into monetary obligations in USD or currencies other than their own functional currencies. Certain of our foreign subsidiaries calculate and pay taxes in currencies other than their own functional currency. We have varying degrees of exposure to changes in the exchange rate between the USD and the following currencies: Argentine peso, Brazilian real, Chilean peso, Colombian peso, Dominican peso, Euro, Indian rupee, and Mexican peso. These subsidiaries and affiliates have attempted to limit potential foreign exchange exposure by entering into revenue contracts that adjust to changes in foreign exchange rates. We also use foreign currency forwards, swaps and options, where possible, to manage our risk related to certain foreign currency fluctuations.
AES enters into foreign currency hedges to protect economic value of the business and minimize the impact of foreign exchange rate fluctuations to AES’ portfolio. While protecting cash flows, the hedging strategy is also designed to reduce forward looking earnings foreign exchange volatility. Due to variation of timing and amount between cash distribution and earnings exposure, the hedge impact may not fully cover the earnings exposure on a realized basis which could result in greater volatility in earnings. The largest foreign exchange risks over the remaining period of 2019 stem from the following currencies: Brazilian real, Colombian peso, Euro, and Indian rupee. As of September 30, 2019, assuming a 10% USD appreciation, cash distributions attributable to foreign subsidiaries exposed to movement in the exchange rate of the Brazilian real, Colombian peso, Euro, and Indian rupee each are projected to be impacted by less than $5 million. These numbers have been produced by applying a one-time 10% USD appreciation to forecasted exposed cash distributions for 2019 coming from the respective subsidiaries exposed to the currencies listed above, net of the impact of outstanding hedges and holding all other variables constant. The numbers presented above are net of any transactional gains/losses. These sensitivities
may change in the future as new hedges are executed or existing hedges are unwound. Additionally, updates to the forecasted cash distributions exposed to foreign exchange risk may result in further modification. The sensitivities presented do not capture the impacts of any administrative market restrictions or currency inconvertibility.
Interest Rate Risks — We are exposed to risk resulting from changes in interest rates as a result of our issuance of variable and fixed-rate debt, as well as interest rate swap, cap, floor and option agreements.
Decisions on the fixed-floating debt mix are made to be consistent with the risk factors faced by individual businesses or plants. Depending on whether a plant’s capacity payments or revenue stream is fixed or varies with inflation, we partially hedge against interest rate fluctuations by arranging fixed-rate or variable-rate financing. In certain cases, particularly for non-recourse financing, we execute interest rate swap, cap and floor agreements to effectively fix or limit the interest rate exposure on the underlying financing. Most of our interest rate risk is related to non-recourse financings at our businesses.
As of September 30, 2019, the portfolio’s pre-tax earnings exposure for 2019 to a one-time 100-basis-point increase in interest rates for our Argentine peso, Brazilian real, Chilean peso, Colombian peso, Euro, and USD denominated debt would be approximately $5 million on interest expense for the debt denominated in these currencies. These amounts do not take into account the historical correlation between these interest rates.
ITEM 4. CONTROLS AND PROCEDURES
Evaluation of Disclosure Controls and Procedures — The Company, under the supervision and with the participation of its management, including the Company’s Chief Executive Officer (“CEO”) and Chief Financial Officer (“CFO”), evaluated the effectiveness of its “disclosure controls and procedures,” as such term is defined in Rule 13a-15(e) under the Exchange Act, as of the end of the period covered by this Quarterly Report on Form 10-Q. Based on that evaluation, our CEO and CFO have concluded that our disclosure controls and procedures were effective as of September 30, 2019, to ensure that information required to be disclosed by the Company in reports that we file or submit under the Exchange Act is recorded, processed, summarized and reported within the time periods specified in SEC rules and forms, and include controls and procedures designed to ensure that information required to be disclosed by us in such reports is accumulated and communicated to our management, including our CEO and CFO, as appropriate, to allow timely decisions regarding required disclosures.
Changes in Internal Controls over Financial Reporting — There were no changes that occurred during the fiscal quarter covered by this Quarterly Report on Form 10-Q that have materially affected, or are reasonably likely to materially affect, our internal control over financial reporting.
PART II: OTHER INFORMATION
ITEM 1. LEGAL PROCEEDINGS
The Company is involved in certain claims, suits and legal proceedings in the normal course of business. The Company has accrued for litigation and claims when it is probable that a liability has been incurred and the amount of loss can be reasonably estimated. The Company believes, based upon information it currently possesses and taking into account established reserves for estimated liabilities and its insurance coverage, that the ultimate outcome of these proceedings and actions is unlikely to have a material adverse effect on the Company's condensed consolidated financial statements. It is reasonably possible, however, that some matters could be decided unfavorably to the Company and could require the Company to pay damages or make expenditures in amounts that could be material, but cannot be estimated as of September 30, 2019.
In December 2001, Grid Corporation of Odisha (“GRIDCO”) served a notice to arbitrate pursuant to the Indian Arbitration and Conciliation Act of 1996 on the Company, AES Orissa Distribution Private Limited (“AES ODPL”), and Jyoti Structures (“Jyoti”) pursuant to the terms of the shareholders agreement between GRIDCO, the Company, AES ODPL, Jyoti and the Central Electricity Supply Company of Orissa Ltd. (“CESCO”), an affiliate of the Company. In the arbitration, GRIDCO asserted that a comfort letter issued by the Company in connection with the Company's indirect investment in CESCO obligates the Company to provide additional financial support to cover all of CESCO's financial obligations to GRIDCO. GRIDCO appeared to be seeking approximately $189 million in damages, plus undisclosed penalties and interest, but a detailed alleged damage analysis was not filed by GRIDCO. The Company counterclaimed against GRIDCO for damages. In June 2007, a 2-to-1 majority of the arbitral tribunal rendered its award rejecting GRIDCO's claims and holding that none of the respondents, the Company, AES ODPL, or Jyoti, had any liability to GRIDCO. The respondents' counterclaims were also rejected. A majority of the tribunal later awarded the respondents, including the Company, some of their costs relating to the arbitration. GRIDCO filed challenges of the tribunal's awards with the local Indian court. GRIDCO's challenge of the costs award has been dismissed by the court, but its challenge of the liability award remains pending. A hearing on the liability award has not taken place to date. The Company believes that it has meritorious defenses to the claims asserted against it and will defend itself vigorously in these proceedings; however, there can be no assurances that it will be successful in its efforts.
Pursuant to their environmental audit, AES Sul and AES Florestal discovered 200 barrels of solid creosote waste and other contaminants at a pole factory that AES Florestal had been operating. The conclusion of the audit was that a prior operator of the pole factory, Companhia Estadual de Energia (“CEEE”), had been using those contaminants to treat the poles that were manufactured at the factory. On their initiative, AES Sul and AES Florestal communicated with Brazilian authorities and CEEE about the adoption of containment and remediation measures. In March 2008, the State Attorney of the state of Rio Grande do Sul, Brazil filed a public civil action against AES Sul, AES Florestal and CEEE seeking an order requiring the companies to mitigate the contaminated area located on the grounds of the pole factory and an indemnity payment of approximately R$6 million ($1 million). In October 2011, the State Attorney filed a request for an injunction ordering the defendant companies to contain and remove the contamination immediately. The court granted injunctive relief on October 18, 2011, but determined that only CEEE was required to perform the removal work. In May 2012, CEEE began the removal work in compliance with the injunction. The case is now awaiting judgment. The removal costs are estimated to be approximately R$29 million ($7 million), and there could be additional remediation costs which cannot be estimated at this time. In June 2016, the Company sold AES Sul to CPFL Energia S.A. and as part of the sale, AES Guaiba, a holding company of AES Sul, retained the potential liability relating to this matter. The Company believes that there are meritorious defenses to the claims asserted against it and will defend itself vigorously in these proceedings; however, there can be no assurances that it will be successful in its efforts.
In January 2015, DPL received NOVs from the EPA alleging violations of opacity at Stuart and Killen Stations, and in October 2015, IPL received a similar NOV alleging violations at Petersburg Station. In February 2017, the EPA issued a second NOV for DPL Stuart Station, alleging violations of opacity in 2016. Moreover, in February 2016, IPL received an NOV from the EPA alleging violations of NSR and other CAA regulations, the Indiana SIP, and the Title V operating permit at Petersburg Station. It is too early to determine whether the NOVs could have a material impact on our business, financial condition or results of our operations. IPL would seek recovery of any operating or capital expenditures, but not fines or penalties, related to air pollution control technology to reduce regulated air emissions; however, there can be no assurances that IPL would be successful in this regard.
In September 2015, AES Southland Development, LLC and AES Redondo Beach, LLC filed a lawsuit against the California Coastal Commission (the “CCC”) over the CCC's determination that the site of AES Redondo Beach included approximately 5.93 acres of CCC-jurisdictional wetlands. The CCC has asserted that AES Redondo Beach has improperly installed and operated water pumps affecting the alleged wetlands in violation of the California Coastal Act and Redondo Beach Local Coastal Program and has ordered AES Redondo Beach to restore the site.
Additional potential outcomes of the CCC determination could include an order requiring AES Redondo Beach to fund a wetland mitigation project and/or pay fines or penalties. AES Redondo Beach believes that it has meritorious arguments and intends to vigorously prosecute such lawsuit, but there can be no assurances that it will be successful.
In October 2015, Ganadera Guerra, S.A. (“GG”) and Constructora Tymsa, S.A. (“CT”) filed separate lawsuits against AES Panama in the local courts of Panama. The claimants allege that AES Panama profited from a hydropower facility (La Estrella) being partially located on land owned initially by GG and currently by CT, and that AES Panama must pay compensation for its use of the land. The damages sought from AES Panama are approximately $685 million (GG) and $100 million (CT). In October 2016, the court dismissed GG's claim because of GG's failure to comply with a court order requiring GG to disclose certain information. GG has refiled its lawsuit. Also, there are ongoing administrative proceedings concerning whether AES Panama is entitled to acquire an easement over the land and whether AES Panama can continue to occupy the land. AES Panama believes it has meritorious defenses and claims and will assert them vigorously; however, there can be no assurances that it will be successful in its efforts.
In January 2017, the Superintendencia del Medio Ambiente (“SMA”) issued a Formulation of Charges asserting that Alto Maipo is in violation of certain conditions of the Environmental Approval Resolution (“RCA”) governing the construction of Alto Maipo’s hydropower project, for, among other things, operating vehicles at unauthorized times and failing to mitigate the impact of water infiltration during tunnel construction (“Infiltration Water”). In February 2017, Alto Maipo submitted a compliance plan (“Compliance Plan”) to the SMA which, if approved by the agency, would resolve the matter without materially impacting construction of the project. In April 2018, the SMA approved the Compliance Plan (“April 2018 Approval”). Among other things, the Compliance Plan as approved by the SMA requires Alto Maipo to obtain from the Environmental Evaluation Service (“SEA”) a definitive interpretation of the RCA’s provisions concerning the authorized times to operate certain vehicles. In addition, Alto Maipo must obtain the SEA’s final approval concerning the control, discharge, and treatment of Infiltration Water. Alto Maipo continues to seek the relevant final approvals from the SEA. In May 2018, three lawsuits were filed with the Environmental Court of Santiago (“ECS”) challenging the April 2018 Approval. Alto Maipo does not believe that there are grounds to challenge the April 2018 Approval. The ECS has not decided the lawsuits to date. In July 2019, a separate lawsuit was filed in the Court of Appeals of Santiago (“CAS”) seeking emergency relief to invalidate the April 2018 Approval. Alto Maipo believes there is no merit to the lawsuit, which remains pending. Furthermore, in September 2019, a petition was filed in the CAS requesting an order stopping certain construction works immediately. The CAS rejected the petition. If Alto Maipo complies with the requirements of the Compliance Plan, and if the above-referenced lawsuits are dismissed, the Formulation of Charges will be discharged without penalty. Otherwise, Alto Maipo could be subject to penalties, and the construction of the project could be negatively impacted. Alto Maipo will pursue its interests vigorously in these matters; however, there can be no assurances that it will be successful in its efforts.
In June 2017, Alto Maipo terminated one of its contractors, Constructora Nuevo Maipo S.A. (“CNM”), given CNM’s stoppage of tunneling works, its failure to produce a completion plan, and its other breaches of contract. Also, Alto Maipo drew $73 million under letters of credit (“LC Funds”) in connection with its termination of CNM. Alto Maipo is pursuing arbitration against CNM to recover excess completion costs and other damages totaling at least $236 million (net of the LC Funds) relating to CNM’s breaches (“First Arbitration”). CNM denies liability and seeks a declaration that its termination was wrongful, damages that it alleges result from that termination, and other relief. CNM alleges that it is entitled to damages ranging from $70 million to $170 million (which include the LC Funds) plus interest and costs, based on various scenarios. Alto Maipo has contested these submissions. The evidentiary hearing in the First Arbitration took place May 20-31, 2019. Post-hearing briefs were submitted in September 2019, and closing arguments may be scheduled in the future. One of the three arbitrators on the arbitral Tribunal has been replaced and the new Tribunal will consider how to take matters forward, including whether to repeat the May 2019 evidentiary hearing. Also, in August 2018, CNM purported to initiate a separate arbitration against AES Gener and the Company (“Second Arbitration”). In the Second Arbitration, CNM seeks to pierce Alto Maipo’s corporate veil and appears to seek an award holding AES Gener and the Company jointly and severally liable to pay any alleged net amounts that are found to be due to CNM in the First Arbitration or otherwise. The Second Arbitration has been consolidated into the First Arbitration. The arbitral Tribunal has bifurcated the Second Arbitration to determine in the first instance the jurisdictional objections raised by AES Gener and the Company to CNM’s piercing claims. The hearing on the jurisdictional objections was previously scheduled to take place in March 2020. However, the Second Arbitration has been temporarily suspended and, therefore, the jurisdictional hearing and other deadlines in the proceeding may be extended. Each of Alto Maipo, AES Gener, and the Company believes it has meritorious claims and/or defenses and will pursue its interests vigorously; however, there can be no assurances that each will be successful in its efforts.
In October 2017, the Maritime Prosecution Office from Valparaíso issued a ruling alleging responsibility by AES Gener for the presence of coal waste on Ventanas beach, and proposed a fine before the Maritime Governor, of approximately $380,000. AES Gener submitted its statement of defense, denying the allegations. An evidentiary stage was concluded and then re-opened by order of the Maritime Governor on February 5, 2019 to allow AES Gener a six-month period to present reports and other evidence to challenge the grounds of the ruling. In September 2019, this period was extended for an additional six months, in order to allow the execution of a field test in the bay of Ventanas. AES Gener believes that it has meritorious defenses to the allegations; however, there are no assurances that it will be successful in defending this action.
In February 2018, Tau Power B.V. and Altai Power LLP (collectively, “AES Claimants”) initiated arbitration against the Republic of Kazakhstan (“ROK”) for the ROK’s failure to pay approximately $75 million (“Return Transfer Payment”) for the return of two hydropower plants (“HPPs”) pursuant to a concession agreement. The ROK has responded by denying liability and asserting purported counterclaims concerning the annual payment provisions in the concession agreement, a bonus allegedly due for the 1997 takeover of the HPPs, and dividends paid by the HPPs. The ROK seeks to recover the Return Transfer Payment (which is in an escrow account maintained by a third party) and appears to be seeking over $500 million on its counterclaims. The AES Claimants believe that the ROK’s defenses and counterclaims are without merit and have contested the ROK’s submissions on these issues. An arbitrator was appointed to decide the case. The final evidentiary hearing took place July 22-26, 2019. The parties are awaiting the arbitrator’s decision. The AES Claimants will pursue their case and assert their defenses vigorously; however, there can be no assurances that they will be successful in their efforts.
In December 2018, a lawsuit was filed in Dominican Republic civil court against the Company, AES Puerto Rico, and three other AES affiliates. The lawsuit purports to be brought on behalf of over 100 Dominican claimants, living and deceased, and appears to seek relief relating to CCRs that were delivered to the Dominican Republic in 2004. The lawsuit generally alleges that the CCRs caused personal injuries and deaths and demands $476 million in alleged damages. The lawsuit does not identify, or provide any supporting information concerning, the alleged injuries of the claimants individually. Nor does the lawsuit provide any information supporting the demand for damages or explaining how the quantum was derived. The relevant AES companies believe that they have meritorious defenses to the claims asserted against them and will defend themselves vigorously in this proceeding; however, there can be no assurances that they will be successful in their efforts.
In February 2019, a separate lawsuit was filed in Dominican Republic civil court against the Company, AES Puerto Rico, two other AES affiliates, and an unaffiliated company and its principal. The lawsuit purports to be brought on behalf of over 200 Dominican claimants, living and deceased, and appears to seek relief relating to CCRs that were delivered to the Dominican Republic in 2003 and 2004. The lawsuit generally alleges that the CCRs caused personal injuries and deaths and demands $900 million in alleged damages. The lawsuit does not identify, or provide any supporting information concerning, the alleged injuries of the claimants individually. Nor does the lawsuit provide any information supporting the demand for damages or explaining how the quantum was derived. The relevant AES companies believe that they have meritorious defenses to the claims asserted against them and will defend themselves vigorously in this proceeding; however, there can be no assurances that they will be successful in their efforts.
In March 2019, the Puerto Rico Department of Natural and Environmental Resources (“DNER”) issued an Administrative Order, which later amended (collectively, the “DNER Order”), alleging that AES Puerto Rico, LP (“AES Puerto Rico”) failed to comply with certain DNER requests for documents and information, that AES Puerto Rico has contaminated groundwater in excess of certain state water quality standards, and requesting AES Puerto Rico to submit a corrective/remedial action plan for DNER’s review and approval, among others. The DNER Order also proposes an administrative fine of $160,000. In April 2019, AES Puerto Rico timely filed its response to the DNER Order contesting the alleged violations and the proposed fine and also moved to dismiss the case. The Hearing Examiner assigned to the case denied AES Puerto Rico’s request for dismissal. The case is currently in discovery, and is awaiting the scheduling of the administrative hearing. AES Puerto Rico believes that it has meritorious defenses, but there are no assurances that it will be successful in defending this action.
On October 1, 2019, the Superintendency of the Environment (the "SMA") notified AES Gener of certain alleged breaches associated with the environmental permit of the Ventanas Complex, initiating a sanctioning process through Exempt Resolution N° 1 / ROL D-129-2019. The alleged charges include exceeding generation limits, failing to reduce emissions during episodes of poor air quality, exceeding limits on discharges to the sea, and exceeding noise limits. As the charges are currently classified, the maximum fine is approximately $6.5 million. On October 14, 2019, the SMA notified AES Gener of other alleged breaches at the Guacolda Complex under Exempt Resolution N° 1 / ROL D-146-2019. These allegations include failure to comply with all measures to mitigate atmospheric emissions, failure to comply with mitigation measures to avoid solid fuel discharges to the sea, failure
to perform temperature monitoring in intake and water discharge at Unit 3, and a one-day exceedance of the seawater discharge limits. As the Guacolda charges are currently classified, the maximum fine is approximately $4 million. For each complex, additional fines are possible if the SMA determines that non-compliance resulted in an economic benefit. Under applicable regulations, for each complex, AES Gener may submit a proposed "Compliance Program" to the SMA, and if approved by the SMA and satisfactorily fulfilled by the company, the process would be filed without sanctions and not generate further actions; however, there are no assurances that the SMA would approve any Compliance Program submitted by the company.
ITEM 1A. RISK FACTORS
There have been no material changes to the risk factors disclosed in Item 1A.—Risk Factors of our 2018 Form 10-K.
ITEM 2. UNREGISTERED SALES OF EQUITY SECURITIES AND USE OF PROCEEDS
The Board has authorized the Company to repurchase stock through a variety of methods, including open market repurchases, purchases by contract (including, without limitation, accelerated stock repurchase programs or 10b5-1 plans) and/or privately negotiated transactions. There can be no assurances as to the amount, timing or prices of repurchases, which may vary based on market conditions and other factors. The Program does not have an expiration date and can be modified or terminated by the Board of Directors at any time. As of September 30, 2019, $264 million remained available for repurchase under the Program. No repurchases were made by the AES Corporation of its common stock during the third quarter of 2019.
ITEM 3. DEFAULTS UPON SENIOR SECURITIES
None.
ITEM 4. MINE SAFETY DISCLOSURES
Not applicable.
ITEM 5. OTHER INFORMATION
None.
ITEM 6. EXHIBITS
|
| | |
31.1 | | |
31.2 | | |
32.1 | | |
32.2 | | |
101 | | The AES Corporation Quarterly Report on Form 10-Q for the quarter ended September 30, 2019, formatted in Inline XBRL (Inline Extensible Business Reporting Language): (i) the Cover Page, (ii) Condensed Consolidated Balance Sheets, (iii) Condensed Consolidated Statements of Operations, (iv) Condensed Consolidated Statements of Comprehensive Income (Loss), (v) Condensed Consolidated Statements of Changes in Equity, (vi) Condensed Consolidated Statements of Cash Flows, and (vii) Notes to Condensed Consolidated Financial Statements. The instance document does not appear in the Interactive Data File because its XBRL tags are embedded within the Inline XBRL document. |
104 | | Cover Page Interactive Data File (formatted as Inline XBRL and contained in Exhibit 101) |
SIGNATURES
Pursuant to the requirements of the Securities Exchange Act of 1934, the registrant has duly caused this report to be signed on its behalf by the undersigned thereunto duly authorized.
|
| | | | | |
| | THE AES CORPORATION (Registrant) |
| | | | | |
Date: | November 5, 2019 | By: | | /s/ GUSTAVO PIMENTA |
| | | | Name: | Gustavo Pimenta |
| | | | Title: | Executive Vice President and Chief Financial Officer (Principal Financial Officer) |
| | | | | |
| | By: | | /s/ SARAH R. BLAKE |
| | | | Name: | Sarah R. Blake |
| | | | Title: | Vice President and Controller (Principal Accounting Officer) |