EXHIBIT 99.2
PowerPoint slide presentation dated April 25, 2012.


UNITED STATES SECURITIES AND EXCHANGE COMMISSION
Washington, D.C. 20549
Form 8-KCURRENT REPORT
PURSUANT TO SECTION 13 OR 15(d) OF THE
SECURITIES EXCHANGE ACT OF 1934
Date of Report (Date of earliest event reported):
April 25, 2012
THE JONES GROUP INC.
|
Pennsylvania (State or Other Jurisdiction of Incorporation) |
1-10746 (Commission File Number) |
06-0935166 (IRS Employer Identification No.) |
| 1411 Broadway New York, New York 10018 (Address of principal executive offices) |
||
| (212) 642-3860
(Registrant's telephone number, including area code) |
||
| Not Applicable
Former name or former address, if changed since last report |
Check the appropriate box below if the Form 8-K filing is intended to simultaneously satisfy the filing obligation of the registrant under any of the following provisions:
[ ] Written communications pursuant to Rule 425 under the Securities Act (17
CFR 230.425)
[ ] Soliciting material pursuant to Rule 14a-12 under the Exchange Act (17 CFR
240.14a-12)
[ ] Pre-commencement communications pursuant to Rule 14d-2(b) under the
Exchange Act (17 CFR 240.14d-2(b))
[ ] Pre-commencement communications pursuant to Rule 13e-4(c) under the
Exchange Act (17 CFR 240.13e-4(c))
Item 2.02 Results of Operations and Financial Condition.
On April 25, 2012, The Jones Group Inc. (the "Company") issued a press release reporting its results of operations for the fiscal quarter ended March 31, 2012.
A copy of the press release is attached as Exhibit 99.1 to this report.
This information shall not be deemed "filed" for purposes of Section 18 of the Securities Exchange Act of 1934, as amended (the "Exchange Act"), or incorporated by reference in any filing under the Securities Act of 1933, as amended, or the Exchange Act, except as shall be expressly set forth by specific reference in such a filing.
The press release attached as Exhibit 99.1 contains non-GAAP financial measures within the meaning of Regulation G promulgated by the Securities and Exchange Commission. For purposes of Regulation G, a non-GAAP financial measure is a numerical measure of a company's performance, financial position, or cash flows that either excludes or includes amounts that are not normally excluded or included in the most directly comparable measure calculated and presented in accordance with generally accepted accounting principles. To supplement the Company's consolidated financial statements presented in accordance with GAAP, it is presenting non-GAAP information regarding the effect on earnings per share from costs related to, among other things:
severance, fixed asset impairment and other charges and credits related to the closure of underperforming retail locations;
the amortization of certain acquired intangible assets from the acquisitions of KG Group Holdings Limited ("Kurt Geiger") and Stuart Weitzman Holdings, LLC ("Stuart Weitzman") and the fair value adjustment of the contingent consideration payable for the Stuart Weitzman and Moda Nicola International, LLC ("Robert Rodriguez") acquisitions;
investment consulting fees, legal fees, accounting fees and other items related to acquisitions and other business development activities;
severance and restricted stock amortization related to executive management changes;
present value accruals and adjustments for liabilities related to leases on properties currently not in use;
severance and other expenses associated with the closure of the Texas and Rhode Island warehouses; and
severance, occupancy, and other costs related to the exit from or restructuring of certain other product lines and other charges not considered by management to be part of ongoing operations.
These non-GAAP measures are provided to enhance the user's overall understanding of the Company's current financial performance. Specifically, the Company believes the non-GAAP results provide useful information to both management and investors by excluding certain expenses that may not be indicative of the Company's core operating results. In addition, because the Company has historically reported certain non-GAAP results to investors, the Company believes the inclusion of non-GAAP numbers provides consistency in its financial reporting. These measures should be considered in addition to results prepared in accordance with GAAP, but are not a substitute for or superior to GAAP results. The non-GAAP measures of adjusted net income and adjusted diluted earnings per share included in the attached press release have been reconciled to the equivalent GAAP measure.
Item 7.01 Regulation FD Disclosure.
PowerPoint Slide Presentation
A copy of the PowerPoint slide presentation to be made during the conference call with Company management on April 25, 2012 concerning the Company's results of operation for the fiscal quarter ended March 31, 2012 is attached as Exhibit 99.2 to this report.
This information shall not be deemed "filed" for purposes of Section 18 of the Securities Exchange Act of 1934, as amended (the "Exchange Act"), or incorporated by reference in any filing under the Securities Act of 1933, as amended (the "Securities Act"), or the Exchange Act, except as shall be expressly set forth by specific reference in such a filing.
Item 9.01 Financial Statements and Exhibits.
| Exhibit No. | Description |
| 99.1 | Press Release of the Registrant dated April 25, 2012. |
| 99.2 | PowerPoint slide presentation dated April 25, 2012. |
2
SIGNATURES
Pursuant to the requirements of the Securities Exchange Act of 1934, the registrant has duly caused this report to be signed on its behalf by the undersigned hereunto duly authorized.
| THE JONES GROUP INC. (Registrant) By: /s/ John T. McClain |
Date: April 25, 2012
3
Exhibit Index
| Exhibit No. | Description |
| 99.1 | Press Release of the Registrant dated April 25, 2012. |
| 99.2 | PowerPoint slide presentation dated April 25, 2012. |
4
EXHIBIT 99.1
FOR IMMEDIATE RELEASE
The Jones Group Inc.
Investor Contact:
John T. McClain, Chief Financial Officer
The Jones Group
(212) 703-9189
Media Contacts:
Joele Frank and Sharon Stern
Joele Frank, Wilkinson Brimmer Katcher
(212) 355-4449
THE JONES GROUP INC. REPORTS 2012 FIRST QUARTER FINANCIAL RESULTS
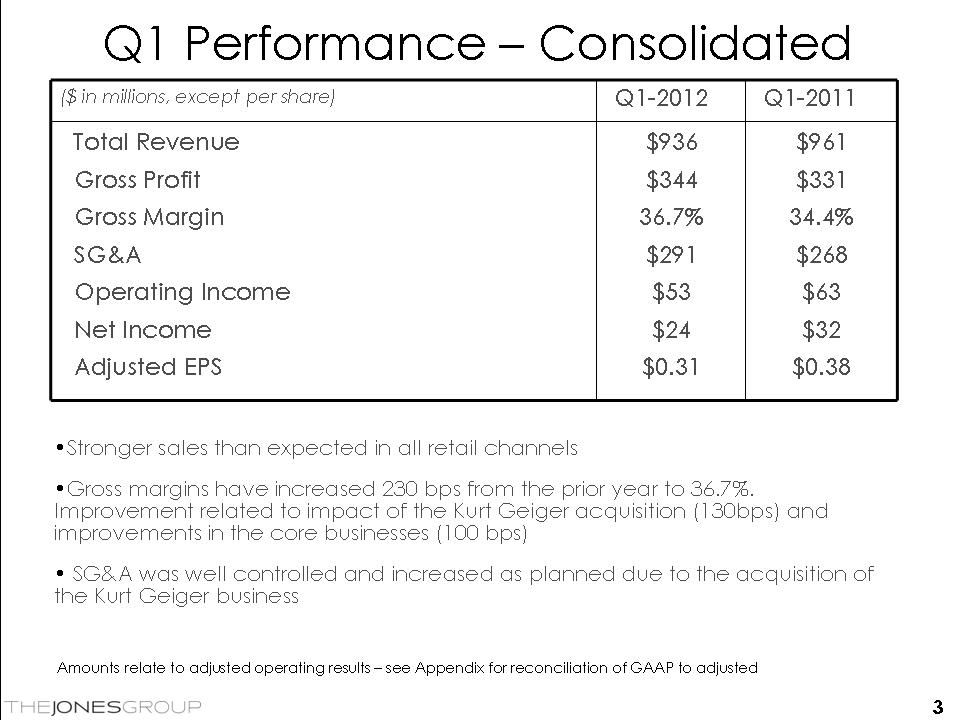
New York, New York - April 25, 2012 - The Jones Group Inc. (NYSE: JNY; the "Company") today reported results for the first quarter ended March 31, 2012. Revenues for the first quarter of 2012 were $936 million, as compared with $961 million for the first quarter of 2011.
The Company reported adjusted earnings per share of $0.31 for the first quarter of 2012, as compared with adjusted earnings per share of $0.38 for the same period last year. The adjusted results exclude charges related to the impact of severance, asset impairments in retail locations to be closed and other costs related to restructuring activities, certain acquisition-related costs and other costs not considered relevant for period-over-period comparisons (see reconciliation of adjusted earnings to reported earnings in the accompanying schedule).
As reported under generally accepted accounting principles ("GAAP"), the Company reported a first quarter loss per share of ($0.01) in 2012 and income of $0.30 per share in 2011. The 2012 and 2011 first quarter results include, among other items, costs and charges of approximately $28 million ($18 million after tax) and $9 million ($6 million after tax), respectively, related to the acquisition of Stuart Weitzman. In addition, the first quarter of 2012 also includes $12 million ($8 million after tax) of restructuring and strategic review costs.
Wesley R. Card, The Jones Group Chief Executive Officer, stated: "We are pleased with the results we achieved in the first quarter, particularly our improved gross margin, which exceeded expectations. Our gross margin improvement of 230 basis points was the result of the inclusion of Kurt Geiger in the quarter and improvement in many segments as a result of conservative inventory planning and control. Our sales registered $936 million and were within expectations. The warmer weather during the quarter, coupled with an early Easter holiday, resulted in stronger sales in all retail channels during the period than expected. Our footwear and accessories and jeanswear groups performed the best at retail, while traditional sportswear remained more challenging and promotional. "
Cash used by operating activities during the first quarter of 2012 was $60 million, compared with $137 million in the prior year period. The current year results reflect a lower level of required investment in working capital, somewhat offset by lower earnings. At March 31, 2012, the Company had $147 million in cash and no amounts drawn under its $650 million of committed revolving credit facilities.
John T. McClain, The Jones Group Chief Financial Officer, commented: "Our financial position remains strong. We ended the quarter with $147 million in cash and our revolver undrawn. Our approach to inventory commitments continues to be conservative, and we continue to emphasize tight expense control. We believe these actions will enable us to continue to improve margins and maintain a strong balance sheet."
Mr. Card concluded: "On a macroeconomic level, we are encouraged by generally rising consumer confidence and positive retail trends. While we believe these trends should continue, the economic environment still contains mixed signals and consumer spending is unpredictable. We have made major enhancements to our Fall product offerings across our brands, most importantly to our sportswear product lines. We remain focused on executing against our strategic pillars, that is revitalizing our core brands, investing in emerging brands, expanding our international footprint, improving our direct-to-consumer performance and building on our operational excellence."
The Company's Board of Directors has declared a regular quarterly cash dividend of $0.05 per share to all common stockholders of record as of May 11, 2012, for payment on May 25, 2012.
The Company will host a conference call with management to discuss these
results at 8:30 a.m. eastern time today, which is accessible by dialing
412-858-4600 or through a web cast at www.jonesgroupinc.com (under Investor
Relations/Conference Schedule). The call will be recorded and made available
through May 3, 2012 and may be accessed by dialing 877-344-7529. Enter account
number 10012825. A slide presentation will accompany the prepared remarks and
has been posted with the webcast on the Company's website.
Presentation of Information in the Press Release
Financial information discussed in this press release includes both GAAP and non-GAAP measures, which include or exclude certain items. These non-GAAP measures differ from reported results and are intended to illustrate what management believes are relevant period-over-period comparisons. A complete reconciliation of the GAAP measures presented to the comparable non-GAAP information appears in the financial tables section of this press release.
About The Jones Group Inc.
The Jones Group Inc. (www.jonesgroupinc.com) is a leading global designer, marketer and wholesaler of over 35 brands with product expertise in apparel, footwear, jeanswear, jewelry and handbags. The Jones Group has a reputation for innovation, excellence in product quality and value, operational execution and talent. The Company also markets directly to consumers through branded specialty retail and outlet stores and through its e-commerce sites.
The Company's internationally recognized brands and licensing agreements (L) include: Nine West, Jones New York, Anne Klein, Kurt Geiger, Rachel Roy (L), Robert Rodriguez, Robbi & Nikki, Stuart Weitzman, B Brian Atwood (L), Boutique 9, Easy Spirit, Carvela, Gloria Vanderbilt, l.e.i., Bandolino, Enzo Angiolini, Nine & Co., GLO, Joan & David, Miss KG, Jones Wear, Kasper, Energie, Evan-Picone, Le Suit, Mootsies Tootsies, Grane, Erika, Napier, Jessica Simpson (L), Sam & Libby, Givenchy (L), Judith Jack, Albert Nipon, Pappagallo and Rafe(L).
Forward Looking Statements
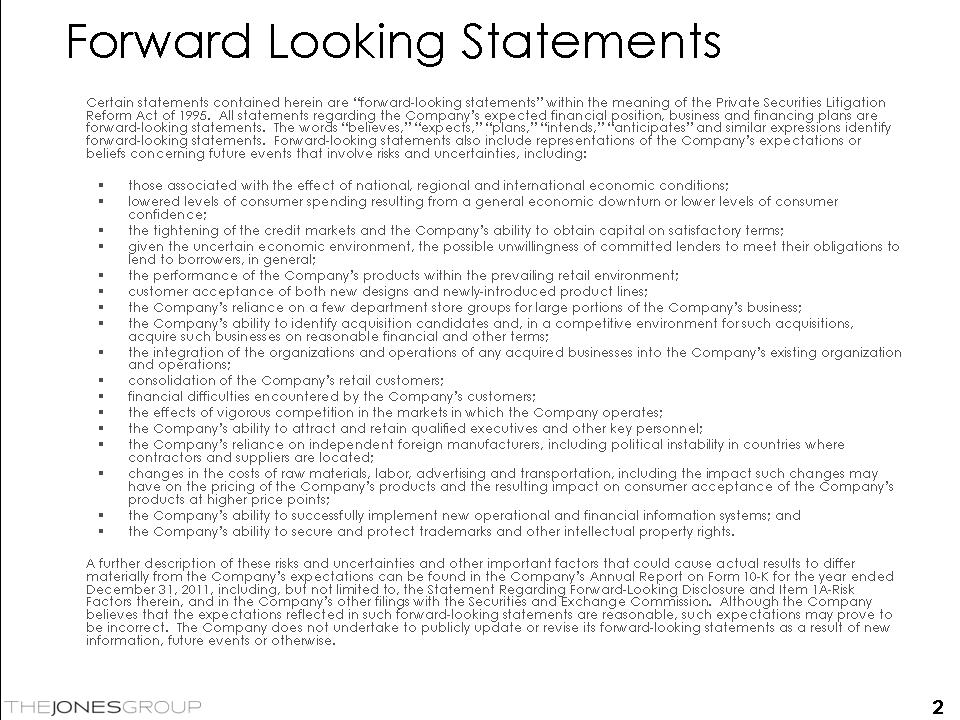
Certain statements contained herein are "forward-looking statements" within the meaning of the Private Securities Litigation Reform Act of 1995. All statements regarding the Company's expected financial position, business and financing plans are forward-looking statements. The words "believes," "expects," "plans," "intends," "anticipates" and similar expressions identify forward-looking statements. Forward-looking statements also include representations of the Company's expectations or beliefs concerning future events that involve risks and uncertainties, including:
A further description of these risks and uncertainties and other important factors that could cause actual results to differ materially from the Company's expectations can be found in the Company's Annual Report on Form 10-K for the year ended December 31, 2011, including, but not limited to, the Statement Regarding Forward-Looking Disclosure and Item 1A-Risk Factors therein, and in the Company's other filings with the Securities and Exchange Commission. Although the Company believes that the expectations reflected in such forward-looking statements are reasonable, such expectations may prove to be incorrect. The Company does not undertake to publicly update or revise its forward-looking statements as a result of new information, future events or otherwise.
THE JONES GROUP INC.
CONSOLIDATED OPERATING RESULTS
(UNAUDITED)
| All amounts in millions, except per share data |
FIRST QUARTER |
||||||||||
|
2012 |
2011 | ||||||||||
| Net sales | $ | 923.4 | 98.7 | % | $ | 949.0 | 98.7 | % | |||
| Licensing income | 12.3 | 1.3 | 12.1 | 1.3 | |||||||
| Other revenues | 0.3 | 0.0 | 0.2 | 0.0 | |||||||
| Total revenues | 936.0 | 100.0 | 961.3 | 100.0 | |||||||
| Cost of goods sold | 592.5 | 63.3 | 630.6 | 65.6 | |||||||
| Gross profit | 343.5 | 36.7 | 330.7 | 34.4 | |||||||
| SG&A expenses | 303.3 | 32.4 | 269.5 | 28.0 | |||||||
| Operating income | 40.2 | 4.3 | 61.2 | 6.4 | |||||||
| Net interest expense and financing costs (1) | (42.7 | ) | (4.6 | ) | (21.1 | ) | (2.2 | ) | |||
| Equity in income of unconsolidated affiliate | 0.9 | 0.1 | 1.3 | 0.1 | |||||||
| (Loss) income before (benefit) provision for income taxes | (1.6 | ) | (0.2 | ) | 41.4 | 4.3 | |||||
| (Benefit) provision for income taxes | (0.6 | ) | (0.1 | ) | 15.5 | 1.6 | |||||
| Net (loss) income | (1.0 | ) | (0.1 | ) | 25.9 | 2.7 | |||||
| Less: income attributable to noncontrolling interest | 0.2 | 0.0 | 0.2 | 0.0 | |||||||
| (Loss) income attributable to Jones | $ | (1.2 | ) | (0.1 | %) | $ | 25.7 | 2.7 | % | ||
| (Loss) earnings per share (2) | |||||||||||
| Net (loss) income | $ | (1.0 | ) | $ | 25.9 | ||||||
| Less: income attributable to noncontrolling interest | 0.2 | 0.2 | |||||||||
| (Loss) income attributable to Jones | (1.2 | ) | 25.7 | ||||||||
| Less: (loss) income allocated to participating securities | (0.2 | ) | 0.8 | ||||||||
| (Loss) income available to common stockholders of Jones | $ | (1.0 | ) | $ | 24.9 | ||||||
| Shares outstanding - diluted | 76.1 | 83.4 | |||||||||
| (Loss) earnings per share - diluted | $ | (0.01 | ) | $ | 0.30 | ||||||
Percentages may not add due to rounding.
| (1) | Refer to item "h" on the
Reconciliation of Non-GAAP Measures to GAAP for amounts impacting
interest expense relating to adjustment of remaining consideration
payable related to acquisition of Stuart Weitzman. |
| (2) | Earnings per share is calculated under the "two-class method," where income is allocated between common shares and participating securities (unvested restricted shares held by employees that have a nonforfeitable right to dividends). Both our common shares and participating securities share equally in dividend payments and earnings. |
THE JONES GROUP INC.
Reconciliation of Non-GAAP Measures to GAAP
for the quarters ended March 31, 2012 and April 2, 2011
(UNAUDITED)
| All amounts in millions, except per share data | FIRST QUARTER | ||||||
| 2012 | 2011 | ||||||
| Operating income | $ | 40.2 | $ | 61.2 | |||
| Adjustments: | |||||||
| Items affecting segment income: | |||||||
| Impairment and other expenses related to retail store closure plan (a) | 0.5 | (0.5 | ) | ||||
| Charges related to acquired businesses (b) | (0.9 | ) | (0.1 | ) | |||
| Other business development costs (c) | 0.2 | 0.1 | |||||
| Present value adjustments to lease liabilities for properties not in use (d) | - | 0.4 | |||||
| Charges related to closure of distribution facilities (e) | - | 0.2 | |||||
| Severance and other charges related to executive management changes (f) | 3.7 | - | |||||
| Other restructuring expenses and certain other charges (g) | 8.9 | 1.8 | |||||
| Total adjustments to operating income | 12.4 | 1.9 | |||||
| Adjusted operating income | $ | 52.6 | $ | 63.1 | |||
|
(Loss) income attributable to Jones (as reported) |
$ | (1.2 | ) | $ | 25.7 | ||
| (Benefit) provision for income taxes | (0.6 | ) | 15.5 | ||||
| Adjustments to operating income, from above | 12.4 | 1.9 | |||||
| Adjustment of remaining consideration payable related to acquisition of Stuart Weitzman (h) | 27.7 | 8.9 | |||||
| Adjusted income before provision for income taxes | 38.3 | 52.0 | |||||
| Adjusted provision for income taxes | 14.3 | 19.6 | |||||
| Adjusted income attributable to Jones | 24.0 | 32.4 | |||||
| Less: adjusted income allocated to participating securities | (0.4 | ) | (1.0 | ) | |||
| Adjusted income available to common stockholders | $ | 23.6 | $ | 31.4 | |||
| (Loss) earnings per share - diluted (as reported) |
$ | (0.01 | ) | $ | 0.30 | ||
| (Benefit) provision for income taxes | (0.01 | ) | 0.18 | ||||
| Items affecting segment income: | |||||||
| Impairment and other expenses related to retail store closure plan (a) | 0.01 | (0.01 | ) | ||||
| Charges related to acquired businesses (b) | (0.01 | ) | - | ||||
| Other business development costs (c) | - | - | |||||
| Present value adjustments to lease liabilities for properties not in use (d) | - | 0.01 | |||||
| Charges related to closure of distribution facilities (e) | - | - | |||||
| Severance and other charges related to executive management changes (f) | 0.05 | - | |||||
| Other restructuring expenses and certain other charges (g) | 0.11 | 0.02 | |||||
| Adjustment of remaining consideration payable related to acquisition of Stuart Weitzman (h) | 0.35 | 0.10 | |||||
| Adjusted income before provision for income taxes | 0.49 | 0.60 | |||||
| Adjusted provision for income taxes | 0.18 | 0.22 | |||||
| Adjusted earnings per share - diluted | $ | 0.31 | $ | 0.38 | |||
|
Non-GAAP adjustments affecting revenue by segment (i): |
|||||||
| Domestic wholesale sportswear | $ | - | $ | - | |||
| Domestic wholesale jeanswear | - | - | |||||
| Domestic wholesale footwear and accessories | - | - | |||||
| Domestic retail | - | - | |||||
| International wholesale | - | - | |||||
| International retail | - | - | |||||
| Licensing, other & eliminations | - | - | |||||
| Total | $ | - | $ | - | |||
| Non-GAAP adjustments affecting income by segment (i): | |||||||
| Domestic wholesale sportswear (b,f,g) | $ | 3.9 | $ | (0.2 | ) | ||
| Domestic wholesale jeanswear (d,e,f,g) | 1.2 | 0.9 | |||||
| Domestic wholesale footwear and accessories (b,d,e,f,g) | 2.1 | 1.4 | |||||
| Domestic retail (a,f,g) | 1.4 | (0.3 | ) | ||||
| International wholesale (b,f) | 0.1 | 0.1 | |||||
| International retail (b,f) | 1.5 | - | |||||
| Licensing, other & eliminations (b,c,f) | 2.2 | - | |||||
| Total | $ | 12.4 | $ | 1.9 | |||
| (a) | 2012 and 2011 include severance, fixed asset impairment and other charges and credits related to the closure of underperforming retail locations. |
| (b) | 2012 and 2011 include the adjustments of the contingent consideration payable for the Robert Rodriguez acquisition. Also included are the amortization of certain acquired intangible assets related to the acquisitions of Stuart Weitzman (2011 only) and Kurt Geiger (2012 only). |
| (c) | 2012 and 2011 include investment consulting fees, legal fees, accounting fees and other items related to acquisitions and other business development activities. |
| (d) | 2011 includes present value accruals and adjustments for liabilities related to leases on properties currently not in use. |
| (e) | 2011 represents charges related to the closures of the Texas and Rhode Island warehouses. |
| (f) | 2012 includes severance and restricted stock charges related to executive management changes. |
| (g) | 2012 and 2011 include severance, occupancy, and other costs related to the exit from certain product lines or restructuring of corporate and business support functions and other charges not considered by management to be part of ongoing operations. |
| (h) | Represents the fair value adjustment in accordance with GAAP of the remaining consideration payable related to the acquisition of Stuart Weitzman. |
| (i) | See "Segment Information" page for the presentation of GAAP and Adjusted amounts. |
THE JONES GROUP INC.
SEGMENT INFORMATION
(UNAUDITED)
| Dollars in millions |
Domestic Wholesale Sportswear |
Domestic Wholesale Jeanswear |
Domestic Wholesale Footwear & Accessories |
Domestic Retail |
International Wholesale |
International Retail |
Licensing, Other & Eliminations |
Consolidated |
||||||||||||||||
| For the fiscal quarter ended March 31, 2012 | ||||||||||||||||||||||||
| Revenues | $ | 233.6 | $ | 184.8 | $ | 225.9 | $ | 128.1 | $ | 73.4 | $ | 77.9 | $ | 12.3 | $ | 936.0 | ||||||||
| Segment income (loss) | $ | 23.2 | $ | 16.6 | $ | 18.4 | $ | (22.4 | ) | $ | 9.9 | $ | (4.9 | ) | $ | (0.6 | ) | 40.2 | ||||||
| Segment margin | 9.9% | 9.0% | 8.1% | (17.5% | ) | 13.5% | (6.3% | ) | 4.3% | |||||||||||||||
| Net interest expense (a) | (42.7 | ) | ||||||||||||||||||||||
| Equity in income of unconsolidated affiliate | 0.9 | |||||||||||||||||||||||
| Loss before benefit for income taxes | $ | (1.6 | ) | |||||||||||||||||||||
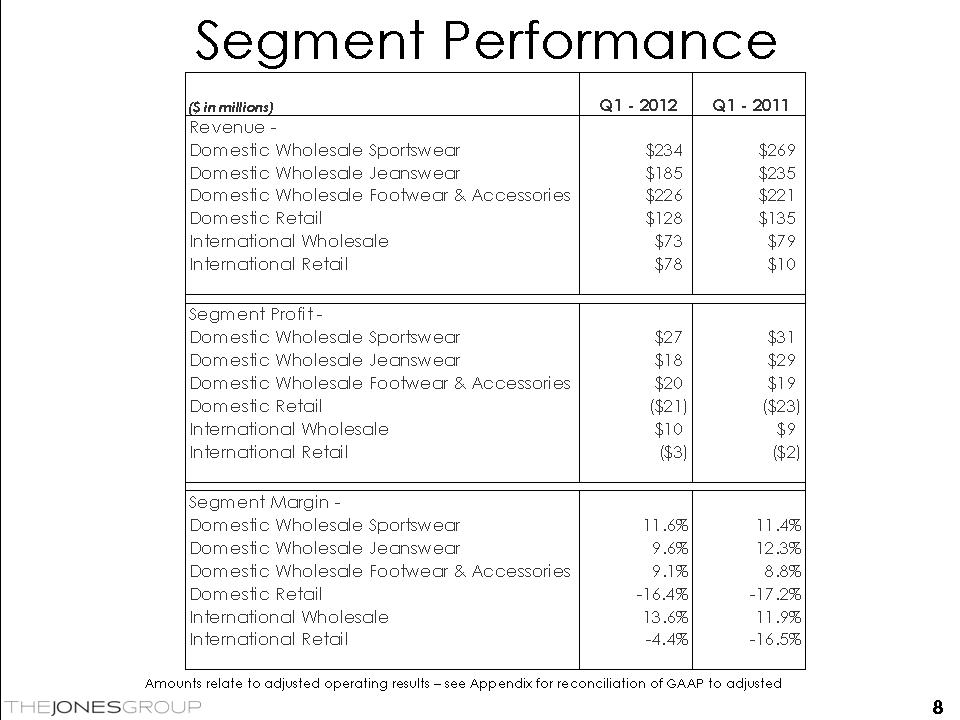
| Segment revenues | $ | 233.6 | $ | 184.8 | $ | 225.9 | $ | 128.1 | $ | 73.4 | $ | 77.9 | $ | 12.3 | $ | 936.0 | ||||||||
| Adjustments affecting segment revenues (b) | - | - | - | - | - | - | - | - | ||||||||||||||||
| Adjusted segment revenues | $ | 233.6 | $ | 184.8 | $ | 225.9 | $ | 128.1 | $ | 73.4 | $ | 77.9 | $ | 12.3 | $ | 936.0 | ||||||||
| Segment income (loss) | $ | 23.2 | $ | 16.6 | $ | 18.4 | $ | (22.4 | ) | $ | 9.9 | $ | (4.9 | ) | $ | (0.6 | ) | $ | 40.2 | |||||
| Adjustments affecting segment income (b) | 3.9 | 1.2 | 2.1 | 1.4 | 0.1 | 1.5 | 2.2 | 12.4 | ||||||||||||||||
| Adjusted segment income (loss) | $ | 27.1 | $ | 17.8 | $ | 20.5 | $ | (21.0 | ) | $ | 10.0 | $ | (3.4 | ) | $ | 1.6 | $ | 52.6 | ||||||
| Adjusted segment margin | 11.6% | 9.6% | 9.1% | (16.4% | ) | 13.6% | (4.4% | ) | 5.6% | |||||||||||||||
| For the fiscal quarter ended April 2, 2011 | ||||||||||||||||||||||||
| Revenues | $ | 268.7 | $ | 235.5 | $ | 220.6 | $ | 135.1 | $ | 79.0 | $ | 10.3 | $ | 12.1 | $ | 961.3 | ||||||||
| Segment income (loss) | $ | 30.8 | $ | 28.0 | $ | 18.1 | $ | (22.9 | ) | $ | 9.3 | $ | (1.7 | ) | $ | (0.4 | ) | 61.2 | ||||||
| Segment margin | 11.5% | 11.9% | 8.2% | (17.0% | ) | 11.8% | (16.5% | ) | 6.4% | |||||||||||||||
| Net interest expense (a) | (21.1 | ) | ||||||||||||||||||||||
| Equity in income of unconsolidated affiliate | 1.3 | |||||||||||||||||||||||
| Income before provision for income taxes | $ | 41.4 | ||||||||||||||||||||||
| Segment revenues | $ | 268.7 | $ | 235.5 | $ | 220.6 | $ | 135.1 | $ | 79.0 | $ | 10.3 | $ | 12.1 | $ | 961.3 | ||||||||
| Adjustments affecting segment revenues (b) | - | - | - | - | - | - | - | - | ||||||||||||||||
| Adjusted segment revenues | $ | 268.7 | $ | 235.5 | $ | 220.6 | $ | 135.1 | $ | 79.0 | $ | 10.3 | $ | 12.1 | $ | 961.3 | ||||||||
| Segment income (loss) | $ | 30.8 | $ | 28.0 | $ | 18.1 | $ | (22.9 | ) | $ | 9.3 | $ | (1.7 | ) | $ | (0.4 | ) | $ | 61.2 | |||||
| Adjustments affecting segment income (b) | (0.2 | ) | 0.9 | 1.4 | (0.3 | ) | 0.1 | - | - | 1.9 | ||||||||||||||
| Adjusted segment income (loss) | $ | 30.6 | $ | 28.9 | $ | 19.5 | $ | (23.2 | ) | $ | 9.4 | $ | (1.7 | ) | $ | (0.4 | ) | $ | 63.1 | |||||
| Adjusted segment margin | 11.4% | 12.3% | 8.8% | (17.2% | ) | 11.9% | (16.5% | ) | 6.6% | |||||||||||||||
| (a) | Refer to item "h" on the Reconciliation
of Non-GAAP Measures to GAAP for amounts impacting interest expense
relating to adjustment of remaining consideration payable related to
acquisition of Stuart Weitzman. |
| (b) | See "Reconciliation of Non-GAAP Measures to GAAP" page. |
THE JONES GROUP INC.
CONDENSED CONSOLIDATED BALANCE SHEETS
(UNAUDITED)
| All amounts in millions | March 31, 2012 | April 2, 2011 | |||||
| ASSETS | |||||||
| Current assets: | |||||||
| Cash and cash equivalents | $ | 147.1 | $ | 306.5 | |||
| Accounts receivable | 458.6 | 506.4 | |||||
| Inventories | 473.0 | 452.6 | |||||
| Deferred taxes | 34.6 | 31.3 | |||||
| Other current assets | 54.6 | 39.5 | |||||
| Total current assets | 1,167.9 | 1,336.3 | |||||
| Property, plant and equipment, at cost, less accumulated depreciation and amortization | 273.0 | 245.0 | |||||
| Goodwill | 258.5 | 161.8 | |||||
| Other intangibles, less accumulated amortization | 900.9 | 725.0 | |||||
| Other assets | 134.9 | 137.4 | |||||
| Total assets | $ | 2,735.2 | $ | 2,605.5 | |||
| LIABILITIES AND EQUITY | |||||||
| Current liabilities: | |||||||
| Current portion of long-term debt and capital lease obligations | $ | 2.1 | $ | 1.9 | |||
| Current portion of acquisition consideration payable | 228.3 | 21.9 | |||||
| Accounts payable | 244.7 | 177.1 | |||||
| Accrued expenses and other current liabilities | 136.8 | 124.5 | |||||
| total current liabilities | 611.9 | 325.4 | |||||
| Long-term debt and obligations under capital leases | 855.2 | 834.3 | |||||
| Deferred taxes | 74.9 | 14.0 | |||||
| Acquisition consideration payable | 5.8 | 193.5 | |||||
| Other | 93.6 | 77.4 | |||||
| Total liabilities | 1,641.4 | 1,444.6 | |||||
| Equity | 1,093.8 | 1,160.9 | |||||
| Total liabilities and equity | $ | 2,735.2 | $ | 2,605.5 | |||
THE JONES GROUP INC.
CONDENSED STATEMENTS OF CASH FLOWS
(UNAUDITED)
| All amounts in millions |
Three Months Ended |
||||||||
| March 31, 2012 | April 2, 2011 | ||||||||
| CASH FLOWS FROM OPERATING ACTIVITIES: | |||||||||
| Net (loss) income | $ | (1.0 | ) | $ | 25.9 | ||||
| Adjustments to reconcile net (loss) income to net cash used in operating activities, net of acquisitions: | |||||||||
| Amortization of employee stock options and restricted stock | 9.3 | 8.2 | |||||||
| Depreciation and other amortization | 22.5 | 18.5 | |||||||
| Impairments of property, plant and equipment | 0.4 | 1.6 | |||||||
| Adjustments to acquisition consideration payable | 24.6 | 8.7 | |||||||
| Equity in income of unconsolidated affiliate | (0.9 | ) | (1.3 | ) | |||||
| Deferred taxes | (9.5 | ) | 9.7 | ||||||
| Other items, net | (1.0 | ) | 2.6 | ||||||
| Changes in operating assets and liabilities: | |||||||||
| Accounts receivable | (117.5 | ) | (159.8 | ) | |||||
| Inventories | 20.8 | 13.9 | |||||||
| Accounts payable | 7.4 | (36.4 | ) | ||||||
| Income taxes payable/prepaid taxes | 14.9 | 18.4 | |||||||
| Acquisition consideration payable | (0.3 | ) | (4.5 | ) | |||||
| Other assets and liabilities, net | (29.5 | ) | (42.3 | ) | |||||
| Total adjustments | (58.8 | ) | (162.7 | ) | |||||
| Net cash used in operating activities | (59.8 | ) | (136.8 | ) | |||||
| CASH FLOWS FROM INVESTING ACTIVITIES: | |||||||||
| Capital expenditures | (18.2 | ) | (32.9 | ) | |||||
| Other | (0.2 | ) | - | ||||||
| Net cash used in investing activities | (18.4 | ) | (32.9 | ) | |||||
| CASH FLOWS FROM FINANCING ACTIVITIES: | |||||||||
| Issuance of 6.875% Senior Notes due 2019 | - | 300.0 | |||||||
| Debt issuance costs | - | (6.4 | ) | ||||||
| Repurchase of common shares | (8.9 | ) | (10.0 | ) | |||||
| Dividends paid | (4.0 | ) | (4.3 | ) | |||||
| Payments of acquistion consideration payable | (2.0 | ) | (4.2 | ) | |||||
| Other | 1.5 | 1.0 | |||||||
| Net cash (used in) provided by financing activities | (13.4 | ) | 276.1 | ||||||
| EFFECT OF EXCHANGE RATES ON CASH | (0.1 | ) | (0.7 | ) | |||||
| NET (DECREASE) INCREASE IN CASH AND CASH EQUIVALENTS | (91.7 | ) | 105.7 | ||||||
| CASH AND CASH EQUIVALENTS, BEGINNING | 238.8 | 200.8 | |||||||
| CASH AND CASH EQUIVALENTS, ENDING | $ | 147.1 | $ | 306.5 | |||||
EXHIBIT 99.2
PowerPoint slide presentation dated April 25, 2012.