Exhibit 99.1

Neonode Reports Second Quarter Ended
June 30, 2019 Financial Results
STOCKHOLM, SWEDEN – August
14, 2019 – Neonode Inc. (NASDAQ: NEON), the optical interactive sensing technology company, today reported financial results
for the three and six months ended June 30, 2019.
“We are growing our
global sales presence and partner network and have successfully promoted our selected use cases to customers and at numerous
trade shows. In addition, we have released updated versions of our product offerings improving our competitive position.
These activities have resulted in an increased number of on-going customer discussions and evaluations. I am confident that
we have created a foundation that will allow us to achieve future revenue growth and profitability,” said
Håkan Persson, CEO of Neonode Inc.
FINANCIAL SUMMARY FOR THE THREE AND SIX MONTHS ENDED JUNE
30, 2019
| ● | Net
sales totaled $1.7 million and $3.7 million for the three and six months ended June 30, 2019 compared to $1.9 million and $4.3
million, respectively, for the same periods last year. |
| ● | Net
loss totaled $1.3 million and $1.8 million for the three and six months ended June 30, 2019 compared to a net loss of $1.0 million
and $1.7 million, respectively, for the same periods last year. |
| ● | Loss
per share totaled $0.14 and $0.21 for the three and six months ended June 30, 2019 compared to a loss per share of $0.16 and $0.28,
respectively, for the same periods last year. |
| ● | Net
cash used in operating activities totaled $1.5 million for the six months ended June 30, 2019 compared to $1.4 million for the
same period last year. |
BUSINESS HIGHLIGHTS DURING THE QUARTER
|
● |
Signed collaboration agreement with Finetek Co., Ltd who will serve as a system integrator and future electronic manufacturing partner for Neonode zForce technology. For more information, see our press release https://www.neonode.com/neonode-and-finetek-sign-collaboration-agreement/ |
| ● | Assigned a
portfolio of patents not used in our current business to Aequitas Technologies LLC as part of an agreement to share
potential proceeds generated from
a licensing and monetization program. |
| ● | Received
purchase order for sensor modules of approximately $0.6 million from industry leading medical device OEM who will use our sensor
module in a touch display system for an X-Ray machine. Initial delivery began in June 2019. |
BUSINESS HIGHLIGHTS SINCE THE END OF THE QUARTER
|
● |
Signed agreement with Serial Microelectronics (HK) Limited to promote and sell Neonode’s sensor products in China, Taiwan and Hong Kong. For more information, see our press release https://www.neonode.com/neonode-signs-serial-microelectronics-hk-as-distributor-to-chinese-market/ |
THE CEO’S COMMENTS
During the first six months of the year we have completed a
number of actions required to successfully re-align the company according to our strategic use case focus and business plan.
Improved product performance
| ● | Launched
a performance-optimized zForce Touch Solution (CORE) for basic touch use cases |
| ● | Released
an updated version of zForce sensor modules enabling extended range and 90-degree angle mount of the sensor to obtain the same
active detection area with new levels of design freedom |
Increased market activities
| ● | Announced use cases for basic touch,
high-image quality display touch, ruggedized display touch and entry systems for automotive systems |
| ● | Exhibited
at several relevant industry trade shows to communicate and promote Neonode’s use case strategy |
| ● | Strenghtend
relationships with existing customers, supply chain partners and external sales representatives |
Our strong use case focus is providing clarity of the best application
fit for our technology and has been received positively by both customers and employees.
Our marketing and sales activities
are directed towards our key target markets; the U.S., Japan and China and selected countries in Europe. Participation at SID
in San Jose, Computex in Taiwan and Sensor Expo in San Jose have generated a substantial number of concrete leads and
interest from potential customers, partners and system suppliers. We continue to see strong market interest for our product
offerings, however customer project cycles are long in the embedded market and, why continuous marketing and sales coverage
is key.
We are making progress in our discussions with both consumer
customers and automotive Tier 1s for IVI solutions (“In Vehicle Infotainment”). A new printer customer in China has
entered into a license agreement and pre-paid initial license fees. We have had ongoing discussions with other new potential printer
customers in Asia with decisions expected later in the year. For automotive IVI, we are in a number of evaluation projects with
Tier 1s and a specific program is identified for one OEM. Our liftgate solution for automotive entry systems is progressing well
and we see a strong after market potential, paving the way for an OEM standard product offering. After the quarter ended, we entered
into discussions with a major existing customer for a potential monitor solution.
Our collaboration with Finetek is progressing well with several
business opportunities unfolding for monitors, liftgate systems and steering wheel touch pads. Our objective is to have Finetek
support both our sensor module and licensing business and become a key partner from a design and manufacturing perspective.
In order to increase our sales efforts and to improve our local
presence, we have strengthened our sales capability in China and the U.S. Our sales partner network in the U.S., Canada and Mexico
is developing well and has become operational with a growing number of opportunities in evaluation phase. In July, we signed an
agreement with Serial Microelectronics to promote and sell our sensor modules in mainland China, Taiwan and Hong Kong. In addition,
we are in discussions with sales distributors in Japan and expect an agreement to be signed in the near-term. We have identified
and are in negotiations with sales distributors to support our markets in the United Kingdom and Central Europe and are evaluating
other companies to provide coverage for the remainder of Europe.
We have been active with Digi-Key for 17 months and have shipped
more than 840 evaluation kits globally, primarily to industrial accounts in the U.S. and Asia. The leads generated through this
channel are continuously being qualified through our local representatives and sales partners. We anticipate that our new version
of the zForce sensor module will be introduced for sales in the fourth quarter 2019.
In summary, we continue to execute on our plan and see positive customer response with increasing on-going
customer discussions and evaluations. I’m confident we are moving in the right direction and that our current investments
in our sales coverage together with strong cost control and cash flow focus will generate future revenue growth and profitability.
FINANCIAL OVERVIEW FOR THE THREE AND SIX MONTHS ENDED JUNE
30, 2019
Revenues for the three and six months ended
June 30, 2019 decreased by 8.8% and 12.4% year over year, respectively. The decrease in the second quarter is mainly due to a $0.3
million decrease in license fees from one e-reader customer plus a $0.3 million and $0.5 million decrease in license fees from
one printer customer compared to the same periods in 2018, respectively. This decrease is partly offset by an increase in license
fees from other printer and automotive customers together with an increase in revenues from module sales. Operating expenses for
the three months ended June 30, 2019 are in line with the same period previous year but lower by 10.1% for the six months ended
June 30, 2019 compared to the same period in 2018. Net loss for the three and six months ended June 30, 2019 increased by 31.1%
and 10.9% compared to the same periods in 2018. Cash used by operations during the six months ended June 30, 2019 increased by
3.1% year over year. Cash and accounts receivables totaling $6.4 million per June 30, 2019 is sufficient to continue to execute
according to our plan. Our second quarter Form 10-Q is available for download from the Investor Section of our website at www.neonode.com.
Financial Overview
| | |
Three months ended
June 30, | | |
Six months ended
June 30, | |
| Amounts in USD thousand unless otherwise stated | |
2019 | | |
2018 | | |
2019 | | |
2018 | |
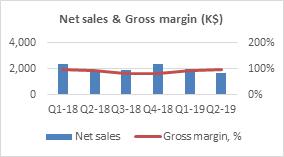
| Net sales | |
$ | 1,710 | | |
$ | 1,876 | | |
$ | 3,722 | | |
$ | 4,251 | |
| Net sales decline % | |
| (8.8 | )% | |
| | | |
| (12.4 | )% | |
| | |
| Gross margin % | |
| 95.8 | % | |
| 95.3 | % | |
| 95.4 | % | |
| 96.8 | % |
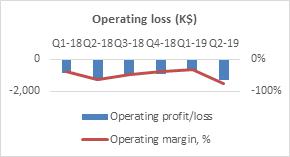
| Operating loss | |
$ | (1,314 | ) | |
$ | (1,161 | ) | |
$ | (1,982 | ) | |
$ | (2,040 | ) |
| Operating margin % | |
| (76.8 | )% | |
| (61.9 | )% | |
| (53.3 | )% | |
| (48.0 | )% |
| Net cash used in operating activities | |
| | | |
| | | |
$ | (1,475 | ) | |
$ | (1,431 | ) |
Revenue Distribution by Business Model
| | |
2019 | | |
2018 | | |
2017 | | |
2018 | | |
2017 | |
| Revenue Distribution By Business Model | |
Q2 | | |
Q2 | | |
Q2 | | |
Full year | | |
Full year | |
| License fees | |
$ | 1,467 | | |
$ | 1,761 | | |
$ | 1,965 | | |
$ | 7,954 | | |
$ | 8,684 | |
| Sensor modules | |
| 223 | | |
| 85 | | |
| 213 | | |
| 227 | | |
| 814 | |
| Non-recurring engineering | |
| 20 | | |
| 30 | | |
| 151 | | |
| 357 | | |
| 743 | |
License Fee Revenue Distribution per Market
| | |
2019 | | |
2018 | | |
2017 | | |
2018 | | |
2017 | |
| License Fee Revenue Distribution Per Market | |
Q2 | | |
Q2 | | |
Q2 | | |
Full year | | |
Full year | |
| Printers | |
$ | 1,073 | | |
$ | 1,101 | | |
$ | 1,054 | | |
$ | 5,490 | | |
$ | 5,330 | |
| E-Readers and Tablets | |
| (46 | ) | |
| 275 | | |
| 250 | | |
| 837 | | |
| 1,206 | |
| Automotive | |
| 440 | | |
| 385 | | |
| 661 | | |
| 1,627 | | |
| 2,148 | |
PATENTS
On May 6, 2019, Neonode assigned a portfolio
of patents to Aequitas Technologies LLC. The portfolio contains two patent families comprising nine US patents, five non-U.S.
patents and three pending U.S. patent applications that are all outside of Neonode’s current business. The assignment
provides Neonode the right to share potential proceeds
generated from a licensing and monetization program.
ORGANIZATION AND STAFF
Neonode Inc., a Delaware Incorporated Company,
with its executive head office in Stockholm, Sweden are organized in four wholly owned subsidiaries located in Sweden, Japan, Korea
and Taiwan and with a majority owned subsidiary in Kungsbacka, Sweden. At the end of the second quarter, the company had a workforce
of 56 people, including eleven consultants compared to a workforce of 54 people at December 31, 2018. The workforce primarily is
located in Sweden.
FUTURE REPORTING DATES
| Q3 Interim Report 2019 |
November 6, 2019 (planned) |
FOR MORE INFORMATION, PLEASE CONTACT:
Investor Relations
David Brunton
Email: david.brunton@neonode.com
Chief Financial Officer
Maria Ek
E-mail: maria.ek@neonode.com
ABOUT NEONODE
Neonode Inc. (NASDAQ:NEON) develops, manufactures
and sells advanced sensor modules based on our company’s proprietary ZFORCE AIR technology. Neonode ZFORCE AIR Sensor Modules
enable touch interaction, mid-air interaction and object sensing and are ideal for integration in a wide range of applications
within the automotive, consumer electronics, medical, robotics and other markets. Our company also develops and licenses user interfaces
and optical interactive touch solutions based on its patented ZFORCE CORE technology. To date, Neonode’s technology has been
deployed in approximately 70 million products, including 4 million cars and 66 million consumer devices.
NEONODE, the NEONODE logo, ZFORCE and ZFORCE AIR are trademarks
of Neonode Inc. registered in the United States and other countries. ZFORCE CORE is a trademark of Neonode Inc.
For further information please visit www.neonode.com
Follow us at:
Linkedin.com/company/neonode
News.cision.com/neonode
Subscribe to our news here
SAFE HARBOR STATEMENT
This press release contains forward-looking
statements within the meaning of the Private Securities Litigation Reform Act of 1995. These include, but are not limited to, statements
relating to expectations, future performance or future events, business plan and strategy, potential revenue from license fees
and module sales, development and introduction of new sensor modules, proceed from patent licensing, revenue from patent monetization,
customer shipments and orders, and product cost, performance, and functionality matters. These statements are based on current
assumptions, expectations and information available to Neonode management and involve a number of known and unknown risks, uncertainties
and other factors that may cause Neonode’s actual results, levels of activity, performance or achievements to be materially
different from any expressed or implied by these forward-looking statements.
These risks, uncertainties, and factors
are discussed under “Risk Factors” and elsewhere in Neonode’s public filings with the U.S. Securities and Exchange
Commission from time to time, including Neonode’s annual report on Form 10-K, quarterly reports on Form 10-Q, and current
reports on Form 8-K. You are advised to carefully consider these various risks, uncertainties and other factors. Although Neonode
management believes that the forward-looking statements contained in this press release are reasonable, it can give no assurance
that its expectations will be fulfilled. Forward-looking are made as today’s date, and Neonode undertakes no duty to update
or revise them.
NEONODE INC.
CONDENSED CONSOLIDATED BALANCE SHEETS
(In thousands, except share and per share
amounts)
| | |
June 30, | | |
December 31, | |
| | |
2019 | | |
2018 | |
| ASSETS | |
(Unaudited) | | |
(Audited) | |
| Current assets: | |
| | |
| |
| Cash | |
$ | 4,638 | | |
$ | 6,555 | |
| Accounts receivable and unbilled revenue, net | |
| 1,784 | | |
| 1,830 | |
| Projects in process | |
| 8 | | |
| - | |
| Inventory | |
| 1,166 | | |
| 1,219 | |
| Prepaid expenses and other current assets | |
| 762 | | |
| 890 | |
| Total current assets | |
| 8,358 | | |
| 10,494 | |
| | |
| | | |
| | |
| Investment in joint venture | |
| 3 | | |
| 3 | |
| Property and equipment, net | |
| 2,011 | | |
| 2,484 | |
| Operating lease right-of-use assets | |
| 728 | | |
| - | |
| Other assets | |
| 246 | | |
| 261 | |
| Total assets | |
$ | 11,346 | | |
$ | 13,242 | |
| | |
| | | |
| | |
| LIABILITIES AND STOCKHOLDERS’ EQUITY | |
| | | |
| | |
| Current liabilities: | |
| | | |
| | |
| Accounts payable | |
$ | 401 | | |
$ | 501 | |
| Accrued payroll and employee benefits | |
| 1,112 | | |
| 902 | |
| Accrued expenses | |
| 93 | | |
| 265 | |
| Deferred revenues | |
| 66 | | |
| 75 | |
| Current portion of finance lease obligations | |
| 547 | | |
| 570 | |
| Current portion of operating lease obligations | |
| 427 | | |
| - | |
| Total current liabilities | |
| 2,646 | | |
| 2,313 | |
| | |
| | | |
| | |
| Finance lease obligations, net of current portion | |
| 807 | | |
| 1,133 | |
| Operating lease obligations, net of current portion | |
| 266 | | |
| - | |
| Total liabilities | |
| 3,719 | | |
| 3,446 | |
| | |
| | | |
| | |
| Commitments and contingencies | |
| | | |
| | |
| | |
| | | |
| | |
| Stockholders’ equity: | |
| | | |
| | |
| Series B Preferred stock, 54,425 shares authorized with par value $0.001 per share; 80 and 82 shares issued and outstanding at June 30, 2019 and December 31, 2018, respectively. (In the event of dissolution, each share of Series B Preferred stock has a liquidation preference equal to par value of $0.001 per share over the shares of common stock) | |
| - | | |
| - | |
| Common stock, 15,000,000 shares authorized with par value $0.001 per share; 8,800,577 and 8,800,313 shares issued and outstanding at June 30, 2019 and December 31, 2018, respectively. | |
| 9 | | |
| 9 | |
| Additional paid-in capital | |
| 197,507 | | |
| 197,507 | |
| Accumulated other comprehensive loss | |
| (611 | ) | |
| (456 | ) |
| Accumulated deficit | |
| (187,059 | ) | |
| (185,222 | ) |
| Total Neonode Inc. stockholders’ equity | |
| 9,846 | | |
| 11,838 | |
| Noncontrolling interests | |
| (2,219 | ) | |
| (2,042 | ) |
| Total stockholders’ equity | |
| 7,627 | | |
| 9,796 | |
| Total liabilities and stockholders’ equity | |
$ | 11,346 | | |
$ | 13,242 | |
NEONODE INC.
CONDENSED CONSOLIDATED STATEMENTS OF
OPERATIONS
(In thousands, except per share amounts)
(Unaudited)
| | |
Three months ended
June 30, | | |
Six months ended
June 30, | |
| | |
2019 | | |
2018 | | |
2019 | | |
2018 | |
| Revenues: | |
| | |
| | |
| | |
| |
| License fees | |
$ | 1,467 | | |
$ | 1,761 | | |
$ | 3,409 | | |
$ | 4,084 | |
| Sensor module | |
| 223 | | |
| 85 | | |
| 273 | | |
| 137 | |
| Non-recurring engineering | |
| 20 | | |
| 30 | | |
| 40 | | |
| 30 | |
| Total revenues | |
| 1,710 | | |
| 1,876 | | |
| 3,722 | | |
| 4,251 | |
| Cost of revenues: | |
| | | |
| | | |
| | | |
| | |
| Sensor module | |
| 72 | | |
| 89 | | |
| 56 | | |
| 134 | |
| Non-recurring engineering | |
| (1 | ) | |
| - | | |
| 116 | | |
| 1 | |
| Total cost of revenues | |
| 71 | | |
| 89 | | |
| 172 | | |
| 135 | |
| | |
| | | |
| | | |
| | | |
| | |
| Total gross margin | |
| 1,639 | | |
| 1,787 | | |
| 3,550 | | |
| 4,116 | |
| | |
| | | |
| | | |
| | | |
| | |
| Operating expenses: | |
| | | |
| | | |
| | | |
| | |
| Research and development | |
| 1,452 | | |
| 1,362 | | |
| 2,711 | | |
| 2,880 | |
| Sales and marketing | |
| 491 | | |
| 470 | | |
| 940 | | |
| 1,026 | |
| General and administrative | |
| 1,010 | | |
| 1,116 | | |
| 1,881 | | |
| 2,250 | |
| | |
| | | |
| | | |
| | | |
| | |
| Total operating expenses | |
| 2,953 | | |
| 2,948 | | |
| 5,532 | | |
| 6,156 | |
| Operating loss | |
| (1,314 | ) | |
| (1,161 | ) | |
| (1,982 | ) | |
| (2,040 | ) |
| | |
| | | |
| | | |
| | | |
| | |
| Other expense: | |
| | | |
| | | |
| | | |
| | |
| Interest expense | |
| 9 | | |
| 13 | | |
| 19 | | |
| 27 | |
| Total other expense | |
| 9 | | |
| 13 | | |
| 19 | | |
| 27 | |
| | |
| | | |
| | | |
| | | |
| | |
| Loss before provision for income taxes | |
| (1,323 | ) | |
| (1,174 | ) | |
| (2,001 | ) | |
| (2,067 | ) |
| | |
| | | |
| | | |
| | | |
| | |
| Provision for income taxes | |
| 7 | | |
| 1 | | |
| 13 | | |
| 8 | |
| Net loss including noncontrolling interests | |
| (1,330 | ) | |
| (1,175 | ) | |
| (2,014 | ) | |
| (2,075 | ) |
| Less: Net loss attributable to noncontrolling interests | |
| 66 | | |
| 211 | | |
| 177 | | |
| 418 | |
| Net loss attributable to Neonode Inc. | |
$ | (1,264 | ) | |
$ | (964 | ) | |
$ | (1,837 | ) | |
$ | (1,657 | ) |
| | |
| | | |
| | | |
| | | |
| | |
| Loss per common share: | |
| | | |
| | | |
| | | |
| | |
| Basic and diluted loss per share | |
$ | (0.14 | ) | |
$ | (0.16 | ) | |
$ | (0.21 | ) | |
$ | (0.28 | ) |
| Basic and diluted – weighted average number of common shares outstanding | |
| 8,801 | | |
| 5,859 | | |
| 8,800 | | |
| 5,859 | |
NEONODE INC.
CONDENSED CONSOLIDATED STATEMENTS OF
COMPREHENSIVE LOSS
(In thousands)
(Unaudited)
| | |
Three months ended
June 30, | | |
Six months ended
June 30, | |
| | |
2019 | | |
2018 | | |
2019 | | |
2018 | |
| | |
| | |
| | |
| | |
| |
| Net loss | |
$ | (1,330 | ) | |
$ | (1,175 | ) | |
$ | (2,014 | ) | |
$ | (2,075 | ) |
| Other comprehensive income (loss): | |
| | | |
| | | |
| | | |
| | |
| Foreign currency translation adjustments | |
| 26 | | |
| (336 | ) | |
| (155 | ) | |
| (430 | ) |
| Comprehensive loss | |
| (1,304 | ) | |
| (1,511 | ) | |
| (2,169 | ) | |
| (2,505 | ) |
| Less: Comprehensive loss attributable to noncontrolling interests | |
| 66 | | |
| 211 | | |
| 177 | | |
| 418 | |
| Comprehensive loss attributable to Neonode Inc. | |
$ | (1,238 | ) | |
$ | (1,300 | ) | |
$ | (1,992 | ) | |
$ | (2,087 | ) |
NEONODE INC.
CONSOLIDATED STATEMENTS OF STOCKHOLDERS’
EQUITY
(In thousands)
For the Quarter to Date periods ended
March 31, 2018 through June 30, 2019
| |
|
Series B Preferred Stock Shares Issued |
|
|
Series B Preferred Stock Amount |
|
|
Common Stock Shares Issued |
|
|
Common Stock Amount |
|
|
Additional Paid-in Capital |
|
|
Accumulated Other Comprehensive Income (Loss) |
|
|
Accumulated Deficit |
|
|
Total
Neonode Inc. Stockholders’ Equity |
|
|
Noncontrolling Interests |
|
|
Total
Stockholders’ Equity |
|
| |
|
|
|
|
|
|
|
|
|
|
|
|
|
|
|
|
|
|
|
|
|
|
|
|
|
|
|
|
|
|
| Balances, January 1, 2018 |
|
|
83 |
|
|
$ |
- |
|
|
|
5,859 |
|
|
$ |
6 |
|
|
$ |
192,861 |
|
|
$ |
(99 |
) |
|
$ |
(183,745 |
) |
|
$ |
9,023 |
|
|
$ |
(1,160 |
) |
|
$ |
7,863 |
|
| |
|
|
|
|
|
|
|
|
|
|
|
|
|
|
|
|
|
|
|
|
|
|
|
|
|
|
|
|
|
|
|
|
|
|
|
|
|
|
|
|
| Adjustment related to adoption of ASC 606 revenue recognition |
|
|
- |
|
|
|
- |
|
|
|
- |
|
|
|
- |
|
|
|
- |
|
|
|
- |
|
|
|
1,583 |
|
|
|
1,583 |
|
|
|
- |
|
|
|
1,583 |
|
| |
|
|
|
|
|
|
|
|
|
|
|
|
|
|
|
|
|
|
|
|
|
|
|
|
|
|
|
|
|
|
|
|
|
|
|
|
|
|
|
|
| Stock option and warrant compensation expense to employees and directors |
|
|
- |
|
|
|
- |
|
|
|
- |
|
|
|
- |
|
|
|
12 |
|
|
|
- |
|
|
|
- |
|
|
|
12 |
|
|
|
- |
|
|
|
12 |
|
| |
|
|
|
|
|
|
|
|
|
|
|
|
|
|
|
|
|
|
|
|
|
|
|
|
|
|
|
|
|
|
|
|
|
|
|
|
|
|
|
|
| Foreign currency translation adjustment |
|
|
- |
|
|
|
- |
|
|
|
- |
|
|
|
- |
|
|
|
- |
|
|
|
(94 |
) |
|
|
- |
|
|
|
(94 |
) |
|
|
- |
|
|
|
(94 |
) |
| |
|
|
|
|
|
|
|
|
|
|
|
|
|
|
|
|
|
|
|
|
|
|
|
|
|
|
|
|
|
|
|
|
|
|
|
|
|
|
|
|
| Net loss |
|
|
- |
|
|
|
- |
|
|
|
- |
|
|
|
- |
|
|
|
- |
|
|
|
- |
|
|
|
(693 |
) |
|
|
(693 |
) |
|
|
(207 |
) |
|
|
(900 |
) |
| |
|
|
|
|
|
|
|
|
|
|
|
|
|
|
|
|
|
|
|
|
|
|
|
|
|
|
|
|
|
|
|
|
|
|
|
|
|
|
|
|
| Balances, March 31, 2018 |
|
|
83 |
|
|
$ |
- |
|
|
|
5,859 |
|
|
$ |
6 |
|
|
$ |
192,873 |
|
|
$ |
(193 |
) |
|
$ |
(182,855 |
) |
|
$ |
9,831 |
|
|
$ |
(1,367 |
) |
|
$ |
8,464 |
|
| |
|
|
|
|
|
|
|
|
|
|
|
|
|
|
|
|
|
|
|
|
|
|
|
|
|
|
|
|
|
|
|
|
|
|
|
|
|
|
|
|
| Stock option compensation expense to employees and directors |
|
|
- |
|
|
|
- |
|
|
|
- |
|
|
|
- |
|
|
|
18 |
|
|
|
- |
|
|
|
- |
|
|
|
18 |
|
|
|
- |
|
|
|
18 |
|
| |
|
|
|
|
|
|
|
|
|
|
|
|
|
|
|
|
|
|
|
|
|
|
|
|
|
|
|
|
|
|
|
|
|
|
|
|
|
|
|
|
| Foreign currency translation adjustment |
|
|
- |
|
|
|
- |
|
|
|
- |
|
|
|
- |
|
|
|
- |
|
|
|
(336 |
) |
|
|
- |
|
|
|
(336 |
) |
|
|
- |
|
|
|
(336 |
) |
| |
|
|
|
|
|
|
|
|
|
|
|
|
|
|
|
|
|
|
|
|
|
|
|
|
|
|
|
|
|
|
|
|
|
|
|
|
|
|
|
|
| Net loss |
|
|
- |
|
|
|
- |
|
|
|
- |
|
|
|
- |
|
|
|
- |
|
|
|
- |
|
|
|
(964 |
) |
|
|
(964 |
) |
|
|
(211 |
) |
|
|
(1,175 |
) |
| |
|
|
|
|
|
|
|
|
|
|
|
|
|
|
|
|
|
|
|
|
|
|
|
|
|
|
|
|
|
|
|
|
|
|
|
|
|
|
|
|
| Balances, June 30, 2018 |
|
|
83 |
|
|
$ |
- |
|
|
|
5,859 |
|
|
$ |
6 |
|
|
$ |
192,891 |
|
|
$ |
(529 |
) |
|
$ |
(183,819 |
) |
|
$ |
8,549 |
|
|
$ |
(1,578 |
) |
|
$ |
6,971 |
|
| | |
Series B Preferred Stock Shares Issued | | |
Series B Preferred Stock Amount | | |
Common Stock Shares Issued | | |
Common Stock Amount | | |
Additional Paid-in Capital | | |
Accumulated Other Comprehensive Income (Loss) | | |
Accumulated Deficit | | |
Total
Neonode Inc. Stockholders’ Equity | | |
Noncontrolling Interests | | |
Total
Stockholders’ Equity | |
| | |
| | |
| | |
| | |
| | |
| | |
| | |
| | |
| | |
| | |
| |
| Foreign currency translation adjustment | |
| - | | |
| - | | |
| - | | |
| - | | |
| - | | |
| 13 | | |
| - | | |
| 13 | | |
| - | | |
| 13 | |
| | |
| | | |
| | | |
| | | |
| | | |
| | | |
| | | |
| | | |
| | | |
| | | |
| | |
| Net loss | |
| - | | |
| - | | |
| - | | |
| - | | |
| - | | |
| - | | |
| (810 | ) | |
| (810 | ) | |
| (142 | ) | |
| (952 | ) |
| | |
| | | |
| | | |
| | | |
| | | |
| | | |
| | | |
| | | |
| | | |
| | | |
| | |
| Balances, September 30, 2018 | |
| 83 | | |
$ | - | | |
| 5,859 | | |
$ | 6 | | |
$ | 192,891 | | |
$ | (516 | ) | |
$ | (184,629 | ) | |
$ | 7,752 | | |
$ | (1,720 | ) | |
$ | 6,032 | |
| | |
| | | |
| | | |
| | | |
| | | |
| | | |
| | | |
| | | |
| | | |
| | | |
| | |
| Conversion of series B Preferred Stock to Common Stock | |
| (1 | ) | |
| - | | |
| - | | |
| - | | |
| - | | |
| - | | |
| - | | |
| - | | |
| - | | |
| - | |
| | |
| | | |
| | | |
| | | |
| | | |
| | | |
| | | |
| | | |
| | | |
| | | |
| | |
| Proceeds from sale of Common Stock, net of offering costs | |
| - | | |
| - | | |
| 2,941 | | |
| 3 | | |
| 4,616 | | |
| - | | |
| - | | |
| 4,619 | | |
| - | | |
| 4,619 | |
| | |
| | | |
| | | |
| | | |
| | | |
| | | |
| | | |
| | | |
| | | |
| | | |
| | |
| Foreign currency translation adjustment | |
| - | | |
| - | | |
| - | | |
| - | | |
| - | | |
| 60 | | |
| - | | |
| 60 | | |
| - | | |
| 60 | |
| | |
| | | |
| | | |
| | | |
| | | |
| | | |
| | | |
| | | |
| | | |
| | | |
| | |
| Net loss | |
| - | | |
| - | | |
| - | | |
| - | | |
| - | | |
| - | | |
| (593 | ) | |
| (593 | ) | |
| (322 | ) | |
| (915 | ) |
| | |
| | | |
| | | |
| | | |
| | | |
| | | |
| | | |
| | | |
| | | |
| | | |
| | |
| Balances, December 31, 2018 | |
| 82 | | |
$ | - | | |
| 8,800 | | |
$ | 9 | | |
$ | 197,507 | | |
$ | (456 | ) | |
$ | (185,222 | ) | |
$ | 11,838 | | |
$ | (2,042 | ) | |
$ | 9,796 | |
| | |
| | | |
| | | |
| | | |
| | | |
| | | |
| | | |
| | | |
| | | |
| | | |
| | |
| Foreign currency translation adjustment | |
| - | | |
| - | | |
| - | | |
| - | | |
| - | | |
| (181 | ) | |
| - | | |
| (181 | ) | |
| - | | |
| (181 | ) |
| | |
| | | |
| | | |
| | | |
| | | |
| | | |
| | | |
| | | |
| | | |
| | | |
| | |
| Net loss | |
| - | | |
| - | | |
| - | | |
| - | | |
| - | | |
| - | | |
| (573 | ) | |
| (573 | ) | |
| (111 | ) | |
| (684 | ) |
| | |
| | | |
| | | |
| | | |
| | | |
| | | |
| | | |
| | | |
| | | |
| | | |
| | |
| Balances, March 31, 2019 | |
| 82 | | |
$ | - | | |
| 8,800 | | |
$ | 9 | | |
$ | 197,507 | | |
$ | (637 | ) | |
$ | (185,795 | ) | |
$ | 11,084 | | |
$ | (2,153 | ) | |
$ | 8,931 | |
| | |
| | | |
| | | |
| | | |
| | | |
| | | |
| | | |
| | | |
| | | |
| | | |
| | |
| Conversion of series B Preferred Stock to Common Stock | |
| (2 | ) | |
| - | | |
| 1 | | |
| - | | |
| - | | |
| - | | |
| - | | |
| - | | |
| - | | |
| - | |
| | |
| | | |
| | | |
| | | |
| | | |
| | | |
| | | |
| | | |
| | | |
| | | |
| | |
| Foreign currency translation adjustment | |
| - | | |
| - | | |
| - | | |
| - | | |
| - | | |
| 26 | | |
| - | | |
| 26 | | |
| - | | |
| 26 | |
| | |
| | | |
| | | |
| | | |
| | | |
| | | |
| | | |
| | | |
| | | |
| | | |
| | |
| Net loss | |
| - | | |
| - | | |
| - | | |
| - | | |
| - | | |
| - | | |
| (1,264 | ) | |
| (1,264 | ) | |
| (66 | ) | |
| (1,330 | ) |
| | |
| | | |
| | | |
| | | |
| | | |
| | | |
| | | |
| | | |
| | | |
| | | |
| | |
| Balances, June 30, 2019 | |
| 80 | | |
$ | - | | |
| 8,801 | | |
$ | 9 | | |
$ | 197,507 | | |
$ | (611 | ) | |
$ | (187,059 | ) | |
$ | 9,846 | | |
$ | (2,219 | ) | |
$ | 7,627 | |
NEONODE INC.
CONDENSED CONSOLIDATED STATEMENTS OF
CASH FLOWS
(In thousands)
(Unaudited)
| | |
Six months ended
June 30, | |
| | |
2019 | | |
2018 | |
| Cash flows from operating activities: | |
| | |
| |
| Net loss (including noncontrolling interests) | |
$ | (2,014 | ) | |
$ | (2,075 | ) |
| Adjustments to reconcile net loss to net cash used in operating activities: | |
| | | |
| | |
| Stock-based compensation expense | |
| - | | |
| 29 | |
| Bad debt expense | |
| 19 | | |
| - | |
| Depreciation and amortization | |
| 439 | | |
| 536 | |
| Amortization of operating lease right-of-use assets | |
| 189 | | |
| - | |
| | |
| | | |
| | |
| Changes in operating assets and liabilities: | |
| | | |
| | |
| Accounts receivable and unbilled revenue, net | |
| 24 | | |
| 532 | |
| Projects in process | |
| (8 | ) | |
| (224 | ) |
| Inventory | |
| (5 | ) | |
| (56 | ) |
| Prepaid expenses and other current assets | |
| 118 | | |
| 45 | |
| Accounts payable and accrued expenses | |
| 1 | | |
| 219 | |
| Deferred revenues | |
| (14 | ) | |
| (437 | ) |
| Operating lease obligations | |
| (224 | ) | |
| - | |
| Net cash used in operating activities | |
| (1,475 | ) | |
| (1,431 | ) |
| | |
| | | |
| | |
| Cash flows from investing activities: | |
| | | |
| | |
| Purchase of property and equipment | |
| (77 | ) | |
| (145 | ) |
| Net cash used in investing activities | |
| (77 | ) | |
| (145 | ) |
| | |
| | | |
| | |
| Cash flows from financing activities: | |
| | | |
| | |
| Principal payments on finance lease obligations | |
| (272 | ) | |
| (277 | ) |
| Net cash used in financing activities | |
| (272 | ) | |
| (277 | ) |
| | |
| | | |
| | |
| Effect of exchange rate changes on cash | |
| (93 | ) | |
| (250 | ) |
| | |
| | | |
| | |
| Net decrease in cash | |
| (1,917 | ) | |
| (2,103 | ) |
| Cash at beginning of period | |
| 6,555 | | |
| 5,796 | |
| Cash at end of period | |
$ | 4,638 | | |
$ | 3,693 | |
| | |
| | | |
| | |
| Supplemental disclosure of cash flow information: | |
| | | |
| | |
| Cash paid for income taxes | |
$ | 13 | | |
$ | 8 | |
| Cash paid for interest | |
$ | 19 | | |
$ | 27 | |
10