FALSE00000086706/302021FYP5YP3YP3YP3Yus-gaap:AccruedLiabilitiesCurrentus-gaap:AccruedLiabilitiesCurrentP5DP1Y00000086702020-07-012021-06-30iso4217:USD00000086702020-12-31xbrli:shares00000086702021-07-3000000086702021-06-300000008670adp:RevenuesOtherThanInterestOnFundsHeldForClientsAndPEORevenuesMember2020-07-012021-06-300000008670adp:RevenuesOtherThanInterestOnFundsHeldForClientsAndPEORevenuesMember2019-07-012020-06-300000008670adp:RevenuesOtherThanInterestOnFundsHeldForClientsAndPEORevenuesMember2018-07-012019-06-300000008670adp:InterestOnFundsHeldForClientsMember2020-07-012021-06-300000008670adp:InterestOnFundsHeldForClientsMember2019-07-012020-06-300000008670adp:InterestOnFundsHeldForClientsMember2018-07-012019-06-300000008670adp:PEORevenuesMember2020-07-012021-06-300000008670adp:PEORevenuesMember2019-07-012020-06-300000008670adp:PEORevenuesMember2018-07-012019-06-3000000086702019-07-012020-06-3000000086702018-07-012019-06-300000008670us-gaap:RetainedEarningsMember2020-07-012021-06-30iso4217:USDxbrli:shares00000086702020-06-300000008670us-gaap:CommonStockMember2018-06-300000008670us-gaap:AdditionalPaidInCapitalMember2018-06-300000008670us-gaap:RetainedEarningsMember2018-06-300000008670us-gaap:TreasuryStockMember2018-06-3000000086702018-06-300000008670us-gaap:RetainedEarningsMember2018-07-012019-06-300000008670us-gaap:AccumulatedOtherComprehensiveIncomeMember2018-07-012019-06-300000008670us-gaap:AdditionalPaidInCapitalMember2018-07-012019-06-300000008670us-gaap:TreasuryStockMember2018-07-012019-06-300000008670us-gaap:CommonStockMember2019-06-300000008670us-gaap:AdditionalPaidInCapitalMember2019-06-300000008670us-gaap:RetainedEarningsMember2019-06-300000008670us-gaap:TreasuryStockMember2019-06-3000000086702019-06-300000008670us-gaap:RetainedEarningsMember2019-07-012020-06-300000008670us-gaap:AccumulatedOtherComprehensiveIncomeMember2019-07-012020-06-300000008670us-gaap:AdditionalPaidInCapitalMember2019-07-012020-06-300000008670us-gaap:TreasuryStockMember2019-07-012020-06-300000008670us-gaap:CommonStockMember2020-06-300000008670us-gaap:AdditionalPaidInCapitalMember2020-06-300000008670us-gaap:RetainedEarningsMember2020-06-300000008670us-gaap:TreasuryStockMember2020-06-300000008670us-gaap:AccumulatedOtherComprehensiveIncomeMember2020-06-300000008670us-gaap:AccumulatedOtherComprehensiveIncomeMember2020-07-012021-06-300000008670us-gaap:AdditionalPaidInCapitalMember2020-07-012021-06-300000008670us-gaap:TreasuryStockMember2020-07-012021-06-300000008670us-gaap:CommonStockMember2021-06-300000008670us-gaap:AdditionalPaidInCapitalMember2021-06-300000008670us-gaap:RetainedEarningsMember2021-06-300000008670us-gaap:TreasuryStockMember2021-06-300000008670us-gaap:AccumulatedOtherComprehensiveIncomeMember2021-06-30adp:segment0000008670srt:MinimumMember2020-07-012021-06-300000008670srt:MaximumMember2020-07-012021-06-300000008670srt:MinimumMember2021-06-300000008670srt:MaximumMember2021-06-30xbrli:pure0000008670adp:NotesDueOn2028Member2020-07-012021-06-300000008670adp:NotesDueOn2030Member2020-07-012021-06-300000008670adp:NotesDueOn2028And2030Member2021-06-300000008670adp:Notesdueon2025Member2015-07-012016-06-300000008670adp:Notesdueon2025Member2016-06-300000008670adp:DataProcessingEquipmentMembersrt:MinimumMember2020-07-012021-06-300000008670srt:MaximumMemberadp:DataProcessingEquipmentMember2020-07-012021-06-300000008670us-gaap:BuildingMembersrt:MinimumMember2020-07-012021-06-300000008670srt:MaximumMemberus-gaap:BuildingMember2020-07-012021-06-300000008670us-gaap:FurnitureAndFixturesMembersrt:MinimumMember2020-07-012021-06-300000008670srt:MaximumMemberus-gaap:FurnitureAndFixturesMember2020-07-012021-06-300000008670adp:InternalUseSoftwareMembersrt:MinimumMember2020-07-012021-06-300000008670srt:MaximumMemberadp:InternalUseSoftwareMember2020-07-012021-06-300000008670adp:InternalUseSoftwareMember2020-07-012021-06-300000008670us-gaap:SubsequentEventMember2021-07-012021-07-310000008670adp:HCMMember2020-07-012021-06-300000008670adp:HCMMember2019-07-012020-06-300000008670adp:HCMMember2018-07-012019-06-300000008670adp:HROMember2020-07-012021-06-300000008670adp:HROMember2019-07-012020-06-300000008670adp:HROMember2018-07-012019-06-300000008670adp:PEOMember2020-07-012021-06-300000008670adp:PEOMember2019-07-012020-06-300000008670adp:PEOMember2018-07-012019-06-300000008670adp:GlobalMember2020-07-012021-06-300000008670adp:GlobalMember2019-07-012020-06-300000008670adp:GlobalMember2018-07-012019-06-300000008670adp:ClientfundinterestMember2020-07-012021-06-300000008670adp:ClientfundinterestMember2019-07-012020-06-300000008670adp:ClientfundinterestMember2018-07-012019-06-300000008670adp:HCMMemberadp:EmployerServicesSegmentMember2020-07-012021-06-300000008670adp:HCMMemberadp:ProfessionalEmployeeOrganizationServicesSegmentMember2020-07-012021-06-300000008670adp:HCMMemberus-gaap:AllOtherSegmentsMember2020-07-012021-06-300000008670adp:EmployerServicesSegmentMemberadp:HROMember2020-07-012021-06-300000008670adp:HROMemberadp:ProfessionalEmployeeOrganizationServicesSegmentMember2020-07-012021-06-300000008670adp:HROMemberus-gaap:AllOtherSegmentsMember2020-07-012021-06-300000008670adp:PEOMemberadp:EmployerServicesSegmentMember2020-07-012021-06-300000008670adp:PEOMemberadp:ProfessionalEmployeeOrganizationServicesSegmentMember2020-07-012021-06-300000008670adp:PEOMemberus-gaap:AllOtherSegmentsMember2020-07-012021-06-300000008670adp:EmployerServicesSegmentMemberadp:GlobalMember2020-07-012021-06-300000008670adp:ProfessionalEmployeeOrganizationServicesSegmentMemberadp:GlobalMember2020-07-012021-06-300000008670us-gaap:AllOtherSegmentsMemberadp:GlobalMember2020-07-012021-06-300000008670adp:ClientfundinterestMemberadp:EmployerServicesSegmentMember2020-07-012021-06-300000008670adp:ClientfundinterestMemberadp:ProfessionalEmployeeOrganizationServicesSegmentMember2020-07-012021-06-300000008670adp:ClientfundinterestMemberus-gaap:AllOtherSegmentsMember2020-07-012021-06-300000008670adp:EmployerServicesSegmentMember2020-07-012021-06-300000008670adp:ProfessionalEmployeeOrganizationServicesSegmentMember2020-07-012021-06-300000008670us-gaap:AllOtherSegmentsMember2020-07-012021-06-300000008670adp:HCMMemberadp:EmployerServicesSegmentMember2019-07-012020-06-300000008670adp:HCMMemberadp:ProfessionalEmployeeOrganizationServicesSegmentMember2019-07-012020-06-300000008670adp:HCMMemberus-gaap:AllOtherSegmentsMember2019-07-012020-06-300000008670adp:EmployerServicesSegmentMemberadp:HROMember2019-07-012020-06-300000008670adp:HROMemberadp:ProfessionalEmployeeOrganizationServicesSegmentMember2019-07-012020-06-300000008670adp:HROMemberus-gaap:AllOtherSegmentsMember2019-07-012020-06-300000008670adp:PEOMemberadp:EmployerServicesSegmentMember2019-07-012020-06-300000008670adp:PEOMemberadp:ProfessionalEmployeeOrganizationServicesSegmentMember2019-07-012020-06-300000008670adp:PEOMemberus-gaap:AllOtherSegmentsMember2019-07-012020-06-300000008670adp:EmployerServicesSegmentMemberadp:GlobalMember2019-07-012020-06-300000008670adp:ProfessionalEmployeeOrganizationServicesSegmentMemberadp:GlobalMember2019-07-012020-06-300000008670us-gaap:AllOtherSegmentsMemberadp:GlobalMember2019-07-012020-06-300000008670adp:ClientfundinterestMemberadp:EmployerServicesSegmentMember2019-07-012020-06-300000008670adp:ClientfundinterestMemberadp:ProfessionalEmployeeOrganizationServicesSegmentMember2019-07-012020-06-300000008670adp:ClientfundinterestMemberus-gaap:AllOtherSegmentsMember2019-07-012020-06-300000008670adp:EmployerServicesSegmentMember2019-07-012020-06-300000008670adp:ProfessionalEmployeeOrganizationServicesSegmentMember2019-07-012020-06-300000008670us-gaap:AllOtherSegmentsMember2019-07-012020-06-300000008670adp:HCMMemberadp:EmployerServicesSegmentMember2018-07-012019-06-300000008670adp:HCMMemberadp:ProfessionalEmployeeOrganizationServicesSegmentMember2018-07-012019-06-300000008670adp:HCMMemberus-gaap:AllOtherSegmentsMember2018-07-012019-06-300000008670adp:EmployerServicesSegmentMemberadp:HROMember2018-07-012019-06-300000008670adp:HROMemberadp:ProfessionalEmployeeOrganizationServicesSegmentMember2018-07-012019-06-300000008670adp:HROMemberus-gaap:AllOtherSegmentsMember2018-07-012019-06-300000008670adp:PEOMemberadp:EmployerServicesSegmentMember2018-07-012019-06-300000008670adp:PEOMemberadp:ProfessionalEmployeeOrganizationServicesSegmentMember2018-07-012019-06-300000008670adp:PEOMemberus-gaap:AllOtherSegmentsMember2018-07-012019-06-300000008670adp:EmployerServicesSegmentMemberadp:GlobalMember2018-07-012019-06-300000008670adp:ProfessionalEmployeeOrganizationServicesSegmentMemberadp:GlobalMember2018-07-012019-06-300000008670us-gaap:AllOtherSegmentsMemberadp:GlobalMember2018-07-012019-06-300000008670adp:ClientfundinterestMemberadp:EmployerServicesSegmentMember2018-07-012019-06-300000008670adp:ClientfundinterestMemberadp:ProfessionalEmployeeOrganizationServicesSegmentMember2018-07-012019-06-300000008670adp:ClientfundinterestMemberus-gaap:AllOtherSegmentsMember2018-07-012019-06-300000008670adp:EmployerServicesSegmentMember2018-07-012019-06-300000008670adp:ProfessionalEmployeeOrganizationServicesSegmentMember2018-07-012019-06-300000008670us-gaap:AllOtherSegmentsMember2018-07-012019-06-300000008670adp:DeferredcoststoobtainacontractMember2021-06-300000008670adp:DeferredcoststoobtainacontractMember2020-06-300000008670adp:DeferredcoststofulfillacontractMember2021-06-300000008670adp:DeferredcoststofulfillacontractMember2020-06-300000008670us-gaap:PropertyPlantAndEquipmentMember2019-07-012020-06-300000008670country:US2019-07-012020-06-300000008670us-gaap:MoneyMarketFundsMember2021-06-300000008670us-gaap:CorporateDebtSecuritiesMember2021-06-300000008670us-gaap:USTreasurySecuritiesMember2021-06-300000008670us-gaap:AssetBackedSecuritiesMember2021-06-300000008670us-gaap:ForeignGovernmentDebtSecuritiesMember2021-06-300000008670us-gaap:USGovernmentAgenciesDebtSecuritiesMember2021-06-300000008670adp:CanadianProvincialBondsMember2021-06-300000008670us-gaap:CommercialMortgageBackedSecuritiesMember2021-06-300000008670us-gaap:OtherDebtSecuritiesMember2021-06-300000008670adp:CorporateInvestmentsMember2021-06-300000008670adp:FundsHeldForClientsMember2021-06-300000008670us-gaap:MoneyMarketFundsMember2020-06-300000008670us-gaap:CorporateDebtSecuritiesMember2020-06-300000008670us-gaap:AssetBackedSecuritiesMember2020-06-300000008670us-gaap:USTreasurySecuritiesMember2020-06-300000008670us-gaap:USGovernmentAgenciesDebtSecuritiesMember2020-06-300000008670us-gaap:ForeignGovernmentDebtSecuritiesMember2020-06-300000008670us-gaap:CommercialMortgageBackedSecuritiesMember2020-06-300000008670adp:CanadianProvincialBondsMember2020-06-300000008670us-gaap:OtherDebtSecuritiesMember2020-06-300000008670adp:CorporateInvestmentsMember2020-06-300000008670adp:FundsHeldForClientsMember2020-06-300000008670us-gaap:FairValueInputsLevel1Member2021-06-300000008670us-gaap:FairValueInputsLevel3Member2021-06-300000008670adp:AssetBackedAutoLoanReceivablesMember2021-06-300000008670adp:FixedRateCreditCardMember2021-06-300000008670adp:AssetBackedEquipmentLeaseReceivableMember2021-06-300000008670adp:RateReductionReceivableMember2021-06-300000008670adp:FederalFarmCreditBanksMember2021-06-300000008670us-gaap:FederalHomeLoanBankCertificatesAndObligationsFHLBMember2021-06-300000008670us-gaap:MunicipalBondsMember2021-06-300000008670us-gaap:ForeignCorporateDebtSecuritiesMember2021-06-300000008670adp:CurrentMember2021-06-300000008670adp:CurrentMember2020-06-300000008670adp:NoncurrentMember2021-06-300000008670adp:NoncurrentMember2020-06-300000008670us-gaap:LandAndBuildingMember2021-06-300000008670us-gaap:LandAndBuildingMember2020-06-300000008670adp:DataProcessingEquipmentMember2021-06-300000008670adp:DataProcessingEquipmentMember2020-06-300000008670us-gaap:FurnitureAndFixturesMember2021-06-300000008670us-gaap:FurnitureAndFixturesMember2020-06-300000008670us-gaap:PropertyPlantAndEquipmentMember2021-06-300000008670us-gaap:PropertyPlantAndEquipmentMember2020-06-300000008670adp:EmployerServicesSegmentMember2019-06-300000008670adp:PeoServicesSegmentMember2019-06-300000008670adp:PeoServicesSegmentMember2019-07-012020-06-300000008670adp:EmployerServicesSegmentMember2020-06-300000008670adp:PeoServicesSegmentMember2020-06-300000008670adp:PeoServicesSegmentMember2020-07-012021-06-300000008670adp:EmployerServicesSegmentMember2021-06-300000008670adp:PeoServicesSegmentMember2021-06-300000008670us-gaap:ComputerSoftwareIntangibleAssetMember2021-06-300000008670us-gaap:ComputerSoftwareIntangibleAssetMember2020-06-300000008670us-gaap:CustomerListsMember2021-06-300000008670us-gaap:CustomerListsMember2020-06-300000008670us-gaap:OtherIntangibleAssetsMember2021-06-300000008670us-gaap:OtherIntangibleAssetsMember2020-06-300000008670us-gaap:ComputerSoftwareIntangibleAssetMember2020-07-012021-06-300000008670us-gaap:CustomerListsMember2020-07-012021-06-300000008670us-gaap:OtherIntangibleAssetsMember2020-07-012021-06-300000008670adp:ThreeHundredAndSixtyFourDayCreditFacilityMember2021-06-300000008670adp:ThreeHundredAndSixtyFourDayCreditFacilityMember2020-07-012021-06-300000008670adp:CreditFacilityExpiringInJuneTwoThousandTwentyFourMember2021-06-300000008670adp:CreditFacilityExpiringInJuneTwoThousandTwentyFourMember2020-07-012021-06-300000008670adp:CreditFacilityExpiringInJuneTwoThousandTwentySixMember2020-07-012021-06-300000008670adp:CreditFacilityExpiringInJuneTwoThousandTwentySixMember2021-06-300000008670us-gaap:CommercialPaperMember2021-06-300000008670us-gaap:CommercialPaperMember2020-07-012021-06-300000008670us-gaap:CommercialPaperMember2019-07-012020-06-300000008670adp:ReverseRepurchaseAgreementsMember2020-07-012021-06-300000008670adp:ReverseRepurchaseAgreementsMember2019-07-012020-06-300000008670adp:Notesdueon2020Member2020-08-012020-08-310000008670adp:Notesdueon2020Member2021-06-3000000086702020-08-1300000086702019-07-012021-06-300000008670adp:Notesdueon2020Member2020-06-300000008670adp:Notesdueon2025Member2021-06-300000008670adp:Notesdueon2025Member2020-06-300000008670adp:NotesDueOn2030Member2021-06-300000008670adp:NotesDueOn2030Member2020-06-300000008670adp:NotesDueOn2028Member2021-06-300000008670adp:NotesDueOn2028Member2020-06-300000008670us-gaap:OtherDebtSecuritiesMember2021-06-300000008670us-gaap:OtherDebtSecuritiesMember2020-06-300000008670adp:TimeBasedRestricedStockGrantedDuringOrAfterSeptember12018Member2020-07-012021-06-300000008670adp:PerformanceBasedRestrictedStockAndUnitsMembersrt:MinimumMember2020-07-012021-06-300000008670srt:MaximumMemberadp:PerformanceBasedRestrictedStockAndUnitsMember2020-07-012021-06-300000008670adp:PerformanceBasedRestrictedStockAndUnitsMember2020-07-012021-06-300000008670us-gaap:EmployeeStockMember2020-07-012021-06-300000008670adp:OperatingExpensesMember2020-07-012021-06-300000008670adp:OperatingExpensesMember2019-07-012020-06-300000008670adp:OperatingExpensesMember2018-07-012019-06-300000008670us-gaap:SellingGeneralAndAdministrativeExpensesMember2020-07-012021-06-300000008670us-gaap:SellingGeneralAndAdministrativeExpensesMember2019-07-012020-06-300000008670us-gaap:SellingGeneralAndAdministrativeExpensesMember2018-07-012019-06-300000008670adp:SystemDevelopmentAndProgrammingCostsMember2020-07-012021-06-300000008670adp:SystemDevelopmentAndProgrammingCostsMember2019-07-012020-06-300000008670adp:SystemDevelopmentAndProgrammingCostsMember2018-07-012019-06-300000008670adp:NonvestedStockOptionsMember2021-06-300000008670us-gaap:RestrictedStockUnitsRSUMember2021-06-300000008670adp:NonvestedRestrictedStockMember2021-06-300000008670adp:NonvestedStockOptionsMember2020-07-012021-06-300000008670us-gaap:RestrictedStockUnitsRSUMember2020-07-012021-06-300000008670adp:NonvestedRestrictedStockMember2020-07-012021-06-300000008670adp:TimeBasedRestrictedStockMember2020-06-300000008670adp:TimeBasedRestrictedStockUnitsMember2020-06-300000008670adp:TimeBasedRestrictedStockMember2020-07-012021-06-300000008670adp:TimeBasedRestrictedStockUnitsMember2020-07-012021-06-300000008670adp:TimeBasedRestrictedStockMember2021-06-300000008670adp:TimeBasedRestrictedStockUnitsMember2021-06-300000008670adp:PerformanceBasedRestrictedStockMember2020-06-300000008670adp:PerformanceBasedRestrictedStockUnitMember2020-06-300000008670adp:PerformanceBasedRestrictedStockMember2020-07-012021-06-300000008670adp:PerformanceBasedRestrictedStockUnitMember2020-07-012021-06-300000008670adp:PerformanceBasedRestrictedStockMember2021-06-300000008670adp:PerformanceBasedRestrictedStockUnitMember2021-06-300000008670adp:PerformanceBasedRestrictedStockMember2019-07-012020-06-300000008670adp:PerformanceBasedRestrictedStockMember2018-07-012019-06-300000008670adp:TimeBasedRestrictedStockMember2019-07-012020-06-300000008670adp:TimeBasedRestrictedStockMember2018-07-012019-06-3000000086702019-07-012019-07-010000008670us-gaap:CashAndCashEquivalentsMember2021-06-300000008670us-gaap:CashAndCashEquivalentsMember2020-06-300000008670us-gaap:FixedIncomeSecuritiesMember2021-06-300000008670us-gaap:FixedIncomeSecuritiesMember2020-06-300000008670us-gaap:DefinedBenefitPlanEquitySecuritiesUsMember2021-06-300000008670us-gaap:DefinedBenefitPlanEquitySecuritiesUsMember2020-06-300000008670us-gaap:DefinedBenefitPlanEquitySecuritiesNonUsMember2021-06-300000008670us-gaap:DefinedBenefitPlanEquitySecuritiesNonUsMember2020-06-300000008670adp:GlobalEquitySecuritiesMember2021-06-300000008670adp:GlobalEquitySecuritiesMember2020-06-300000008670country:USus-gaap:FixedIncomeSecuritiesMembersrt:MinimumMember2021-06-300000008670country:USsrt:MaximumMemberus-gaap:FixedIncomeSecuritiesMember2021-06-300000008670country:USus-gaap:DefinedBenefitPlanEquitySecuritiesUsMembersrt:MinimumMember2021-06-300000008670country:USsrt:MaximumMemberus-gaap:DefinedBenefitPlanEquitySecuritiesUsMember2021-06-300000008670country:USus-gaap:DefinedBenefitPlanEquitySecuritiesNonUsMembersrt:MinimumMember2021-06-300000008670country:USsrt:MaximumMemberus-gaap:DefinedBenefitPlanEquitySecuritiesNonUsMember2021-06-300000008670country:USadp:GlobalEquitySecuritiesMembersrt:MinimumMember2021-06-300000008670country:USsrt:MaximumMemberadp:GlobalEquitySecuritiesMember2021-06-300000008670adp:ComingledTrustsMemberus-gaap:FairValueInputsLevel1Member2021-06-300000008670us-gaap:FairValueInputsLevel2Memberadp:ComingledTrustsMember2021-06-300000008670us-gaap:FairValueInputsLevel3Memberadp:ComingledTrustsMember2021-06-300000008670adp:ComingledTrustsMember2021-06-300000008670us-gaap:FairValueInputsLevel1Memberus-gaap:USTreasuryAndGovernmentMember2021-06-300000008670us-gaap:FairValueInputsLevel2Memberus-gaap:USTreasuryAndGovernmentMember2021-06-300000008670us-gaap:FairValueInputsLevel3Memberus-gaap:USTreasuryAndGovernmentMember2021-06-300000008670us-gaap:USTreasuryAndGovernmentMember2021-06-300000008670adp:MutualFundsMemberus-gaap:FairValueInputsLevel1Member2021-06-300000008670adp:MutualFundsMemberus-gaap:FairValueInputsLevel2Member2021-06-300000008670us-gaap:FairValueInputsLevel3Memberadp:MutualFundsMember2021-06-300000008670adp:MutualFundsMember2021-06-300000008670us-gaap:FairValueInputsLevel1Memberadp:CorporateAndMunicipalBondsMember2021-06-300000008670us-gaap:FairValueInputsLevel2Memberadp:CorporateAndMunicipalBondsMember2021-06-300000008670us-gaap:FairValueInputsLevel3Memberadp:CorporateAndMunicipalBondsMember2021-06-300000008670adp:CorporateAndMunicipalBondsMember2021-06-300000008670us-gaap:MortgageBackedSecuritiesIssuedByUSGovernmentSponsoredEnterprisesMemberus-gaap:FairValueInputsLevel1Member2021-06-300000008670us-gaap:FairValueInputsLevel2Memberus-gaap:MortgageBackedSecuritiesIssuedByUSGovernmentSponsoredEnterprisesMember2021-06-300000008670us-gaap:FairValueInputsLevel3Memberus-gaap:MortgageBackedSecuritiesIssuedByUSGovernmentSponsoredEnterprisesMember2021-06-300000008670us-gaap:MortgageBackedSecuritiesIssuedByUSGovernmentSponsoredEnterprisesMember2021-06-300000008670adp:TotalPensionAssetsExcludingCashMemberus-gaap:FairValueInputsLevel1Member2021-06-300000008670adp:TotalPensionAssetsExcludingCashMemberus-gaap:FairValueInputsLevel2Member2021-06-300000008670us-gaap:FairValueInputsLevel3Memberadp:TotalPensionAssetsExcludingCashMember2021-06-300000008670adp:TotalPensionAssetsExcludingCashMember2021-06-300000008670us-gaap:CashAndCashEquivalentsMemberus-gaap:FairValueInputsLevel1Member2021-06-300000008670adp:ComingledTrustsMemberus-gaap:FairValueInputsLevel1Member2020-06-300000008670us-gaap:FairValueInputsLevel2Memberadp:ComingledTrustsMember2020-06-300000008670us-gaap:FairValueInputsLevel3Memberadp:ComingledTrustsMember2020-06-300000008670adp:ComingledTrustsMember2020-06-300000008670us-gaap:FairValueInputsLevel1Memberus-gaap:USTreasuryAndGovernmentMember2020-06-300000008670us-gaap:FairValueInputsLevel2Memberus-gaap:USTreasuryAndGovernmentMember2020-06-300000008670us-gaap:FairValueInputsLevel3Memberus-gaap:USTreasuryAndGovernmentMember2020-06-300000008670us-gaap:USTreasuryAndGovernmentMember2020-06-300000008670adp:MutualFundsMemberus-gaap:FairValueInputsLevel1Member2020-06-300000008670adp:MutualFundsMemberus-gaap:FairValueInputsLevel2Member2020-06-300000008670us-gaap:FairValueInputsLevel3Memberadp:MutualFundsMember2020-06-300000008670adp:MutualFundsMember2020-06-300000008670us-gaap:FairValueInputsLevel1Memberadp:CorporateAndMunicipalBondsMember2020-06-300000008670us-gaap:FairValueInputsLevel2Memberadp:CorporateAndMunicipalBondsMember2020-06-300000008670us-gaap:FairValueInputsLevel3Memberadp:CorporateAndMunicipalBondsMember2020-06-300000008670adp:CorporateAndMunicipalBondsMember2020-06-300000008670us-gaap:MortgageBackedSecuritiesIssuedByUSGovernmentSponsoredEnterprisesMemberus-gaap:FairValueInputsLevel1Member2020-06-300000008670us-gaap:FairValueInputsLevel2Memberus-gaap:MortgageBackedSecuritiesIssuedByUSGovernmentSponsoredEnterprisesMember2020-06-300000008670us-gaap:FairValueInputsLevel3Memberus-gaap:MortgageBackedSecuritiesIssuedByUSGovernmentSponsoredEnterprisesMember2020-06-300000008670us-gaap:MortgageBackedSecuritiesIssuedByUSGovernmentSponsoredEnterprisesMember2020-06-300000008670adp:TotalPensionAssetsExcludingCashMemberus-gaap:FairValueInputsLevel1Member2020-06-300000008670adp:TotalPensionAssetsExcludingCashMemberus-gaap:FairValueInputsLevel2Member2020-06-300000008670us-gaap:FairValueInputsLevel3Memberadp:TotalPensionAssetsExcludingCashMember2020-06-300000008670adp:TotalPensionAssetsExcludingCashMember2020-06-300000008670us-gaap:CashAndCashEquivalentsMemberus-gaap:FairValueInputsLevel1Member2020-06-3000000086702020-01-012020-12-3100000086702019-01-012019-12-3100000086702018-01-012018-12-310000008670us-gaap:OtherAssetsMember2021-06-300000008670us-gaap:OtherAssetsMember2020-06-300000008670us-gaap:ForeignCountryMember2021-06-300000008670us-gaap:DomesticCountryMember2021-06-300000008670us-gaap:StateAndLocalJurisdictionMember2021-06-300000008670adp:IncomeTaxesPayableMember2021-06-300000008670adp:IncomeTaxesPayableMember2020-06-300000008670us-gaap:EarliestTaxYearMemberstpr:IL2020-07-012021-06-300000008670stpr:ILus-gaap:LatestTaxYearMember2020-07-012021-06-300000008670us-gaap:EarliestTaxYearMemberstpr:MA2020-07-012021-06-300000008670us-gaap:LatestTaxYearMemberstpr:MA2020-07-012021-06-300000008670stpr:TXus-gaap:EarliestTaxYearMember2020-07-012021-06-300000008670stpr:TXus-gaap:LatestTaxYearMember2020-07-012021-06-300000008670us-gaap:EarliestTaxYearMemberstpr:MI2020-07-012021-06-300000008670stpr:MIus-gaap:LatestTaxYearMember2020-07-012021-06-300000008670stpr:NYus-gaap:EarliestTaxYearMember2020-07-012021-06-300000008670stpr:NYus-gaap:LatestTaxYearMember2020-07-012021-06-300000008670adp:NewYorkCityMemberus-gaap:EarliestTaxYearMember2020-07-012021-06-300000008670adp:NewYorkCityMemberus-gaap:LatestTaxYearMember2020-07-012021-06-300000008670country:INus-gaap:EarliestTaxYearMember2020-07-012021-06-300000008670country:INus-gaap:LatestTaxYearMember2020-07-012021-06-3000000086702021-06-012021-06-30adp:claim00000086702020-05-012020-05-310000008670us-gaap:AccumulatedTranslationAdjustmentMember2018-06-300000008670us-gaap:AccumulatedNetUnrealizedInvestmentGainLossMember2018-06-300000008670us-gaap:AccumulatedGainLossNetCashFlowHedgeParentMember2018-06-300000008670us-gaap:AccumulatedDefinedBenefitPlansAdjustmentMember2018-06-300000008670us-gaap:AccumulatedOtherComprehensiveIncomeMember2018-06-300000008670us-gaap:AccumulatedTranslationAdjustmentMember2018-07-012019-06-300000008670us-gaap:AccumulatedNetUnrealizedInvestmentGainLossMember2018-07-012019-06-300000008670us-gaap:AccumulatedGainLossNetCashFlowHedgeParentMember2018-07-012019-06-300000008670us-gaap:AccumulatedDefinedBenefitPlansAdjustmentMember2018-07-012019-06-300000008670us-gaap:AccumulatedTranslationAdjustmentMember2019-06-300000008670us-gaap:AccumulatedNetUnrealizedInvestmentGainLossMember2019-06-300000008670us-gaap:AccumulatedGainLossNetCashFlowHedgeParentMember2019-06-300000008670us-gaap:AccumulatedDefinedBenefitPlansAdjustmentMember2019-06-300000008670us-gaap:AccumulatedOtherComprehensiveIncomeMember2019-06-300000008670us-gaap:AccumulatedTranslationAdjustmentMember2019-07-012020-06-300000008670us-gaap:AccumulatedNetUnrealizedInvestmentGainLossMember2019-07-012020-06-300000008670us-gaap:AccumulatedGainLossNetCashFlowHedgeParentMember2019-07-012020-06-300000008670us-gaap:AccumulatedDefinedBenefitPlansAdjustmentMember2019-07-012020-06-300000008670us-gaap:AccumulatedTranslationAdjustmentMember2020-06-300000008670us-gaap:AccumulatedNetUnrealizedInvestmentGainLossMember2020-06-300000008670us-gaap:AccumulatedGainLossNetCashFlowHedgeParentMember2020-06-300000008670us-gaap:AccumulatedDefinedBenefitPlansAdjustmentMember2020-06-300000008670us-gaap:AccumulatedTranslationAdjustmentMember2020-07-012021-06-300000008670us-gaap:AccumulatedNetUnrealizedInvestmentGainLossMember2020-07-012021-06-300000008670us-gaap:AccumulatedGainLossNetCashFlowHedgeParentMember2020-07-012021-06-300000008670us-gaap:AccumulatedDefinedBenefitPlansAdjustmentMember2020-07-012021-06-300000008670us-gaap:AccumulatedTranslationAdjustmentMember2021-06-300000008670us-gaap:AccumulatedNetUnrealizedInvestmentGainLossMember2021-06-300000008670us-gaap:AccumulatedGainLossNetCashFlowHedgeParentMember2021-06-300000008670us-gaap:AccumulatedDefinedBenefitPlansAdjustmentMember2021-06-300000008670us-gaap:OperatingSegmentsMemberadp:EmployerServicesSegmentMember2020-07-012021-06-300000008670us-gaap:OperatingSegmentsMemberadp:ProfessionalEmployeeOrganizationServicesSegmentMember2020-07-012021-06-300000008670us-gaap:CorporateNonSegmentMember2020-07-012021-06-300000008670us-gaap:OperatingSegmentsMemberadp:EmployerServicesSegmentMember2021-06-300000008670us-gaap:OperatingSegmentsMemberadp:ProfessionalEmployeeOrganizationServicesSegmentMember2021-06-300000008670us-gaap:CorporateNonSegmentMember2021-06-300000008670us-gaap:OperatingSegmentsMemberadp:EmployerServicesSegmentMember2019-07-012020-06-300000008670us-gaap:OperatingSegmentsMemberadp:ProfessionalEmployeeOrganizationServicesSegmentMember2019-07-012020-06-300000008670us-gaap:CorporateNonSegmentMember2019-07-012020-06-300000008670us-gaap:OperatingSegmentsMemberadp:EmployerServicesSegmentMember2020-06-300000008670us-gaap:OperatingSegmentsMemberadp:ProfessionalEmployeeOrganizationServicesSegmentMember2020-06-300000008670us-gaap:CorporateNonSegmentMember2020-06-300000008670us-gaap:OperatingSegmentsMemberadp:EmployerServicesSegmentMember2018-07-012019-06-300000008670us-gaap:OperatingSegmentsMemberadp:ProfessionalEmployeeOrganizationServicesSegmentMember2018-07-012019-06-300000008670us-gaap:CorporateNonSegmentMember2018-07-012019-06-300000008670us-gaap:OperatingSegmentsMemberadp:EmployerServicesSegmentMember2019-06-300000008670us-gaap:OperatingSegmentsMemberadp:ProfessionalEmployeeOrganizationServicesSegmentMember2019-06-300000008670us-gaap:CorporateNonSegmentMember2019-06-300000008670country:US2020-07-012021-06-300000008670srt:EuropeMember2020-07-012021-06-300000008670country:CA2020-07-012021-06-300000008670adp:OtherGeographicalPlacesMember2020-07-012021-06-300000008670country:US2021-06-300000008670srt:EuropeMember2021-06-300000008670country:CA2021-06-300000008670adp:OtherGeographicalPlacesMember2021-06-300000008670srt:EuropeMember2019-07-012020-06-300000008670country:CA2019-07-012020-06-300000008670adp:OtherGeographicalPlacesMember2019-07-012020-06-300000008670country:US2020-06-300000008670srt:EuropeMember2020-06-300000008670country:CA2020-06-300000008670adp:OtherGeographicalPlacesMember2020-06-300000008670country:US2018-07-012019-06-300000008670srt:EuropeMember2018-07-012019-06-300000008670country:CA2018-07-012019-06-300000008670adp:OtherGeographicalPlacesMember2018-07-012019-06-300000008670country:US2019-06-300000008670srt:EuropeMember2019-06-300000008670country:CA2019-06-300000008670adp:OtherGeographicalPlacesMember2019-06-300000008670us-gaap:AllowanceForCreditLossMemberadp:CurrentMember2020-06-300000008670us-gaap:AllowanceForCreditLossMemberadp:CurrentMember2020-07-012021-06-300000008670us-gaap:AllowanceForCreditLossMemberadp:CurrentMember2021-06-300000008670us-gaap:AllowanceForCreditLossMemberadp:NoncurrentMember2020-06-300000008670us-gaap:AllowanceForCreditLossMemberadp:NoncurrentMember2020-07-012021-06-300000008670us-gaap:AllowanceForCreditLossMemberadp:NoncurrentMember2021-06-300000008670us-gaap:ValuationAllowanceOfDeferredTaxAssetsMember2020-06-300000008670us-gaap:ValuationAllowanceOfDeferredTaxAssetsMember2020-07-012021-06-300000008670us-gaap:ValuationAllowanceOfDeferredTaxAssetsMember2021-06-300000008670us-gaap:AllowanceForCreditLossMemberadp:CurrentMember2019-06-300000008670us-gaap:AllowanceForCreditLossMemberadp:CurrentMember2019-07-012020-06-300000008670us-gaap:AllowanceForCreditLossMemberadp:NoncurrentMember2019-06-300000008670us-gaap:AllowanceForCreditLossMemberadp:NoncurrentMember2019-07-012020-06-300000008670us-gaap:ValuationAllowanceOfDeferredTaxAssetsMember2019-06-300000008670us-gaap:ValuationAllowanceOfDeferredTaxAssetsMember2019-07-012020-06-300000008670us-gaap:AllowanceForCreditLossMemberadp:CurrentMember2018-06-300000008670us-gaap:AllowanceForCreditLossMemberadp:CurrentMember2018-07-012019-06-300000008670us-gaap:AllowanceForCreditLossMemberadp:NoncurrentMember2018-06-300000008670us-gaap:AllowanceForCreditLossMemberadp:NoncurrentMember2018-07-012019-06-300000008670us-gaap:ValuationAllowanceOfDeferredTaxAssetsMember2018-06-300000008670us-gaap:ValuationAllowanceOfDeferredTaxAssetsMember2018-07-012019-06-30
UNITED STATES
SECURITIES AND EXCHANGE COMMISSION
Washington, D.C. 20549
______________
FORM 10-K
_________________ | | | | | | | | | | | | | | |
| ☒ | ANNUAL REPORT PURSUANT TO SECTION 13 OR 15(d) OF THE SECURITIES EXCHANGE ACT OF 1934 |
For the Year Ended June 30, 2021
OR | | | | | | | | | | | | | | |
| ☐ | TRANSITION REPORT PURSUANT TO SECTION 13 OR 15(d) OF THE SECURITIES EXCHANGE ACT OF 1934 |
For the Transition Period From to
Commission File Number 1-5397
AUTOMATIC DATA PROCESSING, INC.
(Exact name of registrant as specified in its charter) | | | | | | | | |
| Delaware | 22-1467904 |
| (State or other jurisdiction of incorporation or organization) | (IRS Employer Identification No.) |
| One ADP Boulevard | |
| Roseland, | NJ | 07068 |
| (Address of principal executive offices) | (Zip Code) |
| |
| | |
| | |
| | |
|
Registrant's telephone number, including area code: (973)-974-5000 | | | | | | | | |
| Securities registered pursuant to Section 12(b) of the Act: | |
| Title of each class | Trading Symbol(s) | Name of each exchange on which registered |
Common Stock, $0.10 Par Value
(voting) | ADP | NASDAQ Global Select Market
|
Securities registered pursuant to Section 12(g) of the Act: None
Indicate by check mark if the Registrant is a well-known seasoned issuer, as defined in Rule 405 of the Securities Act. Yes ý No ☐
Indicate by check mark if the Registrant is not required to file reports pursuant to Section 13 or 15(d) of the Act. Yes ☐ No ý
Indicate by check mark whether the Registrant (1) has filed all reports required to be filed by Section 13 or 15(d) of the Securities Exchange Act of 1934 during the preceding 12 months (or for such shorter period that the Registrant was required to file such reports), and (2) has been subject to the filing requirements for the past 90 days. Yes ý No ☐
Indicate by check mark whether the Registrant has submitted electronically every Interactive Data File required to be submitted pursuant to Rule 405 of Regulation S-T (§232.405 of this chapter) during the preceding 12 months (or for such shorter period that the Registrant was required to submit such files). Yes ý No ☐
Indicate by check mark whether the Registrant is a large accelerated filer, an accelerated filer, a non-accelerated filer, smaller reporting company, or an emerging growth company. See the definitions of “large accelerated filer,” “accelerated filer,” “smaller reporting company,” and "emerging growth company" in Rule 12b-2 of the Exchange Act. | | | | | | | | | | | |
| Large Accelerated Filer | ☒ | Accelerated filer | ☐ |
| Non-accelerated filer | ☐ | Smaller reporting company | ☐ |
| | Emerging growth company | ☐ |
If an emerging growth company, indicate by check mark if the Registrant has elected not to use the extended transition period for complying with any new or revised financial accounting standards provided pursuant to Section 13(a) of the Exchange Act. ☐
Indicate by check mark whether the registrant has filed a report on and attestation to its management’s assessment of the effectiveness of its internal control over financial reporting under Section 404(b) of the Sarbanes-Oxley Act (15 U.S.C. 7262(b)) by the registered public accounting firm that prepared or issued its audit report. ☒ | | | | | | | | | | | | | | |
| Indicate by check mark whether the registrant is a shell company (as defined in Rule 12b-2 of the Exchange Act). | Yes | ☐ | No | ☒ |
The aggregate market value of the voting and non-voting common equity held by non-affiliates of the Registrant as of the last business day of the Registrant’s most recently completed second fiscal quarter was approximately $75,329,818,310. On July 30, 2021 there were 423,080,556 shares of Common Stock outstanding.
DOCUMENTS INCORPORATED BY REFERENCE | | | | | |
| Portions of the Registrant's Proxy Statement for its 2021 Annual Meeting of Stockholders. | Part III |
Table of Contents
| | | | | | | | |
| | | |
| | | Page |
| Part I | | |
| Item 1. | | |
| Item 1A. | | |
| Item 1B. | | |
| Item 2. | | |
| Item 3. | | |
| Item 4. | | |
| | |
| Part II | | |
| Item 5. | | |
| Item 6. | | |
| Item 7. | | |
| Item 7A. | | |
| Item 8. | | |
| Item 9. | | |
| Item 9A. | | |
| Item 9B. | | |
| | |
| Part III | | |
| Item 10. | | |
| Item 11. | | |
| Item 12. | | |
| Item 13. | | |
| Item 14. | | |
| | |
| Part IV. | | |
| Item 15. | | |
| Signatures | | |
| | |
| | |
Part I
Item 1. Business
CORPORATE BACKGROUND
General
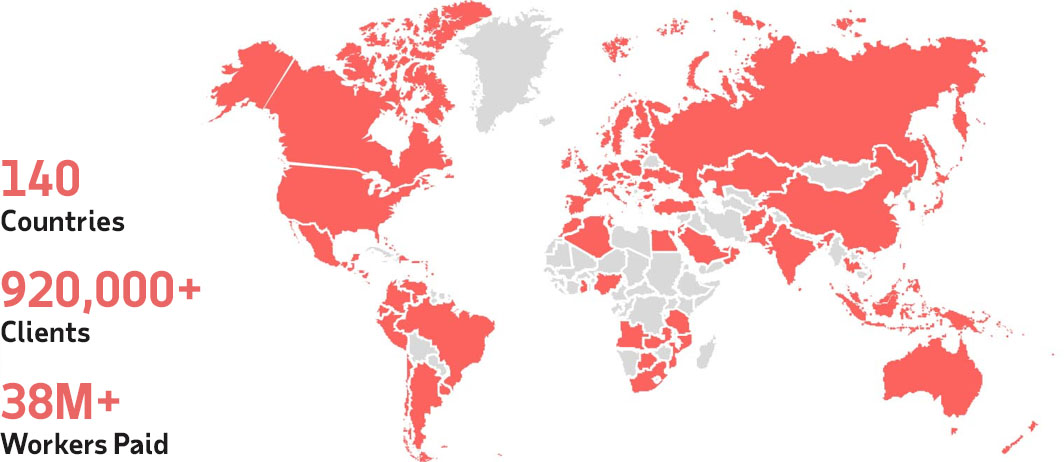
In 1949, our founders established ADP to shape the world of work with a simple, innovative idea: help clients focus on their business by freeing them up from certain non-core tasks such as payroll. Today, we are one of the world’s leading providers of cloud-based human capital management (HCM) solutions to employers, offering solutions to businesses of all sizes, whether they have simple or complex needs. We serve over 920,000 clients and pay over 38 million workers in 140 countries and territories. Our common stock is listed on the NASDAQ Global Select Market® under the symbol “ADP.”
When we refer to “we,” “us,” “our,” “ADP,” or the “Company” in this Annual Report on Form 10-K, we mean Automatic Data Processing, Inc. and its consolidated subsidiaries.
BUSINESS OVERVIEW
ADP’s Mission
As digital technology, globalization, new business models and other significant events and disruptions reshape the way people work, our mission is to power organizations with insightful solutions that meet the changing needs of our clients and their workers. Our HCM technology, industry and compliance expertise and data insights deliver measurable results, peace-of-mind and an engaged, productive workforce. Our leading technology and commitment to service excellence is at the core of our relationship with each one of our clients, whether it's a small, mid-sized or large organization operating in one or multiple countries around the world. We are constantly designing better ways to work through cutting-edge products, premium services and exceptional experiences that enable people to reach their full potential.
ADP’s Strategy
Our Strategic Pillars. Our business strategy is based on three strategic pillars, which are designed to position us as the global market leader in HCM technology and services:
• Grow a complete suite of cloud-based HCM solutions (HCM Solutions). We develop cloud-based software and offer comprehensive solutions that assist employers of all types and sizes in managing the entire worker spectrum and employment cycle — from full-time to freelancer and from hire to retire.
• Grow and scale our market-leading HR Outsourcing solutions (HRO Solutions). We offer comprehensive HRO solutions in which we provide complete management solutions for HR administration, payroll administration, talent management, employee benefits, benefits administration, employer liability management, and other HCM and employee benefits functions.
• Leverage our global presence to offer clients HCM solutions wherever they do business (Global Solutions). We are expanding our international HCM and HRO businesses, comprised of our established local, in-country solutions and our market-leading, cloud-based multi-country solutions.
With a large and growing addressable market, we are strongly positioned to continue delivering sustainable long-term value across our strategic pillars. We are doing this by successfully executing on product and technology innovation, providing industry-leading service and compliance expertise, and enhancing our world-class distribution.
We are focused on, and investing in, our world-class and next-gen platforms that are built for the future of work, and on providing market-leading HCM product and technology solutions that solve the needs of our clients today, and anticipate the needs of our clients tomorrow. Our world-class platforms and multi-national solutions provide our clients with comprehensive HR and payroll capabilities that drive productivity and enable compliance globally. Our cloud-based next-gen platforms are built to be person-centric, serve all worker types, support flexible work and on-demand pay, and deliver seamless global capabilities to dynamic, team-based organizations.
Digital technology is transforming today's workplace and workforce. We are accelerating our own digital transformation and leveraging digital technology to change how we engage with our clients and how their workers engage with us — and an important part of this includes delivering solutions wherever they are, whether at work or on the go.
We offer the broadest suite of complete HRO solutions coupled with dedicated and strategic HR services and deep local expertise. These offerings can be tailored to meet the increasingly complex and sophisticated needs of our clients and their workers.
Our global footprint in the HCM industry is unmatched and, together with world-class technology and deep in-country compliance expertise, we are strongly positioned to continue to drive growth by delivering solutions to clients of all sizes wherever they do business.
Innovation at ADP
Innovation is in our DNA. For over 70 years, we have reimagined the world of work by designing cutting-edge products, robust services and exceptional experiences that touch millions of people’s lives daily. We pioneered HCM automation, HCM in the cloud, mobile HCM and a digital HCM marketplace. As the business and digital technology landscape rapidly evolves, what “work” means, how and where it gets done, and how workers are paid is changing as well. We innovate by anticipating the future of work, the future of HCM and the future of pay in order to meet the evolving and unique needs of our clients and their workers.
Our next-gen platforms are built for the ever-changing world of work. Designed from the ground up to be cloud-native, global, scalable and secure, our next-gen platforms provide our clients with the flexibility they need to address today’s and tomorrow’s workplace challenges. Our award winning next-gen HCM platform enables our clients to personalize their experience based on their needs. Built for dynamic teams, our next-gen HCM platform provides our clients with visibility into where work actually happens rather than into rigid organizational hierarchies and worker types. With our “HR your way” approach, clients can easily tailor the solution to their needs by deploying low-code applications.
In 2020, our next-gen payroll solution was named “Top HR Product” at the annual HR Technology Conference, marking the sixth consecutive year ADP has been honored for its innovative technology, an unprecedented achievement. Recently expanded across North America to Canada and Mexico, this next-gen payroll solution supports workers of all types and enables real-time, transparent, continuous payroll calculations. Our next-gen payroll solution also unlocks flexible pay choices for our clients so they can provide the best pay experience for their workers. As the regulatory environment rapidly changes, making it harder for companies to navigate the complexities of payroll, our next-gen payroll solution’s built-in compliance capabilities enable our clients to focus on managing their business. Our next-gen platforms are designed to meet the needs of our clients in an ever-changing world of work.
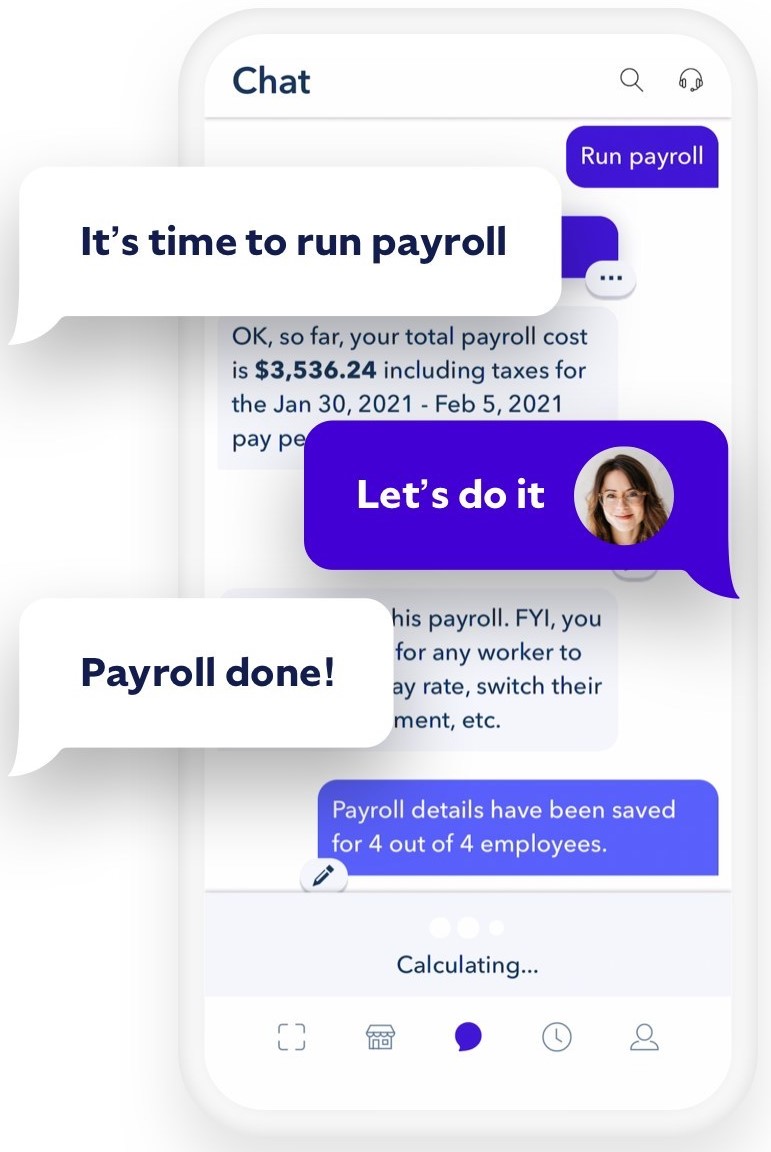
In February 2021, we launched the “Roll™ by ADP” mobile-first solution - reimagining how small businesses do payroll. This groundbreaking payroll solution utilizes an AI-powered chat interface to turn traditional payroll management into an intuitive conversation that can complete payroll in under a minute. Leveraging ADP’s long-standing payroll expertise and data security, small business owners can download and self-purchase Roll and run payroll anywhere, anytime, quickly and compliantly, with no experience or training needed. The conversational experience runs off simple chat prompts such as “Run my payroll,” offering a frictionless experience that also allows
clients to confidently handle compliance matters like tax filing and deposits.
Today, big data provides a real competitive advantage. That is why we have accelerated the deployment of machine learning (ML) against our unmatched HCM dataset – the same HCM dataset that drives our renowned ADP National Employment Report®. We are leading this innovation effort with ADP® DataCloud, our award-winning ML and workforce analytics platform which is by far one of the largest repositories of payroll information available. DataCloud analyzes aggregated, anonymized and timely HCM and compensation data from more than 920,000 organizations across the country, powering solutions that provide clients with in-depth workforce and business insights that enable critical HR decisions. ADP DataCloud's Skills Graph, our proprietary data structure, is based on more than 30 million employee records, 50 million resumes and 5 million job postings across more than 20 industries and 500 geographic areas, and extracts, aligns and normalizes key information such as skills, job titles and levels, education and qualifications from non-structured data and infers missing skills and qualifications from context. Skills Graph powers ADP’s Candidate Profile Relevancy tool to help score, assess and predict candidates who are the best fit for a job opening, as well as our new Organizational Benchmarking Dashboard which enables companies to decide how best to deploy their workers by comparing organizational metrics like headcount, labor costs and turnover against other similar businesses. We offer similar solutions to clients outside the United States.
ADP’s Model-Based Benchmarks, powered by Skills Graph, also extend benchmarks to include compensation for up to 150 million workers. Model-Based Benchmarks are driven by a set of deep learning models that extract patterns and knowledge from millions of payroll records and job profiles to provide accurate information that reflects the reality of the position being shown. ADP’s Pay Equity Storyboard combines analytics and benchmarking to help employers better understand potential pay gaps and provide them with real, up-to-date, aggregated and anonymized market data to understand how their compensation for a particular job compares to other similar employers. We continue to leverage the powerful DataCloud platform to provide clients with relevant, actionable insights. These insights are particularly important with respect to Diversity and Inclusion and, as part of our commitment to Diversity and Inclusion, this year we introduced the Diversity, Equity and Inclusion (DEI) Dashboard which can help businesses focus on the DEI issues that are most important to them by analyzing their diversity landscape through a simple question-and-answer format and easy-to-navigate user interface that allows them to better set, track and expand their DEI goals. These innovative offerings combine HR expertise and data transparency in a way that connects HR to the bottom line. In harnessing the power of big data through ML, ADP recognizes the importance of accountability, transparency, privacy, explainability and governance, and in furtherance of those goals has established an active AI & Data Ethics Committee, comprised of both industry leaders and ADP experts, which advises on emerging industry trends and concerns and provides guidance with respect to compliance with the principles that ADP should follow while developing products, systems and applications that involve artificial intelligence, ML and big data.
WorkMarket, a cloud-based workforce management solution, provides robust freelancer management functionality and reporting insights, enabling clients to organize, manage and pay their extended workforce.
Our innovative Wisely® payment offerings support an employer’s need for flexible payment solutions in order to meet the individual needs of its workers. The Wisely® Pay payroll card is a network-branded payroll card and digital account that enables employers to pay their employees, and enables employees to access their payroll funds immediately, including via a network member bank or an ATM, make purchases or pay bills, load additional funds onto the card, such as tax refunds and military pensions, and transfer funds to a bank account in the United States. We also offer Wisely® Direct, a network-branded general purpose reloadable card and digital account, which provides similar features and functionality as Wisely Pay but is offered directly to consumers. Our digital card offerings are true banking alternatives that feature innovative services such as savings, budgeting and cash-back rewards, are digital wallet-enabled and, through the companion myWisely app, offer other personal financial management features.

In addition, our ADP Mobile apps simplify how work gets done by enabling clients to process their payroll anywhere, and giving millions of their employees worldwide convenient access to their payroll and HR information in 28 languages.
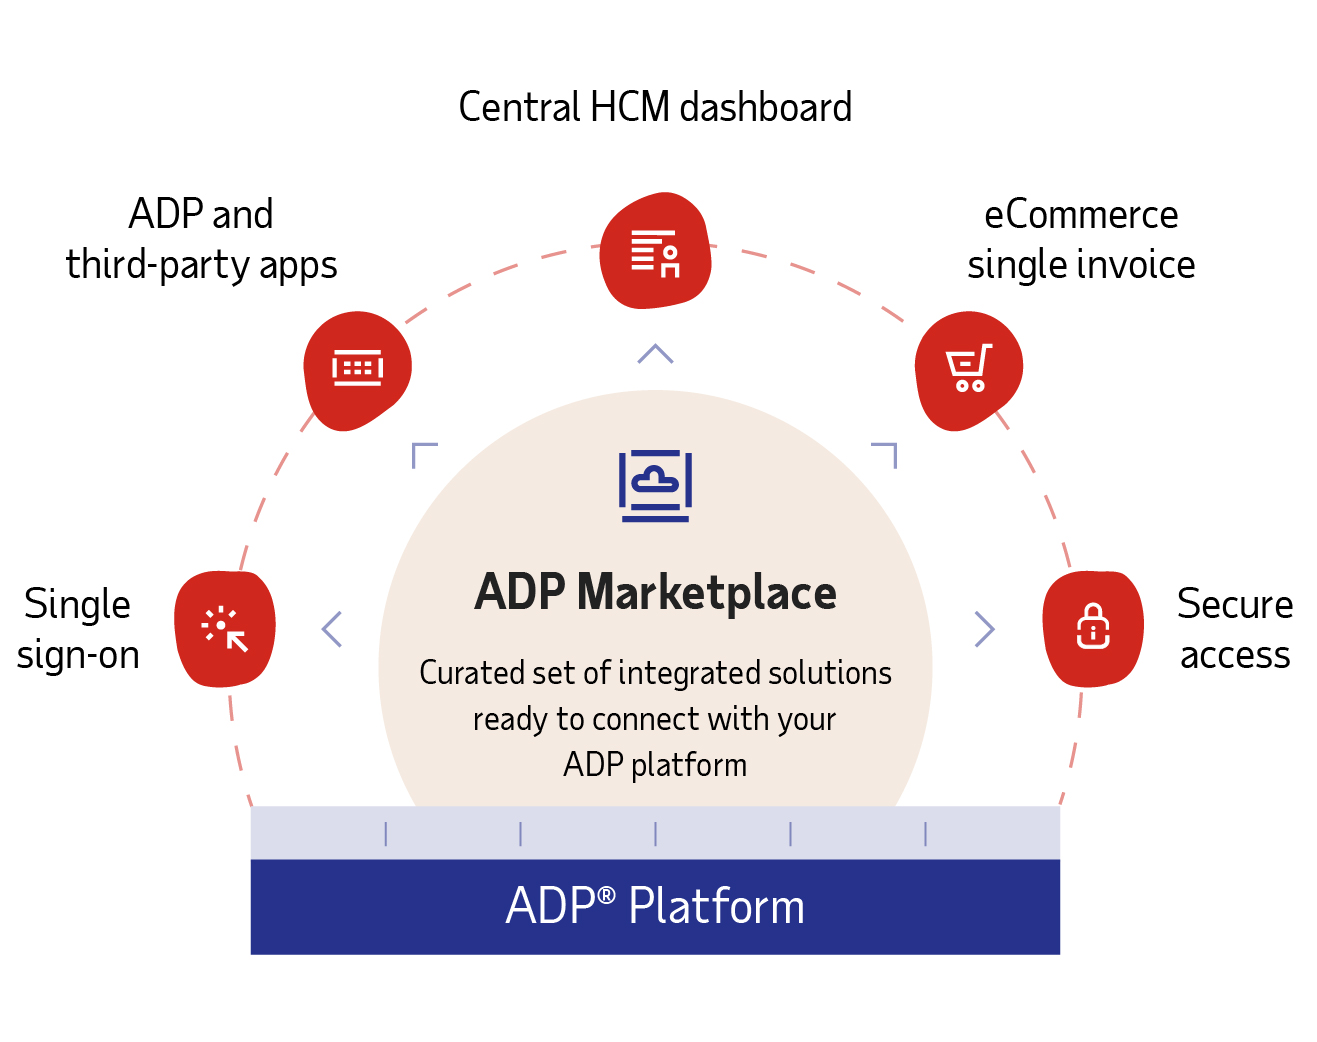
We have also given third-party developers and system integrators access to some of our platforms’ API (application programming interface) libraries through ADP Marketplace in order to enable secure data sharing between ADP and other solutions across the HR and business ecosystem. ADP Marketplace is a digital HR storefront where clients can discover the best-fit apps for their industry; browse by solution-types such as learning management, financial wellness, time and attendance, and benefits administration; or connect HR software they already use. The pre-built integrations help clients simplify their processes, create a single system of record, and reduce data errors, freeing up time and resources to focus on growing their business and taking care of their people. With approximately 600 apps and integrations to choose from, ADP Marketplace offers ADP clients a modern HR experience that they can tailor to their specific needs.
Helping Clients and their Employees Emerge Stronger from the COVID-19 Global Pandemic
The COVID-19 global pandemic has continued to create extremely challenging circumstances for our clients and their employees, and our priority has been to provide the support they need to navigate these challenges. As they pivot their focus from seeking essential relief to evolving their business models and operations to address changes in the economy and workplace, we continue to provide trusted solutions, data and expertise to help them emerge stronger.
At the onset of the pandemic, we quickly developed and provided – at no charge – reporting capabilities designed to provide clients around the world with data they needed to benefit from legislation providing financial assistance to enable them to stay in business. We were one of the first HCM companies to provide tools and reports that enabled our clients to apply for Paycheck Protection Program loans under the Coronavirus Aid, Relief and Economic Security (CARES) Act of more than $115 billion – ultimately helping approximately 400,000 employers apply for this essential assistance. To help employers confidently manage compliance, our teams analyzed more than 2,000 legislative updates associated with COVID-19 across the globe in order to provide them with easy to understand and actionable guidance and updated reporting tools.
As COVID-19 restrictions ease, many employers are returning to the workplace and designing new policies that reflect the demand for remote and hybrid work models, we are supporting their efforts by providing our clients with tools that can help them manage compliance confidently, achieve business continuity, and support employee wellness and engagement.
Our Return to Workplace dashboard powered by ADP DataCloud uses data analytics and employee surveys to allow clients to monitor workforce trends including availability, health attestation results, and worker readiness and sentiment toward returning to the workplace; identify and schedule workers based on availability, location, job title and other attributes; track vaccination status; and facilitate contact tracing, in order to help transition workers back to workplaces with more clarity and confidence.
With ADP® Compliance on Demand, clients can easily tap into a knowledge base for compliance — from new leave laws and time tracking requirements, to record-keeping and more.
The new ADP Time Kiosk helps employers manage safe levels of occupancy by equipping workers with time & attendance tracking without touching a device. The Time Kiosk uses optional facial recognition to log workers in compliantly and voice activation to start/end a shift, take a meal break, transfer jobs and more.
As the economy recovers and the way people work is reshaped, our teams continue to swiftly adapt and adjust workflows to deliver the content, resources and support that employers and their workforce need, when they need it. Our expertise, innovative technology and data, as well as established financial relationships with our clients, financial institutions and employees, make ADP the partner that clients trust as they adapt to new world of work and create workplaces where everyone can thrive.
Reportable Segments
Our two reportable business segments are Employer Services and Professional Employer Organization (“PEO”). For financial data by segment and by geographic area, see Note 16 to the “Consolidated Financial Statements” contained in this Annual Report on Form 10-K.
Employer Services. Our Employer Services segment serves clients ranging from single-employee small businesses to large enterprises with tens of thousands of employees around the world, offering a comprehensive range of technology-based HCM solutions, including our strategic, cloud-based platforms, and HRO (other than PEO) solutions. These solutions address critical client needs and include: Payroll Services, Benefits Administration, Talent Management, HR Management, Workforce Management, Compliance Services, Insurance Services and Retirement Services.
Professional Employer Organization. Our PEO business, called ADP TotalSource®, provides clients with comprehensive employment administration outsourcing solutions through a relationship in which employees who work for a client (referred to as “worksite employees”) are co-employed by us and the client.
Our reportable segments are based on the way that management reviews the performance of, and makes decisions about, our business. Our strategic pillars represent the strategic growth areas for our business. The results of our business related to products and solutions within the HCM Solutions pillar, the HRO Solutions pillar (other than PEO products and solutions) and the Global Solutions pillar are contained within our Employer Services segment. The results of our business within the HRO Solutions pillar related to our PEO products and solutions are contained within our PEO segment.
In order to serve the unique needs of diverse types of businesses and workforce models, we provide a range of solutions which businesses of all types and sizes and across geographies can use to recruit, pay, manage, and retain their workforce. We address these broad market needs with our cloud-based strategic platforms: RUN Powered by ADP®, serving approximately 750,000 small businesses; ADP Workforce Now®, serving over 75,000 mid-sized and large businesses across our strategic pillars; and ADP Vantage HCM®, serving over 500 large enterprise businesses. All of these solutions can be combined with ADP SmartCompliance® to address the increasingly broad and complex needs of employers. Outside the United States, we address the needs of over 60,000 clients with premier global solutions consisting of in-country solutions and multinational offerings, including ADP GlobalView®, ADP Celergo®/Streamline® and ADP iHCM.
Strategic Cloud-based Products and Solutions Across Client Size and Geography
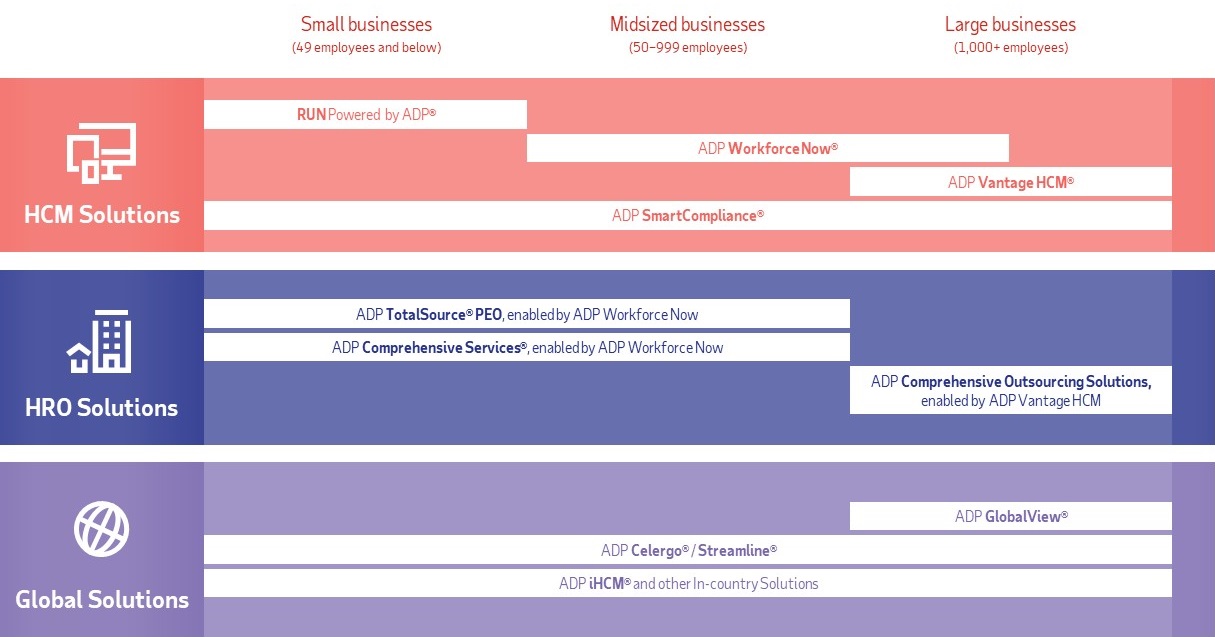
HCM Solutions
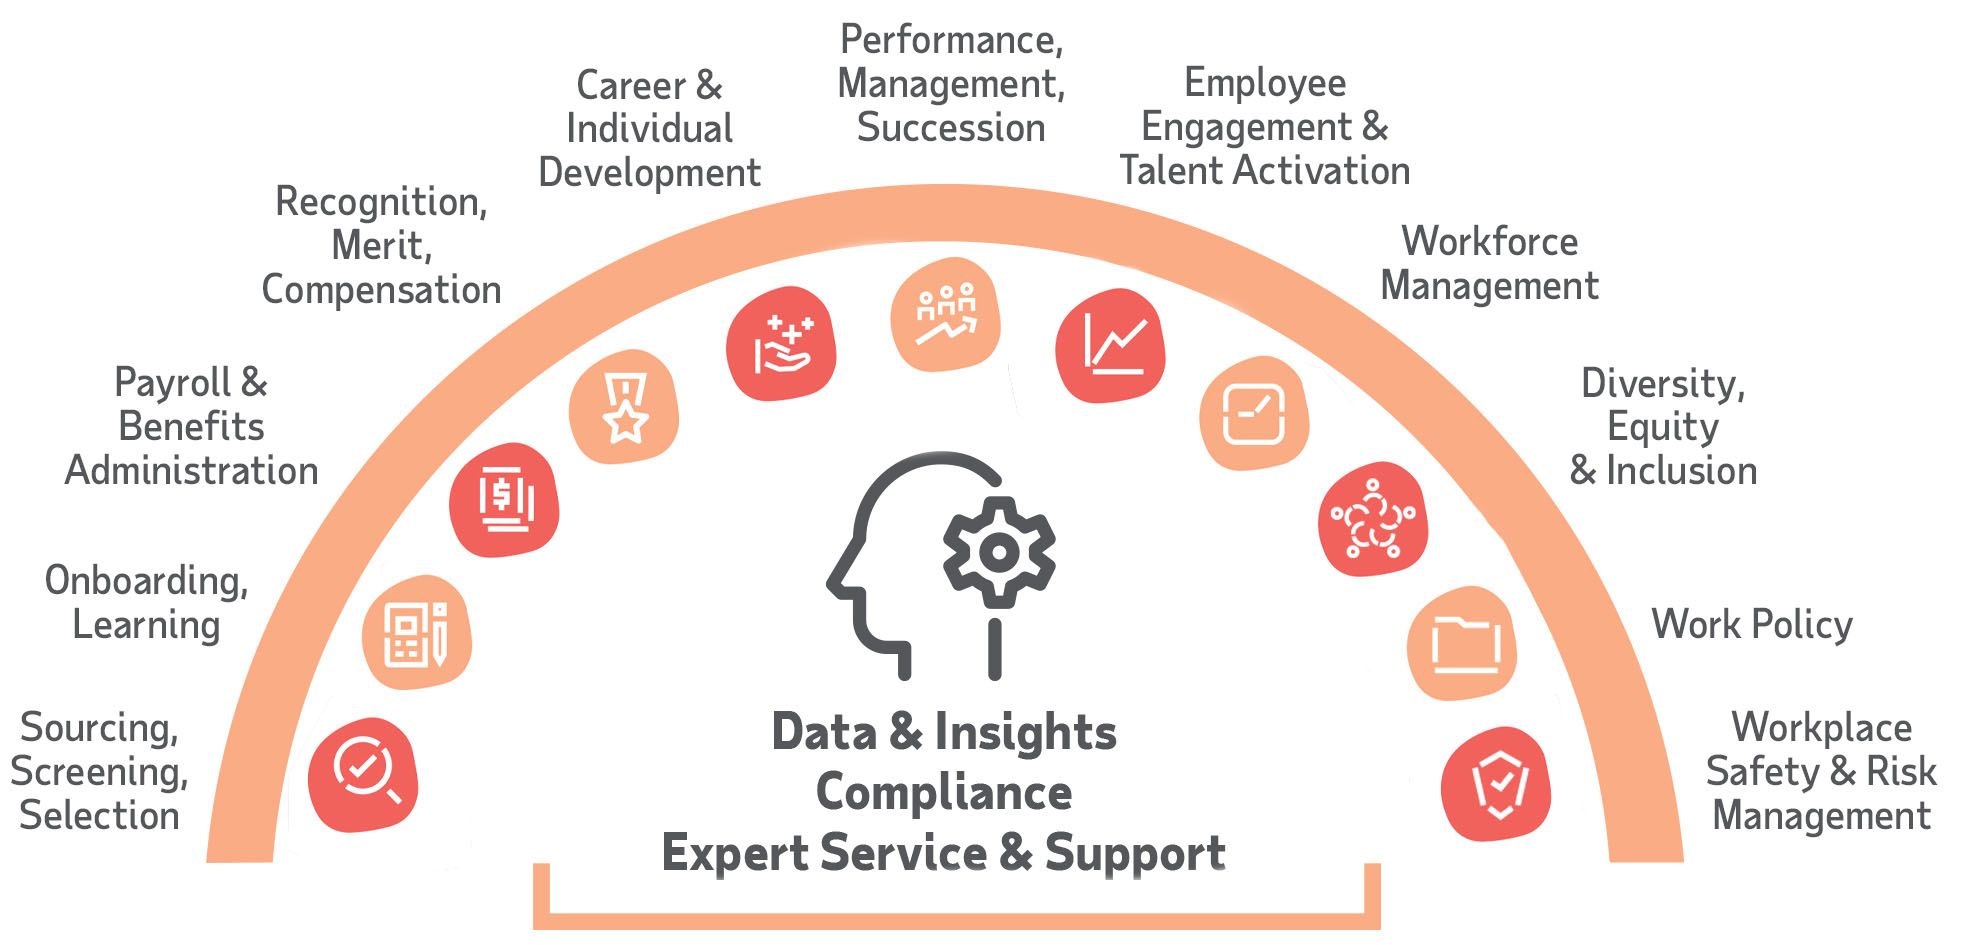
Integrated HCM Solutions. Our premier suite of HCM products offers complete solutions that assist employers of all types and sizes in all stages of the employment cycle, from recruitment to retirement.
Our suite of HCM solutions are powered by our strategic, cloud-based, award-winning platforms:
• RUN Powered by ADP combines a software platform for small business payroll, HR management and tax compliance administration, with 24/7 service and support from our team of small business experts. RUN Powered by ADP also integrates with other ADP solutions, such as workforce management, workers’ compensation insurance premium payment plans, and retirement plan administration systems.
• ADP Workforce Now is a flexible HCM solution used across mid-sized and large businesses in North America to manage their employees. More businesses use ADP Workforce Now in North America than any other HCM solution designed for both mid-sized and large businesses.
• ADP Vantage HCM is a solution for large enterprises in the United States. It offers a comprehensive set of HCM capabilities within a single solution that unifies the five major areas of HCM: HR management, benefits administration, payroll services, time and attendance management, and talent management.
Payroll Services. We pay over 23 million (approximately 1 out of every 6) workers in the United States. We provide flexible payroll services to employers of all sizes, including the preparation of employee paychecks, pay statements, supporting journals, summaries, and management reports.
We provide employers with a wide range of payroll options, including using mobile technology, connecting their major enterprise resource planning (“ERP”) applications with ADP’s payroll services or outsourcing their entire payroll process to us. Employers can choose a variety of payroll payment options including ADP’s electronic wage payment and, in the United States, payroll card solutions and digital accounts. On behalf of our clients in the United States, we prepare and file federal, state and local payroll tax returns, and quarterly and annual Social Security, Medicare, and federal, state and local income tax withholding reports.

Benefits Administration. In the United States, we provide powerful and agile solutions for employee benefits administration. These options include health and welfare administration services, leave administration services, insurance carrier enrollment services, employee communication services, and dependent verification services. In addition, ADP benefits administration solutions offer employers a simple and flexible cloud-based eligibility and enrollment system that provides their employees with tools, communications, and other resources they need to understand their benefits options and make informed choices.
Talent Management. ADP’s Talent Management solutions simplify and improve the talent acquisition, management, and activation process from recruitment to ongoing employee engagement and development. Employers can also outsource their internal recruitment function to ADP. Our solutions provide performance, learning, succession and compensation management tools that help employers align goals to outcomes, and enable managers to identify and mitigate potential retention risks. Our talent activation solutions include StandOut® powered by ADP, which provides team leaders with data and
insights to drive employee engagement and leadership development, which in turn help drive employee performance.
Workforce Management. ADP’s Workforce Management offers a range of solutions to over 100,000 employers of all sizes, including time and attendance, absence management and scheduling tools. Time and attendance solutions include time capture via online timesheets, timeclocks with badge readers, biometrics and touch-screens, telephone/interactive voice response, and mobile smartphones and tablets. These tools automate the calculation and reporting of hours worked, helping employers prepare payroll, control costs and overtime, and manage compliance with wage and hour regulations. Absence management tools include accrued time off, attendance policy and leave case management modules. Our employee scheduling tools simplify visibility, offer shift-swapping capabilities and can assist managers with optimizing schedules to boost productivity and minimize under- and over-staffing. We also offer analytics and reporting tools that provide clients with insights, benchmarks and performance metrics so they can better manage their workforce. In addition, industry-specific modules are available for labor forecasting, budgeting, activity and task management, grant and project tracking, and tips management.
Compliance Solutions. ADP’s Compliance Solutions provides industry-leading expertise in payment compliance and employment-related tax matters that complement the payroll, HR and ERP systems of its clients. In our fiscal year ended June 30, 2021, in the United States, we processed and delivered more than 69 million employee year-end tax statements, and moved more than $2.3 trillion in client funds to taxing and other agencies and to our clients’ employees and other payees.

• ADP SmartCompliance. In the United States, ADP SmartCompliance integrates client data delivered from our integrated HCM platforms or third-party payroll, HR and financial systems into a single, cloud-based solution. Our specialized teams use the data to work with clients to help them manage changing and complex regulatory landscapes and improve business processes. ADP SmartCompliance includes HCM-related compliance solutions such as Employment Tax and Wage Payments, as well as Tax Credits, Health Compliance, Wage Garnishments, Employment Verifications, Unemployment Claims and W-2 Management.
• ADP SmartCompliance Employment Tax. As part of our full-service employment tax services in the United States, we prepare and file employment tax returns on our clients’ behalf and, in connection with these stand-alone services, collect employment taxes from clients and remit these taxes to more than 8,000 federal, state and local tax agencies.
• ADP SmartCompliance Wage Payments. In the United States, we offer compliant pay solutions for today's workforce, including electronic payroll disbursement options such as payroll cards, digital accounts and direct deposit, as well as traditional payroll checks, which can be integrated with clients’ ERP and payroll systems.
Human Resources Management. Commonly referred to as Human Resource Information Systems, ADP’s Human Resources Management Solutions provide employers with a single system of record to support the entry, validation, maintenance, and reporting of data required for effective HR management, including employee names, addresses, job types, salary grades, employment history, and educational background.
Insurance Services. ADP’s Insurance Services business, in conjunction with our licensed insurance agency,
Automatic Data Processing Insurance Agency, Inc., facilitates access in the United States to workers’ compensation and group health insurance for small and mid-sized clients through a variety of insurance carriers. Our automated Pay-by-Pay® premium payment program calculates and collects workers’ compensation premium payments each pay period, simplifying this task for employers.
Retirement Services. ADP Retirement Services helps employers in the United States administer various types of retirement plans, such as traditional and Roth 401(k)s, profit sharing (including new comparability), SIMPLE and SEP IRAs, and executive deferred compensation plans. ADP Retirement Services offers a full service 401(k) plan program which provides recordkeeping and administrative services, combined with an investment platform offered through ADP Broker-Dealer, Inc. that gives our clients’ employees access to a wide range of non-proprietary investment options and online tools to monitor the performance of their investments. In addition, ADP Retirement Services offers investment management services to retirement plans through ADP Strategic Plan Services, LLC, an SEC registered investment adviser under the Investment Advisers Act of 1940. ADP Retirement Services also offers trustee services through a third party.
HRO Solutions
As a leader in the growing HR Outsourcing market, we partner with our clients to offer a full range of seamless technology and service solutions for HR administration, workforce management, payroll services, benefits administration and talent management. From small businesses to enterprises with thousands of employees, with HRO our clients gain proven technology and processes and robust service and support. Whether a client chooses our PEO or other HR Outsourcing solutions, we offer solutions tailored to a client’s specific needs and preferences – designed to meet the client’s needs today, and as its business and needs evolve.
Professional Employer Organization. ADP TotalSource is enabled by ADP Workforce Now and offers small and mid-sized businesses a comprehensive HR outsourcing solution through a co-employment model. With a PEO, both ADP and the client have a co-employment relationship with the client’s employees. We assume certain employer responsibilities such as payroll processing and tax filings, and the client maintains control of its business and all management responsibilities. ADP TotalSource clients are able to offer their employees services and benefits on par with those of much larger enterprises, without the need to staff a full HR department. With our cloud-based HCM software at the core, we serve more than 14,500 clients and
more than 620,000 worksite employees in all 50 U.S. states. ADP TotalSource is the largest PEO certified by the Internal Revenue Service as meeting the requirements to operate as a Certified Professional Employer Organization under the Internal Revenue Code. As a full-service PEO, ADP TotalSource provides a broad range of HR administrative services, including payroll and payroll tax, employer compliance, HR guidance, employee benefits and benefit administration, talent strategies, and workers’ compensation insurance including risk and claims management. Some of the rich offerings available through ADP TotalSource to address today’s workplace challenges include:
• Better Employee Benefits: Through our PEO, many of our clients discover that they can offer a richer overall benefits package than they could afford to offer on their own. We give clients access to a new patent-pending approach to help them target the best benefit plan offerings for their employees. They can compare plan options and make more educated decisions about what plan offering is best for their company and budget. In addition, ADP TotalSource integrates with our award-winning ADP Marketplace to further tailor offerings, such as helping employees pay off student loans with payroll contributions and integrating a client’s U.S. PEO population with its global workforce’s HR system of record.
• Protection and Compliance: ADP TotalSource HR experts help clients manage the risks of being an employer by advising how to handle properly a range of issues - from HR and safety compliance to employee-relations. This includes access to workers' compensation coverage and expertise designed to help them handle both routine and unexpected incidents, including discrimination and harassment claims.
• Talent Engagement: Featuring a talent blueprint, ADP TotalSource HR experts work with clients to help them better engage and retain their workforce through solutions that support the core needs of an employee at work. In addition, our full-service recruitment team is dedicated to helping our clients find and hire new talent, while reducing the stress of uncovering top talent.
• Expertise: Each client is assigned a designated HR specialist for day-to-day and strategic guidance. Clients can also access data-driven benchmarks in areas such as turnover and overtime, staffing and understanding profit leaks, and have their ADP HR expert help tailor recommendations to continue to drive their business forward. A payroll specialist is also available to clients to help them ensure their workers are paid correctly, on time and in compliance.
ADP Comprehensive Services. Leveraging our market-leading ADP Workforce Now platform, ADP Comprehensive Services partners with clients of all types and sizes to tackle their HR, talent, benefits administration
and pay challenges with help from our proven expertise, deep experience and best practices. ADP Comprehensive Services is flexible – enabling clients to partner with us for managed services for one, some or all areas across HR, talent, benefits administration and pay. We provide outsourced execution that combines processes, technology and a robust service and support team that acts as an extension of our client’s in-house resources – so their HCM and pay operations are executed with confidence.
ADP Comprehensive Outsourcing Services (ADP COS). Enabled by ADP Vantage HCM, ADP COS is designed for large business outsourcing for payroll, HR administration, workforce management, benefits administration and talent management. With COS, the day-to-day payroll process becomes our responsibility, freeing up clients to address critical issues like employee engagement and retention. The combination of technology, deep expertise and data-driven insights that COS offers is powerful, allowing clients to focus on strategy and results.
ADP Recruitment Process Outsourcing Services (ADP RPO®). ADP RPO provides deep talent insights to help drive targeted recruitment strategies for attracting top talent. With global, customizable recruitment services, ADP RPO enables organizations to find and hire the best candidates for hourly, professional or executive positions. In addition, we also deliver market analytics, sourcing strategies, candidate screening, selection and on-boarding solutions to help organizations connect their talent strategy to their business's priorities.
Global Solutions
Our premier global solutions consist of multi-country and local in-country solutions for employers of any type or size. We partner with clients to help them navigate the most complex HR and payroll scenarios using tailored and scalable technology supported by our deep compliance expertise.
ADP Global Payroll is a solution for multinational organizations of all sizes, empowering them to harmonize HCM strategies in 140 countries globally. This improves visibility, control and operational efficiency, giving organizations the insight and confidence to adapt to changing local needs, while helping to drive overall organizational agility and engagement.
We also offer comprehensive, country-specific HCM solutions that combine innovative technology with deep local expertise. By operating a flexible service model, we help customers manage various combinations of payroll services, HR management, time and attendance management, talent management and benefits management, depending on the country in which the solution is provided.
We pay over 14 million workers outside the United States with our in-country solutions and with ADP GlobalView, ADP Celergo/Streamline and ADP iHCM – our simplified and intuitive multi-country payroll solutions. As part of our global payroll services, we supply year-end regulatory and legislative tax statements and other forms to our clients’ employees. Our global talent management solutions elevate the employee experience, from recruitment to ongoing employee engagement and development. Our comprehensive HR solutions combined with our deep expertise make our clients’ global HR management strategies a reality. Our configurable, automated time and attendance tools help global clients understand the work being performed and the resources being used, and help ensure the right people are in the right place at the right time.
MARKETS AND SALES
Our HCM solutions are offered in 140 countries and territories across North America, Latin America, Europe, Asia and Africa. The most material markets for HCM Solutions, Global Solutions and HRO Solutions (other than PEO) are the United States, Canada and Europe. In each market, we have both country-specific solutions and multi-country solutions, for employers of all sizes and complexities. The major components of our offerings throughout these geographies are payroll, HR outsourcing and time and attendance management. In addition, we offer wage and tax collection and/or remittance services in the United States, Canada, the United Kingdom, Australia, India and China. Our PEO business offers services exclusively in the United States.
We market our solutions primarily through our direct sales force. We also market HCM Solutions, Global Solutions and HRO Solutions through indirect sales channels, such as marketing relationships with certified public accountants and banks, among others. None of our major business units has a single homogeneous client base or market. While concentrations of clients exist in specific industries, no one client, industry or industry group is material to our overall
revenues. We are a leader in each of our major service offerings and do not believe any of our major services or business units is subject to unique market risk.
COMPETITION
The industries in which we operate are highly competitive. We know of no reliable statistics by which we can determine the number of our competitors, but we believe that we are one of the largest providers of HCM solutions in the world. HCM Solutions, Global Solutions and HRO Solutions (other than PEO) compete with other business outsourcing companies, companies providing ERP services, providers of cloud-based HCM solutions and financial institutions. Our PEO business competes with other PEOs providing similar services, as well as business outsourcing companies, companies providing ERP services and providers of cloud-based HCM solutions. Other competitive factors include a company’s in-house function, whereby a company installs and operates its own HCM system.
Competition for business outsourcing solutions is primarily based on product and service quality, reputation, ease of use and accessibility of technology, breadth of offerings, and price. We believe that we are competitive in each of these areas and that our leading-edge technology, together with our commitment to service excellence, distinguishes us from our competitors.
INDUSTRY REGULATION
Our business is subject to a wide range of complex U.S. and foreign laws and regulations. In addition, many of our solutions are designed to assist clients with their compliance with certain U.S. and foreign laws and regulations that apply to them. We have, and continue to enhance, compliance programs and policies to monitor and address the legal and regulatory requirements applicable to our operations and client solutions, including dedicated compliance personnel and training programs.
As one of the world’s largest providers of HCM solutions, our systems contain a significant amount of sensitive data related to clients, employees of our clients, vendors and our employees. We are, therefore, subject to compliance obligations under federal, state and foreign privacy, data protection and cybersecurity-related laws, including federal, state and foreign security breach notification laws with respect to both client employee data and our own employee data. The changing nature of these comprehensive laws in the United States, Europe and elsewhere, including the European Union’s (the “EU”) General Data Protection Regulation (the “GDPR”) and the California Consumer Privacy Act (the “CCPA”), which will be replaced by the voter-approved California Privacy Rights Act of 2020 (the “CPRA”), impact our processing of personal information of our employees and on behalf of our clients. The GDPR imposes strict and comprehensive requirements on us as both a data controller and a data processor. As part of our overall data protection compliance program, including with respect to data protection laws in the EU, we are one of the few companies in the world to have implemented Binding Corporate Rules (“BCRs”). Compliance with our BCRs permits us to process and transfer personal data across borders in accordance with the GDPR and other data protection laws in the EU. The CCPA and CPRA require companies to provide new data disclosure, access, deletion and opt-out rights to consumers in California. In addition, in the United States, the Health Insurance Portability and Accountability Act of 1996 applies to our insurance services businesses and ADP TotalSource.
As part of our payroll and payroll tax management services, we move client funds to taxing authorities, our clients’ employees and other payees via electronic transfer, direct deposit, prepaid access and ADPCheck. In 2019, the Office of the Comptroller of Currency (the “OCC”) authorized us to open ADP Trust Company, National Association (the “ADP Trust Bank”), via a national trust bank charter pursuant to the National Bank Act. The ADP Trust Bank is the sole trustee of ADP Client Trust, our grantor trust which holds client funds, and is responsible for the oversight and management of those client funds. The ADP Trust Bank, and all of its fiduciary activities including the U.S. money movement it oversees and manages via ADP Client Trust, is subject to comprehensive ongoing oversight and regulation by the OCC. We have surrendered all state money transmitter licenses as the activity previously managed through those licenses was moved into the ADP Client Trust managed by ADP Trust Bank, which is federally exempt from state money transmitter regulation with respect to the client money movement activity that it manages. In addition, our U.S. money movement managed by the ADP Trust Bank and our U.S. prepaid access offering are subject to the anti-money laundering and reporting provisions of The Bank Secrecy Act of 1970, as amended by the USA PATRIOT Act of 2001 (the “BSA”). Elements of our money
movement activities outside of the United States are subject to licensing and similar anti-money laundering and reporting laws and requirements in the countries in which we provide such services. Our employee screening and selection services business offers background checking services that are subject to the Fair Credit Reporting Act. ADP TotalSource is subject to various state licensing requirements and maintains certifications with the Internal Revenue Service. Because ADP TotalSource is a co-employer with respect to its clients’ worksite employees, we may be subject to limited obligations and responsibilities of an employer under federal and state tax, insurance and employment laws. Our registered investment adviser provides certain investment management and advisory services to retirement plan administrators under a heightened “fiduciary” standard and is regulated by the SEC and the U.S. Department of Labor. ADP Broker-Dealer, Inc., which supports our Retirement Services business, is a registered broker-dealer regulated by the SEC and the Financial Industry Regulatory Authority (FINRA).
In addition, many of our businesses offer solutions that assist our clients in complying with certain U.S. and foreign laws and regulations that apply to them. Although these laws and regulations apply to our clients and not to ADP, changes in such laws or regulations may affect our operations, products and services. For example, our payroll services are designed to facilitate compliance with state laws and regulations applicable to the payment of wages. In addition, our HCM solutions help clients manage their compliance with certain requirements of the Affordable Care Act in the United States. Similarly, our Tax Credit Services business, which helps clients in the United States take advantage of tax credit opportunities in connection with the hiring of new employees and certain other activities, is based on federal, state or local tax laws and regulations allowing for tax credits, which are subject to renewal, amendment or rescission.
We believe that key components of our compliance programs provide real competitive differentiators. For instance, our BCRs have enabled ADP to apply a global standard of data protection, simplifying data transfer processes and assisting our clients in meeting the demanding standards of data protection expected in Europe – a solution that most competitors cannot provide. Similarly, the ADP Client Trust and ADP Trust Bank provide client funds with a level of protection that most competitors cannot offer. We continue to expand our approach to compliance and are adopting “Compliance by design” as a tenet that prioritizes compliance in designing and developing new solutions to support our clients.
The foregoing description does not include an exhaustive list of the laws and regulations governing or impacting our business. See the discussion contained in the “Risk Factors” section in Part I, Item 1A of this Annual Report on Form 10-K for information regarding changes in laws
and regulations that could have a materially adverse effect on our reputation, results of operations or financial condition or have other adverse consequences.
CLIENTS AND CLIENT CONTRACTS
We provide services to more than 920,000 clients. In fiscal 2021, no single client or group of affiliated clients accounted for revenues in excess of 2% of our annual consolidated revenues.
We are continuously in the process of performing implementation services for new clients. Depending on the service agreement and/or the size of the client, the installation or conversion period for new clients can vary from a short period of time for a small Employer Services client (as little as 24 hours) to a longer period for a large Employer Services client with multiple deliverables (generally six to nine months). In some cases, based on a client's timeline, the period may exceed two years for a large, multi-country GlobalView client or other large, multi-phase implementation. Although we monitor sales that have not yet been installed, we do not view this metric as material to an understanding of our overall business in light of the recurring nature of our business. This metric is not a reported number, but it is used by management as a planning tool to allocate resources needed to install services, and as a means of assessing our performance against the expectations of our clients. In addition, some of our products and services are sold under longer-term contracts with initial terms ranging from two to seven years. However, this anticipated future revenue under contract is not a significant portion of our expected future revenue, is not a meaningful indicator of our future performance and is not material to management's estimate of our future revenue.
Our business is typically characterized by long-term client relationships that result in recurring revenue. Our services are provided under written price quotations or service agreements having varying terms and conditions. No one price quotation or service agreement is material to us. Based on our retention levels in fiscal 2021, our client retention is estimated at approximately 13 years in Employer Services, and approximately 7 years in PEO. While our client retention rate historically has not varied significantly from year to year, we experienced an increase in our Employer Services rate in fiscal 2021 that we believe was driven primarily by a combination of improvement in client satisfaction and a decrease in clients switching providers during the Covid-19 pandemic.
PRODUCT DEVELOPMENT
We continually upgrade, enhance, and expand our solutions and services. In general, new solutions and services supplement rather than replace our existing
solutions and services and, given our recurring revenue model, do not have a material and immediate effect on our revenues. We believe that our strategic solutions and services have significant remaining life cycles.
SYSTEMS DEVELOPMENT AND PROGRAMMING
During the fiscal years ended June 30, 2021, 2020 and 2019, we invested approximately $1.016 billion, $947 million and $911 million, respectively, in systems development and programming. These investments include expenses for activities such as the development of new products, maintenance expenses associated with our existing technologies, purchases of new software and software licenses, additions to software resulting from business combinations, as well as client migrations to our new strategic cloud-based platforms.
LICENSES
We are the licensee under a number of agreements for computer programs and databases. Our business is not dependent upon a single license or group of licenses. Third-party licenses, patents, trademarks, and franchises are not material to our business as a whole.
OUR HCM STRATEGY
Our Human Capital Management (HCM) strategy is simple, our people are one of our most valuable assets and we are committed to valuing, growing and engaging them.
Our Chief Human Resources Officer (CHRO), together with our Chief Diversity and Talent Officer, manages our HCM strategy and related programs and initiatives, as well as our talent strategy. Our CHRO, along with our CEO, as appropriate, regularly updates and supports our Compensation and Management Development Committee of the Board (“CMDC”) as well as the Board of Directors on HCM matters, including culture, engagement, and diversity and inclusion. The CMDC is responsible for these matters, as well as our executive compensation program, management succession planning and talent development, and company-wide equity-based plans.
Our Employees and Demographics
As of June 30, 2021, our global team of associates consisted of approximately 56,000 persons. We track the female, minority and generational demographics of our workforce and share them in our annual Global Corporate Social Responsibility (“CSR”) Report, which is available on our website. Nothing in our CSR Report shall be deemed incorporated by reference into this Annual Report on Form 10-K.
Our Culture and Values
More than 70 years ago, our founders established the values that guide us today.
 These values have helped shape our one-of-a-kind culture, which embraces diversity, inclusiveness and belonging.
Our long-term business success is closely linked to our commitment to creating an environment in which our associates thrive, and that means we have to listen to and engage our associates. We conduct an annual culture survey, myVoice, where our associates can share their opinions on important topics, including client service, diversity, social responsibility, ethics, innovation and leadership. Along with many of our world-class clients, we leverage our innovative StandOut® powered by ADP platform, to drive talent engagement and activation. We issue quarterly global StandOut® Engagement Pulse® surveys to ensure that all associates can share how they feel about their work and their team, and for us to get a snapshot of engagement across the globe.
The strength of our ADP team comes from what each one of us offers each other, our clients and our community. Through our myMoment Recognition Program, we give our associates the opportunity to recognize and celebrate each other when they demonstrate our values, drive our goals and go above and beyond in contributing to our collective success. Our global ADP Cares program, which is funded by the Company, the ADP Foundation and our generous associates, helps members of our team get through difficult, unforeseen events such as natural disasters and major illnesses. We also proudly support our associates that give back to our communities through paid volunteer time off and our donation matching program.
Diversity and inclusion are a cornerstone of our one-of-a-kind culture. We value diverse perspectives and believe that our associates and their best ideas thrive in a diverse
and inclusive environment. We strive to reflect the diversity of the communities and clients we serve and are firmly focused on ensuring that all our associates are welcomed and enjoy a deep sense of belonging.
We have launched a number of initiatives to strengthen and further cultivate our diverse and inclusive culture, starting with our Talent Task Force for all of our people leaders, which includes diversity goals for our senior leaders that are tied to their compensation as an incentive to diversify our leadership ranks. Our Workforce Diversity Initiative uses data analysis to identify and focus on opportunities to increase the number of underrepresented associates in our workforce to better reflect the communities we serve. Our voluntary business resource groups (BRGs), which cover a broad array of diverse associates that share common interests and experiences, make us stronger by promoting diversity and cultural awareness, accelerating associate engagement, retention and career development, and helping build relationships with diverse markets in our communities. In addition, we are deeply committed to fair and equitable pay, which is critical to creating a diverse, inclusive and engaging culture. We make pay decisions based on skills, job-related experience, the market value of the job, and performance and in the U.S. and Canada have proactively determined to no longer ask candidates for prior pay history, whether or not we are required to do so.
Our Talent Strategy
Our talent strategy is simple – we aim to attract and retain ambitious, passionate and overall top talent by offering a place where our people can grow their careers, challenge themselves, share generously, take risks, and create positive change. This has allowed us to be consistently recognized by esteemed organizations as an employer of choice year after year.
We invest in our team members to ensure they have the skills necessary to succeed and grow their careers. The ADP talent journey begins with onboarding supported by extensive training and mentorship. Thereafter, our associates can access a wide range of professional and functional skills training to further continue and enhance performance and career development. Our professional skills program provides on-demand and self-paced learning paths on key topics such as business acumen, client service, time management, teamwork and collaboration, communication and career management.
Our Benefits and Health and Wellness Programs
The wide range of benefits and health and wellness programs we offer contribute to an environment where all our associates add to our success. Our associates receive a competitive benefits package, intended to help them enjoy physical, emotional and financial well-being and be productive members of their teams. While exact benefits vary by associate and region, they typically include health
care coverage, a 401(k) plan with company matching contributions, life insurance, paid time off and tuition reimbursement. We particularly emphasize benefits that support individual and family needs (parental leave, adoption/fertility benefits and caregiver support), and constantly update our programs according to our associates’ needs.
We offer physical and mental wellness programs that help our team pursue a healthy lifestyle and reduce absenteeism and lost time due to injuries. Our efforts include a company-wide health and safety manual and website, safety education and training, and a wellness program that rewards associates for completing wellness activities. Physical and mental health initiatives vary across regions, but can include personal health checks, regular exercise classes, nutrition and fitness expert visits offering free consultation and programs, employee mental wellness assistance programs, free counselling and mental health therapy sessions for associates, and mindfulness, massages and yoga classes.
Our Response to Covid-19
With respect to the Covid-19 pandemic, we moved quickly to protect our associates and their families by relocating nearly all of our associates to work-from-home or remote working arrangements. We provided all of our associates, excluding corporate officers, with two one-time payments totaling $1,250 (or equivalent based on the average wage parity in each country) to assist with the unexpected hardships of the pandemic. We conducted Covid-19 vaccination drives in our offices in India for associates and their families during a vaccine shortage in India. We also provided important additional support by expanding our Voluntary Wellness Program and Employee Assistance Program and creating a Mental Health Resources Guide highlighting important mental health topics and resources available to our associates and their families.
Available Information
Our corporate website, www.adp.com, provides materials for investors and information about our solutions and services. ADP’s Annual Reports on Form 10-K, Quarterly Reports on Form 10-Q, Current Reports on Form 8-K, all amendments to those reports, and the Proxy Statements for our Annual Meetings of Stockholders are made available, free of charge, on our corporate website as soon as reasonably practicable after such reports have been filed with or furnished to the Securities and Exchange Commission (“SEC”), and are also available on the SEC’s website at www.sec.gov. The content on any website referenced in this filing is not incorporated by reference into this filing unless expressly noted otherwise.
Item 1A. Risk Factors
Our businesses routinely encounter and address risks, some of which may cause our future results to be different than we currently anticipate. The risk factors described below represent our current view of some of the most important risks facing our businesses and are important to understanding our business. The following information should be read in conjunction with Management’s Discussion and Analysis of Financial Condition and Results of Operations, Quantitative and Qualitative Disclosures About Market Risk and the consolidated financial statements and related notes included in this Annual Report on Form 10-K. This discussion includes a number of forward-looking statements. You should refer to the description of the qualifications and limitations on forward-looking statements in the first paragraph under Management’s Discussion and Analysis of Financial Condition and Results of Operations included in this Annual Report on Form 10-K. The level of importance of each of the following risks may vary from time to time, and any of these risks may have a materially adverse effect on our business, results of operations, financial condition or reputation.
LEGAL AND COMPLIANCE RISKS
Failure to comply with, or changes in, laws and regulations applicable to our businesses could have a materially adverse effect on our reputation, results of operations or financial condition, or have other adverse consequences
Our business is subject to a wide range of complex U.S. and foreign laws and regulations, including, but not limited to, the laws and regulations described in the “Industry Regulation” section in Part I, Item 1 of this Annual Report on Form 10-K. Failure to comply with laws and regulations applicable to our operations or client solutions and services could cause us to incur substantial costs or could result in the suspension or revocation of licenses or registrations, the limitation, suspension or termination of services, the imposition of consent orders or civil and criminal penalties, including fines, and lawsuits, including class actions, that could damage our reputation and have a materially adverse effect on our results of operation or financial condition.
In addition, changes in laws or regulations, or changes in the interpretation of laws or regulations by a regulatory authority, may decrease our revenues and earnings and may require us to change the manner in which we conduct some aspects of our business. For example, a change in regulations either decreasing the amount of taxes to be withheld or allowing less time to remit taxes to government authorities would adversely impact average client balances and, thereby, adversely impact interest income from investing client funds before such funds are remitted to the applicable taxing authorities. Changes in U.S. or foreign
tax laws, regulations or rulings or the interpretation thereof could adversely affect our effective tax rate and our net income. Changes in laws that govern the co-employment arrangement between a professional employer organization and its worksite employees may require us to change the manner in which we conduct some aspects of our PEO business. Health care reform under the Affordable Care Act, related state laws, and the regulations thereunder, as well as the uncertainty surrounding the Affordable Care Act, have the potential to further impact the demand for our health care compliance solutions. We are unable to determine the additional impact that any of this will have on our PEO business, our ability to attract and retain PEO clients or demand for our health care compliance solutions.
Failure to comply with anti-corruption laws and regulations, economic and trade sanctions, anti-money laundering laws and regulations, and similar laws could have a materially adverse effect on our reputation, results of operations or financial condition, or have other adverse consequences
Regulators worldwide continue to exercise a high level of scrutiny with respect to anti-corruption, economic and trade sanctions, and anti-money laundering laws and regulations. Such scrutiny has resulted in aggressive investigations and enforcement of such laws and burdensome regulations, any of which could materially adversely impact our business. We operate our business around the world, including in numerous developing economies where companies and government officials are more likely to engage in business practices that are prohibited by domestic and foreign laws and regulations, including the United States Foreign Corrupt Practices Act and the U.K. Bribery Act. Such laws generally prohibit improper payments or offers of payments to foreign government officials and leaders of political parties and, in some cases, to other persons, for the purpose of obtaining or retaining business. We are also subject to economic and trade sanctions programs, including those administered by the U.S. Treasury Department’s Office of Foreign Assets Control, which prohibit or restrict transactions or dealings with specified countries, their governments and, in certain circumstances, their nationals, and with individuals and entities that are specially designated, including narcotics traffickers and terrorists or terrorist organizations, among others. In addition, some of our businesses and entities in the U.S. and a number of other countries in which we operate are subject to anti-money laundering laws and regulations, including, for example, The Bank Secrecy Act of 1970, as amended by the USA PATRIOT Act of 2001 (the “BSA”). Among other things, the BSA requires certain financial institutions, including banks and money services businesses (such as national trust banks and providers of prepaid access like us), to develop and implement risk-based anti-money laundering programs, report large cash transactions and suspicious activity, and maintain transaction records. We have registered our payroll card
business as a provider of prepaid access, and registered our ADP Trust Bank with the Treasury Department’s Financial Crimes Enforcement Network (FinCEN).
We have implemented policies and procedures to monitor and address compliance with applicable anti-corruption, economic and trade sanctions and anti-money laundering laws and regulations, and we regularly review, upgrade and enhance our policies and procedures. However, there can be no assurance that our employees, consultants or agents will not take actions in violation of our policies for which we may be ultimately responsible, or that our policies and procedures will be adequate or will be determined to be adequate by regulators. Any violations of applicable anti-corruption, economic and trade sanctions or anti-money laundering laws or regulations could limit certain of our business activities until they are satisfactorily remediated and could result in civil and criminal penalties, including fines, which could damage our reputation and have a materially adverse effect on our results of operation or financial condition. Further, bank regulators, including the OCC which regulates the ADP Trust Bank, continue to impose additional and stricter requirements on banks to ensure they are meeting their BSA obligations, and banks are increasingly viewing money services businesses, as a class, to be higher risk customers for money laundering. As a result, our banking partners that assist in processing our money movement transactions may limit the scope of services they provide to us or may impose additional material requirements on us. These regulatory restrictions on banks and changes to banks’ internal risk-based policies and procedures may result in a decrease in the number of banks that may do business with us, may require us to materially change the manner in which we conduct some aspects of our business, may decrease our revenues and earnings and could have a materially adverse effect on our results of operations or financial condition.
Failure to comply with privacy, data protection and cyber security laws and regulations could have a materially adverse effect on our reputation, results of operations or financial condition, or have other adverse consequences
The collection, storage, hosting, transfer, processing, disclosure, use, security and retention and destruction of personal information required to provide our services is subject to federal, state and foreign privacy, data protection and cyber security laws. These laws, which are not uniform, generally do one or more of the following: regulate the collection, storage, hosting, transfer (including in some cases, the transfer outside the country of collection), processing, disclosure, use, security and retention and destruction of personal information; require notice to individuals of privacy practices; give individuals certain access and correction rights with respect to their personal information; and regulate the use or disclosure of personal information for secondary purposes such as marketing. Under certain circumstances, some of these
laws require us to provide notification to affected individuals, clients, data protection authorities and/or other regulators in the event of a data breach. In many cases, these laws apply not only to third-party transactions, but also to transfers of information among the Company and its subsidiaries. The European Union (the “EU”) General Data Protection Regulation (the “GDPR”), and state consumer privacy laws like the California Consumer Protection Act (the “CCPA”), which will be replaced by the voter-approved California Privacy Rights Act of 2020 (the “CPRA”), are among the most comprehensive of these laws, and more and more jurisdictions are adopting similarly comprehensive laws that impose new data privacy protection requirements and restrictions. As part of our overall data protection compliance program in connection with the GDPR, we implemented Binding Corporate Rules (“BCRs”) as both a data processor and data controller, which permits us to process and transfer personal data across borders in compliance with EU data protection laws.
We believe that providing insights from data, including artificial intelligence and machine learning, will become increasingly important to the value that our solutions and services deliver to our customers. However, the ability to provide data-driven insights may be constrained by current or future regulatory requirements or ethical considerations that could restrict or impose burdensome and costly requirements on our ability to leverage data in innovative ways.
Complying with privacy, data protection and cyber security laws and requirements, including the enhanced obligations imposed by the GDPR, our BCRs and the CCPA and CPRA, may result in significant costs to our business and require us to amend certain of our business practices. Further, enforcement actions and investigations by regulatory authorities related to data security incidents and privacy violations continue to increase. The future enactment of more restrictive laws, rules or regulations and/or future enforcement actions or investigations could have a materially adverse impact on us through increased costs or restrictions on our businesses and noncompliance could result in significant regulatory penalties and legal liability and damage our reputation. In addition, data security events and concerns about privacy abuses by other companies are changing consumer and social expectations for enhanced privacy and data protection. As a result, even the perception of noncompliance, whether or not valid, may damage our reputation.
If we fail to protect our intellectual property rights, it could materially adversely affect our business and our brand
Our ability to compete and our success depend, in part, upon our intellectual property. We rely on patent, copyright, trade secret and trademark laws, and
confidentiality or license agreements with our employees, customers, vendors, partners and others to protect our intellectual property rights. We may need to devote significant resources, including cybersecurity resources, to monitoring our intellectual property rights. In addition, the steps we take to protect our intellectual property rights may be inadequate or ineffective, or may not provide us with a significant competitive advantage. Our intellectual property could be wrongfully acquired as a result of a cyber-attack or other wrongful conduct by third parties or our personnel. Litigation brought to protect and enforce our intellectual property rights could be costly and time-consuming. Furthermore, our efforts to enforce our intellectual property rights may be met with defenses, counterclaims, and countersuits attacking the validity and enforceability of our intellectual property rights, which may be successful.
We may be sued by third parties for infringement of their proprietary rights, which could have a materially adverse effect on our business, financial condition or results of operations
There is considerable intellectual property development activity in our industry. Third parties, including our competitors, may own or claim to own intellectual property relating to our products or services and may claim that we are infringing their intellectual property rights. We may be found to be infringing upon such rights, even if we are unaware of their intellectual property rights. Any claims or litigation could cause us to incur significant expenses and, if successfully asserted against us or if we decide to settle, could require that we pay substantial damages or ongoing royalty payments, obtain licenses, modify applications, prevent us from offering our services, or require that we comply with other unfavorable terms. We may also be obligated to indemnify our customers, vendors or partners in connection with any such claim or litigation. Even if we were to prevail in such a dispute, any litigation regarding our intellectual property could be costly and time-consuming.
SECURITY AND TECHNOLOGY RISKS
Our businesses collect, host, store, transfer, process, disclose, use, secure and retain and dispose of personal and business information, and collect, hold and transmit client funds, and a security or privacy breach may damage or disrupt our businesses, result in the disclosure of confidential information, damage our reputation, increase our costs, cause losses and materially adversely affect our results of operations
In connection with our business, we collect, host, store, transfer, process, disclose, use, secure and retain and dispose of large amounts of personal and business information about our clients, employees of our clients, our vendors and our employees, contractors and temporary
staff, including payroll information, health care information, personal and business financial data, social security numbers and their foreign equivalents, bank account numbers, tax information and other sensitive personal and business information. We also collect significant amounts of funds from the accounts of our clients and transmit them to their employees, taxing authorities and others.
We are focused on ensuring that we safeguard and protect personal and business information and client funds, and we devote significant resources to maintain and regularly update our systems and processes. Nonetheless, the global environment continues to grow increasingly hostile as attacks on information technology systems continue to grow in frequency, complexity and sophistication, and we are regularly targeted by unauthorized parties using malicious tactics, code and viruses. Certain of these malicious parties may be state-sponsored and supported by significant financial and technological resources. Although this is a global problem, it may affect our businesses more than other businesses because malevolent parties (including our personnel) may focus on the amount and type of personal and business information that our businesses collect, host, store, transfer, process, disclose, use, secure and retain and dispose of, and the client funds that we collect and transmit.
We have programs and processes in place to prevent, detect and respond to data or cyber security incidents. However, because the techniques used to obtain unauthorized access, disable or degrade service, or sabotage systems change frequently, are increasingly more complex and sophisticated and may be difficult to detect for long periods of time, we may be unable or fail to anticipate these techniques or implement adequate or timely preventive or responsive measures. Our ability to address cyber security incidents may also depend on the timing and nature of assistance that may be provided from relevant governmental or law enforcement agencies. Hardware, software, applications or services that we develop or procure from third parties, or are required by third parties such as foreign governments to install on our systems, may contain defects in design or manufacture or other problems that could (or, in respect of third-party software, may be designed to) compromise the confidentiality, integrity or availability of data or our systems. Unauthorized parties also attempt to gain access to our systems or facilities, or those of third parties with whom we do business, through fraud, trickery, or other methods of deceiving these third parties or our personnel, including phishing and other social engineering techniques whereby attackers use end-user behaviors to distribute computer viruses and malware into our systems or otherwise compromise the confidentiality, integrity or availability of data on our systems. As these threats continue to evolve and increase, we continue to invest significant resources, and may be required to invest
significant additional resources, to modify and enhance our information security and controls and to investigate and remediate any security vulnerabilities. In addition, while our operating environments are designed to safeguard and protect personal and business information, we may not have the ability to monitor the implementation or effectiveness of any safeguards by our clients, vendors or partners and, in any event, third parties may be able to circumvent those security measures. Information obtained by malevolent parties resulting from successful attacks against our clients, vendors, partners or other third parties may, in turn, be used to attack our information technology systems.
Any cyberattack, unauthorized intrusion, malicious software infiltration, network disruption, denial of service, corruption of data, theft of non-public or other sensitive information, or similar act by a malevolent party (including our personnel), or inadvertent acts or inactions by our vendors, partners or personnel, could result in the loss, disclosure or misuse of confidential personal or business information or the theft of client or ADP funds, and could have a materially adverse effect on our business or results of operations or that of our clients, result in liability, litigation, regulatory investigations and sanctions or a loss of confidence in our ability to serve clients, or cause current or potential clients to choose another service provider. As the global environment continues to grow increasingly hostile, the security of our operating environment is ever more important to our clients and potential clients. As a result, the breach or perceived breach of our security systems could result in a loss of confidence by our clients or potential clients and cause them to choose another service provider, which could have a materially adverse effect on our business.
Although we believe that we maintain a robust program of information security and controls and none of the data or cyber security incidents that we have encountered to date have materially impacted us, a data or cyber security incident could have a materially adverse effect on our business, results of operations, financial condition and reputation. While ADP maintains insurance coverage that, subject to policy terms and conditions and a significant self-insured retention, is designed to address losses or claims that may arise in connection with certain aspects of data and cyber risks, such insurance coverage may be insufficient to cover all losses or all types of claims that may arise in the continually evolving area of data and cyber risk.
Our systems, applications, solutions and services may be subject to disruptions that could have a materially adverse effect on our business and reputation
Many of our businesses are highly dependent on our ability to process, on a daily basis, a large number of complicated transactions. We rely heavily on our payroll, financial,
accounting, and other data processing systems. We need to properly manage our systems, applications and solutions, and any upgrades, enhancements and expansions we may undertake from time to time, in order to ensure they properly support our businesses. If any of these systems, applications or solutions fails to operate properly or becomes disabled even for a brief period of time, whether due to malevolent acts, errors, defects or any other factor(s), we could suffer financial loss, a disruption of our businesses, liability to clients, loss of clients, regulatory intervention or damage to our reputation, any of which could have a materially adverse effect on our results of operation or financial condition. We have disaster recovery, business continuity, and crisis management plans and procedures designed to protect our businesses against a multitude of events, including natural disasters, military or terrorist actions, power or communication failures, or similar events. Despite our preparations, our plans and procedures may not be successful in preventing or mitigating the loss of client data, service interruptions, disruptions to our operations, or damage to our important facilities.
A disruption of the data centers or cloud-computing services that we utilize could have a materially adverse effect on our business
We host our applications and serve our clients with data centers that we operate, and with data centers that are operated, and cloud-computing services that are provided, by third-party vendors. If any of these data centers or cloud-computing services fails, becomes disabled or is disrupted, even for a limited period of time, our businesses could be disrupted and we could suffer financial loss, liability to clients, loss of clients, regulatory intervention or damage to our reputation, any of which could have a material adverse effect on our results of operation or financial condition. In addition, our third-party vendors may cease providing data center facilities or cloud-computing services, elect to not renew their agreements with us on commercially reasonable terms or at all, breach their agreements with us or fail to satisfy our expectations, which could disrupt our operations and require us to incur costs which could materially adversely affect our results of operation or financial condition.
BUSINESS AND INDUSTRY RISKS
If we fail to upgrade, enhance and expand our technology and services to meet client needs and preferences, the demand for our solutions and services may materially diminish
Our businesses operate in industries that are subject to rapid technological advances and changing client needs and preferences. In order to remain competitive and responsive to client demands, we continually upgrade, enhance, and expand our technology, solutions and
services. If we fail to respond successfully to technology challenges and client needs and preferences, the demand for our solutions and services may diminish. In addition, investment in product development often involves a long return on investment cycle. We have made and expect to continue to make significant investments in product development. We must continue to dedicate a significant amount of resources to our development efforts before knowing to what extent our investments will result in products the market will accept. In addition, our business could be adversely affected in periods surrounding our new product introductions if customers delay purchasing decisions to evaluate the new product offerings. Furthermore, we may not execute successfully on our product development strategy, including because of challenges with regard to product planning and timing and technical hurdles that we fail to overcome in a timely fashion.
We may not realize or sustain the expected benefits from our business transformation initiatives, and these efforts could have a materially adverse effect on our business, operations, financial condition, results of operations and competitive position
We have been and will be undertaking certain transformation initiatives, which are designed to streamline our organization, extend our world-class distribution and strengthen our talent and culture, while supporting our revenue growth, margin improvement and productivity. If we do not successfully manage and execute these initiatives, or if they are inadequate or ineffective, we may fail to meet our financial goals and achieve anticipated benefits, improvements may be delayed, not sustained or not realized and our business, operations and competitive position could be adversely affected. These initiatives, or our failure to successfully manage them, could result in unintended consequences or unforeseen costs, including distraction of our management and employees, attrition, inability to attract or retain key personnel, and reduced employee productivity, which could adversely affect our business, financial condition, and results of operations.
A major natural disaster or catastrophic event could have a materially adverse effect on our business, financial condition and results of operations, or have other adverse consequences
Our business, financial condition, results of operations, access to capital markets and borrowing costs may be adversely affected by a major natural disaster or catastrophic event, including civil unrest, geopolitical instability, war, terrorist attack, pandemics or other (actual or threatened) public health emergencies such as the recent COVID-19 outbreak, or other events beyond our control, and measures taken in response thereto.
The COVID-19 outbreak created, and such other events may create, significant volatility and uncertainty and economic and financial market disruption. The extent of any such impact depends on developments which are highly uncertain and cannot be predicted, including the duration and scope of the event; the governmental and business actions taken in response thereto; actions taken by the Company in response thereto and the related costs; the impact on economic activity and employment levels; the effect on our clients, prospects, suppliers and partners; our ability to sell and provide our solutions and services, including due to travel restrictions, business and facility closures, and employee remote working arrangements; the ability of our clients or prospects to pay for our services and solutions; and how quickly and to what extent normal economic and operating conditions can resume. In addition, clients or prospects may delay decision making, demand pricing and other concessions, reduce the value or duration of their orders, delay planned work or seek to terminate existing agreements. Our business is also impacted by employment levels across our clients, as we have varied contracts throughout our business that blend base fees and per-employee fees. The COVID-19 outbreak had a significant impact on our clients and, as a result, negatively impacted our revenue and new business bookings. Our bookings were also adversely affected by the impact of the outbreak on the buying behavior of our clients and prospects, coupled with the inability of our sales force to engage with clients and prospects on an in-person basis and instead primarily leveraging virtual interactions. The COVID-outbreak pandemic may also have long-term effects on the nature of the office environment and remote working, which may present operational and workplace culture challenges that may adversely affect our business.
Political, economic and social factors may materially adversely affect our business and financial results
Trade, monetary and fiscal policies, and political and economic conditions may substantially change, and credit markets may experience periods of constriction and volatility. When there is a slowdown in the economy, employment levels and interest rates may decrease with a corresponding impact on our businesses. Clients may react to worsening conditions by reducing their spending on HCM services or renegotiating their contracts with us, which may adversely affect our business and financial results.
We invest our funds held for clients in liquid, investment-grade marketable securities, money market securities, and other cash equivalents. Nevertheless, such investments are subject to general market, interest rate, credit and liquidity risks. These risks may be exacerbated, individually or together, during periods of unusual financial market volatility.
In addition, as part of our client funds investment strategy, we extend the maturities of our investment portfolio for client funds and utilize short-term financing arrangements to satisfy our short-term funding requirements related to client funds obligations. In order to satisfy these short-term funding requirements, we maintain access to various sources of liquidity, including borrowings under our commercial paper program and our committed credit facilities, our ability to execute reverse repurchase transactions and corporate cash balances. A reduction in the availability of any such financing during periods of disruption in the financial markets or otherwise may increase our borrowing costs and/or require us to sell available-for-sale securities in our funds held for clients to satisfy our short-term funding requirements. When there is a reduction in employment levels due to a slowdown in the economy, the Company may experience a decline in client fund obligations and may also sell available-for-sale securities in our funds held for clients in order to reduce the size of the funds held for clients to correspond to client fund obligations. A sale of such available-for-sale securities may result in the recognition of losses and reduce the interest income earned on funds held for clients, either or both of which may adversely impact our results of operations, financial condition and cash flow.
We are dependent upon various large banks to execute electronic payments and wire transfers as part of our client payroll, tax and other money movement services. While we have contingency plans in place for bank failures, a systemic shutdown of the banking industry would impede our ability to process funds on behalf of our payroll, tax and other money movement services clients and could have an adverse impact on our financial results and liquidity.
We derive a significant portion of our revenues and operating income outside of the United States and, as a result, we are exposed to market risk from changes in foreign currency exchange rates that could impact our results of operations, financial position and cash flows.
We publicly share certain information about our environmental, social and governance (“ESG”) initiatives. We may face increased scrutiny related to these activities, including from the investment community, and our failure to achieve progress in these areas on a timely basis, if at all, could impact our reputation, business, including employee retention, and growth.
Change in our credit ratings could adversely impact our operations and lower our profitability
The major credit rating agencies periodically evaluate our creditworthiness and have given us strong, investment-grade long-term debt ratings and high commercial paper ratings. Failure to maintain high credit ratings on long-term and short-term debt could increase our cost of borrowing, reduce our ability to obtain intra-day borrowing required
by our Employer Services business, and adversely impact our results of operations.
Our business could be negatively impacted as a result of actions by activist stockholders or others
We may be subject to actions or proposals from activist stockholders or others that may not align with our business strategies or the interests of our other stockholders. Responding to such actions could be costly and time-consuming, disrupt our business and operations, and divert the attention of our Board of Directors and senior management from the pursuit of our business strategies. Activist stockholders may create perceived uncertainties as to the future direction of our business or strategy, including with respect to our ESG efforts, which may be exploited by our competitors and may make it more difficult to attract and retain qualified personnel, potential customers and business partners and may affect our relationships with current customers, vendors, investors and other third parties. In addition, actions of activist stockholders may cause periods of fluctuation in our stock price based on temporary or speculative market perceptions or other factors that do not necessarily reflect the underlying fundamentals and prospects of our business.
We may be unable to attract and retain qualified personnel
Our ability to grow and provide our clients with competitive services is partially dependent on our ability to attract and retain highly motivated people with the skills to serve our clients and reflecting diverse perspectives and the diversity of our communities and clients. Competition for skilled employees in the outsourcing and other markets in which we operate is intense and, if we are unable to attract and retain highly skilled, motivated and diverse personnel, results of our operations and culture may suffer.
Item 1B. Unresolved Staff Comments
None.
Item 2. Properties
ADP owns 7 of its processing/print centers, and 12 other operational offices, sales offices, and its corporate headquarters in Roseland, New Jersey, which aggregate approximately 3,070,644 square feet. None of ADP's owned facilities is subject to any material encumbrances. ADP leases space for some of its processing centers, other operational offices, and sales offices. All of these leases, which aggregate approximately 5,366,245 square feet worldwide, expire at various times up to the year 2031. ADP believes its facilities are currently adequate for their intended purposes and are adequately maintained.
Item 3. Legal Proceedings
In the normal course of business, ADP is subject to various claims and litigation. While the outcome of any litigation is inherently unpredictable, ADP believes that it has valid defenses with respect to the legal matters pending against it and that the ultimate resolution of these matters will not have a materially adverse impact on its financial condition, results of operations, or cash flows.
Item 4. Mine Safety Disclosures
Not applicable.
Part II
Item 5. Market for Registrant's Common Equity, Related Stockholder Matters and Issuer Purchases of Equity Securities
Market for Registrant's Common Equity
The principal market for the Company’s common stock is the NASDAQ Global Select Market under the symbol ADP. As of June 30, 2021, there were 34,701 holders of record of the Company’s common stock. As of such date, 1,051,941 additional holders held their common stock in “street name.”
Issuer Purchases of Equity Securities | | | | | | | | | | | | | | |
| Period | Total Number of Shares Purchased (1) | Average Price Paid per Share | Total Number of Shares Purchased as Part of the Publicly Announced Common Stock Repurchase Plan (2) | Maximum Approximate Dollar Value
of Shares that
may yet be
Purchased under
the Common Stock
Repurchase Plan (2) |
April 1, 2021 to April 30, 2021 | 703,968 | $190.81 | 702,309 | $3,414,959,644 |
May 1, 2021 to May 31, 2021 | 846,225 | $193.80 | 845,310 | $3,251,138,425 |
June 1, 2021 to June 30, 2021 | 893,690 | $197.42 | 891,590 | $3,075,122,616 |
| Total | 2,443,883 | | 2,439,209 | |
| | | | | | | | |
| (1) | | Pursuant to the terms of the Company’s restricted stock program, the Company purchased 4,674 shares at the then-market value of the shares to satisfy certain tax withholding requirements for employees upon the vesting of their restricted shares. |
| |
| (2) | | The Company received the Board of Directors' approval to repurchase shares of the Company's common stock as follows: |
| | | | | | | | |
| Date of Approval | | |
| November 2019 | | $5 billion |
There is no expiration date for the common stock repurchase authorization.
For equity compensation plan information, please refer to Item 12 in Part III of this Annual Report or Form 10-K.
Performance Graph
The following graph compares the cumulative return on the Company’s common stock for the most recent five years with the cumulative return on the S&P 500 Index, a Peer Group Index,(a) and the Old Peer Group Index,(b) assuming an initial investment of $100 on June 30, 2016, with all dividends reinvested. The Company reassessed its peer group and determined that the companies included in the Nasdaq Dividend Achievers Select Index more closely match our Company characteristics than the companies previously included in the Old Peer Group Index based on their commitment to increasing annual regular dividend payments, maturity and stable and positive earnings growth profile. The stock price performance shown on this graph may not be indicative of future performance.
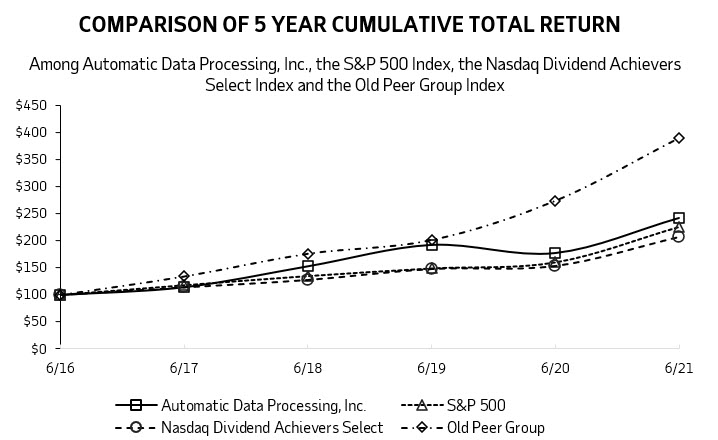
(a) We use the Nasdaq Dividend Achievers Select Index as our Peer Group Index. The Nasdaq Dividend Achievers Select Index is a select group of companies, that includes the Company, with at least ten consecutive years of increasing annual regular dividend payments.
(b) The Old Peer Group Index was the S&P 500 Information Technology Index.
Item 6. Selected Financial Data
Not applicable.
Item 7. Management's Discussion and Analysis of Financial Condition and Results of Operations
Tabular dollars are presented in millions, except per share amounts
The following section discusses our year ended June 30, 2021 (“fiscal 2021”), as compared to year ended June 30, 2020 (“fiscal 2020”). A detailed review of our fiscal 2020 performance compared to our fiscal 2019 performance is set forth in Part II, Item 7 of our Form 10-K for the fiscal year ended June 30, 2020.
FORWARD-LOOKING STATEMENTS
This document and other written or oral statements made from time to time by ADP may contain “forward-looking statements” within the meaning of the Private Securities Litigation Reform Act of 1995. Statements that are not historical in nature and which may be identified by the use of words like “expects,” “assumes,” “projects,” “anticipates,” “estimates,” “we believe,” “could” “is designed to” and other words of similar meaning, are forward-looking statements. These statements are based on
management’s expectations and assumptions and depend upon or refer to future events or conditions and are subject to risks and uncertainties that may cause actual results to differ materially from those expressed. Factors that could cause actual results to differ materially from those contemplated by the forward-looking statements or that could contribute to such difference include: ADP's success in obtaining and retaining clients, and selling additional services to clients; the pricing of products and services; the success of our new solutions; compliance with existing or new legislation or regulations; changes in, or interpretations of, existing legislation or regulations; overall market, political and economic conditions, including interest rate and foreign currency trends and inflation; competitive conditions; our ability to maintain our current credit ratings and the impact on our funding costs and profitability; security or cyber breaches, fraudulent acts, and system interruptions and failures; employment and wage levels; changes in technology; availability of skilled technical associates; the impact of new acquisitions and divestitures; the adequacy, effectiveness and success of our business transformation initiatives; and the impact of any uncertainties related to major natural disasters or catastrophic events, including the coronavirus (“COVID-19”) pandemic. ADP disclaims any obligation to update any forward-looking statements, whether as a result of new information, future events or otherwise, except as required by law. These risks and uncertainties, along with the risk factors discussed under “Item 1A. Risk Factors,” and in other written or oral statements made from time to time by ADP, should be considered in evaluating any forward-looking statements contained herein.
NON-GAAP FINANCIAL MEASURES
In addition to our U.S. GAAP results, we use adjusted results and other non-GAAP metrics to evaluate our operating performance in the absence of certain items and for planning and forecasting of future periods. Adjusted EBIT, adjusted EBIT margin, adjusted net earnings, adjusted diluted earnings per share, adjusted effective tax rate and organic constant currency are all non-GAAP financial measures. Please refer to the accompanying financial tables in the “Non-GAAP Financial Measures” section for a discussion of why ADP believes these measures are important and for a reconciliation of non-GAAP financial measures to their comparable GAAP financial measures.
EXECUTIVE OVERVIEW
Highlights from the year ended June 30, 2021 include:
| | | | | | | | | | | | | | |
| 3% | | 60 basis points | | 6% |
| Revenue Growth | | Earnings Before Income Taxes Margin Expansion | | Diluted EPS Growth |
| | | | |
| 2% | | (40) basis points | | 2% |
Organic Constant Currency
Revenue Growth | | Adjusted EBIT Margin Expansion | | Adjusted Diluted EPS Growth |
| | | | | | | | | | | | | | | | | |
| 23% | Employer Services
New Business Bookings Growth | 2% | PEO Services
Average Worksite Employee Growth |
|
| | | | | |
$3.0B | Cash Returned via Shareholder Friendly Actions $1.6B Dividends | $1.4B Share Repurchases | |
|
We are a leading global provider of cloud-based Human Capital Management (“HCM”) technology solutions to employers around the world. The global COVID-19 pandemic has had a significant impact on the global business environment and on our clients, but our priority has been and continues to be the safety of our associates and the needs of our clients. We have continued to provide HCM services, including the processing of payroll and tax obligations, to our clients during this time. ADP's efforts have also been focused on providing information and tools to help clients understand and navigate the governmental relief that has been adopted globally. In addition, we released a Return to Workplace solution that assists our clients in bringing their employees back to work safely through a comprehensive set of tools designed to streamline the entire process.
During the fiscal year, we continued to advance our market-leading solutions and achieved some new milestones. Earlier this year, our next-gen payroll solution earned ADP its 6th consecutive “Top HR Product Award” at the annual HR Technology Conference. This solution features a highly scalable, policy-based framework that enables easy self-service and powerful transparency. In February, we announced the launch of Roll, a new mobile-first payroll and tax filing product aimed at small businesses, which combines an AI-driven chat-based interface with the power and scale of our payroll and tax filing expertise. We continued to add to our robust DataCloud platform by introducing the Diversity, Equity and Inclusion (DEI) Dashboard which can help businesses analyze their diversity landscape through a simple Q&A format and user interface that allows them to better set, track and expand their DEI goals. For our RUN platform, which is a leading solution in the market with approximately 750,000 clients, we began to roll out a new user experience and launched TimeKeeping Plus, an entirely new, native workforce management solution. This year, we reached 100,000 clients across our workforce management solutions for the first time, as the pandemic reinforced the need for robust workforce management solutions for our clients while they navigate the new norm of increasingly flexible schedules and work arrangements.
Our suite of HRO solutions also continued to deliver steady growth this year, despite the dynamic economic environment. Within PEO, the average worksite employee count grew 12% in the fourth quarter resulting in annual growth of 2%. We also have over 2 million worksite employees on our other HRO solutions within our Employer Services segment, as clients look for ways to outsource parts of the HR function to a best-in-class provider like ADP.
We continue to drive innovation by anticipating our clients' evolving needs and always designing for people as the world of work changes. We lead the HCM industry by driving growth through our strategic, cloud-based HCM solutions and developing innovations like our next gen platforms. We further enable these solutions by supplementing them with organic, differentiated investments such as the ADP Datacloud and ADP Marketplace, and through our compliance expertise.
For fiscal 2021, we drove solid revenue growth of 3% for the year, continued to invest for sustainable growth despite market conditions, and managed any non-essential spend prudently. Employer Services New Business Bookings was up 23% for fiscal 2021. In addition, the Employer Services client revenue retention rate for fiscal 2021 improved 170 basis points to 92.2% as compared to our rate for fiscal 2020. The PEO average number of Worksite Employees increased 2% for fiscal 2021. Our pays per control metric, which represents the number of employees on ADP clients' payrolls in the United States when measured on a same-store-sales basis for a subset of clients ranging from small to large businesses, turned positive in the fourth quarter resulting in annual growth of negative 3% for fiscal 2021.
We have a strong business model, a highly cash generative business with low capital intensity, and offer a suite of products that provide critical support to our clients’ HCM functions. We generate sufficient free cash flow to satisfy our cash dividend and our modest debt obligations, which enables us to absorb the impact of downturns and remain steadfast in our reinvestments, our longer term strategy, and our commitments to shareholder friendly actions. We are committed to building upon our past successes by investing in our business through enhancements in research and development and by driving meaningful transformation in the way we operate. Our financial condition remains solid at June 30, 2021 and we remain well positioned to support our associates and our clients.
RESULTS AND ANALYSIS OF CONSOLIDATED OPERATIONS
Total Revenues
For the year ended June 30, respectively:
| | | | | | | | | | |
| á | 3% YoY Growth | | |
| á | 2% YoY Growth, Organic Constant Currency | | |
Revenues for fiscal 2021 increased due to strong retention, new business started from New Business Bookings, an increase in zero-margin benefits pass-throughs and one percentage point of favorability from foreign currency. This increase is partially offset by a one percentage point of pressure from our interest earned on funds held for clients discussed below. Refer to “Analysis of Reportable Segments” for additional discussion of the increases in revenue for both of our reportable segments, Employer Services and Professional Employer Organization (“PEO”) Services.
Total revenues in fiscal 2021 include interest on funds held for clients of $422.4 million, as compared to $545.2 million in fiscal 2020. The decrease in the consolidated interest earned on funds held for clients resulted from the decrease in our average interest rate earned to 1.5% in fiscal 2021, as compared to 2.1% in fiscal 2020. The decrease is partially offset by an increase in our average client funds balances of 5.2% to $27.4 billion in fiscal 2021 as compared to fiscal 2020.
Total Expenses | | | | | | | | | | | | | | | | | | | | | | | | | | | |
| | | | | | | Years Ended | | | | |
| | | | | | June 30, | | | |
| | | | | | | | | | 2021 | | 2020 | | %
Change | | |
| | | | | | | |
| Costs of revenues: | | | | | | | | | | | | | | | |
| Operating expenses | | | | | | | | | $ | 7,520.7 | | | $ | 7,404.1 | | | 2 | % | | |
| Systems development and programming costs | | | | | | | | | 716.6 | | | 674.1 | | | 6 | % | | |
| Depreciation and amortization | | | | | | | | | 403.0 | | | 366.9 | | | 10 | % | | |
| Total costs of revenues | | | | | | | | | 8,640.3 | | | 8,445.1 | | | 2 | % | | |
| Selling, general and administrative expenses | | | | | | | | | 3,040.5 | | | 3,003.0 | | | 1 | % | | |
| Interest expense | | | | | | | | | 59.7 | | | 107.1 | | | (44) | % | | |
| Total expenses | | | | | | | | | $ | 11,740.5 | | | $ | 11,555.2 | | | 2 | % | | |
For the year ended June 30, 2021, operating expenses increased due to the increase in our PEO Services zero-margin benefits pass-through costs to $3,092.0 million from $2,907.7 million for the year ended June 30, 2021 and 2020, respectively, the impact of foreign currency, and an increase in incentive compensation costs due to decreases in the prior year. These increases were partially offset by reduced costs as a result of our broad-based transformation initiatives and excess capacity headcount actions in the prior year, a change of $52.5 million in our estimated losses related to ADP Indemnity compared to prior year, reduced travel expenses and decreased pension costs as a result of U.S. pension service costs that were eliminated with the July 1, 2020 cessation of U.S. participants accruing any future service benefits (“U.S. pension freeze”).
Systems development and programming costs increased for fiscal 2021 due to increased investments and costs to develop, support, and maintain our products, partially offset by capitalization of costs related to our strategic projects, including our next gen platforms.
Depreciation and amortization expense increased related to the amortization of our acquisitions of intangibles and internally developed software.
Selling, general and administrative expenses increased for the year ended June 30, 2021 due to an increase in
incentive compensation costs, investments in our sales organization, and the impact of foreign currency, partially offset by a decrease in charges related to transformation initiatives, reduced costs as a result of our broad-based transformation initiatives and excess capacity headcount actions in the prior year for non-sales associates, capitalization of costs to obtain a contract under ASC 606, reduced travel expenses, legal settlements, and a decrease in bad debt expense.
Interest expense decreased for the year ended June 30, 2021 primarily due to a decrease in average interest rates for commercial paper borrowings to 0.1% for the year ended June 30, 2021, as compared to 1.6% for the year ended June 30, 2020. This was coupled with a decrease in average daily borrowings under our commercial paper program to $1.6 billion for the year ended June 30, 2021, as compared to $2.7 billion for the year ended June 30, 2020.
Other (Income)/Expense, net | | | | | | | | | | | | | | | | | | | | |
| (In millions) | | | | | | |
| Years ended June 30, | | 2021 | | 2020 | | $ Change |
| Interest income on corporate funds | | $ | (36.5) | | | $ | (84.5) | | | $ | (48.0) | |
| | | | | | |
| | | | | | |
| Realized (gains)/losses on available-for-sale securities, net | | (11.3) | | | (12.9) | | | (1.6) | |
| Impairment of assets | | 19.9 | | | 29.9 | | | 10.0 | |
| | | | | | |
| | | | | | |
| Gain on sale of assets | | (8.1) | | | (5.8) | | | 2.3 | |
| Gain on sale of investment | | (1.7) | | | (0.2) | | | 1.5 | |
| Non-service components of pension income, net | | (58.6) | | | (74.5) | | | (15.9) | |
| Other (income)/expense, net | | $ | (96.3) | | | $ | (148.0) | | | $ | (51.7) | |
Other (income)/expense, net, decreased $51.7 million in fiscal 2021, as compared to fiscal 2020 as a result of a decrease in interest income on corporate funds due to lower interest rates earned and the change in non-service components of pension income, net, and the items described below. See Note 10 of our Consolidated Financial Statements for further details on non-service components of pension income, net.
In fiscal 2021, the Company recorded impairment charges of $19.9 million which is comprised of a write down of $10.5 million related to internally developed software which was determined to have no future use, impairment charges of $9.4 million related to operating right-of-use assets and certain related fixed assets associated with vacating certain leased locations early, and recognizing certain owned facilities at fair value given intent to sell and accordingly classified as held for sale.
In fiscal 2020, the Company recorded impairment charges of $29.9 million, which is comprised of $25.3 million as a result of recognizing certain owned facilities at fair value given intent to sell and accordingly classified as held for sale and vacating certain leased locations early and recorded total impairment charges of $4.6 million related to operating right-of-use assets and certain related fixed assets associated with the vacated locations.
Earnings Before Income Taxes
For the year ended June 30, respectively:
| | | | | | | | | | | |
| á | 6% YoY Growth | á | 60 bps YoY Growth |
| | | |
Earnings before income taxes increased in fiscal 2021 due to the increases in revenues partially offset by the increases in expenses discussed above.
Overall margin increased in fiscal 2021 as a result of operational efficiencies, coupled with a decrease in charges related to transformation initiatives, legal settlements, reduced costs as a result of our broad-based transformation initiatives and excess capacity headcount actions in the prior year, a change of $52.5 million in our estimated losses related to ADP Indemnity compared to prior year, decreased selling expense, and decreased interest expense. These were partially offset by an increase in incentive compensation costs, a decrease in interest earned on funds held for clients, and incremental pressure from growth in our zero-margin benefits pass-throughs.
Adjusted Earnings before certain Interest and Taxes ("Adjusted EBIT")
For the year ended June 30, respectively:
| | | | | | | | | | | |
| á | 1% YoY Growth | â | 40 bps YoY Growth |
| | | |
Adjusted EBIT and Adjusted EBIT margin exclude certain interest amounts, legal settlements, gain on sale of assets, net charges related to our broad-based transformation initiatives and the impact of the net severance charges as applicable in the respective periods.
Provision for Income Taxes
The effective tax rate in fiscal 2021 and 2020 was 22.7% and 22.5%, respectively. The increase in the effective tax rate is primarily due to combined benefits from a valuation allowance release related to foreign tax credit carryforwards and a foreign tax law change during fiscal 2020 as well as a decrease in the excess tax benefit on stock-based compensation, partially offset by favorable adjustments to prior year tax liabilities during fiscal 2021. Refer to Note 11, Income Taxes, within the Notes to the Consolidated Financial Statements for further discussion.
Adjusted Provision for Income Taxes
The adjusted effective tax rate in fiscal 2021 and 2020 was 22.7% and 22.6%, respectively. The drivers of the adjusted effective tax rate are the same as the drivers of the effective tax rate discussed above.
Net Earnings and Diluted Earnings per Share
For the year ended June 30, respectively:
| | | | | | | | | | | |
| á | 5% YoY Growth | á | 6% YoY Growth |
| | | |
For fiscal 2021, adjusted net earnings and adjusted diluted EPS reflect the changes in components described above.
For fiscal 2021, diluted EPS increased as a result of the impact of fewer shares outstanding resulting from the repurchase of approximately 8.2 million shares during fiscal 2021 and 6.2 million shares during fiscal 2020, partially offset by the issuances of shares under our employee benefit plans.
Adjusted Net Earnings and Adjusted Diluted Earnings per Share
For the year ended June 30, respectively:
| | | | | | | | | | | |
| á | 1% YoY Growth | á | 2% YoY Growth |
| | | |
For fiscal 2021, adjusted net earnings and adjusted diluted EPS reflect the changes in components described above.
ANALYSIS OF REPORTABLE SEGMENTS | | | | | | | | | | | | | | | | | | | | | | | | | | | | | | | | | | | | |
| | Revenues |
| | Years Ended
June 30, | | | | | | % Change |
| | | 2021 | | 2020 | | | | | | | | As Reported | | | | Organic Constant Currency | | |
| Employer Services | | $ | 10,195.2 | | | $ | 10,086.6 | | | | | | | | | 1 | % | | | | — | % | | |
| PEO Services | | 4,818.3 | | | 4,511.5 | | | | | | | | | 7 | % | | | | 7 | % | | |
| Other | | (8.1) | | | (8.3) | | | | | | | | | n/m | | | | n/m | | |
| | | | | | | | | | | | | | | | | | |
| | | | | | | | | | | | | | | | | | |
| | $ | 15,005.4 | | | $ | 14,589.8 | | | | | | | | | 3 | % | | | | 2 | % | | |
| | | | | | | | | | | | | | | | | | | | | | | | | | | | | | | | |
| | Earnings before Income Taxes | | | | | | |
| | Years Ended
June 30, | | | | | | % Change |
| | | 2021 | | 2020 | | | | | | | | As Reported | | | | |
| Employer Services | | $ | 3,052.1 | | | $ | 3,058.2 | | | | | | | | | — | % | | | | | | |
| PEO Services | | 718.8 | | | 609.3 | | | | | | | | | 18 | % | | | | | | |
| Other | | (409.7) | | | (484.9) | | | | | | | | | n/m | | | | | | |
| | | | | | | | | | | | | | | | | | |
| | | | | | | | | | | | | | | | | | |
| | $ | 3,361.2 | | | $ | 3,182.6 | | | | | | | | | 6 | % | | | | | | |
n/m - not meaningful
Employer Services
Revenues
Revenues increased in fiscal 2021 due to strong retention, business started from New Business Bookings and one percentage point of favorability from foreign currency. Employer Services client revenue retention rate for fiscal 2021 improved 170 basis points to 92.2% as compared to our rate for fiscal 2020. Increases in revenues were partially offset by a decrease in interest earned on funds held for clients.
Earnings before Income Taxes
Employer Services’ earnings before income taxes was flat in fiscal 2021 due to increased revenues discussed above offset by increases in expenses. The increases in expenses were due to an increase in incentive compensation costs, investments in our sales organization, an increase in amortization expense, and the impact of foreign currency. The increases in expenses were offset by reduced costs as a result of our broad-based transformation initiatives and excess capacity headcount actions for non-sales associates, reduced travel expenses, and a decrease in bad debt expense.
For the year ended June 30, respectively:
Employer Services' overall margin decreased for fiscal 2021 due to an increase in incentive compensation costs, a decrease in interest earned on funds held for clients, and an increase in amortization expense. This decrease was partially offset by reduced costs as a result of our broad-based transformation initiatives and excess capacity headcount actions in the prior year, and a decrease in bad debt expense.
Revenues | | | | | | | | | | | | | | | | | | | | | | | | | | | | | | | |
| | | | | | | | | PEO Revenues |
| | | | | Years Ended | | Change |
| | | | June 30, | |
| | | | | | | | | | 2021 | | 2020 | | $ | | % |
| PEO Services' revenues | | | | | | | | | $ | 4,818.3 | | | $ | 4,511.5 | | | $ | 306.8 | | | 7 | % |
| Less: PEO zero-margin benefits pass-throughs | | | | | | | | | 3,092.0 | | | 2,907.7 | | | 184.3 | | | 6 | % |
| PEO Services' revenues excluding zero-margin benefits pass-throughs | | | | | | | | | $ | 1,726.3 | | | $ | 1,603.8 | | | $ | 122.5 | | | 8 | % |
PEO Services' revenues increased 7% and PEO Services' revenues excluding zero-margin benefits pass-through costs increased 8% in fiscal 2021. PEO Services' revenues increased due to a 2% increase in the average number of Worksite Employees in fiscal 2021 driven by an increase in the number of new PEO Services clients, partially offset by a modest decline in pays per control.
Earnings before Income Taxes
PEO Services’ earnings before income taxes increased 18% in fiscal 2021 due to increased revenues discussed above, partially offset by increases in expenses. The increases in expenses were due to the increase in zero-margin benefits pass-through costs of $184.3 million described above, partially offset by a change of $52.5 million in our estimated losses related to ADP Indemnity compared to the prior year, and a decrease in selling expenses.
For the year ended June 30, respectively:
PEO Services' overall margin increased for fiscal 2021 due to an increase in revenues as discussed above, a change in our estimated losses related to ADP Indemnity compared to the prior year, and a decrease in selling expenses.
ADP Indemnity provides workers’ compensation and employer’s liability deductible reimbursement insurance protection for PEO Services’ worksite employees up to $1 million per occurrence. PEO Services has secured a workers’ compensation and employer’s liability insurance policy that caps the exposure for each claim at $1 million per occurrence and has also secured aggregate stop loss insurance that caps aggregate losses at a certain level in fiscal years 2012 and prior from an admitted and licensed insurance company of AIG. We utilize historical loss experience and actuarial judgment to determine the estimated claim liability, and changes in estimated ultimate incurred losses are included in the PEO segment.
Additionally, starting in fiscal year 2013, ADP Indemnity paid premiums to enter into reinsurance arrangements with ACE American Insurance Company, a wholly-owned subsidiary of Chubb Limited (“Chubb”), to cover substantially all losses incurred by the Company up to the $1 million per occurrence related to the workers' compensation and employer's liability deductible reimbursement insurance protection for PEO Services' worksite employees. Each of these reinsurance arrangements limits our overall exposure incurred up to a certain limit. The Company believes the likelihood of ultimate losses exceeding this limit is remote. During fiscal 2021, ADP Indemnity paid a premium of $240 million to enter into a reinsurance arrangement with Chubb to cover substantially all losses incurred by ADP Indemnity for the fiscal 2021 policy year up to $1 million per occurrence. ADP Indemnity recorded a pre-tax benefit of approximately $32 million in fiscal 2021 and a pre-tax loss of approximately $20 million in fiscal 2020, which were primarily a result of changes in our estimated actuarial losses. ADP Indemnity paid a premium of $260 million in July 2021 to enter into a reinsurance agreement with Chubb to cover substantially all losses incurred by ADP Indemnity for fiscal 2022 policy year on terms substantially similar to the fiscal 2021 reinsurance policy.
Other
The primary components of “Other” are certain corporate overhead charges and expenses that have not been allocated to the reportable segments, including corporate functions, costs related to our transformation office, legal settlements, severance costs, non-recurring gains and losses, the elimination of intercompany transactions, and other interest expense.
Non-GAAP Financial Measures
In addition to our GAAP results, we use the adjusted results and other non-GAAP metrics set forth in the table below to evaluate our operating performance in the absence of certain items and for planning and forecasting of future periods: | | | | | | |
| Adjusted Financial Measures | U.S. GAAP Measures | |
| Adjusted EBIT | Net earnings | |
| Adjusted provision for income taxes | Provision for income taxes | |
| Adjusted net earnings | Net earnings | |
| | |
| Adjusted diluted earnings per share | Diluted earnings per share | |
| Adjusted effective tax rate | Effective tax rate | |
| | |
| Organic constant currency | Revenues | |
| | |
We believe that the exclusion of the identified items helps us reflect the fundamentals of our underlying business model and analyze results against our expectations and against prior period, and to plan for future periods by focusing on our underlying operations. We believe that the adjusted results provide relevant and useful information for investors because it allows investors to view performance in a manner similar to the method used by management and improves their ability to understand and assess our operating performance. The nature of these exclusions is for specific items that are not fundamental to our underlying business operations. Since these adjusted financial measures and other non-GAAP metrics are not measures of performance calculated in accordance with U.S. GAAP, they should not be considered in isolation from, as a substitute for, or superior to their corresponding U.S. GAAP measures, and they may not be comparable to similarly titled measures at other companies.
| | | | | | | | | | | | | | | | | | | | | | | | | | | | | | |
| | Years Ended
June 30, | | | | % Change | | |
| | 2021 | | 2020 | | | | As Reported | | | | | | | | |
| Net earnings | | $ | 2,598.5 | | | $ | 2,466.5 | | | | | 5 | % | | | | | | | | |
| Adjustments: | | | | | | | | | | | | | | | | |
| Provision for income taxes | | 762.7 | | | 716.1 | | | | | | | | | | | | | |
| All other interest expense (a) | | 57.3 | | | 59.2 | | | | | | | | | | | | | |
| All other interest income (a) | | (6.5) | | | (20.5) | | | | | | | | | | | | | |
| | | | | | | | | | | | | | | | |
| Gain on sale of assets | | — | | | (0.2) | | | | | | | | | | | | | |
| | | | | | | | | | | | | | | | |
| Transformation initiatives (b) | | — | | | 77.4 | | | | | | | | | | | | | |
| Excess capacity severance charges (c) | | 2.9 | | | 25.4 | | | | | | | | | | | | | |
| | | | | | | | | | | | | | | | |
| Legal settlements (d) | | (30.7) | | | 25.0 | | | | | | | | | | | | | |
| Adjusted EBIT | | $ | 3,384.2 | | | $ | 3,348.9 | | | | | 1 | % | | | | | | | | |
| Adjusted EBIT Margin | | 22.6 | % | | 23.0 | % | | | | | | | | | | | | |
| | | | | | | | | | | | | | | | |
| Provision for income taxes | | $ | 762.7 | | | $ | 716.1 | | | | | 7 | % | | | | | | | | |
| Adjustments: | | | | | | | | | | | | | | | | |
| | | | | | | | | | | | | | | | |
| Gain on sale of assets (e) | | — | | | (0.1) | | | | | | | | | | | | | |
| | | | | | | | | | | | | | | | |
| Transformation initiatives (e) | | — | | | 19.2 | | | | | | | | | | | | | |
| Excess capacity severance charges (e) | | 0.5 | | | 6.3 | | | | | | | | | | | | | |
| | | | | | | | | | | | | | | | |
| Legal settlements (e) | | (7.5) | | | 6.2 | | | | | | | | | | | | | |
| | | | | | | | | | | | | | | | |
| Adjusted provision for income taxes | | $ | 755.7 | | | $ | 747.7 | | | | | 1 | % | | | | | | | | |
| Adjusted effective tax rate (f) | | 22.7 | % | | 22.6 | % | | | | | | | | | | | | |
| | | | | | | | | | | | | | | | |
| Net earnings | | $ | 2,598.5 | | | $ | 2,466.5 | | | | | 5 | % | | | | | | | | |
| Adjustments: | | | | | | | | | | | | | | | | |
| | | | | | | | | | | | | | | | |
| | | | | | | | | | | | | | | | |
| Gain on sale of assets | | — | | | (0.2) | | | | | | | | | | | | | |
| Income tax provision on gain on sale of assets (e) | | — | | | 0.1 | | | | | | | | | | | | | |
| | | | | | | | | | | | | | | | |
| | | | | | | | | | | | | | | | |
| Transformation initiatives (b) | | — | | | 77.4 | | | | | | | | | | | | | |
| Income tax benefit for transformation initiatives (e) | | — | | | (19.2) | | | | | | | | | | | | | |
| Excess capacity severance charges (c) | | 2.9 | | | 25.4 | | | | | | | | | | | | | |
| Income tax benefit for excess capacity severance charges (e) | | (0.5) | | | (6.3) | | | | | | | | | | | | | |
| | | | | | | | | | | | | | | | |
| | | | | | | | | | | | | | | | |
| Legal settlements (d) | | (30.7) | | | 25.0 | | | | | | | | | | | | | |
| Income tax provision/ (benefit) for legal settlements (e) | | 7.5 | | | (6.2) | | | | | | | | | | | | | |
| | | | | | | | | | | | | | | | |
| Adjusted net earnings | | $ | 2,577.7 | | | $ | 2,562.5 | | | | | 1 | % | | | | | | | | |
| | | | | | | | | | | | | | | | |
| Diluted EPS | | $ | 6.07 | | | $ | 5.70 | | | | | 6 | % | | | | | | | | |
| Adjustments: | | | | | | | | | | | | | | | | |
| | | | | | | | | | | | | | | | |
| Gain on sale of assets (e) | | — | | | — | | | | | | | | | | | | | |
| | | | | | | | | | | | | | | | |
| Transformation initiatives (b) (e) | | — | | | 0.13 | | | | | | | | | | | | | |
| Excess capacity severance charges (c) (e) | | 0.01 | | | 0.04 | | | | | | | | | | | | | |
| | | | | | | | | | | | | | | | |
| Legal settlements (d) (e) | | (0.05) | | | 0.04 | | | | | | | | | | | | | |
| | | | | | | | | | | | | | | | |
| Adjusted diluted EPS | | $ | 6.02 | | | $ | 5.92 | | | | | 2 | % | | | | | | | | |
| | | | | | | | | | | | | | | | |
(a) We include the interest income earned on investments associated with our client funds extended investment strategy and interest expense on borrowings related to our client funds extended investment strategy as we believe these amounts to be fundamental to the underlying operations of our business model. The adjustments in the table above represent the interest income and interest expense that are not related to our client funds extended investment strategy and are labeled as “All other interest expense” and “All other interest income.”
(b) In fiscal 2021, transformation initiatives include impairment charges as a result of recognizing certain owned facilities at fair value given intent to sell and accordingly classified as held for sale and lease asset impairment charges, offset by gain on sale of assets and net reversals of charges related to other transformation initiatives, including severance.
Unlike other severance charges which are not included as an adjustment to get to adjusted results, these specific charges relate to actions taken as part of our broad-based, company-wide transformation initiative.
(c) Represents net severance cost related to excess capacity. Unlike certain other severance charges in prior periods that are not
included as an adjustment to get to adjusted results, these specific charges relate to actions that are part of our broad-based,
company-wide initiatives to address excess capacity across our business and functions, including charges in fiscal 2020 due to the COVID-19 pandemic.
(d) Represents legal settlements including an insurance recovery in fiscal 2021.
(e) The income tax provision/(benefit) was calculated based on the marginal rate in effect for the year ended June 30, 2021.
(f) The Adjusted effective tax rate is calculated as our Adjusted provision for income taxes divided by the sum of our Adjusted net earnings plus our Adjusted provision for income taxes.
The following table reconciles our reported growth rates to the non-GAAP measure of organic constant currency, which excludes the impact of acquisitions, the impact of dispositions, and the impact of foreign currency. The impact of acquisitions and dispositions is calculated by excluding the current year revenues of acquisitions until the one-year anniversary of the transaction and by excluding the prior year revenues of divestitures for the one-year period preceding the transaction. The impact of foreign currency is determined by calculating the current year result using foreign exchange rates consistent with the prior year. The PEO segment is not impacted by acquisitions, dispositions or foreign currency. | | | | | | | | | | | | |
| | | | | Year Ended | | | |
| | | | | June 30, | | | |
| | | | | 2021 | | | |
| Consolidated revenue growth as reported | | | | | 3 | % | | | |
| Adjustments: | | | | | | | | |
Impact of acquisitions | | | | | — | % | | | |
| | | | | | | | |
Impact of foreign currency | | | | | (1) | % | | | |
| Consolidated revenue growth, organic constant currency | | | | | 2 | % | | | |
| | | | | | | | |
| Employer Services revenue growth as reported | | | | | 1 | % | | | |
| Adjustments: | | | | | | | | |
Impact of acquisitions | | | | | — | % | | | |
| | | | | | | | |
Impact of foreign currency | | | | | (1) | % | | | |
| Employer Services revenue growth, organic constant currency | | | | | — | % | | | |
FINANCIAL CONDITION, LIQUIDITY AND CAPITAL RESOURCES
As of June 30, 2021, cash and cash equivalents were $2.6 billion, which were primarily invested in time deposits and money market funds.
For corporate liquidity, we expect existing cash, cash equivalents, long-term marketable securities, cash flow from operations together with our $9.7 billion of committed credit facilities and our ability to access both long-term and short-term debt financing from the capital markets will be adequate to meet our operating, investing, and financing activities such as regular quarterly dividends, share repurchases, and capital expenditures for the foreseeable future. Our financial condition remains solid at June 30, 2021 and we have sufficient liquidity as noted above; however, given the uncertainty in the rapidly changing market and economic conditions related to the COVID-19 pandemic, we will continue to evaluate the nature and extent of the impact to our financial condition and liquidity.
For client funds liquidity, we have the ability to borrow through our financing arrangements under our U.S. short-term commercial paper program and our U.S., Canadian and United Kingdom short-term reverse repurchase agreements, together with our $9.7 billion of committed credit facilities and our ability to use corporate liquidity when necessary to meet short-term funding requirements related to client funds obligations. Please see “Quantitative and Qualitative Disclosures about Market Risk” for a further discussion of the risks, including with respect to the COVID-19 pandemic, related to our client funds extended investment strategy. See Note 8 of our Consolidated Financial Statements for a description of our short-term financing including commercial paper.
Operating, Investing and Financing Cash Flows
Our cash flows from operating, investing, and financing activities, as reflected in the Statements of Consolidated Cash Flows are summarized as follows: | | | | | | | | | | | | | | | | | | | | | | | | |
| | Years ended June 30, | | |
| | 2021 | | 2020 | | | | $ Change |
| Cash provided by (used in): | | | | | | | | | | |
| Operating activities | | $ | 3,093.3 | | | $ | 3,026.2 | | | | | $ | 67.1 | | | |
| Investing activities | | (3,515.0) | | | 3,156.3 | | | | | (6,671.3) | | | |
| Financing activities | | 6,437.5 | | | (5,890.6) | | | | | 12,328.1 | | | |
| Effect of exchange rate changes on cash, cash equivalents, restricted cash, and restricted cash equivalents | | 73.8 | | | (34.5) | | | | | 108.3 | | | |
| Net change in cash, cash equivalents, restricted cash, and restricted cash equivalents | | $ | 6,089.6 | | | $ | 257.4 | | | | | $ | 5,832.2 | | | |
Net cash flows provided by operating activities increased due to a net favorable change in the components of operating assets and liabilities as compared to the year ended June 30, 2020.
Net cash flows from investing activities changed due to the timing of proceeds and purchases of corporate and client funds marketable securities of $6,771.2 million.
Net cash flows from financing activities changed due to a net increase in the cash flow from client funds obligations of $11,549.4 million, which is due to the timing of impounds from our clients and payments to our clients' employees and other payees, and proceeds from debt issuances. These were partially offset by payments of debt, more cash returned to shareholders via share repurchases and dividends, and settlement of cash flow hedges in fiscal 2021.
We purchased approximately 8.2 million shares of our common stock at an average price per share of $170.04 during fiscal 2021, as compared to purchases of 6.2 million shares at an average price per share of $160.61 during fiscal 2020. From time to time, the Company may repurchase shares of its common stock under its authorized share repurchase program. The Company considers several factors in determining when to execute share repurchases, including, among other things, actual and potential acquisition activity, cash balances and cash flows, issuances due to employee benefit plan activity, and market conditions.
Capital Resources and Client Fund Obligations
We have $3.0 billion of senior unsecured notes with maturity dates in 2025, 2028, and 2030. We may from time to time revisit the long-term debt market to refinance existing debt, finance investments including acquisitions for our growth, and maintain the appropriate capital structure. However, there can be no assurance that volatility in the global capital and credit markets would not impair our ability to access these markets on terms acceptable to us, or at all. See Note 9 of our Consolidated Financial Statements for a description of our notes.
Our U.S. short-term funding requirements related to client funds are sometimes obtained on an unsecured basis through the issuance of commercial paper, rather than liquidating previously-collected client funds that have already been invested in available-for-sale securities. This commercial paper program provides for the issuance of up to $9.7 billion in aggregate maturity value. Our commercial paper program is rated A-1+ by Standard and Poor’s, Prime-1 (“P-1”) by Moody’s and F1+ by Fitch. These ratings denote the highest quality commercial paper securities. Maturities of commercial paper can range from overnight to up to 364 days. At June 30, 2021 and 2020, we had no commercial paper borrowing outstanding. Details of the borrowings under the commercial paper program are as follows:
| | | | | | | | | | | | | | | | | |
| Years ended June 30, | | | | | 2021 | | 2020 |
| Average daily borrowings (in billions) | | | | | $ | 1.6 | | | $ | 2.7 | |
| Weighted average interest rates | | | | | 0.1 | % | | 1.6 | % |
| Weighted average maturity (approximately in days) | | | | | 1 day | | 2 days |
Our U.S., Canadian, and United Kingdom short-term funding requirements related to client funds obligations are sometimes obtained on a secured basis through the use of reverse repurchase agreements, which are collateralized principally by
government and government agency securities, rather than liquidating previously-collected client funds that have already been invested in available-for-sale securities. These agreements generally have terms ranging from overnight to up to five business days. We have successfully borrowed through the use of reverse repurchase agreements on an as-needed basis to meet short-term funding requirements related to client funds obligations. At June 30, 2021 and 2020, there were $23.5 million and $13.6 million, respectively, of outstanding obligations related to the reverse repurchase agreements. Details of the reverse repurchase agreements are as follows:
| | | | | | | | | | | | | | | | | |
| Years ended June 30, | | | | | 2021 | | 2020 |
| Average outstanding balances | | | | | $ | 136.7 | | | $ | 263.4 | |
| Weighted average interest rates | | | | | 0.2 | % | | 1.6 | % |
We vary the maturities of our committed credit facilities to limit the refinancing risk of any one facility. We have a $3.75 billion, 364-day credit agreement that matures in June 2022 with a one year term-out option. In addition, we have a five-year $2.75 billion credit facility and a five-year $3.2 billion credit facility maturing in June 2024 and June 2026, respectively, each with an accordion feature under which the aggregate commitment can be increased by $500 million, subject to the availability of additional commitments. The primary uses of the credit facilities are to provide liquidity to the commercial paper program and funding for general corporate purposes, if necessary. We had no borrowings through June 30, 2021 under the credit facilities. We believe that we currently meet all conditions set forth in the revolving credit agreements to borrow thereunder, and we are not aware of any conditions that would prevent us from borrowing part or all of the $9.7 billion available to us under the revolving credit agreements. See Note 8 of our Consolidated Financial Statements for a description of our short-term financing including credit facilities.
Our investment portfolio does not contain any asset-backed securities with underlying collateral of sub-prime mortgages, alternative-A mortgages, sub-prime auto loans or sub-prime home equity loans, collateralized debt obligations, collateralized loan obligations, credit default swaps, derivatives, auction rate securities, structured investment vehicles or non-investment grade fixed-income securities. We own AAA-rated senior tranches of primarily fixed rate auto loan, credit card, equipment lease, and rate reduction receivables, secured predominantly by prime collateral. All collateral on asset-backed securities is performing as expected through June 30, 2021. In addition, we own U.S. government securities which primarily include debt directly issued by Federal Farm Credit Banks and Federal Home Loan Banks. Our client funds investment strategy is structured to allow us to average our way through an interest rate cycle by laddering the maturities of our investments out to five years (in the case of the extended portfolio) and out to ten years (in the case of the long portfolio). This investment strategy is supported by our short-term financing arrangements necessary to satisfy short-term funding requirements relating to client funds obligations. See Note 4 of our Consolidated Financial Statements for a description of our corporate investments and funds held for clients.
Capital expenditures for fiscal 2021 were $178.3 million, as compared to $168.3 million for fiscal 2020. We expect capital expenditures in fiscal 2022 to be between $200 million and $225 million.
Contractual Obligations
The following table provides a summary of our contractual obligations at June 30, 2021: | | | | | | | | | | | | | | | | | | | | | | | | | | | | | | | | | | | | | | |
| (In millions) | | Payments due by period |
| Contractual Obligations | | Less than
1 year | | 1-3
years | | 3-5
years | | More than
5 years | | Unknown | | Total |
| | | | | | | | | | | | |
| Debt Obligations (1) | | $ | 64.2 | | | $ | 128.5 | | | $ | 1,111.8 | | | $ | 2,092.1 | | | $ | — | | | $ | 3,396.6 | |
| | | | | | | | | | | | |
| Operating Lease Obligations (2) | | $ | 103.2 | | | $ | 160.7 | | | $ | 102.5 | | | $ | 100.9 | | | $ | — | | | $ | 467.3 | |
| Purchase Obligations (3) | | $ | 448.5 | | | $ | 184.8 | | | $ | 25.3 | | | $ | — | | | $ | — | | | $ | 658.6 | |
Obligations Related to Unrecognized
Tax Benefits (4) | | $ | 14.8 | | | $ | — | | | $ | — | | | $ | — | | | $ | 85.1 | | | $ | 99.9 | |
Other Long-Term Liabilities Reflected
on our Consolidated Balance Sheets: | | | | | | | | | | | | |
| Compensation and Benefits (5) | | $ | 49.0 | | | $ | 64.9 | | | $ | 57.4 | | | $ | 267.2 | | | $ | 33.9 | | | $ | 472.4 | |
| | | | | | | | | | | | |
| Total | | $ | 679.7 | | | $ | 538.9 | | | $ | 1,297.0 | | | $ | 2,460.2 | | | $ | 119.0 | | | $ | 5,094.8 | |
(1)These amounts represent the principal and interest payments of our debt.
(2)Included in these amounts are various facilities and equipment leases. We enter into operating leases in the normal course of business relating to facilities and equipment. The majority of our lease agreements have fixed payment terms based on the passage of time. Certain facility and equipment leases require payment of maintenance and real estate taxes and contain escalation provisions based on future adjustments in price indices. Our future operating lease obligations could change if we exit certain contracts or if we enter into additional operating lease agreements.
(3)Purchase obligations are comprised of a $260 million reinsurance premium with Chubb for the fiscal 2022 policy year, as well as obligations related to software subscription licenses and purchase and maintenance agreements on our software, equipment, and other assets.
(4)Based on current estimates, we expect to make cash payments up to $14.8 million in the next twelve months for obligations related to unrecognized tax benefits across various jurisdictions and tax periods. For $85.1 million of obligations related to unrecognized tax benefits we are unable to make reasonably reliable estimates as to the period in which cash payments are expected to be paid.
(5)Compensation and benefits primarily relates to amounts associated with our employee benefit plans and other compensation arrangements. These amounts exclude the estimated contributions to our defined benefit plans, which are expected to be $10.0 million in fiscal 2022.
In addition to the obligations quantified in the table above, we had obligations for the remittance of funds relating to our payroll and payroll tax filing services. As of June 30, 2021, the obligations relating to these matters, which are expected to be paid in fiscal 2022, total $34,403.8 million and were recorded in client funds obligations on our Consolidated Balance Sheets. We had $34,905.8 million of cash and cash equivalents and marketable securities that were impounded from our clients to satisfy such obligations recorded in funds held for clients on our Consolidated Balance Sheets as of June 30, 2021.
Separately, ADP Indemnity paid a premium of $260 million in July 2021 to enter into a reinsurance agreement with Chubb to cover substantially all losses incurred by ADP Indemnity for the fiscal 2022 policy year. At June 30, 2021, ADP Indemnity had total assets of $564.2 million to satisfy the actuarially estimated unpaid losses of $487.4 million for the policy years since July 1, 2003. ADP Indemnity paid claims of $3.3 million and $4.4 million, net of insurance recoveries, in fiscal 2021 and 2020, respectively. Refer to the “Analysis of Reportable Segments - PEO Services” above for additional information regarding ADP Indemnity.
In the normal course of business, we also enter into contracts in which we make representations and warranties that relate to the performance of our services and products. We do not expect any material losses related to such representations and warranties.
Quantitative and Qualitative Disclosures about Market Risk
Our overall investment portfolio is comprised of corporate investments (cash and cash equivalents, short-term and long-term marketable securities) and client funds assets (funds that have been collected from clients but have not yet been remitted to the applicable tax authorities or client employees).
Our corporate investments are invested in cash and cash equivalents and highly liquid, investment-grade marketable securities. These assets are available for our regular quarterly dividends, share repurchases, capital expenditures and/or acquisitions, as well as other corporate operating purposes. All of our short-term and long-term fixed-income securities are classified as available-for-sale securities.
Our client funds assets are invested with safety of principal, liquidity, and diversification as the primary objectives. Consistent with those objectives, we also seek to maximize interest income and to minimize the volatility of interest income. Client funds assets are invested in highly liquid, investment-grade marketable securities, with a maximum maturity of 10 years at the time of purchase, and money market securities and other cash equivalents.
We utilize a strategy by which we extend the maturities of our investment portfolio for funds held for clients and employ short-term financing arrangements to satisfy our short-term funding requirements related to client funds obligations. Our client funds investment strategy is structured to allow us to average our way through an interest rate cycle by laddering the maturities of our investments out to five years (in the case of the extended portfolio) and out to ten years (in the case of the long portfolio). As part of our client funds investment strategy, we use the daily collection of funds from our clients to satisfy other unrelated client funds obligations, rather than liquidating previously-collected client funds that have already been invested in available-for-sale securities. In circumstances where we experience a reduction in employment levels due to a slowdown in the economy, we may make tactical decisions to sell certain securities in order to reduce the size of the funds held for clients to correspond to client funds obligations. We minimize the risk of not having funds collected from a client available at the time such client’s obligation becomes due by impounding, in virtually all instances, the client’s funds in advance of the timing of payment of such client’s
obligation. As a result of this practice, we have consistently maintained the required level of client funds assets to satisfy all of our obligations.
There are inherent risks and uncertainties involving our investment strategy relating to our client funds assets. Such risks include liquidity risk, including the risk associated with our ability to liquidate, if necessary, our available-for-sale securities in a timely manner in order to satisfy our client funds obligations. However, our investments are made with the safety of principal, liquidity, and diversification as the primary goals to minimize the risk of not having sufficient funds to satisfy all of our client funds obligations. We also believe we have significantly reduced the risk of not having sufficient funds to satisfy our client funds obligations by consistently maintaining access to other sources of liquidity, including our corporate cash balances, available borrowings under our $9.7 billion commercial paper program (rated A-1+ by Standard and Poor’s, P-1 by Moody’s, and F1+ by Fitch, the highest possible short-term credit ratings), and our ability to engage in reverse repurchase agreement transactions and available borrowings under our $9.7 billion committed credit facilities. The reduced availability of financing during periods of economic turmoil, including the COVID-19 pandemic, even to borrowers with the highest credit ratings, may limit our ability to access short-term debt markets to meet the liquidity needs of our business. In addition to liquidity risk, our investments are subject to interest rate risk and credit risk, as discussed below.
We have established credit quality, maturity, and exposure limits for our investments. The minimum allowed credit rating at time of purchase for corporate, Canadian government agency and Canadian provincial bonds is BBB, for asset-backed securities is AAA, and for municipal bonds is A. The maximum maturity at time of purchase for BBB-rated securities is 5 years, for single A rated securities is 10 years, and for AA-rated and AAA-rated securities is 10 years. Time deposits and commercial paper must be rated A-1 and/or P-1. Money market funds must be rated AAA/Aaa-mf.
Details regarding our overall investment portfolio are as follows: | | | | | | | | | | | | | | | | |
| | | | | | |
| Years ended June 30, | | 2021 | | 2020 | | |
| Average investment balances at cost: | | | | | | |
| Corporate investments | | $ | 3,525.6 | | | $ | 4,560.3 | | | |
| Funds held for clients | | 27,353.1 | | | 25,990.3 | | | |
| Total | | $ | 30,878.7 | | | $ | 30,550.6 | | | |
| | | | | | |
Average interest rates earned exclusive of realized
(gains)/losses on: | | | | | | |
| Corporate investments | | 1.0 | % | | 1.9 | % | | |
| Funds held for clients | | 1.5 | % | | 2.1 | % | | |
| Total | | 1.5 | % | | 2.1 | % | | |
| | | | | | |
| | | | | | |
| | | | | | |
| Net realized (gains)/losses on available-for-sale securities | | $ | (11.3) | | | $ | (12.9) | | | |
| | | | | | | | | | | | | | | | |
| As of June 30: | | | | | | |
| Net unrealized pre-tax gains on available-for-sale securities | | $ | 502.2 | | | $ | 876.8 | | | |
| | | | | | |
| Total available-for-sale securities at fair value | | $ | 24,371.7 | | | $ | 21,576.6 | | | |
We are exposed to interest rate risk in relation to securities that mature, as the proceeds from maturing securities are reinvested. Factors that influence the earnings impact of interest rate changes include, among others, the amount of invested funds and the overall portfolio mix between short-term and long-term investments. This mix varies during the fiscal year and is impacted by daily interest rate changes. The annualized interest rate earned on our entire portfolio decreased from 2.1% for fiscal 2020 to 1.5% for fiscal 2021. A hypothetical change in both short-term interest rates (e.g., overnight interest rates or the federal funds rate) and intermediate-term interest rates of 25 basis points applied to the estimated average investment balances and any related short-term borrowings would result in approximately a $22 million impact to earnings before income taxes over the ensuing twelve-month period ending June 30, 2022. A hypothetical change in only short-term interest rates of 25 basis points applied to the estimated average short-term investment balances and any related short-term borrowings would result in approximately an $10 million impact to earnings before income taxes over the ensuing twelve-month period ending June 30, 2022.
We are exposed to credit risk in connection with our available-for-sale securities through the possible inability of the borrowers to meet the terms of the securities. We limit credit risk by investing in investment-grade securities, primarily AAA-rated and AA- rated securities, as rated by Moody’s, Standard & Poor’s, DBRS for Canadian dollar denominated securities, and Fitch for asset-backed and commercial-mortgage-backed securities. Approximately 72% of our available-for-sale securities held a AAA-rating or AA-rating at June 30, 2021. In addition, we limit amounts that can be invested in any security other than U.S. government and government agency, Canadian government, and United Kingdom government securities.
We operate and transact business in various foreign jurisdictions and are therefore exposed to market risk from changes in foreign currency exchange rates that could impact our consolidated results of operations, financial position, or cash flows. We manage our exposure to these market risks through our regular operating and financing activities and, when deemed appropriate, through the use of derivative financial instruments. We may use derivative financial instruments as risk management tools and not for trading purposes.
RECENTLY ISSUED ACCOUNTING PRONOUNCEMENTS
See Note 1, Recently Issued Accounting Pronouncements, of Notes to the Consolidated Financial Statements for a discussion of recent accounting pronouncements.
CRITICAL ACCOUNTING POLICIES
Our Consolidated Financial Statements and accompanying notes have been prepared in accordance with U.S. GAAP. The preparation of these financial statements requires management to make estimates, judgments, and assumptions that affect reported amounts of assets, liabilities, revenues, expenses and other comprehensive income. We continually evaluate the accounting policies and estimates used to prepare the Consolidated Financial Statements. The estimates are based on historical experience and assumptions believed to be reasonable under current facts and circumstances. Actual amounts and results could differ from these estimates made by management. In addition, as the duration and severity of COVID-19 pandemic are uncertain, certain of our estimates could require further judgment or modification and therefore carry a higher degree of variability and volatility. As events continue to evolve, our estimates may change materially in future periods. Certain accounting policies that require significant management estimates and are deemed critical to our results of operations or financial position are Revenue Recognition (including Deferred Costs), Goodwill and Income Taxes. Refer to Note 1, Summary of Significant Accounting Policies, of Notes to the Consolidated Financial Statements for discussion of our policies for Revenue Recognition (including Deferred Costs), Goodwill and Income Taxes.
Goodwill. Goodwill represents the excess of purchase price over the value assigned to the net tangible and identifiable intangible assets of businesses acquired. Goodwill is tested annually for impairment or more frequently when an event or circumstance indicates that goodwill might be impaired.
The Company’s annual goodwill impairment assessment as of June 30, 2021 was performed for all reporting units using a quantitative approach by comparing the fair value of each reporting unit to its carrying value. We estimated the fair value of each reporting unit using, as appropriate, the income approach, which is derived using the present value of future cash flows discounted at a risk-adjusted weighted-average cost of capital, and the market approach, which is based upon using market multiples of companies in similar lines of business. Significant assumptions used in determining the fair value of our reporting units include projected revenue growth rates, profitability projections, working capital assumptions, the weighted average cost of capital, the determination of appropriate market comparison companies, and terminal growth rates. Several of these assumptions including projected revenue growth rates and profitability projections are dependent on our ability to upgrade, enhance, and expand our technology and services to meet client needs and preferences. As such, the determination of fair value requires management to make significant estimates and assumptions related to forecasts of future revenue and operating margins. Based upon the quantitative assessment, the Company has concluded that goodwill is not impaired. As the assumptions used in the income approach and market approach can have a material impact on the fair value determinations, we performed a sensitivity analysis and determined that a one percentage point increase in the weighted-average cost of capital would not result in an impairment of goodwill for all reporting units and their fair values substantially exceeded their carrying values.
Item 7A. Quantitative and Qualitative Disclosures About Market Risk
The information called for by this item is provided under the caption “Quantitative and Qualitative Disclosures About Market Risk” under “Item 7 - Management’s Discussion and Analysis of Financial Condition and Results of Operation.”
Item 8. Financial Statements and Supplementary Data
REPORT OF INDEPENDENT REGISTERED PUBLIC ACCOUNTING FIRM
To the Board of Directors and Stockholders of
Automatic Data Processing, Inc.
Roseland, New Jersey
Opinion on the Financial Statements
We have audited the accompanying consolidated balance sheets of Automatic Data Processing, Inc. and subsidiaries (the "Company") as of June 30, 2021 and 2020, and the related statements of consolidated earnings, comprehensive income, stockholders' equity, and cash flows for each of the three years in the period ended June 30, 2021, and the related notes and the schedule listed in the Index at Item 15(a)2 (collectively referred to as the “financial statements”). In our opinion, the financial statements present fairly, in all material respects, the financial position of the Company as of June 30, 2021 and 2020, and the results of its operations and its cash flows for each of the three years in the period ended June 30, 2021, in conformity with accounting principles generally accepted in the United States of America.
We have also audited, in accordance with the standards of the Public Company Accounting Oversight Board (United States) (PCAOB), the Company’s internal control over financial reporting as of June 30, 2021, based on criteria established in Internal Control - Integrated Framework (2013) issued by the Committee of Sponsoring Organizations of the Treadway Commission and our report dated August 4, 2021, expressed an unqualified opinion on the Company’s internal control over financial reporting.
Change in Accounting Principle
As discussed in Note 1 to the financial statements, effective July 1, 2019, the Company adopted FASB Accounting Standards Update 2016-02, Leases (ASC 842), under the optional transition method.
Basis for Opinion
These financial statements are the responsibility of the Company's management. Our responsibility is to express an opinion on the financial statements based on our audits. We are a public accounting firm registered with the PCAOB and are required to be independent with respect to the Company in accordance with the U.S. federal securities laws and the applicable rules and regulations of the Securities and Exchange Commission and the PCAOB.
We conducted our audits in accordance with the standards of the PCAOB. Those standards require that we plan and perform the audit to obtain reasonable assurance about whether the financial statements are free of material misstatement, whether due to error or fraud. Our audits included performing procedures to assess the risk of material misstatements of the financial statements, whether due to error or fraud, and performing procedures that respond to those risks. Such procedures included examining, on a test basis, evidence regarding the amounts and disclosures in the financial statements. Our audits also included evaluating the accounting principles used and significant estimates made by management, as well as evaluating the overall presentation of the financial statements. We believe that our audits provide a reasonable basis for our opinion.
Critical Audit Matters
The critical audit matters communicated below are matters arising from the current-period audit of the financial statements that were communicated or required to be communicated to the audit committee and that (1) relate to accounts or disclosures that are material to the financial statements and (2) involved our especially challenging, subjective, or complex judgments. The communication of critical audit matters does not alter in any way our opinion on the financial statements, taken as a whole, and we are not, by communicating the critical audit matters below, providing separate opinions on the critical audit matters or on the accounts or disclosures to which they relate.
Goodwill – Employer Services Reportable Segment— Refer to Notes 1 and 7 to the financial statements
Critical Audit Matter Description
The Company’s evaluation of goodwill for impairment involves the comparison of the fair value of each reporting unit to its carrying value. The Company uses the discounted cash flow model to estimate fair value, which requires management to make significant estimates and assumptions related to forecasts of future revenue and operating margin. In addition, the discounted cash flow model requires the Company to select an appropriate weighted average cost of capital based on current market conditions as of June 30, 2021. Changes in these assumptions could have a significant impact on either the fair value, the amount of any goodwill impairment charge, or both.
Forecasts of future revenue and operating margin from the Company’s next-gen platform, for which there is limited historical data, contribute significantly to the estimate of fair value of a reporting unit within the Employer Services reportable segment with approximately $678 million of goodwill as of June 30, 2021. Given the limited historical data associated with the Company’s next-gen platform, significant management judgment was required to forecast future revenue and operating margin to estimate the fair value of the reporting unit. In turn, a high degree of auditor judgment and an increased extent of audit effort were required when performing audit procedures to evaluate the reasonableness of management’s estimates and assumptions related to the forecasts of revenue and operating margin and the selection of the weighted average cost of capital, including the involvement of our fair value specialists.
How the Critical Audit Matter Was Addressed in the Audit
Our audit procedures related to the forecasts of future revenue and operating margin and the selection of the weighted average cost of capital used by management to estimate the fair value contributed by the next-gen platform included the following, among others:
•We tested the effectiveness of controls over management’s goodwill impairment evaluation, including those over the determination of the fair value of the reporting unit within the Employer Services reportable segment, such as controls related to management’s forecasts of future revenue and operating margin and the selection of the weighted average cost of capital.
•With the assistance of our fair value specialists, we evaluated the reasonableness of the valuation models, methodology, and significant assumptions used by the Company, specifically the weighted average cost of capital including:
◦Testing the mathematical accuracy of the Company’s calculation of the weighted average cost of capital.
◦Developing a range of independent estimates and compared to the weighted average cost of capital selected by management.
•We evaluated management’s ability to accurately forecast future revenue and operating margin by comparing actual results to management’s historical forecasts. Due to the limited historical data for the next-gen platform, we evaluated the reasonableness of management’s revenue and operating margin forecasts by comparing the forecasts to (1) the historical operating results of the Company’s similar existing platforms, (2) the limited operating results to date of the next-gen platform, (3) internal communications to management and the board of directors, and (4) external communications made by management to analysts and investors.
Client Funds Obligations - Refer to Note 4 to the financial statements
Critical Audit Matter Description
Client funds obligations represent the Company's contractual obligations to remit funds to satisfy clients' payroll, tax and other payee payment obligations and are recorded as a liability at the time that the Company impounds funds from clients (i.e., money movement). The Company has reported client funds obligations as a current liability in the consolidated financial statements totaling $34,403.8 million as of June 30, 2021. This money movement activity involves significant amounts of client funds being impounded and remitted to third parties and results in a high volume of transactions.
To validate the accuracy and completeness of the client funds obligations reported as of period end, the Company performs complex data extracts in order to reconcile the transactional data to the client funds obligations and funds held for clients balances reported at period end. Given the significant volume of data used in the reconciliation, the complexity of the data extraction, and the reconciliation of the data extracts to the client funds obligations balance reported, auditing the client funds obligations is complex and requires the involvement of data specialists to independently reperform the reconciliation and assist with testing of the completeness and accuracy of client funds obligations reported as of period end, including identifying the manual adjustments identified in management’s reconciliation process.
How the Critical Audit Matter Was Addressed in the Audit
Our audit procedures related to the Company's client funds obligations included the following, among others:
•We tested the effectiveness of general information technology controls over the applications relevant to the money movement reconciliation process.
•We tested the effectiveness of (1) management’s controls over the client funds obligations data reconciliation and (2) management’s control to reconcile the consolidated client funds obligations to the corresponding consolidated funds held for clients balance.
•We involved data specialists to (1) independently reperform management’s client funds obligations reconciliation and (2) perform data analyses to identify and evaluate recurring and new adjustments to the data extracts in the current period.
•For a selection of client funds obligations transactions, we evaluated whether the funds were impounded prior to June 30, 2021, agreed the liability to the corresponding asset balance, and evaluated whether the funds were properly included or excluded from the client funds obligations.
•We made a selection of adjustments identified by management’s reconciliation of the transactional data to the client funds obligations balance reported at period end and evaluated whether the adjustments were supported and appropriate to reconcile and validate the client funds obligations balance reported at period end.
•We made a selection of disbursements to third parties subsequent to the balance sheet date to evaluate whether they were properly included or excluded from client funds obligations.
•We tested the Company’s reconciliation of the consolidated client funds obligations to funds held for clients.
| | |
| /s/ Deloitte & Touche LLP |
Parsippany, New Jersey
August 4, 2021
We have served as the Company’s auditor since 1968.
Statements of Consolidated Earnings
(In millions, except per share amounts)
| | | | | | | | | | | | | | | | | | | | |
| | | | | | |
| Years ended June 30, | | 2021 | | 2020 | | 2019 |
| | | | | | |
| REVENUES: | | | | | | |
Revenues, other than interest on funds held
for clients and PEO revenues | | $ | 9,768.6 | | | $ | 9,538.1 | | | $ | 9,375.8 | |
| Interest on funds held for clients | | 422.4 | | | 545.2 | | | 561.9 | |
| PEO revenues (A) | | 4,814.4 | | | 4,506.5 | | | 4,172.5 | |
| TOTAL REVENUES | | 15,005.4 | | | 14,589.8 | | | 14,110.2 | |
| | | | | | |
| EXPENSES: | | | | | | |
| Costs of revenues: | | | | | | |
| Operating expenses | | 7,520.7 | | | 7,404.1 | | | 7,080.9 | |
| Systems development and programming costs | | 716.6 | | | 674.1 | | | 636.3 | |
| Depreciation and amortization | | 403.0 | | | 366.9 | | | 304.4 | |
| TOTAL COSTS OF REVENUES | | 8,640.3 | | | 8,445.1 | | | 8,021.6 | |
| | | | | | |
| Selling, general, and administrative expenses | | 3,040.5 | | | 3,003.0 | | | 3,064.2 | |
| Interest expense | | 59.7 | | | 107.1 | | | 129.9 | |
| TOTAL EXPENSES | | 11,740.5 | | | 11,555.2 | | | 11,215.7 | |
| | | | | | |
| Other (income)/expense, net | | (96.3) | | | (148.0) | | | (111.1) | |
| | | | | | |
| EARNINGS BEFORE INCOME TAXES | | 3,361.2 | | | 3,182.6 | | | 3,005.6 | |
| | | | | | |
| Provision for income taxes | | 762.7 | | | 716.1 | | | 712.8 | |
| | | | | | |
| | | | | | |
| | | | | | |
| | | | | | |
| | | | | | |
| | | | | | |
| NET EARNINGS | | $ | 2,598.5 | | | $ | 2,466.5 | | | $ | 2,292.8 | |
| | | | | | |
| | | | | | |
| | | | | | |
| BASIC EARNINGS PER SHARE | | $ | 6.10 | | | $ | 5.73 | | | $ | 5.27 | |
| | | | | | |
| | | | | | |
| | | | | | |
| DILUTED EARNINGS PER SHARE | | $ | 6.07 | | | $ | 5.70 | | | $ | 5.24 | |
| | | | | | |
| Basic weighted average shares outstanding | | 426.3 | | | 430.8 | | | 435.0 | |
| Diluted weighted average shares outstanding | | 428.1 | | | 432.7 | | | 437.6 | |
| | | | | | |
| | | | | | |
(A) For the years ended June 30, 2021 (“fiscal 2021”), June 30, 2020 (“fiscal 2020”), and June 30, 2019 (“fiscal 2019”), Professional Employer Organization (“PEO”) revenues are net of direct pass-through costs, primarily consisting of payroll wages and payroll taxes, of $51,362.3 million, $45,826.1 million, and $42,688.8 million, respectively.
See notes to the Consolidated Financial Statements.
Statements of Consolidated Comprehensive Income
(In millions)
| | | | | | | | | | | | | | | | | | | | |
| | | | | | |
| Years ended June 30, | | 2021 | | 2020 | | 2019 |
| | | | | | |
| Net earnings | | $ | 2,598.5 | | | $ | 2,466.5 | | | $ | 2,292.8 | |
| | | | | | |
| Other comprehensive income/(loss): | | | | | | |
| Currency translation adjustments | | 95.4 | | | (53.0) | | | (42.2) | |
| | | | | | |
| Unrealized net gains/(losses) on available-for-sale securities | | (363.3) | | | 602.2 | | | 642.4 | |
| Tax effect | | 82.6 | | | (136.4) | | | (144.4) | |
| Reclassification of net losses/(gains) on available-for-sale securities to net earnings | | (11.3) | | | (12.9) | | | 0.9 | |
| Tax effect | | 2.5 | | | 2.9 | | | (0.3) | |
| | | | | | |
| Unrealized (losses)/gains on cash flow hedging activities | | (3.3) | | | (40.3) | | | — | |
| Tax effect | | 0.8 | | | 10.0 | | | — | |
| Amortization of unrealized losses on cash flow hedging activities | | 3.8 | | | — | | | — | |
| Tax effect | | (0.9) | | | — | | | — | |
| | | | | | |
| Pension net (losses)/gains arising during the year | | 281.5 | | | (160.8) | | | (84.7) | |
| Tax effect | | (69.0) | | | 39.5 | | | 20.0 | |
| Reclassification of pension liability adjustment to net earnings | | 9.3 | | | (11.8) | | | 40.3 | |
| Tax effect | | (2.7) | | | 3.1 | | | (9.5) | |
| | | | | | |
| Other comprehensive income/(loss), net of tax | | 25.4 | | | 242.5 | | | 422.5 | |
| Comprehensive income | | $ | 2,623.9 | | | $ | 2,709.0 | | | $ | 2,715.3 | |
See notes to the Consolidated Financial Statements.
Consolidated Balance Sheets
(In millions, except per share amounts) | | | | | | | | | | | | | | |
| | | | |
| June 30, | | 2021 | | 2020 |
| Assets | | | | |
| Current assets: | | | | |
| Cash and cash equivalents | | $ | 2,575.2 | | | $ | 1,908.5 | |
| | | | |
Accounts receivable, net of allowance for doubtful accounts of $79.6 and $92.5, respectively | | 2,727.4 | | | 2,441.3 | |
| Other current assets | | 533.4 | | | 506.2 | |
| | | | |
| | | | |
| Total current assets before funds held for clients | | 5,836.0 | | | 4,856.0 | |
| Funds held for clients | | 34,905.8 | | | 26,708.1 | |
| Total current assets | | 40,741.8 | | | 31,564.1 | |
| | | | |
Long-term receivables, net of allowance for doubtful accounts of $0.3 and $0.5, respectively | | 11.5 | | | 18.6 | |
| Property, plant and equipment, net | | 684.5 | | | 703.9 | |
| Operating lease right-of-use asset | | 462.2 | | | 493.7 | |
| Deferred contract costs | | 2,498.2 | | | 2,401.6 | |
| Other assets | | 825.8 | | | 458.4 | |
| Goodwill | | 2,338.4 | | | 2,309.4 | |
| Intangible assets, net | | 1,210.1 | | | 1,215.8 | |
| | | | |
| Total assets | | $ | 48,772.5 | | | $ | 39,165.5 | |
| | | | |
| Liabilities and Stockholders' Equity | | | | |
| Current liabilities: | | | | |
| Accounts payable | | $ | 141.1 | | | $ | 102.0 | |
| Accrued expenses and other current liabilities | | 1,963.3 | | | 1,980.7 | |
| Accrued payroll and payroll-related expenses | | 910.2 | | | 557.0 | |
| Dividends payable | | 390.8 | | | 387.3 | |
| Short-term deferred revenues | | 203.9 | | | 212.5 | |
| Obligations under reverse repurchase agreements (A) | | 23.5 | | | 13.6 | |
| | | | |
| Short-term debt | | — | | | 1,001.8 | |
| Income taxes payable | | 58.2 | | | 40.1 | |
| | | | |
| Total current liabilities before client funds obligations | | 3,691.0 | | | 4,295.0 | |
| Client funds obligations | | 34,403.8 | | | 25,831.6 | |
| Total current liabilities | | 38,094.8 | | | 30,126.6 | |
| Long-term debt | | 2,985.0 | | | 1,002.8 | |
| Operating lease liabilities | | 343.2 | | | 344.4 | |
| Other liabilities | | 834.1 | | | 837.0 | |
| Deferred income taxes | | 482.9 | | | 731.9 | |
| Long-term deferred revenues | | 362.4 | | | 370.6 | |
| Total liabilities | | 43,102.4 | | | 33,413.3 | |
| | | | |
| Commitments and Contingencies (Note 12) | | | | |
| | | | |
| Stockholders' equity: | | | | |
Preferred stock, $1.00 par value: Authorized, 0.3 shares; issued, none | | — | | | — | |
Common stock, $0.10 par value: authorized,1,000.0 shares; issued, 638.7 shares at June 30, 2021 and June 30, 2020; outstanding, 423.7 and 429.9 shares at June 30, 2021 and June 30, 2020, respectively | | 63.9 | | | 63.9 | |
| Capital in excess of par value | | 1,531.3 | | | 1,333.8 | |
| Retained earnings | | 19,451.1 | | | 18,436.3 | |
Treasury stock - at cost: 215.0 and 208.9 shares at June 30, 2021 and June 30, 2020, respectively | | (15,386.8) | | | (14,067.0) | |
| Accumulated other comprehensive income (loss) | | 10.6 | | | (14.8) | |
| Total stockholders’ equity | | 5,670.1 | | | 5,752.2 | |
| Total liabilities and stockholders’ equity | | $ | 48,772.5 | | | $ | 39,165.5 | |
(A) As of June 30, 2021, $23.5 million of long-term marketable securities have been pledged as collateral under the Company's reverse repurchase agreements. As of June 30, 2020, $13.6 million of long-term marketable securities have been pledged as collateral under the Company's reverse repurchase agreements (see Note 8).
See notes to the Consolidated Financial Statements.
Statements of Consolidated Stockholders' Equity
(In millions, except per share amounts)
| | | | | | | | | | | | | | | | | | | | | | | | | | | | | | | | | | | | | | |
| | Common Stock | | Capital in Excess of Par Value | | Retained Earnings | | Treasury Stock | | Accumulated Other Comprehensive Income/(Loss) |
| | Shares | | Amount | | | | |
| | | | | | | | | | | | |
| Balance at June 30, 2018 | | 638.7 | | | $ | 63.9 | | | $ | 1,014.8 | | | $ | 16,546.6 | | | $ | (12,209.6) | | | $ | (679.8) | |
| Net earnings | | — | | | — | | | — | | | 2,292.8 | | | — | | | — | |
| | | | | | | | | | | | |
| | | | | | | | | | | | |
| | | | | | | | | | | | |
| Other comprehensive income | | — | | | — | | | — | | | — | | | — | | | 422.5 | |
| Stock-based compensation expense | | — | | | — | | | 144.2 | | | — | | | — | | | — | |
| Issuances relating to stock compensation plans | | — | | | — | | | 24.2 | | | — | | | 124.1 | | | — | |
| | | | | | | | | | | | |
Treasury stock acquired (6.5 million shares repurchased) | | — | | | — | | | — | | | — | | | (1,005.0) | | | — | |
| | | | | | | | | | | | |
| | | | | | | | | | | | |
Dividends ($3.06 per share) | | — | | | — | | | — | | | (1,338.8) | | | — | | | — | |
| | | | | | | | | | | | |
| Balance at June 30, 2019 | | 638.7 | | | $ | 63.9 | | | $ | 1,183.2 | | | $ | 17,500.6 | | | $ | (13,090.5) | | | $ | (257.3) | |
| Net earnings | | — | | | — | | | — | | | 2,466.5 | | | — | | | — | |
| | | | | | | | | | | | |
| | | | | | | | | | | | |
| | | | | | | | | | | | |
| Other comprehensive income | | — | | | — | | | — | | | — | | | — | | | 242.5 | |
| Stock-based compensation expense | | — | | | — | | | 117.8 | | | — | | | — | | | — | |
| Issuances relating to stock compensation plans | | — | | | — | | | 32.8 | | | — | | | 112.9 | | | — | |
| | | | | | | | | | | | |
Treasury stock acquired (6.2 million shares repurchased) | | — | | | — | | | — | | | — | | | (1,089.4) | | | — | |
Dividends ($3.52 per share) | | — | | | — | | | — | | | (1,523.9) | | | — | | | — | |
| Other | | — | | | — | | | — | | | (6.9) | | | — | | | — | |
| | | | | | | | | | | | |
| Balance at June 30, 2020 | | 638.7 | | | $ | 63.9 | | | $ | 1,333.8 | | | $ | 18,436.3 | | | $ | (14,067.0) | | | $ | (14.8) | |
| Net earnings | | — | | | — | | | — | | | 2,598.5 | | | — | | | — | |
| | | | | | | | | | | | |
| | | | | | | | | | | | |
| | | | | | | | | | | | |
| Other comprehensive income | | — | | | — | | | — | | | — | | | — | | | 25.4 | |
| Stock-based compensation expense | | — | | | — | | | 156.3 | | | — | | | — | | | — | |
| Issuances relating to stock compensation plans | | — | | | — | | | 41.2 | | | — | | | 111.4 | | | — | |
| | | | | | | | | | | | |
Treasury stock acquired (8.2 million shares repurchased) | | — | | | — | | | — | | | — | | | (1,431.2) | | | — | |
| | | | | | | | | | | | |
| | | | | | | | | | | | |
Dividends ($3.70 per share) | | — | | | — | | | — | | | (1,583.7) | | | — | | | — | |
| | | | | | | | | | | | |
| Balance at June 30, 2021 | | 638.7 | | | $ | 63.9 | | | $ | 1,531.3 | | | $ | 19,451.1 | | | $ | (15,386.8) | | | $ | 10.6 | |
See notes to the Consolidated Financial Statements.
Statements of Consolidated Cash Flows
(In millions)
| | | | | | | | | | | | | | | | | | | | |
| Years ended June 30, | | 2021 | | 2020 | | 2019 |
| Cash Flows from Operating Activities: | | | | | | |
| Net earnings | | $ | 2,598.5 | | | $ | 2,466.5 | | | $ | 2,292.8 | |
| Adjustments to reconcile net earnings to cash flows provided by operating activities: | | | | | | |
| Depreciation and amortization | | 510.7 | | | 480.0 | | | 409.0 | |
| Amortization of deferred contract costs | | 935.3 | | | 915.0 | | | 874.0 | |
| Deferred income taxes | | (251.1) | | | 26.0 | | | 9.3 | |
| Stock-based compensation expense | | 175.3 | | | 130.8 | | | 167.3 | |
| | | | | | |
| Net pension (income)/expense | | (52.8) | | | (11.6) | | | 55.4 | |
| | | | | | |
| Net amortization of premiums and accretion of discounts on available-for-sale securities | | 69.5 | | | 50.2 | | | 50.1 | |
| Impairment of assets | | 19.9 | | | 29.9 | | | 12.1 | |
| Gain on sale of assets | | (9.8) | | | (6.0) | | | (19.8) | |
| | | | | | |
| Other | | 35.2 | | | 65.4 | | | 43.9 | |
| Changes in operating assets and liabilities: | | | | | | |
| Increase in accounts receivable | | (339.8) | | | (113.8) | | | (473.9) | |
| Increase in other assets | | (1,029.4) | | | (910.4) | | | (987.2) | |
| Increase/(Decrease) in accounts payable | | 36.9 | | | (18.3) | | | (10.7) | |
| Increase/(Decrease) in accrued expenses and other liabilities | | 394.9 | | | (77.5) | | | 266.0 | |
| | | | | | |
| | | | | | |
| Net cash flows provided by operating activities | | 3,093.3 | | | 3,026.2 | | | 2,688.3 | |
| | | | | | |
| Cash Flows from Investing Activities: | | | | | | |
| Purchases of corporate and client funds marketable securities | | (9,266.3) | | | (3,905.1) | | | (4,422.6) | |
| Proceeds from the sales and maturities of corporate and client funds marketable securities | | 6,238.4 | | | 7,648.4 | | | 2,909.0 | |
| | | | | | |
| Capital expenditures | | (178.6) | | | (172.7) | | | (162.0) | |
| Additions to intangibles | | (327.3) | | | (443.7) | | | (404.5) | |
| Acquisitions of businesses, net of cash acquired | | — | | | — | | | (125.5) | |
| Proceeds from the sale of property, plant, and equipment and other assets | | 18.8 | | | 29.4 | | | 7.9 | |
| | | | | | |
| | | | | | |
| | | | | | |
| | | | | | |
| | | | | | |
| Net cash flows (used in)/provided by investing activities | | (3,515.0) | | | 3,156.3 | | | (2,197.7) | |
| | | | | | |
| Cash Flows from Financing Activities: | | | | | | |
| Net increase /(decrease) in client funds obligations | | 8,336.2 | | | (3,213.2) | | | 1,696.0 | |
| | | | | | |
| Payments of debt | | (1,001.8) | | | (2.2) | | | (2.1) | |
| Proceeds from the issuance of debt | | 1,981.5 | | | — | | | — | |
| Settlement of cash flow hedges | | (44.6) | | | — | | | — | |
| Repurchases of common stock | | (1,372.3) | | | (1,006.3) | | | (937.7) | |
| Net proceeds from stock purchase plan and stock-based compensation plans | | 104.1 | | | 50.0 | | | 72.9 | |
| | | | | | |
| | | | | | |
| Dividends paid | | (1,575.5) | | | (1,470.5) | | | (1,293.0) | |
| | | | | | |
| Net proceeds/(payments) related to reverse repurchase agreements | | 9.9 | | | (248.4) | | | 262.0 | |
| | | | | | |
| Other | | — | | | — | | | (5.8) | |
| | | | | | |
| Net cash flows provided by/(used in) financing activities | | 6,437.5 | | | (5,890.6) | | | (207.7) | |
| | | | | | |
| Effect of exchange rate changes on cash, cash equivalents, restricted cash, and restricted cash equivalents | | 73.8 | | | (34.5) | | | (28.8) | |
| | | | | | |
| Net change in cash, cash equivalents, restricted cash, and restricted cash equivalents | | 6,089.6 | | | 257.4 | | | 254.1 | |
| | | | | | |
| Cash, cash equivalents, restricted cash, and restricted cash equivalents, beginning of year | | 7,053.6 | | | 6,796.2 | | | 6,542.1 | |
| | | | | | |
| Cash, cash equivalents, restricted cash, and restricted cash equivalents, end of year | | $ | 13,143.2 | | | $ | 7,053.6 | | | $ | 6,796.2 | |
| | | | | | |
| | | | | | |
| | | | | | |
| | | | | | |
| | | | | | |
| Reconciliation of cash, cash equivalents, restricted cash, and restricted cash equivalents to the Consolidated Balance Sheets | | | | | | |
| Cash and cash equivalents | | $ | 2,575.2 | | | $ | 1,908.5 | | | $ | 1,949.2 | |
| Restricted cash and restricted cash equivalents included in funds held for clients (A) | | 10,568.0 | | | 5,145.1 | | | 4,847.0 | |
| Total cash, cash equivalents, restricted cash, and restricted cash equivalents | | $ | 13,143.2 | | | $ | 7,053.6 | | | $ | 6,796.2 | |
| | | | | | |
| Supplemental disclosures of cash flow information: | | | | | | |
| Cash paid for interest | | $ | 53.1 | | | $ | 104.8 | | | $ | 127.5 | |
| Cash paid for income taxes, net of income tax refunds | | $ | 973.7 | | | $ | 677.1 | | | $ | 633.8 | |
(A) See Note 4 for a reconciliation of restricted cash and restricted cash equivalents in funds held for clients on the Consolidated Balance Sheets.
See notes to the Consolidated Financial Statements.
Notes to Consolidated Financial Statements
(Tabular dollars in millions, except per share amounts)
NOTE 1. SUMMARY OF SIGNIFICANT ACCOUNTING POLICIES
A. Basis of Preparation. The accompanying Consolidated Financial Statements and footnotes thereto of Automatic Data Processing, Inc., its subsidiaries and variable interest entity (“ADP” or the “Company”) have been prepared in accordance with accounting principles generally accepted in the United States of America (“U.S. GAAP”). Intercompany balances and transactions have been eliminated in consolidation.
The Company has a grantor trust, which holds the majority of the funds provided by its clients pending remittance to employees of those clients, tax authorities, and other payees. The Company is the sole beneficial owner of the trust. The trust meets the criteria in Accounting Standards Codification (“ASC”) 810, “Consolidation” to be characterized as a variable interest entity (“VIE”). The Company has determined that it has a controlling financial interest in the trust because it has both (1) the power to direct the activities that most significantly impact the economic performance of the trust (including the power to make all investment decisions for the trust) and (2) the right to receive benefits that could potentially be significant to the trust (in the form of investment returns) and therefore, consolidates the trust. Further information on these funds and the Company’s obligations to remit to its clients’ employees, tax authorities, and other payees is provided in Note 4, “Corporate Investments and Funds Held for Clients.”
The preparation of financial statements in conformity with U.S. GAAP requires management to make estimates and
assumptions that affect the assets, liabilities, revenues, expenses, and other comprehensive income that are reported in the
Consolidated Financial Statements and footnotes thereto. Actual results may differ from those estimates.
Certain amounts from the prior year's financial statements have been reclassified in order to conform to the current year's
presentation.
B. Description of Business. The Company is a provider of cloud-based Human Capital Management (“HCM”) solutions. The Company classifies its operations into the following two reportable segments: Employer Services and Professional Employer Organization (“PEO”) Services. The primary components of the “Other” segment are certain corporate overhead charges and expenses that have not been allocated to the reportable segments, including corporate functions, costs related to our transformation office, legal settlements, severance costs, non-recurring gains and losses, the elimination of intercompany transactions, and interest expense.
C. Revenue Recognition. Revenues are primarily attributable to fees for providing services (e.g., Employer Services' payroll processing fees), investment income on payroll funds, payroll tax filing funds, other Employer Services' client-related funds, and fees charged to implement clients on the Company's solutions. The Company enters into agreements for a fixed fee per transaction (e.g., number of payees or number of payrolls processed).
The Company enters into service agreements with clients that include anywhere from one service to a full suite of services. The Company’s agreements vary in duration having a legally enforceable term of 30 days to 5 years. The performance obligations in the agreements are generally combined into one performance obligation, as they are considered a series of distinct services, and are satisfied over time because the client simultaneously receives and consumes the benefits provided as the Company performs the services. The Company uses the output method based on a fixed fee per employee serviced to recognize revenue, as the value to the client of the goods or services transferred to date (e.g. number of payees or number of payrolls processed) appropriately depicts our performance towards complete satisfaction of the performance obligation. The fees are typically billed in the period in which services are performed.
PEO, a component of the HR Outsourcing (“HRO”) strategic pillar, provides a comprehensive human resources outsourcing solution, including offering benefits, providing workers’ compensation insurance, and administering state unemployment insurance, among other human resources functions. Amounts collected from PEO worksite employers include payroll, fees for benefits, and an administrative fee that also includes payroll taxes, fees for workers’ compensation and state unemployment taxes.
The payroll and payroll taxes collected from the worksite employers are presented in revenue net, as the Company does not retain risk and acts as an agent with respect to this aspect of the PEO arrangement. With respect to the payroll and payroll taxes, the worksite employer is primarily responsible for providing the service and has discretion in establishing wages.
The fees collected from the worksite employers for benefits (i.e., PEO zero-margin benefits pass-throughs), workers’ compensation and state unemployment taxes are presented in revenues and the associated costs of benefits, workers’ compensation and state unemployment taxes are included in operating expenses, as the Company does retain risk and acts as a principal with respect to this aspect of the arrangement. With respect to these fees, the Company is primarily responsible for fulfilling the service and has discretion in establishing price.
We recognize client fund interest income on collected but not yet remitted funds held for clients in revenues as earned, as the collection, holding and remittance of these funds are critical components of providing these services.
Set up fees received from certain clients to implement the Company's solutions are considered a material right. Therefore, the Company defers revenue associated with these set up fees and records them over the period in which such clients are expected to benefit from the material right, which is approximately five to seven years.
Collection of consideration the Company expects to receive typically occurs within 30 to 60 days of billing. We assess the collectability of revenues based primarily on the creditworthiness of the customer as determined by credit checks and analysis, as well as the customer's payment history and their intention to pay the consideration.
D. Deferred Costs.
Incremental Costs of Obtaining a Contract
Incremental costs of obtaining a contract (e.g., sales commissions) that are expected to be recovered are capitalized and amortized on a straight-line basis over a period of three to eight years, depending on the Company's business unit. Incremental costs of obtaining a contract include only those costs the Company incurs to obtain a contract that it would not have incurred if the contract had not been obtained. These costs are included in selling, general and administrative expenses.
Costs to fulfill a Contract
The Company capitalizes costs incurred to fulfill its contracts that i) relate directly to the contract ii) are expected to generate resources that will be used to satisfy the Company's performance obligations under the contract and iii) are expected to be recovered through revenue generated under the contract. Costs incurred to implement clients on our solutions (e.g., direct labor) are capitalized and amortized on a straight-line basis over the expected client relationship period if the Company expects to recover those costs. The expected client relationship period ranges from three to eight years. These costs are included in operating expenses.
The Company has estimated the amortization periods for the deferred costs by using its historical retention by business units to estimate the pattern during which the service transfers.
E. Cash and Cash Equivalents. Highly liquid investment securities with a maturity of ninety days or less at the time of purchase are considered cash equivalents. The fair value of our cash and cash equivalents approximates carrying value.
F. Corporate Investments and Funds Held for Clients. All of the Company's marketable securities are considered to be “available-for-sale” and, accordingly, are carried on the Consolidated Balance Sheets at fair value. Unrealized gains and losses, net of the related tax effect, are excluded from earnings and are reported as a separate component of accumulated other comprehensive income (loss) on the Consolidated Balance Sheets until realized. Realized gains and losses from the sale of available-for-sale securities are determined on an aggregate approach basis and are included in other (income)/expense, net on the Statements of Consolidated Earnings.
If the fair value of an available-for-sale debt security is below its amortized cost, the Company assesses whether it intends to sell the security or if it is more likely than not the Company will be required to sell the security before recovery. If either of those two conditions is met, the Company would recognize a charge in earnings equal to the entire difference between the security's amortized cost basis and its fair value. If the Company does not intend to sell a security or it is not more likely than not that it will be required to sell the security before recovery, the unrealized loss is separated into an amount representing the credit loss, which is recognized in earnings, and the amount related to all other factors, which is recognized in accumulated other comprehensive income (loss).
Premiums and discounts are amortized or accreted over the life of the related available-for-sale security as an adjustment to yield using the effective-interest method. Dividend and interest income are recognized when earned.
G. Fair Value Measurements. Fair value is defined as the price that would be received to sell an asset or paid to transfer a liability (an exit price) in an orderly transaction between market participants at the measurement date and is based upon the Company’s principal, or most advantageous, market for a specific asset or liability.
U.S. GAAP provides for a three-level hierarchy of inputs to valuation techniques used to measure fair value, defined as follows:
Level 1 Fair value is determined based upon quoted prices for identical assets or liabilities that are traded in active markets.
Level 2 Fair value is determined based upon inputs other than quoted prices included in Level 1 that are observable for the asset or liability, either directly or indirectly, for substantially the full term of the asset or liability, including:
· quoted prices for similar assets or liabilities in active markets;
· quoted prices for identical or similar assets or liabilities in markets that are not active;
· inputs other than quoted prices that are observable for the asset or liability; or
· inputs that are derived principally from or corroborated by observable market data by correlation or other means.
Level 3 Fair value is determined based upon inputs that are unobservable and reflect the Company’s own assumptions about the assumptions that market participants would use in pricing the asset or liability based upon the best information available in the circumstances (e.g., internally derived assumptions surrounding the timing and amount of expected cash flows).
The Company's corporate investments and funds held for clients (see Note 4) are measured at fair value on a recurring basis as described below. Over 99% of the Company's available-for-sale securities included in Level 2 are valued based on prices obtained from an independent pricing service. To determine the fair value of the Company's Level 2 investments, the independent pricing service uses pricing models for each asset class that are consistent with what other market participants would use, including the market approach. Inputs and assumptions to the pricing model used by the independent pricing service are derived from market observable sources including: benchmark yields, reported trades, broker/dealer quotes, issuer spreads, benchmark securities, bids, offers and other market-related data. Since many fixed income securities do not trade on a daily basis, the independent pricing service applies available information, as applicable, through processes such as benchmark curves, benchmarking of like securities, sector groupings and matrix pricing to prepare valuations. For the purposes of valuing the Company’s asset-backed securities and mortgage-backed securities that are included within Other securities in Note 4, the independent pricing service includes additional inputs to the model such as monthly payment information, new issue data, and collateral performance. For the purposes of valuing the Company’s Municipal bonds, the independent pricing service includes quoted prices for similar assets, benchmark yield curves, and market corroborated inputs. While the Company is not provided access to the proprietary models of the third party pricing service, each quarterly reporting period, the Company reviews the inputs utilized by the independent pricing service and compares the valuations received from the independent pricing service to valuations from at least one other observable source for reasonableness. The Company has not adjusted the prices obtained from the independent pricing service and the Company believes the prices received from the independent pricing service are representative of the prices that would be received to sell the assets at the measurement date (exit price). The Company had no available-for-sale securities included in Level 1 and Level 3 at June 30, 2021.
In fiscal 2021, the Company issued two series of fixed-rate notes with staggered maturities of 7 and 10-years totaling $2.0 billion, and in fiscal 2016 the Company issued fixed rate notes with a 10-year maturity of $1.0 billion, for an aggregate principal amount of $3.0 billion (collectively the “Notes”). The fair value of the Notes are estimated in Note 9 utilizing a variety of inputs obtained from an independent pricing service, including benchmark yields, reported trades, non-binding broker/dealer quotes, issuer spreads, two-sided markets, benchmark securities, bids, offers, and reference data. The Notes are senior unsecured obligations, and interest is payable in arrears, semi-annually. The Company reviews the values generated by the independent pricing service for reasonableness by comparing the valuations received from the independent pricing service to valuations from at least one other observable source. The Company has not adjusted the prices obtained from the independent pricing service.
The Company's assessment of the significance of a particular input to the fair value measurement requires judgment and may affect the classification of assets and liabilities within the fair value hierarchy. In certain instances, the inputs used to measure fair value may meet the definition of more than one level of the fair value hierarchy. The significant input with the lowest level priority is used to determine the applicable level in the fair value hierarchy.
H. Property, Plant and Equipment. Property, plant and equipment is stated at cost less accumulated depreciation on the Consolidated Balance Sheets. Depreciation is recognized over the estimated useful lives of the assets using the straight-line method. Leasehold improvements are amortized over the shorter of the term of the lease or the estimated useful lives of the
improvements. The estimated useful lives of assets are primarily as follows: | | | | | |
| Data processing equipment | 5 to 10 years |
| Buildings | 20 to 40 years |
| Furniture and fixtures | 4 to 7 years |
I. Leases. Operating lease right-of-use (“ROU”) assets and operating lease liabilities are recognized at the lease commencement date based on the present value of the lease payments over the lease term. The lease liabilities are measured by discounting future lease payments at the Company’s collateralized incremental borrowing rate for financing instruments of a similar term, unless the implicit rate is readily determinable. ROU assets also include adjustments related to prepaid or deferred lease payments and lease incentives. Lease ROU assets are amortized over the life of the lease and tested for impairment in the same manner as long-lived assets as described below.
J. Goodwill. Goodwill represents the excess of purchase price over the value assigned to the net tangible and identifiable intangible assets of businesses acquired. Goodwill is tested annually for impairment or more frequently when an event or circumstance indicates that goodwill might be impaired.
The Company’s annual goodwill impairment assessment as of June 30, 2021 was performed for all reporting units using a quantitative approach by comparing the fair value of each reporting unit to its carrying value. We estimated the fair value of each reporting unit using, as appropriate, the income approach, which is derived using the present value of future cash flows discounted at a risk-adjusted weighted-average cost of capital, and the market approach, which is based upon using market multiples of companies in similar lines of business. Significant assumptions used in determining the fair value of our reporting units include projected revenue growth rates, profitability projections, working capital assumptions, the weighted average cost of capital, the determination of appropriate market comparison companies, and terminal growth rates. Several of these assumptions including projected revenue growth rates and profitability projections are dependent on our ability to upgrade, enhance, and expand our technology and services to meet client needs and preferences. As such, the determination of fair value requires management to make significant estimates and assumptions related to forecasts of future revenue and operating margins. Based upon the quantitative assessment, the Company has concluded that goodwill is not impaired.
K. Impairment of Long-Lived Assets. Long-lived assets are reviewed for impairment whenever events or changes in circumstances indicate that the carrying amount of an asset may not be recoverable. Recoverability of assets to be held and used is measured by a comparison of the carrying amount of an asset to estimated undiscounted future cash flows expected to be generated by the asset. If the carrying amount of an asset exceeds its estimated future cash flows, an impairment charge is recognized for the amount by which the carrying amount of the asset exceeds the fair value of the asset.
L. Foreign Currency. The net assets of the Company's foreign subsidiaries are translated into U.S. dollars based on exchange rates in effect for each period, and revenues and expenses are translated at average exchange rates in the periods. Gains or losses from balance sheet translation are included in accumulated other comprehensive income (loss) on the Consolidated Balance Sheets. Currency transaction gains or losses, which are included in the results of operations, are not significant for all periods presented.
M. Foreign Currency Risk Management Programs and Derivative Financial Instruments. The Company transacts business in various foreign jurisdictions and is therefore exposed to market risk from changes in foreign currency exchange rates that could impact its consolidated results of operations, financial position, or cash flows. The Company manages its exposure to these market risks through its regular operating and financing activities and, when deemed appropriate, through the use of derivative financial instruments. The Company does not use derivative financial instruments for trading purposes.
N. Earnings per Share (“EPS”). The Company computes EPS in accordance with ASC 260.
The calculations of basic and diluted EPS are as follows: | | | | | | | | | | | | | | | | | | | | | | | | | | |
| Years ended June 30, | | Basic | | Effect of Employee Stock Option Shares | | Effect of
Employee
Restricted
Stock
Shares | | Diluted |
| 2021 | | | | | | | | |
| Net earnings | | $ | 2,598.5 | | | | | | | $ | 2,598.5 | |
| Weighted average shares (in millions) | | 426.3 | | | 0.8 | | | 1.0 | | | 428.1 | |
| EPS | | $ | 6.10 | | | | | | | $ | 6.07 | |
| | | | | | | | |
| 2020 | | | | | | | | |
| Net earnings | | $ | 2,466.5 | | | | | | | $ | 2,466.5 | |
| Weighted average shares (in millions) | | 430.8 | | | 0.9 | | | 1.0 | | | 432.7 | |
| EPS | | $ | 5.73 | | | | | | | $ | 5.70 | |
| | | | | | | | |
| 2019 | | | | | | | | |
| Net earnings | | $ | 2,292.8 | | | | | | | $ | 2,292.8 | |
| Weighted average shares (in millions) | | 435.0 | | | 1.0 | | | 1.6 | | | 437.6 | |
| EPS | | $ | 5.27 | | | | | | | $ | 5.24 | |
Options to purchase 1.1 million, 1.2 million, and 0.7 million shares of common stock for fiscal 2021, 2020, and 2019, respectively, were excluded from the calculation of diluted earnings per share because their inclusion would have been anti-dilutive.
O. Stock-Based Compensation. The Company recognizes stock-based compensation expense in net earnings based on the fair value of the award on the date of the grant, and in the case of international units settled in cash, adjusts this fair value based on changes in the Company's stock price during the vesting period. Restricted stock units and restricted stock awards are valued based on the closing price of the Company's common stock on the date of the grant and, in the case of performance based restricted stock units and restricted stock, are adjusted for changes to probabilities of achieving performance targets. International restricted stock units are settled in cash and are marked-to-market based on changes in the Company's stock price. See Note 10 for additional information on the Company's stock-based compensation programs.
P. Internal Use Software. Expenditures for major software purchases and software developed or obtained for internal use are capitalized and amortized generally over a three to five-year period on a straight-line basis. Software developed as part of the Company's next-generation platforms are depreciated over ten years. The Company begins to capitalize costs incurred for computer software developed for internal use when the preliminary development efforts are successfully completed, management has authorized and committed to funding the project, and it is probable that the project will be completed and the software will be used as intended. Capitalization ceases when a computer software project is substantially complete and ready for its intended use.
The Company's policy provides for the capitalization of external direct costs of materials and services associated with developing or obtaining internal use computer software. In addition, the Company also capitalizes certain payroll and payroll-related costs for employees who are directly associated with internal use computer software projects. The amount of capitalizable payroll costs with respect to these employees is limited to the time directly spent on such projects. Costs associated with preliminary project stage activities, training, maintenance, and all other post-implementation stage activities are expensed as incurred. The Company also expenses internal costs related to minor upgrades and enhancements, as it is impractical to separate these costs from normal maintenance activities.
Fees related to cloud-based subscriptions for which the Company has the right to take possession of the software at any time during the hosting period (without significant penalty) and can run the software on internal hardware, or through contract with a third party vendor to host the software, is recognized as an intangible asset and capitalized following the Internal Use Software guidance under ASC 350-40. Subscriptions where the Company accesses the software through the cloud but cannot take
possession of the software during the hosting period is treated as a service contract, and as such hosting fees are treated as expense.
Q. Acquisitions. Assets acquired and liabilities assumed in business combinations are recorded on the Company’s Consolidated Balance Sheets as of the respective acquisition dates based upon their estimated fair values at such dates. The results of operations of businesses acquired by the Company are included in the Statements of Consolidated Earnings since their respective dates of acquisition. The excess of the purchase price over the estimated fair values of the underlying assets acquired and liabilities assumed is allocated to goodwill. In certain circumstances, the allocations of the excess purchase price are based upon preliminary estimates and assumptions and subject to revision when the Company receives final information, including appraisals and other analysis. Accordingly, the measurement period for such purchase price allocations will end when the information, or the facts and circumstances, becomes available, but will not exceed twelve months.
R. Income Taxes. The objectives of accounting for income taxes are to recognize the amount of taxes payable or refundable for the current year and deferred tax liabilities and assets for the future tax consequences of events that have been recognized in an entity's financial statements or tax returns. Judgment is required in addressing the future tax consequences of events that have been recognized in our Consolidated Financial Statements or tax returns (e.g., realization of deferred tax assets, changes in tax laws or interpretations thereof). The Company is subject to the continuous examination of our income tax returns by the Internal Revenue Service (“IRS”) and other tax authorities. A change in the assessment of the outcomes of such matters could materially impact our Consolidated Financial Statements.
There is a financial statement recognition threshold and measurement attribute for tax positions taken or expected to be taken in a tax return. Specifically, the likelihood of an entity's tax benefits being sustained must be “more likely than not,” assuming that these positions will be examined by taxing authorities with full knowledge of all relevant information prior to recording the related tax benefit in the financial statements. If a tax position drops below the “more likely than not” standard, the benefit can no longer be recognized. Assumptions, judgment, and the use of estimates are required in determining if the “more likely than not” standard has been met when developing the provision for income taxes. As of June 30, 2021 and 2020, the Company's liabilities for unrecognized tax benefits, which include interest and penalties, were $99.9 million and $62.3 million, respectively.
If certain pending tax matters settle within the next twelve months, the total amount of unrecognized tax benefits may increase or decrease for all open tax years and jurisdictions. See Note 11 for additional details.
S. Workers' Compensation Costs. The Company employs a third-party actuary to assist in determining the estimated claim liability related to workers' compensation and employer's liability coverage for PEO Services worksite employees. In estimating ultimate loss rates, we utilize historical loss experience, exposure data, and actuarial judgment, together with a range of inputs which are primarily based upon the worksite employee's job responsibilities, their location, the historical frequency and severity of workers' compensation claims, and an estimate of future cost trends. For each reporting period, changes in the actuarial assumptions resulting from changes in actual claims experience and other trends are incorporated into our workers' compensation claims cost estimates. PEO Services has secured a workers’ compensation and employer’s liability insurance policy that caps the exposure for each claim at $1 million per occurrence and has also secured aggregate stop loss insurance that caps aggregate losses at a certain level in fiscal years 2012 and prior from an admitted and licensed insurance company of AIG. The Company has obtained approximately $273 million of irrevocable standby letters of credit in favor of licensed insurance companies of AIG to secure TotalSource workers’ compensation obligations if ADP were to fail to reimburse AIG for workers’ compensation payments. The Company had no drawdowns during June 30, 2021 and 2020 under the letters of credit.
Additionally, starting in fiscal 2013, ADP Indemnity paid premiums to enter into reinsurance arrangements with ACE American Insurance Company a wholly-owned subsidiary of Chubb Limited to cover substantially all losses incurred by the Company up to the $1 million per occurrence related to workers' compensation and employer's liability deductible reimbursement insurance protection for PEO services worksite employees. Each of these reinsurance arrangements limit our overall exposure incurred up to a certain limit. The Company believes the likelihood of ultimate losses exceeding this limit is remote. ADP Indemnity paid a premium of $240 million to enter into a reinsurance arrangement with Chubb Limited to cover substantially all losses incurred by ADP Indemnity for the fiscal 2021 policy year up to $1 million per occurrence. ADP Indemnity paid a premium of $260 million in July 2021 to enter into a reinsurance arrangement to cover substantially all losses for the fiscal 2022 policy year on terms substantially similar to the fiscal 2021 policy.
T. Contingencies. In the normal course of business, the Company is subject to loss contingencies, such as claims and assessments arising from litigation and other legal proceedings, contractual indemnities, and tax matters. Accruals for loss contingencies are recorded when the Company determines that it is both probable that a liability has been incurred and the amount of loss can be reasonably estimated. If the estimate of the amount of the loss is a range and some amount within the range appears to be a better estimate than any other amount within the range, that amount is accrued as a liability. If no amount
within the range is a better estimate than any other amount, the minimum amount of the range is accrued as a liability. These accruals are adjusted periodically as assessments change or additional information becomes available. The loss contingencies are included in Selling, general and administrative expenses.
If no accrual is made for a loss contingency because the amount of loss cannot be reasonably estimated, the Company will disclose contingent liabilities when there is at least a reasonable possibility that a loss or an additional loss may have been incurred.
Legal fees and other costs related to litigation and other legal proceedings or services are expensed as incurred and are included in Selling, general and administrative expenses.
Any claim for insurance recovery is recognized only when realization becomes probable.
U. Recently Issued Accounting Pronouncements.
Recently Adopted Accounting Pronouncements
Effective July 1, 2020, the Company adopted accounting standard update (“ASU”) 2018-13, “Fair Value Measurement.” The update modifies the disclosure requirements on fair value measurements. The adoption of ASU 2018-13 modified the disclosures in Note 6 but did not have an impact on the Company's consolidated results of operations, financial condition, or cash flows.
Effective July 1, 2020, the Company adopted ASU 2016-13, “Financial Instruments - Credit Losses (Topic 326): Measurement of Credit Losses on Financial Instruments.” This update introduces the current expected credit loss (“CECL”) model, which requires an entity to measure credit losses based on expected losses rather than incurred losses for certain financial instruments and financial assets, including trade receivables. The adoption of ASU 2016-13 did not have a material impact on the Company's consolidated results of operations, financial condition, or cash flows.
Recently Issued Accounting Pronouncements
The following table summarizes recent ASU's issued by the Financial Accounting Standards Board (“FASB”) which have been assessed and are applicable to the Company:
| | | | | | | | | | | |
| Standard | Description | Effective Date | Effect on Financial Statements or Other Significant Matters |
| | | |
| ASU 2018-14 Compensation-Retirement Benefits-Defined Benefit Plans | This update modifies the disclosure requirements for employers that sponsor defined benefit pension or other post-retirement plans by removing and adding certain disclosures for these plans. The eliminated disclosures include (a) the amounts in accumulated other comprehensive income expected to be recognized in net periodic benefit costs over the next fiscal year, and (b) the effects of a one percentage point change in assumed health care cost trend rates on the net periodic benefit costs and the benefit obligation for post-retirement health care benefits. Additional disclosures include descriptions of significant gains and losses affecting the benefit obligation for the period. The amendments in ASU 2018-14 would need to be applied on a retrospective basis. | July 1, 2021
(Fiscal 2022) | The adoption of this guidance will modify disclosures but will not have an impact on the Company's consolidated results of operations, financial condition, or cash flows.
|
| | | |
| | | |
| | | |
| | | |
NOTE 2. REVENUE
Based upon similar operational and economic characteristics, the Company’s revenues are disaggregated by its three strategic pillars: Human Capital Management (“HCM”), HR Outsourcing (“HRO”), and Global (“Global”) Solutions, with separate disaggregation for PEO zero-margin benefits pass-through revenues and client fund interest revenues. The Company believes
these revenue categories depict how the nature, amount, timing, and uncertainty of its revenue and cash flows are affected by economic factors.
The following tables provide details of revenue by our strategic pillars and includes a reconciliation to the Company’s reportable segments:
| | | | | | | | | | | | | | | | | | | | | |
| | | | | | | |
| | | Years Ended |
| | | June 30, |
| Types of Revenues | | | | | 2021 | | 2020 | | 2019 |
| HCM | | | | | $ | 6,629.1 | | | $ | 6,540.9 | | | $ | 6,441.8 | |
| HRO, excluding PEO zero-margin benefits pass-throughs | | | | | 2,694.8 | | | 2,543.2 | | | 2,444.4 | |
| PEO zero-margin benefits pass-throughs | | | | | 3,092.0 | | | 2,907.7 | | | 2,647.5 | |
| Global | | | | | 2,167.1 | | | 2,052.8 | | | 2,014.6 | |
| Interest on funds held for clients | | | | | 422.4 | | | 545.2 | | | 561.9 | |
| Total Revenues | | | | | $ | 15,005.4 | | | $ | 14,589.8 | | | $ | 14,110.2 | |
Reconciliation of disaggregated revenue to our reportable segments for the fiscal year ended June 30, 2021: | | | | | | | | | | | | | | | | | | | | | | | |
| Types of Revenues | Employer Services | | PEO | | Other | | Total |
| HCM | $ | 6,634.6 | | | $ | — | | | $ | (5.5) | | | $ | 6,629.1 | |
| HRO, excluding PEO zero-margin benefits pass-throughs | 975.0 | | | 1,722.4 | | | (2.6) | | | 2,694.8 | |
| PEO zero-margin benefits pass-throughs | — | | | 3,092.0 | | | — | | | 3,092.0 | |
| Global | 2,167.1 | | | — | | | — | | | 2,167.1 | |
| Interest on funds held for clients | 418.5 | | | 3.9 | | | — | | | 422.4 | |
| Total Segment Revenues | $ | 10,195.2 | | | $ | 4,818.3 | | | $ | (8.1) | | | $ | 15,005.4 | |
Reconciliation of disaggregated revenue to our reportable segments for the fiscal year ended June 30, 2020: | | | | | | | | | | | | | | | | | | | | | | | |
| Types of Revenues | Employer Services | | PEO | | Other | | Total |
| HCM | $ | 6,546.4 | | | $ | — | | | $ | (5.5) | | | $ | 6,540.9 | |
| HRO, excluding PEO zero-margin benefits pass-throughs | 947.2 | | | 1,598.8 | | | (2.8) | | | 2,543.2 | |
| PEO zero-margin benefits pass-throughs | — | | | 2,907.7 | | | — | | | 2,907.7 | |
| Global | 2,052.8 | | | — | | | — | | | 2,052.8 | |
| Interest on funds held for clients | 540.2 | | | 5.0 | | | — | | | 545.2 | |
| Total Segment Revenues | $ | 10,086.6 | | | $ | 4,511.5 | | | $ | (8.3) | | | $ | 14,589.8 | |
Reconciliation of disaggregated revenue to our reportable segments for the fiscal year ended June 30, 2019: | | | | | | | | | | | | | | | | | | | | | | | |
| Types of Revenues | Employer Services | | PEO | | Other | | Total |
| HCM | $ | 6,447.5 | | | $ | — | | | $ | (5.7) | | | $ | 6,441.8 | |
| HRO, excluding PEO zero-margin benefits pass-throughs | 924.0 | | | 1,525.0 | | | (4.6) | | | 2,444.4 | |
| PEO zero-margin benefits pass-throughs | — | | | 2,647.5 | | | — | | | 2,647.5 | |
| Global | 2,014.6 | | | — | | | — | | | 2,014.6 | |
| Interest on funds held for clients | 556.7 | | | 5.2 | | | — | | | 561.9 | |
| Total Segment Revenues | $ | 9,942.8 | | | $ | 4,177.7 | | | $ | (10.3) | | | $ | 14,110.2 | |
Contract Balances
The timing of revenue recognition for our HCM, HRO and Global Solutions is consistent with the invoicing of clients, as invoicing occurs in the period the services are provided. Therefore, the Company does not recognize a contract asset or liability resulting from the timing of revenue recognition and invoicing.
Changes in deferred revenue related to set up fees for the twelve months ended June 30, 2021 were as follows: | | | | | |
| Contract Liability | |
| Contract liability, July 1, 2020 | $ | 522.7 | |
| Recognition of revenue included in beginning of year contract liability | (163.3) | |
| Contract liability, net of revenue recognized on contracts during the period | 130.2 | |
| Currency translation adjustments | 26.5 | |
| Contract liability, June 30, 2021 | $ | 516.1 | |
Deferred costs
The balance is as follows: | | | | | | | | | | | | | | |
| | | | |
| June 30, | | 2021 | | 2020 |
| Deferred costs to obtain a contract | | $ | 1,055.7 | | | $ | 977.8 | |
| Deferred costs to fulfill a contract | | 1,442.5 | | | 1,423.8 | |
| Total deferred contract costs (1) | | $ | 2,498.2 | | | $ | 2,401.6 | |
(1) The amount of total deferred costs amortized during the twelve months ended June 30, 2021, June 30, 2020, and June 30, 2019 were $935.3 million, $915.0 million, and $874.0 million, respectively.
Deferred costs are periodically reviewed for impairment. There were no impairment losses incurred during the period.
NOTE 3. OTHER (INCOME)/EXPENSE, NET
Other (income)/expense, net consists of the following: | | | | | | | | | | | | | | | | | | | | |
| Years ended June 30, | | 2021 | | 2020 | | 2019 |
| Interest income on corporate funds | | $ | (36.5) | | | $ | (84.5) | | | $ | (97.6) | |
| | | | | | |
| | | | | | |
| Realized (gains)/losses on available-for-sale securities, net | | (11.3) | | | (12.9) | | | 0.9 | |
| | | | | | |
| | | | | | |
| Impairment of assets | | 19.9 | | | 29.9 | | | 12.1 | |
| Gain on sale of assets | | (8.1) | | | (5.8) | | | (4.1) | |
| Gain on sale of investment | | (1.7) | | | (0.2) | | | (15.7) | |
| | | | | | |
| Non-service components of pension income, net (see Note 10) | | (58.6) | | | (74.5) | | | (6.7) | |
| Other (income)/expense, net | | $ | (96.3) | | | $ | (148.0) | | | $ | (111.1) | |
In fiscal 2021, the Company recorded impairment charges of $19.9 million which is comprised of a write down of $10.5 million related to internally developed software which was determined to have no future use, impairment charges of $9.4 million related to operating right-of-use assets and certain related fixed assets associated with vacating certain leased locations early, and recognizing certain owned facilities at fair value given intent to sell and accordingly classified as held for sale.
In fiscal 2020, the Company recorded impairment charges of $25.3 million as a result of recognizing certain owned facilities at fair value given intent to sell and accordingly classified as held for sale. In addition, the Company vacated certain leased locations early and recorded total impairment charges of $4.6 million related to operating right-of-use assets and certain related fixed assets associated with the vacated locations.
In fiscal 2019, the Company wrote down $12.1 million of internally developed software which was determined to have no future use due to redundant software identified as part of a recent acquisition.
In fiscal 2019, the Company recognized a gain of $15.7 million in relation to the sale of an investment held at cost acquired in
prior years and subsequently sold during fiscal 2019.
NOTE 4. CORPORATE INVESTMENTS AND FUNDS HELD FOR CLIENTS
Corporate investments and funds held for clients at June 30, 2021 and 2020 were as follows:
| | | | | | | | | | | | | | | | | | | | | | | |
| | June 30, 2021 |
| Amortized
Cost | | Gross
Unrealized
Gains | | Gross
Unrealized
Losses | | Fair Value (A) |
| Type of issue: | | | | | | | |
| Money market securities, cash and other cash equivalents | $ | 13,143.2 | | | $ | — | | | $ | — | | | $ | 13,143.2 | |
| Available-for-sale securities: | | | | | | | |
| Corporate bonds | 11,732.3 | | | 321.9 | | | (38.5) | | | 12,015.7 | |
| U.S. Treasury securities | 4,036.9 | | | 64.8 | | | (9.3) | | | 4,092.4 | |
| Asset-backed securities | 2,279.8 | | | 60.9 | | | (0.9) | | | 2,339.8 | |
Canadian government obligations and Canadian government agency obligations | 1,542.3 | | | 15.0 | | | (9.0) | | | 1,548.3 | |
| U.S. government agency securities | 1,446.3 | | | 22.5 | | | (9.4) | | | 1,459.4 | |
| Canadian provincial bonds | 956.3 | | | 22.7 | | | (5.3) | | | 973.7 | |
| Commercial mortgage-backed securities | 793.4 | | | 41.2 | | | — | | | 834.6 | |
| Other securities | 1,082.2 | | | 30.9 | | | (5.3) | | | 1,107.8 | |
| | | | | | | |
| Total available-for-sale securities | 23,869.5 | | | 579.9 | | | (77.7) | | | 24,371.7 | |
| | | | | | | |
| Total corporate investments and funds held for clients | $ | 37,012.7 | | | $ | 579.9 | | | $ | (77.7) | | | $ | 37,514.9 | |
(A) Included within available-for-sale securities are corporate investments with fair values of $33.9 million and funds held for clients with fair values of $24,337.8 million. All available-for-sale securities are included in Level 2 of the fair value hierarchy. | | | | | | | | | | | | | | | | | | | | | | | |
| | June 30, 2020 |
| Amortized
Cost | | Gross
Unrealized
Gains | | Gross
Unrealized
Losses | | Fair Value (B) |
| Type of issue: | | | | | | | |
| Money market securities, cash and other cash equivalents | $ | 7,053.6 | | | $ | — | | | $ | — | | | $ | 7,053.6 | |
| Available-for-sale securities: | | | | | | | |
| Corporate bonds | 9,188.7 | | | 473.4 | | | — | | | 9,662.1 | |
| Asset-backed securities | 3,274.6 | | | 96.0 | | | (0.5) | | | 3,370.1 | |
U.S. Treasury securities | 3,580.6 | | | 120.8 | | | — | | | 3,701.4 | |
| U.S. government agency securities | 1,128.2 | | | 35.6 | | | — | | | 1,163.8 | |
Canadian government obligations and Canadian government agency obligations | 1,018.7 | | | 23.1 | | | — | | | 1,041.8 | |
| Commercial mortgage-backed securities | 814.3 | | | 53.9 | | | — | | | 868.2 | |
| Canadian provincial bonds | 676.6 | | | 33.6 | | | — | | | 710.2 | |
| Other securities | 1,018.1 | | | 41.1 | | | (0.2) | | | 1,059.0 | |
| | | | | | | |
| Total available-for-sale securities | 20,699.8 | | | 877.5 | | | (0.7) | | | 21,576.6 | |
| | | | | | | |
| Total corporate investments and funds held for clients | $ | 27,753.4 | | | $ | 877.5 | | | $ | (0.7) | | | $ | 28,630.2 | |
(B) Included within available-for-sale securities are corporate investments with fair values of $13.6 million and funds held for clients with fair values of $21,563.0 million. All available-for-sale securities were included in Level 2 of the fair value hierarchy.
For a description of the fair value hierarchy and the Company's fair value methodologies, including the use of an independent third-party pricing service, see Note 1 “Summary of Significant Accounting Policies.” The Company concurred with and did not adjust the prices obtained from the independent pricing service. The Company had no available-for-sale securities included in Level 1 or Level 3 at June 30, 2021.
The unrealized losses and fair values of available-for-sale securities that have been in an unrealized loss position for a period of less than and greater than 12 months as of June 30, 2021, are as follows:
| | | | | | | | | | | | | | | | | | | | | | | | | | | | | | | | | | | |
| June 30, 2021 |
| Securities in unrealized loss position less than
12 months | | Securities in unrealized loss position greater than 12 months | | Total |
| Gross Unrealized
Losses | | Fair Market
Value | | Gross Unrealized
Losses | | Fair Market
Value | | Gross
Unrealized
Losses | | Fair
Market Value |
| Corporate bonds | $ | (38.5) | | | $ | 3,539.6 | | | $ | — | | | $ | — | | | $ | (38.5) | | | $ | 3,539.6 | |
| U.S. Treasury securities | (9.3) | | | 580.9 | | | — | | | — | | | (9.3) | | | 580.9 | |
| Asset-backed securities | (0.9) | | | 160.9 | | | — | | | — | | | (0.9) | | | 160.9 | |
Canadian government obligations and Canadian government agency obligations | (9.0) | | | 721.3 | | | — | | | — | | | (9.0) | | | 721.3 | |
U.S. government agency securities | (9.4) | | | 749.7 | | | — | | | — | | | (9.4) | | | 749.7 | |
| Canadian provincial bonds | (5.3) | | | 253.7 | | | — | | | — | | | (5.3) | | | 253.7 | |
| Commercial mortgage-backed securities | — | | | 16.7 | | | — | | | — | | | — | | | 16.7 | |
| Other securities | (5.2) | | | 308.5 | | | (0.1) | | | 1.9 | | | (5.3) | | | 310.4 | |
| | $ | (77.6) | | | $ | 6,331.3 | | | $ | (0.1) | | | $ | 1.9 | | | $ | (77.7) | | | $ | 6,333.2 | |
The unrealized losses and fair values of available-for-sale securities that have been in an unrealized loss position for a period of less than and greater than 12 months as of June 30, 2020 are as follows:
| | | | | | | | | | | | | | | | | | | | | | | | | | | | | | | | | | | |
| June 30, 2020 |
| Securities in unrealized loss position less than
12 months | | Securities in unrealized loss position greater than 12 months | | Total |
| Gross Unrealized
Losses | | Fair Market
Value | | Gross Unrealized
Losses | | Fair Market
Value | | Gross
Unrealized
Losses | | Fair
Market Value |
| Corporate bonds | $ | — | | | $ | — | | | $ | — | | | $ | — | | | $ | — | | | $ | — | |
| Asset-backed securities | (0.5) | | | 43.9 | | | — | | | — | | | (0.5) | | | 43.9 | |
U.S. Treasury securities | — | | | 2.0 | | | — | | | — | | | — | | | 2.0 | |
U.S. government agency securities | — | | | — | | | — | | | — | | | — | | | — | |
Canadian government obligations and Canadian government agency obligations | — | | | — | | | — | | | — | | | — | | | — | |
| Commercial mortgage-backed securities | — | | | — | | | — | | | 1.5 | | | — | | | 1.5 | |
| Canadian provincial bonds | — | | | — | | | — | | | — | | | — | | | — | |
| Other securities | (0.2) | | | 17.1 | | | — | | | — | | | (0.2) | | | 17.1 | |
| | $ | (0.7) | | | $ | 63.0 | | | $ | — | | | $ | 1.5 | | | $ | (0.7) | | | $ | 64.5 | |
At June 30, 2021, Corporate bonds include investment-grade debt securities, with a wide variety of issuers, industries, and sectors, primarily carry credit ratings of A and above, and have maturities ranging from July 2021 through July 2031.
At June 30, 2021, asset-backed securities include AAA-rated senior tranches of securities with predominately prime collateral of fixed-rate auto loan, credit card, equipment lease and rate reduction receivables with fair values of $1,247.4 million, $759.5 million, $263.5 million, and $68.7 million, respectively. These securities are collateralized by the cash flows of the underlying
pools of receivables. The primary risk associated with these securities is the collection risk of the underlying receivables. All collateral on such asset-backed securities has performed as expected through June 30, 2021.
At June 30, 2021, U.S. government agency securities primarily include debt directly issued by Federal Farm Credit Banks and Federal Home Loan Banks with fair values of $827.3 million and $536.8 million, respectively. U.S. government agency securities represent senior, unsecured, non-callable debt that primarily carry ratings of Aaa by Moody's and AA+ by Standard & Poor's, with maturities ranging from July 2021 through June 2031.
At June 30, 2021, U.S. government agency commercial mortgage-backed securities of $834.6 million include those issued by Federal Home Loan Mortgage Corporation and Federal National Mortgage Association.
At June 30, 2021, other securities primarily include municipal bonds, diversified with a variety of issuers, with credit ratings of A and above, with fair values of $569.5 million and AA-rated United Kingdom Gilt securities of $237.5 million.
Classification of corporate investments on the Consolidated Balance Sheets is as follows: | | | | | | | | | | | | | | |
| June 30, | | 2021 | | 2020 |
| Corporate investments: | | | | |
| Cash and cash equivalents | | $ | 2,575.2 | | | $ | 1,908.5 | |
| Short-term marketable securities (a) | | 10.4 | | | — | |
| Long-term marketable securities (b) | | 23.5 | | | 13.6 | |
| Total corporate investments | | $ | 2,609.1 | | | $ | 1,922.1 | |
(a) - Short-term marketable securities are included within Other current assets on the Consolidated Balance Sheets.
(b) - Long-term marketable securities are included within Other assets on the Consolidated Balance Sheets.
Funds held for clients represent assets that, based upon the Company's intent, are restricted for use solely for the purposes of satisfying the obligations to remit funds relating to the Company’s payroll and payroll tax filing services, which are classified as client funds obligations on our Consolidated Balance Sheets.
Funds held for clients have been invested in the following categories: | | | | | | | | | | | | | | |
| June 30, | | 2021 | | 2020 |
| Funds held for clients: | | | | |
| Restricted cash and cash equivalents held to satisfy client funds obligations | | $ | 10,568.0 | | | $ | 5,145.1 | |
| Restricted short-term marketable securities held to satisfy client funds obligations | | 3,743.3 | | | 5,541.2 | |
| Restricted long-term marketable securities held to satisfy client funds obligations | | 20,594.5 | | | 16,021.8 | |
| Total funds held for clients | | $ | 34,905.8 | | | $ | 26,708.1 | |
Client funds obligations represent the Company's contractual obligations to remit funds to satisfy clients' payroll, tax and other payee payment obligations and are recorded on the Consolidated Balance Sheets at the time that the Company impounds funds from clients. The client funds obligations represent liabilities that will be repaid within one year of the balance sheet date. The Company has reported client funds obligations as a current liability on the Consolidated Balance Sheets totaling $34,403.8 million and $25,831.6 million as of June 30, 2021 and 2020, respectively. The Company has classified funds held for clients as a current asset since these funds are held solely for the purposes of satisfying the client funds obligations. Of the Company’s funds held for clients at June 30, 2021, $31,092.3 million are held in the grantor trust. The liabilities held within the trust are intercompany liabilities to other Company subsidiaries and eliminate in consolidation.
The Company has reported the cash flows related to the purchases of corporate and client funds marketable securities and related to the proceeds from the sales and maturities of corporate and client funds marketable securities on a gross basis in the investing section of the Statements of Consolidated Cash Flows. The Company has reported the cash and cash equivalents related to client funds investments with original maturities of ninety days or less, within the beginning and ending balances of cash, cash equivalents, restricted cash, and restricted cash equivalents. The Company has reported the cash flows related to the cash received from and paid on behalf of clients on a net basis within net increase in client funds obligations in the financing activities section of the Statements of Consolidated Cash Flows.
Approximately 72% of the available-for-sale securities held a AAA-rating or AA-rating at June 30, 2021, as rated by Moody's, Standard & Poor's, DBRS for Canadian dollar-denominated securities, and Fitch for asset-backed and commercial mortgage-backed securities. All available-for-sale securities were rated as investment grade at June 30, 2021.
Expected maturities of available-for-sale securities at June 30, 2021 are as follows: | | | | | |
| One year or less | $ | 3,753.8 | |
| One year to two years | 4,644.3 | |
| Two years to three years | 2,940.3 | |
| Three years to four years | 3,393.5 | |
| After four years | 9,639.8 | |
| |
| Total available-for-sale securities | $ | 24,371.7 | |
NOTE 5. PROPERTY, PLANT AND EQUIPMENT
Property, plant and equipment at cost and accumulated depreciation at June 30, 2021 and 2020 are as follows: | | | | | | | | | | | | | | |
| June 30, | | 2021 | | 2020 |
| Property, plant and equipment: | | | | |
| Land and buildings | | $ | 686.5 | | | $ | 737.2 | |
| Data processing equipment | | 902.0 | | | 847.9 | |
| Furniture, leaseholds and other | | 656.0 | | | 643.6 | |
| | 2,244.5 | | | 2,228.7 | |
| Less: accumulated depreciation | | (1,560.0) | | | (1,524.8) | |
| Property, plant and equipment, net | | $ | 684.5 | | | $ | 703.9 | |
Depreciation of property, plant and equipment was $183.3 million, $192.8 million, and $180.6 million for fiscal 2021, 2020 and 2019, respectively.
The Company has certain assets classified as held for sale given intent to sell. The fair value of these assets was approximately $29.8 million and $6.7 million as of June 30, 2021and 2020, respectively, and it is not material for reclassification separately on the Consolidated Balance Sheets.
NOTE 6. LEASES
The Company records leases on the Consolidated Balance Sheets as operating lease ROU assets, records the current portion of operating lease liabilities within accrued expenses and other current liabilities and, separately, records long-term operating lease liabilities. The difference between total ROU assets and total lease liabilities are primarily attributable to pre-payments of our obligations and the recognition of various lease incentives.
The Company has entered into operating lease agreements for facilities and equipment. The Company's leases have remaining lease terms of up to approximately eleven years.
The components of operating lease expense were as follows: | | | | | | | | | | | | | | | |
| | | Year ended |
| | | June 30, |
| | | 2021 | | 2020 |
| Operating lease cost | | | $ | 157.8 | | | $ | 163.7 | |
| Short-term lease cost | | | 1.3 | | | 6.1 | |
| Variable lease cost | | | 7.6 | | | 6.7 | |
| Total operating lease cost | | | $ | 166.7 | | | $ | 176.5 | |
| | | | | |
The following table provides supplemental cash flow information related to the Company's leases: | | | | | | | | | | | |
| Year ended |
| June 30, |
| 2021 | | 2020 |
| Cash paid for operating lease liabilities | $ | 142.2 | | | $ | 224.7 | |
| Operating lease ROU assets obtained in exchange for new operating lease liabilities | $ | 120.2 | | | $ | 160.4 | |
| | | |
| | | |
Other information related to our operating lease liabilities is as follows:
| | | | | | | | | | | |
| June 30, | | June 30, |
| 2021 | | 2020 |
| Weighted-average remaining lease term (in years) | 6 | | 6 |
| Weighted-average discount rate | 2.2 | % | | 2.3 | % |
| Current operating lease liability | $ | 94.7 | | | $ | 95.5 | |
As of June 30, 2021, maturities of operating lease liabilities are as follows: | | | | | |
| |
| Twelve months ending June 30, 2022 | $ | 103.2 | |
| Twelve months ending June 30, 2023 | 90.4 | |
| Twelve months ending June 30, 2024 | 70.3 | |
| Twelve months ending June 30, 2025 | 55.3 | |
| Twelve months ending June 30, 2026 | 47.2 | |
| Thereafter | 100.9 | |
| Total undiscounted lease obligations | 467.3 | |
| Less: Imputed interest | (29.4) | |
| Net lease obligations | $ | 437.9 | |
NOTE 7. GOODWILL AND INTANGIBLE ASSETS, NET
Changes in goodwill for the fiscal years ended June 30, 2021 and 2020 are as follows: | | | | | | | | | | | | | | | | | | | |
| Employer
Services | | PEO
Services | | | | Total |
| Balance at June 30, 2019 | $ | 2,318.2 | | | $ | 4.8 | | | | | $ | 2,323.0 | |
| Additions and other adjustments | (2.5) | | | — | | | | | (2.5) | |
| Currency translation adjustments | (11.1) | | | — | | | | | (11.1) | |
| | | | | | | |
| Balance at June 30, 2020 | $ | 2,304.6 | | | $ | 4.8 | | | | | $ | 2,309.4 | |
| | | | | | | |
| Currency translation adjustments | 29.0 | | | — | | | | | 29.0 | |
| | | | | | | |
| Balance at June 30, 2021 | $ | 2,333.6 | | | $ | 4.8 | | | | | $ | 2,338.4 | |
Components of intangible assets, net, are as follows: | | | | | | | | | | | | | | |
| June 30, | | 2021 | | 2020 |
| | | | |
| Intangible assets: | | | | |
| Software and software licenses | | $ | 2,950.8 | | | $ | 2,719.1 | |
| Customer contracts and lists | | 1,062.2 | | | 1,021.2 | |
| Other intangibles | | 239.0 | | | 239.2 | |
| | | 4,252.0 | | | 3,979.5 | |
| Less accumulated amortization: | | | | |
| Software and software licenses | | (2,090.4) | | | (1,912.0) | |
| Customer contracts and lists | | (723.4) | | | (628.3) | |
| Other intangibles | | (228.1) | | | (223.4) | |
| | | (3,041.9) | | | (2,763.7) | |
| | | | |
| Intangible assets, net | | $ | 1,210.1 | | | $ | 1,215.8 | |
Other intangibles consist primarily of purchased rights, purchased content, trademarks and trade names (acquired directly or through acquisitions). All intangible assets have finite lives and, as such, are subject to amortization. The weighted average remaining useful life of the intangible assets is 6 years (6 years for software and software licenses, 4 years for customer contracts and lists, and 3 years for other intangibles). Amortization of intangible assets was $327.4 million, $287.2 million, and $228.4 million for fiscal 2021, 2020, and 2019, respectively.
Estimated future amortization expenses of the Company's existing intangible assets are as follows: | | | | | |
| | Amount |
| Twelve months ending June 30, 2022 | $ | 312.0 | |
| Twelve months ending June 30, 2023 | $ | 249.6 | |
| Twelve months ending June 30, 2024 | $ | 200.1 | |
| Twelve months ending June 30, 2025 | $ | 139.2 | |
| Twelve months ending June 30, 2026 | $ | 89.4 | |
NOTE 8. SHORT TERM FINANCING
The Company has a $3.75 billion, 364-day credit agreement that matures in June 2022 with a one year term-out option. The Company also has a $2.75 billion five year credit facility that matures in June 2024 that also contains an accordion feature under which the aggregate commitment can be increased by $500 million, subject to the availability of additional commitments. In addition, the Company has a five year $3.2 billion credit facility maturing in June 2026 that contains an accordion feature under which the aggregate commitment can be increased by $500 million, subject to the availability of additional commitments. The interest rate applicable to committed borrowings is tied to LIBOR, the effective federal funds rate, or the prime rate depending on the notification provided by the Company to the syndicated financial institutions prior to borrowing. The Company is also required to pay facility fees on the credit agreements. The primary uses of the credit facilities are to provide liquidity to the commercial paper program and funding for general corporate purposes, if necessary. The Company had no borrowings through June 30, 2021 and 2020 under the credit agreements.
The Company's U.S. short-term funding requirements related to client funds are sometimes obtained on an unsecured basis through the issuance of commercial paper, rather than liquidating previously-collected client funds that have already been invested in available-for-sale securities. This commercial paper program provides for the issuance of up to $9.7 billion in aggregate maturity value. The Company’s commercial paper program is rated A-1+ by Standard & Poor’s, Prime-1 (“P-1”) by Moody’s and F1+ by Fitch. These ratings denote the highest quality commercial paper securities. Maturities of commercial paper can range from overnight to up to 364 days. At June 30, 2021 and June 30, 2020, the Company had no commercial paper borrowing outstanding. Details of the borrowings under the commercial paper program are as follows:
| | | | | | | | | | | | | | | | | |
| | | |
| | | |
| Years ended June 30, | | | | | 2021 | | 2020 |
| Average daily borrowings (in billions) | | | | | $ | 1.6 | | | $ | 2.7 | |
| Weighted average interest rates | | | | | 0.1 | % | | 1.6 | % |
| Weighted average maturity (approximately in days) | | | | | 1 day | | 2 days |
The Company’s U.S., Canadian and United Kingdom short-term funding requirements related to client funds obligations are sometimes obtained on a secured basis through the use of reverse repurchase agreements, which are collateralized principally by government and government agency securities, rather than liquidating previously-collected client funds that have already been invested in available-for-sale securities. These agreements generally have terms ranging from overnight to up to five business days. At June 30, 2021 and 2020, there were $23.5 million and $13.6 million, respectively, of outstanding obligations related to the reverse repurchase agreements. Details of the reverse repurchase agreements are as follows:
| | | | | | | | | | | | | | | | | |
| | | |
| | | |
| Years ended June 30, | | | | | 2021 | | 2020 |
| Average outstanding balances | | | | | $ | 136.7 | | | $ | 263.4 | |
| Weighted average interest rates | | | | | 0.2 | % | | 1.6 | % |
NOTE 9. DEBT
In fiscal 2021, the Company issued two series of fixed-rate notes with staggered maturities of 7 and 10-years totaling $2.0 billion, and in fiscal 2016 the Company issued fixed rate notes with a 10-year maturity of $1.0 billion, for an aggregate principal amount of $3.0 billion (collectively the “Notes”). The Notes are senior unsecured obligations, and interest is payable in arrears, semi-annually.
In August 2020, the Company redeemed $1.0 billion of senior notes bearing a fixed interest rate of 2.25%. In addition, the Company terminated several derivative contracts in place to hedge exposure in changes in benchmark interest rates for the senior notes issued in August 2020 with an aggregate notional amount totaling $1.0 billion (of which $400.0 million were entered into during fiscal year 2020 and $600.0 million were entered into on the day of issuance). Since these derivative contracts were classified as cash flow hedges, the unamortized loss of $43.6 million was deferred in accumulated other comprehensive income (loss) and will be amortized to earnings over the life of the senior notes due in 2030 as the interest payments are made.
The principal amounts and associated effective interest rates of the Notes and other debt as of June 30, 2021 and 2020 are as follows:
| | | | | | | | | | | | | | | | | | | | |
| Debt instrument | | Effective Interest Rate | | June 30, 2021 | | June 30, 2020 |
Fixed-rate 2.250% notes due September 15, 2020 | | 2.37% | | $ | — | | | $ | 1,000.0 | |
Fixed-rate 3.375% notes due September 15, 2025 | | 3.47% | | 1,000.0 | | | 1,000.0 | |
Fixed-rate 1.250% notes due September 1, 2030 | | 1.83% | | 1,000.0 | | | — | |
Fixed-rate 1.700% notes due May 15, 2028 | | 1.85% | | 1,000.0 | | | — | |
| Other | | | | 6.9 | | | 8.4 | |
| | | | 3,006.9 | | | 2,008.4 | |
| Less: current portion (a) | | | | (1.2) | | | (1,001.8) | |
| Less: unamortized discount and debt issuance costs | | | | (20.7) | | | (3.8) | |
| Total long-term debt | | | | $ | 2,985.0 | | | $ | 1,002.8 | |
(a) - Current portion of long-term debt as of June 30, 2021 is included within Accrued expenses and other current liabilities on the Consolidated Balance Sheets.
The effective interest rates for the Notes include the interest on the Notes and amortization of the discount and debt issuance costs.
As of June 30, 2021, the fair value of the Notes, based on Level 2 inputs, was $3,060.4 million. For a description of the fair value hierarchy and the Company's fair value methodologies, including the use of an independent third-party pricing service, see Note 1 “Summary of Significant Accounting Policies.”
NOTE 10. EMPLOYEE BENEFIT PLANS
A. Stock-based Compensation Plans. Stock-based compensation consists of the following:
•Stock Options. Stock options are granted to employees at exercise prices equal to the fair market value of the Company's common stock on the dates of grant. Stock options generally vest ratably over 4 years and have a term of 10 years. Compensation expense is measured based on the fair value of the stock option on the grant date and recognized on a straight-line basis over the vesting period. Stock options are generally forfeited if the employee ceases to be employed by the Company prior to vesting. The Company determines the fair value of stock options issued using a binomial option-pricing model. The binomial option-pricing model considers a range of assumptions related to volatility, dividend yield, risk-free interest rate, and employee exercise behavior. Expected volatilities utilized in the binomial option-pricing model are based on a combination of implied market volatilities, historical volatility of the Company's stock price, and other factors. Similarly, the dividend yield is based on historical experience and expected future changes. The risk-free rate is derived from the U.S. Treasury yield curve in effect at the time of grant. The binomial option-pricing model also incorporates exercise and forfeiture assumptions based on an analysis of historical data. The expected life of a stock option grant is derived from the output of the binomial model and represents the period of time that options granted are expected to be outstanding.
•Restricted Stock.
•Time-Based Restricted Stock and Time-Based Restricted Stock Units. Time-based restricted stock and time-based restricted stock units generally vest ratably over 3 years. Awards are forfeited if the employee ceases to be employed by the Company prior to vesting.
Time-based restricted stock cannot be transferred during the vesting period. Compensation expense relating to the issuance of time-based restricted stock is measured based on the fair value of the award on the grant date and recognized on a straight-line basis over the vesting period. Dividends are paid on shares awarded under the time-based restricted stock program.
Time-based restricted stock units are settled in cash and cannot be transferred during the vesting period. Compensation expense relating to the issuance of time-based restricted stock units is recorded over the vesting period and is initially based on the fair value of the award on the grant date and is subsequently remeasured at each reporting date during the vesting period based on the change in the ADP stock price. No dividend equivalents are paid on units awarded under the time-based restricted stock unit program.
•Performance-Based Restricted Stock and Performance-Based Restricted Stock Units. Performance-based restricted stock and performance-based restricted stock units generally vest over a one to three year performance period and a subsequent service period of up to 38 months. Under these programs, the Company communicates “target awards” at the beginning of the performance period with possible payouts at the end of the performance period ranging from 0% to 150% of the “target awards.” Awards are generally forfeited if the employee ceases to be employed by the Company prior to vesting.
Performance-based restricted stock cannot be transferred during the vesting period. Compensation expense relating to the issuance of performance-based restricted stock is recognized over the vesting period based on the fair value of the award on the grant date with subsequent adjustments to the number of shares awarded during the performance period based on probable and actual performance against targets. After the performance period, if the performance targets are achieved, employees are eligible to receive dividends during the remaining vesting period on shares awarded under the performance-based restricted stock program.
Performance-based restricted stock units cannot be transferred and are settled in either cash or stock, depending on the employee's home country. Compensation expense relating to the issuance of performance-based restricted stock units settled in cash is recognized over the vesting period initially based on the fair value of the award on the grant date with subsequent adjustments to the number of units awarded during the performance period based on probable and actual performance against targets. In addition, compensation expense is remeasured at each reporting period during the vesting period based on the change in the ADP stock price. Compensation expense relating to the issuance of performance-based restricted stock units settled in stock is recorded over the vesting period based on the fair value of the award on the grant date with subsequent adjustments to the number of units awarded based on the probable and actual performance against targets. Dividend equivalents are paid on awards under the performance-based restricted stock unit program.
•Employee Stock Purchase Plan. The Company offers an employee stock purchase plan that allows eligible employees to purchase shares of common stock at a price equal to 95% of the market value for the Company's common stock on the last day of the offering period. This plan has been deemed non-compensatory and, therefore, no compensation expense has been recorded.
The Company currently utilizes treasury stock to satisfy stock option exercises, issuances under the Company's employee stock purchase plan, and restricted stock awards. From time to time, the Company may repurchase shares of its common stock under its authorized share repurchase program. The Company repurchased 8.2 million shares in fiscal 2021 as compared to 6.2 million shares repurchased in fiscal 2020. The Company considers several factors in determining when to execute share repurchases, including, among other things, actual and potential acquisition activity, cash balances and cash flows, issuances due to employee benefit plan activity, and market conditions. Cash payments related to the settlement of vested time-based restricted stock units and performance-based restricted stock units were approximately 10.7 million, 34.6 million, and 26.6 million during fiscal years 2021, 2020, and 2019, respectively.
The following table represents stock-based compensation expense and related income tax benefits in each of fiscal 2021, 2020, and 2019, respectively: | | | | | | | | | | | | | | | | | | | | |
| Years ended June 30, | | 2021 | | 2020 | | 2019 |
| Operating expenses | | $ | 17.9 | | | $ | 13.7 | | | $ | 16.9 | |
| Selling, general and administrative expenses | | 133.9 | | | 99.1 | | | 131.2 | |
| System development and programming costs | | 23.5 | | | 18.0 | | | 19.2 | |
| Total pretax stock-based compensation expense | | $ | 175.3 | | | $ | 130.8 | | | $ | 167.3 | |
| | | | | | |
| Income tax benefit | | $ | 43.0 | | | $ | 32.2 | | | $ | 41.6 | |
As of June 30, 2021, the total remaining unrecognized compensation cost related to non-vested stock options, restricted stock units, and restricted stock awards amounted to $19.2 million, $43.5 million, and $113.1 million, respectively, which will be amortized over the weighted-average remaining requisite service periods of 2.2 years, 1.6 years, and 1.8 years, respectively.
In fiscal 2021, the following activity occurred under the Company’s existing plans.
Stock Options: | | | | | | | | | | | | | | |
| | Number
of Options
(in thousands) | | Weighted
Average Price
(in dollars) |
| Options outstanding at July 1, 2020 | | 3,510 | | | $ | 126 | |
| Options granted | | 1,153 | | | $ | 139 | |
| Options exercised | | (865) | | | $ | (102) | |
| Options forfeited/cancelled | | (93) | | | $ | (147) | |
| Options outstanding at June 30, 2021 | | 3,705 | | | $ | 135 | |
| Options exercisable at June 30, 2021 | | 1,433 | | | $ | 117 | |
| Shares available for future grants, end of year | | 22,985 | | | |
| Shares reserved for issuance under stock option plans, end of year | | 26,690 | | | |
Time-Based Restricted Stock and Time-Based Restricted Stock Units: | | | | | | | | | | | | | | |
| | Number of Shares
(in thousands) | | Number of Units
(in thousands) |
| Restricted shares/units outstanding at July 1, 2020 | | 905 | | | 180 | |
| Restricted shares/units granted | | 685 | | | 105 | |
| Restricted shares/units vested | | (375) | | | (74) | |
| Restricted shares/units forfeited | | (74) | | | (11) | |
| Restricted shares/units outstanding at June 30, 2021 | | 1,141 | | | 200 | |
Performance-Based Restricted Stock and Performance-Based Restricted Stock Units: | | | | | | | | | | | | | | |
| | Number of Shares
(in thousands) | | Number of Units
(in thousands) |
| Restricted shares/units outstanding at July 1, 2020 | | 179 | | | 851 | |
| Restricted shares/units granted | | 156 | | | 177 | |
| Restricted shares/units vested | | (70) | | | (290) | |
| Restricted shares/units forfeited | | (18) | | | (38) | |
| Restricted shares/units outstanding at June 30, 2021 | | 247 | | | 700 | |
The aggregate intrinsic value of outstanding stock options and exercisable stock options as of June 30, 2021 was $237.0 million and $116.9 million, respectively, which have a remaining life of 7 years and 6 years, respectively. The aggregate intrinsic value for stock options exercised in fiscal 2021, 2020, and 2019 was $58.6 million, $78.0 million, and $78.2 million, respectively.
The fair value for stock options granted was estimated at the date of grant using the following assumptions: | | | | | | | | | | | | | | | | | |
| | 2021 | | 2020 | | 2019 |
| Risk-free interest rate | 0.1 | % | | 1.4 | % | | 2.7 | % |
| Dividend yield | 2.6 | % | | 1.9 | % | | 1.9 | % |
| Weighted average volatility factor | 25.8 | % | | 19.3 | % | | 20.9 | % |
| Weighted average expected life (in years) | 5.4 | | 5.4 | | 5.4 |
| Weighted average fair value (in dollars) | $ | 21.66 | | | $ | 24.40 | | | $ | 26.60 | |
The weighted average fair values of shares granted were as follows: | | | | | | | | | | | | | | | | | | | | |
| Year ended June 30, | | 2021 | | 2020 | | 2019 |
| (in dollars) | | | | | | |
| Performance-based restricted stock | | $ | 138.53 | | | $ | 169.84 | | | $ | 146.93 | |
| Time-based restricted stock | | $ | 141.52 | | | $ | 167.16 | | | $ | 146.80 | |
B. Pension Plans
The Company has a defined benefit cash balance pension plan. The U.S. pension plan, which is currently closed to new entrants, was frozen effective July 1, 2020. As of July 1, 2020 and onward, participants will retain their accrued benefits and will not accrue any future benefits due to pay and/or service. The plan interest credit rate varies from year-to-year based on the ten-year U.S. Treasury rate. The Company's policy is to make contributions within the range determined by generally accepted actuarial principles.
The Company also has various retirement plans for its non-U.S. employees and maintains a Supplemental Officers Retirement Plan (“SORP”). The SORP is a defined benefit plan pursuant to which the Company pays supplemental pension benefits to certain corporate officers upon retirement based upon the officers' years of service and compensation. The SORP, which is currently closed to new entrants, was frozen effective July 1, 2019, with no future accruals due to pay and/or service.
A June 30 measurement date was used in determining the Company's benefit obligations and fair value of plan assets.
The Company is required to (a) recognize in its Consolidated Balance Sheets an asset for a plan's net overfunded status or a liability for a plan's net underfunded status, (b) measure a plan's assets and its obligations that determine its funded status as of the end of the employer's fiscal year, and (c) recognize changes in the funded status of a defined benefit plan in the year in which the changes occur in accumulated other comprehensive income (loss).
The Company's pension plans' funded status as of June 30, 2021 and 2020 is as follows: | | | | | | | | | | | | | | |
| June 30, | | 2021 | | 2020 |
| | | | |
| Change in plan assets: | | | | |
| Fair value of plan assets at beginning of year | | $ | 1,988.8 | | | $ | 1,910.5 | |
| Actual return on plan assets | | 385.2 | | | 172.1 | |
| Employer contributions | | 10.9 | | | 9.8 | |
| Currency translation adjustments | | 21.8 | | | (3.5) | |
| Benefits paid | | (100.4) | | | (100.1) | |
| Fair value of plan assets at end of year | | $ | 2,306.3 | | | $ | 1,988.8 | |
| | | | |
| Change in benefit obligation: | | | | |
| Benefit obligation at beginning of year | | $ | 2,180.1 | | | $ | 1,951.2 | |
| Service cost | | 4.9 | | | 59.7 | |
| Interest cost | | 51.4 | | | 61.8 | |
| Actuarial loss | | (11.8) | | | 210.7 | |
| Currency translation adjustments | | 25.1 | | | (3.6) | |
| Plan changes | | — | | | 0.4 | |
| | | | |
| Benefits paid | | (100.4) | | | (100.1) | |
| Projected benefit obligation at end of year | | $ | 2,149.3 | | | $ | 2,180.1 | |
| | | | |
| Funded status - plan assets less benefit obligations | | $ | 157.0 | | | $ | (191.3) | |
The amounts recognized on the Consolidated Balance Sheets as of June 30, 2021 and 2020 consisted of: | | | | | | | | | | | | | | |
| June 30, | | 2021 | | 2020 |
| | | | |
| Noncurrent assets | | $ | 320.5 | | | $ | 19.8 | |
| Current liabilities | | (6.0) | | | (5.4) | |
| Noncurrent liabilities | | (157.5) | | | (205.7) | |
| Net amount recognized | | $ | 157.0 | | | $ | (191.3) | |
The accumulated benefit obligation for all defined benefit pension plans was $2,135.0 million and $2,167.5 million at June 30, 2021 and 2020, respectively.
The Company's pension plans with accumulated benefit obligations in excess of plan assets as of June 30, 2021 and 2020 had the following projected benefit obligation, accumulated benefit obligation, and fair value of plan assets: | | | | | | | | | | | | | | |
| June 30, | | 2021 | | 2020 |
| | | | |
| Projected benefit obligation | | $ | 182.2 | | | $ | 2,046.5 | |
| Accumulated benefit obligation | | $ | 168.3 | | | $ | 2,034.4 | |
| Fair value of plan assets | | $ | 18.7 | | | $ | 1,835.4 | |
The components of net pension (income)/ expense were as follows: | | | | | | | | | | | | | | | | | | | | |
| | | 2021 | | 2020 | | 2019 |
| Service cost – benefits earned during the period | | $ | 4.9 | | | $ | 59.7 | | | $ | 59.8 | |
| Interest cost on projected benefits | | 51.4 | | | 61.8 | | | 78.6 | |
| Expected return on plan assets | | (121.3) | | | (117.9) | | | (131.8) | |
| Net amortization and deferral | | 9.3 | | | 6.8 | | | 0.1 | |
| Special termination benefits, plan curtailments, and settlement charges | | 2.9 | | | (22.0) | | | 48.7 | |
| Net pension (income)/expense | | $ | (52.8) | | | $ | (11.6) | | | $ | 55.4 | |
As a result of the freeze of the U.S. pension plan, described above, the Company recognized $17.0 million of prior service credits during fiscal 2020 within Other (income)/expense, net, which were previously recognized within accumulated other comprehensive income (loss) (see Note 13).
In fiscal 2018, the Company offered a Voluntary Early Retirement Program (“VERP”) to certain eligible U.S. based associates aged 55 or above with at least 10 years of service. In fiscal 2019, the Company recorded $48.2 million of non-cash settlement charges and special termination benefits.
The net actuarial loss and prior service cost for the defined benefit pension plans that are included in accumulated other comprehensive income (loss) that have not yet been recognized as components of net periodic benefit cost are $145.8 million and $2.5 million, respectively, at June 30, 2021. There is no remaining transition obligation for the defined benefit pension plans included in accumulated other comprehensive income (loss). The estimated net actuarial loss and prior service cost for the defined benefit pension plans that will be amortized from accumulated other comprehensive income (loss) into net periodic pension cost in fiscal 2022 are $6.6 million and $0.3 million, respectively.
Assumptions used to determine the actuarial present value of benefit obligations were: | | | | | | | | | | | | | | |
| Years ended June 30, | | 2021 | | 2020 |
| | | | |
| Discount rate | | 2.55 | % | | 2.45 | % |
| Increase in compensation levels | | N/A | | 4.00 | % |
Assumptions used to determine the net pension expense generally were: | | | | | | | | | | | | | | | | | | | | |
| Years ended June 30, | | 2021 | | 2020 | | 2019 |
| | | | | | |
| Discount rate | | 2.45 | % | | 3.40 | % | | 4.10 | % |
| Expected long-term rate of return on assets | | 6.75 | % | | 6.75 | % | | 6.75 | % |
| Increase in compensation levels | | 4.00 | % | | 4.00 | % | | 4.00 | % |
The discount rate is based upon published rates for high-quality fixed-income investments that produce cash flows that approximate the timing and amount of expected future benefit payments.
The expected long-term rate of return on assets is determined based on historical and expected future rates of return on plan assets considering the target asset mix and the long-term investment strategy.
Plan Assets
The Company's pension plans' asset allocations at June 30, 2021 and 2020 by asset category were as follows: | | | | | | | | | | | | | | |
| | 2021 | | 2020 |
| | | | |
| Cash and cash equivalents | | 1 | % | | 1 | % |
| Fixed income securities | | 38 | % | | 44 | % |
| U.S. equity securities | | 19 | % | | 17 | % |
| International equity securities | | 15 | % | | 13 | % |
| Global equity securities | | 27 | % | | 25 | % |
| | 100 | % | | 100 | % |
The Company's pension plans' asset investment strategy is designed to ensure prudent management of assets, consistent with long-term return objectives and the prompt fulfillment of all pension plan obligations. The investment strategy and asset mix were developed in coordination with an asset liability study conducted by external consultants to maximize the funded ratio with the least amount of volatility.
The pension plans' assets are currently invested in various asset classes with differing expected rates of return, correlations, and volatilities, including large capitalization and small capitalization U.S. equities, international equities, U.S. fixed income securities, and cash.
The target asset allocation ranges for the U.S. plan are generally as follows: | | | | | |
| U.S. fixed income securities | 35% - 45% |
| U.S. equity securities | 14% - 24% |
| International equity securities | 11% - 21% |
| Global equity securities | 20% - 30% |
As of June 30, 2021 and June 30, 2020, the U.S. pension plan asset allocation is within the target ranges.
The pension plans' fixed income portfolio is designed to match the duration and liquidity characteristics of the pension plans' liabilities. In addition, the pension plans invest only in investment-grade debt securities to ensure preservation of capital. The pension plans' equity portfolios are subject to diversification guidelines to reduce the impact of losses in single investments. Investment managers are prohibited from buying or selling commodities and from the. short selling of securities.
None of the pension plans' assets are directly invested in the Company's stock, although the pension plans may hold a minimal amount of Company stock to the extent of the Company's participation in equity indices.
The pension plans' investments included in Level 1 are valued using closing prices for identical instruments that are traded on active exchanges. The pension plans' investments included in Level 2 are valued utilizing inputs obtained from an independent pricing service, which are reviewed by the Company for reasonableness. To determine the fair value of our Level 2 plan assets, a variety of inputs are utilized, including benchmark yields, reported trades, non-binding broker/dealer quotes, issuer spreads, two-sided markets, benchmark securities, bids, offers, reference data, new issue data, and monthly payment information. The pension plans have no Level 3 investments at June 30, 2021.
The following table presents the investments of the pension plans measured at fair value at June 30, 2021: | | | | | | | | | | | | | | | | | | | | | | | | | | |
| | Level 1 | | Level 2 | | Level 3 | | Total |
| | | | | | | | |
| Commingled trusts | | $ | — | | | $ | 1,060.2 | | | $ | — | | | $ | 1,060.2 | |
| Government securities | | — | | | 426.2 | | | — | | | 426.2 | |
| Mutual funds | | 10.2 | | | 345.7 | | | — | | | 355.9 | |
| Corporate and municipal bonds | | — | | | 417.2 | | | — | | | 417.2 | |
| Mortgage-backed security bonds | | — | | | 38.6 | | | — | | | 38.6 | |
| Total pension asset investments | | $ | 10.2 | | | $ | 2,287.9 | | | $ | — | | | $ | 2,298.1 | |
In addition to the investments in the above table, the pension plans also held cash and cash equivalents of $8.2 million as of June 30, 2021, which have been classified as Level 1 in the fair value hierarchy.
The following table presents the investments of the pension plans measured at fair value at June 30, 2020: | | | | | | | | | | | | | | | | | | | | | | | | | | |
| | Level 1 | | Level 2 | | Level 3 | | Total |
| | | | | | | | |
| Commingled trusts | | $ | — | | | $ | 798.6 | | | $ | — | | | $ | 798.6 | |
| U.S. government securities | | — | | | 414.7 | | | — | | | 414.7 | |
| Mutual funds | | 7.3 | | | 274.8 | | | — | | | 282.1 | |
| Corporate and municipal bonds | | — | | | 434.8 | | | — | | | 434.8 | |
| Mortgage-backed security bonds | | — | | | 38.5 | | | — | | | 38.5 | |
| Total pension asset investments | | $ | 7.3 | | | $ | 1,961.4 | | | $ | — | | | $ | 1,968.7 | |
In addition to the investments in the above table, the pension plans also held cash and cash equivalents of $20.1 million as of June 30, 2020, which have been classified as Level 1 in the fair value hierarchy.
Contributions
During fiscal 2021, the Company contributed $10.9 million to the pension plans. The Company expects to contribute $10.0 million to the pension plans during fiscal 2022.
Estimated Future Benefit Payments
The benefits expected to be paid in each year from fiscal 2022 to the year ended June 30, 2026 are $120.4 million, $112.9 million, $120.0 million, $111.0 million, and $115.7 million, respectively. The aggregate benefits expected to be paid in the five fiscal years from the year ended June 30, 2027 to the year ended June 30, 2031 are $643.7 million. The expected benefits to be paid are based on the same assumptions used to measure the Company's pension plans' benefit obligations at June 30, 2021 and includes estimated future employee service.
C. Retirement and Savings Plan. The Company has a 401(k) retirement and savings plan, which allows eligible employees to contribute up to 50% of their compensation annually and allows highly compensated employees to contribute up to 12% of their compensation annually. The Company matches a portion of employee contributions, which amounted to approximately $130.8 million, $112.7 million, and $110.9 million for the calendar years ended December 31, 2020, 2019, and 2018, respectively.
NOTE 11. INCOME TAXES
Earnings before income taxes shown below are based on the geographic location to which such earnings are attributable. | | | | | | | | | | | | | | | | | | | | |
| Years ended June 30, | | 2021 | | 2020 | | 2019 |
| | | | | | |
| Earnings before income taxes: | | | | | | |
| United States | | $ | 3,010.9 | | | $ | 2,815.4 | | | $ | 2,584.6 | |
| Foreign | | 350.3 | | | 367.2 | | | 421.0 | |
| | $ | 3,361.2 | | | $ | 3,182.6 | | | $ | 3,005.6 | |
The provision (benefit) for income taxes consists of the following components: | | | | | | | | | | | | | | | | | | | | |
| Years ended June 30, | | 2021 | | 2020 | | 2019 |
| | | | | | |
| Current: | | | | | | |
| Federal | | $ | 749.3 | | | $ | 468.3 | | | $ | 464.3 | |
| Foreign | | 121.9 | | | 119.5 | | | 129.1 | |
| State | | 142.6 | | | 102.3 | | | 110.1 | |
| Total current | | 1,013.8 | | | 690.1 | | | 703.5 | |
| | | | | | |
| Deferred: | | | | | | |
| Federal | | (182.6) | | | 23.7 | | | 7.9 | |
| Foreign | | (19.1) | | | (5.4) | | | 12.8 | |
| State | | (49.4) | | | 7.7 | | | (11.4) | |
| Total deferred | | (251.1) | | | 26.0 | | | 9.3 | |
| Total provision for income taxes | | $ | 762.7 | | | $ | 716.1 | | | $ | 712.8 | |
A reconciliation between the Company's effective tax rate and the U.S. federal statutory rate is as follows: | | | | | | | | | | | | | | | | | | | | | | | | | | | | | | | | | | | | | | |
| Years ended June 30, | | 2021 | | % | | 2020 | | % | | 2019 | | % |
| | | | | | | | | | | | |
| Provision for taxes at U.S. statutory rate | | $ | 705.9 | | | 21.0 | | | $ | 668.4 | | | 21.0 | | | $ | 631.2 | | | 21.0 | |
| | | | | | | | | | | | |
| Increase/(decrease) in provision from: | | | | | | | | | | | | |
| | | | | | | | | | | | |
| State taxes, net of federal tax benefit | | 67.2 | | | 2.0 | | | 85.6 | | | 2.7 | | | 80.7 | | | 2.7 | |
| Valuation allowance release on foreign tax credits | | — | | | — | | | (20.3) | | | (0.6) | | | — | | | — | |
| | | | | | | | | | | | |
| | | | | | | | | | | | |
| | | | | | | | | | | | |
| | | | | | | | | | | | |
| | | | | | | | | | | | |
| | | | | | | | | | | | |
| | | | | | | | | | | | |
| Foreign rate differential | | 34.0 | | | 1.0 | | | 44.9 | | | 1.4 | | | 46.9 | | | 1.6 | |
| Excess tax benefit - Stock-based compensation | | (8.8) | | | (0.2) | | | (26.9) | | | (0.8) | | | (29.8) | | | (1.0) | |
| Other | | (35.6) | | | (1.1) | | | (35.6) | | | (1.2) | | | (16.2) | | | (0.6) | |
| | $ | 762.7 | | | 22.7 | | | $ | 716.1 | | | 22.5 | | | $ | 712.8 | | | 23.7 | |
The effective tax rate in fiscal 2021 and 2020 was 22.7% and 22.5%, respectively. The increase in the effective tax rate is primarily due to combined benefits from a valuation allowance release related to foreign tax credit carryforwards and a foreign tax law change during fiscal 2020 as well as a decrease in the excess tax benefit on stock-based compensation, partially offset by favorable adjustments to prior year tax liabilities during fiscal 2021.
The effective tax rate for fiscal 2020 and 2019 was 22.5% and 23.7%, respectively. The decrease in the effective tax rate is primarily due to the release of a valuation allowance related to foreign tax credit carryforwards, a reduction in the operating tax rate due to the mix between domestic and foreign earnings, the benefit of a foreign tax law change and lower reserves for uncertain tax positions during fiscal 2020 partially offset by favorable adjustments to prior year tax liabilities during fiscal 2019.
The significant components of deferred income tax assets and liabilities and their balance sheet classifications are as follows: | | | | | | | | | | | | | | |
| Years ended June 30, | | 2021 | | 2020 |
| | | | |
| Deferred tax assets: | | | | |
| Accrued expenses not currently deductible | | $ | 244.2 | | | $ | 203.0 | |
| Stock-based compensation expense | | 38.4 | | | 33.8 | |
| Foreign tax credits | | 21.3 | | | 20.1 | |
| | | | |
| Net operating losses | | 46.3 | | | 52.0 | |
| | | | |
| Retirement benefits | | — | | | 46.0 | |
| Other | | 34.7 | | | 25.9 | |
| | 384.9 | | | 380.8 | |
| Less: valuation allowances | | (13.4) | | | (12.0) | |
| Deferred tax assets, net | | $ | 371.5 | | | $ | 368.8 | |
| | | | |
| Deferred tax liabilities: | | | | |
| Deferred revenue | | $ | 494.5 | | | $ | 475.0 | |
| Fixed and intangible assets | | 119.4 | | | 288.2 | |
| Prepaid expenses | | 27.9 | | | 82.3 | |
| Prepaid retirement benefits | | 37.7 | | | — | |
| Unrealized investment gains, net | | 101.7 | | | 187.9 | |
| Tax on unrepatriated earnings | | 11.4 | | | 22.2 | |
| Other | | 13.6 | | | 6.4 | |
| Deferred tax liabilities | | 806.2 | | | 1,062.0 | |
| Net deferred tax liabilities | | $ | 434.7 | | | $ | 693.2 | |
There are $48.3 million and $38.8 million of long-term deferred tax assets included in other assets on the Consolidated Balance Sheets at June 30, 2021 and 2020, respectively.
Income taxes have not been provided on undistributed earnings of certain foreign subsidiaries in an aggregate amount of approximately $291.1 million as the Company considers such earnings to be permanently reinvested outside of the United States. As of June 30, 2021, it is not practicable to estimate the unrecognized tax liability that would occur upon distribution.
The Company has estimated foreign net operating loss carry-forwards of approximately $61.8 million as of June 30, 2021, of which $1.1 million expire through June 2031 and $60.7 million have an indefinite utilization period. As of June 30, 2021, the Company has approximately $31.3 million of federal net operating loss carry-forwards from acquired companies. The net operating losses have an annual utilization limitation pursuant to section 382 of the Internal Revenue Code and expire through June 2036.
The Company has state net operating loss carry-forwards of approximately $348.7 million as of June 30, 2021, which expire through June 2040. The Company has recorded valuation allowances of $13.4 million and $12.0 million at June 30, 2021 and 2020, respectively, to reflect the estimated amount of domestic and foreign deferred tax assets that may not be realized.
Income tax payments were approximately $973.7 million, $677.1 million, and $633.8 million for fiscal 2021, 2020, and 2019, respectively.
As of June 30, 2021, 2020, and 2019 the Company's liabilities for unrecognized tax benefits, which include interest and penalties, were $99.9 million, $62.3 million, and $54.2 million respectively. The amount that, if recognized, would impact the effective tax rate is $68.5 million, $49.9 million, and $43.3 million, respectively. The remainder, if recognized, would principally impact deferred taxes.
A reconciliation of the beginning and ending amounts of unrecognized tax benefits is as follows: | | | | | | | | | | | | | | | | | | | | |
| | 2021 | | 2020 | | 2019 |
| | | | | | |
| Unrecognized tax benefits at beginning of the year | | $ | 62.3 | | | $ | 54.2 | | | $ | 45.2 | |
| Additions for tax positions | | 18.8 | | | 13.2 | | | 9.5 | |
| | | | | | |
| Additions for tax positions of prior periods | | 32.5 | | | 6.3 | | | 18.3 | |
| Reductions for tax positions of prior periods | | (11.0) | | | (4.3) | | | (7.7) | |
| Settlement with tax authorities | | (1.3) | | | (4.0) | | | (10.3) | |
| Expiration of the statute of limitations | | (1.5) | | | (2.8) | | | (0.6) | |
| Impact of foreign exchange rate fluctuations | | 0.1 | | | (0.3) | | | (0.2) | |
| Unrecognized tax benefit at end of year | | $ | 99.9 | | | $ | 62.3 | | | $ | 54.2 | |
Interest expense and penalties associated with uncertain tax positions have been recorded in the provision for income taxes on the Statements of Consolidated Earnings. During the fiscal years 2021, 2020, and 2019, the Company recorded interest expense of $10.8 million, $1.6 million, and $1.9 million, respectively. During fiscal year 2021, the Company recorded penalties of $0.3 million, penalties recorded during fiscal years 2020, and 2019 were not significant.
At June 30, 2021, the Company had accrued interest of $19.2 million recorded on the Consolidated Balance Sheets, of which $3.9 million was recorded within income taxes payable, and the remainder was recorded within other liabilities. At June 30, 2020, the Company had accrued interest of $8.8 million recorded on the Consolidated Balance Sheets, of which $1.0 million was recorded within income taxes payable, and the remainder was recorded within other liabilities. At June 30, 2021, the Company’s accrued penalties of $0.3 million was recorded on the Consolidated Balance Sheets within income taxes payable. At June 30, 2020, the Company's accrued penalties recorded on the Consolidated Balance Sheets within other liabilities were not material.
The Company is routinely examined by the IRS and tax authorities in foreign countries in which it conducts business, as well as tax authorities in states in which it has significant business operations. The tax years currently under examination vary by jurisdiction. Examinations in progress in which the Company has significant business operations are as follows:
| | | | | | | | |
| Taxing Jurisdiction | | Fiscal Years under Examination |
| | |
| | |
| Illinois | | 2017 - 2018 |
| | |
| | |
| Massachusetts | | 2013 - 2014, 2016 - 2018 |
| Texas | | 2016 - 2018 |
| Michigan | | 2012 - 2018 |
| New York State | | 2016 - 2018 |
| New York City | | 2016 - 2017 |
| | |
| | |
| India | | 2004 - 2011, 2013 - 2018 |
| | |
The Company regularly considers the likelihood of assessments resulting from examinations in each of the jurisdictions. The resolution of tax matters is not expected to have a material effect on the consolidated financial condition of the Company, although a resolution could have a material impact on the Company's Statements of Consolidated Earnings for a particular future period and on the Company's effective tax rate.
If certain pending tax matters settle within the next twelve months, the total amount of unrecognized tax benefits may increase or decrease for all open tax years and jurisdictions. Based on current estimates, settlements related to various jurisdictions and tax periods could increase earnings up to $3 million and expected cash payments could be up to $15 million in the next twelve months. The liability related to cash payments expected to be paid within the next 12 months has been reclassified from other liabilities to current liabilities on the Consolidated Balance Sheets. Audit outcomes and the timing of audit settlements are subject to significant uncertainty. We continually assess the likelihood and amount of potential adjustments and adjust the income tax provision, the current tax liability and deferred taxes in the period in which the facts that give rise to a revision become known.
NOTE 12. COMMITMENTS AND CONTINGENCIES
As of June 30, 2021, the Company has purchase commitments of approximately $658.6 million, including a reinsurance premium with Chubb for the fiscal 2022 policy year, as well as obligations related to software license agreements and purchase and maintenance agreements on our software, equipment, and other assets, of which $448.5 million relates to fiscal 2022, $184.8 million relates to the fiscal year ending June 30, 2023, and the remaining relates to fiscal years ending June 30, 2024 through fiscal 2026.
In June 2018, a potential class action complaint was filed against the Company in the Circuit Court of Cook County, Illinois asserting that ADP violated the Illinois Biometric Privacy Act in connection with its collection, use and storage of biometric data of employees of its clients who are residents of Illinois. In addition, similar potential class action complaints have been filed in Illinois state courts against ADP and/or certain of its clients with respect to the collection, use and storage of biometric data of the employees of these clients. In June 2020, the Company reached a settlement of all outstanding claims against ADP for $25.0 million, In February 2021, the court granted final approval of the $25.0 million settlement. The Company does not expect that any of the remaining cases against ADP's clients will result in any material liabilities to the Company. In June 2021, the Company received a $15 million insurance recovery related to this litigation.
In May 2020, two potential class action complaints were filed against ADP, TotalSource and related defendants in the U.S. District Court, District of New Jersey. The complaints assert violations of the Employee Retirement Income Security Act of 1974 (“ERISA”) in connection with the ADP TotalSource Retirement Savings Plan’s fiduciary administrative and investment decision-making. The complaints seek statutory and other unspecified monetary damages, injunctive relief and attorney’s fees. These claims are still in their earliest stages and the Company is unable to estimate any reasonably possible loss, or range of loss, with respect to these matters. The Company intends to vigorously defend against these lawsuits.
The Company is subject to various claims, litigation, and regulatory compliance matters in the normal course of business. When a loss is considered probable and reasonably estimable, the Company records a liability in the amount of its best estimate for the ultimate loss. Management currently believes that the resolution of these claims, litigation and regulatory compliance matters against us, individually or in the aggregate, will not have a material adverse impact on our consolidated results of operations, financial condition or cash flows. These matters are subject to inherent uncertainties and management's view of these matters may change in the future.
It is not the Company’s business practice to enter into off-balance sheet arrangements. In the normal course of business, the Company may enter into contracts in which it makes representations and warranties that relate to the performance of the Company’s services and products. The Company does not expect any material losses related to such representations and warranties.
NOTE 13. RECLASSIFICATION OUT OF ACCUMULATED OTHER COMPREHENSIVE INCOME ("AOCI")
Comprehensive income is a measure of income that includes both net earnings and other comprehensive income (loss). Other comprehensive income (loss) results from items deferred on the Consolidated Balance Sheets in stockholders' equity. Other comprehensive income (loss) was $25.4 million, $242.5 million, and $422.5 million in fiscal 2021, 2020, and 2019, respectively. Changes in Accumulated Other Comprehensive Income (“AOCI”) by component are as follows:
| | | | | | | | | | | | | | | | | | | | | | | | | | | | | | | | |
| | Currency Translation Adjustment | | Net Gains on Available-for-sale Securities | | | Cash Flow Hedging Activities | | Pension Liability | | | Accumulated Other Comprehensive (Loss) /Income |
| | | | | | | | | | | | |
| Balance at June 30, 2018 | | $ | (227.0) | | | $ | (274.0) | | | | $ | — | | | $ | (178.8) | | | | $ | (679.8) | |
| Other comprehensive income/(loss) before reclassification adjustments | | (42.2) | | | 642.4 | | | | — | | | (84.7) | | | | 515.5 | |
| Tax effect | | — | | | (144.4) | | | | — | | | 20.0 | | | | (124.4) | |
| Reclassification adjustments to net earnings | | — | | | 0.9 | | (A) | | — | | | 40.3 | | (B) | | 41.2 | |
| Tax effect | | — | | | (0.3) | | | | — | | | (9.5) | | | | (9.8) | |
| | | | | | | | | | | | |
| Balance at June 30, 2019 | | $ | (269.2) | | | $ | 224.6 | | | | $ | — | | | $ | (212.7) | | | | $ | (257.3) | |
| Other comprehensive income/(loss) before reclassification adjustments | | (53.0) | | | 602.2 | | | | (40.3) | | | (160.8) | | | | 348.1 | |
| Tax effect | | — | | | (136.4) | | | | 10.0 | | | 39.5 | | | | (86.9) | |
| Reclassification adjustments to net earnings | | — | | | (12.9) | | (A) | | — | | | (11.8) | | (B) | | (24.7) | |
| Tax effect | | — | | | 2.9 | | | | — | | | 3.1 | | | | 6.0 | |
| | | | | | | | | | | | |
| Balance at June 30, 2020 | | $ | (322.2) | | | $ | 680.4 | | | | $ | (30.3) | | | $ | (342.7) | | | | $ | (14.8) | |
| Other comprehensive income/(loss) before reclassification adjustments | | 95.4 | | | (363.3) | | | | (3.3) | | | 281.5 | | | | 10.3 | |
| Tax effect | | — | | | 82.6 | | | | 0.8 | | | (69.0) | | | | 14.4 | |
| Reclassification adjustments to net earnings | | — | | | (11.3) | | (A) | | 3.8 | | (C) | 9.3 | | (B) | | 1.8 | |
| Tax effect | | — | | | 2.5 | | | | (0.9) | | | (2.7) | | | | (1.1) | |
| | | | | | | | | | | | |
| Balance at June 30, 2021 | | $ | (226.8) | | | $ | 390.9 | | | | $ | (29.9) | | | $ | (123.6) | | | | $ | 10.6 | |
(A) Reclassification adjustments out of AOCI are included within Other (income)/expense, net, on the Statements of Consolidated Earnings.
(B) Reclassification adjustments out of AOCI are included in net pension (income)/expense (see Note 10). In fiscal 2020, reclassification includes $17.0 million of prior service credits which were recognized as a component of net pension (income)/expense as a result of the U.S. pension plan freeze.
(C) Reclassification adjustments out of AOCI are included in Interest expense on the Statements of Consolidated Earnings (see Note 9).
NOTE 14. FINANCIAL DATA BY SEGMENT AND GEOGRAPHIC AREA
Based upon similar economic and operational characteristics, the Company’s strategic business units have been aggregated into the following two reportable segments: Employer Services and PEO Services. The primary components of the “Other” segment are certain corporate overhead charges and expenses that have not been allocated to the reportable segments, including corporate functions, costs related to our transformation office, legal settlements, severance costs, non-recurring gains and losses, the elimination of intercompany transactions, and interest expense. Certain revenues and expenses are charged to the reportable segments at a standard rate for management reasons. Other costs are recorded based on management responsibility. The Company made changes to the allocation methodology for certain corporate allocations, in both the current period and the prior period in the table below, which did not materially affect reportable segment results.
| | | | | | | | | | | | | | | | | | | | | | | | | | | | |
| | Employer Services | | PEO Services | | Other | | | | Total |
| Year ended June 30, 2021 | | | | | | | | | | |
| Revenues | | $ | 10,195.2 | | | $ | 4,818.3 | | | $ | (8.1) | | | | | $ | 15,005.4 | |
| Earnings before income taxes | | 3,052.1 | | | 718.8 | | | (409.7) | | | | | 3,361.2 | |
| Assets | | 50,279.3 | | | 1,543.4 | | | (3,050.2) | | | | | 48,772.5 | |
| Capital expenditures | | 116.7 | | | — | | | 61.6 | | | | | 178.3 | |
| Depreciation and amortization | | 421.7 | | | 7.4 | | | 81.6 | | | | | 510.7 | |
| | | | | | | | | | |
| Year ended June 30, 2020 | | | | | | | | | | |
| Revenues | | $ | 10,086.6 | | | $ | 4,511.5 | | | $ | (8.3) | | | | | $ | 14,589.8 | |
| Earnings before income taxes | | 3,058.2 | | | 609.3 | | | (484.9) | | | | | 3,182.6 | |
| Assets | | 37,071.7 | | | 1,443.2 | | | 650.6 | | | | | 39,165.5 | |
| Capital expenditures | | 115.7 | | | — | | | 52.6 | | | | | 168.3 | |
| Depreciation and amortization | | 388.0 | | | 3.4 | | | 88.6 | | | | | 480.0 | |
| | | | | | | | | | |
| Year ended June 30, 2019 | | | | | | | | | | |
| Revenues | | $ | 9,942.8 | | | $ | 4,177.7 | | | $ | (10.3) | | | | | $ | 14,110.2 | |
| Earnings before income taxes | | 2,954.2 | | | 613.3 | | | (561.9) | | | | | 3,005.6 | |
| Assets | | 34,606.3 | | | 1,584.1 | | | 5,697.3 | | | | | 41,887.7 | |
| Capital expenditures | | 98.2 | | | — | | | 64.5 | | | | | 162.7 | |
| Depreciation and amortization | | 321.0 | | | 3.5 | | | 84.5 | | | | | 409.0 | |
| | | | | | | | | | | | | | | | | | | | | | | | | | | | | | | | |
| | United States | | Europe | | Canada | | Other | | Total |
| Year ended June 30, 2021 | | | | | | | | | | |
| Revenues | | $ | 13,081.7 | | | $ | 1,307.9 | | | $ | 337.3 | | | $ | 278.5 | | | $ | 15,005.4 | |
| Assets | | $ | 42,137.1 | | | $ | 2,425.1 | | | $ | 3,360.5 | | | $ | 849.8 | | | $ | 48,772.5 | |
| | | | | | | | | | |
| Year ended June 30, 2020 | | | | | | | | | | |
| Revenues | | $ | 12,740.1 | | | $ | 1,236.3 | | | $ | 329.8 | | | $ | 283.6 | | | $ | 14,589.8 | |
| Assets | | $ | 33,891.0 | | | $ | 2,162.7 | | | $ | 2,435.3 | | | $ | 676.5 | | | $ | 39,165.5 | |
| | | | | | | | | | |
| Year ended June 30, 2019 | | | | | | | | | | |
| Revenues | | $ | 12,262.6 | | | $ | 1,236.8 | | | $ | 326.6 | | | $ | 284.2 | | | $ | 14,110.2 | |
| Assets | | $ | 36,508.3 | | | $ | 2,807.9 | | | $ | 1,950.5 | | | $ | 621.0 | | | $ | 41,887.7 | |
Item 9. Changes in and Disagreements with Accountants on Accounting and Financial Disclosure
None.
Item 9A. Controls and Procedures
Attached as Exhibits 31.1 and 31.2 to this Annual Report on Form 10-K are certifications of ADP's Chief Executive Officer and Chief Financial Officer, which are required by Rule 13a-14(a) of the Securities Exchange Act of 1934, as amended (the “Exchange Act”). This “Controls and Procedures” section should be read in conjunction with the report of Deloitte & Touche LLP that appears in this Annual Report on Form 10-K and is hereby incorporated herein by reference.
Management's Evaluation of Disclosure Controls and Procedures
The Company carried out an evaluation (the “evaluation”), under the supervision and with the participation of the Company's management, including its Chief Executive Officer and Chief Financial Officer, of the effectiveness of the Company's disclosure controls and procedures, as defined in Rules 13a-15(e) and 15d-15(e) under the Exchange Act. Disclosure controls and procedures include, without limitation, controls and procedures designed to ensure that information required to be disclosed by the Company in the reports that it files or submits under the Exchange Act is accumulated and communicated to the Company's management, including its Chief Executive Officer and Chief Financial Officer, or persons performing similar functions, as appropriate to allow timely decisions regarding required disclosure. Based on the evaluation, the Company's Chief Executive Officer and Chief Financial Officer have concluded that the Company's disclosure controls and procedures were effective as of June 30, 2021 in ensuring that (i) information required to be disclosed by the Company in reports that it files or submits under the Exchange Act is accumulated and communicated to the Company's management, including its Chief Executive Officer and Chief Financial Officer, to allow timely decisions regarding required disclosure and (ii) such information is recorded, processed, summarized and reported within the time periods specified in the Securities and Exchange Commission's rules and forms.
Management's Report on Internal Control over Financial Reporting
It is the responsibility of Automatic Data Processing, Inc.'s (“ADP”) management to establish and maintain effective internal control over financial reporting (as defined in Rule 13a-15(f) under the Exchange Act). Internal control over financial reporting is designed to provide reasonable assurance to ADP's management and board of directors regarding the preparation of reliable financial statements for external purposes in accordance with generally accepted accounting principles.
ADP's internal control over financial reporting includes those policies and procedures that: (i) pertain to the maintenance of records that, in reasonable detail, accurately and fairly reflect the transactions and dispositions of the assets of ADP; (ii) provide reasonable assurance that transactions are recorded as necessary to permit preparation of financial statements in accordance with generally accepted accounting principles, and that receipts and expenditures of ADP are being made only in accordance with authorizations of management and directors of ADP; and (iii) provide reasonable assurance regarding the prevention or timely detection of unauthorized acquisition, use or disposition of ADP's assets that could have a material effect on the financial statements of ADP.
Because of its inherent limitations, internal control over financial reporting may not prevent or detect misstatements. Therefore, even those systems determined to be effective can provide only reasonable assurance with respect to financial statement preparation and presentation.
Management has performed an assessment of the effectiveness of ADP’s internal control over financial reporting as of June 30, 2021 based upon criteria set forth in Internal Control - Integrated Framework (2013) issued by the Committee of Sponsoring Organizations of the Treadway Commission. Based on this assessment, management determined that ADP’s internal control over financial reporting was effective as of June 30, 2021.
Deloitte & Touche LLP, the independent registered public accounting firm that audited and reported on the consolidated financial statements of ADP included in this Annual Report on Form 10-K, has issued an attestation report on the operating effectiveness of ADP's internal control over financial reporting. The Deloitte & Touche LLP attestation report is set forth below.
| | |
| /s/ Carlos A. Rodriguez |
| Carlos A. Rodriguez |
| President and Chief Executive Officer |
| |
| /s/ Kathleen A. Winters |
| Kathleen A. Winters |
| Chief Financial Officer |
Roseland, New Jersey
August 4, 2021
Changes in Internal Control over Financial Reporting
There were no changes in ADP's internal control over financial reporting that occurred during the quarter ended June 30, 2021 that have materially affected, or are reasonably likely to materially affect, ADP's internal control over financial reporting.
REPORT OF INDEPENDENT REGISTERED PUBLIC ACCOUNTING FIRM
To the Board of Directors and Stockholders of
Automatic Data Processing, Inc.
Roseland, New Jersey
Opinion on Internal Control over Financial Reporting
We have audited the internal control over financial reporting of Automatic Data Processing, Inc. and subsidiaries (the “Company”) as of June 30, 2021, based on criteria established in Internal Control - Integrated Framework (2013) issued by the Committee of Sponsoring Organizations of the Treadway Commission (COSO). In our opinion, the Company maintained, in all material respects, effective internal control over financial reporting as of June 30, 2021, based on criteria established in Internal Control - Integrated Framework (2013) issued by COSO.
We have also audited, in accordance with the standards of the Public Company Accounting Oversight Board (United States) (PCAOB), the consolidated financial statements as of and for the year ended June 30, 2021, of the Company and our report dated August 4, 2021, expressed an unqualified opinion on those financial statements and included an explanatory paragraph regarding the Company’s adoption of a new accounting standard.
Basis for Opinion
The Company’s management is responsible for maintaining effective internal control over financial reporting and for its assessment of the effectiveness of internal control over financial reporting, included in the accompanying Management's Report on Internal Control over Financial Reporting. Our responsibility is to express an opinion on the Company’s internal control over financial reporting based on our audit. We are a public accounting firm registered with the PCAOB and are required to be independent with respect to the Company in accordance with the U.S. federal securities laws and the applicable rules and regulations of the Securities and Exchange Commission and the PCAOB.
We conducted our audit in accordance with the standards of the PCAOB. Those standards require that we plan and perform the audit to obtain reasonable assurance about whether effective internal control over financial reporting was maintained in all material respects. Our audit included obtaining an understanding of internal control over financial reporting, assessing the risk that a material weakness exists, testing and evaluating the design and operating effectiveness of internal control based on the assessed risk, and performing such other procedures as we considered necessary in the circumstances. We believe that our audit provides a reasonable basis for our opinion.
Definition and Limitations of Internal Control over Financial Reporting
A company’s internal control over financial reporting is a process designed to provide reasonable assurance regarding the reliability of financial reporting and the preparation of financial statements for external purposes in accordance with generally accepted accounting principles. A company’s internal control over financial reporting includes those policies and procedures that (1) pertain to the maintenance of records that, in reasonable detail, accurately and fairly reflect the transactions and dispositions of the assets of the company; (2) provide reasonable assurance that transactions are recorded as necessary to permit preparation of financial statements in accordance with generally accepted accounting principles, and that receipts and expenditures of the company are being made only in accordance with authorizations of management and directors of the company; and (3) provide reasonable assurance regarding prevention or timely detection of unauthorized acquisition, use, or disposition of the company’s assets that could have a material effect on the financial statements.
Because of its inherent limitations, internal control over financial reporting may not prevent or detect misstatements. Also, projections of any evaluation of effectiveness to future periods are subject to the risk that controls may become inadequate because of changes in conditions, or that the degree of compliance with the policies or procedures may deteriorate.
| | |
| /s/ Deloitte & Touche LLP |
| Parsippany, New Jersey |
August 4, 2021
Item 9B. Other Information
None.
Part III
Item 10. Directors, Executive Officers and Corporate Governance
The executive officers of the Company, their ages, positions, and the period during which they have been employed by ADP are as follows: | | | | | | | | | | | | | | | | | | | | |
| | | | | | Employed by |
| Name | | Age | | Position | | ADP Since |
| Brock Albinson | | 46 | | Corporate Controller and Principal Accounting Officer | | 2007 |
| John Ayala | | 54 | | President, Employer Services North America | | 2002 |
| Maria Black | | 47 | | President, Worldwide Sales and Marketing | | 1996 |
| Michael A. Bonarti | | 55 | | Chief Administrative Officer | | 1997 |
| Laura Brown | | 49 | | President, Major Account Services and ADP Canada | | 2000 |
| Chris D'Ambrosio | | 40 | | Chief Strategy Officer | | 2014 |
| Joe DeSilva | | 46 | | President, Small Business Services, Retirement Services and | | 2003 |
| | | | Insurance Services | | |
| Deborah L. Dyson | | 55 | | President, National Accounts Services | | 1988 |
| Michael C. Eberhard | | 59 | | Vice President and Treasurer | | 1998 |
| Sreeni Kutam | | 51 | | Chief Human Resources Officer | | 2014 |
| David Kwon | | 51 | | Chief Legal Officer/General Counsel | | 2011 |
| Don McGuire | | 61 | | President, Employer Services International | | 1998 |
| Brian Michaud | | 53 | | President, Smart Compliance Solutions | | 1991 |
| Alex Quevedo | | 49 | | President, Human Resource Outsourcing | | 1997 |
| Carlos A. Rodriguez | | 57 | | President and Chief Executive Officer | | 1999 |
| Stuart Sackman | | 60 | | Corporate Vice President, Global Shared Services | | 1992 |
| Donald Weinstein | | 52 | | Corporate Vice President, Global Product and Technology | | 2006 |
| Kathleen A. Winters | | 53 | | Chief Financial Officer | | 2019 |
Brock Albinson joined ADP in 2007. Prior to his appointment as Corporate Controller and Principal Accounting Officer in March 2015, he served as Assistant Corporate Controller from December 2011 to February 2015, as Vice President, Corporate Finance from January 2011 to December 2011, and as Vice President, Financial Policy from March 2007 to January 2011.
John Ayala joined ADP in 2002. Prior to his appointment as President, Employer Services North America, he served as President, Major Account Services and ADP Canada from January 2017 to February 2020, as President, Small Business Services, Retirement Services and Insurance Services from July 2014 to December 2016, as Vice President, Client Experience and Continuous Improvement from November 2012 to June 2014, as Senior Vice President, Services and Operations - Small Business Services from February 2012 to October 2012, as President, TotalSource from July 2011 to January 2012, and as Senior Vice President, Service and Operations, TotalSource from June 2008 to June 2011.
Maria Black joined ADP in 1996. Prior to her appointment as President, Worldwide Sales and Marketing, she served as President, Small Business Solutions and Human Resources Outsourcing from January 2017 to February 2020, as President, ADP TotalSource from July 2014 to December 2016, as General Manager, ADP United Kingdom from April 2013 to June 2014, and as General Manager, Employer Services - TotalSource Western Central Region from January 2008 to March 2013.
Michael A. Bonarti joined ADP in 1997. Prior to his appointment as Chief Administrative Officer in July 2021, he served as Corporate Vice President, General Counsel and Secretary from July 2010 to June 2021.
Laura Brown joined ADP in 2000. Prior to her appointment as President, Major Account Services and ADP Canada in March 2020, she served as Senior Vice President/General Manager, Next Gen Human Capital Management from March 2019 to March 2020, as Senior Division Vice President, Major Account Services from September 2016 to March 2019, and Division Vice President/General Manager, Small Business Services from April 2014 to August 2016.
Chris D’Ambrosio joined ADP in 2014. Prior to his appointment as Chief Strategy Officer in June 2021, he served as Senior Vice President, General Manager, Insurance Services, Small Business Services from January 2019 to June 2021, and as Senior Division Vice President of Strategy and Business Development, Small Business Services and Human Resources Outsourcing from December 2017 to January 2019, as Division Vice President of Strategy and Business Development, Human Resources Outsourcing from February 2017 to December 2017, and Division Vice President of Strategy, Human Resources Outsourcing from March 2016 to February 2017.
Joe DeSilva joined ADP in 2003. Prior to his appointment as President, Small Business Services, Retirement Services and Insurance Services in February 2020, he served as Senior Vice President, Services & Operations, Small Business Services from May 2017 to February 2020, as Senior Vice President/General Manager, Retirement Services from June 2015 to May 2017, and as Senior Vice President, Sales, Retirement Services from May 2013 to June 2015.
Deborah L. Dyson joined ADP in 1988. Prior to her appointment as President, National Accounts Services in August 2017, she served as Corporate Vice President, Client Experience and Continuous Improvement from July 2014 to June 2018, as Division Vice President / General Manager, Employer Services - Major Account Services South Service Center from July 2012 to June 2014, and as Division Vice President / General Manager, Employer Services - Major Account Services Northwest Service Center from July 2006 to June 2012.
Michael C. Eberhard joined ADP in 1998. He has served as Vice President and Treasurer since November 2009.
Sreeni Kutam joined ADP in 2014. Prior to his appointment as Chief Human Resources Officer in June 2018, he served as Interim Chief Human Resources Officer from January 2018 to June 2018, as Division Vice President, Human Resources, Major Account Services from May 2016 to January 2018, and as Vice President, HR Strategy and Planning from January 2014 to April 2016. Prior to joining ADP, he was an HR consultant.
David Kwon joined ADP in 2011. Prior to his appointment as Corporate Vice President, Chief Legal Officer/General Counsel in July 2021, he served as Staff Vice President and Associate General Counsel – Global Compliance from March 2019 to June 2021, and as Staff Vice President and Associate General Counsel – Litigation from July 2012 to March 2019.
Don McGuire joined ADP in 1998. Prior to his appointment as President, Employer Services International in June 2018, he served as President, Global Enterprise Solutions EMEA/Streamline from July 2016 to June 2018, as Senior Vice President, General Manager, Asia Pacific Region from December 2012 to June 2016, and as General Manager, ADP United Kingdom/Ireland from September 2007 to December 2012.
Brian Michaud joined ADP in 1991. Prior to his appointment as President, Smart Compliance Solutions in July 2021, he served as President, Human Resources Outsourcing from February 2020 to June 2021, as Senior Vice President, TotalSource from August 2016 to February 2020, as Senior Vice President, Client Services from June 2015 to August 2016, and as General Manager, Northeast from September 2011 to June 2015.
Alex Quevedo joined ADP in 1997. Prior to his appointment as President, Human Resources Outsourcing in July 2021, he served as Senior Vice President, Human Resources Outsourcing Sales from September 2018 to June 2021, as Senior Vice President/General Manager, Insurance Services from December 2015 to August 2018, and as Division Vice President, Insurance Services Sales from December 2011 to December 2015.
Carlos A. Rodriguez joined ADP in 1999. Prior to his appointment in November 2011 to President and Chief Executive Officer, he served as President and Chief Operating Officer from May 2011 to November 2011, and as President, Employer Services International - National Account Services, ADP Canada, and GlobalView and Employer Services International, from March 2010 to May 2011.
Stuart Sackman joined ADP in 1992. Prior to his appointment as Corporate Vice President, Global Shared Services in July 2018, he served as Corporate Vice President, Global Product and Technology from March 2015 to June 2018, as Corporate Vice President and General Manager of Multinational Corporations Services from June 2012 to February 2015, and as Division Vice President and General Manager of the National Account Services’ East National Service Center from February 2008 to May 2012.
Donald Weinstein joined ADP in 2006. Prior to his appointment as Corporate Vice President, Global Product and Technology in July 2018, he served as Chief Strategy Officer from December 2015 to June 2018, as Senior Vice President,
Product Management from October 2010 to November 2015, and as Division Vice President, Strategy & Marketing from September 2007 to September 2010.
Kathleen A. Winters joined ADP in April 2019 as Chief Financial Officer. Prior to joining ADP, she was Chief Financial Officer and Treasurer of MSCI Inc. from May 2016 to March 2019. Prior to joining MSCI Inc., she served in various positions of increasing responsibility at Honeywell International, Inc. from 2002 to 2016, most recently as Vice President and Chief Financial Officer of the Performance Materials and Technologies operating segment.
Directors
See “Election of Directors” in the Proxy Statement for the Company’s 2021 Annual Meeting of Stockholders, which information is incorporated herein by reference.
Code of Ethics
ADP has adopted a code of ethics that applies to its principal executive officer, principal financial officer, principal accounting officer and persons performing similar functions. The code of ethics may be viewed online on ADP’s website at www.adp.com under “Investor Relations” in the “Corporate Governance” section. Any amendment to or waivers from the code of ethics will be disclosed on our website within four business days following the date of the amendment or waiver.
Audit Committee; Audit Committee Financial Expert
See “Corporate Governance - Committees of the Board of Directors” and “Audit Committee Report” in the Proxy Statement for the Company’s 2021 Annual Meeting of Stockholders, which information is incorporated herein by reference.
Item 11. Executive Compensation
See “Corporate Governance,” “Compensation Discussion and Analysis,” “Compensation Committee Report,” “Compensation of Executive Officers” and “Compensation of Non-Employee Directors” in the Proxy Statement for the Company’s 2021 Annual Meeting of Stockholders, which information is incorporated herein by reference.
Item 12. Security Ownership of Certain Beneficial Owners and Management and Related Stockholder Matters
See “Security Ownership of Certain Beneficial Owners and Management” and “Equity Compensation Plan Information” in the Proxy Statement for the Company’s 2021 Annual Meeting of Stockholders, which information is incorporated herein by reference.
Item 13. Certain Relationships and Related Transactions, and Director Independence
See “Election of Directors” and “Corporate Governance” in the Proxy Statement for the Company’s 2021 Annual Meeting of Stockholders, which information is incorporated herein by reference.
Item 14. Principal Accounting Fees and Services
See “Independent Registered Public Accounting Firm's Fees” in the Proxy Statement for the Company's 2021 Annual Meeting of Stockholders, which information is incorporated herein by reference.
Part IV
1.Item 15. Exhibits, Financial Statement Schedules
(a) Financial Statements and Financial Statement Schedules
1. Financial Statements
The following report and Consolidated Financial Statements of the Company are contained in Part II, Item 8 hereof:
Report of Independent Registered Public Accounting Firm
Statements of Consolidated Earnings - years ended June 30, 2021, 2020 and 2019
Statements of Consolidated Comprehensive Income - years ended June 30, 2021, 2020 and 2019
Consolidated Balance Sheets - June 30, 2021 and 2020
Statements of Consolidated Stockholders' Equity - years ended June 30, 2021, 2020 and 2019
Statements of Consolidated Cash Flows - years ended June 30, 2021, 2020 and 2019
Notes to Consolidated Financial Statements
2. Financial Statement Schedules | | | | | | | | | | | |
| | | | Page in Form 10-K |
| | Schedule II - Valuation and Qualifying Accounts | | |
All other Schedules have been omitted because they are inapplicable, are not required or the information is included elsewhere in the financial statements or notes thereto.
(b) Exhibits
The following exhibits are filed with this Annual Report on Form 10-K or incorporated herein by reference to the document set forth next to the exhibit in the list below:
| | | | | |
| Amended and Restated Certificate of Incorporation dated November 10, 1998 - incorporated by reference to Exhibit 3.1 to the Company's Registration Statement No. 333-72023 on Form S-4 filed with the Commission on February 9, 1999 |
| Amended and Restated By-laws of the Company, dated August 5, 2020 - incorporated by reference to Exhibit 3.2 to the Company's Annual Report on Form 10-K for the fiscal year ended June 30, 2020 |
| Description of Common Stock |
| Form of Indenture between the Company and Wells Fargo Bank, National Association, as trustee - incorporated by reference to Exhibit 4.3 to the Company's Registration Statement on Form S-3 (No. 333-206631), filed on August 28, 2015 |
| Form of First Supplemental Indenture between Automatic Data Processing, Inc. and Wells Fargo Bank, National Association, as trustee - incorporated by reference to Exhibit 4.1 to the Company's Current Report on Form 8-K dated and filed on September 15, 2015 |
| Form of 3.375% Senior Note due 2025 - incorporated by reference to Exhibit B to Exhibit 4.1 to the Company's Current Report on Form 8-K dated and filed on September 15, 2015 |
| Form of First Supplemental Indenture between Automatic Data Processing, Inc. and U.S. Bank National Association, as trustee - incorporated by reference to Exhibit 4.1 to the Company's Current Report on Form 8-K dated August 11, 2020 and filed on August 13, 2020 |
| Form of 1.250% Senior Note due 2030 - incorporated by reference to Exhibit A to Exhibit 4.1 to the Company's Current Report on Form 8-K dated August 11, 2020 and filed on August 13, 2020 |
| Form of Second Supplemental Indenture between Automatic Data Processing, Inc. and U.S. Bank National Association, as trustee - incorporated by reference to Exhibit 4.1 to the Company's Current Report on Form 8-K dated May 11, 2021 and filed on May 14, 2021 |
| Form of 1.700% Senior Note due 2028 - incorporated by reference to Exhibit A to 4.1 to the Company's Current Report on Form 8-K dated May 11, 2021 and filed on May 14, 2021 |
| 364-Day Credit Agreement, dated as of June 9, 2021, among Automatic Data Processing, Inc., the Lenders party thereto, JPMorgan Chase Bank, N.A., as Administrative Agent, Bank of America, N.A., BNP Paribas, Wells Fargo Bank, N.A. and Deutsche Bank Securities Inc., as Syndication Agents, and Barclays Bank PLC and MUFG Bank, Ltd., as Documentation Agents - incorporated by reference to Exhibit 10.1 to the Company’s Current Report on Form 8-K dated June 9, 2021 and filed on June 10, 2021 |
| Five-Year Credit Agreement, dated as of June 12, 2019, among Automatic Data Processing, Inc., the Lenders party thereto, JPMorgan Chase Bank, N.A., as Administrative Agent, Bank of America, N.A., BNP Paribas, Wells Fargo Bank, N.A., Citibank, N.A., MUFG Bank, Ltd. and Deutsche Bank Securities Inc., as Syndication Agents, and Barclays Bank PLC, as Documentation Agent - incorporated by reference to Exhibit 10.2 to the Company’s Current Report on Form 8-K dated June 12, 2019 and filed on June 13, 2019 |
| Five-Year Credit Agreement, dated as of June 9, 2021, among Automatic Data Processing, Inc., the Lenders Party thereto, JPMorgan Chase Bank, N.A., as Administrative Agent, Bank of America, N.A., BNP Paribas, Wells Fargo Bank, N.A., and Deutsche Bank Securities Inc., as Syndication Agents, and Barclays Bank PLC and MUFG Bank Ltd., as Documentation Agents - incorporated by reference to Exhibit 10.2 to the Company’s Current Report on Form 8-K dated June 9, 2021 and filed on June 10, 2021 |
| Amended and Restated Supplemental Officers Retirement Plan - incorporated by reference to Exhibit 10.8 to the Company's Annual Report on Form 10-K for the fiscal year ended June 30, 2017 (Management Compensatory Plan) |
| | | | | |
| Automatic Data Processing, Inc. Deferred Compensation Plan, as Amended and Restated Effective October 14, 2020 - incorporated by reference to Exhibit 10.1 to the Company’s Quarterly Report on Form 10-Q for the fiscal quarter ended September 30, 2020 (Management Compensatory Plan) |
| Automatic Data Processing, Inc. Change in Control Severance Plan for Corporate Officers, as amended - incorporated by reference to Exhibit 10.8 to the Company’s Annual Report on Form 10-K for the fiscal year ended June 30, 2014 (Management Compensatory Plan) |
| Automatic Data Processing, Inc. Amended and Restated Employees’ Savings-Stock Purchase Plan - incorporated by reference to Exhibit 10.11 to the Company’s Annual Report on Form 10-K for the fiscal year ended June 30, 2014 (Management Compensatory Plan) |
| Automatic Data Processing, Inc. Executive Retirement Plan - incorporated by reference to Exhibit 10.1 to the Company’s Quarterly Report on Form 10-Q for the fiscal quarter ended March 31, 2015 (Management Compensatory Plan) |
| Automatic Data Processing, Inc. Retirement and Savings Restoration Plan - incorporated by reference to Exhibit 10.2 to the Company’s Quarterly Report on Form 10-Q for the fiscal quarter ended March 31, 2015 (Management Compensatory Plan) |
| Automatic Data Processing, Inc. Retirement and Savings Restoration Plan (Amended and Restated as of February 3, 2020) - incorporated by reference to Exhibit 10.2 to the Company’s Quarterly Report on Form 10-Q for the fiscal quarter ended September 30, 2020 (Management Compensatory Plan) |
| Automatic Data Processing, Inc. Corporate Officer Severance Plan - incorporated by reference to Exhibit 10.3 to the Company’s Quarterly Report on Form 10-Q for the fiscal quarter ended March 31, 2015 (Management Compensatory Plan) |
| Automatic Data Processing, Inc. Change in Control Severance Plan for Corporate Officers (as amended) (Management Compensatory Plan) - incorporated by reference to Exhibit 10.4 to the Company's Current Report on Form 8-K dated November 6, 2018 and filed on November 13, 2018 (Management Compensatory Plan) |
| Automatic Data Processing, Inc. Amended and Restated 2008 Omnibus Award Plan (as amended and restated as of April 11, 2018 (the "2008 Omnibus Award Plan") - incorporated by reference to Exhibit 10.1 to the Company’s Quarterly Report on Form 10-Q for the fiscal quarter ended March 31, 2018 (Management Compensatory Plan) |
| French Sub Plan under the 2008 Omnibus Award Plan effective as of January 26, 2012 - incorporated by reference to Exhibit 10.2 to the Company’s Quarterly Report on Form 10-Q for the fiscal quarter ended March 31, 2012 (Management Compensatory Plan) |
| Amended French Sub Plan under the 2008 Omnibus Award Plan effective as of April 6, 2016 (Management Compensatory Plan) - incorporated by reference to Exhibit 10.22 to the Company’s Annual Report on Form 10-K for the fiscal year ended June 30, 2016 (Management Compensatory Plan) |
| Form of Deferred Stock Unit Award Agreement under the 2008 Omnibus Award Plan - incorporated by reference to Exhibit 10.33 to the Company’s Annual Report on Form 10-K for the fiscal year ended June 30, 2012 (Management Compensatory Plan) |
| Form of Stock Option Grant Agreement under the 2008 Omnibus Award Plan (Form for Employees) - incorporated by reference to Exhibit 10.29 to the Company’s Annual Report on Form 10-K for the fiscal year ended June 30, 2014 (Management Compensatory Plan) |
| Form of Restricted Stock Award Agreement under the 2008 Omnibus Award Plan (Form for Corporate Officers) - incorporated by reference to Exhibit 10.5 to the Company’s Quarterly Report on Form 10-Q for the fiscal quarter ended March 31, 2015 (Management Compensatory Plan) |
| Form of Stock Option Grant under the 2008 Omnibus Award Plan (Form for Corporate Officers) - incorporated by reference to Exhibit 10.6 to the Company’s Quarterly Report on Form 10-Q for the fiscal quarter ended March 31, 2015 (Management Compensatory Plan) |
| Form of Performance Stock Unit Award Agreement under the 2008 Omnibus Award Plan (Form for Corporate Officers) - incorporated by reference to Exhibit 10.33 to the Company's Annual Report on Form 10-K for the fiscal year ended June 30, 2016 (Management Compensatory Plan) |
| Form of Stock Option Grant Agreement under the 2008 Omnibus Award Plan (Form for Corporate Officers) - incorporated by reference to Exhibit 10.34 to the Company's Annual Report on Form 10-K for the fiscal year ended June 30, 2016 (Management Compensatory Plan) |
| Form of Performance Stock Unit Award Agreement under the 2008 Omnibus Award Plan for grants beginning September 1, 2017 (Management Compensatory Plan) - incorporated by reference to Exhibit 10.33 to the Company's Annual Report on Form 10-K for the fiscal year ended June 30, 2017 (Management Compensatory Plan) |
| Form of Stock Option Grant Agreement under the 2008 Omnibus Award Plan for grants beginning September 1, 2017 (Management Compensatory Plan) - incorporated by reference to Exhibit 10.34 to the Company's Annual Report on Form 10-K for the fiscal year ended June 30, 2017 (Management Compensatory Plan) |
| | | | | |
| Form of Restricted Stock and Restricted Stock Unit Award Agreement under the 2008 Omnibus Award Plan for grants beginning September 1, 2017 (Management Compensatory Plan) - incorporated by reference to Exhibit 10.35 to the Company's Annual Report on Form 10-K for the fiscal year ended June 30, 2017 (Management Compensatory Plan) |
| Form of Restricted Stock and Restricted Stock Unit Award Agreement under the 2008 Omnibus Award Plan for grants beginning September 1, 2018 (Management Compensatory Plan) - incorporated by reference to Exhibit 10.30 to the Company's Annual Report on Form 10-K for the fiscal year ended June 30, 2018 (Management Compensatory Plan) |
| Automatic Data Processing, Inc. 2018 Omnibus Award Plan (the "2018 Omnibus Award Plan") - incorporated by reference to Appendix B to the Company’s Definitive Proxy Statement on Form Schedule 14A dated September 20, 2018 (Management Compensatory Plan) |
| French Sub Plan under the 2018 Omnibus Award Plan (Adopted January 15, 2019) (Management Compensatory Plan) - incorporated by reference to Exhibit 10.1 to the Company's Quarterly Report on Form 10-Q for the fiscal quarter ended December 31, 2018 (Management Compensatory Plan) |
| Form of Stock Option Grant Agreement under the 2018 Omnibus Award Plan (Management Compensatory Plan) - incorporated by reference to Exhibit 10.1 to the Company's Current Report on Form 8-K dated November 6, 2018 and filed on November 13, 2018 (Management Compensatory Plan) |
| Form of Restricted Stock and Restricted Stock Unit Award Agreement under the 2018 Omnibus Award Plan (Management Compensatory Plan) - incorporated by reference to Exhibit 10.2 to the Company's Current Report on Form 8-K dated November 6, 2018 and filed on November 13, 2018 (Management Compensatory Plan) |
| Form of Performance Stock Unit Award Agreement under the 2018 Omnibus Award Plan (Management Compensatory Plan) - incorporated by reference to Exhibit 10.3 to the Company's Current Report on Form 8-K dated November 6, 2018 and filed on November 13, 2018 (Management Compensatory Plan) |
| Form of Stock Option Grant Agreement under the 2018 Omnibus Award Plan for grants beginning September 1, 2021 (Management Compensatory Plan) |
| Form of Restricted Stock and Restricted Stock Unit Award Agreement under the 2018 Omnibus Award Plan for grants beginning September 1, 2021 (Management Compensatory Plan) |
| Form of Performance Stock Unit Award Agreement under the 2018 Omnibus Award Plan for grants beginning September 1, 2021 (Management Compensatory Plan) |
| Offer Letter, dated as of March 1, 2019, between Automatic Data Processing, Inc. and Kathleen Winters - incorporated by reference to Exhibit 10.1 to the Company's Quarterly Report on Form 10-Q for the fiscal quarter ended March 31, 2019 |
| Separation Agreement and Release, dated March 12, 2020, by and between Thomas J. Perrotti and Automatic Data Processing, Inc. - incorporated by reference to Exhibit 10.1 to the Company's Current Report on Form 8-K dated March 12, 2020 and filed on March 18, 2020 |
| Subsidiaries of the Company |
| Consent of Independent Registered Public Accounting Firm |
| Certification by Carlos A. Rodriguez pursuant to Rule 13a-14(a) of the Securities Exchange Act of 1934 |
| Certification by Kathleen A. Winters pursuant to Rule 13a-14(a) of the Securities Exchange Act of 1934 |
| Certification by Carlos A. Rodriguez pursuant to 18 U.S.C. Section 1350, as adopted pursuant to Section 906 of the Sarbanes-Oxley Act of 2002 |
| Certification by Kathleen A. Winters pursuant to 18 U.S.C. Section 1350, as adopted pursuant to Section 906 of the Sarbanes-Oxley Act of 2002 |
| 101.INS | Instance Document - the instance document does not appear in the Interactive Data File because its XBRL tags are embedded within the Inline XBRL document |
| 101.SCH | Inline XBRL Taxonomy Extension Schema
|
| 101.CAL | Inline XBRL Taxonomy Extension Calculation Linkbase
|
| 101.LAB | Inline XBRL Taxonomy Label Linkbase
|
| 101.PRE | Inline XBRL Taxonomy Extension Presentation Linkbase
|
| 101.DEF | Inline XBRL Taxonomy Extension Definition Document |
AUTOMATIC DATA PROCESSING, INC.
AND SUBSIDIARIES
SCHEDULE II - VALUATION AND QUALIFYING ACCOUNTS
(In thousands) | | | | | | | | | | | | | | | | | | | | | | | | | | | | | | | | | | | |
| Column A | | Column B | | Column C | | Column D | | | Column E |
| | | | Additions | | | | | |
| | | | (1) | | (2) | | | | | |
| | Balance at beginning of period | | Charged to costs and expenses | | Charged to other accounts (A) | | Deductions | | | Balance at end of period |
| Year ended June 30, 2021: | | | | | | | | | | | |
| Allowance for doubtful accounts: | | | | | | | | | | | |
| Current | | $ | 92,472 | | | $ | 14,661 | | | $ | 2,185 | | | $ | (29,750) | | (B) | | $ | 79,568 | |
| Long-term | | $ | 549 | | | $ | — | | | $ | (300) | | | $ | — | | (B) | | $ | 249 | |
| Deferred tax valuation allowance | | $ | 11,992 | | | $ | 3,250 | | | $ | 226 | | | $ | (2,091) | | | | $ | 13,377 | |
| Year ended June 30, 2020: | | | | | | | | | | | |
| Allowance for doubtful accounts: | | | | | | | | | | | |
| Current | | $ | 54,850 | | | $ | 65,069 | | | $ | (4,536) | | | $ | (22,911) | | (B) | | $ | 92,472 | |
| Long-term | | $ | 505 | | | $ | — | | | $ | 44 | | | $ | — | | (B) | | $ | 549 | |
| Deferred tax valuation allowance | | $ | 31,627 | | | $ | (18,953) | | | $ | (204) | | | $ | (479) | | | | $ | 11,992 | |
| Year ended June 30, 2019: | | | | | | | | | | | |
| Allowance for doubtful accounts: | | | | | | | | | | | |
| Current | | $ | 51,342 | | | $ | 28,177 | | | $ | 5,165 | | | $ | (29,834) | | (B) | | $ | 54,850 | |
| Long-term | | $ | 510 | | | $ | — | | | $ | (5) | | | $ | — | | (B) | | $ | 505 | |
| Deferred tax valuation allowance | | $ | 46,006 | | | $ | 7,171 | | | $ | (20,685) | | | $ | (865) | | | | $ | 31,627 | |
(A) Includes amounts related to foreign exchange fluctuation.
(B) Doubtful accounts written off, less recoveries on accounts previously written off.
SIGNATURES
Pursuant to the requirements of Section 13 or 15(d) of the Securities Exchange Act of 1934, the Registrant has duly caused this report to be signed on its behalf by the undersigned, thereunto duly authorized. | | | | | | | | | | | |
| | AUTOMATIC DATA PROCESSING, INC. |
| | (Registrant) |
| |
| August 4, 2021 | By | /s/ Carlos A. Rodriguez | |
| | Carlos A. Rodriguez |
| | President and Chief Executive Officer |
Pursuant to the requirements of the Securities Exchange Act of 1934, this report has been signed below by the following persons on behalf of the Registrant in the capacities and on the dates indicated. | | | | | | | | | | | | | | |
| Signature | | Title | | Date |
| | | | | |
| | | | |
| /s/ Carlos A. Rodriguez | | President and Chief Executive | | August 4, 2021 |
| (Carlos A. Rodriguez) | | Officer, Director | | |
| | (Principal Executive Officer) | | |
| | | | | |
| /s/ Kathleen A. Winters | | Chief Financial Officer | | August 4, 2021 |
| (Kathleen A. Winters) | | (Principal Financial Officer) | | |
| | | | | |
| /s/ Brock Albinson | | Corporate Controller | | August 4, 2021 |
| (Brock Albinson) | | (Principal Accounting Officer) | | |
| | | | | |
| /s/ Peter Bisson | | Director | | August 4, 2021 |
| (Peter Bisson) | | | | |
| | | | |
| | | | |
| | | | |
| /s/ Richard T. Clark | | Director | | August 4, 2021 |
| (Richard T. Clark) | | | | |
| | | | |
| /s/ Linnie M. Haynesworth | | Director | | August 4, 2021 |
| (Linnie M. Haynesworth) | | | | |
| | | | | |
| /s/ John P. Jones | | Director | | August 4, 2021 |
| (John P. Jones) | | | | |
| | | | | |
| /s/ Francine S. Katsoudas | | Director | | August 4, 2021 |
| (Francine S. Katsoudas) | | | | |
| | | | | | | | | | | | | | |
| /s/ Nazzic S. Keene | | Director | | August 4, 2021 |
| (Nazzic S. Keene) | | | | |
| | | | | |
| /s/ Thomas J. Lynch | | Director | | August 4, 2021 |
| (Thomas J. Lynch) | | | | |
| | | | | |
| /s/ Scott F. Powers | | Director | | August 4, 2021 |
| (Scott F. Powers) | | | | |
| | | | |
| /s/ William J. Ready | | Director | | August 4, 2021 |
| (William J. Ready) | | | | |
| | | | |
| /s/ Sandra S. Wijnberg | | Director | | August 4, 2021 |
| (Sandra S. Wijnberg) | | | | |
| | | | |
| | | | |
| | | | |
| | | | | |
| | | | |
| | | | |