Exhibit 99.1
| News Release
PS Business Parks, Inc. 701 Western Avenue Glendale, CA 91201-2349 psbusinessparks.com |

|
| For Release: |
Immediately | |||
| Date: |
February 22, 2022 | |||
| Contact: |
Adeel Khan | |||
| (818) 244-8080, Ext. 8975 |
PS Business Parks, Inc. Reports Results for the Quarter and Year Ended December 31, 2021
GLENDALE, California—PS Business Parks, Inc. (NYSE:PSB), a real estate investment trust (“REIT”), today announced financial and operating results for the quarter and year ended December 31, 2021.
Financial and Operational Highlights for the Three Months and Year Ended December 31, 2021
| ● | Net income allocable to common stockholders for the three months and year ended December 31, 2021 was $267.4 million, or $9.66 per diluted common share, and $393.1 million, or $14.22 per diluted common share, respectively. |
| ● | FFO for the three months and year ended December 31, 2021 was $1.53 per share and $6.67 per share, respectively, representing a decrease of -7.8% and an increase of 2.5% from the same periods in 2020. |
| ● | Core FFO for the three months and year ended December 31, 2021 was $1.81 and $6.97 per share, respectively, representing an increase of 9.0% and 6.1% from the same periods in 2020. |
| ● | Cash NOI for the Company’s total portfolio was $77.6 million and $306.8 million for the three months and year ended December 31, 2021, respectively, representing an increase of 4.8% and 7.0% for the same periods in 2020. |
| ● | Cash NOI for the Company’s Same Park portfolio was $71.8 million and $279.8 million for the three months and year ended December 31, 2021, respectively, representing an increase of 6.5% and 8.0% for the same periods in 2020. |
| ● | Weighted average occupancy for the Company’s Total Park portfolio was 95.5% and 94.3% during the three months and year ended December 31, 2021, respectively, compared to 92.4% and 92.2% for the same periods in 2020. |
| ● | Weighted average occupancy for the Company’s Same Park portfolio was 95.7% and 94.4% during the three months and year ended December 31, 2021, respectively, compared to 92.7% for both comparable periods in 2020. |
| ● | Comparable rental rates for the Company’s Total Park portfolio for the three and twelve months on 1.8 million and 7.4 million rentable square feet were 16.4% and 14.7% on a net effective rent growth basis, and 6.1% and 5.2% on a cash basis, respectively. |
| ● | During the three months ended December 31, 2021, the Company acquired Jupiter Business Park, a 141,000 square foot industrial business park located in Plano, Texas, for a total purchase price of $25.6 million, inclusive of capitalized transaction cost. |
| ● | During the three months ended December 31, 2021, the Company sold Lusk, a 371,000 square foot industrial-flex business park located in San Diego, California, for net sale proceeds of $311.1 million, Ammendale, a 53,000 square foot industrial building located in Beltsville, Maryland, for net sale proceeds of $4.5 million and Royal Tech 10, a 70,000 square foot industrial-flex building located in Irving, Texas, for net sale proceeds of $8.8 million. |
1
Financial Results:
Net income allocable to common stockholders was $267.4 million or $9.66 per diluted share and $393.1 million or $14.22 per diluted share, for the three months and year ended December 31, 2021, respectively.
FFO for the quarter and year ended December 31, 2021 was $1.53 per share and $6.67 per share, respectively, representing a decrease of 7.8% and an increase of 2.5% from the same periods in 2020. The decrease in FFO per share for the fourth quarter was due to a $6.4 million non-cash charge related to the redemption of the Series W preferred stock and $3.6 million charge for a state income tax provision due to differences between state and federal tax codes. The increase in FFO per share for the year was the result of higher NOI, partially offset by the $6.4 million non-cash charge related to the redemption of the Series W preferred stock and the $3.6 million for state Income tax provision, as discussed above, as well as higher general and administrative expense primarily driven by stock compensation expense.
Core FFO for the quarter and year ended December 31, 2021 was $1.81 and $6.97 per share, respectively, representing an increase of 9.0% and 6.1% from the same periods in 2020. For the quarter ended December 31, 2021, Core FFO excludes the impact of (i) the $6.4 million non-cash charge related to the redemption of the Series W preferred stock and (ii) the $3.6 million of state income tax provision discussed above. For the year ended December 31, 2021, along with the items excluded for the quarter, Core FFO also excludes the impact of a one-time cost associated with the Company’s reincorporation as a Maryland corporation of $0.5 million incurred during the second quarter of 2021. For the year ended December 31, 2020, Core FFO excludes the impact of (i) accelerated amortization of stock compensation expense of $1.7 million related to the retirement of our former President and CEO and (ii) non-capitalizable demolition costs of $0.3 million.
FAD for the quarter and year ended December 31, 2021 was $54.3 million and $210.7 million, respectively, representing an increase of 13.2% and 10.8%, respectively, from the same periods in 2020.The increase in FAD for the quarter and year ended December 31, 2021 and 2020 is primarily attributable to higher Cash NOI driven by higher weighted average occupancy, higher rent growth, decrease in rent deferrals (net of amounts repaid,) a decrease in rent abatements in 2021 compared to the same periods in prior year and lower preferred distributions resulting from the redemption of Series W preferred stock during fourth quarter of 2021.
Same Park NOI was $72.2 million and $280.9 million for the three months and year ended December 31, 2021, respectively, representing increases of 8.6% and 7.0% over the same periods in 2020, respectively.
The Company also reports NOI on a cash basis, which excludes non-cash rental income such as amortization of deferred rent receivable and other non-cash items, and also excludes rents that have been deferred or abated during the period. Same Park Cash NOI was $71.8 million and $279.8 million for the quarter and year ended December 31, 2021, respectively, representing increases of 6.5% and 8.0% over the same periods in 2020, respectively. The increase in Same Park Cash NOI for the three months ended December 31, 2021 was primarily driven by higher weighted average occupancy in the fourth quarter of 2021, which was 95.7% versus 92.7% in the fourth quarter of 2020. The increase in Same Park Cash NOI for the year ended December 31, 2021 was primarily driven by higher weighted average occupancy, which was 94.4% in 2021 versus 92.7% in 2020. The Company noted that Same Park Cash Rental Income per occupied square foot increased by 4.9% during the year, from $15.76 in 2020 to $16.53 in 2021.
2
The following table presents the unaudited details of the change in Same Park rental income for the three months and years ended December 31, 2021 and 2020 (in thousands):
| For the Three Months | For the Years | |||||||||||||||||||||||||||||||
| Ended December 31, | Ended December 31, | |||||||||||||||||||||||||||||||
|
|
|
|
|
|
|
|||||||||||||||||||||||||||
| 2021 | 2020 | $ Change | % Change | 2021 | 2020 | $ Change | % Change | |||||||||||||||||||||||||
|
|
|
|
|
|
|
|
|
|
|
|
|
|
|
|
|
|
| |||||||||||||||
| Rental income |
||||||||||||||||||||||||||||||||
| Base rental income |
$ | 74,607 | $ | 70,432 | $ | 4,175 | 5.9% | $ | 291,169 | $ | 280,499 | $ | 10,670 | 3.8% | ||||||||||||||||||
| Expense recovery income |
24,591 | 22,265 | 2,326 | 10.4% | 96,248 | 88,534 | 7,714 | 8.7% | ||||||||||||||||||||||||
| Lease buyout income |
538 | 257 | 281 | 109.3% | 1,856 | 1,044 | 812 | 77.8% | ||||||||||||||||||||||||
| Rent receivable recovery/(write-off) |
(73 | ) | (195 | ) | 122 | (62.6%) | (12 | ) | (1,515 | ) | 1,503 | (99.2%) | ||||||||||||||||||||
| Abatements |
(8 | ) | (96 | ) | 88 | (91.7%) | (312 | ) | (1,285 | ) | 973 | (75.7%) | ||||||||||||||||||||
| Deferrals |
— | (109 | ) | 109 | (100.0%) | (292 | ) | (5,253 | ) | 4,961 | (94.4%) | |||||||||||||||||||||
| Deferral repayments |
250 | 1,787 | (1,537 | ) | (86.0%) | 1,773 | 2,953 | (1,180 | ) | (40.0%) | ||||||||||||||||||||||
| Fee Income |
101 | 225 | (124 | ) | (55.1%) | 695 | 904 | (209 | ) | (23.1%) | ||||||||||||||||||||||
|
|
|
|
|
|
|
|
|
|
|
|
|
|
|
|
|
|
|
|||||||||||||||
| Cash Rental Income |
100,006 | 94,566 | 5,440 | 5.8% | 391,125 | 365,881 | 25,244 | 6.9% | ||||||||||||||||||||||||
| Non-Cash Rental Income (1) |
414 | (959 | ) | 1,373 | (143.2%) | 1,096 | 3,567 | (2,471 | ) | (69.3%) | ||||||||||||||||||||||
|
|
|
|
|
|
|
|
|
|
|
|
|
|
|
|
|
|
|
|||||||||||||||
| Total rental income |
$ | 100,420 | $ | 93,607 | $ | 6,813 | 7.3% | $ | 392,221 | $ | 369,448 | $ | 22,773 | 6.2% | ||||||||||||||||||
|
|
|
|
|
|
|
|
|
|
|
|
|
|
|
|
|
|
|
|||||||||||||||
| (1) | Non-cash rental income includes amortization of deferred rent receivable (net of write-offs), in-place lease intangible, tenant improvement reimbursement, and lease incentives. |
The following table presents the unaudited operating results of the Company’s Same Park facilities for the three months and years ended December 31, 2021 and 2020 (in thousands, except per square foot amounts):
| For the Three Months | For the Years | |||||||||||||||||||||||||||||||
| Ended December 31, | Ended December 31, | |||||||||||||||||||||||||||||||
|
|
|
|
|
|
|
|||||||||||||||||||||||||||
| 2021 | 2020 | $ Change | % Change | 2021 | 2020 | $ Change | % Change | |||||||||||||||||||||||||
|
|
|
|
|
|
|
|
|
|
|
|
|
|
|
|
|
|
| |||||||||||||||
| Rental income |
||||||||||||||||||||||||||||||||
| Cash Rental Income (1) (2) |
$ | 100,006 | $ | 94,566 | $ | 5,440 | 5.8% | $ | 391,125 | $ | 365,881 | $ | 25,244 | 6.9% | ||||||||||||||||||
| Non-Cash Rental Income (1) (3) |
414 | (959 | ) | 1,373 | (143.2%) | 1,096 | 3,567 | (2,471 | ) | (69.3%) | ||||||||||||||||||||||
|
|
|
|
|
|
|
|
|
|
|
|
|
|
|
|
|
|
|
|||||||||||||||
| Total rental income |
100,420 | 93,607 | 6,813 | 7.3% | 392,221 | 369,448 | 22,773 | 6.2% | ||||||||||||||||||||||||
|
|
||||||||||||||||||||||||||||||||
| Adjusted Cost of Operations (1) |
||||||||||||||||||||||||||||||||
| Property taxes |
9,936 | 9,827 | 109 | 1.1% | 41,958 | 41,184 | 774 | 1.9% | ||||||||||||||||||||||||
| Utilities |
4,746 | 4,235 | 511 | 12.1% | 18,066 | 17,170 | 896 | 5.2% | ||||||||||||||||||||||||
| Repairs and maintenance |
6,452 | 6,680 | (228 | ) | (3.4%) | 23,064 | 22,697 | 367 | 1.6% | |||||||||||||||||||||||
| Compensation |
4,137 | 3,835 | 302 | 7.9% | 16,082 | 15,522 | 560 | 3.6% | ||||||||||||||||||||||||
| Snow removal |
9 | 162 | (153 | ) | (94.4%) | 1,021 | 233 | 788 | 338.2% | |||||||||||||||||||||||
| Property insurance |
1,227 | 1,036 | 191 | 18.4% | 4,778 | 3,943 | 835 | 21.2% | ||||||||||||||||||||||||
| Other expenses |
1,678 | 1,340 | 338 | 25.2% | 6,364 | 6,111 | 253 | 4.1% | ||||||||||||||||||||||||
|
|
|
|
|
|
|
|
|
|
|
|
|
|
|
|
|
|
|
|||||||||||||||
| Total Adjusted Cost of Operations |
28,185 | 27,115 | 1,070 | 3.9% | 111,333 | 106,860 | 4,473 | 4.2% | ||||||||||||||||||||||||
|
|
|
|
|
|
|
|
|
|
|
|
|
|
|
|
|
|
|
|||||||||||||||
| NOI (1) |
$ | 72,235 | $ | 66,492 | $ | 5,743 | 8.6% | $ | 280,888 | $ | 262,588 | $ | 18,300 | 7.0% | ||||||||||||||||||
|
|
|
|
|
|
|
|
|
|
|
|
|
|
|
|
|
|
|
|||||||||||||||
|
|
||||||||||||||||||||||||||||||||
| Cash NOI (1) |
$ | 71,821 | $ | 67,451 | $ | 4,370 | 6.5% | $ | 279,792 | $ | 259,021 | $ | 20,771 | 8.0% | ||||||||||||||||||
|
|
||||||||||||||||||||||||||||||||
| Selected Statistical Data |
||||||||||||||||||||||||||||||||
| Rentable square footage at period end |
25,053 | 25,053 | — | — | 25,053 | 25,053 | — | — | ||||||||||||||||||||||||
| NOI margin (1) |
71.9% | 71.0% | — | 0.9% | 71.6% | 71.1% | — | 0.5% | ||||||||||||||||||||||||
| Cash NOI margin (1) |
71.8% | 71.3% | — | 0.5% | 71.5% | 70.8% | — | 0.7% | ||||||||||||||||||||||||
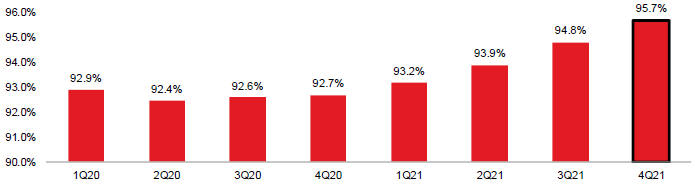
| Weighted average square foot occupancy |
95.7% | 92.7% | — | 3.0% | 94.4% | 92.7% | — | 1.7% | ||||||||||||||||||||||||
| Revenue per Occupied Square Foot (1) |
$ | 16.74 | $ | 16.12 | $ | 0.62 | 3.8% | $ | 16.58 | $ | 15.91 | $ | 0.67 | 4.2% | ||||||||||||||||||
| Revenue per Available Foot (RevPAF) (1) |
$ | 16.03 | $ | 14.95 | $ | 1.08 | 7.2% | $ | 15.66 | $ | 14.75 | $ | 0.91 | 6.2% | ||||||||||||||||||
| Cash Rental Income per Occupied Square Foot (1) |
$ | 16.67 | $ | 16.29 | $ | 0.38 | 2.3% | $ | 16.53 | $ | 15.76 | $ | 0.77 | 4.9% | ||||||||||||||||||
| Cash Rental Income per Available Foot (1) |
$ | 15.97 | $ | 15.10 | $ | 0.87 | 5.8% | $ | 15.61 | $ | 14.60 | $ | 1.01 | 6.9% | ||||||||||||||||||
| (1) | Defined in Definitions/Non-GAAP Discussion. |
| (2) | Detail of the components of Cash Rental Income can be found in the table presented under financial results above. |
| (3) | Same Park Non-Cash Rental Income is presented net of deferred rent receivable write-offs of $0.1 million and $0.4 million for the three months ended December 31, 2021 and 2020, respectively, and $0.3 million and $3.0 million for the years ended December 31, 2021 and 2020, respectively. |
3
Operating Results:
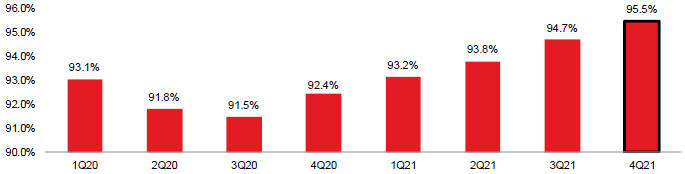
Total portfolio weighted average occupancy(1) was 95.5% and 94.3% during the three and twelve months ended December 31, 2021, respectively, compared to 92.4% and 92.2% for the same periods in 2020.
Leasing Production (2)
During the three months and year ended December 31, 2021, the Company executed leases on 1.8 million and 7.4 million square feet, respectively, compared to 1.8 million and 7.1 million for the three months and year ended December 31, 2020, respectively. The table below represents cash rental rate growth and net effective rent growth (3) by product type for leases executed during the three months and year ended December 31, 2021.
| For the Three Months ended December 31, 2021 | For the Twelve Months ended December 31, 2021 | |||||||||||||||||||||||||||
|
Product type |
Leasing volume |
Cash rental rate growth |
Net effective rent growth(3) |
Leasing volume |
Cash rental rate growth |
Net effective rent growth(3) |
||||||||||||||||||||||
| Industrial |
1,246,000 | 11.5% | 25.7% | 5,211,000 | 9.4% | 21.7% | ||||||||||||||||||||||
| Industrial-flex |
302,000 | 1.2% | 8.0% | 1,514,000 | 1.0% | 7.2% | ||||||||||||||||||||||
| Office |
207,000 | -2.3% | 4.7% | 712,000 | -5.6% | 0.7% | ||||||||||||||||||||||
|
|
|
|
|
|||||||||||||||||||||||||
| Total |
1,755,000 | 6.1% | 16.4% | 7,437,000 | 5.2% | 14.7% | ||||||||||||||||||||||
The average lease term of the leases executed during the three months ended December 31, 2021 was 3.6 years, with associated average transaction costs (tenant improvements and leasing commissions) of $3.15 per square foot. For comparative purposes, average lease term and transaction costs on leases executed in the same period of 2020 were 3.3 years and $2.90 per square foot, respectively.
For the three and twelve months ended December 31, 2021 and for all comparative periods presented herein, the Company has excluded assets held for sale as of December 31, 2021 as follows:
| ● | 702,000 square foot industrial-flex business park located in Irving, Texas. |
For the three and twelve months ended December 31, 2021 and for all comparative periods presented herein, the Company has also excluded assets sold in 2021 as follows:
| ● | 198,000 square foot office-oriented flex business park located in Chantilly, Virginia, sold in June 2021; |
| ● | 244,000 square foot office park located in Herndon, Virginia, sold in July 2021; |
| ● | 22,000 square foot industrial-flex building located in Irving, Texas, sold in September 2021; |
| ● | 371,000 square foot industrial-flex business park located in San Diego, California, sold in October 2021; |
| ● | 53,000 square foot industrial building located in Beltsville, Maryland, sold in December 2021, and |
| ● | 70,000 square foot industrial-flex business building located in Irving, Texas, sold in December 2021. |
Also excluded from the respective periods in 2020 are assets sold comprising 40,000 square feet sold in September 2020 and 113,000 square feet sold in January 2020.
| (1) | Total portfolio occupancy statistics exclude assets sold or held for sale as of December 31, 2021. |
| (2) | Leasing Production excludes assets sold or held for sale as of December 31, 2021. |
| (3) | Net effective rent represents average rental payments for the term of a lease on a straight-line basis in accordance with U.S. generally accepted accounting principles (“GAAP”) and excludes operating expense reimbursements. |
4
Quarterly Financial Data
The following table summarizes unaudited selected quarterly financial data with respect to the Same Park portfolio (in thousands, except per square foot amounts.)
| For the Three Months Ended | ||||||||||||||||||||
| March 31 | June 30 | September 30 | December 31 | Full Year | ||||||||||||||||
| Cash Rental income (1) |
||||||||||||||||||||
| 2021 |
$ | 95,010 | $ | 96,948 | $ | 99,161 | $ | 100,006 | $ | 391,125 | ||||||||||
| 2020 |
$ | 93,109 | $ | 86,705 | $ | 91,501 | $ | 94,566 | $ | 365,881 | ||||||||||
|
|
||||||||||||||||||||
| Adjusted Cost of Operations (1) |
||||||||||||||||||||
| 2021 |
$ | 28,017 | $ | 26,661 | $ | 28,470 | $ | 28,185 | $ | 111,333 | ||||||||||
| 2020 |
$ | 26,669 | $ | 25,439 | $ | 27,637 | $ | 27,115 | $ | 106,860 | ||||||||||
|
|
||||||||||||||||||||
| Cash NOI (1) |
||||||||||||||||||||
| 2021 |
$ | 66,993 | $ | 70,287 | $ | 70,691 | $ | 71,821 | $ | 279,792 | ||||||||||
| 2020 |
$ | 66,440 | $ | 61,266 | $ | 63,864 | $ | 67,451 | $ | 259,021 | ||||||||||
|
|
||||||||||||||||||||
| Weighted average square foot occupancy |
|
|||||||||||||||||||
| 2021 |
93.2% | 93.9% | 94.8% | 95.7% | 94.4% | |||||||||||||||
| 2020 |
92.9% | 92.4% | 92.6% | 92.7% | 92.7% | |||||||||||||||
|
|
||||||||||||||||||||
| Cash Rental Income per Occupied Square Foot (1) |
|
|||||||||||||||||||
| 2021 |
$ | 16.28 | $ | 16.49 | $ | 16.70 | $ | 16.67 | $ | 16.53 | ||||||||||
| 2020 |
$ | 16.00 | $ | 14.97 | $ | 15.78 | $ | 16.29 | $ | 15.76 | ||||||||||
|
|
||||||||||||||||||||
| Cash Rental Income per Available Square Foot (1) |
|
|||||||||||||||||||
| 2021 |
$ | 15.17 | $ | 15.48 | $ | 15.83 | $ | 15.97 | $ | 15.61 | ||||||||||
| 2020 |
$ | 14.87 | $ | 13.84 | $ | 14.61 | $ | 15.10 | $ | 14.60 | ||||||||||
| (1) | Defined in Definitions/Non-GAAP Discussion. |
COVID-19 Pandemic/Rent Collections Update
During the three months ended December 31, 2021, the Company granted $0 of rent deferral and $0 of rent abatement compared to the $0.2 million of rent deferral and $0.1 million of rent abatement granted for the three months ended December 31, 2020. During the year ended December 31, 2021, the Company granted $0.5 million of rent deferral and $0.3 million of rent abatement which was significantly lower than the $5.7 million of rent deferrals and $1.3 million of rent abatements granted during the year ended December 31, 2020. Since the onset of the COVID-19 pandemic, the Company has entered into rent relief agreements consisting of $6.2 million of rent deferrals and $1.6 million of rent abatements. As of December 31, 2021, the 317 current customers that received rent relief account for 9.5% of rental income. Also as of December 31, 2021, the Company had collected $5.3 million of rent deferral repayment, representing 99.8% of the amounts scheduled to be repaid through December 2021. An additional $0.9 million of rent deferral repayment is scheduled to be repaid thereafter.
As of February 18, 2022, the Company had collected 99.9% of revenue billed during the year ended December 31, 2021. The Company noted that the fourth quarter of 2021 marked the sixth consecutive quarter of normal accounts receivable write-off activity. During the three months and year ended December 31, 2021, the Company wrote off $0.1 million and $0.1 million of accounts receivable, net of recoveries, respectively, compared to $0.2 million and $1.6 million written off during the three months and year ended December 31, 2020, respectively. During the three months and year ended December 31, 2021, the Company wrote off $0.1 million and $0.3 million of deferred rent receivable, respectively, which is significantly lower than the $0.4 million and $3.1 million written off during the three months and year ended December 31, 2020, respectively.
5
As of December 31, 2021, the Company had open rent relief requests from less than 1% of its customers. See “Management’s Discussion and Analysis of Financial Condition and Results of Operations–Certain Factors that May Impact Future Results–Impact of COVID-19 Pandemic” in our Form 10-K for the year ended December 31, 2021 for more information.
Acquisition and Dispositions Update
In December 2021, the Company acquired Jupiter Business Park, a 141,000 square foot industrial business park located in Plano, Texas, for a total purchase price of $25.6 million, inclusive of capitalized transaction cost.
In December 2021, the Company sold a 53,000 square foot industrial building, that was part of Ammendale, located in Beltsville, Maryland, for net sale proceeds of $4.5 million and gain on sale of $3.2 million and Royal Tech 10 a 70,000 square foot industrial-flex business park located in Irving, Texas, for net sale proceeds of $8.8 million and gain on sale of $6.3 million.
In October 2021, the Company sold Lusk, a 371,000 square foot industrial-flex business park located in San Diego, California, for net sale proceeds of $311.1 million and gain on sale of $301.2 million.
Capital Activity
On November 3, 2021, the Company redeemed all outstanding depositary shares representing interests in its 5.20% Cumulative Preferred Stock, Series W, at $25.00 per share plus accrued dividends from October 1, 2021, through the date of redemption. The aggregate redemption amount, inclusive of prorated dividends, paid to the holders was $190.7 million. The Company recorded a non-cash charge related to the redemption of preferred securities of $6.4 million for the three months and year ended December 31, 2021.
Distributions Declared
On February 21, 2022, the Company’s Board of Directors declared a quarterly dividend of $1.05 per common share. Distributions were also declared on the various series of depositary shares, each representing 1/1,000 of a share of preferred stock. Distributions for both shares of common stock and preferred stock will be payable on March 31, 2022 to stockholders of record on March 16, 2022.
Supplemental Information and Investor Presentation:
The Company’s supplemental financial reporting package as well as an updated investor presentation are available on the Company’s investor relations website at www.ir.psbusinessparks.com.
Earnings Release, Investor Conference Webcast and Conference Call:
The Company will host a webcast and conference call on Wednesday, February 23, 2022, at 10:00 a.m. PST (1:00 p.m. EST) to review fourth quarter results, discuss recent events and conduct a question-and-answer period. The live webcast will be available on the Company’s investor relations website at ir.psbusinessparks.com.
To Participate in the Telephone Conference Call:
Phone #: (866) 831-8713
Pass Code: PSBQ421
Conference Call Playback:
Phone #: (800) 925-9942
The playback can be accessed through March 2, 2022.
6
Company Information
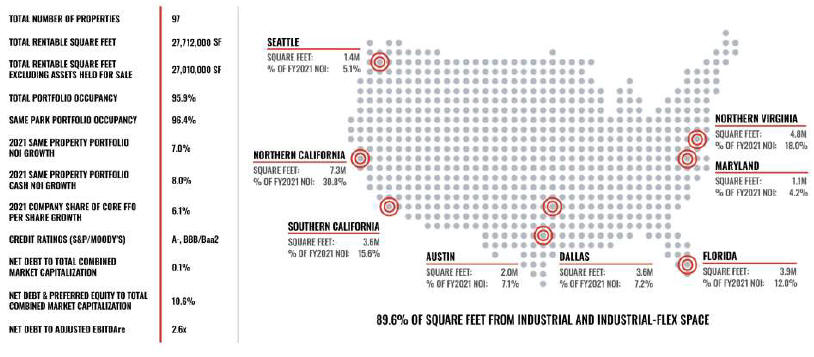
PS Business Parks, Inc. (NYSE:PSB), a S&P MidCap 400 company, is a REIT that acquires, develops, owns, and operates commercial properties, predominantly multi-tenant industrial, industrial-flex, and low-rise suburban office space. Located primarily in major coastal markets, PS Business Parks’ 97 properties serve approximately 5,000 tenants in 28 million square feet of space as of December 31, 2021. The portfolio also includes 800 residential units (including units in-process).
Forward-Looking Statements
When used within this press release, the words “may,” “believes,” “anticipates,” “plans,” “expects,” “seeks,” “estimates,” “intends,” and similar expressions are intended to identify “forward-looking statements.” Such forward-looking statements involve known and unknown risks, uncertainties, and other factors, which may cause the actual results and performance of the Company to be materially different from those expressed or implied in the forward-looking statements, including but not limited to: (i) the duration and severity of the COVID-19 pandemic and its impact on our business and our customers; (ii) changes in general economic and business conditions, including as a result of the economic fallout of the COVID-19 pandemic; (iii) potential regulatory actions to close our facilities or limit our ability to evict delinquent customers; (iv) decreases in rental rates or increases in vacancy rates/failure to renew or replace expiring leases; (v) tenant defaults; (vi) the effect of the recent credit and financial market conditions; (vii) our failure to maintain our status as a REIT under the Internal Revenue Code of 1986, as amended (the “Code”); (viii) the economic health of our customers; (ix) the health of our officers and directors; (x) increases in operating costs; (xi) casualties to our properties not covered by insurance; (xii) the availability and cost of capital; (xiii) increases in interest rates and its effect on our stock price; (xiv) security breaches, including ransomware, or a failure of our networks, systems or technology which could adversely impact our operations or our business, customer and employee relationships or result in fraudulent payments; (xv) the impact of inflation; and (xvi) other factors discussed in the Company’s SEC reports, including quarterly reports on Form 10-Q, reports on Form 8-K, and annual reports on Form 10-K.
Additional information about PS Business Parks, Inc., including more financial analysis of the fourth quarter operating results, is available on the Company’s website at psbusinessparks.com.
Definitions/Discussion of Non-GAAP Financial Measures:
Adjusted Cost of Operations: Adjusted cost of operations represents cost of operations, excluding non-cash stock compensation expense for employees whose compensation expense is recorded in cost of operations, which can vary significantly period to period based upon the performance of the Company. The GAAP measure most directly comparable to adjusted cost of operations is cost of operations.
Cash NOI: Cash NOI represents NOI adjusted to exclude non-cash items included in rental income and in cost of operations. The non-cash rental income includes amortization of deferred rent receivable (net of write-offs), in-place lease intangible, tenant improvement reimbursements, and lease incentives. The non-cash expense is equal to stock compensation expense for employees whose compensation expense is recorded in cost of operations. We believe that cash NOI assists investors in analyzing cash flow performance of our business parks. The GAAP measure most directly comparable to cash NOI is net income.
Cash NOI Margin: Cash NOI margin is computed by dividing Cash NOI by Cash Rental Income.
Cash Rental Income: Cash rental income represents rental income, excluding non-cash rental income, specifically amortization of deferred rent receivable (net of write-offs), in-place lease intangible, tenant improvement reimbursements, and lease incentives.
Cash Rental Income per Occupied Square Feet and Cash Rental Income per Available Square Foot: Computed by dividing Cash Rental Income for the period by weighted average occupied and available square feet for the same period. Cash rental income per occupied and available square foot for the three-month period shown is annualized.
Core Funds from Operations (Core FFO): We calculate Core FFO by adjusting FFO, as defined below, excluding the impact of (i) charges related to the redemption of preferred stock and (ii) other nonrecurring income or expense items as appropriate. Management believes that Core FFO is a useful supplemental measure as it provides a more meaningful and consistent comparison of operating performance and allows investors to more easily compare the Company’s operating results. Because certain of these adjustments have a real economic impact on our financial condition and results from operations, the utility of Core FFO as a measure of our performance is limited. Other REITs may not calculate Core FFO in a consistent manner. Accordingly, our Core FFO may not be comparable to other REITs’ Core FFO. Core FFO should be considered only as a supplement to net income computed in accordance with GAAP as a measure of our performance.
7
Funds Available for Distribution (FAD): FAD is a non-GAAP measure that represents Core FFO adjusted to (a) deduct recurring capital improvements that maintains the condition of our real estate, tenant improvements and lease commissions and (b) remove certain non-cash rental income or expenses such as amortization of deferred rent receivable and non-cash stock compensation expense. We believe our presentation of FAD assists investors and analysts in analyzing and comparing our operating and financial performance between reporting periods. FAD is not a substitute for GAAP net cash flow in evaluating our liquidity or ability to pay dividends, because they exclude investing and financing activities presented on our statements of cash flows. The GAAP measure most directly comparable to FAD is operating cash flow from our statements of cash flows.
Funds from Operations (FFO): We calculate FFO in accordance with the standards established by the National Association of Real Estate Investment Trusts (“NAREIT”). FFO represents net income (loss) (computed in accordance with GAAP), excluding gains (or losses) from sales of depreciable operating property, gains (or losses) from sales of assets incidental to our business, impairment losses of depreciable operating property or assets incidental to our business, real estate related depreciation and amortization (excluding amortization of deferred financing costs and amortization of above/below-market lease intangibles) and after adjustments for unconsolidated joint ventures. Management uses FFO as a supplemental performance measure because, in excluding real estate related depreciation and amortization, gains and losses from property dispositions, other than temporary impairments of unconsolidated real estate entities, and impairment on our investment in real estate, it provides a performance measure that, when compared year over year, captures trends in occupancy rates, rental rates and operating costs. We also believe that, as a widely recognized measure of performance used by other REITs, FFO may be used by investors as a basis to compare our operating performance with that of other REITs. However, because FFO excludes depreciation and amortization and captures neither the changes in the value of our properties that result from use or market conditions nor the level of capital expenditures and leasing commissions necessary to maintain the operating performance of our properties, all of which have real economic effects and could materially impact our results from operations, the utility of FFO as a measure of our performance is limited. Other equity REITs may not calculate or interpret FFO in accordance with the NAREIT definition as we do, and, accordingly, our FFO may not be comparable to such other REITs’ FFO. FFO should not be used as a measure of our liquidity and is not indicative of funds available for our cash needs, including our ability to pay dividends. FFO should be considered only as a supplement to net income computed in accordance with GAAP as a measure of our performance. A reconciliation of net income, the nearest GAAP equivalent, to FFO is under the additional financial data section.
Net Operating Income (NOI): We utilize NOI, a non-GAAP financial measure, to evaluate the operating performance of our business parks. We define NOI as rental income less adjusted cost of operations (described above). We believe NOI assists investors in analyzing the performance and value of our business parks by excluding (i) corporate overhead (i.e. general and administrative expenses) because it does not relate to the results of our business parks, (ii) depreciation and amortization expense because it does not accurately reflect changes in the fair value of our business parks and (iii) non-cash stock compensation expense because this expense item can vary significantly from period to period and thus impact comparability across periods. The GAAP measure most directly comparable to NOI is net income.
NOI Margin: NOI margin is computed by dividing NOI by rental income.
Revenue Per Occupied Square Foot and Revenue per Available Square Foot (RevPAF): Computed by dividing rental income for the period by weighted average occupied and available square feet for the same period. Revenue per occupied square foot and RevPAF for the three month period shown is annualized.
Same Park Portfolio: The Company believes that evaluation of the Same Park portfolio, defined as all properties owned and operated as of December 31, 2021 that were acquired prior to January 1, 2019, provides an informative view of how the Company’s portfolio has performed over comparable periods. As of December 31, 2021, the Same Park portfolio consisted of 25.1 million rentable square feet, or 92.8% of the Company’s 27.0 million total rentable square feet, excluding the Company’s 95.0% interest in a 395-unit multifamily property and 702,000 square feet of assets held for sale.
Additional financial data attached.
8
PS BUSINESS PARKS, INC.
CONSOLIDATED BALANCE SHEETS
(In thousands, except share data)
| December 31, | ||||||||
| 2021 | 2020 | |||||||
| ASSETS |
||||||||
|
|
||||||||
| Cash and cash equivalents |
$ | 27,074 | $ | 69,083 | ||||
|
|
||||||||
| Real estate facilities, at cost |
||||||||
| Land |
867,345 | 843,765 | ||||||
| Buildings and improvements |
2,239,137 | 2,080,895 | ||||||
|
|
|
|
|
|
| |||
| 3,106,482 | 2,924,660 | |||||||
| Accumulated depreciation |
(1,178,397 | ) | (1,101,739 | ) | ||||
|
|
|
|
|
|
| |||
| 1,928,085 | 1,822,921 | |||||||
| Properties held for sale, net |
33,609 | 75,138 | ||||||
| Land and building held for development, net |
78,990 | 37,922 | ||||||
|
|
|
|
|
|
| |||
| 2,040,684 | 1,935,981 | |||||||
| Rent receivable |
1,621 | 1,519 | ||||||
| Deferred rent receivable |
37,581 | 36,788 | ||||||
| Other assets |
16,262 | 14,334 | ||||||
|
|
|
|
|
|
| |||
| Total assets |
$ | 2,123,222 | $ | 2,057,705 | ||||
|
|
|
|
|
|
| |||
|
|
||||||||
| LIABILITIES AND EQUITY |
||||||||
|
|
||||||||
| Accrued and other liabilities |
$ | 97,151 | $ | 82,065 | ||||
| Credit facility |
32,000 | — | ||||||
|
|
|
|
|
|
| |||
| Total liabilities |
129,151 | 82,065 | ||||||
| Commitments and contingencies |
||||||||
| Equity |
||||||||
| PS Business Parks, Inc.’s stockholders’ equity |
||||||||
| Preferred stock, $0.01 par value, 50,000,000 shares authorized, 30,200 and 37,790 shares issued and outstanding at December 31, 2021 and 2020, respectively |
755,000 | 944,750 | ||||||
| Common stock, $0.01 par value, 100,000,000 shares authorized, 27,589,807 and 27,488,547 shares issued and outstanding at December 31, 2021 and 2020, respectively |
275 | 274 | ||||||
| Paid-in capital |
752,444 | 738,022 | ||||||
| Accumulated earnings |
226,737 | 73,631 | ||||||
|
|
|
|
|
|
| |||
| Total PS Business Parks, Inc.’s stockholders’ equity |
1,734,456 | 1,756,677 | ||||||
| Noncontrolling interests |
259,615 | 218,963 | ||||||
|
|
|
|
|
|
| |||
| Total equity |
1,994,071 | 1,975,640 | ||||||
|
|
|
|
|
|
| |||
| Total liabilities and equity |
$ | 2,123,222 | $ | 2,057,705 | ||||
|
|
|
|
|
|
| |||
9
PS BUSINESS PARKS, INC.
CONSOLIDATED STATEMENTS OF INCOME
(In thousands, except per share amounts)
| For the Three Months Ended December 31, |
For the Years Ended December 31, | |||||||||||||||
| 2021 | 2020 | 2021 | 2020 | |||||||||||||
|
|
||||||||||||||||
| Rental income |
$ | 110,844 | $ | 105,088 | $ | 438,703 | $ | 415,623 | ||||||||
|
|
||||||||||||||||
| Expenses |
||||||||||||||||
| Cost of operations |
32,738 | 32,023 | 130,896 | 125,513 | ||||||||||||
| Depreciation and amortization |
24,130 | 23,668 | 93,486 | 96,314 | ||||||||||||
| General and administrative |
4,728 | 3,152 | 19,057 | 14,526 | ||||||||||||
|
|
|
|
|
|
|
|
|
|
|
|
| |||||
| Total operating expenses |
61,596 | 58,843 | 243,439 | 236,353 | ||||||||||||
|
|
|
|
|
|
|
|
|
|
|
|
| |||||
|
|
||||||||||||||||
| Interest and other income |
946 | 222 | 2,536 | 1,234 | ||||||||||||
| Interest and other expense |
(3,943 | ) | (172 | ) | (4,646 | ) | (1,072 | ) | ||||||||
| Gain on sale of real estate facilities |
310,758 | — | 359,875 | 27,273 | ||||||||||||
|
|
|
|
|
|
|
|
|
|
|
|
| |||||
| Net income |
357,009 | 46,295 | 553,029 | 206,705 | ||||||||||||
| Allocation to noncontrolling interests |
(70,915 | ) | (7,147 | ) | (104,270 | ) | (33,158 | ) | ||||||||
|
|
|
|
|
|
|
|
|
|
|
|
| |||||
| Net income allocable to PS Business Parks, Inc. |
286,094 | 39,148 | 448,759 | 173,547 | ||||||||||||
| Allocation to preferred stockholders based upon Distributions |
(10,485 | ) | (12,047 | ) | (46,624 | ) | (48,186 | ) | ||||||||
| Preferred securities redemption charge |
(6,434 | ) | — | (6,434 | ) | — | ||||||||||
| Allocation to restricted stock unit holders |
(1,785 | ) | (173 | ) | (2,613 | ) | (716 | ) | ||||||||
|
|
|
|
|
|
|
|
|
|
|
|
| |||||
| Net income allocable to common stockholders |
$ | 267,390 | $ | 26,928 | $ | 393,088 | $ | 124,645 | ||||||||
|
|
|
|
|
|
|
|
|
|
|
|
| |||||
|
|
||||||||||||||||
| Net income per share of common stock |
||||||||||||||||
| Basic |
$ | 9.70 | $ | 0.98 | $ | 14.28 | $ | 4.54 | ||||||||
| Diluted |
$ | 9.66 | $ | 0.98 | $ | 14.22 | $ | 4.52 | ||||||||
|
|
||||||||||||||||
| Weighted average common stocks outstanding |
||||||||||||||||
| Basic |
27,565 | 27,488 | 27,534 | 27,475 | ||||||||||||
| Diluted |
27,671 | 27,572 | 27,636 | 27,563 | ||||||||||||
10
PS BUSINESS PARKS, INC.
Computation of FFO, Core FFO, and FAD
(In thousands, except per share amounts)
| For the Three Months Ended December 31, |
For the Years Ended December 31, | |||||||||||||||
| 2021 | 2020 | 2021 | 2020 | |||||||||||||
| Net income allocable to common stockholders |
$ | 267,390 | $ | 26,928 | $ | 393,088 | $ | 124,645 | ||||||||
| Adjustments |
||||||||||||||||
| Gain on sale of real estate facilities |
(310,758 | ) | — | (359,875 | ) | (27,273 | ) | |||||||||
| Depreciation and amortization expense |
24,130 | 23,668 | 93,486 | 96,314 | ||||||||||||
| Net income allocated to noncontrolling interests |
70,915 | 7,147 | 104,270 | 33,158 | ||||||||||||
| Net income allocated to restricted stock unit holders |
1,785 | 173 | 2,613 | 716 | ||||||||||||
| FFO allocated to joint venture partner |
(11 | ) | (16 | ) | (78 | ) | (118 | ) | ||||||||
|
|
|
|
|
|
|
|
|
|
|
|
| |||||
| FFO allocable to diluted common stock and units (1) |
53,451 | 57,900 | 233,504 | 227,442 | ||||||||||||
| Maryland reincorporation costs |
— | — | 510 | — | ||||||||||||
| Non-capitalizable demolition costs |
— | — | — | 335 | ||||||||||||
| Acceleration of stock compensation expense due to President and Chief Executive Officer retirement |
— | — | — | 1,687 | ||||||||||||
| Preferred securities redemption charge |
6,434 | — | 6,434 | — | ||||||||||||
| Income tax expense |
3,600 | — | 3,600 | — | ||||||||||||
|
|
|
|
|
|
|
|
|
|
|
|
| |||||
| Core FFO allocable to diluted common stock and units (1) |
63,485 | 57,900 | 244,048 | 229,464 | ||||||||||||
| Adjustments |
||||||||||||||||
| Recurring capital improvements |
(3,299 | ) | (3,108 | ) | (11,649 | ) | (9,521 | ) | ||||||||
| Tenant improvements |
(3,512 | ) | (4,909 | ) | (14,767 | ) | (15,948 | ) | ||||||||
| Capitalized lease commissions |
(3,281 | ) | (3,653 | ) | (8,719 | ) | (8,878 | ) | ||||||||
| Non-cash rental income (1) |
(857 | ) | 627 | (2,800 | ) | (4,713 | ) | |||||||||
| Non-cash stock compensation expense (2) |
2,073 | 1,257 | 8,495 | 3,961 | ||||||||||||
| Cash paid for taxes in lieu of stock upon vesting of restricted stock units |
(260 | ) | (114 | ) | (3,940 | ) | (4,216 | ) | ||||||||
|
|
|
|
|
|
|
|
|
|
|
|
| |||||
| FAD allocable to diluted common stock and units (1) |
$ | 54,349 | $ | 48,000 | $ | 210,668 | $ | 190,149 | ||||||||
|
|
|
|
|
|
|
|
|
|
|
|
| |||||
|
|
||||||||||||||||
| Distributions to common stockholders, noncontrolling interests, and restricted stock unit holders (3) |
$ | 36,833 | $ | 36,750 | $ | 147,163 | $ | 146,873 | ||||||||
| Distribution payout ratio |
67.8% | 76.6% | 69.9% | 77.2% | ||||||||||||
|
|
||||||||||||||||
| Reconciliation of Earnings per stock to FFO per share |
||||||||||||||||
| Net income per common stock—diluted |
$ | 9.66 | $ | 0.98 | $ | 14.22 | $ | 4.52 | ||||||||
| Gain on sale of real estate facilities |
(8.87 | ) | — | (10.29 | ) | (0.78 | ) | |||||||||
| Net income allocated to restricted stock unit holders |
0.05 | 0.01 | 0.07 | 0.02 | ||||||||||||
| Depreciation and amortization expense |
0.69 | 0.67 | 2.67 | 2.75 | ||||||||||||
|
|
|
|
|
|
|
|
|
|
|
|
| |||||
| FFO per share (1) |
$ | 1.53 | $ | 1.66 | $ | 6.67 | $ | 6.51 | ||||||||
| Maryland reincorporation costs |
— | — | 0.02 | — | ||||||||||||
| Non-capitalizable demolition costs |
— | — | — | 0.01 | ||||||||||||
| Acceleration of stock compensation expense due to President and Chief Executive Officer retirement |
— | — | — | 0.05 | ||||||||||||
| Preferred securities redemption charge |
0.18 | — | 0.18 | — | ||||||||||||
| Income tax expense |
0.10 | — | 0.10 | — | ||||||||||||
|
|
|
|
|
|
|
|
|
|
|
|
| |||||
| Core FFO per share (1) |
$ | 1.81 | $ | 1.66 | $ | 6.97 | $ | 6.57 | ||||||||
|
|
|
|
|
|
|
|
|
|
|
|
| |||||
|
|
||||||||||||||||
| Weighted average outstanding: |
||||||||||||||||
| Common stock |
27,565 | 27,488 | 27,534 | 27,475 | ||||||||||||
| Operating partnership units |
7,305 | 7,305 | 7,305 | 7,305 | ||||||||||||
| Restricted stock units |
46 | 57 | 50 | 51 | ||||||||||||
| Common stock equivalents |
106 | 84 | 102 | 88 | ||||||||||||
|
|
|
|
|
|
|
|
|
|
|
|
| |||||
| Total diluted common stock and units |
35,022 | 34,934 | 34,991 | 34,919 | ||||||||||||
|
|
|
|
|
|
|
|
|
|
|
|
| |||||
| (1) | Defined in Definitions/Non-GAAP Discussion |
| (2) | Amounts shown are net of accelerated stock compensation expense related to the former President and Chief Executive Officer retirement, which is also excluded from the computation of Core FFO. |
| (3) | Excludes special dividend distribution to common stockholders, noncontrolling interests and restricted stock unit holders. |
11
PS BUSINESS PARKS, INC.
Reconciliation of Selected Non-GAAP Measures to Analogous GAAP Measures
(In thousands)
| For the Three Months Ended December 31, |
For the Years Ended December 31, |
|||||||||||||||||||||||||||||||
| 2021 | 2020 | $ Change | % Change | 2021 | 2020 | $ Change | % Change | |||||||||||||||||||||||||
|
|
|
|
|
|
|
|
|
|
|
|
|
|
|
| ||||||||||||||||||
| Rental income |
||||||||||||||||||||||||||||||||
| Same Park (1) |
$ | 100,420 | $ | 93,607 | $ | 6,813 | 7.3% | $ | 392,221 | $ | 369,448 | $ | 22,773 | 6.2% | ||||||||||||||||||
| Non-Same Park |
5,664 | 3,126 | 2,538 | 81.2% | 17,829 | 9,311 | 8,518 | 91.5% | ||||||||||||||||||||||||
| Multifamily |
2,186 | 2,215 | (29 | ) | (1.3%) | 9,069 | 9,464 | (395 | ) | (4.2%) | ||||||||||||||||||||||
| Assets sold or held for sale (2) |
2,574 | 6,140 | (3,566 | ) | (58.1%) | 19,584 | 27,400 | (7,816 | ) | (28.5%) | ||||||||||||||||||||||
|
|
|
|
|
|
|
|
|
|
|
|
|
|
|
|
|
|
|
|||||||||||||||
| Total rental income |
110,844 | 105,088 | 5,756 | 5.5% | 438,703 | 415,623 | 23,080 | 5.6% | ||||||||||||||||||||||||
|
|
|
|
|
|
|
|
|
|
|
|
|
|
|
|
|
|
|
|||||||||||||||
|
|
||||||||||||||||||||||||||||||||
| Cost of operations |
||||||||||||||||||||||||||||||||
| Adjusted Cost of Operations (1) |
||||||||||||||||||||||||||||||||
| Same Park |
28,185 | 27,115 | 1,070 | 3.9% | 111,333 | 106,860 | 4,473 | 4.2% | ||||||||||||||||||||||||
| Non-Same Park |
1,794 | 1,054 | 740 | 70.2% | 5,523 | 3,661 | 1,862 | 50.9% | ||||||||||||||||||||||||
| Multifamily |
1,242 | 1,180 | 62 | 5.3% | 4,647 | 4,264 | 383 | 9.0% | ||||||||||||||||||||||||
| Assets sold or held for sale (2) |
1,125 | 2,247 | (1,122 | ) | (49.9%) | 7,636 | 9,518 | (1,882 | ) | (19.8%) | ||||||||||||||||||||||
| Stock compensation expense (3) |
392 | 427 | (35 | ) | (8.2%) | 1,757 | 1,210 | 547 | 45.2% | |||||||||||||||||||||||
|
|
|
|
|
|
|
|
|
|
|
|
|
|
|
|
|
|
|
|||||||||||||||
| Total cost of operations |
32,738 | 32,023 | 715 | 2.2% | 130,896 | 125,513 | 5,383 | 4.3% | ||||||||||||||||||||||||
|
|
|
|
|
|
|
|
|
|
|
|
|
|
|
|
|
|
|
|||||||||||||||
|
|
||||||||||||||||||||||||||||||||
| Net operating income (2) |
||||||||||||||||||||||||||||||||
| Same Park |
72,235 | 66,492 | 5,743 | 8.6% | 280,888 | 262,588 | 18,300 | 7.0% | ||||||||||||||||||||||||
| Non-Same Park |
3,870 | 2,072 | 1,798 | 86.8% | 12,306 | 5,650 | 6,656 | 117.8% | ||||||||||||||||||||||||
| Multifamily |
944 | 1,035 | (91 | ) | (8.8%) | 4,422 | 5,200 | (778 | ) | (15.0%) | ||||||||||||||||||||||
| Assets sold or held for sale (2) |
1,449 | 3,893 | (2,444 | ) | (62.8%) | 11,948 | 17,882 | (5,934 | ) | (33.2%) | ||||||||||||||||||||||
| Stock compensation expense (3) |
(392 | ) | (427 | ) | 35 | (8.2%) | (1,757 | ) | (1,210 | ) | (547 | ) | 45.2% | |||||||||||||||||||
| Depreciation and amortization expense |
(24,130 | ) | (23,668 | ) | (462 | ) | 2.0% | (93,486 | ) | (96,314 | ) | 2,828 | (2.9%) | |||||||||||||||||||
| General and administrative expense |
(4,728 | ) | (3,152 | ) | (1,576 | ) | 50.0% | (19,057 | ) | (14,526 | ) | (4,531 | ) | 31.2% | ||||||||||||||||||
| Interest and other income |
946 | 222 | 724 | 326.1% | 2,536 | 1,234 | 1,302 | 105.5% | ||||||||||||||||||||||||
| Interest and other expense |
(3,943 | ) | (172 | ) | (3,771 | ) | 2192.4% | (4,646 | ) | (1,072 | ) | (3,574 | ) | 333.4% | ||||||||||||||||||
| Gain on sale of real estate facilities |
310,758 | — | 310,758 | 100.0% | 359,875 | 27,273 | 332,602 | 1219.5% | ||||||||||||||||||||||||
|
|
|
|
|
|
|
|
|
|
|
|
|
|
|
|
|
|
|
|||||||||||||||
| Net income |
$ | 357,009 | $ | 46,295 | $ | 310,714 | 671.2% | $ | 553,029 | $ | 206,705 | $ | 346,324 | 167.5% | ||||||||||||||||||
|
|
|
|
|
|
|
|
|
|
|
|
|
|
|
|
|
|
|
|||||||||||||||
| (1) | Defined in Definitions/Non-GAAP Discussion. |
| (2) | As of December 31, 2021 and 2020, the Company had reclassified to properties held for sale a 702,000 square foot industrial-flex business park located in Irving, Texas. Also included in the respective periods are assets sold in 2021 and 2020: |
| ● | 198,000 square foot office-oriented flex business park located in Chantilly, Virginia, sold in June 2021; |
| ● | 244,000 square foot office park located in Herndon, Virginia, sold in July 2021; |
| ● | 22,000 square foot industrial-flex building located in Irving, Texas, sold in September 2021; |
| ● | 371,000 square foot industrial-flex business park located in San Diego, California, sold in October 2021; |
| ● | 53,000 square foot industrial building located in Beltsville, Maryland, sold in December 2021; |
| ● | 70,000 square foot industrial-flex building located in Irving, Texas, sold in December 2021; |
| ● | 113,000 square feet sold in January 2020, and |
| ● | 40,000 square feet sold in September 2020. |
| (3) | Stock compensation expense, as shown here, represents stock compensation expense for employees whose compensation expense is recorded in cost of operations. Note that stock compensation expense attributable to the executive management team (including divisional vice presidents) and other corporate employees is recorded within general and administrative expense. |
12